As filed with the Securities and Exchange Commission on June 30, 2008.28, 2011.
UNITED STATES
SECURITIES AND EXCHANGE COMMISSION
Washington, D.C. 20549
FORM 20-F
ANNUAL REPORT PURSUANT TO SECTION 13
OF THE SECURITIES EXCHANGE ACT OF 1934
For the fiscal year ended December 31, 20072010
Commission file number 333-08752
Fomento Económico Mexicano, S.A.B. de C.VC.V.
(Exact name of registrant as specified in its charter)
Mexican Economic Development, Inc.
(Translation of registrant’s name into English)
United Mexican States
(Jurisdiction of incorporation or organization)
General Anaya No. 601 Pte.
Colonia Bella Vista
Monterrey, NL 64410 Mexico
(Address of principal executive offices)
Juan F. Fonseca
General Anaya No. 601 Pte.
Colonia Bella Vista
Monterrey, NL 64410 Mexico
(52-818) 328-6167
investor@femsa.com.mx
(Name, telephone, e-mail and/or facsimile number and
address of company contact person)
Securities registered or to be registered pursuant topto Section 12(b) of the Act:
Title of each class: | Name of each exchange on which registered | |||
American Depositary Shares, each representing 10 BD Units, and each BD Unit consisting of one Series B Share, two Series D-B Shares and two Series D-L Shares, without par value | New York Stock Exchange |
Securities registered or to be registered pursuant to Section 12(g) of the Act:
None
Securities for which there is a reporting obligation pursuant to Section 15(d) of the Act:
None
Indicate the number of outstanding shares of each of the issuer’s classes of capital or common stock as of the close of the period covered by the annual report:
2,161,177,770 | BD Units, each consisting of one Series B Share, two Series D-B Shares and two Series D-L Shares, without par value. The BD Units represent a total of 2,161,177,770 Series B Shares, 4,322,355,540 Series D-B Shares and 4,322,355,540 Series D-L Shares. | |
1,417,048,500 | B Units, each consisting of five Series B Shares without par value. The B Units represent a total of 7,085,242,500 Series B Shares. | |
Indicate by check mark if the registrant is a well-known seasoned issuer, as defined in Rule 405 of the Securities Act.
x Yes | ¨ No |
If this report is an annual or transition report, indicate by check mark if the registrant is not required to file reports pursuant to Section 13 or 15(d) of the Securities Exchange Act of 1934.
¨ Yes | x No |
Indicate by check mark whether the registrant has submitted electronically and posted on its corporate Web site, if any, every Interactive Data File required to be submitted and posted pursuant to Rule 405 of Regulation S-T (§232.405 of this chapter) during the preceding 12 months (or for such shorter period that the registrant was required to submit and post such files). N/A
¨ Yes | ¨ No |
Indicate by check mark whether the registrant: (1) has filed all reports required to be file by Section 13 or 15(d) of the Securities Exchange Act of 1934 during the preceding 12 months (or for such shorter period that the registrant was required to file such reports) and (2) has been subject to such filing requirements for the past 90 days.
x Yes | ¨ No |
Indicate by check mark whether the registrant is a large accelerated filer, an accelerated filer or a non-accelerated filer. See definition of “accelerated filer and large accelerated filer” in Rule 12b-2 of the Exchange Act. (Check one):
Large Accelerated filer x | Accelerated filer ¨ | Non-accelerated filer ¨ |
Indicate by check mark which basis of accounting the registrant has used to prepare the financial statements included in this filing:
U.S. GAAP ¨ | IFRS ¨ | Other x |
If “Other” has been checked in response to the previous question, indicate by check mark which financial statement item the registrant has elected to follow.
¨ Item 17 | x Item 18 |
If this is an annual report, indicate by check mark whether the registrant is a shell company (as defined in Rule 12b-2 of the Exchange Act).
¨ Yes | x No |
i
| Compensation of Directors and Senior Management | ||||
| EVA Stock Incentive Plan | ||||
| Insurance Policies | ||||
| Ownership by Management | ||||
| Board Practices |
i
ii
| ITEM 16D. | NOT APPLICABLE | 128 | ||||
ITEM 16E. | 128 | |||||
ITEM 16F. | 129 | |||||
| 16G. | 129 | |||||
| 17. | 131 | |||||
| ITEM 18. | FINANCIAL STATEMENTS | 131 | ||||
| ITEM 19. | EXHIBITS | 132 | ||||
iii
This annual report contains information materially consistent with the information presented in the audited financial statements and is free of material misstatements of fact that are not material inconsistencies with the information in the audited financial statements.
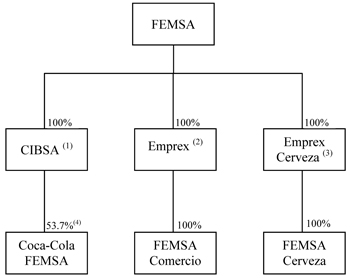
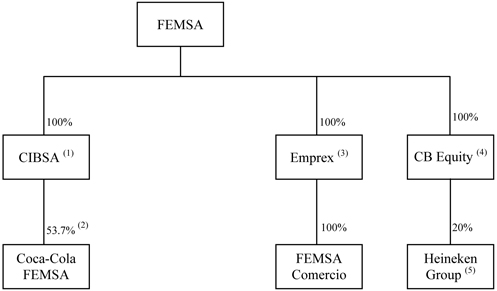
The terms “FEMSA,” “our company,” “we,” “us” and “our,” are used in this annual report to refer to Fomento Económico Mexicano, S.A.B. de C.V. and, except where the context otherwise requires, its subsidiaries on a consolidated basis. We refer to our subsidiary Coca-Cola FEMSA, S.A.B. de C.V., as “Coca-Cola FEMSA,” our subsidiary FEMSA Cerveza, S.A. de C.V., as “FEMSA Cerveza,” and our subsidiary FEMSA Comercio, S.A. de C.V., as “FEMSA Comercio.”
The term “S.A.B.” stands forSociedad Anósociedad anónima Bursábursátil, which is the term used in Mexico used to denominate a publicly traded company under the Mexican Securities Market Law issued in 2006. In December 2006, both(Ley del Mercado de Valores), which we and Coca-Cola FEMSA changed our namerefer to includeas the denomination “S.A.B.” in accordance with the new Mexican Securities Law.
References to “U.S. dollars,” “US$,” “dollars” or “$” are to the lawful currency of the United States of America. References to “Mexican pesos,” “pesos” or “Ps.” are to the lawful currency of the United Mexican States, or Mexico.
Currency Translations and Estimates
This annual report contains translations of certain Mexican peso amounts into U.S. dollars at specified rates solely for the convenience of the reader. These translations should not be construed as representations that the Mexican peso amounts actually represent such U.S. dollar amounts or could be converted into U.S. dollars at the rate indicated. Unless otherwise indicated, such U.S. dollar amounts have been translated from Mexican pesos at an exchange rate of Ps. 10.916912.3825 to US$ 1.00, the noon buying rate for Mexican pesos on December 31, 20072010, as published by the Federal Reserve Bank of New York. On May 30, 2008,31, 2011, this exchange rate was Ps. 10.329011.5790 to US$ 1.00. See “Item 3. Key Information—Exchange Rate Information” for information regarding exchange rates since January 1, 2003. In our previous public disclosures, we presented U.S. dollar amounts based on the exchange rate quoted by dealers to FEMSA for the settlement of obligations in foreign currencies at the end of the applicable period.2006.
To the extent estimates are contained in this annual report, we believe that such estimates, which are based on internal data, are reliable. Amounts in this annual report are rounded, and the totals may therefore not precisely equal the sum of the numbers presented.
Per capita growth rates and population data have been computed based upon statistics prepared by theInstituto Nacional de Estadística, Geografía e Informáticaof Mexico (the National(National Institute of Statistics, Geography and Information, which we refer to as the Mexican Institute of Statistics), the Federal Reserve Bank of New York, the U.S. Federal Reserve Board andBanco de México (the Bank(Bank of Mexico), local entities in each country and upon our estimates.
This annual report contains words, such as “believe,” “expect” and “anticipate” and similar expressions that identify forward-looking statements. Use of these words reflects our views about future events and financial performance. Actual results could differ materially from those projected in these forward-looking statements as a result of various factors that may be beyond our control, including but not limited to effects on our company from changes in our relationship with or among our affiliated companies, movements in the prices of raw materials, competition, significant developments in Mexico or international economic or political conditions or changes in our regulatory environment. Accordingly, we caution readers not to place undue reliance on these forward-looking statements. In any event, these statements speak only as of their respective dates, and we undertake no obligation to update or revise any of them, whether as a result of new information, future events or otherwise.
Selected Consolidated Financial Data This annual report includes, under Item 18, our audited consolidated balance sheets as of December 31, ITEM 3. KEY INFORMATIONITEMS 1-2. NOT APPLICABLE ITEM 3. KEY INFORMATION 20072010 and 2006 and2009, the related consolidated statements of income, cash flows and changes in stockholders’ equity and changes in financial position for the years ended
December 31, 2007, 20062010, 2009 and 2005.2008. Our audited consolidated financial statements are prepared in accordance with Mexican Financial Reporting Standards, or Mexican FRS, (Normas de Información Financiera)or NIF), which differ in certain significant respects from accounting principles generally accepted in the United States, or U.S. GAAP.
Notes 2627 and 2728 to our audited consolidated financial statements provide a description of the principal differences between Mexican Financial Reporting StandardsFRS and U.S. GAAP as they relate to our company, together with a reconciliation to U.S. GAAP of net income, comprehensive income and stockholders’ equity as well as U.S. GAAP consolidated balance sheets, statements of income changes in stockholders’ equityand comprehensive income and cash flows for the same periods presented for Mexican Financial Reporting Standards purposes.FRS purposes and for the consolidated statement of changes in stockholders’ equity for the years ended December 31, 2010 and 2009. In the reconciliation to U.S. GAAP, we present our subsidiary Coca-Cola FEMSA, which is a consolidated subsidiary for purposes of Mexican Financial Reporting Standards,FRS, under the equity method for U.S. GAAP purposes, due to the substantive participating rights of The Coca-Cola Company as a minority shareholder in Coca-Cola FEMSA.FEMSA for the years ended December 31, 2009 and 2008.
On February 1, 2010, FEMSA and The effectsCoca-Cola Company signed an amendment to their Shareholders’ Agreement. As a result of this amendment, FEMSA began to consolidate Cola-Cola FEMSA for U.S. GAAP purposes on this date. See Note 27A to our audited consolidated financial statements.
Beginning on January 1, 2008, in accordance with changes to NIF B-10 under the Mexican FRS, we discontinued the use of inflation accounting underfor our subsidiaries that operate in “non-inflationary” countries where cumulative inflation for the three preceding years was less than 26%. Our subsidiaries in Mexico, Guatemala, Panama, Colombia and Brazil operate in non-inflationary economic environments, therefore 2010, 2009 and 2008 figures reflect inflation effects only through 2007. Our subsidiaries in Nicaragua, Costa Rica, Venezuela and Argentina operate in economic environments in which cumulative inflation during the same three-year period was 26% or greater, and we therefore continue recognizing inflationary accounting for 2010, 2009 and 2008. For comparison purposes, the figures prior to 2008 have been restated in Mexican Financial Reporting Standardspesos with purchasing power as of December 31, 2007, taking into account local inflation for each country with reference to the consumer price index. Local currencies have been converted into Mexican pesos using official exchange rates published by the local central bank of each country. Our subsidiary in the Euro Zone operated in a non-inflationary economic environment in 2010. See Note 5 to our audited consolidated financial statements.
As a result of discontinuing inflationary accounting for subsidiaries that operate in non-inflationary economic environments, the financial statements are no longer considered to be presented in a reporting currency that comprehensively includes the effects of price level changes. Therefore, the inflationary effects of inflationary economic environments arising in 2008, 2009 and 2010 result in a difference that must be reconciled for U.S. GAAP purposes, except for Venezuela, which is considered to be a hyperinflationary environment since January 2010 and which inflationary effects have not been reversed in the reconciliation tounder U.S. GAAP. See note 26Notes 27 and 28 to our audited consolidated financial statements.
On April 30, 2010, FEMSA announced the closing of the transaction pursuant to which FEMSA agreed to exchange 100% of its beer operations for a 20% economic interest in Heineken Holding N.V. and Heineken N.V., which, together with their respective subsidiaries, we refer to as Heineken or the Heineken Group. See “Item 4. Information on the Company—FEMSA Cerveza and Equity Method Investment in Heineken Group.” Under Mexican FRS, we have reclassified our audited consolidated balance sheets as of December 31, 2010 and 2009, the related consolidated statements of income and changes in stockholders’ equity and cash flows for the years ended December 31, 2010, 2009 and 2008 to reflect FEMSA Cerveza, S.A. de C.V. (now Cuauhtémoc Moctezuma Holding, S.A. de C.V.), which we refer to as FEMSA Cerveza or Cuauhtemoc Moctezuma, as a discontinued
operation. However, FEMSA Cerveza is not presented as a discontinued operation under U.S. GAAP. See “Item 5. Operating and Financial Review and Prospects—U.S. GAAP Reconciliation” and Notes 27 and 28 to our audited consolidated financial statements.
The following table presents selected financial information of our company. This information should be read in conjunction with, and is qualified in its entirety by, our audited consolidated financial statements and the notes to those statements. See “Item 18. Financial Statements.” The selected financial information is presented on a consolidated basis and is not necessarily indicative of our financial position or results offrom operations at or for any future date or period. Under Mexican FRS, FEMSA Cerveza figures for years prior to 2010 have been reclassified and presented as discontinued operations for comparison purposes to 2010 figures. See Note 2 to our audited consolidated financial statements. Under U.S. GAAP, FEMSA Cerveza figures are presented as a continuing operation.
| Selected Consolidated Financial Information Year Ended December 31, | Selected Consolidated Financial Information Year Ended December 31, | ||||||||||||||||||||||||||||||||||||||||||
| 2007(1) | 2007 | 2006 | 2005 | 2004 | 2003(2) | 2010(2) | 2010 | 2009 | 2008 | 2007 | 2006 | ||||||||||||||||||||||||||||||||
| (In millions of U.S. dollars and millions of Mexican pesos at December 31, 2007, except for per share data, the weighted average number of shares outstanding and percentages) | (In millions of U.S. dollars and millions of Mexican pesos, except for percentages, per share data and weighted average number of shares outstanding) | ||||||||||||||||||||||||||||||||||||||||||
| Income Statement Data: | |||||||||||||||||||||||||||||||||||||||||||
| Mexican FRS: | |||||||||||||||||||||||||||||||||||||||||||
Total revenues | $ | 13,516 | Ps. 147,556 | Ps. 136,120 | Ps. 119,462 | Ps. 109,500 | Ps. 92,132 | $ | 13,705 | Ps | .169,702 | Ps. | 160,251 | Ps. | 133,808 | Ps. | 114,459 | Ps.102,870 | |||||||||||||||||||||||||
Income from operations | 1,793 | 19,569 | 18,467 | 17,439 | 15,858 | 14,380 | |||||||||||||||||||||||||||||||||||||
Income from operations(3) | 1,819 | 22,529 | 21,130 | 17,349 | 14,300 | 12,431 | |||||||||||||||||||||||||||||||||||||
Income taxes | 454 | 4,950 | 4,608 | 4,620 | 2,801 | 4,173 | 457 | 5,671 | 4,959 | 3,108 | 3,931 | 3,091 | |||||||||||||||||||||||||||||||
Consolidated net income before discontinued operations | 1,451 | 17,961 | 11,799 | 7,630 | 8,438 | 6,685 | |||||||||||||||||||||||||||||||||||||
Income from the exchange of shares with Heineken, net of taxes | 2,150 | 26,623 | — | — | — | — | |||||||||||||||||||||||||||||||||||||
Net income from discontinued operations | 57 | 706 | 3,283 | 1,648 | 3,498 | 3,175 | |||||||||||||||||||||||||||||||||||||
Consolidated net income | 1,093 | 11,936 | 9,860 | 9,073 | 10,729 | 5,662 | 3,658 | 45,290 | 15,082 | 9,278 | 11,936 | 9,860 | |||||||||||||||||||||||||||||||
Net majority income | 780 | 8,511 | 7,127 | 5,951 | 6,917 | 3,905 | |||||||||||||||||||||||||||||||||||||
Net minority income | 313 | 3,425 | 2,733 | 3,122 | 3,812 | 1,757 | |||||||||||||||||||||||||||||||||||||
Net majority income:(4) | |||||||||||||||||||||||||||||||||||||||||||
Net controlling interest income | 3,251 | 40,251 | 9,908 | 6,708 | 8,511 | 7,127 | |||||||||||||||||||||||||||||||||||||
Net non-controlling interest income | 407 | 5,039 | 5,174 | 2,570 | 3,425 | 2,733 | |||||||||||||||||||||||||||||||||||||
Net controlling interest income before discontinued operations:(5) | |||||||||||||||||||||||||||||||||||||||||||
Per series “B” share | 0.05 | 0.64 | 0.33 | 0.25 | 0.25 | 0.20 | |||||||||||||||||||||||||||||||||||||
Per series “D” share | 0.07 | 0.81 | 0.42 | 0.32 | 0.32 | 0.24 | |||||||||||||||||||||||||||||||||||||
Net controlling income from discontinued operations:(5) | |||||||||||||||||||||||||||||||||||||||||||
Per series “B” share | 0.11 | 1.37 | 0.16 | 0.08 | 0.17 | 0.16 | |||||||||||||||||||||||||||||||||||||
Per series “D” share | 0.14 | 1.70 | 0.20 | 0.10 | 0.21 | 0.20 | |||||||||||||||||||||||||||||||||||||
Net controlling interest income:(5) | |||||||||||||||||||||||||||||||||||||||||||
Per Series B Share | 0.04 | 0.42 | 0.36 | 0.31 | 0.39 | 0.22 | 0.16 | 2.01 | 0.49 | 0.33 | 0.42 | 0.36 | |||||||||||||||||||||||||||||||
Per Series D Share | 0.05 | 0.53 | 0.44 | 0.39 | 0.49 | 0.27 | 0.21 | 2.51 | 0.62 | 0.42 | 0.53 | 0.44 | |||||||||||||||||||||||||||||||
Weighted average number of shares outstanding (in millions): | |||||||||||||||||||||||||||||||||||||||||||
Series B Shares | 9,246.4 | 9,246.4 | 9,246.4 | 8,834.9 | 8,217.6 | 8,217.6 | 9,246.4 | 9,246.4 | 9,246.4 | 9,246.4 | 9,246.4 | 9,246.4 | |||||||||||||||||||||||||||||||
Series D Shares | 8,644.7 | 8,644.7 | 8,644.7 | 8,260.1 | 7,683.0 | 7,683.0 | 8,644.7 | 8,644.7 | 8,644.7 | 8,644.7 | 8,644.7 | 8,644.7 | |||||||||||||||||||||||||||||||
Allocation of earnings: | |||||||||||||||||||||||||||||||||||||||||||
Series B Shares | 46.11 | % | 46.11 | % | 46.11 | % | 46.11 | % | 46.11 | % | 46.11 | % | 46.11 | % | 46.11 | % | 46.11 | % | 46.11 | % | 46.11 | % | 46.11 | % | |||||||||||||||||||
Series D Shares | 53.89 | % | 53.89 | % | 53.89 | % | 53.89 | % | 53.89 | % | 53.89 | % | 53.89 | % | 53.89 | % | 53.89 | % | 53.89 | % | 53.89 | % | 53.89 | % | |||||||||||||||||||
| U.S. GAAP: | |||||||||||||||||||||||||||||||||||||||||||
U.S. GAAP:(6) | |||||||||||||||||||||||||||||||||||||||||||
Total revenues | $ | 7,636 | Ps. 83,362 | Ps. 75,704 | Ps. 63,031 | Ps. 55,557 | Ps. 49,777 | $ | 14,299 | Ps. | 177,053 | Ps. | 102,902 | Ps. | 91,650 | Ps. | 83,362 | Ps. 75,704 | |||||||||||||||||||||||||
Income from operations | 706 | 7,710 | 7,821 | 6,911 | 6,011 | 5,379 | 1,715 | 21,235 | 8,661 | 7,881 | 7,667 | 7,821 | |||||||||||||||||||||||||||||||
Participation in Coca-Cola FEMSA’s earnings(5) | 333 | 3,635 | 2,420 | 2,205 | 2,936 | 1,263 | |||||||||||||||||||||||||||||||||||||
Minority interest | (3 | ) | (32 | ) | 169 | — | (524 | ) | (429 | ) | |||||||||||||||||||||||||||||||||
Net income | 784 | 8,557 | 6,973 | 6,059 | 7,352 | 3,838 | |||||||||||||||||||||||||||||||||||||
Participation in Coca-Cola FEMSA’s earnings(6) | 15 | 183 | 4,516 | 2,994 | 3,635 | 2,420 | |||||||||||||||||||||||||||||||||||||
| Selected Consolidated Financial Information Year Ended December 31, | Selected Consolidated Financial Information Year Ended December 31, | ||||||||||||||||||||||||||||||||||||
| 2007(1) | 2007 | 2006 | 2005 | 2004 | 2003(2) | 2010(2) | 2010 | 2009 | 2008 | 2007 | 2006 | ||||||||||||||||||||||||||
| (In millions of U.S. dollars and millions of Mexican pesos at December 31, 2007, except for per share data, the weighted average number of shares outstanding and percentages) | (In millions of U.S. dollars and millions of Mexican pesos, except for percentages, per share data and weighted average number of shares outstanding) | ||||||||||||||||||||||||||||||||||||
Net income:(4) | |||||||||||||||||||||||||||||||||||||
Consolidated net income | 5,831 | 72,204 | (12) | 10,685 | 6,599 | 8,589 | 6,804 | ||||||||||||||||||||||||||||||
Less: Net income attributable to the non-controlling interest income | (384 | ) | (4,759 | ) | (783 | ) | 253 | (32 | ) | 169 | |||||||||||||||||||||||||||
Net income attributable to controlling interest income | 5,447 | 67,445 | 9,902 | 6,852 | 8,557 | 6,973 | |||||||||||||||||||||||||||||||
Net controlling interest income(5): | |||||||||||||||||||||||||||||||||||||
Per Series B Share | 0.04 | 0.43 | 0.35 | 0.32 | 0.42 | 0.22 | 0.27 | 3.36 | 0.49 | 0.34 | 0.43 | 0.35 | |||||||||||||||||||||||||
Per Series D Share | 0.05 | 0.53 | 0.43 | 0.40 | 0.52 | 0.27 | 0.34 | 4.20 | 0.62 | 0.43 | 0.53 | 0.43 | |||||||||||||||||||||||||
Weighted average number of shares outstanding (in millions): | |||||||||||||||||||||||||||||||||||||
Series B Shares | 9,246.4 | 9,246.4 | 9,246.4 | 8,834.9 | 8,217.6 | 8,217.6 | 9,246.4 | 9,246.4 | 9,246.4 | 9,246.4 | 9,246.4 | 9,246.4 | |||||||||||||||||||||||||
Series D Shares | 8,644.7 | 8,644.7 | 8,644.7 | 8,260.1 | 7,683.0 | 7,683.0 | 8,644.7 | 8,644.7 | 8,644.7 | 8,644.7 | 8,644.7 | 8,644.7 | |||||||||||||||||||||||||
| Balance Sheet Data: | |||||||||||||||||||||||||||||||||||||
| Mexican FRS: | |||||||||||||||||||||||||||||||||||||
Mexican FRS:(1) | |||||||||||||||||||||||||||||||||||||
Total assets of continuing operations | $ | 18,056 | Ps. | 223,578 | Ps. | 153,638 | Ps. | 126,833 | Ps. | 114,537 | Ps. | 97,623 | |||||||||||||||||||||||||
Total assets of discontinued operations | — | — | 72,268 | 71,201 | 68,881 | 62,350 | |||||||||||||||||||||||||||||||
Current liabilities of continuing operations | 2,464 | 30,516 | 37,218 | 35,351 | 28,783 | 22,846 | |||||||||||||||||||||||||||||||
Current liabilities of discontinued operations | — | — | 10,883 | 12,912 | 13,581 | 10,503 | |||||||||||||||||||||||||||||||
Long-term debt of continuing operations(7) | 1,793 | 22,203 | 21,260 | 21,853 | 23,066 | 21,160 | |||||||||||||||||||||||||||||||
Other long-term liabilities of continuing operations | 1,442 | 17,846 | 8,500 | 8,285 | 9,882 | 7,249 | |||||||||||||||||||||||||||||||
Non-current liabilities of discontinued operations | — | — | 32,216 | 22,738 | 18,453 | 20,007 | |||||||||||||||||||||||||||||||
Capital stock | 432 | 5,348 | 5,348 | 5,348 | 5,348 | 5,348 | |||||||||||||||||||||||||||||||
Total stockholders’ equity | 12,357 | 153,013 | 115,829 | 96,895 | 89,653 | 78,208 | |||||||||||||||||||||||||||||||
Controlling interest | 9,477 | 117,348 | 81,637 | 68,821 | 64,578 | 56,654 | |||||||||||||||||||||||||||||||
Non-controlling interest | 2,880 | 35,665 | 34,192 | 28,074 | 25,075 | 21,554 | |||||||||||||||||||||||||||||||
U.S. GAAP:(6) | |||||||||||||||||||||||||||||||||||||
Total assets | $ | 15,187 | Ps. 165,795 | Ps. 154,516 | Ps. 139,823 | Ps. 138,533 | Ps. 128,598 | $ | 27,015 | Ps. | 334,517 | Ps. | 158,000 | Ps. | 139,219 | Ps. | 127,167 | Ps. | 116,392 | ||||||||||||||||||
Current liabilities | 3,060 | 33,404 | 28,060 | 22,510 | 27,250 | 21,285 | 2,474 | 30,629 | 23,539 | 23,654 | 18,579 | 14,814 | |||||||||||||||||||||||||
Long-term debt(6) | 2,809 | 30,665 | 35,673 | 32,129 | 40,563 | 39,378 | |||||||||||||||||||||||||||||||
Long-term debt(7) | 1,771 | 21,927 | 24,119 | 19,557 | 16,569 | 18,749 | |||||||||||||||||||||||||||||||
Other long-term liabilities | 1,106 | 12,073 | 12,575 | 10,786 | 10,963 | 11,840 | 3,216 | 39,825 | 10,900 | 9,966 | 8,715 | 8,738 | |||||||||||||||||||||||||
Non-controlling interest | 6,339 | 78,495 | 1,274 | 505 | 698 | 166 | |||||||||||||||||||||||||||||||
Controlling interest | 13,216 | 163,641 | 98,168 | 85,537 | 82,606 | 73,925 | |||||||||||||||||||||||||||||||
Capital stock | 490 | 5,348 | 5,348 | 5,348 | 4,979 | 4,979 | 432 | 5,348 | 5,348 | 5,348 | 5,348 | 5,348 | |||||||||||||||||||||||||
Total stockholders’ equity | 8,212 | 89,653 | 78,208 | 74,398 | 60,027 | 56,095 | |||||||||||||||||||||||||||||||
Majority interest | 5,915 | 64,578 | 56,654 | 52,400 | 40,314 | 35,096 | |||||||||||||||||||||||||||||||
Minority interest | 2,297 | 25,075 | 21,554 | 21,998 | 19,713 | 20,999 | |||||||||||||||||||||||||||||||
Stockholders’ equity(8) | 19,555 | 242,136 | 99,442 | 86,042 | 83,304 | 74,091 | |||||||||||||||||||||||||||||||
Other information: | |||||||||||||||||||||||||||||||||||||
Mexican FRS:(1) | |||||||||||||||||||||||||||||||||||||
Depreciation(9) | $ | 366 | Ps. | 4,527 | Ps. | 4,391 | Ps. | 3,762 | Ps. | 4,930 | Ps. | 4,954 | |||||||||||||||||||||||||
Capital expenditures(10) | 902 | 11,171 | 9,067 | 7,816 | 5,939 | 5,003 | |||||||||||||||||||||||||||||||
Operating margin(11) | 13.3 | % | 13.3 | % | 13.2 | % | 13.0 | % | 12.5 | % | 12.1 | % | |||||||||||||||||||||||||
U.S. GAAP: | |||||||||||||||||||||||||||||||||||||
Depreciation(9) | $ | 394 | Ps. | 4,884 | Ps. | 2,786 | Ps. | 2,439 | Ps. | 2,114 | Ps. | 2,080 | |||||||||||||||||||||||||
Operating margin(11) | 11.9 | % | 11.9 | % | 8.4 | % | 8.6 | % | 9.2 | % | 10.3 | % | |||||||||||||||||||||||||
Total assets Current liabilities Long-term debt(6) Other long-term liabilities Minority interest Capital stock Stockholders’ equity Depreciation(7) Capital expenditures(8) Operating margin(9) Depreciation(7) Operating margin(9) Selected Consolidated Financial Information
Year Ended December 31, 2007(1) 2007 2006 2005 2004 2003(2) (in millions of U.S. dollars and millions of Mexican pesos at December 31, 2007, except for
per share data, the weighted average number of shares outstanding and percentages) U.S. GAAP: $ 11,430 Ps. 124,775 Ps. 114,693 Ps. 98,869 Ps. 92,613 Ps. 80,827 1,702 18,579 14,814 10,090 16,997 11,652 1,518 16,569 18,749 15,177 16,254 8,343 579 6,323 7,039 4,996 3,470 5,529 64 698 166 52 56 5,968 490 5,348 5,348 5,348 4,979 4,979 7,567 82,606 73,925 68,554 55,836 49,334 Other information: Mexican FRS: $ 452 Ps. 4,930 Ps. 4,954 Ps. 4,682 Ps. 4,280 Ps. 3,708 1,031 11,257 9,422 7,508 7,948 8,085 13.3 % 13.3 % 13.6 % 14.6 % 14.5 % 15.6 % U.S. GAAP: 194 $ 2,114 Ps. 2,163 Ps. 2,079 Ps. 1,990 Ps. 2,009 9.2 % 9.2 % 10.3 % 11.0 % 10.8 % 10.8 %
| (1) | As a result of the FEMSA Cerveza share exchange with the Heineken Group on April 30, 2010, related figures are presented as discontinued operations for Mexican FRS purposes. As a result, prior year financial information has been modified in order to conform to 2010 financial information. |
| (2) | Translation to U.S. dollar amounts at an exchange rate of Ps. |
| As of February 1, 2010, Coca-Cola FEMSA |
| Includes long-term debt minus the current portion of long-term debt. |
| In 2009, U.S. GAAP requires that non-controlling interest be included as part of the total stockholders’ equity. This standard was applied retrospectively for comparative purposes. |
| (9) | Includes bottle breakage. |
| Includes investments in property, plant and equipment, intangible and other assets. |
| Operating margin is calculated by dividing income from operations by total revenues. |
| (12) | Includes gain recognized in other income due to control acquisition of Coca-Cola FEMSA. See Note 27A to our audited consolidated financial statements. |
We have historically paid dividends per BD Unit (including in the form of ADSs) approximately equal to or greater than 1% of the market price on the date of declaration, subject to changes in our results offrom operations and financial position, including due to extraordinary economic events and to the factors described in “Risk Factors” that affect our financial condition and liquidity. These factors may affect whether or not dividends are declared and the amount of such dividends. We do not expect to be subject to any contractual restrictions on our ability to pay dividends, although our subsidiaries may be subject to such restrictions. Because we are a holding company with no significant operations of our own, we will have distributable profits and cash to pay dividends only to the extent that we receive dividends from our subsidiaries. Accordingly, we cannot assure you that we will pay dividends or as to the amount of any dividends.
The following table sets forth for each year the nominal amount of dividends per share that we declared in Mexican pesos and the U.S. dollar amounts that were actually paid on each of theand their respective payment dates for the 20032006 to 20072010 fiscal years:
Date Dividend Paid | Fiscal Year with Respect to which Dividend was Declared | Aggregate Amount of Dividend Declared | Per Series B Share Dividend(1) | Per Series B Share Dividend(1) | Per Series D Share Dividend(1) | Per Series D Share Dividend(1) | Fiscal Year with Respect to which Dividend was Declared | Aggregate Amount of Dividend Declared | Per Series B Share Dividend | Per Series B Share Dividend | Per Series D Share Dividend | Per Series D Share Dividend | |||||||||||||||||||||||||||||
May 31, 2004 | 2003 | P | s. 531,379,672 | P | s. 0.0298 | $ | 0.0026 | P | s. 0.0373 | $ | 0.0033 | ||||||||||||||||||||||||||||||
May 31, 2005 | 2004 | P | s. 659,997,941 | P | s. 0.0371 | $ | 0.0034 | P | s. 0.0463 | $ | 0.0042 | ||||||||||||||||||||||||||||||
June 15, 2006 | 2005 | P | s. 986,000,000 | P | s. 0.0492 | $ | 0.0043 | P | s. 0.0615 | $ | 0.0054 | ||||||||||||||||||||||||||||||
May 15, 2007 | 2006 | P | s. 1,485,000,000 | P | s. 0.0741 | $ | 0.0069 | P | s. 0.0926 | $ | 0.0086 | 2006 | (1) | Ps.1,485,000,000 | Ps.0.0741 | $ | 0.0069 | Ps.0.0926 | $ | 0.0086 | |||||||||||||||||||||
May 8, 2008 | 2007 | P | s. 1,620,000,000 | P | s. 0.1009 | $ | 0.0095 | P | s. 0.0807 | $ | 0.0076 | 2007 | (1) | Ps.1,620,000,000 | Ps.0.0807 | $ | 0.0076 | Ps.0.1009 | $ | 0.0095 | |||||||||||||||||||||
May 4, 2009 and November 3, 2009(2) | 2008 | Ps.1,620,000,000 | Ps.0.0807 | $ | 0.0061 | Ps.0.1009 | $ | 0.0076 | |||||||||||||||||||||||||||||||||
May 4, 2009 | Ps.0.0404 | $ | 0.0030 | Ps.0.0505 | $ | 0.0038 | |||||||||||||||||||||||||||||||||||
November 3, 2009 | Ps.0.0404 | $ | 0.0030 | Ps.0.0505 | $ | 0.0038 | |||||||||||||||||||||||||||||||||||
May 4, 2010 and November 3, 2010(3) | 2009 | Ps.2,600,000,000 | Ps.0.1296 | $ | 0.0105 | Ps.0.1621 | $ | 0.0132 | |||||||||||||||||||||||||||||||||
May 4, 2010 | Ps.0.0648 | $ | 0.0053 | Ps.0.0810 | $ | 0.0066 | |||||||||||||||||||||||||||||||||||
November 3, 2010 | Ps.0.0648 | $ | 0.0053 | Ps.0.0810 | $ | 0.0066 | |||||||||||||||||||||||||||||||||||
Date Dividend Paid May 3, 2011 and November 2, 2011(4)(5) May 3, 2011 November 2, 2011 Fiscal Year
with Respect to
which
Dividend
was Declared Aggregate
Amount
of Dividend
Declared Per Series
B Share
Dividend Per Series B
Share
Dividend Per Series D
Share
Dividend Per Series D
Share
Dividend 2010 Ps.4,600,000,000 Ps.0.2294 N/a Ps.0.28675 N/a Ps.0.1147 $ 0.0099 Ps.0.14338 $ 0.0124 Ps.0.1147 N/a Ps.0.14338 N/a
(1) | The per series dividend amount has been adjusted for comparability purposes to reflect the 3:1 stock split effective May 25, 2007 by dividing, |
| (2) | The dividend payment for 2008 was divided into two equal payments. The first payment was paid on May 4, 2009, with a record date of April 30, 2009, and the second payment was paid on November 3, 2009, with a record date of October 30, 2009. |
| (3) | The dividend payment for 2009 was divided into two equal payments. The first payment was paid on May 4, 2010, with a record date of May 3, 2010, and the second payment was paid on November 3, 2010, with a record date of November 2, 2010. |
| (4) | The dividend payment for 2010 was divided into two equal payments. The first payment was paid on May 3, 2011, with a record date of May 2, 2011, and the second payment will be paid on November 2, 2011, with a record date of November 1, 2011. |
| (5) | The U.S. dollar amount of the second 2010 dividend payment will be based on the exchange rate on the record date of November 1, 2011. |
At the annual ordinary general shareholders meeting, or AGM, the board of directors submits the financial statements of our company for the previous fiscal year, together with a report thereon by the board of directors. Once the holders of Series B Shares have approved the financial statements, they determine the allocation of our net profits for the preceding year. Mexican law requires the allocation of at least 5% of net profits to a legal reserve, which is not subsequently available for distribution, until the amount of the legal reserve equals 20% of our paid in capital stock. Thereafter, the holders of Series B Shares may determine and allocate a certain percentage of net profits to any general or special reserve, including a reserve for open-market purchases of our shares. The remainder of net profits is available for distribution in the form of dividends to our shareholders. Dividends may only be paid if net profits are sufficient to offset losses from prior fiscal years.
Our bylaws provide that dividends will be allocated among the shares outstanding and fully paid at the time a dividend is declared in such manner that each Series D-B Share and Series D-L Share receives 125% of the dividend distributed in respect of each Series B Share. Holders of Series D-B Shares and Series D-L Shares are entitled to this dividend premium in connection with all dividends paid by us other than payments in connection with the liquidation of our company.
Subject to certain exceptions contained in the deposit agreement dated May 11, 2007, among FEMSA, The Bank of New York, as ADS depositary, and holders and beneficial owners from time to time of our American Depositary Shares, or ADSs, evidenced by American Depositary Receipts, or ADRs, any dividends distributed to holders of our ADSs will be paid to the ADS depositary in Mexican pesos and will be converted by the ADS depositary into U.S. dollars. As a result, restrictions on conversion of Mexican pesos into foreign currencies and exchange rate fluctuations may affect the ability of holders of our ADSs to receive U.S. dollars and the U.S. dollar amount actually received by holders of our ADSs.
The following tables settable sets forth, for the periods indicated, the high, low, average and period endyear-end noon buying rates ofexchange rate published by the Federal Reserve Bank of New York expressed in Mexicanfor cable transfers of pesos per one U.S. dollar. The Federal Reserve Bank of New York discontinued the publication of foreign exchange rates on December 31, 2008, and therefore, the data provided for the periods beginning January 1, 2009, is based on the rates published by the U.S. Federal Reserve Board in its H.10 Weekly Release of Foreign Exchange Rates. The rates have not been restated in constant currency units and therefore represent nominal historical figures.
| Exchange Rate | ||||||||
Period | High | Low | Average (1) | Period End | ||||
2003 | 11.41 | 10.11 | 10.80 | 11.24 | ||||
2004 | 11.64 | 10.81 | 11.29 | 11.15 | ||||
2005 | 11.41 | 10.41 | 10.89 | 10.63 | ||||
2006 | 11.46 | 10.43 | 10.91 | 10.80 | ||||
2007 | 11.27 | 10.67 | 10.93 | 10.92 | ||||
Year ended December 31, | Exchange Rate | |||||||||||||||
| High | Low | Average(1) | Year End | |||||||||||||
2006 | 11.46 | 10.43 | 10.91 | 10.80 | ||||||||||||
2007 | 11.27 | 10.67 | 10.93 | 10.92 | ||||||||||||
2008 | 13.94 | 9.92 | 11.21 | 13.83 | ||||||||||||
2009 | 15.41 | 12.63 | 13.50 | 13.06 | ||||||||||||
2010 | 13.19 | 12.16 | 12.64 | 12.38 | ||||||||||||
| (1) | Average month-end rates. |
| Exchange Rate | Exchange Rate | |||||||||||||||||
| High | Low | Period End | High | Low | Period End | |||||||||||||
2006: | ||||||||||||||||||
2009: | ||||||||||||||||||
First Quarter | Ps. 10.95 | Ps. 10.46 | Ps. 10.90 | Ps.15.41 | Ps.13.33 | Ps.14.21 | ||||||||||||
Second Quarter | 11.46 | 10.84 | 11.29 | 13.89 | 12.89 | 13.17 | ||||||||||||
Third Quarter | 11.18 | 10.74 | 10.98 | 13.80 | 12.82 | 13.48 | ||||||||||||
Fourth Quarter | 11.06 | 10.71 | 10.80 | 13.67 | 12.63 | 13.06 | ||||||||||||
2007: | ||||||||||||||||||
2010: | ||||||||||||||||||
First Quarter | Ps. 11.18 | Ps. 10.77 | Ps. 11.04 | Ps.13.19 | Ps.12.30 | Ps.12.30 | ||||||||||||
Second Quarter | 11.03 | 10.71 | 10.79 | 13.14 | 12.16 | 12.83 | ||||||||||||
Third Quarter | 11.27 | 10.73 | 10.93 | 13.17 | 12.49 | 12.63 | ||||||||||||
Fourth Quarter | 11.00 | 10.67 | 10.92 | 12.61 | 12.21 | 12.38 | ||||||||||||
December | 10.92 | 10.80 | 10.92 | |||||||||||||||
2008: | ||||||||||||||||||
2011: | ||||||||||||||||||
January | 10.97 | 10.82 | 10.82 | Ps.12.25 | Ps.12.04 | Ps.12.15 | ||||||||||||
February | 10.82 | 10.67 | 10.73 | 12.18 | 11.97 | 12.11 | ||||||||||||
March | 10.85 | 10.63 | 10.63 | 12.11 | 11.92 | 11.92 | ||||||||||||
First Quarter | 12.25 | 11.92 | 11.92 | |||||||||||||||
April | 10.60 | 10.44 | 10.51 | 11.86 | 11.52 | 11.52 | ||||||||||||
May | 10.57 | 10.31 | 10.33 | 11.77 | 11.51 | 11.58 | ||||||||||||
June(1) | 10.44 | 10.29 | 10.37 | 11.87 | 11.64 | 11.87 | ||||||||||||
| (1) | Information from June 1 to |
Risks Related to Our Company
Coca-Cola FEMSA
Coca-Cola FEMSA’s business dependsrelies on its relationship with The Coca-Cola Company, and changes in this relationship may adversely affect its results offrom operations and financial position.condition.
Approximately 95%99% of Coca-Cola FEMSA’s sales volume in 20072010 was derived from sales ofCoca-Cola trademark beverages. In each of its territories, Coca-Cola FEMSA produces, markets and distributesCoca-Cola trademark beverages through standard bottler agreements.agreements in certain territories in Mexico and Latin America, which we refer to as Coca-Cola FEMSA’s territories. See “Item 4. Information on the Company—Coca-Cola FEMSA—Coca-Cola FEMSA’s Territories.” Through its rights under the bottler agreements and as a large shareholder, The Coca-Cola Company has the abilityright to exercise substantial influence overparticipate in the conduct ofprocess for making important decisions related to Coca-Cola FEMSA’s business.
Under Coca-Cola FEMSA’s bottler agreements, The Coca-Cola Company may unilaterally set the price for its concentrate. In 2005,addition, under its bottler agreements, Coca-Cola FEMSA is prohibited from bottling or distributing any other beverages without The Coca-Cola Company’s authorization or consent and it may not transfer control of the bottler rights of any of its territories without consent of The Coca-Cola Company. On February 1, 2010, FEMSA’s subsidiaries signed an agreement with subsidiaries of The Coca-Cola Company decided to gradually increase concentrate prices for sparkling beverages over a three-year period in Mexico beginning in 2007amend the shareholders agreement of Coca-Cola FEMSA. The purpose of the amendment is to set forth that the appointment and in Brazil in 2006.compensation of the chief executive officer and all officers reporting to the chief executive officer, as well as the adoption of decisions related to the ordinary operations of Coca-Cola FEMSA preparesshall only require a three-year general business plan that is submitted to itssimple majority vote of the board of directors for approval.directors. See “Item 4. Information on the Company—The Company—Overview.” The Coca-Cola Company may require that Coca-Cola FEMSA demonstrate its financial ability to meet its plans and may terminate Coca-Cola FEMSA’s rights to produce, market and distribute soft drinks in territories with respect to which such approval is withheld.business. The Coca-Cola Company also makes significant contributions to Coca-Cola FEMSA’s marketing expenses although it is not required to contribute a particular amount. In addition, Coca-Cola FEMSA is prohibited from bottling any soft drink product or distributing other beverages without The Coca-Cola Company’s authorization or consent.Accordingly, The Coca-Cola Company has the exclusive right to import and export Coca-Cola trademark beverages to and from Coca-Cola FEMSA’s territories; however, Coca-Cola FEMSA holds the exclusive right to sell Coca-Cola trademark beverages within its territories. Coca-Cola FEMSA may not transfer control of the bottler rights ofdiscontinue or reduce such contributions at any of its territories without the consent of The Coca-Cola Company.time.
Coca-Cola FEMSA depends on The Coca-Cola Company to renew its bottler agreements. In Mexico, Coca-Cola FEMSA has four bottler agreements; the agreements for two territories expire in June 2013 and the agreements for the other two territories expire in May 2015. Coca-Cola FEMSA’s bottler agreements for Mexicowith The Coca-Cola Company will expire in 2013 and 2015 and are renewable in each case for ten-year terms. Coca-Cola FEMSA’s bottler agreement forterritories in other countries as follows: Argentina expires in September 2014; Brazil in April 2014; Colombia in June 2014; Venezuela in August 2016; Guatemala in March 2015; Costa Rica in September 2017; Nicaragua in May 2016; and Panama in November 2014. All of Coca-Cola FEMSA’s bottler agreements are automatically renewable for Guatemala, Nicaragua, Panama (other beverages), Costa Rica, Venezuela and Colombia expired in September 2008. Coca-Cola FEMSA’s bottler agreement for Brazil expired in December 2004. Coca-Cola FEMSA’s bottler agreement for Coca-Cola trademark beverages for Panama has an indefinite term butten-year terms, subject to the right of either party to give prior notice that it does not wish to renew a specific agreement. In addition, these agreements generally may be terminated with six months prior written notice by either party. Coca-Cola FEMSA is currently in the processcase of negotiating renewals of these agreements on similar terms and conditions as in other countries. Coca-Cola FEMSA and The Coca-Cola Company are operating under the terms of the existing agreements. There can be no assurances that The Coca-Cola Company will decide to renew any of these agreements. In addition, in the event a material breach of these agreements occurs, the agreements may be terminated.breach. Termination would prevent Coca-Cola FEMSA from sellingCoca-Cola trademark beverages in the affected territory and would have an adverse effect on Coca-Cola FEMSA’s business, financial condition, prospects,conditions, results offrom operations and cash flows.prospects.
The Coca-Cola Company has substantialsignificant influence on the conduct of Coca-Cola FEMSA’s business, which may result in Coca-Cola FEMSA taking actions contrary to the interestinterests of its remaining shareholders.
The Coca-Cola Company has significant influence on the conduct of Coca-Cola FEMSA’s business. Currently, The Coca-Cola Company indirectly owns 31.6% of Coca-Cola FEMSA’s outstanding capital stock, representing 37.0% of its capital stock with full voting rights. The Coca-Cola Company is entitled to appoint four of Coca-Cola FEMSA’s 18 directors and the vote of at least two of them is required to approve certain of its executive officers and, except under limited circumstances, has the power to veto all actions requiring approval by Coca-Cola FEMSA’s board of directors. WeOn February 1, 2010, we and The Coca-Cola Company signed a second amendment to the shareholders agreement that confirms our power to govern the operating and financial policies of Coca-Cola FEMSA in order to exercise control over its operations in the ordinary course of business. Consequently, we are entitled to appoint 11 of Coca-Cola FEMSA’s 18 directors and certainall of its executive officers. The Coca-Cola Company thus may havehas the power to determine the outcome of certain actionsprotective rights, such as mergers, acquisitions, or the sale of any line of business, requiring approval by its board of directors and may have the power to determine the outcome of certain actions requiring approval of Coca-Cola FEMSA’s shareholders. See “Item 10.
Additional Information—Material Contracts—Coca-Cola FEMSA.” The interests of The Coca-Cola Company may be different from the interests of Coca-Cola FEMSA’s remaining shareholders, which may result in Coca-Cola FEMSA taking actions contrary to the interestinterests of its remaining shareholders.
Coca-Cola FEMSA has significant transactions with affiliates, particularly The Coca-Cola Company, which may create the potential for conflicts of interest and could result in less favorable terms to Coca-Cola FEMSA.
Coca-Cola FEMSA engages in transactions with subsidiaries of The Coca-Cola Company, including cooperative marketing arrangements and a number of bottler agreements. In November 2007, Coca-Cola FEMSA purchased jointly with The Coca-Cola Company the outstanding shares of Jugos del Valle, S.A.B de C.V., which we refer to as Jugos del Valle, a Mexican juice and beverage producer with operations in Mexico, Brazil and the United States. In addition, Coca-Cola FEMSA has entered into cooperative marketing arrangements with The Coca-Cola Company. The transactions may create potential conflicts of interest, which could result in terms less favorable to Coca-Cola FEMSA than could be obtained from an unaffiliated third party.third-party.
Competition could adversely affect Coca-Cola FEMSA’s financial performance.
The beverage industry throughout Latin Americain territories in which Coca-Cola FEMSA operates is highly competitive. Coca-Cola FEMSA faces competition from other bottlers of sparkling beverages such as Pepsi products, and from producers of low cost beverages, or “B brands.” Coca-Cola FEMSA also competes against beveragesin different beverage categories, other than soft drinkssparkling beverages, such as water, fruit juicejuice-based beverages, teas and sport drinks. Although competitive conditions are different in each of Coca-Cola FEMSA’s territories, Coca-Cola FEMSA competes principally in terms of price, packaging, consumer salesales promotions, customer service and non-price retail incentives.product innovation. See “Item 4. Information on the Company—Coca-Cola FEMSA—Competition.” There can be no assurances that Coca-Cola FEMSA will be able to avoid lower pricing as a result of competitive pressure. Lower pricing, changes made in response to competition and changes in consumer preferences may have an adverse effect on Coca-Cola FEMSA’s financial performance.
Coca-Cola FEMSA’s principal competitor in Mexico is The Pepsi Bottling Group, or PBG. PBG is the largest bottler of Pepsi products worldwide and competes with Coca-Cola trademark beverages. Coca-Cola FEMSA has also experienced stronger competition in Mexico from lower priced soft drinks in larger, multiple serving packaging. In Argentina and Brazil, Coca-Cola FEMSA competes with Companhia de Bebidas das Américas, commonly referred to as AmBev, the largest brewer in Latin America and a subsidiary of InBev S.A., which sells Pepsi products, in addition to a portfolio that includes local brands with flavors such as guaraná and proprietary beers. In each of its territories, Coca-Cola FEMSA competes with Pepsi bottlers and with various other bottlers and distributors of nationally and regionally advertised soft drinks.
Changes in consumer preference could reduce demand for some of Coca-Cola FEMSA’s products
The non-alcoholic beverage industry is rapidly evolving as a result of, among other things, changes in consumer preferences. Specifically, consumers are becoming increasingly more aware of and concerned about environmental and health issues. Concerns over the environmental impact of plastic may reduce the consumption of Coca-Cola FEMSA’s products sold in plastic bottles or result in additional taxes that would adversely affect consumer demand. In addition, researchers, health advocates and dietary guidelines are encouraging consumers to reduce their consumption of certain types of beverages sweetened with sugar and high fructose corn syrup, which could reduce demand for certain of Coca-Cola FEMSA’s products. A reduction in consumer demand would adversely affect Coca-Cola FEMSA’s results offrom operations.
A water shortageWater shortages or aany failure to maintain existing concessions could adversely affect Coca-Cola FEMSA’s business.
Water is an essential component of soft drinks.all of Coca-Cola FEMSA’s products. Coca-Cola FEMSA obtains water from various sources in its territories, including springs, wells, rivers and municipal water companies. In Mexico, Coca-Cola FEMSA purchases water from municipaland state water companies and pumpspursuant to either contracts to obtain water from its own wellsor pursuant to concessions granted by the Mexican government. governments in its various territories.
Coca-Cola FEMSA obtains the vast majority of the water used in its soft drink production in Mexico pursuant to these concessions to exploit wells, which the Mexican governmentare generally granted based on studies of the existing and projected groundwater supply. Coca-Cola FEMSA’s existing water
concessions in Mexicoor contracts to obtain water may be terminated by governmental authorities under certain circumstances and their renewal depends on receiving necessary authorizations from municipallocal and/or federal water authorities. See “Item 4—4. Information on the Company—Regulatory Matters—Water Supply Law.” In some of Coca-Cola FEMSA’s other territories, its existing water supply may not be sufficient to meet its future production needs and the available water supply may be adversely affected by shortages or changes in governmental regulations.regulations and environmental changes.
Coca-Cola FEMSA
We cannot assure you that water will be available in sufficient quantities to meet itsCoca-Cola FEMSA’s future production needs or will prove sufficient to meet its water supply needs.
Increases in the prices of raw materials would increase Coca-Cola FEMSA’s cost of sales and may adversely affect its results offrom operations.
Coca-Cola FEMSA’s most significant raw materials are (1) concentrate, which it acquires from companies designated byaffiliates of The Coca-Cola Company, (2) packaging materials and (3) sweeteners. Prices for sparkling beverages concentrate are determined by The Coca-Cola Company pursuant to Coca-Cola FEMSA’s bottler agreements as a percentage of the weighted average retail price in local currency, net of applicable taxes. In 2005, The Coca-Cola Company decided to gradually increase concentrate prices for sparkling beverages over a three-year period in Mexico which began in 2007Brazil and Mexico. These increases were fully implemented in Brazil in 2006.2008 and in Mexico in 2009. However, Coca-Cola FEMSA may experience further increases in the future. The prices for Coca-Cola FEMSA’s remaining raw materials are driven by market prices and local availability as well as the imposition of import duties and import restrictions and fluctuations in exchange rates. Coca-Cola FEMSA is also required to meet all of its supply needs from suppliers approved by The Coca-Cola Company, which may limit the number of suppliers available to it. Coca-Cola FEMSA’s sales prices are denominated in the local currency in each country in which it operates, while the prices of certain materials, including those used in the bottling of its products mainly(mainly resin, and ingots used to make plastic bottles, finished plastic bottles, and aluminum cans and high fructose corn syrup), are paid in or determined with reference to the U.S. dollar, and thereforedollar. These prices may increase if the U.S. dollar appreciates against the currency of any country in which Coca-Cola FEMSA operates, particularly against the Mexican peso. Seewhich occurred in 2008 and 2009.See “Item 4—4. Information on the Company—Coca-Cola FEMSA—Raw Materials.”
After concentrate, packaging materials and sweeteners constitute the largest portion of Coca-Cola FEMSA’s raw material costs. Coca-Cola FEMSA’s most significant packaging raw material costs arise from the purchase of resin and plastic ingots to make plastic bottles and from the purchase of finished plastic bottles, the prices of which are tied to crude oil prices and global resin supply. Average U.S. dollarThe average prices that Coca-Cola FEMSA paid for resin remained relatively flatand plastic ingots in 2007, although pricesU.S. dollars decreased significantly in 2009 and in 2010. Prices may also increase in future periods. During 2009 and 2010, international sugar prices were volatile due to various factors, including shifting demands, availability and climate issues affecting production and distribution. Sugar prices in all of the countries in which Coca-Cola FEMSA operates other than Brazil are subject to local regulations and other barriers to market entry that cause itCoca-Cola FEMSA to pay in excess of international market prices for sugar. In 2007,Average sweetener prices slightly increasedpaid during 2010 were higher as compared to 2009 in all of the countries in which Coca-Cola FEMSA operates other than Mexico and Argentina. In Venezuela, operates. See “Item 4. Information on the Company—Coca-Cola FEMSA has experienced sugar shortages that have adversely affected its operations. These shortages were due to insufficient domestic production to meet demand and current restrictions on sugar imports.FEMSA—Raw Materials.”
Coca-Cola FEMSAWe cannot assure you that itsCoca-Cola FEMSA’s raw material prices will not further increase in the future. Increases in the prices of raw materials would increase Coca-Cola FEMSA’s cost of sales and adversely affect its results of operations.financial performance.
Taxes on soft drinks could adversely affect Coca-Cola FEMSA’s business.
The countries in which Coca-Cola FEMSA operates may adopt new tax laws or modify existing law to increase taxes applicable to its business. For example, in Mexico, a general tax reform became effective on January 1, 2010, pursuant to which, as applicable to Coca-Cola FEMSA, there was a temporary increase in the income tax rate from 28% to 30% from 2010 through 2012. This increase will be followed by a reduction to 29% for the year 2013 and a further reduction in 2014 to return to the previous rate of 28%. In addition, the value added tax (VAT) rate increased in 2010 from 15% to 16%. This increase had an impact on Coca-Cola FEMSA’s results from operations due to the reduction in consumer acquisition capacity.
In Panama, there was an increase in a certain consumer tax, effective as of April 1, 2010, affecting syrups powders and concentrate. Some of these materials are used for the production of Coca-Cola FEMSA’s sparkling beverages. These taxes increased from 6% to 10%.
Coca-Cola FEMSA’s products are also subject to excise and value-addedcertain taxes in many of the countries in which it operates. The imposition of new taxes or increases in taxes on its products may have a material adverse effect on Coca-Cola FEMSA’s business, financial condition, prospects and results of operations. In 2003, Mexico implemented a 20% excise tax on sparkling beverages produced with non-sugar sweetener. This tax was eliminated beginning in 2007. Certain countries in Central America, Brazil and Argentina and Brazilalso impose taxes on sparkling beverages. See “Item 4—Information on the Company—Coca-Cola FEMSA—Taxation of Soft Drinks.” We cannot assure you that any governmental authority in any country where Coca-Cola FEMSA operates will not impose new taxes or increase taxes on its products in the future.
Regulatory developments may adversely affect Coca-Cola FEMSA’s business.
Coca-Cola FEMSA is subject to regulation in each of the territories in which it operates. The principal areas in which Coca-Cola FEMSA is subject to regulation are environment, labor, taxation, health and antitrust. Regulation can also affect Coca-Cola FEMSA’s ability to set prices for its products. The adoption of new laws or regulations or a stricter interpretation or enforcement thereof in the countries in which Coca-Cola FEMSA operates may increase its operating costs or impose restrictions on its operations, which in turn, may adversely affect its financial condition, business and results offrom operations. In particular, environmental standards are becoming more stringent in several of the countries in which Coca-Cola FEMSA operates and Coca-Cola FEMSA is in the process of complying with these new standards.standards, although we cannot assure you that Coca-Cola FEMSA will be able to meet any timelines for compliance established by the relevant regulatory authorities. See “Item 4. Information on the Company—Regulatory Matters—Environmental Matters.” Further changes in current regulations may result in an increase in compliance costs, which may have an adverse effect on Coca-Cola FEMSA’s future results offrom operations or financial condition.
Voluntary price restraints or statutory price controls have been imposed historically in several of the countries in which Coca-Cola FEMSA operates. It is currently subject to price controls in Argentina. The imposition of these restrictions or voluntary price restraints in the futureother territories may have an adverse effect on Coca-Cola FEMSA’s results offrom operations and financial position. Although Mexican bottlers have been free to set prices for sparkling beverages without governmental intervention since January 1996, such prices had been subject to statutory price controls and to voluntary price restraints, which effectively limited Coca-Cola FEMSA’s ability to increase prices in the Mexican market without governmental consent. We cannot assure you that governmental authorities in any country where Coca-Cola FEMSA operates will not impose statutory price controls or that it will need to implement voluntary price restraints in the future.
In January 2010, the Venezuelan government amended theLey para la Defensa y Acceso a las Personas a los Bienes y Servicios(Access to Goods and Services Defense Law). Any violation by a company that produces, distributes and sells goods and services could lead to fines, penalties or the confiscation of the assets used to produce, distribute and sell these goods without compensation. Although we believe that Coca-Cola FEMSA is in compliance with this law, consumer protection laws in Venezuela are subject to continuing review and changes, and any such changes could lead to an adverse impact on Coca-Cola FEMSA.
Coca-Cola FEMSA’s operations have from time to time been subject to investigations and proceedings by antitrust authorities and litigation relating to alleged anticompetitive practices. Coca-Cola FEMSA has also been subject to investigations and proceedings on environmental and labor matters. See “Item 8. Financial Information—Legal Proceedings.” We cannot assure you that these investigations and proceedings willcould not have an adverse effect on Coca-Cola FEMSA’s results offrom operations or financial condition.
Unfavorable economicEconomic and political conditions in Mexico, Brazil or the United Statesother Latin American countries in which Coca-Cola FEMSA operates may adversely affect FEMSA Cerveza’shave an increasingly adverse effect on its business.
Demand for the products of FEMSA Cerveza may be affected by economic conditionsIn addition to operating in Mexico, our subsidiary Coca-Cola FEMSA conducts operations in Guatemala, Nicaragua, Costa Rica, Panama, Colombia, Venezuela, Brazil or the United States. In particular, demand in northern Mexico, where there are a large number of border towns, may be disproportionately affected by the performance of the United States’ economy. In addition, FEMSA Cerveza’s exports to the United States may be affected by reduced demandand Argentina. Total revenues and income from the United States or from a reduction in prices by its competitors. Any depreciation of the Mexican peso may negatively affect its results ofCoca-Cola FEMSA’s combined non-Mexican operations because a significant portion of its costs and expenses are denominated in, or determined by reference to, the U.S. dollar.
Uncertainty in commodity prices of raw materials used by FEMSA Cerveza may result in increased costs and adversely affect its results of operations.
FEMSA Cerveza purchases a number of commodities for the production of its products (principally aluminum, barley, malt and hops) from Mexican producers and in the international market. The prices of such commodities can fluctuate and are determined by global supply and demand and other factors, including changes in exchange rates, over which FEMSA Cerveza has no control. Market prices for aluminum increased by approximately 3% in 2007. Because aluminum prices are denominated in U.S. dollars, an appreciation of the U.S. dollar against the Mexican peso would increase the cost to FEMSA Cerveza as a percentage of net sales, as its salestheir consolidated total revenues and income from operations from 42.8% and 29.5%, respectively, in 2005 to 62.5% and 61.3%, respectively, in 2010. As a consequence, Coca-Cola FEMSA’s results have been increasingly affected by the economic and political conditions in the countries, other than Mexico, where it conducts operations.
Consumer demand, preferences, real prices and the costs of raw materials are generallyheavily influenced by macroeconomic and political conditions in the other countries in which Coca-Cola FEMSA operates. These conditions vary by country and may not be correlated to conditions in Mexican pesos. Barley market prices increased moreoperations. In Venezuela, Coca-Cola FEMSA continues to face exchange rate risk as well as scarcity of raw materials and restrictions with respect to the import of such materials. Deterioration in economic and political conditions in any of these countries would have an adverse effect on Coca-Cola FEMSA’s financial position and results from operations.
Depreciation of the local currencies of the countries in which Coca-Cola FEMSA operates against the U.S. dollar may increase its operating costs. Coca-Cola FEMSA has also operated under exchange controls in Venezuela since 2003 that limit the ability to remit dividends abroad or make payments other than 35% in 2007.local currencies and that may increase the real price paid for raw materials and services purchased in local currency. In January 2010, the Venezuelan government announced a devaluation of its official exchange rate and the establishment of a multiple exchange rate system of (1) 2.60 bolivars to US$ 1.00 for high priority categories (2) 4.30 bolivars to US$ 1.00 for non-priority categories and (3) the recognition of the existence of other exchange rates that the government shall determine. In January 2011, the
Venezuelan government announced that its only official exchange rate as of January 1, 2011 is 4.30 bolivars to US$ 1.00, although the Venezuelan government continues to recognize the existence of other exchange rates that the government shall determine; FEMSA Cerveza’s expects barley pricesthis devaluation may have an adverse impact on its results from operations as a result of the exchange rate as applied to increase,Coca-Cola FEMSA’s U.S. dollar-denominated raw material costs. Future currency devaluation or the imposition of exchange controls in any of the countries in which Coca-Cola FEMSA has operations could have an adverse effect on average over 35%its financial position and results from operations.
During 2010, Coca-Cola FEMSA’s plant in 2008, due to grain price increasesValencia, Venezuela, was affected by a strike for 26 days, which stopped all production at this plant. The Valencia plant is Coca-Cola FEMSA’s principal plant, producing 50% of the volume of sales in Venezuela. A final agreement was reached with the union that resulted in additional expenditures in the international markets. There can be no assurance that FEMSA Cerveza will be able to recover increasesform of increased wages and certain improvements in work conditions for the cost of raw materials. See “Item 4. Information on the Company—FEMSA Cerveza—Raw Materials.” An increase in raw materials costs would adversely affect its results of operations and cash flows.
FEMSA Cerveza’s sales in the United States depend on distribution arrangements with Heineken USA.
Heineken USA Inc., or Heineken USA, is the exclusive importer, marketer and distributor of FEMSA Cerveza’s beer brands in the United States. In April 2007, FEMSA Cerveza and Heineken USA entered into a new ten-year agreement, which began in January 2008, pursuant to which Heineken USA will continue to be the exclusive importer, marketer and distributor of FEMSA Cerveza’s beer brands in the United States. Accordingly, FEMSA Cerveza’s exports to the United States depend to a significant extent on Heineken USA’s performance under these agreements. See “Item 5. Operating and Financial Review and Prospectus—Recent Developments.” We cannot assure that Heineken USApolitical or social developments in any of the countries in which Coca-Cola FEMSA has operations, and over which it has no control, will be able to maintainnot have a corresponding adverse effect on the economic situation and on Coca-Cola FEMSA’s business, financial condition or increase salesresults from operations.
Weather conditions may adversely affect Coca-Cola FEMSA’s results.
Lower temperatures and higher rainfall may negatively impact consumer patterns, which may result in lower per capita consumption of FEMSA Cerveza’s beer brandsCoca-Cola FEMSA’s beverage offerings. Additionally, adverse weather conditions may affect road infrastructure in the United States, nor that when the new agreement expiresterritories in December of 2017,which Coca-Cola FEMSA Cerveza will be able to renew the agreement or enter into a substitute arrangement on comparable terms.
FEMSA Cerveza’s sales in the Mexican market depend onoperates and may limits its ability to compete with Grupo Modelo.
FEMSA Cerveza faces competitionsell and distribute its products, thus affecting Coca-Cola FEMSA’s results from operations. As was the case in the Mexican beer market from Grupo Modelo, S.A.B. de C.V., or Grupo Modelo. FEMSA Cerveza’s ability to compete successfullyMexico, Colombia, Venezuela and Central America in the Mexican beer market will have a significant impact on its Mexican sales. See “Item 4. Information on the Company—FEMSA Cerveza—The Mexican Beer Market.”
FEMSA Cerveza’s2010, adverse weather conditions affected Coca-Cola FEMSA’s sales in the Brazilian market depend on its ability to compete with Ambev and local brewers.
FEMSA Cerveza faces competition in the Brazilian beer market from Companhia de Bebidas das Americas, or AmBev, Grupo Schincariol and Cervejarias Petropolis. FEMSA Cerveza’s ability to compete successfully in the Brazilian beer market will have a significant impact on its Brazilian sales. See “Item 4. Information on the Company—FEMSA Cerveza—The Brazilian Beer Market.”
Competition from imports in the Mexican beer market is increasing and may adversely affect FEMSA Cerveza’s business.
Imports represented 2.3% of the Mexican beer market in terms of sales volume in 2007. Under the North American Free Trade Agreement, or NAFTA, the tariffs applicable to beers imported from the United States and Canada were eliminated in January 2001. Increased import competition, however, could result from potential new entrants to the Mexican beer market or from a change in consumer preferences in Mexico and could lead to greater competition in general, which may adversely affect FEMSA Cerveza’s business, financial position and results of operations. See “Item 4. Information on the Company—FEMSA Cerveza—The Mexican Beer Market.”
Regulatory developments in our main markets could adversely affect FEMSA Cerveza’s business.
FEMSA Cerveza’s business is subject to a variety of different government regulations in our key markets of Mexico, Brazil and the United States, and thus may be affected by changes in law, regulation or regulatory policy. Particularly in Mexico, actions of federal and local authorities, specifically changes in governmental policy with respect to excise and value-added tax laws or cold beer regulation and governmental actions relating to the beer industry practice of financing and bringing support to the point of sale through agreements or arrangements with retailers to sell and promote a beer producer’s products, may have a material adverse effect on FEMSA Cerveza’s business, financial position and results of operations.
Federal regulation of beer consumption in Mexico is primarily effected through a 25% excise tax, which includes an alternative minimum Mexican peso amount of Ps. 3.00 per liter for non-returnable presentations and Ps. 1.74 per liter for returnable presentations, and a 15% value-added tax. Currently, we do not anticipate an increase in these taxes, but federal regulation relating to excise taxes may change in the future, resulting in an increase or decrease in the tax. Local regulations are primarily effected through the issuance of licenses authorizing retailers to sell alcoholic beverages. Other regulations affecting beer consumption in Mexico vary according to local jurisdictions and include limitations on the hours during which restaurants, bars and other retail outlets are allowed to sell beer. See “Item 4. Information on the Company—FEMSA Cerveza—The Mexican Beer Market.”
FEMSA Cerveza may not be able to improve performance in its Brazilian operations.
FEMSA Cerveza owns 83% of Brazilian brewer Cervejarias Kaiser Brasil S.A., or Kaiser. Prior to the acquisition of Kaiser, Kaiser’s profitability and market position had declined as a result of operational changes by the prior owner and increased competition in the Brazilian beer market. Kaiser’s operating margins are therefore lower than those of FEMSA Cerveza’s Mexican operations. FEMSA Cerveza continues to be in the process of implementing a number of initiatives to seek to improve Kaiser’s performance, although FEMSA Cerveza has not previously conducted operations in the Brazilian beer market, where market conditions differ significantly from Mexico. FEMSA Cerveza’s initiatives may not be successful in improving Kaiser’s performance, which would adversely affect FEMSA Cerveza’s sales growth and operating margins.
A water supply shortage could adversely affect FEMSA Cerveza’s business.
FEMSA Cerveza purchases water from Mexican government entities and obtains pump water from its own wells pursuant to concessions granted by the Mexican government.
FEMSA Cerveza believes that its water concessions will satisfy its current and future water requirements. We cannot assure, however, that isolated periods of adverse weather will not affect FEMSA Cerveza’s supply of water to meet its future production needs in any given period, or that its concessions will not be terminated or will be renewed by the Mexican government. Anycertain regions of these events or actions may adversely affect FEMSA Cerveza’s business, financial position and results of operations.territories.
Competition from other retailers in Mexico could adversely affect FEMSA Comercio’s business.
The Mexican retail sector is highly competitive. FEMSA participates in the retail sector primarily through FEMSA Comercio. FEMSA Comercio’s OXXO convenience stores face competition on a regional basis from 7-Eleven, Super Extra, which is owned and managed by Grupo Modelo, our main competitor in the Mexican beer market, Super City AM/PM and Circle K stores. OXXO convenience stores also face competition from numerous small chains of retailers across Mexico. In the future, OXXO stores may face additional competition from other retailers that do not currently participate in the convenience store sector or from new market entrants. Increased competition may limit the number of new locations available to FEMSA Comercio and require FEMSA Comercio to modify its product offering or pricing. In addition, consumers may prefer alternative products or store formats offered by competitors. As a result, FEMSA Comercio’s results offrom operations and financial position may be adversely affected by competition in the future.
Sales of OXXO convenience stores may be adversely affected by changes in economic conditions in Mexico.
Convenience stores often sell certain products at a premium. The convenience store market is thus highly sensitive to economic conditions, since an economic slowdown is often accompanied by a decline in consumer purchasing power, which in turn results in a decline in the overall consumption of FEMSA Comercio’s main product categories. During periods of economic slowdown, OXXO stores may experience a decline in traffic per store and purchases per customer, and this may result in a decline in FEMSA Comercio’s results offrom operations.
FEMSA Comercio may not be able to maintain its historic growth rate.
FEMSA Comercio increased the number of OXXO stores at an averagea compound annual growth rate of 19%14.8% from 20032006 to 2007.2010. The growth in the number of OXXO stores has driven growth in total revenue and operating income at FEMSA Comercio over the same period. As the overall number of stores increases, percentage growth in the number of OXXO stores is likely to decrease. In addition, as convenience store penetration in Mexico grows, the number of viable new store locations may decrease, and new store locations may be less favorable in terms of same store sales, average ticket and store traffic. As a result, FEMSA Comercio’s future results offrom operations and financial condition may not be consistent with prior periods and may be characterized by lower growth rates in terms of total revenue and operating income. In Colombia, FEMSA Comercio may not be able to maintain similar historic growth rates to those in Mexico.
FEMSA Comercio’s business may be adversely affected by an increase in the crime rate in Mexico.
In recent years, crime rates have increased, particularly in the north of Mexico and there has been a particular increase in drug-related crime and other organized crime. Although FEMSA Comercio has stores across the majority of the Mexican territory, the north of Mexico represents an important region in FEMSA Comercio’s operations. An increase in crime rates could negatively affect sales and customer traffic, increase security expenses incurred in each store, result in higher turnover of personnel or damage to the perception of the OXXO brand, each of which could have an adverse effect on FEMSA Comercio’s business.
FEMSA Comercio’s business may be adversely affected by changes in information technology.
FEMSA Comercio invests aggressively in information technology in order to maximize its value generation potential. Given the rapid speed at which FEMSA Comercio adds new services and products to its commercial offerings, the development of information technology systems, hardware and software needs to keep pace with the growth of the business. If these systems became unstable or if planning for future information technology investments were inadequate, it could affect FEMSA Comercio’s business by reducing the flexibility of its value proposition to consumers or by increasing its operating complexity, either of which could adversely affect FEMSA Comercio’s revenue-per-store trends.
Risks Related to Our Holding of Heineken N.V. and Heineken Holding N.V. Shares
FEMSA will not control Heineken N.V.’s and Heineken Holding N.V.’s decisions.
On April 30, 2010, FEMSA announced the closing of the transaction pursuant to which FEMSA agreed to exchange 100% of its beer operations for a 20% economic interest in the Heineken Group, which we refer to as the Heineken transaction. As a consequence of the Heineken transaction, FEMSA now participates in the Heineken Holding N.V. Board, which we refer to as the Heineken Holding Board, and in the Heineken N.V. Supervisory Board, which we refer to as the Heineken Supervisory Board. However, FEMSA is not a majority or controlling shareholder of Heineken N.V. and Heineken Holding N.V., nor does it control the decisions of the Heineken Holding Board or the Heineken Supervisory Board. Therefore, the decisions made by the majority or controlling shareholders of Heineken N.V. and Heineken Holding N.V. or the Heineken Holding Board or the Heineken Supervisory Board may not be consistent with or may not consider the interests of FEMSA’s shareholders or may be adverse to the interests of FEMSA’s shareholders. Additionally, FEMSA has agreed not to disclose non-public information and decisions taken by Heineken.
Heineken is present in a large number of countries.
Heineken is a global distributor and brewer of beer in a large number of countries. As a consequence of the Heineken transaction, FEMSA shareholders are indirectly exposed to the political, economic and social circumstances affecting the markets in which Heineken is present, which may have an adverse effect on the value of FEMSA’s interest in Heineken, and, consequently, the value of FEMSA shares.
Strengthening of the Mexican peso.
In the event of a depreciation of the Euro (€) against the Mexican Peso, the fair value of FEMSA’s investment in shares will be adversely affected.
Furthermore, the cash flow that is expected to be received in the form of dividends from Heineken will be in Euros, and therefore, in the event of a depreciation of the Euro against the Mexican Peso, the amount of expected cash flow will be adversely affected.
Heineken N.V. and Heineken Holding N.V. are publicly listed companies.
Heineken N.V. and Heineken Holding N.V. are listed companies whose stock trades publicly and is subject to market fluctuation. A reduction in the price of Heineken N.V. and Heineken Holding N.V. shares would result in a reduction in the economic value of FEMSA’s participation in Heineken.
Risks Related to Our Principal Shareholders and Capital Structure
A majority of our voting shares are held by a voting trust, which effectively controls the management of our company, and whose interests may differ from those of other shareholders.
As of MayApril 30, 2008,2011, a voting trust, the participants of which are members of fiveseven families, owned 38.65%38.69% of our capital stock and 74.78%74.86% of our capital stock with full voting rights, consisting of the Series B Shares. Consequently, the voting trust has the power to elect a majority of the members of our board of directors and to play a significant or controlling role in the outcome of substantially all matters to be decided by our board of directors or our shareholders. The interests of the voting trust may differ from those of our other shareholders. See “Item 7. Major Shareholders and Related Party Transactions” and “Item 10. Additional Information—Bylaws—Voting Rights and Certain Minority Rights.”
Holders of Series D-B and D-L Shares have limited voting rights.
Holders of Series D-B and D-L Shares have limited voting rights and are only entitled to vote on specific matters, such as certain changes in the form of our corporate organization, dissolutions, liquidations,dissolution, or liquidation, a merger with a company with a distinct corporate purpose, a merger in which we are not the surviving entity, a change of our jurisdiction of incorporation, the cancellation of the registration of the Series D-B and D-L Shares and any other matters that expressly require approval from such holders under the new Mexican Securities Market Law, which we refer to as the Mexican Securities Law. As a result of these limited voting rights, Series D-B and D-L these holders will not be able to influence our business or operations. See “Item 7. Major Shareholders and Related Party Transactions—Major Shareholders” and “Item 10. Additional Information—Bylaws—Voting Rights and Certain Minority Rights.”
Holders of ADSs may not be able to vote at our shareholder meetings.
Our shares are traded on the New York Stock Exchange, NYSE, in the form of ADSs. We cannot assure you that holders of our shares in the form of ADSs will receive notice of shareholders’ meetings from our ADS depositary in sufficient time to enable such holders to return voting instructions to the ADS depositary in a timely manner. In the event that instructions are not received with respect to any shares underlying ADSs, the ADS depositary will, subject to certain limitations, grant a proxy to a person designated by us in respect of these shares. In the event that this proxy is not granted, the ADS depositary will vote these shares in the same manner as the majority of the shares of each class for which voting instructions are received.
Holders of BD Units in the United States and holders of ADSs may not be able to participate in any future preemptive rights offering and as a result may be subject to dilution of their equity interests.
Under applicable Mexican law, if we issue new shares for cash as a part of a capital increase, other than in connection with a public offering of newly issued shares or treasury stock, we are generally required to grant our shareholders the right to purchase a sufficient number of shares to maintain their existing ownership percentage.
Rights to purchase shares in these circumstances are known as preemptive rights. We may not legally allow holders of our shares or ADSs who are located in the United States to exercise any preemptive rights in any future capital increases unless (1) we file a registration statement with the SEC with respect to that future issuance of shares or (2) the offering qualifies for an exemption from the registration requirements of the U.S. Securities Act of 1933. At the time of any future capital increase, we will evaluate the costs and potential liabilities associated with filing a registration statement with the SEC, as well as the benefits of preemptive rights to holders of our shares in the form of ADSs in the United States and any other factors that we consider important in determining whether to file a registration statement.
We may decide not to file a registration statement with the SEC to allow holders of our shares or ADSs who are located in the United States to participate in a preemptive rights offering. In addition, under current Mexican law, the sale by the ADS depositary of preemptive rights and the distribution of the proceeds from such sales to the holders of our shares in the form of ADSs is not possible. As a result, the equity interest of holders of our shares in the form of ADSs would be diluted proportionately. See “Item 10. Additional Information—Bylaws—Preemptive Rights.”
The protections afforded to minority shareholders in Mexico are different from those afforded to minority shareholders in the United States.
Under Mexican law, the protections afforded to minority shareholders are different from, and may be less than, those afforded to minority shareholders in the United States. Mexican laws do not provide a remedy to shareholders relating to violations of fiduciary duties, thereduties. There is no procedure for class actions as such actions are conducted in the United States and there are different procedural requirements for bringing shareholder lawsuits against directors for the benefit of companies. Therefore, it may be more difficult for minority shareholders to enforce their rights against us, our directors or our controlling shareholders than it would be for minority shareholders of a United States company.
Investors may experience difficulties in enforcing civil liabilities against us or our directors, officers and controlling persons.
FEMSA is organized under the laws of Mexico, and most of our directors, officers and controlling persons reside outside the United States. In addition, all or a substantial portion of our assets and their respective assets are located outside the United States. As a result, it may be difficult for investors to effect service of process within the United States on such persons or to enforce judgments against them, including any action based on civil liabilities under the U.S. federal securities laws. There is doubt as to the enforceability against such persons in Mexico, whether in original actions or in actions to enforce judgments of U.S. courts, of liabilities based solely on the U.S. federal securities laws.
Developments in other countries may adversely affect the market for our securities.
The market value of securities of Mexican companies is, to varying degrees, influenced by economic and securities market conditions in other emerging market countries. Although economic conditions are different in each country, investors’ reaction to developments in one country can have effects on the securities of issuers in other countries, including Mexico. We cannot assure you that events elsewhere, especially in emerging markets, will not adversely affect the market value of our securities.
The failure or inability of our subsidiaries to pay dividends or other distributions to us may adversely affect us and our ability to pay dividends to holders of ADSs.
FEMSA is a holding company. Accordingly, FEMSA’s cash flows are principally derived from dividends, interest and other distributions made to FEMSA by its subsidiaries. Currently, FEMSA’s subsidiaries do not have contractual obligations that require them to pay dividends to FEMSA. In addition, debt and other contractual obligations of our subsidiaries may in the future impose restrictions on our subsidiaries’ ability to make dividend or other payments to FEMSA, which in turn may adversely affect FEMSA’s ability to pay dividends to shareholders and meet its debt and other obligations. As of December 31, 2010, FEMSA had no restrictions on its ability to pay
dividends. Given the exchange of 100% of our FEMSA Cerveza business for a 20% interest in the Heineken Group, FEMSA’s non-controlling shareholder position in Heineken N.V. and Heineken Holding N.V. means that it will be unable to require payment of dividends with respect to the Heineken N.V. and Heineken Holding N.V. shares.
Risks Related to Mexico and the Other Countries in Which We Operate
Adverse economic conditions in Mexico may adversely affect our financial position and results offrom operations.
We are a Mexican corporation, and our Mexican operations are our single most important geographic segment.territory. Given the exchange of 100% of our FEMSA Cerveza business for a 20% interest in the Heineken Group, FEMSA shareholders may face a lesser degree of exposure with respect to economic conditions in Mexico and a greater degree of indirect exposure to the political, economic and social circumstances affecting the markets in which Heineken is present. For the year ended December 31, 2007, 72%2010, 62% of our consolidated total revenues were attributable to Mexico and at the net income level the percentage attributable to our Mexican operations is further reduced. The Mexican economy experienced a downturn as a result of the impact of the global financial crisis on many emerging economies that began in the second half of 2008 and continued through 2010. In the first quarter of 2011, Mexican gross domestic product, or GDP, increased by approximately 4.6% on an annualized basis compared to the same period in 2010 due to an improvement in the manufacturing and services sectors of the economy. The Mexican economy continues to be heavily influenced by the U.S. economy, and therefore, further deterioration in economic conditions in, or delays in recovery of, the U.S. economy may hinder any recovery in Mexico. In the past, Mexico has experienced both prolonged periods of weak economic conditions and deteriorations in economic conditions that have had a negative impact on our company. Weresults from operations. Given the continuing global macroeconomic downturn in 2009 and 2010, which also affected the Mexican economy, we cannot assure you that such conditions will not return or that such conditions will not have a material adverse effect on our results offrom operations and financial position.position going forward.
Our business may be significantly affected by the general condition of the Mexican economy, or by the rate of inflation in Mexico, interest rates in Mexico and exchange rates for, or exchange controls affecting, the Mexican peso. Decreases in the growth rate of the Mexican economy, periods of negative growth and/or increases in inflation or interest rates may result in lower demand for our products, lower real pricing of our products or a shift to lower margin products. Because a large percentage of our costs and expenses are fixed, we may not be able to reduce costs and expenses upon the occurrence of any of these events, and our profit margins may suffer as a result.
In addition, an increase in interest rates in Mexico would increase the cost to us of variable rate debt, which constituted 20%52.1% of our total debt as of December 31, 20072010 (including the effect of interest rate swaps), and have an adverse effect on our financial position and results offrom operations.
Depreciation of the Mexican peso relative to the U.S. dollar could adversely affect our financial position and results offrom operations.
A depreciationDepreciation of the Mexican peso relative to the U.S. dollar would increaseincreases the cost to us of a portion of the raw materials we acquire, the price of which is paid in or determined with reference to U.S. dollars, and of our debt obligations denominated in U.S. dollars and thereby may negatively affectaffects our financial position and results offrom operations. A severe devaluation or depreciation of the Mexican peso may also result in disruption of the international foreign exchange markets and may limit our ability to transfer or to convert Mexican pesos into U.S. dollars and other currencies for the purpose of making timely payments of interest and principal on our U.S. dollar-denominated debt or obligations in other currencies. Although the value of the Mexican peso against the U.S. dollar had been fairly stable until mid-2008, in the fourth quarter of 2008, the Mexican peso depreciated approximately 27% compared to the fourth quarter of 2007. During 2009 and 2010, the Mexican peso experienced a recovery relative to the U.S. dollar of approximately 5.2% and 5.6% compared to the year of 2008 and 2009 respectively, and in the first quarter of 2011, the Mexican peso has appreciated approximately 3% compared to the fourth quarter of 2010.
While the Mexican government does not currently restrict, and since 1982 has not restricted, the right or ability of Mexican or foreign persons or entities to convert Mexican pesos into U.S. dollars or to transfer other currencies out of Mexico, the Mexican government could institute restrictive exchange rate policies in the future, as
it has done in the past. Currency fluctuations may have an adverse effect on our financial position, results offrom operations and cash flows in future periods.
When the financial markets are volatile, as they have been in recent periods, our results from operations may be substantially affected by variations in exchange rates and commodity prices, and to a lesser degree, interest rates. These effects include foreign exchange gain and loss on assets and liabilities denominated in U.S. dollars, fair value gain and loss on derivative financial instruments, commodities prices and changes in interest income and interest expense. These effects can be much more volatile than our operating performance and our operating cash flows.
Political events in Mexico could adversely affect our operations.
Mexican political events may significantly affect our operations. Presidential elections in Mexico occur every six years, and the most recent election occurred in July 2006. Elections in both houses of the Mexican Congresssenate also occurred in July 2006, and although thePartido Acción Nacional won a plurality of the seats in the Mexican Congresscongress in the election, no party succeeded in securing a majoritymajority. Elections of theCámara de Diputados(House of Representatives) occurred in either chamber2009, and although thePartido Revolucionario Institucionalwon a plurality of seats in the Mexican Congress.House of Representatives, no party succeeded in securing a majority. The absence of a clear majority by a single party is likely to continue at least until the next congressional election in 2009.continue. This situation may result in government gridlock and political uncertainty. We cannot provide any assurances that political developments in Mexico, over which we have no control, will not have an adverse effect on our business, financial condition or results offrom operations.
EconomicInsecurity in Mexico could increase and political conditionsadversely affect our results.
The presence and increasing levels of violence among drug cartels, and between these and the Mexican law enforcement and armed forces, pose a risk to our business. Organized criminal activity and related violent incidents remained high during 2010 and are relatively concentrated along the northern Mexican border, as well as in certain other Mexican states such as Sinaloa and Michoacán. Mexican President Felipe Calderón has acted to fight the drug cartels and has disrupted the balance of power among them. The principal driver of organized criminal activity is the drug trade that aims to supply and profit from the uninterrupted demand for drugs and the supply of weapons from the United States. This situation could impact our business because consumer habits and patterns adjust to the increased perceived and real insecurity as people refrain from going out as much and gradually shift some on-premise consumption to off-premise consumption of food and beverages on certain social occasions. Insecurity could increase and could therefore adversely affect our operational and financial results.
Depreciation of local currencies in other Latin American countries in which we operate may adversely affect our business.financial position.
In addition to conducting operations in Mexico, our subsidiary Coca-Cola FEMSA conducts operations in Guatemala, Nicaragua, Costa Rica, Panama, Colombia, Venezuela, Brazil and Argentina and, beginning in 2006, our subsidiary FEMSA Cerveza also conducts operations in Brazil. These countries expose us to different or greater country risk than Mexico. Consumer demand preferences, real prices and the costs of raw materials are heavily influenced by macroeconomic and political conditions in the other countries in which we operate. These conditions vary by country and may not be correlated to conditions in our Mexican operations. In particular, Brazil and Colombia have benefited from high growth rates and relative economic stability in recent periods, although these countries have a history of economic volatility and political instability. In Venezuela, Coca-Cola FEMSA faces exchange risk as well as work stoppages and potential scarcity of raw materials. Coca-Cola FEMSA has also experienced short-term disruptions in its business in Venezuela over the past few years. Deterioration in economic and political conditions in many of these countries would have an adverse effect on our financial position and results of operations.
Total revenues increased in certain of our non-Mexican beverage operations at a higher rate relative to their respective Mexican operations in 2007.2010. This higher rate of total revenue growth could result in a greater contribution to the respective results offrom operations for these territories, but may also expose us to greater risk in these territories as a result. DevaluationThe devaluation of the local currencies in countries other than Mexico against the U.S. dollar mayin our non-Mexican territories can increase our operating costs in these countries, and depreciation of the local currencies against the Mexican peso maycan negatively affect theour results offrom operations for these countries as reported in our consolidated financial statements.countries. In recent years, the Mexican peso hasvalue of the currency in the countries in which we operate had been relatively stable against the U.S. dollar, while currencies of other countries, specifically the Brazilian reais and the Colombian peso, have appreciated relative to the U.S. dollar and the Mexican peso.except in Venezuela. Future currency devaluation or the imposition of exchange controls in any of these countries, including Mexico, would have an adverse effect on our financial position and results offrom operations.
| ITEM 4. | INFORMATION ON THE COMPANY |
We are a Mexican company headquartered in Monterrey, Mexico, and our origin dates back to 1890. Our company was incorporated on May 30, 1936 and has a duration of 99 years. The duration can be extended indefinitely by resolution of our shareholders. Our legal name is Fomento Económico Mexicano, S.A.B. de C.V., and in commercial contexts we frequently refer to ourselves as FEMSA. On December 5, 2006, as required by the new Mexican Securities Law, we changed our name to reflect that we are asociedad anónima bursátil de capital variable (a variable capital listed stock corporation), whereas previously companies’ names in Mexico, including ours, did not indicate whether the company was a listed company (sociedad anónima de capital variable). Our principal executive offices are located at General Anaya No. 601 Pte., Colonia Bella Vista, Monterrey, Nuevo León 64410, Mexico. Our telephone number at this location is (52-81) 8328-6000. Our website is www.femsa.com. We are organized as asociedad anónima bursátil de capital variable under the laws of Mexico.
We conduct our operations through the following principal holding companies, each of which we refer to as a principal sub-holding company:
Coca-Cola FEMSA, which engages in the production, distribution and marketing of soft drinks;
FEMSA Cerveza,Comercio, which engages in the production, distribution and marketing of beer;operates convenience stores; and
CB Equity, which holds our investment in Heineken.
On April 30, 2010, FEMSA Comercio,announced the closing of the transaction pursuant to which operates convenience stores.FEMSA agreed to exchange 100% of its beer operations for a 20% economic interest in the Heineken Group. Under Mexican FRS, we have reclassified our audited consolidated balance sheets as of December 31, 2010 and 2009, the related consolidated statements of income and changes in stockholders’ equity and cash flows for the years ended December 31, 2010, 2009 and 2008 to reflect FEMSA Cerveza as a discontinued operation. However, FEMSA Cerveza is not a discontinued operation under U.S. GAAP. See “Item 5. Operating and Financial Review and Prospects—U.S. GAAP Reconciliation” and Notes 27 and 28 to our audited consolidated financial statements.
FEMSA traces its origins to the establishment of Mexico’s first brewery, Cervecería Cuauhtémoc, S.A. de C.V., which we refer to as Cuauhtémoc, that was founded in 1890 by four Monterrey businessmen: Francisco G. Sada, José A. Muguerza, Isaac Garza and José M. Schneider. Descendants of certain of the founders of Cuauhtémoc controlare participants of the voting trust that controls the management of our company.
In 1891, the first year of production, Cuauhtémoc produced 2,000 hectoliters of beer. Cuauhtémoc continued to expand through additions to existing plant capacity and through acquisitions of other Mexican breweries, and has continued to increase its production capacity, reaching approximately 34.596 million hectoliters in 2007.
The strategic integration of our company dates back to 1936 when our packaging operations were established to supply crown caps to the brewery. During this period, these operations were part of what was known as the Monterrey Group, which also included interests in banking, steel and other packaging operations.
In 1974, the Monterrey Group was split between two branches of the descendants of the founding families of Cuauhtémoc. The steel and other packaging operations formed the basis for the creation of Corporación Siderúrgica, S.A. (later(now Alfa, S.A.B. de C.V.), controlled by the Garza Sada family, and the beverage and banking operations were consolidated under the FEMSAValores Industriales, S.A. de C.V. (the corporate predecessor of FEMSA) corporate umbrella controlled by the Garza Lagüera family. FEMSA’s shares were first listed on the Mexican Stock Exchange on September 19, 1978. Between 1977 and 1981, FEMSA diversified its operations through acquisitions in the soft drinks and mineral water industries, the establishment of the first convenience stores under the trade name OXXO and other investments in the hotel, construction, auto parts, food and fishing industries, which were considered non-core businesses and were subsequently divested.
In August 1982, the Mexican government suspended payment on its international debt obligations and nationalized the Mexican banking system. In 1985, certain controlling shareholders of FEMSA acquired a
controlling interest in Cervecería Moctezuma, S.A., which was then Mexico’s third-largest brewery and which we refer to as Moctezuma, and related companies in the packaging industry. FEMSA subsequently undertook an extensive corporate and financial restructuring that was completed in December 1988, and pursuant to which FEMSA’s assets were combined under a single corporate entity, which became Grupo Industrial Emprex, S.A. de C.V., which we refer to as Emprex.
In October 1991, certain majority shareholders of FEMSA acquired a controlling interest in Bancomer, S.A., which we refer to as Bancomer. The investment in Bancomer was undertaken as part of the Mexican government’s reprivatization of the banking system, which had been nationalized in 1982. The Bancomer acquisition was financed in part by a subscription by Emprex’s shareholders, including FEMSA, of shares in Grupo Financiero Bancomer, S.A. de C.V. (currently Grupo Financiero BBVA Bancomer, S.A. de C.V.), which we refer to as BBVA Bancomer, the Mexican financial services holding company that was formed to hold a controlling interest in Bancomer. In February 1992, FEMSA offered Emprex’s shareholders the opportunity to exchange the BBVA Bancomer shares to which they were entitled for Emprex shares owned by FEMSA. In August 1996, the shares of BBVA Bancomer that were received by FEMSA in the exchange with Emprex’s shareholders were distributed as a dividend to FEMSA’s shareholders.
Upon the completion of these transactions, we began a series of strategic transactions to strengthen the competitive positions of our operating subsidiaries. These transactions included the sale of a 30% strategic interest in Coca-Cola FEMSA to a wholly-owned subsidiary of The Coca-Cola Company and a subsequent public offering of Coca-Cola FEMSA shares, both of which occurred in 1993, and the sale of a 22% strategic interest in FEMSA Cerveza to Labatt Brewing Company Limited, which we refer to as Labatt, in 1994. Labatt, which was later acquired by InBev S.A., or InBev (known at the time of the acquisition of Labatt as Interbrew)Interbrew and currently referred to as A-B InBev), subsequently increased its interest in FEMSA Cerveza to 30%.
In 1998, we completed a reorganization that:
simplifiedchanged our capital structure by converting our outstanding capital stock at the time of the reorganization into BD Units and B Units, and
united the shareholders of FEMSA and the former shareholders of Emprex at the same corporate level through an exchange offer that was consummated on May 11, 1998.
As part of the reorganization, FEMSA listed ADSs on the New York Stock Exchange representing BD Units, and listed the BD Units and its B Units on the Mexican Stock Exchange.
In May 2003, our subsidiary Coca-Cola FEMSA expanded its operations throughout Latin America by acquiring 100% of Panamco México, S.A. de C.V,C.V., which we refer to as Panamco, then the largest soft drink bottler in Latin America in terms of sales volume in 2002. Through its acquisition of Panamco, Coca-Cola FEMSA began producing and distributingCoca-Cola trademark beverages in additional territories in Mexico, Central America, Colombia, Venezuela and Brazil, along with bottled water, beer and other beverages in some of these territories. The Coca-Cola Company and its subsidiaries received Series D Shares in exchange for their equity interest in Panamco of approximately 25%.
On August 31, 2004, we consummated a series of transactions with InBev, Labatt and certain of their affiliates to terminate the existing arrangements between FEMSA Cerveza and Labatt. As a result of these transactions, FEMSA acquired 100% ownership of FEMSA Cerveza and previously existing arrangements among affiliates of FEMSA and InBev relating to governance, transfer of ownership and other matters with respect to FEMSA Cerveza were terminated.
On June 1, 2005, we consummated an equity offering of 80.5 million BD Units (including BD Units in the form of ADSs) and 52.78 million B units that resulted in net proceeds to us of US$ 700 million after underwriting spreads and commissions. We used the proceeds of the equity offering to refinance indebtedness incurred in connection with the transactions with InBev, Labatt and certain of their affiliates.
On January 13, 2006, FEMSA Cerveza, through one of its subsidiaries, acquired 68% of the equity of the Brazilian brewer Kaiser from the Molson Coors Brewing Company, or Molson Coors, for US$ 68 million. Molson Coors retained a 15% ownership stake in Kaiser, while Heineken N.V.’s ownership of 17% remained unchanged. In December 2006, Molson Coors completed its exit from Kaiser by exercising its option to sell its 15% holding to FEMSA Cerveza. On December 22, 2006, FEMSA Cerveza made a capital increase of US$200 million in Kaiser. At the time, Heineken N.V. elected not to participate in the increase, thereby diluting its 17% interest in Kaiser to 0.17%, and FEMSA Cerveza thereby increasing its stake to 99.83% of the equity of Kaiser, however, in August 2007, FemsaFEMSA Cerveza and Heineken NVN.V. closed a stock purchase agreement whereby Heineken NVN.V. purchased the shares necessary to regain its 17% interest in Kaiser. As a result of this transaction, FEMSA Cerveza now ownsobtained ownership of 83% of Kaiser and Heineken NV ownsN.V. obtained ownership of 17%.
On November 3, 2006, we acquired from certain subsidiaries of The Coca-Cola Company 148,000,000 Series “D” shares of Coca-Cola FEMSA, representing 8.02% of the total outstanding stock of Coca-Cola FEMSA. We acquired these shares at a price of US$ 2.888 per share, or US$ 427.4 million in the aggregate, pursuant to a Memorandum of Understanding with The Coca-Cola Company. As of MayMarch 30, 2008,2011, FEMSA indirectly owns 53.7% of the capital stock of Coca-Cola FEMSA (63.0% of its capital stock with full voting rights) and The Coca-Cola Company indirectly owns 31.6% of the capital stock of Coca-Cola FEMSA (37.0% of its capital stock with full voting rights). The remaining 14.7% of its capital consists of Series L Shares with limited voting rights, which trade on the Mexican Stock Exchange and on the New York Stock Exchange in the form of ADSs under the trading symbol KOF.
In November 2007, Coca-Cola FEMSA and The Coca-Cola Company acquired Jugos del Valle from its controlling shareholders through a 100% tender offer for an aggregate price of US$ 456 million, including the assumption of net existing debt of approximately US$ 86 million.
In March 2007, at our company’s annual meeting,AGM, our shareholders approved a three-for-one stock split of FEMSA’s outstanding stock and our ADSs traded on the NYSE. The pro rata stock split had no effect on the ownership structure of FEMSA. The new units issued in the stock split were distributed by the Mexican Stock Exchange on May 28, 2007, to holders of record as of May 25, 2007, and ADSs traded on the NYSE were distributed on May 30, 2007, to holders of record as of May 25, 2007.
On November 8, 2007, Administración, S.A.P.I. de C.V., or Administración S.A.P.I., a Mexican company owned directly or indirectly by Coca-Cola FEMSA and by The Coca-Cola Company, acquired 58,350,908 shares representing 100% of the shares of the capital stock of Jugos del Valle, for US$ 370 million in cash, with assumed liabilities of US$ 86 million. On June 30, 2008, Administración S.A.P.I. and Jugos del Valle merged, and Jugos del Valle became the surviving entity. Subsequent to the initial acquisition of Jugos del Valle, Coca-Cola FEMSA offered to sell 30% of its interest in Administración S.A.P.I. to other Coca-Cola bottlers in Mexico. In December 2008, the surviving Jugos del Valle entity sold its operations to The Coca-Cola Company, Coca-Cola FEMSA and other bottlers ofCoca-Cola trademark brands in Brazil. These still beverage operations were integrated into a joint business with The Coca-Cola Company in Brazil. Through Coca-Cola FEMSA’s joint ventures with The Coca-Cola Company, we distribute the Jugos del Valle line of juice-based beverages and have begun to develop and distribute new products. As of December 31, 2010, 2009 and 2008, Coca-Cola FEMSA has a recorded investment of 19.8% of the capital stock of Jugos del Valle.
On April 22, 2008, FEMSA shareholders approved a proposal to amend our bylaws in order to preserve the unit structure for our shares that has been in place since May 1998, and to maintain our existing share structure beyond May 11, 2008. Our bylaws previously provided that on May 11, 2008 our Series D-B Shares would convert into Series B Shares and our Series D-L Shares would convert into Series L Shares with limited voting rights. In addition, our bylaws provided that on May 11, 2008, our current unit structure would cease to exist and each of our B Units would be unbundled into five Series B Shares, while each BD Unit would unbundle into three Series B Shares and two newly issued Series L Shares. Following the April 22, 2008 shareholder approvals, the automatic conversion of our share and unit structures will no longer exist, and, absent shareholder action, our share structure will continue to be comprised of Series B Shares, which must represent up tonot less than 51% of our outstanding capital stock, and Series D-B and Series D-L Shares, which together may represent up to 49% of our outstanding capital stock. Our Unit structure, absent shareholder action, will continue to consist of B Units, which bundle five Series B Shares, and BD Units, which bundle one Series B Share, two Series D-B Shares and two Series D-L Shares. See “The“Item 9. The Offer and Listing – Listing—Description of Securities.”
Mr. Eugenio Garza Lagüera, our Honorary Life Chairman, passed away onIn May 24, 2008. Mr. Garza Lagüera began his professional career as a chemist2008, Coca-Cola FEMSA completed its acquisition of REMIL in Cuauhtémoc’s research departmentBrazil for US$ 364.1 million, net of cash received, and became chairmanassumed liabilities of ourUS$ 196.9 million.
On January 11, 2010, FEMSA announced that its Board of Directors unanimously approved a definitive agreement under which FEMSA would exchange its FEMSA Cerveza business for a 20% economic interest in Heineken, one of the world’s leading brewers. Under the terms of the agreement, FEMSA received 43,018,320 shares of Heineken Holding N.V. and 43,009,699 shares of Heineken N.V., with an additional 29,172,504 shares to be delivered pursuant to an allotted share delivery instrument. It is expected that the allotted shares will be acquired by Heineken in the secondary market for delivery to FEMSA over a term not to exceed five years. Nonetheless, during the period for the delivery of the allotted shares, FEMSA will be subject to all the economic benefits, as well as the risk and obligations, of the Heineken Group as if such shares had been delivered at the closing of the transaction on April 29, 1969. He served30, 2010. Heineken would also assume US$ 2.1 billion of indebtedness, including FEMSA Cerveza’s unfunded pension obligations. The principal terms of the Heineken transaction documents are summarized below in “Item 10. Additional Information—Material Contracts.”
On February 1, 2010, FEMSA signed an agreement with subsidiaries of The Coca-Cola Company to amend the shareholders agreement for Coca-Cola FEMSA. The purpose of the amendment is to set forth that the appointment and compensation of the chief executive officer and all officers reporting to the chief executive officer, as well as the adoption of decisions related to the ordinary operations of Coca-Cola FEMSA, shall only require a simple majority vote of the board of directors. Decisions related to extraordinary matters (such as business acquisitions or combinations in an amount exceeding US$ 100 million, among others) shall continue to require the vote of the majority of the board of directors, including the affirmative vote of two of the board members appointed by The Coca-Cola Company. The amendment was approved at Coca-Cola FEMSA’s extraordinary shareholders meeting on April 14, 2010, and is reflected in the by-laws of Coca-Cola FEMSA. This amendment was signed without transfer of any consideration. The percentage of our voting interest in our subsidiary Coca-Cola FEMSA remains the same after the signing of this amendment.
On April 22, 2010, Heineken N.V. and Heineken Holding N.V. held their AGM, and approved the acquisition of 100% of the shares of the beer operations owned by FEMSA, under the terms announced on January 11, 2010. The AGM of Heineken appointed, subject to the completion of the acquisition of FEMSA’s beer operations, Mr. Jose Antonio Fernández Carbajal as member of several boardsthe Board of directorsDirectors of nationalHeineken Holding N.V. and international firms. Heineken Supervisory Board, and Mr. Javier Astaburuaga Sanjines as second representative in the Heineken Supervisory Board. Their appointments became effective on April 30, 2010.
On April 26, 2010, FEMSA held its AGM, during which shareholders approved the transaction with Heineken. Shareholders approved the exchange of 100% of FEMSA’s beer operations in Mexico and Brazil for a 20% economic interest in the Heineken Group, and the assumption by Heineken of debt in the amount of US$2.1 billion dollars, under the transaction terms described on January 11, 2010.
On April 30, 2010, FEMSA announced the closing of the transaction pursuant to which FEMSA agreed to exchange 100% of its beer operations for a 20% economic interest in the Heineken Group. The principal terms of the Heineken transaction documents are summarized below in “Item 10. Additional Information—Material Contracts.”
On September 2010, FEMSA sold Promotora de Marcas Nacionales, S. de R.L. de C.V., which we refer to as Promotora, to The Coca-Cola Company. Promotora was the owner of theMundet brands of soft drinks in Mexico.
On September 2010, FEMSA signed definitive agreements with GPC III, B.V. to sell its flexible packaging and label operations, Grafo Regia, S.A. de C.V. This transaction was part of FEMSA’s strategy to divest non-core assets. The transaction was closed on December 31, 2010.
During his life he was recognizedthe third quarter of 2010, Coca-Cola FEMSA completed a transaction with a Brazilian subsidiary of The Coca-Cola Company to produce, sell and distributeMatte Leão branded products. This transaction will reinforce Coca-Cola FEMSA’s non-carbonated product offering through the platform that is operated by The Coca-Cola Company and its bottling partners in Brazil. As a part of the agreement, Coca-Cola FEMSA has been selling and distributing certainMatte Leão branded ready-to-drink products since the first quarter of 2010. Coca-Cola FEMSA currently has a 13.84% indirect interest in theMatte Leão business in Brazil.
On March 17, 2011, a consortium of investors formed by FEMSA, the Macquarie Mexican Infrastructure Fund and other investors, acquired Energía Alterna Istmeña, S. de R.L. de C.V., which we refer to as EAI, and Energía Eólica Mareña, S.A. de C.V., which we refer to as EEM, from subsidiaries of Preneal, S.A., which we refer to as Preneal, for his entrepreneuriala transaction enterprise value of Ps. 1,063.5 million. FEMSA owns a 45% interest in the consortium. EAI and social trajectories.EEM are the owners of a 396 megawatt late-stage wind energy project in the south-eastern region of the State of Oaxaca. Certain subsidiaries of FEMSA, FEMSA Comercio and Coca-Cola FEMSA have entered into 20-year wind power supply agreements with EAI and EEM to purchase energy output produced by such companies. The project is currently in its long-term financing stage.
On March 28, 2011, Coca-Cola FEMSA, together with The Coca-Cola Company, acquired Grupo Estrella Azul (also known as Grupo Industrias Lacteas), which we refer to as Grupo Estrella Azul, a Panamanian company engaged for more than 50 years in the dairy and juice-based beverage categories. The Company acquired a 50% interest and will continue to develop this business jointly with The Coca-Cola Company. Beginning in April 2011, both The Coca-Cola Company and Coca-Cola FEMSA commenced the gradual integration of Grupo Estrella Azul into the existing beverage platform they share for the development of non-carbonated products in Panama.
We conduct our business through our principal sub-holding companies as shown in the following diagram and table:
Principal Sub-holding Companies—Ownership Structure
As of May 30, 200831, 2011
(1) | Compañía Internacional de Bebidas, S.A. de C.V. , which we refer to as CIBSA. |
(2) |
|
|
|
| Percentage of capital stock, equal to 63.0% of capital stock with full voting rights. |
| (3) | Grupo Industrial Emprex, S.A. de C.V. |
| (4) | Ownership in CB Equity held through various FEMSA subsidiaries. |
| (5) | Combined economic interest in Heineken N.V. and Heineken Holding N.V. |
The following tables present an overview of our operations by reportable segment and by geographic region under Mexican Financial Reporting Standards:FRS:
Operations by Segment—Overview
Year Ended December 31, 20072010 and % of growth vs. last year(1)
| Coca-Cola FEMSA | FEMSA Cerveza | FEMSA Comercio | Coca-Cola FEMSA | FEMSA Comercio | CB Equity(2) | ||||||||||||||||||||||||||||||||||
(in millions of constant Mexican pesos, except for employees and percentages) | (in millions of Mexican pesos, except for employees and percentages) | ||||||||||||||||||||||||||||||||||||||
Total revenues | Ps. 69,251 | 8.1 | % | Ps. 39,566 | 4.3 | % | Ps. 42,103 | 14.3 | % | Ps.103,456 | 0.7 | % | Ps.62,259 | 16.3 | % | Ps. | — | N/a | |||||||||||||||||||||
Income from operations | 11,447 | 11.7 | 5,404 | (11.7 | ) | 2,315 | 39.1 | 17,079 | 7.9 | 5,200 | 16.7 | (3 | ) | N/a | |||||||||||||||||||||||||
Total assets | 87,178 | 8.4 | 65,539 | 5.3 | 14,284 | 16.0 | 114,061 | 3.1 | 23,677 | 20.2 | 67,010 | N/a | |||||||||||||||||||||||||||
Employees | 58,122 | 2.5 | % | 21,748 | 1.9 | % | 15,824 | 38.2 | % | 68,449 | 1.5 | 73,101 | 20.0 | — | N/a | ||||||||||||||||||||||||
Total Revenues Summary by Segment(1)
| Year Ended December 31, | Year Ended December 31, | |||||||||||||||||
| 2007 | 2006 | 2005 | 2010 | 2009 | 2008 | |||||||||||||
| (in millions of constant Mexican pesos) | (in millions of Mexican pesos) | |||||||||||||||||
Coca-Cola FEMSA | Ps. 69,251 | Ps. 64,046 | Ps. 59,642 | Ps. | 103,456 | Ps. | 102,767 | Ps. | 82,976 | |||||||||
FEMSA Cerveza | 39,566 | 37,919 | 29,768 | |||||||||||||||
FEMSA Comercio | 42,103 | 36,835 | 31,021 | 62,259 | 53,549 | 47,146 | ||||||||||||
CB Equity(2) | — | N/a | N/a | |||||||||||||||
Other | 8,124 | 7,966 | 6,485 | 12,010 | 10,991 | 9,401 | ||||||||||||
Consolidated total revenues | Ps. 147,556 | Ps. 136,120 | Ps. 119,462 | Ps. | 169,702 | Ps. | 160,251 | Ps. | 133,808 | |||||||||
Total Revenues Summary by Geographic Region(2)(4)
| Year Ended December 31, | ||||||
| 2007 | 2006 | 2005 | ||||
| (in millions of constant Mexican pesos) | ||||||
Mexico | Ps. 106,136 | Ps. 99,310 | Ps. 90,561 | |||
Central America | 4,850 | 4,592 | 4,022 | |||
Colombia | 7,051 | 6,556 | 6,147 | |||
Venezuela | 9,792 | 7,997 | 7,188 | |||
Brazil | 16,093 | 14,378 | 8,433 | |||
Argentina | 4,034 | 3,458 | 3,256 | |||
Consolidated total revenues | Ps. 147,556 | Ps. 136,120 | Ps. 119,462 | |||
| Year Ended December 31, | ||||||||||||||
| 2010 | 2009 | 2008 | ||||||||||||
Mexico(3) | Ps. | 105,448 | Ps. | 94,819 | Ps. | 84,920 | ||||||||
Latincentro(5) | 17,492 | 16,211 | 12,853 | |||||||||||
Venezuela | 14,048 | 22,448 | 15,217 | |||||||||||
Mercosur(3)(6) | 33,409 | 27,604 | 21,227 | |||||||||||
Consolidated total revenues(3) | Ps. | 169,702 | Ps. | 160,251 | Ps. | 133,808 | ||||||||
| (1) | The sum of the financial data for each of our segments and percentages with respect thereto differ from our consolidated financial information due to intercompany transactions, which are eliminated in consolidation, and certain assets and activities of FEMSA. |
| (2) | CB Equity holds Heineken N.V. and Heineken Holding N.V. shares. |
| (3) | For 2010, 2009 and 2008, consolidated total revenues have been modified to exclude FEMSA Cerveza financial information due to its presentation as a discontinued operation. |
| (4) | The sum of the financial data for each geographic region differs from our consolidated financial information due to intercompany transactions, which are eliminated in consolidation. |
| (5) | Includes Guatemala, Nicaragua, Costa Rica, Panama and Colombia. |
| (6) | Includes Brazil and Argentina. |
The following table sets forth our significant subsidiaries as of May 31, 2008:April 30, 2011:
Name of Company | Jurisdiction of Establishment | Percentage Owned | ||||
CIBSA | Mexico | 100.0 | % | |||
Coca-Cola FEMSA(1) | Mexico | |||||
| 53.7 | % | ||||
Propimex, S.A. de C.V. | Mexico | 53.7 | % | |||
Refrescos Latinoamericanos, S.A. de C.V. | Mexico | 53.7 | % | |||
Controladora Interamericana de Bebidas, S.A. de C.V. | Mexico | 53.7 | % | |||
Coca-Cola FEMSA de Venezuela, S.A. (formerly Panamco | Venezuela | 53.7 | % | |||
Spal Industria Brasileira de Bebidas, S.A. | Brazil | 52.5 | % | |||
Industria Nacional de Gaseosas, S.A. | Colombia | 53.7 | % | |||
FEMSA Comercio | Mexico | 100.0 | % | |||
| ||||||
| 100.0 | % | |||||
| ||||||
| ||||||
| (1) |
| Percentage of capital stock. FEMSA owns 63.0% of the capital stock with full voting rights. |
We areFEMSA is a leading company that participates in the non-alcoholic beverage company. Our soft drink operation,industry through Coca-Cola FEMSA, is the largest independent bottler of Coca-Cola products in Latin America and the second largest in the world measured in terms of sales volumes in 2007, and our brewing operation, FEMSA Cerveza, is both a significant competitorvolume; in the Mexican and Brazilian beer markets as well as an exporter in key international markets including the United States. Coca-Colaretail industry through FEMSA and FEMSA Cerveza are our core businesses, which together define our identity and represent the avenues for our future growth. Our beverage businesses are enhanced by OXXO,Comercio, operating the largest and fastest-growing chain of convenience store chainstores in Mexico measuredLatin America, and in termsthe beer industry, through its ownership of numberthe second largest equity stake in Heineken, one of stores at December 31, 2007 and a significant growth driverthe world’s leading brewers with operations in its own right.over 70 countries.
As a beverage company, weWe understand the importance of connecting with our end consumers by interpreting their needs, and ultimately delivering the right products to them for the right occasions.occasions and the optimal value proposition. We strive to achieve this by developing thebrand value, of our brands, expanding our significant distribution capabilities, including aligning our interests with those at our third-party distribution partners in the beer market in Mexico, which in some instances involve us acquiring these third-party partners, and improving the efficiency of our operations.operations while aiming to reach our full potential. We continue to improve our information gathering and processing systems in order to better know and understand what our consumers want and need, and we are improving our production and distribution by more efficiently leveraging our asset base.
We believe that the competencies that our businesses have developed can be replicated in other geographic regions. This underlying principle guided our consolidation efforts, which culminated in Coca-Cola FEMSA’s acquisition of Panamco on May 6, 2003. The continental platform that this new combination produces—produced—encompassing a significant territorial expanse in Mexico and Central America, including some of the most populous metropolitan areas in Latin America—we believe may providehas provided us with opportunities to create value through both an improved ability to execute our strategies and the use of superior marketing tools. We have also increased our capabilities to operate and succeed in other geographic regions, by developing an understanding of local consumer needs and trends as is the case with OXXO’s new Colombian operations. Going forward, we can use those capabilities to continue our international expansion of both Coca-Cola FEMSA and OXXO.
Our ultimate objectives are achieving sustainable revenue growth, improving profitability and increasing the return on invested capital in each of our operations. We believe that by achieving these goals we will create sustainable value for our shareholders.
Overview
Coca-Cola FEMSA is the largest publicly listed bottler ofCoca-Colatrademark beverages in Latin America, and the second largest in the world, calculated in each case by sales volume in 2007.2010. Coca-Cola FEMSA operates in the following territories:
Mexico – a substantial portion of central Mexico (including Mexico City)City and the states of Michoacán and Guanajuato) and southeast Mexico (including the Gulf region).
Central America – Guatemala (Guatemala City and surrounding areas), Nicaragua (nationwide), Costa Rica (nationwide) and Panama (nationwide).
Colombia – most of the country.
Venezuela – nationwide.
Argentina – Buenos Aires and surrounding areas.
Brazil – the area of greater São Paulo, Campinas, Santos, the state of Mato Grosso do Sul, the state of Minas Gerais and part of the state of Goiás.
Coca-Cola FEMSA was organized on October 30, 1991 as asociedad anónima de capital variable (a variable capital stock corporation) under the laws of Mexico with a duration of 99 years. On December 5, 2006, in response toas required by amendments to the Mexican Securities Law, Coca-Cola FEMSA became asociedad anónima bursátil de capital variable (a variable capital listed stock corporation). Coca-Cola FEMSA’s principal executive offices are located at Guillermo González Camarena No. 600, Col. Centro de Ciudad Santa Fé, Delegación Álvaro Obregón, México, D.F., 01210, México. Coca-Cola FEMSA’s telephone number at this location is (52-55) 5081-5100. Coca-Cola FEMSA’s website iswww.coca-colafemsa.comwww.coca-colafemsa.com..
The following is an overview of Coca-Cola FEMSA’s operations by reporting segment in 2007:2010:
Operations by Reporting Segment—Overview
Year Ended December 31, 20072010(1)
| Total Revenues | Percentage of Total Revenues | Income from Operations | Percentage of Income from Operations | |||||
Mexico | Ps. 32,550 | 47.0 | Ps. 6,569 | 57.4 | ||||
Central America | 4,808 | 7.0 | 715 | 6.2 | ||||
Colombia | 6,933 | 10.0 | 1,242 | 10.9 | ||||
Venezuela | 9,785 | 14.1 | 572 | 5.0 | ||||
Argentina | 4,034 | 5.8 | 492 | 4.3 | ||||
Brazil | 11,141 | 16.1 | 1,857 | 16.2 |
| Total Revenues | Percentage of Total Revenues | Income from Operations | Percentage of Income from Operations | |||||||
Mexico | 38,782 | 37.5% | 6,605 | 38.7% | ||||||
Latincentro(2) | 17,281 | 16.7% | 3,022 | 17.7% | ||||||
Venezuela | 14,033 | 13.6% | 2,444 | 14.3% | ||||||
Mercosur(3) | 33,360 | 32.2% | 5,008 | 29.3% | ||||||
Consolidated | 103,456 | 100% | 17,079 | 100% | ||||||
| (1) | Expressed in millions of Mexican pesos, except for percentages. |
| (2) | Includes Guatemala, Nicaragua, Costa Rica, Panama and Colombia. |
| (3) | Includes Brazil and Argentina. |
Corporate History
In 1979, one of our subsidiaries acquired certain soft drinksparkling beverage bottlers that are now a part of its company. At that time, the acquired bottlers had 13 Mexican distribution centers operating 701 distribution routes, and their production capacity was 83 million physical cases. In 1991, FEMSA transferred its ownership in the bottlers to FEMSA Refrescos, S.A. de C.V., the corporate predecessor to Coca-Cola FEMSA, S.A.B. de C.V.
In June 1993, a subsidiary of The Coca-Cola Company subscribed for 30% of Coca-Cola FEMSA capital stock in the form of Series D Shares for US$ 195 million. In September 1993, FEMSA sold Series L Shares that represented 19% of Coca-Cola FEMSA’s capital stock to the public, and Coca-Cola FEMSA listed these shares on the Mexican Stock Exchange and, in the form of ADSs, on the New York Stock Exchange. In a series of transactions between 1994 and 1997, Coca-Cola FEMSA acquired territories in Argentina and additional territories in southern Mexico.
In May 2003, Coca-Cola FEMSA acquired Panamco and began producing and distributingCoca-Colatrademark beverages in additional territories in the central and the gulf regions of Mexico and in Central America (Guatemala, Nicaragua, Costa Rica and Panama), Colombia, Venezuela and Brazil, along with bottled water, beer and other beverages in some of these territories. As a result of the acquisition, the interest of The Coca-Cola Company in the capital stock of its companyCoca-Cola FEMSA increased from 30% to 39.6%.
During August 2004, Coca-Cola FEMSA conducted a rights offering to allow existing holders of its Series L Shares and ADSs to acquire newly-issued Series L Shares in the form of Series L Shares and ADSs, respectively, at the same price per share at which ourselves and The Coca-Cola Company subscribed in connection with the Panamco acquisition. On March 8, 2006, its shareholders approved the non-cancellation of the 98,684,857 Series L Shares (equivalent to approximately 9.87 million ADSs, or over one-third of the outstanding Series L Shares) that were not subscribed for in the rights offering which are available for issuance at an issuance price of no less than US$ 2.216 per share or its equivalent in Mexican currency.
On November 3, 2006, we acquired, through a subsidiary, 148,000,000 of Coca-Cola FEMSA Series D Shares from certain subsidiaries of The Coca-Cola Company representing 9.4% of the total outstanding voting shares and 8.0% of the total outstanding equity, at a price of US$ 2.888 per share for an aggregate amount of US$ 427.4 million. With this purchase, we increased our ownership to 53.7% of Coca-Cola FEMSA capital stock. Pursuant to Coca-Cola FEMSA bylaws, the acquired shares were converted from Series D Shares to Series A Shares.
On November 8, 2007, a Mexican company owned directly or indirectly by Coca-Cola FEMSA and The Coca-Cola Company, acquired 100% of the shares of capital stock of Jugos del Valle. See “Item 4. “—The Company—Jugos del Valle Acquisition.Corporate Background.”
On May 30, 2008, Coca-Cola FEMSA entered into a purchase agreement with The Coca-Cola Company to acquire its wholly owned bottling franchise located in the state of Minas Gerais (Refrigerantes Minas Gerais Ltda., or REMIL) in Brazil.
OnIn December 21, 2007 and on May 30, 2008, Coca-Cola FEMSA sold most of its proprietary brands to The Coca-Cola Company.Company for a total amount of US$ 64 million. Both of these transactions were conducted on an arm’s length basis. These trademarks are now being licensed to Coca-Cola FEMSA by The Coca-Cola Company subject to existing bottler agreements.
On May 30, 2008, Coca-Cola FEMSA entered into a transaction with The Coca-Cola Company to acquire its wholly-owned bottling territory, REMIL, located in the State of Minas Gerais in Brazil. During the second quarter of 2008, Coca-Cola FEMSA closed this transaction for US$ 364.1 million. Coca-Cola FEMSA consolidates REMIL in its financial statements as of June 1, 2008.
In July 2008, Coca-Cola FEMSA acquired Agua de los Angeles, S.A. de C.V. (Agua de los Angeles), a water business in the Valley of Mexico, from Grupo Embotellador CIMSA S.A. de C.V., one of the Coca-Cola bottlers in Mexico, for US$ 18.3 million. The trademarks remain with The Coca-Cola Company. Coca-Cola FEMSA subsequently merged Agua de los Angeles into its jug water business under theCiel brand.
In December 2008, Jugos del Valle sold its Brazilian operations, Holdinbrás, Ltd. to a subsidiary of The Coca-Cola Company, Coca-Cola FEMSA and other bottlers ofCoca-Cola trademark brands in Brazil. These operations were integrated into the Sucos Mais business, a joint venture with The Coca-Cola Company in Brazil.
In February 2009, Coca-Cola FEMSA completed the transaction with Bavaria, a subsidiary of SABMiller, to jointly acquire with The Coca-Cola Company theBrisa bottled water business in Colombia (including theBrisa brand). The purchase price of US$ 92 million was shared equally by Coca-Cola FEMSA and The Coca-Cola Company. Following a transition period, in June 2009, Coca-Cola FEMSA began to sell and distribute theBrisaportfolio of products in that country.
In May 2009, Coca-Cola FEMSA entered into an agreement to develop theCrystal trademark water products in Brazil jointly with The Coca-Cola Company.
In August 2010, Coca-Cola FEMSA acquired from The Coca-Cola Company along with other BrazilianCoca-Colabottlers the business operations of theMatte Leaotea brand. Coca-Cola FEMSA currently has a 13.84% indirect interest in theMatte Leao business in Brazil.
On March 28, 2011, Coca-Cola FEMSA, together with The Coca-Cola Company, acquired Grupo Estrella Azul (also known as Grupo Industrias Lacteas), a Panamanian conglomerate that participates in the dairy and juice-based beverage categories in Panama. Coca-Cola FEMSA will continue to develop this business jointly with The Coca-Cola Company.
As of MarchMay 31, 2008,2011, we indirectly owned Series A Shares equal to 53.7% of Coca-Cola FEMSA capital stock (63.0% of its capital stock with full voting rights), and. As of May 31, 2011, The Coca-Cola Company indirectly owned Series D Shares equal to 31.6% of the capital stock of Coca-Cola FEMSA (37.0%(37% of Coca-Cola FEMSA’s capital stock with full voting rights). Series L Shares with limited voting rights, which trade on the Mexican Stock Exchange and in the form of ADSs on the New York Stock Exchange, constitute the remaining 14.7% of Coca-Cola FEMSA’s capital stock.
Business Strategy
Coca-Cola FEMSA is the largest bottler ofCoca-Colatrademark beverages in Latin America in terms of total sales volume in 2007,2010, with operations in Mexico, Guatemala, Nicaragua, Costa Rica, Panama, Colombia, Venezuela, Argentina and Brazil. While its corporate headquarters are in Mexico City, it has established divisional headquarters in the following three regions:
Mexico with headquarters in Mexico City;
Latincentro (covering territories in Guatemala, Nicaragua, Costa Rica, Panama, Colombia and Venezuela) with headquarters in San José, Costa Rica; and
Mercosur (covering territories in Argentina and Brazil) with headquarters in São Paulo, Brazil.
Coca-Cola FEMSA seeks to provide its shareholders with an attractive return on their investment by increasing its profitability. The key factors in achieving increased revenues and profitability are increasing(1) transforming its revenues by (1)commercial models to focus on its customers’ value potential and using a value-based segmentation approach to capture the industry’s value potential; (2) implementing multi-segmentation strategies in its major markets to target distinct market clusters divided by consumption occasion, competitive intensity and socioeconomic levels; (2)(3) implementing well-planned product, packaging and pricing strategies through channel distribution;different distribution channels; and (3)(4) driving product innovation along its different product categories and (5) achieving the full operating potential of its commercial models and processes to drive operational efficiencies throughout its company. To achieve these goals Coca-Cola FEMSA continues to focus its efforts in:on, among other initiatives, the following:
working with The Coca-Cola Company to develop a business model to continue exploring and participating in new lines of beverages, extendextending existing product lines participate in new beverage segments and effectively advertiseadvertising and marketmarketing its products;
developing and expanding its still beverage portfolio through innovation, strategic acquisitions and by entering into joint ventures with The Coca-Cola Company;
expanding its bottled water strategy, in conjunction with The Coca-Cola Company through innovation and selective acquisitions to maximize its profitability across its market territories;
strengthening its selling capabilities and go-to-market strategies, including pre-sale, conventional selling and hybrid routes, in order to get closer to its clients and help them satisfy the beverage needs of consumers;
| • | implementing packaging strategies designed to increase consumer demand for its products and to build a strong returnable base for theCoca-Colabrand selectively; |
replicating its best practices throughout the whole value chain;
rationalizing and adapting its organizational and asset structure in order to be in a better position to respond to a changing competitive environment;
strengthening its selling capabilities and go-to-market strategies, including pre-sale, conventional selling and hybrid routes, in order to get closer to its clients and help them satisfy the beverage needs of consumers;
expanding its bottled water strategy, in conjunction with The Coca-Cola Company through innovation and selective acquisitions to maximize its profitability across its market territories;
committing to building a multi-cultural collaborative team, from top to bottom; and
seeking to expandbroadening its geographical footprint.footprint through organic growth and strategic acquisitions.
Coca-Cola FEMSA seeks to increase per capita consumption of soft drinksits products in the territories in which it operates. To that end, its marketing teams continuously develop sales strategies tailored to the different characteristics of its various territories and distribution channels. Coca-Cola FEMSA continues to develop its product portfolio to better meet market demand and maintain its overall profitability. To stimulate and respond to consumer demand, it continues to introduce new categories, products and new presentations. See “—Product and Packaging Mix.” It also seeks to increase placement of refrigeration equipment,coolers, including promotional displays, in retail outlets in order to showcase and promote its products. In addition, because it views its relationship with The Coca-Cola Company as integral to its business, strategy, it uses market information systems and strategies developed with The Coca-Cola Company to improve its coordination with the worldwidebusiness and marketing efforts of The Coca-Cola Company.strategies. See “—Marketing—Channel Marketing.”
Coca-Cola FEMSA seeks to rationalize its manufacturing and distribution capacity to improve the efficiency of its operations. In 2003 and 2004, as part of the integration process from its acquisition of Panamco, Coca-Cola FEMSA closed several under-utilized manufacturing centers and shifted distribution activities to other existing facilities. In each of 2005, 2006 and 2007, Coca-Cola FEMSA closed additional distribution centers. See “—Description of Property, Plant and Equipment.” In each of its facilities, Coca-Cola FEMSA seeks to increase productivity in its facilities through infrastructure and process reengineering for improved asset utilization. Its capital expenditure program includes investments in production and distribution facilities, bottles, cases, coolers and information systems. Coca-Cola FEMSA believes that this program will allow it to maintain its capacity and flexibility to innovate and to respond to consumer demand for its non-alcoholic beverages.
Finally, Coca-Cola FEMSA focuses on management quality as a key element of its growth strategiesstrategy and remains committed to fostering the development of quality management at all levels. Both The Coca-Cola Company and we provide Coca-Cola FEMSA with managerial experience. To build upon these skills, Coca-Cola FEMSA also offers management training programs designed to enhance its executives’ abilities and exchangeto provide a forum for exchanging experiences, know-how and talent among an increasing number of multinational executives from its new and existing territories.
Sustainable development is an important pillar of Coca-Cola FEMSA’s strategy. Coca-Cola FEMSA continually develops programs that ensure the creation of social and economic value by fostering the quality of life of its employees, promoting a culture of health and well-being, supporting its surrounding communities and minimizing its operations’ environmental impact.
Coca-Cola FEMSA’s MarketsTerritories
The following map shows the locations of Coca-Cola FEMSA’s territories, giving estimates in each case of the population to which it offers products, the number of retailers of its sparkling beverages and the per capita consumption of its sparkling beverages:beverages as of December 31, 2010:
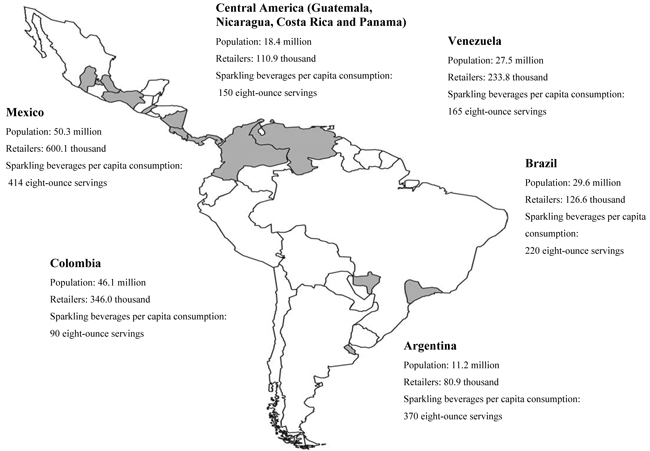
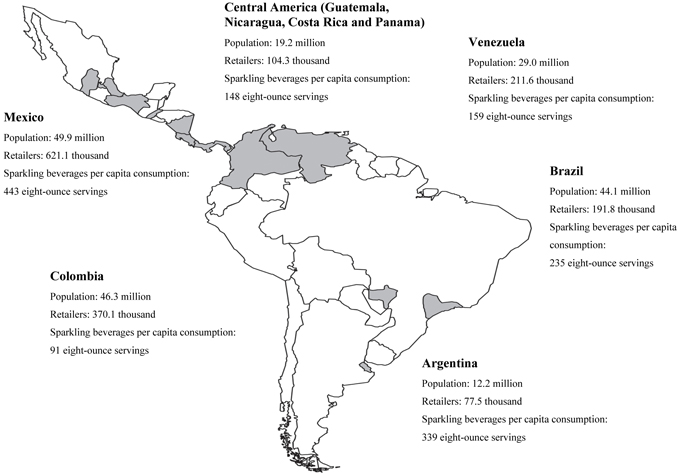
Per capita consumption data for a territory is determined by dividing sparkling beverage sales volume within the territory (in bottles, cans and fountain containers) by the estimated population within such territory, and is expressed on the basis of the number of eight-ounce servings of Coca-Cola FEMSA products consumed annually per capita. In evaluating the development of local volume sales in its territories and to determine product potential, Coca-Cola FEMSA and The Coca-Cola Company measure, among other factors, the per capita consumption of its sparkling beverages.
Coca-Cola FEMSA’s Products
Coca-Cola FEMSA produces, markets and distributesCoca-Cola trademark beverages, proprietary brands and brands licensed from third parties.us through 2010. TheCoca-Cola trademark beverages include colas,include: sparkling beverages (colas and flavored sparkling beverages, waterbeverages); water; and still beverages in other categories such as(including juice drinks, ready-to-drink teas and isotonics.isotonics). In December 2007 and May 2008, Coca-Cola FEMSA sold certainmost of its proprietary brands to The Coca-Cola Company. See “Item 7. Major Shareholders and Related Party Transactions—Related Party Transactions—Business Transactions between Coca-Cola FEMSA and The following table sets forth its main brands as of March 31, 2008:Coca-Cola Company.”
Colas: | Mexico | Venezuela | ||||||||||||||||
Coca-Cola | ü | ü | ü | ü | ||||||||||||||
Coca-Cola | ü | ü | ü | ü | ||||||||||||||
Coca-Cola Zero | ü | ü | ü | ü | ||||||||||||||
Flavored | Mexico | Venezuela | ||||||||||||||||
Aquarius Fresh | ü | |||||||||||||||||
Chinotto | ü | |||||||||||||||||
Crush | ü | ü | ||||||||||||||||
Fanta | ü | ü | ü | |||||||||||||||
Fresca | ü | ü | ||||||||||||||||
Frescolita | ü | ü | ||||||||||||||||
Hit | ü | |||||||||||||||||
Kuat | ü | |||||||||||||||||
Lift | ü | ü | ||||||||||||||||
Mundet | ü | |||||||||||||||||
Quatro | ü | ü | ||||||||||||||||
Simba | ü | |||||||||||||||||
Sprite | ü | ü | ü | |||||||||||||||
Water: | Mexico | Venezuela | ||||||||||||||||||||||
Alpina | ü | |||||||||||||||||||||||
Brisa | ü | |||||||||||||||||||||||
Ciel | ü | |||||||||||||||||||||||
Crystal | ü | |||||||||||||||||||||||
Kin | ü | |||||||||||||||||||||||
Manantial | ü | |||||||||||||||||||||||
| ü | |||||||||||||||||||||||
Other Categories: | Mexico | Venezuela | ||||||||||||||||||||||
| ||||||||||||||||||||||||
| ü | |||||||||||||||||||||||
Cepita | ü | |||||||||||||||||||||||
Hi-C(5) | ü | |||||||||||||||||||||||
Jugos del Valle | ü | ü | ü | |||||||||||||||||||||
Nestea | ü | ü | ü | |||||||||||||||||||||
Powerade | ü | ü | ü | ü | ||||||||||||||||||||
Matte Leão(7) | ü | |||||||||||||||||||||||
| (1) |
| (2) |
| (3) |
| (4) |
| (5) | Juice-based beverage. IncludesValleFrut in Mexico andFreshin Colombia. |
| (6) | Isotonic. |
| (7) | Ready to drink tea. |
Sales Overview
Coca-Cola FEMSA measures total sales volume in terms of unit cases. Unit case refers to 192 ounces of finished beverage product (24 eight-ounce servings) and, when applied to fountain syrup, powders and concentrate,soda fountains, refers to the volume of fountain syrup, powders and concentrate that is required to produce 192 ounces of finished beverage product. Theproduct.The following table illustrates its historical sales volume for each of its territories.
| Sales Volume Year Ended December 31, | Sales Volume Year Ended December 31, | |||||||||||||||||
| 2007 | 2006 | 2005 | 2010 | 2009 | 2008 | |||||||||||||
| (millions of unit cases) | (millions of unit cases) | |||||||||||||||||
Mexico | 1,110.4 | 1,070.7 | 1,025.0 | 1,242.3 | 1,227.2 | 1,149.0 | ||||||||||||
Central America | 128.1 | 120.3 | 109.4 | |||||||||||||||
Colombia | 197.8 | 190.9 | 179.7 | |||||||||||||||
Latincentro | ||||||||||||||||||
Central America(1) | 137.0 | 135.8 | 132.6 | |||||||||||||||
Colombia(2) | 244.3 | 232.2 | 197.9 | |||||||||||||||
Venezuela | 209.0 | 182.6 | 172.5 | 211.0 | 225.2 | 206.7 | ||||||||||||
Mercosur | ||||||||||||||||||
Brazil(3) | 475.6 | 424.1 | 370.6 | |||||||||||||||
Argentina | 179.4 | 164.9 | 150.1 | 189.3 | 184.1 | 186.0 | ||||||||||||
Brazil(1) | 296.1 | 268.7 | 252.5 | |||||||||||||||
Combined Volume | 2,120.8 | 1,998.1 | 1,889.2 | 2,499.5 | 2,428.6 | 2,242.8 | ||||||||||||
| (1) | Includes Guatemala, Nicaragua, Costa Rica and Panama. |
| (2) | As of June 1, 2009, includes sales from theBrisa bottled water business. |
| (3) | Excludes beer sales volume. As of June 1, 2008, includes sales from REMIL. As of the first quarter of 2010, Coca-Cola FEMSA began to distribute certain ready to drink products under theMatte Leaobrand. |
Product and Packaging Mix
Out of the more than 100 brands and line extensions of beverages sold and distributed by Coca-Cola FEMSA’sFEMSA, their most important brand, isCoca-Colaand, together with its line extensions,Coca-Cola light,Coca-Cola light caffeine freeLight andCoca-Cola Zero, which together accounted for 62.7%61.7% of total sales volume in 2007.Ciel(including jug presentations),Fanta, Sprite, Lift andFresca, its2010. Coca-Cola FEMSA’s next largest brands, in consecutive order,Ciel (a water brand from Mexico),Fanta(and its line extensions), Sprite(and its line extensions) and ValleFrut(and its line extensions), accounted for 10.8%9.9%, 6.9%5.8%, 2.9%2.6%, 1.6% and 1.4%2.2%, respectively, of total sales volume in 2007.2010. Coca-Cola FEMSA uses the term line extensions to refer to the different flavors in which it offers its brands. Coca-Cola FEMSA produces, markets and distributesCoca-Cola trademark beverages in each of its territories in containers authorized by The Coca-Cola Company, which consist of a variety of returnable and non-returnable presentations in the form of glass bottles, cans and plastic bottles made of polyethylene terephtalate,therephthalate, which it referswe refer to as PET.
Coca-Cola FEMSA uses the term presentation to refer to the packaging unit in which it sells its products. Presentation sizes for itsCoca-Cola trademark beverages range from a 4-ounce6.5-ounce personal size to a 20-liter3-liter multiple serving size. For all of its products excluding water, Coca-Cola FEMSA considers a multiple serving size as equal to, or larger than, 1.0 liter. In general, personal sizes have a higher price per unit case as compared to multiple serving sizes. Coca-Cola FEMSA offers both returnable and non-returnable presentations, which allow Coca-Cola FEMSA to offer different combinations ofportfolio alternatives based on convenience and priceaffordability to implement revenue management strategies and to target specific distribution channels and population segments in its territories. In addition, it sells someCoca-Cola trademark beverage syrups in containers designed for soda fountain use, which it refers to as fountain. It also sells bottled water products in jugbulk sizes, which refers to sizespresentations equal to or larger than 175 liters, that have a much lower average price per unit case than its other beverage products.
In addition toCoca-Cola trademark beverages, Coca-Cola FEMSA produces, markets and distributes certain other proprietary brands and beverages licensed from third parties other than The Coca-Cola Company in a variety of presentations.
Coca-Cola FEMSA’s core brands are principally theCoca-Cola trademark beverages. Coca-Cola FEMSA sells certain of these brands or their line extensions at a premium in some of its territories, in which case it refers to them as premium brands. It also sells certain other brands at a lower price per ounce, which it refers to as value protection brands.
The characteristics of itsCoca-Cola FEMSA’s territories are very diverse. Central Mexico and its territories in Argentina are densely populated and have a large number of competing sparkling beverages brands as compared
to the rest of its territories. Its territories in Brazil isare densely populated but hashave lower per capita consumption of sparkling beverage products as compared to Mexico. Portions of southern Mexico, Central America and Colombia are large and mountainous areas with lower population density, lower per capita income and lower per capita
consumption of sparkling beverages. In Venezuela, Coca-Cola FEMSA faces operational disruptions from time to time, which may have an effect on Coca-Cola FEMSA’s volumes sold, and consequently, lower per capita consumption of Coca-Cola FEMSA products has improved in spite of short-term operating disruptions over the past few years.consumption.
The following discussion analyzes Coca-Cola FEMSA’s product and packaging mix by reporting segment. The volume data presented is for the years 2007, 20062010, 2009 and 2005.2008.
Mexico.Coca-Cola FEMSA’s product portfolio consists ofCoca-Cola trademark beverages, and since 2001 has included theMundettrademark beverages. In 2007,2008, as part of its efforts to strengthen theCoca-Colabrand it launchedits multi-category beverage portfolio, Coca-Cola Zero, aFEMSA incorporated the Jugos del Valle line extension of the Coca-Cola brandjuice based beverages.SparklingTotal beverage per capita consumption of its products in its Mexican territories in 20072010 was 414598 eight-ounce servings.
The following table highlights historical sales volume and mix in Mexico for its products:
| Year Ended December 31, | Year Ended December 31, | ||||||||||||||||||||
| 2007 | 2006 | 2005 | 2010 | 2009 | 2008 | ||||||||||||||||
| Product Sales Volume | (millions of unit cases) | ||||||||||||||||||||
| (millions of unit cases) | |||||||||||||||||||||
Total Sales Volume | |||||||||||||||||||||
Total | 1,110.4 | 1,070.7 | 1,025.0 | 1,242.3 | 1,227.2 | 1,149.0 | |||||||||||||||
% Growth | 3.7 | % | 4.5 | % | 3.5 | % | 1.2 | % | 6.8 | % | 3.5 | % | |||||||||
| (in percentages) | |||||||||||||||||||||
| Unit Case Volume Mix by Category | (in percentages) | ||||||||||||||||||||
Sparkling beverages | 78.3 | % | 79.6 | % | 79.6 | % | 74.1 | % | 73.4 | % | 75.4 | % | |||||||||
Water(1) | 20.7 | 19.5 | 19.7 | 20.6 | 21.5 | 21.6 | |||||||||||||||
Still beverages | 1.0 | 0.9 | 0.7 | 5.3 | 5.1 | 3.0 | |||||||||||||||
Total | 100.0 | % | 100.0 | % | 100.0 | % | 100.0 | % | 100.0 | % | 100.0 | % | |||||||||
| (1) | Includes |
Coca-Cola FEMSA’s most popular sparkling beverage presentations were the 2.5-liter returnable plastic bottle, the 0.6-liter non-returnable plastic bottle (the 20-ounce bottle that is also popular in the United States) and the 2.5-liter3.0-liter non-returnable plastic bottle, which together accounted for 52%54.3% of total sparkling beverage sales volume in Mexico in 2007.2010. In 2007,2010, multiple serving presentations represented 62.4%67.5% of total sparkling beverages sales volume in Mexico, a 2.2% growth3.2% increase compared to 2006.2009. Coca-Cola FEMSA’s commercial strategies seekstrategy is to foster consumption in single serving presentations while maintaining multiple serving volumes. In 2007,2010, its sparkling beverages non-returnable presentations slightly increased as a percentage of its total sales volume from 69.5%73.4% in 20062009 to 71.8%74.1% in 2007.2010, mainly due to a decrease of the bulk water business and the strong preference of Coca-Cola FEMSA’s consumers for theCoca-Cola brand.
Total sales volume reached 1,110.41,242.3 million unit cases in 2007,2010, an increase of 3.7%1.2% compared to 1,070.71,227.2 million unit cases in 2006.2009. Sparkling beveragesbeverage sales volume grew 2.1%, accountingincreased 2.3% as compared to 2009. The sparkling beverage category and the still beverage category accounted for almost 50% of the total incremental volumes during the year. Sparkling beverages volume growth was mainly driven by strong growth of theCoca-Colabrand.
Central America.Latincentro (excluding Venezuela).Coca-Cola FEMSA’s producttotal sales volume in Central AmericaLatincentro consist predominantly ofCoca-Cola trademark beverages. Sparkling beverages perPer capita consumption of its beverage products in Colombia and Central America of its products was 150127 and 171 eight-ounce servings, respectively, in 2007.2010.
The following table highlights historical total sales volume and sales volume mix in Central America:Latincentro:
| Year Ended December 31, | Year Ended December 31, | ||||||||||||||||||||
| 2007 | 2006 | 2005 | 2010 | 2009 | 2008 | ||||||||||||||||
| Product Sales Volume | (millions of unit cases) | ||||||||||||||||||||
| (millions of unit cases) | |||||||||||||||||||||
Total Sales Volume | |||||||||||||||||||||
Total | 128.1 | 120.3 | 109.4 | 381.3 | 368.0 | 330.5 | |||||||||||||||
% Growth | 6.5 | % | 10.0 | % | (1.1 | )% | 3.6 | % | 11.3 | % | 1.4 | % | |||||||||
| (in percentages) | |||||||||||||||||||||
| Unit Case Volume Mix by Category | (in percentages) | ||||||||||||||||||||
Sparkling beverages | 89.7 | % | 90.9 | % | 93.6 | % | 76.9 | % | 79.3 | % | 87.9 | % | |||||||||
Water | 4.3 | 4.4 | 4.3 | ||||||||||||||||||
Water(1) | 15.3 | % | 13.0 | % | 7.7 | % | |||||||||||||||
Still beverages | 6.0 | 4.7 | 2.1 | 7.8 | % | 7.7 | % | 4.4 | % | ||||||||||||
Total | 100.0 | % | 100.0 | % | 100.0 | % | 100.0 | % | 100.0 | % | 100.0 | % | |||||||||
| (1) | Includes bulk water volume. |
In 2007,2010, multiple serving presentations represented 51.8%as a percentage of total sparkling beverage sales volume, represented 56.3% in Central America compared with 50.6%and 58.7% in 2006.Colombia. In 2008, as part of its efforts to strengthen its multi-category beverage portfolio, Coca-Cola FEMSA incorporated the Jugos del Valle line of juice-based beverages. The acquisition ofBrisa in 2009 helped Coca-Cola FEMSA to become leader, based on sales volume, in the water market in Colombia.
Total sales volume was 128.1381.3 million unit cases in 2007,2010, increasing 6.5%3.6% compared to 120.3368.0 million in 2006. Sparkling beverages volumes in the year accounted for more than 70%2009. Water sales, including bulk water, represented approximately 80% of its total incremental volume, mainly driven by the integration of theBrisa bottled water business in Colombia. Sparkling beverages, driven by theCoca-Cola brand and still beverages, weremainly driven by the majorityJugos del Valle line of products and Nestea, represented the balance. See “—The Company—Corporate Background.”
Colombia.Venezuela.Coca-Cola FEMSA’s product portfolio in ColombiaVenezuela consists ofCoca-Cola trademark beverages, certain products sold under proprietary trademarks and other brands, which it licenses from third parties. Sparkling beverages perbeverages. Per capita consumption of its productsbeverages in ColombiaVenezuela during 20072010 was 90175 eight-ounce servings.
The following table highlights historical total sales volume and sales volume mix in Colombia:Venezuela:
| Year Ended December 31, | Year Ended December 31, | ||||||||||||||||||||
| 2007 | 2006 | 2005 | 2010 | 2009 | 2008 | ||||||||||||||||
| Product Sales Volume | (millions of unit cases) | ||||||||||||||||||||
| (millions of unit cases) | |||||||||||||||||||||
Total Sales Volume | |||||||||||||||||||||
Total | 197.8 | 190.9 | 179.7 | 211.0 | 225.2 | 206.7 | |||||||||||||||
% Growth | 3.6 | % | 6.2 | % | 7.5 | % | (6.3 | %) | 9.0 | % | (1.1 | )% | |||||||||
| (in percentages) | |||||||||||||||||||||
| Unit Case Volume Mix by Category | (in percentages) | ||||||||||||||||||||
Sparkling beverages | 87.6 | % | 87.9 | % | 87.9 | % | 91.2 | % | 91.7 | % | 91.3 | % | |||||||||
Water(1) | 11.0 | 10.9 | 11.7 | 5.4 | % | 5.0 | % | 5.8 | % | ||||||||||||
Still beverages | 1.4 | 1.2 | 0.4 | 3.4 | % | 3.3 | % | 2.9 | % | ||||||||||||
Total | 100.0 | % | 100.0 | % | 100.0 | % | 100.0 | % | 100.0 | % | 100.0 | % | |||||||||
| (1) | Includes |
In 2007, multiple serving presentations represented 49.9% of total sparkling beverages sales volume in Colombia. In 2008, as part of its efforts to strengthen theCoca-Colabrand, Coca-Cola FEMSA launchedCoca-Cola Zero, a line extension of the Coca-Cola brand.
Total sales volume was 197.8 million unit cases in 2007, an increase of 3.6% compared to 190.9 million in 2006, driven by sparkling beverages volume growth, which accounted for more than 80% of total incremental volume.
Venezuela.Coca-Cola FEMSA’s product portfolio in Venezuela consists predominantly ofCoca-Cola trademark beverages. Sparkling beverages per capita consumption of its products in Venezuela during 2007 was 165 eight-ounce servings.
The following table highlights historical total sales volume and sales volume mix in Venezuela:
| Year Ended December 31, | |||||||||
| 2007 | 2006 | 2005 | |||||||
| Product Sales Volume | (millions of unit cases) | ||||||||
Total | 209.0 | 182.6 | 172.5 | ||||||
% Growth | 14.5 | % | 5.9 | % | (0.1 | )% | |||
Unit Case Volume Mix by Category | (in percentages) | | |||||||
Sparkling beverages | 90.4 | % | 87.7 | % | 86.6 | % | |||
Water(1) | 5.7 | 7.5 | 8.7 | ||||||
Still beverages | 3.9 | 4.8 | 4.7 | ||||||
Total | 100.0 | % | 100.0 | % | 100.0 | % | |||
During 2007 Coca-Cola FEMSA continued facing periodic operating difficulties that prevented it from producing and distributing enough supply. It has implemented a product portfolio rationalization strategy which enabledthat allows it to increase its totalminimize the impact of certain operating disruptions that have been recurrent in the last several years. During 2010, Coca-Cola FEMSA faced a difficult economic environment that prevented it from growing sales volume for the yearits products, and its sparkling beverage volume decreased by 14.5%6.8%.
In 2007,2010, multiple serving presentations represented 90.4%77.6% of total sparkling beverages sales volume in Venezuela. Total sales volume was 209.0211.0 million unit cases in 2007, an increase2010, a decrease of 14.5%6.3% compared to 182.6225.2 million in 2006, driven by volume growth in the sparkling beverage segment.2009.
Argentina.Mercosur (Brazil and Argentina).Coca-Cola FEMSA’s product portfolio in ArgentinaMercosur consists exclusivelymainly ofCoca-Cola trademark beverages. Sparkling beverages perand theKaiser beer brand in Brazil, which Coca-Cola FEMSA sells and distributes. In 2009, as part of its efforts to strengthen its multi-category beverage portfolio, Coca-Cola FEMSA incorporated the Jugos del Valle line of juice based beverages in Brazil. Per capita consumption of its productsbeverages in Brazil and Argentina during 2007 was 370259 and 374 eight-ounce servings.servings, respectively, in 2010.
The following table highlights historical total sales volume and sales volume mix in Argentina:Mercosur, not including beer:
| Year Ended December 31, | Year Ended December 31, | ||||||||||||||||||||
| 2007 | 2006 | 2005 | 2010 | 2009 | 2008 | ||||||||||||||||
| Product Sales Volume | (millions of unit cases) | ||||||||||||||||||||
| (millions of unit cases) | |||||||||||||||||||||
Total Sales Volume | |||||||||||||||||||||
Total | 179.4 | 164.9 | 150.1 | 664.9 | 608.2 | 556.6 | |||||||||||||||
% Growth | 8.8 | % | 9.8 | % | 4.0 | % | 9.3 | % | 9.3 | % | 17.1 | % | |||||||||
| (in percentages) | |||||||||||||||||||||
| Unit Case Volume Mix by Category | (in percentages) | ||||||||||||||||||||
Sparkling beverages | 96.2 | % | 96.6 | % | 97.3 | % | 90.8 | % | 92.0 | % | 93.3 | % | |||||||||
Water | 1.0 | 1.2 | 1.4 | ||||||||||||||||||
Water(1) | 4.2 | 4.1 | 4.2 | ||||||||||||||||||
Still beverages | 2.8 | 2.2 | 1.3 | 5.0 | 3.9 | 2.5 | |||||||||||||||
Total | 100.0 | % | 100.0 | % | 100.0 | % | 100.0 | % | 100.0 | % | 100.0 | % | |||||||||
| (1) | Includes bulk water volume. |
During 2007, returnable packaging accounted for 25.2% of total sales volumeIn 2008, in its continued effort to develop the still beverage category in Argentina, in 2007 as compared to 24.7% in 2006. In 2006, as part of Coca-Cola FEMSA’s efforts to strengthen theCoca-Colabrand it launchedCoca-Cola Zero, a line extension of the Coca-Cola brand.
Total sales volume reached 179.4 million unit cases in 2007, an increase of 8.8% compared with 164.9 million in 2006. The majority of the volume growth came from its non-returnable presentations, which represented over 60% of the sales volume increase. In 2007, multiple serving presentations for sparkling beverages remained flat at 83.7%.
Brazil.Coca-Cola FEMSA’s product portfolio in Brazil consists mainly ofCoca-Cola trademark beverages and certain products sold under proprietary trademarks and theKaiser beer brand, which Coca-Cola FEMSA sells and distributes on our behalf. Sparkling beverage per capita consumption of its products in Brazil during 2007 was 220 eight-ounce servings.
The following table highlights historical total sales volume and sales volume mix in Brazil:
| Year Ended December 31, | |||||||||
| 2007 | 2006 | 2005 | |||||||
| Product Sales Volume | (millions of unit cases) | ||||||||
Total | 296.1 | 268.7 | 252.5 | ||||||
% Growth | 10.2 | % | 6.4 | % | 11.0 | % | |||
| Unit Case Volume Mix by Category | (in percentages) | ||||||||
Sparkling beverages | 91.7 | % | 91.7 | % | 92.3 | % | |||
Water | 6.7 | 7.3 | 6.9 | ||||||
Still beverages | 1.6 | 1.0 | 0.8 | ||||||
Total | 100.0 | % | 100.0 | % | 100.0 | % | |||
launched Aquarius, a flavored water. During 2007 almost 100% of its incremental volumes of sparkling beverages were in non-returnable presentations.
Total sales volume was 296.1 million unit cases in 2007, an increase of 10.2% compared to 268.7 million in 2006. This increase included 10.3% sparkling beverage volume growth during the year. In 2007,2010, as part of its efforts to strengthenfoster sparkling beverage per capita consumption in Brazil, Coca-Cola FEMSA re-launched a 2.0 liter returnable plastic bottle for theCoca-Colabrand Coca-Cola FEMSA launchedCoca-Cola Zero, a line extensionand introduced two single-serve 0.25-liter presentations. These presentations accounted for close to 50% of incremental volumes in Brazil.
Total sales volume was 664.9 million unit cases in 2010, an increase of 9.3% compared to 608.2 million in 2009. Growth in sparkling beverages mainly driven by the sales of theCoca-Cola brand.brand in both Brazil and Argentina, accounted for close to 80% of the growth during the year. Growth in still beverages, mainly driven by the Jugos del Valle line of products in Brazil andAquarius flavored water in Argentina, represented more than 15% incremental volumes. In 2010, returnable packaging, as a percentage of total sparkling beverage sales volume, accounted for 28.5% in Argentina and 14.9% in Brazil. In 2010, multiple serving presentations represented 71.1% and 84.6% of total sparkling beverages sales volume in Brazil and Argentina, respectively.
Coca-Cola FEMSA sells and distributes theKaiser brands of beer in its territories in Brazil. In January 2006, weFEMSA Cerveza acquired an indirecta controlling stake in Cervejarias Kaiser. Since that time, Coca-Cola FEMSA continues to distributehas distributed theKaiser beer portfolio and to assume the sales function in São Paulo, Brazil,Coca-Cola FEMSA’s Brazilian territories, consistent with the arrangements between Coca-Cola FEMSA and Cervejarias Kaiser in place prior to 2004. Beginning within the second quarter of 2005, Coca-Cola FEMSA ceased including beer that Coca-Cola FEMSAit distributes in Brazil in its reported sales volumes. However,On April 30, 2010, FEMSA announced the closing of the transaction pursuant to which FEMSA agreed to exchange 100% of its beer operations for comparability purposes, sales volumes presenteda 20% economic interest in this report do not include beer sales for 2005, 2006 and 2007.
Jugos del Valle Acquisition
On October 10, 2007, Administración, S.A.P.I. de C.V., or Administración, a Mexican joint venture company owned directly or indirectly bythe Heineken Group. Coca-Cola FEMSA has agreed with Cervejarias Kaiser to continue to distribute and Thesell the Kaiser beer portfolio in Coca-Cola Company, launched a public tender offer to buy 100%FEMSA’s Brazilian territories through the 20-year term of the outstanding capital stock of Jugos del Valle, for approximately US$ 370 millionarrangement in cash, equivalentplace prior to a price of US$ 6.3409 per share, assuming liabilities of approximately US$ 86 million.
On November 8, 2007, Administración, upon the expiration of the public tender offer, acquired 100% of the shares of capital stock of Jugos del Valle. This transaction was approved by the Mexican regulatory authorities and was carried out in Mexico. Jugos del Valle produces and sells fruit juices, beverages and other fruit derivatives. It is based in Mexico but markets its products internationally, particularly in Brazil and the United States of America.
Coca-Cola FEMSA and The Coca-Cola Company invited all Mexican and BrazilianCoca-Cola bottlers to participate in a joint venture in the Mexican and Brazilian business, respectively, of Jugos del Valle on the same basic terms and conditions. In Mexico and Brazil, all of theCoca-Cola bottlers agreed to participate in the corresponding sale of the shares, which is expected to be completed during 2008. Coca-Cola FEMSA will hold a stake of approximately 20% in the Mexican joint venture.2004.
Beginning in February 2008, Coca-Cola FEMSA began to distribute Jugos del Valle brand juice-based beverages in its Mexican operations.
Seasonality
Sales of Coca-Cola FEMSA’s products are seasonal, as its sales levels generally increase during the summer months of each country and during the Christmas holiday season. In Mexico, Central America, Colombia and Venezuela, Coca-Cola FEMSA typically achieves its highest sales during the summer months of April through September as well as during the Christmas holidays in December. In Argentina and Brazil, its highest sales levels occur during the summer months of October through March and the Christmas holidays in December.
Marketing
Coca-Cola FEMSA, in conjunction with The Coca-Cola Company, has developed a sophisticated marketing strategy to promote the sale and consumption of its products. Coca-Cola FEMSA relies extensively on advertising, sales promotions and non-price related retailer incentivesupport programs designed by local affiliates of The Coca-Cola Company to target the particular preferences of its soft drink consumers. Its consolidated marketing expenses in 2007,2010, net of contributions by The Coca-Cola Company, were Ps. 2,6063,979 million. The Coca-Cola Company contributed an additional Ps. 1,5822,386 million in 2007.2010, which mainly includes contributions for coolers, bottles and cases. Through the use of advanced information technology, it has collected customer and consumer information that allows it to tailor its marketing strategies to thetarget different types of customers located in each of its territories and to meet the specific needs of the various market segmentsmarkets it serves.
Retailer IncentiveSupport Programs. IncentiveSupport programs include providing retailers with commercial coolers for the display and cooling of soft drink products and for point-of-sale display materials. Coca-Cola FEMSA seeks, in particular, to increase coolermaterials and consumer sales promotions such as contests, sweepstakes and the giveaway of product samples.
Coolers. Cooler distribution among retailers to increaseis important for the visibility and consumption of itsCoca-Cola FEMSA’s products and to ensure that they are sold at the proper temperature. Sales promotions include sponsorship of community activities, sporting, cultural and social events, and consumer sales promotions such as contests, sweepstakes and product giveaways.
Advertising. Coca-Cola FEMSA advertises in all major communications media. It focuses its advertising efforts on increasing brand recognition by consumers and improving its customer relations. National advertising campaigns are designed and proposed by The Coca-Cola Company’s local affiliates, with Coca-Cola FEMSA’s input at the local or regional level.
Channel Marketing. In order to provide more dynamic and specialized marketing of its products, Coca-Cola FEMSA’s strategy is to segmentclassify its marketmarkets and develop targeted efforts for each consumer segment or distribution channel. Its principal channels are small retailers, “on-premise” consumption such as restaurants and bars, supermarkets and third partythird-party distributors. Presence in these channels entails a comprehensive and detailed analysis of the purchasing patterns and preferences of various groups of soft drink consumers in each of the different types of locations or distribution channels. In response to this analysis, Coca-Cola FEMSA tailors its product, price, packaging and distribution strategies to meet the particular needs of and exploit the potential of each channel.
Multi-Segmentation. Coca-Cola FEMSA has been implementing a multi-segmentation strategy in the majority of its markets. This strategy consists on the implementation of different product/price/package portfolios by market cluster or group. These clusters are defined based on consumption occasion, competitive intensity and socio-economic levels, rather than solely on the types of distribution channels.
Client Value Management. Coca-Cola FEMSA has been transforming its commercial models to focus on its customers’ value potential using a value-based segmentation approach to capture the industry’s potential. Coca-Cola FEMSA has started the rollout of this new model in its Mexico, Brazil, Colombia and Central America operations.
Coca-Cola FEMSA believes that the implementation of its channel marketing strategy also enables it to respond to competitive initiatives with channel-specific responses as opposed to market-wide responses. This focused response capability isolates the effects of competitive pressure in a specific channel, thereby avoiding costlier market-wide responses. Coca-Cola FEMSA’s channel marketing activities are facilitated by its management information systems. Coca-Cola FEMSA has invested significantly in creating these systems, including in hand-held computers to support the gathering of product, consumer and delivery information, for most of its sales routes in Mexico and Argentina and selectively in otherthroughout its territories.
Multi-segmentation. Coca-Cola FEMSA has been implementing a multi-segmentation strategy in the majority of its markets. This strategy consists on the implementation of different product/price/package portfolios by market cluster or group. These clusters are defined based on competitive intensity and socio-economic levels, rather than solely on the types of distribution channels. Coca-Cola FEMSA has developed a market intelligence system that it refers to as the right-execution-daily system (RED), which has allowed it to implement this strategy. This system provides the data required to target specific consumer segments and channels and allows Coca-Cola FEMSA to collect and analyze the data required to tailor its product, package, price and distribution strategies to fit different consumer needs.
Product Sales and Distribution
The following table provides an overview of its product distribution centers and the number of retailers to which it sells its products:
Product Distribution Summary
as of December 31, 20072010
| Mexico | Central America | Colombia | Venezuela | Argentina | Brazil | |||||||
Distribution Centers | 84 | 29 | 37 | 32 | 5 | 12 | ||||||
Retailers (in thousands)(1) | 600.1 | 110.9 | 346.0 | 233.8 | 80.9 | 126.6 |
| Mexico | Latincentro(1) | Venezuela | Mercosur(2) | |||||||||||||
Distribution centers | 83 | 57 | 32 | 32 | ||||||||||||
Retailers(3) | 621,053 | 474,387 | 211,568 | 269,349 | ||||||||||||
| (1) | Includes Guatemala, Nicaragua, Costa Rica, Panama and Colombia. |
| (2) | Includes Brazil and Argentina. |
| (3) | Estimated. |
Coca-Cola FEMSA continuallycontinuously evaluates its distribution model in order to fit with the local dynamics of the market place. Coca-Cola FEMSA is currently analyzingplace and to analyze the way it goes to market, recognizing different service needs from its customers, while looking for a more efficient distribution model. As part of this strategy, Coca-Cola FEMSA is rolling out a variety of new distribution models throughout its territories looking for improvements in its distribution network.
Coca-Cola FEMSA use two mainuses several sales methodsand distribution models depending on market, geographic conditions and geographic conditions:the customer’s profile: (1) the traditional orpre-sale system, which separates the sales and delivery functions, permitting trucks to be loaded with the mix of products that retailers have previously ordered, thereby increasing both sales and distribution efficiency, (2) the conventional truck route system, in which the person in charge of the delivery makes immediate sales from inventory available on the truck, and (2) the pre-sale system, which separates the sales and delivery functions and allows sales personnel to sell products prior to delivery and trucks to be loaded with the mix of products that retailers have previously ordered, thereby increasing distribution efficiency. Coca-Cola FEMSA also begun to use(3) a hybrid distribution system, in some of its territories, where the same truck holdscarries product available for immediate sale and product previously ordered through the pre-sale system. system, (4) the telemarketing system, which could be combined with pre-sales visits and (5) sales through third-party wholesalers of its products.
As part of the pre-sale system, sales personnel also provideprovides merchandising services during retailer visits, which it believes enhance the presentation of its productsshopper experience at the point of sale. Coca-Cola FEMSA believes that an adequate number of service visits to retailers and frequency of deliveries are essential elements in an effective selling and distribution system for its products. In certain areas, Coca-Cola FEMSA also makes sales through third party wholesalers of its products. The vast majority of its sales are on a cash basis.
Coca-Cola FEMSA’s distribution centers range from large warehousing facilities and re-loading centers to small deposit centers. In addition to its fleet of trucks, Coca-Cola FEMSA distributes its products in certain locations through a fleet of electric carts and hand-trucks in order to comply with local environmental and traffic regulations. In some of its territories, Coca-Cola FEMSA generally retains third parties to transport its finished products from the bottlerbottling plants to the distribution centers.
Mexico. Coca-Cola FEMSA contracts with one of our subsidiaries for the transportation of finished products to its distribution centers from its Mexican production facilities. See “Item 7. Major Shareholders and Related Party Transactions—Related Party Transactions.” From the distribution centers, it then distributes its finished products to retailers through its own fleet of trucks. During 2007, it closed 8 out of 92 distribution centers in its Mexican operations.
In Mexico, Coca-Cola FEMSA sells a majority of its beverages at small retail stores to customersconsumers who may take the beverages for consumption at home or elsewhere for consumption.elsewhere. Coca-Cola FEMSA also sells products through the “on-premise” consumer segment, supermarkets and others.other locations. The “on-premise” consumer segment consists of sales through sidewalk stands, restaurants, bars and various types of dispensing machines as well as sales through point-of-sale programs in concert halls, auditoriums and theaters.
Brazil. In Brazil, Coca-Cola FEMSA sold 21.4% of its total sales volume through supermarkets in 2010. Also in Brazil, the delivery of its finished products to customers is by a third-party. In designated zones in Brazil,
third-party distributors purchase its products at a discount from the wholesale price and resell the products to retailers.
Territories other than Mexico and Brazil. Coca-Cola FEMSA distributes its finished products to retailers through a combination of its own fleet of trucks and third partythird-party distributors. At the end of 2007, Coca-Cola FEMSA operated 29, 37, 32, 5 and 12 distribution centers in its Central American territories, Colombia, Venezuela, Argentina and Brazil, respectively.
In most of its territories, an important part of itsCoca-Cola FEMSA’s total sales volume is sold through small retailers, with low supermarket penetration. In contrast, in Brazil Coca-Cola FEMSA sold more than 21% of its total sales volume through supermarkets in 2007. Also in Brazil, the delivery of its finished products to customers is by a third party. In designated zones in Brazil, third-party distributors purchase its products at a discount from the wholesale price and resell the products to retailers.
Competition
Although we believe that Coca-Cola FEMSA’s products enjoy wider recognition and greater consumer loyalty than those of its principal competitors, the soft drink segmentsmarkets in the territories in which it operates are highly competitive. Coca-Cola FEMSA’s principal competitors are localPepsi bottlers of Pepsi and other bottlers and distributors of national and regional soft drinksparkling beverage brands. Coca-Cola FEMSA faces increased competition in many of its territories from producers of low price beverages, commonly referred to as “B brands.” A number of its competitors in Central America, Venezuela, Brazil and Argentina offer beer in addition to sparkling beverages, still beverages, and Brazil offer both soft drinks and beer,water, which may enable them to achieve distribution efficiencies.
Recently, pricePrice discounting and packaging have joined consumer sales promotions, customer service and non-price retailer incentives as the primary means of competition among soft drink bottlers. Coca-Cola FEMSA competes by seeking to offer products at an attractive price in the different segments in its markets and by building on the value of its brands. Coca-Cola FEMSA believes that the introduction of new products and new presentations has been a significant competitive technique that allows it to increase demand for its products, provide different options to consumers and increase new consumption opportunities. See “—Sales Overview.”
Mexico. Coca-Cola FEMSA’s principal competitors in Mexico are bottlers ofPepsi products, whose territories overlap but are not co-extensive with its own. In central Mexico Coca-Cola FEMSA competes with a subsidiary of PBG,PepsiCo, Pepsi Beverage Company, the largest bottler of Pepsi products globally, and Grupo Embotelladores Unidos, S.A.B. de C.V., thePepsi bottler in central and southeast Mexico. Coca-Cola FEMSA’s main competition in the juice category in Mexico is Grupo Jumex. In the water category, Coca-Cola FEMSA’s main competitor isBonafont, a water brand owned by Groupe Danone. In addition, Coca-Cola FEMSA competes with Cadbury Schweppes in sparkling beverages and with other national and regional brands in its Mexican territories.territories, as well as low-price producers, such asBig Cola and Consorcio AGA, S.A. de C.V., that offer various presentations of sparkling and still beverages.
Latincentro (excluding Venezuela). Coca-Cola FEMSAFEMSA’s principal competitor in Colombia is Postobón, a well-established local bottler that sells flavored sparkling beverages, some of which have a wide consumption preference, such asmanzana Postobón (apple Postobón), which is the second most popular flavor in the Colombian sparkling beverage industry in terms of total sales volume. Postobón also sellsPepsi products. Postobón is a vertically integrated producer, the owners of which hold other significant commercial interests in Colombia. It also competes with low pricelow-price producers, offeringsuch as the producers ofBig Cola, which principally offer multiple serving size presentations in the soft drinksparkling and still beverage industry.
Central America. In the countries that comprise itsCoca-Cola FEMSA’s Central America segment, Coca-Cola FEMSA’sregion, its main competitors are Pepsi andBig Cola bottlers. In Guatemala and Nicaragua, itCoca-Cola FEMSA competes againstwith a joint venture between AmBev and The Central American Bottler Corporation. In Costa Rica, its principal competitor is Embotelladora Centroamericana,Florida Bebidas S.A., subsidiary of Florida Ice and inFarm Co. S.A. In Panama, its main competitor is Refrescos Nacionales,Cervecería Nacional, S.A. Coca-Cola FEMSA also faces competition from low pricelow-price producers offering multiple serving size presentations in some Central American countries.
Colombia. Coca-Cola FEMSA’s principal competitor in Colombia is Postobón S.A., which it refers to as Postobón, a well-established local bottler that sells flavored soft drinks, some of which have a wide consumption preference, such as cream soda, which is the second most popular category in the Colombian soft drink industry in terms of total sales volume, and that also sells Pepsi products. Postobón is a vertically integrated producer, the owners of which hold other significant commercial interests in Colombia. In the second half of 2007, Big Cola, a “B brand” producer, started operations in Colombia, increasing competition in multi serving size presentations. Coca-Cola FEMSA expects competition to intensify in 2008.
Venezuela. In Venezuela, Coca-Cola FEMSA’s main competitor is Pepsi-Cola Venezuela, C.A., a joint venture formed between PepsiCo and Empresas Polar, S.A., the leading beer distributor in the country. Coca-Cola FEMSA also competes with the producers of Kola RealBig Cola in partparts of the country.
ArgentinaMercosur (Brazil and Argentina). In Brazil, Coca-Cola FEMSA competes against AmBev, a Brazilian company with a portfolio of brands that includesPepsi, local brands with flavors such as guaraná, and proprietary
beers. Coca-Cola FEMSA also competes against “B brands” or “Tubainas,” which are small, local producers of low-cost flavored sparkling beverages in multiple serving presentations that represent a significant portion of the sparkling beverage market.
In Argentina, Coca-Cola FEMSA’s main competitor is Buenos Aires Embotellador S.A. (BAESA), aPepsi bottler, which is owned by Argentina’s principal brewery, Quilmes Industrial S.A., and indirectly controlled by AmBev. In addition, Coca-Cola FEMSA competes with a number of competitors offering generic, low priced soft drinkslow-priced sparkling beverages as well as many other generic products and private label proprietary supermarket brands.
Brazil. In Brazil, Coca-Cola FEMSA competes against AmBev, a Brazilian company with a portfolio of brands that includes Pepsi, local brands with flavors such as guaraná and proprietary beers. Coca-Cola FEMSA also competes against “B brands” or “Tubainas,” which are small, local producers of low cost flavored soft drinks in multiple serving presentations that represent an important portion of the soft drink market.
Raw Materials
Pursuant to theCoca-Cola FEMSA’s bottler agreements, with The Coca-Cola Company, Coca-Cola FEMSA is authorized to manufacture, sell and distributeCoca-Cola trademark beverages within specific geographic areas, and it is required to purchase concentrate, including aspartame, an artificial sweetener used in diet sodas,some of its territories for allCoca-Colatrademark beverages concentrate from companies designated by The Coca-Cola Company and artificial sweeteners from companies authorized by The Coca-Cola Company. The price of concentrateConcentrate prices for allCoca-Colatrademarksparkling beverages isare determined as a percentage of the weighted average retail price it charges to its retailers in local currency net of applicable taxes. Although The Coca-Cola Company has the right to unilaterally set the price of concentrates, in practice this percentage has historically been set pursuant to periodic negotiations with The Coca-Cola Company.
In 2005, The Coca-Cola Company decided to gradually increase concentrate prices for sparkling beverages over a three year period in Mexico beginning in 2007,Brazil and Mexico. These increases were fully implemented in Brazil in 2006.2008 and in Mexico in 2009. As part of the new cooperation framework that Coca-Cola FEMSA arrived atreached with The Coca-Cola Company at the end of 2006, The Coca-Cola Company will provide a relevant portion of the funds derived from the incidenceconcentrate increase tofor marketing support of theCoca-Cola FEMSA’s sparkling and still beverages portfolio. See “Item 7. Major Shareholders and Related Party Transactions—Major Shareholders—New Cooperation Framework withRelated Party Transactions—Business Transactions between Coca-Cola FEMSA and The Coca-Cola Company.”
In addition to concentrate, Coca-Cola FEMSA purchases sweeteners, carbon dioxide and other raw materials, resin and ingots to make plastic bottles, finished plastic and glass bottles, cans, closures and fountain containers, as well as other packaging materials. Sweeteners are combined with water to produce basic syrup, which is added to the concentrate as the sweetener for the soft drink. Itsmost of Coca-Cola FEMSA’s beverages. Coca-Cola FEMSA’s bottler agreements provide that, with respect toCoca-Colatrademark beverages, these materials may be purchased only from suppliers approved by The Coca-Cola Company.Company, including affiliates of FEMSA. Prices for packaging materials and high fructose corn syrup historically arehave been determined with reference to the U.S. dollar, although the local currency equivalent in a particular country is subject to price volatility in accordance with changes in exchange rates. Coca-Cola FEMSA’s most significant packaging raw material costs arise from the purchase of resin, plastic ingots to make plastic bottles and finished plastic bottles, which it obtains from international and local producers. The prices of these materials are tied to crude oil prices and global resin supply, and in the lastsupply. In recent years, itCoca-Cola FEMSA has experienced volatility in the prices it pays for these materials. In Mexico,Across Coca-Cola FEMSA’s territories, its average price for resin remained relatively stable during 2007.in U.S. dollars increased in 2010 as compared to 2009.
Under itsCoca-Cola FEMSA’s agreements with The Coca-Cola Company, Coca-Cola FEMSAit may use raw or refined sugar or high fructose corn syrup as sweeteners in its products. Sugar prices in all of the countries in which itCoca-Cola FEMSA operates, other than Brazil, are subject to local regulations and other barriers to market entry that cause it to pay in excess of international market prices for sugar in certain countries. Coca-Cola FEMSA hasDuring 2010, international sugar prices experienced sugar price volatility in these territories as a result of changes in local conditions, regulations and the stronger correlation to oil prices recently due to the use of sugar in alternative fuels.significant volatility.
None of the materials or supplies that Coca-Cola FEMSA uses is presently in short supply, although the supply of specific materials could be adversely affected by strikes, weather conditions, governmental controls or national emergency situations.
Mexico. Coca-Cola FEMSA purchases its returnable plastic bottles from Continental PET Technologies deGraham Packaging México, S.A. de C.V, a subsidiary of Continental Can, Inc.C.V., known as Graham, which has beenis the exclusive supplier of returnable plastic bottles to The Coca-Cola Company and its bottlers in Mexico. In addition, Coca-Cola FEMSA also mainly purchasepurchases resin from Arteva Specialties, S. de R.L. de C.V., M. & G. Polímeros México S.A. de C.V. and Industrias Voridian,DAK Resinas Americas Mexico S.A. de C.V., which
ALPLA Fábrica de Plásticos,México S.A. de C.V., known as ALPLA, manufacturesand Envases Innovativos de México S.A. de C.V. manufacture into non-returnable plastic bottles for it.Coca-Cola FEMSA.
Coca-Cola FEMSA mainly purchases sugarall of its cans for its Mexican operations from Promotora Mexicana de Embotelladoras, S.A. de C.V., known as PROMESA, a cooperative ofCoca-Cola bottlers, in which itCoca-Cola FEMSA indirectly holds a 5.0%15% equity interest. TheseCoca-Cola mainly purchases are regularly made under one-year agreements between PROMESAits glass bottles from Compañía Vidriera, S.A. de C.V., known as VITRO, and each bottlerSilices de Veracruz, S.A. de C.V., known as SIVESA, a wholly-owned subsidiary forof Cuauhtémoc Moctezuma and the sale of sugar at a price that is determined monthly based on the cost of sugar to PROMESA. Heineken Group.
Coca-Cola FEMSA also purchases sugar from, among other suppliers, Beta San Miguel, S.A. de C.V., a sugar cane producer in which it currently holds a 2.54%2.6% equity interest.
In December 2001, the Mexican government expropriated the majority of the sugar mills in Mexico. To manage this industry, the Mexican government entered into a trust agreement with Nacional Financiera, S.N.C., which we refer to as Nafin, a Mexican government-owned development bank, pursuant to which Nafin acts as trustee. In addition, the Mexican government imposed a 20% excise tax, effective January 1, 2002, on sparkling beverages sweetened with high fructose corn syrup. As a result, Coca-Cola FEMSA converted its Mexican bottler facilities to sugar cane-based production in early 2002. On January 1, 2003, the Mexican government broadened the reach of this tax by imposing a 20% excise tax on sparkling beverages produced with non-sugar sweetener. The effect of these excise taxes was to limit Coca-Cola FEMSA’s ability to substitute other sweeteners for sugar. Coca-Cola FEMSA initiated proceedings in Mexican federal court against this excise tax that allowed it to cease paying the tax in 2005 and 2006. Coca-Cola FEMSA also resumed the use ofpurchases high fructose corn syrup form CPIngredientes, S.A. de C.V. and Almidones Mexicanos, S.A. de C.V., known as a sweetener. At the end of 2006, effective beginning in 2007, the Mexican government removed this excise tax. The government has also agreed to give back to the former owners the sugar mills expropriated in 2001, the process has begun and the majority of the sugar mills have being given back to their former owners.Almex.
Imported sugar is also presently subject to import duties, the amount of which is set by the Mexican government. As a result, sugar prices in Mexico are in excess of international market prices for sugar. In 2006 and 2007,2010, sugar prices increased.increased compared to 2009.
Central AmericaLatincentro (excluding Venezuela). TheIn Colombia, Coca-Cola FEMSA uses sugar as a sweetener in most of its products, which it buys from several domestic sources. Coca-Cola FEMSA purchases plastic bottles from Amcor and Tapón Corona de Colombia S.A. Coca-Cola FEMSA purchases all its glass bottles from Peldar O-I and cans from Crown, both suppliers in which Grupo Ardila Lulle, owners of Coca-Cola FEMSA’s competitor, Postobón, owns an equity interest. Glass bottles and cans are available only from theses local sources.
In Central America, the majority of Coca-Cola FEMSA’s raw materials such as glass and plastic bottles and cans are purchased from several local suppliers. Coca-Cola FEMSA purchases all of its cans for its Central American operations from PROMESA. Sugar is available from one supplier in each country.suppliers that represent several local producers. Local sugar prices, in certainthe countries that comprisedcomprise the region, are significantly higher thanhave increased mainly due to volatility in international market prices and its ability to import sugar or high fructose corn syrup is limited.
Colombia.prices. In Costa Rica, Coca-Cola FEMSA uses sugar as a sweeteneracquires plastic non-returnable bottles from ALPLA C.R. S.A., and in its products, whichNicaragua it buysacquires such plastic bottles from several domestic sources. Coca-Cola FEMSA purchases pre-formed ingots from Amcor and Tapón Corona de ColombiaALPLA Nicaragua, S.A. Coca-Cola FEMSA purchases all its glass bottles and cans from suppliers, in which its competitor Postobón owns a 40% equity interest. Other suppliers exist for glass bottles, however, cans are available only from this one source.
Venezuela. Coca-Cola FEMSA uses sugar as a sweetener in most of its products, which it purchasepurchases mainly from the local market. Since 2003, itfrom time to time, Coca-Cola FEMSA has experienced a sugar shortage due to lower domestic production and the inability of the predominant sugar importers to obtain permissionspermission to import. However, itimport in a timely manner. Sugar supply was affected in 2010 due to (1) shortages in local sugar cane production, (2) quotas imposed by the government to sugar suppliers that limit the quantity of sugar that can be delivered (3) a production decrease by certain sugar mills. We cannot assure you that Coca-Cola FEMSA will be able to meet its sugar requirements through imports.in the long-term if sugar supply conditions do not improve. Coca-Cola FEMSA buys glass bottles from one local supplier, Productos de Vidrio, S.A., a local supplier, but there are other alternative suppliers authorized by The Coca-Cola Company. Coca-Cola FEMSA has several supplier options for plastic non-returnable bottles but it acquires most of its requirementsplastic non-returnable bottles from ALPLA de Venezuela, S.A. and all of its aluminum cans from a local producer, Dominguez Continental, C.A.
Under current regulations promulgated by the Venezuelan authorities, Coca-Cola FEMSA’s ability to import some of its raw materials and other supplies used in its production could be limited, and access to the official exchange rate for these items for Coca-Cola FEMSA and its suppliers, including, among others, resin, aluminum, plastic caps, distribution trucks and vehicles, is only achieved by obtaining proper approvals from the relevant authorities.
Mercosur (Brazil and Argentina). Sugar is available in Brazil at local market prices, which historically have been similar to international prices. Sugar prices in Brazil in recent periods have been volatile, mainly due to the increased demand for sugar cane for production of alternative fuels, and Coca-Cola FEMSA’s average acquisition cost for sugar in 2010 increased. Coca-Cola FEMSA purchases glass bottles, plastic bottles and cans from several domestic and international suppliers.
Argentina. In Argentina, Coca-Cola FEMSA mainly uses high fructose corn syrup that it purchases from several different local suppliers as a sweetener in its products instead of sugar. Coca-Cola FEMSA purchases glass
bottles, plastic cases and other raw materials from several domestic sources. Coca-Cola FEMSA purchases pre-formed plastic ingots, as well as returnable plastic bottles, at competitive prices from Embotelladora del Atlántico S.A., a local subsidiary of Embotelladora Andina S.A., a Coca-Cola bottler with operations in Argentina, Chile and Brazil, and other internationallocal suppliers. Coca-Cola FEMSA purchasesalso acquires pre-formed plastic ingots from ALPLA Avellaneda S.A. Coca-Cola FEMSA produces its own can presentations and juice-based products for distribution of its products to customers in Buenos Aires from CICAN S.A., which is directly or indirectly owned 100.0% by it after giving effect toAires.
Plants and Facilities
Over the acquisition of the remaining 51.1% in November 2007.
Brazil. Sugar is widely available in Brazil at local market prices, which historically have been lower than international prices. Sugar prices in Brazil in recent periods have been volatile and Coca-Cola FEMSA’s average acquisition cost for sugar in 2007 decreased.past several years, Coca-Cola FEMSA purchases glass bottles,made significant capital investments to modernize its facilities and improve operating efficiency and productivity, including:
increasing the annual capacity of its bottling plants by installing new production lines;
installing clarification facilities to process different types of sweeteners;
installing plastic bottlesbottle-blowing equipment;
modifying equipment to increase flexibility to produce different presentations, including faster sanitation and cans from several domesticchangeover times on production lines; and international suppliers.
closing obsolete production facilities.
As of December 31, 2010, Coca-Cola FEMSA Cerveza
Overview and Background
FEMSA Cerveza produces beerowned thirty bottling plants company-wide. By country, it has nine bottling facilities in Mexico, and Brazil and exports its products to 47 countries worldwide, with Northfive in Central America, being its most important export market, followed by certain marketssix in Europe, Latin America and Asia. In 2007, FEMSA Cerveza was ranked the twelfth-largest brewerColombia, four in the world in terms of sales volume. In Mexico, its main market, FEMSA Cerveza is the second largest beer producer in terms of sales volume. In 2007, approximately 67.5% of FEMSA Cerveza’s sales volume came from Mexico, with the remaining 24.5% from Brazil and 8.0% from exports. In 2007, FEMSA Cerveza sold 39.940 million hectoliters of beer.
FEMSA Cerveza’s principal operating subsidiaries are Grupo Cuauhtémoc Moctezuma, S.A. de C.V., which operates six breweries in Mexico, Cervejarias Kaiser Brasil S.A., or Kaiser, which operates eight breweriesVenezuela, four in Brazil and Cervezas Cuauhtémoc Moctezuma, S.A. de C.V., which operates our company-ownedtwo in Argentina.
As of December 31, 2010, Coca-Cola FEMSA operated 204 distribution centers, across Mexico.
Our management has identified Brazil as oneapproximately 40% of the most attractive and profitable beer marketswhich were in the world. Accordingly, in January 2006,its Mexican territories. Coca-Cola FEMSA Cerveza acquired a 68% equity stake in the Brazilian brewer Kaiser from The Molson Coors Brewing Co., or Molson Coors, for US$68 million, at the same time receiving indemnity rights for certain tax contingencies of Kaiser. Molson Coors later completed its exit from the Brazilian market in December 2006 by exercising a put option to sell its 15% stake in Kaiser to FEMSA Cerveza for US$15.6 million. Under the terms of the agreements governing FEMSA Cerveza’s original acquisition of Kaiser in January 2006, FEMSA Cerveza’s indemnity rights for certain tax contingencies provided by Molson Coors increased proportionately with the incremental 15% stake it acquired. In addition, on December 22, 2006, FEMSA Cerveza completed a capital increase of US$200 million in Kaiser. FEMSA Cerveza was the only shareholder to participate in the capital increase, and as a result of this transaction, FEMSA Cerveza owned 99.83% and Heineken N.V. was diluted from 17% to 0.17%. In August 2007, FEMSA Cerveza and Heineken N.V. closed a stock purchase agreement whereby Heineken NV purchased the shares necessary to regain its 17% interest in Kaiser. As a resultowns more than 88% of these transactions, FEMSA Cerveza owns 83% of Kaiserdistribution centers and Heineken N.V. owns 17%.
Beerleases the remainder. See “—Product Sales Volume
FEMSA Cerveza volume figures contained in this annual report refer to invoiced sales volume of beer. In Mexico, invoiced sales volume represents the quantity of hectoliters of beer sold by FEMSA Cerveza’s breweries to unaffiliated distributors and by affiliated distributors to retailers. In Brazil, invoiced sales volume represents the quantity of hectoliters of beer sold by Kaiser. Kaiser sells its products primarily to the BrazilianCoca-Cola bottlers, which sell and distribute Kaiser beers in their respective territories. The term hectoliter means 100 liters or approximately 26.4 U.S. gallons.
FEMSA Cerveza’s total beer sales volume totaled 39.940 million hectoliters in 2007, an increase of 5.9% from total sales volume of 37.697 million hectoliters in 2006. In 2007, FEMSA Cerveza’s Mexican beer sales volume increased by 3.9% to 26.962 million hectoliters, Brazil sales volume increased by 9.6% to 9.795 million hectoliters and export beer sales volume increased by 13.2% to 3.183 million hectoliters. Brazil sales volume prior to 2006 is not reported as the operation was not owned or operated by FEMSA Cerveza before January 2006.
FEMSA Cerveza Total Beer Sales Volumes
| Year Ended December 31, | ||||||||||
| 2007 | 2006 | 2005 | 2004 | 2003 | ||||||
| (in thousands of hectoliters) | ||||||||||
Mexico beer sales volume | 26,962 | 25,951 | 24,580 | 23,442 | 22,582 | |||||
Brazil beer sales volume | 9,795 | 8,935 | NA | NA | NA | |||||
Export beer sales volume | 3,183 | 2,811 | 2,438 | 2,240 | 1,982 | |||||
Total beer sales volume | 39,940 | 37,697 | 27,018 | 25,682 | 24,564 | |||||
FEMSA Cerveza’s Mexican beer sales volume recorded a compounded average growth rate of 4.5% while growth in the Mexican beer industry increased 4.1% for the period from 2003 through 2007. This compares with the 3.8% compounded average growth rate of the Mexican gross domestic product for the same period. FEMSA Cerveza’s Mexican beer sales for the same period recorded a 6.1% compounded average growth rate. FEMSA Cerveza’s export sales volume recorded a compound average growth rate of 12.6% for the same period, while the compound average growth rate for FEMSA Cerveza export sales was 17.8%.
Femsa Cerveza’s Strategy
In order to achieve its objectives in the Mexican market, FEMSA Cerveza seeks to:
|
|
|
|
|
Mexico Operations
The Mexican Beer MarketDistribution.”
The Mexican beer market wastable below summarizes by country the eighth largest beer market in the world in termsprincipal use, installed capacity and percentage utilization of industry sales volume in 2007 and is characterized by (1) concentrated domestic beerCoca-Cola FEMSA’s production (2) regional market share differences, (3) the prevalence of government licensing regulations and (4) favorable demographics in the beer drinking population.facilities:
Mexican beer production
Since 1985, Mexico has effectively had only two independent domestic beer producers, FEMSA Cerveza and Grupo Modelo. Grupo Modelo, a publicly traded company based in Mexico City, is the holding company of 76.8% of Diblo, S.A. de C.V., which operates the brewing and packaging subsidiaries of Grupo Modelo. Grupo Modelo’s principal beer brands areCorona,Modelo,VictoriaandPacífico. FEMSA Cerveza’s sales in the Mexican market depend on its ability to compete with Grupo Modelo.
Historically, beer imports have not been a significant factor in the Mexican beer market, primarily due to the Mexican consumer preference of Mexican brands. In 2007, this segment accounted for approximately 2.3% of total Mexican beer market in terms of sales volume. FEMSA Cerveza believes that the elimination of tariffs imposed on imported beers has had a limited effect on the Mexican beer market due to the fact that imported beers are largely premium and super-premium products sold in aluminum cans, which are a more expensive means of packaging in Mexico than beer sold in returnable bottles, and also given the dynamics of the beer market, where the point of sale is highly fragmented. Periods of relative strength of the Mexican peso with respect to the U.S. dollar, however, may lower the price of imported beer to consumers and may result in increased demand for imported beer in the Mexican market.
Regional market share differences
FEMSA Cerveza and Grupo Modelo are both strongest in beer markets in separate regions of Mexico. FEMSA Cerveza has a stronger market position in the northern and southern areas of Mexico while Grupo Modelo has a stronger market position in central Mexico. We believe that these regional market positions can be traced in part to consumer loyalty to the brand of beer that has historically been associated with a particular region.
We also believe that regional market strength is a function of the proximity of the breweries to the markets they serve. Transportation costs restrict the most efficient distribution of beer to a geographic area of approximately 300 to 500 kilometers surrounding a brewery. Generally, FEMSA Cerveza commands a majority of the beer sales in regions that are nearest to its largest breweries. FEMSA Cerveza’s largest breweries are in Orizaba, Veracruz and in Monterrey, Nuevo León. Grupo Modelo’s largest breweries are located in Mexico City, Oaxaca and Zacatecas.
The northern region of Mexico has traditionally enjoyed a higher per capita income level, attributable in part to its rapid industrialization within the last 50 years and to its commercial proximity to the United States. In addition, FEMSA Cerveza believes that per capita beer consumption is also greater in this region due to its warmer climate and a more ingrained beer culture.
Mexican Regional Demographic Statistics
Region | Percent of 2007 Total Population | Percent of Total 2007 Gross Domestic Product | Per Capita 2007 Gross Domestic Product(1) | |||||
Northern | 26.9 | % | 33.6 | % | Ps. 106.1 | |||
Southern | 22.9 | 15.3 | 56.9 | |||||
Central | 50.2 | 51.1 | 86.8 | |||||
Total | 100.0 | % | 100.0 | % | Ps. 85.2 |
Government regulation
The Mexican federal government regulates beer consumption in Mexico primarily through taxation while local governments in Mexico regulate primarily through the issuance of licenses that authorize retailers to sell alcoholic beverages.
Prior to 2005, federal taxes on beer consisted of a 15% value-added tax and an excise tax which is the higher of (1) 25% and (2) Ps. 3 per liter for non-returnable presentation or Ps. 1.74 for returnable presentations, as part of an environmental initiative by the Mexican governmental to encourage returnable presentations. The tax component of retail beer prices is significantly higher in Mexico than in the United States.
The number of retail outlets authorized to sell beer is controlled by local jurisdictions, which issue licenses authorizing the sale of alcoholic beverages. Other regulations regarding beer consumption in Mexico vary according to local jurisdiction and include limitations on the hours during which restaurants, bars and other retail outlets are allowed to sell beer and other alcoholic beverages.
FEMSA Cerveza has been engaged in addressing these limitations at various levels, including efforts with governmental and civil authorities to promote better education for the responsible consumption of beer. For instance, as part of its ongoing community activities, FEMSA Cerveza has been an active sponsor of a nationwide designated driver program in Mexico.
Since July 1984, Mexican federal regulation has required that all forms of beer packaging carry a warning advising that excessive consumption of beer is hazardous to one’s health. In addition, theLey General de Salud (the General Health Law), requires that all beers sold in Mexico maintain a sanitation registration with theSecretaría de Salud (the Ministry of Health).
Demographics of beer drinking population
We estimate that annual per capita beer consumption for the total Mexican population reached approximately 59 liters in 2007. The legal drinking age is 18 in Mexico. We consider the population segment of men between the ages of 18 and 45 to be FEMSA Cerveza’s primary market. At least 38% of the Mexican population is under the age of 18 and, therefore, is not considered to be part of the beer drinking population.
Based on historical trends and what management perceives as the continued social acceptance of beer consumption, FEMSA Cerveza believes that general population growth will result in an increase in the number of beer consumers in Mexico. Based on historical trends as measured by the Mexican Institute of Statistics, we expect the Mexican population to grow at an average annual rate of approximately 0.8% per year over the period from 2008 to 2012. We estimate that over the next 10 years approximately in excess of 1.5 million additional people per year will become potential beer consumers due to the natural aging of the Mexican population.
In 2007, estimated annual per capita beer consumption was approximately 59 liters in Mexico, as compared to approximately 82 liters in the United States.
Macroeconomic influences affecting beer consumption
We believe that consumption activity in the Mexican beer market is heavily influenced by the general level of economic activity in Mexico, the country’s gross wage base, changes in real disposable income and employment levels. As a result, the beer industry reacts sharply to economic change. The industry generally experiences high volume growth in periods of economic strength and slower volume growth or volume contraction in periods of economic weakness. Domestic beer sales declined in Mexico in 1982, 1983 and 1995. These sales decreases correspond to periods in which the Mexican economy experienced severe disruptions. Similarly, the economic slowdown observed in 2002 corresponded to a reduction in domestic beer sales in 2002. In 2003, given the effect of a continued economic slowdown on consumers, FEMSA Cerveza decided not to increase prices. The reduction in prices in real terms (after giving effect to inflation) was the main driver for increasing sales volumes during 2003. In 2004, growth in Mexico’s gross domestic product was the main driver for increasing beer sales volume, despite price increases in nominal terms in the Mexican beer industry. In 2005, 2006 and 2007, beer sales volume growth outpaced growth in Mexico’s gross domestic product. In 2006, beer sales volume growth was the highest in the last ten years due to the strong economy, which boosted consumption of our products.
Beer Prices
During 2005, FEMSA Cerveza increased prices in Mexico in line with inflation. In 2006, FEMSA Cerveza again increased prices, however, the increase in prices in 2006 was below the average increase registered in the Mexican consumer price index. During 2007, FEMSA Cerveza increased prices to partially compensate for the increase in raw material prices.
According to the Bank of Mexico’s consumer beer price index, for the Mexican beer industry as a whole, average consumer beer prices increased 2.9% in nominal terms in 2007, which means that the prices were flat in real terms. The following table shows relative real average retail prices since 2003 for the Mexican beer industry:
Mexican Beer Industry
Cumulative Real Consumer Beer Price Index: 2003-2007
| Year Ended December 31, | ||||||||
2007 | 2006 | 2005 | 2004 | 2003 | ||||
| 93.7 | 94.8 | 94.9 | 98.0 | 100.0 | ||||
Source: Bank of México
Product OverviewBottling Facility Summary
As of December 31, 2007, in Mexico FEMSA Cerveza produced and/or distributed 21 brands of beer in 14 different presentations resulting in a portfolio of 102 different product offerings. The most important brands in FEMSA Cerveza’s Mexican portfolio include:Tecate, Sol, Carta BlancaandIndio.These four brands, all of which are distributed nationwide in Mexico, accounted for approximately 89% of FEMSA Cerveza’s Mexico beer sales volume in 2007.
Per capita information, product segments, relative prices and packaging information with respect to FEMSA Cerveza have been computed and are based upon our statistics and assumptions.
Beer Presentations
In its Mexican operations, FEMSA Cerveza produces and distributes beer in returnable glass bottles and kegs and in non-returnable aluminum cans and glass bottles. FEMSA Cerveza uses the term presentation to reflect these packaging options.
Returnable presentations
The most popular form of packaging in the Mexican beer market is the returnable bottle. FEMSA Cerveza believes that the popularity of the returnable bottle is attributable to its lower price to the consumer. Returnable bottles may be reused an average of 30 times before being recycled. As a result, beer producers are able to charge lower prices for beer in returnable bottles. During periods when the Mexican economy is weak, returnable sales volume generally increase at a faster rate relative to non-returnable sales volume, given that non-returnable bottles are a more expensive presentation.
Non-returnable presentations
FEMSA Cerveza’s presentation mix in Mexico has been growing in non-returnable presentations in the last few years, as we tailor our offering to consumer preferences and provide different convenient alternatives. However, we believe that demand for these presentations is highly sensitive to economic factors because of their higher prices. The vast majority of export sales are in non-returnable presentations.
Relative Pricing
Returnable bottles and kegs are the least expensive beer presentation on a per-milliliter basis. Cans and non-returnable bottles have historically been priced higher than returnable bottles. The consumer preference for presentations in cans has varied considerably over the past 20 years, rising in periods of economic prosperity and declining in periods of economic austerity, reflecting the price differential between these forms of packaging.
Seasonality
Demand for FEMSA Cerveza’s beer is highest in the Mexican summer season, and consequently, brewery utilization rates are at their highest during this period. Demand for FEMSA Cerveza’s products also tends to increase in the month of December, reflecting consumption during the holiday season. Demand for FEMSA Cerveza’s products decreases during the months of November, January and February primarily as a result of colder weather in the northern regions of Mexico.
Primary Distribution
FEMSA Cerveza’s primary distribution in Mexico is from its production facilities to its distribution centers’ warehouses. FEMSA Cerveza delivers to a combination of company-owned and third party distributors. In an effort to improve the efficiency and alignment of the distribution network, FEMSA Cerveza has adjusted its relationship with independent distributors by implementing franchise agreements and as a result, has achieved economies of scale through integration with FEMSA Cerveza’s operating systems. In recent years, FEMSA Cerveza has achieved infrastructure and personnel efficiencies through the integration of company-owned distribution centers. The results of these efficiencies have been partially diminished by the acquisition of third party distribution centers. FEMSA Cerveza has increased its directly distributed volume in respect of its Mexican beer sales volume to 85%, operating through 234 company-owned distribution centers. The remaining 15% of the beer sales volume was sold through 68 third party distribution centers, most of them operating under franchise agreements with FEMSA Cerveza. A franchise agreement is offered only to those distributors that meet certain standards of operating capabilities, performance and alignment. FEMSA Cerveza has historically and intends to continue in the future to acquire those distributors that do not meet these standards. Through this initiative FEMSA Cerveza will continue to seek to increase its Mexico beer sales volume through company-owned distribution centers.
In addition to distributing its own brands, on June 22, 2004, FEMSA Cerveza’s brewing subsidiary and Coors Brewing Company entered into an agreement pursuant to which FEMSA Cerveza’s subsidiary was appointed the exclusive importer, distributor, marketer and seller ofCoors Light beer in Mexico.
Retail Distribution
The main sales outlets for beer in Mexico are small, independently-owned “mom and pop” grocery stores, dedicated beer stores or “depósitos,” liquor stores and bars. Supermarkets account for only a small percentage of beer sales in Mexico. In addition, FEMSA Comercio operates a chain of more than 5,500 convenience stores under the trade name OXXO that exclusively sell FEMSA Cerveza’s brands.
The Mexican retail market is fragmented and characterized by a preponderance of small outlets that are unable and unwilling to maintain meaningful inventory levels. Consequently, FEMSA Cerveza must make frequent product deliveries to its retailers. In recent years, FEMSA Cerveza has implemented the pre-sale process of distribution in its markets to improve its distribution practices. FEMSA Cerveza has completed the pre-sale process in all of its company-owned distribution centers. The pre-sale process is a distribution method in which the sales and delivery functions are separated and trucks are loaded with the actual mix of products that retailers have previously ordered. One of the primary objectives of pre-sale is to separate sales from distribution to ensure more reliable market access and to enhance efficiency by reducing the number of secondary distribution routes in otherwise highly fragmented markets. Where pre-sale has been implemented, we have experienced a significant reduction in unsold product and a net reduction in distribution personnel. The existence of the pre-sale process facilitates systematic product delivery and helps discipline product inventory at the point-of-sale. Furthermore, pre-sale has enabled FEMSA Cerveza to collect customer and consumer information directly from the marketplace, which then becomes valuable in defining brand portfolios by channel. See “—Marketing Strategy.”
As of December 31, 2007, FEMSA Cerveza serves more than 340,000 retailers in Mexico and its distribution network operates approximately 2,137 retail distribution routes.
Enterprise Resource Planning
FEMSA Cerveza operates an Enterprise Resource Planning system, or ERP, that provides an information and control platform to support commercial activities nationwide in Mexico and correlate them with the administrative and business development decision-making process occurring in FEMSA Cerveza’s central office. The Mexican beer sales volume of all FEMSA Cerveza’s company-owned distribution centers, including our main third party distributors, operates through ERP.
Marketing Strategy
FEMSA Cerveza focuses on the consumer by segmenting markets and positioning its brands, accordingly, striving to develop brand and packaging portfolios that provide the best alternatives for every consumption occasion at the appropriate price. By segmenting its markets, we refer to the technique whereby we design and execute relevant and distinctive positioning and communication strategies that allow us to satisfy different consumer needs. Continuous market research provides feedback that is used to develop and adapt our product offerings to best satisfy our consumers’ needs. We are increasingly focused on micro-segmentation, where we use our market research and our information technology systems to target smaller market segments, including in some cases the individual point-of-sale.
FEMSA Cerveza also focuses on the retailer by designing and implementing channel marketing at the point-of-sale, such as promotional programs providing merchandising materials and, where appropriate, refrigeration equipment. A channel refers to a point-of-sale category, or sub-category, such as a supermarket, beer depot or restaurants. Furthermore, we are always attempting to develop new channels in order to capture incremental consumption opportunities for our brands.
In order to coordinate the brand and channel strategies, we are developing and implementing integrated marketing programs, which aim to improve brand value through the simultaneous use of mass media advertising and targeted marketing efforts at the point-of-sale as well as event sponsorships. Our marketing program for a particular brand seeks to emphasize in a consistent manner the distinctive attributes of that brand.
FEMSA Cerveza has implemented a program called Innovation to efficiently enable corporate growth strategies. This program, which relies on our extensive consumer and market research practices, seeks the development of new packaging and product alternatives that allow us to capture new consumers and to strengthen the presence of our brands through brand line extensions. Innovation has been a key priority at FEMSA Cerveza and has been implemented throughout the value chain with the objective of allowing FEMSA Cerveza to continue to offer different options to consumers.
Plants and Facilities
FEMSA Cerveza currently operates six breweries in Mexico with an aggregate monthly production capacity of 2.88 million hectoliters, equivalent to approximately 34.6 million hectoliters of annual capacity. Each of FEMSA Cerveza’s Mexican breweries have received ISO 9001 and 9002 certification and a Clean Industry Certification (Industria Limpia) given by Mexican environmental authorities. A key consideration in the selection of a site for a brewery is its proximity to potential markets, as the cost of transportation is a critical component of the overall cost of beer to the consumer. FEMSA Cerveza’s Mexican breweries are strategically located across the country, as shown in the table below, to better serve FEMSA Cerveza’s distribution system.
FEMSA Cerveza Mexico Facility Capacity Summary
Year Ended December 31, 20072010
| |||
| |||
| |||
| |||
| |||
| |||
| |||
| |||
| |||
| |||
Between 2003 and 2007, FEMSA Cerveza increased its average monthly production capacity by approximately 175,000 hectoliters through additional investments in existing facilities.
During 2005, FEMSA Cerveza opened a new malt production facility in Puebla, Mexico, increasing its malting capacity by 16% to 154,000 tons per year. This facility covers an area of 18,000 square meters and is one of the largest and most technologically advanced in the world.
FEMSA Cerveza operates seven effluent water treatment systems in Mexico to treat the water used by the breweries, all of which are wholly owned by FEMSA Cerveza except for the effluent treatment system at the Orizaba brewery, which is a joint venture among FEMSA Cerveza, several other local companies and the government of the state of Veracruz.
In November 2007, FEMSA Cerveza announced an investment of US$275 million for the construction of a new brewery in Meoqui, Chihuahua, in Northern Mexico, which will begin operating in 2010. In its first stage, the new brewery will have an annual production capacity of 5 million hectoliters, an increase of 15% over FEMSA Cerveza’s current capacity in its Mexican territories.
Glass Bottles and Cans
FEMSA Cerveza produces (1) beverage cans and can ends, (2) glass bottles and (3) crown caps for glass bottle presentations principally to meet the packaging needs of its Mexican operations. The packaging operations include a silica sand mine, which provides materials necessary for the production of glass bottles. The following table provides a summary of the facilities for these operations:
FEMSA Cerveza Mexico Glass Bottle and Beverage Can Operations Product Summary
Year Ended December 31, 2007
Product | Location | Annual Production Capacity(1) | % Average Capacity Utilization | |||
Beverage cans | Ensenada | 1,700 | 100.0 | |||
| Toluca | 2,400 | 100.0 | ||||
| 4,100 | 100.0 | |||||
Can ends | Monterrey | 4,600 | 100.0 | |||
Crown cap | Monterrey | 18,000 | 85.0 | |||
Glass bottles | Orizaba | 1,190 | 80.6 | |||
Bottle decoration | Nogales | 330 | 60.3 | |||
Silica sand | Acayucan | 550 | 95.3 |
Country | Installed Capacity (thousands of unit cases) | % Utilization(1) | ||||||
Mexico | 1,651,786 | 73 | % | |||||
Guatemala | 35,909 | 72 | % | |||||
Nicaragua | 63,674 | 55 | % | |||||
Costa Rica | 85,194 | 53 | % | |||||
Panama | 41,428 | 60 | % | |||||
Colombia | 484,344 | 50 | % | |||||
Venezuela | 266,859 | 76 | % | |||||
Brazil | 630,276 | 69 | % | |||||
Argentina | 277,992 | 67 | % | |||||
| (1) |
Two plants produce aluminum beverage can bodies at production facilities in Ensenada and Toluca, and another plant produces can ends at a production facility in Monterrey. During 2007, 60.3% of the beverage can volume produced by these plants was used by FEMSA Cerveza and the remaining amount was sold to third parties.
Glass bottles are produced at a glass production facility in Orizaba, Veracruz and bottles are decorated at a plant in Nogales, Veracruz. During 2007, 82.8% of the glass bottle volume produced by these plants was used by FEMSA Cerveza, and the remaining 17.2% was sold to Coca-Cola FEMSA.
In addition to the construction of the new brewery in Meoqui, Chihuaha, FEMSA Cerveza announced a US$117 million investment for the construction of a new glass bottle facility in Meoqui, which will also begin operations in 2010.
Raw Materials
Malted barley, hops, certain grains, yeast and water are the principal ingredients used in manufacturing FEMSA Cerveza’s beer products. The principal raw materials used by FEMSA Cerveza’s packaging operations include aluminum, steel and silica sand. All of these raw materials are generally available in the open market. FEMSA Cerveza satisfies its commodity requirements through purchases from various sources, including purchases pursuant to contractual arrangements and purchases in the open market.
Aluminum and steel are two of the most significant raw materials used in FEMSA Cerveza’s packaging operations to make aluminum cans, can ends and bottle caps. FEMSA Cerveza purchases aluminum and steel directly from international and local suppliers on a contractual basis. These contracts generally have terms of six months or one year and specify prices free-on-board at FEMSA Cerveza’s facilities. Companies such as Alcoa, Nittetsu-Shoji, Noreli, CSN, Rasselstein and AHMSA have been selected as suppliers. Prices of aluminum and steel are generally quoted in U.S. dollars, and FEMSA Cerveza’s cost is therefore affected by changes in exchange rates. For example, a depreciation of the Mexican peso against the U.S. dollar will increase the cost to FEMSA Cerveza of aluminum and steel, and will decrease FEMSA Cerveza’s margins as its sales are generally denominated in Mexican pesos. To date, FEMSA Cerveza’s silica sand mine has been able to satisfy all of the silica sand requirements of its glass bottle operations.
Barley is FEMSA Cerveza’s most significant raw material for the production of its beer products. International markets determine the prices and supply sources of agricultural raw materials, which are affected by the level of crop production, inventories, weather conditions, domestic and export demand, as well as government regulations affecting agriculture. The principal source of barley for the Mexican beer industry is the domestic harvest. If domestic production in Mexico is insufficient to meet the industry’s requirements, barley (or its equivalent in malt) can be obtained from international markets. Raw material prices have increased in recent years, and in particular the price for barley due to the fact that for two consecutive years the harvests of Europe and Australia (two of the largest producers) have fallen because of droughts and untimely rains. Additionally, the price of wheat, which is not an ingredient of our beers, but competes for land with barley and other grains, has increased drastically due to fallen harvests, and therefore, the price of wheat is adding pressure to the price of grains worldwide.
Hops are the only ingredient that is not available domestically in Mexico. FEMSA Cerveza imports hops primarily from the United States and Europe.
Brazil Operations
The Brazilian Beer Market
The Brazilian beer market was the fifth largest beer market in the world in terms of industry sales volume in 2007 and is characterized by (1) concentrated domestic beer production, (2) favorable demographics in the beer drinking population, and (3) a fragmented retail channel.
Concentrated Brazilian beer production
The Brazilian beer market is comprised of one large producer holding substantial market share, three medium sized producers, and some minor regional brewers. The large producer is Companhia de Bebidas das Americas or AmBev, a publicly traded company based in Sao Paulo that is majority-owned by the Belgian brewer Inbev. AmBev’s principal beer brands areSkol, BrahmaandAntarctica.AmBev is also a large bottler of sparkling beverages, with brands such asGuaraná AntarcticaandPepsi Cola.The three medium sized producers are FEMSA Cerveza, Grupo Schincariol, whose main brand isNova Schin, and Cervejaria Petropolis, whose main brand isCrystal. FEMSA Cerveza’s sales in the Brazilian market depend on its ability to compete in a complex competitive environment with a large producer with predominant market share and two strong regional local brewers. Historically, beer imports have not been a significant factor in the Brazilian beer market, but are increasing as the super premium beer segment develops.
Demographics of beer drinking population
We estimate that annual per capita beer consumption for the total Brazilian population reached approximately 54 liters in 2007. The legal drinking age is 18 in Brazil. We consider the population segment of men between the ages of 18 and 45 to be FEMSA Cerveza’s primary market. Approximately 37% of the Brazilian population is under the age of 18 and, therefore, is not considered to be part of the beer drinking population.
Based on historical trends and what management perceives as the continued social acceptance of beer consumption, FEMSA Cerveza believes that general population growth will result in an increase in the number of beer consumers in Brazil. Based on historical trends as measured by theInstituto Brasileiro de Geografia e Estadística (Brazilian Institute of Statistics), or IBGE, we expect the Brazilian population to grow at an average annual rate of approximately 1.3% per year over the period from 2008 to 2012.We estimate that over the next 10 years approximately in excess of 3 million additional people per year will become potential beer consumers due to the natural aging of the Brazilian population.
Product Overview
As of December 31, 2007, in Brazil FEMSA Cerveza produced and/or distributed 12 brands of beer in 7 different presentations resulting in a portfolio of 37 different product offerings. The most important brands in FEMSA Cerveza’s Brazilian portfolio include:Kaiser, Bavaria, Sol, HeinekenandXingu.These five brands, all of which are distributed nationwide in Brazil, accounted for approximately 98% of FEMSA Cerveza’s Brazil beer sales volume in 2007.
Beer Presentations
In its Brazilian breweries, FEMSA Cerveza produces and distributes beer in returnable glass bottles and kegs and in non-returnable aluminum cans and glass bottles. In the Brazilian beer market, the most popular presentation is the 600 ml returnable bottle because of the affordability of this presentation combined with its popularity in the on-premise segment. However, in the past years the sales volume mix has slightly shifted towards non-returnable presentations, which can be attributed in part to improvements in the Brazilian economy.
Primary Distribution
FEMSA Cerveza’s primary distribution in Brazil is from its production facilities to the warehouses of the various Coca-Cola franchise bottlers in Brazil. There are 19 Coca-Cola bottlers across Brazil, each responsible for a certain geographic territory including subsidiaries of Coca-Cola FEMSA.
Retail Sales and Distribution
FEMSA Cerveza relies on the 19 different bottlers of the Coca-Cola system across Brazil for the sale and secondary distribution of our beers. The bottlers leverage their infrastructure, sales force, expertise, distribution assets and refrigeration equipment at the point of sale to offer a broad portfolio of products to the retailer.
Plants and Facilities
FEMSA Cerveza currently operates eight breweries in Brazil with an aggregate monthly production capacity of 1.7 million hectoliters, equivalent to approximately 20 million hectoliters of annual capacity. Six of FEMSA Cerveza’s eight Brazilian breweries have received ISO 9001 14.000 and OHASA 18.000 certifications. Two breweries were ISO 9001 certificated during 2007. A key consideration in the selection of a site for a brewery is its proximity to potential markets, as the cost of transportation is a critical component of the overall cost of beer to the consumer. FEMSA Cerveza’s Brazilian breweries are strategically located across the country, as shown in the table below, to better serve FEMSA Cerveza’s distribution system.
FEMSA Cerveza Brazil Facility Allocation
as of December 31, 2007
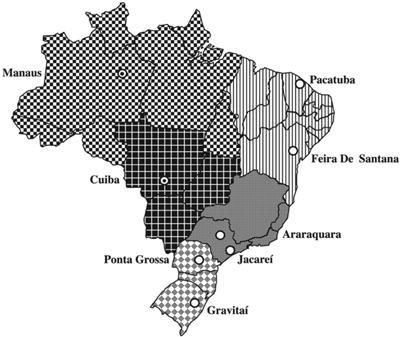
FEMSA Cerveza Brazil Facility Capacity Summary
Year Ended December 31, 2007
| |||
| |||
| |||
| |||
| |||
| |||
| |||
| |||
| |||
| |||
| |||
| |||
Exports
FEMSA Cerveza’s principal export market is the United States and its export strategy focuses on that country. In particular, FEMSA Cerveza concentrates efforts on its core markets located in the sun-belt states bordering Mexico, while seeking to develop its brands in key imported beer markets located in the eastern United States. FEMSA Cerveza believes that these two regions of the United States represent one of its greatest potential market outside of Mexico.
Prior to January 1, 2005, Labatt USA was the importer of FEMSA Cerveza’s brands in the United States. On June 21, 2004, FEMSA Cerveza and two of its subsidiaries entered into distributor and sublicense agreements with Heineken USA. In accordance with these agreements, on January 1, 2005, Heineken USA became the exclusive importer, marketer and seller of FEMSA Cerveza’s brands in the United States. In April 2007, FEMSA Cerveza and Heineken USA entered into a new ten-year agreement pursuant to which Heineken USA will continue to be the exclusive importer, marketer and distributor of FEMSA Cerveza’s beer brands in the United States. This agreement went into effect on January 1, 2008.
Export beer sales volume of 3.183 million hectoliters in 2007 represented 8.0% of FEMSA Cerveza’s total beer sales volume and accounted for 10.9% of FEMSA Cerveza’s total beer sales. The following table highlights FEMSA Cerveza’s export beer sales volumes and export beer sales:
FEMSA Cerveza Export Summary
| Year Ended December 31, | |||||||||||||||
| 2007 | 2006 | 2005 | 2004 | 2003 | |||||||||||
Export beer sales volume(1) | 3,183 | 2,811 | 2,438 | 2,240 | 1,982 | ||||||||||
Volume growth(2) | 13.2 | % | 15.3 | % | 8.8 | % | 13.0 | % | 1.4 | % | |||||
Percent of total beer sales volumes(3) | 8.0 | % | 7.4 | % | 9.0 | % | 8.7 | % | 8.1 | % | |||||
Mexican pesos(4) (millions) | 3,339 | 2,977 | 2,717 | 2,008 | 1,737 | ||||||||||
U.S. dollars(5) (millions) | 299 | 256 | 227 | 156 | 133 | ||||||||||
Revenue growth (US$)(2) | 16.5 | % | 13.0 | % | 45.8 | % | 16.7 | % | 4.6 | % | |||||
Percent of total beer sales | 8.4 | % | 8.1 | % | 10.2 | % | 8.1 | % | 7.2 | % | |||||
FEMSA Cerveza currently exports its products to 47 countries. The principal export market for FEMSA Cerveza is North America, which accounted for 89% of FEMSA Cerveza’s export beer sales volume in 2007.
FEMSA Cerveza’s principal export brands areTecate, XX Lager,Dos Equis (Amber) andSol. These brands collectively accounted for 93% of FEMSA Cerveza’s export sales volume for the year ended December 31, 2007.
Overview and Background
FEMSA Comercio operates the largest chain of convenience stores in Mexico, measured in terms of number of stores as of December 31, 2007,2010, under the trade name OXXO. As of December 31, 2007,2010, FEMSA Comercio operated 5,5638,426 OXXO stores, of which 8,409 are located in 31 states ofthroughout the country, with a particularly strong presence in the northern part of Mexico.Mexico, and the remaining 17 stores are located in Bogotá, Colombia.
FEMSA Comercio, the largest single customer of FEMSA CervezaCuauhtémoc Moctezuma and of the Coca-Cola system in Mexico, was established by FEMSA in 1978 when two OXXO stores were opened in Monterrey, one store in Mexico City and another store in Guadalajara. The motivating factor behind FEMSA’s entrance into the retail industry was to enhance beer sales through company-owned retail outlets as well as to gather information on customer preferences. In 2007,2010, sales of beer through OXXO represented 11% of FEMSA Cerveza’s domestic beer sales volume as well as approximately 13.4%16.1% of FEMSA Comercio’s revenues. In 2007,2010, a typical OXXO store carried 1,8002,059 different store keeping units (SKUs) in 31 main product categories.
In recent years, FEMSA Comercio has gained importance as an effective distribution channel for our beverage products, as well as a rapidly growing point of contact with our consumers. Based on the belief that location plays a major role in the long-term success of a retail operation such as a convenience store, as well as a role in our continually improving ability to accelerate and streamline the new-store development process, FEMSA Comercio has focused on a strategy of rapid, profitable growth. FEMSA Comercio opened 675, 706811, 960 and 7161,092 net new OXXO stores in 2005, 20062008, 2009 and 2007,2010, respectively. The accelerated expansion in the number of stores yielded total revenue growth of 14.3%16.3% to reach Ps. 42,10362,259 million in 2007, while same2010. Same store sales increased 3.3%,an average of 5.2% driven by an increase in store traffic. Starting in 2008, FEMSA Comercio revenues reflect an accounting effect of the mix shift from physical prepaid wireless air-time cards to the sale of electronic air-time for which was considerably higher thanonly the retail industry average.margin is recorded, not the full revenue amount of the electronic recharge. FEMSA Comercio performed approximately 1,357 million2.3 billion transactions in 20072010 compared to 1,168 million2.0 billion in 2006.2009.
Business Strategy
A fundamental element of FEMSA Comercio’s business strategy is to utilize its position in the convenience store market to grow in a cost-effective and profitable manner. As a market leader in convenience store retailing, based on internal company surveys, management believes that FEMSA Comercio has an in-depth understanding of its markets and significant expertise in operating a national store chain. FEMSA Comercio intends to continue increasing its store base while capitalizing on the market knowledge gained at existing stores.
FEMSA Comercio has developed proprietary models to assist in identifying appropriate store locations, store formats and product categories. Its model utilizes location-specific demographic data and FEMSA Comercio’s experience in similar locations to fine tune the store format and product offerings to the target market. Market segmentation is becoming an important strategic tool, and it should increasingly allow FEMSA Comercio to improve the operating efficiency of each location and the overall profitability of the chain.
FEMSA Comercio has made and will continue to make significant investments in information technology to improve its ability to capture customer information from its existing stores and to improve its overall operating performance. AllThe majority of products carried through OXXO stores are bar-coded, and all OXXO stores are equipped with point-of-sale systems that are integrated into a company-wide computer network. To implement revenue management strategies, FEMSA Comercio created a division in charge of product category management for products, such as beverages, fast food and perishables, to enhance and better utilize its consumer information base and market intelligence capabilities. FEMSA Comercio has implemented an ERP system, which will allow FEMSA Comercio to redesigncontinue redesigning its key operating processes and enhance the usefulness of its market information going forward. In addition, FEMSA Comercio has expanded its operations by opening 12 new stores in Bogotá, Colombia in 2010.
FEMSA Comercio has adopted innovative promotional strategies in order to increase store traffic and sales. In particular, FEMSA Comercio sells high-frequency items such as beverages, snacks and cigarettes at competitive
prices. FEMSA Comercio’s ability to implement this strategy profitably is partly attributable to the size of the OXXO chain, as FEMSA Comercio is able to work together with its suppliers to implement their revenue-management strategies through differentiated promotions. OXXO’s national and local marketing and promotional strategies are an effective revenue driver and a means of reaching new segments of the population while strengthening theOXXO brand. For example, the organization has refined its expertise in executing cross promotions (discounts on multi-packs or sales of complementary products at a special price) and targeted promotions to attract new customer segments, such as housewives, by expanding the offerings in the grocery product category in certain stores. FEMSA Comercio is also strengthening its capabilities to increasingly provide consumers with services such as utility bill payment and other basic transactions.
Store Locations
With 5,5638,409 OXXO stores in Mexico and 17 stores in Colombia as of December 31, 2007,2010, FEMSA Comercio operates the largest convenience store chain in Latin America measured by number of stores. OXXO stores are concentrated in the northern part of Mexico, but also have a growing presence in centralthe rest of the country.
FEMSA Comercio
Regional Allocation of OXXO Stores in Mexico and the Gulf coast.
as of December 31, 2010
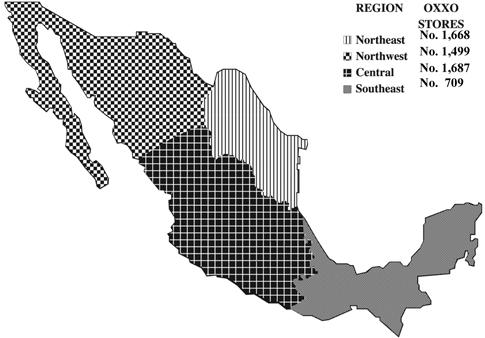
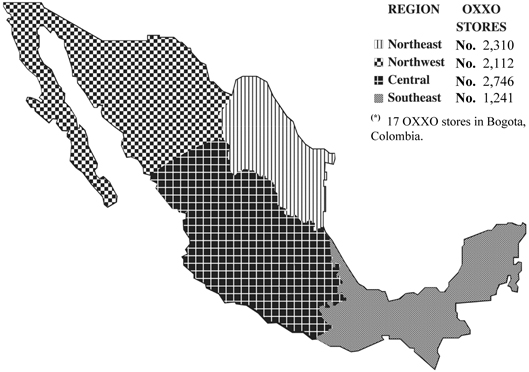
FEMSA Comercio has aggressively expanded its number of stores over the past several years. The average investment required to open a new store varies, depending on location and format and whether the store is opened in an existing retail location or requires construction of a new store. FEMSA Comercio is generally able to use supplier credit to fund the initial inventory of new stores.
Growth in Total OXXO Stores
| Year Ended December 31, | Year Ended December 31, | ||||||||||||||||||||||||||||||||||
| 2007 | 2006 | 2005 | 2004 | 2003 | 2010 | 2009 | 2008 | 2007 | 2006 | ||||||||||||||||||||||||||
Total OXXO stores | 5,563 | 4,847 | 4,141 | 3,466 | 2,798 | 8,426 | 7,334 | 6,374 | 5,563 | 4,847 | |||||||||||||||||||||||||
Store growth (% change over previous year) | 14.8 | % | 17.0 | % | 19.5 | % | 23.9 | % | 26.3 | % | 14.9 | % | 15.1 | % | 14.6 | % | 14.8 | % | 17.0 | % | |||||||||||||||
FEMSA Comercio currently expects to continue the growth trend established over the past several years by emphasizing growth in areas of high economic potential in existing markets and by expanding in underserved and unexploited markets. Management believes that the southeast part of Mexico is particularly underserved by the convenience store industry.
The identification of locations and pre-opening planning in order to optimize the results of new stores are important elements in FEMSA Comercio’s growth plan. FEMSA Comercio continuously reviews store performance against certain operating and financial benchmarks to optimize the overall performance of the chain. Stores unable to maintain benchmark standards are generally closed. Between December 31, 20032006 and 2007,2010, the total number of OXXO stores increased by 2,765,3,579 which resulted from the opening of 2,8743,663 new stores and the closing of 10984 existing stores.
Competition
OXXO competes in the convenience store segment of the retail market with 7-Eleven, Super Extra, Super City Circle-K and AM/PM,Circle-K, as well as other local convenience stores. The format of these stores is similar to the format of the OXXO stores. OXXO competes both for consumers and for new locations for stores and the managers to operate those stores. Based on an internal market survey conducted by FEMSA Comercio, management believes that, as of December 31, 2007,2010, there were approximately 8,89813,138 stores in Mexico that could be considered part of the convenience store segment of the retail market. OXXO is the largest chain in Mexico, operating more than half60% of thesethe country’s convenience stores. Furthermore, FEMSA Comercio operates in 31the 32 Mexican states and has much broader geographical coverage than any of its competitors in Mexico.
Market and Store Characteristics
Market Characteristics
FEMSA Comercio is placing increased emphasis on market segmentation and differentiation of store formats to more appropriately serve the needs of customers on a location-by-location basis. The principal segments include residential neighborhoods, commercial and office locations and stores near schools and universities, along with other types of specialized locations.
Approximately 67% of OXXO’s customers are between the ages of 15 and 35. FEMSA Comercio also segments the market according to demographic criteria, including income level.
Store Characteristics
The average size of an OXXO store is approximately 111105 square meters of selling space, excluding space dedicated to refrigeration, storage or parking. The average constructed area of a store is approximately 186 square meters and, when parking areas are included, the average store size increases to approximately 440437 square meters.
FEMSA Comercio—Operating Indicators
| Year Ended December31, | Year Ended December 31, | ||||||||||||||||||||||||||||||||||
| 2007 | 2006 | 2005 | 2004 | 2003 | 2010 | 2009 | 2008 | 2007 | 2006 | ||||||||||||||||||||||||||
| (percentage increase compared to previous year) | (percentage increase compared to previous year) | ||||||||||||||||||||||||||||||||||
Total FEMSA Comercio revenues | 14.3 | % | 18.7 | % | 21.8 | % | 24.8 | % | 24.5 | % | 16.3 | % | 13.6 | % | 12.0 | % | 14.3 | % | 18.7 | % | |||||||||||||||
OXXO same-store sales(1) | 3.3 | % | 8.2 | % | 8.7 | % | 8.9 | % | 8.2 | % | 5.2 | % | 1.3 | % | 0.4 | % | 3.3 | % | 8.2 | % | |||||||||||||||
| (percentage of total) | |||||||||||||||||||||||||||||||||||
| (percentage of total) | |||||||||||||||||||||||||||||||||||
Beer-related data: | |||||||||||||||||||||||||||||||||||
Beer sales as % of total store sales | 13.4 | % | 13.5 | % | 13.0 | % | 13.4 | % | 12.8 | % | 16.1 | % | 15.1 | % | 14.6 | % | 13.4 | % | 13.5 | % | |||||||||||||||
OXXO store sales as a % of FEMSA Cerveza’s volume | 11.0 | % | 9.9 | % | 8.6 | % | 7.3 | % | 5.4 | % | |||||||||||||||||||||||||
| (1) | Same-store sales growth is calculated by comparing the sales of stores for each year that have been in operation for |
Beer, cellular telephone cards,air-time, soft drinks and cigarettes represent the main product categories for OXXO stores. FEMSA Comercio has a distribution agreement with FEMSA Cerveza.Cuauhtémoc Moctezuma. As a result of this agreement, OXXO stores only carry beer brands produced and distributed by FEMSA Cerveza.Cuauhtémoc Moctezuma. OXXO stores will continue to benefit from the existing relationship under which Cuauhtémoc Moctezuma will continue to be the exclusive supplier of beer to OXXO until June 2020. Prior to 2001, OXXO stores had informal agreements with Coca-Cola bottlers, including Coca-Cola FEMSA’s territories in central Mexico, to sell only their products. Since 2001, a limited number of OXXO stores began sellingPepsi products in certain cities in northern Mexico, as part of a defensive competitive strategy.Mexico.
Approximately 76%69% of OXXO stores are operated by independent managers responsible for all aspects of store operations. The managers are commission agents and are not employees of FEMSA Comercio. Each store manager is the legal employer of the store’s staff, which typically numbers six people per store. FEMSA Comercio continually invests in on-site operating personnel, with the objective of promoting loyalty, customer-service and low personnel turnover in the stores.
Advertising and Promotion
FEMSA Comercio’s marketing efforts include both specific product promotions and image advertising campaigns. These strategies seek to increase store traffic and sales, and to reinforce the OXXO name and market position.
FEMSA Comercio manages its advertising on three levels depending on the nature and scope of the specific campaign: local or store-specific, regional and national. Store-specific and regional campaigns are closely monitored to ensure consistency with the overall corporate image of OXXO stores and to avoid conflicts with national campaigns. FEMSA Comercio primarily uses point of purchase materials, flyers, handbills and print and radio media for promotional campaigns, although television is used occasionally for the introduction of new products and services. The OXXO chain’s image and brand name are presented consistently across all stores, irrespective of location.
Inventory and Purchasing
FEMSA Comercio has placed considerable emphasis on improving operating performance. As part of these efforts, FEMSA Comercio continues to invest in extensive information management systems to improve inventory management. Electronic data collection has enabled FEMSA Comercio to reduce average inventory levels. Inventory replenishment decisions are carried out on a store-by-store basis.
Management believes that the OXXO chain’s scale of operations provides FEMSA Comercio with a competitive advantage in its ability to realize strategic alliances with suppliers. General category offerings are determined on a national level, although purchasing decisions are implemented on a local, regional or national level, depending on the nature of the product category. Given the fragmented nature of the retail industry in Mexico in general, Mexican producers of beer, soft drinks, bread, dairy products, snacks, cigarettes and other high-frequency
products have established proprietary distribution systems with extensive direct distribution routes. As a result, approximately 56%53% of the products carried by the OXXO chain are delivered directly to the stores by suppliers. Other products with longer shelf lives are distributed to stores by FEMSA Comercio’s distribution system, which includes nine11 regional warehouses located in Monterrey, Mexico City, Guadalajara, Mexicali, Mérida, León, Obregón, Puebla, Chihuahua, Reynosa and Chihuahua.Tijuana. The distribution centers operate a fleet of approximately 242491 trucks that make deliveries to each store approximately everyonce a week.
Seasonality
OXXO stores experience periods of high demand in December, as a result of the holidays, and in July and August, as a result of increased consumption of beer and soft drinks during the hot summer months. The months of November and February are generally the weakest sales months for OXXO stores. In general, colder weather during these months reduces store traffic and consumption of cold beverages.
Other Stores
FEMSA Comercio also operates other stores under the names Bara, Six and Matador.
FEMSA Cerveza and Equity Method Investment in the Heineken Group
Until April 30, 2010, FEMSA Cerveza was our wholly-owned subsidiary, producing beer in Mexico and Brazil and exporting its products to more than 50 countries worldwide, with North America being its most important export market, followed by certain markets in Europe, Latin America and Asia. As of December 31, 2009, FEMSA Cerveza was ranked the tenth-largest brewer in the world in terms of sales volume, and in Mexico, its main market, FEMSA Cerveza was ranked the second-largest beer producer in terms of sales volume. In 2009, approximately 66.4% of FEMSA Cerveza’s sales volume came from Mexico, with the remaining 24.8% from Brazil and 8.8% from exports. As of December 31, 2009, FEMSA Cerveza sold 40.548 million hectoliters of beer and produced and/or distributed 21 brands of beer in 14 different presentations resulting in a portfolio of 111 different product offerings in Mexico.
As of December 31, 2009, FEMSA Cerveza represented 23.5% of our total revenues and 34.1% of our total assets. For the period from January 1, 2010 to April 30, 2010, FEMSA Cerveza contributed net income of Ps. 706 to our net income. On April 30, 2010, FEMSA announced the closing of the transaction pursuant to which FEMSA agreed to exchange 100% of its beer operations for a 20% economic interest in the Heineken Group. The principal terms of the Heineken transaction documents are summarized below in “Item 10. Additional Information—Material Contracts.”
As of April 30, 2010, FEMSA owns a non-controlling interest in the Heineken Group, one of the world’s leading brewers. Our 20% economic interest in the Heineken Group was comprised of 43,018,320 shares of Heineken Holding N.V. and 43,009,699 shares of Heineken N.V., with an additional 29,172,504 shares to be delivered pursuant to allotted share delivery instruments. As of May 31, 2011, 13,147,233 shares have been delivered pursuant to the allotted share delivery instruments. For the eight-month period from May 1, 2010 to December 31, 2010, FEMSA recognized an equity income of Ps. 3,319 million regarding its economic interest in the Heineken Group.
FEMSA Comercio has a distribution agreement with Cuauhtémoc Moctezuma (which is now a part of the Heineken Group) pursuant to which OXXO stores only carry beer brands produced and distributed by Cuauhtémoc Moctezuma. OXXO stores will continue to benefit from the existing relationship under which Cuauhtémoc Moctezuma will continue to be the exclusive supplier of beer to OXXO until June 2020. As of April 30, 2010, Coca-Cola FEMSA has agreed with Cervejarias Kaiser (also now part of the Heineken Group) to continue to distribute and sell the Kaiser beer portfolio in Coca-Cola FEMSA’s Brazilian territories for a 20-year term beginning in 2003, consistent with the arrangement already in place. In addition, our corporate and shared services subsidiary will continue to provide certain services to Cuauhtémoc Moctezuma and its subsidiaries.
Our other business consists of the following smaller operations that support our core operations:
Our commercial refrigerators, labels and flexible packaging subsidiaries. The refrigeration business produces vertical and horizontal commercial refrigerators for the soft drink, beer and food industries, with an annual capacity of 180,300260,500 units at December 31, 2007.2010. In 2007,2010, this business sold 161,519293,982 refrigeration units, 16.0 % of which were sold to FEMSA Cerveza, 32.3%40% of which were sold to Coca-Cola FEMSA, and the remainder of which were sold to third parties. TheUntil December 31, 2010, our labeling and flexible packaging business has its facility in Monterrey with an annual production capacity of 335,081 thousands meters of flexible packaging.was our wholly-owned subsidiary. In 2007,2010, this business sold 46%14% of its label sales volume to FEMSA Cerveza, 21%Cuauhtémoc Moctezuma, 20% to Coca-Cola FEMSA and 33%66% to third parties. Management believes that growth at these businesses will continue to reflect the marketing strategies of Coca-Cola FEMSAOur labeling and FEMSA Cerveza.flexible packaging business was sold on December 31, 2010.
Our logistics services subsidiary provides logistics services to Coca-Cola FEMSA, FEMSA Empaques, the packaging operations of FEMSA Cerveza, FEMSA Comercio and third partythird-party clients that either supply or participate directly in the Mexican beverage industry or in other industries. It also provided logistics services to the packaging operations of FEMSA and to Cuauhtémoc Moctezuma. This business provides integrated logistics support for its clients’ supply chain, including the management of carriers and other supply chain services.
| • |
|
Our corporate services subsidiary employs all of our corporate staff, including the personnel managing the areas of finance, corporate accounting, taxation, legal, financial and strategic planning, human resources and internal audit. Through this subsidiary, we direct, control, supervise and review the operations of our sub-holding companies. FEMSA Cerveza,As of December 31, 2010, FEMSA Comercio and our packaging subsidiaries pay management fees for the services provided to them. In addition, FEMSA Cerveza and Coca-Cola FEMSA have eachhas entered into a services agreement pursuant to which they payit pays for specific services. As part of the Heineken transaction, the corporate and shared services subsidiaries will continue to provide some limited corporate services and shared services to subsidiaries of Cuauhtémoc Moctezuma (now part of the Heineken Group), for which such companies will continue to pay.
Description of Property, Plant and Equipment
As of December 31, 2007,2010, we owned all of our manufacturing facilities and substantially all of our warehouses and distribution centers. Our properties primarily consisted of production and distribution facilities for our beer and soft drink operations and office space. In addition, FEMSA Comercio owns approximately 12.7%10.9% of the OXXO store locations, while the other stores are located in properties that are rented under long-term lease arrangements with third parties.
The table below sets forth the location, principal use and production area of our production facilities, and the sub-holding company that owns such facilities.each of which is owned by Coca-Cola FEMSA.
Production Facilities of FEMSA
As of December 31, 20072010
| Location | Principal Use | Production Area | |||
(in thousands
| ||||||
| ||||||
Mexico | San Cristóbal de las Casas, Chiapas | Soft Drink Bottling Plant | 45 | |||
| Cuautitlán, Estado de México | Soft Drink Bottling Plant | 35 | ||||
| Los Reyes la Paz, Estado de México | Soft Drink Bottling Plant | 50 | ||||
| Toluca, Estado de México | Soft Drink Bottling Plant | 242 | ||||
| León, Guanajuato | Soft Drink Bottling Plant | |||||
| Morelia, Michoacan | Soft Drink Bottling Plant | 50 | ||||
| Ixtacomitán, Tabasco | Soft Drink Bottling Plant | |||||
| Apizaco, Tlaxcala | Soft Drink Bottling Plant | 80 | ||||
| Coatepec, Veracruz | Soft Drink Bottling Plant | 142 | ||||
Guatemala | Guatemala City | Soft Drink Bottling Plant | ||||
Nicaragua | Managua | Soft Drink Bottling Plant | ||||
Costa Rica | Calle Blancos, San José | Soft Drink Bottling Plant | 52 | |||
| Coronado, San José | Soft Drink Bottling Plant | 14 | ||||
Panama | Panama City | Soft Drink Bottling Plant | 29 | |||
Colombia | Barranquilla | Soft Drink Bottling Plant | ||||
| Bogotá | Soft Drink Bottling Plant | |||||
| Bucaramanga | Soft Drink Bottling Plant | 26 | ||||
| Cali | Soft Drink Bottling Plant | |||||
| Manantial | Soft Drink Bottling Plant | 67 | ||||
| Medellín | Soft Drink Bottling Plant | |||||
Venezuela | Antimano | Soft Drink Bottling Plant | ||||
| Barcelona | Soft Drink Bottling Plant | 141 | ||||
| Maracaibo | Soft Drink Bottling Plant | 68 | ||||
| Valencia | Soft Drink Bottling Plant | 100 | ||||
Brazil | Campo Grande | Soft Drink Bottling Plant | 36 | |||
| Jundiaí | Soft Drink Bottling Plant | 191 | ||||
| Soft Drink Bottling Plant | ||||||
| Belo Horizonte | Soft Drink Bottling Plant | 73 | ||||
Argentina | Alcorta | Soft Drink Bottling Plant | 73 | |||
| ||||||
| ||||||
| ||||||
| ||||||
We maintain an “all risk” insurance policy covering our properties (owned and leased), machinery and equipment and inventories as well as losses due to business interruptions. The policy covers damages caused by natural disaster, including hurricane, hail, earthquake and damages caused by human acts, including explosion, fire, vandalism, riot and losses incurred in connection with goods in transit. In addition, we maintain an “all risk” liability insurance policy that covers product liability. We purchase our insurance coverage through an insurance broker. The policies for “all risk” property insurance and “all risk” liability insurance are issued byAllianz México, ACE Seguros, S.A., Aseguradora, and the coverage is partially reinsured in the international reinsurance market. We believe that our coverage is consistent with the coverage maintained by similar companies operating in Mexico.
Capital Expenditures and Divestitures
Our consolidated capital expenditures for the years ended December 31, 2007, 2006,2010, 2009 and 20052008 were Ps. 11,25711,171 million, Ps. 9,4229,103 million and Ps. 7,5087,816 million respectively, and were for the most part financed from cash from operations generated by our subsidiaries. These amounts were invested in the following manner:
| Year Ended December 31, | Year Ended December 31, | |||||||||||||||||||
| 2007 | 2006 | 2005 | 2010 | 2009 | 2008 | |||||||||||||||
| (in millions of constant Mexican pesos) | (in millions of Mexican pesos) | |||||||||||||||||||
Coca-Cola FEMSA | 3,682 | Ps. | 2,863 | Ps. | 2,516 | Ps. | 7,478 | Ps. | 6,282 | Ps. | 4,802 | |||||||||
FEMSA Cerveza | 5,373 | 4,419 | 3,197 | |||||||||||||||||
FEMSA Comercio | 2,112 | 1,943 | 1,528 | 3,324 | 2,668 | 2,720 | ||||||||||||||
Other | 90 | 197 | 267 | 369 | 153 | 294 | ||||||||||||||
Total | 11,257 | Ps. | 9,422 | Ps. | 7,508 | |||||||||||||||
Total(1) | Ps. | 11,171 | Ps. | 9,103 | Ps. | 7,816 | ||||||||||||||
| (1) | Capital expenditures and divestitures in 2009 and 2008 have been modified in order to conform to 2010 figures presentation due to the discontinued operations of FEMSA Cerveza. |
Coca-Cola FEMSA
During 2007,2010, Coca-Cola FEMSA’s capital expenditures focused on investments inincreasing plant production capacity, placing coolers with retailers, returnable bottles and cases, increasing plant operating capacity, placing refrigeration equipment with retailers and improving the efficiency of its distribution infrastructure.infrastructure and information technology. Capital expenditures in Mexico were approximately Ps.1,945Ps. 2,932 million and accounted for approximately 50%39% of Coca-Cola FEMSA’s capital expenditures.
FEMSA Cerveza
Production
During 2007, FEMSA Cerveza invested approximately Ps. 643 million on equipment substitution and upgrades in its facilities. FEMSA Cerveza’s monthly installed capacity as of December 31, 2007 was 4.55 million hectoliters, equivalent to an annualized installed capacity of 54.6 million hectoliters. In addition, FEMSA Cerveza invested Ps. 645 million in plant improvements and equipment upgrades for its beverage can and glass bottle operations.
Distribution
In 2007, FEMSA Cerveza invested Ps. 778 million in its distribution network. Approximately Ps. 213 million of this amount was invested in the replacement of trucks in its distribution fleet, Ps. 353 million in land, buildings and improvements to leased properties dedicated to various distribution functions, and the remaining Ps. 212 million in other distribution-related investments.
Market-related Investments
During 2007, FEMSA Cerveza invested Ps. 3,198 million in market-related activities and brand support in the domestic market. Approximately 53% of these investments were directed to customer agreements with retailers and commercial support to owned and third party distributors. Investments in retail agreements that exceed a one-year term are capitalized and amortized over the life of the agreement. In general, FEMSA Cerveza’s retail agreements are for a period of four to five years. Other market-related investments include the purchase of refrigeration equipment, coolers, plastic furniture and other promotional items. These items are placed with retailers as a mean of facilitating the retailers’ ability to service consumers and to promote the image and profile of FEMSA Cerveza’s brands.
Information Technology Investments
In addition, during 2007, FEMSA Cerveza invested Ps. 109 million in system software projects.
FEMSA Comercio’s principal investment activity is the construction and opening of new stores. During 2007,2010, FEMSA Comercio opened 7161,092 net new OXXO stores. FEMSA Comercio invested Ps. 2,1123,325 million in 20072010 in the addition of new stores, warehouses and improvements to leased properties.
Competition Legislation
TheLey Federal de Competencia Económica (the Federal(Federal Economic Competition Law or the Mexican Competition Law) became effective on June 22, 1993. The Mexican Competition Law and theReglamento de la Ley Federal de Competencia Económica (the Regulations(Regulations under the Mexican Competition Law), effective as of March 9, 1998,October 13, 2007, regulate monopolies and monopolistic practices and require Mexican government approval of certain mergers and acquisitions. The Mexican Competition Law subjects the activities of certain Mexican companies, including us, to regulatory scrutiny. In addition, the Regulations under the Mexican Competition Law prohibit members of any trade association from reaching any agreement relating to the price of their products.
Management believes that we are currently in compliance in all material respects with Mexican competition legislation.
In Mexico and in some of the other countries in which we operate, we are involved in different ongoing competition related proceedings. We believe that the outcome of these proceedings will not have a material adverse effect on our financial position or results offrom operations. See “Item 8. Financial Information—Legal Proceedings—Coca-Cola FEMSA—Antitrust Matters”Matters.”
Taxation of Sparkling Beverages
All the countries in which Coca-Cola FEMSA operates, except for Panama, impose a value-added tax on the sale of sparkling beverages, with a rate of 16% in Mexico beginning in January 2010, 12% in Guatemala, 15% in Nicaragua, 13% in Costa Rica, 16% in Colombia (applied only to the first sale in supply chain), 12% in Venezuela (beginning in April 2009), 17% (Mato Grosso do Sul) and “Item 8. Financial Information—Legal Proceedings—18% (São Paulo and Minas Gerais) in Brazil, and 21% in Argentina. In addition, several of the countries in which Coca-Cola FEMSA Cerveza—Antitrust Matters.”
Guatemala imposes an excise tax of 0.18 cents in local currency (approximately Ps. 0.2775 as of December 31, 2010) per liter of sparkling beverage.
Costa Rica imposes a specific tax on non-alcoholic bottled beverages based on the combination of packaging and flavor, currently assessed at 15.50 colones (approximately Ps. 0.3705 as of December 31, 2010) per 250 ml, and an excise tax on local brands of 5%, foreign brands of 10% and mixers of 14%.
Nicaragua imposes a 9% tax on consumption, and municipalities impose a 1% tax on Coca-Cola FEMSA’s Nicaraguan gross income.
Panama imposes a 5% tax based on the cost of goods produced. Panama also imposes a 10% selective consumption tax on syrups, powders and concentrate.
Brazil imposes an average production tax of approximately 4.4% and an average sales tax of approximately 7.9%, both assessed by the federal government. Most of these taxes are fixed, based on average retail prices in each state where the company operates (VAT) or fixed by the federal government (excise and sales tax).
Argentina imposes an excise tax on sparkling beverages containing less than 5% lemon juice or less than 10% fruit juice of 8.7%, and an excise tax on flavored sparkling beverages with 10% or more fruit juice and on sparkling water of 4.2%, although this excise tax is not applicable to certain of Coca-Cola FEMSA’s products.
Environmental Matters
In all of the countries where we operate, our businessesterritories, our operations are subject to federal and state laws and regulations applicable in the respective jurisdiction relating to the protection of the environment.
Mexico
In Mexico, the principal legislation is theLey General del Equilibrio Ecológico y la Protección al Ambiente (the Federal(Federal General Law for Ecological Equilibrium and Environmental Protection)Protection or the Mexican Environmental LawLaw) and theLey General para la Prevención y Gestión Integral de los Residuos(the General Law for the Prevention and Integral Management of Waste), which are enforced by theSecretaría de Medio Ambiente y Recursos Naturales(the Ministry of the Environment and Natural Resources)Resources or SEMARNAT.SEMARNAT). SEMARNAT can bring administrative and criminal proceedings against companies that violate environmental laws, and it also has the power to temporarily close non-complying facilities. Under the Mexican Environmental Law, rules have been
promulgated concerning water, air and noise pollution and hazardous substances. In particular, Mexican environmental laws and regulations require that we file periodic reports with respect to air and water emissions and hazardous wastes and set forth standards for waste water discharge that apply to our operations. We are also subject to certain minimal restrictions on the operation of delivery trucks in Mexico City. We have implemented several programs designed to facilitate compliance with air, waste, noise and energy standards established by current Mexican federal and state environmental laws, including a program that installs catalytic converters and liquid petroleum gas in delivery trucks for our operations in Mexico City. See “—Coca-Cola FEMSA—Product Sales and Distribution.”
In addition, we are subject to theLey Federal de DerechosAguas Nacionales (the Federal Law of Governmental Fees)National Water Law), also enforced by SEMARNAT.the Mexican National Water Commission. Adopted in January 1993,December 1992, the law provides that plants located in Mexico City that use deep water wells to supply their water requirements must pay a fee to the city for the discharge of residual waste water to drainage. In 1995,Pursuant to this law, certain municipallocal authorities began to test the quality of the waste water discharge and charge plants an additional fee for measurements that exceed certain standards published by SEMARNAT.the Mexican National Water Commission. All of ourCoca-Cola FEMSA’s bottler plants located in Mexico City, as well as the Toluca plant,have met these new standards as of 2001.standards. In addition, Coca-Cola FEMSA’s plants in Apizaco and San Cristóbal are certified with ISO 14001.
Coca-Cola FEMSA’s Mexican operations Coca-Cola FEMSA builtestablished a PET recycling plant in 2004 in partnership with The Coca-Cola Company and ALPLA, which manufacturesa supplier of plastic bottles forto Coca-Cola FEMSA in Mexico. This plant,Mexico, to createIndustria Mexicana de Reciclaje (IMER), a PET recycling facility located in Toluca, Mexico,Mexico. This facility started operations in 2005 and has a recycling capacity of approximately 25,000 metric tons per year from which 15,000 metric tons can be usedre-used in PET bottles for food packaging purposes. Coca-Cola FEMSA has also continued contributing funds to a nationwide recycling company, ECOCE or Ecología y Compromiso Empresarial (Environmentally(Environmentally Committed Companies). In addition, Coca-Cola FEMSA’s plants located in Toluca, Reyes, Cuautitlán, Apizaco, San Cristobal, Morelia, Ixtacomitan and Coatepec have received aCertificado de Industria Limpia (Certificate of Clean Industry).
As part of our environmental and sustainability strategies, several of our subsidiaries have entered into 20-year wind power supply agreements with EAI, and EEM to receive electrical energy for use at production and distribution facilities of FEMSA and Coca-Cola FEMSA throughout Mexico, as well as for a significant number of OXXO convenience stores. The wind farms will be located in the state of Oaxaca and are expected to have a capacity of 396 megawatts. We anticipate that the wind farms will begin operations in 2013.
Also, as part of Coca-Cola FEMSA’s environmental and sustainability strategies, in December 2009, some of its affiliates, jointly with strategic partners, entered into a wind energy supply agreement with a subsidiary of Iberdrola to supply energy to a plant in Toluca, Mexico, owned by Coca-Cola FEMSA’s subsidiary, Propimex, S.A. de C.V. and to supply green energy to Coca-Cola FEMSA’s suppliers of PET bottles. The 26.7 megawatt wind farm is located in La Ventosa, Oaxaca and is expected to generate approximately 100 thousand megawatt hours annually. The energy supply services began in April 2010.
Central America
Coca-Cola FEMSA’s Central American operations are subject to several federal and state laws and regulations relating to the protection of the environment, which have been enacted in the last ten years, as awareness has increased in this region about the protection of the environment and the disposal of dangeroushazardous and toxic materials as well as water usage. In some countries in Central America, Coca-Cola FEMSA is in the process of bringing its operations into compliance with new environmental laws. Also,laws on the timeline established by the relevant regulatory authorities. Coca-Cola FEMSA’s Costa Rica and Panama operations have participated in a joint effort along with the local division of The Coca-Cola Company calledMisión Planeta (Mission Planet) for the collection and recycling of non-returnable plastic bottles.
Colombia
Coca-Cola FEMSA’s Colombian operations are subject to several Colombian federal, state and municipal laws and regulations related to the protection of the environment and the disposal of treated water and toxic and dangeroushazardous materials. These laws include the control of atmospheric emissions, noise emissions, disposal of treated water and strict limitations on the use of chlorofluorocarbons. Coca-Cola FEMSA’s plants in Colombia have obtained theCertificación Ambiental Fase IV (Phase IV Environmental Certificate) demonstrating its compliance at
the highest level with relevant Colombian regulations. Coca-Cola FEMSA is also engaged in nationwide campaigns for the collection and recycling of glass and plastic bottles.bottles as well as reforestation programs.
Venezuela
Coca-Cola FEMSA’s Venezuelan operations are subject to several Venezuelan federal, state and municipal laws and regulations related to the protection of the environment. The most relevant of these laws are theLey Orgánica del Ambiente (the Organic(Organic Environmental Law), theLey Sobre Sustancias, Materiales y Desechos Peligrosos(the Substance, Material and Dangerous Waste Law) and, theLey Penal del Ambiente (the Criminal Environment(Criminal Environmental Law) and theLey de Aguas(Water Law). Since the enactment of the Organic Environmental Law in 1995, Coca-Cola FEMSA’s Venezuelan subsidiary has presented the proper authorities with plans to bring their production facilities and distribution centers into compliance with applicable laws, which mainly consist of building or expanding the law. While the laws provide certain grace periods for compliance with the new environmental standards,capacity of water treatment plants in Coca-Cola FEMSA’s bottling facilities. Even though Coca-Cola FEMSA has had to adjust some of the originally proposed timelines presenteddue to the authorities because ofconstruction delays, in 2009, Coca-Cola FEMSA completed the completionconstruction and received all the required permits to operate a new water treatment plant in its bottling facility located in the city of someBarcelona. At the end of 2009, Coca-Cola FEMSA also agreed with the relevant authorities to construct a water treatment plant in its Valencia plant within the next 18 months, and construction has begun. Coca-Cola FEMSA is also in the process of obtaining the necessary authorization and licenses before it can begin the construction of two additional water treatment plants in Antimano and Maracaibo. Coca-Cola FEMSA expects that by the end of 2011, these projects.three plants will be in operation. Coca-Cola FEMSA is also in process of obtaining the ISO 14000 certification for all of its plants in Venezuela.
In addition, in December 2010, the Venezuelan government approved theLey Integral de Gestión de la Basura (Comprehensive Waste Management Law), which will regulate solid waste management and which may be applicable to manufacturers of products for mass consumption. The full scope of this law has not yet been established.
Brazil
FEMSA Cerveza’s and Coca-Cola FEMSA’s Brazilian operations are subject to several federal, state and municipal laws and regulations related to the protection of the environment. Among the most relevant laws and regulations are those dealing with the emission of toxic and dangeroushazardous gases, and disposal of wastewater and solid waste, which impose penalties, such as fines, facility closures or criminal charges depending upon the level of non-compliance.
Coca-Cola FEMSA’s production plant located in Jundiaí has been recognized by the Brazilian authorities for its compliance with environmental regulations and for having standards well above those imposed by the law. The plant has been certified for the (i) ISO 9001 since March 1995; (ii) and the ISO 14001 since March 1997; (iii) norm OHSAS 18001 since 2005; and iv) ISO 22000 since 2007. Coca-Cola FEMSA’s Brazilian operations are also ISO 9001, ISO 14001 and OHSAS 18001 certified.
In Brazil it is necessary to obtain concessions from the government to cast drainage. All of Coca-Cola FEMSA’s plants in Brazil have been granted this concession, except Mogi das Cruzes, but Coca-Cola FEMSA is inwhere it has timely begun the process of obtaining one. In December, 2010, Coca-Cola FEMSA increased the capacity of the water treatment plant in its Jundiaí facility.
In Brazil, a municipal regulation of the City of São Paulo, implemented pursuant to Law 13.316/2002, came into effect in May 2008. This regulation requires Coca-Cola FEMSA to collect for recycling a specified annual percentage of plastic bottles made from PET sold in the City of São Paulo; such percentage increases each year. As of May 2009, it was required to collect for recycling 50% of the PET bottles sold in the City of São Paulo and by May 2010, it was required to collect 75%, and as of May 2011, it was required to collect 90%. Currently, Coca-Cola FEMSA is not able to collect the entire volume required of the PET bottles it sold in City of São Paulo for recycling. If Coca-Cola FEMSA does not meet the requirements of this regulation, which we believe to be more onerous than those imposed by the countries with the highest recycling standards, it could be fined and be subject to other sanctions, such as the suspension of operations in any of its plants and/or distribution centers located in the City of São Paulo. In May 2008, Coca-Cola FEMSA, together with other bottlers in São Paulo, through theAssociação Brasileira das Indústrias de Refrigerantes e de Bebidas Não-alcoólicas (Brazilian Soft Drink and Non-Alcoholic Beverage Association, or ABIR),
filed a motion requesting a court to overturn this regulation on the basis of impossibility of compliance. In October 2010 the municipal authority of São Paolo levied a fine on Coca-Cola FEMSA’s Brazilian operating subsidiary of 250,000 Brazilian reais (approximately Ps. 1,750,000 as of December 31, 2010) on the grounds that the report submitted by Coca-Cola FEMSA’s Brazilian operating subsidiary did not comply with the 75% proper disposal requirement for the period from may 2008 to May 2010. Coca-Cola FEMSA filed an appeal against this fine. In addition, in November 2009, in response to a requirement of the municipal authority request for Coca-Cola FEMSA to demonstrate the destination of the PET bottles sold in São Paulo, it filed a motion showing all of its recycling programs and requesting a more practical timeline to comply with the requirements of the law. Coca-Cola FEMSA is currently awaiting resolution of both matters.
In August 2010, Law No. 12.305/2010 established the Brazilian National Solid Waste Policy. This policy is based on the principle of shared responsibility between the government, companies and the public, and provides for the post-consumption return of products to companies and requires public authorities to implement waste management programs. This law is regulated by Federal Decree No. 7.404/2010, and was published in December 2010. Coca-Cola FEMSA is currently discussing with the relevant authorities the impact this law may have on Brazilian companies in complying with the regulation in effect in the City of São Paulo.
Argentina
Coca-Cola FEMSA’s Argentine operations are subject to federal and provincialmunicipal laws and regulations relating to the protection of the environment. The most significant of these are regulations concerning waste water discharge, which are enforced by theSecretaría de Ambiente y Desarrollo Sustentable(the Ministry of Natural Resources and Sustainable Development) and theOrganismo Provincial para el Desarrollo Sostenible(the Provincial Organization for Sustainable Development) for the province of Buenos Aires. Coca-Cola FEMSA’s Alcorta plant is in compliance with environmental standards.standards and has been certified for ISO 14001:2004 for the plants and operative units in Buenos Aires.
For all of Coca-Cola FEMSA’s plant operations, Coca-Cola FEMSA employs two environmental management systems: (i) Sistema Integral de Calidad (Integral Quality System or SICKOF) and (ii) Sistema de Administración Ambiental (Environmental Administration System or EKOSYSTEM). We havedo not believe that Coca-Cola FEMSA’s business activities pose a material risk to the environment, and we believe that Coca-Cola FEMSA is in material compliance with all applicable laws and regulations.
Coca-Cola FEMSA has expended, and may be required to expend in the future, funds for compliance with and remediation under local environmental laws and regulations. Currently, we do not believe that such costs will have a material adverse effect on ourCoca-Cola FEMSA’s results offrom operations, or financial condition. However, since environmental laws and regulations and their enforcement are becoming increasingly more stringent in ourCoca-Cola FEMSA’s territories, and there is increased awarenessrecognition by local authorities of the need for higher environmental standards in the countries where we operate,it operates, changes in current regulations may result in an increase in costs, which may have an adverse effect on ourCoca-Cola FEMSA’s future results offrom operations or financial condition. ManagementCoca-Cola FEMSA’s management is not aware of any significant pending regulatory changes that would require a significant amount of additional remedial capital expenditures.
Other regulations
In December 2009, the Venezuelan government issued a decree requiring a reduction in energy consumption by at least 20% for industrial companies whose consumption is greater than two megawatts per hour and to submit an energy-usage reduction plan. Some of Coca-Cola FEMSA’s bottling operations in Venezuela outside of Caracas met this threshold and it submitted a plan, which included the purchase of generators for its plants. In January 2010, the Venezuelan government subsequently implemented power cuts and other measures for all industries in Caracas whose consumption was above 35 kilowatts per hour.
In January 2010, the Venezuelan government amended theLey para la Defensa y Acceso a las Personas a los Bienes y Servicios(Access to Goods and Services Defense Law). Any violation by a company that produces, distributes and sells goods and services could lead to, among other consequences, fines, penalties or the confiscation of the assets used to produce, distribute and sell these goods without compensation. Although we believe Coca-Cola FEMSA is in compliance with this law, consumer protection laws in Venezuela are subject to continuing review and changes.
Water Supply Law
FEMSA Cerveza and Coca-Cola FEMSA purchasepurchases water in Mexico directly from municipal water companies and pumppumps water from their own wells and rivers pursuant to concessions obtained from the Mexican government on a plant-by-plant basis. Water use in Mexico is regulated primarily by theLey de Aguas Nacionales de 1992 (the 1992(1992 Water Law), and regulations issued thereunder, which created theComisión Nacional del Agua(the National Water Commission). The National Water Commission is charged with overseeing the national system of water use. Under the 1992 Water Law, concessions for the use of a specific volume of ground or surface water generally run for five, ten, fifteen and up to thirty-yearor fifteen-year terms, depending on the supply of groundwater in each region as projected by the National Water Commission. Concessionaires may request concession terms to be extended upon termination. These extensions are given for the same period of time given in the original concession. The Mexican government is authorized to reduce the volume of ground or surface water granted for use by a concession by whatever volume of water is not used by the concessionaire for threetwo consecutive years. However, because the current concessions for each of FEMSA Cerveza and Coca-Cola FEMSA’s plants
in Mexico do not match each plant’s projected needs for water in future years, we successfully negotiated with the Mexican government the right to transfer the unused volume under concessions from certain plants to other plants anticipating greater water usage in the future. These concessions may be terminated if, among other things, we use more water than permitted or we fail to pay required concession-related fees and do not cure such situations in a timely manner. We believe that we are in compliance with the terms of our existing concessions.
Although we have not undertaken independent studies to confirm the sufficiency of the existing or future groundwater supply, we believe that our existing concessions satisfy our current water requirements in Mexico. We can give no assurances,
In Argentina, a state water company provides water to Coca-Cola FEMSA’s Alcorta plant on a limited basis; however, that groundwater will be availablewe believe the authorized amount meets Coca-Cola FEMSA’s requirements for this plant. Water is pumped from Coca-Cola FEMSA’s own wells in sufficient quantitiesits Monte Grande plant in Argentina, without the need for any specific permit or license, regulated by the Law 25.688.
In Brazil, we buy water directly from municipal utility companies and pump water from our own wells or rivers (Mogi das Cruzes plant) pursuant to meet our future production needs or that we will be able to maintain our current concessions.
concessions granted by the Brazilian government for each plant. According to the Brazilian Constitution, water is considered an asset of the governmentcommon use and may only be exploited infor the national interest, by Brazilians or companies constitutedincorporated under Brazilian law. ConcessionairesDealers and users have the responsibility for any damage to the environment. The exploitation and utilizationuse of water is regulated by theCódigo de Mineração (Decree (Code of Mining, Decree Law nº. 227/67), by theCódigo de Águas Minerais (Decree (Mineral Water Code, Decree Law nº. 7841/45), the National Water Resources Policy (Law nº. 9433/97) and also by regulations issued thereunder. The companies whichCompanies that exploit water are supervised by theDepartamento Nacional de Produção Mineira—DNPM (National Department of Mineral - DNPMProduction) and the National Water Agency in connection with sanitary, federal health agencies, as well as state and municipal authorities (Ministério da Saúdeauthorities. In Coca-Cola FEMSA’s Jundaí and Secretarias da Saúde). We believeBelo Horizonte plants, we are currently in compliance with these regulations at bothdo not exploit mineral water. In the Mogi das Cruzes and Jacareí.Campo Grande plants, we have all the necessary permits related to the exploitation of mineral water.
We do not currently requireIn Colombia, in addition to natural spring water, Coca-Cola FEMSA acquires water directly from its own wells and from utility companies. Coca-Cola FEMSA is required to have a permitspecific concession to obtainexploit water from natural sources. Water use in our other territories. Colombia is regulated by law no. 9 of 1979 and decrees no. 1594 of 1984 and no. 2811 of 1974. The National Institute of National Resources supervises companies that exploit water.
In Nicaragua, the use of water is regulated by theLey General de Aguas Nacionales (National Water Law). In Costa Rica, the use of water is regulated by theLey de Aguas (Water Law). In both of these countries, Coca-Cola FEMSA owns and some plants in Colombia and Venezuela, weexploits their own private water wells. However, in Colombia, we require a specificwells granted to them through governmental concessions. In Guatemala, no license filed before the environmental authorities. In the remainder of our territories, we obtainor permits are required to exploit water from governmental agencies or municipalities. the private wells in Coca-Cola FEMSA’s plants. In Panama, Coca-Cola FEMSA acquires water from a state water company, and the use of water is regulated by theReglamento de Uso de Aguas de Panamá(Panama Use of Water Regulation). In Venezuela, Coca-Cola FEMSA uses private wells in addition to water provided by the municipalities, and it has taken the appropriate actions, including actions to comply with water regulations, to have water supply available from these sources, regulated by theLey de Aguas (Water Law).
We can give no assurancescannot assure you that water will be available in sufficient quantities to meet our future production needs, that we will be able to maintain our current concessions or that additional regulations relating to water use will not be adopted in the future.future in our territories. We believe that we are in material compliance with the terms of our existing water concessions and that we are in compliance with all relevant water regulations.
ITEM 4A. UNRESOLVED STAFF COMMENTS
| ITEM 4A. | UNRESOLVED STAFF COMMENTS |
None
| ITEM 5. | OPERATING AND FINANCIAL REVIEW AND PROSPECTS |
The following discussion should be read in conjunction with, and is entirely qualified by reference to, our audited consolidated financial statements and the notes to those financial statements. Our audited consolidated financial statements were prepared in accordance with Mexican Financial Reporting Standards,FRS, which differ in certain significant respects from U.S. GAAP. Notes 2627 and 2728 to our audited consolidated financial statements provide a description of the principal differences between Mexican Financial Reporting StandardsFRS and U.S. GAAP as they relate to us, as well as U.S. GAAP consolidated balance sheets, statements of income and comprehensive income, changes in stockholders’ equity and cash flows for the same periods presented for Mexican Financial Reporting StandardsFRS purposes and afor the consolidated statement of changes in stockholders’ equity for the years ended December 31, 2009 and 2010, and reconciliation to U.S. GAAP of net income, comprehensive income and stockholders’ equity. See “—U.S. GAAP Reconciliation.”
Overview of Events, Trends and Uncertainties
Management currently considers the following events, trends and uncertainties to be important to understanding its results offrom operations and financial position during the periods discussed in this section:
| • | While Coca-Cola FEMSA’s |
At FEMSA Cerveza, total beer sales volumes have increased in Mexico, Brazil and in the export market. The high price of raw materials, particularly aluminum and barley, represent an uncertainty in our cost structure. Heineken USA has been distributing FEMSA Cerveza’s beer brands in the United States since January 1, 2005 with very encouraging results, and we have signed a new agreement that extends this commercial relationship until December 2017.
FEMSA Comercio continues to increase the numberaccelerated its rate of OXXO storesstore openings and continues to grow in terms of total revenues and as a percentage of our consolidated total revenues. FEMSA Comercio has lower operating margins than our beverage businesses.business. Given that FEMSA Comercio has lower operating margins and fixed costs, it is more sensitive to changes in sales which could negatively affect operating margins. We expect to continue to expand the OXXO chain during 2008.2011.
Our results offrom operations and financial position are affected by the economic and market conditions in the countries where our subsidiaries conduct their operations, particularly in Mexico. Changes in these conditions are influenced by a number of factors, including those discussed in “Item 3. Key Information—Risk Factors.”
On September 23, 2010, FEMSA Sharesold Promotora to The Coca-Cola Company. Promotora was the owner of theMundetbrands of soft drinks in Mexico, which comprised 100-plus year old brands acquired by FEMSA in 2001 for which a payment of Ps. 1,002 million was received.
In September 2010, FEMSA signed definitive agreements with GPC III, B.V., to sell its flexible packaging and Unit Structure Extendedlabel operations, Grafo Regia, S.A. de C.V. This transaction was part of FEMSA’s strategy to divest non-core assets. The transaction was closed on December 31, 2010 for which a payment of Ps. 1,021 million was received.
During the third quarter of 2010, Coca-Cola FEMSA completed a transaction with a Brazilian subsidiary of The Coca-Cola Company to produce, sell and distributeMatte Leão branded products. This transaction will
reinforce Coca-Cola FEMSA’s non-carbonated product offering through the platform that is operated by The Coca-Cola Company and its bottling partners in Brazil. As a part of the agreement, Coca-Cola FEMSA has been selling and distributing certainMatte Leão branded ready-to-drink products since the first quarter of 2010.
On April 22, 2008,March 17, 2011, a consortium of investors formed by FEMSA, shareholders approvedthe Macquarie Mexican Infrastructure Fund and other investors, acquired EAI and EEM from subsidiaries of Preneal. FEMSA holds a proposal45% interest in the consortium. EAI and EEM are the owners of a 396 megawatt late-stage wind energy project in the south-eastern region of the State of Oaxaca. Certain subsidiaries of FEMSA, FEMSA Comercio and Coca-Cola FEMSA have entered into 20-year wind power supply agreements with EAI and EEM to amend our bylawspurchase energy output produced by such companies. The project is currently in order to preserveits long-term financing stage.
On March 28, 2011, Coca-Cola FEMSA, together with The Coca-Cola Company, acquired Grupo Estrella Azul, a Panamanian company engaged for more than 50 years in the unit structure for our shares that has been in place since May 1998,dairy and to maintain our existing share structure beyond May 11, 2008. Our bylaws previously provided that on May 11, 2008 our Series D-B Shares would convert into Series B Shares,juice-based beverage categories. The Company acquired a 50% interest and our Series D-L Shares would convert into Series L Shares with limited voting rights. In addition, our bylaws provided that our current unit structure would cease to exist and each of our B Units would be unbundled into five Series B Shares, while each BD Unit would unbundle into three Series B Shares and two newly issued Series L Shares. Following the April 22, 2008 shareholder approvals, the automatic conversion of our share and unit structures will no longer exist, and, absent shareholder action, our share structure will continue to be compriseddevelop this business jointly with The Coca-Cola Company. Beginning in April 2011, both The Coca-Cola Company and Coca-Cola FEMSA commenced the gradual integration of Series B Shares, which must represent up to 51%Grupo Estrella Azul into the existing beverage platform they share for the development of our outstanding capital stock, and Series D-B and Series D-L Shares, which together may represent up to 49% of our outstanding capital stock. Our Unit structure, absent shareholder action, will continue to consist of B Units, which bundle five Series B Shares, and BD Units, which bundle one Series B Share, two Series D-B Shares and two Series D-L Shares. See “The Offer and Listing – Description of Securities.”
Brazilian Beverage Industry Tax
On June 24, 2008, the president of Brazil approved Provisional Measure No. 413/08 which changes the tax collection applicable to the Brazilian beverage industry. This Provisional Measure was turned back to the Brazilian tax authority for its review. Neither the implementation scheme nor the period from which the new taxes will apply, has been published. We are still assessing the materiality of these taxes.non-carbonated products in Panama.
Changes in Mexican Financial Reporting Standards Affecting
The Mexican National Banking and Securities Commission announced the Statementadoption of Income
Pursuant to MexicanInternational Financial Reporting Standard B-3 (NIF B-3), beginningStandards for public companies
TheComisión Nacional Bancaria y de Valores (Mexican National Banking and Securities Commission, or CNBV) has announced that commencing in 2012, all Mexican public companies must report their financial information in accordance with International Financial Reporting Standards, which we refer to as IFRS. Since 2006, theConsejo Mexicano para la Investigación y Desarrollo de Normas de Información Financiera (Mexican Board of Research and Development of Financial Reporting Standards) has been modifying Mexican FRS in order to ensure their convergence with IFRS. We are in the adoption process and we expect to report our financial information according to IFRS starting on January 1, 2007, generic standards were established for the presentation and structuring of the statement of income, whereby minimum content requirements and general disclosure standards were developed. In addition, under Mexican Reporting Standard Interpretation No. 4, or INIF 4, statutory employee profit sharing (PTU) is now required to be presented within “other expenses”2012 on the income statement. We previously presented employee profit sharing within taxes. For comparability purposes, our historical information has been reclassified and presented according to the new standards.a comparable basis.
Effects of Changes in Economic Conditions
Our results offrom operations are affected by changes in economic conditions in Mexico and in the other countries in which we operate. For the years ended December 31, 2007, 20062010, 2009 and 2005, 72.0%2008, 62%, 73.0%59% and 76.0%64%, respectively, of our total sales were attributable to Mexico. After the acquisitions of Panamco and Kaiser,As a result, we have greater exposure to the economic conditions of certain countries, in which we have not historically conducted operations, particularly countriesthose in Central America, Colombia, Venezuela and Brazil, although we continue to generate a substantial portion of our total sales from Mexico. The participation of these other countries as a percentage of our total sales has not changed significantly during the last five years and is expected to continue to maintain 2010 percentages in future periods.
The Mexican economy is gradually recovering from a downturn as a result of the impact of the global financial crisis on many emerging economies in 2009. In the third quarter of 2010, Mexican GDP expanded by approximately 5.1% compared to the same period in 2009 and experienced an expansion of 5.4% for the full year of 2010, according to INEGI. According to the Banco Nacional de México survey regarding the economic expectations of specialists, Mexican GDP is expected to increase by 4.4% in future periods.2011, as of the last estimate published in March 2011. The Mexican economy continues to be heavily influenced by the U.S. economy, and therefore, further deterioration in economic conditions in, or delays in the recovery of, the U.S. economy may hinder any recovery in Mexico.
Our future results may be significantly affected by the general economic and financial positionsconditions in the countries where we operate, including by levels of economic growth, by the devaluation of the local currency, by inflation and high interest rates or by political developments, and may result in lower demand for our products, lower real pricing or a shift to lower margin products. Because a large percentage of our costs are fixed costs, we may not be able to reduce such costs and expenses, and our profit margins may suffer as a result of downturns in the economy of each country. In addition, an increase
The decrease in interest rates in Mexico would increasein 2010 decreases our cost of Mexican peso-denominated variable interest rate indebtedness and wouldcould have an adversea favorable effect on our financial position and results from operations during 2011. During 2010, our weighted average interest rate decreased by 140 basis points.
Beginning in the fourth quarter of operations. A depreciation2009 and through 2010, the value of the Mexican peso relative to the U.S. dollar would increasefluctuated from a low of Ps. 12.16 per U.S. dollar, to a high of Ps. 13.67 per U.S. dollar. At December 31, 2010, the exchange rate (noon buying rate) was Ps. 12.3825 to US$ 1.00. On May 31, 2011, the exchange rate was 11.579. See “Item 3. Key Information—Exchange Rate Information.” A depreciation of the Mexican peso or local currencies in the countries in which we operate relative to the U.S. dollar increases our cost of those raw materials the price of which is paidpriced in or determinedU.S. dollars, including raw materials whose prices are set with reference to the U.S. dollar. In addition, a depreciation of the Mexican peso or local currencies in the countries in which we operate relative to the U.S. dollar andwill increase our U.S.-denominated debt obligations, denominated in U.S. dollars, and thereby maywhich could negatively affect our financial position and results offrom operations.
Companies with structural characteristics that result in margin expansion in excess of sales growth are referred to as having high “operating leverage.”
The operating subsidiaries of Coca-Cola FEMSA and FEMSA Cerveza are engaged, to varying degrees, in capital-intensive activities. The high utilization of the installed capacity of the production facilities results in better fixed cost absorption, as increased
output results in higher revenues without additional fixed costs. Absent significant increases in variable costs, gross profit margins will expand when production facilities are operated at higher utilization rates. Alternatively, higher fixed costs will result in lower gross profit margins in periods of lower output.
In addition, the commercial operations of Coca-Cola FEMSA and FEMSA Cerveza are carried out through extensive distribution networks, the principal fixed assets of which are warehouses and trucks. The distribution systems of both Coca-Cola FEMSAtrucks and FEMSA Cerveza are designed to handle large volumes of beverages. Fixed costs represent an important proportion of the total distribution expense of both Coca-Cola FEMSA and FEMSA Cerveza.FEMSA. Generally, the higher the volume that passes through the distribution system, the lower the fixed distribution cost as a percentage of the corresponding revenues. As a result, operating margins improve when the distribution capacity is operated at higher utilization rates. Alternatively, periods of decreased utilization because of lower volumes will negatively affect our operating margins.
FEMSA Comercio operations result in a low margin business with relatively fixed costs. These two characteristics make FEMSA Comercio a business with an operating margin that might be affected more easily by a change in sales levels.
The preparation of our audited consolidated financial statements requires that we make estimates and assumptions that affect (1) the reported amounts of our assets and liabilities, (2) the disclosure of our contingent liabilities at the date of the financial statements and (3) the reported amounts of revenues and expenses during the reporting period. We base our estimates and judgments on our historical experience and on various other reasonable factors that together form the basis for making judgments about the carrying values of our assets and liabilities. Our actual results may differ from these estimates under different assumptions or conditions. We evaluate our estimates and judgments on an on-going basis. Our significant accounting policies are described in note 4Note 5 to our audited consolidated financial statements. We believe our most critical accounting policies that imply the application of estimates and/or judgments are the following:
Allowance for doubtful accounts
We determine our allowance for doubtful accounts based on an evaluation of the aging of our receivable portfolio. The amount of the allowance considers our historical loss rate on receivables and the economic environment in which we operate. Our beer operations represent the most important part of the consolidated allowance for doubtful accounts as a result of the credit that FEMSA Cerveza extends to retailers, on terms and conditions in accordance with industry practices. Coca-Cola FEMSA and FEMSA Comercio sales are generally realized in cash.
Bottles and cases; allowance for bottle breakage
ReturnableWe recorded returnable bottles and cases are recorded at acquisition cost and restated to their replacement cost.them applying inflation factors only when they form part of our operations in countries with an inflationary economic environment. For FEMSA Cerveza and Coca-Cola FEMSA, breakage is expensed as it is incurred. We compare quarterly the carrying value of bottle breakage expense with the calculated depreciation expense of our returnable bottles and cases in plant and distribution centers, estimating a useful life of five years for glass beer bottles, four years for returnable glass soft drink bottles and plastic cases and 18 months for returnable plastic soft drink bottles. These useful lives are determined in accordance with our business experience. The annual calculated depreciation expense has been similar to the annual carrying value of bottle breakage expense. Whenever we decide to discontinue a particular returnable presentation and retire it from the market, we write off the discontinued presentation through an increase in breakage expense. We determine depreciation of bottles and cases only for tax purposes.
Property, plant and equipment
Property, plant and equipment are depreciated over their estimated useful lives. The estimated useful lives represent the period we expect the assets to remain in service and to generate revenues. We base our estimates on the experience of our technical personnel. Depreciation is computed using the straight line method of accounting.
Imported equipment is recorded using the exchange rate as of the acquisition date and, if part of an inflationary economic environment, is restated applying the inflation rate of the reporting entity.
We describetest at fair value long-lived assets for impairment and determine whether impairment exists, by comparing the methodology used to restate imported equipment in note 4(g) to our audited consolidated financial statements, which includes applying the exchange and inflation rates of the country of origin utilized as permitted by Mexican Financial Reporting Standards. We believe this method more accurately presents the fairbook value of the assets than restated cost determined by applying inflation factors.
We valued atwith their fair value, all fixed assets acquired,which is calculated considering their operating conditions and the future cash flows expected to be generated based on their estimated remaining useful life as determined by management.
Through 2005, all of our subsidiaries depreciated refrigeration equipment over a five-year estimated useful life. In 2006, we implemented a program to review the estimated useful lives of its refrigeration equipment. As of December 31, 2007, our subsidiaries in Mexico, Argentina, Brazil, Colombia, Costa Rica and Guatemala changed their accounting estimate from five to seven years, considering the maintenance and replacement plans of the equipment. The impact of the change in estimate for the years ended December 31, 2007 and 2006, which was accounted for prospectively, was a reduction in depreciation expense of Ps. 115 million and Ps. 132 million, respectively. The useful life of refrigeration equipment in Venezuela, Panama and Nicaragua remains at five years.
Valuation of intangible assets and goodwill
We identify all intangible assets to reduce as much as possible the goodwill associated with business acquisitions. We separate intangible assets between those with a finite useful life and those with an indefinite useful life, in accordance with the period over which we expect to receive the benefits.
We determine the fair value of assets acquired and liabilities assumed as of the date of acquisition, and we assigned the excess purchase price over the fair value of the net assets. In certain circumstances this resulted in the recognition of an intangible asset. The intangible assets of indefinite life are subject to annual impairment tests. WeAs of December 31, 2010, we have recorded intangible assets with indefinite lives, which consist of:
| • | Coca-Cola FEMSA’s rights to produce and distributeCoca-Cola trademark products for |
Trademarks and distribution rights for Ps.11,299 million as a result of the acquisition of the 30% interest of FEMSA Cerveza and distribution rights acquired from a third-party distributor;
Trademarks and goodwill as a result of the acquisition of Kaiser for Ps.4,802 million; and
Other intangible assets with indefinite lives that amounted to Ps.784Ps. 462 million.
For Mexican Financial Reporting Standards purposes, goodwill is the difference between the price paid and the fair value of the shares and/or net assets acquired that was not assigned directly to an intangible asset. Goodwill is recorded in the functional currency of the subsidiary in which the investment was made and is restated by applying the inflation rate factors of the country of origin and the year-end exchange rate. Until December 31, 2004 under Mexican Financial Reporting Standards, goodwill was amortized using the straight-line method over a period of no more than 20 years. The amount of goodwill amortization in 2004 was Ps. 16 million.In 2005, Bulletin B-7, “Adquisiciones de Negocios” (Business Acquisitions), was issued, which establishes that goodwill is no longer subject to amortization, being subject instead to an annual impairment test.
Impairment of goodwill and long-livedintangible assets with indefinite lives
We review annually review the carrying value of our goodwill and long-livedintangible assets and whenever circumstances indicate that the carrying amount of the reporting unit might exceed its implied fair value. We reviewwith indefinite lives for impairment based on our estimated discounted future cash flows to be generated by those assets.recognized valuation techniques. While we believe that our estimates of future cash flows are reasonable, different assumptions regarding such cash flowsestimates could materially affect our evaluations.
Following our evaluations during 20072010 and up to the date of this annual report, we do not have any information which leads to any impairment of goodwill or long-lived assets.intangible assets with indefinite lives. We can give no assurance that our expectations will not change as a result of new information or developments. Future changes in economic or political conditions in any country in which we operate or in the industries in which we participate, however, may cause us to change our current assessment.
Executory contracts
As part of the normal course of business, we frequently invest in the development of our beer distribution channels through a variety of commercial agreements with different retailers in order to generate sales volume. These agreements are considered to be executory contracts and accordingly the costs incurred under these contracts are recognized as performance under the contracts is received.
These agreements require cash disbursements to be made in advance to certain retailers in order to fund activities intended to generate sales volume. These advance cash disbursements are then compensated for as sales are invoiced. These disbursements are considered to be market-related investments, which are capitalized as other assets. The amortization of amounts capitalized is presented as a reduction of net sales in relation to the volume sold to each retailer. The period of amortization is between three and four years, which is the normal term of the commercial agreements.
We periodically evaluate the carrying value of executory contracts. If the carrying value is considered to be impaired, these assets are written down as appropriate. The accuracy of the carrying value is based on our ability to predict certain key variables such as sales volume, prices and other industry and economic factors. Predicting these key variables involves assumptions based on future events. These assumptions are consistent with our internal projections.
Labor liabilitiesEmployee benefits
Our employee benefits, which we used to refer to as labor liabilities, are comprised of pension plan, seniority premium, post-retirement medical services and severance indemnities. The determination of our obligations and expenses for pension and other post-retirement benefits isare determined by actuarial calculations and are dependent on our determination of certain assumptions used by independent actuaries in calculatingto estimate such amounts. We evaluate our assumptions at least annually.
In 2006,2008, we decidedadopted NIF D-3 (“Employee Benefits”), which eliminates the recognition of the additional liability resulting from the difference between obligations for accumulated benefits and net projected liability, in addition to modifymaking other important changes. On January 1, 2008, our pensionadditional liability cancelled was Ps. 868 million, of which Ps. 447 million corresponds to intangible assets and retirement plans. Through 2006Ps. 251 to cumulative other comprehensive income, net of its deferred tax of Ps. 170 million.
NIF D-3 establishes a maximum five-year period to amortize the initial balance of the labor costs of past services of pension and retirement plans providedand the same amortization period for lifetime monthly paymentsthe labor cost of past service of severance indemnities, previously defined by Bulletin D-3 (“Labor Liabilities”) as a complement to the pension payment received from the Mexican Social Security Institute. (Instituto Mexicano del Seguro Social or “IMSS”). The modified pensionunrecognized transition obligations and retirement plans consist in a lump-sum payment to personal vesting on or after January 1, 2007.
Additionally, in 2006, we modified the long-term assumptions used in the actuarial calculations for Mexican subsidiaries based on changes in the company’s revised estimate of current prices for settling its related obligations as a result of recent stability in the Mexican economy. These assumptions are described in note 15 to our consolidated financial statements and include the discount rate, expected long-term rate of return on plan assets and rates of increase in compensation costs. All our assumptions depend on the economic circumstances of each country where we operate.
These changes were accounted for as unrecognized prior service costs. For the year ended December 31, 2009, labor costs for past services amounted to Ps. 81 million, and for the year ended December 31, 2010, they amounted to Ps. 81 million, and were recorded within operating income.
Actuarial gains and losses related to severance indemnities are registered under operating income during the year in which they are generated. The balance of unrecognized actuarial net lossgains and will be amortized over the expected service periodlosses as of the Company’s personnel. The net effect of the changes mentioned above was an increase in pension and retirement plan, seniority premium and severance indemnity liabilities of Ps.797 million, Ps.l9 million and Ps.23 million, respectively.
In 2007, FEMSA Cerveza approved a plan to allow certain qualifying employees to retire early beginning in 2008. This plan consisted of allowing employees over the age of 55 with 20 years of service to take advantage of early retirement in order to obtain the same pension benefits they would have obtained had they retired at their regular retirement age. In addition, this plan authorized FEMSA Cerveza to make severance payments to certain employees who otherwise would not have met the criteria for eligibility. The plan is intended to improve the efficiency of FEMSA’s Cerveza operating structure. The total financial impact of the plan was Ps. 231 million, from which Ps.125 millionJanuary 1, 2008 was recorded in our consolidated income statement for 2007 as part of other expenses. (See note 18 to our audited consolidated financial statements) and Ps. 106 million recorded in 2008 consolidated results.
In accordance with Mexican Financial Reporting Standards, actual results that differ from our assumptions (actuarial gains or losses) are accumulated and amortized over future periods and, therefore, generally affect our recognized expenses and recorded obligations in these future periods. amounted to Ps. 163 million.
While we believe that our assumptions are appropriate, significant differences in our actual experience or significant changes in our assumptions may materially affect our pension and other post-retirement obligations and our future expense. The following table is a summary of the three key assumptions to be used in determining 20072010 annual labor liability expense, along with the impact on this expense of a 1% change in each assumed rate.
Assumption | 2008 Rate(1) | Impact of Rate Change(2) | ||||||||||||||||||||||||||||||||||||||||
| +1% | -1% | |||||||||||||||||||||||||||||||||||||||||
| Nominal Rates(3) | Real Rates(4) | Impact of Rate Changes(2) | ||||||||||||||||||||||||||||||||||||||||
Assumptions 2010(1) | 2010 | 2009 | 2008 | 2010 | 2009 | 2008 | +1% | -1% | ||||||||||||||||||||||||||||||||||
| (in real terms) | (in millions of Mexican pesos) | (in millions of Mexican pesos) | ||||||||||||||||||||||||||||||||||||||||
Mexican and Foreign Subsidiaries: | ||||||||||||||||||||||||||||||||||||||||||
Discount rate | 4.5 | % | (668 | ) | Ps. | 776 | 7.6 | % | 8.2 | % | 8.2 | % | 4.0 | % | 4.5 | % | 4.5 | % | Ps. | (288) | Ps. | 413 | ||||||||||||||||||||
Salary increase | 1.5 | % | 486 | (385 | ) | 4.8 | % | 5.1 | % | 5.1 | % | 1.2 | % | 1.5 | % | 1.5 | % | 354 | (183) | |||||||||||||||||||||||
Return on assets | 4.5 | % | 24 | (34 | ) | |||||||||||||||||||||||||||||||||||||
Long-term asset return | 8.2 | % | 8.2 | % | 11.3 | % | 3.6 | % | 4.5 | % | 4.5 | % | (40) | 11 | ||||||||||||||||||||||||||||
| (1) | Calculated using a measurement |
| (2) | The impact is not the same for an increase of 1% as for a decrease of 1% because the rates are not linear. |
| (3) | For countries considered non-inflationary economic environments according to Mexican FRS. |
| (4) | For countries considered inflationary economic environments according to Mexican FRS. |
Income taxes
As we describe in note 23Note 24 to our audited consolidated financial statements, on January 1, 2010, the Mexican tax reform became effective. The most notable change followingimportant changes are: an increase in the 2007value added tax rate (IVA) from 15% to 16%, an increase on special tax on production and services from 25% to 26.5% and an increase in the statutory income tax rate from 28% in 2009 to 30% for 2010, 2011 and 2012, and a reduction from 30% to 29% and 28% for 2013 and 2014, respectively. In addition, the Mexican Fiscal Reform istax reform requires that income tax payments related to consolidated tax benefits obtained since 1999 be paid during the introduction ofnext five years beginning on the sixth year when tax benefits were used. See Note 24 D and E to our audited consolidated financial statements.
Mexican tax reform effective in 2008 introduced theImpuesto Empresarial de Tasa Unica(“IETU”) which (IETU) that functions similar to an alternative minimum corporate income tax, except that any amounts paid are not creditable
against future income tax payments. Mexican taxpayers will beare now subject to the higher of the IETU or the income tax liability computed under Mexican Income Tax Law. This new tax is calculated on a cash-flow basis and the ratesrate for 20082010 and 2009 will be 16.5% and 17.0%, respectively.2011 is 17.5% for both years.
Based on our financial projections estimated for our Mexican tax returns, we expect to pay corporate income tax in the future and do not expect to pay IETU, therefore we did not record deferred IETU. As such, the enactment of IETU did not impact our consolidated financial position or results offrom operations, as it only recognizes deferred income tax.
We recognize deferred tax assets and liabilities based on the differences between the financial statement carrying amounts and the tax basis of assets and liabilities. We regularly review our deferred taxes for recoverability and/or payment, and establish a valuation allowance based on our judgment regarding historical taxable income, projected future taxable income and the expected timing of the reversals of existing temporary differences. If these estimates and related assumptions change in the future, we may be required to record additional valuation allowances against our deferred taxes resulting in an impact in net income.
The statutory income tax rate in Mexico was 30% for 2007, 2006, 2005 was2010, and 28%, 29% for 2009 and 30%, respectively.2008.
TaxIndirect tax and legal contingencies
We are subject to various claims and contingencies related to indirect tax and legal proceedings as described in note 24Note 25 to our audited consolidated financial statements. Due to their nature, such legal proceedings involve inherent uncertainties including, but not limited to, court rulings, negotiations between affected parties and governmental actions. Management periodically assesses the probability of loss for such contingencies and accrues a liability and/or discloses the relevant circumstances, as appropriate. If the potential loss from any claim or legal proceeding is considered probable and the amount can be reasonably estimated, we accrue a liability for the estimated loss.
Derivative Financial Instruments
As we mention in note 4 (r) to our consolidated financial statements, beginning in 2005 we began to apply Bulletin C-10, “Instrumentos Financieros Derivados y Operaciones de Cobertura” (Derivative Financial Instruments and Hedging Activities), which requires usWe are required to measure all derivative financial instruments at fair value and recognize them in the balance sheet as an asset or liability. Changes in the fair value of derivative financial instruments are recorded each year in net income or as a component of cumulative other comprehensive income, based on the type of hedging instrument and the ineffectiveness of the hedge. The fair values of derivative financial instruments are determined considering quoted prices in recognized markets. If such instruments are not traded, fair value is determined by applying techniques based upon technical models supported by sufficient reliable and verifiable data, recognized in the financial sector. We base our forward price curves upon market price quotations.
Although we are stillAs of the date of issuance of these consolidated financial statements and their accompanying notes, the Company is determining its opening consolidated balance sheet as of January 1, 2011 for IFRS and assessing all the possible impacts in 2011 in order to have a comparable basis in the 2012 consolidated financial statements. As part of the transition process to IFRS, the Company is reviewing its accounting policies in order to comply with international standards by the transition date.
The following accounting standards have been issued under Mexican FRS; the application of which is required as indicated. Except as otherwise noted, the Company will adopt these standards when they become effective. The Company is in the process of assessing the effectseffect of our adoption ofadopting the new accounting standards, described below, we dobut it does not anticipate any significant impact except as may be described below.
NIF B-5 “Financial Information by Segment”
NIF B-5 establishes that an operating segment shall meet the following criteria: i) the segment engages in business activities from which it earns or is in the process of obtaining revenues, and incurs related costs and expenses; ii) the operating results are reviewed regularly by the main authority of the entity’s
decision maker; and iii) specific financial information is available. NIF B-5 also requires disclosures related to operating segments subject to reporting, including details of earnings, assets and liabilities, reconciliations, information about products and services, and geographical areas. NIF B-5 is effective beginning on our consolidated balance sheet, resultsJanuary 1, 2011, and this guidance shall be applied retrospectively for comparative purposes.
NIF B-9 “Interim Financial Reporting”
NIF B-9 prescribes the content to be included in a complete or condensed set of operations, or significant changes to ourfinancial statements for an interim period. In accordance with this standard, the complete set of financial statements shall include: a) a statement of financial position oras of the end of the period, b) an income statement for the period, c) a statement of changes in equity for the period, d) a statement of cash flows.
Under Mexican Financial Reporting Standards (Normas de Información Financiera, or NIF)flows for the period, and e) notes providing the relevant accounting policies and other explanatory notes. Condensed financial statements shall include: a) condensed statement of financial position, b) condensed income statement, c) condensed statement of changes in equity, d) condensed statement of cash flows, and e) selected explanatory notes. NIF B-9 is effective beginning on January 1, 2011. Interim financial statements shall be presented in comparative form.
|
NIF C-4 “Inventories”
NIF C-4 replaces Bulletin C-4, and describes new accounting treatment for inventories. This standard eliminates the option to use “direct costing” as a valuation system; and it does not permit the use of the last-in, first-out (LIFO) formula to measure the cost of inventories. NIF C-4 establishes that the cost of inventories should be modified on the basis of net realizable value. According to this standard, when an entity purchase inventories on deferred settlement terms, the difference between the purchase price for normal credit terms and the amount paid, should be recognized as interest expense. NIF C-4 also requires companies to disclose the amount of any inventory recognized as an expense, when the cost of sales includes other elements or when a part of the cost of sales is included as discontinued operations. In addition, advances to suppliers are no longer part of inventories. When an entity changes the cost formula, this change should be treated as an accounting change. NIF C-4 is effective beginning on January 1, 2011, and has to be applied prospectively.
NIF C-5 “Prepaid Expenses”
NIF C-5 replaces Bulletin C-5, and establishes general rules for recognition of prepaid expenses. This standard excludes from the presentation, structurescope prepaid expenses which are treated in other NIF, as such as: prepaid income taxes, prepaid net assets from pension plans, and preparationprepaid interest expenses. NIF C-5 establishes the cases in which prepaid expenses of statementsinventories or tangible assets, among others, should be presented in the line of cash flow,“Prepaid Expenses”, instead of the lines of “Inventories” or “Property, Plant and Equipment”. Prepaid expenses should be classified as wellcurrent or noncurrent. This statement establishes that prepaid expenses shall be recognized as “expense” in the disclosures supplementing these cash flow statements. NIF B-2 replaces prior Bulletin B-12,Estado de Cambios en la Situación Financiera (Statements of Changes in Financial Position), which established guidelines with respect to statements of changes in financial position. N1F B-2 requiresIncome Statement when the company receives benefits from the asset; and prepaid expenses shall be recognized as “assets” when the entity is certain that the cash flow statement show the company’s cash inflows and outflows during the relevant period. Line-items should also be presented as gross itemsasset will generate future economic benefits. Additionally, when appropriate. Cash flows from financing activities are now presented below those from investing activities, which represents a departure from Bulletin B-12. In addition, NIF B-2 allows entities to determine and present their cash flows from operating activities using either the direct or indirect method. NIF B-2 was effective starting January 1, 2008.
|
This NIF provides a separate set of guidelines to deal with accounting for inflation effects. If inflation for the three preceding years is 26% or more, cumulatively, the effects of inflation must be recognized using the comprehensive method. If cumulative inflation for the three preceding years is less than 26%, no inflationary effects need toan impairment loss arises, prepaid expenses shall be recognized in the company’s financial statements. Additionally,income statement. NIF B-10 eliminates the replacement cost and specific indexation methods for inventories and fixed assets, respectively, and requires that the cumulative gain or loss from holding non-monetary assets be reclassified to retained earnings, if such gain or lossC-5 is realized. The gain or loss that is not realized will be maintained in stockholders’ equity and charged to current earnings for the period in which the originating item is realized. NIF B-10 was effective startingbeginning on January 1, 2008. As of December 31, 2007, the cumulative inflation rate for the three preceding years in Mexico, Colombia, Brazil, Panama2011, and Guatemala was less than 26% and, accordingly we will not recognize inflation effects in 2008 for our subsidiaries located in these countries. For Costa Rica, Nicaragua, Argentina and Venezuela, we will continuehas to recognize inflation effects for our subsidiaries located in these countries.
|
NIF B-15 eliminates classification of integrated foreign operations and foreign entities and incorporates the concepts of accounting currency, functional currency and reporting currency. N1F B-15 establishes the procedures to translate the financial information of a foreign subsidiary: i) from the accounting to the functional currency, and ii) from the functional to the reporting currency, and allows entities to present their financial statements in a reporting currency other than their functional currency. NIF B-15 was effective starting January 1, 2008.
|
This NIF applies to current and deferred Employee Profit Sharing (PTU). Deferred PTU should be calculated using the same methodology established in NIF D-4,Impuestos a la Utilidad (Income Taxes). It also includes a career salary concept and the amortization period for most items has been reduced to five years. NIF D-3 was effective starting January 1, 2008.
|
This NIF relocates accounting for current and deferred PTU to NIF D-3, eliminates the permanent difference concept and redefines and incorporates various definitions. NIF D-4 was effective starting January 1, 2008.
Under US. GAAPapplied prospectively.
FASB Staff Position (FSP) FASB Interpretation No. 39 Offsetting of Amounts Related to Certain Contracts, or FSP FIN No. 39NIF C-6 “Property, Plant and Equipment”
NIF C-6 replaces Bulletin C-6, and establishes general rules for valuation, presentation and disclosures about property, plant and equipment, also known as “fixed assets”. This FSP amends paragraph 3standard requires entities to recognize and depreciate fixed assets by components, instead of FASB Interpretation No. 39doing as a whole. NIF C-6 also eliminates the requirement to replace the terms “conditional contracts”revaluate fixed assets acquired with no cost, and “exchange contracts”states that those assets have to be recognized as an equity contribution with the term “derivative instruments” as defined in SFAS No. 133. In addition, this FSP amends paragraph 10 of FASB Interpretation No. 39 to permit a reporting entity to offset fair value amounts recognized for the right to reclaim
cash collateral (a receivable) or the obligation to return cash collateral (a payable) against fair value amounts recognized for derivative instruments executed with the same counterparty under the same master netting arrangement that have been offset in accordance with that paragraph. This FSPno cost. NIF C-6 is effective beginning on January 1, 2011, and has to be applied prospectively, except for fiscal yearsthose changes regarding recognition by components, which are effective beginning after November 15, 2007.on January 1, 2012.
The Fair Value Option for Financial AssetsNIF C-18 “Obligations Associated with the Disposal of Property, Plant and Financial Liabilities, or SFAS No. 159Equipment”
This standard permits entities to choose to measure financial instruments and certain other items at fair value to mitigate volatility in reported earnings. According to SFAS No. 159, the following are eligible items for the use of the fair value measurement: (1) recognized financial assets and financial liabilities; (2) firm commitments that would otherwise not be recognized at inception and that involve only financial instruments; (3) non-financial insurance contracts and warranties that the insurer can settle by paying a third party to provide those goods or services; and (4) host financial instruments resulting from separation of an embedded non-financial derivative instrument from a nonfinancial hybrid instrument. The fair value option established by SFAS No. 159 permits all entities to choose to measure eligible items at fair value at specified election dates. A business entity shall report unrealized gains and lossesNIF C-18 contains guidance on items for which the fair value option has been elected in earnings (or another performance indicator if the business entity does not report earnings) at each subsequent reporting date. SFAS No. 159 is effective as of the beginning of an entity’s first fiscal year that begins after November 15, 2007. We are in the process of determining the impact of adopting this new accounting principle on our consolidated financial position and results of operations.
Business Combinations, an amendment of SFAS No. 141, or SFAS No. 141(R)
This statement requires (a) a company to recognize acquired assets, assumed liabilities, and any non- controlling interest in the acquiree at fair value as of the acquisition date; and (b) an acquirer in preacquisition periods to expense all acquisition-related costs. SFAS No. 141(R) requires that any adjustments to an acquired entity’s deferred tax asset and liability balance that occur after the measurement period be recorded as a component of income tax expense. This accounting treatment is required for business combinations consummated before the effective date of SFAS No. 141(R) (non-prospective), otherwise SFAS No. 141(R) must be applied prospectively, meaning early adoption is prohibited. SFAS No. 141(R) is effective for fiscal years, and interim periods within those fiscal years, beginning on or after December 15, 2008.
Fair Value Measurements, or SFAS No. 157
This statement establishes a framework for measuring fair value and expands disclosures about fair value measurements. SFAS No. 157 clarifies the definition of exchange price as the price between market participants in an orderly transaction to sell an asset or transfer a liability in the market in which the reporting entity would transact for the asset or liability, that is, the principal or most advantageous market for the asset or liability. The changes to current practices resulting from the application of this statement relate to the definition of fair value, the methods used to measure fair value, and the expanded disclosures about fair value measurements. SFAS No. 157 is effective for fiscal years beginning after November 15, 2007 and interim periods within those fiscal years. On February 12, 2008, the FASB issued FSP FAS 157-1 and FSP FAS 157-2, which remove leasing transactions accounted for under SFAS No. 13 “Accounting for Leases” from the scope of SFAS No. 157 and partially defer the effective date of SFAS No. 157 with respect to non-recurring fair value measurement of non-financial assets and non-financial liabilities until fiscal years beginning after November 15, 2008. We are in the process of determining the impact of adopting this new accounting principle on our consolidated financial position and results of operations.
Non-controlling Interest in Consolidated Financial Statements, or SFAS No. 160
This statement has the following effects on an entity’s financial statements: (a) amends ARB No. 51 to establish accounting and reporting standards for the non-controlling interest in a subsidiary and the deconsolidation of a subsidiary; (b) changes the way the consolidated income statement is presented; (c) establishes a single method of accounting for changes in a parent’s ownership interest in a subsidiaryliabilities that does not result in deconsolidation; (d) requires that a parent recognize a gain or loss in net income when a subsidiary is deconsolidated; and (e) requires expanded disclosures in the consolidated financial statements that clearly identify and distinguish between the interestshave been recognized as part of the parent companycost of a property, plant and equipment under NIF C-6 “Property, plant and equipment” (NIF C-6) and as a provision (liability) under Bulletin C-9 “Liabilities, provisions, contingent assets and liabilities, and commitments” (Bulletin C-9). NIF C-18 establishes: (a) the requirements to be considered for the assessment of a liability associated with the disposal of a component of property,
interestsplant and equipment; (b) the requirement to recognize such obligations as a provision that increases the acquisition cost of a component; (c) the methodology to recognize changes to the valuation of these provisions, for revisions to the cash flows, the frequency for its liquidation and the appropriate discount rate that has to be used; (d) the use of an adequate discount rate that includes time value of money and credit risk of the non-controlling ownersentity; (e) the use of present value to determine the best estimation of provisions; (f) the disclosures that an entity has to present when it has an obligation associated with the disposal of a subsidiary. SFAS No. 160 must be applied prospectively and early adoption is prohibited. SFAS No. 160component. NIF C-18 is effective for fiscal years, and interim periods within those fiscal years, beginning on or after December 15, 2008. WeJanuary 1, 2011.
There are no significant new U.S. GAAP accounting standards effective in 2011 that are expected to impact the process of determining the impact of adopting this new accounting principle on our consolidated financial position and results of operations.Company.
The following table sets forth our consolidated income statement under Mexican Financial Reporting StandardsFRS for the years ended December 31, 2007, 20062010, 2009 and 2005:2008:
| Year Ended December 31, 2007 | Year Ended December 31, | |||||||||||||||||||||||||||||||
| 2007 | 2007 | 2006 | 2005 | 2010(1) | 2010 | 2009 | 2008 | |||||||||||||||||||||||||
| (in millions of U.S. dollars and constant Mexican pesos at December 31, 2007) | (in millions of U.S. dollars and Mexican pesos) | |||||||||||||||||||||||||||||||
Net sales | $ | 13,472 | Ps. | 147,069 | Ps. | 135,647 | Ps. | 118,799 | $ | 13,598 | Ps. 168,376 | Ps. 158,503 | Ps. 132,260 | |||||||||||||||||||
Other operating revenues | 44 | 487 | 473 | 663 | 107 | 1,326 | 1,748 | 1,548 | ||||||||||||||||||||||||
Total revenues | 13,516 | 147,556 | 136,120 | 119,462 | 13,705 | 169,702 | 160,251 | 133,808 | ||||||||||||||||||||||||
Cost of sales | 7,310 | 79,801 | 73,366 | 63,721 | 7,974 | 98,732 | 92,313 | 77,990 | ||||||||||||||||||||||||
Gross profit | 6,206 | 67,755 | 62,754 | 55,741 | 5,731 | 70,970 | 67,938 | 55,818 | ||||||||||||||||||||||||
Operating expenses: | ||||||||||||||||||||||||||||||||
Administrative | 842 | 9,191 | 8,973 | 7,957 | 627 | 7,766 | 7,835 | 6,292 | ||||||||||||||||||||||||
Selling | 3,571 | 38,995 | 35,314 | 30,345 | 3,285 | 40,675 | 38,973 | 32,177 | ||||||||||||||||||||||||
Total operating expenses | 4,413 | 48,186 | 44,287 | 38,302 | 3,912 | 48,441 | 46,808 | 38,469 | ||||||||||||||||||||||||
Income from operations | 1,793 | 19,569 | 18,467 | 17,439 | 1,819 | 22,529 | 21,130 | 17,349 | ||||||||||||||||||||||||
Other expenses, net | (119 | ) | (1,297 | ) | (1,650 | ) | (1,108 | ) | (23 | ) | (282 | ) | (1,877 | ) | (2,019 | ) | ||||||||||||||||
Interest expense | (417 | ) | (4,554 | ) | (4,299 | ) | (4,759 | ) | (264 | ) | (3,265 | ) | (4,011 | ) | (3,823 | ) | ||||||||||||||||
Interest income | 70 | 769 | 792 | 765 | 89 | 1,104 | 1,205 | 865 | ||||||||||||||||||||||||
Interest expense, net | (347 | ) | (3,785 | ) | (3,507 | ) | (3,994 | ) | (175 | ) | (2,161 | ) | (2,806 | ) | (2,958 | ) | ||||||||||||||||
Foreign exchange gain (loss), net | 63 | 691 | (217 | ) | 318 | |||||||||||||||||||||||||||
Foreign exchange loss, net | (50 | ) | (614 | ) | (431 | ) | (1,431 | ) | ||||||||||||||||||||||||
Gain on monetary position, net | 151 | 1,639 | 1,488 | 1,204 | 34 | 410 | 486 | 657 | ||||||||||||||||||||||||
Market value gain (loss) on ineffective portion of derivative financial instrument | 6 | 69 | (113 | ) | (166 | ) | 17 | 212 | 124 | (950 | ) | |||||||||||||||||||||
Integral result of financing | (127 | ) | (1,386 | ) | (2,349 | ) | (2,638 | ) | ||||||||||||||||||||||||
Comprehensive financing result | (174 | ) | (2,153 | ) | (2,627 | ) | (4,682 | ) | ||||||||||||||||||||||||
Equity method of associates | 286 | 3,538 | 132 | 90 | ||||||||||||||||||||||||||||
Income before income taxes | 1,547 | 16,886 | 14,468 | 13,693 | 1,908 | 23,632 | 16,758 | 10,738 | ||||||||||||||||||||||||
Income taxes | 454 | 4,950 | 4,608 | 4,620 | 457 | 5,671 | 4,959 | 3,108 | ||||||||||||||||||||||||
Consolidated net income before discontinued operations | 1,451 | 17,961 | 11,799 | 7,630 | ||||||||||||||||||||||||||||
Income from the exchange of shares with Heineken, net | 2,150 | 26,623 | — | — | ||||||||||||||||||||||||||||
Net income from discontinued operations | 57 | 706 | 3,283 | 1,648 | ||||||||||||||||||||||||||||
Consolidated net income | $ | 1,093 | Ps. | 11,936 | Ps. | 9,860 | Ps. | 9,073 | 3,658 | 45,290 | 15,082 | 9,278 | ||||||||||||||||||||
Net majority income | 780 | 8,511 | 7,127 | 5,951 | ||||||||||||||||||||||||||||
Net minority income | 313 | 3,425 | 2,733 | 3,122 | ||||||||||||||||||||||||||||
Net controlling interest income | 3,251 | 40,251 | 9,908 | 6,708 | ||||||||||||||||||||||||||||
Net non-controlling interest income | 407 | 5,039 | 5,174 | 2,570 | ||||||||||||||||||||||||||||
Consolidated net income | $ | 1,093 | Ps. | 11,936 | Ps. | 9,860 | Ps. | 9,073 | 3,658 | 45,290 | 15,082 | Ps. 9,278 | ||||||||||||||||||||
| (1) | Translation to U.S. dollar amounts at an exchange rate of Ps. 12.3825 to US$1.00 provided solely for the convenience of the reader. |
The following table sets forth certain operating results by reportable segment under Mexican Financial Reporting StandardsFRS for each of our segments for the years ended December 31, 2007, 20062010, 2009 and 2005:2008. Due to the discontinued operation of FEMSA Cerveza it is not considered as a reportable segment.
| Year Ended December 31 | Year Ended December 31, | ||||||||||||||||||||||||||||||||||
| Percentage Growth | Percentage Growth | ||||||||||||||||||||||||||||||||||
| 2007 | 2006 | 2005 | 2007 vs. 2006 | 2006 vs. 2005 | 2010 | 2009 | 2008 | 2010 vs. 2009 | 2009 vs. 2008 | ||||||||||||||||||||||||||
| (in millions of constant Mexican pesos at December 31, 2007, except for percentages) | (in millions of Mexican pesos at December 31, 2010, except for percentages) | ||||||||||||||||||||||||||||||||||
Net sales | |||||||||||||||||||||||||||||||||||
Coca-Cola FEMSA | 68,969 | Ps. 63,820 | Ps. 59,181 | 8.1 | % | 7.8 | % | Ps. 102,988 | Ps. 102,229 | Ps. 82,468 | 0.7 | % | 24.0 | % | |||||||||||||||||||||
FEMSA Cerveza | 39,284 | 37,680 | 29,593 | 4.2 | % | 27.3 | % | ||||||||||||||||||||||||||||
FEMSA Comercio | 42,103 | 36,835 | 31,021 | 14.3 | % | 18.7 | % | 62,259 | 53,549 | 47,146 | 16.3 | % | 13.6 | % | |||||||||||||||||||||
CB Equity(1) | — | N/a | N/a | N/a | N/a | ||||||||||||||||||||||||||||||
Total revenues | |||||||||||||||||||||||||||||||||||
Coca-Cola FEMSA | 69,251 | 64,046 | 59,642 | 8.1 | % | 7.4 | % | 103,456 | 102,767 | 82,976 | 0.7 | % | 23.9 | % | |||||||||||||||||||||
FEMSA Cerveza | 39,566 | 37,919 | 29,768 | 4.3 | % | 27.4 | % | ||||||||||||||||||||||||||||
FEMSA Comercio | 42,103 | 36,835 | 31,021 | 14.3 | % | 18.7 | % | 62,259 | 53,549 | 47,146 | 16.3 | % | 13.6 | % | |||||||||||||||||||||
CB Equity | — | N/a | N/a | N/a | N/a | ||||||||||||||||||||||||||||||
Cost of sales | |||||||||||||||||||||||||||||||||||
Coca-Cola FEMSA | 35,881 | 33,745 | 30,558 | 6.3 | % | 10.4 | % | 55,534 | 54,952 | 43,895 | 1.1 | % | 25.2 | % | |||||||||||||||||||||
FEMSA Cerveza | 17,889 | 16,487 | 11,998 | 8.5 | % | 37.4 | % | ||||||||||||||||||||||||||||
FEMSA Comercio | 30,301 | 26,839 | 22,792 | 12.9 | % | 17.8 | % | 41,220 | 35,825 | 32,565 | 15.1 | % | 10.0 | % | |||||||||||||||||||||
CB Equity | — | N/a | N/a | N/a | N/a | ||||||||||||||||||||||||||||||
Gross profit | |||||||||||||||||||||||||||||||||||
Coca-Cola FEMSA | 33,370 | 30,301 | 29,084 | 10.1 | % | 4.2 | % | 47,922 | 47,815 | 39,081 | 0.2 | % | 22.3 | % | |||||||||||||||||||||
FEMSA Cerveza | 21,677 | 21,432 | 17,770 | 1.1 | % | 20.6 | % | ||||||||||||||||||||||||||||
FEMSA Comercio | 11,802 | 9,996 | 8,229 | 18.1 | % | 21.5 | % | 21,039 | 17,724 | 14,581 | 18.7 | % | 21.6 | % | |||||||||||||||||||||
CB Equity | — | N/a | N/a | N/a | N/a | ||||||||||||||||||||||||||||||
Income from operations | |||||||||||||||||||||||||||||||||||
Coca-Cola FEMSA | 11,447 | 10,251 | 9,973 | 11.7 | % | 2.8 | % | 17,079 | 15,835 | 13,695 | 7.9 | % | 15.6 | % | |||||||||||||||||||||
FEMSA Cerveza | 5,404 | 6,121 | 5,800 | (11.7 | )% | 5.5 | % | ||||||||||||||||||||||||||||
FEMSA Comercio | 2,315 | 1,664 | 1,360 | 39.1 | % | 22.4 | % | 5,200 | 4,457 | 3,077 | 16.7 | % | 44.8 | % | |||||||||||||||||||||
CB Equity | (3 | ) | N/a | N/a | N/a | N/a | |||||||||||||||||||||||||||||
Depreciation | |||||||||||||||||||||||||||||||||||
Coca-Cola FEMSA(1) | 2,637 | 2,595 | 2,610 | 1.6 | % | (0.6 | )% | ||||||||||||||||||||||||||||
FEMSA Cerveza | 1,637 | 1,818 | 1,617 | (10.0 | )% | 12.4 | % | ||||||||||||||||||||||||||||
Coca-Cola FEMSA | 3,333 | 3,473 | 3,036 | (4.0 | )% | 14.4 | % | ||||||||||||||||||||||||||||
FEMSA Comercio | 543 | 431 | 348 | 26.0 | % | 23.8 | % | 990 | 819 | 663 | 20.9 | % | 23.5 | % | |||||||||||||||||||||
CB Equity | — | N/a | N/a | N/a | N/a | ||||||||||||||||||||||||||||||
Gross margin | |||||||||||||||||||||||||||||||||||
Coca-Cola FEMSA | 48.2 | % | 47.3 | % | 48.8 | % | 0.9 | % | (1.5 | )% | 46.3 | % | 46.5 | % | 47.1 | % | (0.2 | ) p.p. | (0.6 | ) p.p. | |||||||||||||||
FEMSA Cerveza | 54.8 | % | 56.5 | % | 59.7 | % | (1.7 | )% | (3.2 | )% | |||||||||||||||||||||||||
FEMSA Comercio | 28.0 | % | 27.1 | % | 26.5 | % | 0.9 | % | 0.6 | % | 33.8 | % | 33.1 | % | 30.9 | % | 0.7 | p.p. | 2.2 | p.p. | |||||||||||||||
CB Equity | N/a | N/a | N/a | N/a | N/a | ||||||||||||||||||||||||||||||
Operating margin | |||||||||||||||||||||||||||||||||||
Coca-Cola FEMSA | 16.5 | % | 16.0 | % | 16.7 | % | 0.5 | % | (0.7 | )% | 16.5 | % | 15.4 | % | 16.5 | % | 1.1 | p.p. | (1.1 | ) p.p. | |||||||||||||||
FEMSA Cerveza | 13.7 | % | 16.1 | % | 19.5 | % | (2.4 | )% | (3.4 | )% | |||||||||||||||||||||||||
FEMSA Comercio | 5.5 | % | 4.5 | % | 4.4 | % | 1.0 | % | 0.1 | % | 8.4 | % | 8.3 | % | 6.5 | % | 0.1 | p.p. | 1.8 | p.p. | |||||||||||||||
CB Equity | N/a | N/a | N/a | N/a | N/a | ||||||||||||||||||||||||||||||
| (1) | CB Equity holds Heineken N.V. and Heineken Holding N.V. Shares. |
| (2) | Includes breakage of bottles. |
| Gross margin is calculated with reference to total revenues. |
| As used herein, p.p. refers to a percentage point increase (or decrease), contrasted with a straight percentage increase (or decrease). |
| (5) | Operating margin is calculated with reference to total revenues. |
Results of Operationsfrom operations for the Year Ended December 31, 20072010 Compared to the Year Ended December 31, 20062009
FEMSA Consolidated
Under Mexican FRS, we reclassified our financial statements to reflect FEMSA Cerveza as a discontinued operation.
Total Revenues
FEMSA’s consolidated total revenues increased 8.4%5.9% to Ps. 147,556169,702 million in 20072010 compared to Ps. 136,120160,251 million in 2006.2009. All of FEMSA’s operations—soft drinks, beerbeverage and retail—retail operations contributed positively to this revenue growth. FEMSA Comercio’s revenues increased 14.3% to Ps. 42,103 million, due to the 716 net new stores opened during the year and the 3.3% growth in same stores sales. Coca-Cola FEMSA’s total revenues increased 8.1%0.7% to Ps. 69,251103,456 million, driven by the revenue growth in our Mercosur and Mexico divisions. FEMSA Comercio’s revenues increased 16.3% to Ps. 62,259 million, mainly driven by the opening of 1,092 net new stores combined with an average increase of 5.2% in same-store sales.
Gross Profit
Consolidated gross profit increased 4.5% to Ps. 70,970 million in 2010 compared to Ps. 67,938 million in 2009, driven by FEMSA Comercio. Gross margin contracted by 0.6 percentage points, from 42.4% of consolidated total revenues in 2009 to 41.8% in 2010 as the faster growth of lower-margin FEMSA Comercio tends to compress FEMSA’s consolidated margins over time. Gross margin improvement at FEMSA Comercio partially offset raw-material cost pressures at Coca-Cola FEMSA.
Income from Operations
Consolidated operating expenses increased 3.5% to Ps. 48,441 million in 2010 compared to Ps. 46,808 million in 2009. The majority of this increase resulted from additional operating expenses at FEMSA Comercio, due to strong volume growthan accelerated store expansion. As a percentage of 6.1%total revenues, consolidated operating expenses decreased from 29.2% in 2009 to 28.5% in 2010.
Consolidated administrative expenses decreased 0.9% to Ps. 7,766 million in 2010 compared to Ps. 7,835 million in 2009. As a percentage of total revenues, consolidated administrative expenses remained stable at 4.6% in 2010 compared with 4.9% in 2009.
Consolidated selling expenses increased 4.4% to Ps. 40,675 million in 2010 as compared to 2006Ps. 38,973 million in 2009. This increase was attributable to FEMSA Comercio. As a percentage of total revenues, selling expenses decreased 0.3 percentage points from 2,120.8to 24.3% in 2009 to 24.0% in 2010.
Consolidated income from operations increased 6.6% to Ps. 22,529 million unit cases in 20072010 as compared to 1,998.1Ps. 21,130 million unit cases in 20062009. This increase was driven by the results of Coca-Cola FEMSA and anFEMSA Comercio. Excluding one-time Heineken Transaction-related expenses, consolidated income from operations would have grown 8.7% in that period. Consolidated operating margin increased 0.1 percentage points from 13.2% in 2009, to 13.3% as a percentage of 2010 consolidated total revenues.
Some of our subsidiaries pay management fees to us in consideration for corporate services we provide to them. These fees are recorded as administrative expenses in the respective business segments. Our subsidiaries’ payments of management fees are eliminated in consolidation and, therefore, have no effect on our consolidated operating expenses.
Coca-Cola FEMSA
Total Revenues
Coca-Cola FEMSA total revenues increased 0.7% to Ps. 103,456 million in 2010, compared to Ps. 102,767 million in 2009 as a result of revenue growth in Coca-Cola FEMSA’s Mercosur and Mexico divisions and despite the devaluation of the Venezuelan bolivar, which affected our revenues in that country. On a currency-neutral basis and excluding the acquisition of Brisa in Colombia, total revenues increased approximately 15% in 2010.
Consolidated average price per unit case decreased 2.6%, reaching Ps. 39.89 in 2010 as compared to Ps. 40.95 in 2009, reflecting the devaluation in the Venezuelan bolivar.
Consolidated total sales volume reached 2,499.5 million unit cases in 2010, compared to 2,428.6 million unit cases in 2009, an increase of 2.9%. Volume growth resulted largely from increases in sparkling beverages, which accounted for approximately 70% of incremental volumes, mainly driven by the Coca-Cola brand. The still beverage category, mainly driven by the Jugos del Valle line of business in Coca-Cola FEMSA’s key operations, contributed with less than 20% of the incremental volumes and the bottled water category represented the balance. Excluding the acquisitions of Brisa, total sales volume increased 2.1% to reach 2,479.6 million unit cases.
Gross Profit
Cost of sales increased 1.1% to Ps. 55,534 million in 2010 compared to Ps. 54,952 million in 2009, as a result of increases in the cost of sweeteners of our operations, which were partially offset by the appreciation of the Brazilian real, the Colombian peso and the Mexican peso as applied to Coca-Cola FEMSA’s U.S. dollar-denominated raw material costs. Gross profit increased 0.2% to Ps. 47,922 million in 2010, as compared to 2009, despite the devaluation of the Venezuelan bolivar; Coca-Cola FEMSA’s gross margin decreased 0.2 percentage points to 46.3% in 2010.
Operating Expenses
Operating expenses decreased 3.6% to Ps. 30,843 million in 2010. As a percentage of sales, operating expenses decreased to 29.8% in 2010 from 31.1% in 2009.
Income from Operations
Income from operations increased 7.9% to Ps. 17,079 million in 2010, as compared to Ps. 15,835 million in 2009 driven by Coca-Cola FEMSA’s Mercosur and Latincentro divisions. Operating margin was 16.5% in 2010, an expansion of 1.1 percentage points as compared to 2009.
FEMSA Comercio
Total Revenues
FEMSA Comercio total revenues increased 16.3% to Ps. 62,259 million in 2010 compared to Ps. 53,549 million in 2009, primarily as a result of the opening of 1,092 net new stores during 2010, combined with an average increase of same-store sales of 5.2%. As of December 31, 2010, there were a total of 8,409 stores in Mexico and 17 stores in Colombia. FEMSA Comercio same-store sales increased an average of 5.2% compared to 2009, driven by a 3.9% increase in store traffic and 1.3% in average ticket. As was the case in 2009, the same-store sales, ticket and traffic dynamics continued to reflect the effects from the continued mix shift from physical prepaid wireless air-time cards to the sale of electronic air-time, for which only the margin is recorded, rather than the full amount of the electronic recharge.
Gross Profit
Cost of sales increased 15.1% to Ps. 41,220 million in 2010, below total revenue growth, compared with Ps. 35,825 million in 2009. As a result, gross profit reached Ps. 21,039 million in 2010, which represented an 18.7% increase from 2009. Gross margin expanded 0.7 percentage points to reach 33.8% of total revenues. This increase reflects a positive mix shift due to (i) the growth of higher margin categories, (ii) a more effective collaboration and execution with FEMSA Comercio’s key supplier partners combined with a more efficient use of promotion-related marketing resources, and (iii) to a lesser extent, the continued mix shift towards electronic air-time recharges as described above.
Income from Operations
Operating expenses increased 19.4% to Ps. 15,839 million in 2010 compared with Ps. 13,267 million in 2009, largely driven by the growing number of stores as well as by incremental expenses such as (i) higher utility tariffs at the store level and (ii) the strengthening of FEMSA Comercio’s organizational structure, mainly IT-related, which was deferred in 2009 in response to the challenging economic environment that prevailed in Mexico at the time.
Administrative expenses increased 23.7% to Ps. 1,186 million in 2010, compared with Ps. 959 million in 2009, however, as a percentage of sales remained stable at 1.9%. Total
Selling expenses increased 19.1% to Ps. 14,653 in 2010 compared with Ps. 12,308 million in 2009. Income from operations increased 16.7% to Ps. 5,200 million in 2010 compared with Ps. 4,457 million in 2009, resulting in an operating margin expansion of 10 basis points to 8.4% as a percentage of total revenues atfor the year, compared with 8.3% in 2009.
FEMSA Consolidated—Net Income
Other Expenses
Other expenses include employee profit sharing, which we refer to as PTU, impairment of long-lived assets, contingencies, as well as their subsequent interest and penalties, severance payments derived from restructuring programs and all other non-recurring expenses related to activities different from the main activities of the Company and that are not recognized as part of the comprehensive financing result. During 2010, other expenses contracted to Ps. 282 million from Ps. 1,877 million in 2009.
Comprehensive Financing Result
Comprehensive financing result decreased 18.0% in 2010 to Ps. 2,153 million, reflecting an improvement over the low comparison base of 2009, driven by lower interest expenses.
Income Taxes
Our accounting provision for income taxes in 2010 was Ps. 5,671 million compared to Ps. 4,959 million in 2009, resulting in an effective tax rate of 24.0% in 2010 as compared with 29.6% in 2009 as the inclusion of the participation in Heineken’s 2010 net income is shown net of taxes.
Consolidated Net Income before Discontinued Operations
Net income from continuing operations increased 52.2% to Ps. 17,961 million in 2010 compared to Ps. 11,799 million in 2009. These results were driven by the combination of (i) the inclusion of FEMSA’s 20% participation in the last eight months of Heineken’s 2010 net income, (ii) growth in income from operations, and (iii) a reduction in the other expenses line.
Consolidated Net Income
Net consolidated income reached Ps. 45,290 million in 2010 compared to Ps. 15,082 million in 2009, driven by (i) the one-time Heineken transaction-related gain and (ii) a double-digit increase in FEMSA’s net income from continuing operations.
Net controlling interest amounted to Ps. 40,251 million in 2010 compared to Ps. 9,908 million in 2009. Net controlling interest in 2010 per FEMSA Unit(1)was Ps. 11.25 (US$ 9.08 per ADS).
Results from operations for the Year Ended December 31, 2009 Compared to the Year Ended December 31, 2008
FEMSA Consolidated
Under Mexican FRS, we reclassified our financial statements to reflect FEMSA Cerveza as a discontinued operation.
Total Revenues
FEMSA’s consolidated total revenues increased 4.3% over 200619.8% to Ps. 39,566160,251 million in 2009 compared to Ps. 133,808 million in 2008. Our beverage and retail businesses contributed positively to this revenue growth. Coca-Cola FEMSA’s total revenues increased 23.9% to Ps. 102,767 million, driven by a 13.9% higher volumes that more than offset the slight decline in average price per hectoliterunit case and a volume growth of 8.3%, from 2,242.8 million unit cases in real terms and2008 to 2,428.6 million unit cases in 2009. FEMSA Comercio’s revenues increased 13.6% to Ps. 53,549 million, mainly driven by the declineopening of 960 net new stores combined with an average increase of 1.3% in lower third-party packaging revenues as our internal demand for packaging increased as opposed to third-partysame-store sales.
Gross Profit
Consolidated cost of sales increased 8.8%18.4% to Ps. 79,80192,313 million in 20072009 compared to Ps. 73,36677,990 million in 2006.2008. Approximately 53.8%80% of this increase resultedcame from FEMSA Comercio and its rapid pace of store expansion. Coca-Cola FEMSA accounted for 33.2%as a result of thiscost pressures due to (i) the devaluation of local currencies in Coca-Cola FEMSA’s main operations as applied to its dollar-denominated raw material costs, (ii) the higher cost of sweetener across its operations, (iii) the integration of REMIL and (iv) the third and final stage of the scheduled Coca-Cola Company concentrate price increase and FEMSA Cerveza accounted for 21.8%.announced in 2006 in Mexico.
Consolidated gross profit increased 8.0%21.7% to Ps. 67,75567,938 million in 20072009 compared to Ps. 62,75455,818 million in 20062008 due to gross profit increases in all of our beverage and retail operations. Gross margin decreased 0.2expanded by 0.7 percentage points, as compared to 2006, from 46.1%41.7% of consolidated total revenues in 20062008 to 45.9%42.4% in 2007.2009. Gross margin improvementsimprovement at FEMSA Comercio, more than offset raw-material cost pressures at Coca-Cola FEMSA and FEMSA Comercio partially offset raw material pressure at FEMSA Cerveza, resulting in a slight gross margin decrease.FEMSA.
Income from Operations
Consolidated operating expenses increased 8.8%21.7% to Ps. 48,18646,808 million in 20072009 compared to Ps. 44,28738,469 million in 2006.2008. Approximately 48%80% of this increase was driven byresulted from additional operating expenses at Coca-Cola FEMSA due to higher labor costs and increased marketing expenses in allcertain of Coca-Cola FEMSA’s operations, especially in Venezuela, Brazil and Mexico, which togetherour divisions. FEMSA Comercio accounted for 75.6% of the incremental expense.balance, resulting from accelerated store expansion. As a percentage of total revenues, consolidated operating expenses remained stable at 32.6%expanded from 28.7% in 2007 compared with 32.5%2008 to 29.2% in 2006.2009.
Consolidated administrative expenses increased 2.4%24.5% to Ps. 9,1917,835 million in 20072009 compared to Ps. 8,9736,292 million in 2006. However, as2008. As a percentage of total revenues, consolidated administrative expenses decreased 0.4 percentage points to 6.2%remained stable at 4.9% in 2007
| 1 | FEMSA Units consist of FEMSA BD Units and FEMSA B Units. Each FEMSA BD Unit is comprised of one Series B share, two Series D-B shares and two Series D-L shares. Each FEMSA B Unit is comprised of five Series B shares. The number of FEMSA Units outstanding as of December 31, 2010 was 3,578,226,270, which is equivalent to the total number of FEMSA shares outstanding as of the same date, divided by five. |
2009 compared with 6.6%4.7% in 20062008, due to operating leverage driven by higher revenues achieved in all of FEMSA’s operations.
Consolidated selling expenses increased 10.4%21.1% to Ps. 38,99538,973 million in 20072009 as compared to Ps. 35,31432,177 million in 2006.2008. Approximately 45.2%80% of this increase was dueattributable to Coca-Cola FEMSA and 31.5% to FEMSA Comercio’s rapid rate of growth.Comercio represented the balance. As a percentage of total revenues, selling expenses increased 0.50.3 percentage points from to 26.4%24.0% in 2007 compared2008 to 25.9%24.3% in 2006.
We incur various expenses related to the distribution of our products that are accounted for in our selling expenses. During 2007 and 2006, our distribution costs amounted to Ps. 10,601 million and Ps. 9,921 million, respectively. The exclusion of these charges from our cost of sales may result in the amounts reported as gross profit not being comparable to other companies that may include all expenses related to their distribution network in cost of sales when calculating gross profit or an equivalent measure.2009.
Consolidated income from operations increased 6.0%21.8% to Ps. 19,56921,130 million in 20072009 as compared to Ps. 18,46717,349 million in 2006,2008. This increase was driven by the results from both of Coca-Cola FEMSA and FEMSA Comercio, which more than offset the decrease at FEMSA Cerveza.
our businesses. Consolidated operating margin, decreased 0.3as a percentage points from 2006 levels to 13.3% of consolidated total revenues, increased 0.2 percentage points from 2008 levels, to 13.2% in 2007. The decrease in operating2009. Gross margin was primarily attributable to a margin contractionimprovement at FEMSA Cerveza driven by higherComercio offset raw material prices and operating expenses andpressures at the increased contribution of FEMSA Comercio, which has a lower margin than our corebeverages operations.
Some of our subsidiaries pay management fees to us in consideration for corporate services providedwe provide to them. These fees are recorded as administrative expenses in the respective business segments. Our subsidiaries’ payments of management fees are eliminated in consolidation and, therefore, have no effect on our consolidated operating expenses.
Coca-Cola FEMSA
Total Revenues
Coca-Cola FEMSA total revenues increased 8.1%23.9% to Ps. 69,251102,767 million in 2007,2009, compared to Ps. 64,04682,976 million in 2006 with Mexico, Brazil and Venezuela accounting for2008 as a result of revenue growth in all of its divisions. Organic growth across Coca-Cola FEMSA’s operations contributed more than 75% of this growth.
Consolidated total sales volume reached 2,120.8 million unit casesincremental revenue. The acquisition of REMIL in 2007, compared to 1,998.1 million unit cases in 2006, an increase of 6.1%. Sparkling beverage volume, which we previously referred to as sparkling beverages, increased 5.7% as a result of sales volume increases in all of our territories. Sparkling beverage volume growth was mainly driven by the Coca-Cola brand, which accounted for close to 65% of incremental total volume. A strong marketing campaign associated with the launching of Coca-Cola Zero in Mexico, Brazil and ArgentinaBrisa in Colombia together contributed to slightly less than 15% of this growth.growth, while a positive exchange rate translation effect resulting from the depreciation of the peso against its operations’ local currencies represented the balance.
ConsolidatedCoca-Cola FEMSA’s average price per unit case increased 1.9% in real terms,13.9%, reaching Ps. 32.1540.95 in 20072009 as compared to Ps. 31.5635.94 in 2006. Average price increases in most of our territories, partially offset lower2008, reflecting higher average prices in Mexico.all of Coca-Cola FEMSA’s territories resulting from selective price increases implemented during the year across geographies.
Gross Profit
Cost ofCoca-Cola FEMSA’s total sales volume increased 8.3% to 2,428.6 million unit cases in absolute terms increased 6.3% to Ps. 35,881 million in 20072009, compared to Ps. 33,7452,242.8 million unit cases in 2006. Gross profit2008. Excluding the acquisitions of REMIL andBrisa, total sales volume increased 10.1%5.1% to Ps. 33,370reach 2,357.0 million unit cases. Organic volume growth resulted from increases in 2007, as compared to the previous year,sparkling beverages, which accounted for approximately 45% of incremental volumes, mainly driven by incremental revenues across all of our territories and higher fixed-cost absorption. Gross margin increased to 48.2% in 2007 from 47.3% in 2006, driven by revenue growth, which more than compensated for higher sweetener costs in Mexico.
Cost of sales includes raw materials, in particular concentrate and sweeteners, packaging materials, depreciation expenses attributable to our production facilities, wages and other employment expenses associated with the labor force employed at our production facilities, as well as certain overhead expenses. Concentrate prices are determined as a percentage of the retail price of our products in local currency net of applicable taxes.
Income from operationsCoca-Cola
Operating expenses in absolute terms increased 9.3% year over year to Ps. 21,923 million, mainly as a result of (1) salary increases ahead of inflation in some of the countries in which we operate, (2) higher operating expenses due to increases in maintenance expenses and freight costs in some territories and (3) higher marketing investment in our major operations in connection with several initiatives intended to reinforce our presence in the market and build brand equity. As a percentage of total revenues, operating expenses increased from 31.3% in 2006 to 31.7% in 2007.
Income from operations increased 11.7% to Ps. 11,447 million in 2007, as compared to Ps. 10,251 million in 2006. Brazil, Colombia and Venezuela accounted for the majority of the incremental growth and more than offset a slight operating income decline in Mexico. Operating margin increased 0.5 percentage points to reach 16.5% of total revenues in 2007, brand. The still beverage category, mainly driven by the improved operating leverage that resulted from higher revenues.
FEMSA Cerveza
Total Revenues
FEMSA Cerveza total revenues increased 4.3% to Ps. 39,566 millionJugos del Valle line of business in 2007 as compared to Ps. 37,919 million in 2006. Beer sales increased 5.4% to Ps. 36,457 million in 2007 compared to Ps. 34,602 million in 2006 and represent 92.1%its main operations, contributed with less than 45% of total revenues in 2007. Total revenue growth was primarily driven by higherthe incremental volumes which more than offset the decline in lower third-party packaging revenues driven by a higher percentage of our packaging production going to internal demand as opposed to third-party sales; and the 0.6% decline in average price per hectoliter in real terms, resulting from lower average price per hectoliter in all our operations. Mexico beer revenuesbottled water category represented 68.8% of total revenues in 2007 compared to 69.2% in 2006. Brazil beer revenues represented 14.9% of total revenues in 2007, up from 14.2% in 2006. Export beer revenues reached 8.4% of total revenues in 2007, up from 7.9% in 2006.
Mexico sales volume increased 3.9% to 26.962 million hectoliters in 2007, despite strong comparable growth figures in 2006 and adverse weather conditions mainly in the first and third quarters of 2007. Growth was driven by our Tecate, Sol and Indio brand families throughout the country. Mexico price per hectoliter remained almost flat in real terms at Ps. 1,009.4 in 2007.
Brazil sales volume increased 9.6% to 9.795 million hectoliters in 2007 compared to 8.935 million hectoliters in 2006, outpacing the growth of the Brazilian beer industry. This growth reflects positive trends for our brand portfolio that continue to develop according to FEMSA Cerveza’s plan for these operations. Brazil price per hectoliter decreased 0.2% over 2006 in real terms to Ps. 602.7 in 2007.
Export sales volumes increased 13.2% compared to 2006 reaching 3.183 million hectoliters compared to 2.811 million hectoliters in 2006, primarily driven by increased demand for our Dos Equis and Tecate brands in the U.S. and for our Sol brand in other key markets. Export price per hectoliter decreased 1.0% compared to 2006 to Ps. 1,048.9 in 2007.balance.
Gross Profit
Cost of sales increased 8.5%25.2% to Ps. 17,88954,952 million in 20072009 compared to Ps. 16,48743,895 million in 2008, as a result of cost pressures due to (i) the devaluation of local currencies in Coca-Cola FEMSA’s main operations in Mexico, Colombia and Brazil, as applied to its U.S. dollar-denominated raw material costs, (ii) the higher cost of sweetener across its operations, (iii) the integration of REMIL and (iv) the third and final stage of the scheduled Coca-Cola Company concentrate price increase announced in 2006 mainlyin Mexico. All of these items were partially offset by lower resin costs. Gross profit increased 22.3% to Ps. 47,815 million in 2009, as compared to 2008, driven by 5.9% total volumegross profit growth higher raw material prices, particularly aluminum and grains, and incremental volumes comingacross all of Coca-Cola FEMSA’s divisions, however Coca-Cola FEMSA’s gross margin decreased 0.6 percentage points to 46.5% in 2009.
Income from non-returnable presentations. Gross profit reachedOperations
Operating expenses increased 26.0% to Ps. 21,67731,980 million in 2007 an increase2009, mainly as a result of 1.1%(i) higher labor costs in Venezuela, (ii) increased marketing investments in the Mexico division, (iii) the integration of REMIL in Brazil and (iv) increased marketing expenses in the Latincentro division, mainly due to the integration of theBrisaportfolio in Colombia and the continued expansion of the Jugos del Valle line of products in Colombia and Central America. As a percentage of sales, operating expenses increased to 31.1% in 2009 from 30.6% in 2008.
Income from operations increased 15.6% to Ps. 15,835 million in 2009, as compared to Ps. 21,43213,695 million in 2006. Gross2008. Increases in operating income from the Latincentro division, including Venezuela, accounted for approximately 50% of this growth, while operating income growth in the Mercosur division accounted for more than 40% of incremental operating income. Operating margin decreased 1.7 percentagewas 15.4% in 2009, a decline of 110 basis points from 56.5% in 2006 to 54.8% in 2007.
Income from operations
Operating expenses increased 6.3% to Ps. 16,273 million in 2007 compared to Ps. 15,312 million in 2006. Administrative expenses slightly increased 0.8% to Ps. 4,316 million in 2007 compared to Ps. 4,283 million in 2006. Selling expenses increased 8.4% to Ps. 11,957 million in 2007 as compared to Ps. 11,029 million in 2006, mainly due to continued investment in channel development and brand-building activities for Sol and Tecate in Mexico as well as for Dos Equis and Tecate in the U.S. and stepped-up marketing activities in Brazil in connection with our Sol and Kaiser brands. Income from operations decreased 11.7% to Ps. 5,404 million in 2007, to 13.7% of consolidated total revenues.2008.
FEMSA Comercio
Total Revenues
FEMSA Comercio total revenues increased 14.3%13.6% to Ps. 42,10353,549 million in 20072009 compared to Ps. 36,83547,146 million in 2006,2008, primarily as a result of the opening of 716960 net new OXXO stores during 2007 and2009, combined with an average increase of same-store sales growth.of 1.3%. As of December 31, 2007,2009, there were a total of 5,563 OXXO7,329 stores in Mexico. This is OXXO’s 12th consecutive year of increasing the number of new store
openings. OXXOMexico and 5 stores in Colombia. FEMSA Comercio same-store sales increased onan average 3.3%of 1.3% compared to 2006, due to2008, driven by a 4.4%3.3% increase in store traffic, which was driven by broader mix of products and services, which more than offset a decreaseslight reduction of 1.1%1.6% in average customer ticket. TrafficAs was the case in 2008, the same-store sales, ticket and tickettraffic dynamics continued to reflect the introductioneffects from the continued mix shift from physical prepaid wireless air-time cards to the sale of electronic air-time, sales for customers of wireless telephone carriers, launched in recent months across the country, which drive incremental traffic to the store and for which only the margin is recorded, notrather than the total revenues coming fromfull amount of the air-timeelectronic recharge. As 2009 progressed, this effect diminished.
Gross Profit
Cost of sales increased 12.9%10.0% to Ps. 30,30135,825 million in 2007,2009, below total revenue growth, compared with Ps. 26,83932,565 million in 2006.2008. As a result, gross profit reached Ps. 11,80217,724 million in 2007,2009, which represented an 18.1%a 21.6% increase from 2006.2008. Gross margin expanded 0.92.2 percentage points to reach 28.0%33.1% of total revenues. This improvement was driven by better pricing strategies, improved commercial termsincrease reflects more effective collaboration and execution with our key supplier partners, as well as bycombined with a more efficient use of promotion-related marketing resources and a positive mix shift due to the growth coming fromof higher-margin categories such as fast food, coffee and, alternative beverages.to a lesser extent, the continued shift towards electronic air-time recharges described above.
Income from operationsOperations
Operating expenses increased 13.9%15.3% to Ps. 9,48713,267 million in 20072009 compared with Ps. 8,33211,504 million in 2006. 2008, largely driven by the growing number of stores, and partially offset by broad expense-containment initiatives at the store level and by scale-driven efficiencies.
Administrative expenses decreased 0.4%increased 15.1% to Ps. 751959 million in 20072009, compared with Ps. 754833 million in 2006 primarily as our initial capitalized investments in the Oracle ERP system have been fully amortized, and due to a lesser extent to broad expense-containment initiatives. Selling expenses2008, however, as a percentage of total revenuessales remained stable at 20.7%1.8%.
Selling expenses increased 15.3% to Ps. 12,308 in 2007, an increase of 15.3% in 20072009 compared with Ps. 7,57810,671 million in 2006. 2008.
Income from operations increased 39.1%44.8% to Ps. 2,3154,457 million in 20072009 compared with Ps. 1,6643,077 million in 2006,2008, resulting in an operating margin expansion of 1.01.8 percentage pointpoints to 5.5%8.3% as a percentage of total revenues for the year, compared with 4.5%6.5% in 2006.2008. This all-time high operating margin expansion was driven by gross margin expansion, and by better fixed-expense absorption resulting from higher revenues.which more than offset the increase in operating expenses.
FEMSA Consolidated—Net Income
IntegralOther Expenses
Other expenses include employee profit sharing, which we refer to as PTU, impairment of long-lived assets, contingencies, as well as their subsequent interest and penalties, severance payments derived from restructuring programs and all other non-recurring expenses related to activities different from the main activities of the Company and that are not recognized as part of the comprehensive financing result. During 2009, other expenses decreased to Ps. 1,877 million from Ps. 2,019 million in 2008.
Comprehensive Financing Result of Financing
Net interest expense reached Ps. 3,7854,011 million in 20072009 compared with Ps. 3,5073,823 million in 2006 mainly2008. Foreign exchange recorded a loss of Ps. 431 million in 2009 from a loss of Ps. 1,431 million in 2008, reflecting an important improvement due to the significant loss reported in 2008, driven by higher interest expense derived from an increaselower foreign exchange losses in average total debt during2009 due to the year. Foreign exchange (loss/gain) amountedlower depreciation of local currencies in our markets against the U.S. dollar. Additionally, the monetary position represented a lower gain of Ps. 486 million in 2009 compared to Ps. 657 million in 2008, due to a lower liability monetary position in 2009 (monetary liabilities less monetary assets) and a lower inflation rate in countries in which inflationary adjustments are applied.
The market value of the ineffective portion of our derivative financial instruments reflects a shift to a gain of Ps. 691124 million in 2007 compared with2009 from a loss of Ps. 217950 million in 2006. This gain resulted2008, reflecting an improvement due to appreciation of the Mexican peso and the Brazilian reais as appliedsignificant loss reported in 2008, driven by losses in certain derivative instruments that do not meet hedging criteria for accounting purposes, due to mark-to-market recognition in our U.S. dollar-denominated debt positiondollar cross-swap.
Comprehensive financing result decreased 43.9% in 2007.
Monetary position amounted to a gain of Ps. 1,639 million in 2007 compared with a gain of Ps. 1,488 million in 2006. This gain in 2007 represents the positive effects of inflation on monetary items on our increased liabilities recorded in 2007.
Other Expenses
Beginning in 2007, pursuant to Mexican Financial Reporting Standards, we recorded employee profit sharing as part of “other expenses” instead of presenting it within the taxes line. For comparison purposes, we also reflect this change in the information presented for prior periods. Our employee profit sharing expenses amounted2009 to Ps. 5532,627 million, reflecting an important improvement due to the significant loss reported in 2007 compared to Ps. 530 million in 2006. Excluding employee profit sharing, other expenses, net decreased 33.6% to Ps. 744 million in 2007 from Ps. 1,120 million in 2006,2008, driven by extraordinary items recorded for strategic projects, mainly at Coca-Cola FEMSA,lower foreign exchange losses in 2006.2009 due to the lower depreciation of local currencies in our markets against the U.S. dollar and a shift to gains in certain derivative instruments during the year, as mentioned above.
Taxes
TheOur accounting provision for income taxes in 20072009 was Ps. 4,9504,959 million compared to Ps. 4,608 million in 2006,3,108 resulting in an effective tax rate of 29.3% compared to 31.8%29.6% in 2006, mainly driven by a reduction in the statutory income tax rate in Mexico from 29% in 2006 to 28% in 2007 and less non-deductible expenses.
Net Income
Net income increased 21.1% to Ps. 11,936 million in 2007 compared to Ps. 9,860 million in 2006, driven by income from operations growth and a shift from a loss in foreign exchange in 2006 to a gain in 2007.
Net majority income amounted to Ps. 8,511 million in 2007 compared to Ps. 7,127 million in 2006, an increase of 19.4%. Net majority income in 2007 per FEMSA Unit was Ps. 2.38 ($2.18 per ADS).
Results of Operations for Year Ended December 31, 2006 Compared to Year Ended December 31, 2005
FEMSA Consolidated
In 2006, FEMSA Cerveza acquired 99.83% of the Brazilian brewer, Cervejarias Kaiser, or Kaiser, through a series of transactions with Molson Coors and Heineken N.V. The following discussion of our consolidated results for 2006 fully reflects the inclusion of the results for Brazilian beer operations in 2006. However, because we did not own Brazilian beer operations prior to this period, our consolidated results and FEMSA Cerveza��s results for 2006 are not fully comparable to the prior period.
Total Revenues
Consolidated total revenues increased 13.9% to Ps. 136,120 million in 2006 compared to Ps. 119,462 million in 2005. All of FEMSA’s operations—soft drinks, beer, and retail—contributed to this revenue growth. FEMSA Cerveza was the largest contributor to consolidated total revenue growth in 2006, representing approximately 51.1% of the increase, due to the inclusion of its newly acquired Brazilian beer operations and a 9.3% increase in Mexico beer sales, which reached Ps. 26,227 million in 2006. The remaining growth came primarily from FEMSA Comercio and Coca-Cola FEMSA. FEMSA Comercio’s total revenues increased 18.7% to Ps. 36,835 million, due in large part to the 706 net new stores opened during the year. Coca-Cola FEMSA’s total revenues increased 7.4% to Ps. 64,046 million, mainly due to increased prices and strong volume growth throughout most of its nine countries of operation. This increase was partially offset by Mexico’s continued pricing pressure, which was partly compensated for by price improvements in the other areas.
Gross Profit
Consolidated cost of sales increased 15.1 % to Ps. 73,366 million in 2006 compared to Ps. 63,721 million in 2005. Approximately 79% of this increase resulted from FEMSA Comercio and its OXXO store expansion, and to FEMSA Cerveza, which increased its costs of sales due to the acquisition of Brazilian beer operations.
Consolidated gross profit increased 12.6% to Ps. 62,754 million in 2006 compared to Ps. 55,741 million in 2005. Approximately 52% of this increase resulted from FEMSA Cerveza, due to the inclusion of its newly acquired Brazilian operations. Gross margin decreased 0.6 percentage points to 46.1% of consolidated total revenues in 2006, compared to 46.7% of consolidated total revenues in 2005. The slight decline in consolidated gross margin from 2005 levels resulted from the inclusion of FEMSA Cerveza’s lower margin beer operations in Brazil, and the increased contribution of FEMSA Comercio in our consolidated financial results, which has lower gross margin relative to our other operations, typical of convenience and retail store formats.
Income from Operations
Consolidated operating expenses increased 15.6% to Ps. 44,287 million in 2006 compared to Ps. 38,302 million in 2005. Approximately 56% of this increase was due to FEMSA Cerveza, which increased expenses year-over-year due to the inclusion of its newly acquired Brazilian operations and increased selling expenses in the Mexican market, primarily for advertising and market-related initiatives. As a percentage of total revenues, consolidated operating expenses increase 0.5 percentage points to reach 32.5% in 2006 compared with 32.0% in 2005.
Consolidated administrative expenses increased 12.8% to Ps. 8,973 million in 2006 compared to Ps. 7,957 million in 2005. As a percentage of total revenues, consolidated administrative expenses decreased 0.1 percentage points to reach 6.6% in 2006 compared with 6.7% in 2005. The lower level of administrative expenses relative to total revenue growth resulted from a 0.1% reduction in administrative expenses at Coca-Cola FEMSA and stable administrative expenses as percentage of total revenues at FEMSA Cerveza (excluding Brazil) and FEMSA Comercio.
Consolidated selling expenses increased 16.4% to Ps. 35,314 million in 2006 as compared to Ps. 30,345 million in 2005. Approximately 56% of this increase was due to FEMSA Cerveza and the inclusion of its newly acquired Brazilian operations, and 27% to FEMSA Comercio’s rapid rate of growth. As a percentage of total beer revenues, selling expenses increased 0.6 percentage points to reach 25.9% in 2006 compared to 25.3% in 2005.
We incur various expenses related to the distribution of our products that are accounted for in our selling expenses. During 2006 and 2005, our distribution costs amounted to Ps. 9,921 million and Ps. 9,273 million, respectively. The exclusion of these charges from our cost of sales may result in the amounts reported as gross profit not being comparable to other companies that may include all expenses related to their distribution network in cost of sales when calculating gross profit or an equivalent measure.
Consolidated income from operations increased 5.9% to Ps. 18,467 million in 2006 as compared to Ps. 17,439 million in 2005. Over one-third of this increase resulted from FEMSA Cerveza and its top-line growth combined with gross margin improvements that offset increased operating expenses and the negative impact from the inclusion of the newly acquired Brazilian operations. The remaining amount is attributable to FEMSA Comercio and Coca-Cola FEMSA, representing approximately 30% and 27% respectively. Consolidated operating margin decreased 1.0 percentage point from 2005 levels to 13.6% of consolidated total revenues in 2006. The decrease in operating margin was primarily attributable to the inclusion of FEMSA Cerveza’s Brazilian beer operations, which generated a loss of Ps. 94 million due partly to increased marketing expenses for the brand Kaiser and in part to the launch of the brand Sol, to a margin contraction at our key beverage operations, and to the increased contribution of the OXXO retail chain, which has the lowest operating margin relative to our other core beverage operations.
Some of our subsidiaries pay management fees to us in consideration for corporate services provided to them. These fees are recorded as administrative expenses in the respective business segments. Our subsidiaries’ payments of management fees are eliminated in consolidation and, therefore, have no effect on our consolidated operating expenses.
Coca-Cola FEMSA
Total Revenues
Coca-Cola FEMSA’s total revenues increased 7.4% to Ps. 64,046 million in 2006 compared to Ps. 59,642 million in 2005. Net sales increased 7.8% to Ps. 63,820 million in 2006 compared to Ps. 59,181 million in 2005 and represented 99.6% of total revenues in 2006. Total revenue growth primarily resulted from Brazil, Mexico and Venezuela, accounting for approximately 36%, 18% and 17%of the incremental total revenues, respectively.
Sales volume reached 1,998 million unit cases in 2006 compared to 1,889 million unit cases in 2005, which represents an increase of 5.8%, mainly driven by a 6.4% volume growth of the Coca-Cola brand, which accounted for almost 70% of incremental volume. Sales volume growth in Mexico and Brazil, accounted for over 57% of our incremental volume. Sparkling beverage sales volume grew 5.8% to 1,694.7 million unit cases, driven by incremental volume across all of our territories.
Average price per unit case (calculated by dividing net sales by total sales volume excluding beer in Brazil) remained flat in real terms at Ps. 31.56 (US$ 2.61) during 2006, due to price increases in all our territories except for Mexico and Argentina.
Gross Profit
Cost of sales increased 10.4% to Ps. 33,745 million in 2006 compared to Ps. 30,558 million in 2005. As a percentage of sales, cost of sales increased 1.5 percentage points to reach 52.7% of total revenues in 2006, mainly due to higher sweetener costs in all of our operations, combined with higher plastic bottle prices in some of our territories and higher packaging costs due to a packaging mix shift towards non-returnable presentations.
Gross profit increased 4.2% to Ps.30,301 million in 2006 compared to Ps. 29,084 million in 2005, Brazil and Mexico accounted for over 45% of this growth. Gross margin decreased 1.5 percentage points due to higher cost per unit case in all of our territories, except Mexico and Argentina.
Income from Operations
Operating expenses increased 4.9% to Ps. 20,050 million in 2006 compared to Ps. 19,111 million in 2005 mainly as a result of salary increases ahead of inflation in some of the countries in which we operate, higher operating expenses due to increases in maintenance expenses and freight costs in some territories, and higher marketing investment in our major operations in connection with several initiatives intended to reinforce our presence in the market and to build brand equity. As a percentage of total revenues, operating expenses declined from 32.0% in 2005 to 31.3% in 2006 due to higher fixed-cost absorption, driven by incremental volumes and higher average price per unit case. Administrative expenses increased 5.7% to Ps. 3,540 million in 2006 from Ps. 3,348 million in 2005. Selling expenses increased 4.7% to Ps. 16,510 million in 2006 compared to Ps. 15,763 million in 2005. At 25.8% of total revenues, selling expenses decreased 0.7 percentage points from 2005 levels.
After conducting a thorough analysis, performed by a third party, of the current conditions and expected useful life of our cooler inventories in our territories in Mexico, we decided to modify the useful life of Coca-Cola FEMSA’s coolers in Mexico from five to seven years. We made this decision based on Coca-Cola FEMSA’s equipment maintenance policy and our ability to better manage our cooler platform in the marketplace. This change in estimate, which was accounted for prospectively reduced our amortization expenses by Ps. 132 million in 2006, and increased our operating income by a similar amount.
Income from operations increased 2.8% to Ps. 10,251 million in 2006 compared to Ps. 9,973 million in 2005 as a result of higher fixed-cost absorption due to higher revenues. Growth in operating income in Colombia, Central America and Brazil more than compensated for flat operating income in Mexico and a decline in Venezuela and Argentina. Operating margin decreased by 0.7 percentage points to 16.0% in 2006 compared to 16.7% in 2005, mainly due to higher cost per unit case.
FEMSA Cerveza
Total Revenues
FEMSA Cerveza total revenues increased 27.3% to Ps. 37,919 million in 2006 as compared to Ps. 29,768 million in 2005. Net sales, which include beer and packaging sales, represented 99.4% of total revenues. This growth was primarily due to the inclusion of FEMSA Cerveza’s Brazilian operations, which represented approximately 66% of the increase in total revenues. The remaining growth came from a 9.6% increase in export beer sales, a 9.3% increase in Mexican beer sales and a 6.5% increase in packaging sales.
Mexico
Mexico sales volume increased 5.6% to 25.951 million hectoliters in 2006 compared to 24.580 million hectoliters in 2005. The increased product innovation, broader availability of our beers, successful execution at the point of sale, revenue management initiatives and continued strength in consumer demand, produced this top-line growth. Most notable was the growth of ourTecate LightandSol brands, which through focused initiatives have shown improved brand equity and health indicators.
Mexico price per hectoliter increased 3.5% to Ps. 1,010.6 in 2006 compared to Ps. 976.2 in 2005. This strength was driven by (1) the higher price realized from volume brought under direct distribution earlier in the year, (2) a positive mix effect and (3) revenue management and other initiatives aimed at optimizing price points per stock keeping unit and channel while selectively adjusting the margin offered to the retailer.
Brazil
Brazil sales volume was 8.935 million hectoliters in 2006. Brazil price per hectoliter was Ps. 604.1 in 2006.
Export
Export sales volume increased 15.3% to 2.811 million hectoliters in 2006 compared to 2.438 million hectoliters in 2005. This result was slightly above our expectations, in part due to the contribution of Heineken USA, which enabled us to outpace import category growth in the United States for a second year in a row.
Export price per hectoliter decreased 5.0% to Ps. 1,059.0 in 2006 compared to Ps. 1,114.5 in 2005. The decrease in export price reflects a negative foreign exchange rate effect due to the year-on-year real strengthening of the peso, and to a lesser extent due to presentation and channel mix effects as your 24-ounce presentation ofTecate continued to grow in the off-premise trade.
Gross Profit
Cost of sales increased 37.4% to Ps. 16,487 million in 2006 compared to Ps. 11,998 million in 2005. As a percentage of total revenues, cost of sales increased 3.2 percentage points from 2005. The increase relative to total revenue growth resulted from the inclusion of Brazilian beer operations, which has a lower gross margin compared to Mexico and exports. Excluding Brazilian beer operations, as a percentage of revenues, cost of sales would have decreased 0.5 percentage points from 2005.
Gross profit reached Ps.21,432 million in 2006 compared to Ps. 17,770 million in 2005, resulting in a gross margin of 56.5% as compared to 59.7%. The 3.2 percentage point decline from 2005 resulted from the inclusion of Brazilian beer operations. Excluding the Brazilian beer operations, the gross margin would have improved 0.5 percentage points from 2005 due to the benefits of volume-driven fixed cost absorption and increased efficiency compensated for upward pricing pressure from raw materials, particularly aluminum.
Income from Operations
Operating expenses increased 27.9% to Ps. 15,312 million in 2006 compared to Ps. 11,970 million in 2005. Administrative expenses increased 15.1% to Ps. 4,283 million in 2006 compared to Ps. 3,720 million in 2005. Selling expenses increased 33.7% to Ps. 11,029 million in 20062009 as compared with Ps. 8,250 million28.9% in 2005, from which 63% corresponds to the inclusion of Brazilian beer operations and the remaining 37% reflects changes in the distribution network, enhancements to our infrastructure and compliance-related activities. Approximately 63% of the increase in selling expenses resulted from the inclusion of the Brazilian beer operations, with most of remaining increase resulting from increased selling expenses in the domestic market due to the expense structure of third-party volume brought into direct distribution in the year, incremental services provided to retailers whose margins we adjust, increased activation at the point of sale and a strengthened commercial sales structure.
Income from operations increased 5.5% to Ps. 6,120 million in 2006 compared to Ps. 5,800 million in 2005. This reflects an increase in total revenues on strong volume growth and pricing, combined with higher cost of sales and operating expenses. The inclusion of Brazil resulted in a reduction of Ps. 94 million in total income from operations.
FEMSA Comercio
Total Revenues
FEMSA Comercio total revenues increased 18.7% to Ps. 36,835 million in 2006 compared to Ps. 31,021 million in 2005. The increase in total revenues was mainly a result of the aggressive expansion of the OXXO convenience store chain, which added 706 net new OXXO stores during 2006. As of December 31, 2006, we had 4,847 OXXO stores nationwide. This is OXXO’s 11th consecutive year of increasing the number of net new store openings.
Same-store sales of OXXO increased an average of 8.2% in 2006, reflecting an increase in the average customer ticket of 2.8% and an increase in store traffic of 5.4%. This increase reflects rapid store expansion and stronger category management practices, such as tailored product offerings within the stores.
Gross Profit
Cost of sales increased 17.8% to Ps. 26,839 million in 2006, below total revenue growth, compared with Ps. 22,792 million in 2005. As a result, gross profit reached Ps. 9,996 million in 2006, which represented a 21.5% increase from 2005. Gross margin expanded 0.6 percentage points to reach 27.1% of total revenues, primarily due to the benefit from increased coordinated efforts with our suppliers to provide what we believe to be the right promotions and right products for consumers.
Income from Operations
Operating expenses increased 21.3% to Ps. 8,332 million in 2006 compared with Ps. 6,870 million in 2005. Administrative expenses increased 19.3% to Ps. 754 million in 2006 compared with Ps. 632 million in 2005, due to compliance-related expenses and administrative personnel to support the expanded store base. Selling expenses increased 21.5% to Ps. 7,578 million in 2006 compared with Ps. 6,238 million in 2005, due to an increase in expenses related to the development of direct distribution capabilities, opening of new administrative offices in Colima, Tapachula and Tuxtla, an increase in energy tariffs and consumption as we continue to add to our fast-food capabilities, and increased depreciation expense due to the ongoing renovation of certain OXXO store formats.
Income from operations increased 22.4% to Ps. 1,664 million in 2006 compared with Ps. 1,360 million in 2005. This increase was above revenue growth, and contributed to a 0.1 percentage point increase in operating margin which reached 4.5% in 2006 compared with 4.4% in 2005.
FEMSA Consolidated—Net Income
Integral Cost of Financing
Net interest expense reached Ps. 3,507 million in 2006 compared with Ps. 3,994 million in 2005, resulting from a lower average interest rate and a reduction in peso denominated debt, which has a higher interest rate relative to U.S. dollar-denominated debt.
Foreign exchange (loss/gain) amounted to a loss of Ps. 217 million in 2006 compared with a gain of Ps. 318 million in 2005. This loss resulted from the negative effect of the weakening of the Mexican peso on our U.S. dollar-denominated debt during 2006.
Monetary position amounted to a gain of Ps. 1,488 million in 2006 compared with a gain of Ps. 1,204 million in 2005. The increase in the amount of our gain in 2006 compared with 2005 reflects the inflation on our increased liabilities recorded in 2006.
Taxes
Tax recognized in 2006 amounted to Ps. 4,608 million compared to Ps. 4,620 million in 2005. The 0.26% decrease from 2005 is primarily due a reduction in corporate tax rates. Consequently, the effective tax rate in 2006 was 31.8% compared to 33.7% in 2005.
Beginning in 2007, pursuant to Mexican Financial Reporting Standards, we recorded employee profit sharing in the “other expenses” line, instead of recording it in the “income tax” line. For comparison purposes we are reflecting this change in information presented for 20062008.
Net Income
Net income increased 8.7%62.6% to Ps. 9,86015,082 million in 20062009 compared to Ps. 9,0739,278 million in 2005. This increase was due to2008. These results were driven by (i) operating income growth of 6.0%during the year, (ii) a significant improvement in the comprehensive financing result driven by the factors mentioned above and (iii) an improvement in net income from operations combined with a 12.2% decrease in net interest expense, higher gains on monetary position of 23.6%, and a reduction in the effective tax rate, partially offset by an increase in other expenses.discontinued operations.
Net majoritycontrolling interest income amounted to Ps. 7,1279,908 million in 20062009 compared withto Ps. 5,9516,708 million in 2005,2008, an increase of 19.8% from 2005 levels.47.7%. Net majoritycontrolling interest income in 2009 per one FEMSA UnitShare was Ps. 1.992 in 2006. Net majority income2.77 (US$2.12 per FEMSA ADS, considering an exchange rate of Ps. 10.9169 per dollar, was US $1.824 in 2006.ADS).
Liquidity and Capital Resources
Liquidity
Each of our sub-holding companies generally finances its operational and capital requirements on an independent basis. As of December 31, 2007, 74.5%2010, 68% of our outstanding consolidated total indebtedness was at the level of our sub-holding companies. This structure is attributable, in part, to the inclusion of third parties in the capital structure of Coca-Cola FEMSA. Currently, we expect to continue to finance our operations and capital requirements primarily at the level of our sub-holding companies. Nonetheless, we may decide to incur indebtedness at our holding company in the future to finance the operations and capital requirements of our subsidiaries or significant acquisitions, investments or capital expenditures. As a holding company, we depend on dividends and other distributions from our subsidiaries to service our indebtedness.
We continuously evaluate opportunities to pursue acquisitions or engage in joint ventures or other transactions. We would expect to finance any significant future transactions with a combination of cash from operations, long-term indebtedness and capital stock.
The principal source of liquidity of each sub-holding company has generally been cash generated from operations. We have traditionally been able to rely on cash generated from operations because a significant majority of the sales of Coca-Cola FEMSA FEMSA Cerveza and FEMSA Comercio are on a cash or short-term credit basis, and FEMSA Comercio’s OXXO stores are able to finance a significant portion of their initial and ongoing inventories with supplier credit. Our principal use of cash has generally been for capital expenditure programs, debt repayment and dividend payments.
The following is a summary of the principal sources and uses of cash for the three years ended December 31, 2007:2010, 2009 and 2008, from our consolidated statement of cash flows:
Principal Sources and Uses of Cash
of continuing operations
| For the Year Ended December 31, | |||||||||
| 2007 | 2006 | 2005 | |||||||
| (in millions of constant Mexican pesos) | |||||||||
Net resources generated by operations | Ps. 18,022 | Ps. 16,934 | Ps. 15,192 | ||||||
Capital expenditures(1) | (11,257 | ) | (9,422 | ) | (7,508 | ) | |||
Bank loans and notes | (1,191 | ) | 5,112 | (12,457 | ) | ||||
Dividends declared and paid | (1,909 | ) | (1,459 | ) | (1,103 | ) | |||
Years ended December 31, 2010, 2009 and 2008
(in millions of Mexican pesos)(1)
| 2010 | 2009 | 2008 | ||||||||||||
Net cash flows provided by operating activities | Ps. | 17,802 | Ps. | 22,744 | Ps. | 16,023 | ||||||||
Net cash flows provided (used) in investing activities(2) | 6,178 | (11,376 | ) | (11,267 | ) | |||||||||
Net cash flows used in financing activities(3) | (10,496 | ) | (7,889 | ) | (5,543 | ) | ||||||||
Dividends paid | (3,813 | ) | (2,246 | ) | (2,058 | ) | ||||||||
| (1) | As of April 30, 2010 FEMSA no longer controls FEMSA Cerveza. As a result, principal sources and uses of cash of discontinued operations are presented in a separate line in the consolidated statements of cash flows (see “Item 18. Financial Statements”). |
| (2) | Includes property, plant and equipment, |
| (3) | Includes dividends declared and paid. |
Our sub-holding companies generally incur short-term indebtedness in the event that they are temporarily unable to finance operations or meet any capital requirements with cash from operations. A significant decline in the business of any of our sub-holding companies may affect the sub-holding company’s ability to fund its capital requirements. A significant and prolonged deterioration in the economies in which we operate or in our businesses may affect our ability to obtain short-term and long-term credit or to refinance existing indebtedness on terms satisfactory to us.
We have traditionally financed significant acquisitions, principally Coca-Cola FEMSA’s acquisition of Coca-Cola Buenos Aires in 1994 and its acquisition of Panamco in May 2003 and our acquisition of the 30% interest in FEMSA Cerveza owned by affiliates of InBev in August 2004, capital expenditures and other capital requirements that could not be financed with cash from operations by incurring long-term indebtedness and through the issuance of equity.
Our consolidated total indebtedness as of December 31, 2010, was Ps. 40,02925,506 million compared to Ps.29,799 million as of December 31, 2007, as compared to Ps. 42,419 million as of December 31, 2006.2009, excluding FEMSA Cerveza total debt. Short-term debt (including maturities of long-term debt) and long-term debt were Ps. 9,3643,303 million and Ps. 30,66522,203 million, respectively, as of December 31, 2007,2010, as compared to Ps. 6,7468,539 million and Ps. 35,67321,260 million, respectively, as of December 31, 2006.2009. Cash and cash equivalents were Ps. 10,45627,097 million as of December 31, 2007,2010, as compared to Ps. 8,76614,508 million as of December 31, 2006.2009, excluding FEMSA Cerveza.
We believe that our sources of liquidity as of December 31, 20072010, were adequate for the conduct of our sub-holding companies’ businesses and that we will have sufficient funds available to meet our expenditure demands and financing needs in 20082011 and in the following years.
Off-Balance Sheet Arrangements
We do not have any off-balance sheet arrangements.
Contractual Obligations
The table below sets forth our contractual obligations as of December 31, 2007:2010.
| Maturity | Maturity | |||||||||||||||||||||||||||||
| Less than 1 year | 1 - 3 years | 3 - 5 years | In excess of 5 years | Total | Less than 1 year | 1 - 3 years | 3 - 5 years | In excess of 5 years | Total | |||||||||||||||||||||
| (in millions of Mexican pesos) | (in millions of Mexican pesos) | |||||||||||||||||||||||||||||
Long-Term Debt | ||||||||||||||||||||||||||||||
Mexican pesos | Ps. 5,093 | Ps. 4,840 | Ps. 8,487 | Ps. 11,934 | Ps. 30,354 | Ps.1,500 | Ps.6,834 | Ps | .4,216 | Ps.3,193 | Ps | .15,740 | ||||||||||||||||||
Brazilian reais | 4 | 24 | 29 | 45 | 102 | |||||||||||||||||||||||||
Colombian pesos | 155 | 839 | — | — | 994 | |||||||||||||||||||||||||
U.S. dollars | 632 | 3,411 | 762 | 1,155 | 5,960 | — | 222 | — | 6,179 | 6,401 | ||||||||||||||||||||
Brazilian reais(1) | 190 | 76 | — | — | 266 | |||||||||||||||||||||||||
Argentine pesos | 62 | 622 | — | — | 684 | |||||||||||||||||||||||||
Capital Leases | ||||||||||||||||||||||||||||||
U.S. dollars | 2 | — | — | — | 2 | 4 | — | — | — | 4 | ||||||||||||||||||||
Interest payments(2) | ||||||||||||||||||||||||||||||
Interest payments(1) | ||||||||||||||||||||||||||||||
Mexican pesos | 2,546 | 4,052 | 3,155 | 2,289 | 12,042 | 710 | 1,078 | 542 | 257 | 2,587 | ||||||||||||||||||||
Brazilian reais | 4 | 7 | 5 | 8 | 24 | |||||||||||||||||||||||||
Colombian pesos | 73 | 20 | — | — | 93 | |||||||||||||||||||||||||
U.S. dollars | 381 | 442 | 195 | 59 | 1,077 | 287 | 573 | 572 | 1,180 | 2,612 | ||||||||||||||||||||
Argentine pesos | 134 | 37 | — | — | 171 | |||||||||||||||||||||||||
Interest rate swaps and cross currency swaps(2) | ||||||||||||||||||||||||||||||
Mexican pesos | 898 | 229 | 335 | 184 | 1,646 | |||||||||||||||||||||||||
Brazilian reais | 14 | 2 | — | — | 16 | 4 | — | (4) | 1 | 1 | 6 | |||||||||||||||||||
Interest rate swaps(3) | ||||||||||||||||||||||||||||||
Mexican pesos | 249 | 397 | 331 | 430 | 1,407 | |||||||||||||||||||||||||
Colombian pesos | 73 | 73 | — | — | 146 | |||||||||||||||||||||||||
U.S. dollars | 287 | — | (4) | 1 | — | 288 | ||||||||||||||||||||||||
Argentine pesos | 134 | 134 | — | — | 268 | |||||||||||||||||||||||||
Operating leases | ||||||||||||||||||||||||||||||
Mexican pesos | 1,309 | 2,450 | 2,197 | 6,639 | 12,595 | 2,014 | 3,726 | 3,342 | 8,298 | 17,380 | ||||||||||||||||||||
U.S. dollars | 720 | 509 | 13 | — | 1,242 | 94 | 174 | 842 | — | 1,110 | ||||||||||||||||||||
Brazilian reais | 76 | 164 | 22 | — | 262 | 105 | 143 | 16 | 8 | 272 | ||||||||||||||||||||
Commodity price contracts | ||||||||||||||||||||||||||||||
U.S. dollars | 1,905 | 504 | 10 | — | 2,419 | 445 | — | — | — | 445 | ||||||||||||||||||||
Purchase obligations | 514 | 347 | — | — | 861 | |||||||||||||||||||||||||
Expected benefits to be paid for pension plans, seniority premiums, post-retirement medical benefits and severance indemnities | 639 | 878 | 975 | 2,232 | 4,724 | 517 | 554 | 576 | 1,616 | 3,263 | ||||||||||||||||||||
Other long-term liabilities(4) | — | — | — | 4,771 | 4,771 | |||||||||||||||||||||||||
Other long-term liabilities(3) | — | — | — | 5,396 | 5,396 | |||||||||||||||||||||||||
| (1) |
| Interest was calculated using long-term debt as of and interest rate amounts in effect on December 31, |
| Reflects the amount of future payments that we would be required to make. The amounts were calculated by applying the difference between the interest rate swaps and cross currency swaps and the nominal interest rates contracted to long-term debt as of December 31, |
| Other long-term liabilities |
| (4) | The amount rounded is less than Ps. 1 million. |
As of December 31, 2007,2010, Ps. 9,3643,303 million of our total consolidated indebtedness was short-term debt (including maturities of long-term debt).
As of December 31, 2007,2010, our consolidated average cost of borrowing, after giving effect to the cross currency and interest rate swaps, was approximately 8.7%5.8%, very similara decrease of 2.0% percentage points compared to 8.8%7.8% in 2006.2009. As of December 31, 2007,2010, after giving effect to cross currency swaps, 76.2%61.7% of our total consolidated indebtedness was denominated and payable in Mexican pesos, 20.8% was25.1% in U.S. dollars, 1.3% was8.1% in Colombian pesos, 4.7% in Argentine pesos, 1.1% was in Venezuelan bolivars, and the remaining 0.6% was0.4% in Brazilian reais.
Overview of Debt Instruments
The following table shows the allocations of total debt of our company as of December 31, 2007:2010:
| Total Debt Profile of the Company | Total Debt Profile of the Company | |||||||||||||||||||||||||||||
| FEMSA and others | Coca-Cola FEMSA | FEMSA Cerveza | FEMSA Comercio | Total Debt | FEMSA | Coca-Cola FEMSA | FEMSA Comercio | Total Debt | ||||||||||||||||||||||
| (in millions of constant Mexican pesos) | (in millions of Mexican pesos) | |||||||||||||||||||||||||||||
Short-term Debt | ||||||||||||||||||||||||||||||
U.S. dollars: | ||||||||||||||||||||||||||||||
Bank loans | — | Ps. 132 | Ps. 2,240 | — | Ps. 2,372 | |||||||||||||||||||||||||
Argentine pesos: | ||||||||||||||||||||||||||||||
Bank loans | — | 500 | — | — | 500 | — | 506 | — | 506 | |||||||||||||||||||||
Venezuelan bolivars: | ||||||||||||||||||||||||||||||
Colombian pesos | ||||||||||||||||||||||||||||||
Bank loans | — | 425 | — | — | 425 | — | 1,072 | — | 1,072 | |||||||||||||||||||||
Mexican pesos: | ||||||||||||||||||||||||||||||
Bank loans | — | — | 150 | — | 150 | |||||||||||||||||||||||||
Long-term Debt(1) | ||||||||||||||||||||||||||||||
Mexican pesos: | ||||||||||||||||||||||||||||||
Notes | 6,000 | 8,250 | — | — | 14,250 | |||||||||||||||||||||||||
Bank loans(2) | 1,712 | 4,549 | 7,335 | — | 13,596 | |||||||||||||||||||||||||
Bank loans | — | 4,550 | — | 4,550 | ||||||||||||||||||||||||||
Units of Investment (UDI) | 3,193 | — | — | 3,193 | ||||||||||||||||||||||||||
Senior notes | 5,000 | 3,000 | — | 8,000 | ||||||||||||||||||||||||||
U.S. dollars: | ||||||||||||||||||||||||||||||
Yankee bond | — | 3,199 | — | — | 3,199 | |||||||||||||||||||||||||
Bank loans | — | 1,847 | 914 | — | 2,761 | — | 6,401 | — | 6,401 | |||||||||||||||||||||
Leasing | — | 2 | — | — | 2 | — | 4 | — | 4 | |||||||||||||||||||||
Units of Investment (UDI)(3) | 2,508 | — | — | — | 2,508 | |||||||||||||||||||||||||
Brazilian reais(4): | ||||||||||||||||||||||||||||||
Brazilian reais: | ||||||||||||||||||||||||||||||
Bank Loans | — | 102 | — | 102 | ||||||||||||||||||||||||||
Colombian pesos: | ||||||||||||||||||||||||||||||
Bank Loans | — | 994 | — | 994 | ||||||||||||||||||||||||||
Argentine pesos: | ||||||||||||||||||||||||||||||
Bank Loans | — | — | 266 | — | 266 | — | 684 | — | 684 | |||||||||||||||||||||
Total | Ps. 10,220 | Ps. 18,904 | Ps. 10,905 | — | Ps. 40,029 | Ps. 8,193 | Ps. 17,313 | — | Ps. 25,506 | |||||||||||||||||||||
Average Cost(5) | ||||||||||||||||||||||||||||||
Average Cost(2) | ||||||||||||||||||||||||||||||
Mexican pesos | 9.9 | % | 8.9 | % | 8.9 | % | — | 9.3 | % | 5.8 | % | 6.2 | % | — | 5.9 | % | ||||||||||||||
U.S. dollars | — | 6.4 | % | 6.5 | % | — | 6.5 | % | — | 4.5 | % | — | 4.5 | % | ||||||||||||||||
Brazilian reais | — | 4.5 | % | — | 4.5 | % | ||||||||||||||||||||||||
Argentine pesos | — | 11.0 | % | — | — | 11.0 | % | — | 16.0 | % | — | 16.0 | % | |||||||||||||||||
Venezuelan bolivars | — | 15.7 | % | — | — | 15.7 | % | |||||||||||||||||||||||
Brazilian reais | — | — | 11.4 | % | — | 11.4 | % | |||||||||||||||||||||||
TOTAL | 9.9 | % | 8.4 | % | 8.3 | % | — | 8.7 | % | |||||||||||||||||||||
Colombian pesos | — | 4.5 | % | — | 4.5 | % | ||||||||||||||||||||||||
Total | 5.8 | % | 6.0 | % | — | 5.8 | % | |||||||||||||||||||||||
| (1) | Includes the Ps. |
| (2) |
| Includes the effect of cross currency and interest rate swaps. Average cost is determined based on interest rates as of the end of December 31, 2010. |
Restrictions Imposed by Debt Instruments
Generally, the covenants contained in the credit agreements and other instruments governing indebtedness entered into by us or our sub-holding companies include limitations on the incurrence of any additional debt based on debt service coverage ratios or leverage tests. These credit agreements also generally include restrictive covenants applicable to us, our sub-holding companies and their subsidiaries. There are no cross-guarantees between sub-holding companies, and we have not provided guarantees with respect to any of the debt obligations of our sub- holding companies. FEMSA’s obligation of Ps. 2,500 million under itscertificados
bursátilesis guaranteed by FEMSA Cerveza. Additionally, FEMSA’s obligationAs of Ps. 1,712 million is guaranteed by FEMSA Comercio. Certain of our financing instruments mentioned above are subject to either acceleration or repurchase at the lender’s or holder’s option if, in the case of FEMSA, the persons exercising control over FEMSA no longer exercise such control and, in the case of FEMSA Cerveza, FEMSA ceases to control FEMSA Cerveza.
WeDecember 31 2010, we are in compliance with all of our restrictiveCoca-Cola FEMSA’s covenants. FEMSA was not subject to any financial covenants as of December 31, 2007.that date. A significant and prolonged deterioration in our consolidated results offrom operations could cause us to cease to be in compliance under certain indebtedness in the future. We can provide no assurances that we will be able to incur indebtedness or to refinance existing indebtedness on similar terms in the future.
Summary of Debt
The following is a summary of our indebtedness by sub-holding company and for FEMSA as of December 31, 2007:2010:
| • | Coca-Cola FEMSA. Coca-Cola FEMSA’s total indebtedness was Ps. |
As part of ourCoca-Cola FEMSA’s financing policy, we expectit expects to continue to finance ourits liquidity needs with cash from cash operations. Nonetheless, as a result of regulations in certain countries in which we operate,it operates, it may not be beneficial or, as the case of exchange controls in Venezuela, practicable for usCoca-Cola FEMSA to remit cash generated in local operations to fund cash requirements in other countries. Exchange controls like those in Venezuela may also increase the real price of remitting cash from operations to fund debt requirements in other countries. In addition, in the event that cash from operations in these countries is not sufficient to fund future working capital requirements and capital expenditures, weCoca-Cola FEMSA may decide, or be required, to fund cash requirements in these countries through local borrowings rather than remitting funds from another country. In addition, in the future weCoca-Cola FEMSA may be required to finance ourits working capital and capital expenditure needs with short-term or other borrowings.
Coca-Cola FEMSA’s average cost of debt, based on interest rates as of December 31, 2010 and after giving effect to cross currency and interest rate swaps, was 6.4%4.5% in U.S. dollars, 8.9%6.2% in Mexican pesos, 15.7%4.5% in Venezuelan bolivarsColombian pesos, 4.5% in Brazilian reais and 11.0%16.0% in Argentine pesos as of December 31, 20072010, compared to 7.0%2.6% in U.S. dollars, 9.5%7.2% in Mexican pesos, 8.0%12.5% in Colombian pesos, 11.3%18.9% in Venezuelan bolivars,bolívares fuertes and 9.7%21.6% in Argentine pesos as of December 31, 2006.2009.
| • | FEMSA Cerveza. |
| • | FEMSA Comercio. As of December 31, |
| • | FEMSA |
average cost of debt, after giving effect to interest rate swaps, as of December 31, 2010, was 5.9% in Mexican pesos.
Contingencies
We have various loss contingencies, for which reserves have been recorded in those cases where we believe an unfavorable resolution is probable. See “Item 8. Financial Information—Legal Proceedings.” Most of these loss contingencies were recorded in Coca-Cola FEMSA’s books as reserves against intangibles recorded as a result of Panamco and Kaiser acquisitions.acquisition. Any amounts required to be paid in connection with these loss contingencies would be required to be paid from available cash.
During 2009 and 2010, Brazil adopted new laws providing for certain tax amnesties. The tax amnesty programs offers Brazilian legal entities and individuals an opportunity to pay off their income tax and indirect tax debts under less stringent conditions than would normally apply. The amnesty programs also include a favorable option under which taxpayers may utilize income tax loss carry-forwards, which we refer to as NOLs, when settling certain outstanding income tax and indirect tax debts. Brazilian subsidiary of Coca-Cola FEMSA, decided to participate in the amnesty programs allowing it to settle certain previously accrued indirect tax contingencies. During the years ended December 31, 2010 and 2009 the Company de-recognized indirect tax contingency accruals of Ps. 333 and Ps. 433, respectively, making payments of Ps. 118 and Ps. 243, recording a credit to other expenses of Ps. 179 and Ps. 311, reversing previously recorded Brazil valuation allowances against NOLs in 2009, and recording certain taxes recoverable. See Note 19 and Note 25 C to our audited consolidated financial statements.
The following table presents the nature and amount of the loss contingencies recorded as of December 31, 2007:2010:
| Loss Contingencies As of December 31, | ||||
(in millions of
Mexican pesos) | ||||
| Ps. | |||
Labor | 1,133 | |||
Legal | ||||
| ||||
| Ps. | |||
| 2,712 | ||||
As is customary in Brazil, we have been asked by the tax authorities to collateralize tax contingencies currently in litigation in respect of Ps. 1,8872,292 by pledging fixed assets and entering into available lines of credit to cover such contingencies.
We have other contingencies, for which, webased on a legal assessment on whether their risk of loss is deemed to be other than remote but less than probable, have not recorded a reserve.financial impact that is disclosed as loss contingencies in the notes of the consolidated financial statements. These contingencies or our assessment of them may change in the future, and we may record reserves or be required to pay amounts in respect of these contingencies. As of December 31, 20072010, the aggregate amount of contingencies for which we have not recorded a reserve was $311Ps. 5,767 million. These contingencies have been classified as less than probable but more than remote by our legal counsel.
Capital Expenditures
For the past five years, we have had significant capital expenditure programs, which for the most part were financed with cash from operations. Capital expenditures reached Ps. 11,25711,171 million in 20072010 compared to Ps. 9,4229,103 million in 2006,2009, an increase of 19.5%22.7%. This was primarily due to an increasehigher capacity-related investments at Coca-Cola FEMSA and incremental investments in capital expenditures at FEMSA Cerveza and Coca-Cola FEMSA.Comercio related mainly to store expansions. The principal components of our capital expenditures have been for equipment, market-related investments and production capacity and distribution network expansion at both Coca-Cola FEMSA and the opening of new stores at FEMSA Cerveza.Comercio. See “Item 4. Information on the Company—Capital Expenditures and Divestitures.”
Expected Capital Expenditures for 20082011
Our capital expenditure budget for 20082011 is expected to be approximately $1.4 billion.US$ 900 million. The following discussion is based on each of our sub-holding companies’ internal 20082011 budgets. The capital expenditure plan for 20082011 is subject to change based on market and other conditions and the subsidiaries’ results offrom operations and financial resources.
Coca-Cola FEMSA’s capital expenditures in 20082011 are expected to be approximately $470up to US$ 600 million. Coca-Cola FEMSA’s capital expenditures in 20082011 are primarily intended for:
investment in manufacturing lines;
returnable bottles and cases;
market investments (primarily for the placement of refrigeration equipment); and
improvements throughout distribution network.network; and
IT investments.
Coca-Cola FEMSA estimates that theof its projected capital expenditures for 20082011, approximately 33% will be evenly divided betweenallocated in respect of its Mexican territories and the remaining will be for its non-Mexican territories.
Coca-Cola FEMSA Cerveza’sbelieves that internally generated funds will be sufficient to meet its budget capital expenditures for 2011. Coca-Cola FEMSA’s capital expenditure budgetplan for 2008 is expected to be approximately $733 million. FEMSA Cerveza expects to allocate part of this budget for investments in2011 may change based on market and other conditions and based on its manufacturing facilities in Mexicoresults from operations and Brazil, related to the construction of the Meoqui beer plant and glass bottle facility, and in marginal capacity expansions of its breweries and equipment modernization. FEMSA Cerveza also expects to apply a portion of this budget towards the improvement of its distribution assets, including new and replacement vehicles, the maintenance of a secondary distribution fleet and information technology systems. In addition, FEMSA Cerveza plans to invest in commercial and market-related activities such as the enhancement of its retail coverage, the development of long-term sponsorships and the placement of refrigeration equipment nationwide.financial results.
FEMSA Comercio’s capital expenditure budget in 20082011 is expected to total approximately $172US$ 250 million, and will be allocated to the opening of new OXXO stores and to a lesser extent to the refurbishing of existing OXXO stores.stores and the investment in two new distribution centers. In addition, investments are planned in FEMSA Comercio’s information technology, ERP software updates and transportation equipment.
Hedging Activities
Our business activities require the holding or issuing of derivative instruments to hedge our exposure to market risks related to changes in interest rates, foreign currency exchange rates, equity risk and commodity price risk. See “Item 11. Quantitative and Qualitative Disclosures about Market Risk.”
The following table provides a summary of the fair value of derivative financial instruments as of December 31, 2007 The2010. If such instruments are not traded in a formal market, fair market value is obtained mainly from external sources, whichdetermined by applying techniques based upon technical models we believe are our counterparties tosupported by sufficient, reliable and verifiable market data, recognized in the contracts.financial sector.
| Fair Value At December 31, 2007 | ||||||||||||||
| Maturity less than 1 year | Maturity 1 - 3 years | Maturity 3 - 5 years | Maturity in excess of 5 years | Fair Value Asset (Liability) | ||||||||||
| (in millions of constant Mexican pesos) | ||||||||||||||
Prices quoted by external sources | (164 | ) | (171 | ) | (139 | ) | 17 | (457 | ) | |||||
| Fair Value At December 31, 2010 | ||||||||||||||||
| Maturity less than 1 year | Maturity 1 - 3 years | Maturity 3 - 5 years | Maturity in excess of 5 years | Fair Value Asset (Liability) | ||||||||||||
| (in millions of Mexican pesos) | ||||||||||||||||
Prices quoted by external sources | Ps. (16) | Ps. (242) | Ps. (176) | Ps. 1,162 | Ps. 728 | |||||||||||
Plan for the Disposal of Certain Fixed Assets
We have identified certain fixed assets consisting of land, buildings and equipment for disposal, and we have an approved program for disposal of these fixed assets. These assets are not in use and have been valued at
their estimated net realizable value without exceeding their restated acquisition cost. These assets are allocated as follows:
| December31, | December 31, | |||||||||||||
| 2007 | 2006 | 2010 | 2009 | |||||||||||
| (in millions of constant Mexican pesos) | (in millions of Mexican pesos) | |||||||||||||
Coca-Cola FEMSA | Ps. | 94 | Ps. | 196 | Ps. | 189 | Ps. | 288 | ||||||
FEMSA Cerveza | 218 | 293 | ||||||||||||
FEMSA and other | 250 | 307 | 43 | 42 | ||||||||||
Total | Ps. | 562 | Ps. | 796 | Ps. | 232 | Ps. | 330 | ||||||
FixedIn inflationary economic environments, fixed assets recorded at their estimated realizable value are considered monetary assets on which a loss on monetary position is computed and recorded in results of operation.
The principal differences between Mexican Financial Reporting StandardsFRS and U.S. GAAP that affect our net income and majority stockholders’ equity relate to the accounting treatment of the following items:
consolidation of our subsidiary Coca-Cola FEMSA, which is a consolidated subsidiary for purposes of Mexican Financial Reporting StandardsFRS but presented under the equity method for U.S. GAAP purposes;purposes up until January 31, 2010. As of February 1, 2010, we acquired control of Coca-Cola FEMSA through a business acquisition without any transfer of consideration (see “Item 18. Financial Statements”);
discontinued operations of FEMSA Cerveza due to the disposal of FEMSA Cerveza, which was accounted for as discontinued operations for purposes of Mexican FRS, and considered to be a continuing operation due to significant involvement with the disposed operation and accounted for as a disposal of net assets under U.S. GAAP (see “Item 18. Financial Statements”);
subsequent accounting of our investment in Heineken under the equity method for purposes of Mexican FRS; for U.S. GAAP purposes our investment in Heineken has been recognized based on the cost method because it was unable to obtain the required information to reconcile Heineken’s net income from IFRS to U.S. GAAP (see “Item 18. Financial Statements”);
FEMSA’s minoritynon-controlling interest acquisition and sales;
deferred income taxes and deferred employee profit sharing;
restatement of imported machinery and equipment;
capitalization of integral result of financing;comprehensive financing result;
labor liabilities,liabilities; and
start-up expenses.
For a more detailed description of the differences between Mexican Financial Reporting StandardsFRS and U.S. GAAP as they relate to us, as well as U.S. GAAP consolidated balance sheets, statements of income and comprehensive income, changes in stockholders’ equity and cash flows for the same periods presented for Mexican Financial Reporting StandardsFRS purposes and, afor the consolidated statement of changes in stockholders’ equity for the years ended December 31, 2010 and 2009 and reconciliation of net income, comprehensive income and stockholders’ equity under Mexican Financial Reporting StandardsFRS to net income, comprehensive income and stockholders’ equity under U.S. GAAP, see notes 26Notes 27 and 2728 to our audited consolidated financial statements.
Pursuant to Mexican Financial Reporting Standards,FRS through 2007, our audited consolidated financial statements recognize certain effects of inflation in accordance with Bulletin B-10. TheseAs a result of discontinued inflationary accounting for subsidiaries that operate in non-inflationary environments, our financial statements are no longer considered to be presented in a reporting currency that comprehensively includes the effects were not reversedof price level changes, therefore, the
inflationary effects if inflationary economic environments arising in our2008, 2009 and 2010 resulted in a difference to be reconciled for U.S. GAAP financial information.purposes.
Under U.S. GAAP, we had net income attributable to controlling interest of Ps. 8,55767,445 million and Ps. 6,9739,902 million in 20072010 and 2006,2009, respectively. Under Mexican Financial Reporting Standards,FRS, we had net majoritycontrolling interest income of Ps. 8,51140,251 million and Ps. 7,1279,908 million in 20072010 and 2006,2009, respectively. In 2007,2010, net income attributable to controlling interest under U.S. GAAP was higher than net majoritycontrolling income under Mexican Financial Reporting Standards,FRS, mainly as a resultdue to the gain recognized under U.S. GAAP regarding the control acquisition of the effect of deferred income taxes and deferred employee profit sharing.Coca-Cola FEMSA without any transfer consideration, which amounted to Ps. 39,847.
Stockholders’Controlling interest equity under U.S. GAAP as of December 31, 20072010 and 20062009 was Ps. 82,606163,641 million and Ps. 73,92598,168 million, respectively. Under Mexican Financial Reporting Standards, majority stockholders’FRS, controlling interest equity as of December 31, 20072010 and 20062009 was Ps. 64,578117,348 million and Ps. 56,65481,637 million, respectively. The principal reasons for the difference between controlling interest stockholders’ equity under U.S. GAAP and majority stockholders’controlling interest equity under Mexican Financial Reporting StandardsFRS were the effect of the goodwill generated byfair valuation recognized regarding the minority interest acquisitions, deferred income tax, labor liabilities, deferred employee profit sharing and start-up expenses.Coca-Cola FEMSA acquisition.
| ITEM 6. | DIRECTORS, SENIOR MANAGEMENT AND EMPLOYEES |
Management of our business is vested in the board of directors and in our chief executive officer. Our bylaws provide that the board of directors will consist of no more than 21 directors and designatedtheir corresponding alternate directors elected by our shareholders at the annual ordinary general shareholders meeting.AGM. Directors are elected for a term of one year. Alternate directors are authorized to serve on the board of directors in place of their specific directors who are unable to attend meetings and may participate in the activities of the board of directors. Nineteen members form our board of directors. Our bylaws provide that the holders of the Series B Shares elect at least 11eleven directors and that the holders of the Series D Shares elect five directors. The shareholders may designate alternate directors to cover the absence of a specific director. See “Item 10. Additional Information—Bylaws.”
In accordance with our bylaws and article 24 of the Mexican Securities Law, at least 25% of the members of our board of directors must be independent (as defined by the Mexican Securities Law).
The board of directors may designateappoint interim directors in the caseevent that a director is absent or an elected director and corresponding alternate are unable to serve. Such interim directors shall serve until the next shareholders meeting,AGM, at which the Shareholdersshareholders shall elect a replacement.
Our bylaws provide that the board of directors shall meet at least once every 3 months. Actions by the board of directors must be approved by at least a majority of the directors present and voting. The chairman of the board of directors, the chairman of our audit or corporate practices committee, or at least 25% of our directors may call a board of directors’ meeting and include matters in the meeting agenda.
Series “B” Directors
| ||||
| ||||
|
| |||
José Antonio Fernández Carbajal | Born: | February 1954 | ||
Chairman of the Board | First elected (Chairman): | 2001 | ||
First elected (Director): | 1984 | |||
| Term expires: | ||||
| Principal occupation: | Chief Executive Officer of FEMSA | |||
| Other directorships: | Chairman of the board of Coca-Cola FEMSA and Fundación FEMSA A.C., Vice-Chairman of the supervisory board of Heineken N.V. and | |||
| member of the board of Heineken Holding N.V., Vice-Chairman of the board of | ||||
| Business experience: | Joined FEMSA’s strategic planning department in | |||
| Education: | Holds a degree in industrial engineering and an MBA from ITESM | |||
| Alternate director: | Federico Reyes García | |||
| Born: | April 1958 | ||
| First elected: | |||
| Term expires: | ||||
| Principal occupation: | Private investor | |||
| Education: | Holds a degree in Communication Sciences from ITESM | |||
| Alternate director: | Bárbara Garza Lagüera Gonda(2) | |||
Paulina Garza Lagüera Gonda (2) Director | Born: | March 1972 | ||
| First elected: | 2009 | |||
| Term expires: | 2012 | |||
| Principal occupation: | Private investor | |||
| Other directorships: | Member of the board of Coca-Cola FEMSA | |||
| Education: | Holds a business administration degree from ITESM | |||
| Alternate director: | ||||
José Fernando Calderón Rojas Director | Born: | July 1954 | ||||
| First elected: | 2005 | ||||
| Term expires: | ||||||
| Principal occupation: | ||||||
| Other directorships: | ||||||
| Education: | Holds a law degree from the Universidad Autónoma de Nuevo León (UANL) and completed specialization studies in tax at UANL | |||||
| Alternate director: | Francisco José Calderón Rojas | |||||
Consuelo Garza de Garza
| Born: | October 1930 | ||||
| First elected: | 1995 | ||||
| Term expires: | ||||||
| Business experience: | Founder and former President of Asociación Nacional Pro-Superación Personal, (a non-profit organization) | |||||
| Alternate director: | Alfonso Garza Garza | |||
Max Michel Suberville Director | Born: | July 1932 | ||
| First elected: | 1985 | ||
| Term expires: | ||||
| Principal occupation: | ||||
| Other directorships: | Co-chairman of the equity committee of El Puerto de Liverpool, S.A.B. de C.V. (Liverpool). Member of the boards of | |||
| Education: | Holds a graduate degree from The Massachusetts Institute of Technology and completed post-graduate studies at Harvard University | |||
| Alternate director: | Max Michel González | |||
Alberto Bailleres González Director | Born: | August 1931 | ||||
| First elected: | |||||
| Term expires: | ||||||
| Principal occupation: | Chairman of the boards of Grupo BAL, S.A. de C.V. Peñoles, GNP, Fresnillo plc, Grupo Palacio de Hierro, S.A.B. de C.V., | |||||
| Other directorships: | Member of the boards of | |||||
| Education: | Holds an economics degree and an Honorary Doctorate both from Instituto Tecnológico Autónomo de México | |||||
| Alternate director: | Arturo Fernández Pérez | |||||
Francisco Javier Fernández Carbajal Director | Born: | April 1955 | ||||
| First elected: | 2005 | ||||
| Term expires: | ||||||
| Principal occupation: | ||||||
| Other directorships: | Chairman of the boards of Primero Fianzas, S.A. | |||||
| Education: | Holds degrees in mechanical and electrical engineering from ITESM and an MBA from Harvard Business School | |||||
| Alternate director: | Javier Astaburuaga Sanjines | |||||
Ricardo Guajardo Touché
| Born: | May 1948 | ||||
| First elected: | 1988 | ||||
| Term expires: | ||||||
| Principal occupation: | ||||||
| Other directorships: | Member of the Board of | |||||
| Business experience: | Has held senior executive positions in our company, Grupo AXA, S.A. de C.V. and Valores de Monterrey, S.A. de C.V. Former Chairman of the Board of BBVA Bancomer | |||
| Education: | Holds degrees in electrical engineering from ITESM and the University of Wisconsin and a masters degree from the University of California at Berkeley | |||
| Alternate director: | ||||
Alfredo Livas Cantú Director | Born: | July 1951 | ||
| First elected: | 1995 | ||
| Term expires: | ||||
| Principal occupation: | President of Praxis Financiera, S.C. | |||
| Other directorships: | Member of the boards of Grupo | |||
| Business experience: | Joined FEMSA in 1978 and held several positions in the areas of financial planning and treasury and served as Chief Financial Officer from 1989 to 1999 | |||
| Education: | Holds an economics degree from UANL and an MBA and masters degree in economics from the University of Texas | |||
| Alternate Director: | Sergio Deschamps Ebergenyi | |||
| ||||
| ||||
| ||||
Director | ||||
| Born: | |||
| First elected: | |||
| Term expires: | ||||
| Business experience: | Private Investor | |||
| Other directorships: | Member of the boards of directors of Coca-Cola FEMSA, Hospital San José Tec de Monterrey and Museo de Historia Mexicana | |||
| Education: | Holds a business administration degree in Industrial Engineering from ITESM and a Master of International Management from the Thunderbird American Graduate School of International Management | |||
| Alternate director: | ||||
José Manuel Canal Hernando Director | Born: | February 1940 | ||
| First elected: | 2003 | ||
| Term expires: | ||||
| Principal occupation: | Private consultant | |||
| Other directorships: | ||||
| Business experience: | Former managing partner at Ruiz, Urquiza y Cía, S.C. from 1981 to 1999, acted as our statutory examiner from 1984 to 2002, presided in the Committee of Surveillance of the Mexican Institute of Finance Executives, has participated in several commissions at the Mexican Institute of Public Accountants and has extensive experience in financial auditing for holding companies, banks and financial brokers | |||
| Education: | Holds a CPA degree from the Universidad Nacional Autónoma de México | |||
| Alternate director: | Ricardo Saldívar Escajadillo | |||
Series “D”
Directors
| Series “D” Directors | ||||
Armando Garza Sada Director | Born: | June 1957 | ||
| First elected: | |||
| Term expires: | ||||
| Principal occupation: | ||||
| Other directorships: | Member of the | |||
| Business experience: | He has a long professional career in Alfa, | |||
| Education: | Holds a | |||
| Alternate director: | ||||
Alexis E. Rovzar de la Torre
| Born: | July 1951 | ||
| First elected: | |||
| Term expires: | ||||
| Principal occupation: | Executive Partner at White & Case, S.C. law firm | |||
| Other directorships: | Member of the boards of Coca-Cola FEMSA (chairman of its audit committee), | |||
| Business experience: | Expert in private and public mergers and acquisitions as well as other aspects of financial law and has been advisor to many companies on international business and joint venture transactions | |||
| Education: | Holds a law degree from the Universidad Nacional Autónoma de México | |||
| Alternate director: | Francisco Zambrano Rodríguez | |||
Helmut Paul Director | Born: | March 1940 | ||
| First elected: | 1988 | ||
| Term expires: | ||||
| Principal occupation: | ||||
| Other directorships: | Member of the | |||
| Education: | Holds an MBA from the University of Hamburg | |||
| Alternate director: | ||||
| Born: | |||
Director | First elected: | |||
| Term expires: | ||||
| Principal occupation: | ||||
| Other directorships: | ||||
| Business experience: | Harris Investment Management, Putnam Management Company, and ARCO | |||
| Education: | Holds | |||
Robert E. Denham | Born: | August 1945 | ||
Director | First elected: | 2001 | ||
| Term expires: | ||||
| Principal occupation: | Partner of Munger, Tolles & Olson LLP law firm | |||
| Other directorships: | Member of the | |||
| Business experience: | Former Chief Executive Officer of Salomon Inc., representative to the APEC Business Advisory Council and member of the OECD Business Sector Advisory Group on Corporate Governance | |||
| Education: | Magna cum laude graduate from the University of Texas, holds a JD from Harvard Law School and a masters degree in Government from Harvard University | |||
| (1) |
| (2) | Sister-in-law of José Antonio Fernández Carbajal. |
| (3) |
| Brother of José Calderón Rojas. |
| Son of Consuelo Garza de Garza. |
| Son of Max Michel Suberville. |
| Brother of José Antonio Fernández Carbajal. |
| Nephew of Max Michel Suberville. |
The names and positions of our current senior management and that of our principal sub-holding companies, their dates of birth and information on their principal business activities both within and outside of FEMSA are as follows:
FEMSA
| FEMSA | ||||
José Antonio Fernández Carbajal
| See “—Directors.” Joined FEMSA: | 1987 | ||
Chief Executive Officer | Appointed to current position: |
| ||
1994
Javier Gerardo Astaburuaga Sanjines | Born:
| July 1959 1982 | ||
Executive Vice-President of | Appointed to current position: | 2006 | ||
Finance and Strategic Development |
Business experience within FEMSA: |
Joined FEMSA as a financial information analyst and later acquired experience in corporate development, administration and finance, held various senior positions at FEMSA Cerveza between 1993 and 2001, including Chief Financial Officer and for two years was FEMSA Cerveza’s Director of Sales for the north region of Mexico until 2003 in which he was appointed FEMSA Cerveza’s Co-Chief Executive | ||
| Directorships: | Member of the boards of Coca-Cola FEMSA and member of the Supervisory Board of Heineken N.V. | |||
| Education: | Holds a CPA degree from | |||
Federico Reyes García | Born: Joined FEMSA: | September 1945 1992 | ||
Executive Vice-President of Corporate Development |
Appointed to current position: Business experience within FEMSA: |
2006 Director of Corporate Development, 1992 and Chief Financial Officer from 1999 until | ||
| Directorships: | Member of the boards of Coca-Cola FEMSA | |||
| Other business experience: | Served as Director of Corporate Staff at Grupo AXA and has extensive experience in the insurance sector, working eight years in Valores de Monterrey, S.A. de C.V., six of them as Chief Executive Officer | |||
| Education: | Holds a degree in business and finance from ITESM | |||
José González Ornelas | Born: Joined FEMSA: | April 1951 1973 | ||
Executive Vice President of Administration and Operative Control |
Appointed to current position: Business experience within FEMSA: |
2001 Has held several managerial positions in FEMSA including Chief Financial Officer of FEMSA Cerveza, Director of Planning and Corporate Development of FEMSA and Chief Executive Officer of FEMSA Logística, S.A. de C.V. | ||
| Education: | Holds a CPA degree from UANL and has post-graduate studies in business administration from the Instituto Panamericano de Alta Dirección de Empresa (IPADE) | |||
Alfonso Garza Garza | Born: | July 1962 | ||
Executive Vice President of Human Resources, Procurement and IT |
Joined FEMSA: Appointed to current position:
|
1985
2009 | ||
Business within FEMSA: | Has experience in several FEMSA business units and departments, including | |||
| Directorships: | Member of the board of Coca-Cola FEMSA, ITESM and Nutec, S.A. de C.V., and chairman of the board of COPARMEX Nuevo León | |||
| Education: | Holds a degree in Industrial Engineering from ITESM and an MBA from IPADE | |||
Genaro Borrego Estrada
| Born: Joined FEMSA:
| February 1949 2007 | ||
Director of Corporate Affairs | Appointed to current position: | 2007 |
2007
| Professional Experience: | Constitutional Governor of the Mexican State of Zacatecas from 1986 to 1992, General Director of the Mexican Social Security Institute from 1993 to 2000, and Senator in Mexico for the State of Zacatecas from 2000 to | |||
| Directorships: | Member of the board of TANE, S.A. de C.V. | |||
| Education: | Holds a bachelor’s degree in International Relations from the Universidad | |||
Carlos Aldrete
| Born: Joined FEMSA: | August 1956 1979 | ||
General Counsel and Secretary of the Board of Directors | Appointed to current position: Directorships: |
1996 Secretary of the Board of directors of FEMSA and secretary of the board of directors of all of the sub-holding companies of FEMSA | ||
Business experience within FEMSA: | Extensive experience in international business and financial transactions, debt issuances and corporate restructurings and expertise in securities and private mergers and acquisitions law | |||
| Education: | Holds a law degree from the UANL and a masters degree in Comparative Law from the College of Law of the University of Illinois | |||
|
|
| ||
| Coca-Cola FEMSA | ||||
Carlos Salazar Lomelín | Born: Joined FEMSA: | April 1951 1973 | ||
Chief Executive Officer |
Appointed to current position: Business experience within FEMSA: |
2000
Has held managerial positions in several subsidiaries of FEMSA, including Grafo Regia, S.A. de C.V. and Plásticos Técnicos Mexicanos, S.A. de C.V., served as Chief Executive Officer of FEMSA Cerveza, where he also held various management positions in the Commercial Planning and Export divisions | ||
| Directorships: | Member of the boards of Coca-Cola FEMSA, BBVA Bancomer, AFORE Bancomer, S.A. de C.V., Seguros Bancomer, S.A. de C.V., member of the advisory board of Premio Eugenio Garza Sada, Centro Internacional de Negocios Monterrey A.C. (CINTERMEX), Antermex, Apex and the ITESM’s EGADE Business School | |||
| Education: | Holds a bachelor’s degree in economics from ITESM, and performed postgraduate studies in business administration at ITESM and economic development in Italy | |||
Héctor Treviño Gutiérrez | Born: Joined FEMSA: | August 1956 1981 | ||||
Chief Financial Officer |
Appointed to current position: |
1993 | ||||
Business experience within FEMSA: | Has held managerial positions in the international financing, financial planning, strategic planning and corporate development areas of FEMSA | |||||
| Directorships: | Member of the boards of SIEFORES, Insurance and Pensions of BBVA Bancomer, Vinte Viviendas Integrales, S.A.P.I. de C.V. and member of the Technical Committee of Capital-3 | |||||
| Education: | Holds a degree in chemical engineering from ITESM and an MBA from the Wharton Business School | |||||
FEMSA Comercio | ||||
Eduardo Padilla Silva | Born: Joined FEMSA: | January 1955 1997 | ||
Chief Executive Officer |
Appointed to current position: |
| ||
| Business experience within FEMSA: | Director of Planning and Control of FEMSA from 1997 to | |||
| Other business experience: | Had a 20-year career in Alfa, culminating with a ten-year tenure as Chief Executive Officer of Terza, S.A. de C.V., major areas of expertise include operational control, strategic planning and financial restructuring | |||
| Directorships: | Member of the board of Grupo Lamosa, S.A. de C.V., Club Industrial , AC, Asociación Nacional de Tiendas de Autoservicios y Departamentales, A.C., NACS and alternate member of the board of Coca-Cola FEMSA | |||
| Education: | Holds a degree in mechanical engineering from ITESM, | |||
Compensation of Directors and Senior Management
The compensation of Directors is approved at the annual ordinary general shareholders meeting.AGM. For the year ended December 31, 2007,2010, the aggregate compensation paid to our directors was approximately Ps. 5.310 million.
For the year ended December 31, 2007,2010, the aggregate compensation paid to executive officers and senior management of FEMSA and its subsidiaries was approximately Ps. 1,2901,307 million. Aggregate compensation includes bonuses we paid to certain members of senior management and payments in connection with the EVA stock incentive plan described below.in Note 17 to our audited consolidated financial statements. Our senior management and executive officers participate in our benefit plan and post-retirement medical services plan on the same basis as our other employees. Members of our board of directors do not participate in our benefit plan and post-retirement medical services plan, unless they are retired employees of our company. As of December 31, 2007,2010, amounts set aside or accrued for all employees under these retirement plans were Ps. 6,5624,236 million, of which Ps. 2,9021,544 million is already funded.
From 1998 until 2003, we, along with our subsidiaries, had a five-year stock incentive plan for the benefit of our executive officers. Under the terms of the stock incentive plan, during the years 1999 through 2003, certain of our executive officers were selected to receive a special cash bonus, which was used to obtain a stock grant. Each year, our Chief Executive Officer, together with the chief executive officers and corporate practices committees of our sub-holding companies, selected the executive officers eligible to participate in the stock incentive plan and determined the amount of the special bonus, based on each executive officer’s level of responsibility and corporate achievements during the prior year.
The stock grants were administrated by certain trusts for the benefit of the selected executive officers. Every year a new administrative trust was formed to manage the stock grants acquired in that particular year. Under the terms of the stock incentive plan, each time a special bonus was assigned to an executive officer, the executive officer contributed the special bonus received to
the administrative trust in exchange for a stock grant, as determined annually by us. Each administrative trust is managed by a technical committee formed by executives of our company and is governed by Mexican law.
A stock grant entitles an executive officer to receive BD Units or, in the case of officers of Coca-Cola FEMSA, a specified proportion of BD Units and Series L Shares of Coca-Cola FEMSA, which will be acquired by the respective administrative trust in the open market, using the special bonus contributed by each executive officer. Under the terms of the stock incentive plan, the ownership of the BD Units and, in its case, the Series L Shares of Coca-Cola FEMSA, will vest at a rate per year equivalent to the number of BD Units and, as applicable, Coca-Cola FEMSA Series L Shares, which can be acquired with 20% of such stock grant.
Shares were granted in 2003 under this plan, and the plan was terminated in February 2008.
In 2005,2004, we, along with our subsidiaries, commenced a new stock incentive plan for the benefit of our executive officers, which we refer to as the EVA stock incentive plan. This plan replaced the stock incentive plan described above and was developed using as the main metric for the first three years of the plan for evaluation the Economic Value Added, or EVA, framework developed by Stern Stewart & Co., a compensation consulting firm. Under the EVA stock incentive plan, eligible executive officers are entitled to receive a special cash bonus, which will be used to purchase shares.
Under this plan, each year, our Chief Executive Officer in conjunction with our board of directors, together with the chief executive officer of the respective sub-holding company, determines the amount of the special cash bonus used to purchase shares. This amount is determined based on each executive officer’s level of responsibility and based on the EVA generated by Coca-Cola FEMSA or FEMSA, as applicable.
The shares are administrated by a trust for the benefit of the selected executive officers. Under the EVA stock incentive plan, each time a special bonus is assigned to an executive officer, the executive officer contributes the special bonus received to the administrative trust. Pursuant to the plan, the administrative trust acquires BD Units of FEMSA or, in the case of officers of Coca-Cola FEMSA, a specified proportion of publicly traded local shares of FEMSA and Series L Shares of Coca-Cola FEMSA on the Mexican Stock Exchange using the special
bonus contributed by each executive officer. The ownership of the publicly traded local shares of FEMSA and, in the case of Coca-Cola FEMSA executives, the Series L Shares of Coca-Cola FEMSA vests at a rate per year equivalent to 20% of the number of publicly traded local shares of FEMSA and Series L Shares of Coca-Cola FEMSA.
As of May 30, 2008,March, 31, 2011, the trust that manages the EVA stock incentive plan holdsheld a total of 9,781,4359,632,936 BD Units of FEMSA and 2,471,0752,850,451 Series L Shares of Coca-Cola FEMSA, each representing 0.05%0.27% and 0.13%0.15% of the total number of shares outstanding of FEMSA and of Coca-Cola FEMSA, respectively.
We maintain life insurance policies for all of our employees. These policies mitigate the risk of having to pay death benefits in the event of an industrial accident. We maintain a directors and officers’ insurance policy covering all directors and certain key executive officers for liabilities incurred in their capacities as directors and officers.
Several of our directors are participants of a voting trust. Each of the trust participants of the voting trust is deemed to have beneficial ownership with shared voting power over the shares deposited in the voting trust. As of MayApril 30, 2008, 6,914,592,8852011, 6,922,159,485 Series B Shares representing 74.78%74.86% of the outstanding Series B Shares were deposited in the voting trust. See “Item 7. Major Shareholders and Related Party Transactions.”
The following table shows the Series B Shares, Series D-B Shares and Series D-L Shares as of MayApril 30, 20082011 beneficially owned by our directors who are participants in the voting trust, other than the shares deposited in the voting trust:
| Series B | Series D-B | Series D-L | Series B | Series D-B | Series D-L | ||||||||||||||||||||||||||||||||||
Beneficial Owner | Shares | Percent of Class | Shares | Percent of Class | Shares | Percent of Class | Shares | Percent of Class | Shares | Percent of Class | Shares | Percent of Class | |||||||||||||||||||||||||||
The estate of Eugenio Garza Lagüera | 7,566,600 | 0.08 | % | 26,654,808 | 0.62 | % | 26,654,808 | 0.62 | % | ||||||||||||||||||||||||||||||
Eva Garza Lagüera Gonda | 2,674,394 | 0.03 | % | 5,331,688 | 0.12 | % | 5,331,688 | 0.12 | % | ||||||||||||||||||||||||||||||
Mariana Garza Lagüera Gonda | 2,665,480 | 0.03 | % | 5,330,960 | 0.12 | % | 5,330,960 | 0.12 | % | ||||||||||||||||||||||||||||||
Barbara Garza Lagüera Gonda | 2,665,480 | 0.03 | % | 5,330,960 | 0.12 | % | 5,330,960 | 0.12 | % | ||||||||||||||||||||||||||||||
Paulina Garza Lagüera Gonda | 2,665,480 | 0.03 | % | 5,330,960 | 0.12 | % | 5,330,960 | 0.12 | % | ||||||||||||||||||||||||||||||
Consuelo Garza de Garza | 63,024,300 | 0.68 | % | 12,754,950 | 0.30 | % | 12,754,950 | 0.30 | % | 69,401,775 | 0.75 | % | 12,574,950 | 0.29 | % | 12,574,950 | 0.29 | % | |||||||||||||||||||||
Alberto Bailleres González | 8,872,881 | 0.10 | % | 11,558,112 | 0.26 | % | 11,558,112 | 0.26 | % | ||||||||||||||||||||||||||||||
Alfonso Garza Garza | 874,347 | — | 1,212,594 | 0.03 | % | 1,212,594 | 0.03 | % | |||||||||||||||||||||||||||||||
Max Michel Suberville | 0 | 0.00 | % | 34,759,260 | 0.80 | % | 34,759,260 | 0.80 | % | 17,379,630 | 0.19 | % | 34,759,260 | 0.80 | % | 34,759,260 | 0.80 | % | |||||||||||||||||||||
Alberto Bailleres | 3,093,825 | 0.03 | % | 11,192,112 | 0.26 | % | 11,192,112 | 0.26 | % | ||||||||||||||||||||||||||||||
Juan Guichard Michel | 366,930 | — | 0 | 0.00 | % | 0 | 0.00 | % | |||||||||||||||||||||||||||||||
Alfonso Garza Garza | 19,200 | — | 324,306 | 0.01 | % | 324,306 | 0.01 | % | |||||||||||||||||||||||||||||||
To our knowledge, no other director or officer is the beneficial owner of more than 1% of any class of our capital stock.
Our bylaws state that the board of directors will meet at least once every three months following the end of each quarter to discuss our operating results and the advancement in the achievement of strategic objectives. Our board of directors can also hold extraordinary meetings. See “Item 10. Additional Information—Bylaws.”
Under our bylaws, directors serve one-year terms although they continue in office even after the term for which they were appointed ends for up to 30 calendar days, as set forth in article 24 of Mexican Securities Law. None of our directors or senior managers of our subsidiaries has service contracts providing for benefits upon termination of employment.employment, other than post-retirement medical services plans and post-retirement pension plans for our senior managers on the same basis as our other employees.
Our board of directors is supported by committees, which are working groups that analyze issues and provide recommendations to the board of directors regarding their respective areas of focus. The executive officers interact periodically with the committees to address management issues. Each committee has a secretary who attends meetings but is not a member of the committee. The following are the three committees of the board of directors:
| • | Audit Committee. The Audit Committee is responsible for (1) reviewing the accuracy and integrity of quarterly and annual financial statements in accordance with accounting, internal control and auditing requirements, (2) |
| • | The Finance and Planning Committee. |
| • | Corporate Practices Committee. |
As of December 31, 2007,2010, our headcount by geographic region was as follows: 70,603112,811 in Mexico, 5,2825,385 in Central America, 7,9618,622 in Colombia, 7,9808,288 in Venezuela, 9,78614,711 in Brazil and 3,4083,992 in Argentina. We include in headcount employees of third partythird-party distributors who we do not consider to be ourand non-management store employees. The table below sets forth headcount for the years ended December 31, 2007, 20062010, 2009 and 2005:2008:
Headcount for the Year Ended December 31,(1)
| Headcount for the Year Ended December 31, | ||||||||||||||||||||||||||||||||||||||||||
| 2007 | 2006 | 2005 | 2010 | 2009 | 2008 | |||||||||||||||||||||||||||||||||||||
| Non-Union | Union | Total | Non-Union | Union | Non-Union | Union | Non-Union | Union | Total | Non-Union | Union | Non-Union | Union | |||||||||||||||||||||||||||||
Sub-holding company | ||||||||||||||||||||||||||||||||||||||||||
Coca-Cola FEMSA(1) | 32,657 | 25,465 | 58,122 | 31,695 | 24,987 | 32,632 | 23,003 | |||||||||||||||||||||||||||||||||||
FEMSA Cerveza | 13,751 | 10,708 | 24,459 | 13,426 | 10,570 | 11,765 | 8,049 | |||||||||||||||||||||||||||||||||||
FEMSA Comercio(2) | 4,488 | 11,336 | 15,824 | 4,072 | 7,380 | 3,863 | 5,371 | |||||||||||||||||||||||||||||||||||
Coca-Cola FEMSA(2) | 35,364 | 33,085 | 68,449 | 35,734 | 31,692 | 34,773 | 30,248 | |||||||||||||||||||||||||||||||||||
FEMSA Comercio(3) | 51,919 | 21,182 | 73,101 | 43,142 | 17,760 | 37,252 | 16,342 | |||||||||||||||||||||||||||||||||||
Other | 2,661 | 3,954 | 6,615 | 1,978 | 3,662 | 1,943 | 4,105 | 6,270 | 5,989 | 12,259 | 6,592 | 4,947 | 6,186 | 4,488 | ||||||||||||||||||||||||||||
Total | 53,557 | 51,463 | 105,020 | 51,171 | 46,599 | 50,203 | 40,528 | 93,553 | 60,256 | 153,809 | 85,468 | 54,399 | 78,211 | 51,078 | ||||||||||||||||||||||||||||
| (1) | As of April 30, 2010, FEMSA no longer controls FEMSA Cerveza. As a result, employee headcount of FEMSA Cerveza as of December 31, 2009 and 2008, is not included for comparable purposes. |
| (2) | Includes employees of |
As of December 31, 2007,2010, our subsidiaries had entered into 420274 collective bargaining or similar agreements with personnel employed at our operations. Each of the labor unions in Mexico is associated with one of 10eight different national Mexican labor organizations. In general, we have a good relationship with the labor unions throughout our operations, except for in Colombia and Venezuela, which are the subject of significant labor-related litigation. See “Item 8. Financial Information—Legal Proceedings—Coca-Cola FEMSA.” The agreements applicable to our Mexican operations generally have an indefinite term and provide for an annual salary review and for review of other terms and conditions, such as fringe benefits, every two years.
The table below sets forth the number of collective bargaining agreements and unions for our employees:
Collective Bargaining Labor Agreements Between
Sub-holding Companies and Unions
As of December 31, 20072010
Sub-holding Company | Collective Bargaining Agreements | Labor Unions | Collective Bargaining Agreements | Labor Unions | ||||||||
Coca-Cola FEMSA | 106 | 41 | 104 | 68 | ||||||||
FEMSA Cerveza | 157 | 8 | ||||||||||
FEMSA Comercio(1) | 80 | 9 | 96 | 4 | ||||||||
Others | 77 | 10 | 72 | 11 | ||||||||
Total | 420 | 68 | 274 | 83 | ||||||||
| (1) | Does not include non-management store employees, who are employed directly by each individual store. |
| ITEM 7. | MAJOR SHAREHOLDERS AND RELATED PARTY TRANSACTIONS |
The following table identifies each owner of more than 5% of any class of our shares known to the company as of MayApril 30, 2008.2011. Except as described below, we are not aware of any holder of more than 5% of any class of our shares. Only the Series B Shares have full voting rights under our bylaws.
Ownership of Capital Stock as of MayApril 30, 20082011
| Series B Shares(1) | Series D-B Shares(2) | Series D-L Shares(3) | Total Shares of FEMSA Common Stock | Series B Shares(1) | Series D-B Shares(2) | Series D-L Shares(3) | Total Shares of FEMSA Common Stock | |||||||||||||||||||||||||||||||||||||||
| Shares Owned | Percent of Class | Shares Owned | Percent of Class | Shares Owned | Percent of Class | Shares Owned | Percent of Class | Shares Owned | Percent of Class | Shares Owned | Percent of Class | |||||||||||||||||||||||||||||||||||
Shareholder | ||||||||||||||||||||||||||||||||||||||||||||||
Technical Committee and Trust Participants under the Voting Trust(4) | 6,914,592,885 | 74.78 | % | 0 | 0 | % | 0 | 0 | % | 38.65 | % | 6,922,159,485 | 74.86 | % | — | 0 | % | — | 0 | % | 38.69 | % | ||||||||||||||||||||||||
William H. Gates III(5) | 281,053,490 | 3.04 | % | 562,106,980 | 13.00 | % | 562,106,980 | 13.00 | % | 7.85 | % | |||||||||||||||||||||||||||||||||||
Aberdeen Asset Management PLC(6) | 196,577,170 | 2.13 | % | 393,154,340 | 9.10 | % | 393,154,340 | 9.10 | % | 5.49 | % | |||||||||||||||||||||||||||||||||||
| (1) | As of |
| (2) | As of |
| (3) | As of |
| (4) | As a consequence of the voting trust’s internal procedures, the following trust participants are deemed to have beneficial ownership with shared voting power over those same deposited shares: BBVA Bancomer Servicios, S.A., as Trustee under Trust No. F/25078-7 (controlled by Max Michel Suberville), |
| (5) | As reported on Schedule 13D filed on March 28, 2011, includes aggregate shares beneficially owned by Cascade Investments, LLC, over which William H. Gates III has sole voting and dispositive power, and shares beneficially owned by the Bill and Melinda Gates Foundation Trust, over which William H. Gates III and Melinda French Gates have shared voting and dispositive power. |
| (6) | As reported on Schedule 13G filed on February 15, 2011 by Aberdeen Asset Management PLC. |
As of May 30, 2008,June 10, 2011, there were 29644 holders of record of ADSs in the United States, which represented approximately 69.9%%58% of our outstanding BD Units. Since a substantial number of ADSs are held in the name of nominees of the beneficial owners, including the nominee of The Depository Trust Company, the number of beneficial owners of ADSs is substantially greater than the number of record holders of these securities.
The trust participants, who are our principal shareholders, agreed in April 1998 to deposit a majority of their shares, which we refer to as the trust assets, of FEMSA into the voting trust, and later entered into an amended agreement on August 8, 2005, following the substitution ofby Banco Invex, S.A. as trustee to the voting trust. The primary purpose of the voting trust is to permit the trust assets to be voted as a block, in accordance with the instructions of the technical committee. The trust participants are separated into seven trust groups and the technical committee is comprised of one representative appointed by each trust group. The number of B Units
corresponding with each trust group (the proportional share of the shares deposited in the trust of such group) determines the number of votes that each trust representative has on the technical committee. Most matters are decided by a simple majority of the trust assets.
The trust participants agreed to certain transfer restrictions with respect to the trust assets. The trust is irrevocable, for a term that will conclude on May 31, 2013 (subject to additional five-year renewal terms), during which time, trust assets may be transferred by trust participants to spouses and immediate family members and, subject to certain conditions, to companies that are 100% owned by trust participants, which we refer to as the permitted transferees, provided in all cases that the transferee agrees to be bound by the terms of the voting trust. In the event that a trust participant wishes to sell part of its trust assets to someone other than a permitted transferee, the other trust participants have a right of first refusal to purchase the trust assets that the trust participant wishes to sell. If none of the trust participants elects to acquire the trust assets from the selling trust participant, the technical committee will have a right to nominate (subject to the approval of technical committee members representing 75% of the trust assets, excluding trust assets that are the subject of the sale) a purchaser for such trust assets. In the event that none of the trust participants or a nominated purchaser elects to acquire trust assets, the selling trust participant will have the right to sell the trust assets to a third partythird-party on the same terms and conditions that were offered to the trust participants. Acquirors of trust assets will only be permitted to become parties to the voting trust upon the affirmative vote by the technical committee of at least 75% of the trust shares, which must include trust shares represented by at least three trust group representatives. In the event that a trust participant holding a majority of the trust assets elects to sell its trust assets, the other trust participants have “tag along” rights that will enable them to sell their trust assets to the acquiror of the selling trust participant’s trust assets.
Because of their ownership of a majority of the Series B Shares, the trust participants may be deemed to control our company. Other than as a result of their ownership of the Series B Shares, the trust participants do not have any voting rights that are different from those of other shareholders.
Interest of Management in Certain Transactions
The following is a summary of transactions we have entered into with entities for which members of our board of directors or management serve as a member of the board of directors or management. Each of these transactions was entered into in the ordinary course of business, and we believe each is on terms comparable to those that could be obtained in arm’s length negotiations with unaffiliated third parties. Under our by-laws, transactions entered with related parties not in the ordinary course of business are subject to the approval of our board of directors, subject to the prior opinion of the auditcorporate practices committee.
On April 30, 2010, José Antonio Fernández Carbajal, our Chairman and Chief Executive Officer, started to serve as a member of the Board of Directors of Heineken Holding, N.V. and the Supervisory Board of Heineken N.V. Javier Astaburuaga Sanjines, our Chief Financial Officer, also serves on the supervisory Board of Heineken N.V. as of April 30, 2010. Since that date, FEMSA Comercio’s purchases of beer in the ordinary course of business from Cuauhtémoc Moctezuma (a wholly-owned subsidiary of the Heineken Group) amounted to Ps. 7,063 million for the last eight months of 2010. During the same period, we also supplied logistic and administrative services to
subsidiaries of Heineken for a total of Ps. 706 million and Ps. 342 million, respectively. As of the end of December 31, 2010 our net due to Heineken amounted to Ps. 1,038 million.
We, along with certain of our subsidiaries, regularly engage in financing and insurance coverage transactions, including entering into loans, bond offerings in the local capital markets and credit line facilities, with subsidiaries of BBVA Bancomer, a financial services holding company of which José Antonio Fernández Carbajal, our Chairman and Chief Executive Officer, Alberto Bailleres González and Ricardo Guajardo Touché, who isare also a directordirectors of FEMSA, are directors. We made interest expense payments and fees paid to BBVA Bancomer in respect of these transactions of Ps. 305108 million, Ps. 257260 million and Ps. 253235 million as of the end of December 31, 2007, 20062010, 2009 and 2005,2008, respectively. The total amount due to BBVA Bancomer as of the end of December 31, 20072010 and 20062009 were Ps. 1,712999 million and Ps. 1,7764,112 million, respectively.respectively, and we also have a balance with BBVA Bancomer of Ps. 2,944 million and Ps. 4,474 million, respectively, as of the end of December 31, 2010 and 2009.
We maintain an insurance policy covering auto insurance and medical expenses for executives issued by Grupo Nacional Provincial, S.A., an insurance company of which the chairman of the board and chief executive officer is Alberto Bailleres González, one of our directors. The aggregate amount of premiums paid under these policies was approximately Ps. 3169 million, Ps. 4178 million and Ps. 5457 million in 2007, 20062010, 2009 and 2005,2008, respectively.
We regularly engage in the ordinary course of business in hedging transactions, and enter into loans and credit line facilities on an arm’s length basis with subsidiaries of Grupo Financiero Banamex, S.A. de C.V., or Grupo Financiero Banamex, a financial services holding company in which Lorenzo Zambrano Treviño, who served as a director of FEMSA until March 2011, also serves as a director of Grupo Financiero Banamex. The interest expense and fees paid to Grupo Financiero Banamex as of December 31, 2010, 2009 and 2008 were Ps. 56 million, Ps. 61 million and Ps. 50 million, respectively; and we also have a balance of Ps. 2,103 as of the end of December 31, 2010 and the total amount due to Grupo Financiero Banamex as of December 31, 2010 and 2009, was Ps. 500 million in each year.
We, along with certain of our subsidiaries, spent Ps. 37 million, Ps. 13 million and Ps. 20 million in the ordinary course of business in 2010, 2009 and 2008, respectively, in publicity and advertisement purchased from Grupo Televisa, S.A.B., a media corporation in which our Chairman and Chief Executive Officer, José Antonio Fernández Carbajal, and two of our Directors, Alberto Bailleres González and Michael Larson, serve as directors.
Coca-Cola FEMSA, in its ordinary course of business, purchased Ps. 1,206 million, Ps. 1,044 million and Ps. 863 million in 2010, 2009 and 2008, respectively, in juices from subsidiaries of Jugos del Valle.
FEMSA Comercio in its ordinary course of business, purchased Ps. 1,3242,018 million, Ps. 1,0341,733 million and Ps. 9501,578 million in 2007, 20062010, 2009 and 2005,2008, respectively, in baked goods and snacks for its stores from subsidiaries of Grupo Bimbo, S.A.B. de C.V., of which the chairman of the board is Roberto Servitje Sendra, who served as a director of FEMSA.FEMSA until March 2011. Additionally, FEMSA Comercio purchased Ps. 1,0641,883 million, Ps. 7751,413 million and Ps. 6281,439 million in 2007, 20062010, 2009 and 2005,2008, respectively, in cigarettes from British American Tobacco Mexico (BAT Mexico), of which Alfredo Livas Cantú, who is member of the board of directors of FEMSA, is also a member of the board of directors of BAT Mexico.directors. These purchases were entered into in the ordinary course of business, and we believe they were made on terms comparable to those that could be obtained in arm’s length negotiations with unaffiliated third parties.
José Antonio Fernández Carbajal, Ricardo Guajardo TouchéEva Garza Lagüera Gonda and Lorenzo H. Zambrano,Armando Garza Sada, who are directors of FEMSA, and Eva Garza de Fernández, who is an alternate director of FEMSA, are also members of the board of directors of ITESM, which is a prestigious university system with headquarters in Monterrey, Mexico, that routinely receives donations from FEMSA and its subsidiaries. As of the end of December 31, 2010, 2009 and 2008, donations to ITESM amounted to Ps. 63 million, Ps. 72 million and Ps. 49 million, respectively.
Business Transactions between Coca-Cola FEMSA and The Coca-Cola Company
Coca-Cola FEMSA regularly engages in transactions with The Coca-Cola Company and its affiliates. Coca-Cola FEMSA purchases all of its concentrate requirements forCoca-Cola trademark beverages from The
Coca-Cola Company. Total payments by Coca-Cola FEMSA to The Coca-Cola Company for concentrates were approximately Ps. 12,23919,371 million, Ps. 10,32216,863 million and Ps. 9,11213,518 million in 2007, 20062010, 2009 and 2005,2008, respectively. Coca-Cola FEMSA and The Coca-Cola Company pay and reimburse each other for marketing expenditures. The Coca-Cola Company also contributes to Coca-Cola FEMSA’s refrigeration equipmentcoolers, bottles and cases investment program. Coca-Cola FEMSA received contributions to its marketing expenses which include its refrigeration equipmentand the coolers investment program, of Ps. 1,5822,386 million, Ps. 1,2611,945 million and Ps. 1,0981,995 million in 2007, 20062010, 2009 and 2005,2008, respectively.
OnIn December 2007 and in May 2008, Coca-Cola FEMSA sold certainmost of its proprietary brands to The Coca-Cola Company. These trademarksThe proprietary brands are now being licensed back to Coca-Cola FEMSA by The Coca-Cola Company.Company pursuant to Coca-Cola FEMSA’s bottler agreements. The December 2007 transaction was valued at US$ 48 million and the May 2008 transaction was valued at US$ 16 million. Coca-Cola FEMSA believes that both of these transactions were conducted on an arm’s length basis. Revenues from the sale of proprietary brands realized in prior years in which Coca-Cola FEMSA has a significant continuing involvement are deferred and amortized against the related costs of future sales over the estimated sales period. The balance to be amortized amounted to Ps. 547 million, Ps. 616 million and Ps. 571 million as of December 31, 2010, 2009 and 2008, respectively. The short-term portions are included in other current liabilities as of December 31, 2010, 2009 and 2008, and amounted to Ps. 276 million, Ps. 203 million and Ps. 139 million, respectively.
In Argentina, Coca-Cola FEMSA purchases a portion of its plastic ingot requirements for producing plastic bottles and all of its returnable plastic bottle requirements from Embotelladora del Atlántico S.A., a local subsidiary of Embotelladora Andina, S.A., a Coca-Cola bottler with operations in Argentina, Chile and Brazil in which The Coca-Cola Company has a substantial interest.
In connection with the acquisition of Panamco, subsidiaries of The Coca-Cola Company made specified undertakings to support and facilitate the Panamco acquisition for the benefit of Coca-Cola FEMSA. In consideration for these undertakings, Coca-Cola FEMSA made certain undertakings for the benefit of The Coca-Cola Company and its subsidiaries, including indemnity obligations with respect to specified matters relating to the accuracy of disclosure and the compliance with applicable law by Coca-Cola FEMSA’s board of directors and the board of directors of Panamco and undertakings to take specified actions and refrain from specified others to facilitate the ability of The Coca-Cola Company to receive favorable tax treatment in connection with its participation in the acquisition. In connection with the execution of the acquisition agreement for Panamco, The Coca-Cola Company and FEMSA memorialized their understandings relating to specified operational and business issues that may affect Coca-Cola FEMSA following completion of the acquisition. A summary of these understandings is set forth under “Item 10. Additional Information—Material Contracts—The Coca-Cola Memorandum.”
On November 8, 2007, Administración S.A.P.I. de C.V., a Mexican company jointly owned by Coca-Cola FEMSA and The Coca-Cola Company,S.A.P.I acquired 58,350,908 shares, representing 100% of the shares of capital stock of Jugos del Valle. The business of Jugos del Valle in the United States was acquired and sold by The Coca-Cola Company. In June 2008, Administración S.A.P.I. and Jugos del Valle (surviving company) were merged. Subsequently, Coca-Cola FEMSA and The Coca-Cola Company and all Mexican and BrazilianCoca-Cola bottlers entered into a joint business for US$ 370 million (Ps. 4,020 million), paidthe Mexican and the Brazilian operations, respectively, of Jugos del Valle, through transactions completed during 2008. Coca-Cola FEMSA holds an interest of approximately 20% in cash, assuming liabilitieseach of the Mexican and the Brazilian joint businesses. Jugos del Valle sells juice-based beverages and fruit derivatives. Coca-Cola FEMSA distributes the Jugos del Valle line of juice-based beverages in Brazil and its territories in Latincentro.
In February 2009, Coca-Cola FEMSA acquired with The Coca-Cola Company theBrisa bottled water business in Colombia from Bavaria, a subsidiary of SABMiller. Coca-Cola FEMSA acquired the production assets and the rights to distribute in the territory, and The Coca-Cola Company acquired theBrisa brand. Coca-Cola FEMSA and The Coca-Cola Company equally shared in paying the purchase price of US$ 86 million (Ps. 934 million).92 million. Following a transition period, in June 2009, Coca-Cola FEMSA started to sell and distribute theBrisa portfolio of products in Colombia.
In May 2009, Coca-Cola FEMSA completed a transaction to develop theCrystal trademark water business in Brazil jointly with The Coca-Cola Company.
In August 2010, Coca-Cola FEMSA acquired from The Coca-Cola Company along with other BrazilianCoca-Colabottlers the business operations of theMatte Leaotea brand. Coca-Cola FEMSA currently has a 13.84% indirect interest in theMatte Leão business in Brazil.
In September 2010, FEMSA sold Promotora to The Coca-Cola Company. Promotora was the owner of theMundet brands of soft drinks in Mexico.
In March 2011, Coca-Cola FEMSA, together with The Coca-Cola Company, acquired Grupo Estrella Azul, a Panamanian conglomerate that participates in the dairy and juice-based beverage categories in Panama. Coca-Cola FEMSA will continue to develop this business jointly with The Coca-Cola Company.
| ITEM 8. | FINANCIAL INFORMATION |
Consolidated Financial Statements
See pages F-1 through F-56,F-145, incorporated herein by reference.
For a discussion of our dividend policy, see “Item 3. Key Information—Dividends” and “Item 10. Additional Information.”
We are party to various legal proceedings in the ordinary course of business. Other than as disclosed in this annual report, we are not currently involved in any litigation or arbitration proceeding, including any proceeding that is pending or threatened of which we are aware, which we believe will have, or has had, a material adverse effect on our company. Other legal proceedings that are pending against or involve us and our subsidiaries are incidental to the conduct of our and their business. We believe that the ultimate disposition of such other proceedings individually or on an aggregate basis will not have a material adverse effect on our consolidated financial condition or results offrom operations.
Coca-Cola FEMSA
Mexico
Antitrust Matters
During 2000, theComisión Federal de Competencia in Mexico (the Mexican(Mexican Antitrust Commission)Commission or CFC), pursuant to complaints filed by PepsiCo. and certain of its bottlers in Mexico, startedbegan an investigation of The Coca-Cola Company and its bottlers. Later in 2002, the Mexican Antitrust Commission determined that TheCoca-ColaCompany’s bottlers engaged inExport Corporation (TCCEC) for alleged monopolistic practices through exclusivity arrangements with certain retailers. The
After the corresponding legal proceedings in 2008 in theTribunal Colegiado de Circuito (Mexican Federal Court), a final adverse judgment was rendered against two of the six Mexican Antitrust Commission did not impose any fines, but ordered TheCoca-Cola Company’s bottlers, including certain of Coca-Cola FEMSA’s Mexican subsidiaries, to abstain from entering into any exclusivity arrangement with retailers that stock soft drink bottles of up to 2.0-liters. Coca-Cola FEMSA along with otherCoca-Cola bottlers, appealed the resolution rendered in February 2002subsidiaries involved, upholding a fine of approximately Ps. 10.5 million imposed by aRecurso de Reconsideración (Review Recourse) that was presented before the Mexican Antitrust Commission. The Mexican Antitrust Commission confirmed its original determination and issued a confirmatory resolution in July 2002. Coca-Cola FEMSA and its Mexican operating subsidiaries appealed this resolution before a Mexican federal court by initiating severaljuicios de amparo (appeals basedCFC on the violation of constitutional rights) and obtained favorable final decisions not subject to appeal. Under these judicial decisions, the resolution was declared null and void and the Mexican Antitrust Commission was ordered to issue a new resolution.
The case was inactive until May 2005, when the Mexican Antitrust Commission ordered the reopeningeach of the proceeding. In the proceeding, the Mexican Antitrust Commission determined, as in its first instance resolution, that the Coca-Cola bottlers engaged in monopolistic practicestwo subsidiaries and (1) ordered theordering immediate suspension of such practices of alleged exclusivity arrangements and (2) imposed a fine of approximately Ps. 10.5 million to each of the six subsidiary companies investigated.
Coca-Cola FEMSA filed anamparo proceeding challenging this rule in Mexican federal court, and an order was issued in its favor that granted protection against the resolution of the Mexican Antitrust Commission. The Mexican Antitrust Commission and the plaintiffs appealed this order before aTribunal Colegiado de Circuito (Mexican Federal Court), which in turn sent the case to theSuprema Corte de Justicia de la Nación(Mexican Supreme Court) to render a final decision on this matter based on constitutional questions.conditional dealing. The Mexican Supreme Court rendered a decision and sentdecided to resolve the case backproceedings with respect to the Mexican Federal Court. In May 2008, a final judgment was issued bycomplaints against the remaining four subsidiaries, and on June 9, 2010, the Mexican Federal Court against twoordered the CFC to reconsider certain aspects of these proceedings. In March 2011, the CFC ruled in favor of Coca-Cola FEMSA’s subsidiaries, imposingon the grounds of insufficient evidence to prove individual and specific liability of its subsidiaries in the alleged antitrust violations. PepsiCo filed for an administrative recourse against the CFC’s resolution.
In February 2009, the CFC began a finenew investigation of approximately Ps. 10.5 millionalleged monopolistic practices consisting of sparkling beverage sales subject to each company.exclusivity agreements and the granting of discounts and/or benefits in exchange for exclusivity arrangements with certain retailers. As part of this investigation, the CFC has been requiring several Coca-Cola bottlers in Mexico to deliver information regarding their commercial practices and Coca-Cola FEMSA is still awaitingwas required to do so in February 2010. In the final judgment for the remaining four subsidiaries.
In March 2003, in a separate proceeding, the Mexican Antitrust Commission started an investigation involving The Coca-Cola Company, Coca-Cola FEMSA and certain other Coca-Cola bottlers due to complaints filed by some retailers and Ajemex, S.A. de C.V. (Big Cola). In September 2003, the Mexican Antitrust Commission requested certainCoca-Cola bottlers, including some of Coca-Cola FEMSA’s Mexican subsidiaries, to provide information. Coca-Cola FEMSA initiatedamparoproceedings, and a Mexican federal court issued a final ruling statingevent that the requests for information were unconstitutional. In August 2004, however, as a resultCFC finds evidence of monopolistic practices, it may begin administrative proceedings against the companies involved. We cannot determine the scope of the investigation the Mexican Antitrust Commission issued severalOficios de Presunta Responsabilidad (Statement of Charges) asserting that Coca-Cola FEMSA and its Mexican operating subsidiaries, as well as other bottlers, engaged in monopolistic practices and requested additional information. Coca-Cola FEMSA replied to the statement of charges by offering certain evidence, including expert witness reports, which were rejected by the Mexican Antitrust Commission.
The Mexican Antitrust Commission subsequently issued a new order requesting market information. Coca-Cola FEMSA challengedat this request in Mexican federal court again throughamparo proceedings. The Mexican Antitrust Commission initiated a period for the offering of pleadings during which Coca-Cola FEMSA filed the relevant pleadings. The Mexican Antitrust Commissiontime.
issued a resolution, whereby it was determined that certain of Coca-Cola FEMSA’s Mexican subsidiaries engaged in anticompetitive practices and (1) ordered the immediate suspension of such practices of alleged exclusivity arrangements conditioned dealing and (2) imposed a fine of approximately Ps. 10.5 million to each of the six Coca-Cola FEMSA subsidiary companies investigated.
The investigated companies filed an appeal before the Mexican Antritrust Commission, which affirmed its prior resolution. Coca-Cola FEMSA filed an amparo proceeding challenging this ruling and the court issued a judgment against Coca-Cola FEMSA. Coca-Cola FEMSA appealed this order before a Mexican federal court, which in turn sent the case to the Mexican Supreme Court to render a final decision on this matter based on constitutional questions. The Mexican Supreme Court rendered a decision and sent the case back to the Mexican Federal Court. In June 2008, Coca-Cola FEMSA was informed that a final judgment was issued against the six Coca-Cola FEMSA subsidiary companies. Coca-Cola FEMSA has not yet received the text of the resolution.
Central America
Antitrust Matters in Costa Rica
During August 2001, theComisión para Promover la Competenciain Costa Rica (Costa Rican Antitrust Commission), pursuant to a complaint filed by PepsiCo. and its bottler in Costa Rica, initiated an investigation of the sales practices of The Coca-Cola Company and Coca-Cola FEMSA’s Costa Rican subsidiary for alleged monopolistic practices in retail distribution, including sales exclusivity arrangements. A ruling from the Costa Rican Antitrust Commission was issued in July 2004, which found the companyCoca-Cola FEMSA’s subsidiary in Costa Rica engaged in monopolistic practices with respect to exclusivity arrangements, pricing and the sharing of refrigeration equipmentcoolers under certain limited circumstances and imposed a fine of US$ 130,000 fine.(approximately Ps. 1.5 million). Coca-Cola FEMSA’s appeal of the Costa Rican Antitrust Commission’s ruling was dismissed. Coca-Cola FEMSA has filed judicial proceedings challenging the ruling of the Costa Rican Antitrust Commission and the process is still pending in court. We do not believe that this matter will not have a material adverse effect on its financial condition or results offrom operations.
In November, 2004,Ajecen del Sur S.A., the bottler ofBig Cola in Costa Rica, filed a complaint before the Costa Rican Antitrust Commission related to monopolistic practices in retail distribution and exclusivity agreements against The Coca-Cola Company and Coca-Cola FEMSA’s Costa Rican subsidiary. The Costa Rican Antitrust Commission has decided to pursue an investigation. The period for gathering of evidence ended in August 2006,2008, and the final arguments have been filed. Coca-Cola FEMSA expects that the maximum fine that could be imposed is US$ 300,000 (approximately Ps. 3.5 million). Coca-Cola FEMSA is waiting for the final resolution to be issued by the Costa Rican Antitrust Commission, which has been delayed since one of the judges has been changed.Commission.
Colombia
Labor Matters
During July 2001, a labor union and several individuals from the Republic of Colombia filed a lawsuit in the U.S. District Court for the Southern District of Florida against certain of Coca-Cola FEMSA’s subsidiaries. In the complaint, theThe plaintiffs alleged that the subsidiaries of the company acquired in the Panamco acquisition engaged in wrongful acts against the labor union and its members in Colombia, including kidnapping, torture, death threats and intimidation. The complaint alleges claims under the U.S. Alien Tort Claims Act, Torture Victim Protection Act, Racketeer Influenced and Corrupt Organizations Act and state tort law and seeks injunctive and declaratory relief and damages of more than US$ 500 million, including treble and punitive damages and the cost of the suit, including attorney fees. Coca-Cola FEMSA filed a motion to dismissIn September 2006, the complaint on jurisdictional grounds. Thefederal district court also granteddismissed the motion to dismisscomplaint with respect to all claims. The plaintiffs appealed and in August 2009, the Appellate Court affirmed the decision in favor of Coca-Cola FEMSA’s subsidiaries. The plaintiffs moved for a rehearing, and in September 2009, the claims inrehearing motion was denied. Plaintiffs attempted to seek reconsiderationen banc, but so far, the lawsuit. Plaintiffs initially filed a motion of appeal and subsequently moved to stay the appellate proceedings. We believe this lawsuit is without merit and intends to defend itself in this matter.court has not considered it.
Venezuela
Tax Matters
In 1999, certainsome of Coca-Cola FEMSA’s Venezuelan subsidiaries received notice of certainindirect tax claims asserted by the Venezuelan tax authorities. These subsidiaries have taken the appropriate recoursemeasures against these claims at the administrative level as well as beforeand filed appeals with the courts in Venezuela.Venezuelan courts. The claims currently totalamount to approximately US$ 15.6 million. The company21.1 million (approximately Ps. 250 million). Coca-Cola FEMSA has certain rights to indemnification from Venbottling Holding, Inc., a former shareholder of Panamco and The Coca-Cola Company, for a substantial portion of the claims. Coca-Cola FEMSA does not believe that the ultimate dispositionresolution of these cases will have a material adverse effect on its financial condition or results offrom operations.
Labor and Distribution Matters
Since 2001, Coca-Cola FEMSA’s Venezuelan subsidiaries have been the subject of more than 400 claims and lawsuits by former independent distributors claiming alleged labor and severance rights owed to them at the time of the termination of their relationship with Coca-Cola FEMSA. In August 2007, Coca-Cola FEMSA’s Venezuelan subsidiary was able to settle the majority of claims through a special mediation process guided by the Venezuelan Supreme Court. After the settlement of these claims, the Supreme Court invited Coca-Cola FEMSA’s Venezuelan subsidiary to participate in a new mediation and negotiation process to discuss severance claims for which the statute of limitations had expired. Coca-Cola FEMSA has voluntarily agreed to participate in this process and discussions are ongoing.
Brazil
Antitrust Matters
Several claims have been filed against Coca-Cola FEMSA by private parties which are currently pending before the Brazilian Ministry of Law and Economics that allege anticompetitive practices by Coca-Cola FEMSA’s Brazilian subsidiaries. The plaintiffs are Ragi (Dolly), a Brazilian producer of “B Brands,” and PepsiCo.PepsiCo alleging anticompetitive practices by Spal Indústria Brasileira de Bebidas S.A. and Recofarma Indústria do Amazonas Ltda. Of the four claims Dolly filed against Coca-Cola FEMSA, the only one remaining concerns a denial of access to common suppliers. Of the two claims made by PepsiCo, the first concerns exclusivity arrangements at the point of sale, and the second is a corporate espionage allegation against the Pepsi bottler, BAESA, which the Ministry of Economy recommended be dismissed for lack of evidence. Under Brazilian law, each of these claims could result in substantial monetary fines and other penalties. We believepenalties, although Coca-Cola FEMSA believes each of the claims is without merit,merit.
Since December 31, 2010, the following significant changes have occurred in our business, each of which is described in more detail in “Item 5. Operating and it intendsFinancial Review and Prospects—Recent Developments” and in Note 30 to defend itself in these matters.our audited consolidated financial statements:
On March 17, 2011 a consortium of investors formed by FEMSA, Cerveza
Antitrust Matters
In June 2003, the Macquarie Mexican Antitrust Commission disclosed its intention to launch an investigation into the alleged beer industry practiceInfrastructure Fund and other investors, acquired Energia Alterna Istmeña, S. de R.L. de C.V. (EAI) and Energia Eólica Mareña, S.A. de C.V. (EEM), from subsidiaries of tied-customer arrangements.Preneal, S.A. for a transaction enterprise value of Ps. 1,063.5 million. FEMSA Cerveza was among the brewers that receivedowns a request for information from the Mexican Antitrust Commission and responded by filing several amparo proceedings challenging the legality of the Commission’s actions. Thus far, the Mexican federal courts have ruled on all of these proceedings, finding no proper support or validity with respect to the Mexican Antitrust Commission’s request. As of the date of this annual report, the Mexican Antitrust Commission has not formally closed its investigation nor charged FEMSA Cerveza with any illegal behavior. In June 2008, the prescription period for the action by the Antitrust Commission will expire. However, FEMSA Cerveza cannot give any assurances that any action taken as a result of this investigation will not negatively affect FEMSA Cerveza’s operations45% interest in the future.consortium.
In August 2004,
On March 28, 2011, Coca-Cola FEMSA, together with The Coca-Cola Company, completed the Mexican Antitrust Commission disclosedacquisition of Grupo Estrella Azul, a Panamanian conglomerate that it was launching an investigation into beer industry practices with respect to exclusivity arrangements withinparticipates in the beer industry,dairy and we and FEMSA Cerveza were among the companies that received requests for informationjuice-based beverage categories in September 2004 from the Mexican Antitrust Commission. In October 2004, we and FEMSA Cerveza filed amparo proceedings before the appropriate Mexican federal district courts to challenge the grounds of the Mexican Antitrust Commission’s investigation and the requests for information. Concluding that we and FEMSA Cerveza unjustifiably failed to provide the information and documents requested by the Mexican Antitrust Commission, the Antitrust Commission imposed minor monetary fines on both us and FEMSA Cerveza, who challenged the corresponding resolutions.Panama.
In October 2005, as a result of its investigation, the Mexican Antitrust Commission issued an Oficio de Presunta Responsabilidad (Statement of Charges) asserting that FEMSA and FEMSA Cerveza had engaged in alleged monopolistic practices. FEMSA and FEMSA Cerveza filed a rebuttal to such statement of charges and the proceedings are ongoing. In June 2007, the Antitrust Commission closed its investigation and found in favor of FEMSA and FEMSA Cerveza.
| ITEM 9. | THE OFFER AND LISTING |
We have three series of capital stock, each with no par value:
Series B Shares;
Series D-B Shares; and
Series D-L Shares.
Series B Shares have full voting rights, and Series D-B and D-L Shares have limited voting rights. The shares of our company are not separable and may be transferred only in the following forms:
B Units, consisting of five Series B Shares; and
BD Units, consisting of one Series B Share, two Series D-B Shares and two Series D-L Shares.
At our annual general ordinary shareholders’ meetingAGM held on March 29, 2007, our shareholders approved a three-for-one stock split in respect all of our outstanding capital stock. Following the stock split, our total capital stock consists of 2,161,177,770 BD Units and 1,417,048,500 B Units. Our stock split also resulted in a three-for-one stock split of our American Depositary Shares. The stock-split was conduced on a pro-rata basis in respect of all holders of our shares and all ADSs holders of record as of May 25, 2007, and the ratio of voting and non-voting shares was maintained, thereby preserving our ownership structure as it was prior to the stock-split.
On April 22, 2008, FEMSA shareholders approved a proposal to amend our bylaws in order to preserve the unit structure for our shares that has been in place since May 1998, and to maintain our existing share structure beyond May 11, 2008, absent further shareholder action.
Previously, our bylaws provided that on May 11, 2008, each Series D-B Share would automatically convert into one Series B Share with full voting rights, and each Series D-L Share would automatically convert into one Series L Share with limited voting rights. At that time:
the BD Units and the B Units would cease to exist and the underlying Series B Shares and Series L Shares would be separate; and
the Series B Shares and Series L Shares would be entitled to share equally in any dividend, and the dividend preferences of the Series D-B Shares and Series D-L Shares of 125% of any amount distributed in respect of each Series B Share existing prior to May 11, 2008, would be terminated.
However, following the April 22, 2008, shareholder approvals, these changes will no longer occur and instead orour share and unit structure will remain unchanged, absent shareholder action, as follows:
the BD Units and the B Units will continue to exist; and
the dividend preferences of the Series D-B Shares and Series D-L Shares of 125% of any amount distributed in respect of each Series B Share will continue to exist.
The following table sets forth information regarding our capital stock as of May 30, 2008:31, 2011:
| Number | Percentage of Capital | Percentage of Voting | Number | Percentage of Capital | Percentage of Full Voting Rights | |||||||||||||||
Class | ||||||||||||||||||||
Series B Shares (no par value) | 9,246,420,270 | 51.7 | % | 100.0 | % | 9,246,420,270 | 51.68 | % | 100 | % | ||||||||||
Series D-B Shares (no par value) | 4,322,355,540 | 24.2 | 0 | 4,322,355,540 | 24.16 | % | 0 | % | ||||||||||||
Series D-L Shares (no par value) | 4,322,355,540 | 24.2 | 0 | 4,322,355,540 | 24.16 | % | 0 | % | ||||||||||||
Total Shares | 17,891,131,350 | 100.0 | 100.0 | 17,891,131,350 | 100 | % | 100 | % | ||||||||||||
Units | ||||||||||||||||||||
BD Units | 2,161,177,770 | 60.4 | 23.4 | 2,161,177,770 | 60.38 | % | 23.47 | % | ||||||||||||
B Units | 1,417,048,500 | 39.6 | 76.6 | 1,417,848,500 | 39.62 | % | 76.63 | % | ||||||||||||
Total Units | 3,578,226,270 | 100.0 | 100.0 | 3,578,226,270 | 100 | % | 100 | % | ||||||||||||
Since May 11, 1998, ADSs representing BD Units have been listed on the New York Stock Exchange, and the BD Units and the B Units have been listed on the Mexican Stock Exchange. Each ADS represents 10 BD Units deposited under the deposit agreement with the ADS depositary. As of June 10, 2011, approximately 58% of BD Units traded in the form of ADSs.
The New York Stock Exchange trading symbol for the ADSs is “FMX” and the Mexican Stock Exchange trading symbols are “FEMSA UBD” for the BD Units and “FEMSA UB” for the B Units.
Fluctuations in the exchange rate between the Mexican peso and the U.S. dollar have affected the U.S. dollar equivalent of the Mexican peso price of our shares on the Mexican Stock Exchange and, consequently, have also affected the market price of our ADSs. See “Item 3. Key Information—Exchange Rate Information.”
Trading on the Mexican Stock Exchange
The Mexican Stock Exchange, located in Mexico City, is the only stock exchange in Mexico. Founded in 1907, it is organized as a corporation, the shares of which are held by 33 brokerage firms, that are exclusively authorized to trade on the exchange.sociedad anónima bursátil. Trading on the Mexican Stock Exchange takes place principally through automated systems and is open between the hours of 8:9:30 a.m. and 3:4:00 p.m. Mexico City time,Eastern Time, each business day. Trades in securities listed on the Mexican Stock Exchange can also be effected off the exchange. The Mexican Stock Exchange operates a system of automatic suspension of trading in shares of a particular issuer as a
means of controlling excessive price volatility, but under current regulations this system does not apply to securities such as the BD Units that are directly or indirectly (for example, in the form of ADSs) quoted on a stock exchange (including for these purposes the New York Stock Exchange) outside Mexico.
Settlement is effected three business days after a share transaction on the Mexican Stock Exchange. Deferred settlement, even by mutual agreement, is not permitted without the approval of theComisión Nacional Bancaria y de Valores (the Mexican(Mexican National Banking and Securities Commission)Commission or CNBV.CNBV). Most securities traded on the Mexican Stock Exchange, including ours, are on deposit withS.D. Indeval S.A. de C.V., Instituto para el Depósito de Valores S.A. de C.V., which we refer to as Indeval, a privately owned securities depositary that acts as a clearinghouse for Mexican Stock Exchange transactions.
The following tables set forth, for the periods indicated, the reported high, low and closing sale prices and the average daily trading volumes for the B Units and BD Units on the Mexican Stock Exchange and the reported high, low and closing sale prices and the average daily trading volumes for the ADSs on the New York Stock Exchange.
| B Units(1) | B Units(1) | |||||||||||||||||||||||||||||||||||
| Nominal pesos | Close US$(4) | Average Daily Trading Volume (Units) | Nominal pesos | Close US$(4) | Average Daily Trading Volume (Units) | |||||||||||||||||||||||||||||||
| High (2) | Low (2) | Close (3) | FX rate | High(2) | Low(2) | Close(3) | FX rate | |||||||||||||||||||||||||||||
2003 | 13.63 | 11.23 | 12.90 | 11.24 | 1.15 | 6,833 | ||||||||||||||||||||||||||||||
2004 | 17.33 | 13.17 | 17.33 | 11.15 | 1.55 | 12,835 | ||||||||||||||||||||||||||||||
2005 | 24.17 | 15.60 | 21.67 | 10.63 | 2.04 | 674,773 | ||||||||||||||||||||||||||||||
2006 | 34.03 | 23.00 | 33.33 | 10.80 | 3.09 | 197,478 | ||||||||||||||||||||||||||||||
2007 | 42.33 | 31.79 | 37.00 | 10.92 | 3.39 | 1,814 | ||||||||||||||||||||||||||||||
2008 | 46.00 | 32.00 | 34.99 | 13.83 | 2.53 | 7,286 | ||||||||||||||||||||||||||||||
2009 | ||||||||||||||||||||||||||||||||||||
First Quarter | 30.00 | 23.00 | 30.00 | 10.90 | 2.75 | 644,887 | 34.00 | 30.50 | 30.50 | 14.21 | 2.15 | 18 | ||||||||||||||||||||||||
Second Quarter | 34.03 | 30.67 | 30.67 | 11.29 | 2.72 | 242,022 | 38.79 | 31.00 | 35.60 | 13.17 | 2.70 | 556 | ||||||||||||||||||||||||
Third Quarter | 33.33 | 30.33 | 33.33 | 10.98 | 3.04 | 2,476 | 41.00 | 35.00 | 38.60 | 13.48 | 2.86 | 363 | ||||||||||||||||||||||||
Fourth Quarter | 33.67 | 32.17 | 33.33 | 10.80 | 3.09 | 3,742 | 57.00 | 38.00 | 55.00 | 13.06 | 4.21 | 440 | ||||||||||||||||||||||||
2007 | ||||||||||||||||||||||||||||||||||||
2010 | ||||||||||||||||||||||||||||||||||||
First Quarter | 42.33 | 33.33 | 40.67 | 11.04 | 3.68 | 4,133 | 55.00 | 44.00 | 48.50 | 12.30 | 3.94 | 1,900 | ||||||||||||||||||||||||
Second Quarter | 42.00 | 40.33 | 41.68 | 10.79 | 3.86 | 875 | 51.00 | 45.05 | 49.97 | 12.83 | 3.89 | 1,881 | ||||||||||||||||||||||||
Third Quarter | 41.68 | 36.70 | 37.80 | 10.93 | 3.46 | 1,559 | 51.99 | 47.50 | 50.50 | 12.63 | 4.00 | 1,364 | ||||||||||||||||||||||||
Fourth Quarter | 37.80 | 31.79 | 37.00 | 10.92 | 3.39 | 2,096 | 57.99 | 49.50 | 57.98 | 12.38 | 4.68 | 1,629 | ||||||||||||||||||||||||
October | 37.80 | 37.80 | 37.80 | 10.70 | 3.53 | 100 | 52.30 | 49.50 | 51.00 | 12.34 | 4.13 | 2,406 | ||||||||||||||||||||||||
November | 37.80 | 31.79 | 31.79 | 10.90 | 2.92 | 5,038 | 54.33 | 51.00 | 54.33 | 12.45 | 4.36 | 2,200 | ||||||||||||||||||||||||
December | 37.00 | 33.68 | 37.00 | 10.92 | 3.39 | 2,191 | 57.99 | 54.12 | 57.98 | 12.38 | 4.68 | 638 | ||||||||||||||||||||||||
2008 | ||||||||||||||||||||||||||||||||||||
First Quarter | 41.95 | 32.00 | 41.94 | 10.63 | 3.95 | 692 | ||||||||||||||||||||||||||||||
2011 | ||||||||||||||||||||||||||||||||||||
January | 41.00 | 32.00 | 33.00 | 10.82 | 3.05 | 771 | 57.99 | 52.00 | 52.00 | 12.15 | 4.28 | 1,810 | ||||||||||||||||||||||||
February | 41.95 | 37.00 | 41.95 | 10.73 | 3.91 | 2,800 | 55.00 | 50.00 | 50.01 | 12.11 | 4.13 | 1,213 | ||||||||||||||||||||||||
March | 41.94 | 41.94 | 41.94 | 10.63 | 3.95 | 200 | 52.00 | 50.00 | 51.50 | 11.92 | 4.32 | 3,836 | ||||||||||||||||||||||||
First Quarter | 57.99 | 50.00 | 51.50 | 11.92 | 4.32 | 2,062 | ||||||||||||||||||||||||||||||
April | 46.00 | 44.99 | 44.99 | 10.51 | 4.28 | 1,006 | 55.00 | 51.50 | 54.99 | 11.52 | 4.77 | 1,568 | ||||||||||||||||||||||||
May | 45.00 | 40.00 | 40.00 | 10.33 | 3.87 | 79,447 | 56.00 | 53.00 | 56.00 | 11.58 | 4.83 | 1,374 | ||||||||||||||||||||||||
June(5) | 40.00 | 40.00 | 40.00 | 10.37 | 3.86 | 3,025 | 56.00 | 56.00 | 56.00 | 11.87 | 4.72 | — | ||||||||||||||||||||||||
| (1) | The prices and average daily trading volume for the B Units were taken from Bloomberg and reflect our 3:1 stock split, which was effective May 25, 2007. |
| (2) | High and low closing prices for the periods presented. |
| (3) | Closing price on the last day of the periods presented. |
| (4) | Represents the translation from Mexican pesos to U.S. dollars of the closing price of the B Units on the last day of the periods presented based on the noon buying rate for the purchase of U.S. dollars, as reported by the Federal Reserve Bank of New York |
| (5) | Information from June 1, |
| BD Units(1) | BD Units(1) | |||||||||||||||||||||||||||||||||||
| Nominal pesos | Close US$(4) | Average Daily Trading Volume (Units) | Nominal pesos | Close US$(4) | Average Daily Trading Volume (Units) | |||||||||||||||||||||||||||||||
| High (2) | Low (2) | Close (3) | FX rate | High(2) | Low(2) | Close(3) | FX rate | |||||||||||||||||||||||||||||
2003 | 14.89 | 11.17 | 13.83 | 11.24 | 1.23 | 3,033,155 | ||||||||||||||||||||||||||||||
2004 | 19.87 | 13.67 | 19.50 | 11.15 | 1.75 | 3,314,115 | ||||||||||||||||||||||||||||||
2005 | 26.46 | 18.63 | 25.69 | 10.63 | 2.42 | 2,088,995 | ||||||||||||||||||||||||||||||
2006 | 42.25 | 25.69 | 41.72 | 10.80 | 3.86 | 2,368,706 | ||||||||||||||||||||||||||||||
2007 | 48.58 | 32.73 | 41.70 | 10.92 | 3.82 | 3,889,800 | ||||||||||||||||||||||||||||||
2008 | 49.19 | 26.10 | 41.37 | 13.83 | 2.99 | 3,089,044 | ||||||||||||||||||||||||||||||
2009 | ||||||||||||||||||||||||||||||||||||
First Quarter | 33.57 | 25.69 | 33.15 | 10.90 | 3.04 | 2,549,119 | 44.24 | 30.49 | 35.86 | 14.21 | 2.52 | 3,032,889 | ||||||||||||||||||||||||
Second Quarter | 35.36 | 27.91 | 31.64 | 11.29 | 2.80 | 2,635,345 | 45.99 | 35.32 | 42.41 | 13.17 | 3.22 | 2,833,756 | ||||||||||||||||||||||||
Third Quarter | 36.44 | 29.53 | 35.59 | 10.98 | 3.24 | 1,793,562 | 52.26 | 40.98 | 51.38 | 13.48 | 3.81 | 2,637,506 | ||||||||||||||||||||||||
Fourth Quarter | 42.25 | 34.20 | 41.72 | 10.80 | 3.86 | 2,526,820 | 63.20 | 55.92 | 62.65 | 13.06 | 4.80 | 3,552,563 | ||||||||||||||||||||||||
2007 | ||||||||||||||||||||||||||||||||||||
2010 | ||||||||||||||||||||||||||||||||||||
First Quarter | 48.58 | 39.10 | 40.68 | 11.04 | 3.68 | 4,257,029 | 64.39 | 53.33 | 59.03 | 12.30 | 4.80 | 4,213,385 | ||||||||||||||||||||||||
Second Quarter | 43.52 | 38.75 | 42.41 | 10.79 | 3.93 | 5,279,190 | 58.94 | 53.22 | 55.68 | 12.83 | 4.34 | 3,066,006 | ||||||||||||||||||||||||
Third Quarter | 43.13 | 36.17 | 40.76 | 10.93 | 3.73 | 3,281,171 | 66.14 | 55.79 | 63.66 | 12.63 | 5.04 | 3,526,727 | ||||||||||||||||||||||||
Fourth Quarter | 42.42 | 32.73 | 41.70 | 10.92 | 3.82 | 2,771,261 | 71.21 | 62.58 | 69.32 | 12.38 | 5.60 | 3,177,203 | ||||||||||||||||||||||||
October | 42.42 | 37.45 | 37.45 | 10.70 | 3.50 | 2,688,461 | 68.27 | 62.58 | 67.98 | 12.34 | 5.51 | 4,128,790 | ||||||||||||||||||||||||
November | 36.85 | 32.73 | 35.19 | 10.90 | 3.23 | 3,204,045 | 70.71 | 67.04 | 70.60 | 12.45 | 5.67 | 3,244,960 | ||||||||||||||||||||||||
December | 42.00 | 35.04 | 41.70 | 10.92 | 3.82 | 2,415,932 | 71.21 | 68.73 | 69.32 | 12.38 | 5.60 | 2,249,443 | ||||||||||||||||||||||||
2008 | ||||||||||||||||||||||||||||||||||||
First Quarter | 46.53 | 36.13 | 44.77 | 10.63 | 4.21 | 3,197,835 | ||||||||||||||||||||||||||||||
2011 | ||||||||||||||||||||||||||||||||||||
January | 41.80 | 36.13 | 39.07 | 10.82 | 3.61 | 3,326,586 | 69.47 | 64.32 | 64.37 | 12.15 | 5.30 | 2,439,567 | ||||||||||||||||||||||||
February | 46.53 | 40.10 | 42.71 | 10.73 | 3.98 | 3,516,495 | 68.27 | 64.01 | 68.03 | 12.11 | 5.62 | 2,699,563 | ||||||||||||||||||||||||
March | 44.77 | 41.93 | 44.77 | 10.63 | 4.21 | 2,686,406 | 70.61 | 67.00 | 69.85 | 11.92 | 5.86 | 2,562,327 | ||||||||||||||||||||||||
First Quarter | 70.61 | 64.01 | 69.85 | 11.92 | 5.86 | 2,562,803 | ||||||||||||||||||||||||||||||
April | 47.40 | 44.92 | 45.80 | 10.51 | 4.36 | 3,462,336 | 73.91 | 70.52 | 72.45 | 11.52 | 6.29 | 2,425,921 | ||||||||||||||||||||||||
May | 49.19 | 45.50 | 48.53 | 10.33 | 4.70 | 2,645,010 | 73.68 | 70.75 | 71.44 | 11.58 | 6.17 | 3,077,382 | ||||||||||||||||||||||||
June(5) | 47.93 | 43.62 | 45.57 | 10.37 | 4.40 | 3,543,140 | 75.26 | 72.07 | 74.60 | 11.87 | 6.28 | 2,227,763 | ||||||||||||||||||||||||
| (1) | The prices and average daily trading volume for the BD Units were taken from Bloomberg and reflect our 3:1 stock split, which was effective May 25, 2007. |
| (2) | High and low closing prices for the periods presented. |
| (3) | Closing price on the last day of the periods presented. |
| (4) | Represents the translation from Mexican pesos to U.S. dollars of the closing price of the BD Units on the last day of the periods presented based on the noon buying rate for the purchase of U.S. dollars, as reported by the Federal Reserve Bank of New York |
| (5) | Information from June 1, |
| ADSs(1) | ADSs(1) | |||||||||||||||||||||||
| U.S. dollars | Average Daily Trading Volume (ADSs) | U.S. dollars | Average Daily Trading Volume (ADSs) | |||||||||||||||||||||
| High (2) | Low (2) | Close (3) | High(2) | Low(2) | Close(3) | |||||||||||||||||||
2003 | 14.04 | 10.22 | 12.29 | 750,425 | ||||||||||||||||||||
2004 | 17.64 | 12.34 | 17.54 | 846,888 | ||||||||||||||||||||
2005 | 24.58 | 16.97 | 24.17 | 986,032 | ||||||||||||||||||||
2006 | 39.17 | 24.41 | 38.59 | 1,159,232 | ||||||||||||||||||||
First Quarter | 30.65 | 24.85 | 30.55 | 1,067,163 | ||||||||||||||||||||
Second Quarter | 32.33 | 24.41 | 27.91 | 1,592,433 | ||||||||||||||||||||
Third Quarter | 33.30 | 26.89 | 32.31 | 1,054,114 | ||||||||||||||||||||
Fourth Quarter | 39.17 | 31.78 | 38.59 | 984,757 | ||||||||||||||||||||
2007 | 44.42 | 29.96 | 38.17 | 1,350,303 | ||||||||||||||||||||
2008 | 49.39 | 19.25 | 30.13 | 1,321,098 | ||||||||||||||||||||
2009 | ||||||||||||||||||||||||
First Quarter | 44.42 | 34.85 | 36.80 | 1,620,178 | 32.06 | 19.91 | 25.21 | 1,168,072 | ||||||||||||||||
Second Quarter | 40.51 | 35.41 | 39.32 | 1,264,422 | 34.96 | 25.27 | 32.24 | 820,917 | ||||||||||||||||
Third Quarter | 40.04 | 32.50 | 37.40 | 1,252,859 | 40.01 | 30.58 | 38.05 | 899,509 | ||||||||||||||||
Fourth Quarter | 39.27 | 29.96 | 38.17 | 1,231,342 | 49.00 | 42.65 | 47.88 | 1,859,885 | ||||||||||||||||
October | 39.27 | 34.90 | 35.61 | 1,275,323 | 45.98 | 42.95 | 43.31 | 3,002,220 | ||||||||||||||||
November | 34.65 | 29.96 | 32.40 | 1,340,079 | 45.69 | 42.65 | 45.51 | 1,425,004 | ||||||||||||||||
December | 38.42 | 32.25 | 38.17 | 1,066,591 | 49.00 | 46.52 | 47.88 | 1,112,896 | ||||||||||||||||
2008 | ||||||||||||||||||||||||
2010 | ||||||||||||||||||||||||
First Quarter | 43.35 | 33.37 | 41.78 | 1,173,074 | 50.01 | 40.82 | 47.53 | 1,394,455 | ||||||||||||||||
Second Quarter | 48.14 | 40.49 | 42.89 | 854,938 | ||||||||||||||||||||
Third Quarter | 52.09 | 42.78 | 50.43 | 752,792 | ||||||||||||||||||||
Fourth Quarter | 57.38 | 49.89 | 55.92 | 534,197 | ||||||||||||||||||||
October | 55.05 | 49.89 | 54.91 | 762,224 | ||||||||||||||||||||
November | 56.83 | 53.89 | 56.55 | 498,769 | ||||||||||||||||||||
December | 57.38 | 55.46 | 55.92 | 350,353 | ||||||||||||||||||||
2011 | ||||||||||||||||||||||||
January | 38.24 | 33.37 | 35.98 | 1,325,635 | 57.16 | 52.67 | 53.07 | 441,382 | ||||||||||||||||
February | 43.35 | 37.07 | 40.00 | 1,390,375 | 56.84 | 52.95 | 56.23 | 566,677 | ||||||||||||||||
March | 41.78 | 38.54 | 41.78 | 795,585 | 58.93 | 55.49 | 58.70 | 560,110 | ||||||||||||||||
First Quarter | 58.93 | 52.67 | 58.70 | 523,823 | ||||||||||||||||||||
April | 47.40 | 44.92 | 45.80 | 3,462,336 | 63.80 | 59.60 | 62.90 | 615,518 | ||||||||||||||||
May | 47.48 | 43.70 | 47.05 | 1,058,520 | 63.31 | 60.48 | 61.93 | 463,290 | ||||||||||||||||
June(4) | 46.37 | 41.88 | 44.08 | 1,230,483 | 63.80 | 61.52 | 62.58 | 563,503 | ||||||||||||||||
| (1) | Each ADS is comprised of 10 BD Units. Prices and average daily trading volume were taken from Bloomberg and reflect our 3:1 stock split, which was effective May 25, 2007. |
| (2) | High and low closing prices for the periods presented. |
| (3) | Closing price on the last day of the periods presented. |
| (4) | Information from June 1, |
| ITEM 10. | ADDITIONAL INFORMATION |
The following is a summary of the material provisions of our bylaws and applicable Mexican law. Our bylaws were last amended on April 22, 2008. For a description of the provisions of our bylaws relating to our board of directors and executive officers, see “Item 6. Directors, Senior Management and Employees.”
The Mexican Securities Law that came into effect in 2006 includes provisions that, among others, seek to improve the regulation of disclosure of information, minority shareholder rights and corporate governance. In addition, the Mexican Securities Law imposes further duties and liabilities on the members of the board of directors as well as on the relevant officers (such as a duty of loyalty and a duty of care). Likewise, under the Mexican Securities Law we were required to adopt specific amendments to our bylaws, which we carried out in 2006. The most significant of these amendments relate to the following:
|
redefinition of the functions and structure of the board of directors, whereby, among others, the management of the company is entrusted to the board of directors and also to the company’s chief executive officer, who is required to follow the strategies, policies and guidelines approved by the board of directors and the authority, obligations and duties expressly authorized in the Mexican Securities Law;
the Corporate Practices Committee and the Audit Committee consist solely of independent directors, each committee is formed by at least 3 board members appointed by the shareholders or by the board of directors, as proposed by the chairman of the board of directors;
the chairmen of the Corporate Practices Committee and the Audit Committee are appointed (taking into consideration their experience, capacity and professional prestige) and removed exclusively by a shareholders’ meeting, provided that the chairmen shall not also serve as chairman of the board of directors;
|
ability to have the external auditor attend meetings of the board of directors, as an observer with a right to participate, but without voting rights;
the ability to call a meeting of the board of directors, and to cause items to be added to the agenda, is now extended to the chairman of the board of directors, the chairman of the Corporate Practices Committee and the Audit Committee, or to at least 25% of the members of the board of directors;
independence of members of the board of directors is now determined through a shareholders’ meeting, subject to CNBV’s authority to challenge such determination;
directors may continue in the exercise of their functions even if the term for which they have been appointed has concluded, up to a term of 30 calendar days; the board of directors is entitled to appoint interim members, without need of a shareholders’ meeting, in the event of an absence of any member of the board of directors, or if the appointed member does not accept or take office and no alternate director was appointed or such alternate did not take office;
holders of Series “D” and “L” Shares are entitled to vote in the matters expressly set forth in the Mexican Securities Law; and
any capital increase by means of an issuance of non-subscribed shares to be held in treasury of the company requires approval at an extraordinary shareholders’ meeting.
Organization and RegisterRegistry
We are asociedad anónima bursátil de capital variable organized in Mexico under the Mexican General Corporations Law. We were incorporated in 1936 under the name Valores Industriales, S.A., as asociedad anónima, and are currently named Fomento Económico Mexicano, S.A.B. de C.V. On December 5, 2006, as required by the new Mexican Securities Law, we changed our name to reflect that weWe are asociedad anónima bursátil de capital variable (a variable capital listed stock corporation), whereas previously companies’ names in Mexico, including ours, did not indicate whether the company was a listed company (sociedad anónima de capital variable). We were registered in theRegistro Público de la Propiedad y del Comercio(Public Registry of CommerceProperty and Commerce) of Monterrey, Nuevo León on May 30, 1936 under the mercantile number 16, page 168, volume 79, third book, second auxiliary of the Registry.n.
Voting Rights and Certain Minority Rights
Each Series B Share entitles its holder to one vote at any of our ordinary or extraordinary general shareholders meetings. Our bylaws state that the board of directors must comprisebe composed of no more than 21 members. Holders of Series B Shares are entitled to elect at least 11 members of our board of directors. Holders of Series D-B and D-LD Shares are entitled to elect five members of our board of directors. Our bylaws also contemplate that, should a conversion of the Series D-L Shares to Series L Shares occur pursuant to the vote of our Series D-B and Series D-L shareholders at special and extraordinary shareholders meetings, the holders of Series D-L shares (who would become holders of newly-issued Series L Shares) will be entitled to elect two members of the board of directors. None of our shares has cumulative voting rights, which is a right not regulated under Mexican law.
Under our bylaws, the holders of Series D-B and Series D-LD Shares are entitled to vote at extraordinary shareholders meetings called to consider any of the following limited matters: (1) the transformation from one form of corporate organization to another, other than from a company with variable capital stock to a company without variable capital stock or vice versa, (2) any merger in which we are not the surviving entity or with other entities whose principal corporate purposes are different from those of our company or our subsidiaries, (3) change of our jurisdiction of incorporation, (4) dissolution and liquidation and (5) the cancellation of the registration of the Series D Shares or Series L Shares in the Mexican Stock Exchange or in any other foreign stock market where listed, except in the case of the conversion of these shares as provided for in our bylaws.
Holders of Series D-B Shares and Series D-LD Shares are also entitled to vote on the matters that they are expressly authorized to vote on by the Mexican Securities Law and at any extraordinary shareholders meeting called to consider any of the following matters:
To approve a conversion of all of the outstanding Series D-B Shares and Series D-L Shares into Series B shares with full voting rights and Series L Shares with limited voting rights, respectively.
To agree to the unbundling of their share Units.
This conversion and/or unbundling of shares would become effective two (2) years after the date on which the shareholders agreed to such conversion and/or unbundling.
Under Mexican law, holders of shares of any series are entitled to vote as a class in a special meeting governed by the same rules that apply to extraordinary shareholders meetings on any action that would have an effect on the rights of holders of shares of such series. There are no procedures for determining whether a particular proposed shareholder action requires a class vote, and Mexican law does not provide extensive guidance on the criteria to be applied in making such a determination.
Pursuant to the
The Mexican Securities Market Law, and the Mexican General Corporations Law and our bylaws include a number ofprovide for certain minority shareholder protections. These minority protections include provisions that permit:
holders of at least 10% of our outstanding capital stock entitled to vote, (includingincluding in a limited or restricted manner)manner, to require the chairman of the board of directors or of the Audit or Corporate Practices Committees to call a shareholders’ meeting;
holders of at least 5% of our outstanding capital stock, including limited or restricted vote, may bring an action for liabilities against our directors, the secretary of the board of directors or the relevant officers;
holders of at least 10% of our outstanding capital stock who are entitled to vote, including limited or restricted vote, at any shareholders meeting to request that resolutions with respect to any matter on which they considered they were not sufficiently informed be postponed;
holders of 20% of our outstanding capital stock to oppose any resolution adopted at a shareholders meeting in which they are entitled to vote, including limited or restricted vote, and file a petition for a court order to suspend the resolution temporarily within 15 days following the adjournment of the meeting at which the action was taken, provided that (1) the challenged resolution violates Mexican law or our bylaws, (2) the opposing shareholders neither attended the meeting nor voted in favor of the challenged resolution and (3) the opposing shareholders deliver a bond to the court to secure payment of any damages that we may suffer as a result of suspending the resolution in the event that the court ultimately rules against the opposing shareholder; and
holders of at least 10% of our outstanding capital stock who are entitled to vote, including limited or restricted vote, to appoint one member of our board of directors and one alternate member of our board of directors.
Shareholders Meetings
General shareholders meetings may be ordinary meetings or extraordinary meetings. Extraordinary meetings are those called to consider certain matters specified in Article 182 and 228 bis.BIS of the Mexican General Corporations Law, ArticleArticles 53 and 108(II) of the Mexican Securities Law and in our bylaws. These matters include: amendments to our bylaws, liquidation, dissolution, merger and transformation from one form of corporate organization to another, issuance of preferred stock and increases and reductions of the fixed portion of our capital stock. In addition, our bylaws require an extraordinary meeting to consider the cancellation of the registration of shares with the Mexican Registry of Securities, or RNV or with other foreign stock exchanges on which our shares may be listed, the amortization of distributable earnings into capital stock, and an increase in our capital stock in terms of the Mexican Securities Law. General meetings called to consider all other matters, including increases or decreases affecting the variable portion of our capital stock, are ordinary meetings. An ordinary meeting must be held at least once each year within the first four months following the end of the preceding fiscal year. Holders of BD Units or B Units are entitled to attend all shareholders meetings of the Series B Shares and Series D Shares included in the BD Units or B Units and to vote on matters that are subject to the vote of holders of the underlying shares.
The quorum for an ordinary shareholders meeting on first call of the Series B Shares is more than 50% of the Series B Shares, and action may be taken by a majority of the Series B Shares represented at the meeting. If a quorum is not available, a second or subsequent meeting may be called and held by whatever number of Series B Shares is represented at the meeting, at which meeting action may be taken by a majority of the Series B Shares that are represented at the meeting.
The quorum for an extraordinary shareholders meeting is at least 75% of the shares entitled to vote at the meeting, and action may be taken by a vote of the majority of all the outstanding shares that are entitled to vote. If a quorum is not available, a second meeting may be called, at which the quorum will be the majority of the outstanding capital stock entitled to vote, and actions will be taken by holders of the majority of all the outstanding capital stock entitled to vote.
Shareholders meetings may be called by the board of directors, the audit committee or the corporate practicepractices committee and, under certain circumstances, a Mexican court. Holders of 10% or more of our capital stock may require the chairman of the board of directors, or the chairman of the audit or corporate practices committees to call a shareholders meeting. A notice of meeting and an agenda must be published in thePeriódico Oficial del Estado de Nuevo León (the Official(Official State Gazette of Nuevo León) or a newspaper of general circulation in Monterrey, Nuevo León, Mexico at least 15 days prior to the date set for the meeting. Notices must set forth the place, date and time of the meeting and the matters to be addressed and must be signed by whomever convened the meeting. Shareholders meetings will be deemed validly held and convened without a prior notice or publication whenever all the shares representing our capital stock are fully represented. All relevant information relating to the shareholders meeting must be made
available to shareholders starting on the date of publication of the notice. To attend a meeting, shareholders must deposit their shares with the company or with Indeval or an institution for the deposit of securities prior to the meeting as indicated in the notice. If entitled to attend a meeting, a shareholder may be represented by an attorney-in-fact.
In addition to the provisions of the Mexican General Corporations Law, the ordinary shareholders meeting shall be convened to approve any transaction that, in a fiscal year, represents 20% or more of the consolidated assets of the company as of the immediately prior quarter, whether such transaction is executed in one or several operations. All shareholders shall be entitled to vote on in such ordinary shareholders meeting, including those with limited or restricted voting rights.
Dividend Rights
At the annual ordinary general shareholders meeting,AGM, the board of directors submits the financial statements of the company for the previous fiscal year, together with a report thereon by the board of directors. Once the holders of Series B Shares have approved the financial statements, they determine the allocation of our net profits for the preceding year. Mexican law requires the allocation of at least 5% of net profits to a legal reserve, which is not subsequently available for distribution, until the amount of the legal reserve equals 20% of our paid in capital stock. Thereafter, the holders of Series B Shares may determine and allocate a certain percentage of net profits to any general or special reserve, including a reserve for open-market purchases of our shares. The remainder of net profits is available for distribution in the form of dividends to the shareholders. Dividends may only be paid if net profits are sufficient to offset losses from prior fiscal years.
Amounts allocated as dividends will be paid to the holders of capital stock of our company in the following manner. Our bylaws provide that dividends will be allocated among the shares outstanding and fully paid at the time a dividend is declared in such manner that each Series D-B Share and Series D-L Share receives 125% of the dividend distributed in respect of each Series B Share. Holders of Series D-B Shares and Series D-L Shares are entitled to this dividend premium in connection with all dividends paid by us.
Change in Capital and Withdrawal Rights
Our outstanding capital stock consists of both a fixed and a variable portion. The fixed portion of our capital stock may be increased or decreased only by an amendment of the bylaws adopted by an extraordinary shareholders meeting. The variable portion of our capital stock may be increased or decreased by resolution of an ordinary shareholders meeting. Capital increases and decreases must be recorded in our share registry and book of capital variations, if applicable.
A capital stock increase may be effected through the issuance of new shares for payment in cash or in kind, or by capitalization of indebtedness or of certain items of stockholders’ equity. Treasury stock may only be sold pursuant to a public offering.
Any increase or decrease in our capital stock or any redemption or repurchase will be subject to the following limitations: (1) Series B Shares will always represent at least 51% of our outstanding capital stock and the Series D-L Shares and Series L Shares will never represent more than 25% of our outstanding capital stock; and (2) the Series D-B, Series D-L and Series L Shares will not exceed, in the aggregate, 49% of our outstanding capital stock.
Preemptive Rights
Under Mexican law, except in limited circumstances which are described below, in the event of an increase in our capital stock, a holder of record generally has the right to subscribe to shares of a series held by such holder sufficient to maintain such holder’s existing proportionate holding of shares of that series. Preemptive rights must be exercised during a term fixed by the shareholders at the meeting declaring the capital increase, which term must last at least 15 days following the publication of notice of the capital increase in the Official State Gazette. As a result of applicable United States securities laws, holders of ADSs may be restricted in their ability to participate in the exercise of preemptive rights under the terms of the deposit agreement. Shares subject to a preemptive rights offering, with respect to which preemptive rights have not been exercised, may be sold by us to third parties on the same terms and conditions previously approved by the shareholders or the board of directors. Under Mexican law, preemptive rights cannot be waived in advance or be assigned, or be represented by an instrument that is negotiable separately from the corresponding shares.
Our bylaws provide that shareholders will not have preemptive rights to subscribe shares in the event of a capital stock increase or listing of treasury stock in the following events: (i) merger of the Company; (ii) conversion of obligations in terms of the Mexican General Corporations Law;Credit Instruments and Credit Operations Law (Ley General de Títulos y Operaciones de Crédito); (iii) public offering in terms of articles 53, 56 and 56related provisions of the Mexican Securities Law; and (iv) capital increase made through the payment in kind of the issued shares or through the cancellation of debt of the Company; and (v) issuance of shares acquired by the company.Company.
Limitations on Share Ownership
Ownership by non-Mexican nationals of shares of Mexican companies is regulated by the Foreign Investment Law and its regulations. The Foreign Investment Commission is responsible for the administration of the Foreign Investment Law and its regulations.
As a general rule, the Foreign Investment Law allows foreign holdings of up to 100% of the capital stock of Mexican companies, except for those companies engaged in certain specified restricted industries. The Foreign Investment Law and its regulations require that Mexican shareholders retain the power to determine the administrative control and the management of corporations in industries in which special restrictions on foreign holdings are applicable. Foreign investment in our shares is not limited under either the Foreign Investment Law or its regulations.
Management of the Company
Management of the company is entrusted to the board of directors and also to the chief executive officer, who is required to follow the strategies, policies and guidelines approved by the board of directors and the authority, obligations and duties expressly authorized in the Mexican Securities Law.
At least 25% of the members of the board of directors shall be independent. Independence of the members of the board of directors is determined by the shareholders meeting, subject to the CNBV’s challenge of such determination. In the performance of its responsibilities, the board of directors will be supported by a corporate practices committee and an audit committee. The corporate practices committee and the audit committee consist solely of independent directors. Each committee is formed by at least three board members appointed by the shareholders or by the board of directors. The chairmen of said committees are appointed (taking into consideration their experience, capacity and professional prestige) and removed exclusively by a vote in a shareholders meeting or by the board of directors.
Surveillance
Surveillance of the company is entrusted to the board of directors, which shall be supported in the performance of these functions by the corporate practices committee, the audit committee and our external auditor. The external auditor may be invited to attend board of directors meetings as an observer, with a right to participate but without voting rights.
Authority of the Board of Directors
The board of directors is our legal representative and is authorized to take any action in connection with our operations not expressly reserved to our shareholders. Pursuant to the Mexican Securities Law, the board of directors must approve,observing at all moments their duty of care and duty of loyalty, among other matters:
any transactions with related parties outside the ordinary course of our business
significant asset transfers or acquisitions;
material guarantees or collateral;
internal policies; and
other material transactions.
Meetings of the board of directors are validly convened and held if a majority of the members are present. Resolutions passed at these meetings will be valid if approved by a majority of members of the board of directors are present at the meeting. If required, the chairman of the board of directors may cast a tie-breaking vote.
Redemption
We may redeem part of our shares for cancellation with distributable earnings pursuant to a decision of an extraordinary shareholders meeting. Only shares subscribed and fully paid for may be redeemed. Any shares intended to be redeemed shall be purchased on the Mexican Stock Exchange in accordance with the Mexican General Corporations Law and the Mexican Securities Market Law. No shares will be redeemed, if as a consequence of such redemption, the Series D and Series L Shares in the aggregate exceed the percentages permitted by our bylaws or if any such redemption will reduce our fixed capital below its minimum.
Repurchase of Shares
According to our bylaws, subject to the provisions of the Mexican Securities Law and under rules promulgated by the CNBV, we may repurchase our shares.
In accordance with the Mexican Securities Law, our subsidiaries may not purchase, directly or indirectly, shares of our capital stock or any security that represents such shares.
Forfeiture of Shares
As required by Mexican law, our bylaws provide that non-Mexican holders of BD Units, B Units or shares (1) are considered to be Mexican with respect to such shares that they acquire or hold and (2) may not invoke the protection of their own governments in respect of the investment represented by those shares. Failure to comply with our bylaws may result in a penalty of forfeiture of a
shareholder’s capital stock in favor of the Mexican state. In the opinion of Lic. Carlos E. Aldrete Ancira, our general counsel, under this provision, a non-Mexican shareholder (including a non-Mexican holder of ADSs) is deemed to have agreed not to invoke the protection of its own government by asking such government to interpose a diplomatic claim against the Mexican state with respect to its rights as a shareholder, but is not deemed to have waived any other rights it may have, including any rights under the United States securities laws, with respect to its investment in our company. If a shareholder should invoke governmental protection in violation of this agreement, its shares could be forfeited to the Mexican state.
Duration
The bylaws provide that the duration of our company is 99 years, commencing on May 30, 1936.1936, unless extended by a resolution of an extraordinary shareholders meeting.
Appraisal Rights
Whenever the shareholders approve a change of corporate purpose, change of jurisdiction of incorporation or the transformation from one form of corporate organization to another, any shareholder entitled to vote on such change that has voted against it, may withdraw as a shareholder of our company and have its shares redeemed by FEMSA at a price per share calculated as specified under applicable Mexican law, provided that it exercises its right within 15 days following the adjournment of the meeting at which the change was approved. Under Mexican law, the amount which a withdrawing shareholder is entitled to receive is equal to its proportionate interest in our capital stock or according to our most recent balance sheet approved by an ordinary general shareholders meeting.
Delisting of Shares
In the event of a cancellation of the registration of any of our shares with the RNV, whether by order of the CNBV or at our request with the prior consent of 95% of the holders of our outstanding capital stock, our bylaws and the new Mexican Securities Law require us to make a public offer to acquire these shares prior to their cancellation.
Liquidation
Upon the dissolution of our company, one or more liquidators must be appointed by an extraordinary general meeting of the shareholders to wind up its affairs. All fully paid and outstanding shares of capital stock will be entitled to participate equally in any distribution upon liquidation.
Actions Against Directors
Shareholders (including holders of Series D-B and Series D-L Shares) representing, in the aggregate, not less than 5% of our capital stock may directly bring an action against directors.
In the event of actions derived from any breach of the duty of care and the duty of loyalty, liability is exclusively in favor of the company. The Mexican Securities Law, contrary to the previous securities law, establishes that liability may be imposed on the members and the secretary of the board of directors, as well as to the relevant officers.
Notwithstanding, the Mexican Securities Law provides that the members of the board of directors will not incur, individually or jointly, liability for damages and losses caused to the company, when their acts were made in good faith, in any of the following events (1) the directors complied with the requirements of the Mexican Securities Law and with the company’s bylaws, (2) the decision making or voting was based on information provided by the relevant officers, the external auditor or the independent experts, whose capacity and credibility do not offer reasonable doubt; (3) the negative economic effects could not have been foreseen, based on the information available; and (4) they comply with the resolutions of the shareholders’ meeting when such resolutions comply with applicable law.
Fiduciary Duties—Duty of Care
The Mexican Securities Law provides that the directors shall act in good faith and in our best interest and in the best interest of our subsidiaries. In order to fulfill its duty, the board of directors may:
request information about us or our subsidiaries that is reasonably necessary to fulfill its duties;
require our officers and certain other persons, including the external auditors, to appear at board of directors’ meetings to report to the board of directors;
postpone board of directors’ meetings for up to three days when a director has not been given sufficient notice of the meeting or in the event that a director has not been provided with the information provided to the other directors; and
require a matter be discussed and voted upon by the full board of directors in the presence of the secretary of the board of directors.
Our directors may be liable for damages for failing to comply their duty of care if such failure causes economic damage to us or our subsidiaries and the director (1) failed to attend, board of directors’ or committee meetings and as a result of, such failure, the board of directors was unable to take action, unless such absence is approved by the shareholders meeting, (2) failed to disclose to the board of directors or the committees material information necessary for the board of directors to reach a decision, unless legally or contractually prohibited from doing so in order to maintain confidentiality, and (3) failed to comply with the duties imposed by the Mexican Securities Law or our bylaws.
Fiduciary Duties—Duty of Loyalty
The Mexican Securities Law provides that the directors and secretary of the board of directors shall keep confidential any non-public information and matters about which they have knowledge as a result of their position. Also, directors should abstain from participating, attending or voting at meetings related to matters where they have a conflict of interest.
The directors and secretary of the board of directors will be deemed to have violated the duty of loyalty, and will be liable for damages, when they obtain an economic benefit by virtue of their position. Further, the directors will fail to comply with their duty of loyalty if they:
vote at a board of directors’ meeting or take any action on a matter involving our assets where there is a conflict of interest;
fail to disclose a conflict of interest during a board of directors’ meeting;
enter into ana voting arrangement to support a particular shareholder or group of shareholders against the other shareholders;
approve of transactions without complying with the requirements of the Mexican Securities Law;
use company property in violation of the policies approved by the board of directors;
unlawfully use material non-public information; and
usurp a corporate opportunity for their own benefit or the benefit of third parties, without the prior approval of the board of directors.
Limited Liability of Shareholders
The liability of shareholders for our company’s losses is limited to their shareholdings in our company.
The following summary contains a description of certain U.S. federal income and Mexican federal tax consequences of the purchase, ownership and disposition of our ADSs by a holder that is a citizen or resident of the United States, a U.S. domestic corporation or a person or entity that otherwise will be subject to U.S. federal income tax on a net income basis in respect of our ADSs, whom we refer to as a U.S. holder, but it does not purport to be a description of all of the possible tax considerations that may be relevant to a decision to purchase, hold or dispose of ADSs. In particular, this discussion does not address all Mexican or U.S. federal income tax considerations that may be relevant to a particular investor, nor does it address the special tax rules applicable to certain categories of investors, such as banks, dealers, traders who elect to mark to market, tax-exempt entities, insurance companies, certain short-term holders of ADSs or investors who hold our ADSs as part of a hedge, straddle, conversion or integrated transaction or investors who have a “functional currency” other than the U.S. dollar. This summary deals
only with U.S. holders that will hold our ADSs as capital assets and does not address the tax treatment of a U.S. holder that owns or is treated as owning 10% or more of the voting shares (including ADSs) of the company.
This summary is based upon the federal tax laws of the United States and Mexico as in effect on the date of this annual report, including the provisions of the income tax treaty between the United States and Mexico which we refer to as the Tax Treaty, which are subject to change. The summary does not address any tax consequences under the laws of any state or locality of Mexico or the United States or the laws of any taxing jurisdiction other than the federal laws of Mexico and the United States. Holders of our ADSs should consult their tax advisors as to the U.S., Mexican or other tax consequences of the purchase, ownership and disposition of ADSs, including, in particular, the effect of any foreign, state or local tax laws.
Mexican Taxation
For purposes of this summary, the term “non-resident holder” means a holder that is not a resident of Mexico for tax purposes and that does not hold our ADSs in connection with the conduct of a trade or business through a permanent establishment for tax purposes in Mexico. For purposes of Mexican taxation, an individual is a resident of Mexico if he or she has established his or her home in Mexico, or if he or she has another home outside Mexico, but his or herCentro de Intereses Vitales (Center of Vital Interests) (as defined in the Mexican Tax Code) is located in Mexico and, among other circumstances, more than 50% of that person’s total income during a calendar year comes from within Mexico. A legal entity is a resident of Mexico either if it has its principal place of business or its place of effective management in Mexico. A Mexican citizen is presumed to be a resident of Mexico unless he or she can demonstrate that the contrary is true. If a legal entity or an individual is deemed to have a permanent establishment in Mexico for tax purposes, all income attributable to the permanent establishment will be subject to Mexican taxes, in accordance with applicable tax laws.
Taxation of Dividends. Under Mexican income tax law, dividends, either in cash or in kind, paid with respect to our shares represented by our ADSs are not subject to Mexican withholding tax.
Taxation of Dispositions of ADSs. Gains from the sale or disposition of ADSs by non-resident holders will not be subject to Mexican tax, if the disposition is carried out through a stock exchange recognized under applicable Mexican tax law.
GainsIn compliance with certain requirements, gains on the sale or other disposition of ADSs made in circumstances different from those set forth in the prior paragraph generally would be subject to Mexican tax, regardless of the nationality or residence of the transferor. However, under the Tax Treaty, a holder that is eligible to claim the benefits of the Tax Treaty will be exempt from Mexican tax on gains realized on a sale or other disposition of our ADSs in a transaction that is not carried out through the Mexican Stock Exchange or other approved securities markets, so long as the holder did not own, directly or indirectly, 25% or more of our outstanding capital stock (including shares represented by our ADSs) within the 12-month period preceding such sale or other disposition. Deposits of shares in exchange for ADSs and withdrawals of shares in exchange for our ADSs will not give rise to Mexican tax.
Other Mexican Taxes. There are no Mexican inheritance, gift, succession or value added taxes applicable to the ownership, transfer, exchange or disposition of our ADSs. There are no Mexican stamp, issue, registration or similar taxes or duties payable by holders of our ADSs.
United States Taxation
Taxation of Dividends.The gross amount of any dividends paid with respect to our shares represented by our ADSs generally will be included in the gross income of a U.S. holder as ordinary income on the day on which the dividends are received by the ADS depositary and will not be eligible for the dividends received deduction allowed to corporations under the Internal Revenue Code of 1986, as amended. Dividends, which will be paid in Mexican pesos, will be includible in the income of a U.S. holder in a U.S. dollar amount calculated, in general, by reference to the exchange rate in effect on the date that they are received by the ADS depositary (regardless of whether such Mexican pesos are in fact converted into U.S. dollars on such date). If such dividends are converted
into U.S. dollars on the date of receipt, a U.S. holder generally should not be required to recognize foreign currency gain or loss in respect of the dividends. U.S. holders should consult their tax advisors regarding the treatment of the foreign currency gain or loss, if any, on any Mexican pesos received that are converted into U.S. dollars on a date subsequent to the date of receipt. Subject to certain exceptions for short-term and hedged positions, the U.S. dollar amount of dividends received by an individual U.S. holder in respect of the ADSs for taxable years beginning before January 1, 20112013 is subject to taxation at a maximum rate of 15% if the dividends are “qualified dividends.” Dividends paid on the ADSs will be treated as qualified dividends if (1) we are eligible for the benefits of a comprehensive income tax treaty with the United States that the Internal Revenue Service has approved for the purposes of the qualified dividend rules and (2) we were not, in the year prior to the year in which the dividend was paid, and are not, in the year in which the dividend is paid, a passive foreign investment company. The income tax treaty between Mexico and the United States has been approved for the purposes of the qualified dividend rules. Based on our audited consolidated financial statements and relevant market and shareholder data, we believe that we were not treated as a passive foreign investment company for U.S. federal income tax purposes with respect to our 20072010 taxable year. In addition, based on our audited consolidated financial statements and our current expectations regarding the value and nature of our assets, the sources and nature of our income, and relevant market and shareholder data, we do not anticipate becoming a passive foreign investment company for our 20082011 taxable year. Dividends generally will constitute foreign source “passive income” for U.S. foreign tax credit purposes.
Distributions to holders of additional shares with respect to our ADSs that are made as part of a pro rata distribution to all of our shareholders generally will not be subject to U.S. federal income tax.
A holder of ADSs that is, with respect to the United States, a foreign corporation or non-U.S. holder generally will not be subject to U.S. federal income or withholding tax on dividends received on ADSs unless such income is effectively connected with the conduct by the non-U.S. holder of a trade or business in the United States.
Taxation of Capital Gains. A gain or loss realized by a U.S. holder on the sale or other disposition of ADSs will be subject to U.S. federal income taxation as a capital gain or loss in an amount equal to the difference between the amount realized on the disposition and such U.S. holder’s tax basis in the ADSs. Any such gain or loss will be a long-term capital gain or loss if the ADSs were held for more than one year on the date of such sale. Any long-term capital gain recognized by a U.S. holder that is an individual is subject to a reduced rate of federal income taxation. The deduction of capital losses is subject to limitations for U.S. federal income tax purposes. Deposits and withdrawals of shares by U.S. holders in exchange for ADSs will not result in the realization of gains or losses for U.S. federal income tax purposes.
Any gain realized by a U.S. holder on the sale or other disposition of ADSs will be treated as U.S. source income for U.S. foreign tax credit purposes.
A non-U.S. holder of ADSs will not be subject to U.S. federal income or withholding tax on any gain realized on the sale of ADSs, unless (1) such gain is effectively connected with the conduct by the non-U.S. holder of a trade or business in the United States, or (2) in the case of a gain realized by an individual non-U.S. holder, the non-U.S. holder is present in the United States for 183 days or more in the taxable year of the sale and certain other conditions are met.
United States Backup Withholding and Information Reporting. A U.S. holder of ADSs may, under certain circumstances, be subject to “backup withholding” with respect to certain payments to such U.S. holder, such as dividends, interest or the proceeds of a
sale or disposition of ADSs, unless such holder (1) is a corporation or comes within certain exempt categories, and demonstrates this fact when so required, or (2) provides a correct taxpayer identification number, certifies that it is not subject to backup withholding and otherwise complies with applicable requirements of the backup withholding rules. Any amount withheld under these rules does not constitute a separate tax and will be creditable against the holder’s U.S. federal income tax liability. While non-U.S. holders generally are exempt from backup withholding, a non-U.S. holder may, in certain circumstances, be required to comply with certain information and identification procedures in order to prove this exemption.
We and our subsidiaries are parties to a variety of material agreements with third parties, including shareholders’ agreements, supply agreements and purchase and service agreements. Set forth below are summaries of the material terms of such agreements. The actual agreements have either been filed as exhibits to, or incorporated by reference in, this annual report. See “Item 19. Exhibits.”
Material Contracts Relating to Coca-Cola FEMSA
Shareholders Agreement
Coca-Cola FEMSA operates pursuant to a shareholders agreement among two subsidiaries of FEMSA, The Coca-Cola Company and certain of its subsidiaries. This agreement, together with Coca-Cola FEMSA’s bylaws, sets forth the basic rules under which Coca-Cola FEMSA operates.
In February 2010, Coca-Cola FEMSA’s main shareholders, FEMSA and The Coca-Cola Company, amended the shareholders agreement, contemplatesand Coca-Cola FEMSA’s by-laws were amended accordingly. The amendment mainly relates to changes in the voting requirements for decisions on: (1) ordinary operations within an annual business plan and (2) appointment of the chief executive officer and all officers reporting to him, all of which now may be taken by the board of directors by simple majority voting. Also, the amendment provides that payment of dividends, up to an amount equivalent to 20% of the preceding years’ retained earnings, may be approved by a simple majority of the shareholders. Any decision on extraordinary matters, as they are defined in Coca-Cola FEMSA will be managedFEMSA’s by-laws and which include, among other things, any new business acquisition or business combinations in accordancean amount exceeding US$ 100 million and outside the ordinary operations contained in the annual business plan, or any change in the existing line of business, shall require the approval of the majority of the members of the board of directors, with one-yearthe vote of two of the members appointed by The Coca-Cola Company. Also, any decision related to such extraordinary matters or any payment of dividends above 20% of the preceding years’ retained earnings shall require the approval of the majority of the shareholders of each of Series A and five-year business plans, although in practice, it is now managed according toSeries D Shares voting together as a three-year plan.single class, a majority of which must include the majority of the Series D shareholders.
Under Coca-Cola FEMSA’s bylaws and shareholders agreement, its Series A Shares and Series D Shares are the only shares with full voting rights and, therefore, control actions by its shareholders. Except in certain limited situations, the holders of Series A Shares and Series D Shares have the power to determine the outcome of all actions requiring approval by the shareholders. For actions by its board of directors, a supermajority including the directors appointed by the holders of Series D Shares is required for all actions.
The shareholders agreement also sets forth the principal shareholders’ understanding as to the effect of adverse actions of The Coca-Cola Company under the bottler agreements. Coca-Cola FEMSA’s bylaws and shareholders agreement provide that a majority of the directors appointed by the holders of Series A Shares, upon making a reasonable, good faith determination that any action of The Coca-Cola Company under any bottler agreement between The Coca-Cola Company and Coca-Cola FEMSA or any of its subsidiaries is materially adverse to Coca-Cola FEMSA’s business interests and that The Coca-Cola Company has failed to cure such action within 60 days of notice, may declare a simple majority period at any time within 90 days after giving notice. During the simple“simple majority period,” as defined in Coca-Cola FEMSA’s bylaws, certain decisions, namely the approval of material changes in Coca-Cola FEMSA’s business plans, the introduction of a new, or termination of an existing, line of business, and related party transactions outside the ordinary course of business, which would ordinarily requireto the extent the presence and approval of at least two Series D directors would otherwise be required, can be made by a simple majority vote of its entire board of directors, without requiring the presence or approval of any Series D director. A majority of the Series A directors may terminate a simple majority period but, once having done so, cannot declare another simple majority period for one year after the termination. If a simple majority period persists for one year or more, the provisions of the shareholders agreement for resolution of irreconcilable differences may be triggered, with the consequences outlined in the following paragraph.
In addition to the rights of first refusal provided for in Coca-Cola FEMSA’s bylaws regarding proposed transfers of Series A Shares or Series D Shares, the shareholders agreement contemplates three circumstances under which one principal shareholder may purchase the interest of the other in Coca-Cola FEMSA: (1) a change in control in a principal shareholder; (2) the existence of irreconcilable differences between the principal shareholders; or (3) the occurrence of certain specified defaults.events of default.
In the event that (1) one of the principal shareholders buys the other’s interest in Coca-Cola FEMSA in any of the circumstances described above or (2) the ownership of Coca-Cola FEMSA’s shares of capital stock other than the Series L Shares of the subsidiaries of The Coca-Cola Company or FEMSA is reduced below 20% and upon the request of the shareholder whose interest is not so reduced, the shareholders agreement requires that Coca-Cola FEMSA’s bylaws be amended to eliminate all share transfer restrictions and all super-majorityspecial-majority voting and quorum requirements, after which the shareholders agreement would terminate. In the event that the
ownership of Coca-Cola FEMSA’s shares of capital stock other than the Series L Shares of the subsidiaries of The Coca-Cola Company or FEMSA is reduced below 25% (but not below 20%) and upon the request of the shareholder whose interest is not so reduced, the shareholders agreement requires that Coca-Cola FEMSA’s bylaws be amended to eliminate all super-majority voting and quorum requirements, other than those relating to the share transfer restrictions.
The shareholders agreement also contains provisions relating to the principal shareholders’ understanding as to Coca-Cola FEMSA’s growth. It states that it is The Coca-Cola Company’s intention that Coca-Cola FEMSA will be viewed as one of a small number of its “anchor” bottlers in Latin America. In particular, the parties agree that it is desirable that Coca-Cola FEMSA expands by acquiring additional bottler territories in Mexico and other Latin American countries in the event any become available through horizontal growth. In addition, The Coca-Cola Company has agreed, subject to a number of conditions, that if it obtains ownership of a bottler territory that fits with Coca-Cola FEMSA’s operations, it will give Coca-Cola FEMSA the option to acquire such territory. The Coca-Cola Company has also agreed to support prudent and sound modifications to Coca-Cola FEMSA’s capital structure to support horizontal growth. The Coca-Cola Company’s agreement as to horizontal growth expires upon either the elimination of the super-majority voting requirements described above or The Coca-Cola Company’s election to terminate the agreement as a result of a default.
The Coca-Cola Memorandum
In connection with the acquisition of Panamco, in 2003, Coca-Cola FEMSA established certain understandings primarily relating to operational and business issues with both The Coca-Cola Company and our company that were memorialized in writing prior to completion of the acquisition. Coca-Cola FEMSA believes the memorandum should be interpreted in the context of subsequent events, some of which have been noted in the description below. The terms are as follows:
The current stockholdershareholder arrangements between directly wholly-owned subsidiaries of our company and The Coca-Cola Company will continue in place. On February 1, 2010, FEMSA amended its shareholders agreement with The Coca-Cola Company. See “Shareholders“—Shareholders Agreement.”
We will continue to consolidate Coca-Cola FEMSA’s financial results.results under Mexican FRS.
The Coca-Cola Company and our company will continue to discuss in good faith the possibility of implementing changes to Coca-Cola FEMSA’s capital structure in the future.
There will be no changes in concentrate incidence pricing or marketing support by The Coca-Cola Company up to May 2004. After such time, The Coca-Cola Company has complete discretion to implement any changes with respect to these matters, but any decision in this regard will be discussed with Coca-Cola FEMSA and will take Coca-Cola FEMSA’s operating condition into consideration. In 2005, The Coca-Cola Company decided to gradually increase concentrate prices for sparkling beverages over a three-year period in Brazil beginning in 2006 and in Mexico beginning in 2007. These increases were fully implemented in Brazil 2008 and in Mexico in 2009.
The Coca-Cola Company may require the establishment of a different long-term strategy for Brazil. If, after taking into account Coca-Cola FEMSA’sour performance in Brazil, The Coca-Cola Company does not consider Coca-Cola FEMSAus to be part of this long-term strategic solution for Brazil, then Coca-Cola FEMSAwe will sell itsour Brazilian franchise to The Coca-Cola Company or its designee at fair market value. Fair market value would be determined by independent investment bankers retained by each party at their own expense pursuant to specified procedures. Coca-Cola FEMSA currently believes the likelihood of this term applying is remote.
FEMSA, The Coca-Cola Company and Coca-Cola FEMSA will meet to discuss the optimal Latin American territorial configuration for the Coca-Cola bottler system. During this meeting,these meetings, Coca-Cola FEMSA will consider all possible combinations and any asset swap transactions that may arise from these discussions. In addition, Coca-Cola FEMSA will entertain any potential combination as long as it is strategically sound and done at fair market value.
these discussions. In addition, Coca-Cola FEMSA will entertain any potential combination as long as it is strategically sound and done at fair market value. |
Coca-Cola FEMSA would like to keep open strategic alternatives that relate to the integration of sparkling beverages and beer. The Coca-Cola Company, our company and Coca-Cola FEMSA would explore these alternatives on a market-by-market basis at the appropriate time.
The Coca-Cola Company agreed to sell to a subsidiary of our company sufficient shares to permit FEMSA to beneficially own 51% of Coca-Cola FEMSA’s outstanding capital stock (assuming that this subsidiary of FEMSA does not sell any shares and that there are no issuances of Coca-Cola FEMSA’s stock other than as contemplated by the acquisition). As a result of this understanding, on November 3, 2006, FEMSA acquired, through a subsidiary, 148,000,000 of Coca-Cola FEMSA’s Series D shares from certain subsidiaries of The Coca-Cola Company, representing 9.4% of the total outstanding voting shares and 8.02% of the total outstanding equity of Coca-Cola FEMSA, at a price of US$ 2.888 per share for an aggregate amount of US$ 427.4 million. Pursuant to Coca-Cola FEMSA’s bylaws, the acquired shares were converted from Series D Shares to Series A Shares.
Coca-Cola FEMSA may be entering some markets where significant infrastructure investment may be required. The Coca-Cola Company and FEMSA will conduct a joint study that will outline strategies for these markets, as well as the investment levels required to execute these strategies. Subsequently, it is intended that our company and The Coca-Cola Company will reach agreement on the level of funding to be provided by each of the partners. The parties intend that this allocation of funding responsibilities would not be overly burdensome for either partner.
Coca-Cola FEMSA entered into a stand-by credit facility, on December 19, 2003 with The Coca-Cola Export Corporation, which expired in December 2006.2006 and was never used.
New Cooperation Framework with theThe Coca-Cola Company
On September 1, 2006, Coca-Cola FEMSA and The Coca-Cola Company arrived atreached a comprehensive cooperation framework for a new stage of collaboration going forward. This new framework includes the main aspects of Coca-Cola FEMSA’s relationship with The Coca-Cola Company and defines the terms for the new collaborative business model. The framework is structured around three main objectives:objectives, which have been implemented as outlined below.
| • | Sustainable growth of sparkling beverages, |
| • | Horizontal growth: The |
| • | Long-term vision in relationship economics: Coca-Cola FEMSA and The Coca-Cola Company understand each other’s business objectives and growth plans, and the new framework provides long-term perspective on the economics of their relationship. This will allow Coca-Cola FEMSA and The Coca-Cola Company to focus on continuing to drive the business forward and generating profitable growth. |
Bottler Agreements
Bottler agreements are the standard agreements for each territory that The Coca-Cola Company enters into with bottlers outside the United States for the sale of concentrates for certain Coca-Cola trademark beverages.States. Coca-Cola FEMSA manufactures, packages, distributes and sells soft drinksparkling beverages, bottled still beverages and bottled water under a separate bottler agreement for each of its territories. Coca-Cola FEMSA is required to purchase concentrate and artificial sweeteners in some of its territories for allCoca-Cola trademark beverages from companies designated by The Coca-Cola Company.
These bottler agreements provide that Coca-Cola FEMSA will purchase its entire requirement of concentratesconcentrate forCoca-Cola trademark beverages from The Coca-Cola Company and other authorized suppliers at prices, terms of payment and on other terms and conditions of supply as determined from time to time by The Coca-Cola Company at its sole discretion. Concentrate prices are determined as a percentage of the weighted average retail price in local currency, net of applicable taxes. Although the price multipliers used to calculate the cost of concentrate and the currency of payment, among other terms, are set by The Coca-Cola Company at its sole discretion, Coca-Cola FEMSA sets the price of products sold to retailerscustomers at its discretion, subject to the
applicability of price restraints. Coca-Cola FEMSA has the exclusive right to distributeCoca-Cola trademark beverages for sale in its territories in authorized containers of the nature prescribed by the bottler agreements and currently used by Coca-Cola FEMSA. These containers include various configurations of cans and returnable and non-returnable bottles made of glass and plastic and fountain containers.
The bottler agreements include an acknowledgment by Coca-Cola FEMSA that The Coca-Cola Company is the sole owner of the trademarks that identify theCoca-Cola trademark beverages and of the secret formulas with which The Coca-Cola Company’s concentrates are made. Subject to Coca-Cola FEMSA’s exclusive right to distributeCoca-Colatrademark beverages in its territories, The Coca-Cola Company reserves the right to import and exportCoca-Cola trademark beverages to and from each of its territories. Coca-Cola FEMSA’s bottler agreements do not contain restrictions on The Coca-Cola Company’s ability to set the price of concentrates charged to its subsidiaries and do not impose minimum marketing obligations on The Coca-Cola Company. The prices at which Coca-Cola FEMSA purchases concentrates under the bottler agreements may vary materially from the prices it has historically paid. However, under Coca-Cola FEMSA’s bylaws and the shareholders agreement among certain subsidiaries of The Coca-Cola Company and certain of its subsidiaries and certain subsidiaries of our company, an adverse action by The Coca-Cola Company under any of the bottler agreements may result in a suspension of certain veto rights of the directors appointed by The Coca-Cola Company. This provides usCoca-Cola FEMSA with limited protection against The Coca-Cola Company’s ability to raise concentrate prices to the extent that such increase is deemed detrimental to Coca-Cola FEMSA pursuant to the shareholder agreement and the bylaws. See “—Shareholders Agreement.”
The Coca-Cola Company has the ability, at its sole discretion, to reformulate any of theCoca-Cola trademark beverages and to discontinue any of theCoca-Cola trademark beverages, subject to certain limitations, so long as allCoca-Cola trademark beverages are not discontinued. The Coca-Cola Company may also introduce new beverages in Coca-Cola FEMSA’s territories in which case Coca-Cola FEMSA has a right of first refusal with respect to the manufacturing, packaging, distribution and sale of such new beverages subject to the same obligations as then exist with respect to theCoca-Cola trademark beverages under the bottler agreements. The bottler agreements prohibit Coca-Cola FEMSA from producing, bottling or handling cola products other than those of The Coca-Cola Company, or other products or packages that would imitate, infringe upon, or cause confusion with the products, trade dress, containers or trademarks of The Coca-Cola Company, or from acquiring or holding an interest in a party that engages in such restricted activities. The bottler agreements also prohibit Coca-Cola FEMSA from producing, bottling or handling any soft drinksparkling beverage product except under the authority of, or with the consent of, The Coca-Cola Company. The bottler agreements impose restrictions concerning the use of certain trademarks, authorized containers, packaging and labeling of The Coca-Cola Company so as to conform to policies prescribed by The Coca-Cola Company. In particular, Coca-Cola FEMSA is obligated to:
maintain plant and equipment, staff and distribution facilities capable of manufacturing, packaging and distributing the Coca-Cola trademark beverages in authorized containers in accordance with Coca-Cola FEMSA bottler agreements and in sufficient quantities to satisfy fully the demand in its territories;
| • | maintain plant and equipment, staff and distribution facilities capable of manufacturing, packaging and distributing theCoca-Cola trademark beverages in authorized containers in accordance with Coca-Cola FEMSA bottler agreements and in sufficient quantities to satisfy fully the demand in its territories; |
undertake adequate quality control measures prescribed by The Coca-Cola Company;
| • | develop, stimulate and satisfy fully the demand forCoca-Cola trademark beverages using all approved means, which includes the investment in advertising and marketing plans; |
maintain a sound financial capacity as may be reasonably necessary to assure performance by Coca-Cola FEMSA and its affiliates of their obligations to The Coca-Cola Company; and
submit annually to The Coca-Cola Company, Coca-Cola FEMSA’s marketing, management, promotional and advertising plans for the ensuing year.
The Coca-Cola Company contributed a significant portion of Coca-Cola FEMSA’s total marketing expenses in its territories during 2007, a period in which Coca-Cola FEMSA contributed to The Coca-Cola Company’s marketing expenses2010 and has reiterated its intention to continue providing such support as part of ourits new corporationcooperation framework. Although Coca-Cola FEMSA believes that The Coca-Cola Company will continue to provide funds for advertising and marketing, it is not obligated to do so. Consequently, future levels of advertising and marketing support provided by The Coca-Cola Company may vary materially from the levels historically provided. See “—Shareholders Agreement.”
Coca-Cola FEMSA has separate bottler agreements with The Coca-Cola Company for each of the territories in which it operates. Some of theseThese bottler agreements renew automatically unless oneare renewable for ten-year terms, subject to the right of the parties giveseither party to give prior notice that it does not wish to renew the agreement, while others require an agreement between the parties or requirea specific agreement.
In Mexico, Coca-Cola FEMSA to give notice electing to renewhas four bottler agreements; the agreement.
agreements for two territories expire in June 2013 and the agreements for the other two territories expire in May 2015. Coca-Cola FEMSA’s bottler agreements for Mexico expire in 2013 for two of its territories and 2015 for two of its other territories, and are renewable in each case for ten-year terms. Coca-Cola FEMSA’s bottler agreements for Guatemala, Costa Rica, Nicaragua, Panama (other beverages) and Colombia expire on September 30, 2008. These bottler agreements are renewable by mutual agreement of the parties. Coca-Cola FEMSA’s bottler agreement forCoca-Cola trademark beverages for Panama has an indefinite term but may be terminated with six months prior written notice by either party. Coca-Cola FEMSA’s bottler agreement forCoca-Colatrademark beverages for Venezuela expires on September 30, 2008, based on an agreement in principle subject to the execution of a formal extension letter. Coca-Cola FEMSA’s bottler agreement for Argentina expires in 2014 and is renewable for a ten-year term. Coca-Cola FEMSA’s bottler agreement for Brazil expired in December 2004. For the expired agreements and the agreements expiring this year, Coca-Cola FEMSA is currently in the process of negotiating renewals on similar terms and conditions as its agreements in other countries. In the meantime, Coca-Cola FEMSA and The Coca-Cola Company will continue operating underexpire for its territories in the terms of the existing agreements.following countries: Argentina in September 2014; Brazil in April 2014; Colombia in June 2014; Venezuela in August 2016; Guatemala in March 2015; Costa Rica in September 2017; Nicaragua in May 2016; and Panama in November 2014.
The bottler agreements are subject to termination by The Coca-Cola Company in the event of default by Coca-Cola FEMSA. The default provisions include limitations on the change in ownership or control of Coca-Cola FEMSA and the assignment or transfer of the bottler agreements and are designed to preclude any person not acceptable to The Coca-Cola Company from obtaining an assignment of a bottler agreement or from acquiring Coca-Cola FEMSA independently of similarother rights set forth in the shareholders agreement. These provisions may prevent changes in Coca-Cola FEMSA’s principal shareholders, including mergers or acquisitions involving sales or dispositions of Coca-Cola FEMSA’s capital stock, which will involve an effective change of control without the consent of The Coca-Cola Company. See “—Shareholders Agreement.”
Coca-Cola FEMSA has also entered into tradename licensing agreements with The Coca-Cola Company pursuant to which Coca-Cola FEMSA is authorized to use certain trademark names of The Coca-Cola Company. These agreements have an indefinitea ten-year term, but are terminated if Coca-Cola FEMSA’s ceases to manufacture, market, sell and distributeCoca-Cola trademark products pursuant to the bottler agreements or if the shareholders agreement is terminated. The Coca-Cola Company also has the right to terminate thea license agreement if Coca-Cola FEMSA uses its trademark names in a manner not authorized by the bottler agreements.
Material Contracts Relating to our Holding of Heineken Shares
Share Exchange Agreement
As of January 11, 2010, FEMSA and certain of our subsidiaries entered into a share exchange agreement, which we refer to as the Share Exchange Agreement with Heineken Holding N.V. and Heineken N.V. The Share Exchange Agreement required Heineken N.V., in consideration for 100% of the shares of EMPREX Cerveza, S.A.
de C.V. (now Heineken Mexico Holding, S.A. de C.V.), which we refer to as EMPREX Cerveza, to deliver at the closing of the Heineken transaction 86,028,019 newly-issued Heineken N.V. shares to FEMSA with a commitment to deliver 29,172,504 additional Heineken N.V. shares over a period of not more than five years from the date of the closing of the Heineken transaction, which we refer to as the Allotted Shares. If Heineken N.V. is unable to fulfill its obligations to deliver the Allotted Shares, these obligations may be settled in cash with a significant penalty. The Allotted Shares will be delivered to us pursuant to an allotted shares delivery instrument.
The Share Exchange Agreement provided that, simultaneously with the closing of the transaction, Heineken Holding N.V. would swap 43,018,320 Heineken N.V. shares with FEMSA for an equal number of newly issued Heineken Holding N.V. shares. After the closing of the Heineken transaction, we owned 7.5% of Heineken N.V. shares, which will increase to 12.5% upon full delivery of the Allotted Shares, and 14.9% of Heineken Holding N.V. shares, which will represent an aggregate 20% economic interest in the Heineken Group.
Under the terms of the Share Exchange Agreement, in exchange for such economic interest in the Heineken Group, FEMSA delivered 100% of the shares representing the capital stock of EMPREX Cerveza, which owned 100% of the shares of FEMSA Cerveza. As a result of the transaction, EMPREX Cerveza and FEMSA Cerveza became wholly-owned subsidiaries of Heineken.
The principal provisions of the Share Exchange Agreements are as follows:
Delivery to Heineken N.V., by FEMSA, of 100% of the outstanding share capital of EMPREX Cerveza, which together with its subsidiaries, constitutes the entire beer business and operations of FEMSA in Mexico and Brazil (including the United States and other export business);
Delivery to FEMSA by Heineken N.V. of 86,028,019 new Heineken N.V. shares;
Simultaneously with the closing of the Heineken transaction, a swap between Heineken Holding N.V. and FEMSA of 43,018,320 Heineken N.V. shares for an equal number of newly issued shares in Heineken Holding N.V.;
The commitment by Heineken N.V. to assume indebtedness of EMPREX Cerveza and subsidiaries amounting to approximately US$2.1 billion;
The provision by FEMSA to the Heineken Group of indemnities customary in transactions of this nature concerning FEMSA and FEMSA Cerveza and its subsidiaries and their businesses;
FEMSA’s covenants to operate the EMPREX Cerveza business in the ordinary course consistent with past practice until the closing of the transaction, subject to customary exceptions, with the economic risks and benefits of the EMPREX Cerveza business transferring to Heineken as of January 1, 2010;
The provision by Heineken N.V. and Heineken Holding N.V. to FEMSA of indemnities customary in transactions of this nature concerning the Heineken Group; and
FEMSA’s covenants, subject to certain limitations, to not engage in the production, manufacture, packaging, distribution, marketing or sale of beer and similar beverages in Latin America, the United States, Canada and the Caribbean.
Corporate Governance Agreement
As of April 30, 2010, FEMSA, CB Equity LLP (as transferee of the Heineken N.V. & Heineken Holding N.V. Exchange Shares and Allotted Shares), Heineken N.V. Heineken Holding N.V. and L’Arche Green N.V., as majority shareholder of Heineken Holding N.V., entered into the corporate governance agreement, which we refer to as the Corporate Governance Agreement, which establishes the terms of the relationship between Heineken and FEMSA after the closing of the Heineken transaction.
The Corporate Governance Agreement covers, among other things, the following topics:
FEMSA’s representation on the Heineken Holding Board and the Heineken Supervisory Board and the creation of an Americas committee, also with FEMSA’s representation;
FEMSA’s representation on the selection and appointment committee and the audit committee of the Heineken Supervisory Board;
FEMSA’s commitment to not increase its holding in Heineken Holding N.V. above 20% and to not increase its holding in the Heineken Group above a maximum 20% economic interest (subject to certain exceptions); and
FEMSA’s agreement to not transfer any shares in Heineken N.V. or Heineken Holding N.V. for a five-year period, subject to certain exceptions, including among others, (i) beginning in the third anniversary, the right to sell up to 1% of all outstanding shares of each of Heineken N.V. and Heineken Holding N.V. in any calendar quarter and (ii) beginning in the third anniversary, the right to dividend or distribute to its shareholders each of Heineken N.V. and Heineken Holding N.V. shares.
Under the Corporate Governance Agreement, FEMSA is entitled to nominate two representatives to the Heineken Supervisory Board, one of whom will be appointed as Vice Chairman of the board of Heineken N.V. and will also serve as a representative of FEMSA on the Heineken Holding N.V. Board of Directors. Our nominees for appointment to the Heineken Supervisory Board were José Antonio Fernández Carbajal, our Chief Executive Officer, and Javier Astaburuaga Sanjines, our Chief Financial Officer, who were both approved by Heineken N.V.’s general meeting of shareholders. Mr. José Antonio Fernández was also approved to the Heineken Holding N.V. Board of Directors by the general meeting of shareholders of Heineken Holding N.V.
In addition, the Heineken Supervisory Board has created an Americas committee to oversee the strategic direction of the business in the American continent and assess new business opportunities in that region. The Americas committee consists of two existing members of the Heineken Supervisory Board and one FEMSA representative, who acts as the chairman. The chairman of the Americas committee is José Antonio Fernández Carbajal, our Chief Executive Officer.
The Corporate Governance Agreement has no fixed term, but certain provisions cease to apply if FEMSA ceases to have the right to nominate a representative to the Heineken Holding N.V. Board of Directors and the Heineken N.V. Supervisory Board. For example, in certain circumstances, FEMSA would be entitled to only one representative on the Heineken Supervisory Board, including in the event that FEMSA’s economic interest in the Heineken Group were to fall below 14%, the current FEMSA control structure were to change or FEMSA were to be subject to a change of control. In the event that FEMSA’s economic interest in Heineken falls below 7% or a beer producer acquires control of FEMSA, all of FEMSA’s corporate governance rights would end pursuant to the Corporate Governance Agreement.
We file reports, including annual reports on Form 20-F, and other information with the SEC pursuant to the rules and regulations of the SEC that apply to foreign private issuers. You may read and copy any materials filed with the SEC at its public reference rooms in Washington, D.C., at 450 Fifth Street, N.W., Washington, D.C. 20549. Please call the SEC at 1-800-SEC-0330 for further information on the public reference room. Filings we make electronically with the SEC are also available to the public over the Internet at the SEC’s website at www.sec.gov.
| ITEM 11. | QUANTITATIVE AND QUALITATIVE DISCLOSURES ABOUT MARKET RISK |
Our business activities require the holding or issuing of derivative financial instruments that expose us to market risks related to changes in interest rates, foreign currency exchange rates, equity risk and commodity price risk.
Interest rate risk exists principally with respect to our indebtedness that bears interest at floating rates. At December 31, 2007,2010, we had outstanding long-term indebtednesstotal debt of Ps. 36,58225,506 million, of which 32.2%40% bore interest at fixed interest rates and 67.8%60% bore interest at variable interest rates. Swap contracts held by us effectively switch a portion of our variable rate indebtedness into fixed-rate indebtedness. After giving effect to these contracts, as of December 31, 2007, 82.9%2010, 47.9% of our long-term indebtednesstotal debt was fixed rate and 17.1%52.1% of our long-term indebtednesstotal debt was variable rate. The interest rate on our variable rate debt is determined by reference to the London Interbank Offered Rate, or LIBOR, (a benchmark rate used for Eurodollar loans), theTasa de Interés Interbancaria de Equilibrio (Equilibrium Interbank Interest Rate) or TIIE, and theCertificados de la Tesorería (Treasury(Treasury Certificates) or CETES rate. If these reference rates increase, our interest payments would consequently increase.
The table below provides information about our derivative financial instruments that are sensitive to changes in interest rates and exchange rates. The table presents notional amounts and weighted average interest rates by expected contractual maturity dates. Notional amounts are used to calculate the contractual payments to be exchanged under the contract. Weighted average variable rates are based on the reference rates on December 31, 2007,2010, plus spreads contracted by us. TheOur derivative financial instruments’ current payments are denominated in U.S. dollars and Mexican pesos and Brazilian reais.pesos. All of the payments in the table are presented in Mexican pesos, our reporting currency, utilizing the December 31, 20072010 exchange rate of 10.8662Ps. 12.3571 Mexican pesos per U.S. dollar, and 6.1346 Mexican pesos per Brazilian reais.dollar.
The table below also includes the estimated fair value as of December 31, 20072010 of:
short and long-term debt, based on the discounted value of contractual cash flows, in which the discount rate is estimated using rates currently offered for debt with similar terms and remaining maturities;
long-term notes payable, based on quoted market prices; and
cross currency swaps and interest rate swaps, based on quoted market prices to terminate the contracts as of December 31, 2007.2010.
As of December 31, 2007,2010, the fair value represents an additional liabilitya decrease in total debt of Ps. 378 million.55 million less than book value due to a decrease in the interest rate in Mexico.
Principal by Year of Maturity
| At December 31, 2007 | At December 31, 2006 | At December 31, 2010 | At December 31, 2009 | ||||||||||||||||||||||||||||||||||||||||||||||||||||||||||||||||||
| 2008 | 2009 | 2010 | 2011 | 2012 | 2013 and thereafter | Carrying Value | Fair Value | Carrying Value | Fair Value | 2011 | 2012 | 2013 | 2014 | 2015 | 2016 and thereafter | Carrying Value | Fair Value | Carrying Value | Fair Value | ||||||||||||||||||||||||||||||||||||||||||||||||||
| (in millions of Mexican pesos) | |||||||||||||||||||||||||||||||||||||||||||||||||||||||||||||||||||||
Short-term debt: | |||||||||||||||||||||||||||||||||||||||||||||||||||||||||||||||||||||
Variable rate debt: | |||||||||||||||||||||||||||||||||||||||||||||||||||||||||||||||||||||
Mexican pesos | — | 1,400 | 1,400 | ||||||||||||||||||||||||||||||||||||||||||||||||||||||||||||||||||
Interest rate(1) | 8.2 | % | |||||||||||||||||||||||||||||||||||||||||||||||||||||||||||||||||||
Argentine pesos | 506 | — | — | — | — | — | 506 | 506 | 1,179 | 1,179 | |||||||||||||||||||||||||||||||||||||||||||||||||||||||||||
Interest rate(1) | 15.3 | % | 15.3 | % | 20.7 | % | |||||||||||||||||||||||||||||||||||||||||||||||||||||||||||||||
Colombian pesos | 1,072 | — | — | — | — | — | 1,072 | 1,072 | 496 | 496 | |||||||||||||||||||||||||||||||||||||||||||||||||||||||||||
Interest rate(1) | 4.4 | % | 4.4 | % | — | 4.9 | % | ||||||||||||||||||||||||||||||||||||||||||||||||||||||||||||||
Venezuelan Bolívares fuertes | — | 741 | 741 | ||||||||||||||||||||||||||||||||||||||||||||||||||||||||||||||||||
Interest rate(1) | 18.1 | % | |||||||||||||||||||||||||||||||||||||||||||||||||||||||||||||||||||
Subtotal | 1,578 | — | — | — | — | — | 1,578 | 1,578 | 3,816 | 3,816 | |||||||||||||||||||||||||||||||||||||||||||||||||||||||||||
| (in millions of constant Mexican pesos) | |||||||||||||||||||||||||||||||||||||||||||||||||||||||||||||||||||||
Long-term debt: | |||||||||||||||||||||||||||||||||||||||||||||||||||||||||||||||||||||
Fixed rate debt: | |||||||||||||||||||||||||||||||||||||||||||||||||||||||||||||||||||||
Mexican pesos | 50 | 640 | 2,200 | 280 | 1,916 | 2,508 | 7,594 | 7,779 | 5,848 | 6,144 | — | 2,000 | 2,050 | ||||||||||||||||||||||||||||||||||||||||||||||||||||||||
Interest rate(1) | 9.1 | % | 9.1 | % | 9.0 | % | 8.7 | % | 8.6 | % | 7.7 | % | 8.0 | % | — | 9.8 | % | 9.8 | % | ||||||||||||||||||||||||||||||||||||||||||||||||||
J.P. Morgan (Yankee Bond) | 6,179 | 6,179 | 6,179 | — | |||||||||||||||||||||||||||||||||||||||||||||||||||||||||||||||||
Interest rate | 4.6 | % | 4.6 | % | |||||||||||||||||||||||||||||||||||||||||||||||||||||||||||||||||
Units of Investment (UDIs) | 3,193 | 3,193 | 3,193 | 2,964 | 2,964 | ||||||||||||||||||||||||||||||||||||||||||||||||||||||||||||||||
Interest rate(1) | 4.2 | % | 4.2 | % | 4.2 | % | |||||||||||||||||||||||||||||||||||||||||||||||||||||||||||||||
U.S. dollars | 594 | 3,332 | 20 | — | — | — | 3,946 | 4,103 | 4,113 | 4,118 | 4 | — | — | — | — | 4 | 4 | 15 | 15 | ||||||||||||||||||||||||||||||||||||||||||||||||||
Interest rate(1) | 7.0 | % | 7.2 | % | 3.4 | % | — | — | — | 7.0 | % | — | 6.9 | % | 3.8 | % | 3.8 | % | 3.8 | % | |||||||||||||||||||||||||||||||||||||||||||||||||
Japanese yen | 156 | 74 | — | — | 230 | 230 | 191 | 191 | |||||||||||||||||||||||||||||||||||||||||||||||||||||||||||||
Argentine pesos | 62 | 622 | — | — | — | — | 684 | 684 | 69 | 69 | |||||||||||||||||||||||||||||||||||||||||||||||||||||||||||
Interest rate(1) | 20.5 | % | 16.1 | % | 16.5 | % | 20.5 | % | |||||||||||||||||||||||||||||||||||||||||||||||||||||||||||||
Brazilian reais | 4 | 9 | 15 | 15 | 14 | 45 | 102 | 102 | — | — | |||||||||||||||||||||||||||||||||||||||||||||||||||||||||||
Interest rate(1) | 4.8 | % | 2.8 | % | — | — | 4.8 | % | — | 5.8 | % | 4.5 | % | 4.5 | % | 4.5 | % | 4.5 | % | 4.5 | % | 4.5 | % | 4.5 | % | ||||||||||||||||||||||||||||||||||||||||||||
Subtotal | 800 | 4,046 | 2,220 | 280 | 1,916 | 2,508 | 11,770 | 12,112 | 10,152 | 10,453 | 70 | 631 | 15 | 15 | 14 | 9,417 | 10,162 | 10,162 | 5,048 | 5,098 | |||||||||||||||||||||||||||||||||||||||||||||||||
Variable rate debt: | |||||||||||||||||||||||||||||||||||||||||||||||||||||||||||||||||||||
Mexican pesos | 5,043 | 1,269 | 731 | 1,767 | 4,523 | 9,427 | 22,760 | 22,796 | 25,035 | 25,105 | 1,500 | 3,067 | 3,767 | 1,392 | 2,824 | — | 12,550 | 12,495 | 18,062 | 17,886 | |||||||||||||||||||||||||||||||||||||||||||||||||
Interest rate(1) | 8.2 | % | 8.0 | % | 8.0 | % | 8.0 | % | 8.0 | % | 8.0 | % | 8.1 | % | — | 7.8 | % | 4.9 | % | 4.8 | % | 4.8 | % | 5.1 | % | 5.1 | % | 4.9 | % | 5.6 | % | ||||||||||||||||||||||||||||||||||||||
U.S. dollars | 39 | 30 | 30 | 28 | 734 | 1,155 | 2,016 | 2,016 | 2,769 | 2,769 | — | 37 | 185 | — | — | — | 222 | 222 | 2,873 | 2,873 | |||||||||||||||||||||||||||||||||||||||||||||||||
Interest rate(1) | 5.2 | % | 5.2 | % | 5.1 | % | 5.1 | % | 5.1 | % | 5.1 | % | 5.2 | % | — | 5.7 | % | — | 0.5 | % | 0.6 | % | 0.6 | % | 0.5 | % | |||||||||||||||||||||||||||||||||||||||||||
Brazilian reais | 35 | 1 | — | — | — | — | 36 | 36 | 84 | 84 | |||||||||||||||||||||||||||||||||||||||||||||||||||||||||||
Interest rate(1) | 8.7 | % | 10.6 | % | — | — | — | — | 8.7 | % | — | 9.3 | % | — | |||||||||||||||||||||||||||||||||||||||||||||||||||||||
Colombian pesos(2) | — | — | — | — | — | — | 196 | 196 | |||||||||||||||||||||||||||||||||||||||||||||||||||||||||||||
Interest rate(1) | — | — | — | — | — | — | 9.3 | % | |||||||||||||||||||||||||||||||||||||||||||||||||||||||||||||
Subtotal | 5,117 | 1,300 | 761 | 1,795 | 5,257 | 10,582 | 24,812 | 24,848 | 28,084 | 28,154 | |||||||||||||||||||||||||||||||||||||||||||||||||||||||||||
Total debt | 5,918 | 5,346 | 2,981 | 2,075 | 7,173 | 13,090 | 36,582 | 36,960 | 38,236 | 38,607 | |||||||||||||||||||||||||||||||||||||||||||||||||||||||||||
Derivative financial instruments: | |||||||||||||||||||||||||||||||||||||||||||||||||||||||||||||||||||||
Interest rate swaps: | |||||||||||||||||||||||||||||||||||||||||||||||||||||||||||||||||||||
Mexican pesos: | |||||||||||||||||||||||||||||||||||||||||||||||||||||||||||||||||||||
Variable to fixed | 5,000 | 1,250 | 712 | 1,763 | 2,815 | 7,010 | 18,550 | (324 | ) | 20,741 | 1,127 | ||||||||||||||||||||||||||||||||||||||||||||||||||||||||||
Interest pay rate(1) | 9.5 | % | 9.5 | % | 9.4 | % | 9.4 | % | 9.5 | % | 10.3 | % | 9.6 | % | 9.5 | % | |||||||||||||||||||||||||||||||||||||||||||||||||||||
Interest receive rate(1) | 8.0 | % | 8.0 | % | 7.9 | % | 7.9 | % | 7.8 | % | 7.8 | % | 7.9 | % | 7.7 | % | |||||||||||||||||||||||||||||||||||||||||||||||||||||
Cross currency swaps: | |||||||||||||||||||||||||||||||||||||||||||||||||||||||||||||||||||||
Japanese yen to Brazilian reais | |||||||||||||||||||||||||||||||||||||||||||||||||||||||||||||||||||||
Fixed to variable | 156 | 74 | — | — | 230 | 1 | 499 | 5 | |||||||||||||||||||||||||||||||||||||||||||||||||||||||||||||
Interest pay rate(1) | 11.8 | % | 11.8 | % | — | — | — | — | 11.8 | % | 13.9 | % | |||||||||||||||||||||||||||||||||||||||||||||||||||||||||
Interest receive rate(1) | 4.8 | % | 2.8 | % | — | — | — | — | 4.8 | % | 4.0 | % | |||||||||||||||||||||||||||||||||||||||||||||||||||||||||
Colombian pesos | 155 | 839 | — | — | — | — | 994 | 994 | — | ||||||||||||||||||||||||||||||||||||||||||||||||||||||||||||
Interest rate(1) Subtotal Total long-term debt Derivative financial instruments: Interest rate swaps(2): Mexican pesos: Variable to fixed Interest pay rate(1) Interest receive rate(1) U.S. dollars: variable to fixed rate(1) Interest pay rate(1) Interest receive rate(1) Cross currency swaps: Units of Investment (or UDIs) To Mexican pesos and variable rate Interest pay rate(1) Interest receive rate(1) At December 31, 2010 At December 31,
2009 2011 2012 2013 2014 2015 2016 and
thereafter Carrying
Value Fair
Value Carrying
Value Fair
Value (in millions of Mexican pesos) 4.7 % 4.7 % 4.7 % 1,655 3,943 3,952 1,392 2,824 — 13,766 13,711 20,935 20,759 1,725 4,574 3,967 1,407 2,838 9,417 23,928 23,873 25,983 25,857 — 1,600 2,500 — 1,160 — 5,260 (302 ) 5,012 (142 ) 8.1 % 8.1 % 8.4 % 8.1 % 8.9 % 4.8 % 4.8 % 5.1 % 4.9 % 4.9 % — 1,632 (34 ) 3.1 % 0.5 % — — — 2,500 2,500 717 2,500 480 — — — 4.7 % 4.7 % 4.8 % — — — 4.2 % 4.2 % 4.2 %
| (1) | Weighted average interest rate. |
| (2) |
A hypothetical, instantaneous and unfavorable change of one percentage point in the average interest rate applicable to variable-rate liabilities held at December 31, 20072010 would increase our variable interest expense by approximately Ps. 83132.8 million, or 13.5%15.2%, over the 12-month period of 20072010 assuming no additional debt is incurred during such period, in each case after giving effect to all of our interest and cross currency swap agreements.
Foreign Currency Exchange Rate Risk
Our principal exchange rate risk involves changes in the value of the local currencies, of each country in which we operate, relative to the U.S. dollar. In 2007,2010, the percentage of our consolidated total revenues was denominated as follows:
Total Revenues by Countries At December 31, 2010
| ||||||
| % of Consolidated Total Revenues | |||||
Mexico | Mexican peso | |||||
| 62 | |||||
Venezuela | 8 | % | ||||
| ||||||
| Reais, Argentine peso | 20 | % | |||
| 10 | % | ||||
|
We estimate that a majority of our consolidated costs and expenses are denominated in Mexican pesos for Mexican subsidiaries and in the aforementioned currencies for the foreign subsidiaries, which are principally subsidiaries of Coca-Cola FEMSA and FEMSA Cerveza.FEMSA. Substantially all of our costs and expenses denominated in a foreign currency, other than the functional currency of each country in which we operate, are denominated in U.S. dollars. As of December 31, 20072010 after giving effect to all cross currency swaps, 83.0%65.8% of our long-term indebtedness was denominated in Mexican pesos, 16.3%26.8% was denominated in U.S. dollars, 4.1% was denominated in Colombian pesos, 2.9% was denominated in Argentine pesos and the remaining 0.7%0.4% was denominated in Brazilian reais. We also have short-term indebtedness, which consists of revolving bank loans.loans in Colombian pesos and Argentine pesos. Decreases in the value of the different currencies relative to the U.S. dollar will increase the cost of our foreign currency denominated operating costs and expenses, and the debt service obligations with respect to our foreign currency denominated indebtedness. A depreciation of the Mexican peso relative to the U.S. dollar will also result in foreign exchange losses as the Mexican peso value of our foreign currency denominated long-term indebtedness is increased.
Our exposure to market risk associated with changes in foreign currency exchange rates relates primarily to U.S. dollar-denominated debt obligations as shown in the interest risk table above. We occasionally utilize financial derivative instruments to hedge our exposure to the U.S. dollar relative to the Mexican peso and other currencies.
As of December 31, 2007,2010, we had forward agreements that meet the hedging criteria for accounting purposes, to hedge our operations denominated in U.S. dollars. The notional amount is Ps. 1,783578 million with a fair value asset of Ps. 102 million and a notional amount of Ps. 1,690 million with a fair value liability of Ps. 18 million, in each case with a maturity date in 2008. As ofduring 2011. For the year ended December 31, 20072010, we did not have any effects regardingrecorded a net gain on expired forward agreements. In 2006, we registered in our consolidated income statement,agreements of Ps. 227 million as a part of foreign exchange loss related to expired forward agreements that meet the hedging criteria for accounting purposes.exchange. The fair value of the foreign currency forward contracts is estimated based on the quoted market price of each agreement at year endyear-end assuming the same maturity dates originally contracted.
As of December 31, 2007,2009, certain forward agreements do not meet the hedging criteria for accounting purposes; consequently changes in the estimated fair value were recorded in our consolidated income statement. These contracts with a notional amount of Ps. 1,087 million, expire in 2008 and generated a gain of Ps. 9 million. As ofFor the years ended December 31, 20072009 and 2006,2008, the net effect of expired contracts that do not meet hedging criteria for accounting purposes, was a gainwere losses of Ps. 1363 million and a loss of Ps. 22705 million, respectively. The fair value of the foreign currency forward contracts is estimated based on the quoted market price of each agreement at year end assuming the same maturity dates originally contracted.
As of December 31, 2007,2010, we did not have any call option agreements to buy U.S. dollars. We contracted cross currency swaps to manage the interest rate and foreign exchange risks associated with our borrowings denominated in U.S. dollars and other foreign currencies. The aggregate notional amount is Ps. 230 million with maturity date in 2009. The fair value is estimated based on quoted market exchange rates and interest rates to terminate the contracts at December 31, 2007, with a fair value liability of Ps. 39 million. As of December 31, 2007 and 2006, the net effect of expired contracts is included in interest expense and amounted to Ps. 37 million and Ps. 72 million, respectively.
As of December 31, 2007,2010, we have cross currency swaps designated as fair value hedges under contracts with an aggregate notional amount of Ps. 2,500 million that expire in 2013 and 2017, for which we have recorded a net fair value asset of Ps. 717 million. The net effect of our expired contracts for the years ended December 31, 2010, 2009 and 2008 was recorded as an interest income of Ps. 2 million in 2010, and as interest expenses of Ps. 32 million and Ps. 73 million as of December 31, 2009 and 2008, respectively.
For the year ended December 31, 2010, certain cross currency swap instruments dodid not meet the hedging criteria for accounting purposes; consequently changes in the estimated fair value were recorded in the income statement. The notional amount of these contracts is Ps. 5,302 million and maturechanges in December 2017. The fair value of these contracts represented a gaingains of Ps. 59 million. As of December 31, 2007205 million and 2006, the net effect of expired contracts is includedPs. 168 million in the internal result of financing was a gain of Ps. 5 million2010 and 2009, respectively, and a loss of Ps. 3200 million respectively.in 2008.
U.S. Dollar Forwards: To hedge Mexican peso risk Weighted average foreign exchange rate Mexican peso per U.S. Dollar: Contracted Quoted market Euro forwards: To hedge Mexican peso risk Weighted average foreign exchange rate Mexican peso for euro: Contracted Quoted market Cross currency and interest rate swap: To hedge Japanese yen risk Weighted average foreign exchange rate Japanese yen per Brazilian reais: Contracted Quoted market To hedge Japanese yen risk Weighted average foreign exchange rate Japanese yen per Brazilian reais: Contracted Quoted market Forward and Cross Currency Swaps At December 31, 2007 At December 31, 2006 Notional
Amount Fair Value
Asset
(liability) Notional
Amount Fair Value
Asset
(liability) (in millions of U.S. dollars, millions of Euros and
millions of constant Mexican pesos) 1,783 10 — — 10.9986 10.8662 € 2 Ps. 2 — 13.0470 — 14.3303 ¥ 1,639 Ps. (38 ) ¥ 4,267 Ps.(18 ) 0.0183 0.0185 0.0155 0.0181 ¥ 777 Ps. (1 ) — — 0.0161 0.0155
As of December 31, 2007,2010, we had determined that our leasing contracts denominated in U.S. dollars host an embedded derivative financial instrument. AtThe fair value of these contracts is based on the exchange rate used to finish the contract as of the end of the period. For the year ended December 31, 20072010 and 2006,2009, the fair value of these contracts representedresulted in gains of Ps. 915 million and Ps. 4919 million, respectively, and a loss of Ps. 68 million as of December 31, 2008, which are recorded in the income statement as market value loss on ineffective portion of derivative financial instruments.
A hypothetical, instantaneous and unfavorable 10% devaluation in the value of the Mexican peso relative to the U.S. dollar occurring on December 31, 2007,2010, would have resulted in an increasea reduction in our net consolidated integral result of financing expense of approximately Ps. 854368 million over the 12-month period of 2007,2010, reflecting higher interest expense and foreign exchange gain and interest expense generated by the cash balances held in U.S. dollars as of that date, net of the loss based on our U.S. dollar-denominated indebtedness at December 31, 2007.2010. However, this result does not take into account any gain on monetary position that would be expected to result from an increase in the inflation rate generated by a devaluation of the Mexican pesolocal currencies relative to the U.S. dollar in inflationary economic environments, which gain on monetary position would reduce the consolidated net integral result of financing.comprehensive financial result.
As of May 30, 2008,31, 2011, the exchange rates relative to the U.S. dollar of all the countries in which we operate as well as their devaluation/revaluation effect compared to December 31, 2007,2010, are as follows:
Country | Currency | Exchange Rate at May 30, 2008 | (Devaluation) / Revaluation | Currency | Exchange Rate as of May 31, 2011 | (Devaluation) / Revaluation | |||||||||||
Mexico | Mexican peso | 10.3066 | (5.1 | )% | Mexican peso | 11.6526 | 5.9 | % | |||||||||
Brazil | Reai | 1.6294 | (8.0 | )% | Reais | 1.5799 | 5.2 | % | |||||||||
Venezuela | Bolivar | 2.1500 | 0.0 | % | Bolívar fuerte | 4.3000 | — | ||||||||||
Colombia | Colombian peso | 1,744.0100 | (13.4 | )% | Colombian peso | 1,817.3400 | 5.0 | % | |||||||||
Argentina | Argentine peso | 3.0978 | (1.6 | )% | Argentine peso | 4.0900 | (2.9 | )% | |||||||||
Costa Rica | Colon | 570.6300 | 13.9 | % | Colon | 511.1500 | 1.3 | % | |||||||||
Guatemala | Quetzal | 7.4335 | (2.6 | )% | Quetzal | 7.7956 | 2.7 | % | |||||||||
Nicaragua | Cordoba | 19.2899 | 2.0 | % | Cordoba | 22.3287 | (2.0 | )% | |||||||||
Panama | U.S. dollar | 1.0000 | — | U.S. dollar | 1.0000 | — | |||||||||||
Euro Zone | Euro | 16.5150 | 0.7 | % | |||||||||||||
A hypothetical, instantaneous and unfavorable 10% devaluation in the value of the currencies of all the countries in which we operate, relative to the U.S. dollar occurring on December 31, 2007,2010, would produce a reduction in stockholders’ equity as follows:
Country | Currency | Reduction in Stockholders’ Equity | ||||
| (in millions of Mexican pesos) | ||||||
Mexico | Mexican peso | Ps. (368 | ) | |||
Brazil | Reais | 1,542 | ||||
Venezuela | 462 | |||||
Colombia | Colombian peso | 840 | ||||
Costa Rica | Colon | 287 | ||||
Argentina | Argentine peso | 98 | ||||
Guatemala | Quetzal | 103 | ||||
Nicaragua | Cordoba | 117 | ||||
Panama | U.S. dollar | 185 | ||||
Euro Zone | Euro | 6,089 | ||||
As of December 31, 20072010 and 2006,2009, we did not have any equity forward agreements.
We entered into various derivative contracts to hedge the cost of certain raw materials.materials that are exposed to variations of commodity price exchange rates. As of December 31, 2007,2010, we had various derivative instruments contracts with maturity dates in 2010,2011 and 2012, notional amounts of Ps. 2,419451 million and a fair value liabilityasset of Ps. 96445 million. The result of our commodity price contracts as offor the years ended December 31, 20072010, 2009 and 20062008, were losses of Ps. 82393 million, Ps. 247 million and Ps. 1062 million, respectively, which were recorded in the results offrom operations of each year. As of December 31, 2007After discontinuing our beer business, we have certainno derivative contracts that do not meet hedging criteria for accounting purposes.
| ITEM 12. | DESCRIPTION OF SECURITIES OTHER THAN EQUITY SECURITIES |
| ITEM 12A. | DEBT SECURITIES |
Not applicable.
| ITEM 12B. | WARRANTS AND RIGHTS |
Not applicable.
| ITEM 12C. | OTHER SECURITIES |
Not applicable.
| ITEM 12D. | AMERICAN DEPOSITARY SHARES |
The fair valueBank of these contracts was recognizedNew York Mellon serves as the depositary for our ADSs. Holders of our ADSs, evidenced by ADRs are required to pay various fees to the depositary, and the depositary may refuse to provide any service for which a lossfee is assessed until the applicable fee has been paid.
ADS holders are required to pay the depositary amounts in respect of expenses incurred by the depositary or its agents on ineffective portionbehalf of derivative financial instrumentsADS holders, including expenses arising from compliance with applicable law, taxes or other governmental charges, cable, telex and facsimile transmission, or the conversion of Ps. 43 million.foreign currency into U.S. dollars. The fair value is estimated based ondepositary may decide in its sole discretion to seek payment by either billing holders or by deducting the quoted market pricesfee from one or more cash dividends or other cash distributions.
ADS holders are also required to terminatepay additional fees for certain services provided by the contracts atdepositary, as set forth in the reporting date.table below.
Depositary service | Fee payable by ADS holders | |
Issuance and delivery of ADSs, including in connection with share distributions, stock splits | Up to US$5.00 per 100 ADSs (or portion thereof) | |
Distribution of dividends(1) | Up to US$0.02 per ADS | |
Withdrawal of shares underlying ADSs | Up to US$5.00 per 100 ADSs (or portion thereof) |
| (1) | As of the date of this annual report, holders of our ADSs were not required to pay additional fees with respect to this service. |
ITEMS 12-14. NOT APPLICABLEDirect and indirect payments by the depositary
The depositary pays us an agreed amount, which includes reimbursements for certain expenses we incur in connection with the ADS program. These reimbursable expenses include legal and accounting fees, listing fees, investor relations expenses and fees payable to service providers for the distribution of material to ADS holders. For the year ended December 31, 2010, this amount was US$728.7 thousand.
| ITEMS 13-14. | NOT APPLICABLE |
| ITEM 15. | CONTROLS AND PROCEDURES |
(a) DiscloseDisclosure Controls and Procedures
We have evaluated, with the participation of our chief executive officer and chief financial officer, the effectiveness of our disclosure controls and procedures as of December 31, 2007.2010. There are inherent limitations to the effectiveness of any system of disclosure controls and procedures, including the possibility of human error and the circumvention or overriding of the controls and procedures. Accordingly, even effective disclosure controls and procedures can only provide reasonable assurance of achieving their control objectives. Based upon our evaluation, our chiefprincipal executive officer and chiefprincipal financial officer concluded that our disclosure controls and procedures were effective to provide reasonable assurance that information required to be disclosed by us in the reports that we file or submit under the Exchange Act is recorded, processed, summarized and reported, within the time periods specified in the applicable rules and forms, and that it is accumulated and communicated to our management, including our chief executive officer and chief financial officer, as appropriate to allow timely decisions regarding required disclosure.
(b) ManagementsManagement’s annual report on internal control over financial reporting.reporting
Our management is responsible for establishing and maintaining adequate internal control over financial reporting, as such term is defined in Rules 13a-15(f) and 15d-15(f) under the Securities Exchange Act of 1934, as amended. Under the supervision and with the participation of our management, including our principal executive officer and principal financial officer, we conducted an evaluation of the effectiveness of our internal control over financial reporting based on the framework in Internal Control—Integrated Framework issued by the Committee of Sponsoring Organizations of the Treadway Commission.
Our internal control over financial reporting is a process designed to provide reasonable assurance regarding the reliability of financial reporting and the preparation of financial statements for external purposes in accordance with generally accepted accounting principles. Our internal control over financial reporting includes those policies and procedures that (i) pertain to the maintenance of records that, in reasonable detail, accurately and fairly reflect the transactions and dispositions of our assets;assets, (ii) provide reasonable assurance that transactions are recorded as necessary to permit preparation of financial statements in accordance with generally accepted accounting principles, and that our receipts and expenditures are being made only in accordance with authorizations of our management and directors;directors, and (iii) provide reasonable assurance regarding prevention or timely detection of unauthorized acquisition, use, or disposition of our assets that could have a material effect on our financial statements.
Because of its inherent limitations, internal control over financial reporting may not prevent or detect misstatements. Also, projections of any evaluation of effectiveness to future periods are subject to the risk that controls may become inadequate because of changes in conditions, or that the degree of compliance with the policies or procedures may deteriorate. Based on our evaluation under the framework in Internal Controls—Integrated Framework issued by the Committee of Sponsoring Organizations of the Treadway Commission, our management concluded that our internal control over financial reporting was effective as of December 31, 2007.2010.
The effectiveness of our internal control over financial reporting as of December 31, 20072010 has been audited by Galaz, Yamazaki, Ruiz Urquiza,Mancera, S.C., a member of Deloitte Touche Tohmatsu,Ernst & Young Global, an independent registered public accounting firm, as stated in its report included herein.
(c) Attestation Report of the Registered Public Accounting Firm.Firm
REPORT OF INDEPENDENT REGISTERED PUBLIC ACCOUNTING FIRM ON
TO THE BOARD OF DIRECTORS AND STOCKHOLDERS OFINTERNAL CONTROL OVER FINANCIAL REPORTING
FOMENTO ECONÓMICO MEXICANO,The Board of Directors and Stockholders
Fomento Económico Mexicano, S.A.B. DEde C.V.
We have audited the internal control over financial reporting of Fomento Económico Mexicano, S.A.B. de C.V. and subsidiaries (the “Company”)subsidiaries’ internal control over financial reporting as of December 31, 2007,2010, based on criteria established in Internal Control—Integrated Framework issued by the Committee of Sponsoring Organizations of the Treadway Commission. The Company’sCommission (the COSO criteria). Fomento Económico Mexicano, S.A.B. de C.V. and subsidiaries’ management is responsible for maintaining effective internal control over financial reporting, and for its assessment of the effectiveness of internal control over financial reporting included in the accompanying Management’s Annual Report on Internal Control over Financial Reporting. Our responsibility is to express an opinion on the Company’scompany’s internal control over financial reporting based on our audit.
We conducted our audit in accordance with the standards of the Public Company Accounting Oversight Board (United States). Those standards require that we plan and perform the audit to obtain reasonable assurance about whether effective internal control over financial reporting was maintained in all material respects. Our audit included obtaining an understanding of internal control over financial reporting, assessing the risk that a material weakness exists, testing and evaluating the design and operating effectiveness of internal control based on the assessed risk, and performing such other procedures as we considered necessary in the circumstances. We believe that our audit provides a reasonable basis for our opinion.
A company’s internal control over financial reporting is a process designed by, or under the supervision of, the company’s principal executive and principal financial officers, or persons performing similar functions, and effected by the company’s board of directors, management, and other personnel to provide reasonable assurance regarding the reliability of financial reporting and the preparation of financial statements for external purposes in accordance with generally accepted accounting principles.Mexican Financial Reporting Standards, including the reconciliation to U.S. GAAP in accordance with Item 18 of Form 20F. A company’s internal control over financial reporting includes those policies and procedures that (1) pertain to the maintenance of records that, in reasonable detail, accurately and fairly reflect the transactions and dispositions of the assets of the company; (2) provide reasonable assurance that transactions are recorded as necessary to permit preparation of financial statements in accordance with generally accepted accounting principles,Mexican Financial Reporting Standards, including the reconciliation to U.S. GAAP in accordance with Item 18 of Form 20F, and that receipts and expenditures of the company are being made only in accordance with authorizations of management and directors of the company; and (3) provide reasonable assurance regarding prevention or timely detection of unauthorized acquisition, use, or disposition of the company’s assets that could have a material effect on the financial statements.
Because of theits inherent limitations, of internal control over financial reporting including the possibility of collusion or improper management override of controls, material misstatements due to error or fraud may not be prevented or detected on a timely basis.prevent of detect misstatements. Also, projections of any evaluation of the effectiveness of the internal control over financial reporting to future periods are subject to the risk that the controls may become inadequate because of changes in conditions, or that the degree of compliance with the policies or procedures may deteriorate.
In our opinion, the CompanyFomento Económico Mexicano, S.A.B. de C.V. and subsidiaries maintained, in all material respects, effective internal control over financial reporting as of December 31, 2007,2010, based on the criteria established in Internal Control—Integrated Framework issued by the Committee of Sponsoring Organizations of the Treadway Commission.COSO criteria.
We also have also audited, in accordance with the standards of the Public Company Accounting Oversight Board (United States), the consolidated financial statementsbalance sheets of Fomento Económico Mexicano, S.A.B. de C.V. and subsidiaries as of December 31, 2010 and 2009, and the related consolidated statements of income, changes in stockholders’ equity and cash flows for each of the yearthree years in the period ended December 31, 2007 of the Company,2010, and our report dated June 12, 200828, 2011 expressed an unqualified opinion on those financial statements and includes explanatory paragraphs regarding (1) the nature and effect of differences between Mexican Financial Reporting Standards and accounting principles generally accepted in the United States of America (2) the adoption of Statement of Financial Accounting Standards No. 158, Employers’ Accounting for Defined Benefit Pension and Other Postretirement Plans—an amendment of FASB Statements No. 87, 88, 106, and 132(R) effective December 31, 2006 and (3) that our audit also comprehended the translation of Mexican peso amounts into U.S. dollar amounts in conformity with the basis stated in Note 2 to such consolidated financial statements.
Galaz, Yamazaki, Ruiz Urquiza, S.C.
Member of Deloitte Touche Tohmatsu
C.P.C. Gabriel González Martínez
Mancera, S.C. | ||
A Member Practice of Ernst & Young Global | ||
C.P.C. Víctor Luis Soulé García |
Monterrey, N.L., Mexico
June 12, 200828, 2011
(d) Changes in Internal Control over Financial Reporting
During 2007,2010, there were no changes in our internal control over financial reporting that either materially affected, or would be reasonably likely to have a material effect, on our internal control over financial reporting. The share exchange transaction with Heineken for our FEMSA Cerveza division caused the elimination of certain processes related to the FEMSA Cerveza division and the termination of certain non key financial reporting personnel. However, these changes did not have any effect on our internal control over financial reporting.
ITEM 16A. AUDIT COMMITTEE FINANCIAL EXPERT
Our shareholders and our board of directors have designated Jos��José Manuel Canal Hernando, an independent director as required by the Mexican Securities Market Law and applicable New York Stock Exchange listing standards, as an “audit committee financial expert” within the meaning of this Item 16A. See “Item 6. Directors, Senior Management and Employees—Directors.”
We have adopted a code of ethics, within the meaning of this Item 16B of Form 20-F. Our code of ethics applies to our chief executive officer, chief financial officer, chief accounting officer and persons performing similar functions as well as to our directors and other officers and employees. Our code of ethics is available on our website at www.femsa.com/ethics.asp.www.femsa.com. If we amend the provisions of our code of ethics that apply to our chief executive officer, chief financial officer, chief accounting officer and persons performing similar functions, or if we grant any waiver of such provisions, we will disclose such amendment or waiver on our web site at the same address.
ITEM 16C. PRINCIPAL ACCOUNTANT FEES AND SERVICES
| ITEM 16C. | PRINCIPAL ACCOUNTANT FEES AND SERVICES |
Audit and Non-Audit Fees
For the fiscal years ended December 31, 2010 and 2009, Mancera, S.C., a member practice of Ernst & Young Global, was our auditor.
The following table summarizes the aggregate fees billed to us in 2010 and 2009 by Galaz, Yamazaki, Ruiz Urquiza,Mancera, S.C., Member of Deloitte Touche Tohmatsu, and its affiliates as principal auditors, which we collectively refer to as Deloitte,is an independent registered public accounting firm, during the fiscal years ended December 31, 20072010 and 2006:2009:
| Year ended December 31, | Year ended December 31, | |||||||||||||
| 2007 | 2006 | 2010 | 2009 | |||||||||||
| (in millions of Mexican pesos) | (in millions of Mexican pesos) | |||||||||||||
Audit fees | Ps. | 103 | Ps. | 106 | Ps. | 64 | Ps. | 88 | ||||||
Audit-related fees | 13 | 10 | 14 | 7 | ||||||||||
Tax fees | 9 | 5 | 5 | 6 | ||||||||||
Other fees | 8 | 6 | 0 | 1 | ||||||||||
Total | Ps. | 133 | Ps. | 127 | Ps. | 83 | Ps. | 102 | ||||||
Audit fees. Audit fees in the above table arerepresent the aggregate fees billed by Deloitte in connection with the audit of our annual financial statements, the review ofas well as to other limited procedures in connection with our quarterly financial statementsinformation and other statutory and regulatory audits.audit activities.
Audit-related fees. Audit-related fees in the above table for the year ended December 31, 20072010 and 20062009, are the aggregate fees billed by Deloitte mainly in connection with pro forma financial information, due diligence services.services and other technical advice on accounting and audit related matters mainly associated with the Heineken transaction.
Tax fees. Tax fees in the above table are fees billed by Deloitte for services based upon existing facts and prior transactions in order to document, compute, and obtain government approval for amounts included in tax filings such as value-added tax return assistance, transfer pricing documentation and requests for technical advice from taxing authorities.
Other fees. In 2010 there were no other fees. Other fees in the above table are consulting2009 represented mainly non audit related fees. As a percentage of the total fees billed to us, other fees represents 6% for 2007.services.
Audit Committee Pre-Approval Policies and Procedures
We have adopted pre-approval policies and procedures under which all audit and non-audit services provided by our external auditors must be pre-approved by the audit committee as set forth in the Audit Committee’s charter. Any service proposals submitted by external auditors need to be discussed and approved by the Audit Committee during its meetings, which take place at least four times a year. Once the proposed service is approved, we or our subsidiaries formalize the engagement of services. The approval of any audit and non-audit services to be provided by our external auditors is specified in the minutes of our Audit Committee. In addition, the members of our board of directors are briefed on matters discussed by the different committees of our board.
We did not purchase any of our equity securities in ITEM 16E. PURCHASES OF EQUITY SECURITIES BY THE ISSUER AND AFFILIATED PURCHASERSITEM 16D. NOT APPLICABLE ITEM 16E. PURCHASES OF EQUITY SECURITIES BY THE ISSUER AND AFFILIATED PURCHASERS 2007.2010. The following table presents purchases by trusts that we administer in connection with our stock incentive plans, which purchases may be deemed to be purchases by an affiliated purchaser of us. See “Item 6. Directors, Senior Management and Employees—Stock Incentive Plan” and “––EVA Stock Incentive Plan.”
Purchases of Equity Securities
Purchase Date | Total Number of BD Units Purchased | Average Price Paid per BD Units | Total Number of Shares (or Units) Purchased as Part of Publicly Announced Plans or Programs | Maximum Number (or Appropriate U.S. Dollar Value) of Shares (or Units) that May Yet Be Purchased Under the Plans or Programs | |||||
March 1, 2007 | 640,428 | Ps. | 187.55 | ||||||
January 16 to February 5, 2008 | 775,880 | Ps. | 193.46 | ||||||
Purchase Date | Total Number of BD Units Purchased | Average Price Paid per BD Units | Total Number of Shares (or Units) Purchased as Part of Publicly Announced Plans or Programs | Maximum Number (or Appropriate U.S. dollar Value) of Shares (or Units) that May Yet Be Purchased Under the Plans or Programs | ||||||||||||
March 1, 2008 | 4,592,920 | Ps.39.51 | ||||||||||||||
March 1, 2009 | 5,392,080 | Ps.38.76 | ||||||||||||||
March 1, 2010 | 4,207,675 | Ps.55.44 | ||||||||||||||
March 1, 2011 | 2,438,590 | Ps.67.78 | ||||||||||||||
| ITEM 16F. | NOT APPLICABLE |
| ITEM 16G. | CORPORATE GOVERNANCE |
ITEM 17. NOT APPLICABLEPursuant to Rule 303A.11 of the Listed Company Manual of the NYSE, we are required to provide a summary of the significant ways in which our corporate governance practices differ from those required for U.S. companies under the NYSE listing standards. We are a Mexican corporation with shares listed on the Mexican Stock Exchange. Our corporate governance practices are governed by our bylaws, the Mexican Securities Law and the regulations issued by the CNBV. We also disclose the extent of compliance with theCódigo de Mejores Prácticas Corporativas (Mexican Code of Best Corporate Practices), which was created by a group of Mexican business leaders and was endorsed by the CNBV.
The table below discloses the significant differences between our corporate governance practices and the NYSE standards. NYSE Standards Our Corporate Governance Practices Directors Independence: Pursuant to the Mexican Securities Law, we are required to have a board of directors with a maximum of 21 members, 25% of whom must be independent. The Mexican Securities Law sets forth, in article 26, the definition of “independence,” which differs from the one set forth in Section 303A.02 of the Listed Company Manual of the NYSE. Generally, under the Mexican Securities Law, a director is not independent if such director: (i) is an employee or a relevant officer of the company or its subsidiaries; (ii) is an individual with significant influence over the company or its subsidiaries; (iii) is a shareholder or participant of the controlling group of the company; (iv) is a client, supplier, debtor, creditor, partner or employee of an important client, supplier, debtor or creditor of the company; or (v) is a family member of any of the aforementioned persons. In accordance with the Mexican Securities Law, our shareholders are required to make a determination as to the independence of our directors at an ordinary meeting of our shareholders, though the CNBV may challenge that determination. Our board of directors is not required to make a determination as to the independence of our directors. Executive sessions:Under our bylaws and applicable Mexican law, our non-management and independent directors are not required to meet in executive sessions. Our bylaws state that the board of directors will meet at least four times a year, following the end of each quarter, to discuss our operating results and progress in achieving strategic objectives. Our board of directors can also hold extraordinary meetings. Nominating/Corporate Governance Committee:We are not required to have a nominating committee, and the Mexican Code of Best Corporate Practices does not provide for a nominating committee. However, Mexican law requires us to have a Corporate Practices Committee. Our Corporate Practices Committee is composed of three members, and as required by the Mexican Securities Law and our bylaws, the three members are independent.ITEM 18. FINANCIAL STATEMENTSDirectors Independence: A majority of the board of directors must be independent. Executive sessions:Non-management directors must meet at regularly scheduled executive sessions without management. Nominating/Corporate Governance Committee:A nominating/corporate governance committee composed entirely of independent directors is required. Compensation Committee:A compensation committee composed entirely independent directors is required. Compensation Committee: We do not have a committee that exclusively oversees compensation issues. Our Corporate Practices Committee, composed entirely of independent directors, reviews and recommends management compensation programs in order to ensure that they are aligned with shareholders’ interests and corporate performance.
NYSE Standards | Our Corporate Governance Practices | |
| Audit Committee: Listed companies must have an Audit Committee satisfying the independence and other requirements of Rule 10A-3 under the Exchange Act and the NYSE independence standards. | Audit Committee: We have an Audit Committee of four members. Each member of the Audit Committee is an independent director, as required by the Mexican Securities Law. | |
| Equity compensation plan:Equity compensation plans require shareholder approval, subject to limited exemptions. | Equity compensation plan:Shareholder approval is not required under Mexican law or our bylaws for the adoption and amendment of an equity compensation plan. Such plans should provide for general application to all executives. Our current equity compensation plans have been approved by our board of directors. | |
| Code of business conduct and ethics: Corporate governance guidelines and a code of conduct and ethics are required, with disclosure of any waiver for directors or executive officers. | Code of business conduct and ethics: We have adopted a code of ethics, within the meaning of Item 16B of SEC Form 20-F. Our code of ethics applies to our Chief Executive Officer, Chief Financial Officer and persons performing similar functions as well as to our directors and other officers and employees. Our code of ethics is available on our website at www.femsa.com. If we amend the provisions of our code of ethics that apply to our Chief Executive Officer, Chief Financial Officer and persons performing similar functions, or if we grant any waiver of such provisions, we will disclose such amendment or waiver on our website at the same address. | |
| ITEM 17. | NOT APPLICABLE |
| ITEM 18. | FINANCIAL STATEMENTS |
See pages F-1 through F-56,F-145, incorporated herein by reference.
| ITEM 19. | EXHIBITS |
| 1.1 | Bylaws | |
| 1.2 | Share Exchange Agreement by and between Heineken Holding N.V., Heineken N.V., Compañía Internacional de Bebidas, S.A. de C.V., Grupo Industrial Emprex, S.A. de C.V., and FEMSA dated as of January 11, 2010 (incorporated by reference to Exhibit 1.2 of FEMSA’s Annual Report on Form 20-F filed on June 25, 2010 (File No. 333-08752)). | |
| 1.3 | First Amendment to Share Exchange Agreement by and between Heineken Holding N.V., Heineken N.V., Compañía Internacional de Bebidas, S.A. de C.V., Grupo Industrial Emprex, S.A. de C.V., and FEMSA dated as of April 26, 2010 (incorporated by reference to Exhibit 1.3 of FEMSA’s Annual Report on Form 20-F filed on June 25, 2010 (File No. 333-08752)). | |
| 1.4 | Corporate Governance Agreement, dated April 30, 2010, between Heineken Holding N.V., Heineken N.V., L’Arche Green N.V., FEMSA and CB Equity, LLP (incorporated by reference to Exhibit 1.4 of FEMSA’s Annual Report on Form 20-F filed on June 25, 2010 (File No. 333- 08752)). | |
| 2.1 | Deposit Agreement, as further amended and restated as of May 11, 2007, among FEMSA, The Bank of New York, and all owners and holders from time to time of any American Depositary Receipts, including the form of American Depositary Receipt (incorporated by reference to FEMSA’s registration statement on Form F-6 filed on April 30, 2007 (File No. 333- 142469)). | |
| 2.2 | Specimen certificate representing a BD Unit, consisting of one Series B Share, two Series D-B Shares and two Series D-L Shares, together with an English translation (incorporated by reference to FEMSA’s registration statement on Form F-4 filed on April 9, 1998 (File No. 333-8618)). | |
| 2.3 | Indenture dated | |
| 2.4 | First Supplemental Indenture dated | |
| 2.5 | Second Supplemental Indenture dated | |
| 3.1 | Amended Voting Trust Agreement among certain principal shareholders of FEMSA together with an English translation (incorporated by reference to FEMSA’s Schedule 13D as amended filed on August 11, 2005 (File No. 005-54705)). | |
| 4.1 | Amended and Restated Shareholders’ Agreement, dated as of July 6, 2002, by and among CIBSA, Emprex, The Coca-Cola Company and Inmex (incorporated by reference to Coca-Cola FEMSA’s Annual Report on Form 20-F filed on June 27, 2003 (File No. 1-12260)). | |
| 4.2 | Amendment, dated May 6, 2003, to the Amended and Restated Shareholders’ Agreement dated July 6, 2002, among CIBSA, Emprex, The Coca-Cola Company, Inmex, Atlantic Industries, Dulux CBAI 2003 B.V. and Dulux CBEXINMX 2003 B.V. (incorporated by reference to Exhibit 4.14 to Coca-Cola FEMSA’s Annual Report on Form 20-F filed on June 27, 2003 (File No. 1-12260)). | |
| 4.3 | Second Amendment, dated February 1, 2010, to the Amended and Restated Shareholders’ Agreement dated July 6, 2002, among CIBSA, Emprex, The Coca-Cola Company, Inmex and Dulux CBAI 2003 B.V. (incorporated by reference to Exhibit 4.3 to Coca-Cola FEMSA’s Annual Report on Form 20-F filed on June 10, 2010 (File No. 1-12260)). | |
| 4.4 | Amended and Restated Bottler Agreement, dated June 21, 2003, between Coca-Cola FEMSA and The Coca-Cola Company with respect to operations in the southeast of Mexico (incorporated by reference to Exhibit 4.3 to Coca-Cola FEMSA’s Annual Report on Form 20-F filed on April 5, 2004 (File No. 1-12260)). | |
| Supplemental Agreement, dated June 21, 1993, between Coca-Cola FEMSA and The Coca-Cola Company with respect to operations in the southeast of Mexico (with English translation) (incorporated by reference to Exhibit 10.3 to Coca-Cola FEMSA’s Registration Statement on Form F-1 filed on August 13, 1993 (File No. 333-67380)). | ||
| Amended and Restated Bottler Agreement, dated June 21, 2003, between Coca-Cola FEMSA and The Coca-Cola Company with respect to operations in the southeast of Mexico (incorporated by reference to Coca-Cola FEMSA’s Annual Report on Form 20-F filed on April 5, 2004 (File No. 1-12260)). | ||
| Supplemental Agreement, dated June 21, 1993, between Coca-Cola FEMSA and The Coca-Cola Company with respect to operations in the southeast of Mexico (with English translation) (incorporated by reference to Exhibit 10.4 to Coca-Cola FEMSA’s Registration Statement on Form F-1 filed on August 13, 1993 (File No. 333-67380)). | ||
| 4.8 | Amendments, dated May 17 and July 20, 1995, to Bottler Agreement and Letter of Agreement, dated August 22, 1994, each with respect to operations in Argentina between Coca-Cola FEMSA and The Coca-Cola Company (with English translation) (incorporated by reference to Exhibit 10.3 to Coca-Cola FEMSA’s Annual Report on Form 20-F filed on June 28, 1996 (File No. 1-12260)). | |
| 4.9 | Bottler Agreement, dated December 1, 1995, between Coca-Cola FEMSA and The Coca-Cola Company with respect to operations in SIRSA (with English translation) (incorporated by reference to Exhibit 10.4 to Coca-Cola FEMSA’s Annual Report on Form 20-F filed on June 28, 1996 (File No. 1-12260)). | |
| 4.10 | Supplemental Agreement, dated December 1, 1995, between Coca-Cola FEMSA and The Coca-Cola Company with respect to operations in SIRSA (with English translation) (incorporated by reference to Exhibit 10.6 to Coca-Cola FEMSA’s Annual Report on Form 20-F filed on June 28, 1996 (File No. 1-12260)). | |
| 4.11 | Amendment, dated February 1, 1996, to Bottler Agreement between Coca-Cola FEMSA and The Coca-Cola Company with respect to operations in SIRSA, dated December 1, 1995 (with English translation) (incorporated by reference to Exhibit 10.5 to Coca-Cola FEMSA’s Annual Report on Form 20-F filed on June 28, 1996 (File No. 1-12260)). | |
| 4.12 | Amendment, dated May 22, 1998, to Bottler Agreement with respect to the former SIRSA territory, dated December 1, 1995, between Coca-Cola FEMSA and The Coca-Cola Company (with English translation) (incorporated by reference to Exhibit 4.12 to Coca-Cola FEMSA’s Annual Report on Form 20-F filed on June 20, 2001 (File No. 1-12260)). | |
| 4.13 | ||
| Supply Agreement, dated June 21, 1993, between Coca-Cola FEMSA and FEMSA Empaques (incorporated by reference to FEMSA’s registration statement on Form F-4 filed on April 9, 1998 (File No. 333-8618)). | ||
| 4.14 | Bottler Agreement and Side Letter dated June 1, 2005, between Panamco Golfo, S.A. de C.V. and The Coca-Cola Company with respect to operations in Golfo, Mexico (English translation) (incorporated by reference to Exhibit 4.7 to Coca-Cola FEMSA’s Annual Report on Form 20-F filed on April 18, 2006 (File No. 1-12260)). | |
| Bottler Agreement and Side Letter dated June 1, 2005, between Panamco Baijo, S.A. de C.V., and | ||
| Coca-Cola Tradename License Agreement dated June 21, 1993, between Coca-Cola FEMSA and The Coca-Cola Company (with English translation) (incorporated by reference to FEMSA’s Registration Statement on Form F-4 filed on April 9, 1998 (File No. 333-8618)). | ||
| Amendment to the Trademark License Agreement, dated December 1, 2002, entered by and among Administración de Marcas S.A. de C.V., as proprietor, and The Coca-Cola Export Corporation Mexico branch, as licensee (incorporated by reference to Panamco’s Quarterly Report on Form 10-Q for the period ended March 31, 2003 (File No. 1-2290)). | ||
| Trademark Sub-License Agreement, dated January 4, 2003, entered by and among Panamco Golfo S.A. de C.V., as licensor, and The Coca-Cola Company, as licensee (incorporated by reference to Panamco’s Quarterly Report on Form 10-Q for the period ended March 31, 2003 (File No. 1-12290)). | ||
| Trademark Sub-License Agreement, dated January 4, 2003, entered by and among Panamco Bajio S.A. de C.V., as licensor, and The Coca-Cola Company, as licensee (incorporated by reference to Panamco’s Quarterly Report on Form 10-Q for the period ended March 31, 2003 (File No. 1-12290)). | ||
| Supply Agreement dated April 3, 1998, between ALPLA Fábrica de Plásticos, S.A. de C.V. and Industria Embotelladora de México, S.A. de C.V. (with English translation) (incorporated by reference to Exhibit 4.18 to Coca-Cola FEMSA’s Annual Report on Form 20-F filed on July 1, 2002 (File No. 1-12260)).* | ||
| Services Agreement, dated November 7, 2000, between Coca-Cola FEMSA and FEMSA Logística (with English translation) (incorporated by reference to Exhibit 4.15 to Coca-Cola FEMSA’s Annual Report on Form 20-F filed on June 20, 2001 (File No. 1-12260)). | ||
| Promotion and Non-Compete Agreement, dated March 11, 2003, entered by and among The Coca-Cola Export Corporation Mexico branch and Panamco Bajio S.A. de C.V. (with English translation) (incorporated by reference to Panamco’s Quarterly Report on Form 10-Q for the period ended March 31, 2003 (File No. 1-12290)). | ||
| Promotion and Non-Compete Agreement, dated March 11, 2003, entered by and among The Coca-Cola Export Corporation Mexico branch and Panamco Golfo S.A. de C.V. (with English translation) (incorporated by reference to Panamco’s Quarterly Report on Form 10-Q for the period ended March 31, 2003 (File No. 1-12290)). | ||
| Memorandum of Understanding, dated as of March 11, 2003, by and among Panamco, as seller, and The Coca-Cola Company, as buyer (incorporated by reference to Panamco’s Quarterly Report on Form 10-Q for the period ended March 31, 2003 (File No. 1-12290)). | ||
| Bottler Agreement, dated August 22, 1994, between Coca-Cola FEMSA and The Coca-Cola Company with respect to operations in Argentina (with English translation) (incorporated by reference to Exhibit 10.1 to Coca-Cola FEMSA’s Annual Report on Form 20-F filed on June 30, 1995 (File No. 1-12260)). | ||
| Supplemental Agreement, dated August 22, 1994, between Coca-Cola FEMSA and The Coca-Cola Company with respect to operations in Argentina (with English translation) (incorporated by reference to Exhibit 10.2 to Coca-Cola FEMSA’s Annual Report on Form 20-F filed on June 30, 1995 (File No. 1-12260)). | ||
| 8.1 | Significant Subsidiaries. | |
| 12.1 | CEO Certification pursuant to Section 302 of the Sarbanes-Oxley Act of 2002, dated June | |
| 12.2 | CFO Certification pursuant to Section 302 of the Sarbanes-Oxley Act of 2002, dated June | |
| 13.1 | Officer Certification pursuant to Section 906 of the Sarbanes-Oxley Act of 2002, dated June | |
SIGNATURE
The registrant hereby certifies that it meets all of the requirements for filing on Form 20-F and that it has duly caused and authorized the undersigned to sign this annual report on its behalf.
Date: June 30, 200828, 2011
| Fomento Económico Mexicano, S.A.B. de C.V. | ||
| By: | /s/ | |
| Name: | Javier Astaburuaga Sanjines | |
| Title: | Executive Vice-President of Finance and Strategic Development / Chief Financial Officer | |
FOMENTO ECONÓMICO MEXICANO, S.A.B. DE C.V. AND SUBSIDIARIES
MONTERREY, N.L., MEXICO
| Audited consolidated financial statements of Fomento Económico Mexicano, S.A.B. de C.V. | ||
Consolidated balance sheets at December 31, | ||
| F-6 | ||
| F-7 | ||
| ||
Consolidated income statement for the years ended December 31, 2010 and 2009 | F-71 | |
Consolidated statement of comprehensive income for the years ended December 31, 2010 and 2009 | F-72 | |
Consolidated statement of financial position as at December 31, 2010 and 2009 | F-73 | |
Consolidated statement of cash flows for the years ended December 31, 2010 and 2009 | F-74 | |
Consolidated statement of changes in equity for the years ended December 31, 2010 and 2009 | F-76 | |
| F-77 | ||

Report of Independent Registered Public Accounting FirmREPORT OF INDEPENDENT REGISTERED PUBLIC ACCOUNTING FIRM
To theThe Board of Directors and Stockholders of
Fomento Económico Mexicano, S.A.B. de C.V.:
We have audited the accompanying consolidated balance sheets of Fomento Económico Mexicano, S.A.B. de C.V. (a Mexican corporation) and subsidiaries (the “Company”) as of December 31, 20072010 and 2006,2009, and the related consolidated statements of income, changes in stockholders’ equity and changes in financial positioncash flows for each of the three years in the period ended December 31, 2007, all expressed in millions of Mexican pesos of purchasing power as of December 31, 2007.2010. These financial statements are the responsibility of the Company’s management. Our responsibility is to express an opinion on these financial statements based on our audits. We did not audit theThe financial statements of FEMSA Comercio, S.A. de C.V. and subsidiariesHeineken N. V. (a consolidated subsidiary)corporation in which the Company has a 9.24% interest) which is majority owned by Heineken Holdings N.V. (a corporation in which the Company has a 14.94% interest) (collectively “Heineken”), which statements reflect total assets constituting 9% and 8%prepared under International Financial Reporting Standards as adopted by the International Accounting Standards Board (IFRS), respectively, of consolidated total assets as of December 31, 2007 and 2006, and total revenues constituting 29%, 27% and 26%, respectively, of consolidated total revenues for each of the three years in the period ended December 31, 2007. Those statements werehave been audited by other auditors whose report dated February 15, 2011 has been furnished to us, and our opinion on the consolidated financial statements, insofar as it relates to the amounts included for FEMSA Comercio, S.A. de C.V. and subsidiaries,Heineken, is based solely on the report of the other auditors. In the consolidated financial statements, the Company’s investment in Heineken is stated at Ps. 66,478 million at December 31, 2010 and the Company’s equity in the net income of Heineken is stated at Ps. 3,319 million for the eight month period from April 30 to December 31, 2010.
We conducted our audits in accordance with the standards of the Public Company Accounting Oversight Board (United States). Those standards require that we plan and perform the audit to obtain reasonable assurance about whether the financial statements are free of material misstatement. An audit includes examining, on a test basis, evidence supporting the amounts and disclosures in the financial statements. An audit also includes assessing the accounting principles used and significant estimates made by management, as well as evaluating the overall financial statement presentation.presentation (including the Company’s conversion of the financial statements of Heineken to Mexican Financial Reporting Standards, as of December 31, 2010 and for the eight month period from April 30 to December 31, 2010). We believe that our audits and the report of the other auditors provide a reasonable basis for our opinion.
In our opinion, based on our audits and the report of the other auditors, suchthe accompanying consolidated financial statements present fairly, in all material respects, the consolidated financial position of Fomento Económico Mexicano, S.A.B. de C.V. and subsidiaries as ofat December 31, 20072010 and 2006,2009, and the consolidated results of their operations, changes in their stockholders’ equity and changes in their financial positionconsolidated cash flows, for each of the three years in the period ended December 31, 2007,2010, in conformity with Mexican Financial Reporting Standards.
Mexican Financial Reporting Standards, varywhich differ in certain significant respects from accounting principles generally accepted in the United States of America. The application of the latter would have affected the determination of net income for each of the three years in the period ended December 31, 2007,(See Notes 27 and the determination of stockholders’ equity as of December 31, 2007 and 2006,28 to the extent summarized in Note 27.consolidated financial statements).
As disclosed in Note 26 k)3 to the accompanying consolidated financial statements, among other Mexican Financial Reporting Standards (“MFRS”), the Company adopted the recognitionMFRS B-8Consolidated and disclosure provisions ofCombined Financial Statements of Financial Accounting Standards No. 158, “Employers’ Accounting for Defined Benefit Pension and Other Postretirement Plans—an amendment of FASB Statements No. 87, 88, 106 and 132(R),” effective December 31, 2006. during 2009.
Our auditWe also comprehended the translation of the Mexican peso amounts into U.S. dollar amounts and, in our opinion, such translation has been made in conformity with the basis stated in Note 2. The translation of the financial statement amounts into U.S. dollars and the translation of the financial statements into English have been made solely for the convenience of readers in the United States of America.
We have also audited, in accordance with the standards of the Public Company Accounting Oversight Board (United States), the Company’sFomento Económico Mexicano, S.A.B. de C.V. and subsidiaries’ internal control over financial reporting as of December 31, 2007,2010, based on the criteria established inInternal Control—Integrated Framework issued by the Committee of Sponsoring Organizations of the Treadway Commission and our report dated June 12, 200828, 2011 expressed an unqualified opinion on the Company’s internal control over financial reporting.thereon.

Galaz, Yamazaki, Ruiz Urquiza,
Mancera, S.C.
A Member Practice of Ernst & Young Global C.P.C. Víctor Luís Soulé García |
Monterrey, N.L., MexicoMéxico
June 12, 200828, 2011
FOMENTO ECONÓMICO MEXICANO, S.A.B. DE C.V. AND SUBSIDIARIES
MONTERREY, N.L., MEXICOMÉXICO
Consolidated Balance Sheets
At December 31, 20072010 and 2006.2009. Amounts expressed in millions of U.S. dollars ($) and in millions of constant Mexican pesos (Ps.) as of December 31, 2007..
| 2007 | 2006 | Note | 2010 | 2009 | ||||||||||||||||||||||||
ASSETS | ||||||||||||||||||||||||||||
Current Assets: | ||||||||||||||||||||||||||||
Cash and cash equivalents | $ | 958 | Ps. | 10,456 | Ps. | 8,766 | 5 B | $ | 2,188 | Ps. | 27,097 | Ps. | 14,508 | |||||||||||||||
Marketable securities | 5 B | 5 | 66 | 2,113 | ||||||||||||||||||||||||
Accounts receivable | 854 | 9,329 | 7,747 | 7 | 623 | 7,702 | 6,891 | |||||||||||||||||||||
Inventories | 919 | 10,037 | 8,704 | 8 | 924 | 11,447 | 9,995 | |||||||||||||||||||||
Recoverable taxes | 156 | 1,699 | 1,341 | 343 | 4,243 | 3,491 | ||||||||||||||||||||||
Investment in shares available for sale | 63 | 684 | — | |||||||||||||||||||||||||
Other current assets | 117 | 1,280 | 1,271 | 9 | 73 | 905 | 1,265 | |||||||||||||||||||||
Current assets of discontinued operations | 2 | — | — | 13,450 | ||||||||||||||||||||||||
Total current assets | 3,067 | 33,485 | 27,829 | 4,156 | 51,460 | 51,713 | ||||||||||||||||||||||
Investments in shares | 171 | 1,863 | 824 | 10 | 5,556 | 68,793 | 2,208 | |||||||||||||||||||||
Property, plant and equipment | 5,011 | 54,707 | 52,960 | 11 | 3,219 | 39,856 | 38,369 | |||||||||||||||||||||
Bottles and cases | 184 | 2,280 | 1,914 | |||||||||||||||||||||||||
Intangible assets | 5,518 | 60,234 | 57,906 | 12 | 4,227 | 52,340 | 51,992 | |||||||||||||||||||||
Deferred tax asset | 24 D | 28 | 346 | 1,527 | ||||||||||||||||||||||||
Other assets | 1,018 | 11,117 | 9,878 | 13 | 686 | 8,503 | 19,365 | |||||||||||||||||||||
Bottles and cases | 286 | 3,125 | 3,067 | |||||||||||||||||||||||||
Deferred income taxes asset | 116 | 1,264 | 2,052 | |||||||||||||||||||||||||
Non current assets of discontinued operations | 2 | — | — | 58,818 | ||||||||||||||||||||||||
TOTAL ASSETS | 15,187 | 165,795 | 154,516 | 18,056 | 223,578 | 225,906 | ||||||||||||||||||||||
LIABILITIES AND STOCKHOLDERS’ EQUITY | ||||||||||||||||||||||||||||
Current Liabilities: | ||||||||||||||||||||||||||||
Bank loans | 316 | 3,447 | 4,183 | |||||||||||||||||||||||||
Bank loans and notes payable | 18 | 127 | 1,578 | 3,816 | ||||||||||||||||||||||||
Current portion of long-term debt | 18 | 139 | 1,725 | 4,723 | ||||||||||||||||||||||||
Interest payable | 44 | 475 | 461 | 13 | 165 | 103 | ||||||||||||||||||||||
Current portion of long-term debt | 542 | 5,917 | 2,563 | |||||||||||||||||||||||||
Suppliers | 1,251 | 13,657 | 12,479 | 1,410 | 17,458 | 16,311 | ||||||||||||||||||||||
Accounts payable | 434 | 5,375 | 6,305 | |||||||||||||||||||||||||
Taxes payable | 335 | 3,658 | 2,845 | 176 | 2,180 | 4,038 | ||||||||||||||||||||||
Accounts payable | 427 | 4,658 | 3,911 | |||||||||||||||||||||||||
Other current liabilities | 145 | 1,592 | 1,618 | 25 A | 165 | 2,035 | 1,922 | |||||||||||||||||||||
Current liabilities of discontinued operations | 2 | — | — | 10,883 | ||||||||||||||||||||||||
Total current liabilities | 3,060 | 33,404 | 28,060 | 2,464 | 30,516 | 48,101 | ||||||||||||||||||||||
Long-Term Liabilities: | ||||||||||||||||||||||||||||
Bank loans and notes payable | 2,809 | 30,665 | 35,673 | 18 | 1,793 | 22,203 | 21,260 | |||||||||||||||||||||
Deferred income taxes liability | 328 | 3,584 | 3,995 | |||||||||||||||||||||||||
Labor liabilities | 341 | 3,718 | 3,269 | 16 B | 152 | 1,883 | 1,776 | |||||||||||||||||||||
Deferred tax liability | 24 D | 853 | 10,567 | 867 | ||||||||||||||||||||||||
Contingencies and other liabilities | 437 | 4,771 | 5,311 | 25 B | 437 | 5,396 | 5,857 | |||||||||||||||||||||
Non current liabilities of discontinued operations | 2 | — | — | 32,216 | ||||||||||||||||||||||||
Total long-term liabilities | 3,915 | 42,738 | 48,248 | 3,235 | 40,049 | 61,976 | ||||||||||||||||||||||
Total liabilities | 6,975 | 76,142 | 76,308 | 5,699 | 70,565 | 110,077 | ||||||||||||||||||||||
Stockholders’ Equity: | ||||||||||||||||||||||||||||
Minority interest in consolidated subsidiaries | 2,297 | 25,075 | 21,554 | |||||||||||||||||||||||||
Noncontrolling interest in consolidated subsidiaries | 21 | 2,880 | 35,665 | 34,192 | ||||||||||||||||||||||||
Majority interest: | ||||||||||||||||||||||||||||
Controlling interest: | ||||||||||||||||||||||||||||
Capital stock | 490 | 5,348 | 5,348 | 432 | 5,348 | 5,348 | ||||||||||||||||||||||
Additional paid-in capital | 1,888 | 20,612 | 20,557 | 1,660 | 20,558 | 20,548 | ||||||||||||||||||||||
Retained earnings from prior years | 3,491 | 38,108 | 32,529 | 4,122 | 51,045 | 43,835 | ||||||||||||||||||||||
Net income | 780 | 8,511 | 7,127 | 3,251 | 40,251 | 9,908 | ||||||||||||||||||||||
Cumulative other comprehensive income | (734 | ) | (8,001 | ) | (8,907 | ) | 5 W | 12 | 146 | 1,998 | ||||||||||||||||||
Majority interest | 5,915 | 64,578 | 56,654 | |||||||||||||||||||||||||
Controlling interest | 9,477 | 117,348 | 81,637 | |||||||||||||||||||||||||
Total stockholders’ equity | 8,212 | 89,653 | 78,208 | 12,357 | 153,013 | 115,829 | ||||||||||||||||||||||
TOTAL LIABILITIES AND STOCKHOLDERS’ EQUITY | $ | 15,187 | Ps. | 165,795 | Ps. | 154,516 | $ | 18,056 | Ps. | 223,578 | Ps. | 225,906 | ||||||||||||||||
The accompanying notes are an integral part of these consolidated balance sheets.
Monterrey, N.L., Mexico, February 18, 2008.México.

|  |  | ||
José Antonio Fernández Carbajal | Javier Astaburuaga | |||
| Chief Executive Officer | Chief Financial Officer |
FOMENTO ECONÓMICO MEXICANO, S.A.B. DE C.V. AND SUBSIDIARIES
MONTERREY, N.L., MEXICOMÉXICO
Consolidated Income Statements
For the years ended December 31, 2007, 20062010, 2009 and 2005.2008. Amounts expressed in millions of U.S. dollars ($) and in millions of constant Mexican pesos (Ps.) as of December 31, 2007,, except for data per share data.share.
| 2007 | 2006 | 2005 | 2010 | 2009 | 2008 | |||||||||||||||||||||||||||
Net sales | $ | 13,472 | Ps. | 147,069 | Ps. | 135,647 | Ps. | 118,799 | $ | 13,598 | Ps. | 168,376 | Ps. | 158,503 | Ps. | 132,260 | ||||||||||||||||
Other operating revenues | 44 | 487 | 473 | 663 | 107 | 1,326 | 1,748 | 1,548 | ||||||||||||||||||||||||
Total revenues | 13,516 | 147,556 | 136,120 | 119,462 | 13,705 | 169,702 | 160,251 | 133,808 | ||||||||||||||||||||||||
Cost of sales | 7,310 | 79,801 | 73,366 | 63,721 | 7,974 | 98,732 | 92,313 | 77,990 | ||||||||||||||||||||||||
Gross profit | 6,206 | 67,755 | 62,754 | 55,741 | 5,731 | 70,970 | 67,938 | 55,818 | ||||||||||||||||||||||||
Operating expenses: | ||||||||||||||||||||||||||||||||
Administrative | 842 | 9,191 | 8,973 | 7,957 | 627 | 7,766 | 7,835 | 6,292 | ||||||||||||||||||||||||
Selling | 3,571 | 38,995 | 35,314 | 30,345 | 3,285 | 40,675 | 38,973 | 32,177 | ||||||||||||||||||||||||
| 4,413 | 48,186 | 44,287 | 38,302 | 3,912 | 48,441 | 46,808 | 38,469 | |||||||||||||||||||||||||
Income from operations | 1,793 | 19,569 | 18,467 | 17,439 | 1,819 | 22,529 | 21,130 | 17,349 | ||||||||||||||||||||||||
Other expenses, net | (119 | ) | (1,297 | ) | (1,650 | ) | (1,108 | ) | ||||||||||||||||||||||||
Integral result of financing: | ||||||||||||||||||||||||||||||||
Other expenses, net (Note 19) | (23 | ) | (282 | ) | (1,877 | ) | (2,019 | ) | ||||||||||||||||||||||||
Comprehensive financing result: | ||||||||||||||||||||||||||||||||
Interest expense | (417 | ) | (4,554 | ) | (4,299 | ) | (4,759 | ) | (264 | ) | (3,265 | ) | (4,011 | ) | (3,823 | ) | ||||||||||||||||
Interest income | 70 | 769 | 792 | 765 | 89 | 1,104 | 1,205 | 865 | ||||||||||||||||||||||||
Foreign exchange gain (loss), net | 63 | 691 | (217 | ) | 318 | |||||||||||||||||||||||||||
Foreign exchange loss, net | (50 | ) | (614 | ) | (431 | ) | (1,431 | ) | ||||||||||||||||||||||||
Gain on monetary position, net | 151 | 1,639 | 1,488 | 1,204 | 34 | 410 | 486 | 657 | ||||||||||||||||||||||||
Market value gain (loss) on ineffective portion of derivative financial instruments | 6 | 69 | (113 | ) | (166 | ) | 17 | 212 | 124 | (950 | ) | |||||||||||||||||||||
| (127 | ) | (1,386 | ) | (2,349 | ) | (2,638 | ) | (174 | ) | (2,153 | ) | (2,627 | ) | (4,682 | ) | |||||||||||||||||
Equity method of associates (Note 10) | 286 | 3,538 | 132 | 90 | ||||||||||||||||||||||||||||
Net income before income taxes | 1,547 | 16,886 | 14,468 | 13,693 | ||||||||||||||||||||||||||||
Income taxes | 454 | 4,950 | 4,608 | 4,620 | ||||||||||||||||||||||||||||
Income before income taxes | 1,908 | 23,632 | 16,758 | 10,738 | ||||||||||||||||||||||||||||
Income taxes (Note 24 E) | 457 | 5,671 | 4,959 | 3,108 | ||||||||||||||||||||||||||||
Consolidated net income before discontinued operations | 1,451 | 17,961 | 11,799 | 7,630 | ||||||||||||||||||||||||||||
Income from the exchange of shares with Heineken, net of taxes | 2,150 | 26,623 | — | — | ||||||||||||||||||||||||||||
Net income from discontinued operations (Note 2) | 57 | 706 | 3,283 | 1,648 | ||||||||||||||||||||||||||||
Consolidated net income | $ | 1,093 | Ps. | 11,936 | Ps. | 9,860 | Ps. | 9,073 | $ | 3,658 | Ps. | 45,290 | Ps. | 15,082 | Ps. | 9,278 | ||||||||||||||||
Net majority income | 780 | 8,511 | 7,127 | 5,951 | ||||||||||||||||||||||||||||
Net minority income | 313 | 3,425 | 2,733 | 3,122 | ||||||||||||||||||||||||||||
Net controlling interest income | 3,251 | 40,251 | 9,908 | 6,708 | ||||||||||||||||||||||||||||
Net noncontrolling interest income | 407 | 5,039 | 5,174 | 2,570 | ||||||||||||||||||||||||||||
Consolidated net income | $ | 1,093 | Ps. | 11,936 | Ps. | 9,860 | Ps. | 9,073 | $ | 3,658 | Ps | . 45,290 | Ps. | 15,082 | Ps. | 9,278 | ||||||||||||||||
Net majority income (U.S. dollars and constant Mexican pesos): | ||||||||||||||||||||||||||||||||
Per Series “B” share | $ | 0.04 | Ps. | 0.42 | Ps. | 0.36 | Ps. | 0.31 | ||||||||||||||||||||||||
Per Series “D” share | $ | 0.05 | Ps. | 0.53 | Ps. | 0.44 | Ps. | 0.39 | ||||||||||||||||||||||||
Consolidated net income before discontinued operations(1): | ||||||||||||||||||||||||||||||||
Per series “B” share | $ | 0.05 | Ps. | 0.64 | Ps. | 0.33 | Ps. | 0.25 | ||||||||||||||||||||||||
Per series “D” share | 0.07 | 0.81 | 0.42 | 0.32 | ||||||||||||||||||||||||||||
Net income from discontinued operations(1): | ||||||||||||||||||||||||||||||||
Per series “B” share | 0.11 | 1.37 | 0.16 | 0.08 | ||||||||||||||||||||||||||||
Per series “D”share | 0.14 | 1.70 | 0.20 | 0.10 | ||||||||||||||||||||||||||||
Net controlling interest income(1): | ||||||||||||||||||||||||||||||||
Per series “B” share | 0.16 | 2.01 | 0.49 | 0.33 | ||||||||||||||||||||||||||||
Per series “D”share | 0.20 | 2.51 | 0.62 | 0.42 | ||||||||||||||||||||||||||||
| (1) | U.S. dollars and Mexican pesos, see Note 23 for number of shares. |
The accompanying notes are an integral part of these consolidated income statements.
FOMENTO ECONÓMICO MEXICANO, S.A.B. DE C.V. AND SUBSIDIARIES
MONTERREY, N.L., MEXICOMÉXICO
Consolidated Statements of Changes in Financial PositionCash Flows
For the years ended December 31, 2007, 20062010, 2009 and 2005.2008. Amounts expressed in millions of U.S. dollars ($) and in millions of constant Mexican pesos (Ps.) as of December 31, 2007..
| 2007 | 2006 | 2005 | ||||||||||||||
Resources Generated by (Used in) Operating Activities: | ||||||||||||||||
Consolidated net income | $ | 1,093 | Ps. | 11,936 | Ps. | 9,860 | Ps. | 9,073 | ||||||||
Depreciation | 452 | 4,930 | 4,954 | 4,682 | ||||||||||||
Amortization and other non-cash charges | 291 | 3,182 | 3,154 | 2,802 | ||||||||||||
Impairment of long-lived assets | 9 | 93 | 208 | 84 | ||||||||||||
Deferred income taxes | (22 | ) | (239 | ) | 78 | (68 | ) | |||||||||
| 1,823 | 19,902 | 18,254 | 16,573 | |||||||||||||
Working capital: | ||||||||||||||||
Accounts receivable | (141 | ) | (1,536 | ) | (557 | ) | (532 | ) | ||||||||
Inventories | (166 | ) | (1,812 | ) | (1,153 | ) | (359 | ) | ||||||||
Recoverable taxes, net | 41 | 453 | (568 | ) | (625 | ) | ||||||||||
Other current assets and investment in shares available for sale | (61 | ) | (668 | ) | (173 | ) | (95 | ) | ||||||||
Suppliers and other current liabilities | 182 | 1,987 | 1,403 | 628 | ||||||||||||
Interest payable | 1 | 14 | 25 | (6 | ) | |||||||||||
Labor liabilities | (28 | ) | (318 | ) | (297 | ) | (392 | ) | ||||||||
Net resources generated by operating activities | 1,651 | 18,022 | 16,934 | 15,192 | ||||||||||||
Resources Generated by (Used in) Investing Activities: | ||||||||||||||||
Sale of minority interest | 38 | 415 | — | — | ||||||||||||
Property, plant and equipment | (551 | ) | (6,015 | ) | (5,281 | ) | (3,640 | ) | ||||||||
Other assets | (410 | ) | (4,472 | ) | (3,086 | ) | (2,725 | ) | ||||||||
Investment in shares | (95 | ) | (1,040 | ) | 74 | 10 | ||||||||||
Bottles and cases | (79 | ) | (861 | ) | (696 | ) | (548 | ) | ||||||||
Intangible assets | (31 | ) | (336 | ) | (433 | ) | (422 | ) | ||||||||
Other business acquisitions | (12 | ) | (128 | ) | (165 | ) | — | |||||||||
Acquisition of Coca-Cola FEMSA minority interest | — | — | (4,801 | ) | — | |||||||||||
Acquisitions by FEMSA Cerveza | — | — | (1,421 | ) | — | |||||||||||
Net resources used in investing activities | (1,140 | ) | (12,437 | ) | (15,809 | ) | (7,325 | ) | ||||||||
Resources Generated by (Used in) Financing Activities: | ||||||||||||||||
Bank loans obtained | 885 | 9,660 | 9,404 | 2,061 | ||||||||||||
Bank loans paid | (994 | ) | (10,851 | ) | (4,292 | ) | (14,518 | ) | ||||||||
Amortization in real terms of long-term liabilities | (110 | ) | (1,202 | ) | (1,213 | ) | (1,382 | ) | ||||||||
Dividends declared and paid | (175 | ) | (1,909 | ) | (1,459 | ) | (1,103 | ) | ||||||||
Contingencies and other financing liabilities | (4 | ) | (45 | ) | (3,906 | ) | 22 | |||||||||
Cumulative translation adjustment | 41 | 446 | (213 | ) | (239 | ) | ||||||||||
Issuance of capital stock | — | — | — | 8,461 | ||||||||||||
Net resources used in financing activities | (357 | ) | (3,901 | ) | (1,679 | ) | (6,698 | ) | ||||||||
Cash and cash equivalents: | ||||||||||||||||
Net increase (decrease) | 154 | 1,684 | (554 | ) | 1,169 | |||||||||||
Cash received in acquisitions | 1 | 6 | 55 | — | ||||||||||||
Initial balance | 803 | 8,766 | 9,265 | 8,096 | ||||||||||||
Ending balance | $ | 958 | Ps. | 10,456 | Ps. | 8,766 | Ps. | 9,265 | ||||||||
| 2010 | 2009 | 2008 | ||||||||||||||
Cash Flow Generated by (Used in) Operating Activities: | ||||||||||||||||
Income before income taxes from continuing operations | $ | 1,908 | Ps. | 23,632 | Ps. 16,758 | Ps. 10,738 | ||||||||||
Non-cash operating expenses | 31 | 386 | 664 | 295 | ||||||||||||
Other adjustments regarding operating activities | 44 | 545 | 773 | 1,199 | ||||||||||||
Adjustments regarding investing activities: | ||||||||||||||||
Depreciation | 366 | 4,527 | 4,391 | 3,762 | ||||||||||||
Amortization | 79 | 975 | 798 | 689 | ||||||||||||
Loss on sale of long-lived assets | 17 | 215 | 177 | 166 | ||||||||||||
Gain on sale of shares | (125 | ) | (1,554 | ) | (35 | ) | (85 | ) | ||||||||
Write-off of long-lived assets | 1 | 9 | 129 | 378 | ||||||||||||
Interest income | (89 | ) | (1,104 | ) | (1,205 | ) | (865 | ) | ||||||||
Equity method of associates | (286 | ) | (3,538 | ) | (132 | ) | (90 | ) | ||||||||
Adjustments regarding financing activities: | ||||||||||||||||
Interest expenses | 264 | 3,265 | 4,011 | 3,823 | ||||||||||||
Foreign exchange loss, net | 50 | 614 | 431 | 1,431 | ||||||||||||
Gain on monetary position, net | (34 | ) | (410 | ) | (486 | ) | (657 | ) | ||||||||
Market value (gain) loss on ineffective portion of derivative financial instruments | (17 | ) | (212 | ) | (124 | ) | 950 | |||||||||
| 2,209 | 27,350 | 26,150 | 21,734 | |||||||||||||
Accounts receivable and other current assets | (116 | ) | (1,431 | ) | (535 | ) | (294 | ) | ||||||||
Inventories | (108 | ) | (1,340 | ) | (844 | ) | (1,567 | ) | ||||||||
Suppliers and other accounts payable | 66 | 823 | 2,373 | 1,469 | ||||||||||||
Other liabilities | (20 | ) | (249 | ) | (267 | ) | (94 | ) | ||||||||
Labor liabilities | (43 | ) | (530 | ) | (302 | ) | (230 | ) | ||||||||
Income taxes paid | (551 | ) | (6,821 | ) | (3,831 | ) | (4,995 | ) | ||||||||
Net cash flows provided by continuing operations | 1,437 | 17,802 | 22,744 | 16,023 | ||||||||||||
Net cash flows provided by discontinued operations | 91 | 1,127 | 8,181 | 6,959 | ||||||||||||
Net cash flows provided by operating activities | 1,528 | 18,929 | 30,925 | 22,982 | ||||||||||||
Cash Flow Generated by (Used in) Investing Activities: | ||||||||||||||||
BRISA acquisition, net of cash acquired (see Note 6) | — | — | (717 | ) | — | |||||||||||
REMIL acquisition, net of cash acquired (see Note 6) | — | (3,633 | ) | |||||||||||||
Other acquisitions, net of cash acquired | — | — | — | (206 | ) | |||||||||||
Purchase of marketable securities | (5 | ) | (66 | ) | (2,001 | ) | — | |||||||||
Proceeds from marketable securities | 89 | 1,108 | — | — | ||||||||||||
Recovery of long-term financing receivables with FEMSA Cerveza (see Note 13) | 986 | 12,209 | — | — | ||||||||||||
Net effects of FEMSA Cerveza exchange | 71 | 876 | — | — | ||||||||||||
Other disposals | 157 | 1,949 | — | — | ||||||||||||
Interest received | 89 | 1,104 | 1,205 | 865 | ||||||||||||
Dividends received | 105 | 1,304 | — | — | ||||||||||||
Long-lived assets acquisition | (677 | ) | (8,386 | ) | (6,636 | ) | (7,153 | ) | ||||||||
Long-lived assets sale | 50 | 624 | 679 | 511 | ||||||||||||
Other assets | (212 | ) | (2,630 | ) | (1,747 | ) | (597 | ) | ||||||||
Bottles and cases | (82 | ) | (1,022 | ) | (812 | ) | (700 | ) | ||||||||
Intangible assets | (72 | ) | (892 | ) | (1,347 | ) | (354 | ) | ||||||||
Net cash flows used in investment activities by continuing operations | 499 | 6,178 | (11,376 | ) | (11,267 | ) | ||||||||||
Net cash flows used in investment activities by discontinued operations | — | (4 | ) | (3,389 | ) | (6,007 | ) | |||||||||
Net cash flows used in investing activities | 499 | 6,174 | (14,765 | ) | (17,274 | ) | ||||||||||
Net cash flows available for financing activities | 2,027 | 25,103 | 16,160 | 5,708 | ||||||||||||
The accompanying notes are an integral part of thesethis consolidated statementsstatement of changes in financial position.cash flows.
Cash Flow Generated by (Used in) Financing Activities: Bank loans obtained Bank loans paid Interest paid Dividends paid Acquisition of noncontrolling interest Other liabilities payments Net cash flows used in financing activities by continuing operations Net cash flows used in financing activities by discontinued operations Net cash flows used in financing activities Net cash flow by continuing operations Net cash flow by discontinued operations Net cash flow Translation and restatement effect on cash and cash equivalents Initial cash Initial cash of discontinued operations Initial cash and cash equivalents Ending balance Ending balance by discontinued operations Total ending balance of cash and cash equivalents, net 2010 2009 2008 728 9,016 14,107 7,505 (1,012 ) (12,536 ) (15,533 ) (7,098 ) (244 ) (3,018 ) (4,259 ) (3,733 ) (308 ) (3,813 ) (2,246 ) (2,058 ) (18 ) (219 ) 67 (175 ) 6 74 (25 ) 16 (848 ) (10,496 ) (7,889 ) (5,543 ) (82 ) (1,012 ) (909 ) (1,416 ) (930 ) (11,508 ) (8,798 ) (6,959 ) 1,088 13,484 3,479 (787 ) 9 111 3,883 (464 ) 1,097 13,595 7,362 (1,251 ) (81 ) (1,006 ) (1,173 ) 192 1,278 15,824 9,635 10,694 (106 ) (1,316 ) — — 1,172 14,508 9,635 10,694 2,188 27,097 15,824 9,635 — — (1,316 ) (1,070 ) $ 2,188 Ps. 27,097 Ps. 14,508 Ps. 8,565
The accompanying notes are an integral part of this consolidated statement of cash flows.
FOMENTO ECONÓMICO MEXICANO, S.A.B. DE C.V. AND SUBSIDIARIES
MONTERREY, N.L., MEXICOMÉXICO
Consolidated Statements of Changes in Stockholders’ Equity
For the years ended December 31, 2007, 20062010, 2009 and 2005.2008. Amounts expressed in millions of constant Mexican pesos (Ps.) as of December 31, 2007..
| Capital Stock | Additional Paid-in Capital | Retained Earnings from Prior Years | Net Income | Cumulative Other Comprehensive Income | Majority Interest | Minority Interest in Consolidated Subsidiaries | Total Stockholders’ Equity | ||||||||||||||||||||||||
Balances at December 31, 2004 | Ps. | 4,979 | Ps. | 14,154 | Ps. | 21,447 | Ps. | 6,917 | Ps. | (7,183 | ) | Ps. | 40,314 | Ps. | 19,713 | Ps. | 60,027 | ||||||||||||||
Transfer of prior year net income | 6,917 | (6,917 | ) | — | |||||||||||||||||||||||||||
Dividends declared and paid | (731 | ) | (731 | ) | (372 | ) | (1,103 | ) | |||||||||||||||||||||||
Issuance of capital stock | 369 | 8,092 | 8,461 | 8,461 | |||||||||||||||||||||||||||
Comprehensive income | 5,951 | (1,595 | ) | 4,356 | 2,657 | 7,013 | |||||||||||||||||||||||||
Balances at December 31, 2005 | 5,348 | 22,246 | 27,633 | 5,951 | (8,778 | ) | 52,400 | 21,998 | 74,398 | ||||||||||||||||||||||
Transfer of prior year net income | 5,951 | (5,951 | ) | — | |||||||||||||||||||||||||||
Dividends declared and paid | (1,055 | ) | (1,055 | ) | (404 | ) | (1,459 | ) | |||||||||||||||||||||||
Acquisition of Kaiser minority interest | 467 | 467 | |||||||||||||||||||||||||||||
Acquisition of FEMSA Cerveza minority interest | (80 | ) | (80 | ) | (95 | ) | (175 | ) | |||||||||||||||||||||||
Acquisition of Coca-Cola FEMSA minority interest | (1,609 | ) | (1,609 | ) | (3,192 | ) | (4,801 | ) | |||||||||||||||||||||||
Comprehensive income | 7,127 | (129 | ) | 6,998 | 2,780 | 9,778 | |||||||||||||||||||||||||
Balances at December 31, 2006 | 5,348 | 20,557 | 32,529 | 7,127 | (8,907 | ) | 56,654 | 21,554 | 78,208 | ||||||||||||||||||||||
Transfer of prior year net income | 7,127 | (7,127 | ) | — | |||||||||||||||||||||||||||
Dividends declared and paid | (1,525 | ) | (1,525 | ) | (384 | ) | (1,909 | ) | |||||||||||||||||||||||
Sale of minority interest | 55 | 55 | 360 | 415 | |||||||||||||||||||||||||||
Acquisition of minority interest | (23 | ) | (23 | ) | (16 | ) | (39 | ) | |||||||||||||||||||||||
Comprehensive income | 8,511 | 906 | 9,417 | 3,561 | 12,978 | ||||||||||||||||||||||||||
Balances at December 31, 2007 | Ps. | 5,348 | Ps. | 20,612 | Ps. | 38,108 | Ps. | 8,511 | Ps. | (8,001 | ) | Ps. | 64,578 | Ps. | 25,075 | Ps. | 89,653 | ||||||||||||||
| Capital Stock | Additional Paid-in Capital | Retained Earnings from Prior Years | Net Income | Cumulative Other Comprehensive Income (Loss) | Controlling Interest | Non-Controlling Interest in Consolidated Subsidiaries | Total Stockholders’ Equity | |||||||||||||||||||||||||
Balances at December 31, 2007(1) | Ps. | 5,348 | Ps. | 20,612 | Ps. | 38,108 | Ps. | 8,511 | Ps. | (8,001) | Ps. | 64,578 | Ps. | 25,075 | Ps. | 89,653 | ||||||||||||||||
Transfer of prior year net income | 8,511 | (8,511 | ) | — | — | — | ||||||||||||||||||||||||||
Change in accounting principles (see Note 3 I and K) | (6,070 | ) | 6,424 | 354 | — | 354 | ||||||||||||||||||||||||||
Dividends declared and paid (see Note 22) | (1,620 | ) | (1,620 | ) | (445 | ) | (2,065 | ) | ||||||||||||||||||||||||
Acquisitions by Coca-Cola FEMSA of noncontrolling interest (see Note 6) | (61 | ) | (61 | ) | (162 | ) | (223 | ) | ||||||||||||||||||||||||
Other transactions of noncontrolling interest | 91 | 91 | ||||||||||||||||||||||||||||||
Comprehensive income | 6,708 | (1,138 | ) | 5,570 | 3,515 | 9,085 | ||||||||||||||||||||||||||
Balances at December 31, 2008 | 5,348 | 20,551 | 38,929 | 6,708 | (2,715 | ) | 68,821 | 28,074 | 96,895 | |||||||||||||||||||||||
Transfer of prior year net income | 6,708 | (6,708 | ) | — | — | — | ||||||||||||||||||||||||||
Change in accounting principle (see Note 3 E) | (182 | ) | (182 | ) | — | (182 | ) | |||||||||||||||||||||||||
Dividends declared and paid (see Note 22) | (1,620 | ) | (1,620 | ) | (635 | ) | (2,255 | ) | ||||||||||||||||||||||||
Acquisition by FEMSA Cerveza of noncontrolling interest | (3 | ) | (3 | ) | 19 | 16 | ||||||||||||||||||||||||||
Comprehensive income | 9,908 | 4,713 | 14,621 | 6,734 | 21,355 | |||||||||||||||||||||||||||
Balances at December 31, 2009 | 5,348 | 20,548 | 43,835 | 9,908 | 1,998 | 81,637 | 34,192 | 115,829 | ||||||||||||||||||||||||
Transfer of prior year net income | 9,908 | (9,908 | ) | — | — | — | ||||||||||||||||||||||||||
Dividends declared and paid (see Note 22) | (2,600 | ) | (2,600 | ) | (1,213 | ) | (3,813 | ) | ||||||||||||||||||||||||
Other transactions of noncontrolling interest | 10 | 10 | (283 | ) | (273 | ) | ||||||||||||||||||||||||||
Recycling of OCI and decreasing of noncontrolling interest due to exchange of FEMSA Cerveza (see Note 2) | 525 | (525 | ) | — | (1,221 | ) | (1,221 | ) | ||||||||||||||||||||||||
Other movements of equity method of associates, net of taxes | (98 | ) | (98 | ) | — | (98 | ) | |||||||||||||||||||||||||
Comprehensive income | 39,726 | (1,327 | ) | 38,399 | 4,190 | 42,589 | ||||||||||||||||||||||||||
Balances at December 31, 2010 | Ps. | 5,348 | Ps. | 20,558 | Ps. | 51,045 | Ps. | 40,251 | Ps. | 146 | Ps. | 117,348 | Ps. | 35,665 | Ps. | 153,013 | ||||||||||||||||
| (1) | Amounts as of December 31, 2007 are expressed in millions of Mexican pesos as of the end of December 31, 2007 (see Note 3 I). |
The accompanying notes are an integral part of these consolidated statements of changes in stockholders’ equity.
FOMENTO ECONÓMICO MEXICANO, S.A.B. DE C.V. AND SUBSIDIARIES
Notes to the Consolidated Financial Statements
For the years ended December 31, 2007, 20062010, 2009 and 2005.2008. Amounts expressed in millions of U.S. dollars ($) and in millions of constant Mexican pesos (Ps.) as of December 31, 2007..
Note 1. Activities of the Company.
Fomento Económico Mexicano, S.A.B. de C.V. (“FEMSA”) is a Mexican holding company. The principal activities of FEMSA and its subsidiaries (the “Company”), as an economic unit, are carried out by operating subsidiaries and grouped under direct and indirect holding company subsidiaries (the “Subholding Companies”) of FEMSA.
On February 1, 2010, The Company and The Coca-Cola Company signed a second amendment to the shareholders agreement that confirms contractually the capability of the Company to govern the operating and financial policies of Coca-Cola FEMSA, to exercise control over the operations in the ordinary course of business and grants protective rights to The Coca-Cola Company on such items as mergers, acquisitions or sales of any line business. These amendments were signed without transfer of any consideration. The percentage of voting interest of the Company in Coca-Cola FEMSA remains the same after the signing of this amendment.
On April 30, 2010, FEMSA exchanged 100% of its stake in FEMSA Cerveza, the beer business unit, for a 20% economic interest in Heineken Group (“Heineken”). This strategic transaction is broadly described in Note 2, as well as the related impacts.
The following is a description of suchthe activities of the Company as of the date of the issuance of these consolidated financial statements, together with the ownership interest in each Subholding Company:
Subholding Company | % Ownership | Activities | ||
| Coca-Cola FEMSA, S.A.B. de C.V. and | 53.7% (1)(63.0% of the | Production, distribution and marketing of certain Coca-Cola trademark beverages in Mexico, Guatemala, Nicaragua, Costa Rica, Panama, Colombia, Venezuela, Brazil and Argentina. The Coca-Cola Company indirectly owns 31.6% of Coca-Cola FEMSA’s capital stock. In addition, shares representing 14.7% of Coca-Cola FEMSA’s capital stock are | ||
| FEMSA |
| |||
| 100% | Operation of a chain of convenience stores in Mexico under the trade name “OXXO.” | |||
| CB Equity, LLP (“CB Equity”) | 100% | This Company holds Heineken N.V. and Heineken Holding N.V. shares, acquired as part of the exchange of FEMSA Cerveza on April 2010 (see Note 2). | ||
| Other | 100% | Companies engaged in the production and distribution of | ||
| (1) | The Company controls operating and financial policies. |
Note 2. Exchange of FEMSA Cerveza Business.
On April 30, 2010 FEMSA exchanged 100% of FEMSA Cerveza, the beer business unit, for 20% economic interest in Heineken. Under the terms of the agreement, FEMSA exchanged its beer business and received 43,018,320 shares of Heineken Holding N.V., and 72,182,203 shares of Heineken N.V., of which 29,172,504 will be delivered pursuant to an allotted share delivery instrument (“ASDI”). Those shares are considered in substance common stock due to its similarity to common stock, such as rights to receive the same dividends as any other share. As of December 31, 2010, 10,240,553 of Heineken shares have been delivered to the Company. It is expected that the remaining allotted shares will be acquired by Heineken in the secondary market for delivery to FEMSA over a term not to exceed five years.
The total transaction was valued approximately at $7,347, net of assumed debt of $2,100, based on shares closing prices of € 35.18 for Heineken N.V., and € 30.82 for Heineken Holding N.V. on April 30, 2010. The Company recorded a net gain after taxes that amounted to Ps. 26,623 which is the difference between the fair value of the consideration received and the book value of FEMSA Cerveza as of April 30, 2010; a deferred income tax of Ps. 10,379 (see “Income from the exchange of shares with Heineken, net of taxes” in the consolidated income statements and Note 24 D), and recycling Ps. 525 (see consolidated statements of changes in stockholders’ equity) from other comprehensive income which are integrated of Ps.1,418 accounted as a gain of cumulative translation adjustment and Ps. 893 as a mark to market loss on derivatives in cumulative comprehensive loss. Additionally, the Company maintained a loss contingency of Ps. 560, regarding the indemnification accorded with Heineken over FEMSA Cerveza prior tax contingencies (see Note 25 B).
As of the date of the exchange, the Company lost control over FEMSA Cerveza and stopped consolidating its financial information and accounted for the 20% economic interest of Heineken acquired by the purchase method as established in NIF C-7 Investments in associates and other permanent investments. Subsequently, this investment in shares has been accounted for by the equity method, because of the Company’s significant influence.
After purchase price adjustments, the Company identified intangible assets of indefinite and finite life brands and goodwill that amounted to EUR 14,074 million and EUR 1,200 million respectively and increased certain operating assets and liabilities to fair value, which are presented as part of the investment in shares of Heineken within the consolidated financial statement.
The fair values of the proportional assets acquired and liabilities assumed as part of this transaction are as follows:
(in millions of EUR) | Heineken Figures at Fair Value | Fair Value of Proportional Net Assets Acquired by FEMSA (20%) | ||||||
ASSETS | ||||||||
Property, plant & equipment | 8,506 | 1,701 | ||||||
Intangible assets | 15,274 | 3,055 | ||||||
Other assets | 4,025 | 805 | ||||||
Total non-current assets | 27,805 | 5,561 | ||||||
Inventories | 1,579 | 316 | ||||||
Trade and other receivable | 3,240 | 648 | ||||||
Other assets | 1,000 | 200 | ||||||
Total current assets | 5,819 | 1,164 | ||||||
Total assets | 33,624 | 6,725 | ||||||
LIABILITIES | ||||||||
Loans and borrowings | 9,551 | 1,910 | ||||||
Employee benefits | 1,335 | 267 | ||||||
Deferred tax liabilities | 2,437 | 487 | ||||||
Other non-current liabilities | 736 | 147 | ||||||
Total non-current liabilities | 14,059 | 2,811 | ||||||
Trade and other payables | 5,019 | 1,004 | ||||||
Other current liabilities | 1,221 | 244 | ||||||
Total current liabilities | 6,240 | 1,248 | ||||||
Total liabilities | 20,299 | 4,059 | ||||||
Net assets acquired | 13,325 | 2,666 | ||||||
Summarized consolidated balance sheets and income statements of FEMSA Cerveza are presented as follows as of:
Consolidated Balance Sheets | April 30, 2010 | December 31, 2009 | ||||||
Current assets | Ps.13,770 | Ps.13,450 | ||||||
Property, plant and equipment | 26,356 | 26,669 | ||||||
Intangible assets and goodwill | 18,828 | 19,190 | ||||||
Other assets | 11,457 | 12,959 | ||||||
Total assets | 70,411 | 72,268 | ||||||
Current liabilities | 14,039 | 10,883 | ||||||
Long term liabilities | 27,586 | 32,216 | ||||||
Total liabilities | 41,625 | 43,099 | ||||||
Total stockholders’ equity: | ||||||||
Controlling interest | 27,417 | 27,950 | ||||||
Noncontrolling interest in consolidated subsidiaries | 1,369 | 1,219 | ||||||
Total stockholders’ equity | 28,786 | 29,169 | ||||||
Total liabilities and stockholders’ equity | Ps.70,411 | Ps.72,268 | ||||||
Consolidated Income Statements | April 30, 2010 | December 31, 2009 | December 31, 2008 | |||||||||
Total revenues | Ps. | 14,490 | Ps. | 46,329 | Ps. | 42,276 | ||||||
Income from operations | 1,342 | 5,887 | 5,286 | |||||||||
Income before income tax | 749 | 2,231 | 2,748 | |||||||||
Income tax | 43 | (1,052 | ) | 1,100 | ||||||||
Consolidated net income | 706 | 3,283 | 1,648 | |||||||||
Less: Net income attributable to the noncontrolling interest | 48 | 787 | (243 | ) | ||||||||
Net income attributable to the controlling interest | Ps. | 658 | Ps. | 2,496 | Ps. | 1,891 | ||||||
As a result of the transaction described above FEMSA Cerveza operations for the period ended on April 30, 2010, December 31, 2009 and 2008 are presented within the consolidated income statement, net of taxes in a single line as discontinued operations. Prior years consolidated financial statements and the accompanying notes have been reformulated in order to present FEMSA Cerveza as discontinued operations for comparable purposes.
Consolidated statement of balance sheet and cash flows of December 31, 2009 and 2008 presents FEMSA Cerveza as discontinued operations. Intercompany transactions between the Company and FEMSA Cerveza are reclassified in order to conform to consolidated financial statements as of December 31, 2010.
Note 3. Basis of Presentation.
The accompanying consolidated financial statements include the financial statements of FEMSA and those companies in which it directly or indirectly owns a majority of the outstanding voting capital stock and/or exercises control. All intercompany account balances and transactions have been eliminated in such consolidation.
The consolidated financial statements of the Company arewere prepared in accordance with “NormasNormas de Información Financiera”Financiera (Mexican Financial Reporting Standards or “Mexican FRS”), individually referred to as “NIFs,” which differ in certain significant respects from generally accepted accounting principles in the United States of America (“U.S. GAAP”), as further explained in Note 26. A reconciliation from Mexican FRS to U.S. GAAP is included in Note 27.
The consolidated financial statementsand are stated in millions of Mexican pesos (“Ps.”). The translation of Mexican pesos into U.S. dollars (“$”) is included solely for the convenience of the reader, using the noon buying exchange rate published by the Federal Reserve Bank of New York of 10.916912.3825 pesos per U.S. dollar as of December 31, 2007.30, 2010.
On January 1, 2007, NIF B-3 “Income Statement” went into effect. NIF B-3 establishes generic standards for presentingThe consolidated financial statements include the financial statements of FEMSA and structuring the statement of income, minimum content requirementsthose companies in which it exercises control. All intercompany account balances and general disclosure standards. Additionally, statutory employee profit sharing (“PTU”) should be presented within other expenses pursuant to Mexican FRS Interpretation (“INIF”) No. 4. The PTU reclassified to other expenses amounted to Ps. 553, Ps. 530 and Ps. 588 for the years ended December 31, 2007, 2006 and 2005, respectively (see Note 18). The Company’s consolidated income statements for the years ended December 31, 2007, 2006 and 2005 are presented according to NIF B-3 and INIF No. 4 requirements.transactions have been eliminated in consolidation.
The Company classifies its costs and expenses according to theirby function in the consolidated income statementsstatement, in accordance with industry practices.
Incomeorder to conform to the industry’s practices where the Company operates. The income from operations line in the income statement is the result of subtracting cost of sales and operating expenses from total revenues. While NIF B-3 does not require inclusion of this line in the consolidated income statements,revenues and it has been included for a better understanding of the Company’s financial and economic performance.
Figures presented as of December 31, 2007, have been restated and translated as of December 31, 2007, which is the date of the last comprehensive recognition of the effects of the inflation in the financial performance.information in inflationary and non-inflationary economic environments. Beginning on January 1, 2008 and according to NIF B-10 “Effects of Inflation,” only inflationary economic environments have to recognize inflation effects. As described in Note 5 A), since 2008 the Company has operated in a non-inflationary economic environment in Mexico. Figures as of December 31, 2009, 2008 and 2007 are presented as they were reported in last year; as a result figures have not been comprehensively restated as required by NIF B-10 for reporting entities that operate in non-inflationary economic environments.
The results of theoperations of businesses acquired by FEMSAthe Company are included in the consolidated financial statements since the date of acquisition. As a result of certain significant acquisitions (see Note 5)6), the consolidated financial statements are not comparable to the figures presented in prior years.
The accompanying consolidated financial statements and their accompanying notes were approved for issuance by the Company’s Chief Executive Officer and Chief Financial Officer on June 27, 2011 and subsequent events have been considered through that date.
On February 18,January 1, 2010, 2009, and 2008 several Mexican FRS came into effect. Such changes and their application are described as follows:
| a) | NIF C-1 “Cash and Cash Equivalents” |
In 2010, the BoardCompany adopted NIF C-1 “Cash and Cash Equivalents”, which superseded Bulletin C-1 “Cash”. NIF C-1 establishes that cash shall be measured at nominal value, and cash equivalents shall be measured at acquisition cost for initial recognition. Subsequently, cash equivalents should be measured according to its designation: precious metals shall be measured at fair value, foreign currencies shall be translated to the reporting currency applying the closing exchange rate, other cash equivalents denominated in a different measure of Directorsexchange shall be recognized to the extent provided for this purpose at the closing date of FEMSA unanimously approvedfinancial statements, and available-for-sale investments shall be presented at fair value. Cash and cash equivalents will be presented in the first line of assets, including restricted cash. This pronouncement was applied retrospectively, causing an increase in the cash balances reported as a result of the treatment of presentation of restricted cash, which was reclassified from “other current assets” for the amount of Ps. 394 and Ps. 214 at December 31, 2010 and 2009, respectively (see Note 5 B).
| b) | INIF 19, “Accounting Change as a Result of IFRS Adoption”: |
On September 30, 2010, INIF 19 “Accounting change as a result of IFRS adoption” was issued. INIF 19 states disclosure requirements for: (a) financial statements based on Mexican FRS that were issued before IFRS adoption and (b) financial statements on Mexican FRS that are issued during IFRS adoption process. Either A) or B) will result in additional disclosures regarding IFRS adoption, such as date of adoption, significant financial impact, significant changes in accounting policies, among others. The Company will adopt IFRS in 2012.
| c) | NIF B-7, “Business Combinations”: |
In 2009, the Company adopted NIF B-7 “Business Combinations,” which is an amendment to the previous Bulletin B-7 “Business Acquisitions.” NIF B-7 establishes general rules for recognizing the fair value of net assets of businesses acquired as well as the fair value of noncontrolling interests, at the purchase date. This statement differs from the previous Bulletin B-7 in the following: a) To recognize all assets and liabilities acquired at their fair value, including the noncontrolling interest based on the acquirer accounting policies, b) acquisition-related costs and restructuring expenses should not be part of the purchase price, and c) changes to tax amounts recorded in acquisitions must be recognized as part of the income tax provision. This pronouncement was applied prospectively to business combinations for which the acquisition date is on or after January 1, 2009.
| d) | NIF C-7, “Investments in Associates and Other Permanent Investments”: |
NIF C-7 “Investments in Associates and Other Permanent Investments,” establishes general rules of accounting recognition for the investments in associated and other permanent investments not jointly or fully controlled or that are significantly influenced by an entity. This pronouncement includes guidance to determine the existence of significant influence. Previous Bulletin B-8 “Consolidated and combined financial statements and assessment of permanent share investments,” defined that permanent share investments were accounted for by the equity method if the entity held 10% or more of its outstanding shares. NIF C-7 establishes that permanent share investments should to be accounted for by equity method if: a) an entity holds 10% or more of a public entity, b) an entity holds 25% or more of a non-public company, or c) an entity has significant influence in its investment as defined in NIF C-7. The Company adopted NIF C-7 on January 1, 2009, and its adoption did not have a significant impact in its consolidated financial results.
| e) | NIF C-8, “Intangible Assets”: |
In 2009, the Company adopted NIF C-8 “Intangible Assets” which is similar to previous Bulletin C-8 “Intangible Assets.” NIF C-8, establishes the rules of valuation, presentation and disclosures for the initial and subsequent recognition of intangible assets that are acquired either individually, through acquisition of an entity, or generated internally in the course of the entity’s operations. This NIF considers intangible assets as non-monetary items, broadens the criteria of identification to include not only if they are separable (asset could be sold, transferred or used by the entity) but also whether they come from contractual or legal rights. NIF C-8 establishes that preoperative costs capitalized before this standard went into effect should have intangible assets characteristics, otherwise preoperative costs must be expensed as incurred. The impact of adopting NIF C-8 was a Ps. 182, net of deferred income tax, regarding prior years preoperative costs that did not have intangible asset characteristics, charged to retained earnings in the consolidated financial statements and is presented as a change in accounting principle in the accompanying notes,consolidated statements of changes in stockholders’ equity.
| f) | NIF D-8, “Share-Based Payments”: |
In 2009, the Company adopted NIF D-8 “Share-Based Payments” which establishes the recognition of share-based payments. When an entity purchases goods or pays for services with equity instruments, the NIF requires the entity to recognize those goods and services at fair value and the corresponding increase in equity. If the entity cannot determine the fair value of goods and services, it should determine it using an indirect method, based on fair value of the equity instruments. This pronouncement substitutes for the supplementary use of IFRS 2 “Share-Based Payments.” The adoption of NIF D-8 did not impact the Company’s financial statements.
| g) | NIF B-8, “Consolidated and Combined Financial Statements”: |
NIF B-8 “Consolidated and Combined Financial Statements,” issued in 2008 amends Bulletin B-8 “Consolidated and Combined Financial Statements and Assessment of Permanent Share Investments.” Prior Bulletin B-8 based its consolidation principle mainly on ownership of the majority voting capital stock. NIF B-8 differs from previous Bulletin B-8 in the following: a) defines control as the power to govern financial and operating policies, b) establishes that there are other facts, such as contractual agreements that have to be considered to determine if an entity exercises control or not, c) defines “Specific-Purpose Entity” (“SPE”), as those entities that are created to achieve a specific purpose and are considered within the scope of this pronouncement, d) establishes new terms as “controlling interest” instead of “majority interest” and “noncontrolling interest” instead “minority interest,” and e) confirms that noncontrolling interest must be assessed at fair value at the subsidiary acquisition date. NIF B-8 shall be applied prospectively, beginning on January 1, 2009. The amendment to the shareholders agreement described in Note 1, allowed the Company to continue to consolidate Coca-Cola FEMSA for Mexican FRS purposes during 2009.
| h) | NIF B-2, “Statement of Cash Flows”: |
In 2008, the Company adopted NIF B-2 “Statement of Cash Flows.” As established in NIF B-2, the Consolidated Statement of Cash Flows is presented as part of these financial statements for the years ended December 31, 2010, 2009 and 2008. The adoption of NIF B-2 also resulted in several complementary disclosures not previously required.
| i) | NIF B-10, “Effects of Inflation”: |
In 2008, the Company adopted NIF B-10 “Effects of Inflation.” Before 2008, the Company restated prior year financial statements to reflect the impact of current period inflation for comparability purposes.
NIF B-10 establishes two types of inflationary environments: a) Inflationary Economic Environment; this is when cumulative inflation of the three preceding years is 26% or more. In such case, inflation effects should be recognized in the financial statements by applying the integral method as described in NIF B-10; the recognized restatement effects for inflationary economic environments is made starting in the period that the entity becomes inflationary; and b) Non-Inflationary Economic Environment; this is when cumulative inflation of the three preceding years is less than 26%. In such case, no inflationary effects should be recognized in the financial statements, keeping the recognized restatement effects until the last period in which the inflationary accounting was applied.
In order to reverse the effects of inflationary accounting, NIF B-10 establishes that the results of holding non-monetary assets (RETANM) of previous periods should be reclassified in retained earnings. On January 1, 2008, the amount of RETANM reclassified in retained earnings was Ps. 6,070 (see Consolidated Statements of Changes in Stockholders’ Equity).
Through December 31, 2007, the Company accounted for inventories at replacement cost. As a result of NIF B-10 adoption, beginning in 2008, the Company carries out the inventories valuation based on valuation methods described in Bulletin C-4 “Inventories.” Inventories from Subholding Companies that operate in inflationary environments are restated using inflation factors. The change in accounting for inventories impacted the consolidated income statement, through an increase to cost of sales of Ps. 350 for the year ended on December 31, 2007.2008.
In addition, NIF B-10 eliminates the restatement of imported equipment by applying the inflation factors and exchange rate of the country where the asset was purchased. Beginning in 2008, these assets are recorded using the exchange rate of the acquisition date. Subholding Companies that operate in inflationary environments should restate imported equipment using the inflation factors of the country where the asset is acquired. The change in this methodology did not significantly impact the consolidated financial statements of the Company.
| j) | NIF B-15, “Translation of Foreign Currencies”: |
NIF B-15 went into effect in 2008 and incorporates the concepts of recording currency, functional currency and reporting currency, and establishes the methodology to translate financial information of a foreign entity, based on those terms. Additionally, this rule is aligned with NIF B-10, which defines translation procedures of financial information from subsidiaries that operate in inflationary and non-inflationary environments. Prior to the application of this rule, translation of financial information from foreign subsidiaries was according to inflationary environments methodology. The adoption of this pronouncement is prospective and did not impact the consolidated financial statements of the Company (see Note 4).
| k) | NIF D-3, “Employee Benefits”: |
The Company adopted NIF D-3 in 2008, which eliminates the recognition of the additional liability which resulted from the difference between obligations for accumulated benefits and the net projected liability. On January 1, 2008, the additional liability derecognized amounted to Ps. 868 from which Ps.447 corresponds to the intangible asset and Ps. 251 to the controlling cumulative other comprehensive income, net from its deferred tax of Ps. 170 These figures do not match to those presented previously due to discontinued operations.
NIF D-3 establishes a maximum five-year period to amortize the initial balance of the labor costs of past services of pension and retirement plans and the same amortization period for the labor cost of past service of severance indemnities, previously defined by Bulletin D-3 “Labor Liabilities” as unrecognized transition obligation and unrecognized prior service costs.
For the years ended December 31, 2010, 2009 and 2008, labor costs of past services amounted to Ps. 81, Ps. 81 and Ps. 99, respectively; and were recorded within the operating income (see Note 16).
Actuarial gains and losses of severance indemnities are registered in the operating income of the year they were generated and the balance of unrecognized actuarial gains and losses as of January 1, 2008 was recorded in other expenses (see Note 19) and amounted to Ps. 163.
Note 3.4. Foreign Subsidiary Incorporation.
The accounting records of foreign subsidiaries are maintained in local currency and in accordance with local accounting principles of each country. For incorporation into the FEMSACompany’s consolidated financial statements, each foreign subsidiary’s individual financial statements are adjusted to Mexican FRS, and restated totranslated into Mexican pesos, as described as follows:
For inflationary economic environments, the purchasing powerinflation effects of the local currency applying inflation factors of theorigin country of originare recognized, and are subsequently translated into Mexican pesos using the year-end exchange rate.rate for the balance sheets and income statements; and
For non-inflationary economic environments, assets and liabilities are translated into Mexican pesos using the period-end exchange rate, stockholders’ equity is translated into Mexican pesos using the historical exchange rate, and the income statement is translated using the average exchange rate of each month.
Country Mexico Guatemala Costa Rica Panama Colombia Nicaragua Argentina Venezuela(1) Brazil Euro Zone Local Currencies to Mexican Pesos Functional /
Recording Currency Average Exchange
Rate for Exchange Rate as of December 31 2010 2009 2008 2010 2009 2008 Mexican peso Ps. 1.00 Ps. 1.00 Ps. 1.00 Ps. 1.00 Ps. 1.00 Ps. 1.00 Quetzal 1.57 1.66 1.47 1.54 1.56 1.74 Colon 0.02 0.02 0.02 0.02 0.02 0.02 U.S. dollar 12.64 13.52 11.09 12.36 13.06 13.54 Colombian peso 0.01 0.01 0.01 0.01 0.01 0.01 Cordoba 0.59 0.67 0.57 0.56 0.63 0.68 Argentine peso 3.23 3.63 3.50 3.11 3.44 3.92 Bolivar 2.97 6.29 5.20 2.87 6.07 6.30 Reai 7.18 6.83 6.11 7.42 7.50 5.79 Euro 16.74 18.80 16.20 16.41 18.81 18.84
| (1) | Equals 4.30 bolivars per one U.S. dollar in 2010 and 2.15 bolivars per one U.S. Dollar for 2009 and 2008, translated to Mexican pesos applying the average exchange rate or period-end rate. |
The variationvariations in the net investment in foreign subsidiaries generated by exchange rate fluctuations isfluctuation are included in the cumulative translation adjustment, andwhich is recorded directly in stockholders’ equity as part of cumulative other comprehensive income.
The monetary position result and exchange gain or loss generated by foreign subsidiaries associated with the financing of intercompany foreign currency denominated balances recorded in the cumulative translation adjustment in stockholders’ equity as part of cumulative other comprehensive income (loss).
Beginning in 2010, the government of Venezuela announced the devaluation of the Bolivar (Bs). The official exchange rate of 2.150 Bs to the dollar, in effect since 2005, was replaced on January 8, 2010, with a dual-rate regime, which allows two official exchange rates, one for essential products Bs 2.60 per U.S. dollar and other non-essential products of 4.30 Bs per U.S. dollar. According to this, the exchange rate used by the company to convert the information of the operation for this country changed Bs 2.15 to 4.30 per U.S. dollar in 2010. As a result of this devaluation, the balance sheet of the Coca-Cola FEMSA Venezuelan subsidiary reflected a reduction in shareholder’s equity of Ps. 3,700 which was accounted for at the time of the devaluation in January 2010. The Company has operated under exchanges controls in Venezuela since 2003 that affect its ability to remit dividends abroad or make payments other than in local currencies and that may increase the real price to us of raw materials purchased in local currency.
During December 2010, authorities of the Venezuelan Government announced the unification of their two fixed U.S. dollar exchange rates to Bs. 4.30 per U.S. dollar, effective January 1, 2011. As a result of this change, the balance sheet of the Coca-Cola FEMSA’s Venezuelan subsidiary did not have an impact in shareholders’ equity since transactions performed by this subsidiary were already using the Bs. 4.30 exchange rate.
Intercompany financing balances with foreign subsidiaries are considered to beas long-term investments, since settlementthere is not planned or anticipatedno plan to pay such financing in the foreseeable future. Monetary position and exchange rate fluctuation regarding this financing are recorded in equity as part of cumulative translation adjustment, in cumulative other comprehensive income (loss).
The translation of assets and liabilities denominated in foreign currencies into Mexican pesos is for consolidation purposes and does not indicate that the Company could realize or settle the reported value of those assets and liabilities in Mexican pesos. Additionally, this does not indicate that the Company could return or distribute the reported Mexican peso value equity to its shareholders.
Note 4.5. Significant Accounting Policies.
The Company’s accounting policies are in accordance with Mexican FRS, which require that the Company’s management make certain estimates and use certain assumptions to determine the valuation of various items included in the consolidated financial statements. The Company’s management believes that the estimates and assumptions used were appropriate as of the date of these consolidated financial statements. However actual results are subject to future events and uncertainties, which could materially impact the Company’s actual performance.
The significant accounting policies are as follows:
| a) | Recognition of the Effects of |
The recognition ofCompany recognizes the effects of inflation in the financial information of its subsidiaries that operate in inflationary economic environments (when cumulative inflation of the three preceding years is 26% or more), through the integral method, which consists of:of (see Note 3 I):
RestatingUsing inflation factors to restate non-monetary assets such as inventories, investments in process, property, plant and fixedequipment, intangible assets, including related costs and expenses when such assets are consumed or depreciated;
RestatingApplying the appropriate inflation factors to restate capital stock, additional paid-in capital, and retained earnings and the cumulative other comprehensive income/loss by the necessary amount necessary to maintain the purchasing power equivalent in Mexican pesos on the dates such capital was contributed or income was generated throughup to the use of the appropriate inflation factors;
Including in stockholders’ equity the cumulative effect of holding non-monetary assets, which is the net difference between changes in the replacement cost of non-monetary assets and adjustments based upon the inflation factors;date these consolidated financial statements are presented; and
Including in the integral result of financingComprehensive Financing Result the purchasing power gain or loss from holdingon monetary items.position (see Note 5 U).
The Company restates the financial information of its consolidated financial statementssubsidiaries that operate in currencyinflationary economic environments using the consumer price index of constant purchasing power by applying inflation factorseach country.
The operations of the country of origin andCompany are classified as follows considering the exchange rate in effect at the datecumulative inflation of the most recent balance sheet presented.three preceding years of 2010. The following classification was also applied for the 2009 period:
| Inflation Rate | Cumulative Inflation | |||||||||||||||||||
| 2010 | 2009 | 2008 | 2009-2007 | Type of Economy | ||||||||||||||||
Mexico | 4.4 | % | 3.6 | % | 6.5 | % | 14.5 | % | Non-Inflationary | |||||||||||
Guatemala | 5.4 | % | (0.3 | )% | 9.4 | % | 18.6 | % | Non-Inflationary | |||||||||||
Colombia | 3.2 | % | 2.0 | % | 7.7 | % | 16.1 | % | Non-Inflationary | |||||||||||
Brazil | 5.9 | % | 4.1 | % | 6.5 | % | 16.6 | % | Non-Inflationary | |||||||||||
Panama | 4.9 | % | 1.9 | % | 6.8 | % | 15.7 | % | Non-Inflationary | |||||||||||
Euro Zone | 2.2 | % | 0.9 | % | 1.6 | % | 5.7 | % | Non-Inflationary | |||||||||||
Argentina(1) | 10.9 | % | 7.7 | % | 7.2 | % | 25.3 | % | Inflationary | |||||||||||
Venezuela | 27.2 | % | 25.1 | % | 30.9 | % | 100.5 | % | Inflationary | |||||||||||
Nicaragua | 9.2 | % | 0.9 | % | 13.8 | % | 34.2 | % | Inflationary | |||||||||||
Costa Rica | 5.8 | % | 4.0 | % | 13.9 | % | 31.3 | % | Inflationary | |||||||||||
| (1) | According to The National Institute of Statistics and Censuses of Argentina, the expected inflation rate for the following years would increase. As a result, the Company still qualifies Argentina as an inflationary economy according to NIF B-10 “Effects of Inflation”. |
| b) | Cash and Cash |
Cash and Cash Equivalents
Cash is measured at nominal value and consists of non-interest bearing bank deposits.deposits and restricted cash. Beginning in 2010 restricted cash is presented within cash; prior years have been reclassified from other current assets to cash for comparable purposes. Cash equivalents consistconsisting principally of short-term bank deposits and fixed-rate investments with brokerage houses valued at the listed market prices with original maturities of three months or less. less are recorded at its acquisition cost plus interest income not yet received, which is similar to listed market prices.
| 2010 | 2009 | |||||||
Mexican pesos | Ps. | 11,207 | Ps. | 8,575 | ||||
U.S. dollars | 12,652 | 3,181 | ||||||
Brazilian reais | 1,792 | 1,915 | ||||||
Euros | 531 | — | ||||||
Venezuelan bolivars | 460 | 524 | ||||||
Colombian pesos | 213 | 245 | ||||||
Argentine pesos | 153 | 68 | ||||||
Others | 89 | — | ||||||
| Ps. | 27,097 | Ps. | 14,508 | |||||
As of December 31, 20072010 and 2006,2009, the Company has restricted cash which is pledged as collateral of accounts payable in different currencies as follows:
| 2010 | 2009 | |||||||
Venezuelan bolivars | Ps. 143 | Ps. 161 | ||||||
Argentine pesos | 2 | — | ||||||
Brazilian reais | 249 | 53 | ||||||
| Ps. 394 | Ps. 214 | |||||||
As of December 31, 2010 and 2009, cash equivalents amounted to Ps. 6,12519,770 and Ps. 5,369,9,950, respectively.
Marketable Securities
Management determines the appropriate classification of debt securities at the time of purchase and reevaluates such designation as of each balance date. Marketable securities are classified as available-for-sale. Available-for-sale securities are carried at fair value, with the unrealized gains and losses, net of tax, reported in other comprehensive income. Interest and dividends on securities classified as available-for-sale are included in investment income. The fair values of the investments are readily available based on quoted market prices. The following is a detail of available-for-sale securities.
Debt Securities | Amortized Cost | Gross Unrealized Gain | Fair Value | |||||||||
December 31, 2010 | Ps. | 66 | — | Ps. | 66 | |||||||
December 31, 2009 | Ps. | 2,001 | Ps. | 112 | Ps. | 2,113 | ||||||
| c) | Allowance for Doubtful Accounts: |
Allowance for doubtful accounts is based on an evaluation of the aging of the receivable portfolio and the economic situation of the Company’s clients, as well as the Company’s historical loss rate on receivables and the economic environment in which the Company operates. The carrying value of accounts receivable approximates its fair value as of both December 31, 2010 and 2009.
| Inventories and Cost of Sales: |
The operating segments of the Company use inventory costing methodologies provided by Bulletin C-4 “Inventories” to value oftheir inventories, is adjusted to replacementsuch as average cost without exceeding net realizable value.in Coca-Cola FEMSA and retail method in FEMSA Comercio. Advances to suppliers to purchaseof raw materials are included in the inventory account and are restated by applying inflation factors, considering their average age.account.
Cost of sales based on average cost is determined based on replacement costthe average amount of the inventories at the time of sale. Cost of sales includes expenses related to raw materials used in the production process, labor cost (wages and other benefits), depreciation of production facilities, and equipment and other costs includingsuch as fuel, electricity, breakage of returnable bottles in the production process, equipment maintenance, inspection and inter and intra-plantplant transfer costs.
| Other Current Assets: |
Other current assets are comprised of payments for services that will be received over the next 12 months and the fair market value of derivative financial instruments with maturity dates of less than one year (see Note 4 r).5 V), and long-lived assets available for sale that will be sold within the following year.
Prepaid expenses are recorded at historical costprincipally consist of advertising, promotional, leasing and insurance expenses, and are recognized in the income statement when the services or benefits are received. Prepaid expenses principally consist of advertising, promotional, leasing and insurance expenses.
Advertising costs consist of television and radio advertising airtime paid in advance, which areand is generally amortized over a 12-month period based on the transmission of the television and radio spots. The related production costs are recognized in income from operations the first time the advertising is transmitted.broadcasted.
Promotional costs are expensed as incurred, except for those promotional costs related to the launching of new products or presentations.presentations before they are on the market. These costs are recorded as prepaid expenses and amortized over the period during which they are estimated to increase sales of the related products or container presentations to normal operating levels, which is generally no longer than one year.
Additionally, as of December 31, 2007 and 2006, the Company has restricted cash, classified as other current
The long-lived assets of Ps. 224 and Ps. 298 denominated in Venezuelan bolivars, and Ps. 14 and Ps. 8 denominated in Brazilian reais, respectively; both were pledged as collateral of accounts payable andavailable for sale are classified in other currentrecorded at their net realizable value. Long-lived assets dueare subject to their short-term nature.impairment tests (see Note 9).
| Capitalization of Comprehensive Financing Result: |
Comprehensive financing result directly attributable to qualifying assets has to be capitalized as part historic cost, except for interest income obtained from temporary investments while the entity is waiting to invest in the qualifying asset. Comprehensive financing result of long-term financing clearly linked to qualifying assets is capitalized directly. When comprehensive financing result of direct or indirect financing is not clearly linked to qualifying assets, the Company capitalizes the proportional comprehensive financing result attributable to those qualifying assets by the weighted average interest rate of each business, including the effects of derivative financial instruments related to those financing.
| g) | Bottles and Cases: |
Non-returnable bottles and cases are recorded in the results of operations at the time of product sale. Returnable bottles and cases are recorded at acquisition cost and restated to their replacement cost. There are two types of returnable bottles and cases:
Those that are in the Company’s control inwithin its facilities, in plantplants and distribution centers; and
Those that have been placed in the hands of customers.customers, but still belong to the Company.
Breakage of returnable bottles and cases in plantwithin plants and distribution centers is recorded as an expense as it is incurred. For the years ended December 31, 2007, 2006 and 2005, breakage expense amounted to Ps. 780, Ps. 737 and Ps. 822, respectively. The Company estimates that breakage expense of returnable bottles and cases in plantplants and distribution centers is similar to the depreciation calculated on an estimated useful life of approximately five years for beer returnable bottles, four years for returnable soft drinks returnable glass bottles and plastic cases, and 18 months for returnable soft drink returnable plastic bottles. Depreciation is computed for tax purposes usingAs of December 31, 2010 and 2009 the straight-line method at the applicable country rate.accumulated depreciation of bottles and cases amounted to Ps. 1,061 and Ps. 812, respectively.
FEMSA Cerveza’s returnableReturnable bottles and cases that have been placed in the hands of customers are subject to an agreement with a retailer pursuant to which FEMSA Cervezathe Company retains ownership. These bottles and cases are monitored by sales personnel during their periodic visits to retailers and ifthe Company has the right to charge any breakage is identified it is charged to the retailer. Bottles and cases that are not subject to such agreements are expensed when placed in the hands of retailers.
Coca-Cola FEMSA’sThe Company’s returnable bottles and cases in the market and for which a deposit from customers has been received are presented net of such deposits, and the difference between the cost of these assets and the deposits received is amortizeddepreciated according to their useful lives. The bottles and cases for which no deposit has been received, which represent most of the bottles and cases placed in the market, are expensed when placed in the hands of customers.
| Investments in Shares: |
Investments in shares of associated companies where the Company holds 10% or more of a public company, 25% or more of a non-public company, or exercises significant influence according to NIF C-7 (see Note 3 D), are initially recorded at their acquisition cost as of acquisition date and are subsequently accounted for usingby the equity method. In order to apply the equity method from associates, the Company uses the investee’s financial statements for the same period as the Company’s consolidated financial statements and converts them to Mexican FRS if the investee reports financial information in a different GAAP. Equity method income from associates is presented in the consolidated income statements as part of the income from continuing operations.
Goodwill identified at the investment’s acquisition date, is presented as part of the investment of shares of an associate in the consolidated balance sheet. Investment of shares of an associate is tested for impairment whenever certain circumstances indicate that the carrying amount might exceed its fair value. A temporary decrease of its market value is not recognized as impairment. Usually, investees recognize impairment when it first occurs. However, when this does not happen, the Company recognizes it as a decrease in the equity method income of the period.
On May 1, 2010, the Company started to account the equity method regarding the 20% interest in Heineken Group (see Note 2). Heineken is an international company which prepares its information based on International Financial Reporting Standards (IFRS). The Company has analyzed differences between Mexican FRS and IFRS to reconcile Heineken’s profit and total comprehensive income as required by NIF C-7, in order to estimate the impact on its figures.
Investments in affiliated companies in which the Company does not have significant influence are recorded at acquisition cost and are adjusted to market valuerestated using the consumer price index if they havethat entity operates in an observable market value or based upon the inflation factors of the country of origin, with such adjustments reflected in the income statement.inflationary environment.
| Property, Plant and Equipment: |
Property, plant and equipment are initially recorded at their cost of acquisition and/or construction. Property, plant and equipment of domestic origin are restated by applying inflation factors. Imported equipmentThe comprehensive financing result generated to fund long-term assets investment is restated by applying inflation factorscapitalized as part of the countrytotal acquisition cost. As of originDecember 31, 2010 and then translated at2009, the year-end exchange rate.Company has capitalized Ps. 66 and Ps. 55 respectively, based on a capitalization weighted average rate of 5.3% and 7.2% for long-term assets investments that require more than the operating cycle of the Company to get ready for its intended use. As of December 31, 2008 the capitalization of the comprehensive financing result did not have a significant impact in the consolidated financial statements. Major maintenance costs are capitalized as part of total acquisition cost. Routine maintenance and repair costs are expensed as incurred.
Investments in progress consist of long-lived assets not yet in service, in other words, that are not yet used for the purpose that they were bought, built or developed. The Company expects to complete those investments during the following 12 months.
Depreciation is computed using the straight-line method based on the value of the restated assetsover acquisition cost, reduced by their residual values. The Company estimates depreciation rates, considering the estimated remaining useful lives of the assets.
On January 1, 2007, NIF D-6 “Capitalization of the Integral Result of Financing” went into effect. This standard establishes that the integral result of financing generated by borrowings obtained to finance investment projects must be capitalized as part of the cost of long-term assets when certain conditions are met and amortized over the estimated useful life of the related asset. The adoption of this standard did not have an impact on the Company’s financial information.
Through 2005, all of Company’s subsidiaries depreciated refrigeration equipment over a five-year estimated useful life. In 2006, the Company implemented a program to review the estimated useful lives of its refrigeration equipment. As of the end of December 31, 2007, the Company’s subsidiaries in Mexico, Argentina, Brazil, Colombia, Costa Rica and Guatemala changed their accounting estimate from five to seven years, considering the maintenance and replacement plans of the equipment. The impact of the change in estimate for the years ended December 31, 2007 and 2006 which was accounted for prospectively was a reduction in depreciation expense of Ps. 115 and Ps. 132, respectively. The useful life of refrigeration equipment in Venezuela, Panama and Nicaragua remains at five years.
The estimated useful lives of the Company’s principal assets are as follows:
| Years | ||||
Buildings and construction | 40–50 | |||
Machinery and equipment | 12–20 | |||
Distribution equipment | 10–12 | |||
Refrigeration equipment | 5–7 | |||
Information technology equipment | 3– | |||
Leasing Contracts
The Company leases assets such as property, land, transportation and computer equipments, which are accounted for as operating leases. Payments regarding operating leases are recorded as expenses in the consolidated income of statement when incurred.
| Other Assets: |
Other assets represent payments whose benefits will be received in future years and mainly consist of the following:
Agreements with customers for the right to sell and promote the Company’s products during certain periods of time, which are considered monetary assets and amortized under two methods, in accordance with the terms of such agreements:
Actual volume method, which amortizes the proportion of the volume actually sold to the retailer over the volume target (approximately 85% of the agreements of FEMSA Cerveza are amortized on this basis); and
Straight-linestraight-line method, which amortizes the asset over the life of the contract (the remaining 15% of the agreements of FEMSA Cerveza and 100% of the agreements of Coca-Cola FEMSA are amortized on this basis).contract.
In addition, for agreements amortized based on the actual volume method, the Company periodically compares the amortization calculated based on the actual volume method against the amortization that would have resulted under the straight-line method and records a provision to the extent that the recorded amortization is less than what would have resulted under the straight-line method. The amortization is recorded reducing net sales, which during the years ended December 31, 2007, 20062010, 2009 and 2005,2008, amounted to Ps. 1,360,553, Ps. 1,439604 and Ps. 1,323,383, respectively.
Leasehold improvements which are restated by applying inflation factors, are amortized using the straight-line method, over the shorter of the useful life of the assets or a term equivalent to the lease period. The amortization of leasehold improvements as of December 31, 2010, 2009 and 2008 were Ps. 518, Ps. 471 and Ps. 456, respectively.
| Intangible Assets: |
TheseIntangible assets represent payments whose benefits will be received in future years. The Company separatesThese assets are classified as either intangible assets between those with a finite useful life and thoseor intangible assets with an indefinite useful life, in accordance with the period over which the Company expectsis expected to receive the benefits.
Intangible assets with finite useful lives are amortized and mainly consist of:
Start-up expenses, which represent costs incurred prior to the opening of an OXXO store, including rent, permits and licenses. Such amounts are restated applying inflation factors and are amortized on a straight-line basis in accordance with the terms of the lease contract; and
Information technology and management systems costs incurred during the development stage.stage which are currently in use. Such amounts are restated applying inflation factorswere capitalized and arethen amortized using the straight-line method over four years. Expenses that do not fulfill the requirements for capitalization are expensed as incurred.
Other computer systems cost in the development stage, not yet in use. Such amounts are capitalized as they are expected to add value such as income or cost savings in the future. Such amounts will be amortized on a straight-line basis over their estimated useful life after they are placed in service.
Long-term alcohol licenses are amortized using the straight-line method, and are presented as part of intangible assets of finite useful life.
Through 2008, start-up expenses, which represented costs incurred prior to the opening of OXXO stores with the characteristics of an intangible asset internally developed, were amortized on a straight-line basis in accordance with the terms of the lease contract. In 2009, according to NIF C-8, these amounts were reclassified in retained earnings (see Note 3 E).
Intangible assets with indefinite lives are not amortized and are subject to annual impairment tests.tests or more frequently if necessary. These assets are recorded in the functional currency of the subsidiary in which the investment was made and are subsequently translated into Mexican pesos applying the closing rate of each period. Where inflationary accounting is applied, the intangible assets are restated by applying inflation factors of the country of origin and then translated into Mexican pesos at the year-end exchange rate. The Company’s intangible assets with indefinite lives mainly consist of:
Coca-Cola FEMSA’sof rights to produce and distribute Coca-Cola trademark products in the territories acquired. These rights are contained in agreements that are the standard contracts that The Coca-Cola Company enters intohas with bottlers outsideits bottlers.
There are four bottler agreements for Coca-Cola FEMSA’s territories in Mexico; two expire in June 2013, and the United Statesother two in May 2015. The bottler agreement for Argentina expires in September 2014, for Brazil will expire in April 2014, in Colombia in June 2014, in Venezuela in August 2016, in Guatemala in March 2015, in Costa Rica in September 2017, in Nicaragua in May 2016 and in Panama in November 2014. All of Americathe Company’s bottler agreements are renewable for ten-year terms, subject to the saleright of concentrates for certaineach party to decide not to renew any of these agreements. In addition, these agreements generally may be terminated in the case of material breach. Termination would prevent Coca-Cola FEMSA from selling Coca-Cola trademark beverages;
Trademarks and distribution rights, recognized as a result of the acquisition of the 30% of FEMSA Cerveza and payments made by FEMSA Cervezabeverages in the acquisitionaffected territory and would have an adverse effect on its business, financial conditions, results of the previously granted franchise;operations and
Trademarks and goodwill recognized as a result of the acquisition of Kaiser (see Note 5 c).
Goodwill represents the difference between the price paid and the fair value of the shares and/or net assets acquired that was not assigned directly to an intangible asset. Goodwill is recorded in the functional currency of the subsidiary in which the investment was made and is restated by applying inflation factors of the country of origin and the year-end exchange rate. As of December 31, 2007, the Company’s recorded goodwill resulted from the Kaiser acquisition (see Note 5 c). prospects.
| Impairment of Long-Lived |
The Company reviews the carrying value of its long-lived assets and goodwill for impairment and determines whether impairment exists, by comparing estimated discounted future cash flows to be generated by thosethe book value of the assets with their carryingits fair value which is calculated using recognized methodologies. In case of impairment, the Company records the resulting fair value.
For depreciable and amortizable long-lived assets, such as property, plant and equipment and certain other definite long–lived assets, the Company performs tests for impairment whenever events or changes in circumstances indicate that the carrying amount of an asset or group of assets may not be recoverable through their expected future cash flows.
For indefinite life intangible assets, such as distribution rights and trademarks, the Company tests for impairment on an annual basis and whenever certain circumstances indicate that the carrying amount of those intangible assets exceeds its implied fair value calculated using recognized methodologies consistent with them.
For goodwill, the Company tests for impairment on an annual basis and whenever certain circumstances indicate that the carrying amount of the reporting unit might exceed its implied fair value.
Impairment charges regarding long-lived assets and goodwill are recognized in other expenses.
The Company recognized an impairment regarding indefinite life intangible assets of Ps. 10 as of the end of December 31, 2010 (see Note 12). No impairment was recognized regarding indefinite life intangible assets and goodwill as of the end of December 31, 2009 and 2008.
| Payments from The Coca-Cola Company: |
The Coca-Cola Company participates in certain advertising and promotional programs as well as in Coca-Cola FEMSA’s refrigeration equipment and returnable bottles investment program. The contributions received for advertising and promotional incentives are included as a reduction of selling expenses. The contributions received for the refrigeration equipment and returnable bottles investment program are recorded as a reduction of the investment in refrigeration equipment. Theequipment and returnable bottles. Total contributions received were Ps. 1,582,2,386, Ps. 1,2611,945 and Ps. 1,0981,995 during the years ended December 31, 2007, 20062010, 2009 and 2005,2008, respectively.
| Labor Liabilities: |
Labor liabilities include obligations for pension and retirement plans, seniority premiums, postretirement medical services and severance indemnity liabilities other than restructuring, all based on actuarial calculations, by independent actuaries, using the projected unit
credit method. Costs related to compensated absences, such as vacations and vacation premiums, are accrued on a cumulative basis, from which an accrual is made.
Labor liabilities are considered to be non-monetary and are determined using long-term assumptions. The yearly cost for the year of labor liabilities is charged to income from operations and unamortized prior service costs arelabor cost of past services is recorded as expenses over the remaining working life period during which the employees will receive the benefits of the plan.employees.
Certain subsidiaries of the Company have established funds for the payment of pension benefits and postretirement medical services through irrevocable trusts withof which the employees are named as beneficiaries.
| Contingencies: |
The Company recognizes a liability for a loss when it is probable that certain effects related to past events, would materialize and could be reasonably estimated. These events and its financial impact are disclosed as loss contingencies in the consolidated financial statements. The Company does not recognize an asset for a gain contingency unless it is certain that will be collected.
| p) | Commitments: |
The Company discloses all its commitments regarding material long-lived assets acquisitions, and all contractual obligations (see Note 25 F).
| q) | Revenue Recognition: |
Revenue is recognized in accordance with stated shipping terms, as follows:
For domesticCoca-Cola FEMSA sales of products are recognized as revenue upon delivery to the customer and once the customer has taken ownership of the goods (FOB destination). Domestic revenues are defined as the sales generated by the Company for sales realized in the country where the subsidiaries operate. For the years ended December 31, 2007, 2006 and 2005, domestic revenues represented approximately 97% of total consolidated revenues; and
For export sales, upon shipment of goods to customers (FOB shipping point), and transfer of ownership and risk of loss.
goods. Net sales reflect units delivered at list prices reduced by promotional allowances, discounts and the amortization of the agreements with customers to obtain the rights to sell and promote the products of Coca-Cola FEMSA; and
For FEMSA Comercio retail sales, net revenues are recognized when the product is delivered to customers, and customers take possession of products.
During 2007 and 2008, Coca-Cola FEMSA sold certain of its private label brands to The Coca-Cola Company. Proceeds received from The Coca-Cola Company were initially deferred and are being amortized against the related costs of future product sales over the estimated period of such sales. The balance of unearned revenues as of December 31, 2010 and 2009 amounted to Ps. 547 and Ps. 616, respectively. The short-term portions of such amounts are presented as other current liabilities, amounted Ps. 276 and Ps. 203 at December 31, 2010 and 2009, respectively.
| Operating Expenses: |
Operating expenses are comprised of administrative and selling expenses. Administrative expenses include labor costs (salaries and other benefits) forof employees not directly involved in the sale of the Company’s products, as well as professional service fees, depreciation of office facilities and amortization of capitalized information technology system implementation costs.
Selling expenses include:
Distribution: labor costs (salaries and other benefits),; outbound freight costs, warehousing costs of finished products, breakage forof returnable bottles in the distribution process, depreciation and maintenance of trucks and other distribution facilities and equipment. For the years ended December 31, 2007, 20062010, 2009 and 2005,2008, these distribution costs amounted to Ps. 10,601,12,774, Ps. 9,92113,395 and Ps. 9,273,10,468, respectively;
Sales: labor costs (salaries and other benefits) and sales commissions paid to sales personnel; and
Marketing: labor costs (salaries and other benefits), promotionspromotional expenses and advertising costs.
| Other Expenses: |
Other expenses include PTU, participation in affiliated companies, gainEmployee Profit Sharing (“PTU”), gains or losslosses on sales of fixed assets, impairment of long-lived assets, contingencies reserves as well as their subsequent interest and penalties, severance payments forderived from restructuring programs associated with an ongoing benefit arrangement, and all other non-recurrentnon-recurring expenses related to activities different thanfrom the main activities of the Company and that are not recognized as part of the integral result of financing.comprehensive financing result.
PTU is applicable to Mexico and Venezuela. In Mexico, employee profit sharing is computed at the rate of 10% of the individual company taxable income, except thatfor considering cumulative dividends received from resident legal persons in Mexico, depreciation of historical rather than restated values, is used, foreign exchange gains and losses, which are not included until the asset is disposed of or the liability is due and other effects of inflation are also excluded. In Venezuela, employee profit sharing is computed at a rate equivalent to 15% of after tax earnings. There areincome, and it is no significant non-recurring temporary differences betweenmore than four months of salary.
According to the accounting income forassets and liabilities method described in NIF D-4 Income Taxes, the year and the bases used for Mexican employee profit sharing.Company does not expect relevant deferred items to materialize. As a result, the Company has not recorded a provision forrecognized deferred employee profit sharing.sharing as of either December 31, 2010, 2009 or 2008.
Severance indemnities resulting from a restructuring program and associated with an ongoing benefit arrangement are charged to other expenses on the date when athe decision to retiredismiss personnel under a formal program or for specific causes is taken. These severance payments are included in other expenses. During the years ended December 31, 2007, 2006 and 2005, these payments amounted to Ps. 255, Ps. 866 and Ps. 132, respectively.
| Income Taxes: |
Income tax is charged to results as incurred as well asare deferred income taxes. For purposes of recognizing the effects of deferred income taxes in the consolidated financial statements, the Company utilizes both retrospective and prospective and retrospective projectionsanalysis over the medium-termmedium term when more than one tax regime exists per jurisdiction and recognizes the amount based on the tax regime it expects to be subject to, in the future. Deferred income taxes assets and liabilities are recognized for temporary differences resulting from comparing the book and tax values of assets and liabilities plus any future benefits from tax loss carryforwards. Deferred income taxestax assets are reduced by any benefits for which thereit is uncertainty as to their realizability.more likely than not that they are not realizable.
The balance of deferred taxes is comprised of monetary and non-monetary items, based on the temporary differences from which it is derived. Deferred taxes are classified as a long-term asset or liability, regardless of when the temporary differences are expected to reverse.
The Company determines deferred taxes for temporary differences of its permanent investments.
The deferred tax provision to be included in the income statement is determined by comparing the deferred tax balance at the end of the year to the balance at the beginning of the year, restated in currency of the current year, excluding from both balances any temporary differences that are recorded directly in stockholders’ equity. The deferred taxes related to such temporary differences are recorded in the same stockholders’ equity account.
Through 2007, FEMSA has authorization from theSecretaría de Hacienda y Crédito Público (Secretary of Tax and Public Credit) in Mexicoaccount that gave rise to prepare its Mexican income tax and tax on assets returns (up through 2007) on a consolidated basis, which includes the proportional taxable income or loss of its Mexican subsidiaries. The provisions for income taxes of the foreign countries have been determined on the basis of the taxable income of each individual company.them.
Comprehensive financing result includes interest, foreign exchange gain and losses, market value gain or loss on ineffective portion of derivative financial instruments and gain or loss on monetary position, except for those amounts capitalized and those that are recognized as part of the cumulative comprehensive income (loss). The integral resultcomponents of financing includes:the Comprehensive Financing Result are described as follows:
Interest: Interest income and expenses are recorded when earned or incurred, respectively, except for interest expenses ofcapitalized on the financing of long-term assets;
Foreign Exchange Gains and Losses: Transactions in foreign currencies are recorded in local currencies using the exchange rate applicable on the date they occur. Assets and liabilities in foreign currencies are adjusted to the year-end exchange rate, recording the resulting foreign exchange gain or loss directly in the income statement, except for the foreign exchange gain or loss from the intercompany financing foreign currency denominated balances that are considered to be of a long-term investment nature and the foreign exchange gain or loss from the financing of long-term assets (see Note 3)4);
Gain or Loss on Monetary Position: Represents the result of the effects of inflation on monetary items. The gain or loss on monetary position results from the changes in the general price level of monetary accounts of those subsidiaries that operate in inflationary environments (see Note 5 A), which is computeddetermined by applying inflation factors of the country of origin to the net monetary position at the beginning of each month and excluding the intercompany financing in foreign currency denominated balances that areis considered to be of aas long-term investment because of its nature (see Note 3). The gain or loss on monetary position of foreign subsidiaries is translated into Mexican pesos using the year-end exchange rate. In addition,4), as well as the gain or loss on monetary position from long-term liabilities to finance long-term assets, is excluded from the integral result of financing; and
Market Value Gain or Loss on Ineffective Portion of Derivative Financial Instruments: Represents the net change in the fair value of the ineffective portion of derivative financial instruments, the net change in the fair value of those derivative financial instruments that do not meet hedging criteria for accounting purposes; and the net change in the fair value of embedded derivative financial instruments.
| Derivative Financial Instruments: |
The Company is exposed to different risks related to cash flows, liquidity, market and credit. As a result the Company contracts in different derivative financial instruments in order to reduce its exposure to the risk of exchange rate fluctuations between the Mexican peso and other currencies, the risk of exchange rate and interest rate fluctuations associated with its borrowings denominated in foreign currencies and the exposure to the risk of fluctuation in the costs of certain raw materials.
The Company values and records all derivative financial instruments and hedging activities, including certain derivative financial instruments embedded in other contracts, in the balance sheet as either an asset or liability measured at fair value, considering quoted prices in recognized markets. If such instruments are not traded in a formal market, fair value is determined by applying techniques based upon technical models supported by sufficient, reliable and verifiable market data, recognized in the financial sector. Changes in the fair value of derivative financial instruments are recorded each year in current earnings or as a component of cumulative other comprehensive income (loss), based on the type of hedging instrumentitem being hedged and the ineffectiveness of the hedge.
As of December 31, 2010 and 2009, the balance in other current assets of derivative financial instruments was Ps. 24 and Ps. 26 (see Note 9), and in other assets Ps. 708 and Ps. 481 (see Note 13), respectively. The Company recognized liabilities regarding derivative financial instruments in other current liabilities of Ps. 41 and Ps. 45 (see Note 25 A), as of the end of December 31, 2010 and 2009, respectively, and other liabilities of Ps. 653 and Ps. 553 (see Note 25 B) for the same periods.
The Company designates its financial instruments as cash flow hedgehedges at the inception of the hedging relationship, when transactions meet all hedging accounting requirements. For cash flow hedges, the effective portion is recognized temporarily in cumulative other comprehensive income (loss) within stockholders’ equity and subsequently reclassified to current earnings at the same time the hedged item is affected.recorded in earnings. When derivative financial instruments do not meet all of the accounting requirements for hedging purposes, the change in fair value is immediately recognized in net income. For fair value hedges, the changes in the fair value are recorded in the consolidated results in the period the change occurs.occurs as part of the market value gain or loss on ineffective portion of derivative financial instruments.
The Company identifies embedded derivatives that should be segregated from the host contract for purposes of valuation and recognition. When an embedded derivative is identified and the host contract has not been stated at fair value and adequate elements for its valuation exist, the embedded derivative is segregated from the host contract, stated at fair value and is classified as trading or designated as a financial instrument for hedging.trading. Changes in the fair value of the embedded derivatives at the closing of each period are recognized in current earnings.the consolidated results.
| Cumulative Other Comprehensive Income: |
The cumulative balances of the components of majority other comprehensive income arerepresents the period net income as described in NIF B-3 “Income Statement,” plus the cumulative translation adjustment resulted from translation of foreign subsidiaries and associates to Mexican pesos and the effect of unrealized gain/loss on cash flow hedges from derivative financial instruments.
| 2010 | 2009 | |||||||
Unrealized gain (loss) on cash flow hedges | Ps. | 140 | Ps. | (896) | ||||
Cumulative translation adjustment | 6 | 2,894 | ||||||
| Ps. | 146 | Ps. | 1,998 | |||||
The changes in the cumulative translation adjustment (“CTA”) were as follows:
| 2007 | 2006 | |||||||
Cumulative result of holding non-monetary assets | Ps. | (6,071 | ) | Ps. | (6,460 | ) | ||
Unrealized loss on cash flow hedges | (240 | ) | (638 | ) | ||||
Cumulative translation adjustment | (1,336 | ) | (1,696 | ) | ||||
Additional labor liability over unrecognized net transition obligation | (354 | ) | (113 | ) | ||||
| Ps. | (8,001 | ) | Ps. | (8,907 | ) | |||
| 2010 | 2009 | 2008 | ||||||||||
Initial balance | Ps. | 2,894 | Ps. | (826) | Ps. | (1,337) | ||||||
Recycling of CTA from FEMSA Cerveza business (see Note 2) | (1,418 | ) | — | — | ||||||||
Translation effect | (3,031 | ) | 2,183 | (1,023 | ) | |||||||
Foreign exchange effect from intercompany long-term loans | 1,561 | 1,537 | 1,534 | |||||||||
Ending balance | Ps. | 6 | Ps. | 2,894 | Ps. | (826) | ||||||
The deferred income tax from the cumulative translation adjustment amounted to an asset of Ps. 352 and a liability of Ps. 609 as of December 2010 and 2009, respectively (see Note 24 D).
| Provisions: |
Provisions are recognized for obligations that result from a past event that will likelyprobably result in the use of economic resources and that can be reasonably estimated. Such provisions are recorded at net present values when the effect of the discount is significant. The Company has recognized provisions regarding contingencies and vacations in the consolidated financial statements.
| Issuances of Subsidiary Stock: |
The Company recognizes issuances of a subsidiary’s stock as a capital transaction, in which thetransaction. The difference between the book value of the shares issued and the amount contributed by the minoritynoncontrolling interest holder or a third party is recorded as additional paid-in capital.
| z) | Earnings per Share: |
Earnings per share are determined by dividing net controlling interest income by the average weighted number of shares outstanding during the period.
Earnings per share before discontinued operations are calculated by dividing consolidated net income before discontinued operations by the average weighted number of shares outstanding during the period.
Earnings per share from discontinued operations are calculated by dividing net income from discontinued operations by the average weighted number of shares outstanding during the period.
Note 5. Acquisitions.6. Acquisitions and Disposals.
| a) |
On November 3, 2006, FEMSA indirectly acquired from The Coca-Cola Company 148,000,000 series “D” shares, which represent 8.02% of the total outstanding equity of Coca-Cola FEMSA for an aggregate amount of Ps. 4,801 paid in cash. This acquisition increased FEMSA’s ownership stake in Coca-Cola FEMSA from 45.7% to 53.7% and its voting control from 53.6% to 63.0%. In accordance with Mexican FRS, as this transaction occurred between shareholders and did not impact the net assets of the Company, the payment in excess of the book value of the shares acquired of Ps. 1,609 was recorded in stockholders’ equity as a reduction of additional paid-in capital.
On November 8, 2007, Administración S.A.P.I. de C.V. (“Administración SAPI”), a Mexican company owned 50% by Coca-Cola FEMSA and 50% by The Coca-Cola Company, acquired 100% of Jugos del Valle, S.A.B. de C.V. (“Jugos del Valle”). Administración SAPI acquired 58,350,908 shares representing 100% of Jugos del Valle’s outstanding stock, for Ps. 4,020 paid in cash and assumed liabilities of Ps. 934. Administración SAPI is in the process of completing its purchase price allocation represented by the excess of the purchase price over the book value of Jugos del Valle.
Subsequent to the initial acquisition of Jugos del Valle by Administración SAPI, Coca-Cola FEMSA offered to sell 30% of its interest in Administración SAPI to other Coca-Cola bottlers. As of December 31, 2007, a majority of the Coca-Cola bottlers had accepted the offer, which the Company expects will close in 2008. As of December 31, 2007, Coca-Cola FEMSA has recorded an investment equivalent to 20% of the capital stock of Administración SAPI. This represents its investments in shares after the expected sale of the Coca-Cola bottlers of 30% as the remaining 20% of the shares of Administración SAPI, whose fair value of Ps. 684 have been classified as investment in shares available for sale in the consolidated balance sheet.
During 2006, FEMSA Cerveza made certain business acquisitions that were accounted for underrecorded using the purchase method. The results of the operations acquired by FEMSA Cervezaoperations have been included in the consolidated financial statements since Coca-Cola FEMSA obtained control of acquired businesses. Therefore, the date of acquisition.consolidated income statements and the consolidated balance sheets are not comparable with periods before acquisition date. The 2006 statement of changes in financial position presentsconsolidated cash flows for the effectsyears ended December 31, 2009 and 2008 show the acquired operations net of the acquisitions and incorporation of such operations as a single line item within investing activities.
The companies acquired by FEMSA Cerveza are:cash related to those acquisitions. In 2010 the Company did not have any significant business combinations.
| i) | On |
The estimated fair value of the Brisa net assets acquired by Coca-Cola FEMSA is as follows:
| Production related property and equipment, at fair value | Ps. 95 | |||
Distribution rights, at fair value, with an indefinite life | 635 | |||
Net assets acquired / purchase price | Ps. 730 | |||
The results of operation of Brisa for the period from the acquisition through December 31, 2009 were not material to our consolidated results of operations.
| ii) | On July 17, 2008, Coca-Cola FEMSA acquired certain assets of Agua De Los Ángeles, which sells and distributes water within Mexico Valley, for Ps. |
On December 18, 2006, FEMSA Cerveza indirectly acquired Molson Coors’ remaining 14.95% stake in Kaiser and paid Ps. 175 in cash. In accordance with Mexican FRS, this purchase was accounted for as an equity transaction as it took place between Kaiser’s existing shareholders.
Additionally, FEMSA made an equity contribution of Ps. 2,237 on December 22, 2006 to Kaiser. Heineken NV, the other Kaiser shareholder, did not participate in this equity contribution, and as a result its stake in Kaiser was diluted from 17.05% to 0.17%.
On August 31, 2007, FEMSA Cerveza sold 5,308,799,804 common shares of Kaiser to Heineken NV, representing 16.88% of its outstanding shares for Ps. 399. FEMSA Cerveza recognized a gain on the sale of Ps. 55, which for purposes of Mexican FRS was recorded in stockholders’ equity as the transaction occurred between Kaiser’s existing shareholders.
FEMSA Cerveza identified and recorded intangible assets with indefinite lives consisting of trademarks valued at Ps. 758 and goodwill of Ps. 4,044 based on the purchase price allocation.
As of December 31, 2007, FEMSA Cerveza’s ownership interest in Kaiser’s represents 82.95% of its outstanding equity.
The estimated fair value of the REMIL net assets acquired by Coca-Cola FEMSA is as follows:
Total current assets | Ps. | 881 | ||
Total long-term assets | 1,902 | |||
Distribution rights | 2,242 | |||
Total current liabilities | 1,152 | |||
Total long-term liabilities | 814 | |||
Total liabilities | 1,966 | |||
Net assets acquired | Ps. | 3,059 | ||
As of December 31, 2008, Coca-Cola FEMSA has recognized a loss of Ps. 45 as part of the income statement of Coca-Cola FEMSA related to REMIL’s results after its acquisition.
| iv) | On January 21, 2008, a reorganization of the |
| v) | Unaudited Pro Forma Financial Data. |
The results of operation of Brisa for the years ended December 31, 2009 and 2008 were not material to the Company’s consolidated results of operations for those periods. Accordingly, pro forma 2009 and 2008 financial data considering the acquisition of Brisa as of January 1, 2008 has not been presented herein.
| b) | Disposals: |
| i) | On September 23, 2010, the Company disposed of its subsidiary Promotora de Marcas Nacionales, S.A. de C.V. for which received a payment of Ps.1, 002 from The Coca-Cola Company. The recognized gain of Ps. 845 as a sale of shares within other expenses which is the difference between the fair value of the consideration received and the book value of the net assets disposed. |
| ii) | On December 31, 2010, the Company disposed of its subsidiary Graforegia, S.A. de C.V for which received a payment of Ps. 1,021. The Company recognized a gain of Ps. 665, as a sale of shares within other expenses, which is the difference between the fair value of the consideration received and the book value of the net assets disposed. |
Note 6.7. Accounts Receivable.
| 2007 | 2006 | |||||||
Trade | Ps. | 6,841 | Ps. | 6,783 | ||||
Allowance for doubtful accounts | (657 | ) | (586 | ) | ||||
The Coca-Cola Company | 719 | 197 | ||||||
Notes receivable | 546 | 399 | ||||||
Administración SAPI(1) | 523 | — | ||||||
Molson Coors (see Note 5 c) | 228 | 187 | ||||||
Insurance claims | 216 | 63 | ||||||
Loans to employees | 63 | 50 | ||||||
Travel advances to employees | 57 | 50 | ||||||
Guarantee deposits | 45 | 40 | ||||||
Other | 748 | 564 | ||||||
| Ps. | 9,329 | Ps. | 7,747 | |||||
| 2010 | 2009 | |||||||
Trade | Ps. 5,739 | Ps. 5,162 | ||||||
Allowance for doubtful accounts | (249 | ) | (246 | ) | ||||
The Coca-Cola Company | 1,030 | 1,034 | ||||||
Notes receivable | 402 | 302 | ||||||
Loans to employees | 111 | 104 | ||||||
Travel advances to employees | 51 | 62 | ||||||
Other | 618 | 473 | ||||||
| Ps. 7,702 | Ps. 6,891 | |||||||
The changes in the allowance for doubtful accounts are as follows:
| 2007 | 2006 | 2005 | 2010 | 2009 | 2008 | |||||||||||||||||||
Opening balance | Ps. | 586 | Ps. | 519 | Ps. | 505 | Ps. 246 | Ps. 206 | Ps. 170 | |||||||||||||||
Provision for the year | 195 | 220 | 203 | 113 | 91 | 194 | ||||||||||||||||||
Write-off of uncollectible accounts | (98 | ) | (131 | ) | (170 | ) | (100 | ) | (76 | ) | (157 | ) | ||||||||||||
Restatement of the initial balance | (26 | ) | (22 | ) | (19 | ) | ||||||||||||||||||
Translation of foreign currency effect | (10 | ) | 25 | (1 | ) | |||||||||||||||||||
Ending balance | Ps. | 657 | Ps. | 586 | Ps. | 519 | Ps. 249 | Ps. 246 | Ps. 206 | |||||||||||||||
Note 7.8. Inventories.
| 2007 | 2006 | |||||
Finished products | Ps. 4,585 | Ps.4,069 | ||||
Raw materials | 4,305 | 3,692 | ||||
Spare parts | 720 | 645 | ||||
Work in process | 309 | 299 | ||||
Advances to suppliers | 234 | 138 | ||||
Advertising and promotional materials | 4 | 5 | ||||
Allowance for obsolescence | (120 | ) | (144 | ) | ||
| Ps.10,037 | Ps.8,704 | |||||
Finished products Raw materials Spare parts Advances to suppliers Work in process Allowance for obsolescence 2010 2009 Ps. 7,437 Ps. 6,065 3,164 3,020 710 645 187 276 60 70 (111 ) (81 ) Ps. 11,447 Ps. 9,995
Note 8.9. Other Current Assets.
| 2007 | 2006 | 2010 | 2009 | |||||||||
Long-lived assets available for sale | Ps. 125 | Ps. 326 | ||||||||||
Advertising and deferred promotional expenses | Ps. 385 | Ps. 398 | 207 | 204 | ||||||||
Advances to services suppliers | 154 | 253 | ||||||||||
Prepaid leases | 84 | 79 | ||||||||||
Agreements with customers | 85 | 96 | ||||||||||
Derivative financial instruments | 266 | 241 | 24 | 26 | ||||||||
Restricted cash | 238 | 306 | ||||||||||
Prepaid leases | 155 | 133 | ||||||||||
Advances to suppliers | 64 | 69 | ||||||||||
Agreements with customers | 52 | 86 | ||||||||||
Short-term licenses | 28 | 5 | 24 | 12 | ||||||||
Prepaid insurance | 26 | 23 | 31 | 24 | ||||||||
Financing receivables(1) | — | 171 | ||||||||||
Other | 66 | 10 | 171 | 74 | ||||||||
| Ps.1,280 | Ps.1,271 | Ps. 905 | Ps. 1,265 | |||||||||
| (1) | Represents the current portion of financing receivables between FEMSA Holding and Cervecería Cuauhtémoc Moctezuma, S.A. de C.V. which was a subsidiary of FEMSA Cerveza before exchange of FEMSA Cerveza, financing receivables were eliminated as part of consolidation (see Note 2). |
The advertising and deferred promotional expenses recorded in the consolidated income statements for the years ended December 31, 2007, 20062010, 2009 and 20052008 amounted to Ps. 5,455,4,406 Ps. 5,1233,629 and Ps. 3,613,2,600, respectively.
Note 9.10. Investments in Shares.
Company | Ownership | 2007 | 2006 | ||||||
FEMSA Cerveza: | |||||||||
Affiliated companies of FEMSA Cerveza(1) | Various | Ps. | 220 | Ps. | 212 | ||||
Río Blanco Trust (waste water treatment plant)(1) | 19.14 | % | 72 | 77 | |||||
Affiliated companies of Kaiser(2) | Various | 20 | 21 | ||||||
Other(2) | Various | 13 | 14 | ||||||
Coca-Cola FEMSA: | |||||||||
Administración SAPI(1) | 20.00 | % | 978 | — | |||||
Industria Envasadora de Querétaro, S.A. de C.V. (“IEQSA”)(1) | 23.11 | % | 115 | 112 | |||||
Holdfab Partiçipações, LTDA(2) | 11.05 | % | 113 | — | |||||
Industria Mexicana de Reciclaje, S.A. de C.V.(1) | 35.00 | % | 76 | 83 | |||||
KSP Partiçipações, S.A.(1) | 38.74 | % | 69 | 120 | |||||
Beta San Miguel, S.A. de C.V. (“Beta San Miguel”)(2) | 2.54 | % | 69 | 69 | |||||
Compañía de Servicios de Bebidas Refrescantes S.A. de C.V. (“Salesko”)(1) | 26.00 | % | 51 | 18 | |||||
Complejo Industrial Can, S.A. (“CICAN”)(1) (3) | 100.00 | % | — | 40 | |||||
Other(2) | Various | 5 | 6 | ||||||
Other investments(2) | Various | 62 | 52 | ||||||
| Ps. | 1,863 | Ps. | 824 | ||||||
Accounting method:
Company | %Ownership | 2010 | 2009 | |||||||||
Heineken Group(1) | 20.00% | (2) | 66,478 | — | ||||||||
Coca-Cola FEMSA: | ||||||||||||
Jugos del Valle, S.A.P.I. de C.V.(1) | 19.79% | Ps. 603 | Ps. 1,162 | |||||||||
Sucos del Valle Do Brasil, LTDA(1) | 19.89% | 340 | 325 | |||||||||
Mais Industria de Alimentos, LTDA(1) | 19.89% | 474 | 289 | |||||||||
Holdfab2, LTDA(1) | 27.69% | 300 | — | |||||||||
Industria Envasadora de Querétaro, S.A. de C.V. (“IEQSA”)(1) | 13.45% | 67 | 78 | |||||||||
Industria Mexicana de Reciclaje, S.A. de C.V.(1) | 35.00% | 69 | 76 | |||||||||
Estancia Hidromineral Itabirito, LTDA(1) | 50.00% | 87 | 76 | |||||||||
Beta San Miguel, S.A. de C.V. (“Beta San Miguel”)(3) | 2.54% | 69 | 69 | |||||||||
KSP Partiçipações, LTDA(1) | 38.74% | 93 | 88 | |||||||||
Other | Various | 6 | 7 | |||||||||
Other investments | Various | 207 | 38 | |||||||||
| Ps. 68,793 | Ps. 2,208 | |||||||||||
| (1) |
| (2) | As of December 31, 2010, comprised of 9.24% of Heineken, N.V., 14.94% of Heineken Holding, N.V., and 3.29% of the ASDI, which represents an economic interest of 20% in Heineken. |
| (3) | Acquisition cost. |
In August 2010, Coca-Cola FEMSA made an investment for approximately Ps. 295 (R$40 million) in Holdfab2 Participações Societárias, LTDA representing 27.69%. Holdfab2 has a 50% investment in Leao Junior, a tea producer company in Brazil.
During 2010, the shareholders of Jugos del Valle, including Coca-Cola FEMSA, agreed to spin-off the distribution rights. This distribution resulted in a decrease of Coca-Cola FEMSA’s investment in shares of Ps. 735 and an increase to its intangible assets (distribution rights of a separate legal entity) for the same amount.
As of December 31, 2010, the Company owns an economic interest of 20% of Heineken Group (see Note 2). Heineken’s main activities are the production, distribution and marketing of beer worldwide. The Company recognized an equity income of Ps. 3,319 regarding to its interest in Heineken, for the period from May 1, 2010 to December 31, 2010.
The following is some relevant financial information from Heineken as of December 31, 2010 and the condensated results for the full year as of December 31, 2010:
In millions of Euros | 2010 | |||
Current assets | 4,318 | |||
Long-term assets | 22,231 | |||
Total assets | 26,549 | |||
Current liabilities | 5,623 | |||
Long-term liabilities | 10,409 | |||
Total liabilities | 16,032 | |||
Total stockholders’ equity | 10,517 | |||
In millions of Euros | 2010 | |||
Total revenues and other income | 16,372 | |||
Total expenses | (14,089 | ) | ||
Results from operating activities | 2,283 | |||
Profit before income tax | 1,967 | |||
Income tax | (399 | ) | ||
Profit | 1,568 | |||
Profit attributable to equity holders of the company | 1,436 | |||
Total comprehensive income | 2,030 | |||
Total comprehensive income attributable to equity holders of the company | 1,883 | |||
As of December 31, 2010 fair value of FEMSA’s investment in Heineken N.V. Holding and Heineken N.V. represented by shares equivalent to 20% of its outstanding shares amounted to Ps. 66,980 based on quoted market prices of that date.
Note 10.11. Property, Plant and Equipment.
| 2007 | 2006 | 2010 | 2009 | |||||||||||||
Land | Ps. | 7,137 | Ps. | 6,755 | Ps. 5,226 | Ps. 5,412 | ||||||||||
Buildings, machinery and equipment | 83,633 | 81,581 | 51,003 | 51,645 | ||||||||||||
Accumulated depreciation | (42,330 | ) | (41,120 | ) | (24,041 | ) | (25,538 | ) | ||||||||
Refrigeration equipment | 9,343 | 9,497 | 9,829 | 9,180 | ||||||||||||
Accumulated depreciation | (6,847 | ) | (7,246 | ) | (5,849 | ) | (6,016 | ) | ||||||||
Construction in progress | 3,110 | 2,574 | ||||||||||||||
Investment in fixed assets in progress (see Note 5 I) | 3,164 | 3,024 | ||||||||||||||
Long-lived assets stated at net realizable value | 562 | 796 | 232 | 330 | ||||||||||||
Other long-lived assets | 99 | 123 | 292 | 332 | ||||||||||||
| Ps. | 54,707 | Ps. | 52,960 | Ps. 39,856 | Ps. 38,369 | |||||||||||
As of December 31, 2010 and 2009, the Company has identified long-term assets investments of Ps. 1,929 and Ps. 845, respectively that are not ready for their intended use and met the definition of qualified assets for comprehensive financing result capitalization, which amounted to Ps. 66 and Ps. 55. As of December 31, 2008, the capitalization of the comprehensive financing result did not have a significant impact on the consolidated financial statements.
The changes in the carrying amount of the capitalized comprehensive financial result are as follows:
| 2010 | 2009 | |||||||
Beginning balance | Ps. 55 | Ps. — | ||||||
Capitalization of comprehensive financial result | 12 | 55 | ||||||
Amortization | (1 | ) | — | |||||
Ending balance | Ps. 66 | Ps. 55 | ||||||
The Company has identified certain long-lived assets that are not strategic to the current and future operations of the business and are available for sale,not being used, comprised of land, buildings and equipment, in accordance with an approved program for the disposal of certain investments. Such long-lived assets which are not in use, have been recorded at their estimated net realizable value without exceeding their restated acquisition cost, as follows:
| 2007 | 2006 | 2010 | 2009 | |||||||||||
FEMSA and others subsidiaries | Ps. | 250 | Ps. | 307 | ||||||||||
FEMSA Cerveza | 218 | 293 | ||||||||||||
Coca-Cola FEMSA | 94 | 196 | Ps. | 189 | Ps. | 288 | ||||||||
Other subsidiaries | 43 | 42 | ||||||||||||
| Ps. | 562 | Ps. | 796 | Ps. | 232 | Ps. | 330 | |||||||
Buildings | Ps. | 64 | Ps. | 88 | ||||||||||
Land | Ps. | 360 | Ps. | 535 | 139 | 60 | ||||||||
Buildings | 202 | 229 | ||||||||||||
Equipment | — | 32 | 29 | 182 | ||||||||||
| Ps. | 562 | Ps. | 796 | Ps. | 232 | Ps. | 330 | |||||||
As a result of selling certain not strategic long-lived assets, the Company recognized a loss of Ps. 41, gains of Ps. 1276 and Ps. 22 and a loss of Ps. 1 for the years ended December 31, 2007, 20062010, 2009 and 2005,2008, respectively.
Long-lived assets that are available for sale have been reclassified from property, plant and equipment to other current assets. As of December 31, 2010 and 2009, long-lived assets available for sale amounted to Ps. 125 and Ps. 326 (see Note 9).
Note 11.12. Intangible Assets.
| 2007 | 2006 | 2010 | 2009 | |||||||||||
Unamortized intangible assets: | ||||||||||||||
Coca-Cola FEMSA: | ||||||||||||||
Rights to produce and distribute Coca-Cola trademark products | Ps. | 42,225 | Ps. | 40,838 | Ps. | 49,169 | Ps. | 49,520 | ||||||
FEMSA Cerveza: | ||||||||||||||
Trademarks and distribution rights | 11,299 | 11,299 | ||||||||||||
Goodwill | 4,044 | 3,302 | ||||||||||||
Kaiser trademarks | 758 | 545 | ||||||||||||
Other | 285 | 285 | ||||||||||||
Other unamortized intangible assets | 462 | 623 | ||||||||||||
Other unamortized intangible assets | 499 | 489 | ||||||||||||
| Ps. | 49,631 | Ps. | 50,143 | |||||||||||
Amortized intangible assets: | ||||||||||||||
Cost of systems implementation | 589 | 733 | ||||||||||||
Start-up expenses | 398 | 257 | ||||||||||||
Systems in development costs | Ps. | 1,898 | Ps. | 1,188 | ||||||||||
Technology costs and management systems | 286 | 310 | ||||||||||||
Alcohol licenses (see Note 5 K) | 410 | 223 | ||||||||||||
Other | 137 | 158 | 115 | 128 | ||||||||||
| Ps. | 60,234 | Ps. | 57,906 | Ps. | 2,709 | Ps. | 1,849 | |||||||
Total intangible assets | Ps. | 52,340 | Ps. | 51,992 | ||||||||||
The changes in the carrying amount of unamortized intangible assets are as follows:
| 2010 | 2009 | |||||||
Beginning balance | Ps. | 50,143 | Ps. | 47,514 | ||||
Acquisitions | 833 | 698 | ||||||
Cancellations | (151 | ) | — | |||||
Impairment | (10 | ) | — | |||||
Translation and restatement of foreign currency effect | (1,184 | ) | 1,931 | |||||
Ending balance | Ps. | 49,631 | Ps. | 50,143 | ||||
The changes in the carrying amount of amortized intangible assets are as follows:
| Investments | Amortization | |||||||||||||||||||
| Accumulated at the Beginning of the Year | Additions | Accumulated at the Beginning of the Year | For the Year | Total | Estimated Amortization Per Year | |||||||||||||||
2007 | ||||||||||||||||||||
Cost of systems implementation | Ps. | 1,892 | Ps. | 201 | Ps. | (1,159 | ) | Ps. | (345 | ) | Ps. | 589 | Ps. | 251 | ||||||
Start-up expenses | 364 | 189 | (107 | ) | (48 | ) | 398 | 52 | ||||||||||||
2006 | ||||||||||||||||||||
Cost of systems implementation | Ps. | 1,578 | Ps. | 314 | Ps. | (763 | ) | Ps. | (396 | ) | Ps. | 733 | ||||||||
Start-up expenses | 330 | 34 | (78 | ) | (29 | ) | 257 | |||||||||||||
| Investments | Amortization | |||||||||||||||||||
| Accumulated at the Beginning of the Year | Additions | Accumulated at the Beginning of the Year | For the Year | Total | ||||||||||||||||
2010 | ||||||||||||||||||||
Systems in development costs | Ps. | 1,188 | Ps. 751 | Ps. | — | Ps. | (41) | Ps. | 1,898 | |||||||||||
Technology costs and management systems | 1,327 | 76 | (1,017 | ) | (100 | ) | 286 | |||||||||||||
Alcohol licenses(1) | 271 | 224 | (48 | ) | (37 | ) | 410 | |||||||||||||
2009 | ||||||||||||||||||||
Systems in development costs | Ps | 333 | Ps. 855 | Ps. | — | Ps. | — | Ps. | 1,188 | |||||||||||
Technology costs and management systems | 968 | 359 | (667 | ) | (350 | ) | 310 | |||||||||||||
Alcohol licenses(1) | 169 | 102 | (31 | ) | (17 | ) | 223 | |||||||||||||
2008 | ||||||||||||||||||||
Systems in development costs | Ps. | — | Ps. 333 | Ps. | — | Ps. | — | Ps. | 333 | |||||||||||
Technology costs and management systems | 853 | 115 | (521 | ) | (146 | ) | 301 | |||||||||||||
Alcohol licenses(1) | 110 | 59 | (23 | ) | (8 | ) | 138 | |||||||||||||
| (1) | See Note 5 K. |
The estimated amortization for intangible assets of definite life is as follows:
| 2011 | 2012 | 2013 | 2014 | 2015 | ||||||||||||||||
Systems amortization | Ps. 347 | Ps. 346 | Ps. 302 | Ps. 276 | Ps. 267 | |||||||||||||||
Alcohol licenses | 33 | 43 | 56 | 73 | 95 | |||||||||||||||
Others | 25 | 40 | 32 | 26 | 22 | |||||||||||||||
Note 12.13. Other Assets.
| 2007 | 2006 | 2010 | 2009 | |||||||||||
Leasehold improvements-net | Ps. | 4,352 | Ps. | 3,642 | Ps. 5,261 | Ps. 4,401 | ||||||||
Agreements with customers | 3,786 | 3,392 | ||||||||||||
Additional labor liabilities (see Note 15) | 948 | 1,287 | ||||||||||||
Long-term licenses | 411 | 182 | ||||||||||||
Agreements with customers (see Note 5 J) | 186 | 260 | ||||||||||||
Derivative financial instruments | 708 | 481 | ||||||||||||
Guarantee deposits | 897 | 859 | ||||||||||||
Long-term accounts receivable | 383 | 380 | 371 | 214 | ||||||||||
Advertising and promotional expenses | 212 | 123 | 125 | 106 | ||||||||||
Long-term financing receivables(1) | — | 12,209 | ||||||||||||
Other | 1,025 | 872 | 955 | 835 | ||||||||||
| Ps. | 11,117 | Ps. | 9,878 | Ps. 8,503 | Ps. 19,365 | |||||||||
| (1) | Represents financing between FEMSA Holding and Cervecería Cuauthemoc Moctezuma, S.A. de C.V. Before exchange of FEMSA Cerveza, financing receivables were eliminated as part of consolidation (see Note 2). |
Long-term accounts receivables are comprised of Ps. 337 and Ps. 34 of principal and interests, and are expected to be collected as follows:
2011 | Ps. | 7 | ||
2012 | 72 | |||
2013 | 93 | |||
2014 | 197 | |||
2015 and thereafter | 2 | |||
| Ps. | 371 | |||
Note 13.14. Balances and Transactions with Related Parties and Affiliated Companies.
On January 1, 2007, NIF C-13, “Related Parties,” went into effect. This standard broadens the concept of “related parties” to include:Balances and transactions with related parties and affiliated companies include consideration of: a) the overall business in which the reporting entity participates; b) close family members of key officers; and c) any fund created in connection with a labor related compensation plan. Additionally, NIF C-13 requires
On April 30, 2010, the Company lost control over FEMSA Cerveza which became a subsidiary of Heineken Group. As a result, balances and transactions with Heineken Group and subsidiaries are presented since that entities provide comparative disclosures indate as balances and transactions with related parties. Balances and transactions prior to that date are not disclosed because they were not transactions between related parties of the notes to the financial statements.Company.
The consolidated balance sheets and income statements include the following balances and transactions with related parties and affiliated companies:
Balances | 2007 | 2006 | ||||
Due from The Coca-Cola Company | Ps. | 719 | Ps. | 197 | ||
Other receivables | 1,284 | 961 | ||||
Due to BBVA Bancomer, S.A. de C.V. | 1,712 | 1,776 | ||||
Due to The Coca-Cola Company | 3,401 | 2,546 | ||||
Due to British American Tobacco México | 191 | 100 | ||||
Other payables | 327 | 1,632 | ||||
Transactions Income: Sales of cans and aluminum lids to Promotora Mexicana de Embotelladores, S.A. de C.V.(1) Logistic services to Grupo Industrial Saltillo, S.A. de C.V.(1) Sale of Grupo Inmobiliario San Agustín, S.A. de C.V. shares to Instituto Tecnológico y de Estudios Superiores de Monterrey, A.C.(1) Interest income from BBVA Bancomer, S.A. de C.V.(1) Sales of non-carbonated soft-drinks to Salesko(1) Other revenues from affiliated companies Expenses: Purchase of concentrate from The Coca-Cola Company Purchase of baked goods and snacks from Grupo Bimbo, S.A.B. de C.V.(1) Purchase of cigarettes from British American Tobacco México(1) Advertisement expense paid to The Coca-Cola Company Purchase of sugar from Beta San Miguel Purchase of sugar, cans and aluminum lids from Promotora Mexicana de Embotelladores, S.A. de C.V. Purchase of canned products from IEQSA and CICAN(2) Interest expense paid to BBVA Bancomer S.A. de C.V.(1) Advertising services from Grupo Televisa, S.A.B.(1) Donations to Instituto Tecnológico y de Estudios Superiores de Monterrey, A.C. (1) Purchase of plastic bottles from Embotelladora del Atlántico, S.A. (formerly Complejo Industrial Pet, S.A.) (1) Donations to Difusión y Fomento Cultural, A.C.(1) Insurance premiums for policies with Grupo Nacional Provincial, S.A.B.(1) Interest expense paid to The Coca-Cola Company Interest expense paid to Grupo Financiero Banamex, S.A. de C.V.(1) Purchase of crown caps from Tapón Corona, S.A.(3) Balances Due from The Coca-Cola Company (see Note 5 M)(1) Balance with BBVA Bancomer, S.A. de C.V.(2) Due from Grupo Financiero Banamex, S.A. de C.V.(2) Due from Heineken Group(1) Other receivables(1) Due to BBVA Bancomer, S.A. de C.V.(3) Due to The Coca-Cola Company(4) Due to Grupo Financiero Banamex, S.A. de C.V.(3) Due to British American Tobacco México(4) Due to Heineken Group(4) Other payables(4) 2007 2006 2005 Ps. 1,121 Ps. 1,105 Ps. 1,003 242 288 255 37 — — 33 4 3 7 27 19 969 887 851 12,239 10,322 9,112 1,324 1,034 950 1,064 775 628 940 933 939 845 536 621 723 865 1,349 518 816 641 305 257 253 178 165 160 108 92 47 37 34 184 32 19 42 31 41 54 29 65 13 164 201 361 — — 144 2010 2009 Ps. 1,030 Ps. 1,034 2,944 4,474 2,103 — 425 — 295 58 999 4,112 1,911 2,405 500 500 287 186 1,463 — 210 345
| (1) |
| (2) | Recorded as part of |
| (3) | Recorded as part of |
| (4) | Recorded as part of |
Transactions Income: Logistic services to Heineken Group Administrative services to Heineken Group Logistic services to Grupo Industrial Saltillo, S.A. de C.V. Sales of Grupo Inmobiliario San Agustín, S.A. shares to Instituto Tecnológico y de Estudios Superiores de Monterrey, A.C. Other revenues from related parties Expenses: Purchase of concentrate from The Coca-Cola Company(1) Purchase of beer from Heineken Group(1) (2) Purchase of baked goods and snacks from Grupo Bimbo, S.A.B. de C.V.(2) Purchase of cigarettes from British American Tobacco México(2) Advertisement expense paid to The Coca-Cola Company(1) Purchase of juices from Jugos del Valle, S.A. de C.V.(1) (2) Interest expense and fees paid to BBVA Bancomer, S.A. de C.V. Purchase of sugar from Beta San Miguel(1) Purchase of sugar, cans and aluminum lids from Promotora Mexicana de Embotelladores, S.A. de C.V.(1) Purchase of canned products from IEQSA(1) Advertising paid to Grupo Televisa, S.A.B. Interest expense paid to Grupo Financiero Banamex, S.A. de C.V. Insurance premiums for policies with Grupo Nacional Provincial, S.A.B. Donations to Instituto Tecnológico y de Estudios Superiores de Monterrey, A.C. Purchase of plastic bottles from Embotelladora del Atlántico, S.A. (formerly Complejo Industrial Pet, S.A.) (1) Donations to Difusión y Fomento Cultural, A.C. Interest expense paid to The Coca-Cola Company(1) Other expenses with related parties 2010 2009 2008 Ps. 706 Ps. — Ps. — 342 — — 241 234 252 62 64 66 42 22 9 19,371 16,863 13,518 7,063 — — 2,018 1,733 1,578 1,883 1,413 1,439 1,117 780 931 1,332 1,044 863 108 260 235 1,307 713 687 684 783 525 196 208 333 37 13 20 56 61 50 69 78 57 63 72 49 52 54 42 29 18 29 5 25 27 31 42 30
| (1) | These companies are related parties of our subsidiary Coca-Cola FEMSA. |
| (2) |
The benefits and aggregate compensation paid to executive officers and senior management of FEMSA and its subsidiaries were as follows:
| 2007 | 2006 | 2005 | 2010 | 2009 | 2008 | ||||||||||||||||
Short- and long-term benefits paid | $ | 1,290 | $ | 1,098 | $ | 1,037 | Ps. 1,307 | Ps. 1,206 | Ps. 1,083 | ||||||||||||
Severance indemnities | 17 | 13 | 21 | 34 | 47 | 10 | |||||||||||||||
Postretirement benefits (service cost) | 29 | 31 | 22 | ||||||||||||||||||
Postretirement benefits (labor cost) | 83 | 23 | 23 | ||||||||||||||||||
Note 14.15. Balances and Transactions in Foreign Currencies.
Assets,According to NIF B-15, assets, liabilities and transactions denominated in foreign currencies otherare those realized in a currency different than the recording, functional currenciesor reporting currency of each reporting unit. As of the reporting unit, translated into U.S. dollarsend of and for the years ended December 31, 2010 and 2009, assets, liabilities and transactions denominated in foreign currencies, expressed in Mexican pesos are as follows:
Balances | Applicable Exchange Rate (1) | Short-Term | Long-Term | Total | |||||||||
| 2007 | Assets | 10.8662 | $ | 196 | $ | 21 | $ | 217 | |||||
| Liabilities | 420 | 549 | 969 | ||||||||||
| 2006 | Assets | 10.8755 | $ | 107 | $ | 16 | $ | 123 | |||||
| Liabilities | 385 | 585 | 970 | ||||||||||
Transactions | 2007 | 2006 | 2005 | ||||||
Revenues | $ | 463 | $ | 390 | $ | 361 | |||
Expenses: | |||||||||
Purchases of raw materials | 708 | 574 | 468 | ||||||
Interest expense | 155 | 159 | 139 | ||||||
Export expenses | 95 | 74 | 65 | ||||||
Technical assistance fees | 13 | 12 | 5 | ||||||
Suppliers | 47 | 38 | 25 | ||||||
Other | 107 | 75 | 59 | ||||||
| $ | 1,125 | $ | 932 | $ | 761 | ||||
| 2010 | 2009 | |||||||||||||||||||||||
| U.S. Dollars | Other Currencies | Total | U.S. Dollars | Other Currencies | Total | |||||||||||||||||||
Assets: | ||||||||||||||||||||||||
Short-term | Ps. | 11,761 | Ps. | 480 | Ps. | 12,241 | Ps. 6,186 | Ps. — | Ps. 6,186 | |||||||||||||||
Long-term | 321 | — | 321 | 263 | — | 263 | ||||||||||||||||||
Liabilities: | ||||||||||||||||||||||||
Short-term | 1,501 | 247 | 1,748 | 1,562 | 17 | 1,579 | ||||||||||||||||||
Long-term | 6,962 | — | 6,962 | 2,878 | — | 2,878 | ||||||||||||||||||
Transactions | U.S. Dollars | Other Currencies | Total | U.S. Dollars | Other Currencies | Total | ||||||||||||||||||
Total revenues | Ps. | 1,111 | Ps. | — | Ps. | 1,111 | Ps. 1,128 | Ps. — | Ps. 1,128 | |||||||||||||||
Expenses and investments: | ||||||||||||||||||||||||
Purchases of raw materials | 5,648 | — | 5,648 | 7,300 | — | 7,300 | ||||||||||||||||||
Interest expense | 13 | — | 13 | 149 | — | 149 | ||||||||||||||||||
Consulting fees | 452 | 24 | 476 | 101 | — | 101 | ||||||||||||||||||
Assets acquisitions | 311 | — | 311 | 183 | 12 | 195 | ||||||||||||||||||
Other | 804 | 3 | 807 | 721 | — | 721 | ||||||||||||||||||
| Ps. | 7,228 | Ps. | 27 | Ps. | 7,255 | Ps. 8,454 | Ps. 12 | Ps. 8,466 | ||||||||||||||||
As of February 18, 2008, theJune 27, 2011, issuance date of these consolidated financial statements, the exchange rate published by “Banco de México” was 10.7413Ps.11.8816 Mexican pesos per one U.S. dollar,Dollar, and the Company’s foreign currency position was similar to that as of December 31, 2007.2010.
Note 15.16. Labor Liabilities.
In 2007, FEMSA Cerveza approved a plan to allow certain qualifying personnel to early retire beginningThe Company has various labor liabilities in 2008. This plan consisted in the following: (i) allowed personnelconnection with more than 55 years of age and 20 years ofpension, seniority, to take advantage of the earlypost retirement in order to obtain the same pension benefits as if they had retired at their regular retirement age, and (ii) to pay severance indemnities to some employees that do not meet certain characteristics defined by the Company. This plan is intended to improve the efficiency of FEMSA Cerveza’s operating structure. The financial impact of this plan was Ps. 125 and was accounted for as an amendment and recorded in the consolidated results of the Company as part of other expenses (see Note 18).
In December 2006, the Company approved a modification of its pension and retirement plans effective in 2007. Through December 2006, the Company’s pension and retirement plans provided for lifetime monthly payment as a complement to the pension payment received from the Mexican Social Security Institute (Instituto Mexicano del Seguro Social or “IMSS”). The modified pension and retirement plans, provide for one a lump-sum benefit payment, in addition to the pension benefits received from the IMSS, which will supplement the beneficiary’s earnings.
Additionally, FEMSA modified the long-term assumptions used in the actuarial calculations for its Mexican subsidiaries in 2006. The discount rate was reduced from 6.0% to 4.5% based on changes in the Company’s revised estimate of current prices for settling its related obligations as a result of recent stability reflected by the Mexican economy. The expected salary increase was reduced from 2.0% to 1.5% based on changes in the estimated future compensation of its Mexican employees. The expected return on plan assets was reduced from 6.0% to 4.5% based on returns currently being earned by plan assets and the rates of return expected to be available for reinvestment in the future.
The net effect in 2006 of the changes mentioned above was an increase in pension and retirement plan, seniority premiummedical and severance indemnity liabilities of Ps. 797, Ps. 19 and Ps. 23, respectively. These changes were accounted as an unrecognized prior service costs and unrecognized actuarial net losses, which will be amortized over the expected service period of the Company’s personnel.
| a) | Assumptions: |
The Company annually evaluates the reasonableness of the assumptions used in its labor liabilities computations. Actuarial calculations for pension and retirement plans, seniority premiums, postretirement medical services and severance indemnity liabilities, as well as the cost for the year,period, were determined in 2007 using the following long-term assumptions:
| Nominal Rates(1) | Real Rates(2) | |||||||||||||||||||||||||
| 2010 | 2009 | 2008 | 2010 | 2009 | 2008 | |||||||||||||||||||||
Annual discount rate | 7.6 | % | 8.2 | % | 8.2 | % | 4.0 | % | 4.5 | % | 4.5 | % | ||||||||||||||
Salary increase | 4.8 | % | 5.1 | % | 5.1 | % | 1.2 | % | 1.5 | % | 1.5 | % | ||||||||||||||
Return on assets | 8.2 | % | 8.2 | % | 11.3 | % | 3.6 | % | 4.5 | % | 4.5 | % | ||||||||||||||
Measurement date: December 2010 | ||||||||||||||||||||||||||
| (1) | For non-inflationary economies. |
| |||
| |||
| |||
| For inflationary economies. |
The basis for the determination of the long-term rate of return is supported by a historical analysis of average returns in real terms for the last 30 years of the Certificados de Tesorería del Gobierno Federal (Mexican Federal Government Treasury Certificates) for Mexican investments, treasury bonds of each country for other investments and the expected rates of return of long-term returns of the actual investments of the Company.
The annual growth rate for health care expenses is 1.5%5.1% in realnominal terms, consistent with the historical average health care expense rate for the past 30 years. Such rate is expected to remain consistent for the foreseeable future.
Based on these assumptions, the expected benefits to be paid in the following years are as follows:
| Pension and Retirement Plans | Seniority Premiums | Postretirement Medical Services | Severance Indemnities | |||||||||
2008 | Ps. | 467 | Ps. | 17 | Ps. | 39 | Ps. | 116 | ||||
2009 | 334 | 16 | 40 | 86 | ||||||||
2010 | 263 | 17 | 41 | 81 | ||||||||
2011 | 387 | 19 | 42 | 72 | ||||||||
2012 | 326 | 21 | 43 | 65 | ||||||||
2013 to 2017 | 1,554 | 140 | 324 | 214 | ||||||||
| Pension and Retirement Plans | Seniority Premiums | Postretirement Medical Services | Severance Indemnities | |||||||||||||
2011 | Ps. 390 | Ps. 11 | Ps. 12 | Ps. 104 | ||||||||||||
2012 | 163 | 10 | 11 | 83 | ||||||||||||
2013 | 190 | 10 | 11 | 76 | ||||||||||||
2014 | 190 | 12 | 11 | 73 | ||||||||||||
2015 | 197 | 13 | 11 | 69 | ||||||||||||
2016 to 2021 | 1,181 | 91 | 45 | 299 | ||||||||||||
| b) | Balances of the Liabilities: |
| 2007 | 2006 | |||||||
Pension and retirement plans: | ||||||||
Vested benefit obligation | Ps. | 2,373 | Ps. | 2,220 | ||||
Non-vested benefit obligation | 2,797 | 2,595 | ||||||
Accumulated benefit obligation | 5,170 | 4,815 | ||||||
Excess of projected benefit obligation over accumulated benefit obligation | 422 | 528 | ||||||
Projected benefit obligation | 5,592 | 5,343 | ||||||
Pension plan funds at fair value | (2,806 | ) | (2,779 | ) | ||||
Unfunded projected benefit obligation | 2,786 | 2,564 | ||||||
Unrecognized net transition obligation | (170 | ) | (213 | ) | ||||
Unrecognized prior service costs | (1,007 | ) | (1,067 | ) | ||||
Unrecognized actuarial net gain | 38 | 16 | ||||||
| 1,647 | 1,300 | |||||||
Additional labor liability | 915 | 930 | ||||||
Total | 2,562 | 2,230 | ||||||
Seniority premiums: | ||||||||
Vested benefit obligation | 91 | 115 | ||||||
Non-vested benefit obligation | 137 | 105 | ||||||
Accumulated benefit obligation | 228 | 220 | ||||||
Excess of projected benefit obligation over accumulated benefit obligation | 25 | 25 | ||||||
Unfunded projected benefit obligation | 253 | 245 | ||||||
Unrecognized net transition obligation | (9 | ) | (10 | ) | ||||
Unrecognized actuarial net loss | (57 | ) | (51 | ) | ||||
| 187 | 184 | |||||||
Additional labor liability | 60 | 57 | ||||||
Total | 247 | 241 | ||||||
Postretirement medical services: | ||||||||
Vested benefit obligation | 295 | 312 | ||||||
Non-vested benefit obligation | 447 | 419 | ||||||
Accumulated benefit obligation | 742 | 731 | ||||||
Medical services funds at fair value | (96 | ) | (105 | ) | ||||
Unfunded accumulated benefit obligation | 646 | 626 | ||||||
Unrecognized net transition obligation | (39 | ) | (43 | ) | ||||
Unrecognized actuarial net loss | (306 | ) | (334 | ) | ||||
Total | 301 | 249 | ||||||
Severance indemnities: | ||||||||
Accumulated benefit obligation | 609 | 546 | ||||||
Excess of projected benefit obligation over accumulated benefit obligation | 38 | 42 | ||||||
Projected benefit obligation | 647 | 588 | ||||||
Unrecognized net transition obligation | (450 | ) | (486 | ) | ||||
Unrecognized actuarial net loss | (124 | ) | (36 | ) | ||||
| 73 | 66 | |||||||
Additional labor liability | 535 | 483 | ||||||
Total | 608 | 549 | ||||||
Total labor liabilities | Ps. | 3,718 | Ps. | 3,269 | ||||
| 2010 | 2009 | |||||||
Pension and Retirement Plans: | ||||||||
Vested benefit obligation | Ps. | 1,461 | Ps. | 1,146 | ||||
Non-vested benefit obligation | 1,080 | 875 | ||||||
Accumulated benefit obligation | 2,541 | 2,021 | ||||||
Excess of projected benefit obligation over accumulated benefit obligation | 757 | 591 | ||||||
Defined benefit obligation | 3,298 | 2,612 | ||||||
Pension plan funds at fair value | (1,501 | ) | (1,144 | ) | ||||
Unfunded defined benefit obligation | 1,797 | 1,468 | ||||||
Labor cost of past services(1) | (349 | ) | (365 | ) | ||||
Unrecognized actuarial (loss) gain, net | (272 | ) | 72 | |||||
Total | Ps. | 1,176 | Ps. | 1,175 | ||||
Seniority Premiums: | ||||||||
Vested benefit obligation | Ps. | 12 | Ps. | 3 | ||||
Non-vested benefit obligation | 93 | 98 | ||||||
Accumulated benefit obligation | 105 | 101 | ||||||
Excess of projected benefit obligation over accumulated benefit obligation | 49 | 65 | ||||||
Unfunded defined benefit obligation | 154 | 166 | ||||||
Unrecognized actuarial gain (loss), net | 17 | (17 | ) | |||||
Total | Ps. | 171 | Ps. | 149 | ||||
Postretirement Medical Services: | ||||||||
Vested benefit obligation | Ps. | 119 | Ps. | 94 | ||||
Non-vested benefit obligation | 112 | 97 | ||||||
Defined benefit obligation | 231 | 191 | ||||||
Medical services funds at fair value | (43 | ) | (39 | ) | ||||
Unfunded defined benefit obligation | 188 | 152 | ||||||
Labor cost of past services(1) | (4 | ) | (6 | ) | ||||
Unrecognized actuarial (loss), net | (102 | ) | (81 | ) | ||||
Total | Ps. | 82 | Ps. | 65 | ||||
Severance Indemnities: | ||||||||
Accumulated benefit obligation | Ps. | 462 | Ps. | 447 | ||||
Excess of projected benefit obligation over accumulated benefit obligation | 91 | 88 | ||||||
Defined benefit obligation | 553 | 535 | ||||||
Labor cost of past services(1) | (99 | ) | (148 | ) | ||||
Total | Ps. | 454 | Ps. | 387 | ||||
Total labor liabilities | Ps. | 1,883 | Ps. | 1,776 | ||||
| (1) | Unrecognized net transition obligation and unrecognized prior service costs. |
The accumulated actuarial gains and losses were generated by the differences in the assumptions used for the actuarial calculations at the beginning of the year versus the actual behavior of those variables at the end of the current year.
The projected benefit obligation in some of the Company’s subsidiaries was less than the accumulated benefit obligation reduced by the amount of the plan assets at fair value, resulting in an additional liability, which was recorded in other assets up to an amount of the unrecognized net transition obligation and prior service costs (see Note 12) and the difference was recorded in cumulative other comprehensive income.
| c) | Trust Assets: |
Trust assets consist of fixed and variable return financial instruments recorded at market value. The trust assets are invested as follows:
| 2007 | 2006 | |||||
Fixed Return: | ||||||
Traded securities | 22 | % | 25 | % | ||
Bank instruments | 17 | % | 20 | % | ||
Federal government instruments | 31 | % | 31 | % | ||
Variable Return: | ||||||
Publicly traded | 30 | % | 24 | % | ||
| 100 | % | 100 | % | |||
| 2010 | 2009 | |||||||
Fixed return: | ||||||||
Publicly traded securities | 10 | % | 10 | % | ||||
Bank instruments | 8 | % | 5 | % | ||||
Federal government instruments | 60 | % | 65 | % | ||||
Variable return: | ||||||||
Publicly traded shares | 22 | % | 20 | % | ||||
| 100 | % | 100 | % | |||||
The Company has a policy of maintaining at least 30% of the trust assets in Mexican Federal Government instruments. Objective portfolio guidelines have been established for the remaining percentage, and investment decisions are made to comply with those guidelines to the extent that market conditions and available funds allow. The composition of the portfolio is consistent with those of other large multi-national companies that manage long-term funds.
The amounts and types of securities of the Company and related parties included in trustplan assets are as follows:
| 2007 | 2006 | 2010 | 2009 | |||||||||||
Debt: | ||||||||||||||
CEMEX, S.A.B. de C.V. | Ps. | 51 | Ps. | 55 | Ps. 20 | Ps. 21 | ||||||||
BBVA Bancomer, S.A. de C.V. | 29 | — | 11 | 6 | ||||||||||
Deutsche Bank (Mexico)(1) | 26 | — | ||||||||||||
British American Tobacco Mexico(1) | 16 | 16 | ||||||||||||
Valores Mexicanos Casa de Bolsa, S.A. de C.V.(1) | 8 | — | ||||||||||||
Sigma Alimentos, S.A. de C.V. | — | 10 | ||||||||||||
Coca-Cola FEMSA | 2 | — | 2 | 2 | ||||||||||
Grupo Bimbo, S.A.B. de C.V.(1) | — | 11 | ||||||||||||
Grupo Televisa, S.A.B.(1) | — | 10 | ||||||||||||
Grupo Industrial Bimbo, S.A. de C.V. | 2 | 2 | ||||||||||||
Capital: | ||||||||||||||
FEMSA | 177 | 192 | 97 | 90 | ||||||||||
CEMEX, S.A.B. de C.V.(1) | 135 | 69 | ||||||||||||
Grupo Televisa, S.A.B.(1) | 84 | 69 | ||||||||||||
Grupo Televisa, S.A.B. | 8 | 7 | ||||||||||||
The Company does not expect to make material contributions to plan assets during the following fiscal year.
| d) | Cost for the Year: |
| 2007 | 2006 | 2005 | ||||||||||
Pension and retirement plans: | ||||||||||||
Service cost | Ps. | 210 | Ps. | 139 | Ps. | 123 | ||||||
Interest cost | 235 | 232 | 216 | |||||||||
Expected return on trust assets | (129 | ) | (139 | ) | (126 | ) | ||||||
Amortization of unrecognized transition obligation | 102 | 55 | 54 | |||||||||
Amortization of net actuarial loss | 1 | 6 | — | |||||||||
| 419 | 293 | 267 | ||||||||||
Seniority premiums: | ||||||||||||
Service cost | 30 | 24 | 23 | |||||||||
Interest cost | 10 | 11 | 11 | |||||||||
Amortization of unrecognized transition obligation | 2 | 3 | 2 | |||||||||
Amortization of net actuarial loss | 3 | — | — | |||||||||
| 45 | 38 | 36 | ||||||||||
Postretirement medical services: | ||||||||||||
Service cost | 27 | 20 | 20 | |||||||||
Interest cost | 32 | 36 | 34 | |||||||||
Expected return on trust assets | (6 | ) | (4 | ) | (3 | ) | ||||||
Amortization of unrecognized transition obligation | 4 | 4 | 16 | |||||||||
Amortization of net actuarial loss | 13 | 10 | — | |||||||||
| 70 | 66 | 67 | ||||||||||
Severance indemnities: | ||||||||||||
Service cost | 66 | 85 | 63 | |||||||||
Interest cost | 26 | 34 | 30 | |||||||||
Amortization of unrecognized transition obligation | 38 | 35 | 32 | |||||||||
| 130 | 154 | 125 | ||||||||||
| Ps. | 664 | Ps. | 551 | Ps. | 495 | |||||||
| 2010 | 2009 | 2008 | ||||||||||
Pension and Retirement Plans: | ||||||||||||
Labor cost | Ps. | 136 | Ps. | 136 | Ps. | 117 | ||||||
Interest cost | 219 | 216 | 186 | |||||||||
Expected return on trust assets | (94 | ) | (80 | ) | (94 | ) | ||||||
Labor cost of past services(1) | 30 | 29 | 29 | |||||||||
Amortization of net actuarial loss | 4 | 17 | 12 | |||||||||
| 295 | 318 | 250 | ||||||||||
Seniority Premiums: | ||||||||||||
Labor cost | 27 | 25 | 22 | |||||||||
Interest cost | 13 | 12 | 11 | |||||||||
Labor cost of past services(1) | 1 | — | 1 | |||||||||
Amortization of net actuarial loss | — | — | 20 | |||||||||
| 41 | 37 | 54 | ||||||||||
Postretirement Medical Services: | ||||||||||||
Labor cost | 8 | 7 | 6 | |||||||||
Interest cost | 16 | 15 | 13 | |||||||||
Expected return on trust assets | (3 | ) | (3 | ) | (3 | ) | ||||||
Labor cost of past services(1) | 2 | 2 | 2 | |||||||||
Amortization of net actuarial loss | 4 | 5 | 4 | |||||||||
| 27 | 26 | 22 | ||||||||||
Severance Indemnities: | ||||||||||||
Labor cost | 65 | 61 | 70 | |||||||||
Interest cost | 31 | 32 | 38 | |||||||||
Labor cost of past services(1) | 48 | 50 | 67 | |||||||||
Amortization of net actuarial loss | 93 | 45 | 163 | |||||||||
| 237 | 188 | 338 | ||||||||||
| Ps. | 600 | Ps. | 569 | Ps. | 664 | |||||||
| ||||||||||||
| (1) | Amortization of unrecognized net transition obligation and amortization of unrecognized prior service costs. |
| e) | Changes in the Balance of the Obligations: |
| 2007 | 2006 | 2010 | 2009 | |||||||||||||
Pension and retirement plans: | ||||||||||||||||
Pension and Retirement Plans: | ||||||||||||||||
Initial balance | Ps. | 5,343 | Ps. | 4,139 | Ps. | 2,612 | Ps. | 2,614 | ||||||||
Service cost | 210 | 139 | ||||||||||||||
Labor cost | 136 | 136 | ||||||||||||||
Interest cost | 235 | 232 | 219 | 216 | ||||||||||||
Curtailment | — | (24 | ) | 129 | — | |||||||||||
Amendments | 125 | 1,036 | ||||||||||||||
Actuarial (gain) loss | (62 | ) | 29 | |||||||||||||
Actuarial loss (gain), net | 358 | (182 | ) | |||||||||||||
Benefits paid | (259 | ) | (208 | ) | (156 | ) | (172 | ) | ||||||||
Ending balance | 5,592 | 5,343 | 3,298 | 2,612 | ||||||||||||
Seniority premiums: | ||||||||||||||||
Seniority Premiums: | ||||||||||||||||
Initial balance | 245 | 202 | 166 | 149 | ||||||||||||
Service cost | 30 | 24 | ||||||||||||||
Labor cost | 27 | 25 | ||||||||||||||
Interest cost | 10 | 11 | 13 | 12 | ||||||||||||
Actuarial gain, net | (33 | ) | (8 | ) | ||||||||||||
Benefits paid | (19 | ) | (12 | ) | ||||||||||||
Ending balance | 154 | 166 | ||||||||||||||
Postretirement Medical Services: | ||||||||||||||||
Initial balance | 191 | 183 | ||||||||||||||
Labor cost | 8 | 7 | ||||||||||||||
Interest cost | 16 | 15 | ||||||||||||||
Curtailment | 8 | — | ||||||||||||||
Actuarial loss (gain), net | 21 | (2 | ) | |||||||||||||
Benefits paid | (13 | ) | (12 | ) | ||||||||||||
Ending balance | 231 | 191 | ||||||||||||||
Severance Indemnities: | ||||||||||||||||
Initial balance | 535 | 489 | ||||||||||||||
Labor cost | 65 | 61 | ||||||||||||||
Interest cost | 31 | 32 | ||||||||||||||
Curtailment | 1 | — | ||||||||||||||
Actuarial loss | 2 | 42 | 74 | 65 | ||||||||||||
Benefits paid | (34 | ) | (34 | ) | (153 | ) | (112 | ) | ||||||||
Ending balance | 253 | 245 | 553 | 535 | ||||||||||||
Postretirement medical services: | ||||||||||||||||
Initial balance | 731 | 629 | ||||||||||||||
Service cost | 27 | 20 | ||||||||||||||
Interest cost | 32 | 36 | ||||||||||||||
Actuarial loss | 12 | 90 | ||||||||||||||
Benefits paid | (60 | ) | (44 | ) | ||||||||||||
Ending balance | 742 | 731 | ||||||||||||||
Severance indemnities: | ||||||||||||||||
Initial balance | 588 | 538 | ||||||||||||||
Kaiser acquisition | — | 34 | ||||||||||||||
Service cost | 66 | 85 | ||||||||||||||
Interest cost | 26 | 34 | ||||||||||||||
Actuarial loss | 88 | 31 | ||||||||||||||
Benefits paid | (121 | ) | (134 | ) | ||||||||||||
Ending balance | 647 | 588 | ||||||||||||||
| f) | Changes in the Balance of the Trust Assets: |
| 2007 | 2006 | 2010 | 2009 | |||||||||||||
Pension and retirement plans: | ||||||||||||||||
Initial balance | Ps. | 2,779 | Ps. | 2,391 | Ps. | 1,183 | Ps. | 893 | ||||||||
Actual return on trust assets in real terms | 110 | 334 | ||||||||||||||
Contributions | 78 | 216 | ||||||||||||||
Actual return on trust assets | 114 | 299 | ||||||||||||||
Life annuities(1) | 264 | — | ||||||||||||||
Benefits paid | (161 | ) | (162 | ) | (17 | ) | (9 | ) | ||||||||
Ending balance | 2,806 | 2,779 | 1,544 | 1,183 | ||||||||||||
Postretirement medical services: | ||||||||||||||||
Initial balance | 105 | 83 | ||||||||||||||
Actual return on trust assets in real terms | 33 | 1 | ||||||||||||||
Contributions | — | 65 | ||||||||||||||
Benefits paid | (42 | ) | (44 | ) | ||||||||||||
Ending balance | 96 | 105 | ||||||||||||||
| (1) | Life annuities acquired fromAllianz Mexico. |
| g) | Variation in Health Care Assumptions: |
The following table presents the impact to the postretirement medical service obligations and the expenses recorded in the income statement with a variation of 1% in the assumed health care cost trend rates.
| Impact of changes: | Impact of Changes: | ||||||||||||||
| +1% | -1% | +1% | -1% | ||||||||||||
Postretirement medical services obligation | Ps. | 120 | Ps. | (106 | ) | Ps. | 35 | Ps. | (28) | ||||||
Cost for the year | 9 | (13 | ) | 5 | (3) | ||||||||||
Note 16.17. Bonus Program.
The bonus program for executives is based on complying with certain goals established annually by management, which include quantitative and qualitative objectives and special projects.
The quantitative objectives represent approximately 50% of the bonus and are based on the Economic Value Added (“EVA”) methodology. The objective established for the executives at each entity is based on a combination of the EVA per entity and the EVA generated by the Company, calculated at approximately 70% and 30%, respectively. The qualitative objectives and special projects represent the remaining 50% of the annual bonus and are based on the critical success factors established at the beginning of the year for each executive.
In addition, the Company provides a defined contribution plan of share compensation plan to certain key executives, consisting of an annual cash bonus to purchase FEMSA shares or options, based on the executive’s responsibility in the organization, their business’ EVA result achieved, and their individual performance. The acquired shares or options are deposited in a trust, and the executives may access them one year after they are vested at 20% per year. The 50% of Coca-Cola FEMSA’s annual executive bonus is to be used to purchase FEMSA shares or options and the remaining 50% to purchase Coca-Cola FEMSA shares or options. As of December 31, 2007,2010, 2009 and 2008, no options have been granted to employees.employees under the plan.
As of April 30, 2010, the trust linked to FEMSA Cerveza executives was liquidated; as a result 230,642 of FEMSA UBD shares and 27,339 of KOF L shares granted to FEMSA Cerveza executives were vested as part of the share exchange of FEMSA Cerveza.
The incentive plan target is expressed in months of salary, and the final amount payable is computed based on a percentage of compliance with the goals established every year. The bonuses are recorded in income from operations and are paid in cash the following year. During the years ended December 31, 2007, 20062010, 2009 and 2005,2008, the bonus expense recorded amounted to Ps. 1,179,1,016 Ps. 9271,210 and Ps. 707,1,050, respectively.
All shares held by the trustsin trust are considered outstanding for earnings per share purposes and dividends on shares held by the trusts are charged to retained earnings.
As of December 31, 2010 and 2009, the number of shares held by the trust is as follows:
| Number of Shares | ||||||||||||||||
| FEMSA UBD | KOF L | |||||||||||||||
| 2010 | 2009 | 2010 | 2009 | |||||||||||||
Beginning balance | 10,514,672 | 8,992,423 | 3,035,008 | 2,451,977 | ||||||||||||
Shares granted to executives | 3,700,050 | 4,384,425 | 989,500 | 1,340,790 | ||||||||||||
Shares released from trust to executives upon vesting | (3,863,904 | ) | (2,775,853 | ) | (975,132 | ) | (742,249 | ) | ||||||||
Forfeitures | (153,311 | ) | (86,323 | ) | — | (15,510 | ) | |||||||||
Ending balance | 10,197,507 | 10,514,672 | 3,049,376 | 3,035,008 | ||||||||||||
The fair value of the shares held by the trust as of the end of December 31, 2010 and 2009 was Ps. 857 and Ps. 920, respectively, based on quoted market prices of those dates.
Note 17.18. Bank Loans and Notes Payable.
The following table presents short-term debt consisted principally of revolving bank loans as well as their weighted average rates:
| % Interest Rate(1) | 2007 | % Interest Rate(1) | 2006 | At December 31,(1) | ||||||||||||||||||||||||||||||||||||||||||
| (in millions of Mexican pesos) | 2011 | 2012 | 2013 | 2014 | 2015 | 2016 and Thereafter | 2010 | Fair Value | 2009(1) | |||||||||||||||||||||||||||||||||||||
Short-term debt: | ||||||||||||||||||||||||||||||||||||||||||||||
Variable rate debt: | ||||||||||||||||||||||||||||||||||||||||||||||
Colombian pesos | ||||||||||||||||||||||||||||||||||||||||||||||
Bank loans | 1,072 | — | — | — | — | — | 1,072 | 1,072 | 496 | |||||||||||||||||||||||||||||||||||||
Interest rate | 4.4% | 4.4% | 4.9% | |||||||||||||||||||||||||||||||||||||||||||
Argentine pesos | ||||||||||||||||||||||||||||||||||||||||||||||
Bank loans | 506 | — | — | — | — | — | 506 | 506 | 1,179 | |||||||||||||||||||||||||||||||||||||
Interest rate | 15.3% | 15.3% | 20.7% | |||||||||||||||||||||||||||||||||||||||||||
Mexican pesos | 7.8 | % | Ps. 150 | 7.6 | % | Ps. 421 | ||||||||||||||||||||||||||||||||||||||||
Bank loans | 1,400 | |||||||||||||||||||||||||||||||||||||||||||||
Interest rate | 8.2% | |||||||||||||||||||||||||||||||||||||||||||||
Venezuelan bolivars | ||||||||||||||||||||||||||||||||||||||||||||||
Bank loans | 741 | |||||||||||||||||||||||||||||||||||||||||||||
Interest rate | 18.1% | |||||||||||||||||||||||||||||||||||||||||||||
Total short-term debt | 1,578 | 1,578 | 1,578 | 3,816 | ||||||||||||||||||||||||||||||||||||||||||
Long-term debt: | ||||||||||||||||||||||||||||||||||||||||||||||
Fixed rate debt: | ||||||||||||||||||||||||||||||||||||||||||||||
Argentine pesos | ||||||||||||||||||||||||||||||||||||||||||||||
Bank loans | 62 | 622 | — | — | — | — | 684 | 684 | 69 | |||||||||||||||||||||||||||||||||||||
Interest rate | 20.5% | 16.1% | 16.5% | 20.5% | ||||||||||||||||||||||||||||||||||||||||||
Brazilian reais | ||||||||||||||||||||||||||||||||||||||||||||||
Bank loans | 4 | 9 | 15 | 15 | 14 | 45 | 102 | 102 | — | |||||||||||||||||||||||||||||||||||||
Interest rate | 4.5% | 4.5% | 4.5% | 4.5% | 4.5% | 4.5% | 4.5% | — | ||||||||||||||||||||||||||||||||||||||
U.S. dollars | 6.7 | % | 2,372 | 5.9 | % | 2,253 | ||||||||||||||||||||||||||||||||||||||||
Argentine pesos | 11.0 | % | 500 | 10.6 | % | 555 | ||||||||||||||||||||||||||||||||||||||||
Venezuelan bolivars | 15.7 | % | 425 | 9.6 | % | 516 | ||||||||||||||||||||||||||||||||||||||||
Brazilian reais | — | — | 13.9 | % | 129 | |||||||||||||||||||||||||||||||||||||||||
Japanese yen | — | — | 2.9 | % | 309 | |||||||||||||||||||||||||||||||||||||||||
Yankee Bond | 6,179 | 6,179 | 6,179 | — | ||||||||||||||||||||||||||||||||||||||||||
Interest rate | 4.6% | 4.6% | — | |||||||||||||||||||||||||||||||||||||||||||
Capital leases | 4 | — | — | — | — | — | 4 | 4 | 15 | |||||||||||||||||||||||||||||||||||||
Interest rate | 3.8% | 3.8% | 3.8% | |||||||||||||||||||||||||||||||||||||||||||
Mexican pesos | ||||||||||||||||||||||||||||||||||||||||||||||
Units of investment (UDIs) | 3,193 | 3,193 | 3,193 | 2,964 | ||||||||||||||||||||||||||||||||||||||||||
Interest rate | 4.2% | 4.2% | 4.2% | |||||||||||||||||||||||||||||||||||||||||||
Domestic senior notes | 1,000 | |||||||||||||||||||||||||||||||||||||||||||||
Interest rate | 10.4% | |||||||||||||||||||||||||||||||||||||||||||||
Bank loans | 1,000 | |||||||||||||||||||||||||||||||||||||||||||||
Interest rate | 9.3% | |||||||||||||||||||||||||||||||||||||||||||||
Subtotal | 70 | 631 | 15 | 15 | 14 | 9,417 | 10,162 | 10,162 | 5,048 | |||||||||||||||||||||||||||||||||||||
Variable rate debt: | ||||||||||||||||||||||||||||||||||||||||||||||
U.S. dollars | ||||||||||||||||||||||||||||||||||||||||||||||
Bank loans | — | 37 | 185 | — | — | — | 222 | 222 | 2,873 | |||||||||||||||||||||||||||||||||||||
Interest rate | 0.5% | 0.6% | 0.6% | 0.5% | ||||||||||||||||||||||||||||||||||||||||||
Mexican pesos | ||||||||||||||||||||||||||||||||||||||||||||||
Domestic senior notes | 1,500 | 3,000 | 3,500 | — | — | — | 8,000 | 7,945 | 10,000 | |||||||||||||||||||||||||||||||||||||
Interest rate | 4.9% | 4.8% | 4.8% | 4.8% | 5.0% | |||||||||||||||||||||||||||||||||||||||||
Bank loans | — | 67 | 267 | 1,392 | 2,824 | — | 4,550 | 4,550 | 8,062 | |||||||||||||||||||||||||||||||||||||
Interest rate | 5.1% | 5.1% | 5.1% | 5.1% | 5.1% | 6.3% | ||||||||||||||||||||||||||||||||||||||||
Colombian pesos | ||||||||||||||||||||||||||||||||||||||||||||||
Bank loans | 155 | 839 | — | — | — | — | 994 | 994 | — | |||||||||||||||||||||||||||||||||||||
Interest rate | 4.7% | 4.7% | 4.7% | |||||||||||||||||||||||||||||||||||||||||||
Subtotal | 1,655 | 3,943 | 3,952 | 1,392 | 2,824 | — | 13,766 | 13,711 | 20,935 | |||||||||||||||||||||||||||||||||||||
Total long-term debt | 1,725 | 4,574 | 3,967 | 1,407 | 2,838 | 9,417 | 23,928 | 23,873 | 25,983 | |||||||||||||||||||||||||||||||||||||
Current portion of long-term debt | (1,725 | ) | (4,723 | ) | ||||||||||||||||||||||||||||||||||||||||||
| Ps.3,447 | Ps.4,183 | Ps.22,203 | Ps.21,260 | |||||||||||||||||||||||||||||||||||||||||||
| (1) |
The following table presents long-term bank loans and notes payable, as well as their weighted average rates and derivative financial instruments contracted by the Company:
Derivative Financial Instruments(1) | 2011 | 2012 | 2013 | 2014 | 2015 | 2016 and Thereafter | 2010 | 2009 | ||||||||||||||||||||||||
| (notional amounts in millions of Mexican pesos) | ||||||||||||||||||||||||||||||||
Cross currency swaps: | ||||||||||||||||||||||||||||||||
Units of investments to Mexican pesos and variable rate: | 2,500 | 2,500 | 2,500 | |||||||||||||||||||||||||||||
Interest pay rate | 4.7% | 4.7% | 4.8% | |||||||||||||||||||||||||||||
Interest receive rate | 4.2% | 4.2% | 4.2% | |||||||||||||||||||||||||||||
Interest rate swap: | ||||||||||||||||||||||||||||||||
Mexican pesos | ||||||||||||||||||||||||||||||||
Variable to fixed rate: | — | 1,600 | 2,500 | — | 1,160 | — | 5,260 | 5,012 | ||||||||||||||||||||||||
Interest pay rate | 8.1% | 8.1% | 8.4% | 8.1% | 8.9% | |||||||||||||||||||||||||||
Interest receive rate | 4.8% | 4.8% | 5.1% | 4.9% | 4.9% | |||||||||||||||||||||||||||
U.S. dollars | ||||||||||||||||||||||||||||||||
Variable to fixed rate: | 1,632 | |||||||||||||||||||||||||||||||
Interest pay rate | 3.1% | |||||||||||||||||||||||||||||||
Interest receive rate | 0.5% | |||||||||||||||||||||||||||||||
| % Interest Rate(1) | 2007 | % Interest Rate(1) | 2006 | |||||||||||
Fixed interest rate: | ||||||||||||||
U.S. dollars: | ||||||||||||||
Yankee bonds | 7.3 | % | Ps | . 3,199 | 7.3 | % | Ps. | 3,354 | ||||||
Bank loans | 6.0 | % | 747 | 5.3 | % | 759 | ||||||||
Mexican pesos: | ||||||||||||||
Bank loans | 9.7 | % | 3,586 | 9.7 | % | 4,292 | ||||||||
Units of investment (UDIs) | 4.2 | % | 2,508 | — | — | |||||||||
Notes payable | 10.2 | % | 1,500 | 10.2 | % | 1,556 | ||||||||
Japanese yen: | ||||||||||||||
Bank loans | 4.8 | % | 230 | 5.8 | % | 191 | ||||||||
Variable interest rate: | ||||||||||||||
U.S. dollars: | ||||||||||||||
Bank loans | 5.2 | % | 2,014 | 5.7 | % | 2,760 | ||||||||
Capital leases | 8.5 | % | 2 | 8.7 | % | 9 | ||||||||
Mexican pesos: | ||||||||||||||
Bank loans | 8.1 | % | 10,010 | 7.6 | % | 16,573 | ||||||||
Notes payable | 8.2 | % | 12,750 | 8.2 | % | 8,462 | ||||||||
Brazilian reais: | ||||||||||||||
Bank loans | 8.7 | % | 36 | 9.3 | % | 84 | ||||||||
Colombian pesos: | ||||||||||||||
Notes payable | — | — | 9.3 | % | 196 | |||||||||
Long-term debt | 36,582 | 38,236 | ||||||||||||
Current portion of long-term debt | (5,917 | ) | (2,563 | ) | ||||||||||
| Ps. | 30,665 | Ps. | 35,673 | |||||||||||
Hedging Derivative Financial Instruments | % Interest Rate(1) | 2007 | % Interest Rate(1) | 2006 | ||||||||||
Interest rate swaps variable to fixed: | ||||||||||||||
Mexican pesos: | ||||||||||||||
Notes: | Ps. | 14,085 | Ps. | 8,462 | ||||||||||
Interest pay rate | 9.5 | % | 9.2 | % | ||||||||||
Interest receive rate | 8.1 | % | 8.0 | % | ||||||||||
Bank loans: | 4,465 | 12,279 | ||||||||||||
Interest pay rate | 9.4 | % | 9.8 | % | ||||||||||
Interest receive rate | 8.0 | % | 7.4 | % | ||||||||||
Cross currency swaps: | ||||||||||||||
Bank loans from Japanese yen to Brazilian reais: | 230 | 499 | ||||||||||||
Interest pay rate | 11.8 | % | 13.9 | % | ||||||||||
Interest receive rate | 4.8 | % | 4.0 | % | ||||||||||
| (1) |
MaturitiesOn December 4, 2007, the Company obtained the approval from the National Banking and Securities Commission (Comisión Nacional Bancaria y de Valores or “CNBV”) for the issuance of long-term debt asdomestic senior notes (“Certificados Bursátiles”) in the amount of Ps. 10,000 (nominal amount) or its equivalent in investment units. As of December 31, 2010, the Company has issued the following domestic senior notes: i) on December 7, 2007, are as follows:the Company issued domestic senior notes composed of Ps. 3,500 (nominal amount) with a maturity date on November 29, 2013 and a floating interest rate; ii) on December 7, 2007, the Company issued domestic senior notes in the amount of 637,587,000 investment units (Ps. 2,500 nominal amount), with a maturity date on November 24, 2017 and a fixed interest rate, iii) on May 26, 2008, the Company issued domestic senior notes composed of Ps. 1,500 (nominal amount), with a maturity date on May 23, 2011 and a floating interest rate.
Additionally, Coca-Cola FEMSA has the following domestic senior notes: a) issued in the Mexican stock exchange, Ps. 3,000 (nominal amount) with a maturity date in 2012 and a variable rate; b) issued in the NYSE a Yankee Bond of $500 with a bearing interest at a fixed rate of 4.6% and maturity date on February 15, 2020.
Current maturities of long-term debt | Ps. | 5,917 | |
2009 | 5,346 | ||
2010 | 2,981 | ||
2011 | 2,075 | ||
2012 | 7,174 | ||
2013 and thereafter | 13,089 | ||
| Ps. | 36,582 | ||
The Company has financing from different institutions withunder agreements that stipulate different restrictions and covenants, which mainly consist of maximum levels of leverage and capitalization as well as minimum consolidated net worth and debt and interest coverage ratios. As of the date of these consolidated financial statements, the Company was in compliance with all restrictions and covenants contained in its financing agreements.
Note 18.19. Other Expenses.Expenses, Net.
In 2007, FEMSA Cerveza approved a plan to allow certain qualifying personnel to early retire beginning in 2008 (see Note 15). The financial impact of this plan was Ps. 125 and was recorded in other expenses as a pension plan amendment.
In 2006, Coca-Cola FEMSA implemented strategic restructuring programs in its commercial operations and recognized costs of Ps. 689, which were recorded in other expenses in the December 2006 consolidated income statement. Such costs consisted of Ps. 556 of severance payments associated with an ongoing benefit arrangement and Ps. 133 of other costs related to the restructuring programs. As of December 31, 2007, Coca-Cola FEMSA has paid Ps. 485 related to such costs and the remaining balance is expected to be paid during 2008.
| 2007 | 2006 | 2005 | ||||||||||
Employee profit sharing (see Note 2) | Ps. | 553 | Ps. | 530 | Ps. | 588 | ||||||
Loss on sales of fixed assets | 101 | 59 | 237 | |||||||||
Contingencies | 228 | 117 | 172 | |||||||||
Severance payments associated with an ongoing benefit and amendment to pension plan | 255 | 866 | 132 | |||||||||
Impairment of long-lived assets | 93 | 208 | 84 | |||||||||
Participation in affiliated companies | (154 | ) | (11 | ) | (72 | ) | ||||||
Other | 221 | (119 | ) | (33 | ) | |||||||
Total | Ps. | 1,297 | Ps. | 1,650 | Ps. | 1,108 | ||||||
| 2010 | 2009 | 2008 | ||||||||||
Employee profit sharing (see Note 5 S) | Ps. | 785 | Ps. | 1,020 | Ps. | 803 | ||||||
Sale of shares (see Note 6 B) | (1,554 | ) | (35 | ) | (85 | ) | ||||||
Brazil tax amnesty (see Note 24 A) | (179 | ) | (311 | ) | — | |||||||
Vacation provision | — | 333 | — | |||||||||
Write-off of long-lived assets(1) | 9 | 129 | 378 | |||||||||
Severance payments associated with an ongoing benefit | 583 | 127 | 175 | |||||||||
Loss on sale of long-lived assets | 215 | 177 | 166 | |||||||||
Donations | 195 | 116 | 101 | |||||||||
Contingencies | 104 | 152 | 174 | |||||||||
Amortization of unrecognized actuarial loss, net (see Note 3 K) | — | — | 163 | |||||||||
Other | 124 | 169 | 144 | |||||||||
Total | Ps. | 282 | Ps. | 1,877 | Ps. | 2,019 | ||||||
| (1) | Charges related to fixed assets retirement from ordinary operations and other long-lived assets. |
Note 19.20. Fair Value of Financial Instruments.
The Company uses a three level fair value hierarchy to prioritize the inputs used to measure fair value. The three levels of inputs are described as follows:
Level 1:quoted prices (unadjusted) in active markets for identical assets or liabilities that the reporting entity has the ability to access at the measurement date.
Level 2:inputs other than quoted prices included within level 1 that are observable for the asset or liability, either directly or indirectly.
Level 3:are unobservable inputs for the asset or liability. Unobservable inputs shall be used to measure fair value to the extent that observable inputs are not available, thereby allowing for situations in which there is little, if any, market activity for the asset or liability at the measurement date.
The Company measures the fair value of its financial assets and liabilities classified as level 2, applying the income approach method, which estimates the fair value based on expected cash flows discounted to net present value. The following table summarizes financial assets and liabilities measured at fair value, as of December 31, 2010 and 2009:
| 2010 | 2009 | |||||||||||||||
| Level 1 | Level 2 | Level 1 | Level 2 | |||||||||||||
Cash equivalents | Ps. | 19,770 | Ps. | 9,950 | ||||||||||||
Marketable securities | 66 | 2,113 | ||||||||||||||
Pension plan trust assets | 1,544 | 1,183 | ||||||||||||||
Derivative financial instruments (asset) | Ps. | 732 | Ps. | 507 | ||||||||||||
Derivative financial instruments (liability) | 694 | 598 | ||||||||||||||
The Company does not use inputs classified as level 3 for fair value measurement.
| a) |
The fair value of long-term bank loans and syndicated loansdebt is determined based on the discounted value of contractual cash flows, in which the discount rate is estimated using rates currently offered for debt of similar amounts and maturities. The fair value of long-term notes is based on quoted market prices. The fair value is estimated as of the date of the most recent balance sheet presented.
| 2007 | 2006 | 2010 | 2009 | |||||||||||
Carrying value | Ps. | 36,582 | Ps. | 38,235 | Ps. | 25,506 | Ps. | 29,799 | ||||||
Fair value | 36,960 | 38,607 | 25,451 | 29,673 | ||||||||||
| b) | Interest Rate Swaps: |
The Company uses interest rate swaps to manageoffset the interest rate risk associated with its borrowings, pursuant to which it pays amounts based on a fixed rate and receives amounts based on a floating rate. These instruments are recognized in the
consolidated balance sheet at their estimated fair value and have been designated as a cash flow hedge. The estimated fair value is based on formal technical models. Changes in fair value were recorded in cumulative other comprehensive income.income until such time as the hedged amount is recorded in earnings.
At December 31, 2007,2010, the Company has the following outstanding interest rate swap agreements:
Maturity Date | Notional Amount | Fair Value Asset (Liability) | |||||
2008 | Ps. | 6,076 | Ps. | (33 | ) | ||
2009 | 2,570 | (76 | ) | ||||
2010 | 2,267 | (92 | ) | ||||
2011 | 2,412 | (64 | ) | ||||
2012 | 3,225 | (75 | ) | ||||
2013 | 2,000 | 17 | |||||
The net effect of expired derivative contracts is included in current earnings as an interest expense and amounted to Ps. 357, Ps. 334 and Ps. 28 for the years ended December 31, 2007, 2006 and 2005, respectively.
Maturity Date | Notional Amount | Fair Value Asset (Liability) | ||||||
2011 | Ps. | — | Ps. | — | ||||
2012 | 1,600 | (57 | ) | |||||
2013 | 3,812 | (185 | ) | |||||
2014 | 575 | (24 | ) | |||||
2015 and thereafter | 1,963 | (152 | ) | |||||
A portion of certain interest rate swaps do not meet the hedging criteria for accounting purposes; consequently, changes in the estimated fair value of the ineffective portion were recorded in the consolidated results as part of the integral result of financing. For the years ended December 31, 2007, 2006 and 2005, thecomprehensive financing result.
The net effect of these instrumentsexpired contracts that met hedging criteria is recognized as interest expense as part of the date of the financial statements was a gain of Ps. 35, a loss of Ps. 39 and gain of Ps. 10, respectively.comprehensive financing result.
| c) | Forward Agreements to Purchase Foreign Currency: |
The Company enteredenters into forward agreements to reduce its exposure to the risk of exchange rate fluctuations between the Mexican pesospeso and other currencies. These instruments are recognized in the consolidated balance sheet at their estimated fair value which is determined based on formal technical models. Theprevailing market exchange rates to end the contracts at the end of the period. For contracts that meet hedging criteria, the changes in the fair value are recorded in cumulative other comprehensive income. Asincome prior to expiration. Net gain/loss on expired contracts is recognized as part of December 31, 2007,foreign exchange.
Net changes in the Company’s hadfair value of forward contracts to buy U.S. dollars and other currenciesagreements that do not meet the hedging criteria for accounting purposes with a notional amount of Ps. 1,783, and a fair value assets of Ps.10. These contracts expired in 2008.
As of the December 2007, 2006 and 2005 the Company registered effects of expired forward contract foreign exchange losses of Ps. 13, Ps. 2 and Ps. 9, respectively. Additionally, the Company recorded a foreign exchange loss of Ps. 168 in its consolidated income statement of 2005 in connection with the forward contract to buy U.S. dollars in connection with the bridge loans incurred regarding the acquisition of FEMSA Cerveza’s minority interest. These forward contracts were terminated in 2005 in conjunction with the payment of the bridge loans.
As of December 31, 2007, certain of the Company’s forward contracts to buy U.S. dollars and other currencies do not meet the hedging criteria for accounting purposes; consequently changes in the fair value wereare recorded in the consolidated results as part of the integral result of financing.comprehensive financing result. The notional amount of those forward agreements to purchase foreign currency maturing in 2008 is Ps. 1,087 with a corresponding fair value gain of Ps. 9. For the years ended December 31, 2007 and 2006, the net effect of expired contracts that diddo not meet the hedging criteria for accounting purposes was a gain of Ps. 13 and a loss of Ps. 23, respectively, includedis recognized as a market value gain (loss)gain/loss on the ineffective portion of derivative financial instruments. In 2005 there are no effects of forwards agreements that did not meet hedging criteria.
| d) | Cross Currency Swaps: |
The Company enters into cross currency swaps to reduce its exposure to the riskrisks of exchange rate and interest rate fluctuations associated with its borrowings denominated in U.S. dollars and other foreign currencies. These instruments are recognized in the consolidated balance sheet at their estimated fair value which is estimated based on formal technical models. ChangesThese contracts are designated as fair value hedges. The fair value changes related to those cross currency swaps were recorded as part of the ineffective portion of derivative financial instruments, net of changes related to the long-term liability.
Net changes in the fair value were recorded in other comprehensive income. As of December 31, 2007, the Company has cross currency swap agreements outstanding with a notional amount of Ps. 230current and a fair value liability of Ps. 39. Those contracts mature in 2009. The net effect of expired contracts included in interest expense as part of the integral result of financing amounted to Ps. 37 and Ps. 72, for the years ended December 31, 2007 and 2006, respectively. As of the end of December 31, 2005, the net effect of expired contracts, was a gain of Ps. 138.
Certain cross currency swaps instrumentscontracts that did not meet the hedging criteria for accounting purposes; consequently changes in the estimated fair valuepurposes are recorded as a gain or gain/loss in the market value on the ineffective portion of derivative financial instruments in the consolidated results as part of the integral result of financing. Those contracts with a notional amount of Ps. 5,302 expire in December 2017 and the net effect changes in the fair value for the year ended December 31, 2007 amounted to Ps. 59 of a gain recorded in the market value on ineffective portion of derivative financial instruments. The net effect of expired contracts that did not meet the hedging criteria for accounting purposes is recorded as a market value gain of Ps. 5 and losses of Ps. 3 and Ps. 233 for the years ended December 31, 2007, 2006 and 2005, respectively. All effects were recorded as part of ineffective portion of derivative financial instruments.comprehensive financing result.
| e) | Commodity Price Contracts: |
The Company enters into various commodity price contracts to reduce its exposure to the risk of fluctuation in the costs of certain raw material costs.material. The fair value is estimated based on technical formal models.the market valuations to end of the contracts at the date of closing of the period. Changes in the fair value were recorded in cumulative other comprehensive income. As of December 31, 2007,
Changes in the Company has commodity price contracts with maturity dates ending in 2010, with a notional amount of Ps. 2,419 and had recorded a fair value liability of Ps. 96. For the years ended December 31, 2007, 2006 and 2005, the net effect of expired commodity price contracts were lossesrecorded in cost of Ps. 82, Ps. 106 and Ps. 2, respectively, and were recorded as part of operating income offsetting the related raw material cost.
As of the end of December 31, 2007, certain commodity price contracts to reduce its exposure to the risk of certain raw material costs, did not meet the hedging criteria for accounting purposes; consequently changes in the estimated fair value are recorded as part of the market value gain (loss) on ineffective portion of derivative financial instruments within the consolidated income statement. As of the end of December 31, 2007, the net effect of those contracts was a loss of Ps. 43.sales.
| f) | Embedded Derivative Financial Instruments: |
The Company has determined that its leasing contracts denominated in U.S. dollars host embedded derivative financial instruments. The fair value is estimated based on formal technical formal models. The changesChanges in the fair value were recorded in current earnings in the integralcomprehensive financing result of financing as market value on derivative financial instruments. As of December 31, 2007, 2006 and 2005, the net effect of embedded derivative financial instruments was losses of Ps. 9 and Ps. 49 and a gain of Ps. 57, respectively.
| g) | Notional Amounts and Fair Value of Derivative Instruments that Met Hedging Criteria: |
| Notional Amounts | Fair Value | |||||||||||
| 2010 | 2009 | |||||||||||
CASH FLOW HEDGE: | ||||||||||||
Assets: | ||||||||||||
Forward agreements | Ps. | 578 | Ps. | 2 | (1) | Ps. | — | |||||
Commodity price contracts | 451 | 445 | (2) | 133 | ||||||||
Interest rate swaps | 3 | |||||||||||
Liabilities: | ||||||||||||
Forward agreements | Ps. | 1,690 | Ps. | 18 | (1) | Ps. | — | |||||
Interest rate swaps | 7,950 | 418 | (3) | 213 | ||||||||
FAIR VALUE HEDGE: | ||||||||||||
Assets: | ||||||||||||
Cross currency swaps | Ps. | 2,500 | Ps. | 717 | Ps. | 480 | ||||||
| (1) | Expires in 2011. |
| (2) | Maturity dates between 2011 and 2012. |
| (3) | Maturity dates in 2012 and 2015. |
| h) | Net Effects of Expired Contracts that Met Hedging Criteria: |
Types of Derivatives | Impact in Income | 2010 | 2009 | 2008 | ||||||||||
Interest rate swaps | Interest expense | Ps. | (181 | ) | Ps. | (67 | ) | Ps. | 44 | |||||
Forward agreements | Foreign exchange | 27 | — | — | ||||||||||
Cross currency swaps | Foreign exchange/ interest expense | 2 | (32 | ) | (73 | ) | ||||||||
Commodity price contract | Cost of sales | 393 | 247 | 2 | ||||||||||
| i) | Net Effect of Changes in Fair Value of Derivative Financial Instruments that Did Not Meet the Hedging Criteria for Accounting Purposes: |
Types of Derivatives | Impact in Income Statement | 2010 | 2009 | 2008 | ||||||||||
Interest rate swaps | Market value gain (loss) on ineffective portion of derivative financial instruments | Ps. (7 | ) | Ps. — | Ps. 24 | |||||||||
Forwards for purchase of foreign currency | — | (63 | ) | (705 | ) | |||||||||
Cross currency swaps | 205 | 168 | (200 | ) | ||||||||||
| j) | Net Effect of Changes in Fair Value of Other Derivative Financial Instruments that Did Not Meet the Hedging Criteria for Accounting Purposes: |
Types of Derivatives | Impact in Income | 2010 | 2009 | 2008 | ||||||||||
Embedded derivative financial instruments | Market value gain (loss) on ineffective portion of derivative financial instruments | Ps. | 15 | Ps. | 19 | Ps. | (68 | ) | ||||||
Others | (1 | ) | — | (1 | ) | |||||||||
Note 20. Minority21. Noncontrolling Interest in Consolidated Subsidiaries.
An analysis of FEMSA’s noncontrolling interest in its consolidated subsidiaries for the years ended December 31, 2010 and 2009 is as follows:
| 2007 | 2006 | |||||
Coca-Cola FEMSA | Ps. | 24,380 | Ps. | 21,363 | ||
FEMSA Cerveza | 679 | 191 | ||||
Other | 16 | — | ||||
| Ps. | 25,075 | Ps. | 21,554 | |||
| 2010 | 2009 | |||||||
Coca-Cola FEMSA | Ps. | 35,585 | Ps. | 32,918 | ||||
FEMSA Cerveza | — | 1,219 | ||||||
Other | 80 | 55 | ||||||
| Ps. | 35,665 | Ps. | 34,192 | |||||
Note 21.22. Stockholders’ Equity.
At the FEMSA ordinary stockholders’ meeting held on March 29, 2007, a three-for-one stock split was approved for all of FEMSA’s outstanding stock, which went into effect on May 25, 2007. Subsequent to the stock split,The capital stock of FEMSA is comprised of 2,161,177,770 BD Unitsunits and 1,417,048,500 B Units.units.
As of December 31, 2007,2010 and 2009, the capital stock of FEMSA was comprised of 17,891,131,350 common shares, without par value and with no foreign ownership restrictions. Fixed capital stock amounts to Ps. 300 (nominal value) and the variable capital may not exceed 10 times the minimum fixed capital stock.stock amount.
The characteristics of the common shares are as follows:
Series “B” shares, with unlimited voting rights, which at all times must represent a minimum of 51% of total capital stock;
Series “L” shares, with limited voting rights, which may represent up to 25% of total capital stock; and
Series “D” shares, with limited voting rights, which individually or jointly with series “L” shares may represent up to 49% of total capital stock.
The Series “D” shares are comprised as follows:
Subseries “D-L” shares may represent up to 25% of the series “D” shares;
Subseries “D-B” shares may comprise the remainder of outstanding series “D” shares; and
The non-cumulative premium dividend to be paid to series “D” stockholders will be 125% of any dividend paid to series “B” stockholders.
The Series “B” and “D” shares are linked together in related units as follows:
“B units” each of which represents five series “B” shares and which are traded on the BMV;
“BD units” each of which represents one series “B” share, two subseries “D-B” shares and two subseries “D-L” shares, and which are traded both on the BMV and the NYSE; and
The related units will cease to be linked togetherCompany’s statutes addressed that in May 2008, after a period of 10 years from the date of the first issue. Subseriesshares structure established in 1998 would be modified, unlinking subseries “D-B” shares will be converted into series “B” shares and unlinking subseries “D-L” shares will be converted into series “L” shares.
At an ordinary stockholders’ meeting of FEMSA held on April 22, 2008, it was approved to modify the Company’s statutes in order to preserve the unitary shares structure of the Company established on May 1998, and also to maintain the shares structure established after May 11, 2008.
As of December 31, 2007,2010 and 2009, FEMSA’s capital stock is comprised as follows:
| “B” Units | “BD” Units | Total | ||||||||||
Units | 1,417,048,500 | 2,161,177,770 | 3,578,226,270 | |||||||||
Shares: | ||||||||||||
Series “B” | 7,085,242,500 | 2,161,177,770 | 9,246,420,270 | |||||||||
Series “D” | — | 8,644,711,080 | 8,644,711,080 | |||||||||
Subseries “D-B” | — | 4,322,355,540 | 4,322,355,540 | |||||||||
Subseries “D-L” | — | 4,322,355,540 | 4,322,355,540 | |||||||||
Total shares | 7,085,242,500 | 10,805,888,850 | 17,891,131,350 | |||||||||
On May 25, 2005, the Company completed an equity offering, obtaining net proceeds of Ps. 8,461, which were used to repay the bridge loans incurred in connection with the acquisition of a 30% equity interest in FEMSA Cerveza and to repay other indebtedness. As a result of the equity offering in 2005, the Company’s capital stock increased by 666,400,000 shares.
The restatement of stockholders’ equity for inflation is allocated to each of the various stockholders’ equity accounts, as follows:
| Historical Value | Restatement | Restated Value | |||||||
Capital stock | Ps. | 2,982 | Ps. | 2,366 | Ps. | 5,348 | |||
Additional paid-in capital | 13,326 | 7,286 | 20,612 | ||||||
Retained earnings from prior years | 34,926 | 3,182 | 38,108 | ||||||
Net income | 8,300 | 211 | 8,511 | ||||||
The net income of the Company is subject to the legal requirement that 5% thereof be transferred to a legal reserve until such reserve equals 20% of capital stock at nominal value. This reserve may not be distributed to stockholders during the existence of the Company, except as a stock dividend. As of December 31, 2007,2010, this reserve forin FEMSA amounted to Ps. 596 (nominal value).
Retained earnings and other reserves distributed as dividends, as well as the effects derived from capital reductions, are subject to income tax at the rate in effect at the date of distribution, except for the restated stockholder contributions and distributions made from consolidated taxable income, denominated “Cuenta de Utilidad Fiscal Neta” (“CUFIN”) or from reinvested consolidated taxable income, denominated “Cuenta de Utilidad Fiscal Neta Reinvertida” (“CUFINRE”).
Dividends paid in excess of CUFIN and CUFINRE are subject to income tax at a grossed-up rate based on the current statutory rate. Since 2003, this tax may be credited against the income tax of the year in which the dividends are paid and in the following two years against the income tax and estimated tax payments. As of December 31, 2007,2010, FEMSA’s balances of CUFIN amounted to Ps. 39,234.55,369.
At the ordinary stockholders’ meeting of FEMSA held on March 29, 2007, theApril 26, 2010, stockholders approved a dividenddividends of Ps. 0.074060.12966 Mexican pesos (nominal value) per series “B” share and Ps. 0.092570.16208 Mexican pesos (nominal value) per series “D” share that were paid in May 2007.and November, 2010. Additionally, the stockholders approved a reserve for share repurchase of a maximum of Ps. 3,000 for a stock repurchase program.3,000.
As of December 31, 2010, the Company has not repurchased shares.
At an ordinary stockholders’ meeting of Coca-Cola FEMSA held on March 27, 2007,April 14, 2010, the stockholders approved a dividend of Ps. 8312,604 that werewas paid in May 2007.April 2010. The corresponding payment to the minoritynoncontrolling interest was Ps. 384.1,205.
As of December 31, 2010, 2009 and 2008 the dividends paid by the Company and Coca-Cola FEMSA were as follows:
| 2010 | 2009 | 2008 | ||||||||||
FEMSA | Ps. 2,600 | Ps. 1,620 | Ps. 1,620 | |||||||||
Coca-Cola FEMSA (100% of dividend) | 2,604 | 1,344 | 945 | |||||||||
Note 22.23. Net MajorityControlling Interest Income per Share.
This represents the net majoritycontrolling interest income corresponding to each share of the Company’s capital stock, computed on the basis of the weighted average number of shares outstanding during the year.period. Additionally, the net income distribution is presented according to the dividend rights of each share series is presented.series.
As a result of the stock split on May 25, 2007, earnings per share for previously presented periods has been retroactively restated in accordance with Mexican FRS, NIF Bulletin B-14, “Earnings per Share.” The following presents the computed weighted average number of shares and the distribution of income per share series as of December 31, 2007, 20062010, 2009 and 2005:2008:
| Millions of Shares | Millions of Shares | |||||||||||||||||||||||||
| Series “B” | Series “D” | Series “B” | Series “D” | |||||||||||||||||||||||
| Number | Weighted Average | Number | Weighted Average | Number | Weighted Average | Number | Weighted Average | |||||||||||||||||||
Shares outstanding as of December 31, 2005 | 9,246.42 | 8,834.85 | 8,644.71 | 8,260.14 | ||||||||||||||||||||||
Shares outstanding as of December 31, 2006 and 2007 | 9,246.42 | 9,246.42 | 8,644.71 | 8,644.71 | ||||||||||||||||||||||
Shares outstanding as of December 31, 2010, 2009 and 2008 | 9,246.42 | 9,246.42 | 8,644.71 | 8,644.71 | ||||||||||||||||||||||
Dividend rights | 1.00 | 1.25 | 1.00 | 1.25 | ||||||||||||||||||||||
Allocation of earnings | 46.11 | % | 53.89 | % | 46.11 | % | 53.89 | % | ||||||||||||||||||
Note 23. Tax System.24 Taxes.
| a) | Income Tax: |
Income tax is computed on taxable income, which differs from net income for accounting incomepurposes principally due to the treatment of the integralcomprehensive financing result, of financing, the cost of labor liabilities, depreciation and other accounting provisions. TheA tax loss may be carried forward and applied against future taxable income.
| Domestic | Foreign | |||||||||||||||||||||||
| 2010 | 2009 | 2008 | 2010 | 2009 | 2008 | |||||||||||||||||||
Income before income tax from continuing operations | Ps. 13,585 | Ps. 10,278 | Ps. 8,422 | Ps. 12,356 | Ps. 7,549 | Ps. 3,455 | ||||||||||||||||||
Income tax: | ||||||||||||||||||||||||
Current income tax | 2,643 | 2,839 | 2,718 | 2,211 | 2,238 | 1,727 | ||||||||||||||||||
Deferred income tax | 264 | (401 | ) | (1,310 | ) | 553 | 283 | (27 | ) | |||||||||||||||
The difference to sum consolidated income before income tax is mainly dividends which are eliminated in the consolidated financial statement of the Company. The income tax paid in foreign countries is compensated with the consolidated income tax paid in Mexico for the period.
| Domestic | Foreign | |||||||||||||||||||||||
| 2010 | 2009 | 2008 | 2010 | 2009 | 2008 | |||||||||||||||||||
Income before income tax from discontinued operations | Ps. 306 | Ps. 2,688 | Ps. 3,868 | Ps. 442 | Ps. (456 | ) | Ps. (1,121 | ) | ||||||||||||||||
Income tax: | ||||||||||||||||||||||||
Current income tax | 210 | 1,568 | 2,212 | 92 | (45 | ) | 9 | |||||||||||||||||
Deferred income tax | (260 | ) | (508 | ) | (1,122 | ) | — | (2,066 | )(1) | — | ||||||||||||||
| (1) | Application of tax loss carryforwards due to amnesty adoption. |
The statutory income tax rates applicable in 2007 in the countries where the Company operates, the years in which tax loss carryforwards may be applied and the open periods that remain subject to examination as of December 31, 2010 are as follows:
| Statutory Tax Rate | Expiration (Years) | Open Period (Years) | Statutory Tax Rate | Expiration (Years) | Open Period (Years) | ||||||||||||||
Mexico | 28 | % | 10 | 5 | 30 | % | 10 | 5 | |||||||||||
Guatemala | 31 | % | N/A | 4 | 31 | % | N/A | 4 | |||||||||||
Nicaragua | 30 | % | 3 | 4 | 30 | % | 3 | 4 | |||||||||||
Costa Rica | 30 | % | 3 | 3 | 30 | % | 3 | 4 | |||||||||||
Panama | 30 | % | 5 | 7 | 27.5 | % | 5 | 3 | |||||||||||
Colombia | 34 | % | 5–8 | 2 | 33 | % | Indefinite | 2-5 | |||||||||||
Venezuela | 34 | % | 3 | 4 | 34 | % | 3 | 4 | |||||||||||
Brazil | 34 | % | Indefinite | 5 | 34 | % | Indefinite | 6 | |||||||||||
Argentina | 35 | % | 5 | 6 | 35 | % | 5 | 5 | |||||||||||
The statutory income tax rate in Mexico was 30% for 2007, 20062010, and 200528% for 2009 and 2008.
In Panama, the statutory income tax rate for 2010 was 27.5% and 30% for 2009 and 2008.
On January 1, 2010, the Mexican Tax Reform was effective. The most important changes are described as follows: the value added tax rate (IVA) increases from 15% to 16%, an increase in special tax on productions and services from 25% to 26.5%; and the statutory income tax rate changes from 28% in 2009 to 30% for 2010, 2011 and 2012, and then in 2013 and 2014 will decrease to 29% and 28%, 29%respectively. Additionally, the Mexican tax reform requires that income tax payments related to consolidation tax benefits obtained since 1999, have to be paid during the next five years beginning on the sixth year when tax benefits were used (see Note 24 D and 30% respectively.E).
In Colombia, the tax losses generated before December 31, 2002, may be carried forward five yearsfor an indefinite period and those generated after January 1, 2003, may be carried forward eight years. Boththey are limited to 25% of the taxable income of each year. Additionally, the statutory tax rate of Colombia decreases from 38.5% in 2006 to 34% in 2007 and 33% in 2008, and the 5% tax imposed on dividends was eliminated in 2006.
In Brazil, tax losses may be carried forward for an indefinite period but cannot be restated and are limited to 30% of the taxable income of each year.
During 2009 and 2010, Brazil adopted new laws providing for certain tax amnesties. The tax amnesty programs offers Brazilian legal entities and individuals an opportunity to pay off their income tax and indirect tax debts under less stringent conditions than would normally apply. The amnesty programs also include a favorable option under which taxpayers may utilize income tax loss carry-forwards (“NOLs”) when settling certain outstanding income tax and indirect tax debts. Brazilian subsidiary of Coca-Cola FEMSA, decided to participate in the amnesty programs allowing it to settle certain previously accrued indirect tax contingencies. During the years ended, December 31, 2010 and 2009 the Company de-recognized indirect tax contingency accruals of Ps. 333 and Ps. 433 respectively (see Note 25 C), making payments of Ps. 118 and Ps. 243, recording a credit to other expenses of Ps. 179 and Ps. 311 (see Note 19), reversing previously recorded Brazil valuation allowances against NOL’s in 2009, and recording certain taxes recoverable.
| b) | Tax on Assets: |
Through 2006, the Mexican tax on assets was computed at an annual rate of 1.8% based on the average of certain assets at tax restated value less certain liabilities. Since January 1, 2007Effective in 2008, the tax on assets changed from 1.8% to 1.25% and also the deduction of liabilities washas been eliminated in order to determineMexico and it was replaced by the tax to be paid.Business Flat Tax (Impuesto Empresarial a Tasa Única, “IETU;” see Note 24 C). The amounts of tax on assets paid corresponding to previous periods to the IETU introduction can be recovered thru tax returns, only if the income tax is paid onlyhigher than the IETU generated in the same period, to the extent that it exceeds the income taxequivalent to 10% of the year. If in any year alesser tax on assets payment is required, this amount can be credited against the excess of any future income tax liability over the tax on assets in each of the preceding three years. Additionally, this payment may be restated and credited against the excess of the income tax liability over the calculated asset tax for the following 10 years.paid during 2007, 2006 or 2005.
The operations in Guatemala, Nicaragua, Colombia and Argentina are also subject to a minimum tax, which is based primarily on a percentage of assets. Any payments are recoverable in future years, under certain conditions.
| c) | Business Flat Tax (“IETU”): |
On September 14, 2007,Effective in 2008, the Mexican Senate approvedIETU came into effect in Mexico and replaced the 2008 Fiscal Reform Bill, which was approved by the President and subsequently published in the Diario Oficial (Official Gazette) on October 1, 2007. The most notable change in the fiscal reform relates to the introduction of a flat tax in Mexico. The IETU will replace the existing Tax on Assets and functionAssets. IETU functions are similar to an alternative minimum corporate income tax, except that any amounts paid are notcannot be creditable against future income tax payments. TaxpayersThe payable tax will be subject to the higher ofbetween the IETU or the income tax liability computed under the Mexican Income Tax Law.income tax law. The IETU will applyapplies to individuals and corporations, including permanent establishments of foreign entities in Mexico, at a rate of 17.5% beginning in 2010. The rates for 2008 and 2009 will bewere 16.5% and 17.0%, respectively. The IETU will beis calculated onunder a cash-flow basis, whereby the tax base is determined by reducing cash proceeds with certain deductions and credits. In the case of income derived from export sales, where cash on the receivable has not been collected within 12 months, income will be deemed received at the end of this 12-month period. The IETU will be effective beginning January 1, 2008. In addition, as opposed to ISRMexican income tax which allows for fiscal consolidation, companies that incur IETU are required to file their returns on an individual basis.
Based on its financial projections for purposes of its Mexican tax returns, the Company expects to pay corporate income tax in the future and does not expect to pay IETU. As such, the enactment of IETU did not impact the Company’s consolidated financial position or results of operations, as it only recognizes deferred income tax.operations.
| d) | Deferred Income Tax: |
Effective January 2008, in accordance with NIF B-10, “Effects of Inflation,” in Mexico the application of inflationary accounting is suspended. However, for taxes purposes, the balance of non monetary assets is restated through the application of National Consumer Price Index (NCPI) of each country. For this reason, the difference between accounting and taxable values will increase, generating a deferred tax.
The impact to deferred income tax generated by liabilities (assets) temporary differences that generated deferred income taxes liability (asset) are as follows:
Deferred Income Taxes | 2007 | 2006 | 2010 | 2009 | ||||||||||||
Allowance for doubtful accounts | Ps. | (116 | ) | Ps. | (114 | ) | Ps. | (71) | Ps. | (73) | ||||||
Inventories | 385 | 546 | 37 | (26) | ||||||||||||
Prepaid expenses | 120 | 131 | 75 | 70 | ||||||||||||
Property, plant and equipment | 5,325 | 5,214 | 1,418 | 1,596 | ||||||||||||
Investments in shares | (7 | ) | (10 | ) | 161 | (26) | ||||||||||
Intangible and other assets | (1,020 | ) | (847 | ) | ||||||||||||
Intangibles and other assets | (458) | (418) | ||||||||||||||
Amortized intangible assets | 197 | 27 | ||||||||||||||
Unamortized intangible assets | 1,769 | 2,264 | ||||||||||||||
Labor liabilities | (712 | ) | (497 | ) | (448) | (429) | ||||||||||
Recoverable tax on assets | (68 | ) | (50 | ) | ||||||||||||
Tax loss carryforwards | (3,722 | ) | (4,196 | ) | ||||||||||||
Valuation allowance | 3,053 | 3,375 | ||||||||||||||
Derivative financial instruments | (72 | ) | (260 | ) | 8 | 40 | ||||||||||
Loss contingencies | (568 | ) | (552 | ) | (703) | (805) | ||||||||||
Temporary non-deductible provision | (710 | ) | (810 | ) | (999) | (1,426) | ||||||||||
Employee profit sharing | (165 | ) | (150 | ) | ||||||||||||
Employee profit sharing payable | (125) | (137) | ||||||||||||||
Recoverable tax on assets | — | 48 | ||||||||||||||
Tax loss carryforwards | (988) | (1,867) | ||||||||||||||
Deferred tax from exchange of shares of FEMSA Cerveza (see Note 2) | 10,099 | — | ||||||||||||||
Other reserves | 597 | 163 | 249 | 502 | ||||||||||||
Deferred income taxes, net | 2,320 | 1,943 | 10,221 | (660) | ||||||||||||
Deferred income taxes asset | 1,264 | 2,052 | 346 | 1,527 | ||||||||||||
Deferred income taxes liability | Ps. | 3,584 | Ps. | 3,995 | Ps. | 10,567 | Ps. | 867 | ||||||||
The changes in the balance of the net deferred income taxestax liability are as follows:
| 2007 | 2006 | 2010 | 2009 | 2008 | ||||||||||||||||
Initial balance | Ps. | 1,943 | Ps. | 1,967 | Ps. | (660 | ) | Ps. | 670 | Ps. | 546 | |||||||||
Loss on monetary position | (43 | ) | (41 | ) | ||||||||||||||||
Tax provision for the year | (239 | ) | 95 | 875 | (31 | ) | (1,337 | ) | ||||||||||||
Change in the statutory income tax rate | — | (17 | ) | |||||||||||||||||
Change in the statutory rate | (58 | ) | (87 | ) | — | |||||||||||||||
Deferred tax from the exchange of shares of FEMSA (see Note 2) | 10,099 | — | — | |||||||||||||||||
Usage of tax losses related to exchange of FEMSA Cerveza (see Note 2) | 280 | — | — | |||||||||||||||||
Effect of tax loss carryforwards(1) | — | (1,874 | ) | — | ||||||||||||||||
Disposal of subsidiaries | (34 | ) | — | — | ||||||||||||||||
Effects in stockholders’ equity: | ||||||||||||||||||||
Additional labor liability over unrecognized net transition obligation | (107 | ) | 9 | |||||||||||||||||
Additional labor liability over unrecognized transition obligation | — | — | 129 | |||||||||||||||||
Derivative financial instruments | 75 | 80 | (29 | ) | ||||||||||||||||
Cumulative translation adjustment | 85 | 143 | (352 | ) | 609 | 1,263 | ||||||||||||||
Derivative financial instruments | 193 | (5 | ) | |||||||||||||||||
Result of holding non-monetary assets | 488 | (208 | ) | |||||||||||||||||
Retained earnings | (38 | ) | — | — | ||||||||||||||||
Deferred tax cancellation due to change in accounting principle | — | (71 | ) | — | ||||||||||||||||
Restatement effect of beginning balances | 34 | 44 | 98 | |||||||||||||||||
Ending balance | Ps. | 2,320 | Ps. | 1,943 | Ps. | 10,221 | Ps. | (660 | ) | Ps. | 670 | |||||||||
| ||||||||||||||||||||
| (1) | Effect due to 2010 Mexican tax reform, which deferred taxes were reclassified to other current liabilities and other liabilities according to its maturity. |
| e) | Provision for the Year: |
| 2007 | 2006 | 2005 | ||||||||||
Current income taxes | Ps. | 4,965 | Ps. | 4,476 | Ps. | 4,674 | ||||||
Tax on assets | 224 | 54 | 14 | |||||||||
Deferred income taxes | (239 | ) | 95 | (58 | ) | |||||||
Change in the statutory income tax rate | — | (17 | ) | (10 | ) | |||||||
Income taxes and tax on assets | Ps. | 4,950 | Ps. | 4,608 | Ps. | 4,620 | ||||||
| 2010 | 2009 | 2008 | ||||||||||
Current income taxes | Ps. | 4,854 | Ps. | 5,077 | Ps. | 4,445 | ||||||
Deferred income tax | 875 | (31 | ) | (1,337 | ) | |||||||
Change in the statutory rate(1) | (58 | ) | (87 | ) | — | |||||||
Income taxes and tax on assets | Ps. | 5,671 | Ps. | 4,959 | Ps. | 3,108 | ||||||
| ||||||||||||
| (1) | Effect due to 2010 Mexican tax reform. |
| f) | Tax Loss Carryforwards and Recoverable Tax on Assets: |
The subsidiaries in Mexico Panama, Colombia, Venezuela and Brazil have tax loss carryforwards and/or recoverable tax on assets. The expiration datestaxes effect net of such amountsconsolidation benefits and their years of expiration are as follows:
Year | Tax Loss Carryforwards | Recoverable Tax on Assets | Tax Loss Carryforwards | Recoverable Tax on Assets | ||||||||||
2008 | Ps. | 1 | Ps. | 1 | ||||||||||
2009 | 1 | 7 | ||||||||||||
2010 | — | — | ||||||||||||
2011 | 46 | 6 | Ps. | 185 | Ps. | 2 | ||||||||
2012 | 6 | 12 | — | — | ||||||||||
2013 | 90 | 12 | — | 26 | ||||||||||
2014 | 173 | 22 | — | 50 | ||||||||||
2015 | 113 | — | — | 2 | ||||||||||
2016 | — | — | 255 | 2 | ||||||||||
2017 and thereafter | 1,902 | 14 | ||||||||||||
No expiration (Brazil, see Note 23 a) | 8,689 | — | ||||||||||||
2017 | 254 | 102 | ||||||||||||
2018 and thereafter | 2,221 | — | ||||||||||||
No expiration (Brazil, see Note 24 A) | 457 | — | ||||||||||||
| 3,372 | 184 | |||||||||||||
Tax losses used in consolidation | (2,620 | ) | (133 | ) | ||||||||||
| Ps. | 11,021 | Ps. | 74 | Ps. | 752 | Ps. | 51 | |||||||
DueThe changes in the balance of tax loss carryforwards and recoverable tax on assets, excluding discontinued operations are as follows:
| 2010 | 2009 | |||||||
Initial balance | Ps. | 1,425 | Ps. | 2,610 | ||||
Provision | 18 | 491 | ||||||
Usage of tax losses | (600 | ) | (1,714 | ) | ||||
Translation effect of beginning balances | (40 | ) | 38 | |||||
Ending balance | Ps. | 803 | Ps. | 1,425 | ||||
As of December 31, 2010, there is not valuation allowance recorded due to the uncertainty related to the realization of certain tax loss carryforwards amounting to Ps. 8,979, a valuation allowance has been recorded to reduce the deferred incomeand tax asset associated with such carryforwards.on assets. The changes in the valuation allowance which reduce the related deferred taxes asset are as follows:
| 2007 | 2006 | |||||||
Initial balance | Ps. | 3,375 | Ps. | 607 | ||||
Kaiser acquisition | — | 3,157 | ||||||
Cancellation of provision | (157 | ) | (371 | ) | ||||
Restatement of the initial balance | (165 | ) | (18 | ) | ||||
Ending balance | Ps. | 3,053 | Ps. | 3,375 | ||||
| 2010 | 2009 | |||||||
Initial balance | Ps. | 1 | Ps. | 183 | ||||
Provision | — | — | ||||||
Usage of tax losses carryforwards | — | (195 | ) | |||||
Translation of foreign currency effect | (1 | ) | 13 | |||||
Ending balance | Ps. | — | Ps. | 1 | ||||
| g) | Reconciliation of Mexican Statutory Income Tax Rate to Consolidated Effective Income Tax Rate: |
| 2007 | 2006 | 2005 | 2010 | 2009 | 2008 | ||||||||||||||||
Mexican statutory income tax rate | 28 | % | 29.0 | % | 30.0 | % | 30.0 | % | 28.0 | % | 28.0 | % | |||||||||
Difference between book and tax inflationary effects | (1.1 | )% | (0.1 | )% | 0.6 | % | (3.9 | )% | (1.8 | )% | — | ||||||||||
Non-deductible expenses | 1.7 | % | 3.3 | % | 1.9 | % | |||||||||||||||
Change in inventory tax deduction | — | — | (2.1 | )% | |||||||||||||||||
Change in Mexican income tax rate | — | 0.1 | % | — | |||||||||||||||||
Difference between statutory income tax rates | 1.2 | % | 2.4 | % | 2.1 | % | |||||||||||||||
Non-taxable income | — | (1.5 | )% | (0.1 | )% | (2.4 | )% | (0.2 | )% | (0.6 | )% | ||||||||||
Other | 0.7 | % | 1.0 | % | 3.4 | % | (0.9 | )% | 1.2 | % | (0.6 | )% | |||||||||
| 29.3 | % | 31.8 | % | 33.7 | % | 24.0 | % | 29.6 | % | 28.9 | % | ||||||||||
Note 24.25. Other Liabilities, Contingencies and Commitments.
| a) | Other Current Liabilities: |
| 2010 | 2009 | |||||||
Derivative financial instruments | Ps. | 41 | Ps. | 45 | ||||
Sundry creditors | 1,681 | 1,542 | ||||||
Current portion of other long-term liabilities | 276 | 269 | ||||||
Short-term financing(1) | — | 66 | ||||||
Others | 37 | — | ||||||
Total | Ps. | 2,035 | Ps. | 1,922 | ||||
| (1) | Represents current portion of financing between FEMSA Holding and Cervecería Cuauhtémoc Moctezuma. Before the exchange of FEMSA Cerveza this short term financing was eliminated as part of consolidation. |
| b) | Other Liabilities: |
| 2010 | 2009 | |||||||
Contingencies | Ps. | 2,712 | (1) | Ps. | 2,467 | |||
Taxes payable | 872 | 1,428 | ||||||
Derivative financial instruments | 653 | 553 | ||||||
Current portion of other long-term liabilities | (276 | ) | (269 | ) | ||||
Others | 1,435 | 1,678 | ||||||
Total | Ps. | 5,396 | Ps. | 5,857 | ||||
| (1) | Includes Ps. 560 of tax loss contingencies regarding indemnification accorded with Heineken over FEMSA Cerveza prior tax contingencies. |
| c) | Contingencies Recorded in the Balance Sheet: |
The Company has various loss contingencies, and reserves have been recorded in those cases where the Company believes an unfavorable resolution is probable. Most of these loss contingencies were recorded as a result of recent business acquisitions. The following table presents the nature and amount of the loss contingencies recorded as of December 31, 2007:2010:
| Total | ||||
| Ps. | |||
Labor | 1,133 | |||
Legal | ||||
| ||||
Total | Ps. | |||
Changes in the Balance of Contingencies Recorded:
| 2010 | 2009 | |||||||
Initial balance | Ps. | 2,467 | Ps. | 2,076 | ||||
Provision | 716 | 475 | ||||||
Penalties and other charges | 376 | 258 | ||||||
Reversal of provision | (205 | ) | (241 | ) | ||||
Payments | (211 | ) | (190 | ) | ||||
Amnesty adoption | (333 | ) | (433 | ) | ||||
Translation of foreign currency of beginning balance | (98 | ) | 522 | |||||
Ending balance | Ps. | 2,712 | Ps. | 2,467 | ||||
| Unsettled Lawsuits: |
The Company has entered into legal proceedings with its labor unions, tax authorities and other parties that primarily involve Coca-Cola FEMSA and FEMSA Cerveza.FEMSA. These proceedings have resulted in the ordinary course of business and are common to the industry in which the Company operates. The aggregate amount being claimed against the Company resulting from such proceedings as of December 31, 20072010 is $311.Ps. 5,767. Such contingencies were classified by legal counsel as less than probable but more than remote of being settled against the Company. However, the Company believes that the ultimate resolution of such legal proceedings will not have a material adverse effect on its consolidated financial position or result of operations.
In recent years in its Mexican, Costa Rican and Brazilian territories, Coca-Cola FEMSA and FEMSA Cerveza havehas been requested to present certain information regarding possible monopolistic practices. These requests are commonly generated in the ordinary course of business in the beer and soft drink industriesindustry where those subsidiaries operate.
In 2001, a labor union and several individuals from the Republic of Colombia filed a lawsuit in the U.S. District Court for the Southern Division of Florida against certain Colombian subsidiaries and The Coca-Cola Company. In the complaint,
the plaintiffs alleged that the subsidiaries engaged in wrongful acts against the labor union and its members in Colombia and are seeking damages of $500.this subsidiary operates. The Company has filed a motiondoes not expect any significant liability to dismiss the complaint. On September 29, 2006, the Court entered a consolidated omnibus order dismissing the case for lack of subject matter jurisdiction and conclusively ruled that the Court did not have subject matter jurisdiction over any of the labor union and its member actions, and thus all of the claims against the Company were effectively dismissed. However, the plaintiffs have appealed this ruling.arise from these contingencies.
| Collateralized Contingencies: |
As is customary in Brazil, the Company has been requested by the tax authorities to collateralize tax contingencies currently in litigation amounting to Ps. 1,8872,292 by pledging fixed assets and entering into available lines of credit which cover such contingencies.
| Commitments: |
As of December 31, 2007,2010, the Company has capital and operating lease commitments for the leasingrental of production machinery and equipment, distribution equipment, computer equipment and land for FEMSA Comercio’s operations.
The contractual maturities of the lease commitments by currency, expressed in Mexican pesos as of December 31, 2007,2010, are as follows:
| Mexican Pesos | U.S. Dollars | Other | |||||||
2008 | Ps. | 1,309 | Ps. | 720 | Ps. | 76 | |||
2009 | 1,246 | 451 | 81 | ||||||
2010 | 1,204 | 58 | 83 | ||||||
2011 | 1,144 | 13 | 22 | ||||||
2012 and thereafter | 7,692 | — | — | ||||||
Total | Ps. | 12,595 | Ps. | 1,242 | Ps. | 262 | |||
| Mexican Pesos | U.S. Dollars | Other | ||||||||||
2011 | Ps. | 2,014 | Ps. | 94 | Ps. | 105 | ||||||
2012 | 1,906 | 95 | 109 | |||||||||
2013 | 1,820 | 79 | 34 | |||||||||
2014 | 1,706 | 78 | 8 | |||||||||
2015 | 1,636 | 764 | 8 | |||||||||
2016 and thereafter | 8,298 | — | 8 | |||||||||
Total | Ps. | 17,380 | Ps. | 1,110 | Ps. | 272 | ||||||
Rental expense charged to operations amounted to approximately Ps. 1,713,2,602 Ps. 1,5432,255 and Ps. 1,7071,816 for the years ended December 31, 2007, 20062010, 2009 and 2005,2008, respectively.
Note 25.26. Information by Segment.
Analytical information by segment is presented considering the business units and geographic areas in which the Company operates, and is presented according to the information used for decision-making of the administration.
The information presented is based on the Company’s accounting policies. Intercompany operations are eliminated and presented within the consolidation adjustment column.
The information by business unit operation and geographic area for the years ended December 31, 2010, 2009 and 2008, have been modified as a result of the discontinued operations (see Note 2).
a) By Business Unit:
| Coca-Cola FEMSA | FEMSA Cerveza | FEMSA Comercio | Other | Consolidation Adjustments | Consolidated | ||||||||||||||||||||||||||||||||||||||
2007 | |||||||||||||||||||||||||||||||||||||||||||
2010 | Coca-Cola FEMSA | FEMSA Comercio | CB Equity | Other (1) | Consolidation Adjustments | Consolidated | |||||||||||||||||||||||||||||||||||||
Total revenue | Ps. | 69,251 | Ps. | 39,566 | Ps. | 42,103 | Ps. | 8,124 | Ps. | (11,488 | ) | Ps. | 147,556 | Ps. 103,456 | Ps. 62,259 | Ps. | — | Ps. 12,010 | Ps. (8,023 | ) | Ps. 169,702 | ||||||||||||||||||||||
Intercompany revenue | 864 | 4,256 | 16 | 6,352 | (11,488 | ) | — | 1,642 | 2 | — | 6,379 | (8,023 | ) | — | |||||||||||||||||||||||||||||
Income from operations | 11,447 | 5,404 | 2,315 | 403 | — | 19,569 | 17,079 | 5,200 | (3 | ) | 253 | — | 22,529 | ||||||||||||||||||||||||||||||
Depreciation(1) | 2,637 | 1,637 | 543 | 113 | — | 4,930 | |||||||||||||||||||||||||||||||||||||
Depreciation(2) | 3,333 | 990 | — | 204 | — | 4,527 | |||||||||||||||||||||||||||||||||||||
Amortization | 241 | 1,786 | 399 | 39 | — | 2,465 | 403 | 545 | — | 27 | — | 975 | |||||||||||||||||||||||||||||||
Other non-cash charges(2) (3) | 173 | 426 | 28 | 90 | — | 717 | |||||||||||||||||||||||||||||||||||||
Impairment of long-lived assets | — | 91 | — | 2 | — | 93 | |||||||||||||||||||||||||||||||||||||
Other non-cash charges(3) (4) | 207 | 62 | — | 117 | — | 386 | |||||||||||||||||||||||||||||||||||||
Write-off of long-lived assets | 7 | — | — | 2 | — | 9 | |||||||||||||||||||||||||||||||||||||
Interest expense | 2,139 | 2,102 | 449 | 1,001 | (1,137 | ) | 4,554 | 1,748 | 917 | — | 951 | (351 | ) | 3,265 | |||||||||||||||||||||||||||||
Interest income | 613 | 342 | 38 | 913 | (1,137 | ) | 769 | 285 | 25 | 2 | 1,143 | (351 | ) | 1,104 | |||||||||||||||||||||||||||||
Equity method from associates | 217 | — | 3,319 | 2 | — | 3,538 | |||||||||||||||||||||||||||||||||||||
Income taxes | 3,336 | 888 | 377 | 349 | — | 4,950 | 4,260 | 499 | 208 | 704 | — | 5,671 | |||||||||||||||||||||||||||||||
Capital expenditures | 3,682 | 5,373 | 2,112 | 90 | — | 11,257 | 7,478 | 3,324 | — | 369 | — | 11,171 | |||||||||||||||||||||||||||||||
Net cash flows provided by (used in) operating activities | 14,350 | 6,704 | — | (3,252 | ) | — | 17,802 | ||||||||||||||||||||||||||||||||||||
Net cash flows (used in) provided by investment activities | (6,845 | ) | (3,288 | ) | 553 | 15,758 | — | 6,178 | |||||||||||||||||||||||||||||||||||
Net cash flow (used in) financing activities | (2,011 | ) | (819 | ) | (504 | ) | (7,162 | ) | — | (10,496 | ) | ||||||||||||||||||||||||||||||||
Long-term assets | 69,720 | 50,562 | 9,057 | 12,686 | (9,715 | ) | 132,310 | 87,625 | 14,655 | 66,478 | 4,785 | (1,425 | ) | 172,118 | |||||||||||||||||||||||||||||
Total assets | 87,178 | 65,539 | 14,284 | 18,743 | (19,949 | ) | 165,795 | 114,061 | 23,677 | 67,010 | 27,705 | (8,875 | ) | 223,578 | |||||||||||||||||||||||||||||
2006 | |||||||||||||||||||||||||||||||||||||||||||
Total revenue | Ps. | 64,046 | Ps. | 37,919 | Ps. | 36,835 | Ps. | 7,966 | Ps. | (10,646 | ) | Ps. | 136,120 | ||||||||||||||||||||||||||||||
Intercompany revenue | 722 | 3,911 | 13 | 6,000 | (10,646 | ) | — | ||||||||||||||||||||||||||||||||||||
Income from operations | 10,251 | 6,121 | 1,664 | 431 | — | 18,467 | |||||||||||||||||||||||||||||||||||||
Depreciation(1) | 2,595 | 1,818 | 431 | 110 | — | 4,954 | |||||||||||||||||||||||||||||||||||||
Amortization | 253 | 2,018 | 363 | 36 | — | 2,670 | |||||||||||||||||||||||||||||||||||||
Other non-cash charges(2) (3) | 143 | 238 | 15 | 88 | — | 484 | |||||||||||||||||||||||||||||||||||||
Impairment of long-lived assets | 79 | 121 | — | 8 | — | 208 | |||||||||||||||||||||||||||||||||||||
Interest expense | 2,252 | 1,646 | 402 | 525 | (526 | ) | 4,299 | ||||||||||||||||||||||||||||||||||||
Interest income | 383 | 228 | 53 | 654 | (526 | ) | 792 | ||||||||||||||||||||||||||||||||||||
Income taxes | 2,555 | 1,476 | 360 | 217 | — | 4,608 | |||||||||||||||||||||||||||||||||||||
Capital expenditures | 2,863 | 4,419 | 1,943 | 197 | — | 9,422 | |||||||||||||||||||||||||||||||||||||
Long-term assets | 67,955 | 48,570 | 7,912 | 7,901 | (5,651 | ) | 126,687 | ||||||||||||||||||||||||||||||||||||
Total assets | 80,464 | 62,228 | 12,311 | 10,781 | (11,268 | ) | 154,516 | ||||||||||||||||||||||||||||||||||||
2005 | |||||||||||||||||||||||||||||||||||||||||||
Total revenue | Ps. | 59,642 | Ps. | 29,768 | Ps. | 31,021 | Ps. | 6,485 | Ps. | (7,454 | ) | Ps. | 119,462 | ||||||||||||||||||||||||||||||
Intercompany revenue | 650 | 2,232 | 2 | 4,570 | (7,454 | ) | — | ||||||||||||||||||||||||||||||||||||
Income from operations | 9,973 | 5,800 | 1,360 | 306 | — | 17,439 | |||||||||||||||||||||||||||||||||||||
Depreciation(1) | 2,610 | 1,617 | 348 | 107 | — | 4,682 | |||||||||||||||||||||||||||||||||||||
Amortization | 185 | 1,881 | 301 | 16 | — | 2,383 | |||||||||||||||||||||||||||||||||||||
Other non-cash charges(2) (3) | 181 | 162 | 7 | 69 | — | 419 | |||||||||||||||||||||||||||||||||||||
Impairment of long-lived assets | — | 82 | — | 2 | — | 84 | |||||||||||||||||||||||||||||||||||||
Interest expense | 2,757 | 1,312 | 381 | 760 | (451 | ) | 4,759 | ||||||||||||||||||||||||||||||||||||
Interest income | 378 | 226 | 70 | 542 | (451 | ) | 765 | ||||||||||||||||||||||||||||||||||||
Income taxes | 2,698 | 1,186 | 309 | 427 | — | 4,620 | |||||||||||||||||||||||||||||||||||||
Capital expenditures | 2,516 | 3,197 | 1,528 | 267 | — | 7,508 | |||||||||||||||||||||||||||||||||||||
| (1) | Includes |
| (2) |
| (3) | Equivalent to non-cash operating expenses as presented in the |
| (4) | Includes the cost for the |
2009 Total revenue Intercompany revenue Income from operations Depreciation(2) Amortization Other non-cash charges(3) (4) Write-off of long-lived assets Interest expense Interest income Equity method from associates Income taxes Capital expenditures Net cash flows provided by operating activities Net cash flows (used in) provided by investment activities Net cash flow (used in) provided by financing activities Long-term assets(5) Total assets(5) 2008 Total revenue Intercompany revenue Income from operations Depreciation(2) Amortization Other non-cash charges(3) (4) Write-off of long-lived assets Interest expense Interest income Equity method from associates Income taxes Capital expenditures Net cash flows provided by operating activities Net cash flows used in investment activities Net cash flow (used in) provided by financing activities Coca-Cola
FEMSA FEMSA
Comercio Other (1) Consolidation
Adjustments Consolidated Ps. 102,767 Ps. 53,549 Ps. 10,991 Ps. (7,056 ) Ps. 160,251 1,277 2 5,777 (7,056 ) — 15,835 4,457 838 — 21,130 3,473 819 99 — 4,391 307 461 30 — 798 368 49 247 664 124 — 5 129 1,895 954 1,594 (432 ) 4,011 286 27 1,324 (432 ) 1,205 142 — (10 ) — 132 4,043 544 372 — 4,959 6,282 2,668 153 9,103 16,663 4,339 1,742 — 22,744 (8,900 ) (2,634 ) 158 — (11,376 ) (6,029 ) (346 ) (1,514 ) — (7,889 ) 87,022 12,378 20,754 (4,779 ) 115,375 110,661 19,693 31,346 (8,062 ) 153,638 Ps. 82,976 Ps. 47,146 Ps. 9,401 Ps. (5,715 ) Ps. 133,808 1,009 2 4,704 (5,715 ) — 13,695 3,077 577 — 17,349 3,036 663 63 — 3,762 240 422 27 — 689 145 46 104 — 295 371 — 7 — 378 2,207 665 1,254 (303 ) 3,823 433 27 708 (303 ) 865 104 (14 ) — 90 2,486 351 271 — 3,108 4,802 2,720 294 7,816 11,901 3,201 921 — 16,023 (7,299 ) (2,718 ) (1,250 ) — (11,267 ) (5,261 ) 870 (1,152 ) — (5,543 )
| (1) | Includes other companies (see Note 1) and corporate. |
| (2) | Includes bottle breakage. |
| (3) | Equivalent to non-cash operating expenses as presented in the Consolidated Statement of Cash Flows. |
| (4) | Includes the cost for the period related to labor liabilities (see Note 16 D). |
| (5) | Consolidated long-term assets and consolidated total assets presented in this table do not match to those figures presented in the consolidated statements of financial position due to discontinued operations. |
| b) | By Geographic Area: |
The Company’s operations are grouped in the following divisions: (i) Mexico division; (ii) Latincentro division, which is comprised of the territories operated in Central America and Colombia; (iii) Venezuela; (iv) Mercosur division, which is comprised of the territories operated in Brazil and Argentina; and (v) Europe.
2007 | Total Revenue | Capital Expenditures | Long-Lived Assets | Total Assets | |||||||||||
Mexico | Ps. | 106,136 | Ps. | 9,137 | Ps. | 98,302 | Ps. | 120,965 | |||||||
Central America(1) | 4,850 | 328 | 6,058 | 7,075 | |||||||||||
Colombia | 7,051 | 643 | 7,681 | 11,193 | |||||||||||
Venezuela | 9,792 | (9 | ) | 4,155 | 6,364 | ||||||||||
Brazil | 16,093 | 879 | 14,611 | 21,615 | |||||||||||
Argentina | 4,034 | 279 | 1,503 | 2,534 | |||||||||||
Consolidation adjustments | (400 | ) | — | — | (3,951 | ) | |||||||||
Consolidated | Ps. | 147,556 | Ps. | 11,257 | Ps. | 132,310 | Ps. | 165,795 | |||||||
2006 | Total Revenue | Capital Expenditures | Long-Lived Assets | Total Assets | |||||||||||
Mexico | Ps. | 99,310 | Ps. | 7,807 | Ps. | 95,559 | Ps. | 113,570 | |||||||
Central America(1) | 4,592 | 78 | 5,490 | 6,504 | |||||||||||
Colombia | 6,556 | 586 | 6,994 | 10,220 | |||||||||||
Venezuela | 7,997 | 221 | 4,324 | 5,773 | |||||||||||
Brazil | 14,378 | 510 | 12,871 | 18,849 | |||||||||||
Argentina | 3,458 | 220 | 1,449 | 2,335 | |||||||||||
Consolidation adjustments | (171 | ) | — | — | (2,735 | ) | |||||||||
Consolidated | Ps. | 136,120 | Ps. | 9,422 | Ps. | 126,687 | Ps. | 154,516 | |||||||
2005 | Total Revenue | Capital Expenditures | |||||||||||||
Mexico | Ps. | 90,561 | Ps. | 5,934 | |||||||||||
Central America(1) | 4,022 | 218 | |||||||||||||
Colombia | 6,147 | 434 | |||||||||||||
Venezuela | 7,188 | 517 | |||||||||||||
Brazil | 8,433 | 259 | |||||||||||||
Argentina | 3,256 | 146 | |||||||||||||
Consolidation adjustments | (145 | ) | — | ||||||||||||
Consolidated | Ps. | 119,462 | Ps. | 7,508 | |||||||||||
Venezuela operates in an economy with exchange controls. As a result, Bulletin B-5 “Information by Segments” does not allow its integration into another geographical segment.
2010 Mexico Latincentro(1) Venezuela Mercosur(2) Europe Consolidation adjustments Consolidated 2009(3) Mexico Latincentro(1) Venezuela Mercosur(2) Consolidation adjustments Consolidated 2008(3) Mexico Latincentro(1) Venezuela Mercosur(2) Consolidation adjustments Consolidated Total
Revenue Capital
Expenditures Long-Lived
Assets Total Assets Ps. 105,448 Ps. 6,297 Ps. 64,310 Ps. 100,657 17,492 1,773 18,982 22,162 14,048 505 5,469 7,882 33,409 2,596 16,879 27,418 — — 66,478 67,010 (695 ) — — (1,551 ) Ps. 169,702 Ps. 11,171 Ps. 172,118 Ps. 223,578 Ps. 94,819 Ps. 5,484 Ps. 73,563 Ps. 98,404 16,211 1,298 17,992 20,635 22,448 1,253 8,945 13,746 27,604 1,068 14,875 23,158 (831 ) — — (2,305 ) Ps. 160,251 Ps. 9,103 Ps. 115,375 Ps. 153,638 Ps. 84,920 Ps. 4,780 Ps. 63,398 Ps. 83,142 12,853 1,265 16,742 21,150 15,217 722 6,883 9,799 21,227 1,049 12,215 17,546 (409 ) — — (4,804 ) Ps. 133,808 Ps. 7,816 Ps. 99,238 Ps. 126,833
| (1) | Includes Guatemala, Nicaragua, Costa Rica, Panama and |
| (2) | Includes Brazil and Argentina. |
| (3) | Consolidated and Mercosur long-lived assets and consolidated total assets presented in this table do not match to those figures presented in the consolidated statement of financial position due to discontinued operations. |
Note 26.27. Differences Between Mexican FRS and U.S. GAAP.
The United States Financial Accounting Standards Board (“FASB”) released the FASB Accounting Standards Codification, or Codification for short, on January 15, 2008 and it became effective in July 2009. At that time all previous reference sources to accounting principles generally accepted in the United States of America (“U.S. GAAP”) became obsolete. The Codification organizes all U.S. GAAP pronouncements under approximately 90 accounting topic areas. The objective of this project was to arrive at a single source of authoritative U.S. accounting and reporting standards, other than certain guidance issued by the SEC. Included in this Note and Note 28 and 29 are references to certain U.S. GAAP Codifications (“ASC”) that have been adopted by the Company and certain ASC’s that have yet to be adopted by the Company.
As discussed in Note 2,3, the consolidated financial statements of the Company are prepared in accordance with Mexican FRS, which differs in certain significant respects from U.S. GAAP. A reconciliation of the reported majority net income, majority stockholders’ equity and majority comprehensive income to U.S. GAAP is presented in Note 27. It should be noted that this reconciliation to U.S. GAAP does not include the reversal of the restatement of the financial statements as required by NIF Bulletin B-10, “Recognition of the Effects of Inflation in the Financial Information,” of Mexican FRS.
The application of this bulletin represents a comprehensive measure of the effects of price-level changes in the Mexican economy and, as such, is considered a more meaningful presentation than historical cost-based financial reporting in Mexican pesos for both Mexican and U.S. accounting purposes.28.
The principal differences between Mexican FRS and U.S. GAAP included in the reconciliation that affect the consolidated financial statements of the Company are described below.
| a) | Consolidation of Coca-Cola FEMSA: |
UnderThe Company consolidates its investment in Coca-Cola FEMSA under Mexican FRS, the Company consolidates Coca-Cola FEMSA since it owns a majority of the outstanding voting capital stock and exercises control over the operations of Coca-Cola FEMSA in the ordinary course of business in accordance with the requirements of Mexican NIF Bulletin B-8 “Consolidated and Combined Financial Statements and Valuation of Long-Term Investments in Shares.” Pursuant toShares” through 2008 and revised NIF Bulletin B-8 Coca-Cola FEMSA meets“Consolidated and Combined Financial Statements” beginning in 2009 as disclosed in Note 3 G.
For U.S. GAAP purposes, the criteriaexistence of a subsidiary for consolidation as FEMSA holds more than 50% of Coca-Cola FEMSA’s outstanding voting stock and has not yielded control to a minority shareholder. NIF Bulletin B-8 establishes that control has been yielded when a minority shareholder obtains:
Control over more than 50% of the voting rights through a formal agreement with other shareholders;
The power derived from by-laws or formal agreement by shareholders to govern the operating and financial policies of a company;
The power to appoint or remove a majority of the Board of Directors or any organization that governs the operating and financial policies of the company; or
The power to decide the majority of the votes of the Board of Directors.
No minority shareholder of Coca-Cola FEMSA has obtained any of the rights described above.
The shareholder agreement grants The Coca-Cola Company substantive participating rights. The affirmative vote of two Directors appointed by The Coca-Cola Company is, with limited exceptions, required for matters considered by the Board of Directors, including the designation of the Chief Executive Officer and the Chief Financial Officer, the annual business plan, capital investment plan and asset disposals, mergers, acquisitions or sales of any line of business. Under Emerging Issues Task Force (“EITF”) 96-16, “Investor’s Accounting for an Investee When the Investor Owns a Majority of the Voting Stock but the Minority Shareholder or Shareholders Have Certain Approval or Veto Rights,” such approval and veto rights held by Thethe Coca-Cola Company qualify(noncontrolling interest), as substantive participating rights and therefore doaddressed in the shareholder agreement, did not allow FEMSA to consolidate Coca-Cola FEMSA in its financial statements for U.S. GAAP purposes.statements. Therefore, FEMSA’s investment in Coca-Cola FEMSA is recordedhad been accounted for by applying the equity method in FEMSA’s consolidated financial statementsstatement under U.S. GAAP.
Summarized consolidated balance sheets and income statements of Coca-Cola FEMSA and subsidiaries under U.S. GAAP as of December 31, 2007 and 2006 and for the years ended December 31, 2007, 20062009 and 20052008.
As of December 31, 2009, the fair value of FEMSA’s investment in Coca-Cola FEMSA represented by 992,078,519 shares equivalent to 53.7% of its outstanding shares amounted to Ps. 85,135 based on quoted market prices of that date.
Coca-Cola FEMSA’s summarized consolidated balance sheet and income statements under US GAAP are presented as follows as of December 31;
Consolidated Balance Sheets | 2009 | |||
Current assets | Ps. 24,676 | |||
Property, plant and equipment | 29,835 | |||
Other assets | 53,918 | |||
Total assets | Ps. 108,429 | |||
Current liabilities | 23,460 | |||
Long-term liabilities | 18,932 | |||
Total liabilities | Ps. 42,392 | |||
Total stockholders’ equity: | ||||
Controlling interest | 63,704 | |||
Noncontrolling interest in consolidated subsidiaries | 2,333 | |||
Total stockholders’ equity | 66,037 | |||
Total liabilities and stockholders’ equity | Ps. 108,429 | |||
Consolidated Income Statements | 2009 | 2008 | ||||||
Total revenues | Ps. 100,393 | Ps. 81,099 | ||||||
Income from operations | 14,215 | 12,042 | ||||||
Income before income taxes | 12,237 | 7,685 | ||||||
Income taxes | 3,525 | 1,987 | ||||||
Consolidated net income | 8,853 | 5,802 | ||||||
Less: Net income attributable to the noncontrolling interest | (446 | ) | (231 | ) | ||||
Net income attributable to the controlling interest | 8,407 | 5,571 | ||||||
Consolidated comprehensive income | 10,913 | 6,288 | ||||||
Less: Comprehensive income attributable to the noncontrolling interest | (592 | ) | (175 | ) | ||||
Consolidated comprehensive income attributable to the controlling interest | Ps. 10,321 | Ps. 6,113 | ||||||
On February 1, 2010, FEMSA and the Coca-Cola Company signed an amendment to their shareholder’s agreement. This amendment allowed FEMSA to continue to consolidate Coca-Cola FEMSA for Mexican FRS purposes during 2009, because the Company has maintained control over its operating and financial policies. As a result of the modifications to the shareholders’ agreement, substantive participating rights held by The Coca-Cola Company were amended and became protective rights. As a result of the modifications made to the shareholders agreement, which provided control to the Company over Coca-Cola FEMSA, the Company recognized a business combination without transfer of consideration in order to comply with ASC 805 and beginning February 1, 2010 started to consolidate Coca-Cola FEMSA for U.S. GAAP purposes.
The Company estimated the total fair value of Coca-Cola FEMSA based on Coca-Cola FEMSA’s outstanding shares price quoted in the Mexican Stock Exchange of Ps. 80.21 (level 1 information) as of February 1, 2010. As a result of a business combination without transfer of consideration, the Company recognized a gain in other income in the consolidated income statements under U.S. GAAP which amounted to Ps. 39,847. This gain represents the difference between the book value and the fair value of the investment acquired in Coca-Cola FEMSA as of the date of the control acquisition and is reported in “other income, net”.
As of the acquisition date and based on the purchase price allocation, the Company has mainly identified intangible assets with indefinite lives consisting of distribution rights of Ps. 113,434 and depreciable long-lived assets that amounted to Ps. 27,409. The Company has also recognized goodwill of Ps. 41,761 as part of this transaction. The goodwill recognized with our control acquisition of Coca-Cola FEMSA is primarily related to synergistic value created from having an unified operating system that will strategically position us to better market and distribute our beverage brands in Mexico, Central America, Brazil, Colombia, Venezuela and Argentina.
The purchase price allocation based on estimated fair value of all Coca-Cola FEMSA net assets acquired by the Company is as follows:
Consolidated Balance Sheets | 2007 | 2006 | ||||
Current assets | Ps. | 18,065 | Ps. | 11,942 | ||
Property, plant and equipment | 22,968 | 21,242 | ||||
Other assets | 47,550 | 45,370 | ||||
Total assets | Ps. | 88,583 | Ps. | 78,554 | ||
Current liabilities | Ps. | 16,245 | Ps. | 12,618 | ||
Long-term liabilities | 21,213 | 22,906 | ||||
Total liabilities | 37,458 | 35,524 | ||||
Minority interest in consolidated subsidiaries | 1,653 | 1,260 | ||||
Stockholders’ equity | 49,472 | 41,770 | ||||
Total liabilities and stockholders’ equity | Ps. | 88,583 | Ps. | 78,554 | ||
Total current assets | Ps | . 19,874 | ||
Property, plant and equipment | 31,431 | |||
Distribution rights | 113,434 | |||
Other long-term assets | 5,548 | |||
Total current liabilities | 19,054 | |||
Total long-term liabilities | 40,156 | |||
Total liabilities | 59,210 | |||
Net assets acquired | 111,077 | |||
Goodwill | 41,761 | |||
Total purchase price allocation | 152,838 | |||
Fair Value of the noncontrolling interest in the subsidiaries of Coca-Cola FEMSA(1) | 4,728 | |||
Fair Value of the noncontrolling interest of FEMSA in Coca-Cola FEMSA(2) | 68,535 | |||
Fair Value of the controlling interest acquired in Coca-Cola FEMSA | 79,575 | |||
Consolidated Income Statements | 2007 | 2006 | 2005 | |||||||
Total revenues | Ps. | 69,131 | Ps. | 59,940 | Ps. | 54,196 | ||||
Income from operations | 10,741 | 8,749 | 8,720 | |||||||
Income before income taxes | 10,225 | 7,700 | 7,404 | |||||||
Income taxes | 3,271 | 2,420 | 2,467 | |||||||
Minority interest in results of consolidated subsidiaries | 189 | 176 | 128 | |||||||
Net income | 6,765 | 5,104 | 4,809 | |||||||
Other comprehensive income | 1,768 | 1,023 | (336 | ) | ||||||
Comprehensive income | Ps. | 8,533 | Ps. | 6,127 | Ps. | 4,473 | ||||
| (1) | The fair value of the noncontrolling interest in the subsidiaries of Coca-Cola FEMSA was estimated using the market approach. The main inputs used to estimate fair value were multiples of comparable companies from the countries in which the subsidiaries have noncontrolling interests. |
| (2) | The fair value of the noncontrolling interest of FEMSA in Coca-Cola FEMSA was estimated using the market approach. The main input used to estimate fair value was share prices quoted in the Mexican Stock Exchange. |
After acquisition date, depreciation and amortization of identified assets net of deferred income tax resulted in Ps. 661.
The Company recognized within its consolidated income statement revenues of Ps. 95,839 and a net income of Ps. 9,734 for the year ended December 31, 2010, for the eleven months of operations related to Coca-Cola FEMSA after the acquisition date.
Unaudited Pro Forma Financial Data
The following unaudited consolidated pro forma financial data represents the Company’s historical financial statements, adjusted to give effect to (i) the acquisition of Coca Cola FEMSA mentioned in the preceding paragraphs; and (ii) certain accounting adjustments related mainly to the depreciation of the step-up adjustment for fixed assets acquired, (iii) eliminating the gain on the acquisition of Coca-Cola FEMSA.
The unaudited pro forma adjustments assume that the acquisition was made at the beginning of the year immediately preceding the year of acquisition and are based upon available information and other assumptions that management considers reasonable. The pro forma financial information data does not purport to represent what the effect on the Company’s consolidated operations would have been, had the transactions in fact occurred at the beginning of each year, nor are they intended to predict the Company’s future results of operations.
| FEMSA unaudited pro forma consolidated results for the years ended December 31, | ||||||||
| 2010(2) | 2009(2) | |||||||
Total revenues | 184,336 | 195,090 | ||||||
Income before taxes(1) | 47,607 | 18,924 | ||||||
Net income(1) | 32,543 | 15,022 | ||||||
| (1) | In 2010 includes gain of the FEMSA Cerveza exchange. |
| (2) | Does not include gain due to Coca-Cola FEMSA’s control acquisition. |
| b) | Exchange of FEMSA Cerveza and Acquisition of 20% Economic Interest in Heineken: |
As explained in Note 2, on April 30, 2010, FEMSA exchanged 100% of its shares in FEMSA Cerveza for a 20% economic interest in Heineken Group. According to Mexican FRS, the disposal of FEMSA Cerveza has been accounted as a discontinued operation.
For U.S. GAAP purposes, FEMSA Cerveza has not been accounted for as a discontinued operation, given the significant cash flows that continue to be exchanged between FEMSA’s ongoing operations and those of the disposed entity. As a result, the disposition was accounted for as a sale of a group of assets and classified within continuing operations in the consolidated financial statements under U.S. GAAP, and not as the disposal of a component of FEMSA. As such, the Company’s Mexican FRS consolidated income statements have reported FEMSA Cerveza’s results of operations prior to the April 30, 2010 exchange in one line item (discontinued operations).For U.S. GAAP purposes it continues to fully consolidate its line by line results prior to the exchange. Additionally, the Company’s Mexican FRS consolidated balance sheet has segregated the FEMSA Cerveza assets and liabilities as current and noncurrent assets and liabilities of discontinued operations as of December 31, 2009, but under U.S. GAAP continues to report individual line items as of such date. See Note 2 for summarized FEMSA Cerveza financial statements for dates and periods prior to April 30, 2010 under Mexican FRS.
The acquisition of the 20% economic interest in Heineken has been accounted for taking into consideration closing prices of Heineken N.V. and Heineken Holding N.V. as of the acquisition date (see Note 2) As of April 30, 2010, under U.S. GAAP, the Company recognized a gain of Ps. 27,132 within other income in the consolidated statements of income and comprehensive income, which represents the difference between the book value of its interest in FEMSA Cerveza and the acquisition value of Heineken recorded at the exchange date. The basis of the assets and liabilities under U.S. GAAP of the FEMSA Cerveza at the exchange date was different from the basis of such assets and liabilities under Mexican FRS, additionally the goodwill of Ps. 10,600 allocated to FEMSA Cerveza was cancelled as part of this transaction (see Note 27 N); accordingly, the gain recorded on disposal under U.S. GAAP differs from that under Mexican FRS. The deferred income taxfor U.S. GAAP purposes amounted to Ps.10,099.
For subsequent accounting the Company recognizes its investment in Heineken for purposes of Mexican FRS under the equity method after reconciling Heineken’s net income and comprehensive income from IFRS to Mexican FRS, as a result of its ability to exercise significant influence over its operating and financial policies as disclosed in Note 2. However, for purposes of U.S. GAAP, the Company recognizes its investment in Heineken based on the cost method because it was unable to obtain the required information to reconcile Heineken’s net income to U.S. GAAP on an accurate and reliable basis.
| c) | Restatement of Prior Year Financial |
Beginning on January 1, 2008, in accordance with NIF B-10, the Company discontinued inflationary accounting for subsidiaries that operate in non-inflationary economic environments. As explaineda result, financial statements are no longer restated for inflation after Dec. 31, 2007. The cumulative effect of previously realized and unrealized results of holding non-monetary assets (RETANM) of previous periods was reclassified to retained earnings as described in Note 3 I. This reclassification does not result in a difference to reconcile for U.S. GAAP purposes since those amounts are ultimately recognized in the Company’s financial statements.
As a result of discontinued inflationary accounting for subsidiaries that operate in non-inflationary economic environments, the Company’s financial statements are no longer considered to be presented in a reporting currency that comprehensively includes the effects of price level changes; therefore, the inflationary effects of inflationary economic environments arising in 2008, 2009 and 2010 result in a difference to be reconciled for U.S. GAAP purposes. The equity method of Coca-Cola FEMSA recorded by FEMSA as of January 31, 2010, and December 31, 2009 and 2008 considers this difference, as well as the consolidated net income for the eleven months ended on December 31, 2010.
As disclosed in Note 5 A, the three year cumulative inflation rate for Venezuela was 100.5% for the period 2007 through 2009. The three year cumulative inflation rate for Venezuela was 108.2 % as of December 31, 2010. Accordingly, Venezuela is accounted for as a hyper-inflationary economy for U.S. GAAP purposes since January 1, 2010.
For U.S. GAAP reconciliation purposes, the Company has applied an accommodation available in Item 18 to the instructions to Form 20-F whereby the International Accounting Standard 21 Changes in Foreign Exchange Rates (IAS 21) and IAS 29 Financial Reporting in Hyperinflationary Economies (IAS 29) indexation approach is applied. U.S. GAAP would otherwise require a hyper-inflationary economy to be reported using the U.S. dollar as a functional currency. The information related to the revenues as well as long-term assets and total assets related to the Venezuelan subsidiary are shown separately in the segment disclosure footnote (see Note 26). Recent devaluations in the Venezuelan currency are also discussed in Note 4 a), in accordance with Mexican FRS, the financial statements for Mexican subsidiaries for prior years were restated using inflation factors and for foreign subsidiaries and affiliated companies for prior years was restated using the inflation rate of the country in which the foreign subsidiary or affiliated company is located, then translated to Mexican pesos at the year-end exchange rate.above.
Under U.S. GAAP, the Company applies the regulations of the Securities and Exchange Commission of the United States of America (“SEC”), which require that prior year financial statements be restated in constant units of the reporting currency, in this case the Mexican peso, which requires the restatement of prior year amounts using Mexican inflation factors.
Additionally, all other U.S. GAAP adjustments for prior years have been restated based upon this methodology.
| Classification Differences: |
Certain items require a different classification in the balance sheet or income statement under U.S. GAAP. These include:
As explained in Note 4 c),5 D, under Mexican FRS, advances to suppliers are recorded as inventories. Under U.S. GAAP advances to suppliers are classified as prepaid expenses;
Beginning on January 1, 2010, restricted cash has been classified from other current assets to cash and cash equivalents according to NIF C-1 Cash and Cash Equivalents. Under U.S. GAAP, restricted cash remains classified as other current or long term assets;
Impairment of goodwill and other long-lived assets, the gains or losses on the disposition of fixed assets, all severance indemnity chargespayments associated with an ongoing benefit and amendments to pension plans, financial expenses from labor liabilities and employee profit sharing, among others, are included inrecorded as part of operating expensesincome under U.S. GAAP; and
Under Mexican FRS, deferred taxes are classified as non-current, while under U.S. GAAP they are classified based on the classification of the related asset or liability or their estimated reversal date when not associated with an asset or liability.liability;
As explained in Note 4 d), forUnder Mexican FRS, purposes, the promotional costs related to the launchingmarket value gain/loss of new products or presentationsembeded derivatives contracts are recorded as prepaid expenses.market value gain/loss of ineffective portion of derivatives financial instruments. For U.S. GAAPUSGAAP purposes, such promotionalthis effect has been reclassified to operating expenses; and
Under Mexican FRS, restructuring costs are expensedrecorded as incurred. As of December 31, 2007, 2006 and 2005, this difference was reconciled by Coca-Cola FEMSA and its impact in FEMSA is included in the participation of Coca-Cola FEMSA. No other consolidated entity has deferred promotional expenses.expenses while for USGAAP purposes restructuring costs are recorded as operating expense.
| e) | Start-Up Expenses: |
As explained in Note 4 i),5 K, through 2008, under Mexican FRS, start-up expenses arewere capitalized and amortized using the straight-line method in accordance with the terms of the lease contracts at the start of operations. Under U.S. GAAP, these expenses must be recorded in the income statement as incurred, except forincurred. Beginning on January 1, 2009, the licenses for the sale of beer paid for by FEMSA Comercio,Company adopted NIF C-8 “Intangible Assets”, which are consideredestablishes that start-up expenses have to be intangible assetsrecorded in the income statement as incurred (see Note 5 K). As a result, since 2009, there are no differences between Mexican FRS and amortized using the straight-line method beginning at the start of operations.U.S. GAAP.
| f) | Deferred Promotional Expenses: |
As explained in note 5 E, under Mexican FRS, promotional expenses related to the launching of new products or product presentations are recorded as prepaid expenses. For U.S. GAAP purposes, such promotional expenses are expensed as incurred.
| g) | Intangible Assets: |
As mentioned in Note 4 i), underAccording to Mexican FRS, until January 1,in 2003 all intangible assets were amortized over a periodthe amortization of no more than 20 years. Effective January 1, 2003, revised NIF Bulletin C-8, “Intangible Assets,” went into effect and recognizes that certain intangible assets (excluding goodwill) have indefinite lives and should not be amortized. In accordance with Statement of Financial Accounting Standards (“SFAS”) No. 142, “Goodwill and Other Intangible Assets” (effective January 1, 2002),goodwill was discontinued. For U.S. GAAP purposes, since 2002 goodwill and indefinite-lived intangible assets are also no longer subject to amortization, but rather are subject to periodic assessment for impairment. Accordingly, amortization ofamortization.
Under U.S. GAAP, indefinite-lived intangible assets was discontinued in 2002 for U.S. GAAP. In 2003, amortizationare recorded at estimated fair value at the date of indefinite-livedthe acquisition, under Mexican FRS intangible assets was discontinuedwith indefinite life are recognized at its estimated fair value, limited to the underlying amount of the purchase price consideration. This results in a difference in accounting for acquired intangible assets between Mexican FRS and in 2004 the amortization of goodwill was discontinued (see Note 4 i).
As a result of the adoption of this SFAS No. 142, the Company performed an initial impairment test as of January 1, 2002 and found no impairment. Subsequent impairment tests are performed annually by the Company, unless an event occurs or circumstances change that would more likely than not reduce the fair value of a reporting unit below its carrying amount. In such case an impairment test would be performed between annual tests.U.S.GAAP.
| Restatement of Imported Equipment: |
As explained in Note 4 g), under Mexican FRS,Through December 2007, the Company restated imported machinery and equipment have been restated by applying the inflation rate and the exchange rate of the currency of the country of origin andorigin. The resulting amounts were then translated into Mexican pesos using the year-endperiod end exchange rate. This result in a difference in accounting between Mexican FRS and U.S. GAAP.
Under U.S. GAAP,As explained in Note 3 I on January 1, 2008, the Company applies the regulations of the SEC,adopted NIF B-10, which requireestablishes that allimported machinery and equipment both domestic and imported, be restatedare recorded using Mexicanthe exchange rate of the acquisition date. Subholding Companies that operate in inflationary economic environments have to restate those assets by applying the inflation factors.
| Capitalization of the |
Through December 2006, and according to Bulletin C-6 “Property, plant and equipment” the Company didhad not capitalizecapitalized the integralcomprehensive financial result of financing, which was previously optional under Mexican FRS. On January 1,related to fixed assets.
Beginning in 2007, according to NIF D-6 “Capitalization of Integral Result of Financing” went into effect. This standard establishes thatComprehensive Financing Result”, the integralCompany capitalized the comprehensive financing result of financing generated as a result of loansby borrowing obtained to finance investment projects must be capitalized as partqualifying assets.
According to U.S. GAAP, if interest expense (does not include all the components of the cost of long-term assets when certain conditions are met. This standard does not require retrospective application. The adoption of this standard did not have an impact on the Company’s consolidated financial position or results of operations.
In accordance with SFAS No. 34, “Capitalization of Interest Cost,” if the integralcomprehensive result of financingdefined by Mexican FRS) is incurred during the construction of qualifying assets and the net effect is material, capitalization is required for all assets that require a period of time to get them ready for their intended use. Accordingly, aThe net effect of interest expenses incurred to bring qualifying assets to the condition for its intended use was Ps. 90, Ps. 90 and Ps. 56 for the years ended on December 31, 2010, 2009 and 2008, respectively.
A reconciling item is included for the capitalization of a portion ofdifference in capitalized comprehensive financing result and the integral result of financing is included in the U.S. GAAP reconciliation of the majority net income and majority stockholders’ equity. If the borrowings are denominated in U.S. dollars, the weighted average interest rate on all such outstanding debt is applied to the balance of construction in progress to determine the amount to be capitalized. If the borrowings are denominated in Mexican pesos, the amount of interest to be capitalized as noted above is reduced by the gain on monetary position associated with the debt.
Beginning on January 1, 2005, in accordance withrelated amortization recorded under Mexican FRS as mentioned in Note 4 r),and the Company valuescorresponding capitalized interest expense and records all derivative financial instruments and hedging activities according to NIF Bulletin C-10, “Derivative Financial Instruments and Hedging Activities,” which establishes similar accounting treatment as described in SFAS No. 133, “Accounting for Derivative Financial Instruments and Hedging Activities.” Therefore, as of such date the Company no longer has any difference as it relates to derivative financial instruments.related amortization recorded under U.S. GAAP.
| j) | Fair Value Measurements: |
In 2008, the Company adopted a FASB pronouncement that establishes a framework for measuring fair value providing a consistent definition that focuses on exit price and prioritizes the use of market based inputs over company specific inputs. This pronouncement requires companies to consider its own nonperformance risk when measuring liabilities carried at fair value, including derivative financial instruments. The effective date of this standard for nonfinancial assets and nonfinancial liabilities that are recognized or disclosed at fair value on a recurring basis (at least annually) started on January 1, 2009.
Additionally, U.S. GAAP establishes a three level fair value hierarchy that prioritizes the inputs used to measure fair value. This hierarchy requires entities to maximize the use of observable inputs and minimize the use of unobservable inputs. The three levels of inputs are fully described in Note 20. The Company has segregated all financial assets and liabilities that are measured at fair value on a recurring basis (at least annually) into the most appropriate level within the fair value hierarchy based on the inputs used to determine the fair value at the measurement date as shown in Note 20.
The Company is exposed to counterparty credit risk on all derivative financial instruments. Because the amounts are recorded at fair value, the full amount of the Company’s exposure is the carrying value of these instruments. Credit risk is monitored through established approval procedures, which consider grading counterparties periodically in order to offset the net effect of counterparty’s credit risk. As a result the Company only enters into derivative transactions with well-established financial institutions; and estimates that such risk is minimal.
U.S. GAAP allows entities to voluntarily choose to measure certain financial assets and liabilities at fair value (fair value option). The fair value option may be elected on an instrument by instrument basis and is irrevocable, unless a new election date occurs. If the fair value option is elected for an instrument, the unrealized gains and losses for that instrument shall be reported in earnings at each subsequent reporting date. The Company did not elect to adopt fair value option to any of its outstanding instruments; therefore, it did not have any impact on its consolidated financial statements.
In accordance with the financial instruments disclosures, it is necessary to disclose, in the body of the financial statements or in the notes, the fair value of financial instruments for which it is practicable to estimate it, and the method(s) used to estimate the fair value. The Company estimates that carrying amounts of cash and cash equivalents, accounts receivable, interest payable, suppliers, accounts payable and other current liabilities approximate their fair value due to their short maturity.
Additionally as explained in Note 17, the Company has a bonus program in which the cost of the equity instruments is measured based on the fair value of the instruments on the date they are granted.
| k) | Deferred Income Taxes, Employee Profit Sharing and Uncertain Tax Positions: |
The Company calculates itscalculation of deferred income taxes and employee profit sharing in accordance with SFAS No. 109, “Accounting for Income Taxes,” for U.S. GAAP purposes which differs from Mexican FRS as follows:
Under Mexican FRS, theinflation effects of inflation on the deferred taxes balance generated by monetary items are recognized in the income statement as part of the result of monetary position.position of subsidiaries in inflationary economic environments. Under U.S. GAAP, the deferred taxes balance is classified as a non-monetary item. As a result, the consolidated U.S. GAAP income statement differs with respect to the presentation of the gain or loss on monetary position and deferred income taxes provision;
Under Mexican FRS, deferred employee profit sharing is calculated considering only those temporary differences that arise duringusing the yearasset and which are expected to reverse within a defined period, while under U.S. GAAP, the same liability method, which is the method used forto compute deferred income taxes under U.S. GAAP. Employee profit sharing is applied;deductible for purposes of Mexican taxes from profit. This deduction reduces the payments of income taxes in subsequent years. For Mexican FRS purposes, the Company did not record deferred employee profit sharing, since is not expected to materialize in the future; and
The differences in start-upthe deferred income tax of the control acquisition of Coca-Cola FEMSA, deferred income tax of the exchange of FEMSA Cerveza shares, start up expenses through 2008, deferred promotional expenses, intangible assets, restatement of imported machinery and equipment, capitalization of financing costscomprehensive financial result, employee benefits and pension plan mentioneddeferred employee profit sharing, explained in Note 26 d), g), h)27 A, B, E, F, G, H, I, and k)K, generate a difference when calculating the deferred income taxes under U.S. GAAP compared to that presented under Mexican FRS (see Note 23 d)24 D).
Employee profit sharing is deductible for Mexican income taxes purposes. This deduction reduces the payments of income taxes in subsequent years. Therefore, the Company recorded a reduction to the deferred income taxes liability under U.S. GAAP.
The reconciliation of deferred income tax and employee profit sharing, as well as the changes in the balances of deferred taxes, are as follows:
Reconciliation of Deferred Income Taxes, Net | 2007 | 2006 | 2010 | 2009 | ||||||||||||
Deferred income taxes under Mexican FRS | Ps. | 2,320 | Ps. | 1,943 | Ps. | 10,221 | Ps. | (660 | ) | |||||||
Deferred income taxes of discontinued operation under Mexican FRS | — | 378 | ||||||||||||||
Deferred income taxes of Coca-Cola FEMSA | (225 | ) | 381 | — | (1,640 | ) | ||||||||||
U.S. GAAP adjustments: | ||||||||||||||||
Start-up expenses | (58 | ) | (55 | ) | ||||||||||||
Deferred promotional expenses | (14 | ) | — | |||||||||||||
Deferred income tax of Coca-Cola FEMSA´s fair value adjustments | 21,833 | — | ||||||||||||||
Intangible assets | (22 | ) | — | |||||||||||||
Deferred charges | (20 | ) | — | |||||||||||||
Deferred revenues | 26 | — | ||||||||||||||
Equity method of Heineken | (859 | ) | — | |||||||||||||
Restatement of imported equipment | (31 | ) | 87 | 85 | (29 | ) | ||||||||||
Capitalization of integral result of financing | 88 | 102 | ||||||||||||||
Tax deduction for employee profit sharing | (135 | ) | (182 | ) | ||||||||||||
Labor liabilities | (355 | ) | (468 | ) | ||||||||||||
Capitalization of interest expense | 4 | 62 | ||||||||||||||
Tax deduction for deferred employee profit sharing | 50 | (38 | ) | |||||||||||||
Employee benefits | (220 | ) | (478 | ) | ||||||||||||
Total U.S. GAAP adjustments | (491 | ) | (516 | ) | 20,863 | (483 | ) | |||||||||
Deferred income taxes, net, under U.S. GAAP | Ps. | 1,604 | Ps. | 1,808 | Ps. | 31,084 | Ps. | (2,405 | ) | |||||||
Changes in the Balance of Deferred Income Taxes | 2010 | 2009 | 2008 | |||||||||
Initial balance | Ps. | (2,405 | ) | Ps. | 37 |
| Ps. | 1,604 | ||||
Provision for the year | 599 | (795 | ) | (1,243 | ) | |||||||
Control acquisition of Coca-Cola FEMSA and fair value adjustments | 23,843 | — | — | |||||||||
Deferred tax of the exchange of FEMSA Cerveza | 10,001 | — | — | |||||||||
Financial instruments | 75 | 319 | (622 | ) | ||||||||
Equity method of Heineken | (859 | ) | — | — | ||||||||
Application of tax loss carryforwards due to amnesty adoption | — | 2,066 | — | |||||||||
Reversal of tax loss carryforward allowance | — | (2,066 | ) | — | ||||||||
Effect on tax loss carryforwards | — | (1,874 | ) | — | ||||||||
Change in the statutory income tax rate | (58 | ) | (90 | ) | — | |||||||
Cumulative translation adjustment | (15 | ) | (134 | ) | 437 | |||||||
Unrecognized labor liabilities | (59 | ) | 132 | (139 | ) | |||||||
Other | (38 | ) | — | — | ||||||||
Ending balance | Ps. | 31,084 | Ps. | (2,405 | ) | Ps. | 37 | |||||
Reconciliation of Deferred Employee Profit Sharing Deferred employee profit sharing under Mexican FRS U.S. GAAP adjustments: Allowance for doubtful accounts Inventories Prepaid expenses Property, plant and equipment Deferred charges Intangible assets Capitalization of interest expense Derivative financial instruments Labor liabilities Other liabilities Total U.S. GAAP adjustments Valuation allowance Deferred employee profit sharing under U.S. GAAP 2010 2009 Ps. — Ps. — (1 ) (5 ) 8 22 — 6 25 211 4 (34 ) (1 ) 32 — 2 — 15 (233 ) (405 ) (186 ) (187 ) (384 ) (343 ) 206 477 Ps. (178 ) Ps. 134
The total deferred income taxes expense under
Changes in the Balance of Deferred Employee Profit Sharing | 2010 | 2009 | 2008 | |||||||||
Initial balance | Ps. | 134 | Ps. | 214 | Ps. | 483 | ||||||
Provision for the year | (257 | ) | (234 | ) | (576 | ) | ||||||
Acquisition of Coca-Cola FEMSA | (17 | ) | — | — | ||||||||
Net effect on exchange of FEMSA Cerveza | (118 | ) | — | — | ||||||||
Labor liabilities | 82 | 42 | (58 | ) | ||||||||
Valuation allowance | (2 | ) | 112 | 365 | ||||||||
Ending balance | Ps. | (178 | ) | Ps. | 134 | Ps. | 214 | |||||
According to U.S. GAAP, includes the corresponding current portion as of December 31, 2007 and 2006 of Ps. 266 and Ps. 296, respectively.
Changes in the Balance of Deferred Income Taxes | 2007 | 2006 | ||||||
Initial balance | Ps. | 1,808 | Ps. | 2,428 | ||||
Provision for the year | (539 | ) | (238 | ) | ||||
Change in the statutory income tax rate | — | 10 | ||||||
Unrecognized labor liabilities | 33 | (322 | ) | |||||
Derivative financial instruments | 124 | (70 | ) | |||||
Cumulative translation adjustment | 178 | — | ||||||
Ending balance | Ps. | 1,604 | Ps. | 1,808 | ||||
Reconciliation of Deferred Employee Profit Sharing | 2007 | 2006 | ||||||
Deferred employee profit sharing under Mexican FRS | Ps. | — | Ps. | — | ||||
U.S. GAAP adjustments: | ||||||||
Allowance for doubtful accounts | (6 | ) | (6 | ) | ||||
Inventories | 97 | 129 | ||||||
Prepaid expenses | 28 | 28 | ||||||
Property, plant and equipment | 963 | 974 | ||||||
Deferred charges | (214 | ) | (134 | ) | ||||
Intangible assets | 10 | 1 | ||||||
Capitalization of interest expense | 31 | 36 | ||||||
Start-up expenses | (18 | ) | (17 | ) | ||||
Derivative financial instruments | 5 | 3 | ||||||
Labor liabilities | (329 | ) | (297 | ) | ||||
Other reserves | (84 | ) | (67 | ) | ||||
Total U.S. GAAP adjustments | 483 | 650 | ||||||
Deferred employee profit sharing under U.S. GAAP | Ps. | 483 | Ps. | 650 | ||||
The total deferred employee profit sharing under U.S. GAAP includes the corresponding current portion as of December 31, 2007 and 2006 of Ps. 124 and Ps. 154, respectively.
Changes in the Balance of Deferred Employee Profit Sharing | 2007 | 2006 | ||||||
Initial balance | Ps. | 650 | Ps. | 928 | ||||
Provision for the year | (180 | ) | (148 | ) | ||||
Labor liabilities | 13 | (130 | ) | |||||
Ending balance | Ps. | 483 | Ps. | 650 | ||||
In June 2006, FASB Interpretation No. 48, “Accounting for UncertaintyCompany is required to recognize in Income Taxes, an Interpretation of SFAS Statement No. 109,” or “FIN No. 48,” was issued and became effective as of January 1, 2007. FIN No. 48 provides detailed guidance for the financial statement recognition, measurement and disclosure of uncertain tax positions recognized in a company’sits financial statements with SFAS No. 109, “Accounting for Income Taxes.” FIN No. 48 requires a company to recognize the financial statement impact of a tax position when it is more likely than not that the position will be sustained upon examination. If the tax position meets the more-likely-than-not recognition threshold, the tax effect is recognized at the largest amount of the benefit that is greater than 50% likely of being realized upon ultimate settlement.realized. Any differenceexcess between the tax position taken in the tax return and the tax position recognized in the financial statements using the criteria above results in the recognition of a liability in the financial statements for the unrecognized benefit.uncertain position. Similarly, if a tax position fails to meet the more-likely-than-not recognition threshold, the benefit taken in tax return will also result in the recognition of a liability in the financial statements for the full amount of the unrecognized benefit. FIN 48 became effective for fiscal years beginning after December 15, 2006 for public entitiesAccording to Mexican FRS, the Company is required to record tax contingencies in its financial statements when such liabilities are probable in nature and their subsidiaries. The Company adopted FIN 48 as of January 1, 2007, as required. The provisions of FIN 48 were applied to all tax positions under SFAS No. 109 upon initial adoption. The impact of adoptingestimable. However, this interpretation wasdifference between Mexican FRS and U.S. GAAP is not material to the Company’s consolidated financial position, resultsstatements during any of operations or cash flows.
Under Mexican FRS,NIF D-3 “Employee Benefits” eliminates the recognition of the additional labor liability resulting from the difference between actual benefits and the net projected liabilities, for employee benefitsestablishes a maximum of five years to amortize the beginning balance of past labor costs of pension plans and severance indemnities and requires recording actuarial gains or losses of severance indemnities as part of the income from operations during the period when those are determined using actuarial computations in accordance withincurred. The adoption of NIF Bulletin D-3 “Labor Liabilities,” which is substantially the same as SFAS No. 87, “Employers’ Accounting for Pensions,” except for the initial year of application of both standards, which generates a difference in the unamortized net transition obligation and in the amortization expense.
In January 1997, as a resultexpense of the application of inflationary accounting, Mexican FRS determined that labor obligations are non-monetary liabilitiespension plans and required the application of real, instead of nominal, interest rates in actuarial calculations. These changes required recalculation of the accumulated transition obligation, and the difference in the transition obligation represents the sum of the actuarial gains or losses since the first year that labor obligations have been calculated. This difference is being amortized over the average life of employment of the Company’s personnel. The Company uses the same real interest rate for bothseverance indemnities. Under U.S. GAAP and Mexican FRS.
Under Mexican FRS, as mentioned in Note 4 l), Mexican standard NIF Bulletin D-3 requires the recognition of a severance indemnity liability calculated based on actuarial computations. The same recognition criteria under U.S. GAAP is established in SFAS No. 112, “Employers’ Accounting for Postemployment Benefits,” which has been effective since 1994.
Beginning in 2005, the Company applies the same considerations asis required by Mexican FRS to recognize the severance indemnity liability for U.S. GAAP purposes. The cumulative effect of the severance obligation related to vested services was recorded in the 2005 income statement since the effect was not considered to be quantitatively or qualitatively material to the Company’s consolidated U.S. GAAP financial statements taken as a whole. The transition obligation has not been recorded for U.S. GAAP purposes.
In 2006, the Company adopted SFAS No. 158, “Employers’ Accounting for Defined Benefit Pension and Other Postretirement Plans—an amendment of FASB Statements No. 87, 88, 106 and 132(R).” This statement requires companies to (1) fully recognize as an asset or liability from the overfunded or underfunded status of defined pension and other postretirement benefit plans; (2) recognize changes in the funded status through other comprehensive income in the year in which the changes occur; and (3) provide enhanced disclosures. The impact of adoption, including the interrelated impact on the minimum pension liability, resulted in an increase in total liabilities and a decrease in stockholders’ equity reported under U.S. GAAP of Ps. 192 and 892, respectively.plans.
Prior toFor the adoption of SFAS No. 158, there was no differenceNIF B-10 for Mexican FRS, the Company is required to apply real rates for inflationary economic environments and nominal rates for non-inflationary economic environments in the liabilitiesactuarial calculations. The Company uses the same criteria for seniority premiumsinterest rates for both U.S. GAAP and postretirement medical benefits between Mexican FRS and U.S. GAAP.FRS.
The reconciliation of the pension cost for the year and related labor liabilities is as follows:
Cost for the Year | 2007 | 2006 | 2005 | 2010 | 2009 | 2008 | ||||||||||||||||||
Net cost recorded under Mexican FRS | Ps. | 664 | Ps. | 551 | Ps. | 495 | Ps. 600 | Ps. 569 | Ps. 664 | |||||||||||||||
Net cost of Coca-Cola FEMSA | (176 | ) | (163 | ) | (184 | ) | — | (313 | ) | (451 | ) | |||||||||||||
Net cost of FEMSA Cerveza(discontinued operation) | 182 | 574 | 539 | |||||||||||||||||||||
U.S. GAAP adjustments: | ||||||||||||||||||||||||
Amortization of unrecognized transition obligation | (8 | ) | (5 | ) | 279 | (46 | ) | (53 | ) | (55 | ) | |||||||||||||
Amortization of prior service cost | 8 | — | — | (1 | ) | 5 | 4 | |||||||||||||||||
Amortization of net actuarial loss | (4 | ) | 2 | (36 | ) | |||||||||||||||||||
Total U.S. GAAP adjustment | — | (5 | ) | 279 | (51 | ) | (46 | ) | (87 | ) | ||||||||||||||
Cost for the year under U.S. GAAP | Ps. | 488 | Ps. | 383 | Ps. | 590 | Ps. 731 | Ps. 784 | Ps. 665 | |||||||||||||||
Labor Liabilities | 2007 | 2006 | 2010 | 2009 | ||||||||||||
Labor liabilities under Mexican FRS | Ps. | 3,718 | Ps. | 3,269 | ||||||||||||
Labor liabilities of Coca-Cola FEMSA | (993 | ) | (924 | ) | ||||||||||||
Restatement effect | — | (8 | ) | |||||||||||||
Employee benefits under Mexican FRS | Ps. 1,883 | Ps. 1,776 | ||||||||||||||
Employee benefits of Coca-Cola FEMSA | — | (1,088 | ) | |||||||||||||
Employee benefits of FEMSA Cerveza | — | 1,578 | ||||||||||||||
U.S. GAAP adjustments: | ||||||||||||||||
Unrecognized net transition obligation | 459 | 526 | 115 | 287 | ||||||||||||
Unrecognized prior service | 781 | 826 | 337 | 696 | ||||||||||||
Unrecognized net actuarial loss | 444 | 457 | 356 | 730 | ||||||||||||
Additional labor liability in cumulative other comprehensive income | (413 | ) | (127 | ) | ||||||||||||
U.S. GAAP adjustments to stockholders’ equity | 1,271 | 1,682 | 808 | 1,713 | ||||||||||||
Reversal of additional labor obligation under Mexican FRS | (673 | ) | (1,006 | ) | ||||||||||||
Labor liabilities under U.S. GAAP | Ps. | 3,323 | Ps. | 3,013 | Ps. 2,691 | Ps. 3,979 | ||||||||||
Estimates of the unrecognized items expected to be recognized as components of net periodic pension cost during 20072011 are shown in the table below:
| Pension and Retirement Plans | Seniority Premiums | Postretirement Medical Services | ||||
Actuarial net loss and prior service cost recognized in cumulative other comprehensive income during the year | Ps.8 | Ps.2 | Ps.12 | |||
Actuarial net loss and prior service cost recognized as a component of net periodic cost | 50 | 1 | 13 | |||
Net transition liability recognized as a component of net periodic cost | 50 | 1 | 4 | |||
Actuarial net loss, prior service cost and transition liability included in accumulated cumulative other comprehensive income | 973 | 25 | 345 | |||
Estimate to be recognized as a component of net periodic cost over the following fiscal year: | ||||||
Net transition obligation | 1 | 1 | 13 | |||
Prior service cost | 48 | — | — | |||
Actuarial loss | 48 | 1 | 5 |
As mentioned in Note 5 c), in 2006 FEMSA Cerveza indirectly acquired an additional equity interest in Kaiser. According to Mexican standard NIF Bulletin B-7, “Business Acquisitions,” this is a transaction between existing shareholders that does not impact the net assets of the Company, and the payment in excess of the book value of the shares acquired is recorded in stockholders’ equity as a reduction of additional paid-in capital. Under U.S. GAAP, SFAS No. 141, “Business Combinations,” establishes that purchases of minority interest represent a “step acquisition” that must be recorded utilizing the purchase method, whereby the purchase price is allocated to the proportionate fair value of assets and liabilities acquired. The purchase price allocation for this acquisition has been completed, and the allocation period was closed. The Company did not recognize any goodwill as a result of this acquisition.
Additionally, on August 31, 2007, FEMSA Cerveza sold 16.88% of Kaiser’s outstanding shares to Heineken HV. The excess of the price paid over the book value was recorded directly in stockholders’ equity in accordance with Mexican FRS. Under U.S. GAAP, the gain was recorded directly in income in accordance with ARB No. 51, “Consolidated Financial Statements.”
As mentioned in Note 5 a), in 2006 FEMSA indirectly acquired an additional, 8.02% of the total outstanding equity of Coca-Cola FEMSA. According to Mexican standard NIF Bulletin B-7, this is a transaction between shareholders that does not impact the net assets of the Company, and the payment in excess of the book value of the shares acquired is recorded in stockholders’ equity as a reduction of additional paid-in capital. Under U.S. GAAP, SFAS No. 141, “Business Combinations,” purchases of minority interest represent a “step acquisition” that must be accounted for under the purchase method, whereby the purchase price is allocated to the proportionate fair value of assets and liabilities acquired. The difference between the fair value and the price paid for the 8.02% of Coca-Cola FEMSA equity is presented as part of investment in Coca-Cola FEMSA shares in the consolidated balance sheet under U.S. GAAP. The Company did not recognize any goodwill as a result of this acquisition. The acquisition of the additional 8.02% interest in Coca-Cola FEMSA did not affect the consolidation analysis discussed above as it relates to EITF 96-16 given that The Coca-Cola Company’s substantive participating rights were not affected.
| Pension and Retirement Plans | Seniority Premiums | Postretirement Medical Services | ||||||||||
Actuarial net loss and prior service cost recognized in cumulative other comprehensive income during the year | Ps. 252 | Ps. (36 | ) | Ps. 20 | ||||||||
Actuarial net loss and prior service cost recognized as a component of net periodic cost | 90 | (3 | ) | 2 | ||||||||
Net transition liability recognized as a component of net periodic cost | 11 | 1 | 2 | |||||||||
Actuarial net loss, prior service cost and transition liability included in cumulative other comprehensive income | 534 | (28 | ) | 107 | ||||||||
Estimate to be recognized as a component of net periodic cost over the following fiscal year: | ||||||||||||
Transition obligation | (2 | ) | — | (1 | ) | |||||||
Prior service credit | 11 | — | — | |||||||||
Actuarial gain / (loss) | 3 | 4 | (5 | ) | ||||||||
| m) |
Under Mexican FRS, the minoritynoncontrolling interest in consolidated subsidiaries is presented as a separate component within stockholders’ equity in the consolidated balance sheet.
UnderBeginning as of January 1, 2009, under U.S. GAAP, this item must be excluded frompresented as separate component within consolidated stockholders’ equity in the consolidated balance sheet. Additionally, consolidated net income shall be adjusted to include the minoritynet income attributed to the noncontrolling interest. And consolidated comprehensive income shall be adjusted to include the net income attributed to the noncontrolling interest. Because these changes are to be applied retrospectively, they eliminate the differences between MFRS and U.S. GAAP in the presentation of the noncontrolling interest in the net earnings of consolidated subsidiaries is deducted from consolidated net income.financial statements.
The U.S. GAAP adjustments disclosed in Note 27 a) and b) are calculated on a consolidated basis. Therefore, the minority interest effects are presented as a separate line item to obtain net income and stockholders’ equity.
| n) | FEMSA’s |
In accordance with Mexican FRS, the Company applied the entity theory to the acquisition of the minoritynoncontrolling interest by FEMSA in May 1998, through an exchange offer. Accordingly, no goodwill was created as a result of such acquisition and the difference between the book value of the shares acquired by FEMSA and the FEMSA shares exchanged was recorded as additional paid-in capital. The direct out-of-pocket costs identified with the purchase of minoritynoncontrolling interest are treated as an additional purchase cost andwere included in other expenses.
In accordance with U.S. GAAP, the acquisition of minoritynoncontrolling interest must be accounted for under the purchase method, using the market value of shares received by FEMSA in the exchange offer to determine the cost of the acquisition of such minoritynoncontrolling interest and the related goodwill. Under U.S. GAAP, the direct out-of-pocket costs identified with the purchase of minoritynoncontrolling interest are treated as additional goodwill.
Additionally, SFAS No. 142 requiresaccounting standards related to goodwill, require the allocation of all goodwill to the related reporting units. Theunits to the operating segment or component that will generate the related cash flows. As of December 31, 2010, the remaining allocation of the goodwill generated by the previously mentioned acquisition of minoritynoncontrolling interest was as follows:
| ||||
| ||||
FEMSA Comercio | 1,085 | |||
Other | 918 | |||
| 2,003 | ||||
As of February 1, 2010 the goodwill allocated to Coca Cola FEMSA amounted to Ps. 4,753 and was re-evaluated as part of the control acquisition of Coca-Cola FEMSA.
As of April 30, 2010, the goodwill allocated to FEMSA Cerveza amounted to Ps. 10,600 and was cancelled due to the transaction described above, as part of the disposition of FEMSA Cerveza net assets.
| o) | Deconsolidation of Crystal operations: |
During 2009, Coca-Cola FEMSA established a joint venture with The Coca-Cola Company for the production and sale of Crystal brand water in Brazil. Coca-Cola FEMSA has recorded a gain for U.S. GAAP purposes of Ps. 120 related to the deconsolidation of its net assets related to the Crystal operations. Approximately, Ps. 120 of previously recorded unearned revenues related to crystal operations remain recorded for Mexican FRS purposes, and are being amortized into income along with the results from the joint venture over the following three years for Mexican FRS purposes.
| p) | Statement of Cash Flows: |
Under Mexican FRS,In 2008, the Company presents a consolidated statement of changes in financial position in accordance withadopted NIF Bulletin B-12, “Statement of Changes in Financial Position,” which identifies the generation and application of resources by the differences between beginning and ending balance sheet items presented in constant Mexican pesos. NIF Bulletin B-12 also requires that monetary and foreign exchange gains and losses be treated as cash items for the determination of resources generated by operating activities.
In accordance with U.S. GAAP, the Company follows SFAS No. 95,B-2 “Statement of Cash Flows,”Flows” which is presented in historical Mexican pesos, without the effectssimilar to cash flows standards for U.S. GAAP except for different presentation of inflation (see Note 26 p).interest costs, and certain other supplemental disclosures.
| Financial Information Under U.S. GAAP: |
Consolidated Balance Sheets | 2007 | 2006 | 2010 | 2009 | ||||||||
ASSETS | ||||||||||||
Current Assets: | ||||||||||||
Cash and cash equivalents | Ps. 2,914 | Ps. 3,593 | Ps. | 26,703 | Ps. | 7,896 | ||||||
Marketable securities | 66 | — | ||||||||||
Accounts receivable | 5,383 | 5,012 | 7,702 | 6,688 | ||||||||
Inventories | 6,465 | 5,473 | 11,350 | 9,416 | ||||||||
Recoverable taxes | 1,470 | 693 | 4,243 | 1,755 | ||||||||
Other current assets | 775 | 677 | 1,635 | 1,987 | ||||||||
Total current assets | 17,007 | 15,448 | 51,699 | 27,742 | ||||||||
Investments in shares: | ||||||||||||
Coca-Cola FEMSA | 28,188 | 24,043 | — | 35,730 | ||||||||
Heineken | 63,413 | — | ||||||||||
Other investments | 387 | 371 | 2,315 | 175 | ||||||||
Property, plant and equipment | 32,725 | 31,151 | 42,595 | 36,386 | ||||||||
Deferred income tax and deferred employee profit sharing | 541 | 2,116 | ||||||||||
Intangible assets | 34,830 | 33,926 | 163,170 | 37,547 | ||||||||
Bottles and cases | 1,950 | 1,709 | 2,280 | 2,248 | ||||||||
Other assets | 9,688 | 8,045 | 8,504 | 16,056 | ||||||||
TOTAL ASSETS | Ps.124,775 | Ps.114,693 | Ps. | 334,517 | Ps. | 158,000 | ||||||
LIABILITIES AND STOCKHOLDERS’ EQUITY | ||||||||||||
Current Liabilities: | ||||||||||||
Bank loans | Ps. 2,390 | Ps. 2,489 | Ps. | 1,578 | Ps. | 1,400 | ||||||
Interest payable | 202 | 162 | 165 | 109 | ||||||||
Current maturities of long-term debt | 2,166 | 375 | 1,725 | 2,026 | ||||||||
Suppliers | 8,317 | 7,104 | 17,458 | 11,257 | ||||||||
Deferred taxes liability | 390 | 450 | ||||||||||
Deferred income tax and employee profit sharing | 113 | 77 | ||||||||||
Taxes payable | 2,018 | 1,576 | 2,180 | 2,961 | ||||||||
Accounts payable, accrued expenses and other liabilities | 3,096 | 2,658 | 7,410 | 5,709 | ||||||||
Total current liabilities | 18,579 | 14,814 | 30,629 | 23,539 | ||||||||
Long-Term Liabilities: | ||||||||||||
Bank loans and notes payable | 16,569 | 18,749 | 21,927 | 24,119 | ||||||||
Deferred taxes liability | 1,705 | 2,018 | 31,539 | 738 | ||||||||
Labor liabilities | 3,323 | 3,013 | 2,691 | 3,979 | ||||||||
Other liabilities | 1,295 | 2,008 | 5,595 | 6,183 | ||||||||
Total long-term liabilities | 22,892 | 25,788 | 61,752 | 35,019 | ||||||||
Total liabilities | 41,471 | 40,602 | 92,381 | 58,558 | ||||||||
Minority interest in consolidated subsidiaries | 698 | 166 | ||||||||||
Stockholders’ equity | 82,606 | 73,925 | ||||||||||
Equity: | ||||||||||||
Controlling interest | 163,641 | 98,168 | ||||||||||
Noncontrolling interest | 78,495 | 1,274 | ||||||||||
Total equity: | 242,136 | 99,442 | ||||||||||
TOTAL LIABILITIES AND STOCKHOLDERS’ EQUITY | Ps.124,775 | Ps.114,693 | Ps. | 334,517 | Ps. | 158,000 | ||||||
Consolidated Statements of Income and Comprehensive Income | 2010 | 2009 | 2008 | |||||||||||||||||||||
| 2007 | 2006 | 2005 | ||||||||||||||||||||||
Net sales | Ps. | 82,887 | Ps. | 75,288 | Ps. | 62,709 | Ps. | 175,257 | Ps. | 102,039 | Ps. | 90,941 | ||||||||||||
Other operating revenues | 475 | 416 | 322 | 1,796 | 863 | 709 | ||||||||||||||||||
Total revenues | 83,362 | 75,704 | 63,031 | 177,053 | 102,902 | 91,650 | ||||||||||||||||||
Cost of sales | 48,788 | 44,059 | 36,594 | 102,665 | 59,841 | 53,419 | ||||||||||||||||||
Gross profit | 34,574 | 31,645 | 26,437 | 74,388 | 43,061 | 38,231 | ||||||||||||||||||
Operating expenses: | ||||||||||||||||||||||||
Administrative | 5,944 | 5,689 | 5,088 | 9,420 | 7,769 | 6,046 | ||||||||||||||||||
Selling | 20,920 | 18,135 | 14,438 | 43,302 | 26,451 | 24,237 | ||||||||||||||||||
Restructuring | 446 | 180 | 67 | |||||||||||||||||||||
Market value (gain) loss of derivative financial instruments | (15 | ) | — | — | ||||||||||||||||||||
| 26,864 | 23,824 | 19,526 | 53,153 | 34,400 | 30,350 | |||||||||||||||||||
Income from operations | 7,710 | 7,821 | 6,911 | 21,235 | 8,661 | 7,881 | ||||||||||||||||||
Integral result of financing: | ||||||||||||||||||||||||
Comprehensive financing result: | ||||||||||||||||||||||||
Interest expense | (2,417 | ) | (2,003 | ) | (1,850 | ) | (3,966 | ) | (3,013 | ) | (2,561 | ) | ||||||||||||
Interest income | 158 | 421 | 386 | 1,121 | 310 | 181 | ||||||||||||||||||
Foreign exchange gain (loss), net | 592 | 11 | (15 | ) | ||||||||||||||||||||
Foreign exchange loss, net | (332 | ) | (26 | ) | (217 | ) | ||||||||||||||||||
Gain on monetary position, net | 664 | 429 | 285 | 219 | (1 | ) | (1 | ) | ||||||||||||||||
Market value (loss) gain on ineffective portion of derivative financial instruments | (45 | ) | 5 | (92 | ) | |||||||||||||||||||
Market value gain (loss) on ineffective portion of derivative financial instruments | 202 | 73 | (24 | ) | ||||||||||||||||||||
| (1,048 | ) | (1,137 | ) | (1,286 | ) | (2,756 | ) | (2,657 | ) | (2,622 | ) | |||||||||||||
Other expenses, net | (124 | ) | (298 | ) | (94 | ) | ||||||||||||||||||
Other income , net | 68,337 | 52 | 241 | |||||||||||||||||||||
Income before taxes | 6,538 | 6,386 | 5,531 | 86,816 | 6,056 | 5,500 | ||||||||||||||||||
Taxes | 1,610 | 2,029 | 1,723 | 15,014 | (127 | ) | 1,787 | |||||||||||||||||
Income before minority interest and participation in affiliated companies | 4,928 | 4,357 | 3,808 | |||||||||||||||||||||
Minority interest in results of consolidated subsidiaries | (32 | ) | 169 | — | ||||||||||||||||||||
Income before participation in affiliated companies | 71,802 | 6,183 | 3,713 | |||||||||||||||||||||
Participation in affiliated companies: | ||||||||||||||||||||||||
Coca-Cola FEMSA | 3,635 | 2,420 | 2,205 | 183 | 4,516 | 2,994 | ||||||||||||||||||
Other affiliated companies | 26 | 27 | 46 | |||||||||||||||||||||
Other associates companies | 219 | (14 | ) | (108 | ) | |||||||||||||||||||
| 3,661 | 2,447 | 2,251 | 402 | 4,502 | 2,886 | |||||||||||||||||||
Net income | Ps. | 8,557 | Ps. | 6,973 | Ps. | 6,059 | ||||||||||||||||||
Consolidated net income | Ps. | 72,204 | Ps. | 10,685 | Ps. | 6,599 | ||||||||||||||||||
Less: Net income attributable to the noncontrolling interest | (4,759 | ) | (783 | ) | 253 | |||||||||||||||||||
Net income attributable to controlling interest | Ps. | 67,445 | Ps. | 9,902 | Ps. | 6,852 | ||||||||||||||||||
Consolidated net income | Ps. | 72,204 | Ps. | 10,685 | Ps. | 6,599 | ||||||||||||||||||
Other comprehensive income | 1,649 | 346 | (1,072 | ) | (1,702 | ) | 4,335 | (2,241 | ) | |||||||||||||||
Comprehensive income | Ps. | 10,206 | Ps. | 7,319 | Ps. | 4,987 | ||||||||||||||||||
Consolidated comprehensive income | 70,502 | 15,020 | 4,358 | |||||||||||||||||||||
Net income per share (constant Mexican pesos): | ||||||||||||||||||||||||
Per Series “B” share | Ps. | 0.43 | Ps. | 0.35 | Ps. | 0.32 | ||||||||||||||||||
Per Series “D” share | 0.53 | 0.43 | 0.40 | |||||||||||||||||||||
Less: Comprehensive income attributable to the noncontrolling interest | (4,867 | ) | (776 | ) | 193 | |||||||||||||||||||
Consolidated comprehensive income attributable to the controlling interest | Ps. | 65,635 | 14,244 | 4,551 | ||||||||||||||||||||
Net controlling interest income per share: | ||||||||||||||||||||||||
Per Series “B” | Ps. | 3.36 | Ps. | 0.49 | Ps. | 0.34 | ||||||||||||||||||
Per Series “D | 4.20 | 0.62 | 0.43 | |||||||||||||||||||||
Consolidated Cash Flows | 2007 | 2006 | 2005 | 2010 | 2009 | 2008 | ||||||||||||||||||
Cash flows from operating activities: | ||||||||||||||||||||||||
Net income | Ps. | 8,557 | Ps. | 6,973 | Ps. | 6,059 | Ps. | 72,204 | Ps. | 10,685 | Ps. | 6,599 | ||||||||||||
Adjustments to reconcile net income to net cash provided by (used in) operating activities: | ||||||||||||||||||||||||
Minority interest | 32 | (169 | ) | — | ||||||||||||||||||||
Inflation effect | (722 | ) | (710 | ) | (544 | ) | (215 | ) | (1 | ) | (1 | ) | ||||||||||||
Depreciation | 2,114 | 2,080 | 1,930 | 4,884 | 2,786 | 2,439 | ||||||||||||||||||
Amortization | 2,347 | 2,416 | 1,998 | 1,620 | 2,487 | 2,469 | ||||||||||||||||||
Participation in affiliated companies | (3,661 | ) | (2,332 | ) | (2,077 | ) | ||||||||||||||||||
Equity method | (402 | ) | (4,502 | ) | (2,886 | ) | ||||||||||||||||||
Deferred taxes | (719 | ) | (383 | ) | (367 | ) | 10,447 | (3,185 | ) | (1,819 | ) | |||||||||||||
Other non-cash charges | 750 | 1,332 | 586 | 673 | 5,353 | 2,779 | ||||||||||||||||||
Profit regarding Coca-Cola FEMSA (see Note 27 A) | (39,847 | ) | — | — | ||||||||||||||||||||
Income from the exchange of FEMSA Cerveza (see Note 27 B) | (27,132 | ) | ||||||||||||||||||||||
Changes in operating assets and liabilities net of business acquisitions: | ||||||||||||||||||||||||
Working capital investment | (340 | ) | (3,026 | ) | 357 | (5,609 | ) | (1,640 | ) | (914 | ) | |||||||||||||
Dividends received from Coca-Cola FEMSA | 435 | 317 | 283 | — | 722 | 508 | ||||||||||||||||||
Recoverable taxes, net | (422 | ) | (481 | ) | (547 | ) | ||||||||||||||||||
(Recoverable) payable taxes, net | (1,946 | ) | 673 | (354 | ) | |||||||||||||||||||
Interest payable | 27 | 80 | (5 | ) | (851 | ) | (370 | ) | (276 | ) | ||||||||||||||
Labor obligations | (171 | ) | (366 | ) | (168 | ) | (741 | ) | (512 | ) | (453 | ) | ||||||||||||
Derivative financial instruments | (281 | ) | (428 | ) | (1,208 | ) | ||||||||||||||||||
Net cash flows provided by operating activities | 8,227 | 5,731 | 7,505 | 12,804 | 12,068 | 6,883 | ||||||||||||||||||
Cash flows from investing activities: | ||||||||||||||||||||||||
Acquisitions of Coca-Cola FEMSA minority interest | — | (4,601 | ) | — | ||||||||||||||||||||
Acquisitions by FEMSA Cerveza, net of cash acquired | 356 | (1,711 | ) | — | — | — | (27 | ) | ||||||||||||||||
Sale of property, plant and equipment | 150 | 91 | 161 | 643 | 422 | 48 | ||||||||||||||||||
Investment in property, plant and equipment | (3,825 | ) | (3,182 | ) | (2,330 | ) | ||||||||||||||||||
Acquisition of property, plant and equipment | (8,210 | ) | (3,709 | ) | (5,612 | ) | ||||||||||||||||||
Purchase of marketable securities in investing activities | (66 | ) | ||||||||||||||||||||||
Proceeds from marketable securities | 1,108 | |||||||||||||||||||||||
Other assets | (3,885 | ) | (3,091 | ) | (3,002 | ) | (2,111 | ) | (3,660 | ) | (3,432 | ) | ||||||||||||
Bottles and cases | (245 | ) | (95 | ) | (57 | ) | (985 | ) | (70 | ) | (260 | ) | ||||||||||||
Investment in shares | 9 | 7 | — | |||||||||||||||||||||
Recovery of long-term financial receivables with FEMSA Cerveza | 12, 209 | — | — | |||||||||||||||||||||
Net effect of FEMSA Cerveza exchange | (158 | ) | ||||||||||||||||||||||
Cash incorporated from Coca-Cola FEMSA | 5,950 | |||||||||||||||||||||||
Other disposals | 1,949 | — | — | |||||||||||||||||||||
Net cash flows used in investing activities | (7,440 | ) | (12,582 | ) | (5,228 | ) | 10,329 | (7,017 | ) | (9,283 | ) | |||||||||||||
Cash flows from financing activities: | ||||||||||||||||||||||||
Increase in capital stock | — | — | 7,644 | |||||||||||||||||||||
Bank loans obtained | 6,660 | 6,229 | 16 | 12,381 | 16,775 | 18,465 | ||||||||||||||||||
Bank loans paid | (6,368 | ) | (604 | ) | (5,982 | ) | (12,569 | ) | (14,541 | ) | (14,662 | ) | ||||||||||||
Dividends declared and paid | (1,486 | ) | (986 | ) | (660 | ) | (3,813 | ) | (1,620 | ) | (1,620 | ) | ||||||||||||
Derivative financial instruments | (273 | ) | (498 | ) | (221 | ) | ||||||||||||||||||
Restricted cash activity for the year | (181 | ) | (88 | ) | (134 | ) | ||||||||||||||||||
Other financing activities | 30 | 6 | (80 | ) | (194 | ) | (4 | ) | 257 | |||||||||||||||
Net cash flows (used in) provided by financing activities | (1,437 | ) | 4,147 | 717 | ||||||||||||||||||||
Net cash flows provided (used in) by financing activities | (4,376 | ) | 522 | 2,306 | ||||||||||||||||||||
Effect of exchange rate changes on cash and cash equivalents | 101 | (15 | ) | (32 | ) | 50 | (596 | ) | 99 | |||||||||||||||
Cash and cash equivalents: | ||||||||||||||||||||||||
Net decrease | (549 | ) | (2,719 | ) | 2,962 | |||||||||||||||||||
Initial balance | 3,463 | 6,182 | 3,220 | |||||||||||||||||||||
Net increase | 18,807 | 4,977 | 5 | |||||||||||||||||||||
Initial cash | 7,896 | 2,919 | 2,914 | |||||||||||||||||||||
Ending balance | Ps. | 2,914 | Ps. | 3,463 | Ps. | 6,182 | Ps. | 26,703 | Ps. | 7,896 | Ps. | 2,919 | ||||||||||||
Supplemental cash flow information: | ||||||||||||||||||||||||
Interest paid | Ps. | (2,310 | ) | Ps. | (1,804 | ) | Ps. | (2,033 | ) | Ps. | (2,868) | Ps. | (2,586) | Ps. | (2,268) | |||||||||
Income taxes and tax on assets paid | (2,699 | ) | (2,463 | ) | (2,150 | ) | (6,171 | ) | (3,737) | (2,849) | ||||||||||||||
The effect of exchange rate changes on cash balances held in foreign currencies was Ps. 50 as a gain as of December 31, 2010, a loss of Ps. 596 and a gain of Ps. 99 as of December 31, 2009 and 2008, respectively.
Consolidated Statements of Changes in Stockholders’ Equity | 2007 | 2006 | 2010 | 2009 | ||||||||||||
Stockholders’ equity at the beginning of the year | Ps. | 73,925 | Ps. | 68,554 | Ps. 99,442 | Ps. 86,042 | ||||||||||
Dividends declared and paid | (1,525 | ) | (1,056 | ) | (3,813 | ) | (1,620 | ) | ||||||||
Adoption of SFAS No. 158 | — | (892 | ) | |||||||||||||
Noncontrolling interest variation | (891 | ) | (7 | ) | ||||||||||||
Acquisition of Coca-Cola FEMSA | 77,277 | — | ||||||||||||||
Other transactions of noncontrolling interest | (273 | ) | — | |||||||||||||
Other comprehensive income (loss): | ||||||||||||||||
Derivative financial instruments | 398 | (157 | ) | 1,036 | 993 | |||||||||||
Labor liabilities | 82 | 25 | (302 | ) | 285 | |||||||||||
Cumulative translation adjustment | 564 | (107 | ) | (3,130 | ) | 3,810 | ||||||||||
Result of holding non-monetary assets | 605 | 585 | ||||||||||||||
Reversal of inflation effect | 1,111 | (746 | ) | |||||||||||||
Recycling of OCI due to exchange Beer Business | (525 | ) | ||||||||||||||
Other comprehensive income | 1,649 | 346 | ||||||||||||||
Other comprehensive (loss) gain controlling inerest | (1,810 | ) | 4,342 | |||||||||||||
Net income | 8,557 | 6,973 | 72,204 | 10,685 | ||||||||||||
Stockholders’ equity at the end of the year | Ps. | 82,606 | Ps. | 73,925 | Ps. 242,136 | Ps. 99,442 | ||||||||||
Note 27.28. Reconciliation of Mexican FRS to U.S. GAAP.
| a) | Reconciliation of Net Income: |
| 2007 | 2006 | 2005 | ||||||||||
Net majority income under Mexican FRS | Ps. | 8,511 | Ps. | 7,127 | Ps. | 5,951 | ||||||
U.S. GAAP adjustments: | ||||||||||||
Restatement of prior year financial statements (Note 26 b) | — | (254 | ) | 40 | ||||||||
Participation in Coca-Cola FEMSA (Note 26 a) | (77 | ) | 13 | (57 | ) | |||||||
Start-up expenses (Note 26 e) | (10 | ) | (15 | ) | (22 | ) | ||||||
Restatement of imported equipment (Note 26 g) | (31 | ) | (56 | ) | (29 | ) | ||||||
Capitalization of the integral result of financing (Note 26 h) | (48 | ) | (50 | ) | (46 | ) | ||||||
Deferred income taxes (Note 26 j) | 18 | 52 | 147 | |||||||||
Deferred employee profit sharing (Note 26 j) | 180 | 148 | 249 | |||||||||
Labor liabilities (Note 26 k) | — | 5 | (279 | ) | ||||||||
Sale of minority interest (Note 26 l) | 13 | — | — | |||||||||
Minority interest (Note 26 m) | 1 | 3 | — | |||||||||
Derivative financial instruments (Note 26 i) | — | — | 105 | |||||||||
Total U.S. GAAP adjustments | 46 | (154 | ) | 108 | ||||||||
Net income under U.S. GAAP | Ps. | 8,557 | Ps. | 6,973 | Ps. | 6,059 | ||||||
Under U.S. GAAP, the monetary position effect of the income statement adjustments is included in each adjustment, except for the capitalization of the integral result of financing, intangible assets and goodwill as well as pension plan liabilities, which are non-monetary.
| 2010 | 2009 | 2008 | ||||||||||
Net consolidated income under Mexican FRS | Ps. 45,290 | Ps. 15,082 | Ps. 9,278 | |||||||||
Noncontrolling interest under Mexican FRS of Coca-Cola FEMSA | (222 | ) | (4,390 | ) | (2,819 | ) | ||||||
U.S. GAAP adjustments: | ||||||||||||
Reversal of inflation effect (Note 27 C) | (24 | ) | — | — | ||||||||
Participation in Coca-Cola FEMSA (Note 27 A) | (39 | ) | (63 | ) | (14 | ) | ||||||
Coca-Cola FEMSA acquisition depreciation and amortization (Note 27 A) | (961 | ) | — | |||||||||
Heineken equity method (Note 27 B) | (2,789 | ) | — | |||||||||
Net effect on exchange of FEMSA Cerveza (Note 27 B) | (9,881 | ) | — | |||||||||
Start-up expenses (Note 27 E) | — | — | (16 | ) | ||||||||
Restatement of imported equipment (Note 27 H) | (165 | ) | (12 | ) | (14 | ) | ||||||
Capitalization of interest expense (Note 27 I) | 57 | (49 | ) | (49 | ) | |||||||
Deferred income taxes (Note 27 K) | 769 | (9 | ) | (65 | ) | |||||||
Deferred employee profit sharing (Note 27 K) | 257 | 80 | 211 | |||||||||
Gain on control acquisition of Coca-Cola FEMSA (Note 27 A) | 39,847 | — | — | |||||||||
Gain on de-consolidation of Crystal operation (Note 27 O) | (44 | ) | — | — | ||||||||
Deferred promotional expenses (Note 27 F) | 58 | — | — | |||||||||
Employee benefits (Note 27 L) | 51 | 46 | 87 | |||||||||
Total U.S. GAAP adjustments | 27,136 | (7 | ) | 140 | ||||||||
Net income under U.S. GAAP | Ps. 72,204 | Ps. 10,685 | Ps. 6,599 | |||||||||
| b) | Reconciliation of Stockholders’ Equity: |
| 2007 | 2006 | |||||||
Majority stockholders’ equity under Mexican FRS | Ps. | 64,578 | Ps. | 56,654 | ||||
U.S. GAAP adjustments: | ||||||||
Restatement of prior year financial statements | — | (395 | ) | |||||
Participation in Coca-Cola FEMSA (Note 26 a) | 178 | (7 | ) | |||||
Start-up expenses (Note 26 e) | (207 | ) | (197 | ) | ||||
Intangible assets and goodwill (Note 26 f) | 54 | 54 | ||||||
Restatement of imported equipment (Note 26 g) | 140 | 437 | ||||||
Capitalization of the integral result of financing (Note 26 h) | 313 | 361 | ||||||
Deferred income taxes (Note 26 j) | 491 | 516 | ||||||
Deferred employee profit sharing (Note 26 j) | (483 | ) | (650 | ) | ||||
Labor liabilities (Note 26 k) | (1,271 | ) | (1,682 | ) | ||||
Acquisition of Coca-Cola FEMSA minority interest (Note 26 l) | 1,609 | 1,609 | ||||||
Acquisitions by FEMSA Cerveza (Note 26 l) | 61 | 80 | ||||||
Minority interest (Note 26 m) | (2 | ) | — | |||||
FEMSA’s minority interest acquisition (Note 26 n) | 17,145 | 17,145 | ||||||
Total U.S. GAAP adjustments | 18,028 | 17,271 | ||||||
Stockholders’ equity under U.S. GAAP | Ps. | 82,606 | Ps. | 73,925 | ||||
| 2010 | 2009 | |||||||
Total stockholders’ equity under Mexican FRS | Ps. | 153,013 | Ps. | 115,829 | ||||
Noncontrolling interest under Mexican FRS of Coca-Cola FEMSA | — | (32,918 | ) | |||||
U.S. GAAP adjustments: | ||||||||
Control acquisition of Coca-Cola FEMSA (Note 27 A) | 90,980 | — | ||||||
Coca-Cola FEMSA acquisition depreciation and amortization | (961 | ) | — | |||||
Gain on acquisition of Brisa intangible assets (Note 27 G) | 72 | — | ||||||
Gain on deconsolidation of Crystal operation (Note 27 O) | 75 | — | ||||||
Deferred promotional expenses (Note 27 F) | (46 | ) | — | |||||
Reversal of inflation effect (Note 27 C) | (443 | ) | — | |||||
Participation in Coca-Cola FEMSA (Note 27 A) | (39 | ) | (1,328 | ) | ||||
Heineken equity method (Note 27 B) | (3,065 | ) | — | |||||
Intangible assets and goodwill (Note 27 G) | 100 | 54 | ||||||
Restatement of imported equipment (Note 27 H) | 351 | 134 | ||||||
Capitalization of interest expense (Note 27 I) | 200 | 215 | ||||||
Deferred income taxes (Note 27 K) | 523 | 483 | ||||||
Deferred employee profit sharing (Note 27 K) | 181 | (134 | ) | |||||
Employee benefits (Note 27 L) | (808 | ) | (1,713 | ) | ||||
Acquisition of Coca-Cola FEMSA noncontrolling interest (Note 27 N) | — | 1,609 | ||||||
Acquisitions by FEMSA Cerveza (Note 27 N) | — | 66 | ||||||
FEMSA’s noncontrolling interest acquisition (Note 27 N) | 2,003 | 17,145 | ||||||
Total U.S. GAAP adjustments | 89,123 | 16,531 | ||||||
Stockholders’ equity under U.S. GAAP | Ps. | 242,136 | Ps. | 99,442 | ||||
| c) | Reconciliation of Comprehensive Income: |
| 2007 | 2006 | 2005 | ||||||||
Majority comprehensive income under Mexican FRS | Ps. | 9,417 | Ps. | 6,998 | Ps. | 4,356 | ||||
U.S. GAAP adjustments: | ||||||||||
Net income (Note 27 a) | 46 | (154 | ) | 108 | ||||||
Result of holding non-monetary assets | 420 | 475 | 177 | |||||||
Derivative financial instruments | — | — | 346 | |||||||
Additional labor liability in excess of unamortizated transition obligation | 323 | — | — | |||||||
Comprehensive income under U.S. GAAP | Ps. | 10,206 | Ps. | 7,319 | Ps. | 4,987 | ||||
| 2010 | 2009 | 2008 | ||||||||||
Consolidated comprehensive income under Mexican FRS | Ps. | 42,589 | Ps. | 21,355 | Ps. | 9,085 | ||||||
Comprehensive income of the noncontrolling interest under Mexican FRS | (4,190 | ) | (6,734 | ) | (3,515 | ) | ||||||
Comprehensive income of the controlling interest under Mexican FRS | 38,399 | 14,621 | 5,570 | |||||||||
U.S. GAAP adjustments: | ||||||||||||
Net income (Note 28 A) | 27,192 | (7 | ) | 144 | ||||||||
Cumulative translation adjustment | 36 | 91 | (18 | ) | ||||||||
Reversal of inflation effect | 1,111 | (746 | ) | (839 | ) | |||||||
Heineken equity method | (276 | ) | — | — | ||||||||
Recycling of OCI due to exchange Beer Business | (525 | ) | — | — | ||||||||
Additional labor liability in excess of unamortized transition obligation | (302 | ) | 285 | (306 | ) | |||||||
Comprehensive income under U.S. GAAP | Ps. | 65,635 | Ps. | 14,244 | Ps. | 4,551 | ||||||
Note 28.29. Future Impact of Recently Issued Accounting Standards Not Yet in Effect.
TheComisión Nacional Bancaria y de Valores(Mexican National Banking and Securities Commission, or CNBV) announced that commencing in 2012; all Mexican public companies must report their financial information in accordance with IFRS as issued by the Accounting Standards Board (“IASB). Since 2006, theConsejo Mexicano para la Investigación y Desarrollo de Normas de Información Financiera(Mexican Board of Research and Development of Financial Reporting Standards) has been modifying Mexican FRS in order to ensure their convergence with IFRS.
FEMSA will adopt IFRS in 2012. The consolidated financial statements of the Company as of December 31, 2012 and 2011 (comparative period required by IFRS) will be presented according to IFRS as issued by the IASB. As stated by the SEC, foreign private issuers are not required to reconcile to U.S. GAAP if IFRS are fully adopted.
As of the date of issuance of these consolidated financial statements and their accompanying notes, the Company is determining its opening consolidated statement of financial position for IFRS and assessing all the possible impacts in its consolidated financial statements. As part of the transition process to IFRS, the Company is reviewing its accounting policies in order to comply with international standards by the transition date (January 1, 2011).
| a) | Mexican FRS: |
During 2007, theThe following new accounting standards werehave been issued under Mexican FRS, the application of which is required as indicated. The CompanyExcept as otherwise noted, FEMSA will adopt these standards aswhen they become effective. The Company is in the process of January 1, 2008 and has not fully assessedassessing the effect of adopting thesethe new standards, on its consolidated financial information.but the Company does not anticipate any significant impact except as may be described below.
NIF B-2, “Statement of Cash Flows”B-5 “Financial Information by Segment”
This NIF B-5 establishes general rulesthat an operating segment shall meet the following criteria: i) the segment engages in business activities from which it earns or is in the process of obtaining revenues, and incurs in the related costs and expenses; ii) the operating results are reviewed regularly by the main authority of the entity’s decision maker; and iii) specific financial information is available. NIF B-5 also requires disclosures related to operating segments subject to reporting, including details of earnings, assets and liabilities, reconciliations, information about products and services, and geographical areas. NIF B-5 is effective beginning on January 1, 2011, and this guidance shall be applied retrospectively for comparative purposes.
NIF B-9 “Interim Financial Reporting”
NIF B-9 prescribes the content to be included in a complete or condensed set of financial statements for an interim period. In accordance with this standard, the complete set of financial statements shall include: a) a statement of financial position as of the end of the period, b) an income statement for the presentation, structure and preparation of cash flow statement, as well as the disclosures supplementing such statement, which replaces theperiod, c) a statement of changes in equity for the period, d) a statement of cash flows for the period, and e) notes providing the relevant accounting policies and other explanatory notes. Condensed financial position. NIF B-2 requires that thestatements shall include: a) condensed statement show a company’s cash inflows and outflows during the period. Line items should be preferably presented gross. Cash flows from financing activities are now presented below those from investing activities (a departure from theof financial position, b) condensed income statement, c) condensed statement of changes in financial position). In addition, NIF B-2 allows entities to determine and present theirequity, d) condensed statement of cash flows, from operating activities using either the direct or indirect method.
and e) selected explanatory notes. NIF B-10, “Effects of Inflation”
CINIF defines two economic environments: a) inflationary environment, when cumulative inflation of three preceding yearsB-9 is 26% or more,effective beginning on January 1, 2011. Interim financial statements shall be presented in which case, the effects of inflation should be recognized using the comprehensive method; and b) non-inflationary environment, when cumulative inflation of the three preceding years is less than 26%, in which case, no inflationary effects should be recognized in the financial statements. Additionally, NIF B-10 eliminates the replacement cost and specific indexation methods for inventories and fixed assets, respectively, and requires that the cumulative gain or loss from holding non-monetary assets be reclassified to retained earnings, if such gain or loss is realized; the gain or loss that is not realized will be maintained in stockholders’ equity and charged to current earnings of the period in which the originating item is realized.comparative form.
NIF B-15, “Translation of Foreign Currencies”C-4, “Inventories”:
NIF B-15 eliminates classificationIn November 2010, the CINIF issued Mexican FRS C-4, which will be effective for fiscal years beginning on or after January 1, 2011 and will replace Mexican accounting Bulletin C-4, Inventories. Any accounting changes resulting from the adoption of integrated foreign operationsthis standard related to changes in the formula for assigning inventory costs are to be recognized retrospectively. Changes in valuation methods must be recognized prospectively.
The principal difference between Mexican accounting Bulletin C-4 and foreign entitiesMexican FRS C-4 is that the new standard does not allow using direct costs as the inventory valuation method nor does it allow using the LIFO cost method as the formulas (formerly method) for the assignment of unit cost to the inventories. Mexican FRS C-4 establishes that inventories must be valued at the lower of either acquisition cost or net realizable value. Such standard also establishes that advances to suppliers for the acquisition of merchandise must be classified as inventories provided the risks and incorporatesbenefits are transferred to the concepts of accounting currency, functional currency and reporting currency. NIF B-15Company. Mexican FRS C-4 also establishes the procedures to translate the financial information of a foreign subsidiary: i) from the accounting to the functional currency, and ii) from the functional to the reporting currency, and allows entities to present their financial statements in a reporting currency other than their functional currency.standards for service supplier inventory valuations.
NIF D-3, “Employee Benefits”C-5, “Prepaid Expenses”:
In November 2010, the CINIF issued Mexican FRS C-5, which will be effective for fiscal years beginning on or after January 1, 2011. Mexican FRS C-5 will replace Mexican accounting Bulletin B-5. Any accounting changes resulting from the adoption of this standard shall be recognized retrospectively.
This standard establishes that the main characteristic of prepaid expenses is that they do not result in the transfer to the entity of the benefits and risks inherent to the goods or services to be received. Consequently, prepaid expenses must be recognized in the balance sheet as either current or non-current assets, depending on the item classification in the statement of financial position. Moreover, Mexican FRS C-5 establishes that prepaid expenses made for goods or services whose inherent benefits and risks have already been transferred to the entity must be carried to the appropriate caption.
NIF C-6, “Property, Plant and Equipment”:
Mexican FRS C-6 was issued by the CINIF in December 2010 to replace Mexican accounting Bulletin C-6, Property, Machinery and Equipment, and will be effective for fiscal years beginning on or after January 1, 2011, except for the changes related to the segregation of property, plant and equipment into separate components for those assets with different useful lives. For entities that have not performed this component segregation, the provisions of this new standard will be effective as of January 1, 2012.
Unlike Mexican accounting Bulletin C-6, this standard includes currentwithin its scope the tax treatment for assets acquired to develop or maintain biological assets and deferred PTU. Deferred PTU shouldassets related to the mining industry. Among other points, it establishes that for acquisitions of free-of-charge assets, the cost of the assets must be calculated usingnull, thus eliminating the same methodology establishes in NIF D-4. It also includesoption of performing appraisals. In the career salary conceptcase of asset exchanges, Mexican FRS C-6 requires entities to determine the commercial substance of the transaction and the amortization perioddepreciation of most items reduced to five years, as follows:
Items willthese assets must be amortized over a 5-year period, or less, if employees’ remaining labor life is less than the:
Beginning balanceapplied against the components of the transition liabilityassets, and the amount to be depreciated is the cost of acquisition less the asset’s residual value. Prepaid expenses for severancethe acquisition of assets are to be recognized as a component of the asset as of the time the benefits and risks inherent to such assets are transferred. In the case of retirement benefits.
Beginning balance of past service cost and changes toassets, income is recognized when the plan.
Beginning balance of gains and losses from severance benefits, according to actuarial calculations, should be amortized againstrequirements for income recognition outlined under the results of 2008.standard have been met. There are specific disclosures for public entities.
Beginning balance of gains and losses from retirement benefits, according to actuarial calculations, should be amortized over a 5-year period (net transition liability), with the option to fully amortize such item against the results of 2008.
NIF D-4, “Income Taxes”C-18 “Obligations Related to Retirement of Property, Plant and Equipment”:
In December 2010, the CINIF issued Mexican FRS C-18, which came into force for fiscal years beginning on or after January 1, 2011.
This NIF relocatesstandard establishes the accounting treatment for currentthe initial and deferred PTUsubsequent recognition of a liability for provision for legal obligations or assumed related to NIF D-3, eliminates the permanent difference concept, redefinesretirement of property, plant and incorporates various definitions.equipment recognized as a result of the acquisition, construction, development and/or normal operating of such components.
This standard also establishes that an entity must initially recognize a provision for obligations related to retirement of property, plant and equipment based on its best estimate of the disbursements required to settle the present obligation at the time it is assumed, provided a reliable estimate can be made of the amount of the obligation. The best estimate of a provision for an obligation associated with the retirement of property, plant and equipment components should be determined using the expected present value method.
| b) | U.S. GAAP: |
The following newThere are no significant accounting standards that have been issued under U.S. GAAP,that are effective in 2011, impacting the application of which is required as indicated. The Company does not anticipate that those new standards will have a significant impact on its consolidated financial position or results of operations.
FASB Staff Position (“FSP”) FASB Interpretation No. 39 “Offsetting of Amounts Related to Certain Contracts,” or FSP FIN No. 39
This FSP amends paragraph 3 of FASB Interpretation No. 39, to replace the terms conditional contracts and exchange contracts with the term derivative instruments as defined in SFAS No. 133. It also amends paragraph 10 of FASB Interpretation No. 39 to permit a reporting entity to offset fair value amounts recognized for the right to reclaim cash collateral (a receivable) or the obligation to return cash collateral (a payable) against fair value amounts recognized for derivative instruments executed with the same counterparty under the same master netting arrangement that have been offset in accordance with that paragraph. This FSP is effective for fiscal years beginning after November 15, 2007.
“The Fair Value Option for Financial Assets and Financial Liabilities,” or SFAS No. 159
This standard permits entities to choose to measure financial instruments and certain other items at fair value to mitigate volatility in reported earnings. According to this Statement, these are eligible items for the use of the fair value measurement: (1) Recognized financial assets and financial liabilities; (2) Firm commitments that would otherwise not be recognized at inception and that involve only financial instruments; (3) Non-financial insurance contracts and warranties that the insurer can settle by paying a third party to provide those goods or services; and (4) Host financial instruments resulting from separation of an embedded non-financial derivative instrument from a non-financial hybrid instrument. The fair value option established by SFAS No. 159 permits all entities to choose to measure eligible items at fair value at specified election dates. A business entity shall report unrealized gains and losses on items for which the fair value option has been elected in earnings (or another performance indicator if the business entity does not report earnings) at each subsequent reporting date. SFAS No. 159 is effective as of the beginning of an entity’s first fiscal year that begins after November 15, 2007. The Company is in the process of determining the impact of adopting this new accounting principle on its consolidated financial position and results of operations.
“Business Combinations,” an amendment of SFAS No. 141, or SFAS No. 141(R)
This statement requires (a) a company to recognize the assets acquired, the liabilities assumed, and any non-controlling interest in the acquiree at fair value as of the acquisition date; and (b) an acquirer in preacquisition periods to expense all acquisition-related costs. SFAS No. 141(R) requires that any adjustments to an acquired entity’s deferred tax asset and liability balance that occur after the measurement period be recorded as a component of income tax expense. This accounting treatment is required for business combinations consummated before the effective date of SFAS No. 141(R) (non-prospective) otherwise SFAS No. 141(R) must be applied prospectively. Early adoption is prohibited. SFAS No. 141(R) is effective for fiscal years, and interim periods within those fiscal years, beginning on or after December 15, 2008.
“Fair Value Measurements,” or SFAS No. 157
This statement establishes a framework for measuring fair value and expands disclosures about fair value measurements. SFAS No. 157 clarifies the definition of exchange price as the price between market participants in an orderly transaction to sell an asset or transfer a liability in the market in which the reporting entity would transact for the asset or liability, that is, the principal or most advantageous market for the asset or liability. The changes to current practice resulting from the application of this statement relate to the definition of fair value, the methods used to measure fair value, and the expanded disclosures about fair value measurements. SFAS No. 157 is effective for fiscal years beginning after November 15, 2007 and interim periods within those fiscal years. On February 12, 2008, the FASB issued FSP FAS 157-1 and FSP FAS 157-2, which remove leasing transactions accounted for under SFAS No. 13 “Accounting for Leases” from the scope of SFAS No. 157 and partially defer the effective date of SFAS No. 157 as it relates all non-recurring fair value measurement of non-financial assets and non-financial liabilities until fiscal years beginning after November 15, 2008. The Company is in the process of determining the impact of adopting this new accounting principle on its consolidated financial position and results of operations.
“Non-controling Interest in Consolidated Financial Statements,” or SFAS No. 160
This statement has the following effects on an entity’s financial statements: (a) amends ARB No. 51 to establish accounting and reporting standards for the non-controlling interest in a subsidiary and the deconsolidation of a subsidiary; (b) changes the way the consolidated income statement is presented; (c) establishes a single method of accounting for changes in a parent’s ownership interest in a subsidiary that do not result in deconsolidation; (d) requires that a parent recognize a gain or loss in net income when a subsidiary is deconsolidated; and (e) requires expanded disclosures in the consolidated financial statements that clearly identify and distinguish between the interests of the parent company and the interests of the non-controlling owners of a subsidiary. SFAS No. 160 must be applied prospectively and early adoption is prohibited. SFAS No. 160 is effective for fiscal years, and interim periods within those fiscal years, beginning on or after December 15, 2008. The Company is in the process of determining the impact of adopting this new accounting principle on its consolidated financial position and results of operations.
Note 29. Relevant Events.
Coca-Cola FEMSA reached an understanding with The Coca-Cola Company to acquire its wholly owned bottling franchise Minas Gerais Ltda., “REMIL” in Brazil. The closing, terms and conditions of the transaction are subject to a confirmatory due-diligence process, negotiation and execution of a definitive agreement and approval by the Boards of Directors of both companies. The transaction is expected to close during 2008.Company.
Note 30. Subsequent Events.
On February 23, 2011, the Company’s Board of Directors agreed to propose an ordinary dividend of Ps. 4,600 which represents an increase of 77% compared to the dividend paid during 2010. This dividend was approved in the Annual Shareholders meeting on March 25, 2011.
On February 18, 2011, Coca-Cola FEMSA’s Board of Directors agreed to propose an ordinary shareholdersdividend of Ps. 4,358 and represents an increase of 67.4% as compared to the dividend was heldpaid on April, 22, 2008. During this2010. This dividend was approved in the Annual Shareholders meeting shareholders approvedon March 23, 2011.
On March 17, 2011, a proposalconsortium of investors formed by FEMSA, the Macquarie Mexican Infrastructure Fund and other investors, acquired Energía Alterna Istmeña, S. de R.L. de C.V., which we refer to amend FEMSA’s bylawsas EAI, and Energía Eólica Mareña, S.A. de C.V., which we refer to as EEM, from subsidiaries of Preneal, S.A., which we refer to as Preneal, for a transaction enterprise value of Ps. 1,063.5. FEMSA owns a 45% interest in order to preserve the unit structure for FEMSA’s shares that has beenconsortium. EAI and EEM are the owners of a 396 megawatt late-stage wind energy project in place since May 1998, and to maintain the existing share structure beyond May 11, 2008. FEMSA’s bylaws previously provided that on May 11, 2008 Series D-B Shares would convert into Series B Shares, and Series D-L Shares would convert into Series L Shares with limited voting rights. In addition, FEMSA’s bylaws provided that the current unit structure would cease to exist and each of B Units would be unbundled into five Series B Shares, while each BD Unit would unbundle into three Series B Shares and two newly issued Series L Shares. Following April 22, 2008 shareholder approvals, the automatic conversionsouth-eastern region of the shareState of Oaxaca. Certain subsidiaries of FEMSA, FEMSA Comercio and unit structures will no longer exist,Coca-Cola FEMSA have entered into a 20-year wind power supply agreements with EAI and absent shareholder action,EEM to purchase energy output produced by such companies. The project is currently in its long-term financing stage.
On March 28, 2011, Coca-Cola FEMSA, together with The Coca-Cola Company, acquired Grupo Estrella Azul (also known as Grupo Industrias Lacteas), a Panamanian company engaged for more than 50 years in the share structurediary and juice-based beverage categories. Coca-Cola FEMSA acquired 50% interest in Grupo Estrella and will continue to be compriseddevelop this business jointly with thw Coca-Cola Company. Beginning in April 2011, both The Coca-Cola Company and Coca-Cola FEMSA commenced the gradual integration of Series B Shares, which must represent up to 51%Grupo Estrella into the existing beverage platform they share for the development of FEMSA’s outstanding capital stock,non-carbonated products in Panama.
On April 18, Coca-Cola FEMSA successfully issued two tranches of Certificados Bursátiles – a five-year bond in the aggregate amount of Ps. 2,500 million at a yield of 28-day TIIE plus 13 basis points and Series D-B and Series D-L Shares, which together may represent up to 49%a 10-year bond in the aggregate amount of Ps. 2,500 million at a fixed rate of 8.27%. A portion of the Company outstanding capital stock. FEMSA Unit structureproceeds from this placement will continuebe used to consist of B Units, which bundle five Series B Shares, and BD Units, which bundle one Series B Share, two Series D-B Shares and two Series D-L Shares.
Atpay Coca-Cola FEMSA’s KOF-07 Certificado Bursátil at maturity in March 2012, in the ordinary stockholders’ meeting of FEMSA held on April 22, 2008, the stockholders approved a dividend of Ps. 0.0807 Mexican pesos (nominal value) per series “B” share and Ps. 0.1009 Mexican pesos (nominal value) per series “D” share that was paid in May 2008. Additionally, the stockholders approved a maximumamount of Ps. 3,000 million. The remainder of the proceeds will be used for a stock repurchase program.general corporate purposes, including capital expenditures and working capital.
At an ordinary stockholders meetingOn May 5, 2011, the Company received dividends of Coca-Cola FEMSA held on April 8, 2008, the stockholders approved a dividend of Ps.945 million that was paidPs. 1,008 regarding its 20% economic interest in May 2008. The corresponding payment to the minority interest was Ps. 437.Heineken.
Report of Independent Registered Public Accounting Firm
ToTo: the StockholdersExecutive Board of Heineken N.V.
FEMSA COMERCIO, S.A. de C.V.
We have audited the accompanying consolidated balance sheetsstatement ofFEMSA COMERCIO, S.A. de C.V. financial position of Heineken N.V. and Subsidiaries (a wholly-owned subsidiary of FOMENTO ECONÓMICO MEXICANO, S.A. de C.V.)subsidiaries as of December 31, 2007 and 2006,2010 and the related consolidated statements of income, stockholders’ equitycomprehensive income, cash flows and changes in financial positionequity, for each of the three years in the period ended December 31, 2007 (not presented separately herein).year then ended. These consolidated financial statements have been prepared in accordance with International Financial Reporting Standards as issued by the International Accounting Standards Board and are the responsibility of the Company’s management. Our responsibility is to express an opinion on these consolidated financial statements based on our audits.audit.
We conducted our auditsaudit in accordance with the auditing standards of the Public Company Accounting Oversight Board (United States). Those standards require that we plan and perform the audit to obtain reasonable assurance about whether the consolidated financial statements are free of material misstatement. WeThe Company is not required to have, nor were notwe engaged to perform, an audit of the Company’sits internal control over financial reporting. Our auditsaudit included consideration of internal control over financial reporting as a basis for designing audit procedures that are appropriate in the circumstances, but not for the purpose of expressing an opinion on the effectiveness of the Company’s internal control over financial reporting. Accordingly, we express no such opinion. An audit also includes examining, on a test basis, evidence supporting the amounts and disclosures in the financial statements, assessing the accounting principles used and significant estimates made by management, andas well as evaluating the overall financial statement presentation. We believe that our audits provideaudit provides a reasonable basis for our opinion.
In our opinion, the consolidated financial statements referred to above present fairly, in all material respects, the consolidated financial position ofFEMSA COMERCIO, S.A. de C.V. and Subsidiaries at Heineken N.V. as of December 31, 2007 and 2006,2010 and the consolidated results of theirits operations and its cash flows for the changes in their financial position for each of the three years in the periodyear then ended December 31, 2007, in conformity with Mexican financial reporting standards , which differInternational Financial Reporting Standards as issued by the International Accounting Standards Board.
/s/ KPMG ACCOUNTANTS N.V.
Amstelveen, the Netherlands
February 15, 2011
Financial statements
Income Statement
For the year ended 31 December 2010
In millions of EUR | Note | 2010 | 2009 | |||||||||
Revenue | 5 | 16,133 | 14,701 | |||||||||
Other income | 8 | 239 | 41 | |||||||||
Raw materials, consumables and services | 9 | (10,291 | ) | (9,650 | ) | |||||||
Personnel expenses | 10 | (2,680 | ) | (2,379 | ) | |||||||
Amortisation, depreciation and impairments | 11 | (1,118 | ) | (1,083 | ) | |||||||
Total expenses | (14,089 | ) | (13,112 | ) | ||||||||
Results from operating activities | 2,283 | 1,630 | ||||||||||
Interest income | 12 | 100 | 90 | |||||||||
Interest expenses | 12 | (590 | ) | (633 | ) | |||||||
Other net finance expenses | 12 | (19 | ) | 214 | ||||||||
Net finance expenses | (509 | ) | (329 | ) | ||||||||
Share of profit of associates and joint ventures and impairments thereof (net of income tax) | 16 | 193 | 127 | |||||||||
Profit before income tax | 1,967 | 1,428 | ||||||||||
Income tax expenses | 13 | (399 | ) | (286 | ) | |||||||
Profit | 1,568 | 1,142 | ||||||||||
Attributable to: | ||||||||||||
Equity holders of the Company (net profit) | 1,436 | 1,018 | ||||||||||
Non-controlling interests | 132 | 124 | ||||||||||
Profit | 1,568 | 1,142 | ||||||||||
Weighted average number of shares – basic | 23 | 562,234,726 | 488,666,607 | |||||||||
Weighted average number of shares – diluted | 23 | 563,387,135 | 489,974,594 | |||||||||
Basic earnings per share (EUR) | 23 | 2.55 | 2.08 | |||||||||
Diluted earnings per share (EUR) | 23 | 2.55 | 2.08 | |||||||||
Financial statements
of Comprehensive Income
For the year ended 31 December 2010
In millions of EUR | Note | 2010 | 2009 | |||||||||
Profit | 1,568 | 1,142 | ||||||||||
Other comprehensive income: | ||||||||||||
Foreign currency translation differences for foreign operations | 24 | 400 | 112 | |||||||||
Effective portion of change in fair value of cash flow hedges | 24 | 43 | (90 | ) | ||||||||
Effective portion of cash flow hedges transferred to profit or loss | 24 | 45 | 88 | |||||||||
Ineffective portion of cash flow hedges | 24 | 9 | — | |||||||||
Net change in fair value available-for-sale investments | 24 | 11 | 26 | |||||||||
Net change in fair value available-for-sale investments transferred to profit or loss | 24 | (17 | ) | (12 | ) | |||||||
Share of other comprehensive income of associates/joint ventures | 24 | (29 | ) | 22 | ||||||||
Other comprehensive income, net of tax | 24 | 462 | 146 | |||||||||
Total comprehensive income | 2,030 | 1,288 | ||||||||||
Attributable to: | ||||||||||||
Equity holders of the Company | 1,883 | 1,172 | ||||||||||
Non-controlling interests | 147 | 116 | ||||||||||
Total comprehensive income | 2,030 | 1,288 | ||||||||||
Financial statements
of Financial Position
As at 31 December 2010
In millions of EUR | Note | 2010 | 2009 | |||||||||
Assets | ||||||||||||
Property, plant & equipment | 14 | 7,687 | 6,017 | |||||||||
Intangible assets | 15 | 10,890 | 7,135 | |||||||||
Investments in associates and joint ventures | 1,673 | 1,427 | ||||||||||
Other investments and receivables | 17 | 1,103 | 568 | |||||||||
Advances to customers | 32 | 449 | 319 | |||||||||
Deferred tax assets | 18 | 429 | 561 | |||||||||
Total non-current assets | 22,231 | 16,027 | ||||||||||
Inventories | 19 | 1,206 | 1,010 | |||||||||
Other investments | 17 | 17 | 15 | |||||||||
Trade and other receivables | 20 | 2,273 | 2,310 | |||||||||
Prepayments and accrued income | 206 | 189 | ||||||||||
Cash and cash equivalents | 21 | 610 | 520 | |||||||||
Assets classified as held for sale | 7 | 6 | 109 | |||||||||
Total current assets | 4,318 | 4,153 | ||||||||||
Total assets | 26,549 | 20,180 | ||||||||||
Equity | ||||||||||||
Share capital | 922 | 784 | ||||||||||
Share premium | 2,701 | — | ||||||||||
Reserves | 814 | 159 | ||||||||||
ASDI | 666 | — | ||||||||||
Retained earnings | 5,125 | 4,408 | ||||||||||
Equity attributable to equity holders of the Company | 10,228 | 5,351 | ||||||||||
Non-controlling interests | 289 | 296 | ||||||||||
Total equity | 10,517 | 5,647 | ||||||||||
Liabilities | ||||||||||||
Loans and borrowings | 25 | 8,078 | 7,401 | |||||||||
Tax liabilities | 178 | — | ||||||||||
Employee benefits | 28 | 687 | 634 | |||||||||
Provisions | 30 | 475 | 356 | |||||||||
Deferred tax liabilities | 18 | 991 | 786 | |||||||||
Total non-current liabilities | 10,409 | 9,177 | ||||||||||
Bank overdrafts | 21 | 132 | 156 | |||||||||
Loans and borrowings | 25 | 862 | 1,145 | |||||||||
Trade and other payables | 31 | 4,265 | 3,696 | |||||||||
Tax liabilities | 241 | 132 | ||||||||||
Provisions | 30 | 123 | 162 | |||||||||
Liabilities classified as held for sale | 7 | — | 65 | |||||||||
Total current liabilities | 5,623 | 5,356 | ||||||||||
Total liabilities | 16,032 | 14,533 | ||||||||||
Total equity and liabilities | 26,549 | 20,180 | ||||||||||
Financial statements
of Cash Flows
For the year ended 31 December 2010
In millions of EUR | Note | 2010 | 2009 | |||||||||
Operating activities | ||||||||||||
Profit | 1,568 | 1,142 | ||||||||||
Adjustments for: | ||||||||||||
Amortisation, depreciation and impairments | 11 | 1,118 | 1,083 | |||||||||
Net interest expenses | 12 | 490 | 543 | |||||||||
Gain on sale of property, plant & equipment, intangible assets and subsidiaries, joint ventures and associates | 8 | (239 | ) | (41 | ) | |||||||
Investment income and share of profit and impairments of associates and joint ventures | (200 | ) | (138 | ) | ||||||||
Income tax expenses | 13 | 399 | 286 | |||||||||
Other non-cash items | 163 | 1 | ||||||||||
Cash flow from operations before changes in working capital and provisions | 3,299 | 2,876 | ||||||||||
Change in inventories | 95 | 202 | ||||||||||
Change in trade and other receivables | 515 | 337 | ||||||||||
Change in trade and other payables | (156 | ) | (319 | ) | ||||||||
Total change in working capital | 454 | 220 | ||||||||||
Change in provisions and employee benefits | (205 | ) | (67 | ) | ||||||||
Cash flow from operations | 3,548 | 3,029 | ||||||||||
Interest paid | (554 | ) | (467 | ) | ||||||||
Interest received | 15 | — | ||||||||||
Dividend received | 91 | 62 | ||||||||||
Income taxes paid | (443 | ) | (245 | ) | ||||||||
Cash flow related to interest, dividend and income tax | (891 | ) | (650 | ) | ||||||||
Cash flow from operating activities | 2,657 | 2,379 | ||||||||||
Investing activities | ||||||||||||
Proceeds from sale of property, plant & equipment and intangible assets | 113 | 180 | ||||||||||
Purchase of property, plant & equipment | 14 | (648 | ) | (678 | ) | |||||||
Purchase of intangible assets | 15 | (56 | ) | (99 | ) | |||||||
Loans issued to customers and other investments | (145 | ) | (117 | ) | ||||||||
Repayment on loans to customers | 72 | 76 | ||||||||||
Cash flow (used in)/from operational investing activities | (664 | ) | (638 | ) | ||||||||
Free operating cash flow | 1,993 | 1,741 | ||||||||||
Acquisition of subsidiaries, net of cash acquired* | 6 | 17 | (84 | ) | ||||||||
Acquisition of associates, joint ventures and other investments | (77 | ) | (116 | ) | ||||||||
Disposal of subsidiaries and non-controlling interests, net of cash disposed of | 6 | 270 | 17 | |||||||||
Disposal of associates, joint ventures and other investments | 47 | 34 | ||||||||||
Cash flow (used in)/from acquisitions and disposals | 257 | (149 | ) | |||||||||
Cash flow (used in)/from investing activities | (407 | ) | (787 | ) | ||||||||
| * | The non-controlling interests has moved from Investing to Financing in 2010, comparatives have not been adjusted. |
Financial statements
For the year ended 31 December 2010
In millions of EUR | Note | 2010 | 2009 | |||||||||
Financing activities | ||||||||||||
Proceeds from loans and borrowings | 1,920 | 2,052 | ||||||||||
Repayment of loans and borrowings | (3,127 | ) | (3,411 | ) | ||||||||
Dividends paid | (483 | ) | (392 | ) | ||||||||
Purchase own shares and shares issued | (381 | ) | (13 | ) | ||||||||
Acquisition of non-controlling interests | (92 | ) | — | |||||||||
Other | (9 | ) | (73 | ) | ||||||||
Cash flow (used in)/from financing activities | (2,172 | ) | (1,837 | ) | ||||||||
Net Cash Flow | 78 | (245 | ) | |||||||||
Cash and cash equivalents as at 1 January | 364 | 604 | ||||||||||
Effect of movements in exchange rates | 36 | 5 | ||||||||||
Cash and cash equivalents as at 31 December | 21 | 478 | 364 | |||||||||
Financial statements
of Changes in certain significant respects from accounting principles generally accepted in the United States of America, as described inEquity
In millions of EUR | Note | Share capital | Share Premium | Translation reserve | Hedging reserve | Fair value reserve | Other legal reserves | Reserve for own shares | ASDI | Retained earnings | Equity attributable to equity holders of the Company | Non- controlling interests | Total equity | |||||||||||||||||||||||||||||||||||||||
Balance as at 1 January 2009 | 784 | — | (595 | ) | (122 | ) | 88 | 595 | (40 | ) | — | 3,761 | 4,471 | 281 | 4,752 | |||||||||||||||||||||||||||||||||||||
Other comprehensive income | 24 | — | — | 144 | (2 | ) | 12 | 6 | — | — | (6 | ) | 154 | (8 | ) | 146 | ||||||||||||||||||||||||||||||||||||
Profit | — | — | — | — | — | 150 | — | — | 868 | 1,018 | 124 | 1,142 | ||||||||||||||||||||||||||||||||||||||||
Total comprehensive income | — | — | 144 | (2 | ) | 12 | 156 | — | — | 862 | 1,172 | 116 | 1,288 | |||||||||||||||||||||||||||||||||||||||
Transfer to retained earnings | — | — | — | — | — | (75 | ) | — | — | 75 | — | — | — | |||||||||||||||||||||||||||||||||||||||
Dividends to shareholders | — | — | — | — | — | — | — | — | (289 | ) | (289 | ) | (96 | ) | (385 | ) | ||||||||||||||||||||||||||||||||||||
Purchase/reissuance own/non-controlling shares | — | — | — | — | — | — | (2 | ) | — | (11 | ) | (13 | ) | (2 | ) | (15 | ) | |||||||||||||||||||||||||||||||||||
Share-based payments | — | — | — | — | — | — | — | — | 10 | 10 | — | 10 | ||||||||||||||||||||||||||||||||||||||||
Changes in consolidations | — | — | — | — | — | — | — | — | — | — | (3 | ) | (3 | ) | ||||||||||||||||||||||||||||||||||||||
Balance as at 31 December 2009 | 784 | — | (451 | ) | (124 | ) | 100 | 676 | (42 | ) | — | 4,408 | 5,351 | 296 | 5,647 | |||||||||||||||||||||||||||||||||||||
Balance as at 1 January 2010 | 784 | — | (451 | ) | (124 | ) | 100 | 676 | (42 | ) | — | 4,408 | 5,351 | 296 | 5,647 | |||||||||||||||||||||||||||||||||||||
Other comprehensive income | 24 | — | — | 358 | 97 | (10 | ) | 75 | — | — | (73 | ) | 447 | 15 | 462 | |||||||||||||||||||||||||||||||||||||
Profit | — | — | — | — | — | 241 | — | — | 1,195 | 1,436 | 132 | 1,568 | ||||||||||||||||||||||||||||||||||||||||
Total comprehensive income | — | — | 358 | 97 | (10 | ) | 316 | — | — | 1,122 | 1,883 | 147 | 2,030 | |||||||||||||||||||||||||||||||||||||||
Transfer to retained earnings | — | — | — | — | — | (93 | ) | — | — | 93 | — | — | — | |||||||||||||||||||||||||||||||||||||||
Dividends to shareholders | — | — | — | — | — | — | — | — | (351 | ) | (351 | ) | (138 | ) | (489 | ) | ||||||||||||||||||||||||||||||||||||
Share issued | 138 | 2,701 | — | — | — | — | — | 1,026 | — | 3,865 | — | 3,865 | ||||||||||||||||||||||||||||||||||||||||
Purchase/reissuance own/non-controlling shares | — | — | — | — | — | — | (381 | ) | — | — | (381 | ) | — | (381 | ) | |||||||||||||||||||||||||||||||||||||
Allotted Share Delivery Instrument | — | — | — | — | — | — | 362 | (360 | ) | (2 | ) | — | — | — | ||||||||||||||||||||||||||||||||||||||
Own shares granted | — | — | — | — | — | — | 6 | — | (6 | ) | — | — | — | |||||||||||||||||||||||||||||||||||||||
Share-based payments | — | — | — | — | — | — | — | — | 15 | 15 | — | 15 | ||||||||||||||||||||||||||||||||||||||||
Share purchase mandate | — | — | — | — | — | — | — | — | (96 | ) | (96 | ) | — | (96 | ) | |||||||||||||||||||||||||||||||||||||
Acquisition of non-controlling interests without a change in control | — | — | — | — | — | — | — | — | (58 | ) | (58 | ) | (34 | ) | (92 | ) | ||||||||||||||||||||||||||||||||||||
Acquisition of non-controlling interests with a change in control | — | — | — | — | — | — | — | — | — | — | 20 | 20 | ||||||||||||||||||||||||||||||||||||||||
Changes in consolidation | — | — | — | — | — | — | — | — | — | — | (2 | ) | (2 | ) | ||||||||||||||||||||||||||||||||||||||
Balance as at 31 December 2010 | 922 | 2,701 | (93 | ) | (27 | ) | 90 | 899 | (55 | ) | 666 | 5,125 | 10,228 | 289 | 10,517 | |||||||||||||||||||||||||||||||||||||
Financial statements | Notes 21 and 22 to the consolidated financial statementscontinued
Financial Statements
1. Reporting entity
Heineken N.V. (the ‘Company’) is a company domiciled in the Netherlands. The address of the Company’s registered office is Tweede Weteringplantsoen 21, Amsterdam. The consolidated financial statements of the Company as at and for the year ended 31 December 2010 comprise the Company, its subsidiaries (together referred to as ‘Heineken’ or the ‘Group’ and individually as ‘Heineken’ entities) and Heineken’s interest in jointly controlled entities and associates.
A summary of the main subsidiaries, jointly controlled entities and associates is included in note 36 and 16 respectively.
Heineken is primarily involved in the brewing and selling of beer.
2. Basis of preparation
| (a) | Statement of compliance |
The consolidated financial statements have been prepared in accordance with International Financial Reporting Standards (IFRS) as endorsed by the EU and also comply with the financial reporting requirements included in Part 9 of Book 2 of the Dutch Civil Code. All standards and interpretations issued by the International Accounting Standards Board (IASB) and the International Financial Reporting Interpretations Committee (IFRIC) effective year-end 2010 have been adopted by the EU, except that the EU carved out certain hedge accounting provisions of IAS 39. The Company does not utilise this carve-out permitted by the EU, as it is not applicable. Consequently, the accounting policies applied by the Company also comply fully with IFRS as issued by the IASB.
The consolidated financial statements have been prepared by the Executive Board of the Company and authorised for issue on 15 February 2011 and will be submitted for adoption to the Annual General Meeting of Shareholders on 21 April 2011.
| (b) | Basis of measurement |
The consolidated financial statements have been prepared on the historical cost basis except for the following assets and liabilities that are measured at fair value:
Available-for-sale investments
Derivative financial instruments
Liabilities for equity-settled share-based payment arrangements
Long-term interest-bearing liabilities on which fair value hedge accounting is applied.
The methods used to measure fair values are discussed further in note 4.
| (c) | Functional and presentation currency |
These consolidated financial statements are presented in euro, which is the Company’s functional currency. All financial information presented in euro has been rounded to the nearest million unless stated otherwise.
| (d) | Use of estimates and judgements |
The preparation of consolidated financial statements in conformity with IFRSs requires management to make judgements, estimates and assumptions that affect the application of accounting policies and the reported amounts of assets and liabilities, income and expenses. Actual results may differ from these estimates.
Estimates and underlying assumptions are reviewed on an ongoing basis. Revisions to accounting estimates are recognised in the period in which the estimates are revised and in any future periods affected.
Financial statements | Notes to the consolidated financial statementscontinued
2. Basis of preparation continued
In particular, information about assumptions and estimation uncertainties and critical judgements in applying accounting policies that have the most significant effect on the amounts recognised in the consolidated financial statements are described in the following notes:
Note 6 Acquisitions and disposals of subsidiaries and non-controlling interests
Note 15 Intangible assets
Note 16 Investments in associates and joint ventures
Note 17 Other investments
Note 18 Deferred tax assets and liabilities
Note 28 Employee benefits
Note 29 Share-based payments – Long-Term Incentive Plan
Note 30 Provisions
Note 32 Financial risk management and financial instruments
Note 34 Contingencies.
| (e) | Changes in accounting policies |
Accounting for business combinations
From 1 January 2010, the Group has applied IFRS 3Business Combinations (2008) in accounting for business combinations. The change in accounting policy has been applied prospectively and has no impact on Earnings per Share.
For acquisition on or after 1 January 2010, the Group measures goodwill at the acquisition date as the fair value of the consideration transferred plus the fair value of any previously-held equity interest in the acquiree and the recognised amount of any non-controlling interests in the acquiree, less the net recognised amount (generally fair value) of the identifiable assets acquired and liabilities assumed. When the excess is negative, a bargain purchase gain is recognised immediately in profit or loss.
The consideration transferred does not include amounts related to the settlement of pre-existing relationships. Such amounts are generally recognised in profit or loss.
Costs related to the acquisition, other than those associated with the issue of debt or equity securities, that the Group incurs in connection with a business combination are expensed as incurred.
Any contingent consideration payable is recognised at fair value at the acquisition date. If the contingent consideration is classified as equity, it is not remeasured and settlement is accounted for within equity. Otherwise, subsequent changes to the fair value of the contingent consideration are recognised in profit or loss.
Accounting for acquisitions of non-controlling interests
From 1 January 2010 the Group has applied IAS 27Consolidated and Separate Financial Statements (2008) in accounting for acquisitions of non-controlling interests. The change in accounting policy has been applied prospectively and has no impact on Earnings per Share.
Under the new accounting policy, acquisitions of non-controlling interests are accounted for as transactions with owners in their capacity as owners and therefore no goodwill is recognised as a result of such transactions. The adjustments to non-controlling interests are based on a proportionate amount of the net assets of the subsidiary.
Previously, goodwill was recognised on the acquisition of non-controlling interests in a subsidiary, which represented the excess of the cost of the additional investment over the carrying amount of the interest in the net assets acquired at the date of the transaction.
Other standards and interpretations
Other standards and interpretations effective from 1 January 2010 did not have a significant impact on the Company.
Financial statements | Notes to the consolidated financial statementscontinued
3. Significant accounting policies
General
The accounting policies set out below have been applied consistently to all periods presented in these consolidated financial statements and have been applied consistently by Heineken entities.
| (a) | Basis of consolidation |
| (i) | Business combinations |
Business combinations are accounted for using the acquisition method as at the acquisition date, which is the date on which control is transferred to the Group. Control is the power to govern the financial and operating policies of an entity so as to obtain benefits from its activities. In assessing control, the Group takes into consideration potential voting rights that currently are exercisable.
Heineken has changed its accounting policy with respect to accounting for business combinations. See note 2(e) for further details.
| (ii) | Subsidiaries |
Subsidiaries are entities controlled by Heineken. Control exists when Heineken has the power, directly or indirectly, to govern the financial and operating policies of an entity so as to obtain benefits from its activities. In assessing control, potential voting rights that currently are exercisable or convertible are taken into account. The financial statements of subsidiaries are included in the consolidated financial statements from the date that control commences until the date that control ceases. Accounting policies of subsidiaries have been changed where necessary to ensure consistency with the policies adopted by Heineken. Losses applicable to the non-controlling interests in a subsidiary are allocated to the non-controlling interests even if doing so causes the non-controlling interests to have a deficit balance.
| (iii) | Special Purpose Entities (SPEs) |
An SPE is consolidated if, based on an evaluation of the substance of its relationship with Heineken and the SPE’s risks and rewards, Heineken concludes that it controls the SPE. SPEs controlled by Heineken were established under terms that impose strict limitations on the decision-making powers of the SPE’s management and that result in Heineken receiving the majority of the benefits related to the SPE’s operations and net assets, being exposed to the majority of risks incident to the SPE’s activities, and retaining the majority of the residual or ownership risks related to the SPE or their assets.
| (iv) | Acquisitions from entities under common control |
Business combinations arising from transfers of interests in entities that are under the control of the shareholder that controls the Group are accounted for as if the acquisition had occurred at the beginning of the earliest comparative year presented or, if later, at the date that common control was established; for this purpose comparatives are restated. The assets and liabilities acquired are recognised at the carrying amounts recognised previously in the Group controlling shareholder’s consolidated financial statements. The components of equity of the acquired entities are added to the same components within Group equity and any gain/loss arising is recognised directly in equity.
| (v) | Loss of control |
Upon the loss of control, Heineken derecognises the assets and liabilities of the subsidiary, any non-controlling interests and the other components of equity related to the subsidiary. Any surplus or deficit arising on the loss of control is recognised in profit or loss. If Heineken retains any interest in the previous subsidiary, then such interest is measured at fair value at the date that control is lost. Subsequently it is accounted for as an equity-accounted investee or as an available-for-sale financial asset depending on the level of influence retained.
Financial statements | Notes to the consolidated financial statementscontinued
3. Significant accounting policies continued
| (vi) | Investments in associates and joint ventures |
Investments in associates are those entities in which Heineken has significant influence, but not control, over the financial and operating policies. Significant influence is presumed to exist when the Group holds between 20 and 50 per cent of the voting power of another entity. Joint ventures are those entities over whose activities Heineken has joint control, established by contractual agreement and requiring unanimous consent for strategic financial and operating decisions.
Investments in associates and joint ventures are accounted for using the equity method (equity-accounted investees) and are recognised initially at cost. The cost of the investment includes transaction costs.
The consolidated financial statements include Heineken’s share of the profit or loss and other comprehensive income, after adjustments to align the accounting policies with those of Heineken, from the date that significant influence or joint control commences until the date that significant influence or joint control ceases.
When Heineken’s share of losses exceeds the carrying amount of the associate, including any long-term investments, the carrying amount is reduced to nil and recognition of further losses is discontinued except to the extent that Heineken has an obligation or has made a payment on behalf of the associate or joint venture.
| (vii) | Transactions eliminated on consolidation |
Intra-Heineken balances and transactions, and any unrealised gains and losses or income and expenses arising from intra-Heineken transactions, are eliminated in preparing the consolidated financial statements. Unrealised gains arising from transactions with equity-accounted associates and JVs are eliminated against the investment to the extent of the Heineken’s interest in the investee. Unrealised losses are eliminated in the same way as unrealised gains, but only to the extent that there is no evidence of impairment.
| (b) | Foreign currency |
| (i) | Foreign currency transactions |
Transactions in foreign currencies are translated to the respective functional currencies of Heineken entities at the exchange rates at the dates of the transactions. Monetary assets and liabilities denominated in foreign currencies at the reporting date are retranslated to the functional currency at the exchange rate at that date. The foreign currency gain or loss arising on monetary items is the difference between amortised cost in the functional currency at the beginning of the period, adjusted for effective interest and payments during the period, and the amortised cost in foreign currency translated at the exchange rate at the end of the reporting period.
Non-monetary assets and liabilities denominated in foreign currencies that are measured at fair value are retranslated to the functional currency at the exchange rate at the date that the fair value was determined.
Non-monetary items in a foreign currency that are measured in terms of historical cost are translated using the exchange rate at the date of the transaction. Foreign currency differences arising on retranslation are recognised in profit or loss, except for differences arising on the retranslation of available-for-sale (equity) investments and foreign currency differences arising on the retranslation of a financial liability designated as a hedge of a net investment, which are recognised in other comprehensive income.
Non-monetary assets and liabilities denominated in foreign currencies that are measured at cost remain translated into the functional currency at historical exchange rates.
Financial statements | Notes to the consolidated financial statementscontinued
| (ii) | Foreign operations |
The assets and liabilities of foreign operations, including goodwill and fair value adjustments arising on acquisition, are translated to euro at exchange rates at the reporting date. The income and expenses of foreign operations, excluding foreign operations in hyperinflationary economies, are translated to euro at exchange rates approximating the exchange rates ruling at the dates of the transactions.
Foreign currency differences are recognised in other comprehensive income and are presented within equity in the translation reserve. However, if the operation is a non-wholly-owned subsidiary, then the relevant proportionate share of the translation difference is allocated to the non-controlling interests. When a foreign operation is disposed of such that control, significant influence or joint control is lost, the cumulative amount in the translation reserve related to that foreign operation is reclassified to profit or loss as part of the gain or loss on disposal. When Heineken disposes of only part of its interest in a subsidiary that includes a foreign operation while retaining control, the relevant proportion of the cumulative amount is reattributed to non-controlling interests. When Heineken disposes of only part of its investment in an associate or joint venture that includes a foreign operation while retaining significant influence or joint control, the relevant proportion of the cumulative amount is reclassified to profit or loss.
Foreign exchange gains and losses arising from a monetary item receivable from or payable to a foreign operation, the settlement of which is neither planned nor likely in the foreseeable future, are considered to form part of a net investment in a foreign operation and are recognised in other comprehensive income, and are presented within equity in the translation reserve.
The following exchange rates, for the most important countries in which Heineken has operations, were used while preparing these consolidated financial statements:
| Year-end | Average | |||||||||||||||
In EUR | 2010 | 2009 | 2010 | 2009 | ||||||||||||
GBP | 1.1618 | 1.1260 | 1.1657 | 1.1224 | ||||||||||||
EGP | 0.1287 | 0.1273 | 0.1339 | 0.1292 | ||||||||||||
NGN | 0.0050 | 0.0047 | 0.0051 | 0.0048 | ||||||||||||
PLN | 0.2516 | 0.2436 | 0.2503 | 0.2311 | ||||||||||||
BRL | 0.4509 | 0.4001 | 0.4289 | 0.3610 | ||||||||||||
MXN | 0.0604 | 0.0533 | 0.0598 | 0.0532 | ||||||||||||
RUB | 0.0245 | 0.0232 | 0.0248 | 0.0227 | ||||||||||||
USD | 0.7484 | 0.6942 | 0.7543 | 0.7170 | ||||||||||||
| (iii) | Hedge of net investments in foreign operations |
Foreign currency differences arising on the retranslation of a financial liability designated as a hedge of a net investment in a foreign operation are recognised in other comprehensive income to the extent that the hedge is effective and regardless of whether the net investment is held directly or through an intermediate parent. These differences are presented within equity in the translation reserve. To the extent that the hedge is ineffective, such differences are recognised in profit or loss. When the hedged part of a net investment is disposed of, the relevant amount in the translation reserve is transferred to profit or loss as part of the profit or loss on disposal.
Financial statements | Notes to the consolidated financial statementscontinued
3. Significant accounting policies continued
(c) Non-derivative financial instruments
| (i) | General |
Non-derivative financial instruments comprise investments in equity and debt securities, trade and other receivables, cash and cash equivalents, loans and borrowings, and trade and other payables.
Non-derivative financial instruments are recognised initially at fair value plus, for instruments not at fair value through profit or loss, any directly attributable transaction costs. Subsequent to initial recognition non-derivative financial instruments are measured as described hereafter.
If Heineken has a legal right to offset financial assets with financial liabilities and if Heineken intends either to settle on a net basis or to realise the asset and settle the liability simultaneously then financial assets and liabilities are presented in the statement of financial position as a net amount.
Cash and cash equivalents comprise cash balances and call deposits. Bank overdrafts that are repayable on demand and form an integral part of Heineken’s cash management are included as a component of cash and cash equivalents for the purpose of the statement of cash flows.
Accounting policies for interest income, interest expenses and other net finance income and expenses are discussed in note 3r.
| (ii) | Held-to maturity investments |
If Heineken has the positive intent and ability to hold debt securities to maturity, they are classified as held-to-maturity. Debt securities are loans and long-term receivables and are measured at amortised cost using the effective interest method, less any impairment losses. Investments held-to-maturity are recognised or derecognised on the day they are transferred to or by Heineken.
| (iii) | Available-for-sale investments |
Heineken’s investments in equity securities and certain debt securities are classified as available-for-sale. Subsequent to initial recognition, they are measured at fair value and changes therein – other than impairment losses (see note 3i(i)), and foreign currency differences on available-for-sale monetary items (see note 3b(i)) – are recognised in other comprehensive income and presented within equity in the fair value reserve. When these investments are derecognised, the relevant cumulative gain or loss in the fair value reserve is transferred to profit or loss.
Where these investments are interest-bearing, interest calculated using the effective interest method is recognised in the profit or loss. Available-for-sale investments are recognised or derecognised by Heineken on the date it commits to purchase or sell the investments.
| (iv) | Investments at fair value through profit or loss |
An investment is classified at fair value through profit or loss if it is classified as held for trading or is designated as such upon initial recognition. Investments are designated at fair value through profit or loss if Heineken manages such investments and makes purchase and sale decisions based on their fair value in accordance with Heineken’s documented risk management or investment strategy. Upon initial recognition, attributable transaction costs are recognised in profit or loss as incurred.
Investments at fair value through profit or loss are measured at fair value, with changes therein recognised in profit or loss as part of the other net finance income/(expenses). Investments at fair value through profit and loss are recognised or derecognised by Heineken on the date it commits to purchase or sell the investments.
Financial statements | Notes to the consolidated financial statementscontinued
| (v) | Other |
Other non-derivative financial instruments are measured at amortised cost using the effective interest method, less any impairment losses. Included in non-derivative financial instruments are advances to customers. Subsequently, the advances are amortised over the term of the contract as a reduction of revenue.
| (d) | Derivative financial instruments (including hedge accounting) |
| (i) | General |
Heineken uses derivatives in the ordinary course of business in order to manage market risks. Generally Heineken seeks to apply hedge accounting in order to minimise the effects of foreign currency, interest rate or commodity price fluctuations in profit or loss.
Derivatives that can be used are interest rate swaps, forward rate agreements, caps and floors, commodity swaps, spot and forward exchange contracts and options. Transactions are entered into with a limited number of counterparties with strong credit ratings. Foreign currency, interest rate and commodity hedging operations are governed by internal policies and rules approved and monitored by the Executive Board.
Derivative financial instruments are recognised initially at fair value, with attributable transaction costs recognised in profit or loss as incurred. Derivatives for which hedge accounting is not applied are accounted for as instruments at fair value through profit or loss. When derivatives qualify for hedge accounting, subsequent measurement is at fair value, and changes therein accounted for as described 3b(iii), 3d(ii) and 3d(iii).
| (ii) | Cash flow hedges |
Changes in the fair value of the derivative hedging instrument designated as a cash flow hedge are recognised in other comprehensive income and presented in the hedging reserve within equity to the extent that the hedge is effective. To the extent that the hedge is ineffective, changes in fair value are recognised in profit or loss.
If the hedging instrument no longer meets the criteria for hedge accounting, expires or is sold, terminated or exercised, then hedge accounting is discontinued and the cumulative unrealised gain or loss previously recognised in other comprehensive income and presented in the hedging reserve in equity, is recognised in profit or loss immediately, or when a hedging instrument is terminated, but the hedged transaction still is expected to occur, the cumulative gain or loss at that point remains in other comprehensive income and is recognised in accordance with the above-mentioned policy when the transaction occurs. When the hedged item is a non-financial asset, the amount recognised in other comprehensive income is transferred to the carrying amount of the asset when it is recognised. In other cases the amount recognised in other comprehensive income is transferred to the same line of profit or loss in the same period that the hedged item affects profit or loss.
| (iii) | Fair value hedges |
Changes in the fair value of a derivative hedging instrument designated as a fair value hedge are recognised in profit or loss. The hedged item also is stated at fair value in respect of the risk being hedged; the gain or loss attributable to the hedged risk is recognised in profit or loss and adjusts the carrying amount of the hedged item.
If the hedge no longer meets the criteria for hedge accounting, the adjustment to the carrying amount of a hedged item for which the effective interest method is used is amortised to profit or loss over the period to maturity.
Financial statements | Notes to the consolidated financial statementscontinued
3. Significant accounting policies continued
| (iv) | Separable embedded derivatives |
Embedded derivatives are separated from the host contract and accounted for separately if the economic characteristics and risks of the host contract and the embedded derivative are not closely related, a separate instrument with the same terms as the embedded derivative would meet the definition of a derivative, and the combined instrument is not measured at fair value through profit or loss. Changes in the fair value of separable embedded derivatives are recognised immediately in profit or loss.
| (e) | Share capital |
| (i) | Ordinary shares |
Ordinary shares are classified as equity. Incremental costs directly attributable to the issue of ordinary shares are recognised as a deduction from equity, net of any tax effects.
| (ii) | Repurchase of share capital (treasury shares) |
When share capital recognised as equity is repurchased, the amount of the consideration paid, which includes directly attributable costs, is net of any tax effects recognised as a deduction from equity. Repurchased shares are classified as treasury shares and are presented in the reserve for own shares.
When treasury shares are sold or reissued subsequently, the amount received is recognised as an increase inequity, and the resulting surplus or deficit on the transaction is transferred to or from retained earnings.
| (iii) | Dividends |
Dividends are recognised as a liability in the period in which they are declared.
| (f) | Property, Plant and Equipment (P, P & E) |
| (i) | Owned assets |
Items of property, plant and equipment are measured at cost less government grants received (refer (q)), accumulated depreciation (refer (iv)) and accumulated impairment losses (3i(ii)).
Cost comprises the initial purchase price increased with expenditures that are directly attributable to the acquisition of the asset (like transports and non-recoverable taxes). The cost of self-constructed assets includes the cost of materials and direct labour and any other costs directly attributable to bringing the asset to a working condition for its intended use (like an appropriate proportion of production overheads), and the costs of dismantling and removing the items and restoring the site on which they are located. Borrowing costs related to the acquisition or construction of qualifying assets are capitalised as part of the cost of that asset. Cost also may include transfers from equity of any gain or loss on qualifying cash flow hedges of foreign currency purchases of property, plant and equipment.
Spare parts that are acquired as part of an equipment purchase and only to be used in connection with this specific equipment are initially capitalised and amortised as part of the equipment. For example, purchased software that is integral to the functionality of the related equipment is capitalised as part of that equipment.
Where an item of property, plant and equipment comprises major components having different useful lives, they are accounted for as separate items (major components) of property, plant and equipment.
Financial statements | Notes to the consolidated financial statementscontinued
| (ii) | Leased assets |
Leases in terms of which Heineken assumes substantially all the risks and rewards of ownership are classified as finance leases. Upon initial recognition P, P & E acquired by way of finance lease is measured at an amount equal to the lower of its fair value and the present value of the minimum lease payments at inception of the lease. Lease payments are apportioned between the outstanding liability and finance charges so as to achieve a constant periodic rate of interest on the remaining balance of the liability.
Other leases are operating leases and are not recognised in Heineken’s statement of financial position. Payments made under operating leases are charged to profit or loss on a straight-line basis over the term of the lease. When an operating lease is terminated before the lease period has expired, any payment required to be made to the lessor by way of penalty is recognised as an expense in the period in which termination takes place.
| (iii) | Subsequent expenditure |
The cost of replacing a part of an item of property, plant and equipment is recognised in the carrying amount of the item or recognised as a separate asset, as appropriate, if it is probable that the future economic benefits embodied within the part will flow to Heineken and its cost can be measured reliably. The carrying amount of the replaced part is derecognised. The costs of the day-to-day servicing of property, plant and equipment are recognised in profit or loss when incurred.
| (iv) | Depreciation |
Depreciation is calculated over the depreciable amount, which is the cost of an asset, or other amount substituted for cost, less its residual value.
Land is not depreciated as it is deemed to have an infinite life. Depreciation on other P, P & E is charged to profit or loss on a straight-line basis over the estimated useful lives of items of property, plant and equipment, and major components that are accounted for separately, since this most closely reflects the expected pattern of consumption of the future economic benefits embodied in the asset. Assets under construction are not depreciated. Leased assets are depreciated over the shorter of the lease term and their useful lives unless it is reasonable certain that Heineken will obtain ownership by the end of the lease term. The estimated useful lives for the current and comparative years are as follows:
Buildings | 30 – 40 years | |||
Plant and equipment | 10 – 30 years | |||
Other fixed assets | 5 – 10 years |
Where parts of an item of P, P & E have different useful lives, they are accounted for as separate items of P, P & E.
The depreciation methods, residual value as well as the useful lives are reassessed, and adjusted if appropriate, at each financial year-end.
| (v) | Gains and losses on sale |
Net gains on sale of items of P, P & E are presented in profit or loss as other income. Net losses on sale are included in depreciation. Net gains and losses are recognised in profit or loss when the significant risks and rewards of ownership have been transferred to the buyer, recovery of the consideration is probable, the associated costs can be estimated reliably, and there is no continuing management involvement with the P, P & E.
Financial statements | Notes to the consolidated financial statementscontinued
3. Significant accounting policies continued
| (g) | Intangible assets |
| (i) | Goodwill |
Goodwill arises on the acquisition of subsidiaries, associates and joint ventures and represents the excess of the cost of the acquisition over Heineken’s interest in net fair value of the net identifiable assets, liabilities and contingent liabilities of the acquiree.
Goodwill on acquisitions of subsidiaries is included in ‘intangible assets’. Goodwill arising on the acquisition of associates and joint ventures is included in the carrying amount of the associate, respectively the joint ventures. In respect of acquisitions prior to 1 October 2003, goodwill is included on the basis of deemed cost, being the amount recorded under previous GAAP. Goodwill on acquisitions purchased before 1 January 2003 has been deducted from equity.
Goodwill arising on the acquisition of a non-controlling interest in a subsidiary represents the excess of the cost of the additional investment over the carrying amount of the interest in the net assets acquired at the date of exchange.
Goodwill is measured at cost less accumulated impairment losses (refer accounting policy 3j(ii)). Goodwill is allocated to individual or groups of cash-generating units (CGUs) for the purpose of impairment testing and is tested annually for impairment. Negative goodwill is recognised directly in profit or loss as other income.
| (ii) | Brands |
Brands acquired, separately or as part of a business combination, are capitalised if they meet the definition of an intangible asset and the recognition criteria are satisfied.
Brands acquired as part of a business combination are valued at fair value based on the royalty relief method. Brands acquired separately are measured at cost.
Strategic brands are well-known international/local brands with a strong market position and an established brand name. Strategic brands are amortised on an individual basis over the estimated useful life of the brand. Other brands are amortised on a portfolio basis per country.
| (iii) | Customer-related and contract-based intangibles |
Customer-related and contract-based intangibles are capitalised if they meet the definition of an intangible asset and the recognition criteria are satisfied. If the amounts are not material these are included in the brand valuation. The relationship between brands and customer-related intangibles is carefully considered so that brands and customer-related intangibles are not both recognised on the basis of the same cash flows.
Customer-related and contract-based intangibles acquired as part of a business combination are valued at fair value. Customer-related and contract-based intangibles acquired separately are measured at cost.
Customer-related and contract-based intangibles are amortised over the period of the contractual arrangements or the remaining useful life of the customer relationships.
Financial statements | Notes to the consolidated financial statementscontinued
| (iv) | Software, research and development and other intangible assets |
Purchased software is measured at cost less accumulated amortisation (refer (vi)) and impairment losses (refer accounting policy 3i(ii)). Expenditure on internally developed software is capitalised when the expenditure qualifies as development activities, otherwise it is recognised in profit or loss when incurred.
Expenditure on research activities, undertaken with the prospect of gaining new technical knowledge and understanding, is recognised in profit or loss when incurred.
Development activities involve a plan or design for the production of new or substantially improved products, software and processes. Development expenditure is capitalised only if development costs can be measured reliably, the product or process is technically and commercially feasible, future economic benefits are probable, and Heineken intends to and has sufficient resources to complete development and to use or sell the asset. The expenditure capitalised includes the cost of materials, direct labour and overhead costs that are directly attributable to preparing the asset for its intended use, and capitalised borrowing costs. Other development expenditure is recognised in profit or loss when incurred.
Capitalised development expenditure is measured at cost less accumulated amortisation (refer (vi)) and accumulated impairment losses (refer accounting policy 3i(ii)).
Other intangible assets that are acquired by Heineken and have finite useful lives, are measured at cost less accumulated amortisation (refer (vi)) and impairment losses (refer accounting policy 3i(ii)). Expenditure on internally generated goodwill and brands is recognised in profit or loss when incurred.
| (v) | Subsequent expenditure |
Subsequent expenditure is capitalised only when it increases the future economic benefits embodied in the specific asset to which it relates. All other expenditure is expensed when incurred.
| (vi) | Amortisation |
Amortisation is calculated over the cost of the asset, or other amount substituted for cost, less its residual value. Intangible assets with a finite life are amortised on a straight-line basis over their estimated useful lives, other than goodwill, from the date they are available for use, since this most closely reflects the expected pattern of consumption of the future economic benefits embodied in the asset. The estimated useful lives are as follows:
Ÿ | Strategic brands | 40 – 50 years | ||||
Ÿ | Other brands | 15 – 25 years | ||||
Ÿ | Customer-related and contract-based intangibles | 5 – 20 years | ||||
Ÿ | Software | 3 – 7 years | ||||
Ÿ | Capitalised development costs | 3 years |
Amortisation methods, useful lives and residual values are reviewed at each reporting date and adjusted if appropriate.
| (vii) | Gains and losses on sale |
Net gains on sale of intangible assets are presented in profit or loss as other income. Net losses on sale are included in amortisation. Net gains and losses are recognised in profit or loss when the significant risks and rewards of ownership have been transferred to the buyer, recovery of the consideration is probable, the associated costs can be estimated reliably, and there is no continuing management involvement with the intangible assets.
Financial statements | Notes to the consolidated financial statementscontinued
3. Significant accounting policies continued
| (h) | Inventories |
| (i) | General |
Inventories are measured at the lower of cost and net realisable value. The cost of inventories is based on the weighted average cost formula, and includes expenditure incurred in acquiring the inventories, production or conversion costs and other costs incurred in bringing them to their existing location and condition. Net realisable value is the estimated selling price in the ordinary course of business, less the estimated costs of completion and selling expenses.
| (ii) | Finished products and work in progress |
Finished products and work in progress are measured at manufacturing cost based on weighted averages and takes into account the production stage reached. Costs include an appropriate share of direct production overheads based on normal operating capacity.
| (iii) | Other inventories and spare parts |
The cost of other inventories is based on weighted averages. Spare parts are valued at the lower of cost and net realisable value. Value reductions and usage of parts are charged to profit or loss. Spare parts that are acquired as part of an equipment purchase and only to be used in connection with this specific equipment are initially capitalised and amortised as part of the equipment.
| (i) | Impairment |
| (i) | Financial assets |
A financial asset is assessed at each reporting date to determine whether there is any objective evidence that it is impaired. A financial asset is considered to be impaired if objective evidence indicates that one or more events have had a negative effect on the estimated future cash flows of that asset that can be estimated reliably.
An impairment loss in respect of a financial asset measured at amortised cost is calculated as the difference between its carrying amount, and the present value of the estimated future cash flows discounted at the original effective interest rate. An impairment loss in respect of an available-for-sale financial asset is calculated by reference to its current fair value.
Individually significant financial assets are tested for impairment on an individual basis. The remaining financial assets are assessed collectively in groups that share similar credit risk characteristics.
All impairment losses are recognised in profit or loss. Any cumulative loss in respect of an available-for-sale financial asset recognised previously in other comprehensive income and presented in the fair value reserve in equity is transferred to profit or loss.
An impairment loss is reversed if the reversal can be related objectively to an event occurring after the impairment loss was recognised. For financial assets measured at amortised cost and available-for-sale financial assets that are debt securities, the reversal is recognised in profit or loss. For available-for-sale financial assets that are equity securities, the reversal is recognised in other comprehensive income.
Financial statements | Notes to the consolidated financial statementscontinued
| (ii) | Non-financial assets |
The carrying amounts of Heineken’s non-financial assets, other than inventories (refer accounting policy (h) and deferred tax assets (refer accounting policy (s))), are reviewed at each reporting date to determine whether there is any indication of impairment. If any such indication exists then the asset’s recoverable amount is estimated. For goodwill and intangible assets that are not yet available for use, the recoverable amount is estimated each year at the same time.
The recoverable amount of an asset or CGU is the higher of an asset’s fair value less costs to sell and value in use. In assessing value in use, the estimated future cash flows are discounted to their present value using a pre-tax discount rate that reflects current market assessments of the time value of money and the risks specific to the asset or CGU.
For the purpose of impairment testing, assets that cannot be tested individually are grouped together into the smallest group of assets that generates cash inflows from continuing use that are largely independent of the cash inflows of other assets or groups of assets (the ‘CGU’).
For the purpose of impairment testing, goodwill acquired in a business combination, is allocated to each of the acquirer’s CGUs, or groups of CGUs, that is expected to benefit from the synergies of the combination. Each unit or group of units to which the goodwill is allocated represents the lowest level within the entity at which the goodwill is monitored for internal management purposes. Goodwill is monitored on regional, sub regional or country level depending on the characteristics of the acquisition, the synergies to be achieved and the level of integration.
An impairment loss is recognised if the carrying amount of an asset or its CGU exceeds its recoverable amount. A CGU is the smallest identifiable asset group that generates cash flows that largely are independent from other assets and groups. Impairment losses are recognised in profit or loss. Impairment losses recognised in respect of CGU are allocated first to reduce the carrying amount of any goodwill allocated to the units and then to reduce the carrying amounts of the other assets in the unit (group of units) on a pro rata basis. An impairment loss in respect of goodwill is not reversed. In respect of other assets, impairment losses recognised in prior periods are assessed at each reporting date for any indications that the loss has decreased or no longer exists. An impairment loss is reversed if there has been a change in the estimates used to determine the recoverable amount. An impairment loss is reversed only to the extent that the asset’s carrying amount does not exceed the carrying amount that would have been determined, net of depreciation or amortisation, if no impairment loss had been recognised.
Goodwill that forms part of the carrying amount of an investment in an associate and joint venture is not recognised separately, and therefore is not tested for impairment separately. Instead, the entire amount of the investment in an associate and joint venture is tested for impairment as a single asset when there is objective evidence that the investment in an associate may be impaired.
| (j) | Non-current assets held for sale |
Non-current assets, or disposal groups comprising assets and liabilities, that are expected to be recovered primarily through sale rather than through continuing use, are classified as held for sale. Immediately before classification as held for sale, the assets, or components of a disposal group, are measured at the lower of their carrying amount and fair value less cost to sell. Any impairment loss on a disposal group is first allocated to goodwill, and then to remaining assets and liabilities on a pro rata basis, except that no loss is allocated to inventories, financial assets, deferred tax assets and employee benefit assets, which continue to be measured in accordance with Heineken’s accounting policies. Impairment losses on initial classification as held for sale and subsequent gains or losses on remeasurement are recognised in profit or loss. Gains are not recognised in excess of any cumulative impairment loss.
Intangible assets and property, plant and equipment once classified as held for sale are not amortised or depreciated. In addition, equity accounting of equity-accounted investees ceases once classified as held for sale or distribution.
Financial statements | Notes to the consolidated financial statementscontinued
3. Significant accounting policies continued
| (k) | Employee benefits |
| (i) | Defined contribution plans |
A defined contribution plan is a post-employment benefit plan (pension plan) under which the Group pays fixed contributions into a separate entity. The Group has no legal or constructive obligations to pay further contributions if the fund does not hold sufficient assets to pay all employees the benefits relating to employee service in the current and prior periods.
Obligations for contributions to defined contribution pension plans are recognised as an employee benefit expense in profit or loss in the periods during which services are rendered by employees. Prepaid contributions are recognised as an asset to the extent that a cash refund or a reduction in future payments is available. Contributions to a defined contribution plan that are due more than 12 months after the end of the period in which the employee renders the service are discounted to their present value.
| (ii) | Defined benefit plans |
A defined benefit plan is a post-employment benefit plan (pension plan) that is not a defined contribution plan. Typically defined benefit plans define an amount of pension benefit that an employee will receive on retirement, usually dependent on one or more factors such as age, years of service and compensation.
Heineken’s net obligation in respect of defined benefit pension plans is calculated separately for each plan by estimating the amount of future benefit that employees have earned in return for their service in the current and prior periods; that benefit is discounted to determine its present value. Any unrecognised past service costs and the fair value of any plan assets are deducted. The discount rate is the yield at balance sheet date on AA-rated bonds that have maturity dates approximating the terms of Heineken’s obligations and that are denominated in the same currency in which the benefits are expected to be paid.
The calculations are performed annually by qualified actuaries using the projected unit credit method. When the calculation results in a benefit to Heineken, the recognised asset is limited to the net total of any unrecognised actuarial gains and losses and any unrecognised past service costs and the present value of economic benefits available in the form of any future refunds from the plan or reductions in future contributions to the plan. In order to calculate the present value of economic benefits, consideration is given to any minimum funding requirements that apply to any plan in the Group. An economic benefit is available to the Group if it is realisable during the life of the plan, or on settlement of the plan liabilities.
When the benefits of a plan are improved, the portion of the increased benefit relating to past service by employees is recognised as an expense in profit or loss on a straight-line basis over the average period until the benefits become vested. To the extent that the benefits vest immediately, the expense is recognised immediately in profit or loss.
In respect of actuarial gains and losses that arise, Heineken applies the corridor method in calculating the obligation in respect of a plan. To the extent that any cumulative unrecognised actuarial gain or loss exceeds ten per cent of the greater of the present value of the defined benefit obligation and the fair value of plan assets, that portion is recognised in profit or loss over the expected average remaining working lives of the employees participating in the plan. Otherwise, the actuarial gain or loss is not recognised.
| (iii) | Other long-term employee benefits |
Heineken’s net obligation in respect of long-term employee benefits, other than pension plans, is the amount of future benefit that employees have earned in return for their service in the current and prior periods; that benefit is discounted to determine its present value, and the fair value of any related assets is deducted. The discount rate is the yield at balance sheet date on high-quality credit-rated bonds that have maturity dates approximating the terms of Heineken’s obligations. The obligation is calculated using the projected unit credit method. Any actuarial gains and losses are recognised in profit or loss in the period in which they arise.
Financial statements | Notes to the consolidated financial statementscontinued
| (iv) | Termination benefits |
Termination benefits are payable when employment is terminated by the Group before the normal retirement date, or whenever an employee accepts voluntary redundancy in exchange for these benefits.
Termination benefits are recognised as an expense when Heineken is demonstrably committed to either terminating the employment of current employees according to a detailed formal plan without possibility of withdrawal, or providing termination benefits as a result of an offer made to encourage voluntary redundancy. Termination benefits for voluntary redundancies are recognised if Heineken has made an offer encouraging voluntary redundancy, it is probable that the offer will be accepted, and the number of acceptances can be estimated reliably.
Benefits falling due more than 12 months after the balance sheet date are discounted to their present value.
| (v) | Share-based payment plan (long-term incentive plan) |
As from 1 January 2005 Heineken established a share plan for the Executive Board and as from 1 January 2006 Heineken also established a share plan for senior management (see note 29).
The grant date fair value of the share rights granted is recognised as personnel expenses with a corresponding increase in equity (equity-settled), over the period that the employees become unconditionally entitled to the share rights. The costs of the share plan for both the Executive Board and senior management members are spread evenly over the performance period.
At each balance sheet date, Heineken revises its estimates of the number of share rights that are expected to vest, for the 100 per cent internal performance conditions of the share plan 2010 – 2012 of the senior management members and the Executive Board and for the 75 per cent internal performance conditions of the share plan 2008 – 2010 and 2009 – 2011 of the senior management members. It recognises the impact of the revision of original estimates – only applicable for internal performance conditions, if any, in profit or loss, with a corresponding adjustment to equity. The fair value for the share plan 2008 – 2010 and 2009 – 2011 is measured at grant date using the Monte Carlo model taking into account the terms and conditions of the plan.
| (vi) | Short-term employee benefits |
Short-term employee benefit obligations are measured on an undiscounted basis and are expensed as the related service is provided.
A liability is recognised for the amount expected to be paid under short-term benefits if the Group has a present legal or constructive obligation to pay this amount as a result of past service provided by the employee and the obligation can be estimated reliably.
| (l) | Provisions |
| (i) | General |
A provision is recognised if, as a result of a past event, Heineken has a present legal or constructive obligation that can be estimated reliably, and it is probable that an outflow of economic benefits will be required to settle the obligation. Provisions are measured at the present value of the expenditures to be expected to be required to settle the obligation using a pre-tax rate that reflects current market assessments of the time value of money and the risks specific to the obligation. The increase in the provision due to passage of time is recognised as part of the net finance expenses.
| (ii) | Restructuring |
A provision for restructuring is recognised when Heineken has approved a detailed and formal restructuring plan, and the restructuring has either commenced or has been announced publicly. Future operating losses are not provided for. The provision includes the benefit commitments in connection with early retirement and redundancy schemes.
| (iii) | Onerous contracts |
A provision for onerous contracts is recognised when the expected benefits to be derived by Heineken from a contract are lower than the unavoidable cost of meeting its obligations under the contract. The provision is measured at the present value of the lower of the expected cost of terminating the contract and the expected net cost of continuing with the contract. Before a provision is established, Heineken recognises any impairment loss on the assets associated with that contract.
Financial statements | Notes to the consolidated financial statementscontinued
3. Significant accounting policies continued
| (m) | Loans and borrowings |
Loans and borrowings are recognised initially at fair value, net of transaction costs incurred. Loans and borrowings are subsequently stated at amortised cost; any difference between the proceeds (net of transaction costs) and the redemption value is recognised in profit or loss over the period of the borrowings using the effective interest method. Loans and borrowings included in a fair value hedge are stated at fair value in respect of the risk being hedged.
Loans and borrowings for which the Group has an unconditional right to defer settlement of the liability for at least 12 months after the balance sheet date, are classified as non-current liabilities.
| (n) | Revenue |
| (i) | Products sold |
Revenue from the sale of products in the ordinary course of business is measured at the fair value of the consideration received or receivable, net of sales tax, excise duties, returns, customer discounts and other sales-related discounts. Revenue from the sale of products is recognised in profit or loss when the amount of revenue can be measured reliably, the significant risks and rewards of ownership have been transferred to the buyer, recovery of the consideration is probable, the associated costs and possible return of products can be estimated reliably, and there is no continuing management involvement with the products.
If it is probable that discounts will be granted and the amount can be measured reliably, then the discount is recognised as a reduction of revenue as the sales are recognised.
| (ii) | Other revenue |
Other revenues are proceeds from royalties, rental income, pub management services and technical services to third parties, net of sales tax. Royalties are recognised in profit or loss on an accrual basis in accordance with the substance of the relevant agreement. Rental income and technical services are recognised in profit or loss when the services have been delivered.
| (o) | Other income |
Other income are gains from sale of P, P & E, intangible assets and (interests in) subsidiaries, joint ventures and associates, net of sales tax. They are recognised in profit or loss when ownership has been transferred to the buyer.
| (p) | Expenses |
| (i) | Operating lease payments |
Payments made under operating leases are recognised in profit or loss on a straight-line basis over the term of the lease. Lease incentives received are recognised in profit or loss as an integral part of the total lease expense, over the term of the lease.
| (ii) | Finance lease payments |
Minimum lease payments under finance leases are apportioned between the finance expense and the reduction of the outstanding liability. The finance expense is allocated to each period during the lease term so as to produce a constant periodic rate of interest on the remaining balance of the liability. Contingent lease payments are accounted for by revising the minimum lease payments over the remaining term of the lease when the lease adjustment is confirmed.
| (q) | Government grants |
Government grants are recognised at their fair value when it is reasonably assured that Heineken will comply with the conditions attaching to them and the grants will be received.
Government grants relating to P, P & E are deducted from the carrying amount of the asset.
Government grants relating to costs are deferred and recognised in profit or loss over the period necessary to match them with the costs that they are intended to compensate.
Financial statements | Notes to the consolidated financial statementscontinued
| (r) | Interest income, interest expenses and other net finance income and expenses |
Interest income and expenses are recognised as they accrue in profit or loss, using the effective interest method unless collectability is in doubt.
Other net finance income comprises dividend income, gains on the disposal of available-for-sale investments, changes in the fair value of investments designated at fair value through profit or loss and held for trading investments and gains and losses on hedging instruments that are recognised in profit or loss. Dividend income is recognised in profit or loss on the date that Heineken’s right to receive payment is established, which in the case of quoted securities is the ex-dividend date.
Other net finance expenses comprise unwinding of the discount on provisions, changes in the fair value of investments designated at fair value through profit or loss and held for trading investments, impairment losses recognised on investments, and gains or losses on hedging instruments that are recognised in profit or loss.
Borrowing costs that are not directly attributable to the acquisition, construction or production of a qualifying asset are recognised in profit or loss using the effective interest method.
Foreign currency gains and losses are reported on a net basis in the other net finance expenses.
| (s) | Income tax |
Income tax comprises current and deferred tax. Current tax and deferred tax are recognised in profit or loss except to the extent that it relates to a business combination, or items recognised directly in equity or in other comprehensive income.
Current tax is the expected income tax payable or receivable in respect of taxable profit or loss for the year, using tax rates enacted or substantially enacted at the balance sheet date, and any adjustment to income tax payable in respect of profits of previous years. Current tax payable also includes any tax liability arising from the declaration of dividends.
Deferred tax is recognised in respect of temporary differences between the carrying amounts of assets and liabilities for financial reporting purposes and their tax bases.
Deferred tax assets and liabilities are not recognised for the following temporary differences: (i) the initial recognition of goodwill, (ii) the initial recognition of assets or liabilities in a transaction that is not a business combination and that affects neither accounting nor taxable profit or loss, (iii) differences relating to investments in subsidiaries, joint ventures and associates resulting from translation of foreign operations and (iv) differences relating to investments in subsidiaries and joint ventures to the extent that the Company is able to control the timing of the reversal of the temporary difference and they will probably not reverse in the foreseeable future.
Deferred tax is determined using tax rates (and laws) that have been enacted or substantially enacted by the balance sheet date and are expected to apply when the related deferred tax asset is realised or the deferred tax liability is settled.
Deferred tax assets and liabilities are offset if there is a legally enforceable right to offset current tax liabilities and assets, and they relate to income taxes levied by the same tax authority on the same taxable entity, or on different taxable entities which intend either to settle current tax liabilities and assets on a net basis, or to realise the assets and settle the liabilities simultaneously.
A deferred tax asset is recognised for unused tax losses, tax credits and deductible temporary differences, to the extent that it is probable that future taxable profits will be available against which they can be utilised. Deferred tax assets are reviewed at each balance sheet date and are reduced to the extent that it is no longer probable that the related tax benefit will be realised.
Deferred tax assets are recognised in respect of the carry forward of unused tax losses and tax credits. When an entity has a history of recent losses, the entity recognises a deferred tax asset arising from unused tax losses or tax credits only to the extent that the entity has sufficient taxable temporary differences or there is convincing other evidence that sufficient taxable profit will be available against which the unused tax losses or unused tax credits can be utilised by the entity.
Financial statements | Notes to the consolidated financial statementscontinued
3. Significant accounting policies continued
| (t) | Discontinued operations |
A discontinued operation is a component of the Group’s business that represents a separate major line of business or geographical area of operations that has been disposed of or is held for sale or distribution, or is a subsidiary acquired exclusively with a view to resale. Classification as a discontinued operation occurs upon disposal or when the operation meets the criteria to be classified as held for sale, if earlier. When an operation is classified as a discontinued operation, the comparative statement of comprehensive income is re-presented as if the operation had been discontinued from the start of the comparative year.
| (u) | Earnings per share |
Heineken presents basic and diluted earnings per share (EPS) data for its ordinary shares. Basic EPS is calculated by dividing the profit or loss attributable to ordinary shareholders of the Company by the weighted average number of ordinary shares outstanding during the period including the weighted average of outstanding ASDI, adjusted for the weighted average of own shares purchased in the year. Diluted EPS is determined by adjusting the profit or loss attributable to ordinary shareholders and the weighted average number of ordinary shares outstanding including weighted average of outstanding ASDI, adjusted for the weighted average of own shares purchased in the year, for the effects of all dilutive potential ordinary shares, which comprise share rights granted to employees.
| (v) | Cash flow statement |
The cash flow statement is prepared using the indirect method. Changes in balance sheet items that have not resulted in cash flows such as translation differences, fair value changes, equity-settled share-based payments and other non-cash items, have been eliminated for the purpose of preparing this statement. Assets and liabilities acquired as part of a business combination are included in investing activities (net of cash acquired). Dividends paid to ordinary shareholders are included in financing activities. Dividends received are classified as operating activities. Interest paid is also included in operating activities.
| (w) | Operating segments |
Operating segments are reported in a manner consistent with the internal reporting provided to the Executive Board, who is considered to be the Group’s chief operating decision maker. An operating segment is a component of Heineken that engages in business activities from which it may earn revenues and incur expenses, including revenues and expenses that relate to transactions with any of Heineken’s other components. All operating segments’ operating results are reviewed regularly by the Executive Board to make decisions about resources to be allocated to the segment and to assess its performance, and for which discrete financial information is available.
Inter-segment transfers or transactions are entered into under the normal commercial terms and conditions that would also be available to unrelated third parties.
Segment results, assets and liabilities that are reported to the Executive Board include items directly attributable to a segment as well as those that can be allocated on a reasonable basis. Unallocated result items comprise net finance expenses and income tax expenses. Unallocated assets comprise current other investments and cash call deposits.
Segment capital expenditure is the total cost incurred during the period to acquire property, plant and equipment, and intangible assets other than goodwill.
| (x) | Emission rights |
Emission rights are related to the emission of CO2, which relates to the production of energy. These rights are freely tradable. Bought emission rights and liabilities due to production of CO2 are measured at cost, including any directly attributable expenditure. Emission rights received for free are also recorded at cost, i.e. with a zero value.
Financial statements | Notes to the consolidated financial statementscontinued
| (y) | Recently issued IFRS |
| (i) | Standards effective in 2010 and reflected in these consolidated financial statements |
IFRS 3 Business Combinations (revised 2008)). The IASB issued a revised version of the business combinations standard. For the main changes we refer to paragraph 2(e) Changes in accounting policies.
IAS 27 Consolidated and Separate Financial Statements (amended 2008). The IASB amended IAS 27 to reflect changes to the accounting for non-controlling interest. For the amendments we refer to paragraph 2(e) Changes in accounting policies.
Other standards: other standards and interpretations effective from 1 January 2010, like IFRS 2 Share based payments, IFRIC 17 Distributions of non cash assets to owners and IAS 39 Financial instruments: recognition and measurement, did not have a significant impact on the Company.
| (ii) | New relevant standards and interpretations not yet adopted |
The following new standards and interpretations to existing standards relevant to Heineken are not yet effective for the year ended 31 December 2010, and have not been applied in preparing these consolidated financial statements:
IFRS 3 Business Combinations (amendments effective date 1 July 2010). The amendments:
Clarify that contingent consideration arising in a business combination previously accounted for in accordance with IFRS 3 (2004) that remains outstanding at the adoption date of IFRS 3 (2008) continues to be accounted for in accordance with IFRS 3 (2004)
Limit the accounting policy choice to measure non-controlling interests upon initial recognition at fair value or at the non-controlling interest’s proportionate share of the acquiree’s identifiable net assets to instruments that give rise to a present ownership interest and that currently entitle the holder to a share of net assets in the event of liquidation; and
Expand the current guidance on the attribution of the market-based measure of an acquirer’s share-based payment awards issued in exchange for acquiree awards between consideration transferred and post-combination compensation cost when an acquirer is obliged to replace the acquiree’s existing awards to encompass voluntarily replaced unexpired acquired awards.
| • | IAS 27 Consolidated and Separate Financial Statements (amendments effective date 1 July 2010). The amendments clarify that the consequential amendments to IAS 21The Effects of Changes in Foreign Exchange Rates, IAS 28 and IAS 31 resulting from IAS 27 (2008) should be applied prospectively, with the exception of amendments resulting from renumbering. |
IAS 24 Related Party Disclosures (revised 2009 – effective date 1 January 2011). The revised IAS 24 amends the definition of a related party and modifies certain related party disclosure requirements for government-related entities.
IFRS 7 Financial Instruments: Disclosures (amendments effective date 1 January 2011). The amendments add an explicit statement that qualitative disclosure should be made in the contact of the quantitative disclosures to better enable users to evaluate an entity’s exposure to risks arising from financial instruments. In addition, the IASB amended and removed existing disclosure requirements.
IAS 1 Presentation of Financial Statements (amendments effective date 1 January 2011). The amendments clarify that disaggregation of changes in each component of equity arising from transactions recognised in other comprehensive income also is required to be presented, but may be presented either in the statement of changes in equity or in the notes.
IFRS 9 Financial Instruments is part of the IASB’s wider project to replace IAS 39 ‘Financial Instruments: Recognition and Measurement’. IFRS 9 retains but simplifies the mixed measurement model and establishes two primary measurement categories for financial assets, amortised cost and fair value. The basis of classification depends on the entity’s business model and the contractual cash flow characteristics of the financial asset. The standard is effective for annual periods beginning on or after 1 January 2013, but has not yet been endorsed by the EU. Heineken is in the process of evaluating the impact of the applicability of the new standard.
IAS 19 Pensions and IFRIC 14 (amendments effective 1 January 2011) – The limit on a Defined Benefit Assets, Minimum Funding Requirements and their Interaction. These amendments remove unintended consequences arising from the treatment of prepayments where there is a minimum funding requirement. These amendments result in prepayments of contributions in certain circumstances being recognised as an asset rather than an expense.
Financial statements | Notes to the consolidated financial statementscontinued
| 4. | Determination of fair values |
| (i) | General |
A number of Heineken’s accounting policies and disclosures require the determination of fair value, for both financial and non-financial assets and liabilities. Fair values have been determined for measurement and/or disclosure purposes based on the following methods. When applicable, further information about the assumptions made in determining fair values or for the purpose of impairment testing is disclosed in the notes specific to that asset or liability.
| (ii) | Property, plant and equipment |
The fair value of property, plant and equipment recognised as a result of a business combination is based on the quoted market prices for similar items when available and replacement cost when appropriate.
| (iii) | Intangible assets |
The fair value of brands acquired in a business combination is based on the ‘relief of royalty’ method. The fair value of customer relationships acquired in a business combination is determined using the multi-period excess earnings method, whereby the subject asset is valued after deducting a fair return on all other assets that are part of creating the related cash flows. The fair value of other intangible assets is based on the discounted cash flows expected to be derived from the use and eventual sale of the assets.
| (iv) | Inventories |
The fair value of inventories acquired in a business combination is determined based on its estimated selling price in the ordinary course of business less the estimated costs of completion and sale, and a reasonable profit margin based on the effort required to complete and sell the inventories.
| (v) | Investments in equity and debt securities |
The fair value of financial assets at fair value through profit or loss, held-to-maturity investments and available-for-sale financial assets is determined by reference to their quoted closing bid price at the reporting date, or if unquoted, determined using an appropriate valuation technique. The fair value of held-to-maturity investments is determined for disclosure purposes only. In case the quoted price does not exist at the date of exchange or in case the quoted price exists at the date of exchange but was not used as the cost, the investments are valued indirectly based on discounted cash flow models.
| (vi) | Trade and other receivables |
The fair value of trade and other receivables is estimated at the present value of future cash flows, discounted at the market rate of interest at the reporting date. This fair value is determined for disclosure purposes or when acquired in a business combination.
| (vii) | Derivative financial instruments |
The fair value of derivative financial instruments are based on their listed market price, if available. If a listed market price is not available, then fair value is in general estimated by discounting the difference between the cash flows based on contractual price and the cash flows based on current price for the residual maturity of the contract using a risk-free interest rate (based on inter-bank interest rates).
Fair values reflect the credit risk of the instrument and include adjustments to take account of the credit risk of the Group entity and counterparty when appropriate.
| (viii) | Non-derivative financial instruments |
Fair value, which is determined for disclosure purposes or when fair value hedge accounting is applied, is calculated based on the present value of future principal and interest cash flows, discounted at the market rate of interest at the reporting date. For finance leases the market rate of interest is determined by reference to similar lease agreements.
Financial statements | Notes to the consolidated financial statementscontinued
| 5. | Operating segments |
Heineken distinguishes the following six reportable segments:
Western Europe
Central and Eastern Europe
The Americas
Africa and the Middle East
Asia Pacific
Head Office/eliminations.
These first five reportable segments as stated above are the Group’s business regions. These business regions are each managed separately by a Regional President. The Regional President is directly accountable for the functioning of the segment’s assets, liabilities and results of the region and reports regularly to the Executive Board (the chief operating decision maker) to discuss operating activities, regional forecasts and regional results. The Head Office operating segment falls directly under the responsibility of the Executive Board. For each of the six reportable segments, the Executive Board reviews internal management reports on a monthly basis.
Information regarding the results of each reportable segment is included in the table on the next page. Performance is measured based on EBIT (beia), as included in the internal management reports that are reviewed by the Executive Board. EBIT (beia) is defined as earnings before interest and taxes and net finance expenses, before exceptional items and amortisation of brands and customer relationships. Exceptional items are defined as items of income and expense of such size, nature or incidence, that in view of management their disclosure is relevant to explain the performance of Heineken for the period. EBIT and EBIT (beia) are not financial measures calculated in accordance with IFRS. EBIT (beia) is used to measure performance as management believes that this measurement is the most relevant in evaluating the results of these regions.
Heineken has multiple distribution models to deliver goods to end customers. There is no reliance on major clients. Deliveries to end consumers are done in some countries via own wholesalers or own pubs, in other markets directly and in some others via third parties. As such, distribution models are country specific and on consolidated level diverse. In addition, these various distribution models are not centrally managed or monitored. Consequently, the Executive Board is not allocating resources and assessing the performance based on business type information and therefore no segment information is provided on business type.
Inter-segment pricing is determined on an arm’s-length basis. As net finance expenses and income tax expenses are monitored on a consolidated level (and not on an individual regional basis) and regional presidents are not accountable for that, net finance expenses and income tax expenses are not provided per reportable segment.
Financial statements | Notes to the consolidated financial statementscontinued
5. Operating segmentscontinued
Information about reportable segments
| Note | Western Europe | Central and Eastern Europe | The Americas | |||||||||||||||||||||||||
In millions of EUR | 2010 | 2009 | 2010 | 2009 | 2010 | 2009 | ||||||||||||||||||||||
Revenue | ||||||||||||||||||||||||||||
Third party revenue1 | 7,284 | 7,775 | 3,130 | 3,183 | 3,419 | 1,540 | ||||||||||||||||||||||
Interregional revenue | 610 | 657 | 13 | 17 | 12 | 1 | ||||||||||||||||||||||
Total revenue | 7,894 | 8,432 | 3,143 | 3,200 | 3,431 | 1,541 | ||||||||||||||||||||||
Other income | 71 | 28 | 8 | 11 | — | — | ||||||||||||||||||||||
Results from operating activities | 765 | 504 | 330 | 329 | 474 | 204 | ||||||||||||||||||||||
Net finance expenses | ||||||||||||||||||||||||||||
Share of profit of associates and joint ventures and impairments thereof | 3 | (2 | ) | 21 | 18 | 75 | 69 | |||||||||||||||||||||
Income tax expenses | ||||||||||||||||||||||||||||
Profit | ||||||||||||||||||||||||||||
Attributable to: | ||||||||||||||||||||||||||||
Equity holders of the Company (net profit) | ||||||||||||||||||||||||||||
Non-controlling interest | ||||||||||||||||||||||||||||
EBIT reconciliation | ||||||||||||||||||||||||||||
EBIT | 768 | 502 | 351 | 347 | 549 | 273 | ||||||||||||||||||||||
eia | 136 | 290 | 12 | 42 | 102 | — | ||||||||||||||||||||||
EBIT (beia) | 27 | 904 | 792 | 363 | 389 | 651 | 273 | |||||||||||||||||||||
Beer volumes2 | ||||||||||||||||||||||||||||
Consolidated volume | 45,394 | 47,151 | 42,237 | 46,165 | 37,843 | 9,430 | ||||||||||||||||||||||
Joint Ventures’ volume | — | — | 7,229 | 8,909 | 9,195 | 8,988 | ||||||||||||||||||||||
Licenses | 284 | 243 | — | — | 173 | 339 | ||||||||||||||||||||||
Group volume | 45,678 | 47,394 | 49,466 | 55,074 | 47,211 | 18,757 | ||||||||||||||||||||||
Segment assets | 10,123 | 11,047 | 4,583 | 4,826 | 7,756 | 834 | ||||||||||||||||||||||
Investment in associates and joint ventures | 28 | 26 | 134 | 143 | 758 | 565 | ||||||||||||||||||||||
Total segment assets | 10,151 | 11,073 | 4,717 | 4,969 | 8,514 | 1,399 | ||||||||||||||||||||||
Unallocated assets | ||||||||||||||||||||||||||||
Total assets | ||||||||||||||||||||||||||||
Segment liabilities | 3,072 | 3,355 | 1,128 | 1,153 | 1,115 | 123 | ||||||||||||||||||||||
Unallocated liabilities | ||||||||||||||||||||||||||||
Total equity | ||||||||||||||||||||||||||||
Total equity and liabilities | ||||||||||||||||||||||||||||
Purchase of P, P & E | 205 | 291 | 158 | 216 | 121 | 13 | ||||||||||||||||||||||
Acquisition of goodwill | 4 | 16 | — | — | 1,780 | 5 | ||||||||||||||||||||||
Purchases of intangible assets | 5 | 31 | 4 | 20 | 24 | 1 | ||||||||||||||||||||||
Depreciation of P, P & E | 381 | 401 | 253 | 244 | 149 | 15 | ||||||||||||||||||||||
Impairment and reversal of impairment of P, P & E | 1 | 108 | 9 | 51 | — | — | ||||||||||||||||||||||
Amortisation intangible assets | 90 | 89 | 22 | 21 | 73 | 12 | ||||||||||||||||||||||
Impairment intangible assets | 15 | 21 | 1 | 4 | — | — | ||||||||||||||||||||||
| 1 | Includes other revenue of EUR439 million in 2010 and EUR432 million in 2009. |
| 2 | For volume definitions see ‘Glossary’. Joint Ventures’ volume in 2009 excludes India volumes. |
Financial statements | Notes to the consolidated financial statementscontinued
5. Operating segmentscontinued
Information about reportable segments
| Africa and the Middle East | Asia Pacific | Head Office/ Eliminations | Consolidated | |||||||||||||||||||||||||||||
In millions of EUR | 2010 | 2009 | 2010 | 2009 | 2010 | 2009 | 2010 | 2009 | ||||||||||||||||||||||||
Revenue | ||||||||||||||||||||||||||||||||
Third party revenue1 | 1,982 | 1,807 | 206 | 301 | 112 | 95 | 16,133 | 14,701 | ||||||||||||||||||||||||
Interregional revenue | 6 | 10 | — | 4 | (641 | ) | (689 | ) | — | — | ||||||||||||||||||||||
Total revenue | 1,988 | 1,817 | 206 | 305 | (529 | ) | (594 | ) | 16,133 | 14,701 | ||||||||||||||||||||||
Other income | — | 2 | 158 | — | 2 | — | 239 | 41 | ||||||||||||||||||||||||
Results from operating activities | 520 | 470 | 201 | 72 | (7 | ) | 51 | 2,283 | 1,630 | |||||||||||||||||||||||
Net finance expenses | (509 | ) | (329 | ) | ||||||||||||||||||||||||||||
Share of profit of associates and joint ventures and impairments thereof | 28 | 15 | 79 | 31 | (13 | ) | (4 | ) | 193 | 127 | ||||||||||||||||||||||
Income tax expenses | (399 | ) | (286 | ) | ||||||||||||||||||||||||||||
Profit | 1,568 | 1,142 | ||||||||||||||||||||||||||||||
Attributable to: | ||||||||||||||||||||||||||||||||
Equity holders of the Company (net profit) | 1,436 | 1,018 | ||||||||||||||||||||||||||||||
Non-controlling interest | 132 | 124 | ||||||||||||||||||||||||||||||
| 1,568 | 1,142 | |||||||||||||||||||||||||||||||
EBIT reconciliation | ||||||||||||||||||||||||||||||||
EBIT | 548 | 485 | 280 | 103 | (20 | ) | 47 | 2,476 | 1,757 | |||||||||||||||||||||||
eia | 1 | — | (158 | ) | — | 39 | 6 | 132 | 338 | |||||||||||||||||||||||
EBIT (beia) | 549 | 485 | 122 | 103 | 19 | 53 | 2,608 | 2,095 | ||||||||||||||||||||||||
Beer volumes2 | ||||||||||||||||||||||||||||||||
Consolidated volume | 19,070 | 19,820 | 1,328 | 2,681 | — | — | 145,872 | 125,247 | ||||||||||||||||||||||||
Joint Ventures’ volume | 5,399 | 2,228 | 22,181 | 10,897 | — | — | 44,004 | 31,022 | ||||||||||||||||||||||||
Licenses | 1,204 | 1,413 | 806 | 805 | — | — | 2,467 | 2,800 | ||||||||||||||||||||||||
Group volume | 25,673 | 23,461 | 24,315 | 14,383 | — | — | 192,343 | 159,069 | ||||||||||||||||||||||||
Segment assets | 1,911 | 1,673 | 86 | 185 | (74 | ) | (414 | ) | 24,385 | 18,151 | ||||||||||||||||||||||
Investment in associates and joint ventures | 262 | 226 | 507 | 472 | (16 | ) | (5 | ) | 1,673 | 1,427 | ||||||||||||||||||||||
Total segment assets | 2,173 | 1,899 | 593 | 657 | (90 | ) | (419 | ) | 26,058 | 19,578 | ||||||||||||||||||||||
Unallocated assets | 491 | 602 | ||||||||||||||||||||||||||||||
Total assets | 26,549 | 20,180 | ||||||||||||||||||||||||||||||
Segment liabilities | 529 | 466 | 33 | 107 | 479 | 571 | 6,356 | 5,775 | ||||||||||||||||||||||||
Unallocated liabilities | 9,676 | 8,758 | ||||||||||||||||||||||||||||||
Total equity | 10,517 | 5,647 | ||||||||||||||||||||||||||||||
Total equity and liabilities | 26,549 | 20,180 | ||||||||||||||||||||||||||||||
Purchase of P, P & E | 163 | 139 | 1 | 10 | — | 9 | 648 | 678 | ||||||||||||||||||||||||
Acquisition of goodwill | 1 | 13 | — | — | (37 | ) | — | 1,748 | 34 | |||||||||||||||||||||||
Purchases of intangible assets | 9 | 1 | — | — | 14 | 46 | 56 | 99 | ||||||||||||||||||||||||
Depreciation of P, P & E | 100 | 84 | 1 | 10 | 9 | 14 | 893 | 768 | ||||||||||||||||||||||||
Impairment and reversal of impairment of P, P & E | 2 | 2 | — | — | 2 | 2 | 14 | 163 | ||||||||||||||||||||||||
Amortisation intangible assets | 4 | 2 | — | — | 3 | 3 | 192 | 127 | ||||||||||||||||||||||||
Impairment intangible assets | — | — | — | — | — | — | 16 | 25 | ||||||||||||||||||||||||
| 1 | Includes other revenue of EUR439 million in 2010 and EUR432 million in 2009. |
| 2 | For volume definitions see ‘Glossary’. Joint Ventures’ volume in 2009 excludes India volumes. |
Financial statements | Notes to the consolidated financial statementscontinued
6. Acquisitions and disposals of subsidiaries and non-controlling interests
Acquisition of 100 per cent of the beer operations of FEMSA
On 30 April 2010, Heineken N.V. completed the acquisition of the beer operations of Fomento Económico Mexicano, S.A.B. de C.V. (‘FEMSA’) via an all share transaction (the ‘transaction’). Heineken N.V. acquired all shares of common stocks in FEMSA Cerveza, comprising 100 per cent of FEMSA’s Mexican beer operations (including its US and other export businesses) and the remaining 83 per cent of FEMSA’s Brazilian beer business that Heineken did not own. A portion of the Heineken shares allotted to FEMSA (and its affiliates) will be delivered over a period of not more than five years (the ‘Allotted Shares’ or Allotted Share Delivery Instrument or ASDI). The Allotted Shares have been recognised as a separate category within equity.
The beer operations acquired from FEMSA contributed a revenue of EUR2,036 million and results from operating activities of EUR215 million (EBIT) for the eight-months period from 1 May 2010 to 31 December 2010. Amortisation of brands and customer relationships for the eight-month amounts to EUR62 million. Had the acquisition occurred on 1 January 2010, pro-forma revenue and pro-forma results from operating activities (EBIT) for the 12-month period ended 31 December 2010 would have amounted to EUR2,873 million and EUR268 million respectively. The pro-forma amortisation of brands and customer relationships would have amounted to EUR90 million. This pro-forma information does not purport to represent what our actual results would have been had the acquisition actually occurred on 1 January 2010, nor are they necessarily indicative of future results of operations. In determining the contributions, management has assumed that the fair value adjustments that arose on the date of the acquisition would have been the same as if the acquisition had occurred on 1 January 2010.
The following summarises the major classes of consideration transferred, and the recognised amounts of assets acquired and liabilities assumed at the acquisition date.
In millions of EUR | ||||
Property, plant & equipment | 1,851 | |||
Intangible assets | 2,104 | |||
Investments in associates & joint ventures | 7 | |||
Other investments | 342 | |||
Advances to customers | 210 | |||
Inventories | 273 | |||
Trade and other receivables | 521 | |||
Cash and cash equivalents | 69 | |||
Assets acquired | 5,377 | |||
In millions of EUR | ||||
Loans and borrowings, interest bearing | 894 | |||
Loans and borrowings, non-interest bearing | 124 | |||
Tax liabilities (non-current) | 150 | |||
Employee benefits | 162 | |||
Provisions | 175 | |||
Deferred tax liabilities | 449 | |||
Current part loans, interest bearing | 701 | |||
Bank overdraft | 38 | |||
Tax liabilities (current) | 32 | |||
Other current liabilities | 609 | |||
Liabilities assumed | 3,334 | |||
Total net identifiable assets | 2,043 | |||
Consideration transferred in exchange for shares | 3,865 | |||
Consideration paid in cash | 51 | |||
Recognition indemnification receivable | (134 | ) | ||
Fair value of previous interest in the acquiree | 21 | |||
Non-controlling interests | 20 | |||
Net identifiable assets acquired | (2,043 | ) | ||
Goodwill on acquisition | 1,780 | |||
| * | Amounts were converted into euros at the rate of MXN/EUR16.246, BRL/EUR2.2959 and USD/EUR1.3315 for the statement of financial position. |
Financial statements | Notes to the consolidated financial statementscontinued
Goodwill has provisionally been allocated to the America’s region and is held in US dollars, Mexican pesos and Brazil reals. The rationale for the allocation is that the acquisition provides access to the Latin American market, cost synergies to be achieved through economies of scale due to the increased size of the operations and deferred taxes and assembled workforce will mostly be between Mexico and the USA. Additionally, the acquisition secures the distribution of FEMSA products in the USA, previously arranged via a 10-year licence agreement. The entire amount of goodwill is not expected to be tax deductible.
The consideration transferred in exchange of Heineken N.V. is based on 86,028,019 new Heineken N.V. Shares with a commitment to deliver Allotted Shares over a period of not more than five years from the date of Closing. The Allotted Shares will be delivered to FEMSA pursuant to the Allotted Share Delivery Instrument (ASDI). Simultaneously with the Closing, Heineken Holding N.V. has exchanged 43,018,320 (out of the 86,028,019 new) Heineken N.V. Shares with FEMSA for an equal number of newly issued Heineken Holding Shares. The equity consideration transferred is based on:
Heineken N.V. issued shares (based on listed share price of Heineken N.V. and Heineken Holding N.V. of respectively EUR35.18 and EUR30.82 as at 30 April 2010)
ASDI, number of shares 29,172,504 (based on listed share price of Heineken N.V. of EUR35.18 as at 30 April 2010).
The consideration paid in cash amounting to EUR51 million relates to the working capital adjustment for the period between 1 January and 30 April 2010 as agreed in the Share Exchange Agreement.
Between Heineken and FEMSA certain indemnifications were agreed on, that primarily relate to tax and legal matters. Upon acquisition the indemnification asset amounts to EUR134 million, this asset will subsequently change depending on the corresponding liabilities and amounts to EUR145 million as at 31 December 2010. Indemnification assets are recognised as an asset of the acquirer at the same time and on the same basis as the indemnified items are recognised as a liability. The indemnification asset is considered an included element of the business combination. Mexican contingencies will be fully indemnified by FEMSA, Brazilian contingencies, however, are covered by FEMSA for its former share of approximately 83 per cent. Items will only qualify for indemnification if they have not been previously disclosed to Heineken, exceed the floor of USD50 million individually, relate to the period prior to acquisition and the total indemnification does not exceed the cap. The indemnification is maximised at USD500 million, excluding items attributable to Brazilian tax matters.
The fair value of the previously held 17 per cent in Cervejarias Kaiser (Kaiser) is recognised at EUR21 million. The remeasurement to fair value of the Group’s existing 17 per cent interest in Kaiser resulted in a net loss of EUR4 million that has been recognised in profit or loss under other net finance (expenses)/income.
Non-controlling interests are recognised based on their proportional interest in the recognised amounts of the assets and liabilities of the beer operations acquired from of FEMSA of EUR20 million.
In the net assets acquired Heineken noted trade receivables with a fair value of EUR319 million. The gross amount is EUR365 million, of which EUR46 million is considered doubtful.
As part of business combination accounting contingent liabilities amounting to EUR14 million have been recognised mainly relating to change in control provisions in existing contracts and certain onerous contracts. The cash-outflow is expected between one to seven years.
Acquisition related costs of EUR24 million have been recognised in profit or loss for the period ended 31 December 2010.
Provisional accounting other acquisitions in 2010
During 2010 several adjustments were made to provisional accounting for acquisitions in the UK and Ireland. Total impact resulted in a decrease of goodwill of EUR32 million, of which EUR37 million was received in cash. Goodwill decreased by EUR37 million due to the Scottish & Newcastle acquisition of 2008 and is caused by adjustments made to the debt allocation agreement with Carlsberg Group.
For the other acquisitions in 2009, related to Universal Beverages Limited (UBL Cider Mill) in the UK, the goodwill increased by approximately EUR9 million, these adjustments were made within the window period of one year. The remainder goodwill decrease of EUR4 million relates to the finalisation of the contingent consideration of Nash Beverages Ltd. in Ireland.
Financial statements | Notes to the consolidated financial statementscontinued
6. Acquisitions and disposals of subsidiaries and non-controlling interests continued
Acquisition of non-controlling interest
On 12 May 2010, Heineken International acquired an additional interest in Commonwealth Brewery Limited (CBL) of 47 per cent and Burns House Limited (BHL) of 60 per cent , increasing its ownership to 100 per cent in both entities. Before this acquisition, Heineken International already had control in CBL / BHL. On 17 November 2010, Heineken International acquired an additional 5 per cent interest in Brasseries et Limonaderies du Rwanda S.A., increasing its ownership to 75 per cent . During the year, several other non-controlling interests were bought out, which is regular business practice within the Heineken Group. The cash paid for all the acquired non-controlling interests during 2010 amounts to EUR92 million, decreased our non-controlling interests by EUR34 million and resulted in a net decrease of our retained earnings of EUR58 million.
Due to non-disclosure agreements, Heineken cannot provide the consideration paid on an individual level. Considering the overall amounts disclosed above we deem these to be individually as well as aggregated to be immaterial in nature.
Disposals
On 10 February 2010 and 13 April 2010, Heineken N.V. transferred in total a 78.3 per cent stake in PT Multi Bintang Indonesia (MBI) and Heineken’s 87 per cent stake in Grande Brasserie de Nouvelle-Caledonie S.A. (GBNC) to its joint venture Asia Pacific Breweries (APB). Heineken retains a direct shareholding in MBI of 6.8 per cent. As a result of the transaction a gain of EUR157 million before tax has been recognised in other income including the remeasurement to fair value of the Group’s remaining 6.8 per cent share amounting to EUR29 million. The sale price of this transaction was EUR265 million.
Other disposals during 2010 include TBS Waverley in the UK and certain smaller entities in the Caribbean. Due to competitive sensitivity and the non-disclosure agreements with the parties involved, the disposal prices are not individually disclosed.
The disposals had the following effect on Heineken’s assets and liabilities on disposal date:
In millions of EUR | Total Disposals | |||
Property, plant & equipment | (61 | ) | ||
Intangible assets | — | |||
Investments in associates & joint ventures | — | |||
Other investments | (2 | ) | ||
Deferred tax assets | (4 | ) | ||
Inventories | (35 | ) | ||
Trade and other receivables | (69 | ) | ||
Cash and cash equivalents | (24 | ) | ||
Assets | (195 | ) | ||
Loans and borrowings | 2 | |||
Employee benefits | 1 | |||
Provisions | 17 | |||
Deferred tax liabilities | 6 | |||
Trade and other payables | 147 | |||
Tax liabilities | 5 | |||
Liabilities | 178 | |||
Net identifiable assets and liabilities | (17 | ) | ||
Non-controlling interests | 5 | |||
Gain on sale of subsidiaries | (282 | )* | ||
Consideration received in cash | (294 | ) | ||
Net cash disposed of | 24 | |||
Net cash outflow/(inflow) | (270 | ) | ||
| * | EUR101 million of the gain on disposal is eliminated, reflecting the Heineken share in APB. |
Financial statements | Notes to the consolidated financial statementscontinued
7. Assets (or disposal groups) classified as held for sale
Other assets classified as held for sale represent land and buildings following the commitment of Heineken to a plan to sell certain land and buildings. Efforts to sell these assets have commenced and are expected to be completed during 2011.
Assets classified as held for sale
In millions of EUR | 2010 | 2009 | ||||||
Current assets | — | 39 | ||||||
Non-current assets | 6 | 70 | ||||||
| 6 | 109 | |||||||
In millions of EUR | 2010 | 2009 | ||||||
Current liabilities | — | 57 | ||||||
Non-current liabilities | — | 8 | ||||||
| — | 65 | |||||||
8. Other income
In millions of EUR | 2010 | 2009 | ||||||
Net gain on sale of property, plant & equipment | 37 | 39 | ||||||
Net gain on sale of Intangible assets | 13 | — | ||||||
Net gain on sale of subsidiaries, joint ventures and associates | 189 | 2 | ||||||
| 239 | 41 | |||||||
Financial statements | Notes to the consolidated financial statementscontinued
9. Raw materials, consumables and services
In millions of EUR | 2010 | 2009 | ||||||
Raw materials | 1,474 | 1,140 | ||||||
Non-returnable packaging | 1,863 | 1,739 | ||||||
Goods for resale | 1,655 | 2,253 | ||||||
Inventory movements | (8 | ) | (5 | ) | ||||
Marketing and selling expenses | 2,072 | 1,664 | ||||||
Transport expenses | 979 | 934 | ||||||
Energy and water | 442 | 319 | ||||||
Repair and maintenance | 375 | 299 | ||||||
Other expenses | 1,439 | 1,307 | ||||||
| 10,291 | 9,650 | |||||||
Other expenses include rentals of EUR224 million (2009: 184 million), consultant expenses of EUR126 million (2009: EUR109 million), telecom and office automation of EUR156 million (2009: EUR145 million) and other fixed expenses of EUR933 million (2009: EUR820 million).
10. Personnel expenses
In millions of EUR | Note | 2010 | 2009 | |||||||||
Wages and salaries | 1,787 | 1,554 | ||||||||||
Compulsory social security contributions | 317 | 287 | ||||||||||
Contributions to defined contribution plans | 16 | 17 | ||||||||||
Expenses related to defined benefit plans | 28 | 104 | 107 | |||||||||
Increase in other long-term employee benefits | 9 | 7 | ||||||||||
Equity-settled share-based payment plan | 29 | 15 | 10 | |||||||||
Other personnel expenses | 432 | 397 | ||||||||||
| 2,680 | 2,379 | |||||||||||
The increase in other personnel expenses of EUR35 million is mainly due to the acquisition of the beer operations of FEMSA for (EUR70 million) and partly offset by lower amounts paid (EUR35 million) for restructurings compared to 2009.
The average number of full-time equivalent (FTE) employees during the year was:
In millions of EUR | 2010 | 2009 | ||||||
The Netherlands | 3,861 | 3,938 | ||||||
Other Western Europe | 15,751 | 17,557 | ||||||
Central and Eastern Europe | 18,043 | 20,253 | ||||||
The Americas | 17,164 | 1,698 | ||||||
Africa and the Middle East | 10,607 | 10,882 | ||||||
Asia Pacific | 304 | 973 | ||||||
Heineken N.V. and subsidiaries | 65,730 | 55,301 | ||||||
Financial statements | Notes to the consolidated financial statementscontinued
11. Amortisation, depreciation and impairments
In millions of EUR | Note | 2010 | 2009 | |||||||||
Property, plant & equipment | 14 | 907 | 931 | |||||||||
Intangible assets | 15 | 208 | 152 | |||||||||
Impairment on available for sale assets | 3 | — | ||||||||||
| 1,118 | 1,083 | |||||||||||
12. Net finance expenses
Recognised in profit or loss
In millions of EUR | 2010 | 2009 | ||||||
Interest income | 100 | 90 | ||||||
Interest expenses | (590 | ) | (633 | ) | ||||
Dividend income on available-for-sale investments | 1 | 1 | ||||||
Dividend income on investments held for trading | 7 | 10 | ||||||
Net gain/(loss) on disposal of available-for-sale investments | — | 12 | ||||||
Net change in fair value of derivatives | (75 | ) | (7 | ) | ||||
Net foreign exchange gain/(loss) | 62 | (47 | ) | |||||
Impairment losses on available-for-sale investments | (4 | ) | — | |||||
Unwinding discount on provisions | (7 | ) | (3 | ) | ||||
Other net financial income/(expenses) | (3 | ) | 248 | |||||
Other net finance income/(expenses) | (19 | ) | 214 | |||||
Net finance expenses | (509 | ) | (329 | ) | ||||
Recognised in other comprehensive income
In millions of EUR | 2010 | 2009 | ||||||
Foreign currency translation differences for foreign operations | 400 | 112 | ||||||
Effective portion of changes in fair value of cash flow hedges | 43 | (90 | ) | |||||
Effective portion of cash flow hedges transferred to profit or loss | 45 | 88 | ||||||
Ineffective portion of cash flow hedges transferred to profit or loss | 9 | — | ||||||
Net change in fair value of available-for-sale investments | 11 | 26 | ||||||
Net change in fair value available-for-sale investments transferred to profit or loss | (17 | ) | (12 | ) | ||||
Share of other comprehensive income of associates/joint ventures | (29 | ) | 22 | |||||
| 462 | 146 | |||||||
Recognised in: | ||||||||
Fair value reserve | (10 | ) | 12 | |||||
Hedging reserve | 97 | (2 | ) | |||||
Translation reserve | 375 | 136 | ||||||
| 462 | 146 | |||||||
In 2009 the other net financial income/(expense) contained a total (net) book gain of EUR248 million relating to the purchase of Globe debt (Scottish & Newcastle Pub Enterprise).
The increase of the impact of foreign currency translation differences for foreign operations in other comprehensive income is mainly due to the impact of revaluation of the British pound on the net assets and goodwill measured in British pounds of total EUR98 million. Remaining impact is related to the appreciation of the Russian ruble, Polish zloty, Swiss franc and the Chilean peso, partly offset by the devaluation of the Mexican peso.
Financial statements | Notes to the consolidated financial statementscontinued
13. Income tax expense
Recognised in profit or loss
In millions of EUR | 2010 | 2009 | ||||||
Current tax expense | ||||||||
Current year | 498 | 360 | ||||||
Under/(over) provided in prior years | 52 | 8 | ||||||
| 550 | 368 | |||||||
Deferred tax expense | ||||||||
Origination and reversal of temporary differences | (19 | ) | (84 | ) | ||||
Previously unrecognised deductible temporary differences | (2 | ) | — | |||||
Changes in tax rate | 3 | — | ||||||
Utilisation/(benefit) of tax losses recognised | (39 | ) | 10 | |||||
Under/(over) provided in prior years | (94 | ) | (8 | ) | ||||
| (151 | ) | (82 | ) | |||||
Total income tax expense in profit or loss | 399 | 286 | ||||||
Reconciliation of the effective tax rate
In millions of EUR | 2010 | 2009 | ||||||
Profit before income tax | 1,967 | 1,428 | ||||||
Share of net profit of associates and joint ventures and impairments thereof | (193 | ) | (127 | ) | ||||
Profit before income tax excluding share of profit of associates and joint ventures (inclusive impairments thereof) | 1,774 | 1,301 | ||||||
| % | 2010 | % | 2009 | |||||||||||||
Income tax using the Company’s domestic tax rate | 25.5 | 452 | 25.5 | 332 | ||||||||||||
Effect of tax rates in foreign jurisdictions | 1.9 | 34 | 1.6 | 21 | ||||||||||||
Effect of non-deductible expenses | 4.1 | 72 | 2.8 | 36 | ||||||||||||
Effect of tax incentives and exempt income | (8.2 | ) | (146 | ) | (8.2 | ) | (107 | ) | ||||||||
Recognition of previously unrecognised temporary differences | (0.1 | ) | (2 | ) | (0.1 | ) | (1 | ) | ||||||||
Utilisation or recognition of previously unrecognised tax losses | (1.2 | ) | (21 | ) | (0.5 | ) | (7 | ) | ||||||||
Unrecognised current year tax losses | 0.8 | 15 | 0.9 | 12 | ||||||||||||
Effect of changes in tax rate | 0.2 | 3 | — | — | ||||||||||||
Withholding taxes | 1.4 | 25 | 1.2 | 16 | ||||||||||||
Under/(over) provided in prior years | (2.4 | ) | (42 | ) | — | — | ||||||||||
Other reconciling items | 0.5 | 9 | (1.2 | ) | (16 | ) | ||||||||||
| 22.5 | 399 | 22.0 | 286 | |||||||||||||
The effective tax rate of the Company increased from 22 per cent to 22.5 per cent. The 2009 rate included the effects of the tax-exempt book gain on the purchase of the Globe Bonds, whilst the 2010 rate includes the effects of the (partly) tax-exempt gain on the sale of the shares in MBI, GBNC and Waverley TBS (book gain EUR199 million), and exceptional tax items in 2010 related to the finalisation of the Globe transactions in the UK and various other settlements with the tax authorities (tax effect EUR52 million).
Income tax recognised in other comprehensive income
In millions of EUR | Note | 2010 | 2009 | |||||||||
Changes in fair value | (5 | ) | 2 | |||||||||
Changes in hedging reserve | (38 | ) | (4 | ) | ||||||||
| 18 | (43 | ) | (2 | ) | ||||||||
Financial statements | Notes to the consolidated financial statementscontinued
14. Property, plant and equipment
In millions of EUR | Note | Land and buildings | Plant and equipment | Other fixed assets | Under construction | Total | ||||||||||||||||||
Cost | ||||||||||||||||||||||||
Balance as at 1 January 2009 | 3,381 | 5,169 | 3,459 | 457 | 12,466 | |||||||||||||||||||
Changes in consolidation | 15 | 91 | (9 | ) | 3 | 100 | ||||||||||||||||||
Purchases | 45 | 110 | 232 | 291 | 678 | |||||||||||||||||||
Transfer of completed projects under construction | 89 | 199 | 78 | (366 | ) | — | ||||||||||||||||||
Transfer to/(from) assets classified as held for sale | 19 | (39 | ) | (39 | ) | (3 | ) | (62 | ) | |||||||||||||||
Disposals | (94 | ) | (122 | ) | (204 | ) | (68 | ) | (488 | ) | ||||||||||||||
Effect of movements in exchange rates | 5 | (71 | ) | 1 | 1 | (64 | ) | |||||||||||||||||
Balance as at 31 December 2009 | 3,460 | 5,337 | 3,518 | 315 | 12,630 | |||||||||||||||||||
Balance as at 1 January 2010 | 3,460 | 5,337 | 3,518 | 315 | 12,630 | |||||||||||||||||||
Changes in consolidation | 6 | 745 | 635 | 253 | 72 | 1,705 | ||||||||||||||||||
Purchases | 38 | 82 | 249 | 279 | 648 | |||||||||||||||||||
Transfer of completed projects under construction | 106 | 142 | 104 | (352 | ) | — | ||||||||||||||||||
Transfer to/(from) assets classified as held for sale | 26 | 34 | 39 | 2 | 101 | |||||||||||||||||||
Disposals | (49 | ) | (130 | ) | (285 | ) | (1 | ) | (465 | ) | ||||||||||||||
Effect of movements in exchange rates | 71 | 107 | 61 | 15 | 254 | |||||||||||||||||||
Balance as at 31 December 2010 | 4,397 | 6,207 | 3,939 | 330 | 14,873 | |||||||||||||||||||
Depreciation and impairment losses | ||||||||||||||||||||||||
Balance as at 1 January 2009 | (1,282 | ) | (2,720 | ) | (2,150 | ) | — | (6,152 | ) | |||||||||||||||
Changes in consolidation | 2 | — | 3 | — | 5 | |||||||||||||||||||
Depreciation charge for the year | 11 | (117 | ) | (286 | ) | (365 | ) | — | (768 | ) | ||||||||||||||
Impairment losses | 11 | (81 | ) | (95 | ) | (5 | ) | — | (181 | ) | ||||||||||||||
Reversal impairment losses | 11 | 1 | 16 | 1 | — | 18 | ||||||||||||||||||
Transfer (to)/from assets classified as held for sale | 8 | 22 | 19 | — | 49 | |||||||||||||||||||
Disposals | 62 | 169 | 166 | — | 397 | |||||||||||||||||||
Effect of movements in exchange rates | 2 | 19 | (2 | ) | — | 19 | ||||||||||||||||||
Balance as at 31 December 2009 | (1,405 | ) | (2,875 | ) | (2,333 | ) | — | (6,613 | ) | |||||||||||||||
Balance as at 1 January 2010 | (1,405 | ) | (2,875 | ) | (2,333 | ) | — | (6,613 | ) | |||||||||||||||
Changes in consolidation | 6 | 12 | 31 | 35 | — | 78 | ||||||||||||||||||
Depreciation charge for the year | 11 | (117 | ) | (342 | ) | (434 | ) | — | (893 | ) | ||||||||||||||
Impairment losses | 11 | (15 | ) | (19 | ) | (6 | ) | — | (40 | ) | ||||||||||||||
Reversal impairment losses | 11 | 4 | 21 | 1 | — | 26 | ||||||||||||||||||
Transfer (to)/from assets classified as held for sale | (6 | ) | (14 | ) | (23 | ) | — | (43 | ) | |||||||||||||||
Disposals | 37 | 128 | 263 | — | 428 | |||||||||||||||||||
Effect of movements in exchange rates | (36 | ) | (54 | ) | (39 | ) | — | (129 | ) | |||||||||||||||
Balance as at 31 December 2010 | (1,526 | ) | (3,124 | ) | (2,536 | ) | — | (7,186 | ) | |||||||||||||||
Carrying amount | ||||||||||||||||||||||||
As at 1 January 2009 | 2,099 | 2,449 | 1,309 | 457 | 6,314 | |||||||||||||||||||
As at 31 December 2009 | 2,055 | 2,462 | 1,185 | 315 | 6,017 | |||||||||||||||||||
As at 1 January 2010 | 2,055 | 2,462 | 1,185 | 315 | 6,017 | |||||||||||||||||||
As at 31 December 2010 | 2,871 | 3,083 | 1,403 | 330 | 7,687 | |||||||||||||||||||
Financial statements | Notes to the consolidated financial statementscontinued
Impairment losses
In 2010 a total impairment loss of EUR40 million (2009: EUR181 million) was charged to profit or loss. These impairment losses included EUR20 million in Serbia. Management performed an impairment of assets analysis after identifying a triggering event relating to the then current market conditions. The remaining impairments mainly relate to restructuring in Belgium, Egypt, Italy and Austria.
14. Property, plant and equipment continued
Financial lease assets
The Group leases PP&E under a number of finance lease agreements. At 31 December 2010 the net carrying amount of leased property, plant and equipment was EUR95 million (2009: EUR108 million). During the year, the Group acquired leased assets of EUR17 million (2009: EUR4 million).
Security to authorities
Property, plant & equipment EUR281 million (2009: EUR27 million) has been pledged to the authorities in a number of countries as security for the payment of taxation, particularly excise duties on beers, non-alcoholic beverages and spirits and import duties. Increase mainly relates to Brazil (see note 34).
Property, plant and equipment under construction
Property, plant & equipment under construction mainly relates to expansion of the brewing capacity in Mexico, the UK, Russia, Spain and Nigeria.
Capitalised borrowing costs
During 2010 no borrowing costs have been capitalised (2009: EUR nil).
Financial statements | Notes to the consolidated financial statementscontinued
15. Intangible assets
In millions of EUR | Note | Goodwill | Brands | Customer- related intangibles | Contract- based intangibles | Software, research and development and other | Total | |||||||||||||||||||||
Cost | ||||||||||||||||||||||||||||
Balance as at 1 January 2009 | 5,604 | 1,332 | 311 | 108 | 225 | 7,580 | ||||||||||||||||||||||
Changes in consolidation | 34 | 4 | 24 | 7 | 1 | 70 | ||||||||||||||||||||||
Purchases/internally developed | — | 9 | — | 19 | 71 | 99 | ||||||||||||||||||||||
Disposals | — | (7 | ) | — | — | (47 | ) | (54 | ) | |||||||||||||||||||
Transfers to assets held for sale | — | — | — | — | (2 | ) | (2 | ) | ||||||||||||||||||||
Effect of movements in exchange rates | 75 | 44 | 16 | (10 | ) | 11 | 136 | |||||||||||||||||||||
Balance as at 31 December 2009 | 5,713 | 1,382 | 351 | 124 | 259 | 7,829 | ||||||||||||||||||||||
Balance as at 1 January 2010 | 5,713 | 1,382 | 351 | 124 | 259 | 7,829 | ||||||||||||||||||||||
Changes in consolidation | 6 | 1,748 | 924 | 943 | 86 | 39 | 3,740 | |||||||||||||||||||||
Purchased/internally developed | — | — | — | — | 56 | 56 | ||||||||||||||||||||||
Disposals | (1 | ) | (8 | ) | — | — | (16 | ) | (25 | ) | ||||||||||||||||||
Transfers to assets held for sale | — | — | — | — | 3 | 3 | ||||||||||||||||||||||
Effect of movements in exchange rates | 132 | 23 | (10 | ) | 12 | 3 | 160 | |||||||||||||||||||||
Balance as at 31 December 2010 | 7,592 | 2,321 | 1,284 | 222 | 344 | 11,763 | ||||||||||||||||||||||
Amortisation and impairment losses | ||||||||||||||||||||||||||||
Balance as at 1 January 2009 | (290 | ) | (68 | ) | (29 | ) | (11 | ) | (152 | ) | (550 | ) | ||||||||||||||||
Amortisation charge for the year | 11 | — | (36 | ) | (43 | ) | (18 | ) | (30 | ) | (127 | ) | ||||||||||||||||
Impairment losses | 11 | (1 | ) | (4 | ) | — | (20 | ) | — | (25 | ) | |||||||||||||||||
Disposals | (1 | ) | — | — | — | 5 | 4 | |||||||||||||||||||||
Transfers to assets held for sale | — | — | — | — | 2 | 2 | ||||||||||||||||||||||
Effect of movements in exchange rates | 12 | — | (2 | ) | (1 | ) | (7 | ) | 2 | |||||||||||||||||||
Balance as at 31 December 2009 | (280 | ) | (108 | ) | (74 | ) | (50 | ) | (182 | ) | (694 | ) | ||||||||||||||||
Financial statements | Notes to the consolidated financial statementscontinued
In millions of EUR | Note | Goodwill | Brands | Customer- related intangibles | Contract- based intangibles | Software, research and development and other | Total | |||||||||||||||||||||
Balance as at 1 January 2010 | (280 | ) | (108 | ) | (74 | ) | (50 | ) | (182 | ) | (694 | ) | ||||||||||||||||
Changes in consolidation | 6 | — | — | — | 25 | 3 | 28 | |||||||||||||||||||||
Amortisation charge for the year | 11 | — | (54 | ) | (88 | ) | (16 | ) | (34 | ) | (192 | ) | ||||||||||||||||
Impairment losses | 11 | — | (1 | ) | — | (15 | ) | — | (16 | ) | ||||||||||||||||||
Disposals | 1 | 2 | — | — | 10 | 13 | ||||||||||||||||||||||
Transfers to assets held for sale | — | — | — | — | (2 | ) | (2 | ) | ||||||||||||||||||||
Effect of movements in exchange rates | — | (2 | ) | (1 | ) | (4 | ) | (3 | ) | (10 | ) | |||||||||||||||||
Balance as at 31 December 2010 | (279 | ) | (163 | ) | (163 | ) | (60 | ) | (208 | ) | (873 | ) | ||||||||||||||||
Carrying amount | ||||||||||||||||||||||||||||
As at 1 January 2009 | 5,314 | 1,264 | 282 | 97 | 73 | 7,030 | ||||||||||||||||||||||
As at 31 December 2009 | 5,433 | 1,274 | 277 | 74 | 77 | 7,135 | ||||||||||||||||||||||
As at 1 January 2010 | 5,433 | 1,274 | 277 | 74 | 77 | 7,135 | ||||||||||||||||||||||
As at 31 December 2010 | 7,313 | 2,158 | 1,121 | 162 | 136 | 10,890 | ||||||||||||||||||||||
Brands and customer-related/contract-based intangibles
The main brands capitalised are the brands acquired in 2008: Scottish & Newcastle (Fosters and Strongbow) and 2010: Cervecería Cuauhtémoc Moctezuma (Dos Equis, Tecate and Sol). The main customer-related and contract-based intangibles were acquired in 2008 and are related to customer relationships with pubs or retailers in the UK (constituting either by way of a contractual agreement or by way of non-contractual relations). The contract-based and customer related intangibles acquired as a result of the acquisition of the beer operations of FEMSA are a large part of the 2010 intangibles.
Impairment tests for cash-generating units containing goodwill
For the purpose of impairment testing, goodwill in respect of Western Europe, Central and Eastern Europe (excluding Russia) and the Americas (excluding Brazil) is allocated and monitored on a regional basis. In respect of less integrated Operating Companies of Russia, Brazil and Africa and the Middle East, goodwill is allocated and monitored on an individual country basis.
The aggregate carrying amounts of goodwill allocated to each CGU are as follows:
In millions of EUR | 2010 | 2009 | ||||||
Western Europe | 3,328 | 3,282 | ||||||
Central and Eastern Europe (excluding Russia) | 1,494 | 1,467 | ||||||
Russia | 105 | 99 | ||||||
The Americas (excluding Brazil) | 2,031 | 349 | ||||||
Brazil | 110 | — | ||||||
Africa and the Middle East | 245 | 236 | ||||||
| 7,313 | 5,433 | |||||||
Throughout the year total goodwill mainly increased due to the acquisition of the FEMSA beer business in Mexico and Brazil and net foreign currency gains.
Goodwill is tested for impairments annually. The recoverable amounts of the CGUs are based on value-in-use calculations. Value in use was determined by discounting the future cash flows generated from the continuing use of the unit using a pre-tax discount rate.
The key assumptions used for the value in use calculations are as follows:
Financial statements | Notes to the consolidated financial statementscontinued
15. Intangible assets continued
Cash flows were projected based on actual operating results and the three-year business plan. Cash flows for a further seven-year period were extrapolated using expected annual per country volume growth rates, which are based on external sources. Management believes that this forecasted period is justified due to the long-term nature of the beer business and past experiences.
The beer price growth per year after the first three-year period is assumed to be at specific per country expected annual long-term inflation, based on external sources.
Cash flows after the first ten-year period were extrapolated using a perpetual growth rate equal to the expected annual long-term inflation, in order to calculate the terminal recoverable amount.
A per CGU-specific pre-tax Weighted Average Cost of Capital (WACC) was applied in determining the recoverable amount of the units.
The values assigned to the key assumptions used for the value-in-use calculations are as follows:
| Pre-tax WACC | Expected annual long- term inflation 2014-2020 | Expected volume growth rates 2014-2020 | ||||||||||
Western Europe | 9.6 | % | 1.7 | % | (0.2 | )% | ||||||
Central and Eastern Europe (excluding Russia) | 11.9 | % | 2.2 | % | 2.3 | % | ||||||
Russia | 12.8 | % | 5.5 | % | 3.0 | % | ||||||
The Americas (excluding Brazil) | 13.4 | % | 2.9 | % | 1.9 | % | ||||||
Brazil | 19.3 | % | 4.1 | % | 2.9 | % | ||||||
Africa and Middle East | 11.0-23.2 | % | 1.7-8.3 | % | 1.4-5.0 | % | ||||||
The values assigned to the key assumptions represent management’s assessment of future trends in the beer industry and are based on both external sources and internal sources (historical data). For Russia, management has decreased the perpetual growth rate by 3 per cent to reflect management’s best estimate, resulting in a perpetual growth rate of 2.5 per cent and a more conservative value in use.
Sensitivity to changes in assumptions
The outcome of a sensitivity analysis of a 100 basis points adverse change in key assumptions (lower growth rates or higher discount rates respectively) did not result in a materially different outcome of the impairment test.
16. Investments in associates and joint ventures
Heineken has the following significant investments in associates and joint ventures:
| Country | Ownership 2010 | Ownership 2009 | ||||||||||
Joint ventures | ||||||||||||
Brau Holding International GmbH & Co KgaA | Germany | 49.9 | % | 49.9 | % | |||||||
Zagorka Brewery A.D. | Bulgaria | 49.0 | % | 49.0 | % | |||||||
Brewinvest S.A. | Greece | 50.0 | % | 50.0 | % | |||||||
Pivara Skopje A.D. | FYC Macedonia | 27.6 | % | 27.6 | % | |||||||
Brasseries du Congo S.A. | Congo | 50.0 | % | 50.0 | % | |||||||
Asia Pacific Investment Pte. Ltd. | Singapore | 50.0 | % | 50.0 | % | |||||||
Asia Pacific Breweries Ltd. | Singapore | 41.9 | % | 41.9 | % | |||||||
Compania Cervecerias Unidas S.A. | Chile | 33.1 | % | 33.1 | % | |||||||
Tempo Beverages Ltd. | Israel | 40.0 | % | 40.0 | % | |||||||
Heineken Lion Australia Pty. | Australia | 50.0 | % | 50.0 | % | |||||||
Sirocco FZCo | Dubai | 50.0 | % | 50.0 | % | |||||||
Diageo Heineken Namibia B.V. | Namibia | 50.0 | % | 50.0 | % | |||||||
United Breweries Limited | India | 37.5 | % | 37.5 | % | |||||||
Millenium Alcobev Private Limited* | India | 68.8 | % | 68.8 | % | |||||||
DHN Drinks (Pty) Ltd. | South Africa | 44.5 | % | 44.5 | % | |||||||
Financial statements | Notes to the consolidated financial statementscontinued
| Country | Ownership 2010 | Ownership 2009 | ||||||||||
Sedibeng Brewery Pty Ltd.* | South Africa | 75.0 | % | 75.0 | % | |||||||
UB Nizam Breweries Pvt. Ltd | Singapore | 50.0 | % | 0 | % | |||||||
UB Ajanta Breweries Pvt. Ltd | Singapore | 50.0 | % | 0 | % | |||||||
Associates | ||||||||||||
Cerveceria Costa Rica S.A. | Costa Rica | 25.0 | % | 25.0 | % | |||||||
JSC FE Efes Karaganda Brewery | Kazakhstan | 28.0 | % | 28.0 | % | |||||||
| * | Heineken has joint control as the contract and ownership details determine that for certain main operating and financial decisions unanimous approval is required. As a result these investments are not consolidated. |
Reporting date
The reporting date of the financial statements of all Heineken entities and joint ventures disclosed are the same as for the Company except for (i) Asia Pacific Breweries Ltd., Heineken Lion Australia Pty. and Asia Pacific Investment Pte. Ltd which have a 30 September reporting date (the APB results are included with a three-month delay in reporting), (ii) DHN Drinks (Pty) Ltd. which has a 30 June reporting date, and (iii) United Breweries Limited and Millenium Alcobev Private Limited which have a 31 March reporting date. The results of (ii) and (iii) have been adjusted to include numbers for the full financial year ended 31 December 2010.
Shareholdings India
On 10 February 2010, Heineken acquired APB’s existing Indian investments: Asia Pacific Breweries Aurangabad Pte Ltd (‘APB Aurangabad’), currently named UB Ajanta Breweries, and Asia Pacific Breweries-Pearl Pte Ltd (‘APB Pearl’), currently named UB Nizam Breweries. The total acquisition price for 100 per cent of the shares amounted to EUR27 million. We deemed these acquisitions individually to be immaterial in respect of IFRS disclosure requirements. If the acquisitions had occurred on 1 January 2010, management estimates that consolidated results from operating activities and consolidated revenue would not have been materially different. On 27 October 2010 Heineken sold 50 per cent of its share in these acquired entities to our joint venture partner VJM Group.
Share of profit of associates and joint ventures and impairments thereof
In millions of EUR | 2010 | 2009 | ||||||
Income associates | 28 | 7 | ||||||
Income joint ventures | 165 | 120 | ||||||
Impairments | — | — | ||||||
| 193 | 127 | |||||||
In 2010 no impairments were recognised in respect of associates and JVs (2009: EUR nil).
Summary financial information for equity accounted joint ventures
In millions of EUR | Joint ventures 2010 | Joint ventures 2009 | ||||||
Non-current assets | 1,696 | 1,375 | ||||||
Current assets | 869 | 681 | ||||||
Non-current liabilities | (611 | ) | (430 | ) | ||||
Current liabilities | (684 | ) | (631 | ) | ||||
| 1,270 | 995 | |||||||
Revenue | 2,108 | 1,540 | ||||||
Expenses | (1,887 | ) | (1,377 | ) | ||||
| 221 | 163 | |||||||
Financial statements | Notes to the consolidated financial statementscontinued
17. Other investments and receivables
In millions of EUR | Note | 2010 | 2009 | |||||||||
Non-current other investments | ||||||||||||
Loans | 32 | 455 | 329 | |||||||||
Indemnification receivable | 32 | 145 | — | |||||||||
Other receivables | 32 | 174 | — | |||||||||
Held-to-maturity investments | 32 | 4 | 4 | |||||||||
Available-for-sale investments | 32 | 190 | 219 | |||||||||
Non-current derivatives | 32 | 135 | 16 | |||||||||
| 1,103 | 568 | |||||||||||
Current other investments | ||||||||||||
Investments held for trading | 32 | 17 | 15 | |||||||||
| 17 | 15 | |||||||||||
Included in loans are loans to customers with a carrying amount of EUR166 million as at 31 December 2010 (2009: EUR150 million). Effective interest rates range from 2 to 13 per cent. EUR164 million (2009: EUR145 million) matures between 1 and 5 years and EUR2 million (2009: EUR5 million) after 5 years.
The other non-current receivables mainly originate from the acquisition of the beer operations of FEMSA and represent a receivable on the Brazilian Authorities on which interest is calculated in accordance with Brazilian legislation. Collection of this receivable is expected to be beyond a period of five years. The indemnification receivable represents the receivable on FEMSA and is a mirror of the corresponding indemnified liabilities originating from the acquisition of the beer operations of FEMSA.
The main available-for sale-investments are Consorcio Cervecero de Nicaragua S.A. and Desnoes & Geddes Ltd. As far as these investments are listed they are measured at their quoted market price. For others the value in use or multiples are used. Debt securities (which are interest-bearing) with a carrying amount of EUR21 million (2009: EUR21 million) are included in available-for-sale investments.
Sensitivity analysis – equity price risk
An amount of EUR69 million as at 31 December 2010 (2009: EUR57 million) of available-for-sale investments and investments held for trading is listed on stock exchanges. A 1 per cent increase in the share price at the reporting date would have increased equity by EUR1 million (2009: EUR1 million); an equal change in the opposite direction would have decreased equity by EUR1 million (2009: EUR1 million).
18. Deferred tax assets and liabilities
Recognised deferred tax assets and liabilities
Deferred tax assets and liabilities are attributable to the following items:
In millions of EUR | 2010 | Assets 2009 | 2010 | Liabilities 2009 | 2010 | Net 2009 | ||||||||||||||||||
Property, plant & equipment | 86 | 55 | (550 | ) | (385 | ) | (464 | ) | (330 | ) | ||||||||||||||
Intangible assets | 62 | 41 | (789 | ) | (310 | ) | (727 | ) | (269 | ) | ||||||||||||||
Investments | 87 | 15 | (9 | ) | (6 | ) | 78 | 9 | ||||||||||||||||
Inventories | 33 | 17 | (6 | ) | (6 | ) | 27 | 11 | ||||||||||||||||
Loans and borrowings | 1 | 1 | (2 | ) | — | (1 | ) | 1 | ||||||||||||||||
Employee benefits | 141 | 92 | 11 | 24 | 152 | 116 | ||||||||||||||||||
Provisions | 133 | 92 | 1 | — | 134 | 92 | ||||||||||||||||||
Other items | 77 | 215 | (51 | ) | (207 | ) | 26 | 8 | ||||||||||||||||
Tax losses carry-forwards | 213 | 137 | — | — | 213 | 137 | ||||||||||||||||||
Tax assets/(liabilities) | 833 | 665 | (1,395 | ) | (890 | ) | (562 | ) | (225 | ) | ||||||||||||||
Set-off of tax | (404 | ) | (104 | ) | 404 | 104 | — | — | ||||||||||||||||
Net tax assets/(liabilities) | 429 | 561 | (991 | ) | (786 | ) | (562 | ) | (225 | ) | ||||||||||||||
The set-off in 2010 was higher compared to 2009 due to the formation of additional tax groups and the effect of the acquisition of FEMSA.
Financial statements | Notes to the consolidated financial statementscontinued
Tax losses carry-forwards
Heineken has losses carry-forwards for an amount of EUR1,833 million as per 31 December 2010 (2009: EUR983 million), which expire in the following years:
In millions of EUR | 2010 | 2009 | ||||||
2010 | — | 11 | ||||||
2011 | 11 | 16 | ||||||
2012 | 8 | 11 | ||||||
2013 | 32 | 18 | ||||||
2014 | 30 | 18 | ||||||
2015 | 32 | — | ||||||
After 2015 respectively 2014 but not unlimited | 314 | 91 | ||||||
Unlimited | 1,406 | 818 | ||||||
| 1,833 | 983 | |||||||
Recognised as deferred tax assets gross | (807 | ) | (479 | ) | ||||
Unrecognised | 1,026 | 504 | ||||||
Movement in deferred tax on temporary differences during the year
In millions of EUR | Balance 1 January 2009 | Changes in consolidation | Effect of movements in foreign exchange | Recognised in income | Recognised in equity | Transfers | Balance 31 December 2009 | |||||||||||||||||||||
Property, plant & equipment | (338 | ) | (3 | ) | 10 | (3 | ) | — | 4 | (330 | ) | |||||||||||||||||
Intangible assets | (281 | ) | (1 | ) | (4 | ) | 49 | — | (32 | ) | (269 | ) | ||||||||||||||||
Investments | (25 | ) | — | (2 | ) | 34 | 2 | — | 9 | |||||||||||||||||||
Inventories | 5 | — | — | 6 | — | — | 11 | |||||||||||||||||||||
Loans and borrowings | 1 | — | — | — | — | — | 1 | |||||||||||||||||||||
Employee benefits | 117 | 1 | 3 | (4 | ) | — | (1 | ) | 116 | |||||||||||||||||||
Provisions | 64 | (4 | ) | (4 | ) | — | — | 36 | 92 | |||||||||||||||||||
Other items | 30 | 1 | (4 | ) | 10 | (4 | ) | (25 | ) | 8 | ||||||||||||||||||
Tax losses carry-forwards | 128 | — | 6 | (10 | ) | — | 13 | 137 | ||||||||||||||||||||
Net tax assets/(liabilities) | (299 | ) | (6 | ) | 5 | 82 | (2 | ) | (5 | ) | (225 | ) | ||||||||||||||||
In millions of EUR | Balance 1 January 2010 | Changes in consolidation | Effect of movements in foreign exchange | Recognised in income | Recognised in equity | Transfers | Balance 31 December 2010 | |||||||||||||||||||||
Property, plant & equipment | (330 | ) | (161 | ) | — | 28 | — | (1 | ) | (464 | ) | |||||||||||||||||
Intangible assets | (269 | ) | (475 | ) | 3 | 17 | — | (3 | ) | (727 | ) | |||||||||||||||||
Investments | 9 | 54 | (3 | ) | 18 | — | — | 78 | ||||||||||||||||||||
Inventories | 11 | (4 | ) | (1 | ) | 20 | — | 1 | 27 | |||||||||||||||||||
Loans and borrowings | 1 | (1 | ) | — | (1 | ) | — | — | (1 | ) | ||||||||||||||||||
Employee benefits | 116 | 53 | (2 | ) | (15 | ) | — | — | 152 | |||||||||||||||||||
Provisions | 92 | 14 | (2 | ) | 30 | — | — | 134 | ||||||||||||||||||||
Other items | 8 | 40 | (2 | ) | 15 | (43 | ) | 8 | 26 | |||||||||||||||||||
Tax losses carry-forwards | 137 | 33 | 5 | 39 | — | (1 | ) | 213 | ||||||||||||||||||||
Net tax assets/(liabilities) | (225 | ) | (447 | ) | (2 | ) | 151 | (43 | ) | 4 | (562 | ) | ||||||||||||||||
Financial statements | Notes to the consolidated financial statementscontinued
19. Inventories
In millions of EUR | 2010 | 2009 | ||||||
Raw materials | 241 | 170 | ||||||
Work in progress | 147 | 132 | ||||||
Finished products | 261 | 140 | ||||||
Goods for resale | 231 | 269 | ||||||
Non-returnable packaging | 120 | 107 | ||||||
Other inventories | 206 | 192 | ||||||
| 1,206 | 1,010 | |||||||
During 2010 and 2009 no write-down of inventories to net realisable value was required.
20. Trade and other receivables
In millions of EUR | Note | 2010 | 2009 | |||||||||
Trade receivables due from associates and joint ventures | 102 | 78 | ||||||||||
Trade receivables | 1,680 | 1,730 | ||||||||||
Other receivables | 481 | 453 | ||||||||||
Derivatives | 10 | 49 | ||||||||||
| 32 | 2,273 | 2,310 | ||||||||||
A net impairment loss of EUR115 million (2009: EUR64 million) in respect of trade and other receivables was included in expenses for raw materials, consumables and services.
21. Cash and cash equivalents
In millions of EUR | Note | 2010 | 2009 | |||||||||
Bank balances | 430 | 482 | ||||||||||
Call deposits | 180 | 38 | ||||||||||
Cash and cash equivalents | 32 | 610 | 520 | |||||||||
Bank overdrafts | 25 | (132 | ) | (156 | ) | |||||||
Cash and cash equivalents in the statement of cash flows | 478 | 364 | ||||||||||
22. Capital and reserves
Share issuance
On 30 April 2010 Heineken N.V. issued 86,028,019 ordinary shares with a nominal value of EUR1.60, as a result of which the issued share capital consists of 576,002,613 shares. To these shares a share premium value was assigned of EUR2,701 million based on the quoted market price value of 43,018,320 shares Heineken Holding N.V. and 43,009,699 shares Heineken N.V. combined being the share consideration paid to Fomento Económico Mexicano, S.A.B. de C.V. (FEMSA) for its beer operations.
Allotted Share Delivery Instrument
In addition to the shares issued to FEMSA, Heineken also committed itself to deliver 29,172,504 additional shares to FEMSA (the ‘Allotted Shares’) over a period of no longer than five years. This financial instrument is classified to be equity as the number of shares is fixed. Heineken N.V. has the option to accelerate the delivery of the Allotted Shares at its discretion. Pending delivery of the Allotted Shares, Heineken N.V. will pay a coupon on each undelivered Allotted Share such that FEMSA will be compensated, on an after tax basis, for dividends FEMSA would have received had all such Allotted Shares been delivered to FEMSA on or prior to the record date for such dividends. During the period of 8 March through 31 December 2010 Heineken N.V. acquired 10,765,258 shares with an average quoted market price of EUR35.85. During the year a total of 10,240,553 shares were delivered to FEMSA under the ASDI.
During 2010, Heineken announced several share buy-back programmes relating to the ASDI. The most recent share buy-back programmes of EUR150 million was announced on 17 November 2010. Heineken has mandated a bank to repurchase Heineken N.V. shares in the open market starting 18 November 2010 up to and including 16 June 2011. Up to 31 December 2010, EUR54 million of this EUR150 million was paid by Heineken for 1,501,690 shares. The remaining outstanding share purchase mandate liability of EUR96 million has been presented as a current liability (see note 31) in accordance with IAS 32.23.
Financial statements | Notes to the consolidated financial statementscontinued
Share capital
| Ordinary shares | ||||||||
In millions of EUR | 2010 | 2009 | ||||||
On issue as at 1 January | 784 | 784 | ||||||
Issued | 138 | — | ||||||
On issue as at 31 December | 922 | 784 | ||||||
As at 31 December 2010 the issued share capital comprised 576,002,613 ordinary shares (2009: 489,974,594). The ordinary shares have a par value of EUR1.60. All issued shares are fully paid.
The Company’s authorised capital amounts to EUR2.5 billion, comprising of 1,562,500,000 shares.
The holders of ordinary shares are entitled to receive dividends as declared from time to time and are entitled to one vote per share at meetings of the Company. In respect of the Company’s shares that are held by Heineken (see next page), rights are suspended.
Translation reserve
The translation reserve comprises foreign currency differences arising from the translation of the financial statements of foreign operations of the Group (excluding amounts attributable to non-controlling interests) as well as value changes of the hedging instruments in the net investment hedges. Heineken considers this a legal reserve.
Hedging reserve
This reserve comprises the effective portion of the cumulative net change in the fair value of cash flow hedging instruments where the hedged transaction has not yet occurred. Heineken considers this a legal reserve.
Fair value reserve
This reserve comprises the cumulative net change in the fair value of available-for-sale investments until the investment is derecognised or impaired. Heineken considers this a legal reserve.
Other legal reserves
These reserves relate to the share of profit of joint ventures and associates over the distribution of which Heineken does not have control. The movement in these reserves reflects retained earnings of joint ventures and associates minus dividends received. In case of a legal or other restriction which causes that retained earnings of subsidiaries cannot be freely distributed, a legal reserve is recognised for the restricted part.
Reserve for own shares
The reserve for the Company’s own shares comprises the cost of the Company’s shares held by Heineken. As at 31 December 2010, Heineken held 1,630,258 of the Company’s shares (2009: 1,251,201), of which 524,705 are ASDI and 1,105,553 are LTIP shares.
The coupon paid on the ASDI in 2010 amounts to EUR7 million.
22. Capital and reserves continued
Dividends
The following dividends were declared and paid by Heineken:
In millions of EUR | 2010 | 2009 | ||||||
Final dividend previous year EUR0.40, respectively EUR0.34 per qualifying ordinary share | 195 | 167 | ||||||
Interim dividend current year EUR0.26, respectively EUR0.25 per qualifying ordinary share | 156 | 122 | ||||||
Total dividend declared and paid | 351 | 289 | ||||||
Heineken’s policy is for an annual dividend payout of 30 – 35 per cent of Net profit BEIA. The interim dividend is fixed at 40 per cent of the total dividend of the previous year.
After the balance sheet date the Executive Board proposed the following dividends. The dividends, taken into account the interim dividends declared and paid, have not been provided for.
In millions of EUR | 2010 | 2009 | ||||||
per qualifying ordinary share EUR0.76 (2009: EUR0.65) | 438 | 318 | ||||||
Financial statements | Notes to the consolidated financial statementscontinued
23. Earnings per share
Basic earnings per share
The calculation of basic earnings per share as at 31 December 2010 is based on the profit attributable to ordinary shareholders of the Company (net profit) of EUR1.436 million (2009: EUR1,018 million) and a weighted average number of ordinary shares – basic outstanding during the year ended 31 December 2010 of 562,234,726 (2009: 488,666,607). Basic earnings per share for the year amounts to EUR2.55 (2009: EUR2.08).
Weighted average number of shares – basic
| 2010 | 2009 | |||||||
Number of shares basic 1 January | 489,974,594 | 489,974,594 | ||||||
Effect of LTIP own shares held | (1,152,409 | ) | (1,307,987 | ) | ||||
Effect of undelivered ASDI shares | 14,726,761 | — | ||||||
Effect of new shares issued | 58,685,780 | — | ||||||
Weighted number of basic shares 31 December | 562,234,726 | 488,666,607 | ||||||
ASDI
Allotted Share Delivery Instrument (ASDI) representing Heineken’s obligation to deliver shares to FEMSA, either through issuance and/or purchasing of its own shares in the open market. EPS is impacted by ASDI as in the formula, calculating EPS, the net profit is divided by the weighted average number of ordinary shares. In this weighted average number of ordinary shares, the weighted average of outstanding ASDI is included. This means that the ASDI leads to a lower basic EPS until all shares have been repurchased.
Diluted earnings per share
The calculation of diluted earnings per share as at 31 December 2010 was based on the profit attributable to ordinary shareholders of the Company (net profit) of EUR1,436 million (2009: EUR1,018 million) and a weighted average number of ordinary shares – basic outstanding after adjustment for the effects of all dilutive potential ordinary shares of 563,387,135 (2009: 489,974,594). Diluted earnings per share for the year amounted to EUR2.55 (2009: EUR2.08).
Weighted average number of shares – diluted
| 2010 | 2009 | |||||||
Weighted number of basic shares 31 December | 562,234,726 | 488,666,607 | ||||||
Effect of LTIP own shares held | 1,152,409 | 1,307,987 | ||||||
Weighted average diluted shares 31 December | 563,387,135 | 489,974,594 | ||||||
Financial statements | Notes to the consolidated financial statementscontinued
24. Income tax on other comprehensive income
In millions of EUR | Amount before tax | Tax | 2010 Amount net of tax | Amount before tax | Tax | 2009 Amount net of tax | ||||||||||||||||||
Other comprehensive income | ||||||||||||||||||||||||
Foreign currency translation differences for foreign operations | 400 | — | 400 | 112 | — | 112 | ||||||||||||||||||
Effective portion of changes in fair value of cash flow hedge | 61 | (18 | ) | 43 | (121 | ) | 31 | (90 | ) | |||||||||||||||
Effective portion of cash flow hedges transferred to profit or loss | 65 | (20 | ) | 45 | 117 | (29 | ) | 88 | ||||||||||||||||
Ineffective portion of cash flow hedges transferred to profit or loss | 9 | — | 9 | — | — | — | ||||||||||||||||||
Net change in fair value available-for-sale investments | 16 | (5 | ) | 11 | 34 | (8 | ) | 26 | ||||||||||||||||
Net change in fair value available-for-sale investments transferred to profit or loss | (17 | ) | — | (17 | ) | (16 | ) | 4 | (12 | ) | ||||||||||||||
Share of other comprehensive income of associates/joint ventures | (29 | ) | — | (29 | ) | 22 | — | 22 | ||||||||||||||||
Total other comprehensive income | 505 | (43 | ) | 462 | 148 | (2 | ) | 146 | ||||||||||||||||
25. Loans and borrowings
This note provides information about the contractual terms of Heineken’s interest-bearing loans and borrowings. For more information about Heineken’s exposure to interest rate risk and foreign currency risk, see note 32.
Non-current liabilities
In millions of EUR | Note | 2010 | 2009 | |||||||||
Secured bank loans | 48 | 179 | ||||||||||
Unsecured bank loans | 3,260 | 2,958 | ||||||||||
Unsecured bond issues | 2,482 | 2,445 | ||||||||||
Finance lease liabilities | 26 | 47 | 89 | |||||||||
Other non-current interest-bearing liabilities | 1,895 | 1,267 | ||||||||||
Non-current interest-bearing liabilities | 7,732 | 6,938 | ||||||||||
Non-current derivatives | 291 | 370 | ||||||||||
Non-current non-interest-bearing liabilities | 55 | 93 | ||||||||||
| 8,078 | 7,401 | |||||||||||
Financial statements | Notes to the consolidated financial statementscontinued
25. Loans and borrowings continued
Current interest-bearing liabilities
In millions of EUR | Note | 2010 | 2009 | |||||||||
Current portion of secured bank loans | 11 | 96 | ||||||||||
Current portion of unsecured bank loans | 346 | 78 | ||||||||||
Current portion of unsecured bond issues | — | 500 | ||||||||||
Current portion of finance lease liabilities | 26 | 48 | 19 | |||||||||
Current portion of other interest-bearing liabilities | 32 | 75 | ||||||||||
Total current portion of non-current interest-bearing liabilities | 437 | 768 | ||||||||||
Deposits from third parties | 425 | 377 | ||||||||||
| 862 | 1,145 | |||||||||||
Bank overdrafts | 21 | 132 | 156 | |||||||||
| 994 | 1,301 | |||||||||||
Net interest-bearing debt position
In millions of EUR | Note | 2010 | 2009 | |||||||||
Non-current interest-bearing liabilities | 7,732 | 6,938 | ||||||||||
Current portion of non-current interest-bearing liabilities | 437 | 768 | ||||||||||
Deposits from third parties | 425 | 377 | ||||||||||
| 8,594 | 8,083 | |||||||||||
Bank overdrafts | 21 | 132 | 156 | |||||||||
| 8,726 | 8,239 | |||||||||||
Cash, cash equivalents and current other investments | (627 | ) | (535 | ) | ||||||||
Net interest-bearing debt position | 8,099 | 7,704 | ||||||||||
Non-current liabilities
In millions of EUR | Secured bank loans | Unsecured bank loans | Unsecured bond issues | Finance lease liabilities | Other non-current interest-bearing liabilities | Non-current derivatives | Non-current non-interest- bearing liabilities | Total | ||||||||||||||||||||||||
Balance as at 1 January 2010 | 179 | 2,958 | 2,445 | 89 | 1,267 | 370 | 93 | 7,401 | ||||||||||||||||||||||||
Consolidation changes | (1 | ) | 880 | — | — | (56 | ) | 24 | 35 | 882 | ||||||||||||||||||||||
Effect of movements in exchange rates | 7 | (9 | ) | 3 | 2 | 85 | (68 | ) | 1 | 21 | ||||||||||||||||||||||
Transfers | (3 | ) | (171 | ) | — | (42 | ) | (1 | ) | 14 | (59 | ) | (262 | ) | ||||||||||||||||||
Charge to/(from) profit or loss i/r derivatives | — | — | — | — | — | (29 | ) | — | (29 | ) | ||||||||||||||||||||||
Charge to/(from) equity i/r derivatives | — | — | — | — | — | (13 | ) | — | (13 | ) | ||||||||||||||||||||||
Proceeds | — | 1,358 | — | — | 572 | (6 | ) | 3 | 1,927 | |||||||||||||||||||||||
Repayments | (134 | ) | (1,702 | ) | — | (4 | ) | (3 | ) | (1 | ) | (13 | ) | (1,857 | ) | |||||||||||||||||
Other | — | (54 | ) | 34 | 2 | 31 | — | (5 | ) | 8 | ||||||||||||||||||||||
Balance as at 31 December 2010 | 48 | 3,260 | 2,482 | 47 | 1,895 | 291 | 55 | 8,078 | ||||||||||||||||||||||||
Financial statements | Notes to the consolidated financial statementscontinued
Terms and debt repayment schedule
Terms and conditions of outstanding non-current and current loans and borrowings were as follows:
In millions of EUR | Category | Currency | Nominal interest rate % | Repayment | Carrying amount 2010 | Face value 2010 | Carrying amount 2009 | Face value 2009 | ||||||||||||||||||||||
| Secured bank loans | Bank facilities | GBP | 1.9 | 2016 | 23 | 23 | 234 | 234 | ||||||||||||||||||||||
| Secured bank loans | Various | various | various | various | 36 | 36 | 41 | 41 | ||||||||||||||||||||||
| Unsecured bank loans | 2008 Syndicated Bank Facility | EUR | 0.7-1.0 | 2013 | 1,708 | 1,709 | 1,700 | 1,709 | ||||||||||||||||||||||
| Unsecured bank loans | Bank Facility | EUR | 0.4-5.0 | 2011-2016 | 434 | 434 | 486 | 486 | ||||||||||||||||||||||
| Unsecured bank loans | German Schuld schein notes | EUR | 1.0-6.0 | 2016 | 111 | 111 | 111 | 111 | ||||||||||||||||||||||
| Unsecured bank loans | German Schuld schein notes | EUR | 1.0-6.0 | 2013 | 102 | 102 | 102 | 102 | ||||||||||||||||||||||
| Unsecured bank loans | German Schuld schein notes | EUR | 1.0-6.0 | 2014 | 207 | 207 | 207 | 207 | ||||||||||||||||||||||
| Unsecured bank loans | 2008 Syndicated Bank Facility | GBP | 0.60 | 2013 | 336 | 340 | 329 | 329 | ||||||||||||||||||||||
| Unsecured bank loans | Bank Facilities | PLN | 3.7 | 2011 | 60 | 60 | 61 | 61 | ||||||||||||||||||||||
| Unsecured bank loans | Bank Facilities | USD | 0.80 | 2011-2013 | 167 | 172 | — | — | ||||||||||||||||||||||
| Unsecured bank loans | Bank Facilities | MXN | 4.5-10.6 | 2011-2014 | 444 | 445 | — | — | ||||||||||||||||||||||
| Unsecured bank loans | Various | various | various | various | 37 | 37 | 40 | 40 | ||||||||||||||||||||||
| Unsecured bond | Issue under EMTN programme | GBP | 7.3 | 2015 | 461 | 465 | 442 | 450 | ||||||||||||||||||||||
| Unsecured bond | Eurobond on Luxembourg Stock Exchange | EUR | 4.3 | 2010 | — | — | 500 | 500 | ||||||||||||||||||||||
| Unsecured bond | Eurobond on Luxembourg Stock Exchange | EUR | 5.0 | 2013 | 599 | 600 | 598 | 600 | ||||||||||||||||||||||
| Unsecured bond | Issue under EMTN programme | EUR | 7.1 | 2014 | 1,009 | 1,000 | 996 | 1,000 | ||||||||||||||||||||||
| Unsecured bond | Issue under EMTN programme | EUR | 4.6 | 2016 | 397 | 400 | 397 | 400 | ||||||||||||||||||||||
| Unsecured bond issues | n/a | various | various | various | 16 | 16 | 12 | 12 | ||||||||||||||||||||||
| Other interest-bearing liabilities | 2010 US private placement | USD | 4.6 | 2018 | 541 | 546 | — | — | ||||||||||||||||||||||
| Other interest-bearing liabilities | 2002 S&N US private placement | USD | 5.4-5.6 | 2012-2014 | 616 | 569 | 557 | 521 | ||||||||||||||||||||||
| Other interest-bearing liabilities | 2005 S&N US private placement | USD | 5.4 | 2015 | 247 | 225 | 221 | 208 | ||||||||||||||||||||||
| Other interest-bearing liabilities | 2008 US private placement | USD | 5.9-6.3 | 2015-2018 | 331 | 333 | 306 | 307 | ||||||||||||||||||||||
| Other interest-bearing liabilities | Private placement | EUR | 2.0 | 2012 | 50 | 50 | 100 | 100 | ||||||||||||||||||||||
| Other interest-bearing liabilities | Various | various | various | various | 142 | 142 | 158 | 158 | ||||||||||||||||||||||
| Deposits from third parties | n/a | various | various | various | 425 | 425 | 377 | 377 | ||||||||||||||||||||||
| Finance lease liabilities | n/a | various | various | various | 95 | 100 | 108 | 108 | ||||||||||||||||||||||
| 8,594 | 8,547 | 8,083 | 8,061 | |||||||||||||||||||||||||||
As at 31 December 2010, no amount was drawn on the existing Revolving Credit Facility of EUR2 billion. This revolving credit facility is expiring in 2012. Interest is based on EURIBOR plus a margin.
Financial statements | Notes to the consolidated financial statementscontinued
25. Loans and borrowings continued
As part of the acquisition of the beer operations of FEMSA, Heineken acquired a net debt position of EUR1,564 million. From this amount loans and borrowings in Mexico and Brazil amount to EUR1,595 million, the remainder is cash (net of bank overdrafts) of EUR31 million. This position largely consisted of bank loans from local financial institutions as well as several loans from FEMSA, the seller of FEMSA. These loans, which amounted to EUR573 million as at 30 April 2010, were repaid in May and June 2010. These loans have been refinanced by drawings under the Revolving Credit Facility of Heineken. As at 31 December 2010 the available headroom (including cash available in the Group cash pool) is approximately EUR2.1 billion, as the Revolving Credit Facility was undrawn.
On 13 August 2010, Heineken N.V. received the funds related to the 8-year private loan notes, which were placed on 7 May 2010 with institutional investors in the United States. The principal amount of the loan notes is USD725 million and the coupon was fixed at 4.6 per cent. The maturity date is 15 August 2018. Heineken has swapped the proceeds into EUR559 million with a fixed coupon of 3.9 per cent.
EMTN Programme
The Euro Medium Term Note Programme (‘EMTN’) was updated and increased to EUR5 billion in September 2010 and is registered on the Luxembourg Stock Exchange. As currently approximately EUR1.9 billion is outstanding, Heineken still has a capacity of EUR3.1 billion under this programme. The programme can be used for issuing up to one year after its latest update.
26. Finance lease liabilities
Finance lease liabilities are payable as follows:
In millions of EUR | Future minimum lease payments 2010 | Interest 2010 | Present value of minimum lease payments 2010 | Future minimum lease payments 2009 | Interest 2009 | Present value of minimum lease payments 2009 | ||||||||||||||||||
Less than one year | 49 | (1 | ) | 48 | 22 | (3 | ) | 19 | ||||||||||||||||
Between one and five years | 39 | (3 | ) | 36 | 76 | (9 | ) | 67 | ||||||||||||||||
More than five years | 13 | (2 | ) | 11 | 23 | (1 | ) | 22 | ||||||||||||||||
| 101 | (6 | ) | 95 | 121 | (13 | ) | 108 | |||||||||||||||||
Financial statements | Notes to the consolidated financial statementscontinued
27. Non-GAAP measures
In the internal management reports Heineken measures its performance primarily based on EBIT and EBIT (beia), these are non-GAAP measures not calculated in accordance with IFRS. A similar non-GAAP adjustment can be made to the IFRS profit or loss as defined in IAS 1 paragraph 7 being the total of income less expense. Exceptional items are defined as items of income and expense of such size, nature or incidence, that in view of management their disclosure is relevant to explain the performance of Heineken for the period. The table below presents the relationship with IFRS terms, the results from operating activities and profit and Heineken non-GAAP measures being EBIT, EBIT (beia) and profit (beia) for the financial year 2010.
In millions of EUR | ||||
Results from operating activities | 2,283 | |||
Share of profit of associates and joint ventures and impairments thereof (net of income tax) | 193 | |||
Heineken EBIT | 2,476 | |||
Exceptional items and amortization included in EBIT | 132 | |||
Heineken EBIT (beia) | 2,608 | |||
Profit attributable to equity holders of the Company | 1,436 | |||
Exceptional items and amortization included in EBIT | 132 | |||
Exceptional items included in finance costs | (5 | ) | ||
Exceptional items included in tax expense | ||||
Heineken net profit beia | ||||
San Pedro Garza GarcíThe exceptional items included in EBIT contain the amortisation of brands and customer relations for EUR142 million. The total book gain on the sale of MBI and GBNC as well as Waverley TBS for EUR199 million. The bankruptcy of a N.L., Mexicolarge on-trade customer in Western Europe resulted in impairments of loans, receivables and guarantees for a total of EUR70 million and Femsa acquisition and integration expense for EUR80 million. The remaining EUR39 million relates to TCM expenses and one-off expenses due to contract terminations.
June 12, 2008Exceptional items in the other net financing costs reflect interest hedges made by Scottish & Newcastle in the past that do not qualify for hedge accounting under IFRS. The tax expense exceptional items are for EUR39 million related to amortisation of brands and customer relations and EUR27 million to the other exceptional items. Tax specific exceptional items are EUR52 million and relate to the finalisation of the Globe transaction as well as various other settlements with the UK tax authorities.
EBIT and EBIT (beia) are not financial measures calculated in accordance with IFRS. The presentation on these financial measures may not be comparable to similarly titled measures reported by other companies due to differences in the ways the measures are calculated.
28. Employee benefits
In millions of EUR | 2010 | 2009 | ||||||
Present value of unfunded obligations | 118 | 198 | ||||||
Present value of funded obligations | 6,525 | 5,738 | ||||||
Total present value of obligations | 6,643 | 5,936 | ||||||
Fair value of plan assets | (5,646 | ) | (4,858 | ) | ||||
Present value of net obligations | 997 | 1,078 | ||||||
Actuarial (losses)/gains not recognised | (411 | ) | (548 | ) | ||||
Recognised liability for defined benefit obligations | 586 | 530 | ||||||
Other long-term employee benefits | 101 | 104 | ||||||
| 687 | 634 | |||||||
Plan assets comprise:
In millions of EUR | 2010 | 2009 | ||||||
Equity securities | 2,484 | 2,195 | ||||||
Government bonds | 2,421 | 2,119 | ||||||
Properties and real estate | 436 | 385 | ||||||
Other plan assets | 305 | 159 | ||||||
| 5,646 | 4,858 | |||||||
Financial statements | Notes to the consolidated financial statementscontinued
F-5628. Employee benefits continued
Liability for defined benefit obligations
Heineken makes contributions to a number of defined benefit plans that provide pension benefits for employees upon retirement in a number of countries being mainly: the Netherlands, the UK, Ireland, Greece, Austria, Italy, France, Spain, Mexico and Nigeria. In other countries the pension plans are defined contribution plans and/or similar arrangements for employees.
Other long-term employee benefits mainly relate to long-term bonus plans, termination benefits and jubilee benefits.
Movements in the present value of the defined benefit obligations
In millions of EUR | 2010 | 2009 | ||||||
Defined benefit obligations as at 1 January | 5,935 | 4,963 | ||||||
Changes in consolidation and reclassification | 286 | (6 | ) | |||||
Effect of movements in exchange rates | 131 | 153 | ||||||
Benefits paid | (298 | ) | (271 | ) | ||||
Employee contributions | 19 | 16 | ||||||
Current service costs and interest on obligation (see below) | 411 | 363 | ||||||
Past service costs | (9 | ) | 12 | |||||
Effect of any curtailment or settlement | (15 | ) | (16 | ) | ||||
Actuarial (gains)/losses | 183 | 722 | ||||||
Defined benefit obligations as at 31 December | 6,643 | 5,936 | ||||||
Movements in the present value of plan assets
In millions of EUR | 2010 | 2009 | ||||||
Fair value of plan assets as at 1 January | 4,858 | 4,231 | ||||||
Changes in consolidation and reclassification | 115 | (5 | ) | |||||
Effect of movements in exchange rates | 127 | 160 | ||||||
Contributions paid into the plan | 226 | 157 | ||||||
Benefits paid | (298 | ) | (255 | ) | ||||
Expected return on plan assets | 298 | 252 | ||||||
Actuarial gains/(losses) | 320 | 318 | ||||||
Fair value of plan assets as at 31 December | 5,646 | 4,858 | ||||||
Actual return on plan assets | 618 | 570 | ||||||
Expense recognised in profit or loss
In millions of EUR | Note | 2010 | 2009 | |||||||||
Current service costs | 77 | 70 | ||||||||||
Interest on obligation | 334 | 293 | ||||||||||
Expected return on plan assets | (298 | ) | (252 | ) | ||||||||
Actuarial gains and losses recognised | 15 | — | ||||||||||
Past service costs | (9 | ) | 12 | |||||||||
Effect of any curtailment or settlement | (15 | ) | (16 | ) | ||||||||
| 10 | 104 | 107 | ||||||||||
Financial statements | Notes to the consolidated financial statementscontinued
Principal actuarial assumptions as at the balance sheet date
The defined benefit plans in the Netherlands and the UK cover 86.8 per cent of the present value of the plan assets (2009: 88.8 per cent) and 81.7 per cent of the present value of the defined benefit obligations (2009: 86.3 per cent) as at 31 December 2010. For the Netherlands and the UK the following actuarial assumptions apply as at 31 December 2010:
| The Netherlands | 2010 | UK 2009 | ||||||||||||||
| 2010 | 2009 | |||||||||||||||
Discount rate as at 31 December | 5.1 | 5.3 | 5.4 | 5.7 | ||||||||||||
Expected return on plan assets as at 1 January | 5.7 | 6.3 | 6.4 | 6.3 | ||||||||||||
Future salary increases | 3 | 3 | 4.6 | 4.8 | ||||||||||||
Future pension increases | 1.5 | 1.5 | 3 | 3 | ||||||||||||
Medical cost trend rate | — | — | 7 | 7 | ||||||||||||
For the other defined benefit plans the following actuarial assumptions apply as per 31 December 2010:
| Other Western, Central and Eastern Europe | The Americas | Africa and the Middle East | Asia Pacific | |||||||||||||||||||||||||||||
| 2010 | 2009 | 2010 | 2009 | 2010 | 2009 | 2010 | 2009 | |||||||||||||||||||||||||
Discount rate as at 31 December | 2.4-5.8 | 3.3-5.6 | 7-7.6 | 5.3-7 | 7-10 | 11 | — | — | ||||||||||||||||||||||||
Expected return on plan assets as at 1 January | 2.9-7.3 | 3.5-6.6 | 6.5-8.2 | 6.5 | — | 11 | — | — | ||||||||||||||||||||||||
Future salary increases | 1-10 | 1.5-3.5 | 3.8-5.5 | 2.5-5.5 | 5-10 | 11 | — | — | ||||||||||||||||||||||||
Future pension increases | 1-2.1 | 1-3 | 2.8-3 | — | — | 11 | — | — | ||||||||||||||||||||||||
Medical cost trend rate | 3.5-4.5 | 3.5-4.5 | 5.1 | 5 | — | 10 | — | — | ||||||||||||||||||||||||
Assumptions regarding future mortality rates are based on published statistics and mortality tables, with a relevant age setback.
The overall expected long-term rate of return on assets is 6 per cent (2009: 6.1 per cent), which is based on the asset mix and the expected rate of return on each major asset class, as managed by the pension funds.
Assumed healthcare cost trend rates have no effect on the amounts recognised in profit or loss. A one percentage point change in assumed healthcare cost trend rates would not have any effect on profit or loss neither on the statement of financial position as at 31 December 2010.
Based on the most recent triannial review finalised in early 2010, Heineken has agreed a 12-year plan aimed at funding the recovery of the Scottish & Newcastle pension fund through additional Company contributions. These could total GBP504 million of which GBP35 million was paid during 2010. As at 31 December 2010 the IAS 19 present value of the net obligations of the Scottish & Newcastle pension fund represents a GBP409 million (EUR475 million) deficit. The next review of the funding position and the recovery plan will take place no later than around year-end 2012.
The Group expects the 2011 contributions to be paid for the defined benefit plans to be in line with 2010, excluding the additional GBP35 million additional payment made to the UK pension fund in 2010.
Historical information
In millions of EUR | 2010 | 2009 | 2008 | 2007 | 2006 | |||||||||||||||
Present value of the defined benefit obligation | 6,643 | 5,936 | 4,963 | 2,858 | 2,984 | |||||||||||||||
Fair value of plan assets | (5,646 | ) | (4,858 | ) | (4,231 | ) | (2,535 | ) | (2,397 | ) | ||||||||||
Deficit in the plan | 997 | 1,078 | 732 | 323 | 587 | |||||||||||||||
Experience adjustments arising on plan liabilities, losses/(gains) | (24 | ) | (116 | ) | 71 | (4 | ) | (159 | ) | |||||||||||
Experience adjustments arising on plan assets, (losses)/gains | 320 | 313 | (817 | ) | 16 | 9 | ||||||||||||||
Financial statements | Notes to the consolidated financial statementscontinued
29. Share-based payments – Long-Term Incentive Plan
As from 1 January 2005 Heineken established a performance-based share plan (Long-Term Incentive Plan; LTIP) for the Executive Board. As from 1 January 2006 a similar LTIP was established for senior management.
The LTIP 2008 – 2010 and 2009 – 2011 for the Executive Board includes share rights, which are conditionally awarded to the Executive Board each year and are subject to Heineken’s Relative Total Shareholder Return (RTSR) performance in comparison with the TSR performance of a selected peer group.
The LTIP share rights conditionally awarded to senior management each year in the 2008 – 2010 plan and the 2009 – 2011 plan are for 25 per cent subject to Heineken’s RTSR performance and for 75 per cent subject to internal performance conditions.
The LTIP share rights conditioning awarded to senior management and the Executive Board for the 2010 – 2012 plan are fully subject to internal performance conditions.
These performance conditionally are Organic Gross Profit beia growth, Organic EBIT beia growth, Earnings Per Share (EPS) beia growth and Free Operating Cash Flow.
At target performance, 100 per cent of the shares will vest. At maximum performance 150 per cent of the shares will vest.
The performance period for share rights granted in 2008 is from 1 January 2008 to 31 December 2010. The performance period for share rights granted in 2009 was from 1 January 2009 to 31 December 2011. The performance period for share rights granted in 2010 is from 1 January 2010 to 31 December 2012.
The vesting date for the Executive Board is within five business days, and for senior management the latest of 1 April and 20 business days, after the publication of the annual results of 2009, 2010, 2011 and 2012 respectively.
As Heineken will withhold the tax related to vesting on behalf of the individual employees, the number of Heineken N.V. shares to be received by the Executive Board and senior management will be a net number.
The terms and conditions of the share rights granted are as follows:
Grant date/employees entitled | Number* | Based on share price | Vesting conditions | Contractual life of rights | ||||||||||
Share rights granted to Executive Board in 2008 | 26,288 | 44.22 | Continued service and RTSR performance | 3 years | ||||||||||
Share rights granted to senior management in 2008 | 263,958 | 44.22 | Continued service, 75% internal performance conditions and 25% RTSR performance | 3 years | ||||||||||
Share rights granted to Executive Board in 2009 | 53,083 | 21.90 | Continued service and RTSR performance | 3 years | ||||||||||
Share rights granted to senior management in 2009 | 562,862 | 21.90 | Continued service, 75% internal performance conditions and 25% RTSR performance | 3 years | ||||||||||
Share rights granted to Executive Board in 2010 | 55,229 | 33.27 | Continued service, 100% internal performance conditions | 3 years | ||||||||||
Share rights granted to senior management in 2010 | 516,765 | 33.27 | Continued service, 100% internal performance conditions | 3 years | ||||||||||
| 1,478,185 | ||||||||||||||
| * | The number of shares is based on target performance. |
Based on RTSR and internal performance, it is expected that approximately 218,903 shares will vest in 2011 for senior management. No vesting occurred for the Executive Board. The expenses relating to these expected additional grants are recognised in profit or loss during the performance period.
Financial statements | Notes to the consolidated financial statementscontinued
The number and weighted average share price per share is as follows:
| Weighted average share price 2010 | Number of share rights 2010 | Weighted average share price 2009 | Number of share rights 2009 | |||||||||||||
Outstanding as at 1 January | 31.17 | 1,153,748 | 37.48 | 905,537 | ||||||||||||
Granted during the year | 33.44 | 571,994 | 21.90 | 615,945 | ||||||||||||
Forfeited during the year | (102,510 | ) | — | (74,813 | ) | |||||||||||
Vested during the year | (262,048 | ) | — | (292,921 | ) | |||||||||||
Outstanding as at 31 December | 30.70 | 1,361,184 | 31.17 | 1,153,748 | ||||||||||||
The 262,048 (gross) shares vested in 2010 are related to the 2007 – 2009 LTIP of senior management. No vesting occurred under the 2007 – 2009 LTIP of the Executive Board.
The fair value of services received in return for share rights granted is based on the fair value of shares granted, measured using the Monte Carlo model, with following inputs:
In EUR | Executive Board 2009 | Senior management 2009 | ||||||
Fair value at grant date | 512,359 | 8,478,659 | ||||||
Expected volatility | 22.8 | % | 22.8 | % | ||||
Expected dividends | 2.1 | % | 2.1 | % | ||||
Personnel expenses
In millions of EUR | Note | 2010 | 2009 | |||||||||
Share rights granted in 2007 | — | 3 | ||||||||||
Share rights granted in 2008 | 3 | 3 | ||||||||||
Share rights granted in 2009 | 5 | 4 | ||||||||||
Share rights granted in 2010 | 7 | — | ||||||||||
Total expense recognised as personnel expenses | 10 | 15 | 10 | |||||||||
In the 2010 LTIP expense an amount of EUR0.5 million is included for some extraordinary grants that only have a service condition and vest between 1 and 5 years. Total granted shares amount to 32,132 shares.
Financial statements | Notes to the consolidated financial statementscontinued
30. Provisions
In millions of EUR | Note | Restructuring | Onerous contracts | Other | Total | |||||||||||||||
Balance as at 1 January 2010 | 171 | 55 | 292 | 518 | ||||||||||||||||
Changes in consolidation | 6 | (2 | ) | (4 | ) | 154 | 148 | |||||||||||||
Provisions made during the year | 50 | 48 | 132 | 230 | ||||||||||||||||
Provisions used during the year | (87 | ) | (38 | ) | (116 | ) | (241 | ) | ||||||||||||
Provisions reversed during the year | (23 | ) | (9 | ) | (50 | ) | (82 | ) | ||||||||||||
Effect of movements in exchange rates | 2 | 2 | 12 | 16 | ||||||||||||||||
Unwinding of discounts | 1 | 1 | 7 | 9 | ||||||||||||||||
Balance as at 31 December 2010 | 112 | 55 | 431 | 598 | ||||||||||||||||
Non-current | 59 | 40 | 376 | 475 | ||||||||||||||||
Current | 53 | 15 | 55 | 123 | ||||||||||||||||
| 112 | 55 | 431 | 598 | |||||||||||||||||
Restructuring
The provision for restructuring of EUR112 million mainly relates to restructuring programmes in Spain, the Netherlands and the UK.
Other provisions
Included are, amongst others, surety and guarantees provided EUR56 million (2009: EUR61 million), litigations and claims EUR230 million (2009: EUR50 million) and environmental provisions EUR4 million (2009: EUR8 million).
31. Trade and other payables
In millions of EUR | Note | 2010 | 2009 | |||||||||
Trade payables | 1,660 | 1,361 | ||||||||||
Returnable packaging deposits | 434 | 408 | ||||||||||
Taxation and social security contributions | 652 | 551 | ||||||||||
Dividend | 53 | 24 | ||||||||||
Interest | 97 | 134 | ||||||||||
Derivatives | 66 | 94 | ||||||||||
Share purchase mandate | 96 | — | ||||||||||
Other payables | 298 | 233 | ||||||||||
Accruals and deferred income | 909 | 891 | ||||||||||
| 32 | 4,265 | 3,696 | ||||||||||
Financial statements | Notes to the consolidated financial statementscontinued
32. Financial risk management and financial instruments
Overview
Heineken has exposure to the following risks from its use of financial instruments, as they arise in the normal course of Heineken’s business:
Credit risk
Liquidity risk
Market risk.
This note presents information about Heineken’s exposure to each of the above risks, and it summarises Heineken’s policies and processes that are in place for measuring and managing risk, including those related to capital management. Further quantitative disclosures are included throughout these consolidated financial statements.
Risk management framework
The Executive Board, under the supervision of the Supervisory Board, has overall responsibility and sets rules for Heineken’s risk management and control systems. They are reviewed regularly to reflect changes in market conditions and the Group’s activities. The Executive Board oversees the adequacy and functioning of the entire system of risk management and internal control, assisted by Group departments.
The Global Treasury function focuses primarily on the management of financial risk and financial resources. Some of the risk management strategies include the use of derivatives, primarily in the form of spot and forward exchange contracts and interest rate swaps, but options can be used as well. It is the Group policy that no speculative transactions are entered into.
Credit risk
Credit risk is the risk of financial loss to Heineken if a customer or counterparty to a financial instrument fails to meet its contractual obligations, and arises principally from Heineken’s receivables from customers and investment securities.
The economic crisis has impacted our regular business activities and performance, in particular in consumer spending and solvency. However, the business impact differed across the regions and operations. Local management has assessed the risk exposure following Group instructions and is taking action to mitigate the higher than usual risks. Intensified and continuous focus is being given in the areas of customers (managing trade receivables and loans) and suppliers (financial position of critical suppliers).
As at the balance sheet date there were no significant concentrations of credit risk. The maximum exposure to credit risk is represented by the carrying amount of each financial instrument, including derivative financial instruments, in the consolidated statement of financial position.
Loans to customers
Heineken’s exposure to credit risk is mainly influenced by the individual characteristics of each customer.
Heineken’s held-to-maturity investments includes loans to customers, issued based on a loan contract.
Loans to customers are ideally secured by, amongst others, rights on property or intangible assets, such as the right to take possession of the premises of the customer. Interest rates calculated by Heineken are at least based on the risk-free rate plus a margin, which takes into account the risk profile of the customer and value of security given.
Heineken establishes an allowance for impairment of loans that represents its estimate of incurred losses. The main components of this allowance are a specific loss component that relates to individually significant exposures, and a collective loss component established for groups of similar customers in respect of losses that have been incurred but not yet identified. The collective loss allowance is determined based on historical data of payment statistics.
In a few countries the issue of new loans is outsourced to third parties. In most cases, Heineken issues sureties (guarantees) to the third party for the risk of default of the customer. Heineken in return receives a fee.
Financial statements | Notes to the consolidated financial statementscontinued
32. Financial risk management and financial instruments continued
Trade and other receivables
Heineken’s local management has credit policies in place and the exposure to credit risk is monitored on an ongoing basis. Under the credit policies all customers requiring credit over a certain amount are reviewed and new customers are analysed individually for creditworthiness before Heineken’s standard payment and delivery terms and conditions are offered. Heineken’s review includes external ratings, where available, and in some cases bank references. Purchase limits are established for each customer and these limits are reviewed regularly. As a result of the deteriorating economic circumstances in 2008 and 2009, certain purchase limits have been redefined. Customers that fail to meet Heineken’s benchmark creditworthiness may transact with Heineken only on a prepayment basis.
In monitoring customer credit risk, customers are, on a country base, grouped according to their credit characteristics, including whether they are an individual or legal entity, which type of distribution channel they represent, geographic location, industry, ageing profile, maturity and existence of previous financial difficulties. Customers that are graded as ‘high risk’ are placed on a restricted customer list, and future sales are made on a prepayment basis only with approval of Management.
Heineken has multiple distribution models to deliver goods to end customers. Deliveries are done in some countries via own wholesalers, in other markets directly and in some others via third parties. As such distribution models are country specific and on consolidated level diverse, as such the results and the balance sheet items cannot be split between types of customers on a consolidated basis. The various distribution models are also not centrally managed or monitored.
Heineken establishes an allowance for impairment that represents its estimate of incurred losses in respect of trade and other receivables and investments. The components of this allowance are a specific loss component and a collective loss component.
Advances to customers
Advances to customers relate to an upfront cash-discount to customers, for which the amortised amounts are deducted from the revenue on a straight-line basis.
In monitoring customer credit risk, refer to the paragraph above relating to trade and other receivables.
Investments
Heineken limits its exposure to credit risk by only investing available cash balances in liquid securities and only with counterparties that have a credit rating of at least single A or equivalent for short-term transactions and AA- for long-term transactions. Heineken actively monitors these credit ratings.
Guarantees
Heineken’s policy is to avoid issuing guarantees where possible unless this leads to substantial savings for the Group. In cases where Heineken does provide guarantees, such as to banks for loans (to third parties), Heineken aims to receive security from the third party.
Heineken N.V. has issued a joint and several liability statement to the provisions of Section 403, Part 9, Book 2 of the Dutch Civil Code with respect to legal entities established in the Netherlands.
Financial statements | Notes to the consolidated financial statementscontinued
Exposure to credit risk
The carrying amount of financial assets represents the maximum credit exposure. The maximum exposure to credit risk at the reporting date was:
In millions of EUR | Note | 2010 | 2009 | |||||||||
Loans | 17 | 455 | 329 | |||||||||
Indemnification receivable | 17 | 145 | — | |||||||||
Other long term receivables | 17 | 174 | — | |||||||||
Held-to-maturity investments | 17 | 4 | 4 | |||||||||
Available-for-sale investments | 17 | 190 | 219 | |||||||||
Non-current derivatives | 17 | 135 | 16 | |||||||||
Investments held for trading | 17 | 17 | 15 | |||||||||
Trade and other receivables, excluding derivatives | 20 | 2,263 | 2,261 | |||||||||
Current derivatives | 20 | 10 | 49 | |||||||||
Cash and cash equivalents | 21 | 610 | 520 | |||||||||
| 4,003 | 3,413 | |||||||||||
The maximum exposure to credit risk for trade and other receivables (excluding derivatives) at the reporting date by geographic region was:
In millions of EUR | 2010 | 2009 | ||||||
Western Europe | 997 | 1,256 | ||||||
Central and Eastern Europe | 458 | 554 | ||||||
The Americas | 497 | 134 | ||||||
Africa and the Middle East | 151 | 131 | ||||||
Asia Pacific | 19 | 32 | ||||||
Head Office/eliminations | 141 | 154 | ||||||
| 2,263 | 2,261 | |||||||
Impairment losses
The ageing of trade and other receivables (excluding derivatives) at the reporting date was:
In millions of EUR | Gross 2010 | Impairment 2010 | Gross 2009 | Impairment 2009 | ||||||||||||
Not past due | 1,894 | (49 | ) | 1,895 | (34 | ) | ||||||||||
Past due 0 – 30 days | 250 | (21 | ) | 202 | (26 | ) | ||||||||||
Past due 31 – 120 days | 271 | (106 | ) | 198 | (67 | ) | ||||||||||
More than 120 days | 250 | (226 | ) | 300 | (207 | ) | ||||||||||
| 2,665 | (402 | ) | 2,595 | (334 | ) | |||||||||||
Financial statements | Notes to the consolidated financial statementscontinued
32. Financial risk management and financial instruments continued
The movement in the allowance for impairment in respect of trade and other receivables (excluding derivatives) during the year was as follows:
In millions of EUR | 2010 | 2009 | ||||||
Balance as at 1 January | 334 | 280 | ||||||
Changes in consolidation | — | 1 | ||||||
Impairment loss recognised | 168 | 109 | ||||||
Allowance used | (52 | ) | (26 | ) | ||||
Allowance released | (53 | ) | (45 | ) | ||||
Effect of movements in exchange rates | 5 | 15 | ||||||
Balance as at 31 December | 402 | 334 | ||||||
The movement in the allowance for impairment in respect of loans during the year was as follows:
In millions of EUR | 2010 | 2009 | ||||||
Balance as at 1 January | 185 | 177 | ||||||
Changes in consolidation | (8 | ) | — | |||||
Impairment loss recognised | 37 | 48 | ||||||
Allowance used | (23 | ) | (27 | ) | ||||
Allowance released | (2 | ) | (9 | ) | ||||
Effect of movements in exchange rates | 2 | (4 | ) | |||||
Balance as at 31 December | 191 | 185 | ||||||
Impairment losses recognised for trade and other receivables (excluding derivatives) and loans are part of the other non-cash items in the consolidated statement of cash flows.
The income statement impact of EUR35 million (2009: EUR39 million) in respect of loans and the income statement impact of EUR115 million (2009: EUR64 million) in respect of trade receivables (excluding derivatives) were included in expenses for raw materials, consumables and services.
The allowance accounts in respect of trade and other receivables and held-to-maturity investments are used to record impairment losses, unless Heineken is satisfied that no recovery of the amount owing is possible, at that point the amount considered irrecoverable is written off against the financial asset.
Liquidity risk
Liquidity risk is the risk that Heineken will encounter difficulty in meeting the obligations associated with its financial liabilities that are settled by delivering cash or another financial asset. Heineken’s approach to managing liquidity is to ensure, as far as possible, that it will always have sufficient liquidity to meet its liabilities when due, under both normal and stressed conditions, without incurring unacceptable losses or risking damage to Heineken’s reputation.
Recent times have proven the credit markets situation could be such that it is difficult to generate capital to finance long-term growth of the Company. Although currently the situation is more stable, the Company has a clear focus on ensuring sufficient access to capital markets to finance long-term growth and to refinance maturing debt obligations. Financing strategies are under continuous evaluation. In addition, the Company focuses on a further fine-tuning of the maturity profile of its long-term debts with its forecasted operating cash flows. Strong cost and cash management and controls over investment proposals are in place to ensure effective and efficient allocation of financial resources.
Financial statements | Notes to the consolidated financial statementscontinued
Contractual maturities
The following are the contractual maturities of non-derivative financial liabilities and derivative financial assets and liabilities, including interest payments and excluding the impact of netting agreements:
In millions of EUR | Carrying amount | Contractual cash flows | 6 months or less | 6-12 months | 1-2 years | 2-5 years | 2010 More than 5 years | |||||||||||||||||||||
Financial liabilities | ||||||||||||||||||||||||||||
Secured bank loans | 59 | (64 | ) | (5 | ) | (7 | ) | (16 | ) | (34 | ) | (2 | ) | |||||||||||||||
Unsecured bank loans | 3,606 | (3,788 | ) | (228 | ) | (174 | ) | (387 | ) | (2,670 | ) | (329 | ) | |||||||||||||||
Unsecured bond issues | 2,482 | (3,135 | ) | (105 | ) | (49 | ) | (153 | ) | (2,410 | ) | (419 | ) | |||||||||||||||
Finance lease liabilities | 95 | (104 | ) | (47 | ) | (6 | ) | (8 | ) | (29 | ) | (12 | ) | |||||||||||||||
Other interest-bearing liabilities | 1,927 | (2,420 | ) | (62 | ) | (70 | ) | (266 | ) | (944 | ) | (1,078 | ) | |||||||||||||||
Non-interest-bearing liabilities | 55 | (58 | ) | (37 | ) | (1 | ) | (7 | ) | (11 | ) | (2 | ) | |||||||||||||||
Deposits from third parties | 425 | (425 | ) | (422 | ) | (3 | ) | — | — | — | ||||||||||||||||||
Bank overdrafts | 132 | (137 | ) | (90 | ) | (48 | ) | — | — | — | ||||||||||||||||||
Trade and other payables, excluding interest, dividends and derivatives | 4,049 | (4,073 | ) | (3,668 | ) | (405 | ) | — | — | — | ||||||||||||||||||
Derivative financial (assets) and liabilities | ||||||||||||||||||||||||||||
Interest rate swaps used for hedge accounting | ||||||||||||||||||||||||||||
Inflow | (121 | ) | 2,911 | 107 | 52 | 266 | 1,484 | 1,002 | ||||||||||||||||||||
Outflow | 244 | (2,998 | ) | (96 | ) | (88 | ) | (297 | ) | (1,562 | ) | (955 | ) | |||||||||||||||
Forward exchange contracts used for hedge accounting: | ||||||||||||||||||||||||||||
Inflow | (11 | ) | 1,411 | 542 | 580 | 288 | — | — | ||||||||||||||||||||
Outflow | 18 | (1,427 | ) | (567 | ) | (575 | ) | (284 | ) | — | — | |||||||||||||||||
Commodity swaps contracts used for hedge accounting | ||||||||||||||||||||||||||||
Inflow | (26 | ) | 26 | 7 | 1 | 18 | 1 | — | ||||||||||||||||||||
Outflow | 33 | (33 | ) | (7 | ) | (8 | ) | (15 | ) | (3 | ) | — | ||||||||||||||||
Other derivatives not used for hedge accounting, net | 75 | (121 | ) | (52 | ) | (26 | ) | (15 | ) | (29 | ) | — | ||||||||||||||||
| 13,042 | (14,435 | ) | (4,730 | ) | (827 | ) | (876 | ) | (6,207 | ) | (1,795 | ) | ||||||||||||||||
Financial statements | Notes to the consolidated financial statementscontinued
32. Financial risk management and financial instruments continued
The total carrying amount and contractual cash flows of derivatives are included in trade and other receivables (note 20) and trade and other payables (note 31) and non-current non-interest bearing liabilities (note 25).
In millions of EUR | Carrying amount | Contractual cash flows | 6 months or less | 6-12 months | 1-2 years | 2-5 years | 2009 More than 5 years | |||||||||||||||||||||
Financial liabilities | ||||||||||||||||||||||||||||
Secured bank loans | 275 | (304 | ) | (13 | ) | (16 | ) | (89 | ) | (153 | ) | (33 | ) | |||||||||||||||
Unsecured bank loans | 3,036 | (3,249 | ) | (96 | ) | (170 | ) | (1,375 | ) | (1,263 | ) | (345 | ) | |||||||||||||||
Unsecured bond issues | 2,945 | (3,786 | ) | (626 | ) | (49 | ) | (152 | ) | (2,032 | ) | (927 | ) | |||||||||||||||
Finance lease liabilities | 108 | (114 | ) | (10 | ) | (9 | ) | (15 | ) | (49 | ) | (31 | ) | |||||||||||||||
Other interest-bearing liabilities | 1,342 | (1,690 | ) | (91 | ) | (54 | ) | (67 | ) | (803 | ) | (675 | ) | |||||||||||||||
Non-interest-bearing liabilities | 93 | (120 | ) | (20 | ) | (23 | ) | (31 | ) | (45 | ) | (1 | ) | |||||||||||||||
Deposits from third parties | 377 | (377 | ) | (368 | ) | (9 | ) | — | — | — | ||||||||||||||||||
Bank overdrafts | 156 | (156 | ) | (156 | ) | — | — | — | — | |||||||||||||||||||
Trade and other payables, excluding interest, dividends and derivatives | 3,444 | (3,444 | ) | (3,278 | ) | (166 | ) | — | — | — | ||||||||||||||||||
Derivative financial (assets) and liabilities | ||||||||||||||||||||||||||||
Interest rate swaps used for hedge accounting | ||||||||||||||||||||||||||||
Inflow | (17 | ) | 1,490 | 43 | 36 | 88 | 732 | 591 | ||||||||||||||||||||
Outflow | 438 | (1,819 | ) | (74 | ) | (89 | ) | (102 | ) | (965 | ) | (589 | ) | |||||||||||||||
Forward exchange contracts used for hedge accounting: | ||||||||||||||||||||||||||||
Inflow | (48 | ) | 1,015 | 615 | 282 | 118 | — | — | ||||||||||||||||||||
Outflow | 26 | (996 | ) | (608 | ) | (268 | ) | (120 | ) | — | — | |||||||||||||||||
| 12,175 | (13,550 | ) | (4,682 | ) | (535 | ) | (1,745 | ) | (4,578 | ) | (2,010 | ) | ||||||||||||||||
The total carrying amount and contractual cash flows of derivatives are included in trade and other receivables (note 20), other investments (note 17), trade and other payables (note 31) and non-current non-interest bearing liabilities (note 25).
Market risk
Market risk is the risk that changes in market prices, such as foreign exchange rates, interest rates, commodity prices and equity prices will affect Heineken’s income or the value of its holdings of financial instruments. The objective of market risk management is to manage and control market risk exposures within acceptable parameters, whilst optimising the return on risk.
Heineken uses derivatives in the ordinary course of business, and also incurs financial liabilities, in order to manage market risks. Generally, Heineken seeks to apply hedge accounting or make use of natural hedges in order to minimise the effects of foreign currency fluctuations in profit or loss.
Derivatives that can be used are interest rate swaps, forward rate agreements, caps and floors, commodity swaps, spot and forward exchange contracts and options. Transactions are entered into with a limited number of counterparties with strong credit ratings. Foreign currency, interest rate and commodity hedging operations are governed by internal policies and rules approved and monitored by the Executive Board.
Foreign currency risk
Heineken is exposed to foreign currency risk on sales, purchases and borrowings that are denominated in a currency other than the respective functional currencies of Heineken entities. The main currencies that give rise to this risk are the US dollar and British pound.
In managing foreign currency risk, Heineken aims to reduce the impact of short-term fluctuations on earnings. Over the longer term, however, permanent changes in foreign exchange rates would have an impact on profit.
Financial statements | Notes to the consolidated financial statementscontinued
Heineken hedges up to 90 per cent of its mainly intra-Heineken US dollar cash flows on the basis of rolling cash flow forecasts in respect to forecasted sales and purchases. Cash flows in other foreign currencies are also hedged on the basis of rolling cash flow forecasts. Heineken mainly uses forward exchange contracts to hedge its foreign currency risk. The majority of the forward exchange contracts have maturities of less than one year after the balance sheet date.
The Company has a clear policy on hedging transactional exchange risks, which postpones the impact on financial results. Translation exchange risks are hedged to a limited extent, as the underlying currency positions are generally considered to be long-term in nature. The result of the net investment hedging is recognised in the translation reserve as can be seen in the consolidated statement of comprehensive income.
It is Heineken’s policy to provide intra-Heineken financing in the functional currency of subsidiaries where possible to prevent foreign currency exposure on subsidiary level. The resulting exposure at Group level is hedged by means of forward exchange contracts. Intra-Heineken financing in foreign currencies is mainly in British pounds, US dollars, Russian rubles and Polish zloty. In some cases Heineken elects to treat intra-Heineken financing with a permanent character as equity and does not hedge the foreign currency exposure.
The principal amounts of Heineken’s British pound, Polish zloty, Mexican peso and Egyptian pound bank loans and bond issues are used to hedge local operations, which generate cash flows that have the same respective functional currencies. Corresponding interest on these borrowings is also denominated in currencies that match the cash flows generated by the underlying operations of Heineken. This provides an economic hedge without derivatives being entered into.
In respect of other monetary assets and liabilities denominated in currencies other than the functional currencies of the Company and the various foreign operations, Heineken ensures that its net exposure is kept to an acceptable level by buying or selling foreign currencies at spot rates when necessary to address short-term imbalances.
Exposure to foreign currency risk
Heineken’s transactional exposure to the British pound, US dollar and euro was as follows based on notional amounts. The euro column relates to transactional exposure to the euro within subsidiaries which are reporting in other currencies.
In millions | EUR | GBP | 2010 USD | EUR | GBP | 2009 USD | ||||||||||||||||||
Loans and held-to-maturity investments | — | — | — | — | — | — | ||||||||||||||||||
Trade and other receivables | 11 | — | 6 | 25 | — | 7 | ||||||||||||||||||
Cash and cash equivalents | 40 | — | 6 | 46 | — | 2 | ||||||||||||||||||
Secured bank loans | — | — | — | — | — | (1 | ) | |||||||||||||||||
Unsecured bank loans | — | (349 | ) | — | — | (57 | ) | — | ||||||||||||||||
Unsecured bond issues | — | (397 | ) | — | — | (400 | ) | — | ||||||||||||||||
Other interest-bearing liabilities | (50 | ) | — | (2,217 | ) | (100 | ) | — | (1,492 | ) | ||||||||||||||
Non-interest-bearing liabilities | — | — | — | (10 | ) | — | (1 | ) | ||||||||||||||||
Bank overdrafts | (4 | ) | — | — | (63 | ) | — | (2 | ) | |||||||||||||||
Trade and other payables | (46 | ) | — | (2 | ) | (88 | ) | — | (26 | ) | ||||||||||||||
Gross balance sheet exposure | (49 | ) | (746 | ) | (2,207 | ) | (190 | ) | (457 | ) | (1,513 | ) | ||||||||||||
Estimated forecast sales next year | 129 | 1 | 947 | 140 | 1 | 885 | ||||||||||||||||||
Estimated forecast purchases next year | (463 | ) | (1 | ) | (539 | ) | (402 | ) | (1 | ) | (88 | ) | ||||||||||||
Gross exposure | (383 | ) | (746 | ) | (1,799 | ) | (452 | ) | (457 | ) | (716 | ) | ||||||||||||
Cash flow hedge accounting forward exchange contracts | 73 | 395 | 392 | 61 | 427 | (375 | ) | |||||||||||||||||
Other hedge accounting forward exchange contracts | (988 | ) | 1 | 1,056 | (945 | ) | — | 1,061 | ||||||||||||||||
Net exposure | (1,298 | ) | (350 | ) | (351 | ) | (1,336 | ) | (30 | ) | (30 | ) | ||||||||||||
Including in the US dollar amounts are intra-Heineken cash flows. Within the other hedge accounting forward exchange contracts, the cross-currency interest rate swaps of Heineken UK forms the largest component.
Financial statements | Notes to the consolidated financial statementscontinued
32. Financial risk management and financial instruments continued
The following significant exchange rates applied during the year:
In EUR | 2010 | Average rate 2009 | 2010 | Year-end rate 2009 | ||||||||||||
GBP | 1.1657 | 1.1224 | 1.1618 | 1.1260 | ||||||||||||
USD | 0.7543 | 0.7170 | 0.7484 | 0.6942 | ||||||||||||
Sensitivity analysis
A 10 per cent strengthening of the euro against the British pound and US dollar or in case of the euro a strengthening of the euro against all other currencies as at 31 December would have increased (decreased) equity and profit by the amounts shown below. This analysis assumes that all other variables, in particular interest rates, remain constant. The analysis is performed on the same basis for 2009.
In millions of EUR | 31 December | 2010 | Equity 2009 | 2010 | Profit or loss 2009 | |||||||||||||||
EUR | (5 | ) | 1 | — | (3 | ) | ||||||||||||||
GBP | — | 2 | (1 | ) | 2 | |||||||||||||||
USD | 38 | 39 | — | — | ||||||||||||||||
A 10 per cent weakening of the euro against the British pound and US dollar or in case of the euro a weakening of the euro against all other currencies as at 31 December would have had the equal but opposite effect on the basis that all other variables remain constant.
Interest rate risk
In managing interest rate risk, Heineken aims to reduce the impact of short-term fluctuations on earnings. Over the longer term, however, permanent changes in interest rates would have an impact on profit.
Heineken opts for a mix of fixed and variable interest rates in its financing operations, combined with the use of interest rate instruments. Currently Heineken’s interest rate position is more weighted towards fixed rather than floating. Interest rate instruments that can be used are interest rate swaps, forward rate agreements, caps and floors.
Swap maturity follows the maturity of the related loans and borrowings and have swap rates for the fixed leg ranging from 2.0 to 8.8 per cent (2009: from 2.0 to 7.3 per cent).
Interest rate risk – Profile
At the reporting date the interest rate profile of Heineken’s interest-bearing financial instruments was as follows:
In millions of EUR | 2010 | 2009 | ||||||
Fixed rate instruments | ||||||||
Financial assets | 84 | 157 | ||||||
Financial liabilities | (5,275 | ) | (4,664 | ) | ||||
Interest rate swaps floating to fixed | (456 | ) | (2,505 | ) | ||||
| (5,647 | ) | (7,012 | ) | |||||
Variable rate instruments | ||||||||
Financial assets | 633 | 88 | ||||||
Financial liabilities | (2,786 | ) | (2,947 | ) | ||||
Interest rate swaps fixed to floating | 456 | 2,505 | ||||||
| (1,697 | ) | (354 | ) | |||||
Financial statements | Notes to the consolidated financial statementscontinued
Fair value sensitivity analysis for fixed rate instruments
During 2010, Heineken opted to apply fair value hedge accounting on certain fixed rate financial liabilities. The fair value movements on these instruments are recognised in profit or loss. The change in fair value on these instruments was EUR (67) million in 2010 (2009: EUR73 million), which was offset by the change in fair value of the hedge accounting instruments, which was EUR70 million (2009: EUR(73) million).
A change of 100 basis points in interest rates at the reporting date would have increased (decreased) equity and profit or loss by the amounts shown below (after tax).
In millions of EUR | 100 bp increase | Profit or loss 100 bp decrease | 100 bp increase | Equity 100 bp decrease | ||||||||||||
31 December 2010 | ||||||||||||||||
Instruments designated at fair value | 39 | (40 | ) | 40 | (40 | ) | ||||||||||
Interest rate swaps | (25 | ) | 27 | (4 | ) | 5 | ||||||||||
Fair value sensitivity (net) | 14 | (13 | ) | 36 | (35 | ) | ||||||||||
31 December 2009 | ||||||||||||||||
Instruments designated at fair value | 45 | (48 | ) | 45 | (48 | ) | ||||||||||
Interest rate swaps | (19 | ) | 21 | 49 | (47 | ) | ||||||||||
Fair value sensitivity (net) | 26 | (27 | ) | 94 | (95 | ) | ||||||||||
As part of the acquisition of Scottish & Newcastle in 2008, Heineken took over a specific portfolio of euro floating-to-fixed interest rate swaps of which currently EUR940 million is still outstanding. Although interest rate risk is hedged economically, it is not possible to apply hedge accounting on this portfolio. A movement in interest rates will therefore lead to a fair value movement in the profit or loss under the other net financing income/(expenses). Any related non-cash income or expenses in our profit or loss are expected to reverse over time.
Cash flow sensitivity analysis for variable rate instruments
A change of 100 basis points in interest rates constantly applied during the reporting period would have increased (decreased) equity and profit or loss by the amounts shown below (after tax). This analysis assumes that all other variables, in particular foreign currency rates, remain constant and excludes any possible change in fair value of derivatives at period-end because of a change in interest rates. The analysis is performed on the same basis for 2009.
In millions of EUR | 100 bp increase | Profit or loss 100 bp decrease | 100 bp increase | Equity 100 bp Decrease | ||||||||||||
31 December 2010 | ||||||||||||||||
Variable rate instruments | (16 | ) | 16 | (16 | ) | 16 | ||||||||||
Net interest rate swaps fixed to floating | 3 | (3 | ) | 3 | (3 | ) | ||||||||||
Cash flow sensitivity (net) | (13 | ) | 13 | (13 | ) | 13 | ||||||||||
31 December 2009 | ||||||||||||||||
Variable rate instruments | (21 | ) | 21 | (21 | ) | 21 | ||||||||||
Interest rate swaps fixed to floating | 19 | (19 | ) | 19 | (19 | ) | ||||||||||
Cash flow sensitivity (net) | (2 | ) | 2 | (2 | ) | 2 | ||||||||||
Financial statements | Notes to the consolidated financial statementscontinued
32. Financial risk management and financial instruments continued
Other market price risk
Management of Heineken monitors the mix of debt and equity securities in its investment portfolio based on market expectations. Material investments within the portfolio are managed on an individual basis.
The primary goal of Heineken’s investment strategy is to maximise investment returns in order to partially meet its unfunded defined benefit obligations; management is assisted by external advisors in this regard.
Commodity price risk
Commodity price risk is the risk that changes in commodity price will affect Heineken’s income. The objective of commodity price risk management is to manage and control commodity risk exposures within acceptable parameters, whilst optimising the return on risk. The main commodity exposure relates to the purchase of cans, glass bottles, malt and utilities. Commodity price risk is in principle addressed by negotiating fixed prices in supplier contracts with various contract durations. So far, commodity hedging with financial counterparties by the Company is limited to the incidental sale of surplus CO2 emission rights and to aluminium and, to a limited extent, gas hedging, which is done in accordance with risk policies. Heineken does not enter into commodity contracts other than to meet Heineken’s expected usage and sale requirements. As at 31 December 2010, the market value of aluminium swaps was EUR12million.
Cash flow hedges
The following table indicates the periods in which the cash flows associated with derivatives that are cash flow hedges, are expected to occur.
In millions of EUR | Carrying amount | Expected cash flows | 6 months or less | 6-12 months | 1-2 years | 2-5 years | 2010 More than 5 years | |||||||||||||||||||||
Interest rate swaps: | ||||||||||||||||||||||||||||
Assets | 89 | 1,902 | 65 | 30 | 90 | 715 | 1,002 | |||||||||||||||||||||
Liabilities | (105 | ) | (1,921 | ) | (84 | ) | (74 | ) | (118 | ) | (690 | ) | (955 | ) | ||||||||||||||
Forward exchange contracts: | ||||||||||||||||||||||||||||
Assets | 10 | 1,093 | 412 | 393 | 288 | — | — | |||||||||||||||||||||
Liabilities | (18 | ) | (1,117 | ) | (439 | ) | (394 | ) | (284 | ) | — | — | ||||||||||||||||
Other derivatives used for hedge accounting: | ||||||||||||||||||||||||||||
Assets | 26 | 27 | 7 | 1 | 18 | 1 | — | |||||||||||||||||||||
Liabilities | (33 | ) | (33 | ) | (7 | ) | (8 | ) | (15 | ) | (3 | ) | — | |||||||||||||||
| (31 | ) | (49 | ) | (46 | ) | (52 | ) | (21 | ) | 23 | 47 | |||||||||||||||||
The periods in which the cash flows associated with forward exchange contracts that are cash flow hedges are expected to impact profit or loss is on average two months earlier than the occurrence of the cash flows as in the above table.
In millions of EUR | Carrying amount | Expected cash flows | 6 months or less | 6-12 months | 1-2 years | 2-5 years | 2009 More than 5 years | |||||||||||||||||||||
Interest rate swaps: | ||||||||||||||||||||||||||||
Assets | (17 | ) | 503 | 16 | 16 | 27 | 66 | 378 | ||||||||||||||||||||
Liabilities | 226 | (740 | ) | (65 | ) | (78 | ) | (80 | ) | (163 | ) | (354 | ) | |||||||||||||||
Commodity swaps: | ||||||||||||||||||||||||||||
Assets | (48 | ) | 1,015 | 615 | 282 | 118 | — | — | ||||||||||||||||||||
Liabilities | 26 | (996 | ) | (608 | ) | (268 | ) | (120 | ) | — | — | |||||||||||||||||
Other derivatives used for hedge accounting: | ||||||||||||||||||||||||||||
Assets | — | — | — | — | — | — | — | |||||||||||||||||||||
Liabilities | — | — | — | — | — | — | — | |||||||||||||||||||||
| 187 | (218 | ) | (42 | ) | (48 | ) | (55 | ) | (97 | ) | 24 | |||||||||||||||||
Financial statements | Notes to the consolidated financial statementscontinued
Fair value hedges/net investment hedges
The following table indicates the periods in which the cash flows associated with derivatives that are fair value hedges or net investment hedges are expected to occur.
In millions of EUR | Carrying amount | Expected cash flows | 6 months or less | 6-12 months | 1-2 years | 2-5 years | 2010 More than 5 years | |||||||||||||||||||||
Interest rate swaps: | ||||||||||||||||||||||||||||
Assets | 32 | 1,009 | 42 | 22 | 176 | 769 | — | |||||||||||||||||||||
Liabilities | (139 | ) | (1,077 | ) | (12 | ) | (14 | ) | (179 | ) | (872 | ) | — | |||||||||||||||
Forward exchange contracts: | ||||||||||||||||||||||||||||
Assets | 1 | 317 | 130 | 187 | — | — | — | |||||||||||||||||||||
Liabilities | — | (309 | ) | (128 | ) | (181 | ) | — | — | — | ||||||||||||||||||
| (106 | ) | (60 | ) | 32 | 14 | (3 | ) | (103 | ) | — | ||||||||||||||||||
In millions of EUR | Carrying amount | Expected cash flows | 6 months or less | 6-12 months | 1-2 years | 2-5 years | 2009 More than 5 years | |||||||||||||||||||||
Interest rate swaps: | ||||||||||||||||||||||||||||
Assets | — | 987 | 27 | 20 | 61 | 666 | 213 | |||||||||||||||||||||
Liabilities | (212 | ) | (1,079 | ) | (9 | ) | (11 | ) | (22 | ) | (802 | ) | (235 | ) | ||||||||||||||
Forward exchange contracts: | ||||||||||||||||||||||||||||
Assets | — | — | — | — | — | — | — | |||||||||||||||||||||
Liabilities | — | — | — | — | — | — | — | |||||||||||||||||||||
| (212 | ) | (92 | ) | 18 | 9 | 39 | (136 | ) | (22 | ) | ||||||||||||||||||
Financial statements | Notes to the consolidated financial statementscontinued
32. Financial risk management and financial instruments continued
Capital management
There were no major changes in Heineken’s approach to capital management during the year. The Executive Board’s policy is to maintain a strong capital base so as to maintain investor, creditor and market confidence and to sustain future development of business and acquisitions. Capital is herein defined as equity attributable to equity holders of the Company (total equity minus non-controlling interests).
Heineken is not subject to externally imposed capital requirements other than the legal reserves explained in note 22. Shares are purchased to meet the requirements under the Long-Term Incentive Plan as further explained in note 29.
Fair values
The fair values of financial assets and liabilities, together with the carrying amounts shown in the statement of financial position, are as follows:
In millions of EUR | Carrying amount 2010 | Fair value 2010 | Carrying amount 2009 | Fair value 2009 | ||||||||||||
Loans | 455 | 455 | 329 | 329 | ||||||||||||
Indemnification receivable | 145 | 145 | — | — | ||||||||||||
Other long-term receivables | 174 | 174 | — | — | ||||||||||||
Held-to-maturity investments | 4 | 4 | 4 | 4 | ||||||||||||
Available-for-sale investments | 190 | 190 | 219 | 219 | ||||||||||||
Advances to customers | 449 | 449 | 319 | 319 | ||||||||||||
Investments held for trading | 17 | 17 | 15 | 15 | ||||||||||||
Trade and other receivables, excluding derivatives | 2,263 | 2,263 | 2,261 | 2,261 | ||||||||||||
Cash and cash equivalents | 610 | 610 | 520 | 520 | ||||||||||||
Interest rate swaps used for hedge accounting: | ||||||||||||||||
Assets | 121 | 121 | 17 | 17 | ||||||||||||
Liabilities | (244 | ) | (244 | ) | (438 | ) | (438 | ) | ||||||||
Forward exchange contracts used for hedge accounting: | ||||||||||||||||
Assets | 11 | 11 | 48 | 48 | ||||||||||||
Liabilities | (18 | ) | (18 | ) | (26 | ) | (26 | ) | ||||||||
Other derivatives used for hedge accounting: | ||||||||||||||||
Assets | 26 | 26 | — | — | ||||||||||||
Liabilities | (33 | ) | (33 | ) | — | — | ||||||||||
Other derivatives not used for hedge accounting, net | (75 | ) | (75 | ) | — | — | ||||||||||
Bank loans | (3,665 | ) | (3,734 | ) | (3,311 | ) | (3,362 | ) | ||||||||
Unsecured bond issues | (2,482 | ) | (2,739 | ) | (2,945 | ) | (3,058 | ) | ||||||||
Finance lease liabilities | (95 | ) | (95 | ) | (108 | ) | (108 | ) | ||||||||
Other interest-bearing liabilities | (1,927 | ) | (2,260 | ) | (1,342 | ) | (1,423 | ) | ||||||||
Non-interest-bearing liabilities | (55 | ) | (55 | ) | (93 | ) | (93 | ) | ||||||||
Non-current derivatives | (291 | ) | (291 | ) | (370 | ) | (370 | ) | ||||||||
Deposits from third parties | (425 | ) | (425 | ) | (377 | ) | (377 | ) | ||||||||
Trade and other payables excluding dividend, interest and derivatives | (4,049 | ) | (4,049 | ) | (3,444 | ) | (3,444 | ) | ||||||||
Bank overdrafts | (132 | ) | (132 | ) | (156 | ) | (156 | ) | ||||||||
Basis for determining fair values
The significant methods and assumptions used in estimating the fair values of financial instruments reflected in the table above are discussed in note 4.
Fair value hierarchy
IFRS 7 requires disclosure of fair value measurements by level of the following fair value measurement hierarchy:
Financial statements | Notes to the consolidated financial statementscontinued
Quoted prices (unadjusted) in active markets for identical assets or liabilities (level 1)
Inputs other than quoted prices included within level 1 that are observable for the asset or liability, either directly (that is, as prices) or indirectly (that is, derived from prices) (level 2)
Inputs for the asset or liability that are not based on observable market data (unobservable inputs) (level 3).
In millions of EUR | Level 1 | Level 2 | Level 3 | |||||||||
31 December 2010 | ||||||||||||
Available-for-sale investments | 70 | — | 120 | |||||||||
Non-current derivative assets used for hedge accounting | — | 135 | — | |||||||||
Current derivative assets used for hedge accounting | — | 10 | — | |||||||||
Investments held for trading | 17 | — | — | |||||||||
| 87 | 145 | 120 | ||||||||||
Non-current derivative liabilities used for hedge accounting | — | 291 | — | |||||||||
Current derivative liabilities used for hedge accounting | — | 66 | — | |||||||||
| — | 357 | — | ||||||||||
31 December 2009 | Level 1 | Level 2 | Level 3 | |||||||||
Available-for-sale investments | 57 | — | 162 | |||||||||
Non-current derivative assets used for hedge accounting | — | 16 | — | |||||||||
Current derivative assets used for hedge accounting | — | 49 | — | |||||||||
Investments held for trading | 15 | — | — | |||||||||
| 72 | 65 | 162 | ||||||||||
Non-current derivative liabilities used for hedge accounting | — | 370 | — | |||||||||
Current derivative liabilities used for hedge accounting | — | 94 | — | |||||||||
| — | 464 | — | ||||||||||
In millions of EUR | 2010 | 2009 | ||||||
Available-for-sale investments based on Level 3 | ||||||||
Balance as at 1 January | 162 | 174 | ||||||
Fair value adjustments recognised in other comprehensive income | (8 | ) | 18 | |||||
Disposals | (26 | ) | (34 | ) | ||||
Transfers | (8 | ) | 4 | |||||
Balance as at 31 December | 120 | 162 | ||||||
33. Off-balance sheet commitments
In millions of EUR | Total 2010 | Less than 1 year | 1-5 years | More than 5 years | Total 2009 | |||||||||||||||
Lease & operational lease commitments | 433 | 85 | 214 | 134 | 322 | |||||||||||||||
Property, plant & equipment ordered | 49 | 49 | — | — | 46 | |||||||||||||||
Raw materials purchase contracts | 4,503 | 1,055 | 2,469 | 979 | 3,564 | |||||||||||||||
Other off-balance sheet obligations | 1,943 | 457 | 1,207 | 279 | 2,199 | |||||||||||||||
Off-balance sheet obligations | 6,928 | 1,646 | 3,890 | 1,392 | 6,131 | |||||||||||||||
Undrawn committed bank facilities | 2,188 | 138 | 2,050 | — | 2,077 | |||||||||||||||
Heineken leases buildings, cars and equipment.
Raw material contracts include long term purchase contracts with suppliers in which prices are fixed or will be agreed based upon pre-defined price formulas. These contracts mainly relate to malt, bottles and cans.
Financial statements | Notes to the consolidated financial statementscontinued
33. Off-balance sheet commitments continued
During the year ended 31 December 2010 EUR224 million (2009: EUR184 million) was recognised as an expense in profit or loss in respect of operating leases and rent.
Other off-balance sheet obligations mainly include distribution, rental, service and sponsorship contracts.
Committed bank facilities are credit facilities on which a commitment fee is paid as compensation for the bank’s requirement to reserve capital. For the details of these committed bank facilities see note 25. The bank is legally obliged to provide the facility under the terms and conditions of the agreement.
34. Contingencies
Netherlands
Heineken is involved in an antitrust case initiated by the European Commission for alleged violations of the European Union competition laws. By decision of 18 April 2007 the European Commission stated that Heineken and other brewers operating in the Netherlands, restricted competition in the Dutch market during the period 1996 – 1999. This decision follows an investigation by the European Commission that commenced in March 2000. Heineken fully cooperated with the authorities in this investigation. As a result of its decision, the European Commission imposed a fine on Heineken of EUR219 million in April 2007.
On 4 July 2007 Heineken filed an appeal with the European Court of First Instance against the decision of the European Commission as Heineken disagrees with the findings of the European Commission. Pending appeal, Heineken was obliged to pay the fine to the European Commission. This fine was paid in 2007 and was treated as an expense in the 2007 Annual Report. A final decision by the European Court of First Instance is expected in 2011.
Carlsberg
During 2010, the existing contingency between Heineken and Carlsberg was settled. The consideration paid (purchase price) for the acquisition of Scottish & Newcastle was finalised. The impact on goodwill was immaterial.
Brazil
As part of the acquisition of the beer operations of FEMSA, Heineken also inherited existing legal proceedings with labour unions, tax authorities and other parties of its, now wholly-owned, subsidiary Cervejarias Kaiser (Heineken Brasil). The proceedings have arisen in the ordinary course of business and are common to the current economic and legal environment of Brazil. The proceedings have partly been provided for, see note 30. The contingent amount being claimed against Heineken Brasil resulting from such proceedings as at 31 December 2010 is EUR1,267 million. Such contingencies were classified by legal counsel as less than probable but more than remote of being settled against Heineken Brasil. However, Heineken believes that the ultimate resolution of such legal proceedings will not have a material adverse effect on its consolidated financial position or result of operations. Heineken does not expect any significant liability to arise from these contingencies. A significant part of the aforementioned contingencies (EUR364 million) are tax related and qualify for indemnification by FEMSA, see note 6.
As is customary in Brazil, Heineken Brasil has been requested by the tax authorities to collateralise tax contingencies currently in litigation amounting to EUR218 million by either pledging fixed assets or entering into available lines of credit which cover such contingencies.
Guarantees
In millions of EUR | Total 2010 | Less than 1 year | 1-5 years | More than 5 years | Total 2009 | |||||||||||||||
Guarantees to banks for loans (to third parties) | 384 | 213 | 111 | 60 | 371 | |||||||||||||||
Other guarantees | 271 | 68 | 9 | 194 | 177 | |||||||||||||||
Guarantees | 655 | 281 | 120 | 254 | 548 | |||||||||||||||
Guarantees to banks for loans relate to loans to customers, which are given by external parties in the ordinary course of business of Heineken. Heineken provides guarantees to the banks to cover the risk related to these loans.
Financial statements | Notes to the consolidated financial statementscontinued
35. Related parties
Identification of related parties
Heineken has a related party relationship with its associates and joint ventures (refer note 16), Heineken Holding N.V., Heineken pension funds (refer note 28), Fomento Económico Mexicano, S.A.B. de C.V. (FEMSA) and with its key management personnel (Executive Board and the Supervisory Board).
Key management remuneration
In millions of EUR | 2010 | 2009 | ||||||
Executive Board | 5.6 | 4.2 | ||||||
Supervisory Board | 0.5 | 0.4 | ||||||
| 6.1 | 4.6 | |||||||
Executive Board
The remuneration of the members of the Executive Board comprises a fixed component and a variable component. The variable component is made up of a Short-Term Incentive Plan and a Long-Term Incentive Plan. The Short-Term Incentive Plan is based on financial and operational measures and on individual leadership targets as set by the Supervisory Board. It will be subject to the approval of the General Meeting of Shareholders to be held on 21 April 2011. It is partly paid out in shares that are blocked over a period of five calendar years. For the Long-Term Incentive Plan see note 29. The separate remuneration report is stated on page 53.
As at 31 December 2010, J.F.M.L. van Boxmeer held 9,244 Company shares and D.R. Hooft Graafland 6,544 (2009: J.F.M.L. van Boxmeer 9,244 and D.R. Hooft Graafland 6,544 shares). D.R. Hooft Graafland held 3,052 shares of Heineken Holding N.V. as at 31 December 2010 (2009: 3,052 shares).
Executive Board
| Fixed Salary | Short-Term Incentive Plan | Long-Term Incentive Plan* | Pension Plan | Total | ||||||||||||||||||||||||||||||||||||
In thousands of EUR | 2010 | 2009 | 2010 | 2009 | 2010 | 2009 | 2010 | 2009 | 2010 | 2009 | ||||||||||||||||||||||||||||||
J.F.M.L. van Boxmeer | 950 | 750 | 1,306 | 1,125 | 595 | 303 | 464 | 379 | 3,315 | 2,557 | ||||||||||||||||||||||||||||||
D.R. Hooft Graafland | 650 | 550 | 670 | 619 | 326 | 167 | 404 | 315 | 2,050 | 1,651 | ||||||||||||||||||||||||||||||
Total | 1,600 | 1,300 | 1,976 | 1,744 | 921 | 470 | 868 | 694 | 5,365 | 4,208 | ||||||||||||||||||||||||||||||
| * | The remuneration reported as part of Long-Term Incentive Plan is based on IFRS accounting policies based on target shares and does not reflect the value of vested performance shares. |
Supervisory Board
The individual members of the Supervisory Board received the following remuneration:
In thousands of EUR | 2010 | 2009 | ||||||
J.A. van Lede | 67 | 66 | ||||||
J.A. Fernández Carbajal** | 35 | — | ||||||
M. Das | 52 | 52 | ||||||
M.R. de Carvalho | 53 | 50 | ||||||
J.M. Hessels | 50 | 50 | ||||||
J.M. de Jong | 53 | 52 | ||||||
A.M. Fentener van Vlissingen | 50 | 50 | ||||||
M.E. Minnick | 48 | 45 | ||||||
V.C.O.B.J. Navarre | 48 | 31 | ||||||
J.G. Astaburuaga Sanjinés** | 35 | — | ||||||
I.C. MacLaurin* | 15 | 50 | ||||||
Total | 506 | 446 | ||||||
| * | Stepped down as at 22 April 2010. |
| ** | Appointed as at 30 April 2010. |
M.R. de Carvalho held 8 shares of Heineken N.V. as at 31 December 2010 (2009: 8 shares). As at 31 December 2010 and 2009, the Supervisory Board members did not hold any of the Company’s bonds or option rights. C.J.A. van Lede held 2,656 and M.R. de Carvalho held 8 shares of Heineken Holding N.V. as at 31 December 2010 (2009: C.J.A. van Lede 2,656 and M.R. de Carvalho 8 shares).
Financial statements | Notes to the consolidated financial statementscontinued
35. Related parties continued
Other related party transactions
| Transaction value | Balance outstanding as at 31 December | |||||||||||||||
In millions of EUR | 2010 | 2009 | 2010 | 2009 | ||||||||||||
Sale of products and services | ||||||||||||||||
To associates and joint ventures | 18 | 142 | 12 | 12 | ||||||||||||
To FEMSA | 244 | — | 78 | — | ||||||||||||
| 262 | 142 | 90 | 12 | |||||||||||||
Raw materials, consumables and services | ||||||||||||||||
Goods for resale – joint ventures | 57 | 89 | — | 1 | ||||||||||||
Other expenses – joint ventures | — | 12 | 1 | — | ||||||||||||
Other expenses FEMSA | 12 | — | — | — | ||||||||||||
| 69 | 101 | 1 | 1 | |||||||||||||
Heineken Holding N.V.
In 2010, an amount of EUR7.4 million (2009: EUR712,129) was paid to Heineken Holding N.V. for management services for the Heineken Group, the increase in comparison to 2009 was caused by the acquisition of FEMSA and related services performed by Heineken Holding N.V.
This payment is based on an agreement of 1977 as amended in 2001, providing that Heineken N.V. reimburses Heineken Holding N.V. for its costs. Best practice provision III.6.4 of the Dutch Corporate Governance Code of 10 December 2008 has been observed in this regard.
FEMSA
As consideration for Heineken’s acquisition of the beer operations of Fomento Economico Mexicano, S.A.B. de C.V. (FEMSA). FEMSA, became a major shareholder of Heineken N.V. Therefore, several existing contracts between FEMSA and former FEMSA-owned companies acquired by Heineken have become related-party contracts. The total revenue amount related to these related-party relationships amounts to EUR244 million.
APB
On 10 February 2010 and 13 April 2010, Heineken transferred its stakes in PT Multi Bintang Indonesia (MBI) and Grande Brasserie de Nouvelle-Caledonie S.A. (GBNC) to its joint venture Asia Pacific Breweries (APB). The total consideration was EUR265 million. Additionally, on 10 February 2010, Heineken acquired from APB, APB Aurangabad and APB Pearl of which 50 per cent of each entity was subsequently sold to the UBL joint venture partner VJM Group.
36. Heineken entities
Control of Heineken
The shares and options of the Company are traded on Euronext Amsterdam, where the Company is included in the main AEX index. Heineken Holding N.V. Amsterdam has an interest of 50.005 per cent in the issued capital of the Company. The financial statements of the Company are included in the consolidated financial statements of Heineken Holding N.V.
A declaration of joint and several liability pursuant to the provisions of Section 403, Part 9, Book 2, of the Dutch Civil Code has been issued with respect to legal entities established in the Netherlands marked with a • opposite.
Financial statements | Notes to the consolidated financial statementscontinued
Significant subsidiaries
| Ownership interest | ||||||||||||
| Country of incorporation | 2010 | 2009 | ||||||||||
• Heineken Nederlands Beheer B.V. | The Netherlands | 100 | % | 100 | % | |||||||
• Heineken Brouwerijen B.V. | The Netherlands | 100 | % | 100 | % | |||||||
• Heineken Nederland B.V. | The Netherlands | 100 | % | 100 | % | |||||||
• Heineken International B.V. | The Netherlands | 100 | % | 100 | % | |||||||
• Heineken Supply Chain B.V. | The Netherlands | 100 | % | 100 | % | |||||||
• Amstel Brouwerij B.V. | The Netherlands | 100 | % | 100 | % | |||||||
• Amstel Internationaal B.V. | The Netherlands | 100 | % | 100 | % | |||||||
• Vrumona B.V. | The Netherlands | 100 | % | 100 | % | |||||||
• Invebra Holland B.V. | The Netherlands | 100 | % | 100 | % | |||||||
• B.V. Beleggingsmaatschappij Limba | The Netherlands | 100 | % | 100 | % | |||||||
• Brand Bierbrouwerij B.V. | The Netherlands | 100 | % | 100 | % | |||||||
• Heineken CEE Holdings B.V. | The Netherlands | 100 | % | 100 | % | |||||||
• Brasinvest B.V. | The Netherlands | 100 | % | 100 | % | |||||||
• Heineken Beer Systems B.V. | The Netherlands | 100 | % | 100 | % | |||||||
Central Europe Beverages B.V. | The Netherlands | 72 | % | 72 | % | |||||||
Heineken France S.A.S. | France | 100 | % | 100 | % | |||||||
Heineken UK Ltd. | United Kingdom | 100 | % | 100 | % | |||||||
Sociedade Central de Cervejas et Bebidas S.A. | Portugal | 100 | % | 100 | % | |||||||
Oy Hartwell Ab. | Finland | 100 | % | 100 | % | |||||||
Heineken España S.A. | Spain | 98.7 | % | 98.7 | % | |||||||
Heineken Italia S.p.A. | Italy | 100 | % | 100 | % | |||||||
Athenian Brewery S.A. | Greece | 98.8 | % | 98.8 | % | |||||||
Brau Union AG | Austria | 100 | % | 100 | % | |||||||
Brau Union Österreich AG | Austria | 100 | % | 100 | % | |||||||
Grupa Z’ywiec S.A. | Poland | 61.9 | % | 61.9 | % | |||||||
Heineken Ireland Ltd.1 | Ireland | 100 | % | 100 | % | |||||||
Heineken Hungária Sorgyárak Zrt. | Hungary | 100 | % | 100 | % | |||||||
Heineken Slovensko a.s. | Slovakia | 100 | % | 100 | % | |||||||
Heineken Switzerland AG | Switzerland | 100 | % | 100 | % | |||||||
Karlovacka Pivovara d.o.o. | Croatia | 100 | % | 100 | % | |||||||
Mouterij Albert N.V. | Belgium | 100 | % | 100 | % | |||||||
Ibecor S.A. | Belgium | 100 | % | 100 | % | |||||||
N.V. Brouwerijen Alken-Maes Brasseries S.A. | Belgium | 99.9 | % | 99.7 | % | |||||||
LLC Heineken Breweries | Russia | 100 | % | 100 | % | |||||||
Heineken USA Inc. | United States | 100 | % | 100 | % | |||||||
Heineken Ceská republika a.s. | Czech Republic | 100 | % | 100 | % | |||||||
Heineken Romania S.A. | Romania | 98.6 | % | 98.5 | % | |||||||
FCJSC Heineken Breweries | Belarus | 100 | % | 100 | % | |||||||
OJSC, Rechitsapivo | Belarus | 95.4 | % | 86.2 | % | |||||||
Commonwealth Brewery Ltd. | Bahamas | 100 | % | 53.2 | % | |||||||
Windward & Leeward Brewery Ltd. | St Lucia | 72.7 | % | 72.7 | % | |||||||
Cervecerias Baru-Panama S.A. | Panama | 74.9 | % | 74.9 | % | |||||||
Nigerian Breweries Plc. | Nigeria | 54.1 | % | 54.1 | % | |||||||
Al Ahram Beverages Company S.A.E. | Egypt | 99.9 | % | 99.9 | % | |||||||
Brasserie Lorraine S.A. | Martinique | 100 | % | 100 | % | |||||||
Surinaamse Brouwerij N.V. | Surinam | 76.2 | % | 76.2 | % | |||||||
Cuauhtémoc Moctezuma Holding, S.A. de C.V. | Mexico | 100 | % | — | ||||||||
Fabricas Monterrey, S.A. de C.V. | Mexico | 100 | % | — | ||||||||
Financial statements | Notes to the consolidated financial statementscontinued
| Ownership interest | ||||||||||||
| Country of incorporation | 2010 | 2009 | ||||||||||
Silices de Veracruz, S.A. de C.V. | Mexico | 100 | % | — | ||||||||
Cervejarias Kaiser Brazil S.A. | Brazil | 100 | % | 17 | % | |||||||
Consolidated Breweries Ltd. | Nigeria | 50.5 | % | 50.4 | % | |||||||
Brasserie Almaza S.A.L. | Lebanon | 67.0 | % | 67.0 | % | |||||||
Brasseries, Limonaderies et Malteries ‘Bralima’ S.A.R.L. | D.R. Congo | 95.0 | % | 95.0 | % | |||||||
Brasseries et Limonaderies du Rwanda ‘Bralirwa’ S.A. | Rwanda | 75.0 | % | 70.0 | % | |||||||
Brasseries et Limonaderies du Burundi ‘Brarudi’ S.A. | Burundi | 59.3 | % | 59.3 | % | |||||||
Brasseries de Bourbon S.A. | Réunion | 85.7 | % | 85.7 | % | |||||||
Sierra Leone Brewery Ltd. | Sierra Leone | 83.1 | % | 83.1 | % | |||||||
Tango s.a.r.l. | Algeria | 100 | % | 100 | % | |||||||
Société Nouvelle des Boissons Gazeuses S.A. (‘SNBG’) | Tunisia | 74.5 | % | 74.5 | % | |||||||
Société Nouvelle de Brasserie S.A. ‘Sonobra’ | Tunisia | 49.9 | % | 49.9 | % | |||||||
| 1 | In accordance with article 17 of the Republic of Ireland Companies (Amendment) Act 1986, the Company issued an irrevocable guarantee for the year ended 31 December 2010 and 2009 regarding the liabilities of Heineken Ireland Ltd., Heineken Ireland Sales Ltd., West Cork Bottling Ltd., Western Beverages Ltd., Beamish and Crawford Ltd. and Nash Beverages Ltd as referred to in article 5l of the Republic of Ireland Companies (Amendment) Act 1986. |
| 37. | Subsequent events |
Acquisition of business in Nigeria
On 12 January 2011 Heineken announced that it had strengthened its platform for growth in Nigeria via the acquisition of two holding companies from the Sona Group. The two acquired businesses have controlling interests in each of the Sona, IBBI, Benue, Life and Champion breweries in Nigeria.
Heineken will explore the possibility of selling the newly acquired breweries to its existing businesses in Nigeria during 2011. Discussions with Nigerian Breweries and Consolidated Breweries will begin now the transaction has been finalised. The acquired breweries will continue to provide and expand contract brewing services to Nigerian Breweries and Consolidated Breweries for the meantime, whilst continuing to own, brew and support the Goldberg, Williams Dark Ale and Malta Gold brands as well as various smaller regional brands.
The acquisition has been funded from existing resources.
Allotted Share Delivery Instrument
Between 1 January and 11 February 2011, Heineken has bought 710,437 additional Heineken N.V. shares, which are in portfolio pending delivery to FEMSA.
Amsterdam, 15 February 2011 | Executive Board | Supervisory Board | ||||
| Van Boxmeer | Van Lede | |||||
| Hooft Graafland | Fernández Carbajal | |||||
| Das | ||||||
| de Carvalho | ||||||
| Hessels | ||||||
| De Jong | ||||||
| Fentener van Vlissingen | ||||||
| Minnick | ||||||
| Navarre | ||||||
| Astaburuaga Sanjinés | ||||||
F-145
