As of December 31, 2008A Refining & Chemicalssegment, a large industrial center that encompasses refining, petrochemicals, | | fertilizers and specialty chemicals operations. This segment also includes oil trading and shipping activities. Pipeline(s)
| | Origin | | Destination | | %
interest
| | | Operator | | Liquids | | Gas | EUROPE | | | | | | | | | | | | | | France | | | | | | | | | | | | | | TIGF
| | Network South West | | | | 100.00 | | | x | | | | x | Norway | | | | | | | | | | | | | | Frostpipe (inhibited)
| | Lille-Frigg, Froy | | Oseberg | | 36.25 | | | | | x | | | Gassled(a)
| | | | | | 7.995 | | | | | | | x | Heimdal to Brae Condensate
| | Heimdal | | Brae | | 16.76 | | | | | x | | | Line
| | | | | | | | | | | | | | Kvitebjørn pipeline
| | Kvitebjørn | | Mongstad | | 5.00 | | | | | x | | | Norpipe Oil
| | Ekofisk Treatment center | | Teeside (UK) | | 34.93 | | | | | x | | | Oseberg Transport System
| | Oseberg, Brage and Veslefrikk | | Sture | | 8.65 | | | | | x | | | Sleipner East Condensate Pipe
| | Sleipner East | | Karsto | | 10.00 | | | | | x | | | Troll Oil Pipeline I and II
| | Troll B and C | | Vestprosess (Mongstad refinery) | | 3.70 | | | | | x | | | The Netherlands | | | | | | | | | | | | | | Nogat pipeline
| | F3-FB | | Den Helder | | 23.19 | | | | | | | x | WGT K13-Den Helder
| | K13A-K4/K5 | | Den Helder | | 4.66 | | | | | | | x | WGT K13-Extension
| | Markham | | K13-K4/K5 | | 23.00 | | | | | | | x | United Kingdom | | | | | | | | | | | | | | Alwyn Liquid Export Line
| | Alwyn North | | Cormorant | | 100.00 | | | x | | x | | | Bruce Liquid Export Line
| | Bruce | | Forties (Unity) | | 43.25 | | | | | x | | | Central Area Transmission
| | Cats Riser Platform | | Teeside | | 0.57 | | | | | | | x | System (CATS)
| | | | | | | | | | | | | | Central Graben
| | Elgin-Franklin | | ETAP | | 15.885 | | | | | x | | | Liquid Export Line (LEP)
| | | | | | | | | | | | | | Frigg System: UK line
| | Alwyn North, Bruce and others | | St.Fergus (Scotland) | | 100.00 | | | x | | | | x | Ninian Pipeline System
| | Ninian | | Sullom Voe | | 16.00 | | | | | x | | | Shearwater Elgin Area Line (SEAL)
| | Elgin-Franklin, Shearwater | | Bacton | | 25.73 | | | | | | | x | AFRICA | | | | | | | | | | | | | | Algeria | | | | | | | | | | | | | | Medgas
| | Algeria | | Spain | | 9.77 | (b) | | | | | | x | Gabon
| | | | | | | | | | | | | | Mandji Pipe
| | Mandji fields | | Cap Lopez Terminal | | 100.00 | (c) | | x | | x | | | Rabi Pipe
| | Rabi | | Cap Lopez Terminal | | 100.00 | (c) | | x | | x | | | AMERICAS | | | | | | | | | | | | | | Argentina
| | | | | | | | | | | | | | Gas Andes
| | Neuquen Basin (Argentina) | | Santiago (Chile) | | 56.50 | | | x | | | | x | TGN
| | Network (Northern Argentina) | | | | 15.40 | | | x | | | | x | TGM
| | TGN | | Uruguyana (Brazil) | | 32.68 | | | x | | | | x | Bolivia
| | | | | | | | | | | | | | Transierra
| | Yacuiba (Bolivia) | | Rio Grande (Bolivia) | | 11.00 | | | | | | | x | Brazil
| | | | | | | | | | | | | | TBG
| | Bolivia-Brazil border | | Porto Alegre via São Paulo | | 9.67 | | | | | | | x | TSB (project)
| | TGM (Argentina) | | TBG (Porto Alegre) | | 25.00 | | | | | | | x | Colombia
| | | | | | | | | | | | | | Ocensa
| | Cusiana, Cupiagua | | Covenas Terminal | | 15.20 | | | | | x | | | Oleoducto de Alta Magdalena
| | Tenay | | Vasconia | | 0.93 | | | | | x | | | Oleoducto de Colombia
| | Vasconia | | Covenas | | 9.55 | | | | | x | | | ASIA | | | | | | | | | | | | | | Yadana
| | Yadana (Myanmar) | | Ban-I Tong (Thai border) | | 31.24 | | | x | | | | x | REST OF WORLD | | | | | | | | | | | | | | BTC
| | Baku (Azerbaijan) | | Ceyhan (Turkey) | | 5.00 | | | | | x | | | SCP
| | Baku (Azerbaijan) | | Georgia/Turkey Border | | 10.00 | | | | | | | x | Dolphin (International transport and network)
| | Ras Laffan (Qatar) | | U.A.E. | | 24.50 | | | | | | | x |
(a) | Gassled: unitization of Norwegian gas pipelines through a new joint venture in which TOTAL has an interest of 7.995%. In addition to the direct share in Gassled, TOTAL has a 14.4% interest in the joint-stock company Norsea Gas AS, which holds 2.839% in Gassled. |
(b) | Through the Group’s interest in CEPSA (48.83%). |
(c) | Interest of Total Gabon. The Group has a financial interest of 57.96% in Total Gabon. |
Gas & Power
A Supply & Marketing segment, which is dedicated to worldwide supply and marketing activities in the oil products field. The Downstream activities described below, including the data as of December 31, 2011, are presented based on the organization in effect up to December 31, 2011.
Refining & Marketing TOTAL’s worldwide refining capacity was 2,088 kb/d at year end 2011, compared to 2,363 kb/d in 2010 and 2,594 kb/d in 2009. The Group’s worldwide refined products sales (including trading operations) in 2011 were 3,639 kb/d, compared to 3,776 kb/d in 2010 and 3,616 kb/d in 2009. TOTAL is among the largest refiners/marketers in Western Europe(1), and the leading marketer in Africa(2). Directly or via its holdings, TOTAL has a worldwide retail network of 14,819 service stations at year end 2011, compared to 17,490 in 2010 and 16,299 in 2009. Through its retail network, TOTAL provides fuels to more than 3 million customers every day. In addition, TOTAL produces a broad range of specialty products, such as lubricants, liquefied petroleum gas (LPG), jet fuel, special fluids, bitumen, heavy fuel, marine fuel and petrochemical feedstock. The Group continues to adapt its business and improve positions in a context of growing demand worldwide, mainly in non-OECD countries, by focusing on three areas: adapting to mature markets in Europe; developing its positions in growth markets (Africa, Asia and the Middle East); and developing specialty products worldwide. In July 2011, TOTAL closed the sale to IPIC of its 48.83% stake in CEPSA as part of a public takeover bid on the entire share capital of CEPSA. With respect to Refining & Marketing operations, this sale concerns mainly four Spanish refineries (Huelva, Algeciras, Tenerife, Tarragona) and some marketing activities in Spain and Portugal. In October 2011, TOTAL sold its network of service stations and its fuel and heating oil marketing business in the United Kingdom, the Channel Islands and the Isle of Man. Refining TOTAL has equity stakes in twenty refineries (including ten that it operates), located in Europe, the United States, the French West Indies, Africa and China. In 2011, TOTAL continued its program of selective investments in Refining, which is focused on three areas: pursuing major ongoing projects (deep conversion at the Port Arthur refinery and construction of the Jubail refinery), adapting the European refining system to structural market changes, and increasing safety and energy efficiency. InWestern Europe, TOTAL’s refining capacity was 1,792 kb/d in 2011, compared to 2,049 kb/d in 2010 and 2,282 kb/d in 2009, accounting for 85% of the Group’s overall refining capacity. The decrease in 2011 was due to the sale of the Group’s stake in CEPSA. The Group operates nine refineries in Western Europe and owns stakes in the Schwedt refinery in Germany and two refineries in Italy through its interest in TotalErg. InFrance, where it owns five refineries, the Group continues to adapt its refining capacities and shift the production emphasis to diesel, in a context of structural decline in petroleum products demand in Europe and an increase in gasoline surpluses. Since autumn 2010, TOTAL has been implementing its project to repurpose the Flanders site. The shutdown of the refining business will lead to gradually dismantling the units. The Group has commenced repurposing the site through the creation of a technical support center, a refining training school, an oil depot and business offices. In addition, the industrial plan started in 2009 to adapt the Group’s refining base in France is ongoing. This plan is intended to reconfigure the Normandy refinery and rescale certain corporate departments at the Paris headquarters. At the Normandy refinery, the project is intended to upgrade the refinery and shift the production emphasis to diesel. For this purpose, the investments will result in the eventual reduction of the annual distillation capacity to 12 Mt from 16 Mt, upsizing the distillate hydrocracker and improving energy efficiency by lowering carbon dioxide emissions. The new structure is expected to become operational at the end of 2013. In summer 2010, the Group divested its minority interest (40%) in the Société de la Raffinerie de Dunkerque (SRD), a company that specializes in bitumen and base oil production. In theUnited Kingdom, the hydrodesulphurization (HDS) unit at the Lindsey refinery was commissioned in February 2011. The unit makes it possible to process up to 70% of high-sulphur crudes, compared to 10% previously, and increase low-sulphur diesel production. In 2010, the Group announced that it | (1) | The Gas & Power division is focusedBased on the optimization of the Group’s gas resources through marketing, trading, transport of natural gaspublicly available information, refining capacities and liquefied natural gas (LNG), LNG re-gasification and natural gas storage.
The division also contributes to the Group’s activities in the following areas:
liquefied petroleum gas (LPG) shipping and trading;
coal production, marketing and trading;
power generation from gas-fired power plants or renewable energies;
trading and marketing of electricity; and
solar power systems (through its subsidiaries Tenesol and Photovoltech).
The Gas & Power division also conducts research and development related to alternative energies as complementary energy resources to oil and gas.
Natural Gas
In 2008, TOTAL pursued its strategy of developing its activities downstream from natural gas production in order to optimize access for the Group’s current and future gas production and reserves to traditional markets (with long-term contracts between producers and integrated gas companies) and to markets open to international competition (including short-term contracts and spot sales).
The long-term contracts under which TOTAL sells its natural gas production usually provide for a price related to, among other factors, average crude oil and other petroleum product prices, as well as, in some cases, a cost-of-living index. In most cases, price formulas induce a time-lag or an adjustment over time to reflect changes in oil indexes.
In the context of deregulated natural gas markets, which allow customers to more freely access suppliers, in turn leading to new marketing methods that are more flexible than traditional long-term contracts, TOTAL is developing trading, marketing and logistics activities to offer its natural gas production directly to customers, primarily in the industrial and commercial markets.
Europe
TOTAL has been active in the downstream sector of the gas value chain in Europe for more than sixty years.
Natural gas transport, marketing and storage activities were initially developed to complement the Group’s domestic production in Lacq (France). The Group further developed these activities upon additional gas discoveries, and they are now part of its comprehensive downstream gas chain.
The Group’s transport and storage activities in southwestFrance are grouped under TIGF, a wholly-owned subsidiary of the Group. This subsidiary operates a regulated transport network of 4,905 km of gas pipelines, as well as two storage units with 84 Bcf
(2.4 Bm3) of combined usable capacity, representing approximately 20% of the overall natural gas storage capacity in France(1). Highlights of 2008 included:
•
| | Obtaining the authorization, pursuant to an April 9, 2008 decree, to increase the storage capacity of the Lussagnet site from 84 Bcf (2.4 Bm3) to 124 Bcf (3.5 Bm3) over a period of eleven years.
|
The start-up, on November 7, 2008, of the Artère de Guyenne gas pipeline. This pipeline (70 km long and 900 mm in diameter) connects Captieux and Mouliets-et-Villemartin and will allow the flow of gas from the Fos Cavaou LNG terminal to the north of France.
In addition to retaining its Quality, Security and Environment certification, TIGF was awarded an HEQ (High Environmental Quality) certification for its office and technical buildings at the Lussagnet site.
The participation of TIGF in Gas Powernext, a gas trading exchange.
The active participation of TIGF in the development of Franco-Spanish interconnections as part of ERGEG (European Regulator Group for Electricity and Gas).
Regarding TOTAL’s marketing activities:
• | | InSpain, TOTAL has marketed gas in the industrial and commercial sectors since 2001 through its participation in Cepsa Gas Comercializadora. This company is held by TOTAL (35%), CEPSA (35%) and the Algerian national oil company, Sonatrach (30%). Taking into account TOTAL’s
|
(1)quantities sold.
| GIE data (Gaz Infrastructure Europe), February 2008.
|
| 48.83% interest in CEPSA, the Group has a combined direct and indirect interest of approximately 52% in this company. In 2008, Cepsa Gas Comercializadora sold approximately 70 Bcf (2 Bm3) of natural gas to industrial and commercial customers, compared to approximately 59 Bcf (1.7 Bm3) in 2007 and 49 Bcf (1.4 Bm3) in 2006. CEPSA also has a 20% interest in the Medgaz pipeline project which directly connects Algeria to Spain.
|
•
| | InFrance, TOTAL sold 229 Bcf (6.5 Bm3) of gas in 2008 through its marketing subsidiary Total Énergie Gaz (TEGAZ), compared to 245 Bcf (7 Bm3) in 2007 and 240 Bcf (6.9 Bm3) in 2006.
|
•
| | In theUnited Kingdom, TOTAL’s subsidiary Total Gas & Power Ltd sells gas and power to the industrial and commercial markets. This subsidiary also conducts global gas, electricity and LNG trading activities. In 2008, Total Gas & Power Ltd sold 134 Bcf (3.8 Bm3) of natural gas to industrial and commercial customers, compared to 124 Bcf (3.5 Bm3) in 2007 and 134 Bcf (3.8 Bm3) in 2006. Electricity sales amounted to 4.6 TWh in 2008, compared to 3.6 TWh in 2007 and 3.2 TWh in 2006. In 2007, TOTAL disposed of its 10% interest in Interconnector UK Ltd, a gas pipeline connecting Bacton in the UK to Zeebrugge in Belgium. This disposal did not affect TOTAL’s rights to transport gas through the pipeline.
|
The Americas
In theUnited States, TOTAL marketed approximately 1,652 Bcf (46.9 Bm3) of natural gas in 2008, compared to approximately 1,606 Bcf (45.5 Bm3) in 2007 and 923 Bcf (26.2 Bm3) in 2006, supplied by its own production and external sources.
InMexico, Gas del Litoral, a company in which TOTAL holds a 25% interest, sold approximately 173 Bcf (4.9 Bm3) of natural gas in 2008, its second full year of activity, compared to 95 Bcf (2.7 Bm3) in 2007 and 25 Bcf (0.7 Bm3) in 2006.
InSouth America, TOTAL owns interests in several natural gas transport companies in Argentina, Chile and Brazil, including the following:
a 15.4% interest in Transportadora de Gas del Norte (TGN), which operates a gas transport network covering the northern half of Argentina;
a 56.5% interest in the companies that own the GasAndes pipeline, which connects the TGN network to the Santiago del Chile region; and
a 9.7% interest in Transportadora Gasoducto Bolivia-Brasil (TBG), whose gas pipeline supplies southern Brazil from the Bolivian border.
These different assets represent a total integrated network of approximately 9,000 km of pipelines serving the Argentine, Chilean and Brazilian markets from gas-producing basins in Bolivia and Argentina, where the Group has natural gas reserves.
The actions taken by the Argentine government after the 2001 economic crisis and the subsequent energy crisis, marked in 2007 by a severe gas shortage during the austral winter, put TOTAL’s Argentine subsidiaries in difficult financial and operational situations, even after taking into account the restructuring of TGN’s debt, which was completed in 2006. The sale of the Group’s Argentine power generation assets was completed in 2007, while procedures to protect TOTAL’s investments, initiated in 2002, are ongoing.
In 2008, the fall in domestic gas production in Argentina considerably reduced gas export flows to Chile.
Asia
TOTAL markets natural gas transported through pipelines in Indonesia, Thailand and Myanmar, and, in the form of LNG, to Japan, South Korea, China, Taiwan and India. The Group is also developing new outlets for re-gasified LNG in emerging markets.
In India, Hazira LNG Private Limited, a company in which TOTAL holds a 26% interest, sold approximately 87 Bcf (2.5 Bm3) of natural gas in 2008, its third full year in operation, compared to 76 Bcf (2.2 Bm3) in 2007 and 28 Bcf (0.8 Bm3) in 2006.
Liquefied Natural Gas
The Gas & Power division conducts LNG activities downstream from liquefaction plants,(1) including LNG shipping, re-gasification, storage and marketing.
TOTAL has entered into agreements to obtain long-term access to LNG re-gasification capacity on the three continents that are the largest consumers of natural gas: North America (the United States and Mexico), Europe (France and the UK) and Asia (India). This diversified access to markets allows TOTAL to develop new liquefaction projects, in particular in the Middle East and Africa, while strengthening its own LNG supply portfolio.
(1) | Natural gas liquefaction activities are conducted by the Exploration & Production division. |
Europe
InFrance, TOTAL acquired in June 2006 a 30.3% interest in the Société du Terminal Méthanier de Fos Cavaou (STMFC). This terminal is expected to have a re-gasification capacity of 291 Bcf/y (8.25 Bm3/y), of which 79 Bcf/y (2.25 Bm3/y) has been reserved by TOTAL through its subsidiary Total Gas & Power Ltd. The terminal is scheduled to come onstream commercially in the second half 2009.
In December 2006, in connection with its entry in the Qatargas II project, TOTAL acquired an 8.35% interest in the South Hook LNG re-gasification terminal project in theUnited Kingdom. The terminal is scheduled to come onstream in the first half 2009.
In addition, as part of the Snøhvit project (Norway), in which TOTAL holds an 18.4% interest and where the first deliveries started in October 2007, Total Gas & Power Ltd signed in November 2004 a purchase agreement for 35 Bcf/y (1 Bm3/y) of natural gas primarily intended for North America and Europe. TOTAL, through its subsidiary Total E&P Norge AS, chartered an LNG tanker, the Arctic Lady, to transport this LNG. This tanker has a capacity of 145,000 m3 and was delivered in April 2006.
In October 2007, TOTAL announced the creation of Adria LNG, in which TOTAL holds a 25.58% interest, to study the construction of an LNG re-gasification terminal on KrK Island (Croatia), in the northern Adriatic Sea. This terminal is expected to have an initial natural gas re-gasification capacity of 353 Bcf/y (10 Bm3/y), which could be subsequently increased to 494 Bcf/y (14 Bm3/y).
In addition, TOTAL holds a 30% interest in Gaztransport & Technigaz (GTT) which primarily focuses on the design and engineering of membrane cryogenic tanks dedicated to LNG tankers. As of December 31, 2008, 193 active LNG tankers were equipped with membrane tanks built under GTT licenses out of a world tonnage estimated at 302 LNG tankers.(1)
North America
InMexico, the Altamira re-gasification terminal, in which TOTAL holds a 25% interest, has been onstream since summer 2006. This terminal, located on the east coast of Mexico, has an initial LNG re-gasification capacity of 236 Bcf/y (6.7 Bm3/y). This capacity has been entirely reserved by Gas del Litoral, in which TOTAL has a 25% interest. The terminal received forty-two cargos in 2008, compared to thirty-three in 2007.
In theUnited States, TOTAL has reserved re-gasification capacity of 10 Bm3/y (1 Bcf/d) at the Sabine Pass LNG terminal in Louisiana, beginning in April 2009 for a renewable 20-year period. The terminal was inaugurated in April 2008. The LNG to supply Sabine Pass is expected to come from LNG purchase agreements providing for shipments from various producing projects worldwide in which TOTAL holds interests, notably in the Middle East, Norway and West Africa.
Asia
The Hazira re-gasification terminal, located on the west coast ofIndia in the Gujarat state, was inaugurated in April 2005. It had an initial re-gasification capacity of approximately 120 Bcf/y (3.4 Bm3/y). At the end of 2008, its capacity reached 177 Bcf/y (5 Bm3/y) after debottlenecking operations were conducted during the year.
TOTAL has held a 26% interest in the Hazira merchant terminal since May 2005. Its activities include LNG re-gasification and natural gas marketing. TOTAL has agreed to provide up to 26% of the LNG for the Hazira terminal. Due to market conditions in 2008, the Hazira terminal was operated on the basis of short-term contracts, both for the sale of gas on the Indian market and the purchase of LNG from international markets. Thirty cargos were delivered in 2008, compared to twenty-eight in 2007 and twelve in 2006.
On December 10, 2008, TOTAL, through its subsidiary Total Gas & Power Ltd, signed an LNG sale agreement with China National Offshore Oil Company (CNOOC). As part of this agreement, TOTAL is expected to supply CNOOC with up to 1 Mt/y of LNG starting in 2010. The gas supplied will come from the Group’s global LNG resources.
Middle East
InQatar, pursuant to heads of agreement signed in February 2005, TOTAL signed purchase agreements in July 2006 for up to 5.2 Mt/y of LNG from Qatargas II (second train) over a 25-year period. This LNG is expected to be marketed principally in France, the UK and North America. In December 2006, TOTAL also concluded an agreement to acquire a 16.7% interest in the second train of Qatargas II. Start-up is expected in 2009.
InYemen, TOTAL, through its subsidiary Total Gas & Power Ltd, signed an agreement in July 2005 with Yemen LNG Ltd (in which TOTAL has a 39.62% interest) to purchase 2 Mt/y of LNG over a 20-year period, beginning in 2009, to be delivered to the United States. The Yemen LNG project is expected to come onstream in the second quarter of 2009.
(1) | Gaztransport & Technigaz data. |
Africa
InNigeria, as part of the expansion of the Nigeria LNG plant (NLNG), in which TOTAL holds a 15% interest, Total Gas & Power Ltd signed an LNG purchase agreement for an initial 0.23 Mt/y over a 20-year period, to which an additional 0.9 Mt/y was added when the sixth train came onstream. The first deliveries under this agreement were received in January 2006.
As part of an additional NLNG expansion project to build a seventh LNG train with a capacity of approximately 8.5 Mt/y, TOTAL signed a purchase agreement in February 2007 for 1.375 Mt/y of LNG over a 20-year period. This agreement is subject to NLNG’s final investment decision for this new train.
TOTAL also acquired a 17% interest in the Brass LNG project in Nigeria in July 2006. This liquefaction project calls for the construction of two liquefaction trains, each with a capacity of 5 Mt/y. TOTAL signed a preliminary agreement with Brass LNG Ltd in July 2006 setting forth the principal terms of an agreement to purchase approximately one-sixth of the plant’s capacity over a 20-year period. This LNG would be delivered primarily to North America and Western Europe. The purchase agreement is subject to final investment decision for the Brass LNG project.
InAngola, TOTAL holds a 13.6% interest in Angola LNG, a project to construct a single-train liquefaction plant with a capacity of 5.2 Mt/y. The construction of this project began in December 2007 and LNG production is expected to start in 2012. As part of the Angola LNG project, TOTAL, through its subsidiary Total Gas & Power North America, signed a regasified natural gas purchase agreement in December 2007 for 13.6% of the quantities to be delivered to the Gulf LNG Clean Energy terminal in Mississippi in the United States.
Trading
After a period from 2001 to 2006, when Total Gas & Power Ltd was mainly involved in short-term trading on the LNG cargos market, this subsidiary began to receive cargos in 2007 under its long-term supply contracts in Nigeria and Norway. In 2008, Total Gas & Power Ltd purchased twelve contractual cargos and twenty-two spot cargos from Nigeria, Egypt, Equatorial Guinea, Abu Dhabi, Oman and Trinidad & Tobago. This mix of spot and term LNG purchases allows TOTAL to supply its principal clients over the world with gas, while retaining a certain degree of flexibility to react to market opportunities or unexpected fluctuations in supply and demand.
Liquefied Petroleum Gas
In 2008, TOTAL traded and sold 5.2 Mt of LPG (butane and propane) worldwide (compared to 5.2 Mt in 2007 and 5.8 Mt in 2006), including approximately 1.4 Mt in the Middle East and Asia, approximately 0.7 Mt in Europe on small coastal trading vessels and approximately 3 Mt on large vessels in the Atlantic and Mediterranean regions. Approximately 40% of these quantities comes from fields or refineries operated by the Group. LPG trading involved the use of seven time-charters and approximately sixty spot charters. In 2008, this activity represented approximately 9% of the worldwide seaborne LPG trade(1).
In January 2008, SALPG (South Asian LPG Limited), a company in which TOTAL holds a 50% interest, in partnership with Hindustan Petroleum Company Ltd, announced the start-up of commercial operations at the underground import and storage LPG terminal located in Visakhapatnam, on the east coast of India in the state of Andhra Pradesh. This terminal, the first of its kind in India, has a storage capacity of 60 kt.
Electricity and Cogeneration
As a refiner and petrochemicals producer, TOTAL has interests in several cogeneration facilities. Cogeneration is a process whereby the steam produced to turn turbines to generate electricity is then captured and used for industrial purposes. TOTAL also participates in another type of cogeneration, which combines power generation with water desalination and gas-fired electricity generation, as part of its strategy of pursuing opportunities at all levels of the gas value chain.
The Taweelah A1 cogeneration plant inAbu Dhabi, in operation since May 2003, combines electricity generation and water desalination. It is owned and operated by Gulf Total Tractebel Power Cy, in which TOTAL has a 20% interest. The Taweelah A1 power plant currently has an overall power generation capacity of 1,430 MW and a water desalination capacity of 385,000 m3 per day. An additional development of 250 MW of capacity, under construction, is expected to enter into operation in the first half 2009.
Also in Abu Dhabi, TOTAL entered a partnership agreement in early 2008 with GDF Suez and Areva to propose the development of a nuclear power plant project, based on third generation EPR technology, to the local authorities at the appropriate time. The local authorities have launched a process to develop civil nuclear energy. This process includes the setting up of a national development organization and the
(1) | Poten & partners LPG in world markets 2008. |
publication of a specific law for the use of nuclear energy. To this end, authorities look to international best practices and follow the rules of transparency set forth by the International Atomic Energy Agency while also relying on partnerships with countries employing nuclear power technologies, such as France, the United States, the UK and Japan. Currently, the authorities have not yet made a decision on this project. This project would provide TOTAL with an opportunity to enter the nuclear energy production sector, building on its historical presence in the Emirates.
TOTAL entered into a partnership with the Spanish company Abengoa Solar to participate in a bidding process launched by Abu Dhabi Future Energy Company (ADFEC) in 2008 as part of the MASDAR initiative to support new energies. This call for tenders concerns the construction of a concentrated solar thermal plant.
InThailand, TOTAL owns 28% of Eastern Power and Electric Company Ltd (EPEC), which has operated the combined cycle gas power plant of Bang Bo, with a capacity of 350 MW, since March 2003.
InNigeria, TOTAL and its partner, the state-owned NNPC, are participating in two projects to construct gas-fired power generation units. These projects are part of the Nigerian government’s policy to develop power generation, stop gas flaring and privatize the power generation sector:
the Afam project, part of the SPDC (Shell Petroleum Development Company) joint venture in which TOTAL holds a 10% interest, concerns upgrading the Afam V power plant to increase its capacity to 276 MW and developing the Afam VI power plant, with a planned capacity of approximately 600 MW; and
the OML 58 project, part of the TEPNG (Total Exploration Production Nigeria) joint venture in which TOTAL holds a 40% interest (operator), concerns the development of a new 400 MW combined-cycle power plant near the city of Obite.
Renewable Energy
As part of its strategy to develop energy resources to complement oil and gas, TOTAL continued in 2008 to strengthen its positions in renewable energies, with a particular focus on solar-photovoltaic power where the Group has been present since 1983.
Solar-photovoltaic power
In solar-photovoltaic power (silicon-crystal technology), TOTAL is involved in upstream activities, with the
manufacturing of photovoltaic cells, and, in downstream activities, with the marketing of solar panels.
In partnership with GDF Suez and IMEC (Interuniversity MicroElectronics Centre), TOTAL owns 47.8% of Photovoltech, a company specialized in manufacturing high-efficiency photovoltaic cells. This company, whose production capacity is 80 MWp/y, has invested 45 M€ to increase the overall production capacity of its Tierlemont plant (Tienen, Belgium) to 140 MWp/y early in 2010. In 2008, Photovoltech announced a new project to increase the production capacity of photovoltaic cells to 260 MWp/y at its Tierlemont site in 2012. Photovoltech sales rose to approximately 106 M€ in 2008, compared to 73 M€ in 2007 and 42 M€ in 2006.
In addition, TOTAL holds a 50% interest in Tenesol, in partnership with EDF. Tenesol, whose headquarters are located in Lyon (France), designs, manufactures, markets and operates solar-photovoltaic power systems. Tenesol’s consolidated sales were 193 M€ in 2008, compared to 133 M€ in 2007 and 134 M€ in 2006, the equivalent of selling production of approximately 61.3 MWp. Its principal markets are for network connections in France and in the French Overseas Territories, and it is also active in certain professional applications (telecommunications, oil and gas sites, etc.). Tenesol owns two solar panel manufacturing plants: Tenesol Manufacturing in South Africa, with an annual production capacity of 60 MWp; and Tenesol Technologies in the Toulouse region of France, which trebled its production capacity in 2008 from 17 MWp/y to 50 MWp/y.
Temasol, a wholly-owned subsidiary of Tenesol in Morocco since the transfer in 2008 of the respective shares of Total Maroc and EDF EDEV, focuses on decentralized rural electrification activities. Since its creation in 2001, approximately 25,500 households have been equipped by Temasol.
TOTAL is pursuing additional decentralized rural electrification activities by responding to calls for tenders from authorities in several countries. In South Africa, KES (Kwazulu Energy Services Company), of which TOTAL owns 35%, was awarded an initial program in the Kwazulu-Natal province in 2002; late in 2008, approximately 8,000 isolated homes were equipped with individual decentralized systems. In 2008, the program was extended to the Eastern Cape province with the objective to equip approximately 26,000 households. In Mali, Korayé Kurumba (TOTAL, 30%), a company specialized in decentralized service, operated decentralized power micro-networks and individual solar photovoltaic kits, with approximately 500 customers at the end of 2008. In Yemen and Indonesia, studies are underway related to decentralized rural electrification projects as part of commitments to support local populations.
On December 10, 2008, TOTAL acquired, as a core industrial shareholder, an interest in the share capital of the U.S. start-up Konarka, which is specialized in the development ofthird generation organic solar technologies. With a significant interest of slightly below 20%, TOTAL is Konarka’s principal shareholder.
As part of the Group’s contribution to the “Grenelle de l’environnement” program launched by the French government in 2008, TOTAL established a subsidiary, Total Énergie Solaire, to develop photovoltaic projects. Total Énergie Solaire’s primary objectives are to carry out demonstration projects for educational purposes and to display different photovoltaic solutions at the Group’s sites. The selection of five industrialized sites was finalized in 2008 (Pau, Lacq, Provence refinery, Sara refinery and Cray Valley Sorgues) with an overall installed capacity of between 2 MWp and 3 MWp and an investment of 15 M€ in 2008 and 2009.
In addition, TOTAL plans to build a plant in the Carling region in eastern France to manufacture silicon wafers for the photovoltaic industry in partnership with GDF Suez.
Wind power
TOTAL operates a wind farm in Mardyck (near its Flanders refinery, located in Dunkirk, France). Mardyck, commissioned in November 2003, has a capacity of 12 MW and produced approximately 29.5 GWh of electricity in 2008, compared to an annual average of 24.7 GWh from 2005 to 2007.
TOTAL has decided to dispose of certain of its wind farm projects.
Marine energy
In marine energy, TOTAL acquired a 10% interest in a pilot project located offshore Santona, on the northern coast of Spain, in June 2005. The construction of a first buoy, with a capacity of 40 kW, was completed and the buoy was put into the water in September 2008. This project is intended to assess the technical and economic potential of this technology.
With respect to tidal current energy, TOTAL held as of the end of 2007 a 24.9% interest in Scotrenewables Marine Power, located in the Orkney Islands in Scotland. Agreements bringing new partners into the company’s share capital were signed in January 2008. As a result, the Group’s participation was diluted to 16%. Scotrenewables Marine Power is developing tidal current energy converter technology. A 1/5 scale model is expected to be tested offshore in 2009. Construction of a full-scale prototype is scheduled for 2010.
Coal
For more than 25 years, TOTAL has exported steam coal from its mines located in South Africa, primarily to Europe and Asia. Today, TOTAL owns and operates three mines. A fourth mine is under construction and several mining development projects are being reviewed. The Group also trades and markets steam coal through its subsidiaries Total Gas & Power Ltd, Total Energy Resources (Pacific Basin) and CDF Énergie (France).
TOTAL sold approximately 8.4 Mt of coal worldwide in 2008 (compared to 10 Mt in 2007 and 9.2 Mt in 2006) of which 4.0 Mt was South African steam coal (compared to 4.7 Mt in 2007). Approximately 50% of the Group’s South African coal production was sold to European utility companies and approximately 40% was sold in Asia.
The Group’s South African coal is exported through the port of Richard’s Bay in which TOTAL has a 5.7% interest. In 2008, the Group and its partner Mmakau Mining acquired an additional 1 Mt/y of harbor handling rights through the interests they hold in the fifth phase of the port’s development. On the South African domestic market, sales amounted to 0.5 Mt in 2008, primarily destined for the industrial and metallurgic sectors.
Total Coal South Africa (TCSA) is developing new mines. The Forzando South mine, with a planned final capacity of 1.2 Mt/y, entered into production in 2007 and the Tumelo mine in January 2009. In 2007, TCSA became the majority shareholder of the Eloff mine, with a 51% interest.
TOTAL is also active in coal trading through its wholly-owned subsidiary Total Energy Resources (TER) in Hong Kong and through a representative office established in Jakarta. Approximately 34% of the 8.4 Mt of coal traded in 2008 was sold in Asia.
DME (Di-Methyl Ether)
After tests were successfully conducted on DME direct synthesis between 2001 and 2006, TOTAL and eight Japanese partners inaugurated on September 3, 2008, a DME production plant located in Niigata (Honshu Island, Japan). With a capacity of 80 kt/y, this plant produces DME from imported methanol and promotes this new generation clean fuel to Japanese consumers.
Within the consortium led by Volvo, TOTAL has been participating since 2008 in a “bio-DME” European project. DME would be produced by gasifying black liquor, a production residue from paper pulp. It will then be transported to four cities in Sweden, including Stockholm, to supply a pilot fleet of 14 trucks constructed by Volvo. This project is cofinanced by the partners in the consortium, the EU Seventh Framework Program and the Swedish Energy Agency. This preliminary step precedes production on an industrial scale.
In 2008, the Group’s Chinese subsidiary in charge of marketing LPG, Shanghai Total China Merchants LPG Consulting Co., Ltd (TOTAL, 50%), pursued its test program on mixed LPG and DME products in a sample of seventy-five industrial and individual customers. These tests confirmed the positive results achieved in laboratories in 2007. Continuation of the tests is now
subject to regulations to be introduced by the Chinese authorities for these mixed products.
The ISO standardization process for DME, launched in 2007, continued in 2008 through an international working group established for this purpose.
Downstream
The Downstream segment comprises TOTAL’s Refining & Marketing and Trading & Shipping divisions.
Refining & Marketing
As of December 31, 2008, TOTAL’s worldwide refining capacity was 2,604 kb/d. The Group’s worldwide refined products sales were 3,658 kb/d (including trading activities), compared to 3,774 kb/d in 2007 and 3,682 kb/d in 2006. TOTAL is the largest refiner/marketer in Western Europe(1), and the largest marketer in Africa(2). As of December 31, 2008, TOTAL’s worldwide marketing network consisted of 16,425 retail stations (compared to 16,497 in 2007 and 16,534 in 2006), more than 50% of which are owned by the Group. In addition, TOTAL’s refineries allow the Group to produce a broad range of specialty products, such as lubricants, liquefied petroleum gas (LPG), jet fuel, special fluids, bitumen and petrochemical feedstock.
In refining, the Group continues to improve its position by focusing on three key areas: adapting its European refining system to market changes; modernizing its Port Arthur refinery (United States) with the construction of a deep-conversion unit; and pursuing the Jubail refinery project in Saudi Arabia.
Regarding its marketing activities, the Group intends to consolidate its position in Western Europe and to pursue targeted developments in Africa and the growing markets of the Asia-Pacific region, while also growing its worldwide specialty products activities.
Refining
As of December 31, 2008, TOTAL held interests in twenty-five refineries (including twelve that it operates), located in Europe, the United States, the French West Indies, Africa and China.
TOTAL’s refining capacity inWestern Europe was 2,281 kb/d in 2008, accounting for more than 85% of the Group’s overall refining capacity and making TOTAL the leading refiner in this region(1). The Group operates eleven refineries in Western Europe, and holds interests in the German refinery of Schwedt and in four Spanish refineries through its holding in CEPSA(3).
InFrance, TOTAL announced in February 2009 its intention to sell its minority interest (40%) in Société de la Raffinerie de Dunkerque (SRD), a company specialized in the production of bitumen and basic oils, subject to the satisfaction of certain conditions precedent and to the consultation of the SRD works council.
In theUnited States, TOTAL operates the Port Arthur refinery in Texas, with a capacity of 174 kb/d.
InAfrica, TOTAL holds interests in six refineries.
InChina, TOTAL has held since 1997 a 22.4% interest in the WEPEC refinery, located in Dalian, in partnership with Sinochem and PetroChina.
Over the period from 2009 to 2013, TOTAL plans to invest on average more than 1.3 B€ per year in refining, excluding major turnarounds.
Nearly 40% of this investment is designated for two major construction projects: a deep-conversion unit in the United States, and a new refinery in Saudi Arabia.
(1) | Based on publicly available information, refining capacities. |
| (2) | PFC Energy, September 2008, based on quantities sold. |
(3) | Group’s share in CEPSA: 48.83% as of December 31, 2008. | | would offer for sale its Lindsey refinery in the United Kingdom. Due to the difficult market conditions and the lack of sufficiently attractive and competitive offers, the Group decided in early 2012 to maintain the refinery within its refining network. |
InGermany, an additional HDS unit designed to supply the German market with low-sulphur heating oil started up in autumn 2009 at the Leuna refinery. InItaly, TotalErg (TOTAL, 49%) has operated the Rome refinery (100%) since October 2010 and holds a 25.9% stake in the Trecate refinery. In theUnited States, TOTAL operates the Port Arthur refinery in Texas, with a capacity of 174 kb/d. In 2008, TOTAL launched an upgrading program that included the construction of a desulphurization unit commissioned in July 2010 and a vacuum distillation unit, a deep-conversion unit (or coker) and other associated units, which were successfully commissioned in April 2011. This project enables the refinery to process more heavy and high-sulphur crudes and to increase production of lighter products, in particular low-sulphur distillates. InSaudi Arabia, TOTAL and Saudi Arabian Oil Company (Saudi Aramco) created a joint venture in 2008, Saudi Aramco Total Refining and Petrochemical Company (SATORP), to build a 400 kb/d refinery in Jubail held by Saudi Aramco (62.5%) and TOTAL (37.5%). TOTAL and Saudi Aramco each plan to retain a 37.5% interest with the remaining 25% expected to be listed on the Saudi stock exchange. The main contracts for the construction of the refinery were signed in mid-2009, concurrent with the start-up of work. Commissioning is expected in 2013. The heavy conversion process of this refinery is designed for processing heavier crudes produced nearby and selling fuels and lighter products that meet strict specifications and are mainly intended for export. The refinery will also be integrated with petrochemical units. InAfrica, the Group has minority stakes in five refineries in South Africa, Senegal, Côte d’Ivoire, Cameroon and Gabon. In theFrench West Indies, the Group has a 50% stake in the company Société Anonyme de la Raffinerie des Antilles (SARA), which owns a refinery in Martinique. InChina, TOTAL has a 22.4% stake in the WEPEC refinery, located in Dalian, in partnership with Sinochem and PetroChina. Crude oil refining capacity The table below sets forth TOTAL’s daily crude oil refining capacity(a): | | | | | | | | | | | | | | As of December 31, (kb/d) | | 2011 | | | 2010 | | | 2009 | | Refineries operated by the Group | | | | | | | | | | | | | Normandy (France) | | | 199 | | | | 199 | | | | 338 | | Provence (France) | | | 158 | | | | 158 | | | | 158 | | Flanders (France) | | | — | | | | — | | | | 137 | | Donges (France) | | | 230 | | | | 230 | | | | 230 | | Feyzin (France) | | | 117 | | | | 117 | | | | 117 | | Grandpuits (France) | | | 101 | | | | 101 | | | | 101 | | Antwerp (Belgium) | | | 350 | | | | 350 | | | | 350 | | Leuna (Germany) | | | 230 | | | | 230 | | | | 230 | | Rome (Italy)(b) | | | — | | | | — | | | | 64 | | Lindsey — Immingham (United Kingdom) | | | 221 | | | | 221 | | | | 221 | | Vlissingen (Netherlands)(c) | | | 82 | | | | 81 | | | | 81 | | Port Arthur, Texas (United States) | | | 174 | | | | 174 | | | | 174 | | Subtotal | | | 1,862 | | | | 1,861 | | | | 2,201 | | Other refineries in which the Group has equity stakes(d) | | | 226 | | | | 502 | | | | 393 | | Total | | | 2,088 | | | | 2,363 | | | | 2,594 | |
| (a) | For refineries not 100% owned by TOTAL, the capacity shown is TOTAL’s equity share of the site’s overall refining capacity. |
At(b) | TOTAL’s stake was 71.9% until September 30, 2010. |
| (d) | TOTAL has equity stakes ranging from 12% to 50% in ten refineries (five in Africa, two in Italy, one in Germany, one in Martinique and one in China). TOTAL divested its Port Arthurstake in the Indeni refinery in Zambia in 2009. Since October 2010, theUnited States, amounts include the Group’s share in the Rome and Trecate refineries through its stake in TotalErg. TOTAL started the constructiondivested its stake in 2008 of a deep-conversion unit (or coker), a vacuum distillation unit, a desulphurization unit and other associated units as part of a modernization project. This project is designed to process more heavy and high-sulphur crudes and to increase production of lighter products,CEPSA (four refineries) in particular low-sulphur distillates. Start-up is expected in 2011. |
Refined products The table below sets forth by product category TOTAL’s net share of refined quantities produced at the Group’s refineries(a): | | | | | | | | | | | | | | (kb/d) | | 2011 | | | 2010 | | | 2009 | | Gasoline | | | 350 | | | | 345 | | | | 407 | | Aviation fuel(b) | | | 158 | | | | 168 | | | | 186 | | Diesel and heating oils | | | 804 | | | | 775 | | | | 851 | | Heavy fuels | | | 179 | | | | 233 | | | | 245 | | Other products | | | 335 | | | | 359 | | | | 399 | | Total | | | 1,826 | | | | 1,880 | | | | 2,088 | |
In(a) | Saudi Arabia,For refineries not 100% owned by TOTAL, and Saudi Arabian Oil Company (Saudi Aramco) confirmed in May 2008 the construction of a 400 kb/d refinery in Jubail. The heavy conversion process for this refinery is designed for the processing of heavier crudes (Arabian Heavy) and for the production of fuels and lighter products that meet strict specifications and are mainly intended for export.As part of this project, a joint venture initially held by Saudi Aramco (62.5%) and TOTAL (37.5%) was created in September 2008. TOTAL and Saudi Aramco eventually plan to each retain a 37.5% interest with the remaining 25% expected to be listed on the Saudi stock exchange, subject to the approvalshown is TOTAL’s equity share of the relevant authorities.site’s overall production.
|
| (b) | Avgas, jet fuel and kerosene. |
Utilization rate The tables below set forth the utilization rate of the Group’s refineries: | | | | | | | | | | | | | | | | 2011 | | | 2010 | | | 2009 | | On crude and other feedstock(a)(b) | | | | | | | | | | | | | France | | | 91 | % | | | 64 | % | | | 77 | % | Rest of Europe (excluding CEPSA and TotalERG) | | | 77 | % | | | 85 | % | | | 88 | % | Americas | | | 81 | % | | | 83 | % | | | 77 | % | Asia | | | 67 | % | | | 81 | % | | | 80 | % | Africa | | | 80 | % | | | 76 | % | | | 77 | % | CEPSA and TotalERG(c) | | | 83 | % | | | 94 | % | | | 93 | % | Average | | | 83 | % | | | 77 | % | | | 83 | % | (a) Including equity share of refineries in which the Group has a stake. (b) Crude + crackers’ feedstock/capacity and distillation at the beginning of the year. (c) For CEPSA in 2011: calculation of the utilization rate based on production and capacity prorated on the first seven months of the year. | | | | | 2011 | | | 2010 | | | 2009 | | On crude(a)(b) | | | | | | | | | | | | | Average | | | 78 | % | | | 73 | % | | | 78 | % |
The bidding process for
| (a) | Including equity share of refineries in which the constructionGroup has a stake. |
| (b) | Crude/capacity and distillation at the beginning of the project was launched in July 2008. Construction is expected to start in the third quarter 2009 for start-up in 2013.year. |
Marketing TOTAL is one of the leading marketers in Western Europe.(1) The Group is also the largest marketer in Africa, with a market share of nearly 14%.(2) TOTAL markets a wide range of specialty products produced from its refineries and other facilities. TOTAL is among the leading companies in the specialty products market, in particular for lubricants, LPG, jet fuel, special fluids, bitumen, heavy fuels and marine fuels, with products marketed in approximately 150 countries(3). Europe In Europe, TOTAL has a network of more than 9,400 service stations in France, Belgium, the Netherlands, Luxembourg and Germany, as well as in Italy through its share in TotalErg (49%). TOTAL also operates a network of 615 AS24-branded service stations dedicated to commercial transporters. TOTAL is among the leaders in Europe for fuel-payment cards, with approximately 3.5 million cards issued in twenty-seven European countries. InWestern Europe, TOTAL continued to optimize its Marketing business in 2011. InFrance, the network benefits from a wide number of service stations and a diverse selection of products (such as the Bonjour convenience stores and car washes). Nearly 2,000 TOTAL-branded service stations and 270 Elf-branded service stations are operated in France. TOTAL also markets fuels at nearly 1,800 Elan-branded service stations, generally located in rural areas. In October 2011, TOTAL launched Total access, a new service station concept combining low prices with TOTAL brand fuel and service quality. The Total access network will be made up of around 600 service stations in France, including the 270 Elf-branded service stations that will be rebranded as Total access. The project is expected to be fully implemented by 2014. At the end of 2011, TOTAL finished implementing the project to adapt oil logistics operations announced in January 2010. The Pontet and Saint Julien oil depots were closed in October 2010. Operatorship of the Hauconcourt depot was transferred to a third party in October 2010. In July 2011, operatorship of the Le Mans oil depot was transferred to a third party and the Ouistreham oil depot was divested. In January 2010, TOTAL also divested half of its stake (reduced from 50% to 25%) in Dépôts Pétroliers de La Corse and transferred operatorship. Dyneff and TOTAL’s logistics assets in Port La Nouvelle were pooled in December 2011 under the umbrella of new company Entrepôt Pétrolier de Port La Nouvelle, which was created in July 2011. In 2012, TOTAL is expected to complete the adaptation of oil logistics operations by implementing the project announced in September 2011. In the first half of 2012, the Brive and Chambéry depots are expected to be closed, and operatorship of the Lorient and Lyon depots is expected to be transferred to third parties. At the same time, TOTAL is expected to divest 24% of its current 50% stake in Entrepôt Pétrolier de Lyon. The Honfleur depot, which belongs to wholly-owned TOTAL subsidiary BTT, is expected to be closed in the second half of 2012. Nearly 25% of this investment is designated to adapt TOTAL’s European refineries to changes in the oil market: shortage of diesel fuel in Europe; stricter fuel specifications; and an increased portion of supply consisting of high-sulphur crudes.
In theUnited Kingdom, the Lindsey refinery started the construction in June 2007 of a hydrodesulphurization unit (HDS) and a steam methane reformer (SMR) to process high-sulphur crudes and to increase its low-sulphur diesel production. The HDS unit is expected to be commissioned in late 2009 and is designed to increase the portion of high-sulphur crude that the plant can process from 10% to nearly 70%.
InGermany, the construction of a new desulphurization unit at the Leuna refinery started in 2008 and is scheduled to be commissioned in the fourth quarter 2009. This unit is designed to supply the German market with low-sulphur heating oil.
InFrance, the Group announced in March 2009 an industrial plan to adapt its refining base, primarily by reconfiguring the Normandy refinery and rescaling certain corporate departments at its Paris headquarters. The Normandy refinery project will shift the production emphasis to diesel, as oil consumption diminishes and gasoline surpluses increase in France. An investment program of approximately 770 M€ is intended to upgrade and reconfigure the facility, reducing its refining capacity to 12 Mt/y from 16 Mt/y. At the same time, the distillate hydrocracker (DHC) commissioned in 2006, which enables diesel production, will be upsized. These investments will lift the annual average diesel output by 10% and reduce surplus gasoline output by 60%. Implementation of this project, which is scheduled to be spread over three years, is subject to prior consultation with employee representatives.
Lastly, nearly 35% of this investment is designated for modernizing refining sites, improving safety and energy efficiency, and reducing environmental impact.
CEPSA has also been pursuing a program to invest in the improvement of its refineries’ conversion capacity to respond to growing demand for medium distillates on the Spanish market. The construction of a 2.1 Mt/y hydrocracker unit, two additional distillation units (one atmospheric and one vacuum) and a desulphurization unit is underway at the Huelva refinery, with start-up scheduled for early 2010.
2008 was marked by a high level of maintenance activity, with six refineries having undergone complete or partial turnarounds, compared to ten(1) in 2007 and three in 2006. In 2009, six refineries operated by the Group are scheduled for major turnarounds, spread throughout the year.
| (1) | Including the Milford Haven refinery, in which the Group sold its entire 70% interest in December 2007. |
Crude oil refining capacity
The table below sets forth TOTAL’s share of the daily crude oil refining capacity of its refineries.
| | | | | | | | As of December 31(a) (kb/d) | | 2008 | | 2007 | | 2006 | Refineries operated by the Group | | | | | | | Normandy (France) | | 339 | | 331 | | 331 | Provence (France) | | 158 | | 158 | | 158 | Flandres (France) | | 137 | | 141 | | 141 | Donges (France) | | 230 | | 230 | | 230 | Feyzin (France) | | 117 | | 117 | | 116 | Grandpuits (France) | | 101 | | 101 | | 99 | Antwerp (Belgium) | | 350 | | 350 | | 350 | Leuna (Germany) | | 230 | | 227 | | 227 | Rome (Italy)(b) | | 64 | | 63 | | 64 | Immingham (UK) | | 221 | | 221 | | 221 | Milford Haven (UK)(c) | | — | | — | | 74 | Vlissingen (Netherlands)(d) | | 81 | | 81 | | 81 | Port Arthur, Texas (United States) | | 174 | | 174 | | 174 | Sub-total | | 2,202 | | 2,194 | | 2,266 | Other refineries in which the Group has an interest(e) | | 402 | | 404 | | 434 | Total | | 2,604 | | 2,598 | | 2,700 |
(a) | For refineries not 100% owned by TOTAL, the indicated capacity represents TOTAL’s share of the overall refining capacity of the refinery. |
(b) | TOTAL’s interest is 71.9%. |
(c) | TOTAL’s interest was 70% as of December 31, 2006. Interest sold in 2007. |
(d) | TOTAL’s interest is 55%. |
(e) | TOTAL has interests ranging from 16.7% to 50% in thirteen refineries (six in Africa, four in Spain, one in Germany, one in Martinique and one in China). TOTAL disposed of its 55.6% interest in the Luanda refinery in Angola in 2007. |
Refined products(a)
The table below sets forth by product category TOTAL’s net share of refined quantities produced at the Group’s refineries.
| | | | | | | | (kb/d) | | 2008 | | 2007 | | 2006 | Gasoline | | 443 | | 501 | | 532 | Avgas and jet fuel(b) | | 208 | | 208 | | 203 | Diesel and heating oils | | 987 | | 964 | | 952 | Heavy fuel oils | | 257 | | 254 | | 266 | Other products | | 417 | | 412 | | 455 | Total | | 2,312 | | 2,339 | | 2,408 |
(a) | Including TOTAL’s share in CEPSA. |
(b) | Avgas, jet fuel and kerosene. |
Utilization rate(a)
The table below sets forth the utilization rate of the Group’s refineries.
| | | | | | | | | | | | | 2008 | | | 2007 | | | 2006 | | Crude | | 88 | % | | 87 | % | | 88 | % | Crude and other feedstock | | 91 | % | | 89 | % | | 91 | % |
(a) | Including TOTAL’s share in CEPSA. |
Marketing
TOTAL is one of the leading marketers in Western Europe.(1) The Group is also the largest marketer in Africa, with a market share of 11%.(2)
TOTAL markets a wide range of specialty products, which it produces from its refineries and other facilities. TOTAL is among the leading companies in the specialty products market(3), in particular for lubricants, liquefied petroleum gas (LPG), jet fuel, special fluids and bitumen, with products marketed in approximately 150 countries(4).
Sales of refined products(a)
The table below sets forth by geographic area TOTAL’s volumes of refined petroleum products sold for the years indicated.
| | | | | | | | | | (kb/d) | | 2008 | | 2007 | | | 2006 | | France | | 822 | | 846 | | | 837 | | Rest of Europe(a) | | 1,301 | | 1,432 | | | 1,438 | | United States | | 147 | | 162 | (b) | | 160 | (b) | Africa | | 279 | | 286 | | | 274 | | Rest of world | | 171 | | 167 | | | 153 | | Total excluding Trading | | 2,720 | | 2,893 | (b) | | 2,862 | (b) | Trading (Balancing and Export Sales) | | 938 | | 881 | | | 820 | | Total including Trading | | 3,658 | | 3,774 | (b) | | 3,682 | (b) |
(a) | Including TOTAL’s share in CEPSA. |
(b) | Amounts are different from those in TOTAL’s 2007 and 2006 Forms 20-F due to a change in the calculation method for sales of the Port Arthur refinery. |
(1) | Based on publicly available information, quantities sold. Portfolio: France, Benelux, United Kingdom, Germany, Italy, and, through CEPSA, Spain and Portugal. |
(2) | PFC Energy September 2008, based on quantities sold. |
(3) | Based on publicly available information, quantities sold. |
| (2) | Market share for the markets where the Group operates, based on publicly available information, quantities sold. |
| (3) | Including via national distributors. |
| • | | InItaly, as part of the optimization of the Group’s downstream portfolio in Europe, TotalErg (TOTAL, 49%) was created in autumn 2010 through the merger of Total Italia and ERG Petroli. TotalErg has become the third largest operator in the Italian market with a network market share of nearly 13%(1) and more than 3,350 service stations. |
In theUnited Kingdom, TOTAL announced in June 2011 that it had signed an agreement to sell its network of service stations and its fuel and heating oil marketing business in the United Kingdom, the Channel Islands and the Isle of Man. This sale was closed in October 2011. TOTAL continues to operate in specialty products in the United Kingdom, particularly lubricants and aviation fuel. InNorthern, Central and Eastern Europe, the Group is developing its positions primarily in the specialty products market. In 2011, TOTAL continued to expand its direct presence in the growing markets of Eastern Europe, in particular for lubricants. The Group intends to accelerate the growth of its specialty products business in Russia, Ukraine and the Balkans through the development of its direct presence in these markets since 2008. AS24, which is active in twenty-six European countries, continued to expand its network, exceeding the milestone of 600 service stations and opening new outlets in two new countries, Ukraine (2011) and Georgia (early 2012). The AS24 network is expected to continue to grow, mainly through expansion in the Mediterranean Basin and Russia, by strengthening its position in strategic countries and through its toll payment card service, which covers more than seventeen countries. Africa & the Middle East TOTAL is the leading marketer of petroleum products on the African continent, with a market share of 14%.(2) Following the acquisition of marketing and logistics assets in Kenya and Uganda in 2009, the Group runs more than 3,500 service stations in more than forty countries and operates major networks in South Africa, Nigeria, Kenya and Morocco. As part of the optimization of its portfolio, the Group divested its subsidiary in Benin in late 2010. TOTAL also has a large presence in Turkey and Lebanon, and is developing a network of large service stations in Jordan. In the Middle East, the Group is active mainly in the specialty products market and is pursuing its growth strategy in the region, notably through the production and marketing of lubricants. Asia-Pacific At year-end 2011, TOTAL was present in nearly twenty countries in the Asia-Pacific region, primarily in the specialty products market. The Group is developing its position as a fuel marketer in the region, in particular in China. TOTAL operates service stations in Pakistan, the Philippines, Cambodia, Indonesia, and is a significant player in the Pacific Islands. InChina, the Group operated nearly 160 service stations at year-end 2011 through two TOTAL/Sinochem joint ventures. InIndia, TOTAL is expected to open in early 2012 its first lubricants, bitumen, special fluids and additives technical support center outside Europe. InVietnam, TOTAL continues to strengthen its position in the specialty products market. The Group has become one of the leaders in the Vietnamese lubricants market due to the acquisitions of assets at year-end 2009. Americas InLatin America and the Caribbean, TOTAL is active in nearly twenty countries, primarily in the specialty products market. In the Caribbean, the Group holds a significant position in the fuel distribution business, which was strengthened by the acquisition in 2008 of marketing and logistics assets in Puerto Rico, Jamaica and the Virgin Islands. InNorth America, TOTAL markets specialty products, mainly lubricants, and is continuing to grow with the acquisition at year-end 2009 of lubricant assets in the province of Quebec in Canada. Sales of refined products The table below sets forth TOTAL’s sales of refined products by region: | | | | | | | | | | | | | | (kb/d) | | 2011 | | | 2010 | | | 2009 | | France | | | 740 | | | | 725 | | | | 808 | | Europe, excluding France(a) | | | 1,108 | | | | 1,204 | | | | 1,245 | | United States | | | 47 | | | | 65 | | | | 118 | | Africa | | | 304 | | | | 292 | | | | 281 | | Rest of the World | | | 225 | | | | 209 | | | | 189 | | Total excluding Trading | | | 2,424 | | | | 2,495 | | | | 2,641 | | Trading | | | 1,215 | | | | 1,281 | | | | 975 | | Total including Trading | | | 3,639 | | | | 3,776 | | | | 3,616 | |
| (a) | Including TOTAL’s share in CEPSA (up to end of July 2011) and, as from October 1, 2010, in TotalErg. |
| (1) | PFC Energy, Unione Petrolifera, based on quantities sold. |
| (2) | Market share in the countries where the Group operates, based on 2011 publicly available information, quantities sold. |
(4) | Including through national distributors. |
Retail stations
The table below sets forth by geographic area the number of retail stations in TOTAL’s network.
The table below sets forth the number of service stations of the Group: | | | | | | | | | | | | | | As of December 31, | | 2011 | | | 2010 | | | 2009 | | France(a) | | | 4,046 | | | | 4,272 | | | | 4,606 | | Europe, excluding France | | | 5,375 | | | | 7,790 | | | | 6,219 | | of which TotalErg | | | 3,355 | | | | 3,221 | | | | — | | of which CEPSA | | | — | | | | 1,737 | | | | 1,734 | | Africa | | | 3,464 | | | | 3,570 | | | | 3,647 | | Rest of the World | | | 1,934 | | | | 1,858 | | | | 1,827 | | Total | | | 14,819 | | | | 17,490 | | | | 16,299 | |
| | | | | | | | | As of December 31, | | 2008 | | | 2007 | | 2006 | France | | 4,782 | (a) | | 4,992 | | 5,220 | Rest of Europe (excluding France and CEPSA) | | 4,541 | | | 4,762 | | 4,628 | CEPSA(b) | | 1,811 | | | 1,680 | | 1,672 | Africa | | 3,500 | | | 3,549 | | 3,562 | Rest of world | | 1,791 | | | 1,514 | | 1,452 | Total | | 16,425 | | | 16,497 | | 16,534 |
(a) | Of which nearly 2,400 retail stations are under the TOTAL brand, nearly 300 retail stations are under the Elf brand and more than 1,800 retail stations are under the Elan brand.| (a) | Total-, Elf- and Elan-branded service stations. |
(b) | Including all retail stations within the CEPSA network. |
EuropeBiofuels TOTAL is active in the biodiesel and biogasoline sectors. In 2011, TOTAL produced and blended 494 kt of ethanol(1) in gasoline at its European refineries(2) and several oil depots (compared to 464 kt in 2010 and 510 kt in 2009) and 1,859 kt of VOME(3) in diesel at its European refineries(4) and several oil depots (compared to 1,737 kt in 2010 and 1,655 kt in 2009). TOTAL, in partnership with the leading companies in this area, is developing second generation biofuels derived from biomass. TOTAL is also working with leading worldwide public and private scientific partners on biochemical and thermochemical biomass conversion. The Group is thus participating in French, European and international bioenergy development programs. As part of this, TOTAL is involved in two demonstration projects: BioTfueL, which aims to develop technology to convert biomass into biodiesel; and Futurol, an R&D project for cellulosic bioethanol, which intends to develop and promote on an industrial scale a production process for bioethanol by fermentation of non-food lignocellulosic biomass. Hydrogen and electric mobility TOTAL is continuing its hydrogen fueling demonstrations as part of the Clean Energy Partnership in Germany. A new prototype station is being built in the center of Berlin and is scheduled to open in February 2012. TOTAL is also involved in the “H2 Mobility” study underway in Germany, which aims to identify the business model that would enable the creation of an infrastructure in light of the potential marketing of fuel cell vehicles between 2015 and 2020. The number of prototype electric vehicle fueling stations (fast charge) is increasing. TOTAL now has twelve charging stations in Belgium. In France, two stations have been completed in the Paris area as part of the SAVE project, and six are being built in the Netherlands. Trading & Shipping InEurope, TOTAL has a network of 11,134 retail stations in France, Belgium, The Netherlands, Luxembourg, Germany, the United Kingdom, Italy, and, through its 48.83% interest in CEPSA, Spain and Portugal. TOTAL is among the leaders in Europe for fuel-payment cards, with approximately 3.4 million cards issued in more than twenty European countries.
InFrance, the TOTAL-branded network benefits from a wide number of retail stations and a diverse selection of products (such as theBonjour convenience stores and car washes). Elf-branded retail stations offer quality fuels at prices that are particularly competitive. As of December 31, 2008, nearly 2,400 TOTAL-branded retail stations and 300 Elf-branded retail stations were operating in France. TOTAL also markets fuels at more than 1,800 Elan-branded retail stations, generally located in rural areas.
TOTAL launched, in the fall of 2008, a universal Visa® card entitling customers to immediate discounts on fuels in all French TOTAL-branded retail stations. The Group intends to strengthen its leadership(1) in the marketing of fuels in France by increasing the attractiveness of its network to its individual customers.
In 2008, TOTAL continued its efforts to optimize its marketing activities inWestern Europe. In Portugal, TOTAL and CEPSA merged their oil marketing activities in 2008. The combined entity has a leading position on
the Portuguese oil market with a market share of approximately 11%(1), a network of 300 retail stations and a strengthened position in the specialty products market. In Spain, the Group sold its LPG marketing activities in August 2008. In France and Germany, TOTAL continued a program initiated in 2007 to adapt and restructure its marketing activities to optimize its organization and to reduce operating costs.
InCentral and Eastern Europe, the Group is developing its positions primarily through its specialty products. In 2008, TOTAL continued to expand its presence in the growing markets of Eastern Europe, in particular for lubricants. In September 2008, the Group finalized the acquisition of bitumen assets in Poland, strengthening its position in the rapidly growing market for bitumen in that country.
As of December 31, 2008, TOTAL had a network of more than 500 “AS24”-branded retail stations in twenty European countries specialized in the marketing of fuels to professional transporters. During the next few years, the AS24 network is expected to continue its growth and to expand to other countries in northern and southeastern Europe.
Africa & the Middle East
As of December 31, 2008, TOTAL is the leading marketer of petroleum products in the African continent, with a market share of 11%(2) and 3,500 retail stations in more than forty countries. The Group operates two major networks in South Africa and Nigeria. TOTAL also has a large presence in the Mediterranean Basin, principally in Turkey, Morocco and Tunisia. In the Middle East, the Group is primarily active in the specialty products market and is pursuing its growth strategy in the region, notably through the production and marketing of lubricants.
In 2008, the Group continued to strengthen its positions on the African continent. In November 2008, TOTAL entered into an agreement to acquire marketing and logistics assets in Kenya and Uganda. The transaction covers 165 retail stations, aviation product distribution as well as several logistics sites and a lubricant manufacturing plant. Subject to the approval of the relevant authorities, this agreement is expected to enable the Group to strengthen its position in Eastern Africa.
In August 2008, TOTAL disposed of its marketing activities in Rwanda, Burundi and Guinea-Bissau.
(1) | Based on publicly available information, quantities sold. |
(2) | PFC Energy September 2008, based on quantities sold. |
Asia-Pacific
As of December 31, 2008, TOTAL was present in nearly twenty countries in the Asia-Pacific region, primarily through its specialty products. The Group is also developing its position as a fuel distributor in the region, in particular in China, and operates two major networks, in Pakistan and the Philippines.
InChina, the Group operated approximately 100 retail stations as of December 31, 2008, pursuant to two joint venture agreements signed in 2005 by TOTAL and Sinochem to develop a network of 500 retail stations in the Beijing and Shanghai areas.
InSouth Korea, TOTAL increased its interest in its subsidiary Total ISU Oil Co. Ltd to 100% early in 2008 by acquiring the interests of Isu Chemical Co. Ltd and at the same time announced the creation of a joint venture (TOTAL, 50%) with a South Korean company, S-Oil. This transaction is expected to make TOTAL a leading marketer of lubricants in South Korea.(1)
InIndia, the Group is pursuing the development of its specialty products activities. In September 2008, a joint venture (TOTAL, 50%) was created for bitumen activities to supply the Indian road industry in special and emulsion bitumen. Marketing under this joint venture started in December 2008.
InVietnam, TOTAL acquired a company specialized in the marketing of LPG in December 2008. This transaction is expected to enable the Group to substantially strengthen its presence on the market.
Rest of world
InLatin America and theCaribbean, TOTAL is active in nearly twenty countries, primarily through its specialty products. In the Caribbean, the Group pursued the development of its marketing activities through the acquisition, in the second half 2008, of marketing and logistics assets in Puerto Rico, Jamaica and the Virgin Islands. This transaction covers approximately 200 retail stations, aviation product distribution and several terminals. The purchase of these assets is expected to strengthen TOTAL’s activities in the region.
InNorth America, TOTAL markets lubricants and, late in 2008, it expanded its presence in the United States by acquiring a company present in nearly twenty U.S. states.
The Group intends to accelerate the development of its specialty products activities inRussia and theUkraine, two regions with significant potential for growth. Through the development of its presence in these markets in 2008, the Group has primarily targeted the growth of its lubricant sales.
Biofuels and hydrogen
Biofuels
TOTAL is active in the biodiesel and biogasoline biofuel sectors. In 2008, TOTAL consolidated its position as a leading oil and gas company in the European biofuels market(1) by producing and incorporating 790 kt of ETBE(2) at ten refineries(3) (compared to 710 kt in 2007 and 500 kt in 2006) and incorporating 1,470 kt of VOME(4) at fourteen European refineries and several storage sites (compared to 880 kt in 2007 and 420 kt in 2006).
TOTAL, in partnership with the leading companies in this area, is developing second generation biofuels derived from biomass. The Group is also participating in French, European and international bioenergy development programs.
In this framework, TOTAL announced in September 2008 its participation in Futurol, a research and development project for cellulosic bioethanol, which intends to perfect and promote on an industrial scale a production process involving hydrolisis of lignocellulosic biomass.
Hydrogen
In 2008, TOTAL continued its research and testing programs for fuel cell and hydrogen fuel technologies. For several years, TOTAL has been developing cooperation agreements for automotive applications (with BMW in 2006, Renault in 2003 and Delphi in 2001) and stationary applications (Electrabel and Idatech in 2004). Under its partnership with BVG, the largest public transport company in Germany and a bus operator in Berlin, TOTAL participated in the creation of a Center of Excellence for Hydrogen in Berlin.
TOTAL is also participating in the hydrogen technology platform launched by the European Commission and is a founding member of the industrial group created in 2007 to participate in the European Joint Technology Initiative to promote the development of hydrogen technology.
(1) | Based on publicly available information, quantities sold. |
(2) | ETBE: Ethyl-Tertio-Buthyl-Ether. |
(3) | Including the Algeciras and Huelva refineries (CEPSA). |
(4) | VOME: Vegetable-Oil-Methyl-Ester. |
Trading & Shipping division: sells and markets the Group’s crude oil production; provides a supply of crude oil for the Group’s refineries; imports and exports the appropriate petroleum products for the Group’s refineries to be able to adjust their production to the needs of local markets; charters appropriate ships for these activities; and undertakes trading on various derivatives markets. The Trading & Shipping division’s main focus is serving the Group. In addition, the division’s expertise allows it to extend its scope of activities beyond its primary focus. Trading & Shipping’s worldwide activities are conducted through various wholly-owned subsidiaries, including TOTSA Total Oil Trading S.A., Total International Ltd, Socap International Ltd, Atlantic Trading & Marketing Inc., Total Trading Asia Pte, Total Trading and Marketing Canada L.P., Total Trading Atlantique S.A. and Chartering & Shipping Services S.A. | (1) | Including ethanol from ETBE (Ethyl-Tertio-Buthyl-Ether) and biomethanol from MTBE (Methyl-Tertio-Butyl-Ether). |
| (2) | CEPSA’s refineries and oil depots are not included in 2011, 2010 and 2009 figures. |
| (3) | VOME: Vegetable-Oil-Methyl-Ester. Including HVO (Hydrotreated Vegetable Oil). |
| (4) | Including Total Erg’s Rome and Trecate refineries in Italy. CEPSA’s refineries and oil depots are not included in 2011, 2010 and 2009 figures. |
The Trading & Shipping division:
sells and markets
| (1) | Contango is a term used to describe an energy market in which the Group’s crude oil production;provides a supply of crude oil for the Group’s refineries;
imports and exports the appropriate petroleum products for the Group’s refineries to be able to adjust their production to the needs of local markets;
charters appropriate ships for these activities; and
undertakes trading on various derivatives markets.
Although the Trading & Shipping division’s main focus is serving the Group, its know-how and expertise also allow this division to extend the scope of its activities beyond meeting the strict needsanticipated value of the Group.
Trading & Shipping’s worldwide activities are conducted through various wholly-owned subsidiaries, including TOTSA Total Oil Trading S.A., Total International Ltd, Socap International Ltd, Atlantic Trading & Marketing Inc., Total Trading Asia Pte, Total Trading Canada Ltd, Total Trading and Marketing Canada L.P. and Chartering & Shipping Services S.A.
Trading
TOTALspot price in the future is one ofhigher than the world’s major traders of crude oil and refined products on the basis of volumes traded.
current spot price. The table below sets forth selected information with respect to TOTAL’s worldwide sales and source of supply of crude oil for each of the last three years. Supply and sales of crude oil
| | | | | | | | For the year ended December 31 (kb/d, except %) | | 2008 | | 2007 | | 2006 | Supply of crude oil | | | | | | | Total supply | | 3,839 | | 4,194 | | 4,112 | Production sold(a)(b) | | 1,365 | | 1,502 | | 1,473 | Purchased from external suppliers | | 2,474 | | 2,692 | | 2,639 | Production by the Group as a percentage of total supply | | 36% | | 36% | | 36% | Sales of crude oil | | | | | | | Total sales | | 3,839 | | 4,194 | | 4,112 | Sales to Downstream segment(c) | | 1,995 | | 2,042 | | 2,074 | Sales to external customers | | 1,844 | | 2,152 | | 2,038 | Sales to external customers as a percentage of total sales | | 48% | | 51% | | 50% |
(a) | Including condensates and natural gas liquids.reverse situation is described as backwardation. |
(b) | Including TOTAL’s proportionate share of the production of joint ventures.Trading TOTAL is one of the world’s largest traders of crude oil and refined products on the basis of volumes traded. The table below sets forth selected information with respect to the worldwide sales and sources of supply of crude oil and sales of refined products for the Group’s Trading division for each of the last three years. Trading of physical volumes of crude oil and refined products amounted to 4.4 Mb/d in 2011. Trading division’s supply and sales of crude oil and sales of refined products(a) | | | | | | | | | | | | | | (kb/d) | | 2011 | | | 2010 | | | 2009 | | Group’s worldwide liquids production | | | 1,226 | | | | 1,340 | | | | 1,381 | | Purchased by the Trading division from the Group’s Exploration & Production division | | | 960 | | | | 1,044 | | | | 1,054 | | Purchased by the Trading division from external suppliers | | | 1,833 | | | | 2,084 | | | | 2,351 | | Total of Trading division’s supply | | | 2,793 | | | | 3,128 | | | | 3,405 | | Sales by Trading division to Group Refining & Marketing division | | | 1,524 | | | | 1,575 | | | | 1,752 | | Sales by Trading division to external customers | | | 1,269 | | | | 1,553 | | | | 1,653 | | Total of Trading division’s sales | | | 2,793 | | | | 3,128 | | | | 3,405 | | Total sales of refined products | | | 1,632 | | | | 1,641 | | | | 1,323 | |
| (a) | Including condensates. |
(c) | Excluding share of CEPSA.The Trading division operates extensively on physical and derivatives markets, both organized and over the counter. In connection with its trading activities, TOTAL, like most other oil companies, uses derivative energy instruments (futures, forwards, swaps, options) to adjust its exposure to fluctuations in the price of crude oil and refined products. These transactions are entered into with various counterparties. For additional information concerning Trading & Shipping’s derivatives, see Notes 30 (Financial instruments related to commodity contracts) and 31 (Market risks) to the Consolidated Financial Statements. All of TOTAL’s trading activities are subject to strict internal controls and trading limits. In 2011, the oil market tightened; as a result, the oil price rise accelerated and the structure of crude oil prices flipped from contango to backwardation(1). | | | | | | | | | | | | | | | | | | | | | | | | | | | | | | | | | | | | | | | 2011 | | | 2010 | | | 2009 | | | min 2011 | | | max 2011 | | Brent ICE — 1st Line(a) | | | ($/b | ) | | | 110.91 | | | | 80.34 | | | | 62.73 | | | | 93.33 | | | | (Jan. 07 | ) | | | 126.65 | | | | (Apr. 08 | ) | Brent ICE — 12th Line(b) | | | ($/b | ) | | | 108.12 | | | | 84.61 | | | | 70.43 | | | | 94.20 | | | | (Jan. 07 | ) | | | 121.74 | | | | (Apr. 29 | ) | Contango/Backwardation time structure (12th-1st) | | | ($/b | ) | | | -2.79 | | | | 4.27 | | | | 7.70 | | | | -9.55 | | | | (Oct. 14 | ) | | | 2.65 | | | | (Feb. 07 | ) | Gasoil ICE — 1st Line(a) | | | ($/t | ) | | | 933.30 | | | | 673.88 | | | | 522.20 | | | | 767.75 | | | | (Jan. 01 | ) | | | 1,053.00 | | | | (Apr. 08 | ) |
| (a) | 1st line: Average quotation on ICE Futures for first nearby month delivery. |
The Trading division operates extensively on physical and derivatives markets, both organized and over the counter. In connection with its trading activities, TOTAL, like most other oil companies, uses derivative energy instruments (futures, forwards, swaps, options) to adjust its exposure to fluctuations in the price of crude oil and
refined products. These transactions are entered into with various counterparties. For additional information concerning Trading & Shipping’s derivatives, see Notes 30 and 31 to the Consolidated Financial Statements.
All of TOTAL’s trading activities are subject to strict internal controls and trading limits.
Throughout 2008, the Trading division maintained a level of activity similar to the levels attained in 2007 and 2006, trading physical volumes of crude oil and refined products amounting to an average of approximately 5 Mb/d.
In 2008, the principal market benchmarks stood at historically high levels of volatility:
| | | | | | | | | | | | | | | | | | | | | | | | 2008 | | 2007 | | 2006 | | min 2008 | | | max 2008 | | Brent ICE Futures — 1st Line(a) | | ($/b) | | 98.52 | | 72.67 | | 66.11 | | 36.61 | | (Dec 24 | ) | | 146.08 | | (Jul 03 | ) | Gasoil ICE Futures — 1st Line(a) | | ($/t) | | 920.65 | | 637.8 | | 580.4 | | 402 | | (Dec 26 | ) | | 1,325.25 | | (Jul 11 | ) | VLCC Ras Tanura Chiba — BITR(b) | | ($/t) | | 24.09 | | 13.93 | | 14.52 | | 11.16 | | (Nov 28 | ) | | 45.49 | | (Jan 02 | ) |
(a)
| 1st line: Quotation for first month nearby delivery ICE Futures.
|
| (b) | 12th Line: Average quotation on ICE Futures for twelfth nearby month delivery. |
The oil markets had ended 2010 significantly up, driven by the very strong upturn in demand for oil (+2.8 Mb/d). The outbreak of war in Libya in February 2011 quickly deprived the oil market of 1.6 Mb/d of crude supply. On the international markets, the shutdown of Libyan crude production was aggravated by production losses in Nigeria (through attacks on oil infrastructure and diversion of the oil), Angola (with technical problems on several fields), Yemen (through attacks on oil infrastructure) and Syria (due to the embargo). The resulting crude oil deficit was offset mainly by Saudi Arabia, Kuwait and the United Arab Emirates, which all increased their production considerably, thereby reducing the surplus available production capacity. Production in Libya gradually started up again from September 2011 and reached around 0.9 Mb/d at the end of 2011. Overall in 2011, OPEC crude oil production was estimated to be slightly down compared to 2010 (-0.1 Mb/d), as was non-OPEC crude production (-0.2 Mb/d). The production of other liquids in 2011 (LPG, LNG, biofuels) rose (+0.5 Mb/d). With regard to demand, the significant price rise and generally weaker economic growth than in 2010 slowed growth in oil demand, which fell from +2.8 Mb/d in 2010 to +0.5 Mb/d in 2011. In this environment, crude oil prices, which started rising at the beginning of the year, increased from an average of approximately $96/b (ICE Brent 1st Line) in January 2011 to $123/b in April 2011 while the market adjusted to the loss of Libyan supply. Prices fell slightly in the second half of 2011, particularly under the effect of the IEA’s emergency stock release (60 Mb offered, 35 Mb delivered) and the partial resumption of Libyan production. Crude oil prices remained high however, reaching an annual average in 2011 of $110.91/b. As a result of the backwardation in the price structure on the crude oil market for almost the entire year, 2011 was also marked by a sharp fall in OECD oil industry inventories through October 2011 (year-on-year, crude -70 Mb and products -46 Mb), which diminished in the last 2 months of the year with the rise in Libyan crude production (December 2011 year-on-year, crude -26 Mb and products -36 Mb). 2011 also saw a widening of the price differential between WTI crude (confined to the central United States) and Brent crude (delivered in the North Sea and accessible internationally). While Brent was experiencing upward pressure due to the balance of crude oil on the international market, WTI was under downward pressure from a continuous rise in local production and exports from Canada, the combination of which exceeded local refining capacity requirements and potential exports outside the region. The price of WTI thus rose less quickly than Brent, increasing the gap to almost -$28/b in mid-October (at the height of the upward pressure on Brent). The gap was more than halved at the end of the year, particularly with the announcement of the planned reversal of the Seaway pipeline, which should ease the pressure from the surplus of crude weighing down markets in the central United States. Shipping TOTAL’s Shipping division arranges the transportation of crude oil and refined products necessary to develop the Group’s activities. These needs are met through transactions on the spot market and the development of a balanced time charter policy. It has a rigorous safety policy that is due mainly to the strict selection of the vessels the division charters. Like a certain number of other oil companies and shipowners, the Group uses freight rate derivative contracts in its shipping activity to adjust its exposure to freight rate fluctuations. In 2011, TOTAL’s Shipping division chartered approximately 3,000 voyages to transport approximately 110 Mt of crude oil and refined products. As of December 31, 2011, it employed a fleet of fifty vessels chartered under long-term or medium-term agreements (including eight LPG carriers), of which none is single-hulled. The fleet has an average age of approximately five years. Freight rates average of three representative routes for crude transportation | | | | | | | | | | | | | | | | | | | | | | | | | | | | | | | | | | | | | | | 2011 | | | 2010 | | | 2009 | | | min 2011 | | | max 2011 | | VLCC Ras Tanura Chiba — BITR(a) | | | ($/t | ) | | | 11.99 | | | | 13.41 | | | | 10.43 | | | | 9.32 | | | | (Oct. 10 | ) | | | 18.54 | | | | (Feb. 15 | ) | Suezmax Bonny Philadelphia-BITR | | | ($/t | ) | | | 13.86 | | | | 14.50 | | | | 12.75 | | | | 10.23 | | | | (Jan. 20 | ) | | | 19.85 | | | | (Mar. 22 | ) | Aframax Sullom Voe Wilhemshaven-BITR | | | ($/t | ) | | | 6.51 | | | | 6.39 | | | | 5.20 | | | | 5.04 | | | | (Jan. 17 | ) | | | 9.46 | | | | (Mar. 4 | ) |
| (a) | VLCC: Very Large Crude Carrier. Data estimated from BITR market quotations. BITR: Baltic International Tanker Routes. |
2011 was a particularly eventful and difficult period for oil shipping activities. During the first half of 2011, events in Japan and North Africa had a strong impact on crude oil imports. Requirements in Japan fell suddenly and very markedly, but were quickly restored and returned to almost pre-crisis levels by the end of 2011. In the end, the impact on demand for shipping was relatively limited. In the Mediterranean, the shutdown of Libyan production resulted in the rebalancing of demand for long-haul VLCC shipments: imports, particularly to Europe, were offset by supply from further away, thus increasing the demand for transportation. On a more global level, the market was buoyed by demand from China, which is still growing strongly, and to a lesser extent the United States. Despite this generally favorable demand structure, the freight market operated at overcapacity for most of 2011. Very few ships were decommissioned and 2011 saw a steady stream of new vessels being delivered as a result of the many orders placed by shipowners in 2007 and 2008. This situation severely damaged the fundamentals of the freight market for crude oil transport. Following the extremely cold weather at the beginning of 2011, which sustained rates for a time, there was a collapse in the second quarter that left the market at a historic low. With regard to the product tanker market, the situation remains poor worldwide, with transatlantic traffic to the United States particularly slow. CHEMICALS The 2011 Chemicals segment included the Base Chemicals (petrochemicals and fertilizers businesses) and Specialty Chemicals (elastomer processing, adhesives and electroplating chemistry businesses) divisions. TOTAL is one of the world’s largest integrated chemical producers.(1) In October 2011, the Group announced a proposed reorganization of its Downstream and Chemicals segments. The procedure for informing and consulting with employee representatives took place and the reorganization became effective on January 1, 2012. This led to organizational changes, with the creation of: A Refining & Chemicalssegment, a large industrial center that encompasses refining, petrochemicals, fertilizers and specialty chemicals operations. This | | segment also includes oil trading and shipping activities. |
A Supply & Marketing segment, which is dedicated to worldwide supply and marketing activities in the oil products field. The Chemicals activities described below, including the data as of December 31, 2011, are presented based on the organization in effect up to December 31, 2011. Base Chemicals The Base Chemicals division includes TOTAL’s petrochemicals and fertilizers activities. In 2011, the Base Chemicals division’s sales were€12.7 billion, compared to€10.7 billion in 2010 and€8.7 billion in 2009. Petrochemicals BREAKDOWN OF TOTAL’S MAIN PRODUCTION CAPACITIES | | | | | | | | | | | | | | | | | | | | | | | | | | (in thousands of tons) | | 2011 | | | 2010 | | | 2009 | | | | Europe | | | North America | | | Asia and Middle
East(a) | | | Worldwide | | | Worldwide | | | Worldwide | | Olefins(b) | | | 4,695 | | | | 1,195 | | | | 1,460 | | | | 7,350 | | | | 7,190 | | | | 6,895 | | Aromatics | | | 2,500 | | | | 940 | | | | 770 | | | | 4,210 | | | | 4,195 | | | | 4,195 | | Polyethylene | | | 1,180 | | | | 440 | | | | 520 | | | | 2,140 | | | | 2,140 | | | | 2,040 | | Polypropylene | | | 1,315 | | | | 1,175 | | | | 345 | | | | 2,835 | | | | 2,780 | | | | 2,780 | | Styrenics(c) | | | 1,150 | | | | 1,260 | | | | 730 | | | | 3,140 | | | | 2,950 | | | | 3,090 | |
| (a) | Including minority interests in Qatar and 50% of Samsung-Total Petrochemicals capacities. |
Shipping(b)The Shipping division arranges the transportation of crude oil
| Ethylene, propylene and refined products necessary for the Group’s activities. The Shipping division provides the wide range of shipping services required by the Group to develop its activitiesbutadiene. |
| (c) | Styrene and maintains a rigorous safety policy. Like a certain number of other oil companies and shipowners, the Group uses freight rate derivative contracts in its shipping activity to adjust its exposure to freight-rate fluctuations.In 2008, the Shipping division of the Group chartered 3,182 voyages to transport approximately 128 Mt of oil. As of December 31, 2008, the Group employed a fleet of sixty-two vessels chartered under long-term or medium-term agreements (including six LPG carriers). The fleet, consisting entirely of double-hulled vessels, has an average age of approximately five years.
While the beginning of the year was marked by relatively low freight-rate levels, the shrinkage in the freight market in 2008, particularly between the end of April and the beginning of August, led to historically high freight-rate levels.
On route TD3 (transportation of crude, Persian Gulf -Japan, VLCC), spot interest rates averaged WS209(1) between May and July (compared to an average of WS106 over the 2003-2007 period). Daily average income on TD3 from May to July exceeded $158,000/d (compared to approximately $61,000/d over the 2003- 2007 period). Consistent with past experience, freightpolystyrene.
|
The petrochemicals business includes base petrochemicals (olefins and aromatics) and their polymer derivatives (polyolefins and styrenics). InEurope, the main petrochemical sites are located in Belgium, in Antwerp (steam crackers, polyethylene) and Feluy (polypropylene, polystyrene), and in France, in Carling (steam cracker, polyethylene, polystyrene), Feyzin (steam cracker), Gonfreville (steam crackers, styrene, polyolefins, polystyrene) and Lavéra (steam cracker, polypropylene). In theUnited States, the main petrochemical sites are located in Carville, Louisiana (styrene, polystyrene), and in Texas, in Bayport (polyethylene), La Porte (polypropylene) and Port Arthur (steam cracker, butadiene). InAsia, TOTAL owns, in partnership with Samsung, a 50% interest in the petrochemical site located in Daesan, South Korea (steam cracker, styrene, paraxylene, polyolefins). The Group is also active through its polystyrene plants located in Singapore and Foshan (China). InQatar, the Group holds interests in two steam crackers and several polyethylene lines. Most of these sites are either adjacent to or connected by pipelines to Group refineries. As a result, most of TOTAL’s petrochemical operations are integrated within refining operations. rates for other ship sizes predominantly followed the trend recorded by VLCCs. Transport of petroleum products also benefited, to a lesser extent, from the general increase of freight rates.
These historically high freight-rate levels can be explained by several factors. Worldwide tanker fleet growth was moderate, notably with a reduction in size of the VLCC fleet during the first three quarters of the year (with zero overall growth in 2008) and a stagnation of the Suezmax fleet over the same period (weak growth in 2008). This is particularly due to the removal of single-hulled tankers from the fleet for conversion into dry bulks. The use of several VLCCs to store Iranian crude between June and August 2008 also limited the effective tonnage (40 Mb at the beginning of June,i.e., the equivalent of nearly twenty VLCCs).
In addition, demand for transport in 2008 remained strong, in particular during the summer months due to Saudi Arabia’s increased production as from July, which led to a growth in demand for crude transport, especially on long-haul VLCC flows from the Persian Gulf.
From the end of August 2008, market trends reversed. The decrease in global oil demand due to the global economic crisis led the OPEC countries to cut production, resulting in a decrease in crude transport demand. As offered tonnage levels increased and demand remained stable, the surplus in tonnage increased, leading to a drop in spot freight rates.
Chemicals
The Chemicals segment includes the Base Chemicals and Specialty Chemicals divisions:
Base Chemicals encompasses the Group’s petrochemicals and fertilizers activities; and
Specialty Chemicals encompasses the Group’s rubber processing, resins, adhesives and electroplating activities.
TOTAL is one of the world’s largest integrated chemical producers.(2)On May 12, 2006, TOTAL’s shareholders approved the spin-off of Arkema, which, since October 1, 2004, included vinyl products, industrial intermediates and performance products. Arkema has been listed on Euronext Paris since May 18, 2006.
The Chemicals segment improved its safety performance in 2008 by focusing on on-the-job safety, safety management systems and major risk prevention.
(1)
| WS (Worldscale rate): "Worldscale" refers to the "New Worldwide Tanker Nominal Freight Scale," an index intended to permit the comparison of freight rates for various size tanker routes. A particular route’s "Worldscale Rate" represents a voyage charter rate for a hypothetical 75,000 dwt tanker on such route, with Worldscale 100 representing the break-even cost for such a tanker on that route. Worldscale Rates are calculated in USD per ton of crude oil and are updated annually.
|
(2)(1) | Based on publicly available information, consolidated sales. |
Base Chemicals
The Base Chemicals division includes TOTAL’s Petrochemicals and Fertilizers activities.
2008 sales amounted to 13.18 B€, compared to 12.56 B€ in 2007 and 12.01 B€ in 2006. Adjusted net operating income decreased by 25% in 2008 compared to 2007, after an 11% decrease in 2007 compared to 2006. This change primarily reflects the fall in petrochemicals margins in the first half 2008 due to the significant increase in the price of naphtha and the
decrease in sales volume of polymers stemming from the global economic slowdown. In petrochemicals, the Group’s operations in Qatar helped to offset the decrease in results in the mature markets of Europe and the United States. The Fertilizers activity benefited from a favorable environment and an improvement of its industrial operations, which contributed to the significant recovery of its results in 2008.
Petrochemicals
TOTAL’S PRODUCTION CAPACITIES BY
MAIN PRODUCT GROUPS AND REGIONS
| | | | | | | | | | | | | | | | 2008 | | 2007 | | 2006 | | (kt/y) | | Europe | | North
America | | Asia and
Middle
East(c) | | Worldwide | | Worldwide | | Worldwide | Olefins(a) | | 5,085 | | 1,195 | | 1,005 | | 7,285 | | 7,175 | | 7,035 | Aromatics | | 2,665 | | 940 | | 755 | | 4,360 | | 4,335 | | 4,255 | Polyethylene | | 1,315 | | 440 | | 280 | | 2,035 | | 2,035 | | 2,035 | Polypropylene | | 1,275 | | 1,180 | | 295 | | 2,750 | | 2,575 | | 2,420 | Styrenics(b) | | 1,240 | | 1,350 | | 630 | | 3,220 | | 3,160 | | 3,105 |
(a) | Ethylene, propylene and butadiene. |
(b) | Styrene, polystyrene and elastomers (activity discontinued at the end of 2006). |
(c) | Including minority interests in Qatar and 50% of Samsung-Total Petrochemicals capacities in Daesan (South Korea). |
The Petrochemicals activities of Total Petrochemicals include base petrochemicals (olefins and aromatics) and their derivatives (polyethylene, polypropylene and styrenics).
TOTAL’s main petrochemicals sites are located in Belgium (Antwerp, Feluy), France (Gonfreville, Carling, Lavéra, Feyzin), the United States (Port Arthur, La Porte and Bayport in Texas and Carville in Louisiana), Singapore and China (Foshan). Most of these sites are either adjacent to or connected by pipelines to Group refineries. As a result, most of TOTAL’s petrochemicals activities are closely integrated within the Group’s refining operations.
TOTAL owns a 50% interest in the Daesan petrochemicals site in South Korea, in partnership with Samsung. This integrated site is located 400 km off the Chinese coast.
TOTAL also holds a 20% interest in a site with a steam cracker and two polyethylene units in Mesaieed, Qatar.
TOTAL continues to strengthen its leadership positions in the industry by focusing on the following three main strategic areas: InEurope, TOTAL is improving the competitiveness of its long-established sites notably through cost management, better energy efficiency at its facilities and increased flexibility in the choice of feedstock. In an increasingly competitive environment, the Group launched two reorganization plans mainly for the Carling (eastern France) and Gonfreville (northwestern France) sites: TOTAL has continued to strengthen its leadership positions in the industry by focusing on the following strategic areas:
In mature markets, TOTAL is improving the competitiveness of its sites notably through continued improvement of energy efficiency and industrial safety at its facilities. The reorganization plans of 2006 (approved) and 2009 (presented) for the Carling and Gonfreville sites in France are part of this strategy.
| – | | The first plan, callslaunched in 2006, called for the closingclosure of aone of the steam crackercrackers and the styrene plant at Carling and the construction of a new world-class(1)(1) styrene plant at Gonfreville to replace the existing one on this site. Implementation of thisplant closed in late 2008. The reorganization plan is expected to bewas completed in the first halfquarter of 2009. |
| – | | In addition,The second plan, launched in 2009, is a consolidation project to improve the Group presented in March 2009sites’ competitiveness. This project includes a second plan to upgrade itsthe Group’s most efficient units by investing approximately€230 million over three years to increase energy efficiency and consolidate its petrochemicals competitiveness in France. As part of the project, approximately 230 M€€steam cracker and the high-density polyethylene unit in Gonfreville, and to consolidate polystyrene production at the Carling facility. It also includes the shutdown of structurally loss-making units, effective from the end of 2009: two low-density polyethylene lines, one in Carling and one in Gonfreville, and a polystyrene line in Gonfreville. This reorganization plan also impacted the support services at both sites and the central services at Total Petrochemicals France.
|
Following its sole customer’s termination of the supply contract for the secondary butyl alcohol produced at the Notre-Dame-de-Gravenchon facility in Normandy, this dedicated facility had to be closed in the second half of 2010. At the end of 2011, TOTAL signed an agreement relating to the acquisition of 35% of ExxonMobil’s stake in Fina Antwerp Olefins, Europe’s second largest base petrochemicals (monomers) production plant. Following approval by the relevant authorities, the transaction was finalized in February 2012 and TOTAL became the sole shareholder in Fina Antwerp Olefins on March 1, 2012. The acquisition will open new opportunities to strengthen the competitiveness of the assets and to pursue integration which is one of the foundations of Total’s strategy. In theUnited States, TOTAL and BASF purchased in 2011 Shell’s stake in Sabina, one of the largest butadiene production plants in the world. TOTAL and BASF are now the only two shareholders in Sabina, with stakes of 40% and 60%, respectively. This new structure will allow for increased synergies with the TOTAL refinery and the jointly-owned steam cracker (TOTAL 40%, BASF 60%) located on the same site in Port Arthur, Texas. TOTAL is continuing to expand in growth areas. InAsia, the Samsung-Total Petrochemicals Co. Ltd joint venture (TOTAL, 50%) completed in mid-2011 the first debottlenecking phase of the units at the Daesan site in South Korea, with the aim of bringing them to full capacity. This first phase included increasing the capacity of the steam cracker to 1 Mt/y and the polyolefin units to 1,150 kt/y. The second phase is expected to take place in September 2012 and involves increasing the capacity of the paraxylene unit to 700 kt/y. In addition, to keep up with growth on the Asian markets, two major investments have been approved for planned start-up in 2014: a new 240 kt/y EVA(2) unit and a new aromatic unit with a capacity of 1.5 Mt/y of paraxylene and benzene, the feedstock of which will be supplied by a condensate splitter that will also produce jet fuel and diesel. As a result, the site’s paraxylene production capacity will be increased to 1.8 Mt/y. In theMiddle East, the 700 kt/y paraxylene unit at the Jubail refinery in Saudi Arabia is under construction. This world-class unit is mainly intended to supply the Asian market. Start-up is scheduled for 2013. TOTAL is developing sites in countries with favorable access to raw materials. InQatar, through its interest in Qatofin and Qapco, TOTAL holds a 49% interest in a world-class linear low-density polyethylene plant with a capacity of 450 kt/y in Mesaieed. This unit, operated by Qatofin, started up in 2009. The Group also holds a 22% interest in an ethane-based steam cracker in Ras Laffan designed for processing 1.3 Mt/y of ethylene. The steam cracker started up in March 2010. In | (1) | Facilities ranking among the first quartile for production capacities based on publicly available information. |
will be invested to bring to the most efficient level the energy efficiency and competitive strength of the steamcracker and high-density polyethylene (HDPE) unit in Gonfreville and to consolidate polystyrene production at the Carling facility. It will also lead to the closure of structurally loss-making units: a low-density polyethylene line in Carling in eastern France and a low-density polyethylene line and a polystyrene line in Gonfreville in northwestern France. This reorganization plan is also intended to improve the efficiency of support services and central services.
Furthermore, following the sole customer’s termination of the supply contract for the secondary butyl alcohol produced at the Notre-Dame-de-Gravenchon facility in northwestern France, this dedicated facility will have to be closed. Implementation of this project is subject to prior consultation with employee representatives.
Finally, debottlenecking operations conducted in 2008 at the Feluy (Belgium), La Porte and Port Arthur (Texas, United States) sites are expected to strengthen the competitiveness of these sites.
•
| | In Asia, the principal growth area for demand for petrochemicals, Samsung-Total Petrochemicals Co. Ltd completed in 2008 the first modernization phase of the Daesan site in South Korea. This major development increased the site’s initial production capacity by nearly one-third by expanding the steam cracking and styrene units, by building a new polypropylene line in 2007 and by starting up a new metathesis(1) plant in 2008. The project was completed on time and on budget.
|
•
| | In May 2008, the project to build a paraxylene plant in Saudi Arabia was confirmed by both partners, TOTAL and Saudi Aramco. This project, carried out in cooperation with the Group’s Refining & Marketing division, is expected to lead to the construction of a world-class(2) paraxylene plant to supply the Asian market. Start-up of this project is scheduled for 2013.
|
TOTAL continues to develop sites in countries with favorable access to raw materials.
In Qatar, where the Group has been present since 1974 through its 20% interest in Qapco, TOTAL’s 49% affiliate Qatofin is building an ethane-based steam cracker at Ras Laffan, with a production capacity of 1.3 Mt, and a new world-class(2) linear low-density polyethylene plant in Mesaieed.
These two units are scheduled to come onstream in the second half 2009. In addition, Qapco’s existing
steam cracker in Mesaieed was debottlenecked and its production capacity brought to 720 kt/y in August 2007. Qapco expects to build a new low-density polyethylene unit whose commissioning is scheduled in 2011.
| Pursuant to the contract signed in July 2007, TOTAL is continuing its partnership with Sonatrach, the Algerian national oil company, to build a petrochemicals site in Arzew (Algeria). The project includes an ethane-based steam cracker with a production capacity of 1.1 Mt, two polyethylene units and a monoethylene glycol production unit. This world-class(2) project, with favorable access to one of the last particularly competitive sources of relevant raw materials, is ideally located to supply Europe, the Americas and Asia.In addition, TOTAL inaugurated in October 2008 a pilot MTO plant (Methanol to Olefins) at its Feluy site (Belgium). This research project, one of the Group’s most important research projects, is intended to assess, on a semi-industrial scale, the technical and economical feasibility of producing olefins from methanol derived from natural gas, as well as from coal and biomass, and to consider new methods to produce polyolefins.
On all of TOTAL’s petrochemicals sites, the progress realized in 2008 with respect to industrial security and environmental protection was in-line with the Group’s annual objectives.
Base petrochemicals
Base petrochemicals include olefins and aromatics produced by steam cracking petroleum cuts, mainly naphtha, as well as propylene and aromatics manufactured in the Group’s refineries. The economic environment for these activities is strongly influenced by supply and demand and the evolution of the price of naphtha, the principal raw material used.
2008 was marked by highly volatile commodity prices combined with a decrease of demand due to the global economic slowdown.
Olefins production decreased by 2% in 2008 compared to 2007, after a 2% increase in 2007 compared to 2006.
Polyethylene
Polyethylene is a plastic produced by the polymerization of ethylene manufactured in the Group’s steam crackers. It is primarily intended for the packaging, automotive, food, cable and pipe markets. Margins are strongly influenced by the level of demand and by competition from expanding production in the Middle East, which takes advantage of favorable access to the raw material, ethane, to produce ethylene.
(1) | Conversion of ethylene and butene into propylene.Ethylene Vinyl Acetate. |
(2) | Facilities ranking among the first quartile for production capacities based on publicly available information. |
addition, construction of a 300 kt/y low-density polyethylene line has started at Qapco, in which TOTAL holds a 20% interest, with start-up scheduled for the second quarter of 2012. 2008 was marked by the global economic slowdown and strong decline in mature regions (Europe and the United States). TOTAL’s sales volume dropped by 9% in 2008 compared to 2007 and margins shrank. This pressure on margins is expected to persist during the upcoming years due to competition from new plants in the Middle East and Asia. In this context, TOTAL intends to focus on lowering the break-even points in its plants and strengthening its efforts to better differentiate its range of products.
Polypropylene
Polypropylene is a plastic produced by the polymerization of propylene manufactured in the Group’s steam crackers and refineries. It is primarily intended for the automotive, packaging, carpet, household, appliances, fibers and sanitary goods markets. Margins are mainly influenced by the level of demand and the availability and price of propylene.
2008 was marked by a decline of the polypropylene market, notably in Europe and in the United States, with TOTAL’s sales volume having decreased by 4% compared to 2007. Taking into account increased competition in the years to come from the start-up of new plants in the Middle East, TOTAL benefits from plants whose industrial performance, both in Europe and the United States, places the Group among the industry’s leaders. In this regard, TOTAL successfully achieved capacity increases of 60 kt/y in Feluy (Belgium) and 110 kt/y in La Porte (Texas, United States) in 2008.
Styrenics
This business activity includes the production of styrene and polystyrene. Most of the styrene manufactured by the Group is used to produce polystyrene, a plastic principally used in packaging, domestic appliances, electronics and audio-video. Margins are strongly influenced by the level of polystyrene demand and the price of benzene, which is polystyrene’s principal raw material.
After a slight rise in world demand in 2007, the polystyrene market decreased in 2008, marked by a sharp decline of demand in mature zones and a net slowdown of growth in Asia, notably in China. After two years of slight increases, TOTAL’s polystyrene sales volume decreased by 7% in 2008 compared to 2007.
InChina, TOTAL and China Power Investment signed in November 2010 an agreement to study a project to build a coal-to-olefins plant and a polyolefins plant. TOTAL will bring to this partnership its expertise in the methanol-to-olefins (MTO) and olefin cracking process (OCP) technologies tested extensively at its plant in Feluy, Belgium. Base petrochemicals Base petrochemicals includes olefins and aromatics (monomers) produced by the steam cracking of petroleum cuts, naphtha and LPG, or of gas as well as propylene and aromatics manufactured in the Group’s refineries. The economic environment for these activities is strongly influenced by the balance between supply and demand and changes in feedstock prices, especially naphtha. The market was buoyant in the first half of 2011, followed by a significant slowing in volumes and falling margins, mainly in Europe and the United States, in the second half. Over 2011 as a whole, TOTAL’s production volumes remained stable. TOTAL is expanding its positions in Asia and the Middle East with the start-up of the Ras Laffan steam cracker in 2010 in Qatar and continued investments to increase capacities in South Korea. In Europe and the United States, TOTAL is improving energy efficiency at its sites, strengthening synergies with refining and increasing the flexibility of the steam cracker feedstock. Polyolefins TOTAL’s strategy for polyolefins (polyethylene, polypropylene) is based on lowering the breakeven point of its plants in Europe and the United States and continuing to differentiate its range of products, while meeting new market requirements for sustainable development. The Group is also continuing to expand its activities in growth areas, mainly through its stakes in joint ventures in South Korea and Qatar. Polyethylene: Polyethylene is a plastic resulting from the polymerization of ethylene produced by the Group’s steam crackers. It is primarily intended for the packaging, automotive, food, cable and pipe markets. Margins are strongly influenced by the level of demand and the price of ethylene. In Europe, margins are impacted by competition from expanding production in the Middle East, which benefits from favorable access to ethane, the raw material used in ethylene production. 2011 was marked by a slowdown in growth in demand in all geographical areas and by falling margins, more particularly in the second half. Europe was most affected by this deterioration in the market environment. The Group’s sales volumes increased by 2% in 2011. Polypropylene: Polypropylene is a plastic resulting from the polymerization of propylene produced by the Group’s steam crackers and refineries. It is primarily intended for the automotive, packaging, carpet, household appliances, fibers and hygiene markets. Margins are mainly influenced by the level of demand and the availability and price of propylene. As with polyethylene, 2011 saw a slowdown in growth in worldwide demand and falling margins in the second half of the year. TOTAL’s sales volumes decreased by 2.5% compared to 2010. Styrenics This business activity includes the production of styrene and polystyrene. Most of the styrene manufactured by the Group is used to produce polystyrene, a plastic principally used in food packaging, insulation, refrigeration, domestic appliances and electronic devices. Margins are strongly influenced by the level of polystyrene demand and the price of benzene, which is styrene’s principal raw material. The worldwide styrenics market increased by approximately 2% in 2011, driven by Asia, while the markets in Europe and the United States remained practically stable. Margins were low on the highly competitive European and Asian markets, but remained high in the United States. TOTAL’s polystyrene sales volumes increased by 4% in 2011. The Group continues to expand its styrenics business. In Feluy, Belgium, TOTAL is building a new-generation expandable polystyrene manufacturing plant. Start-up is scheduled for early 2013. The expandable polystyrene is intended for the insulation market, which is experiencing strong growth. In China, TOTAL doubled the capacity of the Foshan compact polystyrene plant to 200 kt/y in early 2011. Fertilizers Through its French subsidiary GPN, TOTAL manufactures and markets nitrogen fertilizers made from natural gas. Margins are strongly influenced by the price of natural gas. 2008 was marked by the significant recovery of GPN’s results. GPN’s sales increased by 47% in 2008 compared to 2007, after a 20% rise in 2007. The rise in global demand for cereals was reflected in a growth of nearly 5% of fertilizer demand in Europe compared to 2007. Improved production of the ammonia plants at Grandpuits and Rouen (France) enabled GPN to take advantage of this favorable environment.
In 2006, the Fertilizers activity launched a major restructuring plan to restore its profitability on a long-term basis:
GPN stopped its production in France of complex fertilizers, made from nitrogen, phosphorus and potassium products, due to the declining market for these products, and closed its plants in Bordeaux, Basse Indre, Rouen and Granville. In addition, TOTAL sold its Dutch affiliate, Zuid Chemie, to Engrais Rosier, in which the Group holds a 57% share, to create a more competitive player in the Benelux market.
•
In 2010 and 2011, GPN’s production was affected by a number of manufacturing incidents that resulted in long shutdowns for maintenance of the Grandpuits and Rouen ammonia plants in France and reduced production at the downstream plants (nitric acid, urea and ammonium nitrate). These incidents adversely affected the results of GPN, which could not take advantage of favorable global market conditions. GPN’s plans were strengthened through two major investments: the construction of a nitric acid plant in Rouen, which started up in the second half of 2009, and a urea plant in Grandpuits, the start-up of which was ongoing in March 2012. This additional urea production will enable GPN to position itself in the growing markets of products that contribute to reducing nitrogen oxide emissions(1): DeNOx® for industrial applications and Adblue® for transportation applications. An Adblue unit has been maintained at Oissel waiting for the start-up of the Grandpuits plant. In France, three obsolete nitric acid units in Rouen and Mazingarbe were closed in 2009 and 2010. GPN’s mines and quarries business at the Mazingarbe site was divested in January 2011. Sales for the divested lines of business were€30 million in 2010. In November 2011, the Group initiated the process of divesting its stake (50%) in Pec-Rhin. Having exercised its pre-emptive right on its partner’s 50%, GPN signed an agreement for the complete divestment of Pec-Rhin. Following approval by the relevant authorities, the disposal was finalized in January 2012. These actions are intended to improve the competitiveness of GPN by regrouping its operations at two sites that have production capacity greater than the European average. | | The Fertilizers activity’s core business, the production of nitrogen fertilizers, was strengthened through a major investment in the construction of two competitive nitric acid plants in Rouen and a urea plant in Grandpuits. Start-up of these plants is expected in the first half 2009. This additional urea production is expected to position GPN on the growing markets for DENOX products for industrial applications and Adblue for transportation applications. These products contribute to reducing nitrogen oxide emissions.(1)
|
In France, the Oissel site and three obsolete nitric acid units in Rouen and Mazingarbe are expected to shut down during 2009.
This plan is expected to improve the competitiveness of GPN by regrouping its operations at three sites, two of which feature a production capacity greater than the European average, as market perspectives remain satisfactory in the medium term.
Specialty Chemicals TOTAL’s Specialty Chemicals division includes elastomer processing (Hutchinson), adhesives (Bostik) and electroplating chemistry (Atotech). It serves the automotive, construction, electronics, aerospace and convenience goods markets, for which marketing, innovation and customer service are key drivers. TOTAL markets specialty products in more than sixty countries and intends to develop by combining organic growth and targeted acquisitions. This development is focused on high-growth markets and the marketing of innovative products with high added value that meet the Group’s sustainable development approach. The Hutchinson consumer goods business (Mapa® and Spontex®) was divested in spring 2010. Sales for the divested lines of business were€530 million in 2009. The Cray Valley coating resins and Sartomer photocure resins businesses were divested in July 2011. Sales for the divested lines of business were€860 million in 2010. The structural and hydrocarbon resins business lines were kept and have been incorporated into the Petrochemicals division. Specialty Chemicals enjoyed a favorable climate in the first three quarters of 2011 due to the resilience of the European and North American markets and continued growth in the emerging countries. The situation deteriorated in the fourth quarter. In this context and on a like-for-like basis (excluding Mapa Spontex and Resins), 2011 sales were€5.3 billion, a 9% increase compared to 2010. Elastomer processing Hutchinson manufactures and markets products derived from elastomer processing that are principally intended for the automotive, aerospace and defense industries. Hutchinson, among the industry’s leaders worldwide(2), provides its customers with innovative solutions in the areas of fluid transfer, air and fluid seals, anti-vibration, sound and thermal insulation, and transmission and mobility. Hutchinson has eighty production sites worldwide, including fifty-two in Europe, fifteen in North America, seven in South America, five in Asia and one in Africa. Hutchinson’s sales were€2.99 billion in 2011, up 10% compared to 2010. Sales for the automotive business increased 11% due to stable sales on the European and North American markets and increased sales on the Latin American and Chinese markets. On the industrial markets, sales increased at a lower rate because of the decline in the business planes, helicopters and defense markets, while sales on other industrial markets (e.g., civil aviation, railway, and offshore) saw similar rises to the automotive business. To strengthen its position in the aerospace industry, in late 2008 Hutchinson acquired Strativer, a French company specialized in the growing composite materials market, and, in early 2011, Hutchinson acquired Kaefer, a German company specialized in aircraft interior equipment (insulation, ventilation ducts, etc.). In the automotive sector, in April 2011 Hutchinson acquired Keum-Ah, a South Korean company specialized in fluid transfer systems. TOTAL’s Specialty Chemicals division includes rubber processing (Hutchinson), resins (Cray Valley, Sartomer and Cook Composites & Polymers), adhesives (Bostik)
and electroplating (Atotech). The division serves consumer and industrial markets for which customer-oriented marketing and service as well as innovation are
(1) | Nitrogen oxide’s| (1) | Nitrogen oxide emissions are noxious to the environment and subject to regulation. |
key drivers. The Group markets specialty products in more than fifty-five countries. Its strategy is to pursue its international expansion by combining internal growth and targeted acquisitions while concentrating
| (2) | Based on growing markets and focusing on the distribution of new products with high added value.In 2008, Specialty Chemicals faced a difficult environment due to the economic slowdown in the United States and Europe. In this adverse environment, Specialty Chemicals’ sales decreased by 4% compared to 2007. Adjusted net operating income decreased by 18% compared to 2007.
Rubber processingpublicly available information, consolidated sales.
Hutchinson manufactures and markets products derived from rubber processing that are principally intended for the automotive, aerospace and defense industries and consumer markets.
|
Hutchinson continues to develop in expanding markets, primarily Eastern Europe, South America and China, relying notably on the Brasov (Romania), Lodz (Poland), Sousse (Tunisia) and Suzhou (China) sites and on the Casa Branca site (Brazil) opened in 2011. Adhesives Bostik is one of the world leaders in the adhesive sector(1)and has significant positions on the industrial, hygiene and construction markets, complemented by both consumer and professional distribution channels. Bostik has forty-six production sites worldwide, including twenty-one in Europe, nine in North America, seven in Asia, six in Australia and New Zealand, two in Africa and one in South America. In 2011, sales were€1.43 billion, up 3% compared to 2010. Bostik continues to strengthen its technological position in the construction and industrial sectors, pursue its program for innovation focused on sustainable development, keep up with its expansion in high-growth countries and improve its operational performance. 2011 saw the start-up of two new production units in Egypt and Vietnam and the opening of a new regional technology center for Asia in Shanghai. In addition, Bostik plans to commission a third production unit in Changshu, China in 2012, which is expected to be Bostik’s largest plant worldwide. In the United States, Bostik acquired StarQuartz in 2011, increasing its range of construction adhesives. Finally, Bostik continued to rationalize its industrial base with the closure of the Ibos site in France, which came into effect at year-end 2011. Electroplating Atotech is the second largest company in the electroplating sector based on worldwide sales(1). It is active on the markets for electronics (printed circuits, semiconductors) and general metal finishing (automotive, construction, furnishing). Atotech has sixteen production sites worldwide, including seven in Asia, six in Europe, two in North America and one in South America. Atotech’s sales were€0.89 billion in 2011, up 14% compared to 2010 due to favorable conditions on all of its markets and a significant increase in equipment sales on the electronics market. In order to strengthen its position on the electronics market, in 2011 Atotech started up a new production unit aimed at the semiconductors market in Neuruppin (Germany) and acquired adhesive technologies (molecular interfaces) in the nanotechnology sector in the United States. Atotech successfully pursued its strategy designed to differentiate its products through a comprehensive service provided to its customers in terms of equipment, processes, design and chemical products and through the development of green, innovative technologies to reduce the environmental footprint. This strategy relies on global coverage provided by its technical centers located near customers. Atotech intends to continue to develop in Asia, which represents almost 60% of its global sales. OTHER MATTERS •
| | In the industrial market (automotive, aerospace, defense and transports), Hutchinson, among the industry’s leaders(1), intends to provide its customers with innovative solutions in the domains of fluid transfer, water and airtightness, transmission, mobility and vibration, sound and thermal insulation.
|
Globally, Hutchinson’s 2008 sales remained at a level similar to 2007 despite an uneven environment for its various activities. Automotive’s sales decreased by 6% compared to 2007 in an increasingly challenging environment, both in North America and in Europe, due to the difficulties faced by the automotive industry. In the other industrial markets, sales increased by more than 15% in 2008 compared to 2007 due to strong demand from the defense industry in the United States and from the aerospace and railway industries in Europe. To strengthen its position in the aerospace industry, Hutchinson acquired late in 2008 a company specialized in the expanding carbon fiber industry.
Throughout 2008, Hutchinson continued to develop in expanding markets, primarily Eastern Europe, South America and China, relying notably on the sites launched in 2006 in Romania (Brasov), Poland (Lodz) and China (Suzhou). To further this strategic objective, Hutchinson is expected to open a new site in Tunisia in 2009.
•
Various factors, including certain events or circumstances discussed below, have affected or may affect TOTAL’s business and results. Exploration and production legal considerations TOTAL’s exploration and production operations are conducted in various countries and are therefore subject to a broad range of regulations. These cover virtually all aspects of exploration and production operations, | | The consumer market is essentially oriented towards two ranges of products: baby care (Nuk® and Tigex®) and household specialties (Mapa® and
|
| Spontex®). These activities depend highly on the level of household consumption. Despite the adverse effects of the economic slowdown that began mid-2008, the baby care sector and the household specialties sector continued to grow in 2008. The purchase of Gerber®’s baby care products in 2008 is expected to consolidate Hutchinson’s leading position(1) in this activity by strengthening its presence in the Western Hemisphere, notably in the United States, Canada and Brazil.
including leasehold rights, production rates, royalties, environmental protection, exports, taxes and foreign exchange rates. The terms of the concessions, licenses, permits and contracts governing the Group’s ownership of oil and gas interests vary from country to country. These concessions, licenses, permits and contracts are generally granted by or entered into with a government entity or a state-owned company and are sometimes entered into with private owners. These arrangements usually take the form of concessions or production sharing contracts. |
Resins
TOTAL produces and markets resins for adhesives, inks, paints, coatings and structural materials through three subsidiaries: Cray Valley, Sartomer, and Cook Composites & Polymers.
Since the middle of 2007, this sector was affected by the slowdown of the U.S. economy. This trend continued in 2008. The decrease in volumes extended to Europe from the middle of 2008. Sales decreased by 9% in 2008 compared to 2007, after a 4% decrease in 2007.
In 2008, Cray Valley continued to streamline its European production.
Cook Composites & Polymers, through its affiliate Composite One, strengthened its composite materials distribution activities in the United States.
In the first quarter 2008, Sartomer started its new plant in Nansha, southern China, to pursue its development in growing markets.
Adhesives
Bostik is one of the world leaders in its sector, based on sales(2), with leading positions in the industrial, hygiene, construction and consumer and professional distribution markets.
In 2008, sales decreased by 6% compared to 2007 but remained relatively stable (-1%) at constant exchange rates.
These results in an adverse economy confirm Bostik’s strategy of strengthening its position in the industrial market, which has been less affected than the construction industry, and continuing its development in growing markets, especially in the Asia-Pacific region.
As a result, new production units were commissioned in China (Zhuhai) and Australia (Sydney).
| (1) | Based on publicly available information, consolidated sales. |
(2) | Based on publicly available information. |
Furthermore, Bostik is actively pursuing its program for innovation and is focusing notably on new products and applications contributing to sustainable development.
Electroplating
Atotech, which encompasses TOTAL’s electroplating activities, is the second largest company in this sector, based on worldwide sales(1). It is active in both the electronics and general metal finishing markets.
The electroplating activities faced a slowdown at the end of 2008 that affected the general metal finishing market,
influenced by the difficulties faced by the automotive industry and the electronics industry. Sales decreased by 4% in 2008 compared to 2007.
During this period of economic slowdown, Atotech intends to pursue a full-service strategy for its customers in terms of equipment, chemical products and global geographical coverage through its technical centers. Major research will continue, notably to bring new solutions that meet the strictest environmental requirements. Finally, Atotech intends to continue its development in Asia, which represents more than 50% of its global sales.
Other Matters
Various factors, including certain events or circumstances discussed below, have affected or may affect TOTAL’s business and results.
Exploration and production legal considerations
TOTAL’s exploration and production activities are conducted in many different countries and are therefore subject to an extremely broad range of regulations. These cover virtually all aspects of exploration and production activities, including matters such as leasehold rights, production rates, royalties, environmental protection, exports, taxes and foreign exchange rates. The terms of the concessions, licenses, permits and contracts governing the Group’s ownership of oil and gas interests vary from country to country. These concessions, licenses, permits and contracts are generally granted by or entered into with a government entity or a state-owned company and are sometimes entered into with private owners. These arrangements usually take the form of concessions or production sharing agreements.
The oil concession agreement remains the traditional model for agreements entered into with States: the oil company owns the assets and the facilities and is entitled to the entire production. In exchange, the operating risks, costs and investments are the oil company’s responsibility and it agrees to remit to the relevant State, usually the owner of the subsoil resources, a production-based royalty, income tax, and possibly other taxes that may apply under local tax legislation.
The production sharing contract (PSC) involves a more complex legal framework than the concession agreement: it defines the terms and conditions of
production sharing and sets the rules governing the cooperation between the company or consortium in possession of the license and the host State, which is generally represented by a state-owned company. The latter can thus be involved in operating decisions, cost accounting and production allocation.
The consortium agrees to undertake and finance all exploration, development and production activities at its own risk. In exchange, it is entitled to a portion of the production, known as “cost oil”, the sale of which should cover all of these expenses (investments and operating costs). The balance of production, known as “profit oil”, is then shared in varying proportions, between the company or consortium, on the one hand, and with the State or the state-owned company, on the other hand.
In some instances, concession agreements and PSCs coexist, sometimes in the same country. Even though other contractual structures still exist, TOTAL’s license portfolio is comprised mainly of concession agreements. In all countries, the authorities of the host State, often assisted by international accounting firms, perform joint venture and PSC cost audits and ensure the observance of contractual obligations.
In some countries, TOTAL has also signed contracts called “contracts for risk services” which are similar to production sharing contracts, with the main difference being that the repayment of expenses and the compensation for services are established on a monetary basis. Current contracts for risk services are backed by a compensation agreement (buyback), which allows TOTAL to receive part of the production equal to the cash value of its expenses and compensation.
Hydrocarbon exploration and production activities are subject to public authorizations (permits), which can be
The oil concession agreement remains the traditional model for agreements entered into with States: the oil company owns the assets and the facilities and is entitled to the entire production. In exchange, the operating risks, costs and investments are the oil company’s responsibility and it agrees to remit to the relevant State, usually the owner of the subsoil resources, a production-based royalty, income tax, and possibly other taxes that may apply under local tax legislation. The production sharing contract (PSC) involves a more complex legal framework than the concession agreement: it defines the terms and conditions of production sharing and sets the rules governing the cooperation between the company or consortium in possession of the license and the host State, which is generally represented by a state-owned company. The latter can thus be involved in operating decisions, cost accounting and production allocation. The consortium agrees to undertake and finance all exploration, development and production activities at its own risk. In exchange, it is entitled to a portion of the production, known as “cost oil”, the sale of which should cover all of these expenses (investments and operating costs). The balance of production, known as “profit oil”, is then shared in varying proportions, between the company or consortium, on the one hand, and with the State or the state-owned company, on the other hand. In some instances, concession agreements and PSCs coexist, sometimes in the same country. Even though there are other contractual models, TOTAL’s license portfolio is comprised mainly of concession agreements. In every country, the authorities of the host State, often assisted by international accounting firms, perform joint venture and PSC cost audits and ensure the observance of contractual obligations. In some countries, TOTAL has also signed contracts called “risked service contracts”, which are similar to production sharing contracts. However, the profit oil is replaced by risked monetary remuneration, agreed by contract, which depends notably on the field performance. Thus, the remuneration under the Iraqi contract is based on an amount calculated per barrel produced. Oil and gas exploration and production activities are subject to authorization granted by public authorities (licenses), which are granted for specific and limited periods of time and include an obligation to return a large portion, or the entire portion in case of failure, of the area covered by the license at the end of the exploration period. TOTAL pays taxes on income generated from its oil and gas production and sales activities under its concessions, production sharing contracts and risked service contracts, as provided for by local regulations. In addition, depending on the country, TOTAL’s production and sales activities may be subject to a number of other taxes, fees and withholdings, including special petroleum taxes and fees. The taxes imposed on oil and gas production and sales activities may be substantially higher than those imposed on other industrial or commercial businesses. The legal framework of TOTAL’s exploration and production activities, established through concessions, licenses, permits and contracts granted by or entered into with a government entity, a state-owned company or, sometimes, private owners, is subject to certain risks that, in certain cases, can reduce or challenge the protections offered by this legal framework. Industrial and environmental considerations TOTAL’s operations involve certain industrial and environmental risks which are inherent in handling, processing and use of products that are flammable, explosive, polluting or toxic. The broad scope of TOTAL’s activities, which include drilling, oil and gas production, on-site processing, transportation, refining and petrochemical activities, storage and distribution of petroleum products, and production of base and specialty chemicals, involve a wide range of operational risks. Among these risks are those of explosion, fire, leakage of toxic products, and pollution. In the transportation area, the type of risk depends not only on the hazardous nature of the products transported, but also on the transportation methods used (mainly pipelines, maritime, river-maritime, rail, road), the volumes involved, and the sensitivity of the regions crossed (quality of infrastructure, population density, environmental considerations). Most of these activities also involve environmental risks related to emissions into the air, water or soil and the production of waste, and also require environmental site remediation and closure and decommissioning after production is discontinued. The industrial events that can have the most significant impact are primarily a major industrial accident (fire, explosion, leakage of highly toxic products) or large-scale accidental pollution. All the risks described correspond to events that could potentially cause injury or death, damage property and business activities, cause environmental damage or harm human health. TOTAL employees, contractors, residents living near the facilities or customers can suffer injuries. Property damage can involve TOTAL’s facilities as well as the property of third parties. The seriousness of the consequences of these events varies according to the vulnerability of the people, ecosystems and business activities impacted, on the one hand, and the number of people in the impact area and the location of the ecosystems and business activities in relation to TOTAL’s facilities or to the trajectory of the products after the event, on the other hand. Moreover, oil and gas exploration and production activities are particularly exposed to risks related to the physical characteristics of an oil or gas field. These risks include eruptions of crude oil or natural gas, which notably could result from drilling into abnormally pressurized hydrocarbon pockets. TOTAL conforms to the REACH regulation, which purpose is to protect health and safety of products and chemical substances producers and users notably by providing detailed information through safety data sheets (SDS/ESDS). Like most other industrial groups, TOTAL is concerned by reports of occupational illnesses, in particular those caused by asbestos exposure. Asbestos exposure has been subject to close monitoring at all of the Group’s business units. As of December 31, 2011, the Group estimates that the ultimate cost of all asbestos-related claims paid or pending is not likely to have a material impact on the Group’s financial situation. TOTAL’s entities actively monitor regulatory developments to comply with local and international rules and standards for the evaluation and management of industrial and environmental risks. In case of operations being stopped, the Group’s environmental contingencies and asset retirement obligations are addressed in “Asset retirement obligation” and “Provisions for environmental contingencies” in Note 19 to the Consolidated Financial Statements. Future expenses related to asset retirement obligations are accounted for in accordance with the principles described in paragraph Q of Note 1 to the Consolidated Financial Statements. Health, safety and environment regulations TOTAL is subject to extensive and increasingly strict health, safety and environmental (“HSE”) regulations in the European Union (“EU”), the United States and the rest of the world. The following is a non-exhaustive list of HSE regulations and directives that affect TOTAL’s operations and products in the EU: (1)The Industrial Emissions Directive (“IED”) entered into force on January 6, 2011, and must be transposed | | Based on publicly available information. |
different for eachinto national legislation by EU Member States by January 7, 2013. This Directive replaced a number of these activities. These permits are granted for limited periods of time and include an obligation to return a large portion, in case of failureexisting industrial emission directives, including the entire portion, of the permit area at the end of the exploration period.
TOTAL is required to pay income tax on income generated from its production and sales activities under its concessions or licenses. In addition, depending on the country, TOTAL’s production and sale activities may be subject to a range of other taxes, fees and withholdings, including special petroleum taxes and fees. The taxes imposed on oil and gas production and sale activities may be substantially higher than those imposed on other businesses.
The legal framework of TOTAL’s exploration and production activities, established through concessions, licenses, permits and contracts granted by or entered into with a government entity, a state-owned company or, sometimes, private owners, is subject to certain risks which in certain cases can diminish or challenge the protections offered by this legal framework.
Industrial and environmental considerations
TOTAL’s activities involve certain industrial and environmental risks which are inherent in the production of products that are flammable, explosive or toxic. Its activities are therefore subject to government regulations concerning environmental protection and industrial safety in most countries. More specifically, in
Europe, TOTAL operates industrial sites that meet the criteria of the European Union Seveso II directive for classification as high-risk sites. Other sites operated by TOTAL in other parts of the world involve similar risks.
The broad scope of TOTAL’s activities, which include drilling, oil and gas production, on-site processing, transportation, refining, petrochemicals activities, storage and distribution of petroleum products, production of base chemical and specialty products, involve a wide range of operational risks. Among these risks are those of explosion, fire or leakage of toxic products. In the transportation area, the type of risks depends not only on the hazardous nature of the products transported, but also on the transportation methods used (mainly pipelines, maritime, river-maritime, rail, road), the volumes involved, and the sensitivity of the regions through which the transport passes (population density, environmental considerations).
Most of these activities involve environmental risks related to emissions into the air, water or soil and the creation of waste, and also require environmental site remediation and closure and decommissioning after production is discontinued.
Certain branches or activities face specific risks. In oil and gas exploration and production, there are risks
related to the physical characteristics of an oil or gas field. These include eruptions of crude oil or of natural gas, discovery of hydrocarbon pockets with abnormal pressure, crumbling of well openings, leaks generating toxic risks and risks of fire or explosion. All these events could possibly damage or even destroy crude oil or natural gas wells as well as related equipment and other property, cause injury or even death, lead to an interruption of activity or cause environmental damage. In addition, since exploration and production activities may take place on sites that are ecologically sensitive (tropical forest, marine environment, etc.), each site requires a specific approach to avoid or minimize the impact on the related ecosystem, biodiversity and human health.
TOTAL’s activities in the Chemicals segment and the Refining & Marketing division may also have health, safety and environmental risks related to the overall life cycle of the products manufactured. These risks can arise from the intrinsic characteristics of the products involved, which may, for example, be flammable, toxic, or result in long-term environmental impacts such as greenhouse gas emissions. Risks of facility contamination and off-site impacts may also arise from emissions and discharges resulting from processing or refining, and from recycling or disposing of materials and wastes at the end of their useful life.
Health, safety and environment regulations
TOTAL is subject in general to extensive and increasingly strict environmental regulation in the European Union. Significant directives which apply to its operations and products, particularly refining and marketing, but also its chemicals and, to a lesser extent, its upstream business, are:
The directive for a system of Integrated Pollution Prevention and Control (IPPC), a cost/benefit framework used to comprehensively assessDirective (2008/1/EC — “IPPC”) and the environmental quality standards, prior environmental impacts, and potential additional emissions limits on, large industrial plants, including its refineries and chemical sites.
Air Quality Framework Directive and related directives on ambient air quality assessment and management, which, among other things, limit emissions for sulfur dioxide, oxides of nitrogen, particulate matter, lead, carbon monoxide, benzene and ozone.
The Sulfur Content Directive, under which sulfur in diesel fuel has been limited to 0.2% since July 2000, and 0.1% as of January 2008. Since January 2003, sulfur in heavy fuel oil has been limited to 1%, with certain exceptions for combustion plants provided that local air quality standards are met.
The Large Combustion Plant Directive a directive which limits certain emissions from large combustion plants, including sulfur dioxide, nitrogen oxides and particulates; this directive became effective in 2008.(2001/80/EC).
|
By imposing the reduction of emissions from industrial installations, the IED will progressively result in stricter emission limits on some of TOTAL’s facilities by making compulsory certain rules described in BREFs (Reference documents on Best Available Techniques). The Air Quality Framework Directive (2008/50/CE) and related directives on ambient air quality assessment and management, among other things, limit emissions of sulphur dioxide, nitrogen dioxide and oxides of nitrogen, particulate matter, lead, carbon monoxide, benzene and ozone. Existing directives controlling and limiting exhaust emissions from cars and other motor vehicles are expected to continue to become more stringent over time. Since 2009, a maximum sulphur content of 10 ppm is mandatory throughout the EU. The Sulphur Content Directive (1999/32/EC, as amended) limits sulphur in diesel fuel to 0.1% (since January 2008) and limits sulphur in heavy fuel oil to 1% (since January 2003), with certain exceptions for combustion plants provided that local air quality standards are met. The 1996 Major Hazards Directive (Seveso II) requires emergency planning, public disclosure of emergency plans, assessment of hazards and effective emergency management systems. A revision process is currently pending to strengthen rules on the control of major accident hazards involving chemicals. The revision will align the legislation to changes in EU chemicals law and will clarify and update other provisions, including introducing stricter inspection standards and improving the level and quality of information available to the public in the event of an accident. The new directive is expected to apply from June 1, 2015. In October 2011, the European Commission proposed a regulation on the safety of offshore oil and gas activities. The regulation introduces rules for the effective prevention of and response to a major accident that would be immediately applicable to new installations and with transitional periods for existing installations. Numerous directives regulate the classification, labeling and packaging of chemical substances and
| | Automobile emission directives which control and limit exhaust emissions from cars and other motor vehicles. Under these directives, emission controls will continue to become more stringent over time. Since 2005, maximum sulfur levels for gasoline and diesel fuels have been 50 ppm and, beginning in 2009, a maximum sulfur content of 10 ppm will be mandatory throughout the EU.
The directive, adopted in September 2003, implementing the Kyoto Protocol within the European Union by establishing a system for greenhouse gas emissions quotas. This system, which entered into effect in January 2005, requires the Member States of the European Union to prepare quotas for industrial activities, in particular the energy sector, and to deliver carbon dioxide emissions permits based on these quotas.
The Major Hazards Directive, which requires emergency planning, public disclosure of emergency plans, assessment of hazards, and effective emergency management systems.
The Framework Directive on Waste Disposal is intended to ensure that waste is recovered or disposed of without endangering human health and without using processes or methods that could unduly harm the environment. Numerous related directives regulate specific categories of waste. In November 2008, the Framework Directive on Waste Disposal was partially modified by the Directive on Waste 2008/98, which features more precise definitions and stronger provisions. This directive is expected to completely enter into force and replace the Framework Directive and certain other directives by 2010.
Maritime oil spill directives, a number of which were passed in the wake of the Erika spill. Recent regulations require that tankers have double hulls and mandate improvements to navigation practices in the English Channel.
Numerous water directives impose water quality standards based on the various uses of inland and coastal waters, including ground water, by setting limits on the discharges of many dangerous substances and by imposing information gathering and reporting requirements.
Adopted and effective in 2003, a comprehensive framework water directive has begun progressively replacing the numerous existing directives with a comprehensive set of requirements, including additional regulations obligating member countries to classify all water courses according to their biological, chemical and ecological quality; and to completely ban the discharges of approximately thirty toxic substances by 2017.
Numerous directives regulating the classification, labeling and packaging of chemical substances and their preparation, as well as restrictingrestrict and banningban the use of certain chemical substances and products.
|
On the one hand, the EU Parliament and Council adopted a regulation in December 2008 (now in force) on the Classification, Labelling and Packaging of Substances and Mixtures that incorporates the classification criteria and labelling rules agreed at the UN level (the so-called Globally Harmonized System of Classification and Labelling of Chemicals (GHS)). On the other hand, the EU Member States, the European Commission and the European Chemical Agency are in the process of implementing the regulation adopted in 2006 for the Registration, Evaluation and Authorization of Chemicals (REACH) that replaces or complements the existing rules in this area. REACH required the pre-registration of chemical substances manufactured and imported into the EU by December 1, 2008, to qualify for full registration under a phase in during the period 2010-2018. This regulation requires the registration and identification of chemical substances manufactured or imported in EU Member States, and can result in restrictions on the sales or uses of such substances. GHS and REACH will require us to evaluate the hazards of our chemicals and products and may result in future changes to warning labels and material safety data sheets. The Framework Directive on Waste Disposal is intended to ensure that waste is recovered or disposed of without endangering human health and without using processes or methods that could unduly harm the environment. Numerous related directives regulate specific categories of waste. In November 2008, the Framework Directive on Waste Disposal was partially modified by the Directive on Waste 2008/98, which features more precise definitions and stronger provisions. Transposition of this Directive in France occurred with the Ordinance of December 17, 2010. A number of Maritime Safety Directives were passed in the wake of the Erika and Prestige spills, and implemented in France by Ordinance n° 2011-635 dated June 9, 2011. Those regulations, found in the three Maritime Safety Packages, require that tankers have double hulls and that ship owners acquire improved insurance coverage, mandate improvements to traffic monitoring, accident investigations and in-port vessel inspection (Port State Control: objective of 100% inspection in the EU), and further regulate organizations that inspect and confirm conformity to applicable regulations (Classification Societies). The last package will enter into force in 2012. Numerous directives impose water quality standards based on the various uses of inland and coastal waters, including ground water, by setting limits on the discharges of many dangerous substances and by imposing information gathering and reporting requirements. Adopted and effective since 2000, a comprehensive Water Framework Directive is progressively replacing numerous existing directives with a comprehensive set of requirements, including additional regulations obligating member countries to classify all water courses according to their biological, chemical and ecological quality, and to completely ban the discharges of approximately thirty toxic substances by 2017. The law n° 2011-835 was adopted in France in July 2011 to prohibit the exploration and operation of shale gas by hydro-fracking technique and to repeal the exclusive research permits for projects using this technique. Consequently, the exclusive research permits issued to TOTAL at Montelimar (in the south of France) were repealed by the French Government. An administrative procedure is currently pending against this repeal. In March 2004, the EU adopted a Directive on Environmental Liability (2004/35/EC). The Directive seeks to implement a strict liability approach for damage to water resources, soils and protected species and habitats by authorized industrial activities. Directives implementing the Aarhus Convention of June 25, 1998, concerning public information rights and certain public participation rights in a variety of activities affecting the environment were adopted in January and May 2003, respectively. French regulations on public inquiry and impact assessment were adopted in 2011 and will enter into force on June 2012. These regulations aim to reinforce public participation and information rights concerning projects that could affect the environment. In November 2008, the EU adopted a directive on the protection of the environment through criminal law that obliges EU Member States to provide for criminal penalties in respect of serious infringements of EC law (Directive 2008/99/EC). This directive was transposed in France in January 2012. With respect to the climate change issue, numerous initiatives in the EU are pending or currently being revised, including: | – | | A 2003 Directive implementing the Kyoto Protocol within the EU established an emissions trading |
| | scheme effective as of January 2005 for greenhouse gas (“GHG”) emissions quotas. On the basis of this directive, carbon dioxide emissions permits are then delivered. This trading scheme required Member States to prepare, under the supervision of the EU Commission, national allocation plans identifying a global amount of quotas to be shared and delivered for free by the governments to each industrial installation for specific sectors, in particular the energy intensive installations that have to surrender quotas with respect to their annually verified carbon dioxide emissions. In accordance with the 2009 revision of the aforementioned directive, a progressive quota auctioning mechanism is scheduled to be set up in 2013 together with transitional Community-wide rules for harmonized free allocation up to a level based on benchmarks for sectors exposed to international carbon leakage. These changes will end the free allocations for electricity production and have an expanded scope covering additional commercial sectors and emissions. When this system is established, TOTAL’s industrial facilities may incur capital and operating costs to comply with such legislation including the partial acquisition of emissions allowances. |
| – | | The first period of the Kyoto Protocol is reaching an end in 2012. The Cancun UN conference at the end of 2010 reaffirmed the principles of Kyoto, but did not result in the adoption of any new legally binding agreement with respect to the continuation of the Kyoto Protocol. The Durban conference of November 2011 resulted in the Kyoto principles being extended post-2012 to permit the possible adoption by 2015 of another legally-binding international agreement to be signed by the negotiating countries as well as by the United States together with China, India and certain other developing nations. |
| – | | The Climate Action and Renewable Energy Package imposes an EU objective referred to as “3 x 20”, which commits EU Member States by 2020 to reduce overall GHG emissions to at least 20% below 1990 levels, to improve energy efficiency by 20% and to increase renewable energy usage by 20%. In 2011, the European Commission published its “Roadmap for moving to a competitive low-carbon economy in 2050” to look beyond these 2020 objectives and to set out a plan to meet the European Chemical Agencylong-term target of reducing domestic emissions by 80 to 95% by mid-century. The sectors most responsible for emissions in the | Copenhagen are still in the process of implementing a new system for Registration, Evaluation and Authorization of Chemicals (REACH) which replaces or complements the existing rules in this area. REACH was adopted in June 2006 and will require the registration of up to 100,000 chemicals, including intermediaries and polymers. Detailed economic studies have shown that implementing this regulation is expected to involve significant costs and administrative burden.
|
| | EU (i.e., power generation, industry, transport, buildings and construction, as well as agriculture) are charged with making the transition to a low-carbon economy over the coming decades and these issues could affect TOTAL’s operations in the future. |
| – | | In March 2004, the European Union adopted aThe 2009 Directive on Environmental Liability. This directiveCarbon Capture and Storage (CCS) was transposed into EU Member State national legislations in 2007 and 2008, and in France in August 2008. The directive seeks2010. This legal framework forms the basis for developing CCS projects that are expected to implement a strict liability approachserve as one of the most valuable solutions for damage to biodiversity from high-risk operations.
Directives implementing the Aarhus Convention concerning public information rightsreduction of carbon dioxide emissions. Such regulations will have technical and certain public participation rights in a variety of activities affecting the environment were adopted in January and May 2003, respectively.
In November 2008, the European Commission adopted an environmental protection directive which obliges EU Member States to provide for criminal penalties in respect of serious infringements of EC law. Member States must transpose this directive into their national legislation by December 26, 2010.
In the United States, wherefinancial impacts, including on TOTAL’s operations are less extensive than in Europe, TOTAL is also subject to significant environmental and safety regulation.projects.
|
With respect to biodiversity issues, this subject is increasingly taken into consideration. Following the 2010 Nagoya summit, the UN’s 65th General Assembly decided to form the IPBES (Intergovernmental Science-Policy Platform on Biodiversity) to share knowledge and future policies on biodiversity and ecosystem services. The next UN Conference on Sustainable Development (“Rio +20”) is expected to be held in Rio in June 2012 and will focus on two themes: a green economy in the context of sustainable development and poverty eradication, and the institutional framework for sustainable development. In the United States, where TOTAL’s operations are less extensive than in Europe, TOTAL is also subject to significant HSE regulations at both the state and federal levels. Of particular relevance to TOTAL’s lines of business are: • | | The Comprehensive Environmental Response, Compensation, and Liability Act (also known as CERCLA or Superfund), under which waste generators, former and current site owners and operators, and certain other parties can be held jointly and severally liable for the entire cost of remediating active, abandoned or non-operating sites contaminated by releases of hazardous substances regardless of fault or the amount of hazardous substances sent to a site. The U.S. Environmental Protection Agency has authority under Superfund to order responsible parties to clean up contaminated sites and may seek recovery of the government’s response costs from responsible parties. States have similar legal authority to compel site investigations and cleanups and to recover costs from responsible parties. The U.S. government and states may also sue responsible parties for injuries to natural resources (e.g., rivers and wetlands) arising from contamination.
|
National and international maritime oil spill laws, regulations and conventions, including the Oil
The Clean Air Act and its regulations, which require, among other measures: stricter phased-in fuel specifications and sulfur reductions; enhanced emissions controls and monitoring at major sources of volatile organic compounds, nitrogen oxides, and other designated hazardous and non-hazardous air pollutants; GHG regulation; stringent pollutant emission limits; construction and operating permits for major air emission sources at chemical plants, refineries, marine and distribution terminals and other facilities; and risk management plans for the handling and storage of hazardous substances. The Clean Water Act, which regulates the discharge of wastewater and other pollutants from both onshore and offshore operations and, among other measures, requires industrial facilities to obtain permits for most wastewater and surface water discharges, install control equipment and treatment systems, implement operational controls, and preventative measures, including spill prevention and control plans and practices to control storm water runoff. | Pollution Act of 1990, which imposes significant oil spill prevention requirements, spill response planning obligations, ship design requirements (including in certain instances double hull requirements), operational restrictions and spill liability for tankers and barges transporting oil, offshore oil platform facilities and onshore terminals.
|
The Clean Air Act and its regulations, which require, among other measures: stricter phased-in fuel specifications and sulphur reductions; enhanced emissions controls and monitoring at major sources of volatile organic compounds, nitrogen oxides, and other specific and hazardous air pollutants; stringent pollutant emission limits; construction and operating permits for major sources at chemical plants, refineries, marine and distribution terminals and other facilities; and risk management plans for the handling and storage of hazardous substances.
The Clean Water Act, which regulates the discharge of wastewater and other pollutants from both onshore and offshore operations and, among other measures, requires industrial facilities to obtain permits for most surface water discharges, install control equipment and treatment systems, implement operational controls, and preventative measures, including spill prevention and control plans and practices to control stormwater runoff.
The Resource Conservation and Recovery Act, (RCRA), which regulates the generation, storage, handling, treatment, transportation and disposal of hazardous waste and imposes corrective action requirements on regulated facilities requiring investigation and remediation of potentially contaminated areas at these facilities. | • | | Other significant U.S. environmental legislation includes the Toxic Substances ControlThe Comprehensive Environmental Response, Compensation, and Liability Act (also known as CERCLA or Superfund), under which regulates the development, testing, import, exportwaste generators, former and introduction of new chemical products into commercecurrent site owners and the Emergency Planningoperators, and Community Right-to-Know Act, which requires emergency planningcertain other parties can be held jointly and spill notification as well as public disclosure of chemical usage and emissions. In addition, the Occupational Safety and Health Act, which imposes workplace safety and health, training and extensive process safety standards to reduce the risks of chemical exposure and injury to employees, has a significant impact on U.S. operations due to the comprehensive nature of its regulations which directly affect numerous aspects of refinery and chemical plant operations.
Environmental regulation of industrial activities in the United States is extensive at both the federal and state levels. One area of particular focusseverally liable for the entire cost of remediating active, abandoned or non-operating sites contaminated by releases of hazardous substances regardless of fault or the amount or share of hazardous substances sent by a party to a site. The U.S. Environmental Protection Agency (“EPA”) has authority under Superfund to order responsible parties to clean up contaminated sites and may seek recovery of the government’s response costs from responsible parties. States have similar legal authority to compel site investigations and cleanups and to recover costs from responsible parties. The U.S. government is emissions of greenhouse gases (primarily carbon dioxide) and their effect on the Earth’s climate. Although emissions of carbon dioxide from industrial processes are not currently regulated, it appears increasingly likely that the U.S. government will, in the future, seekstates may also sue responsible parties under CERCLA for damage to impose restrictions on greenhouse gas
emissions from industrial sources, institute a greenhouse gas cap and trade system for large industrial facilities, or otherwise regulate emissions of carbon dioxide as a criteria pollutant under the Clean Air Act.
Proceedings instituted by governmental authorities are pending or known to be contemplated against certain U.S.-based subsidiaries of TOTAL under applicable environmental laws that could result in monetary sanctions in excess of $100,000. No individual proceeding is, nor are the proceedings as a group, expected to have a material adverse effect on TOTAL’s consolidated financial position or profitability.
Risk evaluation
Prior to developing their activities and then on a regular basis during the operations, business units evaluate the related industrial and environmental risks, taking into account the regulatory requirements of the countries where these activities are located.
On sites with significant technological risks, analyses are performed for new developments, updated in case of planned significant modifications of existing equipment, and periodically re-evaluated. To harmonize these analyses and reinforce risk management, TOTAL has developed a group-wide methodology which is being implemented progressively throughout the sites it operates. In France, all the sites that meet the criteria of the European Union Seveso II directive are developing Risk Management Plans pursuant to the French law of July 30, 2003. Each of these plans will introduce various urban planning measures to reduce risks to urban environments surrounding industrial sites. The texts implementing these aspects of the law of July 30, 2003 were published at the end of 2005 and during 2006.
Similarly, environmental impact studies are done prior to any industrial development with a thorough initial site analysis, taking into account any special sensitivities and plans to prevent and reduce the impact of accidents. These studies also take into account the impact of the activities on the local population, based on a common methodology. In countries where prior authorization and supervision is required, the projects are not undertaken without the authorization of the relevant authorities according to the studies they are provided with.
For new products, risk characterizations and evaluations are performed. Furthermore, life cycle analyses for related risks are performed on certain products to study all the stages of a product’s life cycle from its conception until the end of its useful life.
TOTAL’s entities actively monitor regulatory developments to comply with local and international rules and standards for the evaluation and management of industrial and environmental risks.
The Group’s environmental contingencies and asset retirement obligations are addressed in Note 19 to the Consolidated Financial Statements. Future expenses related to asset retirement obligations are accounted for in accordance with the principles described in paragraph Q of Note 1 to the Consolidated Financial Statements.
Risk management
Risk evaluations lead to the establishment of management measures that are designed to minimize the risks of accidents and to limit their consequences and environmental impacts. These measures concern the equipment design itself, the reinforcement of safety devices, the design of structures to be built and the protection against the consequences of environmental events. Risk evaluations may be accompanied, on a case-by-case basis, by an evaluation of the cost of risk control and impact reduction measures.
TOTAL is working to minimize industrial and environmental risks inherent to its activities by putting in place performance procedures and quality, safety and environmental management systems, as well as by moving towards obtaining certification for or assessment of its management systems (including International Safety Rating System, ISO 14001, European Management and Audit Scheme), by performing detailed inspections and audits, training staff and heightening awareness of all the parties involved, and by an active investment policy.
More specifically, following up on the 2002-2005 plan, an action plan was defined for the 2006-2009 period. This plan is focused on two initiatives for improvement: reducing the frequency and seriousness of on-the-job accidents and strengthening the management of industrial risks. The results related to reducing on-the-job accidents are in line with goals, with a significant decrease in the rate of accidents (with or without time-lost) per million hours worked by nearly 75% between the end of 2001 and the end of 2008. In terms of industrial risks, this plan’s initiatives include specific organization and behavioral plans as well as plans to minimize risks at source and increase safety for people and equipment use.
Several environmental action plans have been put in place in different activities of the Group covering periods up until 2012. These plans are designed to improve environmental performance, particularly regarding the use of natural resources air(e.g., rivers and water pollution, waste production wetlands) arising from contamination.
|
National and international maritime oil spill laws, regulations and conventions, including the Oil Pollution Act of 1990, impose significant oil spill prevention requirements, spill response planning and training obligations, ship design requirements (including phased in double hull requirements for tankers), operational restrictions, spill liability for tankers and barges transporting oil, offshore oil platform facilities and onshore terminals and establishes an oil liability spill fund paid for by taxes on imported and domestic oil. In the wake of the Deepwater Horizon accident, the Bureau of Ocean Energy Management, Regulation and Enforcement was replaced by the Bureau of Ocean Energy Management, which is responsible for managing development of offshore resources, and the Bureau of Safety and Environmental Enforcement (“BSEE”), which is responsible for safety and environmental oversight of offshore oil and gas operations. The BSEE has implemented more stringent permitting requirements and oversight of offshore drilling. Among other changes, well design, casing and cementing standards have been upgraded and compliance must be certified by a professional engineer. In addition, plans must describe containment resources available in case of an underwater blowout | | and treatment,worst case discharge, and site decontamination. They also contain quantified objectives to reduce greenhouse gas emissions, water pollution and sulphur dioxide emissions and to improve energy efficiency. As part of its efforts to reduce greenhouse gases and combat climate change, in December 2006 the Group committed to reducing gas flaring at its Exploration &
Production sites by 50% compared to 2005 volumes by 2012. By the end of 2009, the Group intends to obtain ISO 14001 certification for all of its sites that it considers particularly important to the environment (as of today, 80% of such sites are so certified). More than 250 of the Group’s sites worldwide are certified ISO 14001. These activities are monitored through periodic, coordinated reporting by all Group entities.
The Group believes that, according to its current estimates, contingencies or liabilities related to health, safety and environmental concerns would not have a material impact on its consolidated financial situation, its cash flow or its income. Due to the nature of such concerns, however, it is impossible to predict whether additional future commitments or liabilities could have a material adverse effect on the Group’s activities.
Asbestos
Like many other industrial groups, TOTAL is involved in claims related to occupational diseases caused by asbestos exposure. The circumstances described in these claims generally concern activities prior to the beginning of the 1980s, long before the adoption of more comprehensive bans on the new installation of asbestos-containing products in most of the countries where the Group operates (January 1, 1997 in France). The Group’s various activities are not particularly likely to lead to significant exposure to asbestos-related risks, since this material was generally not used in manufacturing processes, except in limited cases. The main potential sources of exposure are related to the use of certain insulating components in industrial equipment. These components are being gradually eliminated from the Group’s equipment through asbestos-elimination plans that have been underway for several years. However, considering the long period of time that may elapse before the harmful results of exposure to asbestos arise (up to 40 years), TOTAL anticipates that claims may be filed in the years to come. Asbestos-related issues have been subject to close monitoring in all branches of the Group. As of December 31, 2008, the Group estimates that the ultimate cost of all asbestos-related claims paid or pending is not likely to have a material adverse effect on the financial situation of the Group.
Oil and gas exploration and production operations
Oil and gas exploration and production require high levels of investment and are associated with particular risks and opportunities. These activities are subject to risks related specifically to the difficulties of exploring underground, to the characteristics of hydrocarbons and to the physical characteristics of an oil or gas field. Of risks related to oil and gas exploration, geologic risks are the most important.
For example, exploratory wells may not result in the discovery of hydrocarbons, or in amounts that would be insufficient to allow for economic development. Even if an economic analysis of estimated hydrocarbon reserves justifies the development of a discovery, the reserves can prove lower than the estimates during the production process, thus adversely affecting the economic development.
Almost all the exploration and production activities of TOTAL are accompanied by a high level of risk of loss of the invested capital due to the risks related to economic or political factors detailed hereafter. It is impossible to guarantee that new resources of crude oil or of natural gas will be discovered in sufficient amounts to replace the reserves currently being developed, produced and sold to enable TOTAL to recover the capital it has invested.
The development of oil and gas fields, the construction of facilities and the drilling of production or injection wells require advanced technology in order to extract and exploit fossil fuels with complex properties over several decades. The deployment of this technology in such a difficult environment makes cost projections uncertain. TOTAL’s activities can be limited, delayed or cancelled as a result of numerous factors, such as administrative delays, particularly in terms of the host states’ approval processes for development projects, shortages, late delivery of equipment and weather conditions, including the risk of hurricanesoperators in the Gulf of Mexico. Some of these risks may also affect TOTAL’s projectsMexico are required to develop and facilities further down the oilimplement a Safety and gas chain.Environmental Management Systems program.
Economic or political factors
The oil sector is subject to domestic regulations and the intervention of governments
|
Other significant U.S. environmental legislation includes the Toxic Substances Control Act, which regulates the development, testing, import, export and introduction of new chemical products into commerce, and the Emergency Planning and Community Right-to-Know Act, which requires emergency planning and spill notification as well as public disclosure of chemical usage and emissions. TOTAL’s facilities in the United States are also subject to extensive workplace safety regulations promulgated by the Occupational Safety and Health Administration (“OSHA”). Most notable among OSHA regulations is the Process Safety Management of Highly Hazardous Chemicals, a comprehensive regulatory program that requires major industrial sources, including petroleum refineries and chemical manufacturing facilities, to undertake significant hazard assessments during the design of new industrial processes and modifications to existing processes, as well as a comprehensive and continual monitoring and management process for these chemicals. The EPA’s regulation of GHG emissions from industrial sources under the Clean Air Act’s Prevention of Significant Deterioration and Title V operating permit programs formally commenced on January 2, 2011. The authority to regulate GHG emissions under the Clean Air Act is the culmination of several EPA rulemakings promulgated in 2009 and 2010 as a result of the 2007 U.S. Supreme Court decision inMassachusetts v. EPAconfirming the authority of EPA to regulate GHG emissions under the Clean Air Act. Each of these rulemakings is under legal challenge. The EPA may issue future regulations requiring additional industry sectors to report GHG emissions and has indicated its intention to phase in GHG permitting for smaller industrial sources. Various state and regional requirements also govern GHG emissions and additional measures can be expected in the future. Depending upon the outcome of legal challenges and the content of future GHG regulations, TOTAL subsidiaries in the United States may incur additional capital and operating costs to comply with control technology and/or facility upgrade requirements for reducing GHG emissions. TOTAL has investments in the United States in unconventional gas plays that utilize hydraulic fracturing, or “fracking,” a process that involves pumping a mixture of water, sand and chemicals underground at high pressure to fracture rock formations and release natural gas and liquids that are otherwise inaccessible. Currently, regulation of these practices occurs at the state level, although there are a number of federal legislative proposals that could alter the regulatory framework. In addition, various state initiatives could result in stricter regulation of fracking. Increased regulation could affect TOTAL’s operating costs, profitability and future investments in these unconventional gas plays. Proceedings instituted by governmental authorities are pending or known to be contemplated against certain U.S.-based subsidiaries of TOTAL under applicable environmental laws that could result in monetary sanctions in excess of $100,000. No individual proceeding is, nor are the proceedings as a whole, expected to have a material adverse effect on TOTAL’s consolidated financial position or profitability. Management and monitoring of industrial and environmental risks TOTAL policies regarding health, safety and the environment TOTAL has developed a “Health Safety Environment Quality Charter” which sets out the basic principles applicable within the Group regarding the protection of people, property and the environment. This charter is rolled out at several levels within the Group by means of management systems. Along these lines, TOTAL has developed efficient organizations as well as safety, environmental and quality management systems, which it makes every effort to have certified or assessed (standards such as the International Safety Rating System, ISO 14001 and ISO 9001). For example, in 2010, TOTAL received ISO 9001 certification for “development and management of the database of technical businesses” in exploration and production. Assessment As part of its policy, TOTAL systematically assesses risks and impacts in the areas of industrial safety (particularly technological risks), the environment and the protection of workers and local residents: prior to approving new projects, investments, acquisitions and disposals; periodically during operations (safety studies, environmental impact studies, health impact studies and risk prevention plan in France as part of the 2003 legislation on the prevention of major technological risks); prior to introducing new substances to the market (toxicological and ecotoxicological studies and life cycle analyses); and based on the regulatory requirements of the countries where these activities are carried out and generally accepted standards. In countries where prior administrative authorization and supervision is required, projects are not undertaken without the authorization of the relevant authorities and are developed according to the studies provided to the authorities. In particular, TOTAL has developed common methodologies for analyzing technological risks which must gradually be applied to all activities carried out by the Group’s companies. Management TOTAL develops risk management measures based on risk and impact assessments. These measures involve facility and structure design, the reinforcement of safety devices and remedies of environmental degradations. In addition to developing organizations and management systems as described above, TOTAL strives to minimize industrial and environmental risks inherent in its operations by conducting thorough inspections and audits, training personnel and raising awareness among all those involved, and implementing an active investment policy. In addition, performance indicators (in the areas of HSE) and risk monitoring have been put in place, objectives have been set and action plans have been implemented to achieve these objectives. Although the emphasis is on preventing risks, TOTAL takes regular steps to prepare for crisis management based on the risk scenarios identified. In particular, TOTAL has developed emergency plans and procedures to respond to an oil spill or leak. These plans and procedures are specific to each TOTAL affiliate and adapted to its organization, activities and environment, and are consistent with the Group plan. They are reviewed regularly and tested through exercises. At the Group level, TOTAL has set up the alert scheme PARAPOL (Plan to Mobilize Resources Against Pollution) to facilitate crisis management and provide assistance by mobilizing both internal and external resources in the event of pollution of marine, coastal or inland waters, without geographical restriction. The PARAPOL procedure is made available to TOTAL affiliates and its main goal is to facilitate access to internal experts and physical response resources. Furthermore, TOTAL and its affiliates are currently members of certain oil spill cooperatives that are able to provide expertise, resources and equipment in all geographic areas where TOTAL has operations, including in particular Oil Spill Response, CEDRE (Center of documentation, research and experimentation on accidental water pollution) and Clean Caribbean and Americas. Following the blow-out on the Macondo well in the Gulf of Mexico in 2010 (concerning which the Group was not involved), TOTAL created three Task Forces in order to analyze risks and provide recommendations. In Exploration & Production, Task Force No. 1 reviewed the safety aspects of deep offshore drilling operations (wells architecture, design of blow-out preventers, training of personnel based on lessons learned from the serious accidents that occurred recently in the industry). Its efforts have led to the implementation of even more stringent controls and audits on drilling operations. Task Force No. 2, coordinated with the Global Industry Response Group (GIRG) created by the OGP (International Association of Oil and Gas Producers), is studying deep offshore oil capture and containment operations in case of a pollution event in deep waters. In the short term, capture devices will be available in several regions of the world where TOTAL has a strong presence in exploration-production (North Sea, Gulf of Guinea). Task Force No. 3 related to plans to fight accidental spills in order to strengthen the Group’s ability to respond to a major accidental pollution, such as a blow out or a total loss of containment from an FPSO (Floating Production, Storage and Offloading facility). This initiative has led, in particular, to a sharp increase in the volume of dispersants available within the Group. The Group believes that it is impossible to guarantee that the contingencies or liabilities related to the above mentioned health, safety and environmental concerns will not have a material impact on its business, assets and liabilities, consolidated financial situation, cash flow or income in the future. Oil and gas exploration and production operations Oil and gas exploration and production require high levels of investment and are associated with particular risks and opportunities. These activities are subject to risks related specifically to the difficulties of exploring underground, the characteristics of hydrocarbons and the physical characteristics of an oil or gas field. Of risks related to oil and gas exploration, geologic risks are the most important. For example, exploratory wells may not result in the discovery of hydrocarbons, or may result in amounts that would be insufficient to allow for economic development. Even if an economic analysis of estimated hydrocarbon reserves justifies the development of a discovery, the reserves can prove lower than the estimates during the production process, thus adversely affecting the economic development. Almost all the exploration and production operations of TOTAL are accompanied by a high level of risk of loss of the invested capital due to the risks related to economic or political factors detailed hereafter. It is impossible to guarantee that new resources of crude oil or of natural gas will be discovered in sufficient amounts to replace the reserves currently being developed, produced and sold to enable TOTAL to recover the capital it has invested. The development of oil and gas fields, the construction of facilities and the drilling of production or injection wells require advanced technology in order to extract and exploit fossil fuels with complex properties over several decades. The deployment of this technology in such a difficult environment makes cost projections uncertain. TOTAL’s operations can be limited, delayed or canceled as a result of a number of factors, including administrative delays, in particular as part of the host states’ approval processes for development projects, shortages, late delivery of equipment and weather conditions, including the risk of hurricanes in the Gulf of Mexico. Some of these risks may also affect TOTAL’s projects and facilities further down the oil and gas chain. Economic or political factors The oil sector is subject to domestic regulations and the intervention of governments, directly or through state-owned companies, in such areas as: the award of exploration and production interests; authorizations by governments or by a state-controlled partner, in particular for development projects, annual programs or the selection of contractors or suppliers; the imposition of specific drilling obligations; environmental protection controls; control over the development, exploitation and abandonment of a field causing restrictions on production; calculating the costs that may be recovered from the relevant authority and what expenditures are deductible from taxes; cases of expropriation, nationalization or reconsideration of contractual rights. The oil industry is also subject to the payment of royalties and taxes, which may be higher than those applicable to other commercial businesses and which may be subject to material changes by the governments of certain countries. Substantial portions of TOTAL’s oil and gas reserves are located in certain countries that may be considered as politically and economically unstable. Such oil and gas reserves and related operations are subject to certain additional risks, including: the implementation of production and export quotas; the compulsory renegotiation of contracts; the expropriation or nationalization of assets; risks related to changes of local governments or the resulting changes in business customs and practices; currency exchange restrictions; depreciation of assets due to the devaluation of local currencies or other measures taken by governments that might have a significant impact on the value of activities; and losses and decreased activity due to armed conflicts, civil unrest, the actions of terrorist groups or sanctions that target activities or parties of certain countries. TOTAL, like other major international oil companies, has a geographically diverse portfolio of reserves and operational sites, which allows it to conduct its business and financial affairs so as to reduce its exposure to such political and economic risks. However, there can be no assurance that such events will not adversely affect the Group. Business Activities in Cuba, Iran, Sudan and Syria Provided in this section is certain information relating to TOTAL’s activities in Cuba, Iran, Sudan and Syria. For more information on U.S. and EU restrictions relevant to our activities in these jurisdictions, see “Item 3. Key Information — Risk Factors”. Cuba In 2011, TOTAL’s Refining & Marketing division had limited marketing activities for the sale of specialty products to non-state entities in Cuba and paid taxes on such activities. In addition, TOTAL’s Trading & Shipping division purchased hydrocarbons pursuant to spot contracts from a state-controlled entity for approximately€40 million. Iran TOTAL’s Exploration & Production division historically had been active in Iran through buyback contracts. Under such contracts, the contractor is responsible for and finances development operations. Once development is completed, operations are handed over to the national oil company, which then operates the field. The contractor receives payments in cash or in kind to recover its expenditures as well as a remuneration based on the field’s performance. Furthermore, upon the national oil company’s request, a technical services agreement may be implemented in conjunction with a buyback contract to provide qualified personnel and services until full repayment of all amounts due to the contractor. TOTAL entered into such buyback contracts between 1995 and 1999 with respect to the development of four fields: Sirri, South Pars 2 & 3, Balal and Dorood. For all of these contracts, development operations have been completed and TOTAL retains no operational responsibilities. A technical services agreement for the Dorood field expired in December 2010. As TOTAL is no longer involved in the operation of these fields, TOTAL has no information on the production from these fields. Some payments are yet to be reimbursed to TOTAL with respect to South Pars 2 & 3, Balal and Dorood. Since 2011, TOTAL has no production in Iran corresponding to such payments in kind, compared to 2 kboe/d in 2010 and 8 kboe/d in 2009. No royalties or fees are paid by the Group in connection with these buyback and service contracts. In 2011, TOTAL made non-material payments to the Iranian administration with respect to certain taxes and social security. With respect to TOTAL’s Refining & Marketing division’s 2011 activities in Iran, Beh Total, a company held 50/50 by Behran Oil and Total Outre-Mer, a subsidiary of the Group, produced and marketed small quantities of lubricants (20,000 tons) for sale to domestic consumers in Iran. In 2011, revenue generated from Beh Total’s activities was€43.5 million and cash flow was€4.6 million. Beh Total paid approximately€1 million in taxes. TOTAL does not own or operate any refineries or chemicals plants in Iran. In 2011, Beh Total paid€5.6 million of dividends for fiscal year 2010 (share of TOTAL:€2.3 million). In 2011, TOTAL’s Trading & Shipping division purchased in Iran pursuant to a mix of spot and term contracts approximately forty-nine million barrels of hydrocarbons from state-controlled entities for approximately€3.7 billion. Prior to January 23, 2012, TOTAL’s Trading & Shipping division ceased its purchase of Iranian hydrocarbons. Sudan Since the independence of the Republic of South Sudan on July 9, 2011, TOTAL is not present in Sudan. TOTAL holds an interest in Block B in what was, prior to July 9, 2011, the southern region of Sudan. TOTAL disbursed in Sudan between January 1, 2011 and July 8, 2011, approximately $0.7 million as scholarships and social development contributions, as well as contributions to the construction of social infrastructure, schools and water wells along with non-governmental organizations and other stakeholders involved in southern Sudan. For more information on TOTAL’s activities in the Republic of South Sudan, see “Item 4. Business Overview — Republic of South Sudan”. Syria In 2011, TOTAL had two contracts relating to oil and gas exploration & production activities: a Production Sharing Agreement entered into in 1988 (“PSA 1988”) for an initial period of twenty years and renewed at the end of 2008 for an additional 10-year period, and the Tabiyeh Gas Project risked Service Contract (the “Tabiyeh contract”) effective from the end of October 2009. TOTAL owns 100% of the rights and obligations under PSA 1988, and operated until early December 2011 on various oil fields in the Deir Ez Zor area through a dedicated non-profit operating company owned equally by the Group and the state-owned General Petroleum Corporation (“GPC”) (the successor to the Syrian Petroleum Company). The main terms of PSA 1988 are similar to those normally used in the oil and gas industry. The Group’s revenues derived from PSA 1988 are made up of a combination of “cost oil” and “profit oil”. “Cost oil” represents the reimbursement of operating and capital expenditures and is accounted for in accordance with normal industry practices. The Group’s share of “profit oil” depends on the total annual production level. TOTAL receives its revenues in cash payments made by GPC. TOTAL pays to the state-owned Syrian company SCOT a transportation fee equal to $2/b for the oil produced in the area, as well as non-material payments to the Syrian government related to PSA 1988 for such items as withholding taxes and Syrian social security. The Tabiyeh contract, signed with GPC, may be considered as an addition to PSA 1988 as production, costs and revenues for the oil and part of the condensates coming from the Tabiyeh field are governed by the contractual terms of PSA 1988. This project is designed to enhance liquids and gas output from the Tabiyeh field through the drilling of “commingled” wells and through process modifications in Deir Ez Zor Gas Plant operated by the Syrian Gas Company. Until early December 2011, TOTAL financed and implemented the Tabiyeh Gas Project and operated the Tabiyeh field. In 2011, technical production for PSA 1988 and the Tabiyeh contract taken together amounted to 63 kboe/d, of which 53 kboe/d were accounted for as the Group’s share of production. The amount identified as technical production under the agreements, minus the amount accounted for as the Group’s share of production, does not constitute the total economic benefit accruing to Syria under the terms of the agreements since Syria retains a margin on a portion of the Group’s production and receives certain production taxes. In addition, TOTAL and GPC entered into a Cooperation Framework Agreement in 2009, which provides for the co-development of oil projects in Syria. Since early December 2011, TOTAL has ceased its activities that contribute to oil and gas production in Syria. In 2011, TOTAL’s Trading & Shipping division purchased in Syria pursuant to a mix of spot and term contracts nearly eleven million barrels of hydrocarbons from state-controlled entities for approximately€824 million. Since early September 2011, the Group has ceased to purchase hydrocarbons from Syria. Competition TOTAL is subject to competition from other oil companies in the acquisition of assets and licenses for the exploration and production of oil and natural gas as well as for the sale of manufactured products based on crude and refined oil. TOTAL’s competitors are comprised of national oil companies and international oil companies. In this regard, the major international oil companies in competition with TOTAL are ExxonMobil, Royal Dutch Shell, Chevron and BP. As of December 31, 2011, TOTAL ranked fifth among these companies in terms of market capitalization.(1) Insurance and risk management Organization TOTAL has its own insurance and reinsurance company, Omnium Insurance and Reinsurance Company (OIRC). OIRC is integrated with the Group’s insurance management and is used as a centralized global operations tool for covering the Group’s risks. It allows the Group’s worldwide insurance program to be implemented in compliance with the specific requirements of local regulations applicable in the countries where the Group operates. Some countries may require the purchase of insurance from a local insurance company. If the local insurer accepts to cover the subsidiary of the Group in compliance with its worldwide insurance program, OIRC requests a retrocession of the covered risks from the local insurer. As the award of exploration and production interests;
authorizations by governments or by a state-controlled partner, especially for development projects, annual programs or the selection of contractors or suppliers;
the imposition of specific drilling obligations;
environmental protection controls;
control over the development and abandonment of a field causing restrictions on production;
calculating the costs that may be recovered from the relevant authority and what expenditures are deductible from taxes; and
possible, though exceptional, nationalization, expropriation or reconsideration of contract rights.
The oil industry is also subject to the payment of royalties and taxes, which may be high compared with those imposed with respect to other commercial activities and which may be subject to material modifications by the governments of certain countries.
Substantial portions of TOTAL’s oil and gas reserves are located in certain countries which may be considered politically and economically unstable. These reserves and the related operations are subject to certain additional risks, including:
the establishment of production and export limits;
the compulsory renegotiation of contracts;
the expropriation or nationalization of assets;
risks relating to changes of local governments or resulting changes in business customs and practices;
currency exchange restrictions;
depreciation of assets due to the devaluation of local currencies or other measures taken by governments that might have a significant impact on the value of activities; and
losses and impairment of operations due to armed conflicts, civil unrest or the actions of terrorist groups.
TOTAL, like other major international oil companies, has a geographically diverse portfolio of reserves and operational sites, which allows it to conduct its business and financial affairs so as to reduce its exposure to such political and economic risks. However, there can be no assurance that such events will not adversely affect the Group.
Regulations concerning Iran and Sudan(1)In September 2006, the U.S. legislation implementing sanctions against Iran and Libya (Iran and Libya Sanction Act, referred to as “ILSA”), was amended and extended until December 2011. Pursuant to this statute, which now concerns only Iran (Iran Sanctions Act, referred to as “ISA”), the President of the United States is authorized to initiate an investigation into the possible imposition of sanctions (from a list that includes denial of financing by the U.S. Export-Import Bank and limitations on the amount of loans or credits available from U.S. financial institutions) against persons found, in particular, to have knowingly made investments of $20 million or more in any 12-month period in the petroleum sector in Iran. In May 1998, the U.S. government waived the application of sanctions for TOTAL’s investment in the South Pars gas field. This waiver, which has not been modified since it was granted, does not address TOTAL’s other activities in Iran, although TOTAL has not been notified of any related sanctions.
In November 1996, the Council of the European Union adopted regulations which prohibit TOTAL from complying with any requirement or prohibition based on or resulting directly or indirectly from certain enumerated legislation, including ILSA. It also prohibits TOTAL from extending its waiver for South Pars to other activities.
In each of the years since the passage of ILSA (now ISA) until 2007, TOTAL made investments in Iran (excluding South Pars) in excess of $20 million. TOTAL’s activities in
Iran are currently limited mainly to the implementation of two buyback contracts signed between 1995 and 1999 for two permits on which the Group is no longer the operator. As a result, TOTAL’s involvement consists essentially in being reimbursed for its past investments. In 2008, TOTAL’s production in Iran was 8.8 kboe/d, approximately 0.4% of the Group’s worldwide production. TOTAL does not believe that its activities in Iran have a material impact on the Group’s results.
In the future, TOTAL may decide to invest amounts in excess of $20 million per year in the country. TOTAL cannot predict interpretations of or the implementation policy of the U.S. government under ISA with respect to its possible future activities in Iran. It is possible that the United States may determine that these or other activities constitute activity prohibited by ISA and will subject TOTAL to sanctions. TOTAL does not believe that enforcement of ISA, including the imposition of the maximum sanctions under the current applicable law and regulations would have a material negative effect on its results of operations or financial condition.
France and the European Union have adopted measures, based on United Nations Security Council resolutions, that restrict the movement of certain individuals and goods to or from Iran as well as certain financial transactions with Iran, in each case when such individuals, goods or transactions are related to nuclear proliferation and weapons activities or likely to contribute to their development. As currently applicable, the Group believes that these measures do not cover TOTAL’s activities and projects in this country.
TOTAL has no active business in Sudan. TOTAL has no oil or gas production in Sudan and, to date, has not made any significant investments or industrial investments there.
TOTAL holds a 32.5% interest in Block B in southern Sudan through a 1980 Exploration and Production Sharing Agreement (EPSA). Operations were voluntarily suspended in 1985 because of escalating security concerns, but the company maintained its exploration rights.
The EPSA was revised, effective December 21, 2004, and provided that the parties (the Government of Sudan and the consortium partners) would mutually agree upon a resumption date when the petroleum operations could be undertaken physically in the contract area. Such resumption date would mark the starting point of the Group’s work obligations as foreseen in the contract. A joint decision on the resumption date has not occurred yet.
If TOTAL were to resume its activities in southern Sudan, it would do so in compliance with applicable national, European and international laws and regulations, as well as with the Group’s Code of Conduct and Ethics Charter. Within the Group’s scope of operations and authority, it is committed to upholding human rights and fundamental freedoms, including social, economic and cultural rights, and the rights and interests of local residents, minorities and any other vulnerable groups. In particular, the Group will study the situation with non-governmental organizations and stakeholders involved in southern Sudan and conduct socio-economic programs adapted to the needs of the local population. Significant programs were launched at the end of 2008 in the fields of access to potable water, social infrastructures and schools with two international non-governmental organizations present in the region.
Certain U.S. states have adopted legislation requiring state pension funds to divest themselves of investments in any company with active business operations in Iran or Sudan. On December 31, 2007, the U.S. Congress adopted the Sudan Accountability and Divestment Act, which supports these state legislative initiatives. If TOTAL’s activities in Iran or Sudan were determined to fall within the prohibited scope of these laws, and TOTAL were to not qualify for exemptions provided by such laws, certain U.S. state pension funds holding interests in TOTAL may be required to sell their interests. If significant, such sales could have an adverse effect on TOTAL’s share price.
Furthermore, the United States currently imposes economic sanctions, which are administrated by the U.S. Treasury Department’s Office of Foreign Assets Control and which apply to U.S. persons, with the objective of denying certain countries, including Iran, Syria and Sudan, the ability to support international terrorism and, additionally in the case of Iran and Syria, to pursue weapons of mass destruction and missile programs. TOTAL does not believe that these sanctions are applicable to any of its activities in these countries.
| CompetitionSource: Reuters.The Group is subject to intense competition within the oil sector and between the oil sector and other sectors aiming to fulfill the energy needs of the industry and of individuals. TOTAL is subject to competition from other oil companies in the acquisition of assets and licenses for the exploration and production of oil and natural gas. Competition is particularly strong with respect to the acquisition of resources of oil and natural gas, which are in great demand. Competition is also intense in the sale of manufactured products based on crude and refined oil.
In this regard, the major international oil companies in competition with TOTAL are ExxonMobil, Royal Dutch Shell, Chevron and BP. As of December 31, 2008, TOTAL ranked fifth among these companies in terms of market capitalization.(1)
|
a result, OIRC negotiates reinsurance contracts with the subsidiaries’ local insurance companies, which transfer most of the risk to OIRC. When a local insurer covers the risks at a lower level than that defined by the Group, OIRC provides additional coverage so as to standardize coverage throughout the Group. At the same time, OIRC negotiates a reinsurance program at the Group level with mutual insurance companies for the oil industry and commercial reinsurers. OIRC permits the Group to better manage price variations in the insurance market by taking on a greater or lesser amount of risk corresponding to the price trends in the insurance market. In 2011, the net amount of risk retained by OIRC after reinsurance was a maximum of $75 million per third-party liability insurance claim and $75 million per property damage and/or business interruption insurance claim. Accordingly, in the event of any loss giving rise to an aggregate insurance claim, the effect on OIRC would be limited to its maximum retention of $150 million per event. Risk and insurance management policy In this context, the Group risk and insurance management policy is to work with the relevant internal department of each subsidiary to: Insurance and risk management
Organization
TOTAL has its own insurance and reinsurance company, Omnium Insurance and Reinsurance Company (OIRC). OIRC is integrated into the Group’s insurance management and is used as a centralized global operations tool for covering the Group’s risks. It allows the Group to implement its worldwide insurance program in compliance with the various regulatory environments in the countries where the Group operates.
Some countries require the purchase of insurance from a local insurance company. If the local insurer accepts to cover the subsidiary of the Group in compliance with its worldwide insurance program, OIRC requests a retrocession of the covered risks from the local insurer. As a result, OIRC negotiates reinsurance contracts with the subsidiaries’ local insurance companies, which transfer most of the risk to OIRC. When a local insurer covers the risks at a lower level than that defined by the Group, OIRC provides additional coverage so as to standardize coverage throughout the Group.
At the same time, OIRC negotiates a reinsurance program at the Group level with mutual insurance companies for the oil industry and commercial reinsurers. OIRC permits the Group to better manage price variations in the insurance market by taking on a greater or lesser amount of risk corresponding to the price trends in the insurance market.
In 2008, the net amount of risk retained by OIRC after reinsurance was 50 M€ per property/business interruption insurance claim and 60 M€ per third party liability insurance claim.
Risk and insurance management policy
In this context, the Group risk and insurance management policy is to work with the relevant internal department of each subsidiary to:
define scenarios of major disaster risks (estimated maximum loss); assess the potential financial impact on the Group should a catastrophic event occur; help to implement measures to limit the probability that a catastrophic event occurs and the financial consequences if such event should occur; and manage the level of risk from such events to be either covered internally by the Group or transferred to the insurance market. Insurance policy The Group has worldwide third-party liability and property insurance coverage for all its subsidiaries. These programs are contracted with first-class insurers (or reinsurers and mutual insurance companies of the oil industry through OIRC). The amounts insured depend on the financial risks defined in the disaster scenarios and the coverage terms offered by the market (available capacities and price conditions). More specifically for: Third-party liability insurance: since the maximum financial risk cannot be evaluated by a systematic approach, the amounts insured are based on market conditions and industry practice, in particular, the oil industry. In 2011, the Group’s third-party liability | | insurance for any liability (including potential accidental environmental liabilities) was capped at $850 million. |
Property damage and business interruption: the amounts insured vary by sector and by site and are based on the estimated cost of and reconstruction under maximum loss scenarios and on insurance market conditions. The Group subscribed for business interruption coverage in 2011 for its main refining and petrochemical sites. For example, for the Group’s highest risks (platforms in the North Sea and main refineries and petrochemical plants in Europe), in 2011 the Group’s share of insurance limit was approximately $1.65 billion for the Downstream segment and approximately $1.5 billion dollars for the Upstream segment. Deductibles for property damage and third-party liability fluctuate between€0.1 million and€10 million depending on the level of risk and liability, and are borne by the relevant subsidiary. For business interruption, coverage begins sixty days after the event giving rise to the interruption. Other insurance contracts are bought by the Group in addition to property damage and third-party liability coverage, mainly for car fleets, credit insurance and employee benefits. These risks are entirely underwritten by outside insurance companies. The above-described policy is given as an example of past practice over a certain period of time and cannot be considered as representative of future conditions. The Group’s insurance policy may be changed at any time depending on the market conditions, specific circumstances and on management’s assessment of the risks incurred and the adequacy of their coverage. While TOTAL believes its insurance coverage is in line with industry practice and sufficient to cover normal risks in its operations, it is not insured against all possible risks. In the event of a major environmental disaster, for example, TOTAL’s liability may exceed the maximum coverage provided by its third-party liability insurance. The loss TOTAL could suffer in the event of such disaster would depend on all the facts and circumstances and would be subject to a whole range of uncertainties, including legal uncertainty as to the scope of liability for consequential damages, which may include economic damage not directly connected to the disaster. The Group cannot guarantee that it will not suffer any uninsured loss and there can be no guarantee, particularly in the case of a major environmental disaster or industrial accident, that such loss would not have a material adverse effect on the Group. Competition law Competition laws apply to the Group’s companies in the vast majority of countries in which it does business. Violations of competition laws carry fines and expose the Group and its employees to criminal sanctions and civil suits. Furthermore, it is now common for persons or corporations allegedly injured by violations of competition laws to sue for damages. The broad range of activities and countries in which the Group operates requires local analysis, by business segment, of the legal risks in terms of competition law. Some of the Group’s business segments have already been implementing competition law conformity plans for a long time. Moreover, a Group-wide policy designed to coordinate risk management measures and competition law conformity plans has been under development since the beginning of 2012. assess the potential financial impact on the Group in case these disasters should occur;
help in implementing measures to limit the probability of the event and the extent of the occurrences of such events; and
manage the level of risk from such events to be either covered internally by the Group or to be transferred to the insurance market.
Insurance policy
The Group has worldwide third party liability and property insurance coverage for all its subsidiaries. These programs are contracted with first-class insurers (or reinsurers and mutual insurance companies of the oil industry through OIRC).
The amounts insured depend on the financial risks defined in the disaster scenarios and the coverage terms offered by the market (available capacities and price conditions).
More specifically, for:
Third party liability insurance: since the maximum financial risk cannot be evaluated by a systematic approach, the amounts insured are based on market conditions and industry practice, in particular, the oil industry. The insurance cap in 2008 for general and product liability was $800 million.
Property damage and business interruption: the amounts insured by sector and by site are based on estimated costs and reconstruction scenarios under the estimated maximum loss scenarios and on insurance market conditions. The Group subscribed for business interruption coverage in 2008 for its main refining and petrochemical sites.
For example, for the highest estimated risks of the Group (main European refineries), the limit of indemnity was $1.4 billion in 2008.
Deductibles for property damages fluctuate between 0.1 M€ and 10 M€ depending on the level of risk, and are borne by the subsidiary. For business interruption, they represent 60 days.
Other insurance contracts are bought by the Group in addition to property damage and third party liability coverage, mainly for car fleets, credit insurance and employee benefits. These risks are entirely underwritten by outside insurance companies.
The above-described policy is given as an example of past practice over a certain period of time and cannot be considered as representative of future conditions. The Group’s insurance policy may be changed at any time depending on the market conditions, specific circumstances and on management’s assessment of the risks incurred and the adequacy of their coverage. The Group cannot guarantee that it will not suffer any uninsured loss.
Organizational Structure TOTAL S.A. is the parent company of the TOTAL Group. As of December 31, 2008,2011, there were 721870 consolidated subsidiaries, of which 622783 were fully consolidated, 12 were proportionately consolidated and 87 were accounted for under the equity method. For a list of the principal subsidiaries of the Company, see Note 35 to the Consolidated Financial Statements. Property, Plants and Equipment TOTAL has freehold and leasehold interests in numerous countries throughout the world, none of which is material to TOTAL. See “— Business Overview — Upstream” for a description of TOTAL’s reserves and sources of crude oil and natural gas. ITEM 4A. UNRESOLVED STAFF COMMENTS None. ITEM 5. OPERATING AND FINANCIAL REVIEW AND PROSPECTS This section is the Company’s analysis of its financial performance and of significant trends that may affect its future performance. It should be read in conjunction with the Consolidated Financial Statements included elsewhere in this Annual Report. The Consolidated Financial Statements are prepared in accordance with International Financial Reporting Standards (IFRS) as issued by the IASB and IFRS as adopted by the European Union. This section contains forward-looking statements which are subject to risks and uncertainties. For a list of important factors that could cause actual results to differ materially from those expressed in the forward-looking statements, see “Cautionary Statement Concerning Forward-Looking Statements” on page v.vi. Overview
OVERVIEW TOTAL’s results are generally affected by a variety of factors, including changes in crude oil and natural gas prices as well as refining and marketing margins, which are all generally expressed in dollars, and changes in exchange rates, particularly the value of the euro compared to the dollar. Higher crude oil and natural gas prices generally have a positive effect on the income of TOTAL, since its Upstream oil and gas business benefits from the resulting increase in revenues realized from production. Lower crude oil and natural gas prices generally have a corresponding negative effect. The effect of changes in crude oil prices on TOTAL’s Downstream activities depends upon the speed at which the prices of refined petroleum products adjust to reflect such changes. In the past several years, untilcrude oil and natural gas prices have varied greatly. As TOTAL reports its results in euros, but conducts its operations mainly in dollars, the fourth quartereffect of 2008 when prices dropped sharply, TOTAL has benefited from a sharp an increase in crude oil and natural gas prices which have beenis partly offset by the effect of the variation in part by a significantexchange rates during periods of weakening of the dollar relative to the euro (despite a more recentand strengthened during periods of strengthening of the dollar) as TOTAL reports its results in euros.dollar relative to the euro. TOTAL’s results are also significantly affected by the costs of ourits activities, in particular those related to exploration and production, and by the outcome of ourits strategic decisions with respect to cost reduction efforts in the current period of significant economic uncertainty.efforts. TOTAL’s results are also affected by general economic and political conditions and changes in governmental laws and regulations, as well as by the impact of decisions by OPEC on oil and gas prices.production levels. However, the Euro zone’s turbulences during the fiscal year 2011 did not affect the Group significantly. For more information, see “Item 3. Key Information — Risk Factors” and “Item 4. Information on the Company — Other Matters”. The year 2011 witnessed a number of geopolitical events that put pressure on market supplies. Despite the economic slowdown, demand for oil products continued to rise, fuelled by the growth of emerging markets. Pressure on supply, plus rising demand, resulted in a sharp increase in the price of crude oil. The average price of Brent in 2011 was $111/b, compared with $80/b in 2010. Gas spot prices continued to rise in Europe and Asia in 2011, mainly due to increased demand on Asian markets. Spot prices for gas in the United States remained very low, due to the continued rise in production, driven by the development of non-conventional gases. FollowingDespite the spin-offgradual adjustment of Arkemarefining capacity, the overcapacity that has existed in May 2006, the 2006 income statement figures forEuropean refining market since 2009 continued into 2011, due to low demand in Europe. Refining margins dropped to an average of $17/t in 2011, compared with $27/t in 2010(1). In the Group andfirst half of 2011, the Chemicals segment (withenjoyed a globally favorable environment, which has deteriorated since then. In the exceptionsecond half of the year, the Base Chemicals and Specialty Chemicals divisions saw their margins shrink due to the drop in demand caused by the economic slowdown.
In this environment, TOTAL’s net income (Group share) amounted to€12.3 billion, up 16% compared to€10.6 billion in 2010. This result essentially reflects a better Upstream environment, while the Downstream and Chemicals segments were faced with more difficult conditions than in 2010. The Upstream segment’s 2011 adjusted net operating income of€10.4 billion was up 21% compared with€8.6 billion in 2010 due to rising prices, but was also negatively impacted by the€-$ exchange rate. The Downstream segment’s adjusted net operating income dropped by 7% to€1.1 billion in 2011 compared to€1.2 billion in 2010. This result can be explained in particular by the impact of reduced refining margins and the sale of the Group’s stake in CEPSA, which were partially offset by an improvement in operational performance. The Chemicals segment’s adjusted net income)operating income dropped by 10% to€775 million in 2011 from€857 million in 2010, due to the more difficult market environment at the end of the year and the asset sales in 2011 (resins, CEPSA). The year 2011 saw numerous acquisitions and asset sales, reflecting the Group’s ambition to optimize its portfolio by creating value from certain mature assets and by developing its Upstream assets with high potential for growth. TOTAL benefited from the rise in its operational cash flow and the€8 billion inflows from asset sales in 2011 to fund the increase in its investment program, while maintaining a dividend of€2.28 per share, which will be submitted for approval to the Shareholders’ meeting on May 11, 2012. The balance sheet remained strong, with a net-debt-to- equity ratio(2) of 23% at the end of 2011, compared with 22% at the end of 2010. In terms of operations, 2011 saw the continued improvement of safety performance, with a 15% drop in the Group-wide TRIR(3) compared with 2010. In the Upstream segment, three major discoveries in Azerbaijan, Bolivia and French Guiana were the first results of the Group’s bolder exploration strategy. The year 2011 also witnessed the successful start-up of the Pazflor deep-offshore platform in Angolan waters, a project operated by TOTAL that illustrates the Group’s expertise in the development of major projects. Five new major projects, including the Ichthys LNG project in Australia (TOTAL, 24%), as wellwere also launched, in order to secure growth in the years to come. Still in the Upstream segment, 2011 also saw the announcement of the acquisition of a 14.09% stake in the Russian company Novatek and an increase of the Group’s stakes in the Fort Hills project in Canada and in Tempa Rossa in Italy. At the end of 2011, the Group announced its entry into the Utica shale gas and condensates deposit in the United States. The Group continued to extend its oil and gas acreage by acquiring stakes in promising exploration areas, such as the return on average capital employed (ROACE)(1) for the Chemicals segment, have been recalculated pursuant to IFRS to exclude contributions from the activities of Arkema to the Chemicals segment. The Arkema spun-off activities are treated as “discontinued operations”, the results of which are presented on the corresponding linepre-salt blocks in the income statement.Kwanza basin in Angola, and by acquiring stakes in deposits that have already been discovered, such as the Yamal LNG project in Russia. At the same time, in 2011, TOTAL disposed of certain mature or non-strategic Upstream assets, including its exploration-production subsidiary in Cameroon and its stakes in pipelines in Colombia. In the realm of new energies, TOTAL acquired in 2011 a 60% stake (now, 66%) in the U.S. company SunPower, to become one of the leaders in the solar industry. Although currently in the consolidation phase, this industry offers opportunities for strong growth. In the Downstream and Chemicals segments, TOTAL deployed its strategy of increasing the competitive performance of its activities, scaling down its exposure to mature zones, mainly Europe, and bolstering its presence | (1) | ROACEBased on TOTAL’s “European Refining Margin Indicator” (ERMI). |
| (2) | Net-debt-to-equity ratio = adjusted net operating incomedebt (i.e., the sum of current borrowings, other current financial liabilities and non-current financial debt, net of current financial assets, hedging instruments on non-current financial debt and cash and cash equivalents) divided by average capital employed. For more information on ROACE, see “— Results 2006-2008 — Business Segment Reporting” belowthe sum of shareholders’ equity and Note 2 to the Consolidated Financial Statements included elsewhere herein.non-controlling interests after expected dividends payable. |
| (3) | Total Recordable Injury Rate. |
2006-2008 resultsin high-growth areas. Consequently, 2011 saw the start-up of the deep-conversion unit (or coker) in Port Arthur in the United States, the continued modernization of the refinery and the petrochemicals platform in Normandy, France, and the construction of the Jubail refinery in Saudi Arabia. The Group also continued to scale down its refining capacity in Europe, by selling off its stake in the Spanish company CEPSA.
TOTAL’s net income (Group share)On the Marketing front, in 2011, the Group continued its optimization drive by selling off its distribution activities in the United Kingdom and launching a program to modernize part of its service station network in France with the Total access program. In the Specialty Chemicals division, the Group sold part of its Resins activity.
A restructuring of the Downstream and Chemicals sectors was 10,590 Mannounced in October 2011. The deployment of this project led to organizational changes on January 1, 2012, with the creation of: a Refining & Chemicals segment, a large industrial base that encompasses refining, petrochemicals, fertilizers and specialty chemicals operations. This segment also includes oil trading and shipping activities. a Supply & Marketing segment, which is dedicated to worldwide supply and marketing activities in the oil products field. The process initiated in 2004 to increase R&D budgets continued with expenditures in 2011 of€ in 2008776 million, up 9% compared to 13,181 M€2010, with the aim of, in 2007. The 20% decrease in net income in 2008 compared to 2007 was mainly due toparticular, the negative after-tax impactcontinued improvement of prices on inventory valuation (-3.8 B€), due to the sharp drop in oil pricesGroup’s technological expertise in the last quarterdevelopment of 2008. Other factors contributingoil and gas resources and the development of solar, biomass, carbon capture and storage technologies in order to the variation in net income in 2008 comparedcontribute to 2007 consisted mainly of: the weaker dollar (-0.8 B€); special items (-0.5 B€); higher Upstream costs (-0.5 B€); lower production (-0.5 B€); less favorable results from U.S. refining, mainly due to a less favorable business environment and hurricanes (-0.2 B€); a less favorable environmentchanges in the Chemicals business (-0.2 B€global energy mix.); Finally, in 2011, TOTAL reasserted the Group’s equity sharepriority on safety and the environment as part of its operations throughout its business. For all of its projects conducted in a large number of countries, the Group puts an emphasis on corporate social responsibility (CSR) challenges and the development of the amortizationlocal economies. Outlook In 2012, TOTAL intends to consolidate its drivers for growth and enhance the priority given to safety, reliability and acceptability of intangibles relatedits operations. The 2012 net investment budget is $20 billion (approximately€14.3 billion(1)). TOTAL intends to the Sanofi-Aventis merger (-0.1 Bcontinue to actively manage its asset portfolio with, in particular, a program of non-strategic asset sales. The 2012 budget for organic investments (i.e., net investments excluding acquisitions and asset sales) is $24 billion (approximately€); and a decrease in income from equity affiliates in the Downstream segment, mainly due to losses incurred through TOTAL’s participation in Wepec, its affiliate for refining in China (-0.1 B€). These negative impacts were partially offset by the positive impacts of higher hydrocarbon prices (+3.5 B€) and a more favorable Downstream business environment (+0.6 B€)17.1 billion). The 12% increase in TOTAL’s net income (Group share) in 2007 compared to 2006 was mainly due toCapital expenditures will mostly be focused on the positive after-tax impactUpstream segment with an allocation of prices on inventory valuation (+1.7 B$20 billion (approximately€)14.3 billion), or more than 80% of the overall more favorable environment (+0.6 B€), production growthGroup’s organic capital expenditure budget. About 30% of the investment in the Upstream segment (+0.6 Bis expected to be dedicated to producing assets while 70% is expected to be assigned to developing new projects. Downstream organic capital expenditures in the Refining & Chemicals and Supply & Marketing segments are expected to amount to $3 billion (approximately€)2.1 billion) and $1 billion (approximately€714 million), respectively, in 2012. In line with the strategy to develop a number of major integrated platforms in order to stimulate growth and productivity plansimprove competitive performance, the main projects in the Downstream andRefining & Chemicals segments (+0.3 B€), which were partially offset bysegment in 2012 will be the negative impactsupgrading of the weaker dollar (-1.0 B€), higher costsNormandy refinery and petrochemical plant, the building of the Jubail refinery in Saudi Arabia and the expansion of the Daesan platform in South Korea. Wherever it operates, TOTAL will continue to make capital expenditure in the Upstreammaintenance and Downstream segments (-0.4 B€), increased exploration expense (-0.3 B€) and the higher net costsafety of net debt for the Group (-0.1 B€ ).its facilities a top priority.
The Group’s expenditures(1)Group also confirms its commitment with respect to R&D with a budget increasing to about $1.2 billion (approximately€857 million) in 2008 were 13,640 M€ compared to 11,722 M€ in 2007 and 11,852 M€ for 2006. Included in the 2008 expenditures are 1,022 M€ of acquisitions reflecting mainly the acquisitions of Synenco in Canada and Goal in The Netherlands, the acquisition of a 60% stake in the Bemolanga permit in Madagascar and payments for new permits and contract extensions in Nigeria and Libya. Included in the 2007 expenditures are approximately 0.2 B€ of acquisitions related primarily to new permits. In 2006, expenditures included approximately 0.8 B€ for acquisitions, principally Ichthys LNG and Tahiti.2012. Divestments in 2008 amounted to 2,585 M€ compared to 1,556 M€ in 2007 and 2,278 M€ in 2006. Divestments in 2008 included asset sales of 1,451 M€, consisting mainly of the sale of Sanofi-Aventis shares. The 2007
divestments included Upstream assets in Canada, the UK and Norway and Downstream assets in the UK, as well as the sale of shares representing 0.4% of Sanofi- Aventis in the fourth quarter. In 2006, divestments included the sale of Upstream assets in the United States and in France as well as the reimbursement of carried investments on Akpo in Nigeria and the sale of non-strategic financial assets.
In each of the three years, the main source of funding for expenditures was cash from operating activities.
Outlook
In the Upstream segment, TOTAL benefits from the high-qualitywill deploy its strategy intended to speed up growth of its portfolio. Production start-ups for severalproduction, while improving the profitability of its portfolio of assets. The year 2012 should see the launch of numerous projects. In 2012, TOTAL plans to bring eight new major projects planned for 2009 include Akpoon-stream, which will contribute to expected growth in output in 2012 and achieving the target rate of average annual production growth of 2.5% between 2010 and 2015: Usan and OML 58 Upgrade in Nigeria, Yemen LNG and Qatargas II. In addition, engineering studies for the next wave of major projects that are expected to be launched between 2009 and 2010 are ongoing, notably for Egina in Nigeria, Laggan TormoreIslay in the UK North Sea, ShtokmanAngola LNG in Russia, IchthysAngola, Bongkot South in AustraliaThailand, Halfaya in Iraq, Sulige in China and certain heavy oilKashagan in Kazakhstan. The Group will also continue to evaluate numerous other projects, in particular in Western Africa, Russia and Canada. The Group seeks to maintain its technical costs at oneanticipated launch of these projects during the course of the lowest levels among the major oil and gas companies, which it considers one of its competitive advantagesnext two years should improve visibility on growth in a weaker oil market environment. In addition, TOTAL is continuing with its effortsoutput after 2015. With an exploration budget that stands at $2.5 billion (approximately€1.8 billion), up 20% compared to improve the reliability of its facilities and to emphasize safety throughout its operations. In the Downstream and Chemicals segments,2011, the Group will define the necessary changes neededcontinue to adapt its industrial assets to new trends in market demand. At the same time, major construction projects are continuing, notably for the modernization of the Port Arthur refinery in the United States, the Jubail refinery project in Saudi Arabiapursue an ambitious and the start-up of the Qatofin cracker in Qatar.
The 2009 budget for capital expenditures, which is comparable to the 2008 budget, is approximately 14 B€(2), with 75% of it allocated to the Upstream segment.diversified strategy.
TOTAL is actively seeking to reduce the cost of its projects by reviewing contractual terms, technical plans and project timing. The Group has implemented company-wide productivity plans to reduce costs and to lower breakeven points for its operations.
In an environment marked by significant economic weakness, TOTAL continues to adhere to its strategy of strict financial discipline and is committed to taking the actions necessary to adapt and rebalance its industrial assets. TOTAL believes that a solid financial base should
| (1) | Expenditures include intangible assets and property, plant and equipment additions; acquisitionsAll euro figures in this section converted at a rate of subsidiaries, net of cash acquired; investments in equity affiliates and other securities; and increases in non-current loans.$1.40/€. |
(2) | Including net investments in equity affiliates and non-consolidated companies, excluding acquisitions, based on€1 = $1.30 for 2009. |
In the Downstream sector, with a new organization that will allow it to take up the companychallenges specific to pursueeach activity of that sector, the Group should start to reap the first benefits of an integrated Refining & Chemicals segment and Supply & Marketing segment, each of which is closer to its markets. TOTAL will strive to improve its competitiveness by adapting its activities in Europe and seeking to enhance its operational efficiency and synergies between its operations. The year 2012 will see continued development in high-growth zones, with the expected start-up of a sustained investmentnew polyethylene production unit in Qatar and the completion of the first step of the expansion of its Daesan platform in South Korea. In 2012, TOTAL can rely on its solid balance sheet and on the start-up and ramp-up of new projects that should contribute to the growth of operating cash flow. Moreover, in 2012, TOTAL will continue to develop its new projects through an ambitious capital expenditure program, to preparewhile maintaining a target for the long term, while also maintaining good profitability, itsnet-debt-to-equity ratio of between 20-30% and a dividend policy and a net-debt-to-equitybased on an average pay-out ratio around 25-30%. In addition, the Company plans to continue to progressively divest its Sanofi-Aventis shares over the short to medium term to give the Group a certain amount of financial flexibility to50% of adjusted fully-diluted earnings per share(1). adapt its financial resources to its growth and dividend strategies.
Since the beginning of 2009, the price of Brent has traded around $45 per barrel. Additional production cuts announced by OPEC may better balance existing supply to the currently weakened market demand.
Critical Accounting Policies
CRITICAL ACCOUNTING POLICIES A summary of the GroupGroup’s accounting policies is included in Note 1 to the Consolidated Financial Statements. Management believes that the application of these policies on a consistent basis enables the Group to report useful and reliable information about the Group’s financial condition and results of operations. The Company has changed its method for reserve estimates due to the adoption of the Accounting Standards Update No. 2010-03, Oil and Gas Reserve Estimation and Disclosures, effective for annual reporting periods ended on or after December 31, 2009. The preparation of financial statements in accordance with IFRS requires management to make estimates and assumptions that affect the reported amounts of assets, liabilities and contingent liabilities at the date of preparation of the financial statements and reported income and expenses for the period. Management reviews these estimates and assumptions on an ongoing basis, by reference to past experience and various other factors considered as reasonable which form the basis for assessing the book value of assets and liabilities. Actual results may differ significantly from these estimates, if different assumptions or circumstances apply. Lastly, where the accounting treatment of a specific transaction is not addressed by any accounting standards or interpretation, management applies its judgment to define and apply accounting policies that will lead to relevant and reliable information, so that the financial statements: give a true and fair view of the Group’s financial position, financial performance and cash flows; reflect the substance of transactions; are prepared on a prudent basis; and are complete in all material aspects. The following summary provides further information about the critical accounting policies that involve significant elements of management judgment, and which could have a significant impact on the results of the Group. It should be read in conjunction with Note 1 to the Consolidated Financial Statements. The assessment of critical accounting policies below is not meant to be an all-inclusive discussion of the uncertainties in financial results that can occur from the application of the full range of the Company’s accounting policies. Materially different financial results could occur in the application of other accounting policies as well. Likewise, materially different results can occur upon the adoption of new accounting standards promulgated by the various rule-making bodies. Successful efforts method of oil and gas accounting The Group follows the successful efforts method of accounting for its oil and gas activities. The Group’s oil and gas reserves are estimated by the Group’s petroleum engineers in accordance with industry standards and SEC regulations. In December 2008, the SEC published a revised set of rules for the estimation of reserves. These revised rules will bewere used for the 2009 year-end estimation of reserves and have not been usedbeginning in the determination of reserves for the year-end 2008.2009. Proved oil and gas reserves are the estimatedthose quantities of crude oil naturaland gas, and natural gas liquids which, geologicalby analysis of geoscience and engineering data, demonstratecan be estimated with reasonable certainty to be recoverable in future yearseconomically producible from a given date forward, from known reservoirs, and under existing economic conditions, operating methods, and operating conditions. Accordingly, thesegovernment regulations, prior to the time at which contracts providing the right to operate expire, unless evidence indicates that renewal is reasonably certain, regardless of whether deterministic or probabilistic | (1) | For the adjusted fully-diluted earnings per share, see the Consolidated Financial Statements included elsewhere herein, Note 4) Business segment information — A) Information by business segment. |
methods are used for the estimation. These estimates do not include probable or possible reserves. Estimated oil and gas reserves are based on available reservoir data and prices and costs in the accounting period during which the estimate is made and are subject to future revision. The Group reassesses its oil and gas reserves at least once a year on all its properties. Exploration leasehold acquisition costs are capitalized when acquired. During the exploration phase, management exercises judgment on the probability that prospects ultimately would partially or fully fail to find proved oil and gas reserves. Based on this judgmental approach, a leasehold impairment charge may be recorded. This position is assessed and adjusted throughout the contractual period of the leasehold based in particular on the results of exploratory activity and any impairment is adjusted prospectively. When a discovery is made, exploratory drilling costs continue to be capitalized pending determination of whether potentially economic oil and gas reserves have been discovered by the drilling effort. The length of time necessary for this determination depends on the specific technical or economic difficulties in assessing the
recoverability of the reserves. If a determination is made that the well did not encounter oil and gas in economically viable quantities, the well costs are expensed and are reported in exploration expense. Exploratory drilling costs are temporarily capitalized pending determination of whether the well has found proved reserves if both of the following conditions are met: the well has found a sufficient quantity of reserves to justify, if appropriate, its completion as a producing well, assuming that the required capital expenditure is made; and satisfactory progress toward ultimate development of the reserves is being achieved, with the Company making sufficient progress assessing the reserves and the economic and operating viability of the project. The Company evaluates the progress made on the basis of regular project reviews which take into account the following factors: First, if additional exploratory drilling or other exploratory activities (such as seismic work or other significant studies) are either underway or firmly planned, the Company deems there is satisfactory progress. For these purposes, exploratory activities are considered firmly planned only if they are included in the Company’s three-year exploration plan/budget. In cases where exploratory activity has been completed, the evaluation of satisfactory progress takes into account indicators such as the fact that costs for development studies are incurred in the current period, or that governmental or other third-party authorizations are pending or that the availability of capacity on an existing transport or processing facility awaits confirmation. | | costs for development studies are incurred in the current period, or that governmental or other third-party authorizations are pending or that the availability of capacity on an existing transport or processing facility awaits confirmation. |
The successful efforts method requires, among other things, requires that the capitalized costs for proved oil and gas properties (which include the costs of drilling successful wells) be amortized on the basis of reserves that are produced in a period as a percentage of the total estimated proved reserves. The impact of changes in estimated proved reserves is dealt with prospectively by amortizing the remaining book value of the asset over the expected future production. If proved reserve estimates are revised downward, earnings could be affected by higher depreciation expense or an immediate write-down of the property’s book value. Conversely, if the oil and gas quantities were revised upwards, future per-barrel depreciation and depletion expense would be lower. Valuation of long-lived assets In addition to oil and gas assets that could become impaired under the application of successful efforts accounting, other assets could become impaired and require write-down if circumstances warrant. Conditions that could cause an asset to become impaired include lower-than-forecastedlower-than-expected commodity sales prices, changes in the Group’s business plans or a significant adverse change in the local or national business climate. The amount of an impairment charge would be based on estimates of an asset’sthe higher of the value in use or the fair value minus cost to sell compared with its book value. The fair value usuallyin use is based on the present valuesvalue of expected future cash flowsflow using assumptions commensurate with the risks involved in the asset group. The expected future cash flowsflow used for impairment reviews areis based on judgmental assessments of future production volumes, prices and costs, considering information available at the date of review. Asset retirement obligations and environmental remediation When legal and contractual obligations require it, the Group, upon application of International Accounting Standard (IAS) 37 and IAS 16, records provisions for the future decommissioning of production facilities at the end of their economic lives. Management makes judgments and estimates in recording liabilities. Most of these removal obligations are many years in the future and the precise requirements that will have to be met when the removal event actually occurs are uncertain. Asset removal technologies and costs are constantly changing, as well as political, environmental, safety and public expectations. The Group also makes judgments and estimates in recording costs and establishing provisions for environmental clean-up and remediation costs, which are based on current information on costs and expected plans for remediation. For environmental provisions, actual costs can differ from estimates because of changes in laws and regulations, public expectations, discovery and analysis of site conditions and changes in clean-up technology. Pensions and post-retirement benefits Accounting for pensions and other post-retirement benefits involves judgments about uncertain events, including estimated retirement dates, salary levels at retirement, mortality rates, rates of return on plan assets, determination of discount rates for measuring plan obligations, healthcare cost-trend rates and rates of utilization of healthcare services by retirees. These assumptions are based on the environment in each country. The assumptions used are reviewed at the end of each year and may vary from year-to-year, based on the evolution of the situation, which will affect future results of operations. Any differences between these assumptions and the actual outcome will also impact future results of operations.
The significant assumptions used to account for pensions and other post-retirement benefits are determined as follows:follows. Discount and inflation rates primarily reflect the rates at which the benefits could be effectively settled, taking into account the duration of the obligation. Indications used in selecting the discount rate include rates of annuity contracts and rates of return on high-quality fixed-income investments (such as government bonds). The inflationhigh quality corporate bonds. Inflation rates reflect market conditions observed on a country-by-country basis. Salary increase assumptions (when relevant) are determined by each entity. They reflect an estimate of the actual future salary levels of the individual employees involved, including future changes attributed to general price levels (consistent with inflation rate assumptions), productivity, seniority, promotion and other factors. Healthcare cost trend assumptions (when relevant) reflect an estimate of the actual future changes in the cost of the healthcare relatedhealthcare-related benefits provided to the plan participants and are based on past and current healthcare cost trends including healthcare inflation, changes in healthcare utilization, and changes in health status of the participants. Demographic assumptions such as mortality, disability and turnover reflect the best estimate of these future events for the individual employees involved, based principally on available actuarial data. Determination of expected rates of return on pension plan assets is made through compound averaging. For each plan, the distribution of investments among bonds, equities and cash and the expected rates of return on bonds, equities and cash are taken into account. A weighted-average rate is then calculated. The effect pensions had on results of operations, cash flow and liquidity is fully set out in Note 18 to the Consolidated Financial Statements. Net employee benefit expense in 20082011 amounted to 232 M€315 million and the Company’s contributions to pension plans were 855 M€.347 million. Differences between projected and actual costs and between the projected return and the actual return on plan assets routinely occur and are called actuarial gains and losses. The Group applies the corridor method to amortize its actuarial losses and gains. This method amortizes the net cumulative actuarial gains and losses that exceed 10% of the greater of (i) the present value of the defined benefit obligation, and (ii) the fair value of plan assets, over the average expected remaining working lives of the employees participating in the plan. The unrecognized actuarial losses of pension benefits as of December 31, 2008,2011, were 953 M€1,713 million compared to 160 M€1,170 million for 2007.2010. The increase in unrecognized actuarial losses is explained by actuarial losses due to a decrease in discount rates in 2011 and due to a decrease in the value of plan assets that were partially offset by an increase in discount rates in 2008.assets. As explained above, pension accounting principles allow that such actuarial losses be deferred and amortized over future periods, in the Company’s case a period of 15fifteen years. While theThe Company has not completed its calculations for 2009, it is considering a decreased weighted-average expected rate of return on pension plan assets of 5.35% for the year (6.13%2012 compared to the 20082011 rate of 6.60%), due to a change in the pension assets allocation as of December 31, 2008, that was partially offset by an increase in discount rates in 2008.5.90%. The Company does not believe, based on currently available information, that it will be significantly modifying its discount rate in 2012 or the near future.
The Company’s estimates indicate that a 1% increase or decrease in the expected rate of return on pension plan assets would have caused a 66 M€62 million decrease or increase, respectively, in the 20082011 net periodic pension cost. The estimated impact on expensenet periodic pension cost of the amortization of the unrecognized actuarial losses of 953 Mpension benefits of€1,713 million as of December 31, 2008,2011, is 99 M€102 million for 2009,2012, compared to 20 Mthe actual impact of€ in 2008.46 million for 2011. Income tax computation The computation of the Group’s income tax expense requires the interpretation of complex tax laws and regulations in many taxing jurisdictions around the world, the determination of expected outcomes from pending litigation, and the assessment of audit findings that are performed by numerous taxing authorities. Actual income tax expense may differ from management’s estimates.
Results 2006-2008RESULTS 2009-2011
| | | | | | | | As of and for the year ended December 31, (M€, except per share data) | | 2008 | | 2007 | | 2006 | Sales(a) | | 179,976 | | 158,752 | | 153,802 | Net income (Group share) | | 10,590 | | 13,181 | | 11,768 | Diluted earnings per share | | 4.71 | | 5.80 | | 5.09 | Investments | | 13,640 | | 11,722 | | 11,852 | Divestments | | 2,585 | | 1,556 | | 2,278 | Cash flow from operating activities | | 18,669 | | 17,686 | | 16,061 |
(a) | Pursuant to IFRS 5, excludes contributions from Arkema in 2006. |
| | | | | | | | | | | | | | As of and for the year ended December 31, (M€, except per share data) | | 2011 | | | 2010 | | | 2009 | | Non-Group sales | | | 184,693 | | | | 159,269 | | | | 131,327 | | Net income (Group share) | | | 12,276 | | | | 10,571 | | | | 8,447 | | Diluted earnings per share | | | 5.44 | | | | 4.71 | | | | 3.78 | |
Group Results 20082011 vs. 20072010 Unprecedented volatility markedThe year 2011 witnessed a number of geopolitical events that put pressure on market supplies. Despite the 2008economic slowdown, demand for oil products continued to rise, fueled by the growth of emerging markets. Pressure on supply, plus rising demand, resulted in a sharp increase in the price of crude oil.
In the Upstream segment, the 2011 oil market environment. environment was marked by a 40% increase in the average Brent price to $111.3/b from $79.5/b in 2010. In 2011, TOTAL’s average liquids price realization(1) increased by 38% to $105.0/b from $76.3/b in 2010, in line with the increase in the average Brent price of oil. TOTAL’s average natural gas price realization(1) increased by 27% to $6.53/MBtu in 2011 from $5.15/MBtu in 2010. The average euro-dollar exchange rate was 1.39 $/€ in 2011 compared to 1.33 $/€ in 2010. In the Downstream segment, the Group’s European Refining Margin Indicator (ERMI) fell to $17.4/t in 2011 from $27.4/t in 2010. Despite the gradual reduction of refining capacity, the overcapacity that has existed in the European refining market since 2009 continued into 2011, due to low demand in Europe. In the first parthalf of 2011, the Chemicals segment enjoyed a globally favorable environment, which has since deteriorated. In the second half of the year, Petrochemicals and Specialty Chemicals saw their margins shrink due to the pricedrop in demand caused by the economic slowdown. Consolidated sales of Brent crude climbed rapidly toward $150/b. InTOTAL were€184.7 billion in 2011, an increase of 16% from€159.3 billion in 2010, as a result of an increase in non-Group sales in the second partUpstream, Downstream and Chemicals segments of 26%, 15% and 11%, respectively. Net income (Group share) in 2011 increased by 16% to€12,276 million from€10,571 million in 2010, mainly due to the impact of the year,increase in hydrocarbon prices on the global economy sufferedUpstream segment’s results. The after-tax inventory valuation effect (as defined below under “— Business Segment Reporting”) had a sharp slowdown, which contributed to driving Brent down to a new low for the year of $35/b in December. The average Brent oil price in 2008 increased by 34% to $97.30/b from $72.40/b in 2007, and its price averaged $55/b for the fourth quarter of 2008. Refining margins also increased in 2008, with the European refining margin indicator used by TOTAL’s management (TRCV) up 16% to $37.80/t from $32.50/t in 2007. The Chemicals environment weakened in 2008 compared to 2007, turning sharply negative at year-end due to decreasing demand resulting from the global economic slowdown. While the dollar lost 7% of its value against the euro during 2008, with the average dollar/euro exchange rate being $1.47/€ in 2008 compared to $1.37/€ in 2007, it did gain 14% against the euro during the fourth quarter. TOTAL’s consolidated sales increased by 13% to 180.0 B€ in 2008 from 158.8 B€ in 2007.
TOTAL’spositive impact on net income (Group share) was 10,590 Mof€834 million in 2008 compared2011 and a positive impact of€748 million in 2010, in each case essentially due to 13,181 M€the increase in 2007. The 20% decreaseoil prices. As from January 1, 2011, the Group accounts for changes in fair value of trading inventories and storage contracts (as defined below under “— Business Segment Reporting”). Changes in fair value of these items had a positive impact on net income (Group share) of€32 million in 20082011. Special items had a negative impact on net income (Group share) of€14 million in 2011, comprised mainly of€1,014 million of impairments (essentially impairments on European refining and renewable energy assets) and€1,538 million of gains on asset sales. Special items had a negative impact on net income (Group share) of€384 million in 2010, comprised essentially of asset impairments that had a negative impact of€1,224 million (essentially impairments on European refining assets) and gains on asset sales that had a positive impact of€1,046 million. Effective July 1, 2010, the Group no longer accounts for its interest in Sanofi as an equity affiliate, but treats such interest as a financial asset available for sale in the line “Other investments” of the balance sheet. In 2010, the Group’s share of adjustment items related to Sanofi had a negative impact on net income (Group share) of€81 million.
In 2011, income taxes amounted to€14,073 million, an increase of 38% compared to 2007€10,228 in 2010, primarily as a result of the increase in taxable income. The increase in the effective tax rate from 49% in 2010 to 53% in 2011 was mainly due to the negative after-tax impact of prices on inventory valuation (-3.8 B€), due to the sharp drop in oil pricesan increase in the last quarterportion of 2008. Other factors contributing to the decrease in net income in 2008 compared to 2007 consisted mainly of: the weaker dollar (-0.8 B€); special items (-0.5 B€); higher Upstream costs (-0.5 B€); lower production (-0.5 B€); less favorable results from U.S. refining, mainly due to a less favorable business environment and hurricanes (-0.2 B€); a less favorable environment in the Chemicals business (-0.2 B€); the Group’s equity share of the amortization of intangibles relatedincome before tax attributable to the Sanofi-Aventis merger (-0.1 B€); andentities with a decrease in income from equity affiliates in the Downstream segment, mainly due to losses incurred through TOTAL’s participation in Wepec, its affiliate for refining in China (-0.1 B€). These negative impacts were partially offset by the positive impacts of higher hydrocarbon prices (+3.5 B€) and a more favorable Downstream business environment (+0.6 B€).
The effectivelocal tax rate formuch higher than the Group was 56.3% in 2008 compared to 55.6% in 2007 due primarily to the relatively higher comparative weightFrench tax rate (36.10%). The portion of the Upstream segmentincome before tax represented 89% in the Group’s results.2011, unchanged from 2010.
In 2008, theThe Group boughtdid not buy back 27.6 million of its shares(1) for 1,339 M€. in 2011. The number of fully-diluted shares at December 31, 2008,2011, was 2,2352,263.8 million compared to 2,2652,249.3 million at December 31, 2007.2010.
DilutedFully-diluted earnings per share, based on 2,2472,257 million fully-diluted weighted-average shares, decreased by 19%was€5.44 in 2011 compared to€4.71 in 2008 from€5.80 in 2007.
Group Results 2007 vs. 2006
The average oil market environment in 2007 was marked by higher oil prices, with the average Brent oil price increasing 11% to $72.40/b from $65.10/b in 2006. Refining margins also increased in 2007, with the European refining margin indicator used by TOTAL’s management (TRCV) up 12% to $32.50/t from $28.90/t in 2006. The environment for Chemicals weakened in 2007 compared to 2006, essentially due to the negative impact on petrochemical margins from the rapid2010, an increase in the price of naphtha late in 2007. The average dollar/euro exchange rate was $1.37/€ in 2007 compared to $1.26/€ in 2006, an 8% decline in the value of the dollar.
TOTAL’s consolidated sales increased by 3% to 158.8 B€ in 2007 from 153.8 B€ in 2006.15%.
| (1) | Includes 2.8 million shares purchased to cover restricted share grants pursuant to the decision of the Board on September 9, 2008.Consolidated subsidiaries, excluding fixed margin and buyback contracts. |
Group Results 2010 vs. 2009 In 2010, the oil and gas market environment was characterized by increased demand for oil and natural gas products. Crude oil prices were relatively stable during 2010, with an average Brent oil price of $79.5/b, an increase of 29% compared to $61.7/b in 2009. In 2010, TOTAL’s average liquids price realization increased 31% to $76.3/b from $58.1/b in 2009, in line with the increase in the average Brent price of oil. TOTAL’s average natural gas price realization(1) decreased to $5.15/MBtu in 2010 from $5.17/MBtu in 2009. The average euro-dollar exchange rate was 1.33 $/€ on average in 2010 compared to 1.39 $/€ in 2009. Refining margins rebounded in 2010 from historically low levels in 2009. For the full year 2010, the Group’s ERMI was $27.4/t, an increase of 54% compared to $17.8/t in 2009. For the full year 2010, the Chemicals segment benefited from a strong rebound in demand and margins in the Base Chemicals division’s market, as well as an increase in demand in the Specialties Chemicals division’s market. Consolidated sales of TOTAL were€159.3 billion in 2010, an increase of 21% from€131.3 billion in 2009, as a result of an increase in non-Group sales in the Upstream, Downstream and Chemicals segments of 15%, 23% and 19%, respectively. Reported net income (Group share) was 13,181 Min 2010 increased by 25% to€10,571 million from€8,447 million in 2007 compared to 11,768 M€ in 2006. The 12% increase in net income in 2007 compared to 2006 was2009, mainly due to the positiveincrease in hydrocarbon prices and production, as well as a rebound in the Chemicals segment. The after-tax impactsimpact of prices on inventory valuation (+1.7 B€), the overall more favorable environment (+0.6 B€), growth in the Upstream segment (+0.6 B€) and growth and productivity plansaccounted for in the Downstream and Chemicals segments (+0.3 Bhad a positive impact on net income (Group share) of€), which were partially offset by748 million in 2010 and a positive impact of€1,533 million in 2009, in each case due to the negative impactsincrease in oil prices. For a discussion of the weaker dollar (-1.0 B€), higher costsimpact of prices on inventory valuation in the UpstreamDownstream and DownstreamChemicals segments (-0.4 Bsee “— Business Segment Reporting” below. Special items had a negative impact on net income (Group share) of€), increased exploration expense (-0.3 B384 million in 2010, comprised essentially of asset impairments that had a negative impact of€)1,224 million and the higher net costgains on asset sales that had a positive impact of net debt for€1,046 million. Special items had a negative impact of€570 million in 2009. Effective July 1, 2010, the Group (-0.1 Bno longer accounts for its interest in Sanofi as an equity affiliate, but treats such interest as a financial asset available for sale in the line “Other investments” of the balance sheet. The Group’s share of adjustment items related to Sanofi had a negative impact on net income (Group share) of€ ).81 million in 2010 (six months) and a negative impact of€300 million in 2009 (full year). In 2010, income taxes amounted to€10,228 million, an increase of 32% compared to€7,751 in 2009, primarily as a result of the increase in taxable income. The increase in the effective tax rate forfrom 47% in 2009 to 49% in 2010 was mainly due to an increase in the portion of the Group was 56%income before tax attributable to entities with a local tax rate much higher than the French tax rate (34.43%). The portion of the Upstream income before tax represented 89% in 2007, stable2010 compared to 56%with 82% in 2006. The Upstream segment had2009, with a comparable relative weight in the results of both years. In 2007,corresponding impact on the Group boughteffective tax rate.
The Group did not buy back 32.4 million of its shares(1) for 1,787 M€. in 2010. The number of fully-diluted shares at December 31, 2007,2010, was 2,2652,249.3 million compared to 2,2852,243.7 million at December 31, 2006.2009. DilutedFully-diluted earnings per share, based on 2,2742,244.5 million fully-diluted weighted-average shares, increased by 14%was€4.71 in 2010, compared to€5.803.78 in 2007 from€5.09 in 2006, slightly greater than the2009, an increase in net income due to the accretive effect of the share buybacks.25%.
Business Segment Reporting The financial information for each business segment is reported on the same basis as that used internally by the chief operating decision maker in assessing segment performance and the allocation of segment resources. Due to their particular nature or significance, certain transactions qualified as “special items” are excluded from the business segment figures. In general, special items relate to transactions that are significant, infrequent or unusual. However, in certain instances, certain transactions such as restructuring costs or assetsasset disposals, which are not considered to be representative of the normal course of business, may be qualified as special items although they may have occurred in prior years or are likely to recur in following years. In accordance with IAS 2, the Group values inventories of petroleum products in the financial statements according to the FIFO (First-In, First-Out) method and other inventories using the weighted-average cost method. Under the FIFO method, the cost of inventory is based on the historic cost of acquisition or manufacture rather than the current replacement cost. In volatile energy markets, this can have a significant distorting effect on the reported income. Accordingly, the adjusted results of the Downstream segment and Chemicals segment are presented according to the replacement cost method in order to facilitate the comparability of the Group’s results | (1) | Consolidated subsidiaries, excluding fixed margin and buyback contracts. |
with those of its competitors mainly in the United States, and to help illustrate the operating performance of these segments excluding the impact of oil price changes on the replacement of inventories. In the replacement cost method, which approximates the LIFO (Last-In, First-Out) method, the variation of inventory valuevalues in the statement of income statement is, depending on the nature of the inventory, determined byusing either the month-end prices differential between one period and another or the average prices of the period rather than the historical value.period. The inventory valuation effect is the difference between the results according tounder the FIFO methodand replacement cost methods. As from January 1, 2011, the effect of changes in fair value presented as an adjustment item reflects, for trading inventories and storage contracts, differences between internal measures of performance used by TOTAL’s management and the replacement cost method. accounting for these transactions under IFRS. IFRS requires that trading inventories be recorded at their fair value using period-end spot prices. In order to best reflect the management of economic exposure through derivative transactions, internal indicators used to measure performance include valuations of trading inventories recorded at their fair value based on forward prices. Furthermore, TOTAL, in its trading activities, enters into storage contracts, the future effects of which are recorded at fair value in the Group’s internal economic performance. IFRS, by requiring accounting for storage contracts on an accrual basis, precludes recognition of this fair value effect. Until June 30, 2010, the Group also adjusted for its equity share of adjustment items related to Sanofi. As of July 1, 2010, Sanofi is no longer accounted for as an equity affiliate (but is instead treated as a financial asset available for sale in the line “Other investments” of the balance sheet). The adjusted business segment results (adjusted operating income and adjusted net operating income) are defined as replacement cost results, adjusted for special items.items, excluding the effect of changes in fair value as from January 1, 2011. For further information on the adjustments affecting operating income on a segment-by-segment basis, and for a reconciliation of segment figures to figures reported in the Company’s audited consolidated financial statements, see Note 4 to the Consolidated Financial Statements. In addition, theThe Group measures performance at the segment level on the basis of net operating income and adjusted net operating income. Net operating income comprises operating income of the relevant segment after deducting the amortization and the depreciation of intangible assets other than leasehold rights, translation adjustments and gains or losses on the sale of assets, as well as all other income and expenses related to capital employed (dividends from non-consolidated companies, income from equity affiliates and capitalized interest expenses), and after income taxes applicable to the above. The income and expenses not included in net operating income whichthat are included in net income are only interest expenses related to long-term liabilities net of interest earned on cash and cash equivalents, after applicable income taxes (net cost of net debt and minoritynon-controlling interests). Adjusted net operating income excludes the effect of the adjustments (special items and the inventory valuation effect) described above.
For further discussion onof the calculation of net operating income and the calculation of ROACE,return on average capital employed (ROACE)(1), see Note 2 to the Consolidated Financial Statements.
(1) | Includes 2.4 million shares purchased to cover restricted share grants pursuant to the decision of the Board on July 17, 2007. |
Upstream results | | (M€) | | 2008 | | 2007 | | 2006 | | | 2011 | | 2010 | | 2009 | | Non-Group sales | | 24,256 | | | 19,706 | | | 20,782 | | | | 23,298 | | | | 18,527 | | | | 16,072 | | Operating income(a) | | 23,468 | | | 19,503 | | | 20,307 | | | | 22,444 | | | | 17,450 | | | | 12,858 | | Equity in income (loss) of affiliates and other items | | 1,541 | | | 1,330 | | | 1,211 | | | | 1,596 | | | | 1,533 | | | | 846 | | Tax on net operating income | | (14,563 | ) | | (11,996 | ) | | (12,764 | ) | | | (13,506 | ) | | | (10,131 | ) | | | (7,486 | ) | Net operating income(a) | | 10,446 | | | 8,837 | | | 8,754 | | | | 10,534 | | | | 8,852 | | | | 6,218 | | Adjustments affecting net operating income | | 278 | | | 12 | | | (45 | ) | | | (129 | ) | | | (255 | ) | | | 164 | | Adjusted net operating income(b) | | 10,724 | | | 8,849 | | | 8,709 | | | | 10,405 | | | | 8,597 | | | | 6,382 | | Investments | | 10,017 | | | 8,882 | | | 9,001 | | | | 21,689 | | | | 13,208 | | | | 9,855 | | Divestments | | 1,130 | | | 751 | | | 1,458 | | | | 2,656 | | | | 2,067 | | | | 398 | | | ROACE | | 36% | | | 34% | | | 35% | | | | 20% | | | | 21% | | | | 18% | |
| (a) | For the definition of operating income and net operating income, see Note 2 to the Consolidated Financial Statements. |
| (b) | Adjusted for special items. See Notes 2 and 4 to the Consolidated Financial Statements. |
| (1) | ROACE = adjusted net operating income divided by average capital employed. |
20082011 vs. 20072010
Upstream segment sales (excluding sales to other segments) were up 23%increased by 26% to 24,256 M€23,298 million in 2008 compared to 19,706 M2011 from€18,527 million in 2007,2010, reflecting higher average hydrocarbon prices, which more than offsetessentially the impacts of the decrease of the dollar compared to the euro and a decrease in production. TOTAL’s average liquids price realization in 2008 increased 32% to $91.1/b from $68.9/b in 2007, in line with the increase in the average Brent price of oil, which was $97.3/b in 2008 compared to $72.4/b in 2007. TOTAL’s average natural gas price realization increased 37% to $7.38/MBtu in 2008 from $5.40/MBtu in 2007.
For 2008, adjusted net operating income for the Upstream segment increased 21% to 10,724 M€ compared to 8,849 M€ in 2007. The increase in adjusted net operating income was mainly due to the positive impacts of the price of hydrocarbons (+3.5 B€) partially offset by the negative impacts of the weaker dollar (-0.6 B€), lower production (-0.5 B€) and higher production costs (-0.5 B€).
The exclusion of special items (which in 2008 comprised principally an asset impairment of 171 M€ on the Joslyn project and the net impact of contract renegotiations of 106 M€) had a positive impact of 278 M€ on adjusted net operating income for the Upstream segment in 2008 compared to a positive impact of 12 M€ in 2007 (comprised principally of asset impairments of 93 M€ largely offset by capital gains of 89 M€).
ROACE for the Upstream segment increased to 35.9% in 2008 from 33.6% in 2007. The increase was mainly due to adjusted net operating income having increased more than the average level of capital employed, which was principally due to higher hydrocarbon prices.
In 2008, Upstream net operating income amounted to 10,446 M€ (for 2007, 8,837 M€) from operating income of 23,468 M€ (for 2007, 19,503 M€), with the difference resulting primarily from taxes on net operating income of 14,563 M€ (11,996 M€ in 2007), partially offset by income from equity affiliates and other items of 1,541 M€ (1,330 M€ in 2007).
Oil and gas production in 2008 averaged 2,341 kboe/d compared to 2,3912,346 kboe/d in 2007.2011, compared to 2,378 kboe/d in 2010. This 2%1.3% decrease was due essentially to the negative impactsresult of normal decline, net of production ramp-ups on new projects (-1.5%), security conditions, mainly in Libya (-1.5%) and the price effect(1) (-2%)(1), unscheduled shutdowns (-2.5%, mainly on the Elgin Franklin field in February, the Bruce and Alwyn fields in the summer and the Al Jurf field from April to the end of December 2008, as described in Item 4 of this Annual Report) andpartially offset by changes in the portfolio (-1%) partially offset by(+2.5%; integrating the positivenet share of Novatek production and the impact of underlying production growththe sale of interests in CEPSA) and the end of OPEC reductions (+3.5%, primarily from production ramp-ups and start-ups of major TOTAL-operated projects, including Dolphin, Rosa, Jura and Dalia, net of the normal decline on existing fields). Underlying production growth in 2008, excluding the price effect and changes in the portfolio, was +1%1%). The Group’s provedProved reserves at December 31, 2008, remained steady at 10,458 Mboe compared to 10,449based on SEC rules were 11,423 Mboe at December 31, 2007. At2011 (Brent at $110.96/b), compared to 10,695 Mboe at December 31, 2010 (Brent at $79.02/b). Based on the 20082011 average rate of production, these reserves represent approximately 12 years of production.reserve life is thirteen years.
See “Item 4. Information on the Company — Exploration & Production — Reserves” for a table showing changes indiscussion of proved reserves by year and “Supplemental Oil and Gas Information (Unaudited)” contained elsewhere herein for additional information on proved reserves, including tables showing changes in proved reserves by region. Upstream net operating income in 2011 amounted to€10,534 million (for 2010,€8,852 million) from operating income of€22,444 million (for 2010,€17,450 million), with the difference between net operating income and operating income resulting primarily from taxes on net operating income of€13,506 million (for 2010,€10,131 million), partially offset by income from equity affiliates and other items of€1,596 million (for 2010,€1,533 million). The increase in net operating income in 2011 compared to 2010 was due primarily to the impact of higher hydrocarbon prices. Adjusted net operating income for the Upstream segment was€10,405 million in 2011 compared to€8,597 million in 2010, an increase of 21%, essentially due to the impact of higher hydrocarbon prices partially offset by the impact of the mix effect, changes in foreign exchange rates and increased costs, exploration expenses and taxes. Technical costs for consolidated subsidiaries, in accordance with ASC 932(2) were $18.9/boe(3) in 2011, compared to $16.6/boe in 2010, mainly due to
depreciation, depletion and amortization (DD&A) charges related notably to the start-up of new projects and increased operating expenses per barrel. Adjusted net operating income for the Upstream segment excludes special items. In 2011, the exclusion of special items had a negative impact of€129 million on adjusted net operating income for the Upstream segment and a negative impact of€255 million in 2010, in both cases comprised principally of capital gains on asset sales partially offset by asset impairments. The Upstream segment’s total capital expenditures increased by 64% to€21,689 million in 2011 from€13,208 million in 2010. Capital expenditures excluding acquisitions in 2011 mainly included projects in the following countries: Angola, Nigeria, Norway, Australia, Kazakhstan, the United Kingdom, Canada, Indonesia, Gabon, the Republic of the Congo and the United States. ROACE for the Upstream segment decreased to 20% in 2011 from 21% in 2010. The decrease was mainly due to the increase in capital employed in 2011. 2010 vs. 2009 Upstream segment sales (excluding sales to other segments) increased by 15% to€18,527 million in 2010 from€16,072 million in 2009, reflecting essentially the impact of higher hydrocarbon prices and production growth. Oil and gas production averaged 2,378 kboe/d in 2010, compared to 2,281 kboe/d in 2009. This 4.3% increase was essentially the result of production ramp-ups on new projects, net of the normal decline, and a lower level of turnarounds (+3%), changes in the portfolio (+2%), lower OPEC reductions and an increase in gas demand (+1.5%) and improved security conditions in Nigeria (+1%), partially offset by the price effect (-3%). Proved reserves based on SEC rules were 10,695 Mboe at December 31, 2010 (Brent at $79.02/b), compared to 10,483 Mboe at December 31, 2009 (Brent at $59.91/b). At the 2010 average rate of production, reserve life was more than twelve years. See “Item 4. Information on the Company — Exploration & Production — Reserves” for a discussion of proved reserves and “Supplemental Oil and Gas Information (Unaudited)” contained elsewhere herein for additional information on proved reserves, including tables showing changes in proved reserves by region. | (1) | The “price effect” refers to the impact of hydrocarbon prices on entitlement volumes from production sharing and buyback contracts. For example, as the price of oil or gas increases above certain pre-determined levels, TOTAL’s share of production normally decreases. |
| (2) | Accounting Standards Codification Topic 932, Extractive industries — Oil and Gas. |
| (3) | Excluding IAS 36 (impairment of assets). |
Total expenditures of the Upstream segment increased by 13% to 10,017 M€ in 2008 from 8,882 M€ in 2007. In 2008, expenditures mainly included the following projects: Kashagan in Kazakhstan; Akpo, Usan and OML 58 in Nigeria; Pazflor, Angola LNG and Tombua Landana in Angola; Ekofisk in Norway; the Mahakam zone in Indonesia; the Alwyn zone in the United Kingdom; Moho Bilondo in the Republic of Congo and Anguille in Gabon.
2007 vs. 2006
Upstream segment sales (excluding sales to other segments) were down 5% to 19,706 M€ in 2007 compared to 20,782 M€ in 2006, reflecting the impact of the decrease of the dollar compared to the euro, which more than offset the impacts of the increase in production and higher average hydrocarbon prices.
TOTAL’s average liquids price realization in 2007 increased 11% to $68.9/b from $61.80/b in 2006, in line with the increase in the average Brent price of oil, which was $72.4/b in 2007 compared to $65.10/b in 2006. TOTAL’s average gas price realization decreased 9% to $5.40/MBtu from $5.91/MBtu in 2006 due to weakness in the UK spot price as well as the ramp-up in production from the Dolphin project in the second half of 2007.
For 2007, adjusted net operating income for the Upstream segment increased 2% to 8,849 M€ compared to 8,709 M€ in 2006. The increase in adjusted net operating income was mainly due to the positive impacts of the more favorable environment (+0.75 B€) and growth (+0.6 B€) which were for the most part offset by the negative impacts of the weaker dollar (-0.65 B€), higher production costs (-0.3 B€ ) and increased exploration expense (-0.25 B€).
The exclusion of special items (which in 2007 comprised principally asset impairments of 93 M€ largely offset by capital gains of 89 M€) had a positive impact of 12 M€ on adjusted net operating income for the Upstream segment in 2007 and a negative impact of 45 M€ in 2006 (comprised of capital gains on asset disposals).
ROACE for the Upstream segment was down slightly to 34% in 2007 from 35% in 2006 because the average level of capital employed increased slightly more than adjusted net operating income as a result of the increased investment program to support future growth.
In 2007, Upstream net operating income in 2010 amounted to 8,837 M€8,852 million (for 2006, 8,754 M2009,€)6,218 million) from operating income of 19,503 M€17,450 million (for 2006, 20,307 M2009,€)12,858 million), with the difference between net operating income and operating income resulting primarily from taxes on net operating income of 11,996 M€ (12,764 M10,131 million (for 2009,€ in 2006)7,486 million), partially offset by income from equity affiliates and other items of 1,330 M€ (1,211 M1,533 million (for 2009,€ in 2006)846 million). The decreaseincrease in taxesnet operating income in 20072010 compared to 2009 was due primarily to the impact of higher hydrocarbon prices and production growth.
Over the full year 2010, adjusted net operating income for the Upstream segment was€8,597 million compared to€6,382 million in 2009, an increase of 35%, essentially due to hydrocarbon prices (+€2.3 billion). Technical costs for consolidated subsidiaries, in accordance with ASC 932 were $16.6/boe in 2010, compared to $15.4/boe in 2009, mainly due to depreciation, depletion and amortization (DD&A) charges related notably to the start-up of new projects and increased operating expenses per barrel. Adjusted net operating income for the Upstream segment excludes special items. In 2010, the exclusion of special items (comprised principally of capital gains on asset sales partially offset by asset impairments) had a relative increasenegative impact of€255 million on adjusted net operating income for the Upstream segment compared to a positive impact of€164 million in 2009 (comprised principally of asset impairments and other elements). The Upstream segment’s total capital expenditures increased by 34% to€13,208 million in 2010 from€9,855 million in 2009. The capital expenditures in 2010 mainly included projects in the sharefollowing countries: Angola, the United States, Nigeria, Canada, Norway, Kazakhstan, Australia, the United Kingdom, Indonesia, the Republic of the Group’s productionCongo, Libya, Gabon and Thailand. ROACE for the Upstream segment increased to 21% in countries with lower tax rates. Oil and gas production2010 from 18% in 2007 averaged 2,391 kboe/d compared to 2,356 kboe/d in 2006. This 1.5%2009. The increase was mainly due to the positive impact of underlying production growth (+5%, primarily from production ramp-ups and start-ups of major TOTAL-operated projects, including Dalia, Rosa and Dolphin), partially offset by the negative impacts of the price effect, OPEC quota reductions and shutdowns in the Niger delta because of security issues (-2%), of changes in the Group’s portfolio, mainly the termination of a concession in Dubai (-1%), and of the May 2007 fire on the Nkossa platform in Congo (-0.5%).
The Group’s proved reserves at December 31, 2007 decreased 6% to 10,449 Mboe from 11,120 Mboe at December 31, 2006. At the 2007 average rate of production, these reserves represent approximately 12 years of production. Changes in 2007 proved reserves were primarilyadjusted net operating income having increased, principally due to the sale of 16.7% of Sincor to PDVSAincreased hydrocarbon prices and other divestments (-4%), the price effect (-2%) and production over the year 2007 (-1.5%), which were only partially offset by new additions from successful exploration and business developments (+2%).
See “Item 4. Information on the Company — Exploration & Production — Reserves” for a table showing changes in proved reserves by year and “Supplemental Oil and Gas Information (Unaudited)” contained elsewhere herein for additional information on proved reserves, including tables showing changes in proved reserves by region.
Total expenditures of the Upstream segment decreased by 1% to 8,882 M€ in 2007 from 9,001 M€ in 2006. In 2007, expenditures mainly included the following projects: Kashagan (Kazakhstan), Akpo (Nigeria), Yemen LNG (Yemen), Moho Bilondo (Congo), Dalia, Rosa, Tombua/Landana and Angola LNG (Angola), Snøhvit and Tyrihans (Norway), Dunbar and Jura (UK), Anguille (Gabon), Dolphin (Qatar), Surmont and Joslyn (Canada) and Tahiti (United States).production.
Downstream results | | (M€) | | 2008 | | 2007 | | 2006 | | | 2011 | | 2010 | | 2009 | | Non-Group sales | | 135,524 | | | 119,212 | | | 113,887 | | | | 141,907 | | | | 123,245 | | | | 100,518 | | Operating income(a) | | 826 | | | 4,824 | | | 3,372 | | | | 1,694 | | | | 982 | | | | 2,237 | | Equity in income (loss) of affiliates and other items | | (158 | ) | | 284 | | | 384 | | | | 401 | | | | 141 | | | | 169 | | Tax on net operating income | | (143 | ) | | (1,482 | ) | | (1,125 | ) | | | (409 | ) | | | (201 | ) | | | (633 | ) | Net operating income(a) | | 525 | | | 3,626 | | | 2,631 | | | | 1,686 | | | | 922 | | | | 1,773 | | Adjustments affecting net operating income | | 2,044 | | | (1,091 | ) | | 153 | | | | (603 | ) | | | 246 | | | | (820 | ) | Adjusted net operating income(b) | | 2,569 | | | 2,535 | | | 2,784 | | | | 1,083 | | | | 1,168 | | | | 953 | | Investments | | 2,418 | | | 1,875 | | | 1,775 | | | | 1,870 | | | | 2,343 | | | | 2,771 | | Divestments | | 216 | | | 394 | | | 428 | | | | 3,235 | | | | 499 | | | | 133 | | | ROACE | | 20% | | | 21% | | | 23% | | | | 7% | | | | 8% | | | | 7% | |
| (a) | For the definition of operating income and net operating income, see Note 2 to the Consolidated Financial Statements. |
| (b) | Adjusted for special items and the inventory valuation effect. See Notes 2 and 4 to the Consolidated Financial Statements. |
20082011 vs. 20072010
For the full year 2011, the Group’s European Refining Margin Indicator (ERMI) was $17.4/t, a decrease of 36% compared to 2010. Downstream segment sales (excluding sales to other segments) increased 14% to 135,524 Mwere€141,907 million in 20082011 compared to€123,245 million in 2010, an increase of 15% essentially due to the impact of higher hydrocarbon prices. Refined product sales (including trading operations) were 3,639 kb/d in 2011, a decrease of 4% compared to 119,212 M€ in 2007. In 2008, refined product sales averaged 3,658 kb/d, down 3% from 3,7743,776 kb/d in 2007. 2008 refinery2010. Refinery throughput decreased slightlyin 2011 was 1,863 kb/d, a 7% decrease compared to 2,362 kb/d from 2,4132,009 kb/d in 2007. The2010 essentially due to the sale of the Group’s interest in CEPSA and a higher level of major turnarounds than in
2010. In 2011, major turnarounds took place in the Antwerp, Grandpuits, Leuna, Lindsey and Port Arthur refineries. For the full year 2011, the refinery utilization rate for 2008 based on crude throughput was 88% (91% based on78% (83% for crude and other feedstock) compared to 87% (89% based on73% in 2010 (77% for crude and other feedstock) in 2007.. In 2008, six refineries were affected2010, the utilization rate was impacted by turnarounds compared to ten in 2007. The levelthe shutdown of the Dunkirk refinery turnarounds in 2009 is expected to be comparable toand a distillation unit at the 2008 level. For 2008, adjusted net operating income for the Downstream segment increased 1% to 2,569 M€ compared to 2,535 M€ in 2007. This result mainly reflects the generally satisfactory environment, with gains in Europe (0.55 B€) in 2008 offset by losses in U.S. refining (-0.2 B€) stemming from the negative environment and from hurricanes,Normandy refinery as well as benefits recordedimpacts from increased productivity and supply optimization, particularly during the fourth quarter of 2008. However, net operating income was negatively affected by a 70% decreasestrikes in income from equity affiliates to 77 M€ in 2008 from 258 M€ in 2007, mainly due to losses incurred through TOTAL’s participation in Wepec, its Chinese refining affiliate.
The adjustment for the inventory valuation effect had a positive impact on Downstream adjusted net operating
income of 1,971 M€ in 2008 compared to a negative impact of 1,098 M€ in 2007. In 2008, the exclusion of special items (relating principally to restructuring charges of 70 M€ and other special items) had a positive impact of 73 M€ on adjusted net operating income. The exclusion of special items in 2007 had a negative impact of 7 M€, with capital gains of 101 M€ more than offsetting restructuring charges, asset impairments and other special items.
ROACE for the Downstream segment was 19.9% in 2008 compared to 20.6% in 2007 due principally to increased investment in 2008.France.
In 2008,2011, Downstream net operating income decreasedincreased to 525 M€1,686 million (for 2007, 3,626 M2010,€)922 million) from operating income of 826 M€1,694 million (for 2007, 4,824 M2010,€)982 million), with the difference between net operating income and operating income resulting primarily from taxes on net operating income of 143 M€409 million (for 2007, 1,482 M2010,€) and from the loss201 million), partially offset by income from equity affiliates and other items of 158 M€401 million (for 2007,2010,€141 million). The increase in net operating income in 2011 compared to 2010 was due primarily to the impact of 284 M€).higher hydrocarbon prices, gains on asset sales and lower impairment charges. Investments byThe Downstream segment’s adjusted net operating income in 2011 was€1,083 million compared to€1,168 million in 2010. The decrease was essentially due to the Downstream segment were 2,418 M€negative impact of the deterioration in 2008 compared to 1,875 M€refining margins in 2007.2011.
2007 vs. 2006
Downstream segment sales (excluding sales to other segments) increased to 119,212 M€ in 2007 compared to 113,887 M€ in 2006.
In 2007, refined product sales averaged 3,863 kb/d, up 2% from 3,786 kb/d in 2006.(1) 2007 refinery throughput decreased slightly to 2,413 kb/d from 2,454 kb/d in 2006. The refinery utilization rate for 2007 based on crude throughput was 87% (89% based on crude and
(1) | These 2007 and 2006 refined product sales averages reflect a method of calculating volumes for the Port Arthur refinery adopted prior to 2008. |
other feedstock) compared to 88% (91% based on crude and other feedstock) in 2006. In 2007, ten refineries were affected by turnarounds compared to three in 2006.
For 2007, adjustedAdjusted net operating income for the Downstream segment decreased 9% to 2,535 M€ compared to 2,784 M€ in 2006. The decrease was mainly due to the impact of a weaker dollar (-0.25 B€), as the negative impacts of higher maintenance activity (-0.11 B€), cost inflation (-0.07 B€)excludes any after-tax inventory valuation effect and the overall slightly negative environment (-0.04 B€) were offset by the positive effect of growth and productivity programs (+0.22 B€), notably the contribution from the Normandy distillate hydrocracker for a full year.
special items. The adjustment for the inventory valuation effect had a negative impact on Downstream adjusted net operating income in 2011 of 1,098 M€ in 2007859 million compared to a positivenegative impact of 327 M€640 million in 2006.2010. The exclusion of special items (comprised essentially of impairments on European refining assets (as described below), partially offset by gains on asset sales) in 20072011 had a negativepositive impact of 7 M€, with capital gains of 101 M€ more than offsetting restructuring charges, asset impairments and other special items. In 2006, special items (relating to capital gains on the sale of certain non-strategic financial interests) had a negative impact of 174 M€256 million on adjusted net operating income. In 2010, the exclusion of special items (comprised essentially of impairments on European refining assets partially offset by gains on asset sales) had a positive impact of€886 million on adjusted net operating income.
The persistence of an unfavorable economic environment for refining, affecting Europe in particular, led the Group to recognize an impairment in the Downstream segment on European refining assets in the third and fourth quarters of 2011 in the amount of€700 million in operating income and€478 million in net income. These elements have been treated as adjustment items. Investments by the Downstream segment were€1,870 million in 2011, a decrease of 20% compared to€2,343 million in 2010. Divestments by the Downstream segment were€3,235 million in 2011, comprised essentially of the Group’s stake in CEPSA and certain distribution activities in the United Kingdom, compared to€499 million in 2010. ROACE for the Downstream segment was 21%7% in 20072011 compared to 8% in 2010. 2010 vs. 2009 For the full year 2010, the Group’s ERMI was $27.4/t, an increase of 54% compared to 2009. Downstream segment sales (excluding sales to other segments) were€123,245 million in 2010, an increase of 23% from€100,518 million in 2006 due principally2009. Refined product sales (including trading operations) were 3,776 kb/d in 2010, an increase of 4% compared to increased investment3,616 kb/d in 2007.2009. Refinery throughput in 2010 was 2,009 kb/d, a 7% decrease compared to 2,151 kb/d in 2009. For the full year 2010, the refinery utilization rate based on crude throughput was 73% (77% for crude and other feedstock) compared to 78% in 2009 (83% for crude and other feedstock), reflecting essentially the shutdown of the Dunkirk refinery and a distillation unit at the Normandy refinery as well as impacts from strikes in France. In 2010, the level of scheduled turnarounds for refinery maintenance was low, with turnaround activity expected to increase notably in 2011. In 2007,2010, Downstream net operating income increaseddecreased to 3,626 M€922 million (for 2006, 2,631 M2009,€)1,773 million) from operating income of 4,824 M€982 million (for 2006, 3,372 M2009,€)2,237 million), with the difference between net operating income and operating income resulting primarily from taxes on net operating income of 1,482 M€201 million (for 2006, 1,125 M2009,€)633 million), partially offset by income from equity affiliates and other items of 284 M€141 million (for 2006, 384 M2009,€)169 million). The decrease in net operating income in 2010 compared to 2009 was due primarily to the impairment charge for French and UK refining assets referred to below. The Downstream segment’s adjusted net operating income in 2010 was€1,168 million compared to€953 million in 2009. The increase was essentially due to the positive impact of the refining margin improvement, which was partially offset by lower throughput and reliability of the Group’s refineries in 2010 and less favorable conditions for supply optimization. Adjusted net operating income for the Downstream segment excludes any after-tax inventory valuation effect and special items. The adjustment for the inventory valuation effect had a negative impact on Downstream adjusted net operating income in 2010 of€640 million compared to a negative impact of€1,285 million in 2009. The exclusion of special items (comprised essentially of impairments on European refining assets (as described below), partially offset by gains on asset sales) in 2010 had a positive impact of€886 million on adjusted net operating income. In 2009, the exclusion of special items (relating mainly to refining asset impairments and other elements) had a positive impact of€465 million on adjusted net operating income. The persistence of an unfavorable economic environment for refining, affecting Europe in particular, led the Group to recognize an impairment in the Downstream segment, essentially on French and UK refining assets, in the fourth quarter 2010 in the amount of€1,192 million in operating income and€913 million in net operating income. These elements have been treated as adjustment items. Investments by the Downstream segment were 1,875 M€2,343 million in 20072010, compared to€2,771 million in 2009. ROACE for the Downstream segment was 8% in 2010 compared to 1,775 M€7% in 2006.2009.
Chemicals(1) results | | (M€) | | 2008 | | 2007 | | 2006 | | | 2011 | | 2010 | | 2009 | | Non-Group sales | | 20,150 | | | 19,805 | | | 19,113 | | | | 19,477 | | | | 17,490 | | | | 14,726 | | Operating income(a) | | (58 | ) | | 1,424 | | | 996 | | | | 658 | | | | 964 | | | | 553 | | Equity in income (loss) of affiliates and other items | | (34 | ) | | (11 | ) | | (298 | ) | | | 471 | | | | 215 | | | | (58 | ) | Tax on net operating income | | 76 | | | (426 | ) | | (191 | ) | | | (225 | ) | | | (267 | ) | | | (92 | ) | Net operating income(a) | | (16 | ) | | 987 | | | 507 | | | | 904 | | | | 912 | | | | 403 | | Adjustments affecting net operating income | | 684 | | | (140 | ) | | 377 | | | | (129 | ) | | | (55 | ) | | | (131 | ) | Adjusted net operating income(b) | | 668 | | | 847 | | | 884 | | | | 775 | | | | 857 | | | | 272 | | Investments | | 1,074 | | | 911 | | | 995 | | | | 847 | | | | 641 | | | | 631 | | Divestments | | 53 | | | 83 | | | 128 | | | | 1,164 | | | | 347 | | | | 47 | | | ROACE | | 9% | | | 12% | | | 13% | | | | 10% | | | | 12% | | | | 4% | |
| (a) | For the definition of operating income and net operating income, see Note 2 to the Consolidated Financial Statements. |
| (b) | Adjusted for special items and the inventory valuation effect. See Notes 2 and 4 to the Consolidated Financial Statements. |
20082011 vs. 20072010
For the full year 2011, Chemicals segment sales, (excludingexcluding intra-Group sales, to other segments) increased by 2% to 20,150 Mwere€19,477 million, an increase of 11% compared to€17,490 million for 2010, reflecting essentially the globally favorable environment in 2008the first half 2011, which has since deteriorated. In 2011, net operating income for the Chemicals segment was€904 million (for 2010,€912 million) from 19,805 Man operating income of€658 million (for 2010,€964 million), with the difference between net operating income and operating income resulting primarily from income from equity affiliates and other items of€471 million (for 2010, income of€215 million) offset by taxes on net operating income of€225 million (for 2010, a tax loss of€267 million). The decrease in 2007.2011 in net operating income compared to 2010 was due primarily to the sale of the Group’s stake in CEPSA and a portion of the Resins activities. The adjusted net operating income for the Chemicals segment in 2011 was€775 million compared to€857 million in 2010, due essentially to the impact of the sale of the Group’s interest in CEPSA and a portion of the Resins activities. The adjusted net operating income for the Base Chemicals division decreased from€393 million in 2010 to€373 million in 2011. Globally, for the full-year 2011, the Base Chemicals division benefited from ramp-ups in its activities in Qatar and South Korea, but suffered from deteriorating margins in the second half of the year in Europe and in the United States. The Specialty Chemicals division, excluding the effect of changes in the portfolio, maintained results at a level close to the 2010 level, with an adjusted net operating income in 2011 of€426 million compared to€475 million in 2010. Adjusted net operating income for the Chemicals segment decreased by 21% to 668 M€ in 2008 from 847 M€ in 2007, due to the negative market environment faced by the Chemicals segment. In the first halfexcludes any after-tax inventory valuation effect and special items. The exclusion of 2008, the Chemicals segment was challenged by the rapid increase in oil prices, while in the second half of the year, despite benefiting from a rebound in margins, it suffered from falling demand linked to the worldwide economic downturn. The adjustment for the inventory valuation effect had a negative impact on Chemicals adjusted net operating income of€10 million in 2011, compared to a
negative impact of€113 million in 2010. In 2011, the exclusion of special items had a negative impact on Chemicals adjusted net operating income of€119 million, where special items consisted essentially of gains on asset sales. In 2010, the exclusion of special items had a positive impact on Chemicals adjusted net operating income of 504 M€58 million. Investments by the Chemicals segment increased 32% to€847 million in 2011 compared to€641 million in 2010. Divestments by the Chemicals segment were€1,164 million in 2011, comprised essentially of the sale of the Group’s stake in CEPSA and certain Resins activities, compared to€347 million in 2010. ROACE for the Chemicals segment was 10% in 2011 compared to 12% in 2010, due essentially to a decrease in adjusted net operating income in 2011 compared to 2010. 2010 vs. 2009 For the full year 2010, Chemicals segment sales, excluding intra-Group sales, were€17,490 million, an increase of 19% compared to 2009. In 2010, net operating income for the Chemicals segment was€912 million (for 2009,€403 million) from an operating income of€964 million (for 2009,€553 million), with the difference between net operating income and operating income resulting primarily from income from equity affiliates and other items of€215 million (for 2009, a loss of€58 million) offset by a loss from taxes on net operating income of€267 million (for 2009, a tax loss of€92 million). The adjusted net operating income for the Chemicals segment in 2008,2010 was€857 million compared to€272 million in 2009. The adjusted net operating income for the Base Chemicals division increased by€377 million from 2009 to 2010, due to an improved environment and the ramp-up of new production units in Qatar. In 2010, the Specialties Chemicals division benefited from strong operational performance and good positioning in growth markets. Adjusted net operating income for the Chemicals segment excludes any after-tax inventory valuation effect and special items. The exclusion of the inventory valuation effect had a negative impact on Chemicals adjusted net operating income of€113 million in 2010, compared to a negative impact of 201 M€254 million in 2007.2009. In 2008,2010, the exclusion of special items (relating principally to restructuring costs, asset impairment and other elements) had a positive impact of 180 M€on Chemicals adjusted net operating income.income of€58 million. In 2007,2009, the exclusion of special items (comprised primarily of restructuring charges, asset impairments and other elements) had a positive impact of 61 M€on Chemicals adjusted net operating income. ROACE for the Chemicals segment was 9.2% in 2008 compared to 12.1% in 2007 due principally to a decrease in adjusted net operating income.
(1) | For 2006, pursuant to IFRS 5, income statement data and ROACE have been recalculated to exclude Arkema. |
In 2008, net operating income amounted to a loss of 16 M€ (for 2007, a gain of 987 M€) from an operating loss of 58 M€ (for 2007, operating income of 1,424 M€), with the difference resulting primarily from losses from equity affiliates and other items of 34 M€ (for 2007, 11 M€), and gains on taxes on net operating income of 76 M€ (for 2007, a loss of 426 M€).123 million.
Investments by the Chemicals segment increased to 1,074 M€641 million in 20082010 compared to 911 M€631 million in 2007. 2007 vs. 2006
Chemicals segment sales (excluding sales to other segments) increased by 4% to 19,805 M€ in 2007 from 19,113 M€ in 2006.
Adjusted net operating income for the Chemicals segment decreased by 4% to 847 M€ in 2007 from 884 M€ in 2006, due principally to the negative impacts of the weaker dollar (-0.11 B€) and the petrochemicals environment (-0.07 B€), essentially linked to the weak margins in the fourth quarter 2007, which were only partially offset by the positive impact of growth and productivity programs (+0.15 B€).
The adjustment for the inventory valuation effect had a negative impact of 201 M€ on adjusted net operating income for the Chemicals segment in 2007, compared to a positive impact of 28 M€ in 2006. In 2007, the exclusion of special items (comprised of restructuring charges, asset impairments and other elements) had a positive impact of 61 M€ on adjusted net operating income. In 2006, the exclusion of special items (comprised mainly of restructuring charges and asset impairments) had a positive impact of 349 M€ on adjusted net operating income.2009.
ROACE for the Chemicals segment was 12% in 20072010 compared to 13%4% in 2006. In 2007,2009 due principally to the significant increase in adjusted net operating income amounted to 987 M€ (for 2006, 507 M€) from operating income of 1,424 M€ (for 2006, 996 M€), with the difference resulting primarily from losses from equity affiliates and other items of 11 M€ (for 2006, a loss of 298 M€), as well as from taxes on net operating income of 426 M€ (for 2006, 191 M€).
Investments by the Chemicals segment decreased to 911 M€ in 2007 compared to 995 M€ in 2006.income.
Liquidity And Capital ResourcesLIQUIDITY AND CAPITAL RESOURCES
| | | | | | | | | | | | | | (M€) | | 2011 | | | 2010 | | | 2009 | | Cash flow from operating activities | | | 19,536 | | | | 18,493 | | | | 12,360 | | Including (increase) decrease in working capital | | | (1,739 | ) | | | (496 | ) | | | (3,316 | ) | Cash flow used in investing activities | | | (15,963 | ) | | | (11,957 | ) | | | (10,268 | ) | Total expenditures | | | (24,541 | ) | | | (16,273 | ) | | | (13,349 | ) | Total divestments | | | 8,578 | | | | 4,316 | | | | 3,081 | | Cash flow used in financing activities | | | (4,309 | ) | | | (3,348 | ) | | | (2,868 | ) | Net increase (decrease) in cash and cash equivalents | | | (736 | ) | | | 3,188 | | | | (776 | ) | Effect of exchange rates | | | 272 | | | | (361 | ) | | | 117 | | Cash and cash equivalents at the beginning of the period | | | 14,489 | | | | 11,662 | | | | 12,321 | | Cash and cash equivalents at the end of the period | | | 14,025 | | | | 14,489 | | | | 11,662 | |
TOTAL’s cash requirements for working capital, share buybacks, capital expenditures, acquisitions and acquisitionsdividend payments over the past three years were financed primarily by a combination of funds generated from operations, borrowings and divestments of non-core assets. In the current environment, TOTAL expects its external debt to be principally financed from the international debt capital markets. The Group continually monitors the balance between cash flow from operating activities and net expenditures. In the Company’s opinion, its working capital is sufficient for its present requirements. Capital expenditures The largest part (approximately 90%) of TOTAL’s capital expenditures arein 2011 was made up of additions to intangible assets and property, plant and equipment (approximately 73%), with the remainder attributable to equity-method affiliates and to acquisitions of subsidiaries and equity-method affiliates.subsidiaries. In the Upstream segment, as described in more detail under “Supplemental Oil and Gas Information (Unaudited) — Costs incurred”incurred in oil and gas property acquisition, exploration and development activities”, capital expenditures arein 2011 were principally development costs (approximately 80%50%, mainly for construction of new production facilities), exploration expenditures (successful or unsuccessful, approximately 8%5%) and acquisitions of proved and unproved properties (approximately 8%40%). In the Downstream segment, about 65%55% of capital expenditures arein 2011 were related to refining activities (essentially 55%70% for upgradingexisting units including maintenance and 45%major turnarounds and 30% for new construction), the balance being used inrelated to marketing/retail activities and for information systems. In the Chemicals segment, capital expenditures relaterelated to all activities in 2011 and arewere split between upgrading unitsBase Chemicals (approximately 55%60%) and new constructionSpecialties Chemicals (approximately 45%40%). For detailed information on expenditures by business segment, please refer to the discussion of CompanyTOTAL’s results for each segment above. Expenditures (cashCash flow
Cash flow from operating activities was€19,536 million in 2011 compared to€18,493 million in 2010 and€12,360 million in 2009. The€1,043 million increase in cash flow from operating activities from 2010 to 2011 was due in part to higher net income (Group share), which increased by€1,705 million over the same period. The cash flow from operating activities was also affected by the effect of changes in oil and oil product prices on the Group’s working capital requirement. As IFRS rules require TOTAL to account for inventories of petroleum products according to the FIFO method, an increase in oil and oil product prices at the end of the relevant period compared to the beginning of the same period generates, all other factors remaining equal, an increase in inventories and accounts receivable net of an increase in accounts payable, resulting in an increase in working capital requirements. Similarly, a decrease in oil and oil products prices generates a decrease in working capital requirements. In 2011, the Group’s working capital requirement increased by€1,739 million, due primarily to the increase in oil and oil products prices over the course of the year. In 2010, the increase was of€496 million. Cash flow used in investing activities)activities was€15,963 million in 2011 compared to€11,957 million in 2010 and€10,268 million in 2009. The increase from 2010 to 2011 was due essentially to the higher level of acquisitions made in 2011 as well as to the larger portfolio of upstream projects that were 13,640 Munder development in 2011. Total expenditures were€24,541 million in 2008,2011, up 16%51% from 11,722 M€16,273 million in 20072010, after decreasing 1%having increased 22% from 11,852 M€13,349 million in 2006.2009. During 2008, 73%2011, 88% of the expenditures were made by the Upstream segment 18%(as compared to 81% in 2010 and 74% in 2009), 8% by the Downstream segment (as compared to 14% in 2010 and 8% by the Chemicals segment. During 2007, 76% of the expenditures were made by the Upstream segment, 16% by the Downstream segment21% in 2009) and 8% by the Chemicals segment. During 2006, 76% of the expenditures were made by the Upstream segment, 15% by the Downstream segment, 8%3% by the Chemicals segment (as compared to 4% in 2010 and 1% by Corporate.5% in 2009). The main source of funding for these expenditures has been cash from operating activities. For additional information on expenditures, please refer to the discussions in “— Overview” and “— Results 2009-2011”. Divestments, based on selling price and net of cash sold, were€8,578 million in 2011, compared to€4,316 million in 2010 and€3,081 million in 2009. In 2011, the Group’s principal divestments were asset sales of€7,705 million, consisting mainly of the Group’s interests in CEPSA, of its Marketing assets in the United Kingdom, of its photocure and coatings resins businesses, of its interests in Total E&P Cameroun and of Sanofi shares. In 2010, the Group’s principal divestments were asset sales of€3,452 million, consisting mainly of Sanofi shares and the Group’s interests in the Valhall/Hod fields in Norway and in Block 31 in Angola. In 2009, the Group’s principal divestments were asset sales of€2,663 million, consisting mainly of Sanofi shares. Cash flow from operatingused in financing activities was 18,669 M€4,309 million in 20082011, compared to€3,348 million in 2010 and€2,868 million in 2009. The increase in cash flow used in financing activities in 2011 compared to 17,686 M€ in 2007 and 16,061 M€ in 2006. Cash flow from operating activities increased 983 M€€ from 2007 to 2008 despite a 2,591 M€€ decrease in net income (Group share) from 2007 to 2008
2010 was due primarily to sucha higher decrease being compensatedin current borrowings (€(3,870) million in 2011 compared to€(731) million in 2010), partly offset by a 2,571 Mhigher issuance of non-current financial debt (€ decrease4,069 million in the Group’s working capital requirement from 20072011 compared to 2008. Cash and cash equivalents increased to 12,321 M€ at year-end 20083,789 million in 2010) and an increase in current financial assets and liabilities (€896 million in 2011 compared to 5,988 M€ at year-end 2007(817) million in order to increase financial flexibility. Cash and cash equivalents were 2,493 M2010). €Indebtedness at year-end 2006.
TOTAL’s non-current financial debt was 16,191 M€22,557 million at year-end 20082011 compared to 14,876 M€20,783 million at year-end 20072010 and 14,174 M€19,437 million at year-end 2006.2009. For further information on the Company’s level of borrowing and the type of financial instruments, including maturity profile of debt and currency and interest rate structure, see Note 20 to the Consolidated Financial Statements. For further information on the Company’s treasury policies, including the use of instruments for hedging purposes and the currencies in which cash and cash equivalents are held, see “Item 11. Quantitative and Qualitative Disclosures About Market Risk”. Cash and cash equivalents were€14,025 million at year-end 2011 compared to€14,489 million at year-end 2010 and€11,662 million at year-end 2009. Divestments, based on selling price and net of cash sold, were 2,585 M€ in 2008 compared to 1,556 M€ in 2007 and 2,278 M€ in 2006. In 2008, the Group’s principal divestments were asset sales of 1,451 M€, consisting mainly of Sanofi-Aventis shares, and reimbursements for carried investments in Yemen, Venezuela and Nigeria. In 2007, the Group sold certain Upstream assets in Canada, the UK and Norway and Downstream assets in the UK. The Group also sold 0.4% of the share capital of Sanofi-Aventis in the fourth quarter of 2007 for 316 M€. In 2006, the Group sold certain Upstream assets in the U.S. and in France, was reimbursed for carried investments on Akpo in Nigeria and sold certain non-strategic financial interests.Shareholders’ equity
Shareholders’ equity increased to 49,950 Mwas€69,389 million at December 31, 2008, from 45,700 M2011, compared to€61,271 million at December 31, 2007,year-end 2010 and 41,148 M€53,539 million at December 31, 2006.year-end 2009. Changes in shareholders’ equity in 20082011 were primarily due to the addition of net income and translation adjustments, which waswere only partially offset by the payment of dividends, translation adjustments and share buybacks. During 2008, TOTAL repurchased 27.6 million of its own shares for 1,339 M€.dividends. Changes in shareholders’ equity in 20072010 were primarily due to the addition of net income and translation adjustments, which were only partially offset by the payment of dividends. Changes in shareholders’ equity in 2009 were primarily due to the addition of net income, which was only partially offset by the payment of dividends and translation adjustments and share buybacks. During 2007,adjustments. TOTAL repurchased 32.4 milliondid not repurchase any of its own shares for 1,787 M€. Changes to shareholders’ equity in 2006 were due primarily toduring the addition of net income, offset by the payment of the annual dividend, share buybacks, the spin-off of Arkemayears 2009, 2010 and translation adjustments. During 2006, TOTAL repurchased 75.9 million of its own shares for 3,975 M€.2011. Net-debt-to-equity As of December 31, 2008,2011, TOTAL’s net-debt-to-equity ratio, which is net debt (i.e., the sum of current borrowings, other current financial liabilities and non-current financial debt, net of current financial assets, hedging instruments on non-current financial debt and cash and cash equivalents,equivalents) divided by the sum of shareholders’ equity and minoritynon-controlling interests after expected dividends payable, was 23%, compared to 22% and 27% at year-ends 2010 and 34% at year-end 2007 and year-end 2006,2009, respectively. Over the 2006-20082009-2011 period, TOTAL used its net cash flow (cash flow from operating activities less investments plus divestments) to maintain this ratio generally in its targettargeted range of around 25% to 30%, primarily by managing net debt, (financial short-term debt plus non-current debt less cash and cash equivalents), while higher net income increased shareholders’ equity and repurchases and cancellations of sharesdividends paid throughout the period decreased shareholders’ equity. As of December 31, 2008,2011, TOTAL S.A. had $8,966$10,139 million of long-term confirmed lines of credit, of which $8,725$10,096 million were unused. In 2009,2012, based on the Group’s capital expenditures budget and after payment of dividends, the Company expects to maintain its net debt-to-equity ratio after payment of dividends in the targetedtarget range of around 25%20% to 30% in a $100 per barrel market environment. For information on the Group’s capital expenditures budget, please refer to the discussion in “— Overview”.
Guarantees and Other Off-balance Sheet Arrangements
GUARANTEES AND OTHER OFF-BALANCE SHEET ARRANGEMENTS As part of certain project financing arrangements, Total S.A. has provided in 2008 guarantees for a maximum aggregate amount of 1.3 B€ in connection with the financing of the Yemen LNG project for an amount of€1,208 million, presented under “Guarantees given against borrowings” in Note 23 to the Consolidated Financial Statements. In turn, certain partners involved in this project have given commitments that could, in the case of Total S.A.’s guarantees being called for the maximum amount, reduce the Group’s exposure by up to 0.4 B€,404 million, recorded under “Other commitments received” in the same Note. “Guarantees given against borrowings” also include the guarantees provided in 2010 by Total S.A. in connection with the financing of the Jubail project (operated by SAUDI ARAMCO TOTAL Refining and Petrochemical Company (SATORP)) of up to€2,463 million, proportional to TOTAL’s share in the project (37.5%). In addition, Total S.A. provided in 2010 a guarantee in favor of its partner in the Jubail project (Saudi Arabian Oil Company) with respect to Total Refining Saudi Arabia SAS’s obligations under the shareholders agreement with respect to SATORP. As of December 31, 2011, this guarantee is of up to€1,095 million and has been presented under “Other operating commitments” in Note 23 to the Consolidated Financial Statements. These guarantees and other information on the Company’s commitments and contingencies are presented in Note 23 to the Consolidated Financial Statements. The Group does not currently consider that these guarantees, or any other off-balance sheet arrangements of Total S.A. nor any other members of the Group, currently have or are reasonably likely to have, currently or in the future, to have a material effect on the Group’s financial condition, changes in financial condition, revenues or expenses, results of operation, liquidity, capital expenditureexpenditures or capital resources.
Contractual ObligationsCONTRACTUAL OBLIGATIONS
| | Payment due by period (M€) | | Less
than 1 year | | 1-3
years | | 3-5
years | | More
than 5 years | | Total | | Less
than
1 year | | | 1-3
years | | | 3-5
years | | | More
than
5 years | | | Total | | Non-current debt obligations(a) | | — | | 6,578 | | 6,486 | | 1,967 | | 15,031 | | | — | | | | 8,052 | | | | 5,069 | | | | 7,308 | | | | 20,429 | | Current portion of non-current debt obligations(b) | | 2,025 | | — | | — | | — | | 2,025 | | | 3,488 | | | | — | | | | — | | | | — | | | | 3,488 | | Finance lease obligations(c) | | 23 | | 72 | | 70 | | 126 | | 291 | | | 25 | | | | 70 | | | | 64 | | | | 18 | | | | 177 | | Asset retirement obligations(d) | | 154 | | 357 | | 296 | | 3,693 | | 4,500 | | | 272 | | | | 469 | | | | 335 | | | | 5,808 | | | | 6,884 | | Operating lease obligations(c) | | 429 | | 549 | | 374 | | 675 | | 2,027 | | | 762 | | | | 968 | | | | 651 | | | | 940 | | | | 3,321 | | Purchase obligations(e) | | 4,420 | | 7,027 | | 6,100 | | 42,679 | | 60,226 | | | 11,049 | | | | 11,058 | | | | 9,476 | | | | 45,770 | | | | 77,353 | | Total | | 7,051 | | 14,583 | | 13,326 | | 49,140 | | 84,100 | | | 15,596 | | | | 20,617 | | | | 15,595 | | | | 59,844 | | | | 111,652 | |
| (a) | Non-current debt obligations are included in the itemitems “Non-current financial debt” (“Hedgingand “Hedging instruments of non-current financial debt,” as presented in Note 20 to the Consolidated Financial Statements)debt” of the Consolidated Balance Sheet. The figure in this table is net of the non-current portion of issue swaps and swaps hedging bonds, and excludes non-current finance lease obligations of 268 M€.152 million. |
| (b) | The current portion of non-current debt is included in the items “Current borrowings”, “Current financial assets” and “Other current financial liabilities” of the balance sheet. The figure in this table is net of the current portion of issue swaps and swaps hedging bonds and excludes the current portion of finance lease obligations of 23 M€.25 million. |
| (c) | Finance lease obligations and operating lease obligations: the Group leases real estate, retail stations, ships, and other equipment through non-cancelable capital and operating leases. These amounts represent the future minimum lease payments on non-cancelable leases to which the Group is committed as of December 31, 2008,2011, less the financial expense due on finance lease obligations for 70 M€.31 million. |
| (d) | The discounted present value of Upstream asset retirement obligations, primarily asset removal costs at the completion date. |
| (e) | Purchase obligations are obligations under contractual agreements to purchase goods or services, including capital projects. These obligations are enforceable and legally binding on TOTAL and specify all significant terms, including the amount and the timing of the payments. These obligations mainly include: hydrocarbon unconditional purchase contracts (except where an active, highly liquid market exists and when the hydrocarbons are expected to be re-sold shortly after purchase), reservation of transport capacities in pipelines, unconditional exploration works and development works in Upstream, and contracts for capital investment projects in Downstream. This disclosure does not include contractual exploration obligations with host states where a monetary value is not attributed and purchases of booking capacities in pipelines where the Group has a participation superior to the capacity used. |
For additional information on the Group’s contractual obligations, see Note 23 to the Consolidated Financial Statements. The Group has other obligations in connection with pension plans which are described in Note 18 to the Consolidated Financial Statements. As these obligations are not contractually fixed as to timing and amount, they have not been included in this disclosure. Other non-current liabilities, detailed in Note 19 to the Consolidated Financial Statements, are liabilities related to risks that are probable and amounts that can be reasonably estimated. However, no contractual agreements exist related to the settlement of such liabilities, and the timing of the settlement is not known. Research and Development
RESEARCH AND DEVELOPMENT In 2011, Research & Development (R&D) expenses amounted to€776 million, compared to€715 million in 2010 and€650 million in 2009. The process initiated in 2004 to increase R&D budgets continued in 2011. In addition, the Group set up in 2009 a structure to contribute to the development of start-ups that specialize in innovative energy technologies. In 2011, 3,946 employees were dedicated to R&D, compared to 4,087 in 2010 and 4,016 in 2009. The reduction in 2011 can be explained, in particular, by the sale of part of the Specialty Chemicals’ Resins activity. There are foursix major axes for research and developmentR&D focuses at TOTAL: information ondeveloping knowledge, tools and understanding of energy resources, mainlytechnological mastery to discover and profitably operate complex oil and gas but alsoresources to help meet the global demand for energy;
developing and industrializing solar, biomass and next generation energies,carbon capture and storage technologies to optimize exploitation;help prepare for future energy needs; competitiveness, renewaldeveloping practical, innovative and qualitycompetitive materials that meet customers’ specific needs, contribute to the emergence of products, including adaptingnew features and systems, enable current materials to market needs,be replaced by materials showing higher performance for users, and understandingaddress the challenges of improved energy efficiency, lower environmental impact and toxicity, better management of their life cycle and their environmental impacts;waste recovery;
efficiency,developing, industrializing and improving first-level competitive processes for the conversion of oil, coal and biomass resources to adapt to changes in resources and markets, improve reliability and longevity of industrial production facilities, including theirsafety, achieve better energy efficiency; andefficiency, reduce the
| | environmental footprint and maintain the Group’s economic margins in the long term; |
understanding and measuring the impacts of the Group’s operations and products on ecosystems (water, soil, air, biodiversity) to improve environmental issues relatedsafety, in conformity with existing regulation, and reduce the Group’s environmental footprint to water, air, soilachieve sustainability in its operations; and biodiversity at industrial sites, mastering and the future of emissionsusing innovative technologies such as carbon dioxide.biotechnologies, materials sciences, nanotechnologies, high-performance computing, information and communications technologies and new analytic techniques. ResearchThe Group intends to increase R&D in all of its business units through cross-functional themes and development costs amountedtechnologies. Attention is paid to 612 M€synergies of R&D efforts between business units.
The Group has twenty-two R&D sites worldwide and has developed approximately 600 partnerships with other industrial groups and academic or highly specialized research institutes. TOTAL also has a permanently renewed network of scientific advisors worldwide that monitor and advise on matters of interest to the Group’s R&D activities. Long-term partnerships with universities and academic laboratories deemed strategic in 2008 (or 0.34%Europe, the United States, Japan and China, as well as innovative small businesses, are part of sales), comparedthe Group’s approach. Each business unit is actively developing its intellectual property policy in order to 594 M€ in 2007 (or 0.37% of sales)protect its innovations, to permit its activity to develop without constraints and 569 M€ in 2006 (or 0.37% of sales). The number of employees dedicated to research and development activities in 2008 was 4,285, compared to 4,216 in 2007 and 4,091 in 2006.facilite its partnerships. In 2011, more than 250 new patent applications were issued by the Group.
ITEM 6. DIRECTORS, SENIOR MANAGEMENT AND EMPLOYEES Directors and Senior ManagementDIRECTORS AND SENIOR MANAGEMENT
Composition of the Board of Directors Directors are appointed by the shareholders for a three-year3-year term (Article 11 of the Company’s bylaws)by-laws). In case of the resignation or death of a director between two shareholders’ meetings,Shareholders’ Meetings, the Board may temporarily appoint a replacement director. This appointment must be ratified by the next shareholders’ meeting.Shareholders’ Meeting. The terms of office of the members of the Board are staggered to more evenly space the renewal of appointments. The Board of Directors appoints the Chairman of the Board of Directors from among its members. The Board of Directors also appoints the Chief Executive Officer who may or may not be a member of the Board. As of December 31, 2008,2011, the Board of Directors has sixteen members. Of these,had fifteen members, including one director has been electedappointed by the shareholders to represent employee shareholders. Twelve of the members of the Board were independent. The following individuals were members of the Board of Directors of TOTAL S.A. in 2008(information as of December 31, 2011(1).): Christophe de Margerie Born on August 6, 1951 (French). Mr. de Margerie joined the Group after graduating from theÉcole Supérieure de Commerce in Paris in 1974. He served in several positions in the Group’s Finance Department and Exploration & Production division. In 1995, he was appointed President of Total Middle East. In May 1999, he joined the Executive Committee as President of the Exploration & Production division. He then became Senior Executive Vice President of Exploration & Production of the new TotalFinaElf group in 2000. In January 2002, he became President of the Exploration & Production division of TOTAL. He was appointed a member of the Board of Directors by the Shareholders’ Meeting held on May 12, 2006 and became Chief Executive Officer of TOTAL on February 14, 2007. On May 21, 2010, he was appointed Chairman and Chief Executive Officer of TOTAL. Director of TOTAL S.A. since 2006 — Last renewal: May 15, 2009 until 2012. Chairman of the Strategic Committee. Holds 105,556 TOTAL shares and 53,869 shares of the “TOTAL ACTIONNARIAT FRANCE” collective investment fund. Principal other directorships | • | | Member of the Supervisory Board ofVivendi* |
| • | | Manager ofCDM Patrimonial SARL |
Thierry Desmarest 63 years old.Born on December 18, 1945 (French).
A graduate of theÉcole Polytechnique and a Miningan Engineer of the FrenchCorps des Mines, Mr. Desmarest served as Director of Mines and Geology in New Caledonia, then as technical advisor onat the staffsOffices of the Minister of Industry and the Minister of Economy. He joined TOTAL in 1981, where he held various management positions, then served as President of Exploration & Production until 1995. He served as Chairman and Chief Executive Officer of TOTAL from May 1995 until February 2007, and continues to servethen as Chairman of the Board of TOTAL.TOTAL until May 21, 2010. He was appointed Honorary Chairman and remains a director of TOTAL and Chairman of the TOTAL Foundation. Director of TOTAL S.A. since 1995 and until 2010 (last— Last renewal: May 11, 2007).21, 2010 until 2013. Chairman of the Nominating & Governance Committee, member of the Compensation Committee and the Strategic Committee. Holds 385,576 shares.186,576 shares in full and 144,000 shares by usufruct. Principal other directorships Director of Sanofi-Aventis.*
Member of the Supervisory Board of Areva.*
| • | | Director of Air Liquide.Sanofi*(2) |
| • | | Director of Renault SA.Air Liquide* |
| • | | Director ofRenault S.A.* |
| • | | Director ofRenault S.A.S. |
| • | | Director ofBombardier Inc. (Canada)* |
| (1) | As of May 13, 2011, the directorships of Bertrand Jacquillat and Lord Levene of Portsoken expired. |
| (2) | Non-consolidated company which was removed from the Company’s scope of consolidation on July 1, 2010. |
| * | Company names marked with an asterisk are publicly listed companies. |
| Underlined | companies are companies excluded from the group in which the director has his or her main duties. |
Patrick Artus Born on October 14, 1951 (French). Independent director. A graduate from theÉcole Polytechnique, theÉcole Nationale de la Statistique et de l’Administration de l’Économie (ENSAE) and theInstitut d’Études Politiques de Paris, Mr. Artus began his career at the INSEE (French National Institute for Statistics and Economic Studies) where his work included economic forecasting and modeling. He then worked at the Economics Department of the OECD (1980), later becoming the Head of Research at the ENSAE from 1982 to 1985. He was scientific adviser at the research department of the Banque de France, before joining the Natixis Group as the head of the research department. He is an associate professor at the University of Paris I, Sorbonne. He is also a member of the council of economic advisors to the French Prime Minister and of theCercle des Economistes. Director of Renault SAS.TOTAL S.A. since May 15, 2009 and until 2012. Member of the Compensation Committee. Holds 1,000 shares. Principal other directorships
Patricia Barbizet 53 years old.Born on April 17, 1955 (French).
Independent director. A graduate of theÉcole Supérieure de Commerceof Paris in 1976, Mrs.Ms. Barbizet started her career in the Renault Group as the Treasurer of Renault Véhicules Industriels and Chief Financial Officer of Renault Crédit International. She joined the Pinault group in 1989 as the Chief Financial Officer. SinceIn 1992, she has been serving asbecame the Chief Executive Officer of Financière Pinault. She was the President of the Supervisory Board of the Pinault Printemps Redoute group until May 2005 and the Director and Chief Executive Officer of Artémis. Since 2005, she has been thebecame Vice-President of the PPR Board of Directors and Chairman of Christie’s.PPR in May 2005. Patricia Barbizet is also a member of the Board of Directors of TOTAL, TF1, Air France-KLM andFonds stratégique d’investissement. Director of TOTAL S.A. since 2008 — Last renewal: May 16, 200813, 2011 and until 2011.2014. Chairperson of the Audit Committee and member of the Strategic Committee. Holds 1,000 shares. Principal other directorships Vice-PresidentVice Chairman of PPR Board.*PPR* Board
Chief Executive Officer and Director of Artémis.mis Chief Executive Officer (non-Director) of Financière Pinault Director and Deputy Chief Executive Officer of Air France-KLM.*Société Nouvelle du Théâtre Marigny Permanent representative of Artémis at the Board of Directors of Agefi Permanent representative of Artémis at the Board of Directors of Sebdo le Point Member of the Management Board of Château Latour (SCI) Chief Member of the Supervisory Board of Yves Saint Laurent | • | | Administratore Delagatoandadministratore of Palazzo Grazzi |
Non-executive Director of Bouygues.*Tawa Plc* DirectorChairman of TF1.*the Board of Directors of Christie’s International Plc
Board member of Gucci Group N.V. | • | | Director ofAir France-KLM* |
| • | | DirectorFonds stratégique d’investissement (French government sovereign fund) |
| * | Company names marked with an asterisk are publicly listed companies. |
(1)Underlined | Information as of December 31, 2008.companies are companies excluded from the group in which the director has his or her main duties. |
Daniel Boeuf
60 years old.
A graduate of theÉcole Supérieure des Sciences Économiques et Commerciales (ESSEC), Mr. Boeuf joined the Group in October 1973 and served in several sales positions before holding various operational positions in Refining & Marketing entities. He is currently responsible for training and skills management in specialties within the Refining & Marketing division. An elected member of the Supervisory Board of the TOTAL
ACTIONNARIAT FRANCE collective investment fund since 1999, he served as the Chairman of its Supervisory Board from 2003 to 2006.
Director of TOTAL S.A. representing employee shareholders since 2004 and until 2010 (last renewal: May 11, 2007).
Holds 3,964 TOTAL shares and 3,842 shares of the TOTAL ACTIONNARIAT FRANCE collective investment fund.
Daniel Bouton 58 years old.Born on April 10, 1950 (French).
Independent director. Inspector General of Finance, Mr. Bouton has held various positions within the French Ministry of Economy. He served as Budget Director at the Ministry of Finance from 1988 to 1990. He joined Société Générale in 1991, where he was appointed Chief Executive Officer in 1993, then Chairman and Chief Executive Officer in November 1997. He has been serving served as the Chairman of the Société Générale group until May 12, 2008 and has been the Honorary Chairman since May 12, 2008.6, 2009. Director of TOTAL S.A. since 1997 and until 2009 (last— Last renewal: May 12, 2006).15, 2009 until 2012. Holds 3,200 shares. Principal other directorships Chairman of Société Générale.
| • | | Director ofVeolia Environnement* |
Director of Veolia Environnement.*
Gunnar Brock Born on April 12, 1950 (Swedish). Independent director. Graduated from the Stockholm School of Economics with an MBA grade in Economics and Business Administration, Mr. Brock held various international positions at Tetra Pak. He served as Chief Executive Officer of Alfa Laval from 1992 to 1994 and as Chief Executive Officer of Tetra Pak from 1994 to 2000. After serving as Chief Executive Officer of Thule International, he was appointed Chief Executive Officer of Atlas Copco AB from 2002 to 2009. He is currently Chairman of the Board of Stora Enso Oy. Mr. Brock is also a member of the Royal Swedish Academy of Engineering Sciences and of the Board of Directors of the Stockholm School of Economics. Director of TOTAL S.A. since May 21, 2010 and until 2013. Member of the Strategic Committee. Holds 1,000 shares. Principal other directorships Chairman of the Board of Stora Enso Oy | • | | Chairman of the Board ofMölnlycke Health Care Group |
| • | | Member of the Board ofInvestor AB |
| • | | Chairman of the Board ofRolling Optics |
| • | | Member of theBoard of Stena AB* |
Claude Clément Born on November 17, 1956 (French). Mr. Clément joined the Group in February 1977 and started his career at Compagnie Française de Raffinage, which offered him professional training. He held various positions at the Refining Manufacturing Department in French and African refineries (Gabon, Cameroon). He is currently Manager of the Refining Manufacturing Methods at the Refining Manufacturing Division. Mr. Clément has been an elected member of the Supervisory Board of the “TOTAL ACTIONNARIAT FRANCE” collective investment fund since 2009, an elected member of the Supervisor Board of the “TOTAL ACTIONS EUROPÉENNES”, “TOTAL DIVERSIFIE A DOMINANTE ACTIONS” and “TOTAL ÉPARGNE SOLIDAIRE” collective investment funds since 2010 and an elected member of the Supervisor Board of the “TOTAL DIVERSIFIÉ A DOMINANTE OBLIGATIONS”, “TOTAL MONETAIRE” and “TOTAL OBLIGATIONS” collective investment funds since 2010. Director of TOTAL S.A. since May 21, 2010 and until 2013. Holds 820 TOTAL shares and 3,442 shares of the “TOTAL ACTIONNARIAT FRANCE” collective investment fund. | * | Company names marked with an asterisk are publicly listed companies. |
| Underlined | companies are companies excluded from the group in which the director has his or her main duties. |
Marie-Christine Coisne-Roquette Born on November 4, 1956 (French). Independent director. A graduate of the University of Paris X Nanterre (law and English) and admitted to the Paris and New York Bar Associations in 1980, Ms. Coisne-Roquette worked as an attorney in Paris and New York until 1988, when she joined the family-owned Sonepar group. From 1988 to 1998, while also serving as Chief Executive Officer of the family-owned Colam Entreprendre holding company, she held several consecutive operational directorships at Sonepar S.A., where she was appointed Chairman of the Board in 1998. She has served as Chairman and Chief Executive Officer of Sonepar since 2002. A member of the Executive Board of MEDEF since 2000, Ms. Coisne-Roquette has chaired that organization’s Tax Commission since 2005. Director of TOTAL S.A. since May 13, 2011 and until 2014. Member of the Audit Committee since May 13, 2011. Holds 1,130 shares. Principal other directorships Chairperson and Chief Executive Officer of Sonepar S.A. Chairman and Chief Executive Officer of Colam Entreprendre Director of Hagemeyer Canada, Inc. President of the Supervisory Board of OTRA N.V. Director of Sonepar Canada, Inc. President of the Supervisory Board of Sonepar Deutschland GmbH Director of de Sonepar Ibérica Director of de Sonepar Italia Holding Chairperson of the Board of Directors of Sonepar Mexico Member of the Supervisory Board of Sonepar Nederland B.V. Director of Sonepar USA Holdings, Inc. Director of Feljas and Masson SAS Permanent representative of Colam Entreprendre, member of the Board of Directors at Cabus & Raulot (S.A.S.) | • | | Permanent representative of Colam Entreprendre and Sonepar, co-administrators of Sonedis (société civile) |
Permanent representative of Sonepar, Director of Sonepar France Permanent representative of Sonepar, President of Sonepar International (S.A.S.) Permanent representative of Colam Entreprendre, Director of Sovemarco Europe (S.A.) | • | | Co-manager ofDéveloppement Mobilier & Industriel(D.M.I.) (société civile) |
| • | | Manager ofKer Coro (société civile immobilière) |
Bertrand Collomb 66 years old.Born on August 14, 1942 (French).
Independent director. A graduate of theÉcole Polytechnique and a Mining Engineer,member of France’s engineeringCorps des Mines, Mr. Collomb held a number of positions within the Ministry of Industry and other staffcabinet positions from 1966 to 1975. He joined the Lafarge group in 1975, where he served in various management positions. He served as Chairman and Chief Executive Officer of Lafarge from 1989 to 2003, then as Chairman of the Lafarge Board of Directors from 2003 to 2007, and has been the honorary PresidentHonorary Chairman since 2007. He is also PresidentChairman of theInstitut des Hautes EtudesÉtudes pour la Science et la Technologie (IHEST) and a Board member of theInstitut Français des Relations InternationalesEuropéen de la Technologie (IFRI). Director of TOTAL S.A. since 2000 and until 2009 (last— Last renewal: May 12, 2006).15, 2009 until 2012. Member of the Compensation Committee and the Nominating & Governance Committee. Holds 4,712 shares. Principal other directorships Director of Lafarge.*Lafarge* Director of DuPont* (United States).
| • | | Director ofDuPont* (United States) |
| • | | Director ofAtco* (Canada) |
Director of Atco* (Canada).
| * | Company names marked with an asterisk are publicly listed companies. |
| Underlined | companies are companies excluded from the group in which the director has his or her main duties. |
Paul Desmarais Jr.(1) 54 years old.Born on July 3, 1954 (Canadian).
Independent director. A graduate of McGill University in Montreal and INSEAD in Fontainebleau, Mr. Desmarais was elected Vice Chairman (1984) then Chairman of the Board (1990) of Corporation Financière Power, a company he helped to found. Since 1996, he has served as Chairman of the Board and Co-Chief Executive Officer of Power Corporation of Canada. Director of TOTAL S.A. since 2002 and until 2011 (last— Last renewal: May 16, 2008).13, 2011 until 2014. Holds 2,000 ADRs (corresponding to 2,000 shares). Principal other directorships Chairman of the Board, and Co-Chief Executive Officer and Member of the Executive Committee of Power Corporation of Canada.*Canada* ChairmanCo-Chairman of the Board and member of the Executive Committee and Member of the Board of Corporation Financière Power* (Canada).
Vice-ChairmanVice Chairman and Acting Managing Director of Pargesa Holding S.A.* (Switzerland).
MemberDirector and member of the BoardExecutive Committee of DirectorsLa Great-West Compagnie d’assurance-vie (Canada)
Director and member of the Executive Committee of First Great-West Life & Annuity Insurance Company (United States) Director and member of the Executive Committee of Great-West Lifeco Inc.* (Canada). MemberDirector of Great West Financial (Canada) Inc. (Canada)
Director and member of the Board of Directors and ExecutivePermanent Committee of Groupe Bruxelles Lambert S.A.* (Belgium). Director and member of the Executive Committee of Groupe Investors Inc. (Canada) Director and member of the Executive Committee of Groupe d’assurance London Inc. (Canada) Director and member of the Executive Committee of London Life, compagnie d’assurance-vie (Canada) Director and member of the Executive Committee of Mackenzie Inc. Director and Deputy Chairman of the Board of La Presse Ltée (Canada) Director and Deputy Chairman of Gesca Ltée (Canada) Director and member of the Executive Committee of Compagnie d’Assurance du Canada sur la Vie (Canada) Director and member of the Executive Committee of the Corporation Financière Canada Life (Canada) Director and member of the Executive Committee of IGM Inc.* (Canada) Director and Chairman of the Board of 171263 Canada Inc. (Canada) Director of GDF Suez* (France).152245 Canada Inc. (Canada) Director of Lafarge.*GWL&A Financial Inc. (United States) Director of IGMGreat West Financial Inc.*(Nova Scotia) Co. (Canada). Director of First Great-West Life & Annuity Insurance Company (United States) Director of Power Corporation International.
Bertrand Jacquillat
64 years old.
A graduate ofÉcole des Hautes Études Commerciales (HEC),Institut d’études politiques de Paris and Harvard Business School, Mr. Jacquillat holds a PhD in management. He has been a university professor (in both France and the United States) since 1969, and is a professor at theInstitut d’Études Politiques in Paris as well as Vice-President of theCercle des Economistes.
Communications Inc. Director and Vice Chairman of TOTAL S.A. since 1996the Board of Power Corporation International Director and until 2011 (last renewal: May 16, 2008). Holds 3,600 shares.
Principal other directorships
Chairman and Chiefmember of the Executive OfficerCommittee of Associés en Finance.Putnam Investments LLC
Member of the Supervisory Board of Klépierre.*Power Financial Europe B.V. Director of Canada Life Capital Corporation Inc. (Canada) Director and member of the Executive Committee of The Canada Life Assurance Company of Canada (Canada) Director and member of the Executive Committee of Crown Life Insurance Company (Canada) Director and Deputy Chairman of the Board of Square Victoria Communications Group Inc. Member of the Supervisory Board of Presses Universitaires de France (PUF).Parjointco N.V.
Antoine Jeancourt-Galignani
71 years old.
Inspector of Finance, Mr. Jeancourt-Galignani held various positions within the Ministry of Finance before serving as Deputy Managing Director of Crédit Agricole from 1973 to 1979. He became Chief Executive Officer of Indosuez bank in 1979 before serving as its Chairman from 1988 to 1994. He then served as Chairman of Assurances Générales de France (AGF) from 1994 to 2001, before serving as Chairman of Gecina from 2001 to 2005, where he currently serves as a director.
Director of TOTAL S.A. since 1994 and until 2009 (last renewal: May 12, 2006).
Holds 5,440 shares.
Principal other directorships
Chairman of the Supervisory Board of Euro Disney SCA.*
Director of Kaufman & Broad S.A.*
Director of Société Générale.*
Member of the Supervisory Board of Oddo et Cie.
* | Company names marked with an asterisk are publicly listed companies. |
| (1) | Mr. Desmarais Jr. is a director of Groupe Bruxelles Lambert, which acting in concert with Compagnie Nationale à Portefeuille, to the Company’s knowledge, owns 5.4%5.5% of the Company’s shares and 5.4%5.5% of the voting rights. Mr. Demarais Jr. disclaims beneficial ownership of such shares. |
| * | Company names marked with an asterisk are publicly listed companies. |
| Underlined | companies are companies excluded from the group in which the director has his or her main duties. |
Anne Lauvergeon(1)Barbara Kux
49 years old.Born on February 26, 1954 (Swiss).
Independent director. Holder of an MBA (with honors) from INSEAD in Fontainebleau, Ms. Kux joined McKinsey & Company in 1984 as a Management Consultant, where she was responsible for strategic assignments for international groups. After serving as manager for development of emerging markets at ABB and then at Nestlé between 1989 and 1999, she was appointed Executive Director of Ford in Europe from 1999 to 2003. In 2003, Ms. Kux became a member of the Management Committee of the Philips group and, starting in 2005, was in charge of sustainable development. Since 2008, she has been a member of the Management Board of Siemens AG. She is also responsible for sustainable development at the Group and is in charge of the Group’s supply chain. Director of TOTAL S.A. since May 13, 2011 and until 2014. Member of the Strategic Committee. Holds 1,000 shares. Principal other directorships Member of the Management Board of Siemens AG* Anne Lauvergeon Born on August 2, 1959 (French). Independent director. Chief Mining Engineer and a graduate of theÉcole Normale Supérieure with a doctorate in physical sciences, Mrs.Ms. Lauvergeon held various positions in industry before becoming Deputy Chief of Staff in the Office of the President of the Republic in 1990. She joined Lazard Frères et Cie as Managing Partner in 1995. From 1997 to 1999, she was Executive Vice President and member of the Executive Committee of Alcatel, in charge of industrial partnerships.partnerships and international affairs. Ms. Lauvergeon Mrs. Lauvergeon has served as Chairman of the Management Board of AREVA sinceAreva from July 2001 to June 2011 and
Chairman and Chief Executive Officer of Areva NC (formerly Cogema) sincefrom June 1999.1999 to June 2011. Director of TOTAL S.A. since 2000 and until 2009 (last— Last renewal: May 12, 2006).15, 2009 until 2012. Member of the Strategic Committee. Holds 2,000 shares. Principal other directorships Chairperson of the Management Board of Areva.
| • | | Director ofVodafone Group Plc* |
Chairperson and CEO of Areva NC.
Director of Vodafone Group Plc.*
Vice-President and Member of the Supervisory Board of Safran.*
Lord Peter Levene of PortsokenClaude Mandil
67 years old.
Lord Levene served in various positions within the Ministry of Defense, the office of the Secretary of State for the Environment, the office of the Prime Minister and the Ministry of Trade in the UK from 1984 to 1995. He then served as senior adviser at Morgan Stanley from 1996 to 1998 before becoming the Chairman of Bankers Trust International from 1998 to 2002. He was Lord Mayor of London from 1998 to 1999. He is currently Chairman of Lloyd’s.
Director of TOTAL S.A. since 2005 and until 2011 (last renewal: May 16, 2008)Born on January 9, 1942 (French).
Holds 2,000 shares.
Principal other directorships
Chairman of International Financial Services.
Chairman of General Dynamics UK Ltd.
Director of Haymarket Group Ltd.
Director of China Construction Bank.*
Claude Mandil
66 years old.Independent director.
A graduate of theÉcole Polytechnique and a General Mining Engineer from France’s engineering school Corps des Mines, Mr. Mandil served as a Mining Engineer in the Lorraine and Bretagne provinces.regions. He then served as a Project Manager at theDélégation de l’Aménagement du Territoire et de l’Action Régionale (City and Department planning/DATAR) and as the Interdepartmental Head of Industry and Research and regional delegate of ANVAR. From 1981 to 1982, he served as the technical advisor on the staff of the Prime Minister, in charge of the industry, energy and research sectors. He was then appointed Chief Executive Officer, then Chairman and Chief Executive Officer of theInstitutde Développement Industriel (Industry Development Institute)Institute — IDI) until 1988. He was Chief Executive Officer of theBureau de Recherches ofBureau de Recherches Géologiques et Minières (BRGM) from 1988 to 1990. From 1990 to 1998, Mr. Mandil was Chief Executive Officer for Energy and Commodities at the French Industry Ministry and the first representative for France atto the Management Board of the International Energy International Agency (EIA) Executive Committee.(IEA). He served as the Chairman of the EIA inIEA from 1997 andto 1998. In 1998, he was appointed Deputy Chief Executive Officer of Gaz de France and, in April 2000, Chairman of theInstitut Français du Pétrole (French(French Institute offor Oil). From 2003 to 2007, he was the Executive Director of the EIA.
Director of TOTAL S.A. since 2008 — Last renewal: May 16, 200813, 2011 and until 2011.2014. Member of the Strategic Committee. Holds 1,000 shares. Principal other directorships | • | | Director ofInstitut Veolia Environnement |
| • | | Director ofSchlumberger SBC Institute |
Director of Institut Veolia Environnement.
| * | Company names marked with an asterisk are publicly listed companies. |
(1)Underlined | Ms. Lauvergeon is Chairperson ofcompanies are companies excluded from the Management Board of Areva,group in which to the Company’s knowledge, owns 0.3% of the Company’s shares and 0.6% of the voting rights. Ms. Lauvergeon disclaims beneficial ownership of such shares.director has his or her main duties. |
Christophe de Margerie
57 years old.
Mr. de Margerie joined the Group after graduating from theÉcole Supérieure de Commerce in Paris in 1974. He served in several positions in the Group’s Finance Department and Exploration & Production division. He became president of Total Middle East in 1995 before joining the Group’s executive committee as the President of the Exploration & Production division in May 1999. He then became Senior Executive Vice-President of Exploration & Production of the new
TotalFinaElf group in 2000. In January 2002 he became President of the Exploration & Production division of TOTAL. He was appointed a member of the Board of Directors by the shareholders’ meeting held on May 12, 2006 and became Chief Executive Officer of TOTAL on February 14, 2007.
Director of TOTAL S.A. since May 12, 2006 and until 2009.
Holds 85,230 TOTAL shares and 39,330 shares of the TOTAL ACTIONNARIAT FRANCE collective investment fund.
Michel Pébereau(1) 66 years old.Born on January 23, 1942 (French).
Independent director. Honorary Inspector General of Finance, Mr. Pébereau held various positions in the Ministry of Economy and Finance, before serving, from 1982 to 1993, as Chief Executive Officer and then as Chairman and CEOChief Executive Officer of Crédit Commercial de France (CCF). He was Chairman and Chief Executive Officer of BNP then BNP Paribas from 1993 to 2003, and is currently Chairman of the Board of Directors from 2003 to December 1, 2011, and is currently Honorary Chairman of BNP Paribas. Director of TOTAL S.A. since 2000 and until 2009 (last— Last renewal: May 12, 2006).15, 2009 until 2012. Chairman of the Compensation Committee and member of the Nominating & Governance Committee. Holds 2,356 shares. Principal other directorships ChairmanDirector of BNP Paribas.*Paribas*
| • | | Director ofSaint-Gobain* |
| • | | Director ofPargesa Holding S.A.* (Switzerland) |
Director of Saint-Gobain.*
Director of Pargesa Holding S.A.* (Switzerland).
Member of the Supervisory Board of AXA.*BNP Paribas Suisse
Member of the Supervisory Board of Banque marocaine pour le Commerce et l’Industrie.*l’Industrie* | • | | Non-voting member (Censeur) of the Supervisory Board of Galeries Lafayette.Lafayette |
Thierry de Rudder(2) 59 years old.Born on September 3, 1949 (Belgian and French).
Independent director. A graduate of theUniversité de Genève in mathematics, theUniversité Libre de Bruxelles and Wharton (MBA), Mr. de Rudder served in various positions at Citibank from 1975 to 1986 before joining Groupe Bruxelles Lambert, where he was appointed Acting Managing Director. Director of TOTAL S.A. since 1999 and until 2010 (last— Last renewal: May 11, 2007).21, 2010 until 2013. Member of the Audit Committee and the Strategic Committee. Principal other directorships Acting Managing Director of Groupe Bruxelles Lambert.*Lambert* Director of Compagnie Nationale à Portefeuille.*Brussels Securities (Belgium) Director of GDF Suez.*GBL Treasury Center (Belgium) Director of Suez-Tractebel.Sagerpar (Belgium) Director of Imerys.*GBL Energy Sàrl (Luxembourg) Director of Lafarge.*GBL Verwaltung Sàrl (Luxembourg) Director of GBL Verwaltung GmbH (Germany) Director of Ergon Capital Partners (Belgium) Director of Ergon Capital Partners II (Belgium) Director of Ergon Capital Partners III (Belgium) At the meeting held on January 12, 2012, the Board of Directors took note of the resignation of Mr. Thierry de Rudder from his position as a director as of the end of the Board meeting, and consequently decided to co-opt Mr. Gérard Lamarche to replace Mr. de Rudder for the remaining term of his predecessor’s directorship until the Shareholders’ Meeting to be held in 2013 to approve the 2012 accounts. The nomination of Mr. Lamarche is subject to the ratification of the Shareholders’ general meeting on May 11, 2012. * | Company names marked with an asterisk are publicly listed companies. |
| (1) | Mr. Pébereau is Honorary Chairman of BNP Paribas, which, to the Company’s knowledge, owns 0.2% of the Company’s shares and 0.2% of the voting rights. Mr. Pébereau is also a director of Pargesa Holding SA, part of Group Bruxelles Lambert, which acting in concert with Compagnie Nationale à Portefeuille, to the Company’s knowledge, owns 5.4%5.5% of the Company’s shares and 5.4%5.5% of the voting rights. Mr. Pébereau disclaims beneficial ownership of such shares. |
| (2) | Mr. de Rudder is acting managing directorwas Acting Managing Director of Groupe Bruxelles Lambert which, acting in concert with Compagnie Nationale à Portefeuille and to the Company’s knowledge, owns 5.4%5.5% of the Company’s shares and 5.4%5.5% of the voting rights. Mr. de Rudder disclaims beneficial ownership of such shares. Since January 2012, Mr. Gérard Lamarche is Acting Managing Director of Groupe Bruxelles Lambert. |
| * | Company names marked with an asterisk are publicly listed companies. |
| Underlined | companies are companies excluded from the group in which the director has his or her main duties. |
Serge TchurukGérard Lamarche
71 years old.Born July 15, 1961 (Belgian).
A graduateIndependent director.
Mr. Lamarche graduated in economic science from Louvain-La-Neuve university and the INSEAD business school (Advanced Management Program for Suez Group Executives). He also followed the Global Leadership Series course of training at the Wharton International Forum in 1998-99. He started his career in 1983 with Deloitte Haskins & Sells in Belgium, before becoming a consultant in mergers and acquisitions in Holland in 1987. In 1988, Mr. Lamarche joined Société Générale de Belgique as an investment manager and management controller between 1989 and 1991, then as a consultant in strategic operations from 1992 to 1995. He joined Compagnie Financière de Suez as a project manager for the Chairman and Secretary of theÉcole Polytechnique Executive Committee (1995-1997), before taking part in the merger between Compagnie de Suez and anIngénieur de l’armementLyonnaise des Eaux, which became Suez Lyonnaise des Eaux (1997), and then being appointed as the acting Managing Director in charge of Planning, Management Control and Accounts. In 2000, Mr. Tchuruk held various management positions with Mobil Corporation, then with Rhône-Poulenc, whereLamarche pursued his career in industry by joining NALCO (the American subsidiary of the Suez group and the world leader in the treatment of industrial water) as the Director and Chief Executive Officer. In March 2004, he was namedappointed Chief Executive Officer in 1983. He served as Chairmancharge of Finance of the Suez group, before being appointed Senior Executive and CEOVice President in charge of CDF-Chimie/Orkem from 1986 to 1990, then as ChairmanFinance and CEOmember of TOTAL from 1990 to 1995. In 1995, hethe Management Committee and the Executive Committee of the GDF Suez group in July 2008. On April 12, 2011, Mr. Lamarche became Chairman and Chief Executive Officer of Alcatel. In 2006, he was appointed Chairman ofa Director on the Board of Alcatel-Lucent.Directors of Groupe Bruxelles Lambert (GBL). He has been the acting Managing Director since January 2012. Mr. Lamarche is also a Director of Legrand.
Director of TOTAL S.A. since 19892012 — Nomination by cooptation: January 12, 2012 until 2013. Member of the Audit Committee and until 2010 (last renewal: May 11, 2007).the Strategic Committee. Holds 61,0601,575 shares. Principal other directorships Acting Managing Director and Director of Thalès.*Groupe Bruxelles Lambert* | • | | Director and member of the Audit Committee ofLegrand* |
Pierre VaillaudOther information
73 years old.
A graduateThe Board noted the absence of potential conflicts between theÉcole Polytechnique, a Mining Engineer Directors’ duties in the best interests of the Company and a graduatethe private interests of its directors. To theÉcole Nationale Supérieure du Pétrole et des Moteurs, Mr. Vaillaud worked as an engineer with Technip and Atochem before joining TOTAL. He served as Chief Executive Officer Company’s knowledge, the members of TOTAL from 1989 to 1992, before becoming Chairman and Chief Executive Officer of Technip from 1992 to 1999, and of Elf Aquitaine from 1999 to 2000.
Directorthe Board of TOTAL S.A. since 2000are not related by close family ties; there are no arrangements or agreements with clients or suppliers that facilitated their appointment; there is no service agreement binding a director of TOTAL S.A. to one of its subsidiary and until 2009 (last renewal: May 12, 2006).
Holds 2,000 shares.
Principal other directorships
Memberproviding for special benefits upon termination of the Supervisory Board of Oddo et Cie.
Directors are elected for a three-year term of office, pursuant to Article 11 of the Company’s bylaws.
Other informationsuch agreement.
The current members of the Board of Directors of the Company have informed the Company that they have not been convicted, have not been associated with a bankruptcy, receivership or liquidation, and have not been incriminated or publicly sanctioned or disqualified, as stipulated in item 14.1 of Annex I of (EC)EC Regulation 809/2004 of April 29, 2004. At its meeting held on February 9, 2012, the Board of Directors decided to propose the renewal of the directorships of Ms. Lauvergeon and Messrs. de Margerie, Artus, Collomb, and Pébereau, which are due to expire. At the general Shareholders’ meeting on May 11, 2012, the Board will also propose the nomination of a new independent director, Ms. Anne-Marie Idrac, who will place her expertise of the world of industry at the Board’s disposal and will broaden the representativeness and the diversity of the Board. If the resolution is approved by the Shareholders’ Meeting, the proportion of women sitting in the Board will be one-third. Representative of the Worker’s Council: pursuant to Article L. 2323- 62 of the French Labor Code, members of the Worker’s Council attend, with consultative rights, all meetings of the Board. In compliance with the second paragraph of such article, since July 7, 2010, four members of the Worker’s Council attend Board meetings. At its meeting on September 15, 2009, the Board of Directors appointed Mr. Charles Paris de Bollardière Secretary of the Board. Director independence At its meeting on February 9, 2012, the Board of Directors, on the recommendation of the Nominating & Governance Committee, reviewed the independence of the Company’s | * | Company names marked with an asterisk are publicly listed companies. |
| Underlined | companies are companies excluded from the group in which the director has his or her main duties. |
directors as of December 31, 2011. At the Committee’s suggestion, the Board considered that, pursuant to the AFEP-MEDEF Code, a director is independent when “he or she has no relationship of any kind with the Company, its Group or its Management, that may compromise the exercise of his or her freedom of judgment”. For each director, this assessment relies on the independence criteria set forth in the AFEP-MEDEF Code as reminded hereafter: not to be an employee or a director of the Company, or a Group company, and not having been in such a position for the previous five years; not to be a director of a company in which the Company holds a directorship or in which an employee appointed as such or an executive director of the company is a director; not to be a material customer, supplier, investment banker or commercial banker of the Company or Group and for which the Company or the Group is not a material part of their business; not to be related by close family ties to a corporate executive officer; not to have been an auditor of the Company within the previous five years; not to have been a director of the Company for more than twelve years (upon expiry term of office during which the 12-year limit is reached). The AFEP-MEDEF Code expressly stipulates that the Board can decide that the implementation of certain defined criteria is not relevant or induces an interpretation that is particular to the Company. With regard to the criterion applying to twelve years of service, the AFEP-MEDEF code states that “the status of independent director due to the application of this criterion shall only be relinquished at the end of the directorship during which the 12-year period is exceeded”. Pursuant to the report of the Nominating & Governance Committee, on February 9, 2012, the Board observed that Mr. Bouton and Mr. de Rudder had exceeded twelve years of service on December 31, 2011. Since the directorships of Messrs. Bouton and de Rudder had been renewed before the twelve-year period expired, the Board decided that they can still be considered as independent directors, according to the AFEP-MEDEF code. Concerning “material” relationships, as a client, supplier, investment or finance banker, between a director and the Company, the Board deemed that the level of activity between Group companies and the bank at which one of its Directors is an officer, which is less than 0.1% of its net banking income and less than 5% of the Group’s overall assets, represents neither a material portion of the overall activity of such bank nor a material portion of the Group’s external financing. The Board concluded that Mr. Pébereau should be considered as independent. Similarly, the Board of Directors deemed that the level of activity between Group companies and one of its suppliers, Stena AB, of which Mr. Brock is a director, which is less than 2.68% of Stena AB’s turnover, represents neither a material portion of the supplier’s overall activity nor a material portion of the Group’s purchasing. The Board concluded that Mr. Brock could be considered as an independent director. Mmes. Barbizet, Coisne-Roquette, Kux and Lauvergeon and Messrs. Artus, Bouton, Brock, Collomb, Desmarais, Mandil, Pébereau and de Rudder were deemed to be independent directors. 80% of the directors were independent on December 31, 2011. Moreover, the Board noted that the directorships of Ms. Lauvergeon and Messrs. Collomb and Pébereau will exceed twelve years on March 22, 2012 for Messrs. Collomb and Pébereau, and on May 25, 2012 for Ms. Lauvergeron, after the Shareholders’ meeting that will be invited to renew her directorship on May 11, 2012. The Board of Directors deemed that, for a company with a long-term activity and investment cycles of more than ten years, extended directorships and the corresponding experience represent an asset for the Group and a means of consolidating the independence of judgment of its Directors. The Board concluded that the proposal to renew the directorships of Ms. Lauvergeon and Messrs. Collomb and Pébereau at the Shareholders meeting in May 11, 2012, does not call their independence into question, according to the AFEP-MEDEF code, in view of their independence of judgment. In addition, the Board of Directors has examined the situations of the directors whose nomination or ratification will be submitted to the Shareholders’ meeting on May 11, 2012. Ms. Idrac and Mr. Lamarche are deemed to be independent directors. General Management At its meetingManagement form
Based on February 13, 2007,the recommendation by the Nominating & Governance Committee, the Board of Directors baseddecided at its meeting on the recommendation of the then existing Nominating & Compensation Committee(1), resolvedMay 21, 2010 to have separate individuals serve inreunify the positions of Chairman of the Board and Chief Executive Officer and appoint the Chief Executive Officer to the position of Chairman of the Board until its term of office expires, that is until the Shareholders’ Meeting called to approve the financial statements for the fiscal year 2011. As a result, Mr. de Margerie has been appointed Chairman and Chief Executive Officer of TOTAL S.A. since May 21, 2010. The Board of Directors deemed that the Company to ensure continuity during changesunified management form was the most appropriate to the Group’s management.business and specificities of the oil and gas sector. This decision was made taking into account the advantage of the unified management and the composition of the Committees of the Board that comprise a significant portion of independent directors, which ensures balanced authority. The management form selected shall remain in effect until a decision to the contrary is made by the Board of Directors. The Executive Committee The Executive Committee, (COMEX)under the responsibility of the Chairman and Chief Executive Officer, is the primary decision-making body of the Group. It implements the strategy formulated by the Board of Directors and authorizes related investments, subject to the approval by the Board of Directors for investments exceeding 3% of the Group’s equity. The Management Committee (CODIR)equity or the notification of the Group facilitates coordination among the divisions and monitors the operating results and activity reportsBoard for investments exceeding 1% of these divisions.equity.
The Executive Committee
The following individuals were serving as members of the Executive Committee asAs of December 31, 2008:2011, the members of TOTAL’s Executive Committee were as follows:
Christophe de Margerie, Chairman of the COMEX (ChiefExecutive Committee (Chairman and Chief Executive Officer).; François Cornélis, Vice-ChairmanVice Chairman of the COMEXExecutive Committee (President of the Chemicals division).; Michel Bénézit (President of the Refining & Marketing division).; Yves-Louis Darricarrère (President of the Exploration & Production division).; Jean-Jacques Guilbaud (General Secretary).(Chief Administrative Officer); and Patrick de La Chevardière (Chief Financial Officer).
In the context of the reorganization of its Downstream and Chemicals segments, TOTAL’s Executive Committee was changed on January 1, 2012. As of that date, the members of TOTAL’s Executive Committee are: * | Company names marked with an asterisk are publicly listed companies. |
(1)
| In February 2007, the then existing Nominating & Compensation Committee was separated into the existing Nominating & Governance Committee and the Compensation Committee (see “Item 6. Corporate Governance”).
|
Christophe de Margerie, Chairman of the Executive Committee (Chairman and Chief Executive Officer); Philippe Boisseau (President of the Supply & Marketing segment); Yves-Louis Darricarrère (President of the Exploration & Production division and Gas & Power division); Jean-Jacques Guilbaud (Chief Administrative Officer); Patrick de La Chevardière (Chief Financial Officer); and Patrick Pouyanné (President of the Refining & Chemicals segment). The Management Committee The Management Committee facilitates coordination among the different entities of the Group and monitors the operating results of the operational divisions and the activity reports of the functional divisions. In addition to the members of the COMEX,Executive Committee, the following twenty-onetwenty-two individuals from various operating divisions and non-operating departments and operating divisions were servingserved as members of the Management Committee as of December 31, 2008(1): Holding2011:
René Chappaz, Vice-President, Executive Career Management.
Yves-Marie Dalibard, Vice-President, Corporate Communications.
Jean-Michel Gires, Executive Vice-President, Sustainable Development and the Environment.
Peter Herbel, General Counsel.
Jean-Marc Jaubert, Senior Vice-President, Industrial Safety.
Jean-François Minster, Senior Vice-President, Scientific Development.
Jean-Jacques Mosconi, Vice-President, Strategic Planning.
François Viaud, Senior Vice-President, Human Resources.
Upstream
Philippe Boisseau, President, Gas & Power.
Jacques Marraud des Grottes, Senior Vice-President, Africa, Exploration & Production.
Jean-Marie Masset, Senior Vice-President, Geosciences, Exploration & Production.
Charles Mattenet, Senior Vice-President, Asia and the Far East, Exploration & Production.
Patrick Pouyanné, Senior Vice-President, Strategy, Business Development and R&D, Exploration & Production.
Downstream
Pierre Barbé, Senior Vice-President, Trading & Shipping.
Alain Champeaux, Senior Vice-President, Overseas.
Alain Grémillet, General Secretrary, Refining & Marketing.
Eric de Menten, Senior Vice-President, Marketing Europe, Refining & Marketing.
André Tricoire, Senior Vice-President, Refining, Refining & Marketing.
Chemicals
Pierre-Christian Clout, Chairman and Chief Executive Officer of Hutchinson, Mapa-Spontex.
Françoise Leroy, General Secretary, Chemicals.
| • | | Corporate: René Chappaz, Peter Herbel, Jean-Marc Jaubert, Manoelle Lepoutre, Jean-François Minster, Jean-Jacques Mosconi, Jacques-Emmanuel Saulnier, François Viaud; |
| • | | Upstream: Marc Blaizot, Philippe Boisseau, Arnaud Breuillac, Michel Hourcard, Jacques Marraud des Grottes; |
| • | | Downstream: Pierre Barbé, Alain Champeaux, Bertrand Deroubaix, Eric de Menten, André Tricoire; and |
| • | | Chemicals: Françoise Leroy, Jacques Maigné, Bernard Pinatel, Patrick Pouyanné. |
In addition Charles Paris de Bollardière servesto the members of the Executive Committee, the following twenty-five individuals from various operating divisions and non-operating departments served as members of the Management Committee as of January 16, 2012: | • | | Corporate: René Chappaz, Peter Herbel, Jean-Marc Jaubert, Helle Kristoffersen, Manoelle Lepoutre, Françoise Leroy, Jean-François Minster, Jacques-Emmanuel Saulnier, François Viaud; |
| • | | Upstream: Marc Blaizot, Arnaud Breuillac, Olivier Cleret de Langavant, Isabelle Gaildraud, Michel Hourcard, Jacques Marraud des Grottes; |
| • | | Refining & Chemicals: Pierre Barbé, Bertrand Deroubaix, Jacques Maigné, Jean-Jacques Mosconi, Bernard Pinatel, Bernadette Spinoy; and |
| • | | Supply & Marketing: Benoît Luc, Momar Nguer, Jérôme Paré, Jérôme Schmitt. |
In addition, Jérôme Schmitt served as the Group’s Treasurer until January 1, 2012. Effective January 2, 2012, Humbert de Wendel is the Group’s Treasurer. As of March 1, 2008, the Group modified its organization to include, notably, a Corporate Affairs Division containing several cross-functional departments.
CompensationCOMPENSATION
Board Compensation The overall amount paidof directors’ fees allocated to members of the Board of Directors was set at€1.1 million for each fiscal year by the Shareholders’ Meeting on May 11, 2007. In 2011, the overall amount of directors’ fees allocated to the members of the Board of Directors as directors’ fees was 0.83 M€ in 2008 in accordance with the decision of the shareholders’ meeting held on May 11, 2007. There1.07 million, noting that there were sixteenfifteen directors as of December 31, 2008, compared with fourteen2011, as of December 31, 2007.at year-end 2010. Compensation was paidThe allocation of the overall amount of fees for 2011 remains based on an allocation scheme comprised of fixed compensation and variable compensation based on fixed amounts per meeting, which made it possible to take into account each director’s actual attendance at the membersmeetings of the Board of Directors in 2008 based onand its Committees.
To take into account the following principles, which remain unchanged from 2007: A fixed amount of€20,000 was paid to each director (paid prorata temporis in case of a change during the period), apart from the Chairmancreation of the AuditStrategic Committee, who was paid€30,000 and the other Audit Committee members who were paid€25,000.
(1) | In January 2009, Marc Blaizot and Bertrand Deroubaix succeeded Jean-Marie Masset and Alain Grémillet, respectively, as members of the Management Committee, and Bruno Weymuller resigned as a member of the Management Committee. |
Each director was paid€5,000 for each meeting of the Board of Directors decided at its meeting of October 27, 2011, to set out the Audit Committee,allocation of fees and the fixed and variable amounts per meeting as follows:
| • | | a fixed amount of€20,000 is to be paid to each director (calculatedprorata temporis in case of a change during the period), apart from the Chairman of the Audit Committee, who is to be paid€30,000 and the other Audit Committee members, who are to be paid€25,000; |
an amount of€5,000 per director for each Board of Directors’ meeting actually attended; an amount of€3,500 per director for each Compensation Committee, or of the Nominating & Governance Committee attended. Thisor Strategic Committee meeting actually attended; an amount was increased toof€7,000 per director for those directors who resideeach Audit Committee meeting actually attended; a premium of€2,000 for travel from a country outside of France.France to attend a Board of Directors or Committee meeting; Neither the Chairman of the Board, nor theand Chief Executive Officer receiveddoes not receive directors’ fees as directorsdirector of TOTAL S.A. or any other company of the Group.
See the table “Directors’ Fees and Other Compensation Received by Directors” below for additional compensation information. Policy for determining the compensation and other benefits of the corporate executive officers Based on a proposal by the Compensation Committee, the Board adopted the following policy for determining the compensation and other benefits of the corporate executive officers (the Chairman and the Chief Executive Officer): Compensation and benefits for the Chairman and the Chief Executive Officer are set by the Board of Directors after considering proposals from the Compensation Committee. Such compensation shall be reasonable and fair, in a context that values both teamwork and motivation within the Company. Compensation for the Chairman and the Chief Executive Officer is related to market practice, work performed, results obtained and responsibilities held. Compensation for the Chairman and the Chief Executive Officer includes both a fixed portion and a variable portion. The fixed portion is reviewed at least every two years. The amount of variable compensation is reviewed each year and may not exceed a stated percentage of fixed compensation. Variable compensation is determined based on pre-defined quantitative and qualitative criteria that are periodically reviewed by the Board of Directors. Quantitative criteria are limited in number, objective, measurable and adapted to the Group’s strategy. Variable compensation is designed to reward short-term performance and progress towards medium-term objectives. The compensation is determined in line with the annual assessment of the performance of the Chairman and the Chief Executive Officer and the Company’s medium-term strategy. The Board of Directors keeps track of the fixed and variable portions of the compensation of the Chairman and the Chief Executive Officer over several years and in light of the Company’s performance. The Group does not have a specific pension plan for the Chairman and the Chief Executive Officer. They are eligible for retirement benefits and pensions available to certain employee categories in the Group under conditions determined by the Board. Stock options and performance shares are designed to align the long-term interests of the Chairman and the Chief Executive Officer with those of the shareholders. The allocation of options and performance shares to the Chairman and the Chief Executive Officer is examined in the light of all the forms of compensation of each person. The exercise price for stock options awarded is not discounted compared to the market price, at the time of the grant, for the underlying share. Stock options and performance shares are awarded at regular intervals to prevent any opportunistic behavior. The exercise of options and the definitive allocation of performance shares to which the Chairman and the Chief Executive Officer are entitled are subjected to performance criteria that must be met over several years. The Board puts in place restrictions on the transfer of a portion of shares held upon the exercise of options and the definitive allocation of performance shares, applicable to the Chairman and the Chief Executive Officer until the end of their term of office. The Chairman and the Chief Executive Officer may be entitled to stock options or performance shares when they leave office. After three years in office, the Chairman and Chief Executive Officer are required to hold at least the number of Company shares set by the Board. The components of the compensation of the Chairman and the Chief Executive Officer are made public after the meeting of the Board of Directors that approves them. Compensation of the Chairman and Chief Executive Officer The compensation paid to Mr. de Margerie for his duties as Chairman and Chief Executive Officer was set by the Board of Directors of TOTAL S.A., based on a recommendation by the Compensation Committee in line with the guidance of the AFEP-MEDEF Corporate Governance Code. It includes an annual fixed base salary of€1,500,000, and a variable portion not to exceed 165% of the fixed base salary. The fixed base salary was set by comparison with the compensation paid to the Chairman and Chief Executive Officer of other French companies included in the CAC 40 index. The maximum percentage of the fixed base salary represented by the variable portion is based on equivalent practice at a reference sample of companies, including oil and gas companies. The variable portion is based on criteria determined by the Board of Directors. The equivalent of up to 100% of the fixed base salary is linked to economic criteria, which varies on a straight-line basis to avoid threshold effects. The criteria based on the Chairman and Chief Executive Officer’s personal contribution account for an additional amount that cannot exceed 65% of the fixed base salary. The economic criteria were selected so as to not only reward short-term performance in terms of return on investment for shareholders, but also the progress made by the Group toward medium-term objectives by comparison with data for the oil and gas industry as a whole. They include: return on equity for a maximum of 50% of the base salary; and | • | | the Company’s earnings performance compared with that of the four other major international oil companies that are its competitors(1), assessed by reference to the average growth over three years of two indicators, earnings per share and consolidated net income. Each indicator represents a maximum of 25% of the base salary. |
The Chairman and Chief Executive Officer’s personal contribution is evaluated on the basis of objective, mainly operational criteria related to the Group’s business segments and established in line with its strategy, including health, safety and environment (HSE) performance and oil and gas production and reserves growth. With respect to the fiscal year 2011, the Board of Directors at its meeting of February 9, 2012, after having found that the Chairman and Chief Executive Officer’s objectives related to personal contribution were deemed to be substantially fulfilled and assessed to what extent financial performance criteria had been met, the Board set the | (1) | ExxonMobil, BP, Shell and Chevron. |
variable portion payable to Mr. de Margerie in 2012 at€1,530,000 for his contribution in 2011, equivalent to 102% of his fixed base salary. The total gross compensation paid to Mr. de Margerie in his role as Chairman and Chief Executive Officer was made up of a fixed base salary of€1,500,000 and a variable portion of€1,530,000 for the 2011 fiscal year, to be paid in 2012. Mr. de Margerie’s total gross compensation as Chief Executive Officer for the period between January 1, 2010 and May 21, 2010 was€1,030,359, composed of a fixed base salary of€507,097 and a variable portion of€523,262 paid in 2011. Mr. de Margerie’s total gross compensation as Chairman and Chief Executive Officer for the period between May 22, 2010 and December 31, 2010 was€1,977,763, composed of a fixed base salary of€919,355 and a variable portion of€1,058,408 paid in 2011. As Chairman and Chief Executive Officer, Mr. de Margerie has the use of a company car, receives the health coverage provided for Group employees and is eligible for the life insurance plan open to the Group’s executive officers (see “— Pensions and other commitments” below). See the tables “Summary of compensation, stock options and performance shares awarded to the Chairman and Chief Executive Officer” and “Chairman and the Chief Executive Officer’s compensation” below for additional compensation information. Executive officer compensation In 2011, the aggregate amount paid directly or indirectly by the French and foreign companies belonging to the Group of the Company as compensation to the executive officers of TOTAL COMPENSATION (INCLUDING IN-KIND BENEFITS) PAID TO EACH DIRECTOR IN THE YEAR INDICATEDin office at December 31, 2011 (members of the Management Committee and the Treasurer) as a group was€20.4 million (twenty-nine individuals), including€9 million paid to the six members of the Executive Committee. Variable compensation accounted for 42.4% of the aggregate amount of€20.4 million paid to executive officers. Pensions and other commitments | | | | | | | | (€) | | 2008 | | | 2007 | | Thierry Desmarest | | (a | ) | | (a | ) | Christophe de Margerie | | (a | ) | | (a | ) | Patricia Barbizet(b) | | 39,651 | | | — | | Daniel Boeuf(c) | | 173,910 | | | 170,124 | | Daniel Bouton | | 40,000 | | | 55,000 | | Bertrand Collomb | | 55,000 | | | 65,000 | | Paul Desmarais Jr. | | 48,000 | | | 41,000 | | Bertrand Jacquillat | | 90,000 | | | 90,000 | | Antoine Jeancourt-Galignani | | 95,000 | | | 90,000 | | Anne Lauvergeon | | 45,000 | | | 50,000 | | Peter Levene of Portsoken | | 41,000 | | | 55,000 | | Maurice Lippens(d) | | — | | | 21,177 | | Claude Mandil(b) | | 27,568 | | | — | | Michel Pébereau | | 70,000 | | | 70,000 | | Thierry de Rudder | | 116,000 | | | 109,000 | | Serge Tchuruk(e) | | 143,427 | | | 137,368 | | Pierre Vaillaud(f) | | 186,873 | | | 189,814 | |
| 1) | Pursuant to applicable law, the Chairman and Chief Executive Officer is eligible for the basic French social security pension and for pension benefits under the ARRCO (Association pour le Régime de RetraiteComplémentaire des Salariés) and AGIRC (Association Générale des Institutions de Retraite des Cadres) government-sponsored supplementary pension schemes. He also participates in the internal defined |
| contribution pension plan and the defined benefit supplementary pension plan, known as RECOSUP, created by the Company. This supplementary pension plan, which is not limited to the Chairman and Chief Executive Officer, is described in point 2 below. |
The sum of the supplementary pension plan benefits and external pension plan benefits may not exceed 45% of the compensation used as the calculation basis. In the event this percentage is exceeded, the supplementary pension is reduced accordingly. The compensation taken into account when calculating the supplementary pension is the retiree’s final three-year average gross compensation (fixed and variable portions). As of December 31, 2011, Mr. de Margerie’s aggregate benefit entitlement under all of the above pension plans would amount to 22.31% of his gross annual compensation received in 2011 (2011 fixed base salary and variable portion for 2010, paid in 2011). | 2) | The Chairman and Chief Executive Officer participates in a defined benefit supplementary pension plan financed and managed by TOTAL S.A. and open to all employees of the Group whose annual compensation is greater than eight times the ceiling for calculating French social security contributions (€36,372 in 2012). Compensation above this amount does not qualify as pensionable compensation under either government-sponsored or contractual pension schemes. |
To be eligible for this supplementary pension plan, participants must meet specific age and length of service criteria. They must also still be employed by the Company upon retirement, unless they retire due to disability or had taken early retirement at the Group’s initiative after the age of 55. The plan provides participants with a pension equal to the sum of 1.8% of the portion of the reference compensation between eight and forty times the annual ceiling for calculating French social security contributions, and 1% of the reference compensation between forty and sixty times the annual ceiling for calculating French social security contributions, which is multiplied by the number of years of service (up to twenty years). It is adjusted in line with changes in the value of the ARRCO pension point and strictly capped as described in point 1 above. As of December 31, 2011, the Group’s pension obligations to Mr. de Margerie under the defined benefit supplementary pension plan represented the equivalent of 18.01% of his gross annual compensation paid in 2011. | 3) | The Chairman and Chief Executive Officer is also entitled to a lump-sum retirement benefit equal to that available to eligible members of the Group under the French National Collective Bargaining Agreement for the Petroleum Industry. This benefit amounts to 25% of the gross annual compensation (fixed and variable portions) received in the 12-month period preceding retirement. Pursuant to the provisions of Article L. 225-42-1 of the French Commercial Code, such benefit is subject to the performance conditions detailed in point 7 below. |
This retirement benefit cannot be combined with the compensation for loss of office described in point 5 below. | 4) | The Chairman and Chief Executive Officer also participates in the same life insurance plan as the Group’s employees, covering supplementary benefits or annuities in the event of temporary incapacity for work and disability, together with a life insurance plan funded by the Company and open to the executive officers of the Group. Upon death, the plan guarantees a payment equal to two years’ gross compensation (fixed and variable portions), increased to three years upon accidental death, as well as, in the event of disability, a payment proportional to the degree of disability. |
| 5) | If the Chairman and Chief Executive Officer is removed from office or his term of office is not renewed by the Company, he is entitled to compensation for loss of office equal to two years’ gross annual compensation. The calculation will be based on the gross compensation (including both fixed and variable portions) paid in the 12-month period preceding the termination or non-renewal of his term of office. |
This compensation for loss of office to be paid in the event of a change of control or a change of strategy of the Company would not be due in cases of gross negligence or willful misconduct or if the Chairman and Chief Executive Officer leaves the Company of his own volition, accepts new responsibilities within the Group, or may claim full retirement benefits within a short time period. Pursuant to the provisions of Article L. 225-42-1 of the French Commercial Code, this benefit is subject to the performance conditions detailed in point 7 below. | 6) | Commitments with regard to the pension and life insurance plans for the Chairman and Chief Executive Officer and the retirement benefit and compensation for loss of office arrangements set out in point 5 were approved on May 21, 2010, by the Board of Directors and by the Shareholders’ Meeting. |
| 7) | In addition, in compliance with Article L. 225-42-1 of the French Commercial Code, the commitments described in points 3 and 5 are subject to performance conditions that are deemed to be met if at least two of the following three criteria are satisfied: |
the average ROE (return on equity) over the three years immediately preceding the year in which the officer retires is at least 12%; the average ROACE (return on average capital employed) over the three years immediately preceding the year in which the officer retires is at least 10%; TOTAL’s oil and gas production growth over the three years immediately preceding the year in which the officer retires is greater than or equal to the average production growth rate of the four other major international oil companies that are its competitors: ExxonMobil, Shell, BP and Chevron. In compliance with the AFEP-MEDEF Corporate Governance Code, the Board of Directors decided that payment of the lump-sum retirement benefit or compensation for loss of office shall be subject to demanding performance conditions combining both internal and external performance criteria. The three criteria were selected to take into account the Company’s general interest, shareholder interests and standard market practices, especially in the oil and gas industry. More specifically, ROE enables the payment of the retirement benefit or compensation for loss of office to be tied to the Company’s overall shareholder return. Shareholders can use ROE to gauge the Company’s ability to generate profit from the capital they have invested and from prior years’ earnings reinvested in the Company. ROACE is used by most oil and gas companies to assess the operational performance of average capital employed, regardless of whether it is funded by equity or debt. ROACE is an indicator of the return on capital employed by the Company for operational activities and, as a result, makes it possible to tie the payment of the retirement benefit or compensation for loss of office to the value created for the Company. The third and last criterion used by the Board of Directors is the Group’s oil and gas production growth compared with that of its competitors. This indicator is widely used in the industry to measure operational performance and the ability to ensure the sustainable development of the Group, most of whose capital expenditure is allocated to exploration and production activities. | 8) | In addition, regarding the implementation of the pension commitments described in points 1 and 2 |
| above made by the Company for directors for fiscal year 2011, the annual supplementary pension received by Mr. Desmarest in relation to his previous employment by the Group was approximately€562,354 (December 31, 2011 value), adjusted in line with changes in the value of the ARRCO pension point. |
| 9) | As of December 31, 2011, the total amount of the Group’s commitments under pension plans and similar for company officers is equal to€31.2 million. |
| | | | | | | | | | Chairman and Chief Executive Officer Summary table at February 29, 2012 | | Employment
contract | | Retirement benefit and supplementary pension plans | | Benefits or advantages due or likely to be due upon termination or change of office | | Benefits related to a non-compete agreement | Christophe de Margerie Chairman and Chief Executive Officer Start of the office: February 2007(a) Term of current office: The Shareholders’ Meeting called in 2012 to approve the financial statements for the year ending December 31, 2011 | | NO | | YES (retirement benefit)(b) (internal defined supplementary pension plan(c) and corporate RECOSUP defined contribution pension plan(d) also applicable to certain Group employees) | | YES (compensation for loss of office)(e) | | NO |
| (a) | For the Chairman of the Board of Directors and the Chief Executive Officer see the summary tables “— Summary of compensation, stock optionssince February 13, 2007, and restricted shares granted to the Chairman and the Chief Executive Officer” and “—Compensation of the Chairman and the Chief Executive Officer”. Thierry Desmarest and Christophe de Margerie received no directors’ fees for their service on the Company’s Board of Directors.Officer since May 21, 2010. |
| (b) | Appointed as a directorPayment subject to performance conditions in accordance with the decision of the Board of Directors on February 11, 2009, and confirmed by the Board of Directors on May 16, 2008.15, 2009 and May 21, 2010. Details of these commitments are set out in points 3 and 7 above. This retirement benefit cannot be combined with the compensation for loss of office described below. |
| (c) | IncludingRepresenting an annual pension that would be equivalent, as of December 31, 2011, to 18.01% of the annual compensation received by Mr. Boeuf as an employee of Total Raffinage Marketing, a subsidiary of TOTAL S.A., which amounted to€115,123.88 in 2007 and€123,910.48 in 2008.for 2011. |
| (d) | TermMr. de Margerie’s pension benefit represented a booked expense of office expired on May 11, 2007.€2,121 for fiscal year 2011. |
| (e) | Including pension payments relatedPayment subject to previous employmentperformance conditions in accordance with the decision of the Board of Directors on February 11, 2009, and confirmed by the Board of Directors on May 15, 2009 and May 21, 2010. Details of these commitments are set out in points 5 and 7 above. |
Stock options and performance share grants policy General policy Stock options and performance share grants put in place by TOTAL S.A. concern only TOTAL shares. No options for or grants of performance shares of any of the Group’s listed subsidiaries are awarded by TOTAL S.A. All grants are approved by the Board of Directors, based on recommendations by the Compensation Committee. For each plan, the Compensation Committee recommends a list of beneficiaries, the conditions and the number of options or performance shares awarded to each beneficiary. The Board of Directors then gives final approval for this list and the grant conditions. Stock options have a term of eight years, with an exercise price set at the average of the closing TOTAL share prices on Euronext Paris during the twenty trading days prior to the grant date, without any discount. The exercising of the options is subject to a presence condition and performance conditions (based on the return on equity (ROE) of the Group) that vary depending on the plan and beneficiary category. As of 2011, all options granted are subject to performance conditions. Subject to the presence condition and applicable performance conditions being met, options may only be exercised after an initial two-year vesting period and the shares issued upon exercise are subject to a two-year mandatory holding period. However, for the 2007 to 2011 option plans, options awarded to beneficiaries employed by non-French subsidiaries at the grant date can be converted to bearer form or transferred after the 2-year vesting period at the end of which the options may be exercised. Performance shares awarded under selective plans become final after a two-year vesting period, subject to a presence condition and a performance condition based on the return on equity (ROE) of the Group. At the end of this vesting period, and provided that the conditions set are satisfied, the performance share grants are finally awarded. However, these shares may not be transferred prior to the end of an additional two-year mandatory holding period. For beneficiaries employed by non-French subsidiaries on the grant date, the vesting period for performance shares may be increased to four years; in such cases, there would be no mandatory holding period. As of 2011, all performance shares granted to executive officers are subject to performance conditions. The grant of these options or performance shares is used to extend, based upon individual performance assessments at the time of each plan, the Group-wide policy of developing employee shareholding (for further information, see “— Employees and Share Ownership — Arrangements for involving employees in the Company’s share capital” below). Stock options and performance share grants to the Chairman and Chief Executive Officer are subject to specific performance conditions set out below. Grants to the Chairman and Chief Executive Officer The Chairman and Chief Executive Officer has been awarded share subscription options, the exercise of which has been subject, since 2007, to a presence condition and performance conditions based on the Group’s ROE and ROACE. The reasons for selecting these criteria are detailed in point 7 of “— Pensions and other commitments” above. Pursuant to Article L. 225-185 of the French Commercial Code, the Board of Directors decided that, for the 2007 to 2011 share subscription option plans, the corporate officers (the Chairman of the Board and the Chief Executive Officer, and as from May 21, 2010 the Chairman and Chief Executive Officer) are required to hold for as long as they remain in office, a number of TOTAL shares representing 50% of the capital gains, net of tax and other deductions, resulting from the exercise of stock options under these plans. Once the Chairman and Chief Executive Officer holds a number of shares (directly or through collective investment funds invested in Company stock) corresponding to more than five times his current gross annual fixed compensation, this holding requirement will be reduced to 10%. If in the future this ratio is no longer met, the previous 50% holding requirement will once again apply. As of 2011, the Chairman and Chief Executive Officer receives performance share grants, the final awarding of which is subject to a presence condition and performance conditions. On the September 14, 2011 grant of TOTAL performance shares, the Board of Directors decided that the Chairman and Chief Executive Officer will have to hold for as long as he remains in office, 50% of the capital gains, net of tax and other deductions, from shares granted under performance share grant plans. Once the Chairman and Chief Executive Officer holds a number of shares (directly or through collective investment funds invested in Company stock) corresponding to more than five times his gross annual fixed compensation at that time, this holding requirement will be reduced to 10%. If in the future this ratio is no longer met, the previous 50% holding requirement will once again apply. In light of this holding requirement, the acquisition of the performance shares is not subject to an additional purchase of the Company’s shares. The Chairman and Chief Executive Officer has given a commitment not to hedge the price risk on the TOTAL stock options and shares he has been granted to date, and on the shares he holds. 2011 share subscription option plan: The Board of Directors decided that, provided the presence condition within the Group is satisfied, the number of options finally granted to the Chairman and Chief Executive Officer will be subject to two performance conditions: For 50% of the share subscription options granted, the performance condition states that the number of options finally granted is based on the average ROE of the Group. The average ROE is calculated by the Group from the consolidated balance sheet and statement of income of the Group for fiscal years 2011 and 2012. The acquisition rate is equal to zero if the average ROE is less than or equal to 7%, varies on a straight-line basis between 0% and 100% if the average ROE is more than 7% and less than 18%, and is equal to 100% if the average ROE is more than or equal to 18%. For 50% of the share subscription options granted, the performance condition states that the number of options finally granted is based on the average ROACE of the Group. The average ROACE is calculated by the Group from the consolidated balance sheet and statement of income of the Group for fiscal years 2011 and 2012. The acquisition rate is equal to zero if the average ROACE is less than or equal to 6%, varies on a straight-line basis between 0% and 100% if the average ROACE is more than 6% and less than 15%, and is equal to 100% if the average ROACE is more than or equal to 15%. 2010 share subscription option plan: The Board of Directors decided that, provided the presence condition within the Group is satisfied, the number of options finally granted to the Chairman and Chief Executive Officer will be subject to two performance conditions: For 50% of the share subscription options granted, the performance condition states that the number of | | options finally granted is based on the average ROE of the Group. The average ROE is calculated by the Group which amountedbased on TOTAL’s consolidated balance sheet and statement of income for fiscal years 2010 and 2011. The acquisition rate is equal to zero if the average ROE is less than or equal to 7%, varies on a straight-line basis between 0% and 100% if the average ROE is more than 7% and less than 18%, and is equal to 100% if the average ROE is more than or equal to 18%. |
For 50% of the share subscription options granted, the performance condition states that the number of options finally granted is based on the average ROACE of the Group calculated based on TOTAL’s consolidated balance sheet and statement of income for fiscal years 2010 and 2011. The acquisition rate is equal to zero if the average ROACE is less than or equal to 6%, varies on a straight-line basis between 0% and 100% if the average ROACE is more than 6% and less than 15%, and is equal to 100% if the average ROACE is more than or equal to 15%. 2009 share subscription option plan: The Board of Directors decided that, provided the presence condition within the Group is satisfied, the number of options finally granted to the Chief Executive Officer will be subject to two performance conditions: For 50% of the share subscription options granted, the performance condition states that the number of options finally granted is based on the average ROE of the Group as published by TOTAL. The average ROE is calculated based on the Group’s consolidated balance sheet and statement of income for fiscal years 2009 and 2010. The acquisition rate is equal to zero if the average ROE is less than or equal to 7%, varies on a straight-line basis between 0% and 100% if the average ROE is more than 7% and less than 18%, and is equal to 100% if the average ROE is more than or equal to 18%. For 50% of the share subscription options granted, the performance condition states that the number of options granted is related to the average ROACE of the Group as published by TOTAL. The average ROACE is calculated based on the Group’s consolidated balance sheet and statement of income for fiscal years 2009 and 2010. The acquisition rate is equal to zero if the average ROACE is less than or equal to 6%, varies on a straight-line basis between 0% and 100% if the average ROACE is more than 6% and less than 15%, and is equal to 100% if the average ROACE is more than or equal to 15%. The acquisition rate applicable to the subscription options that were subject to the performance condition of the 2009 Plan was 100%. 2011 performance share plan:The Board of Directors decided that, provided the presence condition within the Group is satisfied, the number of shares finally granted to the Chairman and Chief Executive Officer will be subject to two performance conditions: For 50% of the shares granted, the performance condition states that the number of shares finally granted is based on the average ROE of the Group. The average ROE is calculated by the Group from the consolidated balance sheet and statement of income of the Group for fiscal years 2011 and 2012. The acquisition rate is equal to zero if the average ROE is less than or equal to 7%, varies on a straight-line basis between 0% and 100% if the average ROE is more than 7% and less than 18%, and is equal to 100% if the average ROE is more than or equal to 18%. For 50% of the shares granted, the performance condition states that the number of shares finally granted is based on the average ROACE of the Group. The average ROACE is calculated by the Group from the consolidated balance sheet and statement of income of the Group for fiscal years 2011 and 2012. The acquisition rate is equal to zero if the average ROACE is less than or equal to 6%, varies on a straight-line basis between 0% and 100% if the average ROACE is more than 6% and less than 15%, and is equal to 100% if the average ROACE is more than or equal to 15%. The Chairman and Chief Executive Officer was not awarded any performance shares as part of the plans in the period 2006 to 2010. Grants to employees Share subscription option plans 2011 share subscription option plan: The Board of Directors decided that, provided the presence condition within the Group is satisfied, for each grantee other than the Chairman and Chief Executive Officer, the options will be finally granted to the beneficiary provided that the performance condition is fulfilled. The performance condition states that the number of options finally granted is based on the average of the ROE of the Group. The average ROE is calculated by the Group from the consolidated balance sheet and statement of income of the Group for fiscal years 2011 and 2012. The acquisition rate: is equal to zero if the average ROE is less than or equal to 7%; varies on a straight-line basis between 0% and 100% if the average ROE is more than 7% and less than 18%; and is equal to 100% if the average ROE is more than or equal to 18%. 2010 share subscription option plan: The Board of Directors decided that, provided the presence condition within the Group was satisfied: for each grantee of up to 3,000 options, other than the Chairman and Chief Executive Officer, the options will be finally granted; for each grantee of more than 3,000 options and less than or equal to 50,000 options (other than the Chairman and Chief Executive Officer): | – | | the first 3,000 options and two-thirds of the options in excess of this number will be finally granted to their beneficiary; |
| – | | the outstanding options, that is one-third of the options in excess of the first 3,000 options, will be granted provided that the performance condition described below is fulfilled; |
for each grantee of more than 50,000 options, other than the Chairman and Chief Executive Officer: | – | | the first 3,000 options, two-thirds of the options above the first 3,000 options and below the first 50,000 options, and one-third of the options in excess of the first 50,000 options, will be finally granted to their beneficiary; |
| – | | the remaining options, that is one-third of the options above the first 3,000 options and below the first 50,000 options, and two-thirds of the options in excess of the first 50,000 options, will be finally granted provided that the performance condition is fulfilled. |
This condition states that the number of options finally granted is based on the average ROE of the Group. The average ROE is calculated by the Group based on TOTAL’s consolidated balance sheet and statement of income for fiscal years 2010 and 2011. The acquisition rate: is equal to zero if the average ROE is less than or equal to 7%; varies on a straight-line basis between 0% and 100% if the average ROE is more than 7% and less than 18%; and is equal to 100% if the average ROE is more than or equal to 18%. 2009 share subscription option plan:The Board of Directors decided that, provided the presence condition within the Group was met, for each beneficiary, other than the Chief Executive Officer, of more than 25,000 options, one-third of the options granted in excess of this number will be finally granted subject to a performance condition. This condition is based on the average ROE of the Group as published by TOTAL. The average ROE is calculated based on the Group’s consolidated balance sheet and statement of income for fiscal years 2009 and 2010. The acquisition rate: is equal to zero if the average ROE is less than or equal to 7%; varies on a straight-line basis between 0% and 100% if the average ROE is more than 7% and less than 18%; and is equal to 100% if the average ROE is more than or equal to 18%. The acquisition rate applicable to the subscription options that were subject to the performance condition of the 2009 Plan was 100%. Performance share plans 2011 performance share plan: The Board of Directors decided that, provided that the presence condition within the Group is satisfied, for executives officers(1) other than the Chairman and Chief Executive Officer, the number of shares finally granted will be subject to the performance condition set out below. This condition is based on the average ROE as published by the Group and calculated based on the Group’s consolidated balance sheet and statement of income for fiscal years 2011 and 2012. The acquisition rate: is equal to zero if the average ROE is less than or equal to 7%; varies on a straight-line basis between 0% and 100% if the average ROE is more than 7% and less than 18%; and is equal to 100% if the average ROE is more than or equal to 18%. | (1) | Executive officers, excluding the Chairman and Chief Executive Officer, are employees other than directors. |
Furthermore, the Board of Directors decided that, for each beneficiary (other than the Chairman and Chief Executive Officer and the executive officers) of more than 100 shares, the shares in excess of this number will be finally granted subject to a performance condition. This condition is based on the average ROE as published by the Group and calculated based on the Group’s consolidated balance sheet and statement of income for fiscal years 2011 and 2012. The acquisition rate: is equal to zero if the average ROE is less than or equal to 7%; varies on a straight-line basis between 0% and 100% if the average ROE is more than 7% and less than 18%; and is equal to 100% if the average ROE is more than or equal to 18%. 2010 performance share plan: The Board of Directors decided that, provided that the presence condition within the Group is satisfied, for each beneficiary of more than 100 shares, half of the shares in excess of this number will be finally granted subject to a performance condition. This condition is based on the average ROE calculated by the Group based on TOTAL’s consolidated balance sheet and statement of income for fiscal years 2010 and 2011. The acquisition rate: is equal to zero if the average ROE is less than or equal to 7%; varies on a straight-line basis between 0% and 100% if the average ROE is more than 7% and less than 18%; and is equal to 100% if the average ROE is more than or equal to 18%. 2009 performance share plan: The Board of Directors decided that, provided that the presence condition within the Group is satisfied, for each beneficiary of more than 100 shares, half of the shares in excess of this number will be finally granted subject to a performance condition. This condition is based on the average ROE of the Group as published by TOTAL. The average ROE is calculated based on the Group’s consolidated balance sheet and statement of income for fiscal years 2009 and 2010. The acquisition rate: is equal to zero if the average ROE is less than or equal to 7%; varies on a straight-line basis between 0% and 100% if the average ROE is more than 7% and less than 18%; and is equal to 100% if the average ROE is more than or equal to 18%. Due to the application of the performance condition, the acquisition rate was 100% for the 2009 Plan. In addition, the Board of Directors decided at its meeting of May 21, 2010 to implement a global free share plan intended for the Group’s employees, that is more than 100,000 employees. On June 30, 2010, rights to twenty-five free shares were granted to every employee. The shares are subject to a vesting period of two to four years depending on the case. The shares granted are not subject to any performance condition. They will be issued at the end of the vesting period. SUMMARY OF COMPENSATION, STOCK OPTIONS AND PERFORMANCE SHARES AWARDED TO THE CHAIRMAN AND CHIEF EXECUTIVE OFFICER | | | | | | | | | | For the year ended (€) | | 2011 | | | 2010 | | Christophe de Margerie Chairman and Chief Executive Officer (since May 21, 2010) | | | | | | | | | Compensation due for fiscal year as Chairman and Chief Executive Officer(a) | | | 3,030,000 | | | | 3,008,122 | | In-kind benefits(b) | | | 6,991 | | | | 6,908 | | Value of options awarded(c) | | | 702,400 | | | | 1,387,200 | | Value of performance shares awarded(d) | | | 437,440 | | | | — | | Total | | | 4,176,831 | | | | 4,402,230 | |
| (a) | Compensation detailed in the following table. For the 2010 fiscal year, Mr. de Margerie received compensation of€72,3681,030,359 as Chief Executive Officer for the period from January 1 to May 21, 2010, and compensation of€1,977,763 as Chairman and Chief Executive Officer for the period from May 22 to December 31, 2010. |
| (b) | Mr. de Margerie has the use of a company car; he receives the health coverage provided for Group employees and is eligible for the life insurance plan open to the Group’s executive officers (see “— Pensions and other commitments”). |
| (c) | Options awarded in 20072011 are detailed in the table “Stock options awarded in 2011 to the Chairman and Chief Executive Officer”. The value of options awarded was calculated on the day when they were awarded using the Black-Scholes model based on the assumptions used for the consolidated accounts (see Note 25 to the Consolidated Financial Statements). |
| (d) | The value of performance shares was calculated on the day when they were awarded. |
CHAIRMAN AND CHIEF EXECUTIVE OFFICER’S COMPENSATION | | | | | | | | | | | | | | | | | | | | For the year ended 2011 | | | For the year ended 2010 | | | For the year ended (€) | | Amount due | | | Amount paid(a) | | | Amount due | | | Amount paid(a) | | Christophe de Margerie Chairman and Chief Executive Officer (since May 21, 2010) | | | | | | | | | | | | | | | | | Fixed compensation | | | 1,500,000 | | | | 1,500,000 | | | | 1,426,452 | (b) | | | 1,426,452 | (b) | Variable compensation(c) | | | 1,530,000 | | | | 1,581 670 | | | | 1,581,670 | (d) | | | 1,356,991 | | Extraordinary compensation | | | — | | | | — | | | | — | | | | — | | Directors’ fees | | | — | | | | — | | | | — | | | | — | | In-kind benefits(e) | | | 6,991 | | | | 6,991 | | | | 6,908 | | | | 6,908 | | Total | | | 3,036,991 | | | | 3,088,661 | | | | 3,015,030 | | | | 2,790,351 | |
| (a) | Variable portion paid for prior fiscal year. For more detailed information about these criteria, see “— Compensation of the Chairman and Chief Executive Officer”. |
| (b) | Includes a fixed portion of€507,097 for the period between January 1 and May 21, 2010 and€73,427 in 2008.919,355 for the period between May 22 and December 31, 2010. |
| (c) | The variable portion for the Chairman and Chief Executive Officer is calculated by taking into account the Group’s return on equity during the relevant fiscal year, the Group’s earnings compared to those of the other major international oil companies that are its competitors as well as the Chairman and Chief Executive Officer’s personal contribution based on operational target criteria. The variable portion can reach a maximum amount of 165% of the fixed base salary. The objectives related to personal contribution were considered to have been substantially fulfilled. |
| (d) | Including a variable portion of€523,262 for the period between January 1 to May 21 2010, and€1,058,408 for the period between May 22 and December 31, 2010. |
| (e) | Mr. de Margerie has the use of a company car, receives the health coverage provided for Group employees and is eligible for the life insurance plan open to the Group’s executive officers (see “— Pensions and other commitments”). |
DIRECTORS’ FEES AND OTHER COMPENSATION RECEIVED BY DIRECTORS Total compensation (including in-kind benefits) paid to each director in the year indicated (Article L. 225-102-1 of the French Commercial Code, 1st and 2nd paragraphs): | | | | | | | | | | Gross amount (€) | | 2011 | | | 2010 | | Christophe de Margerie(a) | | | (b | ) | | | (b | ) | Thierry Desmarest (a)(b) | | | 639,854 | (d) | | | 1,604,039 | (d) | Patrick Artus(c) | | | 65,500 | | | | 55,000 | | Patricia Barbizet(a) | | | 115,500 | | | | 107,000 | | Daniel Bouton | | | 63,500 | | | | 55,000 | | Gunnar Brock(a)(e) | | | 75,500 | | | | 39,328 | | Claude Clément(e) | | | 156,365 | (f) | | | 127,929 | (f) | Marie-Christine Coisne-Roquette(g) | | | 48,460 | | | | — | | Bertrand Collomb | | | 72,500 | | | | 71,000 | | Paul Desmarais Jr. | | | 51,000 | | | | 45,000 | | Bertrand Jacquillat(h) | | | 55,040 | | | | 95,000 | | Barbara Kux(a)(i) | | | 26,770 | | | | — | | Anne Lauvergeon(a) | | | 63,500 | | | | 45,000 | | Peter Levene of Portsoken(j) | | | 19,230 | | | | 79,000 | | Claude Mandil(a) | | | 63,500 | | | | 55,000 | | Michel Pébereau | | | 77,500 | | | | 71,000 | | Thierry de Rudder(a) | | | 138,500 | | | | 142,000 | |
| (a) | Member of the Strategic Committee. |
| (b) | For the Chairman and Chief Executive Officer, see the summary compensation tables “Summary of compensation, stock options and performance shares awarded to the Chairman and Chief Executive Officer” and “Chairman and Chief Executive Officer’s compensation”. The Chairman and Chief Executive Officer did not receive any directors’ fees. |
| (c) | Member of the Compensation Committee since May 21, 2010. |
| (d) | Including for 2011, fees received (€77,500) and pension benefits received (€562,354), and including for 2010, fees received (€39,328), fixed and variable compensation for his role as Chairman of the Board of Directors up to May 21, 2010 (€751,407), the retirement benefit (€492,963) and pension benefits received (€320,341). |
| (e) | Director since May 21, 2010. |
| (f) | Including pension payments related to previous employment byfor 2011, the Group, which amounted todirectors’ fees received, representing€139,814 in 2007 and58,500, as well as the compensation received from Total Raffinage Marketing (a subsidiary of TOTAL S.A.), representing€141,873 in 2008.97,865 and including for 2010, directors’ fees received, representing€32,328 as well as the compensation received from Total Raffinage Marketing, representing€95,601. |
| (g) | Director and member of the Audit Committee from May 13, 2011. |
| (h) | Director and member of the Audit Committee until May 13, 2011. |
| (i) | Director since May 13, 2011. |
| (j) | Director until May 13, 2011. |
Over the past two years, the directors currently in office have not received any compensation or in-kind benefits from companies controlled by TOTAL S.A., except for Mr. Daniel Boeuf,Clément, who is an employee of Total Raffinage Marketing.Marketing, and Mr. Desmarest, Chairman of the Board of Directors until May 21, 2010. The compensation indicated in the table above (except for that of the Chairman theand Chief Executive Officer and Messrs. Boeuf, TchurukDesmarest and Vaillaud)Clément) consists solely of directors’ fees (gross amount) paid during the relevant period. None of the Directors of TOTAL S.A.directors have service contracts whichlinking them to TOTAL S.A. or any of its subsidiaries that provide for benefits upon termination of employment. Compensation of the ChairmanSTOCK OPTIONS AWARDED IN 2011 TO THE CHAIRMAN AND CHIEF EXECUTIVE OFFICER
The total gross compensation paid to Mr. Thierry Desmarest for fiscal 2008 was set by the Board of Directors, based upon the proposal of the Compensation Committee. This compensation is composed of a fixed base salary of€1,100,000 and a variable portion. The variable portion is calculated by taking into account the Group’s return on equity, the Group’s earnings compared to those of other major international oil companies, as well as the Chairman’s personal contribution to the Group’s strategy, corporate governance and performance. The variable portion can reach a maximum amount of 100% of the fixed base salary. The objectives related to personal contribution were considered to be fulfilled, and taking into account the comparison of TOTAL’s earnings with the major international oil companies that are its competitors, the variable portion paid to the Chairman in 2009 for his contribution in 2008 amounted to€969,430.
The total gross compensation paid to the Chairman for fiscal year 2008 amounted to€2,069,430.
Mr. Desmarest does not receive any in-kind benefits.
See the tables “Summary of Compensation, Stock Options and Restricted Shares Grantedstock options awarded to the Chairman and the Chief Executive Officer” and “Compensation of the Chairman and the Chief Executive Officer” below for additional compensation information.
Compensation of the Chief Executive Officer
The total gross compensation paid to Mr. Christophe de Margerie for fiscal 2008 was set by the Board of Directors, based upon the proposal of the Compensation Committee. This compensation is composed of a fixed base salary of€1,250,000 and a variable portion.
The variable portion is calculated by taking into account the Group’s return on equity, the Group’s earnings compared to those of other major international oil companies, as well as the Chief Executive Officer’s personal contribution to the Group’s strategy, evaluated on the basis of objective operational criteria related to the Group’s business segments. The variable portion can reach a maximum amount of 140% of the fixed base salary, which limit may be increased to 165% to reward exceptional performance. The objectives related to personal contribution were considered to be fulfilled, and taking into account the comparison of TOTAL’s earnings with the major international oil companies that are its competitors, the variable portion paid to the Chief Executive Officer are detailed in 2009 for his contribution in 2008 amountedthe table “TOTAL stock options awarded to€1,552,875.
The total gross compensation paid to the Mr. de Margerie, Chairman and Chief Executive Officer for fiscal year 2008 amountedof TOTAL S.A.” below.
| | | | | | | | | | | | | | | | | | | | | | | | | | | | Date of
Plan | | | Type of
options | | Value of
options
(€)(a) | | | Number of
options
awarded
during
fiscal year(b) | | | Exercise
price | | | Exercise
period | | | Performance
condition | | Christophe de Margerie | |
| 2011 Plan
09/14/2011 |
| | Subscription
options | | | 702,400 | | | | 160,000 | | | | 33.00 | | |
| 09/15/2013-
09/14/2019 |
| | For 50% of the options, the condition is based on the average ROE for the Group’s 2011 and 2012 fiscal years. For 50% of the options, the condition is based on the average ROACE for the Group’s 2011 and 2012 fiscal years. | Chairman and Chief Executive Officer | | | | | | | | | | | | | | | | | Total | | | | | | | | | 702,400 | | | | 160,000 | | | | | | | | | | | |
| (a) | The value of options awarded was calculated on the day they were awarded using the Black-Scholes model based on the assumptions used for the consolidated accounts (see Note 25 to the Consolidated Financial Statements). |
| (b) | As part of the share subscription option plan awarded on September 14, 2011, the Board of Directors decided that, for the Chairman and Chief Executive Officer, the number of share subscription options that are likely to be exercised at the end of the two-year vesting period will be subject to performance conditions being met (see “— Grants to the Chairman and Chief Executive Officer”). |
€2,802,875.STOCK OPTIONS EXERCISED IN 2011 BY THE CHAIRMAN AND CHIEF EXECUTIVE OFFICER
Mr. Christophe de Margerie has the use of a company car.
See the tables “Summary of Compensation, Stock Options and Restricted Shares GrantedThe stock options awarded to the Chairman and the Chief Executive Officer” and “Compensation ofOfficer are detailed in the table “TOTAL stock options awarded to Mr. de Margerie, Chairman and the Chief Executive Officer” below for additional compensation information.Officer of TOTAL S.A.” below.
| | | | | | | | | | | | | | Date of Plan | | Number of options
exercised during
fiscal year | | | Exercise
price (€) | | Christophe de Margerie | | 2003 Plan | | | 113,576 | | | | 32.84 | | Chairman and Chief Executive Officer | | 07/16/2003 | | | | | | | | | Total | | | | | 113,576 | | | | | |
Executive Officer CompensationPERFORMANCE SHARES AWARDED IN 2011 TO THE CHAIRMAN AND
In 2008, the aggregate amount paid directly or indirectly by the French and foreign affiliates of the Company as compensation to the executive officers of TOTAL in office as of December 31, 2008 (twenty-eight individuals, members of the Management Committee and the Treasurer) as a group was 18.0 M€, including 7.4 M€ paid to the six members of the Executive Committee. Variable compensation accounted for 44.2% of the aggregate amount of 18.0 M€ paid to executive officers.CHIEF EXECUTIVE OFFICER OR ANY DIRECTOR
| | | | | | | | | | | | | | | | | | | | | | | | | | Date of
Plan | | | Number of
shares
awarded
during
fiscal year | | | Value of
shares (€)(a) | | | Acquisition
date | | | Availability
date | | | Performance condition | | Christophe de MargerieChairman and Chief Executive Officer | |
| 2011 Plan
09/14/2011 |
| | | 16,000 | | | | 437,440 | | | | 09/15/2013 | | | | 09/15/2015 | | | For 50% of the shares, the condition is based on the average ROE for the Group’s 2011 and 2012 fiscal years. For 50% of the shares, the condition is based on the average ROACE for the Group’s 2011 and 2012 fiscal years. | | Claude ClémentDirector representing employee shareholders | |
| 2011 Plan
09/14/2011 |
| | | 240 | | | | 6,562 | | | | 09/15/2013 | | | | 09/15/2015 | | | Shares in excess of the first 100 shares are subject to a condition based on the average ROE for the Group’s 2011 and 2012 fiscal years. | | Total | | | | | | | 16,240 | | | | | | | | | | | | | | | |
| (a) | The value of performance shares was calculated on the day when they were awarded. |
Pensions and other commitmentsPERFORMANCE SHARES FINALLY AWARDED IN 2011 FOR THE CHAIRMAN AND CHIEF EXECUTIVE OFFICER OR ANY DIRECTOR
1) | The Chairman and the Chief Executive Officer, pursuant to applicable law, are eligible for French social security benefits, ARRCO (French Association for Complementary Pension Schemes) and AGIRC (French executive pension scheme federation) complementary pensions, defined benefit pension plans (RECOSUP) and the supplementary pension plan created by the Company. This supplementary pension plan, which is not limited to the Chairman and the Chief Executive Officer, is described in more detail below. |
2) | The Chairman and the Chief Executive Officer are eligible for a supplementary pension plan open to all employees of the Group whose annual compensation is greater than the annual French social security threshold multiplied by eight. |
This supplementary pension plan is financed and managed by TOTAL S.A. to award a pension that is based on the period of employment (up to a limit of 20 years) and the portion of annual gross compensation (including fixed and variable portions) that exceeds by at least eight times the annual French social security threshold. This pension is indexed to the French Association for Complementary Pensions Schemes (ARRCO) index.
As of December 31, 2008, the Group’s supplementary pension obligations related to the Chairman are the equivalent of an annual pension of 23.8% of the Chairman’s 2008 compensation.
For the Chief Executive Officer, the Group’s pension obligations are, as of December 31, 2008, the equivalent of an annual pension of 18.9% of his 2008 compensation.
3) | The Company also funds a life insurance policy which guarantees a payment, upon death, equal to two years’ compensation (both fixed and variable), increased to three years upon accidental death, as well as, in case of disability, a payment proportional to the degree of disability. |
4) | The Chairman and the Chief Executive Officer are also entitled to retirement benefits equal to those available to eligible members of the Group under the French National Collective Bargaining Agreement for the Petroleum Industry, amounting to 25% of the annual gross compensation (including fixed and variable portions) paid in the 12-month period preceding the retirement of the Chairman or the Chief Executive Officer, as the case may be. |
5) | If the Chairman or the Chief Executive Officer’s employment is terminated or his term of office is not renewed, he is eligible for severance benefits equal to two times an individual’s annual pay, based upon the gross compensation (both fixed and variable) paid in the 12-month period preceding termination of employment or term of office. |
The severance benefits to be paid upon a change of control or a change of strategy of the Company are cancelled in the case of gross negligence or wilful misconduct or if the Chairman or the Chief Executive Officer leaves the Company of his own volition, accepts new responsibilities within the Group, or may claim full retirement benefits within a short time period.
Since Mr. Desmarest is eligible to claim his full retirement benefits, these provisions are only relevant to Mr. de Margerie.
6) | The commitments related to the supplementary pension plan, retirement benefits and severance benefits upon termination of employment or term of office will be subject to the procedure for regulated agreements set forth in article L. 225-38 of the French Commercial Code. |
7) | Pursuant to the provisions to the French law of August 21, 2007, which modifies article L. 225-42-1 of the French Commercial Code, the commitments described above related to retirement benefits and severance benefits upon termination of employment or term of office are subject to performance conditions. |
These performance conditions are deemed to be met if at least two of the three following criteria are satisfied:
The average ROE (return on equity) over the three years immediately preceding the year in which the officer retires is at least 12%.
The average ROACE (return on average capital employed) over the three years immediately preceding the year in which the officer retires is at least 10%.
The Company’s oil and gas production growth over the three years immediately preceding the year in which the officer retires is greater than or equal to the average production growth of the four following companies: ExxonMobil, Shell, BP and Chevron.
8) | In addition, the Company has the following pension commitments (described in paragraph 2, above), as defined under French law, to Messrs. Tchuruk and Vaillaud: |
The Company has funded a supplementary pension for Mr. Tchuruk related to his previous employment by the Group. Mr. Tchuruk receives an annual supplementary pension of approximately€73,427, based upon calculations as of December 31, 2008. This pension is indexed to the ARRCO index.
The Company has funded a supplementary pension for Mr. Vaillaud related to his previous employment by the Group. Mr. Vaillaud receives an annual supplementary pension of approximately€141,873, based upon calculations as of December 31, 2008. This pension is indexed to the ARRCO index.
9) | For the year 2008, the total amount of the Group’s pension commitments related to the directors of the Group is equal to 25.8 M€. |
| | | | | | | | | | Summary table
as of February 28, 2009
| | Employment
contractDate of Plan | | Benefits or advantages
due or likely to be due
upon termination or
changeNumber of officeshares
finally awarded during
fiscal year | | | Benefits relatedAcquisition
to a non-compete
agreementcondition | | Benefits or advantages
due or likely to be
due after
termination or
change of office | Thierry Desmarest
Chairman of the Board of Directors
Member of the Board since May 1995(a)
Expiry of current term of office:
The shareholders’ meeting called in 2010 to approve the financial statements for the year ending December 31, 2009
| | NO | | NO | | | NO | | YES
(retirement benefit)(b) (supplementary pension plan also applicable to some Group employees)
| Christophe de Margerie | | 2009 Plan | | | — | | | | — | | Chairman and Chief Executive Officer
| | 09/15/2009 | | | | | | | | | MemberClaude Clément
| | 2009 Plan | | | | | | | — | | Director representing employee shareholders | | 09/15/2009 | | | — | | | | | | Total | | | | | — | | | | — | |
TOTAL STOCK OPTION GRANTS The following table gives a breakdown of stock options awarded by category of beneficiaries (main executive officers, other executive officers and other employees) for the plans in effect during 2011. | | | | | | | | | | | | | | | | | | | | | | | | Number of
beneficiaries | | | Number
of options
awarded(a) | | | Percentage | | | Average
number of
options per
beneficiary(a) | | 2003 Plan(b)(d):: Subscription options | | Main executive officers(c) | | | 28 | | | | 356,500 | | | | 12.2 | % | | | 12,732 | | Decision of the Board on July 16, 2003 | | Other executive officers | | | 319 | | | | 749,206 | | | | 25.5 | % | | | 2,349 | | Exercise price:€133.20; discount: 0.0% | | Other employees | | | 3,603 | | | | 1,829,600 | | | | 62.3 | % | | | 508 | | Exercise price as of May 24, 2006:€32.84(a) | | Total | | | 3,950 | | | | 2,935,306 | | | | 100 | % | | | 743 | | 2004 Plan(d): Subscription options | | Main executive officers(c) | | | 30 | | | | 423,500 | | | | 12.6 | % | | | 14,117 | | Decision of the Board on July 20, 2004 | | Other executive officers | | | 319 | | | | 902,400 | | | | 26.8 | % | | | 2,829 | | Exercise price:€159.40; discount: 0.0% | | Other employees | | | 3,997 | | | | 2,039,730 | | | | 60.6 | % | | | 510 | | Exercise price as of May 24, 2006:€39.30(a) | | Total | | | 4,346 | | | | 3,365,630 | | | | 100 | % | | | 774 | | 2005 Plan(d): Subscription options | | Main executive officers(c) | | | 30 | | | | 370,040 | | | | 24.3 | % | | | 12,335 | | Decision of the Board on July 19, 2005 | | Other executive officers | | | 330 | | | | 574,140 | | | | 37.6 | % | | | 1,740 | | Exercise price:€198.90; discount: 0.0% | | Other employees | | | 2,361 | | | | 581,940 | | | | 38.1 | % | | | 246 | | Exercise price as of May 24, 2006:€49.04(a) | | Total | | | 2,721 | | | | 1,526,120 | | | | 100 | % | | | 561 | | 2006 Plan(d): Subscription options | | Main executive officers(c) | | | 28 | | | | 1,447,000 | | | | 25.3 | % | | | 51,679 | | Decision of the Board on July 18, 2006 | | Other executive officers | | | 304 | | | | 2,120,640 | | | | 37.0 | % | | | 6,976 | | Exercise price:€50.60; discount: 0.0% | | Other employees | | | 2,253 | | | | 2,159,600 | | | | 37.7 | % | | | 959 | | | | Total | | | 2,585 | | | | 5,727,240 | | | | 100 | % | | | 2,216 | | 2007 Plan(d)(e): Subscription options | | Main executive officers(c) | | | 27 | | | | 1,329,360 | | | | 22.8 | % | | | 49,236 | | Decision of the Board on July 17, 2007 | | Other executive officers | | | 298 | | | | 2,162,270 | | | | 37.1 | % | | | 7,256 | | Exercise price:€60.10; discount: 0.0% | | Other employees | | | 2,401 | | | | 2,335,600 | | | | 40.1 | % | | | 973 | | | | Total | | | 2,726 | | | | 5,827,230 | | | | 100 | % | | | 2,138 | | 2008 Plan(d)(e)(f): Subscription options | | Main executive officers(c) | | | 26 | | | | 1,227,500 | | | | 27.6 | % | | | 47,212 | | | Awarded on October 9, 2008, by decision of the Board of Directors on September 9, 2008 | | Other executive officers Other employees | |
| 298
1,690 |
| |
| 1,988,420
1,233,890 |
| |
| 44.7
27.7 | %
% | |
| 6,673
730 |
| Exercise price:€42.90; discount: 0.0% | | Total | | | 2,014 | | | | 4,449,810 | | | | 100 | % | | | 2,209 | | 2009 Plan(d)(e)(g): Subscription options | | Main executive officers(c) | | | 26 | | | | 1,201,500 | | | | 27.4 | % | | | 46,212 | | Decision of the Board on September 15, 2009 | | Other executive officers | | | 284 | | | | 1,825,540 | | | | 41.6 | % | | | 6,428 | | Exercise price:€39.90; discount: 0.0% | | Other employees | | | 1,742 | | | | 1,360,460 | | | | 31.0 | % | | | 781 | | | | Total | | | 2,052 | | | | 4,387,500 | | | | 100 | % | | | 2,138 | | 2010 Plan(d)(e): Subscription options | | Main executive officers(c) | | | 25 | | | | 1,348,100 | | | | 28.2 | % | | | 53,924 | | Decision of the Board on September 14, 2010 | | Other executive officers | | | 282 | | | | 2,047,600 | | | | 42.8 | % | | | 7,261 | | Exercise price:€38.20; discount: 0.0% | | Other employees | | | 1,790 | | | | 1,392,720 | | | | 29.0 | % | | | 778 | | | | Total | | | 2,097 | | | | 4,788,420 | | | | 100 | % | | | 2,283 | | 2011 Plan(d)(e): Subscription options | | Main executive officers(c) | | | 29 | | | | 846,600 | | | | 55.7 | % | | | 29,193 | | Decision of the Board on September 14, 2011 | | Other executive officers | | | 177 | | | | 672,240 | | | | 44.3 | % | | | 3,798 | | Exercise price:€33.00; discount: 0.0% | | Other employees | | | — | | | | — | | | | — | | | | — | | | | Total | | | 206 | | | | 1,518,840 | | | | 100 | % | | | 7,373 | |
| (a) | To take into account the spin-off of Arkema, pursuant to the provisions in effect on the date of the Shareholders’ Meeting on May 12, 2006, at its meeting of March 14, 2006, the Board of Directors resolved to adjust the rights of TOTAL stock options holders. For each plan and each holder, the exercise prices for TOTAL stock options were multiplied by 0.986147 and the number of unexercised stock options was multiplied by 1.014048 (and then rounded up), effective as of May 24, 2006. In addition, to take into account the four-for-one stock split approved by the Shareholders’ Meeting on May 12, 2006, the exercise price for stock options was divided by four and the number of unexercised stock options was multiplied by four. The presentation in this table of the number of options initially awarded has not been adjusted to reflect the four-for-one stock split. |
| (b) | Certain employees of the Elf Aquitaine group in 1998 also benefited from the vesting of Elf Aquitaine options awarded in 1998 subject to performance conditions related to the Elf Aquitaine group from 1998 to 2002. These Elf Aquitaine plans expired on March 31, 2005. |
| (c) | Members of the Management Committee and the Treasurer as of the date of the Board meeting awarding the options. Mr. Desmarest has not been a member of the Management Committee since February 14, 2007. Mr. Desmarest was awarded 110,000 options under the 2007 Expiry Plan and no options since 2008.
|
| (d) | The options are exercisable, subject to a presence condition, after a 2-year vesting period from the date of current termthe Board meeting awarding the options and expire eight years after this date. The underlying shares may not be transferred during the 4-year period from the date of office:
the Board meeting awarding the options (except for the 2008 Plan). The shareholders’presence condition states that the termination of the employment contract will result in the employee losing the right to exercise the options. |
| (e) | The 4-year transfer restriction period does not apply to employees of non-French subsidiaries as of the date of the grant, who may transfer the underlying shares after a 2-year period from the date of the grant. |
| (f) | For the 2008 Plan, the options acquisition rate, linked to the performance condition, was 60%. |
| (g) | For the 2009 Plan, the options acquisition rate, linked to the performance condition, was 100%. |
TOTAL STOCK OPTIONS AS OF DECEMBER 31, 2011 | | | | | | | | | | | | | | | | | | | | | | | | | | | | | | | | | | | | | | | | | | | | 2003 Plan | | | 2004 Plan | | | 2005 Plan | | | 2006 Plan | | | 2007 Plan | | | 2008 Plan | | | 2009 Plan | | | 2010 Plan | | | 2011 Plan | | | Total | | | Type of options | | Subscription
options | | | Subscription
options | | | Subscription
options | | | Subscription
options | | | Subscription
options | | | Subscription
options | | | Subscription
options | | | Subscription
options | | | Subscription
options | | | | | Date of the Shareholders’ Meeting | | | 05/17/2001 | | | | 05/14/2004 | | | | 05/14/2004 | | | | 05/14/2004 | | | | 05/11/2007 | | | | 05/11/2007 | | | | 05/11/2007 | | | | 05/21/2010 | | | | 05/21/2010 | | | | | | Grant date(a) | | | 07/16/2003 | | | | 07/20/2004 | | | | 07/19/2005 | | | | 07/18/2006 | | | | 07/17/2007 | | | | 10/09/2008 | | | | 09/15/2009 | | | | 09/14/2010 | | | | 09/14/2011 | | | | | | Total number of options awarded, including(b): | | | 11,741,224 | | | | 13,462,520 | | | | 6,104,480 | | | | 5,727,240 | | | | 5,937,230 | | | | 4,449,810 | | | | 4,387,500 | | | | 4,788,420 | | | | 1,518,840 | | | | 58,117,264 | | Directors(c) | | | 240,000 | | | | 240,000 | | | | 240,720 | | | | 400,720 | | | | 310,840 | | | | 200,660 | | | | 200,000 | | | | 240,000 | | | | 160,000 | | | | 2,232,940 | | — C. de Margerie | | | n/a | | | | n/a | | | | n/a | | | | 160,000 | | | | 200,000 | | | | 200,000 | | | | 200,000 | | | | 240,000 | | | | 160,000 | | | | 1,160,000 | | — C. Clément | | | n/a | | | | n/a | | | | n/a | | | | n/a | | | | n/a | | | | n/a | | | | n/a | | | | — | | | | — | | | | — | | — D. Boeuf | | | n/a | | | | — | | | | 720 | | | | 720 | | | | 840 | | | | 660 | | | | — | | | | n/a | | | | n/a | | | | 2,940 | | — T. Desmarest | | | 240,000 | | | | 240,000 | | | | 240,000 | | | | 240,000 | | | | 110,000 | | | | — | | | | — | | | | — | | | | n/a | | | | 1,070,000 | | Additional grant | | | — | | | | 24,000 | | | | 134,400 | | | | — | | | | — | | | | — | | | | — | | | | — | | | | — | | | | 158,400 | | Adjustments related to the spin-off of Arkema(d) | | | 163,180 | | | | 196,448 | | | | 90,280 | | | | — | | | | — | | | | — | | | | — | | | | — | | | | — | | | | 449,908 | | Date as of which the options may be exercised | | | 07/17/2005 | | | | 07/21/2006 | | | | 07/20/2007 | | | | 07/19/2008 | | | | 07/18/2009 | | | | 10/10/2010 | | | | 09/16/2011 | | | | 09/15/2012 | | | | 09/15/2013 | | | | | | Expiry date | | | 07/16/2011 | | | | 07/20/2012 | | | | 07/19/2013 | | | | 07/18/2014 | | | | 07/17/2015 | | | | 10/09/2016 | | | | 09/15/2017 | | | | 09/14/2018 | | | | 09/14/2019 | | | | | | Exercise price (€)(e) | | | 32.84 | | | | 39.30 | | | | 49.04 | | | | 50.60 | | | | 60.10 | | | | 42.90 | | | | 39.90 | | | | 38.20 | | | | 33.00 | | | | | | Cumulative number of options exercised as of December 31, 2011 | | | 11,068,508 | | | | 1,266,293 | | | | 38,497 | | | | 8,620 | | | | — | | | | 200 | | | | 1,080 | | | | 2,040 | | | | 9,400 | | | | | | Cumulative number of options canceled as of December 31, 2011 | | | 835,896 | | | | 322,151 | | | | 128,127 | | | | 95,114 | | | | 86,865 | | | | 113,912 | | | | 28,740 | | | | 86,337 | | | | 1,000 | | | | | | Number of options: | | | | | | | | | | | | | | | | | | | | | | | | | | | | | | | | | | | | | | | | | — outstanding as of January 1, 2011 | | | 5,734,444 | | | | 12,338,847 | | | | 6,178,856 | | | | 5,640,886 | | | | 5,866,445 | | | | 4,349,158 | | | | 4,371,890 | | | | 4,787,300 | | | | — | | | | 49,267,826 | | — awarded in 2011 | | | — | | | | — | | | | — | | | | — | | | | — | | | | — | | | | — | | | | — | | | | 1,518,840 | | | | 1,518,840 | | — canceled in 2011(f)(g) | | | (738,534 | ) | | | (28,208 | ) | | | (16,320 | ) | | | (17,380 | ) | | | (16,080 | ) | | | (13,260 | ) | | | (14,090 | ) | | | (85,217 | ) | | | (1,000 | ) | | | (930,089 | ) | — exercised in 2011 | | | (4,995,910 | ) | | | (216,115 | ) | | | — | | | | — | | | | — | | | | (200 | ) | | | — | | | | (2,040 | ) | | | (9,400 | ) | | | (5,223,665 | ) | — outstanding as of December 31, 2011 | | | — | | | | 12,094,524 | | | | 6,162,536 | | | | 5,623,506 | | | | 5,850,365 | | | | 4,335,698 | | | | 4,357,800 | | | | 4,700,043 | | | | 1,508,440 | | | | 44,632,912 | |
| (a) | The grant date is the date of the Board meeting calledawarding the options, except for the share subscription option plan of October 9, 2008, approved by the Board on September 9, 2008. |
| (b) | The number of options awarded before May 23, 2006, has been multiplied by four to take into account the four-for-one stock split approved by the Shareholders’ Meeting on May 12, 2006. |
| (c) | Options awarded to directors at the time of grant. |
| (d) | Adjustments approved by the Board at its meeting on March 14, 2006, pursuant to the provisions in effect at the time of the Board meeting and at the time of the Shareholders’ Meeting on May 12, 2006, related to the spin-off of Arkema. These adjustments were made on May 22, 2006 effective as of May 24, 2006. |
| (e) | Exercise price as of May 24, 2006. The exercise prices of TOTAL subscription shares under the plans in force at that date were multiplied by 0.25 to take into account the four-for-one stock split on May 18, 2006. Moreover, following the spin-off of Arkema, the exercise prices of TOTAL stock options under these plans were multiplied by an adjustment factor equal to 0.986147 effective as of May 24, 2006. The exercise prices effective before May 24, 2006 are given in Note 25, points A, B and C to the Consolidated Financial Statements. |
| (f) | Out of the 930,089 options canceled in 2011, 738,534 options that were not exercised expired due to the expiry of the 2003 subscription option plan on July 16, 2011. |
| (g) | The acquisition rate applicable to the subscription options that were subject to the performance condition of the 2009 Plan was 100%. |
If all the outstanding stock options as of December 31, 2011 were exercised, the corresponding shares would represent 1.85%(1)of the Company’s potential share capital as of such date. | (1) | Out of a total potential share capital of 2,408,400,225 shares. |
TOTAL STOCK OPTIONS AWARDED TO MAIN EXECUTIVE OFFICERS (MANAGEMENT COMMITTEE AND TREASURER) AS OF DECEMBER 31, 2011 | | | | | | | | | | | | | | | | | | | | | | | | | | | | | | | | | | | | | | | | | | | | 2003 Plan | | | 2004 Plan | | | 2005 Plan | | | 2006 Plan | | | 2007 Plan | | | 2008 Plan | | | 2009 Plan | | | 2010 Plan | | | 2011 Plan | | | Total | | | Type of options | | Subscription
options | | | Subscription
options | | | Subscription
options | | | Subscription
options | | | Subscription
options | | | Subscription
options | | | Subscription
options | | | Subscription
options | | | Subscription
options | | | | | Expiry date | | | 07/16/2011 | | | | 07/20/2012 | | | | 07/19/2013 | | | | 07/18/2014 | | | | 07/17/2015 | | | | 10/09/2016 | | | | 09/15/2017 | | | | 09/14/2018 | | | | 09/14/2019 | | | | | | Exercise price (€)(a) | | | 32.84 | | | | 39.30 | | | | 49.04 | | | | 50.60 | | | | 60.10 | | | | 42.90 | | | | 39.90 | | | | 38.20 | | | | 33.00 | | | | | | Options awarded by the Board(b) | | | 680,904 | | | | 848,800 | | | | 711,440 | | | | 851,240 | | | | 1,032,120 | | | | 1,138,300 | | | | 1,215,300 | | | | 1,406,400 | | | | 846,600 | | | | 8,731,104 | | Adjustments related to the spin-off of Arkema(c) | | | 8,988 | | | | 11,992 | | | | 10,048 | | | | — | | | | — | | | | — | | | | — | | | | — | | | | — | | | | 31,028 | | Options outstanding as of January 01, 2011 | | | 277,119 | | | | 757,792 | | | | 721,488 | | | | 851,240 | | | | 1,032,120 | | | | 1,059,901 | | | | 1,215,300 | | | | 1,406,400 | | | | | | | | 7,321,360 | | Options awarded in 2011 | | | — | | | | — | | | | — | | | | — | | | | — | | | | — | | | | — | | | | — | | | | 846,600 | | | | 846,600 | | Options exercised in 2011 | | | (277,119 | ) | | | — | | | | — | | | | — | | | | — | | | | — | | | | — | | | | — | | | | — | | | | (277,119 | ) | Options canceled in 2011 | | | — | | | | — | | | | — | | | | — | | | | — | | | | — | | | | — | | | | (59,000 | ) | | | — | | | | (59,000 | ) | Options outstanding as of December 31, 2011 | | | — | | | | 757,792 | | | | 721,488 | | | | 851,240 | | | | 1,032,120 | | | | 1,059,901 | | | | 1,215,300 | | | | 1,347,400 | | | | 846,600 | | | | 7,831,841 | |
| (a) | Exercise price as of May 24, 2006. The exercise prices of TOTAL subscription shares under the plans in force at that date were multiplied by 0.25 to take into account the four-for-one stock split on May 18, 2006. Moreover, following the spin-off of Arkema, the exercise prices of TOTAL stock options under these plans were multiplied by an adjustment factor equal to 0.986147 effective as of May 24, 2006. The exercise prices effective before May 24, 2006 are given in Note 25, points A, B and C to the Consolidated Financial Statements. |
| (b) | The number of options awarded before May 23, 2006, has been multiplied by four to take into account the four-for-one stock split approved by the Shareholders’ Meeting on May 12, 2006. |
| (c) | Adjustments approved by the Board at its meeting on March 14, 2006, pursuant to the provisions in effect at the time of the Board meeting and of the Shareholders’ Meeting on May 12, 2006, related to the spin-off of Arkema. These adjustments were made on May 22, 2006 effective as of May 24, 2006. |
As part of the 2007, 2008 and 2009 share subscription option plans, the Board of Directors decided that for each beneficiary of more than 25,000 options, one-third of the options awarded in excess of this number be subject to a performance condition. For the 2010 share subscription option plan, beneficiaries of more than 3,000 options are subject to a performance condition for part of the options (see “— Grants to the Chairman and Chief Executive Officer”). For the 2011 share subscription option plan, all of the options are subject to a performance condition. In addition, Mr. Clément, the director representing employee shareholders, has not exercised any option in 2011 and has not been awarded any share subscription options under the 2011 Plan. TOTAL STOCK OPTIONS AWARDED TO MR. DE MARGERIE, CHAIRMAN AND CHIEF EXECUTIVE OFFICER OF TOTAL S.A. | | | | | | | | | | | | | | | | | | | | | | | | | | | | | | | | | | | | | | | | | | | | 2003 Plan | | | 2004 Plan | | | 2005 Plan | | | 2006 Plan | | | 2007 Plan | | | 2008 Plan | | | 2009 Plan | | | 2010 Plan | | | 2011 Plan | | | Total | | | Type of options | | Subscription
options | | | Subscription
options | | | Subscription
options | | | Subscription
options | | | Subscription
options | | | Subscription
options | | | Subscription
options | | | Subscription
options | | | Subscription
options | | | | | Expiry date | | | 07/16/2011 | | | | 07/20/2012 | | | | 07/19/2013 | | | | 07/18/2014 | | | | 07/17/2015 | | | | 10/09/2016 | | | | 09/15/2017 | | | | 09/14/2018 | | | | 09/14/2019 | | | | | | Exercise price (€)(a) | | | 32.84 | | | | 39.30 | | | | 49.04 | | | | 50.60 | | | | 60.10 | | | | 42.90 | | | | 39.90 | | | | 38.20 | | | | 33.00 | | | | | | Options awarded by the Board(b) | | | 112,000 | | | | 128,000 | | | | 130,000 | | | | 160,000 | | | | 200,000 | | | | 200,000 | | | | 200,000 | | | | 240,000 | | | | 160,000 | | | | 1,530,000 | | Adjustments related to the spin-off of Arkema(c) | | | 1,576 | | | | 1,800 | | | | 1,828 | | | | — | | | | — | | | | — | | | | — | | | | — | | | | — | | | | 5,204 | | Options outstanding as of January 01, 2011 | | | 113,576 | | | | 129,800 | | | | 131,828 | | | | 160,000 | | | | 200,000 | | | | 176,667 | | | | 200,000 | | | | 240,000 | | | | — | | | | 1,351,871 | | Options awarded in 2011 | | | — | | | | — | | | | — | | | | — | | | | — | | | | — | | | | — | | | | — | | | | 160,000 | | | | 160,000 | | Options exercised in 2011 | | | (113,576 | ) | | | — | | | | — | | | | — | | | | — | | | | — | | | | — | | | | — | | | | — | | | | (113,576 | ) | Options canceled in 2011 | | | — | | | | — | | | | — | | | | — | | | | — | | | | — | | | | — | | | | — | | | | — | | | | — | | Options outstanding as of December 31, 2011 | | | — | | | | 129,800 | | | | 131,828 | | | | 160,000 | | | | 200,000 | | | | 176,667 | | | | 200,000 | | | | 240,000 | | | | 160,000 | | | | 1,398,295 | |
| (a) | Exercise price as of May 24, 2006. The exercise prices of TOTAL subscription shares under the plans in force at that date were multiplied by 0.25 to take into account the four-for-one stock split on May 18, 2006. Moreover, following the spin-off of Arkema, the exercise prices of TOTAL stock options under these plans were multiplied by an adjustment factor equal to 0.986147 effective as of May 24, 2006. The exercise prices effective before May 24, 2006 are given in Note 25, points A, B and C to the Consolidated Financial Statements (chapter 9). |
| (b) | The number of options awarded before May 23, 2006, has been multiplied by four to take into account the four-for-one stock split approved by the Shareholders’ Meeting on May 12, 2006. |
| (c) | Adjustments approved by the Board at its meeting on March 14, 2006, pursuant to the provisions in effect at the time of the Board meeting and of the Shareholders’ Meeting on May 12, 2006, related to the spin-off of Arkema. These adjustments were made on May 22, 2006 effective as of May 24, 2006. |
As part of the 2007 to 2011 Plans, the Board has made the grant of these options to the Chairman and Chief Executive Officer subject to performance conditions (see “— Grants to the Chairman and Chief Executive Officer”). For the 2009 Plan, the acquisition rate, linked to the performance conditions, was 100%. As of December 31, 2011, the outstanding options of the Chairman and Chief Executive Officer represented 0.058%(1) of the Company’s potential share capital as of such date. Mr. Desmarest, Chairman of the Board of Directors until May 21, 2010, was not awarded any share subscription options under the 2008, 2009, 2010 and 2011 plans. In addition, he was not awarded any performance shares under plans in the period 2005 to 2011. | (1) | Out of a total potential share capital of 2,408,400,225 shares. |
STOCK OPTIONS AWARDED TO THE TEN EMPLOYEES (OTHER THAN CORPORATE EXECUTIVE OFFICERS) RECEIVING THE LARGEST AWARDS/STOCK OPTIONS EXERCISED BY THE TEN EMPLOYEES (OTHER THAN CORPORATE EXECUTIVE OFFICERS) EXERCISING THE LARGEST NUMBER OF OPTIONS | | | | | | | | | | | | | | | | | | | | Total number of
options
awarded/exercised | | | Exercise price (€) | | | Grant date(a) | | | Expiry date | | Options awarded in 2011 to the ten employees of TOTAL S.A., or any company in the Group, receiving the largest number of options | | | 430,400 | | | | 33.00 | | | | 09/14/2011 | | | | 09/14/2019 | | Options exercised in 2011 by the ten employees of TOTAL S.A., or any company in the Group, exercising the largest number of options(b) | | | 227,671 | | | | 32.84 | | | | 07/16/2003 | | | | 07/16/2011 | | | | | 9,736 | | | | 39.30 | | | | 07/20/2004 | | | | 07/20/2012 | | | | | 237,407 | | | | 33.10 | (c) | | | | | | | | |
| (a) | The grant date is the date of the Board meeting awarding the options. |
| (b) | Exercise price as of May 24, 2006. The exercise prices of TOTAL stock options under the plans in force at that date were multiplied by 0.25 to take into account the four-for-one stock split on May 18, 2006. Moreover, following the spin-off of Arkema, the exercise prices of TOTAL stock options under these plans were multiplied by an adjustment factor equal to 0.986147 effective as of May 24, 2006. The exercise prices effective before May 24, 2006 are given in Note 25, points A, B and C to the Consolidated Financial Statements. |
| (c) | Weighted-average price. |
TOTAL GLOBAL FREE AND PERFORMANCE SHARE GRANTS TOTAL global free share plan In addition to the performance shares granted, the Board of Directors decided at its meeting on May 21, 2010, to implement a global free share plan intended for all the Group employees, that is, more than 100,000 employees. On June 30, 2010, rights to twenty-five free shares were granted to every employee. The shares are subject to a vesting period of two to four years depending on the case. The shares granted are not subject to any performance condition. Following the vesting period, the shares will be issued. Breakdown of TOTAL performance share grants The following table gives a breakdown of TOTAL performance share grants by category of beneficiary (main executive officers, other executive officers and other employees). | | | | | | | | | | | | | | | | | | | | | | | | Number of
beneficiaries | | | Number
of shares
awarded(a) | | | Percentage | | | Average
number of
shares per
beneficiary | | 2005 Plan(b) | | Main executive officers(c) | | | 29 | | | | 13,692 | | | | 2.4 | % | | | 472 | | Decision of the Board on July 19, 2005 | | Other executive officers | | | 330 | | | | 74,512 | | | | 13.1 | % | | | 226 | | | | Other employees(d) | | | 6,956 | | | | 481,926 | | | | 84.5 | % | | | 69 | | | | Total | | | 7,315 | | | | 570,130 | | | | 100 | % | | | 78 | | | | | | | | 2006 Plan(b) | | Main executive officers(c) | | | 26 | | | | 49,200 | | | | 2.2 | % | | | 1,892 | | Decision of the Board on July 18, 2006 | | Other executive officers | | | 304 | | | | 273,832 | | | | 12.0 | % | | | 901 | | | | Other employees(d) | | | 7,509 | | | | 1,952,332 | | | | 85.8 | % | | | 260 | | | | Total | | | 7,839 | | | | 2,275,364 | | | | 100 | % | | | 290 | | | | | | | | 2007 Plan(b) | | Main executive officers(c) | | | 26 | | | | 48,928 | | | | 2.1 | % | | | 1,882 | | Decision of the Board on July 17, 2007 | | Other executive officers | | | 297 | | | | 272,128 | | | | 11.5 | % | | | 916 | | | | Other employees(d) | | | 8,291 | | | | 2,045,309 | | | | 86.4 | % | | | 247 | | | | Total | | | 8,614 | | | | 2,366,365 | | | | 100 | % | | | 275 | | | | | | | | 2008 Plan(b) | | Main executive officers(c) | | | 25 | | | | 49,100 | | | | 1.8 | % | | | 1,964 | | | Awarded on October 9, 2008, by decision of the Board of Directors on September 9, 2008 | | Other executive officers | | | 300 | | | | 348,156 | | | | 12.5 | % | | | 1,161 | | | | Other employees(d) | | | 9,028 | | | | 2,394,712 | | | | 85.8 | % | | | 265 | | | | Total | | | 9,353 | | | | 2,791,968 | | | | 100 | % | | | 299 | | | | | | | | 2009 Plan(b) | | Main executive officers(c) | | | 25 | | | | 48,700 | | | | 1.6 | % | | | 1,948 | | Decision of the Board on September 15, 2009 | | Other executive officers | | | 284 | | | | 329,912 | | | | 11.1 | % | | | 1,162 | | | | Other employees(d) | | | 9,693 | | | | 2,593,406 | | | | 87.3 | % | | | 268 | | | | Total | | | 10,002 | | | | 2,972,018 | | | | 100 | % | | | 297 | | | | | | | | 2010 Plan(e) | | Main executive officers(c) | | | 24 | | | | 46,780 | | | | 1.6 | % | | | 1,949 | | Decision of the Board on September 14, 2010 | | Other executive officers | | | 283 | | | | 343,080 | | | | 11.4 | % | | | 1,212 | | | | Other employees(d) | | | 10,074 | | | | 2,620,151 | | | | 87.0 | % | | | 260 | | | | Total | | | 10,381 | | | | 3,010,011 | | | | 100 | % | | | 290 | | | | | | | | 2011 Plan | | Main executive officers(c) | | | 29 | | | | 184,900 | | | | 5.1 | % | | | 6,376 | | Decision of the Board on September 14, 2011 | | Other executive officers | | | 274 | | | | 624,000 | | | | 17.1 | % | | | 2,277 | | | | Other employees(d) | | | 9,658 | | | | 2,840,870 | | | | 77.8 | % | | | 294 | | | | Total | | | 9,961 | | | | 3,649,770 | | | | 100 | % | | | 366 | |
| (a) | The number of performance shares awarded shown in this table has not been adjusted to take into account the four-for-one stock split approved by the Shareholders’ Meeting on May 12, 2006. |
| (b) | For the 2005, 2006, 2007 and 2009 Plans, the acquisition rates of the shares awarded, linked to the performance conditions, were 100%. For the 2008 Plan, the acquisition rate, linked to the performance condition, was 60%. |
| (c) | Members of the Management Committee and the Treasurer as of the date of the Board meeting granting the performance shares. The Chairman of the Board and the Chief Executive Officer were not awarded any performance shares, with the exception of the 2011 Plan. On September 14, 2011, the Board of Directors of TOTAL S.A. decided to grant 16,000 performance shares to Mr. de Margerie. |
| (d) | Mr. Clément, employee of Total Raffinage Marketing, a subsidiary of TOTAL S.A. and the director of TOTAL S.A. representing employee shareholders, was awarded 320 performance shares under the 2005 Plan, 200 performance shares under the 2007 Plan, 500 performance shares under the 2008 Plan, 240 performance shares under the 2010 Plan and 240 performance shares under the 2011 Plan. |
| (e) | Excluding free shares granted as part of the 2010 global free share plan. |
The grant of these performance shares, which were bought back by the Company on the market, will become final after a 2-year vesting period. This final grant is subject to a presence condition and a performance condition (see “— Stock options and performance share grants policy — General policy”). Moreover, the transfer of the performance shares will not be permitted until the end of a 2-year mandatory holding period. PERFORMANCE SHARE PLANS AS OF DECEMBER 31, 2011 | | | | | | | | | | | | | | | | | | | | | | | | | | | | | | | | 2005 Plan(a) | | | 2006 Plan | | | 2007 Plan | | | 2008 Plan | | | 2009 Plan | | | 2010 Plan | | | 2011 Plan | | Date of the Shareholders’ Meeting | | | 05/17/2005 | | | | 05/17/2005 | | | | 05/17/2005 | | | | 05/16/2008 | | | | 05/16/2008 | | | | 05/16/2008 | | | | 05/13/2011 | | Grant date(b) | | | 07/19/2005 | | | | 07/18/2006 | | | | 07/17/2007 | | | | 10/09/2008 | | | | 09/15/2009 | | | | 09/14/2010 | | | | 09/14/2011 | | Closing price on grant date(c) | | | €52.13 | | | | €50.40 | | | | €61.62 | | | | €35.945 | | | | €41.615 | | | | €39.425 | | | | €32.69 | | Average repurchase price per share paid by the Company | | | €51.62 | | | | €51.91 | | | | €61.49 | | | | €41.63 | | | | €38.54 | | | | €39.11 | | | | €39.58 | | Total number of performance shares awarded, including to | | | 2,280,520 | | | | 2,275,364 | | | | 2,366,365 | | | | 2,791,968 | | | | 2,972,018 | | | | 3,010,011 | | | | 3,649,770 | | —Directors(d) | | | 416 | | | | 416 | | | | 432 | | | | 588 | | | | — | | | | 240 | | | | 16,240 | | —Ten employees with largest grants(e) | | | 20,000 | | | | 20,000 | | | | 20,000 | | | | 20,000 | | | | 20,000 | | | | 20,000 | | | | 91,400 | | Start of the vesting period: | | | 07/19/2005 | | | | 07/18/2006 | | | | 07/17/2007 | | | | 10/09/2008 | | | | 09/15/2009 | | | | 09/14/2010 | | | | 09/14/2011 | | Date of final grant, subject to specific condition (end of the vesting period) | | | 07/20/2007 | | | | 07/19/2008 | | | | 07/18/2009 | | | | 10/10/2010 | | | | 09/16/2011 | | | | 09/15/2012 | | | | 09/15/2013 | | Transfer possible from (end of the mandatory holding period) | | | 07/20/2009 | | | | 07/19/2010 | | | | 07/18/2011 | | | | 10/10/2012 | | | | 09/16/2013 | | | | 09/15/2014 | | | | 09/15/2015 | | Number of performance shares: | | | | | | | | | | | | | | | | | | | | | | | | | | | | | — Outstanding as of January 1, 2011 | | | — | | | | — | | | | — | | | | — | | | | 2,954,336 | | | | 3,000,637 | | | | — | | —Awarded in 2011 | | | — | | | | — | | | | — | | | | | | | | — | | | | — | | | | 3,649,770 | | —Canceled in 2011 | | | 800 | (g) | | | 700 | (g) | | | 792 | (g) | | | 356 | (g) | | | (26,214 | ) | | | (10,750 | ) | | | (19,579 | ) | —Finally granted in 2011(f) | | | (800 | )(g) | | | (700 | )(g) | | | (792 | )(g) | | | (356 | )(g) | | | (2,928,122 | ) | | | (1,836 | ) | | | — | | —Outstanding as of December 31, 2011 | | | — | | | | — | | | | — | | | | — | | | | — | | | | 2,988,051 | | | | 3,630,191 | |
| (a) | The number of performance shares awarded has been multiplied by four to take into account the four-for-one stock split approved by TOTAL Shareholders’ Meeting on May 12, 2006. |
| (b) | The grant date is the date of the Board meeting awarding the performance share grant, except for the performance shares awarded on October 9, 2008, approved by the Board on September 9, 2008. |
| (c) | To take into account the four-for-one stock split in May 18, 2006, the closing price for TOTAL shares on July 19, 2005 (€208.50) has been divided by four. |
| (d) | Mr. Desmarest, Chairman of the Board of Directors of TOTAL S.A. until May 21, 2010, and Mr. de Margerie, Chief Executive Officer since February 13, 2007 and Chairman and Chief Executive Officer since May 21, 2010, were not awarded performance shares under the plans approved by the Board of Directors of TOTAL S.A. on July 18, 2006, July 17, 2007, September 9, 2008, September 15, 2009 and September 14, 2010. Furthermore, Mr. Desmarest was not awarded performance shares under the plan approved by the Board of Directors of TOTAL S.A. on July 19, 2005. On September 14, 2011, the Board of Directors of TOTAL S.A. decided to grant 16,000 performance shares to Mr. de Margerie. In addition, Mr. Boeuf, director of TOTAL S.A. representing employee shareholders until December 31, 2009, was awarded performance shares under the plans approved by the Board of Directors of TOTAL S.A. on July 19, 2005, July 18, 2006, July 17, 2007 and September 9, 2008. Mr. Boeuf was not awarded any performance shares under the plan approved by the Board of Directors of TOTAL S.A. on September 15, 2009. |
| Mr. Clément, director of TOTAL S.A. representing employee shareholders since May 21, 2010, was awarded 240 performance shares under the plan approved by the Board of Directors of TOTAL S.A. on September 14, 2011. In addition, Mr. Clément was awarded 240 performance shares under the plan approved by the Board of Directors of TOTAL S.A. on September 14, 2010. |
| (e) | NOEmployees of TOTAL S.A., or of any Group company, who were not directors of TOTAL S.A. as of the date of grant. |
| (f) | For the 2010 Plan, final grants following the death of the beneficiary. |
| (g) | Performance shares finally awarded for which the entitlement right had been canceled erroneously. |
In case of a final grant of the outstanding performance shares as of December 31, 2011, the corresponding shares would represent 0.27%(1) of the Company’s potential share capital as of such date. | (1) | Out of a total potential share capital of 2,408,400,225 shares. |
FOLLOW-UP OF THE GLOBAL FREE SHARE PLAN | | | | | | | | | | | | | | | | 2010 Plan
(2+2)(b) | | | 2010 Plan
(4+0)(c) | | | Total | | Date of the Shareholders’ Meeting | | | 05/16/2008 | | | | 05/16/2008 | | | | | | Grant date(a) | | | 06/30/2010 | | | | 06/30/2010 | | | | | | Final grant date | | | 07/01/2012 | | | | 07/01/2014 | | | | | | Transfer possible from | | | 07/01/2014 | | | | 07/01/2014 | | | | | | Outstanding as of January 1, 2010 | | | | | | | | | | | | | Awarded | | | 1,508,850 | | | | 1,070,650 | | | | 2,579,500 | | Canceled | | | (125 | ) | | | (75 | ) | | | (200 | ) | Finally granted(d) | | | (75 | ) | | | | | | | (75 | ) | Outstanding as of January 1, 2011 | | | 1,508,650 | | | | 1,070,575 | | | | 2,579,225 | | Awarded | | | — | | | | — | | | | — | | Canceled | | | (29,175 | ) | | | (54,625 | ) | | | (83,800 | ) | Finally granted(d) | | | (475 | ) | | | (425 | ) | | | (900 | ) | Outstanding as of December 31, 2011 | | | 1,479,000 | | | | 1,015,525 | | | | 2,494,525 | |
| (a) | The June 30, 2010 grant was decided by the Board of Directors on May 21, 2010. |
| (b) | Vesting period of two years followed by a holding period of two years. |
| (c) | Vesting period of four years without a holding period. |
| (d) | Final grant following the death or disability of the beneficiary of the shares. |
In case of a final grant of the outstanding shares as of December 31, 2011, the corresponding shares would represent 0.10%(1) of the Company’s potential share capital as of such date. PERFORMANCE SHARE GRANTS TO THE TEN EMPLOYEES (OTHER THAN CORPORATE EXECUTIVE OFFICERS) RECEIVING THE LARGEST NUMBER OF PERFORMANCE SHARES | | | | | | | | | | | | | | | | | | | YESNumber of
performance shares
granted/finally
awarded
(termination benefit
| | | Grant date | | | Date of
final grant
(end of
vesting
period) | | | End of
mandatory
holding
period | | )Performance share grants approved by the Board meeting on September 14, 2011 to the ten TOTAL S.A. employees (other than corporate executive officers) receiving the largest number of performance shares(b)(a)
| | NO | 91,400 | | YES
| | 09/14/2011 | | | | 09/15/2013 | | | | 09/15/2015 | | (retirement benefit)(b) (supplementary pensionPerformance shares finally awarded in 2011 following the performance share plan also applicableapproved by the Board meeting on September 15, 2009, to some Group employees)the ten employees (other than corporate executive officers) at the time of such approval receiving the largest number of performance shares(b)
| | | 20,000 | | | | 09/15/2009 | | | | 09/16/2011 | | | | 09/16/2013 | |
| (a) | ChairmanGrant approved by the Board on September 14, 2011. Grants of these performance shares will become final, subject to a performance condition, after a 2-year vesting period (i.e., on September 15, 2013) (see “— Stock options and Chief Executive Officer until February 13, 2007, and Chairmanperformance share grants policy — General policy”). Moreover, the transfer of the Boardperformance shares will not be permitted until the end of Directors from February 14, 2007.a 2-year mandatory holding period (i.e., on September 15, 2015). |
| (b) | PaymentThis final grant is subject to a performance condition in accordance with the decision(see “— Stock options and performance share grants policy — General policy”). The acquisition rate of the Boardshares awarded, linked to the performance condition, was 100%. Moreover, the transfer of Directors on February 11, 2009.the performance shares finally awarded will only be permitted after the end of a 2-year mandatory holding period (i.e., from September 16, 2013). |
| (1) | Out of a total potential share capital of 2,408,400,225 shares. |
Corporate GovernanceCORPORATE GOVERNANCE
For several years, TOTAL has been actively examining corporate governance matters. At its meeting on November 4, 2008, the Board of Directors confirmed its decision to userefer to the Corporate Governance Code for Listed Companies published in 2008 by the principal French business confederations, theAssociation Française des Entreprises Privées (AFEP) and theMouvement des Entreprises de France (MEDEF) (the “AFEP-MEDEF(“AFEP-MEDEF Code”) as its reference for corporate governance matters. The Company’s corporate governance practices differ from the recommendations contained in the AFEP-MEDEF Code onwas amended in April 2010 to make recommendations related to the following limited matters: balanced number of men and women sitting in Board and Committees’ meetings. The AFEP-MEDEF Codecode recommends that a director no longertarget of at least 20% of women be considered as independent uponreached before April 2013 and at least 40% before April 2016. These requirements were also stipulated in the expiryFrench law of January 27, 2011 regarding balanced representation of men and women on Boards of Directors and Supervisory Boards and equal opportunity. The law states that the 20% threshold must be attained at the end of the 2014 Shareholders’ Meeting and that the 40% threshold must be attained at the end of the 2017 Shareholders’ Meeting. As of December 31, 2011, the Company’s Board of Directors was comprised of four women out of a total of fifteen members (i.e., 26%). At the Shareholders’ Meeting in May 2012, it will be proposed to appoint one additional woman to replace one director whose term is coming to an end. If the resolution is approved by the Shareholders’ Meeting, the proportion of office during which the length of his servicewomen sitting on the board reaches 12 years.Board will be one-third. The Board has not followed this recommendationof Directors will keep examining corporate governance issues to keep diversifying in regardsthe years to one ofcome. At its members,meeting on February 8, 2012, the Nominating & Governance Committee examined current practices in considerationthe Company in view of the experienceAFEP-MEDEF code and authorityconcluded that the Company complied with almost all the recommendations. Mr. Thierry Desmarest, Honorary Chairman of which thisthe Company and director, is in possession, which reinforce | his independence and contribute to the Board’s work.
|
The Chairmancan still be entrusted with representative missions for the Group, by decision of the Board of Directors chairs the Nominating & Governance Committee of the Board. The Board of Directors and this Committee consider that the participation of the Chairman on the Nominating & Governance Committee enables the Committee to benefit from his experience and his knowledge of the Company’s activities, environment and executive teams, which is particularly useful to inform the Committee’s deliberations concerning the appointment of executives and directors. The fact that the Chairman of the Board, who does not exercise executive duties, chairs the committee permits close collaboration between the Board and the Committee, the latter being responsible for the review of the Board’s workings and corporate governance matters. This committee is comprised of a majority of independent directors and the Chairman and the Chief Executive Officer do not attend deliberations concerning their own situation.
Pursuant to the AFEP-MEDEF Code, on February 11, 2009, the Board of Directors noted that, effective from the same day, the employment contracts of its Chairman and its Chief Executive Officer had been terminated.May 21, 2010.
Since 2004, the Board of Directors has had a financial codeFinancial Code of ethicsEthics that, in the overall context of the Group’s Code of Conduct, sets forth specific rules for its Chairman, Chief Executive Officer, Chief Financial Officer, Chief Accounting Officer and the financial and accounting officers for its principal activities. The Board has made the Audit Committee responsible for implementing and ensuring compliance with this code. In 2005, the Board approved the procedure for alerting the Audit Committee of complaints or concerns regarding accounting, internal accounting controls or auditing matters. Rules of Procedureprocedure of the Board of Directors At its meeting on February 13, 2007, the Board of Directors adopted Rulesrules of Procedureprocedure to replace the Directors’ Charter and to take into account the separation of the positions of Chairman of the Board and Chief Executive Officer implemented at the same meeting.Charter. The Board’s Rulesrules of Procedureprocedure specify the obligations of each director and set forth the mission and working procedures of the Board of Directors. They also define the respective responsibilities and authority of the Chairman and of the Chief Executive Officer. It is reviewed on a regular basis to match the changes in rules and practices related to governance. An unabridged version of these rules of procedure, which were approved by the Board of Directors of TOTAL S.A.(1), is available herein. Mission of the Board of Directors The principalmission of the Board of Directors is to determine the strategic direction of the Group and supervise the implementation of this vision. With the exception of the powers and authority expressly reserved for shareholders and within the limits of the Company’s legal purpose, the Board may address any issue related to the operation of the Company and take any decision concerning the matters coveredfalling within its purview. Within this framework, the Board’s duties and responsibilities include, but are not limited to, the following: | • | | appointing the Chairman and the Chief Executive Officer(2) and supervising the handling of their responsibilities; |
defining the Company’s strategic orientation and, more generally, that of the Group; | (1) | In these rules of procedure, TOTAL S.A. is referred to as the “Company” and, collectively with all of its direct and indirect subsidiaries, as the “Group”. |
| (2) | The Chairman and Chief Executive Officer, if the Chairman of the Board of Directors is also responsible for the general management of the Company, the Chairman of the Board of Directors and the Chief Executive Officer, if this is not the case, and, where appropriate, any acting Managing Directors, in accordance with the organization adopted by the Board of Directors. |
approving investments or divestments under study by the RulesGroup that concern amounts greater than 3% of Procedureshareholders’ equity; reviewing information on significant events related to the Company’s affairs, in particular for investments or divestments that are summarized below.greater than 1% of shareholders’ equity; Each director undertakesconducting audits and investigations as it may deem appropriate. The Board, with the assistance of the Audit Committee where appropriate, ensures that:
| – | | the proper definition of authority within the Company and the proper exercise of duties and responsibilities by the bodies of the Company are in place; |
| – | | no individual is authorized to contract on behalf of the Company or to commit to pay, or to make payments, on behalf of the Company, without proper supervision and control; |
| – | | the internal control function operates properly and that the statutory auditors are able to conduct their audits under appropriate circumstances; |
| – | | the committees it has created duly perform their responsibilities; |
monitoring the quality of the information provided to maintain the independenceshareholders and the financial markets through the financial statements that it approves and the annual reports, or when major transactions are conducted; convening and setting the agenda for Shareholders’ Meetings or meetings of his analysis, judgment, decision making and actions as well as notbondholders; preparing, for each year, a list of the directors it deems to be unduly influenced. independent under generally recognized corporate governance criteria. Directors’ obligations Before accepting a directorship, every candidate receives a copy of TOTAL S.A.’s by-laws and rules of procedure. He ensures that he has broad knowledge of the general and particular commitments related to his duty, especially the laws and regulations governing directorships in French limited liability companies (société anonyme) whose shares are listed in one or several regulated markets. Accepting a directorship involves upholding the Directors’ ethical rules as described in the Code of Corporate Governance to which the Company refers. It also involves upholding the rules of procedure and the Group’s values as described in its Code of Conduct. When a director participatesdirectors participate in and votesvote at Board meetings, he isthey are required to represent the interest of the shareholders and the Company as a whole. Independence of judgment: Directors must actively participate inundertake, under any circumstance, to maintain the affairsindependence of thetheir analysis, judgment, decision making and actions as well as not to be unduly influenced, directly or indirectly, by other directors, particular groups of shareholders, creditors, suppliers and, more generally, any third party. Preparation of each Board specifically on the basis of information communicated to them by the Company. meeting: Directors undertake to devote the amount of time required to consider the information they are given and otherwise prepare for meetings of the Board and of the committees on which they sit. Directors may request any additional information that they feel is necessary or useful from the Chairman or theand Chief Executive Officer. A director,Directors, if he considersthey consider it necessary, may request training on the Company’s specificities, businesses and activities. activities, and any other training that is of use in the exercise of their duties as Directors. Directors participate inattend all Board meetings and all committees or shareholders’ meetings,Shareholders’ Meetings, unless they have previously contacted the Chairman to inform him of scheduling conflicts. Files reviewed at each meeting of the Board as well as the information collected before or during the meetings are confidential. Directors cannot use them for or share them with a third party whatever the reason. Directors take any necessary measures to keep them confidential. Confidentiality and privacy are lifted when such information is made publicly available by the Company. Each directorThe Chairman of the Board makes sure that the Company provides the directors with the relevant information, including criticisms, in particular financial statement reports and press releases, and the main press articles about the Company.
Duty of loyalty: Directors cannot take advantage of their office or duties to ensure, for themselves or a third party, any monetary or non-monetary benefit. They notify the Board of Directors of any potential conflicts of interest with the Company or any other company of the Group. They refrain from participating in the vote relating to the corresponding resolution or even to the debate preceding the vote. Directors must inform the Board of conflictsDirectors of interesttheir entering into a transaction that involves directly the Company or any other company of the Group before such transaction is closed. Directors cannot take any responsibility in a personal capacity in companies or businesses that are competing with the Company or any other company of the Group without previously informing the Board. Directors are committed not to seek or accept directly or indirectly from the Company or any other company of the Group benefits that may arise, including the nature and termsbe considered as compromising their independence. Duty of any proposed transactionsexpression: Directors are committed to clearly expressing their opposition if they deem that could give rise to such situations. If he is opposed to a project brought beforedecision made by the Board heof Directors is contrary to the Company’s corporate interest and should strive to convince the Board of the relevancy of their position. Company’s securities and stock exchange rules: While in office, directors are required to clearly express his opposition. He is required to own at least 1,000 companyhold the minimum number of registered shares in registered form (withas set by the exception of the director representing employee shareholders, for whom the requirements are more flexible) and comply strictly with provisions regarding the use of material non-public information. The requirement to hold a minimum of 1,000 shares while in office is accepted by each director as a restriction on his ability to freely dispose of these shares.Company’s by-laws. In addition to stipulating thatDirectors refrain from trading any shares and ADRs of TOTAL S.A. and its publicly traded subsidiaries held byfor which they hold non-public information that could impact the securities’ market value. To this purpose, directors are to be heldact in registered form,compliance with the Rules of Procedure prohibit following procedures:
| • | | any shares and ADRs of TOTAL S.A. and its publicly traded subsidiaries are to be held in registered form, either with the Company or its agent(1), or administered registered shares with a French broker (or U.S. broker for ADRs) whose contact details are communicated to the Board’s Secretary by the director; |
buying on margin or short selling (Paris option market (MONEP), warrants, exchangeable obligations, etc.) those same securities. Theysecurities is also prohibit trading shares of TOTAL S.A.prohibited; any transaction on the dates ofTOTAL share (or ADR) is strictly prohibited, including hedging transactions, on the Company’sday when the Company discloses its periodic earnings announcements,(quarterly, interim and annual) as well as the 15fifteen calendar days preceding such dates.date; and | • | | directors make all necessary arrangements to declare to the French Financial Markets Authority (Autorité des marchés financiers) and inform the Board’s secretary, under the form and timeframe provided for by applicable laws, of any transaction on the company’s securities entered into by himself or any other individual with whom he is closely related. |
TheBoardWorkings of Directors’ mission is to determine the strategic direction of the Group and supervise the implementation of this vision.
With the exception of the powers and authority expressly reserved for shareholders and within the limits of the Company’s legal purpose, the Board may address any issue related to the operation of the Company and take any decision concerning the matters falling within its purview.
Within this framework, the Board’s duties and responsibilities include, but are not limited to, the following:
appointing the Chairman and the Chief Executive Officer and supervising the handling of their responsibilities;
defining the Company’s strategic orientation and, more generally, that of the Group;
approving investments or divestments under study by the Group that concern amounts greater than 3% of shareholders’ equity, whether or not the project is part of the announced strategy;
reviewing information on significant events related to the Company’s affairs, in particular for investments or divestments that are greater than 1% of shareholders’ equity;
monitoring the quality of information supplied to shareholders and the financial markets through the financial statements that it approves and the annual reports, or when major transactions are conducted;
convening and setting the agenda for shareholders’ meetings;
preparing, for each year, a list of the directors it deems to be independent under generally recognized corporate governance criteria; and
conducting audits and investigations as it may deem appropriate.
The Board, with the assistance of its specialized committees where appropriate, ensures that:
authority within the Company has been properly delegated before it is exercised, and that the various entities of the Company respect the authority, duties and responsibilities they have been given;
no individual is authorized to contract on behalf of the Company or to commit to pay, or to make payments, on behalf of the Company, without proper supervision and control;
the internal control function operates properly and that the statutory auditors are able to conduct their audits under appropriate circumstances; and
the committees it has created duly perform their responsibilities.
The Board of Directors is regularly informed, through the Audit Committee, of the Group’s financial position, cash position and obligations.
Board of Directors’ activity:
The Board of Directors meets at least four times a year and as often as circumstances may require. Before each meeting of the Board, the agenda is sent out to directors and, whenever possible, it is sent together with the documents that are necessary to consider. Directors are generally given written notice eight days priorcan delegate their authority to Board meetings. Documents to be considered for decisions to be madeanother director at Boardthe meetings are, when possible, sent with the notice of meetings, or otherwise delivered to the directors. The minutes of the previousBoard, within the limit of one delegation per director per meeting. Whenever authorized by the law, those directors attending the meeting are expressly approved at eachof the Board meeting. Directors may participate in meetings either by being present, by being represented by another director or via video conference (in compliance with the technical requirements set by applicable regulations). are considered present for the calculation of the quorum and majority.
The Board may establish specialized committees, whether permanent or ad hoc, as required by applicable legislation or as it may deem appropriate. The Board allocates directors’ fees to, and may allocate additional directors’ fees to, directors who participate on specialized committees within the total amount established by the shareholders.Shareholders’ Meeting. The Chairman and the Chief Executive Officer are not awarded directors’ fees for their work on the Board and Committees.
The Board of Directors, based on the recommendation of its Chairman, appoints a Secretary. Every member of the Board of Directors can refer to the Secretary and benefit from his assistance. The Secretary is responsible for the working procedures of the Board of Directors. The Board shall review such procedures periodically. The Board conducts, at regular intervals not to exceed three years, an assessment of its practices. It alsoSuch assessment is carried out possibly under the supervision of an independent director or with the contribution of an outside counsel. In addition, the Board of Directors conducts an annual discussion of its methods. Responsibility and authority of the Chairman:Chairman The Chairman represents the Board, and, except inunder exceptional circumstances, is the sole member authorized to act and speak on behalf of the Board. He is responsible for organizing and presiding over the Board’s activities and monitors corporate bodies to ensure that they are functioning effectively and respecting corporate governance principles. He coordinates the activity of the Board and its committees. He sets the agenda for the meeting by including the issues proposed by the Chief Executive Officer. He ensures that directors have in due course clear and appropriate information that is necessary to carry out their duties. He is responsible, with the Group’s general management, for maintaining relations between the Board and the Company’s shareholders. He monitors the quality of the information disclosed by the Company. In close cooperation with the Group’s general management, he may represent the Group in high levelhigh-level discussions with government authorities and the Group’s important partners, on both a national and international level. | (1) | Currently, BNP Paribas Securities Services for TOTAL shares and Bank of New York for TOTAL ADRs. |
He is regularly informed by the Chief Executive Officer of events and situations that are important for the Group relating to the strategy, organization, monthly financial reporting, major investment and divestment projects and major financial operations. He may request that the Chief Executive Officer or other Company directors, provided the Chief Executive Officer is informed, provide any useful information for the Board or its committees. committees to carry out their duties. He may also work with the statutory auditors to prepare matters before the Board or the Audit Committee. He presents every year in a report to the Shareholders’ Meeting, practices of the Board of Directors and potential limits set by the Board of Directors concerning the powers of the Chief Executive Officer. For this purpose, he receives from the Chief Executive Officer the relevant information. Authority of the Chief Executive Officer:Officer The Chief Executive Officer is responsible for the general management of the Company. He chairs the Group’s Executive Committee and Management Committee. Subject to the Company’s corporate governance rules and in particular the rules of procedure of the Board of Directors, he has the full extent of authority to act on behalf of the Company in all instances, with the exception of actions that are, by law, reserved to the Board of Directors or to shareholders’Shareholders’ meetings. He The Chief Executive Officer is responsible for periodic reporting of the Group’s results and outlook to shareholders and the financial community. He At each meeting of the Board, the Chief Executive Officer reports on significant Group activities to the Board.highlights of the Group’s activity. Committees of the Board of Directors The Board of Directors has three specialized committees:approved the creation of: an Audit Committee, the Compensation Committee, and theCommittee; a Nominating & Governance Committee; a Compensation Committee; and The missions and composition of these committees are defined in their relevant rules of procedure approved by the Board of Directors. The Committees carry out their duty for and report to the Board of Directors. Each committee reports on its activities to the Board of Directors. Audit CommitteeCommittees of the Board of Directors
The Audit Committee’s role is to assistCommittees of the Board of Directors are: an Audit Committee; a Nominating & Governance Committee; a Compensation Committee; and a Strategic Committee. On April 28, 2011, the Board agreed in ensuring effectiveprinciple on the creation of a new Strategic Committee, the composition and rules of which it approved at its meeting on July 28, 2011. This Committee was set up and met for the first time on September 14, 2011. The composition and an unabridged version of the rules of procedures of the Committees of the Board of Directors is available herein. Audit Committee Rules of procedure (unabridged version) The Board of Directors of TOTAL S.A. (hereafter referred to as the “Company” and, collectively with all its direct and indirect subsidiaries, as the “Group”) has approved the following rules of procedure of the Company’s Audit Committee (hereafter, the “Committee”). The members of the Committee are directors of the Company and therefore uphold the rules of procedure of the Board of Directors of TOTAL S.A. Mission:To allow the Board of Directors of TOTAL S.A. to ensure that internal control is effective and oversight over financial reportingthat published information available to shareholders and financial markets is reliable, the financial markets. The Audit Committee’s duties of the Committee include: recommending the appointment of statutory auditors and their compensation, ensuring their independence and monitoring their work; establishing the rules for the use of statutory auditors for non-audit services and verifying their implementation; supervising the audit by the statutory auditors of the Company’s statutory financial statements and consolidated financial statements; examining the accounting policies used to prepare the financial statements and examining the parent company’s annualCompany’s statutory financial statements and the consolidated annual, semi-annual, and quarterly financial statements prior to their examination by the Board of Directors, after regularly monitoring the financial situation, cash position and obligations of the Company; supervising the implementation of internal control and risk management procedures and their effective application, with the assistance of the internal audit department; supervising procedures for preparing financial information; monitoring the implementation and activities of the disclosure committee, including reviewing the conclusions of this committee; reviewing the annual work program of internal and external auditors; receiving information periodically on completed audits and examining annual internal audit reports and other reports (statutory auditors, annual reports,report, etc.); reviewing the choice of appropriate accounting principles and methods; reviewing the Group’s policy for the use of derivative instruments; reviewing, if requested by the Board of Directors, major transactions contemplated by the Group; reviewing significant litigation annually; implementing and monitoring compliance with the financial code of ethics; proposing to the Board of Directors, for implementation, a procedure for complaints or concerns of employees, shareholders and others, related to accounting, internal accounting controls or auditing matters, and monitoring the implementation of this procedure; and reviewing the procedure for booking the Group’s proved reserves. Audit Committee membership and practices
Composition:The Committee is made up of at least three directors designated by the Board of Directors. Members must be independent directors. In selecting the members of the Committee, the Board of Directors pays particular attention to their independence and their financial and accounting qualifications. The Board of Directors appoints one of the members of the Committee to serve as the financial expert on the Committee. Members of the Committee may not be executive officers of the Company or one of its subsidiaries, nor own more than 10% of the Company’s shares, whether directly or indirectly, individually or acting together with another party. Members of the Audit Committee may not receive from the Company and its subsidiaries, whethereither directly or indirectly, any compensation other than: (i) directors’ fees paid for their services as directors or as members of the Audit Committeecommittee, or, if applicable, as members of another committee of the Company’s Board; and (ii) compensation and pension benefits related to prior employment by the Company, or another Group company, which are not dependent upon future work or activities. The term of office of the members of the Committee coincides with the term of their appointment as director. The term of office as a member of the Committee may be renewed at the same time as the appointment as director. However, the Board of Directors can change the composition of the Committee at any time. Organization of activities:The Committee appoints its own Chairman. The Chairman appoints the Committee secretary, who may be the Chief Financial Officer. Officer of the Company. The Committee deliberates when at least one-half of its members are present. A member of the Committee cannot be represented. The Committee meets at least four times a year to examinereview the consolidated annual and quarterly consolidated financial statements.statements, and at the request of its Chairman, at least one-half of its members, the Chairman of the Board of Directors or the Chief Executive Officer of the Company. The Committee Chairman prepares the schedule of its meetings. The Audit Committee may meet with the Chairman of the Board, the Chief Executive Officer, and, if applicable, any acting Managing Director of the Company and perform inspections and consult with managers of operating or non-operating departments, as may be useful in performing its duties. The Chairman of the committee gives prior notice of such meeting to the Chairman of the Board or, if the latter is not the Chief Executive Officer, to both the Chairman of the Board of Directors and the Chief Executive Officer. In particular, the Committee is authorized to consult with those involved in preparing or auditing the financial statements (Chief Financial Officer and principal Finance Department managers, Audit Department, Legal Department) by asking the Company’s Chief Financial Officer to call them to a meeting. The Committee meetsconsults with the statutory auditors and examines their work, and may do soauditors. It has the capacity of consulting them without management being present. Company representatives attending. If it is informed of a substantial irregularity, it recommends that the Board of Directors take all appropriate action. If it deems it necessary to accomplish its duties, the Committee may request from the Board of Directors the resources to engage external consultants. The proposals made by the Committee to the Board of Directors are adopted by a majority of the members present at the Committee meeting. The Chairman of the Committee casts the deciding vote if an even number of members is present at the meeting. The Committee can adopt proposals intended for the Board of Directors without meeting if all the members of the Committee so agree and sign each proposal. A written summary of Committee meetings is drawn up. Report:The Committee submits written reports to the Board of Directors regarding its work. It periodically evaluates its performance based on these rules of procedure and, if applicable, offers suggestions for improving its performance. Members of the Audit Committee in 2011 In 2008,2011, the Committee’s members were Messrs. Antoine Jeancourt-Galignani, Bertrand Jacquillat,Ms. Patricia Barbizet, Mr. Thierry de Rudder and from July 31, 2008, Mrs. Patricia Barbizet. Mr. Bertrand Jacquillat, until his term as director expired on May 13, 2011. At the Shareholders’ Meeting on May 13, 2011, Ms. Marie-Christine Coisne-Roquette was appointed a member of the Audit Committee to replace Mr. Jacquillat. All of the members of the Committee are independent directors and have recognized experience in the financial and accounting fields, as illustrated in their summary biographies above.fields. The Committee is chaired by Mr. Antoine Jeancourt-Galignani, who was determinedMs. Barbizet. At its meeting on July 28, 2011, the Board of Directors decided to beappoint Ms. Barbizet to serve as the Audit Committee financial expert based on a recommendation by the Board atAudit Committee. At its meeting on September 5, 2006.January 12, 2012, the Board of Directors decided to co-opt Mr. Gérard Lamarche as a director and to nominate him as a member of the Audit Committee in replacement of Mr. de Rudder, who is resigning from his position as a Director. Compensation Committee In February 2007,Rules of procedure (unabridged version)
The Board of Directors of TOTAL S.A. (hereafter referred to as the “Company” and, collectively with all its direct and indirect subsidiaries, as the “Group”) has approved the following rules of procedure of the Company’s Compensation Committee was separated from(hereafter, the then existing Nominating & Compensation Committee. “Committee”). The principal objectivesmembers of thisthe Committee are to:directors of the Company and therefore uphold the rules of procedure of the Board of Directors of TOTAL S.A. The Committee is focused on: examineexamining the executive compensation policies implemented by the Group and the compensation of members of the Executive Committee;
evaluating the performance and recommending the compensation of each corporate executive officer, and evaluatepreparing reports which the performance and recommend the compensation of the Chairman of the Board and of the Chief Executive Officer.Company must present in these areas.
ItsDuties:The Committee’s duties include the following:include:
examining the criteria andmain objectives proposed by the Company’s general management forregarding compensation of the Group’s executive compensationofficers, including stock option and restricted share grant plans and equity-based plans, and advising on this subject; presenting recommendations and proposals to the Board of Directors concerning: | | (i)– | | compensation, pension and life insurance plans, in-kind benefits and other compensation including(including severance benefits,benefits) for the Chairman and the Chief Executive Officercorporate executive officers of the Company,Company; in particular, the Committee proposes compensation structures that take into account the Company’s strategy, objectives and earnings and market practices, |
| | (ii)– | awards of | stock optionsoption and restricted share grants, particularly grants of registered shares to the Chairman and the Chief Executive Officer; andcorporate executive officers; |
examining the compensation of the members of the Executive Committee, including stock option plans,and restricted share grants,grant plans and equity-based plans, and pension and insurance plans.plans and in-kind benefits; preparing and presenting reports in accordance with these rules of procedure; examining, for the parts within its remit, reports to be sent by the Board of Directors or its Chairman to the shareholders; preparing recommendations requested at any time by the Chairman of the Board of Directors or the general management of the Company regarding compensation. Compensation Committee membership and practices
Composition:The Committee is made up of at least three directors designated by the Board of Directors. A majority of the members must be independent directors. Members of the Compensation Committee may not receive from the Company and its subsidiaries, either directly or indirectly, any compensation other than: (i) directors’ fees paid for their services as directors or as members of the committee, or, if applicable, as members of another committee of the Company’s Board; and (ii) compensation and pension benefits related to prior employment by the Company, or another Group company, which are not dependantdependent upon future work or activities. The term of office of the members of the Committee coincides with the term of their appointment as director. The term of office as a member of the Committee may be renewed at the same time as the appointment as director. However, the Board of Directors can change the composition of the Committee at any time. Organization of activities:The Committee appoints its chairmanChairman and its secretary. The secretary is a Company senior executive. The Committee deliberates when at least one-half of its members are present. A member of the Committee cannot be represented. The Committee meets at least twice a year. It meets on an as-needed basis through notice by its Chairman or by one-half of its members. The Committee invites the Chairman andof the Board or the Chief Executive Officer of the Company, as applicable, to present their recommendations. Neither the Chairman nor the Chief Executive Officer may be present during the Committee’s deliberations regarding his own compensation.situation. If the Chairman of the Board is not the Chief Executive Officer of the Company, the Chief Executive Officer may not be present during the Committee’s deliberations regarding the situation of the Chairman of the Board. While maintaining the appropriate level of confidentiality for its discussions, the Committee may request thatfrom the Chief Executive Officer provide it with the assistance ofto be assisted by any senior executive of the Company whose skills and qualifications could facilitate the handling of an agenda item. If it deems it necessary to accomplish its duties, the Committee may request from the Board of Directors the resources to engage external consultants. The proposals made by the Committee to the Board of Directors are adopted by a majority of the members present at the Committee meeting. The Chairman of the Committee casts the deciding vote if an even number of Committee members is present at the meeting. The Committee can adopt proposals intended for the Board of Directors without meeting if all the members of the Committee so agree and sign each proposal. A written summary of Committee meetings is drawn up. Report:The Committee reports on its activities to the Board of Directors. At the request of the Chairman of the Board, the Committee examines all draft reports of the Company regarding compensation of the executive officers or any other issues relevant to its area of expertise. Members of the Compensation Committee in 2011 In 2008,2011, the Committee’s members were Messrs. Patrick Artus, Bertrand Collomb, Thierry Desmarest and Michel Pébereau. Messrs. Artus, Collomb and Pébereau and Serge Tchuruk, each anare independent director. directors. Mr. Michel Pébereau chairs the Committee. At its meeting on February 9, 2012, the Board of Directors decided to change the composition of the Compensation Committee. As of this date, the Committee’s members are Messrs. Patrick Artus, Gunnar Brock, Thierry Desmarest, Claude Mandil and Michel Pébereau. Messrs. Artus, Brock, Mandil and Pébereau are independent directors. Nominating & Governance Committee In February 2007,Rules of procedure (unabridged version)
The Board of Directors of TOTAL S.A. (hereafter referred to as the “Company” and, collectively with all its direct and indirect subsidiaries, as the “Group”) has approved the following rules of procedure of the Company’s Nominating &and Governance Committee was separated from(hereafter, the then existing Nominating & Compensation Committee. “Committee”). The principal objectivesmembers of thisthe Committee are to:directors of the Company and therefore uphold the rules of procedure of the Board of Directors of TOTAL S.A. The Committee is focused on: recommendrecommending to the Board of Directors the persons that are qualified to be appointed as directors, Chairman or Chief Executive Officer;so as to guarantee the scope of coverage of the Directors’ competencies and the diversity of their profiles;
preparerecommending to the Board of Directors the persons that are qualified to be appointed as corporate executive officers;
preparing the Company’s corporate governance rules and supervisesupervising their implementation; and examineexamining any questions referred to it by the Board or the Chairman of the Board, in particular questions related to ethics.ethics and situations of conflicting interests.
ItsDuties:The Committee’s duties include the following:include:
presenting recommendations to the Board for its membership and the membership of its committees;committees, and the qualification in terms of independence of each candidate for Directors’ positions on the Board of Directors; proposing annually to the Board of Directors the list of directors who may be considered as “independent directors”; examining, for the parts within its remit, reports to be sent by the Board of Directors or its Chairman to the Company;shareholders; assisting the Board of Directors in the selection and evaluation of the Chairman of the Board and the Chief Executive Officercorporate executive officers and examining the preparation of their possible successors, in cooperation with the Compensation Committee;including cases of unforeseeable absence; preparingrecommending to the Board of Directors the persons that are qualified to be appointed as directors;
recommending to the Board of Directors the persons that are qualified to be appointed as member of a listCommittee of individuals who might be considered for election as Directors and those who might be named to serve onthe Board committees;of Directors; proposing methods for the Board of Directors to evaluate its performance;performance, and in particular preparing means of regular self-assessment of the workings of the Board of Directors, and the possible assessment thereof by an external consultant; proposing to the procedureBoard of Directors the terms and conditions for allocating directors’ fees;fees and the conditions under which expenses incurred by the directors are reimbursed; developing and recommending to the Board of Directors the corporate governance principles applicable to the Company.Company; examining any questions referred to it by the Board or the Chairman of the Board, in particular questions related to ethics and situations of conflicting interests; preparing recommendations requested at any time by the Board of Directors or the general management of the Company regarding appointments or governance. examining the conformity of the Company’s governance practices with the recommendations of the Code of Corporate Governance adopted by the Company; examining changes in the duties of the Board of Directors. Nominating & Governance Committee membership and practices
Composition:The Committee is made up of at least three directors designated by the Board of Directors. A majority of the members must be independent directors. Members of the Nominating & Governance Committee, other than the Chairman of the Board and the Chief Executive Officer,Company’s corporate executive officers, may not receive from the Company and its subsidiaries any compensation other than: (i) directors’ fees paid for their services as directors or as members of the committee, or, if applicable, as members of another committee of the Company’s Board; and (ii) compensation and pension benefits related to prior employment by the Company, or another Group company, which are not dependantdependent upon future work or activities. The term of office of the members of the Committee coincides with the term of their appointment as director. The term of office as a member of the Committee may be renewed at the same time as the appointment as director. However, the Board of Directors can change the composition of the Committee at any time. Organization of activities:The Committee appoints its chairmanChairman and its secretary. The secretary is a Company senior executive. The Committee deliberates when at least one-half of its members are present. A member of the Committee cannot be represented. The Committee meets at least twice a year. It meets on an as-needed basis through notice by its Chairman or by one-half of its members. The Committee may inviteinvites the Chairman of the Board or the Chief Executive Officer of the Company, as applicable, to present recommendations. Neither The corporate executive officers, whether they are members of the Chairman nor the Chief Executive OfficerCommittee or
invited to its meetings, may not be present duringat deliberations regarding hisconcerning their own situation. While maintaining the appropriate level of confidentiality for its discussions, the Committee may request thatfrom the Chief Executive Officer provide it with the assistance ofto be assisted by any senior executive of the Company whose skills and qualifications could facilitate the handling of an agenda item. If it deems it necessary to accomplish its duties, the Committee may request from the Board of Directors the resources to engage external consultants. The proposals made by the Committee to the Board of Directors are adopted by a majority of the members present at the Committee meeting. The Chairman of the Committee casts the deciding vote if an even number of Committee members is present at the meeting. The Committee can adopt proposals intended for the Board of Directors without meeting if all the members of the Committee so agree and sign each proposal. A written summary of Committee meetings is drawn up. Report:The Committee reports on its activities to the Board of Directors. Members of the Nominating & Governance Committee in 2011 In 2008,2011, the Committee’s members were Messrs. Bertrand Collomb, Thierry Desmarest and Michel Pébereau. Messrs. Collomb and Pébereau are independent directors. The Committee is chaired by Mr. Desmarest. At its meeting on February 9, 2012, the Board of Directors decided to change the composition of the Nominating and Serge Tchuruk. Each,Governance Committee. As of this date, the Committee’s members are Messrs. Patrick Artus, Gunnar Brock, Bertrand Collomb, Thierry Desmarest and Claude Mandil. Messrs. Artus, Brock, Collomb and Mandil are independent directors. Strategic Committee Rules of procedure (unabridged version) The members of the Committee are directors of the Company and therefore uphold the rules of procedure of the Board of Directors of TOTAL S.A. Duties:To allow the Board of Directors of TOTAL S.A. to ensure the Group’s development, the Committee’s duties include: examining the overall strategy of the Group proposed by the Company’s general management; examining operations that are of particular strategic importance; reviewing competition and the resulting medium and long-term outlook for the Group. Composition:The Committee is made up of at least five directors designated by the Board of Directors. Members of the Committee may not receive from the Company and its subsidiaries, either directly or indirectly, any compensation other than: directors’ fees paid for their services as directors or as members of the Committee, or, if applicable, as members of another committee of the Company’s Board; and compensation and pension benefits related to prior employment by the Company, or another Group company, which are not dependent upon future work or activities. The term of office of the members of the Committee coincides with the exceptionterm of their appointment as director. The term of office as a member of the Committee may be renewed at the same time as the appointment as director. However, the Board of Directors can change the composition of the Committee at any time. Organization of activities:The Chairman of the Board is an independent director. Mr. Thierry Desmarestof Directors of the Company chairs the Committee. The Chairman appoints the Committee secretary, who may be the Secretary of the Board of Directors.
The Committee deliberates when at least one-half of its members are present. A member of the Committee cannot be represented. The Committee meets at least once a year and at the request of its Chairman, at least one-half of its members, or the Chief Executive Officer of the Company. The Committee Chairman prepares the schedule of its meetings. Directors who are not members of the Committee are free to participate in the Committee’s meetings. This voluntary participation entitles them to the same directors’ fees as those paid to the members of the Committee for attending meetings. The Committee may meet with the Chief Executive Officer, and, if applicable, any acting Managing Director of the Company and consult with managers of operating or non-operating departments, as may be useful in performing its duties. The Chairman of the Committee [, if the latter is not the Chief Executive Officer of the Company,] gives prior notice of such meeting to the Chief Executive Officer. In particular, the Committee is authorized to consult with the Vice President Strategy & Business Intelligence of the Company or the person delegated by the latter, by asking the Company’s Chief Executive Officer to call them to a meeting. If it deems it necessary to accomplish its duties, the Committee may request from the Board of Directors the resources to engage external consultants. A written summary of Committee meetings is drawn up. Report:The Committee submits written reports to the Board of Directors regarding its work. It periodically evaluates its performance based on these rules of procedure and, if applicable, offers suggestions for improving its performance. Members of the Strategic Committee in 2011 In 2011, the Committee’s members were Mmes. Patricia Barbizet, Barbara Kux and Anne Lauvergeon and Messrs. Christophe de Margerie, Thierry Desmarest, Gunnar Brock, Claude Mandil and Thierry de Rudder. At its meeting on January 12, 2012, the Board of Directors decided to co-opt Mr. Gérard Lamarche as a director and to nominate him as a member of the Strategic Committee in replacement of Mr. de Rudder, who resigned from his position as a Director. Mmes. Barbizet, Kux and Lauvergeon and Messrs. Brock, Mandil and Lamarche are independent directors. As a reminder, directors who are not members of the Committee are free to participate in the Committee’s meetings. Mr. Christophe de Margerie chairs the Committee. Board of Directors practices Management form On May 21, 2010, the Board of Directors decided to reunify the positions of Chairman and Chief Executive Officer and appoint the Chief Executive Officer to the duties of Chairman of the Board. This decision was made further to the work done by the Nominating & Governance Committee and in the best interests of the Company, taking into account the advantage of the unified management and the majority of independent directors appointed at the Committees, which ensures balanced authority. The Board of Directors deemed that the unified management form was the most appropriate to the Group’s organization,modus operandi and business, and the specificities of the oil and gas sector. It respects the respective prerogatives of the various Company instances (Shareholders’ meeting, Board of Directors, general management). Moreover, the Company by-laws and the respective rules of procedure of the Board of Directors and the Committees provide the guarantees required to implement best governance practices within a unified management framework. In particular, the by-laws allow the Board to nominate one or two Vice-Chairmen. They also state that the Board of Directors can be summoned by any means, even verbally, or at short notice in the event of an emergency, by the Chairman, a Vice-Chairman, or one third of the members, at any time and whenever the Company so requires. The rules of procedure of the Board of Directors also state that each Director is required to inform the Board of Directors of any conflicts of interest with the Company or with any other company in the Group, and to abstain from voting on the resolution in question, and even to refrain from taking part in the debate preceding the vote. Performance and evaluation At its meeting on February 11, 2009,10, 2011, the Board of Directors discussed its practices.practices and made suggestions for improvement with respect to broadening criteria when benchmarking with other companies, and for a thorough Pursuantstudy of the Group’s opportunities in the energy sector. These proposals were implemented at the meeting of the new Strategic Committee and when the report of the meeting was presented to the recommendationBoard of Directors.
At its meeting of February 9, 2012, the Board of Directors discussed its practices on the basis of a formal evaluation carried out by means of a detailed questionnaire completed by all of the directors. The responses were then submitted for examination by the Nominating & Governance Committee at its meeting on February 11, 2009, the Board concludedand summarized. It is this summary that its methods and practices were appropriate to meet its responsibilities, both in regards to the number and length of its meetings and to the issues addressed at these meetings. In particular, it concluded that matters related to the technical, economic and geopolitical environment had been adequately addressed through the agenda of its meetings in 2008. In addition, the Board decided that certain cross-functional issues related to the environment and transportation would be examined starting in 2009. Policy for determining the compensation and other benefits of the Chairman and of the Chief Executive Officer
Based on a proposal by the Compensation Committee, on February 11, 2009, the Board adopted the following policy for determining the compensation and other benefits of the Chairman and of the Chief Executive Officer:
Compensation and benefits for the Chairman and the Chief Executive Officer are setwas discussed by the Board of Directors after considering proposals from the Compensation Committee. Such compensation shall be reasonable and fair, inDirectors.
The formal evaluation showed a context that values both teamwork and motivation within the Company. Compensation for the Chairman and the Chief Executive Officer is related to market practice, work performed, results obtained and responsibilities held.
| Compensation for the Chairman and the Chief Executive Officer includes both a fixed portion and a variable portion, each of which is reviewed annually. |
The amount of variable compensation may not exceed a stated percentage of fixed compensation. Variable compensation is determined based on pre-defined quantitative and qualitative criteria. Quantitative criteria are limited in number, objective, measurable and adapted to the Group’s strategy.
| Variable compensation is designed to reward short-term performance and progress towards medium-term objectives. The qualitative criteria for variable compensation are designed to allow exceptional circumstances to be taken into account, when appropriate. |
The Group does not have a specific pension plan for the Chairman and the Chief Executive Officer. They are eligible for retirement benefits and pensions available to other employeesgenerally positive opinion of the Group under conditions determined by the Board.
Stock options are designed to align the long-term interestspractices of the Chairman and the Chief Executive Officer with those of the shareholders.
| Awards of stock options are considered in light of the amount of the total compensation paid to the Chairman and the Chief Executive Officer. The exercise of stock options to which the Chairman and the Chief Executive Officer are entitled is subject to a performance condition. |
| The exercise price for stock options awarded is not discounted compared to the market price, at the time of the grant, for the underlying share. |
| Stock options are awarded at regular intervals to prevent opportunistic behavior. |
| The Board has put in place restrictions on the transfer of a portion of shares issued upon the exercise of options. |
After three years in office, the Chairman and Chief Executive Officer are required to hold at least the number of Company shares set by the Board.
The Chairman and Chief Executive Officer do not receive restricted share grants.
Director independence
At its meeting on February 11, 2009, the Board of Directors acting on a proposal fromand the Nominating & GovernanceCommittees, which highlighted that the improvements requested by the directors in 2011 had been made. The Board therefore stated that it was globally satisfied with its practices and suggested improvements mainly relating to more in-depth strategic reflection. This has already been put in place with the Strategic Committee, reviewedand work in this area will continue for the independencebenefit of
the Company’s directors as of December 31, 2008. Also based on the Committee’s proposal, the Board considered that, pursuant to the AFEP-MEDEF Code, a director is independent when “he or she has no relationship, of any nature, with the company, its group or the management of either, that may compromise the exercise of his or her freedom of judgement”.
Mrs. Barbizet, Mr. Bouton, Mr. Collomb, Mr. Desmarais, Mr. Jacquillat, Mr. Jeancourt-Gallignani, Lord Levene of Portsoken, Mr. Mandil, Mr. Pébereau, Mr. de Rudder, Mr. Tchuruk and Mr. Vaillaud were deemed to be independent directors.
These directors meet the criteria set forth in the AFEP-MEDEF Code, with the exception of one individual who has been a director for longer than twelve years. For a company that has long-term investments and activities, a longer term of office gives experience and authority, and thereby reinforces the independence of directors. The Board concluded that Mr. Tchuruk, the only director concerned by this criterion, should be considered as independent.
Concerning “material” relationships, as a client, supplier, investment or finance banker, between a directorDirectors and the Company, the Board deemed that the level of
activity between Group companies and the banks at which two of its Directors are officers, which is less than 0.1% of their net banking income and less than 5% of the Group’s overall external financing (including confirmed but undrawn credit lines) represent neither a material portion of the overall activity of these banks nor a material portion of the Group’s external financing. The Board concluded that Mr. Bouton and Mr. Pébereau should be considered as independent Directors.
75% of the directors are independent.
The Board also noted the absence of potential conflicts of interests between the Company and its directors.Group.
Employees, Share Ownership, Stock Options and Restricted Share GrantsEMPLOYEES AND SHARE OWNERSHIP
Employees The tables below set forth the number of employees, by division and geographic location, of the Group (fully consolidated subsidiaries) as of the end of the periods indicated: | | | | | | | | | | | | | | Upstream | | Downstream | | Chemicals | | Corporate | | Total | 2008 | | 16,005 | | 34,040 | | 45,545 | | 1,369 | | 96,959 | 2007 | | 15,182 | | 34,185 | | 45,797 | | 1,278 | | 96,442 | 2006 | | 14,862 | | 34,467 | | 44,504 | | 1,237 | | 95,070 | | | | | | France | | Rest of Europe | | Rest of world | | Total | 2008 | | | | 37,101 | | 27,495 | | 32,363 | | 96,959 | 2007 | | | | 37,296 | | 27,374 | | 31,772 | | 96,442 | 2006 | | | | 37,831 | | 26,532 | | 30,707 | | 95,070 |
| | | | | | | | | | | | | | | | | | | | | | | | Upstream | | | Downstream | | | Chemicals | | | Corporate | | | Total | | 2011 | | | 23,563 | | | | 29,423 | | | | 41,665 | | | | 1,453 | | | | 96,104 | | 2010 | | | 17,192 | | | | 32,631 | | | | 41,658 | | | | 1,374 | | | | 92,855 | | 2009 | | | 16,628 | | | | 33,760 | | | | 44,667 | | | | 1,332 | | | | 96,387 | |
| | | | | | | | | | | | | | | | | | | | France | | | Rest of Europe | | | Rest of the World | | | Total | | 2011 | | | 35,037 | | | | 22,453 | | | | 38,614 | | | | 96,104 | | 2010 | | | 35,169 | | | | 24,931 | | | | 32,755 | | | | 92,855 | | 2009 | | | 36,407 | | | | 26,299 | | | | 33,681 | | | | 96,387 | |
TOTAL believes that the relationship between its management and labor unions is, in general, satisfactory. Arrangements for involving employees in the Company’s share capital of the Company Pursuant to agreements signed on March 15, 2002, as amended, the Group created a “Total Group Savings Plan” (PEGT), a “Partnership for Voluntary Wage Savings Plan” (PPESV, later becoming PERCO) and a “Complementary Company Savings Plan” (PEC) for employees of the Group’s French companies.companies having adhered to these plans. These plans allow investments in a number of mutual funds including one that investsinvested in Company shares (“TOTAL ACTIONNARIAT FRANCE”). A “Shareholder Group Savings Plan” (PEG-A) has also been in place since November 19, 1999 to facilitate capital increases reserved for employees of the Group’s French and foreign subsidiaries covered by these plans. Company savings plans The various Company savings plans (PEGT, PEC) give the employees of French Group Companies belonging to these savings plans access to several collective investment funds (Fondsfonds communs de placement), including a Fundfund invested in shares of the Company (“TOTAL ACTIONNARIAT FRANCE”). The capital increases reserved for employees are conducted under PEG-A through the “TOTAL ACTIONNARIAT FRANCE” fund for employees of the Group’s French subsidiaries and through the “TOTAL ACTIONNARIAT INTERNATIONAL CAPITALISATION” fund for the employees of foreign companies.subsidiaries. In addition, U.S. employees participate in these operations through ADRsAmerican Depositary Receipts (ADRs) and Italian employees (as well as German employees starting in 2011) may participate by directly subscribing to new shares at the Group Caisse Autonome of the Group in Belgium. IncentiveProfit-sharing agreements
Performance indicators used underUnder the June 30, 2006,26, 2009 profit-sharing agreements for employees ofconcerning ten Group companies, the amount available for employees profit-sharing is determined, when permitted by local law, link amounts available for profit sharing tobased on the return on equity (ROE) performance (ROE) of the Group as a whole.Group.
Employee shareholding The total number of TOTAL shares held by employees as of December 31, 2008,2011, is as follows: | | | | | “TOTAL ACTIONNARIAT FRANCEFRANCE” | | 69,206,754 | 78,607,765 | | “TOTAL ACTIONNARIAT INTERNATIONAL CAPITALISATIONCAPITALISATION” | | 16,364,272 | 19,691,590 | | ELF PRIVATISATION No.1N°1 | | 1,423,273 | 929,494 | | Shares held by U.S. employees | | 779,445 | 454,305 | | Group Caisse Autonome in Belgium(Belgium) | | 336,001 | 436,431 | | TOTAL shares from the exercise of the Company’s stock options and held as registered shares within a Company Savings Plan (PEE)(a) | | 3,201,243 | 3,293,822 | | Total shares held by employee shareholder funds | | 91,310,988 | 103,413,407 | |
| (a) | Company savings plans. |
As of December 31, 2008,2011, the employees of the Group held, on the basis of the definition of employee shareholding contained in Article L. 225-102 of the French Commercial Code, 91,310,988103,413,407 TOTAL shares, representing 3.85%4.37% of the Company’s share capital and 7.40%8.01% of the voting rights that could be exercised at a shareholders’ meetingShareholders’ Meeting on that date. The management of each of the three collective investment funds mentioned above is controlled by a dedicated supervisory board, two-third of its members representing holders of fund units and one-third representing the Company. This board is responsible for reviewing the collective investment funds’ management report and annual financial statements as well as the financial, administrative and accounting management, exercising voting rights attached to portfolio securities, deciding contribution of securities in case of a public tender offer, deciding mergers, spin-offs or liquidations, and granting its approval prior to changes in the rules and procedures of the collective investment fund in the conditions provided for by the rules and procedures. These rules and procedures also stipulate a simple majority vote for decisions, except for decisions requiring a qualified majority vote of two-third plus one related to a change in a fund’s rules and procedures, its conversion or disposal, and decisions related to contribution of securities of the Elf Privatisation collective investment fund in case of a public tender offer.For employees holding shares outside of the employee collective investment funds mentioned in the table above, voting rights are exercised individually. Capital increase reserved for Group employees At the shareholders’ meetingShareholders’ Meeting held on May 11, 2007,21, 2010, the shareholders delegated to the Board of Directors the authority to increase the share capital of the Company in one or more transactions and within a maximum period of 26twenty-six months from the date of the meeting, by an amountreserving subscriptions for such issuance to the Group employees participating in a company savings plan in accordance with the provisions of Articles L. 3332-2 and L. 3332-18 and following of the French Labor Code, and Articles L. 225-129-2, L. 225-129-6 and L. 225-138-1 of the French Commercial Code. The number of ordinary shares that are likely to be issued pursuant to this delegation of authority will not exceedingexceed 1.5% of the share capital outstanding on the date of the meeting of the Board of Directors at which a decision to proceed with an issuance is made reserving subscriptions for such issuance to the Group employees participating in a company savings plan. It was specified that the amount of any such capital increase reserved for Group employees would be counted against the aggregate maximum nominal amount of share capital increases authorized by the shareholders’ meeting held on May 11, 2007, for issuing new ordinary shares or other securities granting immediate or future access to the Company’s share capital with pre-emptive subscription rights (4 B€ in nominal value). This delegation of authority has cancelled and replaced, for the unusedmade. part, the one granted by the shareholders’ meeting of May 17, 2005.
Pursuant to this delegation of authority, the Board of Directors decided on November 6, 2007,October 28, 2010 to proceed with a capital increase of a maximum of 12 million shares with a subscription price of€44.40 per share reserved for TOTAL employees in 2011, bearing dividends as of January 1, 2007. In accordance with Article 142010. The Board of Directors decided to delegate the FrenchAutorité des marchés financiers (AMF) instruction No. 2005-11 as of December 13, 2005, regardingauthority to set the information to be disclosed in case of a capital increase operation, TOTAL S.A. released on January 16, 2008, on its website and filed with the AMF a press release which specified the terms of the offering. The offering was openedsubscription period to the employees of TOTAL S.A.Chairman and Chief Executive Officer. On March 14, 2011, the Chairman and Chief Executive Officer decided that the subscription period would be set from March 16 to April 1, 2011 and acknowledged that the employees of its French and foreign subsidiaries in which TOTAL S.A. holds directly or indirectly 50%subscription price per ordinary share would be set at least of the capital, who are participants€34.80. The subscription resulted in the issuance in 2011 of 8,902,717 TOTAL Group Savings Plan (PEG-A) and for which local regulatory approval was obtained. The offering was also open to former employees of TOTAL S.A. and its French subsidiaries who have retired and still have holdings in TOTAL employee savings plans. Subscription was open from March 10, 2008, through March 28, 2008, and 4,870,386 new TOTAL shares were issued in 2008.shares.
Shares held by directorsthe administration and executive officersmanagement bodies As of December 31, 2008,2011, based uponon information from the members of the Board and the share registrar, the members of the Board and the Group Executive Officers of the Group (Management (Management Committee and Treasurer) held a total of less than 0.5% of the Company’s shares:share capital: Members of the Board of Directors (including the Chairman and the Chief Executive Officer): 569,094 shares.317,306 shares; Chairman of the Board of Directors: 385,576 shares. and Chief Executive Officer: 85,230105,556 shares and 39,33053,869 shares of the TOTAL“TOTAL ACTIONNARIAT FRANCEFRANCE” collective investment plan.plan; Management Committee and Treasurer (including the Chief Executive Officer): 830,461 and Treasurer: 572,527 shares. By decision of the Board of Directors: The Chairman and the Chief Executive Officer are required to hold a number of shares of the Company equal in value to two years of the fixed portion of their annual compensation. | | equal in value to two years of the fixed portion of their annual compensation. |
Members of the Executive Committee are required to hold a number of shares of the Company equal in value to two years of the fixed portion of their annual compensation. These shares have to be acquired within three years offrom the appointment to the Executive Committee. The number of TOTAL shares to be considered includes: directly held shares, whether or not they are subject to transfer restrictions; and shares in collective investment plans (FCPE)funds invested in TOTAL shares. Summary of transactions in the Company’s securities The following table presents transactions, of which the Company has been informed, in the Company’s shares or related financial instruments carried out in 20082011 by the individuals concerned under paragraphs a) through c) of Article L. 621-18-2 of the French Monetary and Financial Code. Year 2008
| | | | | Acquisition | | Subscription | | Transfer | | Exchange | | Exercise
of stock options | | Thierry Desmarest(a) | | TOTAL shares | | 12,000 | | | | 160,000 | | | | 139,000 | | | | | Shares in collective investment plans (FCPE), and other related financial instruments(b) | | | | Year 2011 | | | Acquisition | | | Subscription | | | Transfer | | | Exchange | | | Exercise
of stock
options | | Christophe de Margerie(a) | | TOTAL shares | | | | | | 45,982 | | | | 73,012 | | TOTAL shares | | | — | | | | — | | | | 93,250 | | | | — | | | | 113,576 | | | | | Shares in collective investment plans (FCPE), and other related financial instruments(b) | | 1,713.28 | | 1,857.26 | | | Shares in collective investment plans (FCPE), and other related financial instruments(b) | | | 5,340.09 | | | | — | | | | — | | | | — | | | | — | | Michel Bénézit(a) | | TOTAL shares | | | | | | 135 | | | | | | TOTAL shares | | | — | | | | — | | | | — | | | | — | | | | | | | Shares in collective investment plans (FCPE), and other related financial instruments(b) | | 149.18 | | 4,539.46 | | | Robert Castaigne(a)(c) | | TOTAL shares | | | | | | 10,000 | | | | 39,696 | | | | | Shares in collective investment plans (FCPE), and other related financial instruments(b) | | 7,100.00 | | 6,950.00 | | | Shares in collective investment plans (FCPE), and other related financial instruments(b) | | | 626.95 | | | | 13,341.83 | | | | 6,828.94 | | | | — | | | | — | | François Cornélis(a) | | TOTAL shares | | | | | | 13,576 | | | | 13,576 | | TOTAL shares | | | — | | | | — | | | | 9,000 | | | | — | | | | | | | Shares in collective investment plans (FCPE), and other related financial instruments(b) | | 557.46 | | 4,353.00 | | | Shares in collective investment plans (FCPE), and other related financial instruments(b) | | | 1,883.86 | | | | 11,440.06 | | | | 5,876.63 | | | | — | | | | — | | Yves-Louis Darricarrère(a) | | TOTAL shares | | | | | | | | | | 2,500 | | TOTAL shares | | | — | | | | — | | | | 14,412 | | | | — | | | | 6,412 | | | | | Shares in collective investment plans (FCPE), and other related financial instruments(b) | | 2.52 | | 2,071.08 | | 2,108.45 | | | Shares in collective investment plans (FCPE), and other related financial instruments(b) | | | 901.20 | | | | 20,088.29 | | | | 10,319.28 | | | | — | | | | Jean-Jacques Guilbaud(a) | | TOTAL shares | | | | | | 14,000 | | | | 3,043 | | TOTAL shares | | | — | | | | — | | | | 29,163 | | | | — | | | | 29,163 | | | | | Shares in collective investment plans (FCPE), and other related financial instruments(b) | | 232.22 | | 3,928.61 | | 1,320.03 | | | Shares in collective investment plans (FCPE), and other related financial instruments(b) | | | 1,008.85 | | | | 14,320.92 | | | | 8,636.03 | | | | — | | | | — | | Antoine Jeancourt-Galignani(a) | | TOTAL shares | | 1,000 | | | | | | | | | | | Bertrand Jacquillat(a)(c) | | | TOTAL shares | | | 300 | | | | — | | | | 33 | | | | — | | | | — | | | | | Shares in collective investment plans (FCPE), and other related financial instruments(b) | | | Shares in collective investment plans (FCPE), and other related financial instruments(b) | | | — | | | | — | | | | — | | | | — | | | | — | | Patrick de La Chevardière(a)(d) | | TOTAL shares | | | | | | | | | | | | | Patrick de La Chevardière(a) | | | TOTAL shares | | | — | | | | — | | | | — | | | | — | | | | — | | | | Shares in collective investment plans (FCPE), and other related financial instruments(b) | | 21.06 | | 113.07 | | | | | | | | Shares in collective investment plans (FCPE), and other related financial instruments(b) | | | 756.08 | | | | 14,998.66 | | | | 7,587.71 | | | | — | | | | — | |
| (a) | Including the related personsindividuals in the meaning of the provisions of the Article R. 621-43-1 of the French Monetary and Financial Code. |
| (b) | Collective investment plansfunds (FCPE) primarily investinginvested in Company shares. |
Stock optionsDirector and restricted share grants policy
General policy
Stock options and restricted share grants concern only shares of TOTAL S.A. No options for or restricted grants of shares of any of the Group’s listed subsidiaries are awarded.
All plans are approved by the Board of Directors, based on recommendations by the Compensation Committee. For each plan, the Compensation Committee proposes a list of the beneficiaries and the number of options or restricted shares granted to each beneficiary. The Board of Directors then gives final approval for this list.
Stock options have a term of eight years, with an exercise price set at the average of the opening share prices during the 20 trading days prior to the award date, without any discount being applied. For the option plans established after 2002, options may only be exercised after an initial two-year period and the shares issued upon exercise may not be transferred prior to the termination of an additional two-year holding period. For the option plans established on July 17, 2007 and October 9, 2008, decided by the Board of Directors on July 17, 2007 and September 9, 2008, respectively, the transfer or conversion to bearer shares of shares issued from the exercise of stock options, for the beneficiaries of an employment contract with a non-French subsidiary on the date of the award, can take place after the termination of the initial two-year period.
Restricted share grants become final after a two-year vesting period, subject to a performance condition related to the Return on Equity (ROE) of the Group, based on the Group’s consolidated accounts in the fiscal year preceding the year of final attribution. This performance condition is defined in advance by the Board of Directors on recommendations by the Compensation Committee. At the end of this vesting period, and subject to these performance conditions, the restricted share grants become final. However, these shares may not be transferred prior to the end of an additional two-year holding period.
For the 2006, 2007 and 2008 Plans, the conditional restricted share grants are subject to a performance condition. This condition states that the number of restricted shares finally granted is based on the ROE of the Group related to the fiscal year preceding the year of the final grant. This final acquisition rate, expressed as a percentage of the restricted shares granted by the Board of Directors:
is equal to zero if the ROE is less than or equal to 10%;
varies on a straight-line basis between 0% and 80% if the ROE is more than 10% and less than 18%;
varies on a straight-line basis between 80% and 100% if the ROE is more than or equal to 18% and less than 30%; and
is equal to 100% if the ROE is more than or equal to 30%.
The 2005 Plan was subject to a performance condition that stated that the acquisition rate of the restricted shares granted was equal to zero if the ROE for 2006 was less than 10%, equal to 100% if the ROE was more than 20% and varied on a straight-line basis between 0% and 100% if the ROE was between 10% and 20%.
The grant of these options or restricted shares is used to complement, based upon individual performance assessments at the time of each plan, the Group-wide policy of developing employee shareholding (including saving plans, and capital increases reserved for employees every two years) which allows employees to be more closely associated with the financial and share price performance of TOTAL.
Grants to the Chairman, the Chief Executive Officer and executive officers
Pursuant to the requirements introduced by French law 2006-1770 of December 30, 2006, the Board of Directors decided that, for the share subscription option plans of July 17, 2007 and October 9, 2008, the Chairman of the Board and the Chief Executive Officer will have to hold a number of TOTAL shares representing 50% of the capital gains, net of tax and related contributions, resulting from the exercise of stock options under these plans in the form of TOTAL shares. Once the Chairman and the Chief Executive Officer hold a number of shares (including shares or interests in collective investment funds invested in Company securities) corresponding to more than five times their current gross annual fixed salary, this holding requirement will be reduced to 10%. If in the future this ratio is no longer met, the previous 50% holding requirement will once again apply.
The Chairman of the Board of Directors was not granted any stock options under the plan of October 9, 2008, created by the Board of Directors on September 9, 2008.
In addition, the Chairman of the Board of Directors was not granted any restricted shares under the plans awarded on July 18, 2006, July 17, 2007 and October 9, 2008.
The Chief Executive Officer was not granted any restricted shares under the plans awarded on July 18, 2006, July 17, 2007 and October 9, 2008.
In addition, as part of the share subscription option plans awarded on July 17, 2007 and September 9, 2008, the Board required that, for each beneficiary of more than 25,000 stock options, one third of the options granted in excess of this number be subject to a performance condition. This condition states that the final grant rate will be based on the ROE of the Group. The ROE will be calculated on the consolidated accounts published by TOTAL related to the fiscal year preceding the year of vesting. The grant rate:
is equal to zero if the ROE is less than or equal to 10%;
varies on a straight-line basis between 0% and 80% if the ROE is more than 10% and less than 18%;
varies on a straight-line basis between 80% and 100% if the ROE is more than or equal to 18% and less than 30%; and
is equal to 100% if the ROE is more than or equal to 30%.
SUMMARY OF COMPENSATION, STOCK OPTIONS AND RESTRICTED SHARES GRANTED TO THE CHAIRMAN AND THE CHIEF EXECUTIVE OFFICER
| | | | | | (€) | | 2008 | | 2007 | Thierry Desmarest Chairman of the Board of Directors | | | | | | | | Compensation(a) | | 2,069,430 | | 2,263,905 | Value of options granted(b) | | — | | 1,529,000 | Value of restricted shares granted(c) | | — | | — | Total | | 2,069,430 | | 3,792,905 | Christophe de Margerie Chief Executive Officer | | | | | | | | Compensation(a) | | 2,808,395 | | 2,693,435 | Value of options granted(b) | | 998,000 | | 2,780,000 | Value of restricted shares granted(c) | | — | | — | Total | | 3,806,395 | | 5,473,435 |
(a) | Compensation further detailed in the table “— Compensation of the Chairman and the Chief Executive Officer”. |
(b) | Options granted in 2008 are detailed in the table “— Stock options granted in 2008 to the Chairman and the Chief Executive Officer”. The value of options granted was calculated on the day they were granted using the Black-Scholes model based on the assumptions used for the consolidated accounts (see Note 25 to the Consolidated Financial Statements). |
(c) | The Chairman and Chief Executive Officer were not granted any restricted shares as part of the plans awarded on July 17, 2007 and October 9, 2008. |
COMPENSATION OF THE CHAIRMAN AND THE CHIEF EXECUTIVE OFFICER
| | | | | | | | | | | | 2008 | | 2007 | | (€) | | Amount
due for
2008 | | Amount
paid in
2008(a) | | Amount
due for
2007 | | Amount
paid in
2007(a) | Thierry Desmarest Chairman of the Board of Directors | | | | | | Fixed compensation | | 1,100,000 | | 1,100,000 | | 1,151,706 | | 1,151,706 | Variable compensation(b) | | 969,430 | | 1,112,199 | | 1,112,199 | | 1,676,109 | Extraordinary compensation | | — | | — | | — | | — | Directors’ fees | | — | | — | | — | | — | In-kind benefits | | — | | — | | — | | — | Total | | 2,069,430 | | 2,212,199 | | 2,263,905 | | 2,827,815 | Christophe de Margerie | | | | | | | | | Chief Executive Officer | | | | | | | | | | | | | | Fixed compensation | | 1,250,000 | | 1,250,000 | | 1,191,580 | | 1,191,580 | Variable compensation(c) | | 1,552,875 | | 1,496,335 | | 1,496,335 | | 705,140 | Extraordinary compensation | | — | | — | | — | | — | Directors’ fees | | — | | — | | — | | — | In-kind benefits(d) | | 5,520 | | 5,520 | | 5,520 | | 5,520 | Total | | 2,808,395 | | 2,751,855 | | 2,693,435 | | 1,902,240 |
(a) | Variable portion paid for prior fiscal year. |
(b) | The variable portion for the Chairman is calculated by taking into account the Group’s return on equity during the relevant fiscal year, the Group’s earnings compared to those of other major international oil companies, as well as the Chairman’s personal contribution to the Group strategy, corporate governance and performance. The variable portion can reach a maximum amount of 100% of the fixed base salary. The objectives related to personal contribution were considered to be met in 2008. |
(c) | The variable portion for the Chief Executive Officer is calculated by taking into account the Group’s return on equity during the relevant fiscal year, the Group’s earnings compared to those of other major international oil companies as well as the Chief Executive Officer’s personal contribution based on operational target criteria. The variable portion can reach a maximum amount of 140% of the fixed base salary, which may be increased up to 165% for exceptional performance. The objectives related to personal contribution were considered to be met in 2008. |
(d) | Mr. de Margerie has the use of a company car. |
STOCK OPTIONS GRANTED IN 2008 TO THE CHAIRMAN AND THE CHIEF EXECUTIVE OFFICER
| | | | | | | | | | | | | | | | | | Date of plan | | | Type of options | | Value of
options (€) | | | Number of options
granted during
fiscal year(a) | | Exercise
price (€) | | Exercise period | Thierry Desmarest | | 2008 Plan | (b) | | Subscription
options | | — | | | — | | — | | — | Chairman of the Board of Directors | | 10/09/2008 | | | | | | | | | | | | | Total | | | | | | | — | | | — | | | | | Christophe de Margerie | | 2008 Plan | (b) | | Subscription
options | | 998,000 | (c) | | 200,000 | | 42.90 | | October 10, 2010 | Chief Executive Officer | | 10/09/2008 | | | | | | | | | | | | October 9, 2016 | Total | | | | | | | 998,000 | (c) | | 200,000 | | | | |
(a) | As part of the share subscription option plan awarded on October 9, 2008, the Board of Directors decided that for each beneficiary of more than 25,000 options, a portion of these options will be finally awarded after a two-year vesting period, subject to a performance condition. |
(b) | Option plan decided by the Board of Directors on September 9, 2008, and awarded on October 9, 2008. |
(c) | The value of options granted was calculated on the day they were granted using the Black-Scholes model based on the assumptions used for the consolidated accounts (see Note 25 to the Consolidated Financial Statements). |
STOCK OPTIONS EXERCISED IN 2008 BY THE CHAIRMAN AND THE CHIEF EXECUTIVE OFFICER
| | | | | | | | | | Date of plan | | Number of options
exercised during
fiscal year | | Exercise
price (€) | Thierry Desmarest | | 2002 Plan | | | | | Chairman of the Board of Directors | | 07/09/2002 | | 139,000 | | 39.03 | Total | | | | 139,000 | | | Christophe de Margerie Chief Executive Officer | | 2000 Plan
07/11/2000 | | 73,012 | | 40.11 | Total | | | | 73,012 | | |
RESTRICTED SHARE GRANTS AWARDED IN 2008 TO THE CHAIRMAN, THE CHIEF EXECUTIVE OFFICER OR ANY DIRECTOR (CONDITIONAL AWARD)
| | | | | | | | | | | | | | | | | Date of plan | | | Number of shares
granted during
fiscal year | | Value of
shares
granted (€)(a) | | Acquisition
date | | Availability
date | | Performance
condition | Thierry Desmarest Chairman of the Board of Directors | | 2008 Plan
10/09/2008 | (b)
| | — | | — | | — | | — | | — | Christophe de Margerie Chief Executive Officer | | 2008 Plan
10/09/2008 | (b)
| | — | | — | | — | | — | | — | Daniel Boeuf Director representing the employee shareholders | | 2008 Plan
10/09/2008 | (b)
| | 588 | | 18,175 | | 10/10/2010 | | 10/10/2012 | | Condition based on the Group’s ROE for fiscal year 2009 | Total | | | | | 588 | | 18,175 | | | | | | |
(a) | The value of the restricted shares granted is determined on the day of the award in compliance with IFRS 2. |
(b) | Share grant decided by the Board of Directors on September 9, 2008, and awarded on October 9, 2008. The Chairman and Chief Executive Officer were not granted any restricted shares as part of the plan awarded on October 9, 2008. |
RESTRICTED SHARES FINALLY GRANTED IN 2008 TO THE CHAIRMAN, THE CHIEF EXECUTIVE OFFICER OR ANY DIRECTOR
| | | | | | | | | | Date of plan | | Number of shares
finally granted during
fiscal year(a) | | Acquisition
condition | | Thierry Desmarest
Chairman of the Board of Directors
| | 2006 Plan
07/18/2006
| | — | | n/a | | Christophe de Margerie
Chief Executive Officer
| | 2006 Plan
07/18/2006
| | — | | n/a | | Daniel Boeuf
Director representing the employee shareholders
| | 2006 Plan
07/18/2006
| | 416 | | (b | ) | Total
| | | | 416 | | | |
(a) | Shares finally granted to the beneficiaries after a 2-year vesting period (i.e., on July 19, 2008). |
(b) | The Chairman and Chief Executive Officer were not granted any restricted shares as part of the plan decided by the Board of Directors on July 18, 2006. In addition, the Board of Directors on May 6, 2008 noted that the acquisition rate, connected to the performance condition, amounted to 100%. Moreover, the transfer of the restricted shares finally granted will only be permitted after the end of a 2-year mandatory holding period (i.e., from July 19, 2010). |
TOTAL stock options plans
The following table gives a breakdown of stock options awarded by category of beneficiaries (executive officers, senior managers and other employees) for the plans in effect during 2008.
| | | | | | | | | | | | | | | | | Number of
beneficiaries | | Number of
options
awarded(i) | | Percentage | | | Average number
of options per
beneficiary(i) | 2000 Plan(a)(f): | | | | | | | | | | | | Purchase options | | Executive officers(g) | | 24 | | 246,200 | | 10.2 | % | | 10,258 | (Decision of the Board on July 11, 2000; exercise price:€162.70; discount: 0.0%, exercice price since May 24, 2006:€40.11(i)) | | Senior managers Other employees | | 298
2,740 | | 660,700
1,518,745 | | 27.2
62.6 | %
% | | 2,217
554 | | | Total | | 3,062 | | 2,425,645 | | 100 | % | | 792 | | | | | | | 2001 Plan(b)(f): | | | | | | | | | | | | Purchase options | | Executive officers(g) | | 21 | | 295,350 | | 11.0 | % | | 14,064 | (Decision of the Board on July 10, 2001; exercise price:€168.20; discount: 0.0%, exercice price since May 24, 2006:€41.47(i)) | | Senior managers Other employees | | 281
3,318 | | 648,950
1,749,075 | | 24.1
64.9 | %
% | | 2,309
527 | | | Total | | 3,620 | | 2,693,375 | | 100 | % | | 744 | | | | | | | 2002 Plan(c)(f): | | | | | | | | | | | | Purchase options | | Executive officers(g) | | 28 | | 333,600 | | 11.6 | % | | 11,914 | (Decision of the Board on July 9, 2002; exercise price:€158.30; discount: 0.0%, exercice price since May 24, 2006:€39.03(i)) | | Senior managers Other employees | | 299
3,537 | | 732,500
1,804,750 | | 25.5
62.9 | %
% | | 2,450
510 | | | Total | | 3,864 | | 2,870,850 | | 100 | % | | 743 | | | | | | | 2003 Plan(c)(f): | | | | | | | | | | | | Subscription options | | Executive officers(g) | | 28 | | 356,500 | | 12.2 | % | | 12,732 | (Decision of the Board on July 16, 2003; exercise price:€133.20; discount: 0.0%, exercice price since May 24, 2006:€32.84(i)) | | Senior managers Other employees | | 319
3,603 | | 749,206
1,829,600 | | 25.5
62.3 | %
% | | 2,349
508 | | | Total | | 3,950 | | 2,935,306 | | 100 | % | | 743 | | | | | | | 2004 Plan(c): | | | | | | | | | | | | Subscription options | | Executive officers(g) | | 30 | | 423,500 | | 12.6 | % | | 14,117 | (Decision of the Board on July 20, 2004; exercise price:€159.40; discount: 0.0%, exercice price since May 24, 2006:€39.30(i)) | | Senior managers Other employees | | 319
3,997 | | 902,400
2,039,730 | | 26.8
60.6 | %
% | | 2,829
510 | | | Total | | 4,346 | | 3,365,630 | | 100 | % | | 774 | | | | | | | 2005 Plan(c): | | | | | | | | | | | | Subscription options | | Executive officers(g) | | 30 | | 370,040 | | 24.3 | % | | 12,335 | (Decision of the Board on July 19, 2005; exercise price:€198.90; discount: 0.0%, exercice price since May 24, 2006:€49.04(i)) | | Senior managers Other employees | | 330
2,361 | | 574,140
581,940 | | 37.6
38.1 | %
% | | 1,740
246 | | | Total | | 2,721 | | 1,526,120 | | 100 | % | | 561 | | | | | | | 2006 Plan(c): | | | | | | | | | | | | Subscription options | | Executive officers(g) | | 28 | | 1,447,000 | | 25.3 | % | | 51,679 | (Decision of the Board on July 18, 2006; exercise price:€50.60; discount: 0.0%) | | Senior managers Other employees | | 304
2,253 | | 2,120,640
2,159,600 | | 37.0
37.7 | %
% | | 6,976
959 | | | Total | | 2,585 | | 5,727,240 | | 100 | % | | 2,216 |
| | | | | | | | | | | | | | | | | Number of
beneficiaries | | Number of
options
awarded(i) | | Percentage | | | Average number
of options per
beneficiary(i) | 2007 Plan(d): | | | | | | | | | | | | Subscription options | | Executive officers(g)(h) | | 27 | | 1,329,360 | | 22,8 | % | | 49,236 | (Decision of the Board on July 17, 2007; exercise price:€60.10; discount: 0.0%) | | Senior managers Other employees | | 298
2,401 | | 2,162,270
2,335,600 | | 37,1
40,1 | %
% | | 7,256
973 | | | Total | | 2,726 | | 5,827,230 | | 100 | % | | 2,138 | | | | | | | 2008 Plan(e): | | | | | | | | | | | | Subscription options | | Executive officers(g)(h) | | 26 | | 1,227,500 | | 27.6 | % | | 47,212 | (Grant decided by the Board of Directors on September 9, 2008 and awarded on October 9, 2008; exercise price:€42.90; discount: 0.0%) | | Senior managers Other employees | | 298
1,690 | | 1,988,420
1,233,890 | | 44.7
27.7 | %
% | | 6,673
730 | | | Total | | 2,014 | | 4,449,810 | | 100 | % | | 2,209 |
(a) | Options are exercisable after a four-year vesting period from the date of the Board meeting awarding the options and expire eight years after this date. The underlying shares may not be transferred during the five-year period from the date of the Board meeting awarding the options. |
(b) | Options are exercisable after January 1, 2005, and expire eight years after the date of the Board meeting awarding the options. The underlying shares may not be transferred during the four-year period from the date of the Board meeting awarding the options. |
(c) | Options are exercisable after a two-year vesting period from the date of the Board meeting awarding the options and expire eight years after this date. The underlying shares may not be transferred during the four-year period from the date of the Board meeting awarding the options. |
(d) | Options are exercisable after a two-year vesting period from the date of the Board meeting awarding the options and expire eight years after this date. The underlying shares may not be transferred during the four-year period from the date of the Board meeting awarding the options. The four-year transfer restriction period does not apply to employees of non-French subsidiaries as of July 17, 2007, who may transfer the underlying shares after July 18, 2009. |
(e) | Options are exercisable after a two-year vesting period from the date of the Board meeting awarding the options and expire eight years after this date. The underlying shares may not be transferred during the four-year period from the date of the Board meeting awarding the options. The four-year transfer restriction period does not apply to employees of non-French subsidiaries as of October 09, 2008, who may transfer the underlying shares after October 10, 2010. |
(f) | Certain employees of the Elf Aquitaine group in 1998 also benefited in 2000, 2001, 2002 and 2003 from the vesting of Elf Aquitaine options awarded in 1998 subject to performance conditions related to the Elf Aquitaine group from 1998 to 2002. These Elf Aquitaine plans expired on March 31, 2005. |
(g) | Members of the Management Committee and the Treasurer as of the date of the Board meeting awarding the options. |
(h) | The Chairman of the Board, not being a member of the ManagementAudit Committee as of the Board of Directors meetings held on July 17, 2007 and September 9, 2008, is not included in the Executive Officers. The Chairman was granted 110,000 options by the July 17, 2007 Board meeting and no option as decided by the Board of Directors on September 9, 2008. |
(i) | To take into account the spin-off of Arkema, pursuant to Articles 174-9, 174-12 and 174-13 of Decree number 67-236 of March 23, 1967, effective at that time and as of the date of the shareholders’ meeting onuntil May 12, 2006, at its meeting of March 14, 2006, the Board of Directors resolved to adjust the rights of holders of TOTAL stock options. For each plan and each holder, the exercise prices for TOTAL stock options were multiplied by 0.986147 and the number of unexercised stock options was multiplied by 1.014048 (and then rounded up), effective as of May 24, 2006. Additionally, to take into account the four-for-one stock split approved by the shareholders’ meeting on May 12, 2006, the exercise price for stock options was divided by four and the number of unexercised stock options was multiplied by four. The presentation in this table of the number of options initially awarded has not been adjusted to reflect the four-for-one stock split. |
TOTAL STOCK OPTIONS AS OF DECEMBER 31, 2008
| | | | | | | | | | | | | | | | | | | | | | | | | | | | | | | | | | 2000 Plan | | | 2001 Plan | | | 2002 Plan | | | 2003 Plan | | | 2004 Plan | | | 2005 Plan | | | 2006 Plan | | | 2007 Plan | | | 2008 Plan | | | Total | | Type of options | | Purchase
options |
| | Purchase
options |
| | Purchase
options |
| | Subscription
options |
| | Subscription
options |
| | Subscription
options |
| | Subscription
options |
| | Subscription
options |
| | Subscription
options |
| | | | Date of the shareholders’ meeting | | May 21,
1997 |
| | May 17,
2001 |
| | May 17,
2001 |
| | May 17,
2001 |
| | May 14,
2004 |
| | May 14,
2004 |
| | May 14,
2004 |
| | May 11,
2007 |
| | May 11,
2007 |
| | | | Date of the award(a) | | July 11,
2000 |
| | July 10,
2001 |
| | July 9,
2002 |
| | July 16,
2003 |
| | July 20,
2004 |
| | July 19,
2005 |
| | July 18,
2006 |
| | July 17,
2007 |
| | October 9,
2008 |
| | | | Total number of options granted, including(b): | | 9,702,580 | | | 10,773,500 | | | 11,483,400 | | | 11,741,224 | | | 13,462,520 | | | 6,104,480 | | | 5,727,240 | | | 5,937,230 | | | 4,449,810 | | | 79,381,984 | | • directors(c) | | 200,000 | | | 300,000 | | | 240,000 | | | 240,000 | | | 240,000 | | | 240,720 | | | 400,720 | | | 310,840 | | | 200,660 | | | 2,372,940 | | • T. Desmarest | | 200,000 | | | 300,000 | | | 240,000 | | | 240,000 | | | 240,000 | | | 240,000 | | | 240,000 | | | 110,000 | | | — | | | 1,810,000 | | • C. de Margerie | | n/a | | | n/a | | | n/a | | | n/a | | | n/a | | | n/a | | | 160,000 | | | 200,000 | | | 200,000 | | | 560,000 | | • D. Boeuf | | n/a | | | n/a | | | n/a | | | n/a | | | — | | | 720 | | | 720 | | | 840 | | | 660 | | | 2,940 | | Additional award | | — | | | 16,000 | | | — | | | — | | | 24,000 | | | 134,400 | | | — | | | — | | | — | | | 174,400 | | Adjustments related to the spin-off of Arkema(d) | | 84,308 | | | 113,704 | | | 165,672 | | | 163,180 | | | 196,448 | | | 90,280 | | | — | | | — | | | — | | | 813,592 | | Date as of which the options may be exercised | | July 12,
2004 |
(e) | | January 1,
2005 |
| | July 10,
2004 |
| | July 17,
2005 |
| | July 21,
2006 |
| | July 20,
2007 |
| | July 19,
2008 |
| | July 18,
2009 |
| | October 10,
2010 |
| | | | Expiration date | | July 11,
2008 |
| | July 10,
2009 |
| | July 9,
2010 |
| | July 16,
2011 |
| | July 20,
2012 |
| | July 19,
2013 |
| | July 18,
2014 |
| | July 17,
2015 |
| | October 9,
2016 |
| | | | Exercise price (€)(f) | | 40.11 | | | 41.47 | | | 39.03 | | | 32.84 | | | 39.30 | | | 49.04 | | | 50.60 | | | 60.10 | | | 42.90 | | | | | Cumulated number of options exercised as of December 31, 2008 | | 9,220,289 | | | 6,115,039 | | | 5,107,425 | | | 4,315,134 | | | 655,895 | | | 38,497 | | | 8,620 | | | — | | | — | | | | | Cumulated number of options cancelled as of December 31, 2008 | | 566,599 | | | 96,739 | | | 90,790 | | | 87,922 | | | 259,896 | | | 98,959 | | | 67,564 | | | 51,785 | | | 6,000 | | | | | Number of options: | | | | | | | | | | | | | | | | | | | | | | | | | | | | | | | • Outstanding as of January 1, 2008 | | 3,142,188 | | | 5,150,258 | | | 7,063,183 | | | 8,368,378 | | | 13,197,236 | | | 6,243,438 | | | 5,711,060 | | | 5,920,105 | | | — | | | 54,795,846 | | • Granted in 2008 | | — | | | — | | | — | | | — | | | — | | | — | | | — | | | — | | | 4,449,810 | | | 4,449,810 | | • Cancelled in 2008 | | (480,475 | ) | | (3,652 | ) | | (13,392 | ) | | (25,184 | ) | | (118,140 | ) | | (34,032 | ) | | (53,304 | ) | | (34,660 | ) | | (6,000 | ) | | (768,839 | ) | • Exercised in 2008 | | (2,661,713 | ) | | (455,180 | ) | | (598,934 | ) | | (841,846 | ) | | (311,919 | ) | | (17,702 | ) | | (6,700 | ) | | — | | | — | | | (4,893,994 | ) | • Outstanding as of December 31, 2008 | | — | | | 4,691,426 | | | 6,450,857 | | | 7,501,348 | | | 12,767,177 | | | 6,191,704 | | | 5,651,056 | | | 5,885,445 | | | 4,443,810 | | | 53,582,823 | |
(a) | The date of the award is the date of the Board meeting awarding the options, except for the share subscription option plan of October 9, 2008 decided by the Board on September 9, 2008. |
(b) | The number of options awarded before May 23, 2006, has been multiplied by four to take into account the four-for-one stock split approved by TOTAL’s shareholders’ meeting on May 12, 2006. |
(c) | Options awarded to directors at the time of award. For the share subscription option plan of July 18, 2006, options awarded to Messrs. Thierry Desmarest, Chairman of the Board of Directors and CEO, Christophe de Margerie, Board member, and Daniel Boeuf, the director representing employee shareholders. For the share subscription option plan of July 17, 2007 and October 9, 2008, options awarded to Messrs. Desmarest, Chairman, de Margerie, CEO, and Boeuf, director representing employee shareholders. |
(d) | Adjustments approved by the Board on March 14, 2006 pursuant to Articles 174-9, 174-12 and 174-13 of Decree No. 67-236 dated March 23, 1967 in effect at the time of the Board meeting as well as at the time of the shareholders’ meeting of TOTAL S.A. on May 12, 2006, related to the spin-off of Arkema. The adjustments were made on May 22, 2006 and became effective on May 24, 2006. |
(e) | January 1, 2004 for employees under contract with a subsidiary incorporated outside of France. |
(f) | Exercise price as of May 24, 2006. To take into account the four-for-one stock split that took place on May 18, 2006, the exercise price of stock options from plans then-current has been divided by four. In addition, to take into account the Arkema spin-off, the exercise price of stock options was multiplied by an adjustment ratio of 0.986147, effective as of May 24, 2006. Exercise prices prior to May 24, 2006, are shown in Note 25 to the Consolidated Financial Statements. |
If all the outstanding stock options as of December 31, 2008, were exercised, the corresponding shares would represent 2.22%(1) of the Company’s potential share capital as of December 31, 2008.
(1) | Out of a total potential share capital of 2,415,383,826 shares, including 2,371,808,074 existing shares as of December 31, 2008, 42,965,666 shares that could be issued through the exercise of stock options awarded by the Company and 610,086 new shares that could be issued through the exercise of Elf Aquitaine options that benefit from exchange rights for TOTAL shares. |
TOTAL STOCK OPTIONS AWARDED TO EXECUTIVE OFFICERS (MANAGEMENT COMMITTEE AND TREASURER) AS OF DECEMBER 31, 2008
| | | | | | | | | | | | | | | | | | | | | | | | | | | | | 2000 Plan | | | 2001 Plan | | | 2002 Plan | | 2003 Plan | | | 2004 Plan | | | 2005 Plan | | 2006 Plan | | 2007 Plan | | 2008 Plan | | Total | | | Type of options | | Purchase
options | | | Purchase
options | | | Purchase
options | | Subscription
options | | | Subscription
options | | | Subscription
options | | Subscription
options | | Subscription
options | | Subscription
options | | | | Expiration date | | July 11, 2008 | | | July 10, 2009 | | | July 9, 2010 | | July 16, 2011 | | | July 20, 2012 | | | July 19, 2013 | | July 18, 2014 | | July 17, 2015 | | October 9, 2016 | | | | Exercise price (€)(a) | | 40.11 | | | 41.47 | | | 39.03 | | 32.84 | | | 39.30 | | | 49.04 | | 50.60 | | 60.10 | | 42.90 | | | | Options granted by the Board(b) | | 523,800 | | | 627,000 | | | 722,400 | | 808,904 | | | 1,028,000 | | | 882,240 | | 1,016,920 | | 1,203,840 | | 1,240,000 | | 8,053,104 | | Adjustments related to the spin-off of Arkema(c) | | 3,972 | | | 5,116 | | | 9,856 | | 10,492 | | | 14,500 | | | 12,316 | | — | | — | | — | | 56,252 | | Outstanding options as of January 1, 2008 | | 191,320 | | | 319,460 | | | 401,232 | | 536,268 | | | 1,033,500 | | | 894,664 | | 1,016,920 | | 1,203,840 | | | | 5,597,204 | | Options awarded in 2008(d) | | — | | | — | | | — | | — | | | — | | | — | | — | | — | | 1,240,000 | | 1,240,000 | | Options exercised in 2008 | | (177,120 | ) | | (2,500 | ) | | — | | (82,849 | ) | | (14,368 | ) | | — | | — | | — | | — | | (276,837 | ) | Options cancelled in 2008 | | (14,200 | ) | | — | | | — | | — | | | — | | | — | | — | | — | | — | | (14,200 | ) | Options outstanding as of December 31, 2008 | | — | | | 316,960 | | | 401,232 | | 453,419 | | | 1,019,132 | | | 894,664 | | 1,016,920 | | 1,203,840 | | 1,240,000 | | 6,546,167 | |
(a) | Exercise price as of May 24, 2006. To take into account the four-for-one stock split that took place on May 18, 2006, the exercise price of stock options from plans then-current has been divided by four. In addition, to take into account the Arkema spin-off, the exercise price of stock options was multiplied by an adjustment ratio of 0.986147, effective as of May 24, 2006. Exercise prices prior to May 24, 2006, are shown in Note 25 to the Consolidated Financial Statements. |
(b) | The number of options awarded before May 23, 2006, has been multiplied by four to take into account the four-for-one stock split approved by TOTAL’s shareholders’ meeting on May 12, 2006. |
(c) | Adjustments approved by the Board on March 14, 2006, pursuant to Articles 174-9, 174-12 and 174-13 of Decree No. 67-236 dated March 23, 1967 in effect at the time of the Board meeting as well as at the time of the shareholders’ meeting of TOTAL S.A. on May 12, 2006, related to the spin-off of Arkema. The adjustments were made on May 22, 2006 and became effective on May 24, 2006. |
(d) | The number of options awarded in 2008 to executive officers, having this title as of December 31, 2008, does not match the amount shown in the table “— TOTAL stock options as of December 31, 2008”, due to the appointment of a new Management Committee member after the date the Board decided the share option plan. |
Certain executive officers of TOTAL as of December 31, 2008, who were previously with the Elf Aquitaine group hold Elf Aquitaine options that, upon exercise, benefit from exchange rights for TOTAL shares based upon the exchange ratio used in the public tender offer of TOTAL for Elf Aquitaine in 1999, adjusted on May 22, 2006 to six TOTAL shares for each Elf Aquitaine share in order to take into account the Arkema spin-off and the four-for-one stock split.
Furthermore, as part of the share subscription option plans of July 17, 2007, and October 9, 2008, the Board of Directors required that for each beneficiary of more than 25,000 stock options, the grant be subject to a performance condition.
In addition, Mr. Daniel Boeuf, the director representing employee shareholders, has not exercised any option in 2008 and was awarded 660 share subscription options on October 9, 2008.
TOTAL STOCK OPTIONS AWARDED TO MR. THIERRY DESMAREST, CHAIRMAN OF THE BOARD OF TOTAL S.A.
| | | | | | | | | | | | | | | | | | | | | | | | | | 2000 Plan | | 2001 Plan | | 2002 Plan | | | 2003 Plan | | 2004 Plan | | 2005 Plan | | 2006 Plan | | 2007 Plan | | 2008 Plan | | Total | | | Type of options | | Purchase
options | | Purchase
options | | Purchase
options | | | Subscription
options | | Subscription
options | | Subscription
options | | Subscription
options | | Subscription
options | | Subscription
options | | | | Expiration date | | July 11, 2008 | | July 10, 2009 | | July 9, 2010 | | | July 16, 2011 | | July 20, 2012 | | July 19, 2013 | | July 18, 2014 | | July 17, 2015 | | October 9, 2016 | | | | Exercise price (€)(a) | | 40.11 | | 41.47 | | 39.03 | | | 32.84 | | 39.30 | | 49.04 | | 50.60 | | 60.10 | | 42.90 | | | | Options granted by the Board(b) | | 200,000 | | 300,000 | | 240,000 | | | 240,000 | | 240,000 | | 240,000 | | 240,000 | | 110,000 | | — | | 1,810,000 | | Adjustments related to the spin-off of Arkema(c) | | — | | 2,532 | | 3,372 | | | 2,476 | | 3,372 | | 3,372 | | — | | — | | — | | 15,124 | | Outstanding options as of January 1, 2008 | | — | | — | | 209,372 | | | — | | 243,372 | | 243,372 | | 240,000 | | 110,000 | | | | 1,046,116 | | Options awarded in 2008 | | — | | — | | — | | | — | | — | | — | | — | | — | | — | | — | | Options exercised in 2008 | | — | | — | | (139,000 | ) | | — | | — | | — | | — | | — | | — | | (139,000 | ) | Options outstanding as of December 31, 2008 | | — | | — | | 70,372 | | | — | | 243,372 | | 243,372 | | 240,000 | | 110,000 | | — | | 907,116 | |
(a) | Exercise price as of May 24, 2006. To take into account the four-for-one stock split that took place on May 18, 2006, the exercise price of stock options from plans then-current has been divided by four. In addition, to take into account the Arkema spin-off, the exercise price of stock options was multiplied by an adjustment ratio of 0.986147, effective as of May 24, 2006. Exercise prices prior to May 24, 2006, are shown in Note 25 to the Consolidated Financial Statements. |
(b) | The number of options awarded before May 23, 2006, has been multiplied by four to take into account the four-for-one stock split approved by TOTAL’s shareholders’ meeting on May 12, 2006. |
(c) | Adjustments approved by the Board on March 14, 2006, pursuant to Articles 174-9, 174-12 and 174-13 of Decree No. 67-236 dated March 23, 1967, in effect at the time of the Board meeting as well as at the time of the shareholders’ meeting of TOTAL S.A. on May 12, 2006, related to the spin-off of Arkema. The adjustments were made on May 22, 2006, and became effective on May 24, 2006. |
As part of the plan awarded on July 17, 2007, the Board has conditioned the award of these options to the Chairman of the Board on the fulfillment of a performance condition.
As of December 31, 2008, the Chairman of the Board of Directors’ outstanding options represent 0.038%(1) of the Company’s potential share capital as of December 31, 2008, and the exercise price of such options exceeds the price of the underlying shares.
(1) | Out of a total potential share capital of 2,415,383,826 shares, including 2,371,808,074 existing shares as of December 31, 2008, 42,965,666 shares that could be issued through the exercise of stock options awarded by the Company and 610,086 new shares that could be issued through the exercise of Elf Aquitaine options that benefit from exchange rights for TOTAL shares. |
TOTAL STOCK OPTIONS AWARDED TO MR. CHRISTOPHE DE MARGERIE,
CHIEF EXECUTIVE OFFICER OF TOTAL S.A.
| | | | | | | | | | | | | | | | | | | | | | | | | | 2000 Plan | | | 2001 Plan | | 2002 Plan | | 2003 Plan | | 2004 Plan | | 2005 Plan | | 2006 Plan | | 2007 Plan | | 2008 Plan | | Total | | | Type of options | | Purchase
options | | | Purchase
options | | Purchase
options | | Subscription
options | | Subscription
options | | Subscription
options | | Subscription
options | | Subscription
options | | Subscription
options | | | | Expiration date | | July 11,
2008 |
| | July 10,
2009 | | July 9,
2010 | | July 16,
2011 | | July 20,
2012 | | July 19,
2013 | | July 18,
2014 | | July 17,
2015 | | October 9,
2016 | | | | Exercise price (€)(a) | | 40.11 | | | 41.47 | | 39.03 | | 32.84 | | 39.30 | | 49.04 | | 50.60 | | 60.10 | | 42.90 | | | | Options granted by the Board(b) | | 72,000 | | | 88,000 | | 112,000 | | 112,000 | | 128,000 | | 130,000 | | 160,000 | | 200,000 | | 200,000 | | 1,202,000 | | Adjustments related to the spin-off of Arkema(c) | | 1,012 | | | 1,240 | | 1,576 | | 1,576 | | 1,800 | | 1,828 | | — | | — | | — | | 9,032 | | Outstanding options as of January 1, 2008 | | 73,012 | | | 89,240 | | 113,576 | | 113,576 | | 129,800 | | 131,828 | | 160,000 | | 200,000 | | | | 1,011,032 | | Options awarded in 2008 | | — | | | — | | — | | — | | — | | — | | — | | — | | 200,000 | | 200,000 | | Options exercised in 2008 | | (73,012 | ) | | — | | — | | — | | — | | — | | — | | — | | — | | (73,012 | ) | Options outstanding as of December 31, 2008 | | — | | | 89,240 | | 113,576 | | 113,576 | | 129,800 | | 131,828 | | 160,000 | | 200,000 | | 200,000 | | 1,138,020 | |
(a) | Exercise price as of May 24, 2006. To take into account the four-for-one stock split that took place on May 18, 2006, the exercise price of stock options from plans then-current was divided by four. In addition, to take into account the Arkema spin-off, the exercise price of stock options was multiplied by an adjustment ratio of 0.986147, effective as of May 24, 2006. Exercise prices prior to May 24, 2006, are shown in Note 25 to the Consolidated Financial Statements. |
(b) | The number of options awarded before May 23, 2006, has been multiplied by four to take into account the four-for-one stock split approved by TOTAL’s shareholders’ meeting on May 12, 2006. |
(c) | Adjustments approved by the Board on March 14, 2006 pursuant to Articles 174-9, 174-12 and 174-13 of Decree No. 67-236 dated March 23, 1967, in effect at the time of the Board meeting as well as at the time of the shareholders’ meeting of TOTAL S.A. on May 12, 2006, related to the spin-off of Arkema. The adjustments were made on May 22, 2006, and became effective on May 24, 2006. |
As part of the plans awarded on July 17, 2007 and October 9, 2008, the Board has conditioned the award of these options to the Chief Executive Officer on the fulfillment of a performance condition.
As of December 31, 2008, the Chief Executive Officer’s outstanding options represent 0.047%(1) of the Company’s potential share capital as of December 31, 2008, and only the exercise price of the 2003 Plan options is below the price of the underlying shares.
(1) | Out of a total potential share capital of 2,415,383,826 shares, including 2,371,808,074 existing shares as of December 31, 2008, 42,965,666 shares that could be issued through the exercise of stock options awarded by the Company and 610,086 new shares that could be issued through the exercise of Elf Aquitaine options that benefit from exchange rights for TOTAL shares. |
STOCK OPTIONS AWARDED TO THE TEN EMPLOYEES (OTHER THAN DIRECTORS) RECEIVING THE LARGEST AWARDS/STOCK OPTIONS EXERCISED BY THE TEN EMPLOYEES (OTHER THAN DIRECTORS) EXERCISING THE LARGEST NUMBER OF OPTIONS
| | | | | | | | | | | | | Total number of options
awarded/options
exercised | | Exercise price (€) | | | Date of the award(a) | | Expiration date | Options awarded in 2008 to the ten employees of TOTAL S.A., or any company in the Group, receiving the largest number of options | | 700,000 | | 42.90 | | | 10/09/2008 | | 10/09/2016 | Options exercised in 2008 by the ten employees of TOTAL S.A., or any company in the Group, exercising the largest number of options(b) | | 114,256 | | 40.11 | | | 07/11/2000 | | 07/11/2008 | | | 42,430 | | 41.47 | | | 07/10/2001 | | 07/10/2009 | | | 34,168 | | 39.03 | | | 07/09/2002 | | 07/09/2010 | | | 96,284 | | 32.84 | | | 07/16/2003 | | 07/16/2011 | | | 12,172 | | 39.30 | | | 07/20/2004 | | 07/20/2012 | | | 299,310 | | 37.81 | (c) | | | | |
(a) | The date of the award is the date of the Board meeting awarding the options, except for the share subscription option plan awarded on October 9, 2008, decided by the Board on September 9, 2008. |
(b) | Exercise price as of May 24, 2006. To take into account the four-for-one stock split that took place on May 18, 2006, the exercise price of stock options from plans then-current has been divided by four. In addition, to take into account the Arkema spin-off, the exercise price of stock options was multiplied by an adjustment ratio of 0.986147, effective as of May 24, 2006. Exercise prices prior to May 24, 2006, are shown in Note 25 to the Consolidated Financial Statements. |
(c) | Weighted-average price. |
TOTAL restricted share grants
The following table gives a breakdown of restricted share grants by category of grantee (executive officers, senior managers and other employees).
| | | | | | | | | | | | | | | | Number of
grantees | | Number of
restricted shares
granted(a) | | Percentage | | Average number
of restricted
shares per
beneficiary | 2005 Plan(b) | | Executive Officers(f) | | 29 | | 13,692 | | 2.4% | | 472 | (Decision of the Board on July 19, 2005) | | Senior managers | | 330 | | 74,512 | | 13.1% | | 226 | | | Other employees(g) | | 6,956 | | 481,926 | | 84.5% | | 69 | | | Total | | 7,315 | | 570,130 | | 100% | | 78 | 2006 Plan(c) | | Executive Officers(f) | | 26 | | 49,200 | | 2.2% | | 1,892 | (Decision of the Board on July 18, 2006) | | Senior managers | | 304 | | 273,832 | | 12.0% | | 901 | | | Other employees(g) | | 7,509 | | 1,952,332 | | 85.8% | | 260 | | | Total | | 7,839 | | 2,275,364 | | 100% | | 290 | 2007 Plan(d) | | Executive Officers(f) | | 26 | | 48,928 | | 2.1% | | 1,882 | (Decision of the Board on July 17, 2007) | | Senior managers | | 297 | | 272,128 | | 11.5% | | 916 | | | Other employees(g) | | 8,291 | | 2,045,309 | | 86.4% | | 247 | | | Total | | 8,614 | | 2,366,365 | | 100% | | 275 | 2008 Plan(e) | | Executive Officers(f) | | 25 | | 49,100 | | 1.8% | | 1,964 | (Decision of the Board on September 9, 2008, and awarded on October 9, 2008) | | Senior managers | | 300 | | 348,156 | | 12.5% | | 1,161 | | | Other employees(g) | | 9,028 | | 2,394,712 | | 85.8% | | 265 | | | Total | | 9,353 | | 2,791,968 | | 100% | | 299 |
(a) | The number of restricted shares granted shown in this table has not been recalculated to take into account the four-for-one stock split approved by the shareholders’ meeting on May 12, 2006. |
(b) | Grant approved by the Board on July 19, 2005, pursuant to the authorization given by the shareholders’ meeting on May 17, 2005. These restricted shares, which the Company purchased on the market in 2005, were finally granted after a two-year vesting period (i.e., on July 20, 2007). The final grant was conditioned to fulfilling a performance condition. The Board of Directors on May 3, 2007, noticed that the acquisition rate, connected to the performance condition, amounted to 100%. Moreover, the transfer of the restricted shares will not be permitted between the date of final grant and the end of a two-year mandatory holding period, on July 20, 2009. To provide for the eventual final grant of these restricted shares, the Company purchased 574,000 previously issued shares, par value€10 per share, on the market at an average price of€206.49 per share, par value€10 per share, the equivalent of an average price of€51.62 per share, par value€2.50 per share. |
(c) | Grant approved by the Board on July 18, 2006, pursuant to the authorization given by the shareholders’ meeting on May 17, 2005. These restricted shares, which the Company purchased on the market in 2006, were finally granted after a two-year vesting period (i.e., on July 19, 2008). The final grant was conditioned to fulfilling a performance condition. The Board of Directors on May 6, 2008, noticed that the acquisition rate, connected to the performance condition, amounted to 100%. Moreover, the transfer of the restricted shares will not be permitted until the end of a two-year mandatory holding period (i.e., from July 19, 2010). To provide for the eventual final grant of these restricted shares, the Company purchased 2,295,684 previously issued shares at an average price of€51.91 per share. |
(d) | Grant approved by the Board on July 17, 2007, pursuant to the authorization given by the shareholders’ meeting on May 17, 2005. Grants of these restricted shares, which the Company purchased on the market in 2007, will become final, subject to performance conditions after a two-year vesting period (i.e., on July 18, 2009). Moreover, the transfer of the restricted shares will not be permitted until the end of a two-year mandatory holding period (i.e., on July 18, 2011). To provide for the eventual final grant of these restricted shares, the Company purchased 2,387,355 previously issued shares at an average price of€61.49 per share. |
(e) | Shares granted on October 9, 2008, as decided by the Board at its meeting on September 9, 2008, pursuant to the authorization given by the shareholders’ meeting on May 16, 2008. Grants of these restricted shares, which the Company purchased on the market in 2008, will become final, subject to performance conditions after a two-year vesting period (i.e., on October 10, 2010). Moreover, the transfer of the restricted shares will not be permitted until the end of a two-year mandatory holding period (i.e., on October 10, 2012). To provide for the eventual final grant of these restricted shares, the Company purchased 2,800,000 previously issued shares at an average price of€41.63 per share. |
(f) | Members of the Management Committee and the Treasurer as of the date of the Board meeting granting the restricted shares. The Chairman of the Board and the Chief Executive Officer were not granted restricted shares under the 2006, 2007 and 2008 Plans. |
(g) | Mr. Daniel Boeuf, employee of Total Raffinage Marketing, a subsidiary of TOTAL S.A. and the director of TOTAL S.A. representing employee shareholders, was granted 416 restricted shares by the July 19, 2005 Board meeting, 416 restricted shares by the July 18, 2006 Board meeting, 432 restricted shares by the July 17, 2007 Board meeting and 588 shares by the September 9, 2008 Board meeting. |
RESTRICTED SHARE PLANS AS OF DECEMBER 31, 2008
| | | | | | | | | | | | | | | | 2005 Plan(a)(b) | | | 2006 Plan(c) | | | 2007 Plan(d) | | | 2008 Plan(e) | | Date of the shareholders’ meeting | | May 17, 2005 | | | May 17, 2005 | | | May 17, 2005 | | | May 16, 2008 | | Date of the award(f) | | July 19, 2005 | | | July 18, 2006 | | | July 17, 2007 | | | October 9, 2008 | | Closing price on the date of the award(g) | | €52.13 | | | €50.40 | | | €61.62 | | | €35.945 | | Average repurchase price per share paid by the Company | | €51.62 | | | €51.91 | | | €61.49 | | | €41.63 | | Total number of restricted shares granted to | | 2,280,520 | | | 2,275,364 | | | 2,366,365 | | | 2,791,968 | | • directors(h) | | 416 | | | 416 | | | 432 | | | 588 | | • ten employees with largest grants(i) | | 20,000 | | | 20,000 | | | 20,000 | | | 20,000 | | Start of the vesting period | | July 19, 2005 | | | July 18, 2006 | | | July 17, 2007 | | | October 9, 2008 | | Date of final grant, subject to specified condition (end of the vesting period) | | July 20, 2007 | | | July 19, 2008 | | | July 18, 2009 | | | October 10, 2010 | | Transfer possible from (end of the holding period) | | July 20, 2009 | | | July 19, 2010 | | | July 18, 2011 | | | October 10, 2012 | | Number of restricted shares: | | | | | | | | | | | | | • Outstanding as of January 1, 2008 | | — | | | 2,263,956 | | | 2,363,057 | | | — | | • Granted in 2008 | | — | | | — | | | — | | | 2,791,968 | | • Cancelled in 2008 | | 2,840 | (k) | | (43,822 | ) | | (29,504 | ) | | (19,220 | ) | • Finally granted in 2008(j) | | (2,840 | )(k) | | (2,220,134 | ) | | (336 | ) | | — | | • Outstanding as of December 31, 2008 | | — | | | — | | | 2,333,217 | | | 2,772,748 | |
(a) | Grant approved by the Board on July 19, 2005, pursuant to the authorization given by the shareholders’ meeting on May 17, 2005. These restricted shares, which the Company purchased on the market in 2005, were finally granted after a two-year vesting period (i.e., on July 20, 2007). The final grant was conditioned to fulfilling a performance condition. The Board of Directors on May 3, 2007, noticed that the acquisition rate, connected to the performance condition, amounted to 100%. Moreover, the transfer of the restricted shares will not be permitted between the date of final grant and the end of a two-year mandatory holding period, on July 20, 2009. To provide for the eventual final grant of these restricted shares, the Company purchased 574,000 previously issued shares, par value€10 per share, on the market at an average price of€206.49 per share, par value€10 per share, the equivalent of an average price of€51.62 per share, par value€2.50 per share. |
(b) | The number of restricted shares granted has been multiplied by four to take into account the four-for-one stock split approved by TOTAL shareholders’ meeting on May 12, 2006. |
(c) | Grant approved by the Board on July 18, 2006, pursuant to the authorization given by the shareholders’ meeting on May 17, 2005. These restricted shares, which the Company purchased on the market in 2006, were finally granted after a two-year vesting period (i.e., on July 19, 2008). The final grant was conditioned to fulfilling a performance condition. The Board of Directors on May 6, 2008, noticed that the acquisition rate, connected to the performance condition, amounted to 100%. Moreover, the transfer of the restricted shares will not be permitted until the end of a two-year mandatory holding period (i.e., from July 19, 2010). |
(d) | Grant approved by the Board on July 17, 2007, pursuant to the authorization given by the shareholders’ meeting on May 17, 2005. Grants of these restricted shares, which the Company purchased on the market in 2007, will become final, subject to performance conditions, after a two-year vesting period (i.e., on July 18, 2009). Moreover, the transfer of the restricted shares will not be permitted until the end of a two-year mandatory holding period (i.e., on July 18, 2011). To provide for the eventual final grant of these restricted shares, the Company purchased 2,387,355 previously issued shares at an average price of€61.49 per share. |
(e) | Shares granted on October 9, 2008, as decided by the Board at its meeting on September 9, 2008, pursuant to the authorization given by the shareholders’ meeting on May 16, 2008. Grants of these restricted shares, which the Company purchased on the market in 2008, will become final, subject to performance conditions after a two-year vesting period (i.e., on October 10, 2010). Moreover, the transfer of the restricted shares will not be permitted until the end of a two-year mandatory holding period (i.e., on October 10, 2012). To provide for the eventual final grant of these restricted shares, the Company purchased 2,800,000 previously issued shares at an average price of€41.63 per share. |
(f) | The date of the award is the date of the Board meeting awarding the restricted share grant, except for the restricted shares awarded on October 9, 2008, decided by the Board on September 9, 2008. |
(g) | The closing price for TOTAL shares on July 19, 2005 (€208.50) has been divided by four in order to take into account the four-for-one stock split. The average repurchase price per share in 2005 (€206.49) has also been divided by four. |
(h) | The Chairman of the Board was not granted restricted shares by the Board meetings on July 19, 2005, July 18, 2006, July 17, 2007, and September 9, 2008. Furthermore, Mr. Christophe de Margerie, Director of TOTAL S.A. since May 12, 2006 and Chief Executive Officer of TOTAL S.A. since February 13, 2007, was not granted restricted shares by the Board meetings of July 18, 2006, July 17, 2007, and September 9, 2008. The Chief Executive Officer was finally granted on July 20, 2007, the 2,000 restricted shares he had been granted by the Board meeting of July 19, 2005, date at which he was not a director of TOTAL S.A. Mr. Daniel Boeuf, the director of TOTAL S.A. representing employee shareholders, was finally granted on July 19, 2008, the 416 shares he had been granted by the July 18, 2006, Board meeting, and was granted 588 restricted shares by the September 9, 2008, Board meeting. |
(i) | Employees of TOTAL S.A., or of any Group company, who were not directors of TOTAL S.A. as of the date of grant. |
(j) | For the 2007 Plan, final grants following the death of the beneficiary. |
(k) | Final restricted share grants for which entitlement right had been cancelled erroneously. |
In case of a final award of the outstanding restricted shares as of December 31, 2008, the corresponding shares would represent 0.21%(1) of the Company’s potential share capital as of such date.
(1) | Out of a total potential share capital of 2,415,383,826 shares, including 2,371,808,074 existing shares as of December 31, 2008, 42,965,666 shares that could be issued through the exercise of stock options awarded by the Company and 610,086 new shares that could be issued through the exercise of Elf Aquitaine options that benefit from exchange rights for TOTAL shares. |
RESTRICTED SHARE GRANTS TO THE TEN EMPLOYEES (OTHER THAN DIRECTORS) RECEIVING THE LARGEST AMOUNT OF GRANTS/RESTRICTED SHARES FINALLY GRANTED TO THE TEN EMPLOYEES (OTHER THAN DIRECTORS AT THE TIME) RECEIVING THE MOST SHARES
| | | | | | | | | | | Restricted share
grants/Shares
finally granted | | Date of the award | | Date of the final grant | | End of the holding
period | TOTAL restricted share grants decided by the Board meeting of September 9, 2008 to the ten employees (other than directors) receiving the largest amount of grants(a)
| | 20,000 | | 10/09/2008 | | 10/10/2010 | | 10/10/2012 | TOTAL restricted shares finally granted in 2008, following the decision by the Board meeting of July 18, 2006, to the ten employees (other than directors at the time) receiving the largest amount of shares(b)
| | 20,000 | | 07/18/2006 | | 07/19/2008 | | 07/19/2010 |
(a) | Shares granted on October 9, 2008, as decided by the Board at its meeting on September 9, 2008, pursuant to the authorization given by the shareholders’ meeting on May 16, 2008. Grants of these restricted shares, which the Company purchased on the market in 2008, will become final, subject to performance conditions after a two-year vesting period (i.e., on October 10, 2010). Moreover, the transfer of the restricted shares will not be permitted until the end of a two-year mandatory holding period (i.e., on October 10, 2012). |
(b) | Grant approved by the Board on July 18, 2006, pursuant to the authorization given by the shareholders’ meeting on May 17, 2005. These restricted shares, which the Company purchased on the market in 2006, were finally granted after a two-year vesting period (i.e., on July 19, 2008). The final grant was conditioned to fulfilling a performance condition. The Board of Directors on May 6, 2008, noticed that the acquisition rate, connected to the performance condition, amounted to 100%. Moreover, the transfer of the restricted shares will not be permitted until the end of a two-year mandatory holding period (i.e., from July 19, 2010). |
Elf Aquitaine share subscription options
ELF AQUITAINE STOCK OPTIONS OF EXECUTIVE OFFICERS (MEMBERS OF THE MANAGEMENT COMMITTEE AND THE TREASURER AS OF DECEMBER 31, 2008)
Certain executive officers of TOTAL as of December 31, 2008, who were previously with the Elf Aquitaine group hold Elf Aquitaine options that, upon exercise, benefit from exchange rights for TOTAL shares based upon the exchange ratio used in the public tender offer of TOTAL for Elf Aquitaine in 1999.
This exchange ratio was adjusted on May 22, 2006, as described in note (c) to the table below as well as Note 25 to the Consolidated Financial Statements included elsewhere herein.
| | | Elf Aquitaine stock subscription plan | | 1999 Plan No.1 | Exercise price per Elf Aquitaine share (€)(a)
| | 114.76 | Expiration date
| | March 30, 2009 | Options awarded
| | 15,280 | Adjustments for S.D.A. spin-off(b)
| | 36 | Options outstanding as of January 1, 2008
| | 700 | Options exercised in 2008
| | — | Options outstanding as of December 31, 2008
| | 700 | Corresponding number of TOTAL shares, as of December 31, 2008, likely to be created pursuant to the exchange guarantee(c)
| | 4,200 |
(a) | Exercise price as of May 24, 2006. The exercise price for Elf Aquitaine share subscription options was adjusted to take into account the spin-off of S.D.A. (Société de Développement Arkema) by Elf Aquitaine. This adjustment consisted of multiplying the exercise price by 0.992769, effective as of May 24, 2006. Exercise prices prior to May 24, 2006, are shown in Note 25 to the Consolidated Financial Statements. |
(b) | Adjustments approved by the Board of Elf Aquitaine on March 10, 2006, pursuant to Articles 174-9, 174-12 and 174-13 of Decree No. 67-236 dated March 23, 1967, in effect at the time of this meeting as well as at the time of the shareholders’ meeting of Elf Aquitaine on May 10, 2006, related to the spin-off of S.D.A. The adjustments were made on May 22, 2006, and became effective on May 24, 2006. |
(c) | To take into account the spin-off of S.D.A. by Elf Aquitaine, the spin-off of Arkema by TOTAL S.A. and the four-for-one TOTAL stock split, on March 14, 2006 the Board of TOTAL S.A. approved an adjustment to the exchange ratio used under the exchange guarantee mentioned above. This exchange ratio was adjusted to become six TOTAL shares per each Elf Aquitaine share upon approval of the S.D.A. spin-off by the shareholders’ meeting of Elf Aquitaine on May 10, 2006, and of the Arkema spin-off as well as the four-for-one TOTAL stock split by the shareholders’ meeting of TOTAL S.A. on May 12, 2006.2011. |
ITEM 7. MAJOR SHAREHOLDERS AND RELATED PARTY TRANSACTIONS Major shareholders Holdings of major shareholders The major shareholders of TOTAL as of December 31, 2011, 2010 and 2009 are set forth in the table below. | | | | | | | | | | | | | | | | | | | | | | | | | | | | | | | | 2011 | | | 2010 | | | 2009 | | | As of December 31 | | % of
share
capital | | | % of
voting
rights | | | % of
theoretical
voting
rights(a) | | | % of
share
capital | | | % of
voting
rights | | | % of
share
capital | | | % of
voting
rights | | Groupe Bruxelles Lambert(b)(c) | | | 4.0 | | | | 4.0 | | | | 3.7 | | | | 4.0 | | | | 4.0 | | | | 4.0 | | | | 4.0 | | Compagnie Nationale à Portefeuille(b)(c) | | | 1.5 | | | | 1.6 | | | | 1.4 | | | | 1.6 | | | | 1.6 | | | | 1.4 | | | | 1.4 | | BNP Paribas(b) | | | 0.2 | | | | 0.2 | | | | 0.1 | | | | 0.2 | | | | 0.2 | | | | 0.2 | | | | 0.2 | | Group employees(b)(d) | | | 4.4 | | | | 8.0 | | | | 7.4 | | | | 4.0 | | | | 7.7 | | | | 3.9 | | | | 7.5 | | Other registered shareholders (non-Group) | | | 1.7 | | | | 2.8 | | | | 2.6 | | | | 1.4 | | | | 2.5 | | | | 1.4 | | | | 2.4 | | Treasury shares | | | 4.6 | | | | — | | | | 8.1 | | | | 4.8 | | | | — | | | | 4.9 | | | | — | | of which TOTAL S.A. | | | 0.4 | | | | — | | | | 0.4 | | | | 0.5 | | | | — | | | | 0.6 | | | | — | | of which Total Nucléaire | | | 0.1 | | | | — | | | | 0.2 | | | | 0.1 | | | | — | | | | 0.1 | | | | — | | of which subsidiaries of Elf Aquitaine | | | 4.2 | | | | — | | | | 7.6 | | | | 4.2 | | | | — | | | | 4.2 | | | | — | | Other bearer shareholders | | | 83.6 | | | | 83.5 | | | | 76.7 | | | | 84.0 | | | | 84.0 | | | | 84.2 | | | | 84.5 | | of which holders of ADS(e) | | | 8.7 | | | | 8.7 | | | | 8.0 | | | | 8.0 | | | | 8.0 | | | | 7.5 | | | | 7.6 | |
| (a) | Pursuant to article 223-11 of the AMF General Regulation, the number of theoretical voting rights is calculated on the basis of all outstanding shares to which voting rights are attached, including treasury shares that are deprived of voting rights. |
| (b) | Shareholders with an executive officer (or a representative of employees) or director serving as a director of TOTAL S.A. |
| (c) | Groupe Bruxelles Lambert is a company controlled jointly by the Desmarais family and Frère-Bourgeois S.A., and for the latter mainly through its direct and indirect interest in Compagnie Nationale à Portefeuille. In addition, Groupe Bruxelles Lambert and Compagnie Nationale à Portefeuille declared their acting in concert. |
| (d) | Based on the definition of employee shareholding pursuant to Article L. 225-102 of the French Commercial Code. |
| (e) | American Depositary Shares listed on the New York Stock Exchange. |
Major Shareholders
As of February 28, 2009,December 31, 2011, the holdings of the major shareholders were calculated based on 2,363,767,313 shares, representing 2,368,716,634 voting rights exercisable at Shareholders’ Meetings or 2,578,602,075 theoretical voting rights(1)including: 9,222,905 voting rights attached to the 9,222,905 TOTAL shares held by TOTAL S.A. that are deprived of voting rights; and 200,662,536 voting rights attached to the 100,331,268 TOTAL shares held by TOTAL S.A. subsidiaries that cannot be exercised at Shareholders’ Meetings. For prior years, the holdings of the major shareholders were established on the basis of 2,349,640,931 shares, to which were attached 2,350,274,592 voting rights that could be exercised at the Shareholders’ Meeting, as of December 31, 2010, and of 2,348,422,884 shares to which were attached 2,339,384,550 voting rights that could be exercised at the Shareholders’ Meeting, as of December 31, 2009. Identification of the holders of bearer shares In accordance with Article 9 of its by-laws, the Company is authorized, to the extent permitted under applicable law, to identify the holders of securities that grant immediate or future voting rights at the Company’s knowledge, Total Actionnariat France, an employee investment fund, heldShareholders’ Meetings. Temporary transfer of securities Pursuant to legal obligations, any legal entity or individual (with the exception of those described in paragraph IV-3° of Article L. 233-7 of the French Commercial Code) holding alone or together a number of shares representing 2.9%more than 0.5% of the Company’s voting rights pursuant to one or several temporary transfers or similar operations as described by Article L. 225-126 of the French Commercial Code is required to inform the Company and the French Financial Markets Authority of the number of shares temporarily held no later than the third business day preceding the shareholders’ meeting at midnight. | (1) | Pursuant to Article 223-11 of the AMF General Regulation, the number of theoretical voting rights is calculated on the basis of all outstanding shares, including those shares held by the Group that are deprived of voting rights. |
Declarations are to be e-mailed to the Company at: holding.df-shareholdingnotification@total.com. Failing to declare such information, any share bought under any of the above described temporary transfer operations shall be deprived of voting rights at the relevant Shareholders’ Meeting and 5.7%at any Shareholders’ Meeting that would be held until such shares are transferred again or returned. Thresholds notifications In addition to the legal obligation to inform the Company and the French Financial Markets Authority within four business days when thresholds representing 5%, 10%, 15%, 20%, 25%, 30%, 1/3, 50%, 2/3, 90% or 95% of the share capital or voting rights(1) are crossed (Article L. 233-7 of the French Commercial Code), any individual or entity who directly or indirectly comes to hold a percentage of the share capital, voting rights or rights giving future access to the share capital of the Company which is equal to or greater than 1%, or a multiple of this percentage, is required to notify the Company within fifteen days by registered mail with return receipt requested, and declare the number of securities held. In case the shares above these thresholds are not declared, any undeclared shares held in excess of the threshold may be deprived of voting rights at future Shareholders’ Meetings if, at that meeting, the failure to make a declaration is acknowledged and if one or more shareholders holding collectively at least 3% of the Company’s share capital or voting rights so request at that meeting. All individuals and entities are also required to notify the Company in due form and within the time limits stated above when their direct or indirect holdings fall below each of the aforementioned thresholds. Declarations are to be sent to the Vice President of the Investor Relations department in Paris. Legal threshold notifications in 2011 Société Générale reported that it had passed: on May 6, 2011, above the thresholds of 5% of the share capital and the voting rights of the Company, and that it held after crossing the thresholds 6.86% of the share capital and 6.29% of the voting rights inof the Company. In addition, Frère-Bourgeois S.A. (mainly through Compagnie Nationale à Portefeuille)Company; on May 25, 2011, below the thresholds of 5% of the share capital and the Desmarais family indirectly control Groupe Bruxelles Lambert. These parties have declared that, acting in concert, they hold 5.3%voting rights of the Company’s sharesCompany, and 5.4%that it held after crossing the thresholds 4.92% of the share capital and 4.50% of the voting rights. Neither Total Actionnariat France,rights of the Company. Holdings above the legal thresholds In accordance with Article L. 233-13 of the French Commercial Code, only one shareholder, Compagnie Nationale à Portefeuille nor(CNP) and Groupe Bruxelles Lambert has(GBL), acting in concert, holds 5% or more of TOTAL’s share capital at year-end 2011(2). In addition, two known shareholders held 5% or more of the voting rights different from other shareholdersexercisable at TOTAL Shareholders’ Meetings at year-end 2011: In the AMF notice No. 209C1156 dated September 2, 2009, CNP and GBL acting in concert declared that they held more than the threshold of 5% of the Company havingvoting rights of TOTAL as of August 25, 2009 and held their127,149,464 TOTAL shares in registered form for over two years.representing 127,745,604 voting rights,i.e. 5.42% of the share capital and 5.0009% of the theoretical voting rights(3) (based on a share capital of 2,347,601,812 shares representing 2,554,431,468 voting rights). To the Company’s knowledge, CNP, jointly with GBL, held, as of December 31, 2011, 5.52% of the share capital representing 5.53% of the voting rights exercisable at Shareholders’ Meetings and 5.08% of the theoretical voting rights(3). | • | | The collective investment fund (fonds commun de placement) “TOTAL ACTIONNARIAT FRANCE”: |
To the Company’s knowledge, the collective investment fund (fonds commun de placement) “TOTAL ACTIONNARIAT FRANCE” held, as of December 31, 2011, 3.33% of the share capital representing 6.12% of the voting rights exercisable at a Shareholders’ Meeting and 5.62% of the theoretical voting rights(3). Shareholders’ agreements TOTAL is not aware of any agreements among its shareholders. | (1) | Pursuant to Article 223-11 of the AMF General Regulation, the number of voting rights is calculated on the basis of all outstanding shares, including those shares held by the Group that are deprived of voting rights. |
| (2) | AMF notice No. 209C1156 dated September 2, 2009. |
| (3) | Pursuant to Article 223-11 of the AMF General Regulation, the number of theoretical voting rights is calculated on the basis of all outstanding shares, including those shares held by the Group that are deprived of voting rights. |
Treasury shares As of MarchDecember 31, 2009, there were 198,248,022 ADSs outstanding in2011, the United States, representing approximately 8.4%Company held 109,554,173 TOTAL shares either directly or through its indirect subsidiaries, which represented 4.63% of the total outstanding shares.share capital, as of this date. By law, these shares are also deprived of voting rights. TOTAL shares held directly by the Company (treasury shares) The Company is notheld 9,222,905 treasury shares as of December 31, 2011, representing 0.39% of the share capital, as of that date. TOTAL shares held directly orby Group companies As of December 31, 2011, Total Nucléaire, a Group company wholly-owned indirectly owned or controlled by another corporation, by any foreignTOTAL held 2,023,672 TOTAL shares. As of December 31, 2011, government or by any other natural or legal person. TheFinancière Valorgest, Sogapar and Fingestval, indirect subsidiaries of Elf Aquitaine, held respectively 22,203,704, 4,104,000 and 71,999,892 TOTAL shares, representing a total of 98,307,596 TOTAL shares. As of December 31, 2011, the Company does not knowheld through its indirect subsidiaries, 4.24% of any arrangements that may, at a subsequent date, result in a change of control of TOTAL.the share capital.
Related Party Transactions The Group’s main transactions with related parties (principally all the investments carried under the equity method) and the balances receivable from and payable to them are shown in Note 24 to the Consolidated Financial Statements. In the ordinary course of its business, TOTAL enters into transactions with various organizations with which certain of its directors or executive officers may be associated, but no such transactions of a material or unusual nature have been entered into during the period commencing on January 1, 2007,2009, and ending on March 31, 2009.23, 2012. ITEM 8. FINANCIAL INFORMATION Consolidated Statements and other supplemental information See pages F-1 through F-86 and S-1 through S-9F-96 for TOTAL’s Consolidated Financial Statements and pages S-1 through S-19 for other supplemental information. Legal or arbitration proceedings There are no governmental, legal or arbitration proceedings, including any proceeding that the Company is aware of, threatened with or even pending (including the main legal proceedings described hereafter) that could have a material impact on the Group’s financial situation or profitability. While it is not feasible to predict the outcome of the pending claims, proceedings, and investigations described below with certainty, management is of the opinion that their ultimate disposition should not have a material adverse effect on the Company’s financial position, cash flows, or results of operations. Antitrust investigations The principal antitrust proceedings in which the Group’s companies are involved are described below. Chemicals | • | | As part of the spin-off of Arkema(1) in 2006, TOTAL S.A. or certain other Group companies agreed |
| | to grant Arkema a guarantee for potential monetary consequences related to antitrust proceedings arising from events prior to the spin-off. |
This guarantee covers, for a period of ten years from the date of the spin-off, 90% of amounts paid by Arkema related to (i) fines imposed by European authorities or European member-states for competition law violations, (ii) fines imposed by U.S. courts or antitrust authorities for federal antitrust violations or violations of the competition laws of U.S. states, (iii) damages awarded in civil proceedings related to the government proceedings mentioned above, and (iv) certain costs related to these proceedings. The guarantee related to anti-competition violations in Europe applies to amounts above a€176.5 million threshold. On the other hand, the agreements provide that Arkema will indemnify TOTAL S.A. or any Group company for 10% of any amount that TOTAL S.A. or any Group company are required to pay under any of the proceedings covered by this guarantee, in Europe. If one or more individuals or legal entities, acting alone or together, directly or indirectly holds more than one-third of the voting rights of Arkema, or if Arkema transfers more than 50% of its assets (as calculated under the enterprise valuation method, as of the date | (1) | Arkema is used in this section to designate those companies of the Arkema group whose ultimate parent company is Arkema S.A. Arkema became an independent company after being spun-off from TOTAL S.A. in May 2006. |
of the transfer) to a third party or parties acting together, irrespective of the type or number of transfers, this guarantee will become void. In the United States, civil liability lawsuits, for which TOTAL S.A. has been named as the parent company, are closed without significant impact on the Group’s financial position. In Europe, since 2006, the European Commission has fined companies of the Group in its configuration prior to the spin-off an overall amount of€385.47 million, of which Elf Aquitaine and/or TOTAL S.A. were held jointly liable for€280.17 million, Elf Aquitaine being personally fined€23.6 million for deterrence. These fines are entirely settled as of today. As a result, since the spin-off, the Group has paid the overall amount of€188.07 million(1), corresponding to 90% of the fines overall amount once the threshold provided for by the guarantee is deducted to which an amount of€31.31 million of interest has been added as explained hereinafter. The European Commission imposed these fines following investigations between 2000 and 2004 into commercial practices involving eight products sold by Arkema. Five of these investigations resulted in prosecutions from the European Commission for which Elf Aquitaine has been named as the parent company, and two of these investigations named TOTAL S.A. as the ultimate parent company of the Group. TOTAL S.A. and Elf Aquitaine are contesting their liability based solely on their status as parent companies and appealed for cancellation and reformation of the rulings that are still pending before the relevant EU court of appeals or supreme court of appeals. During the year 2011, four of the proceedings have evolved and are closed as far as Arkema is concerned: | - | | In one of these proceedings, the Court of Justice of the European Union (CJEU) has rejected the action of Arkema while the decisions of the European Commission and of the General Court of the European Union against the parent companies have been squashed. Consequently, this proceeding is definitively closed regarding Arkema as well as the parent companies. |
| - | | In two other proceedings, previous decisions against Arkema and the parent companies have been upheld by the General Court of the European Union. While the parent companies have introduced an appeal before the CJEU, Arkema did not appeal to the CJEU. |
| - | | Finally, in a last proceeding, the General Court has decided to reduce the amount of the fine initially ordered against Arkema while, in parallel, it has rejected the actions of the parent companies that have remained obliged to pay the whole amount of the fine initially ordered by the European Commission. Arkema has accepted this decision while the parent companies have introduced an appeal before the CJEU. |
With the exception of the€31.31 million of interest charged by the European Commission to the parent companies, which has been required to pay in accordance with the decision concerning the last proceeding referred hereinabove, the evolution of the proceedings during the year 2011 did not modify the global amount assumed by the Group in execution of the guarantee. In addition, civil proceedings against Arkema and other groups of companies were initiated in 2009 and 2011, respectively, before the German and Dutch courts by third parties for alleged damages pursuant to two of the above mentioned legal proceedings. TOTAL S.A. was summoned to serve notice of the dispute before the German court. At this point, the probability to have a favorable verdict and the financial impacts of these proceedings are uncertain due to the number of legal difficulties they give rise to, the lack of documented claims and evaluations of the alleged damages. Arkema began implementing compliance procedures in 2001 that are designed to prevent its employees from violating antitrust provisions. However, it is not possible to exclude the possibility that the relevant authorities could commence additional proceedings involving Arkema regarding events prior to the spin-off, as well as Elf Aquitaine and/or TOTAL S.A. based on their status as parent company. Within the framework of all of the legal proceedings described above, a€17 million reserve remains booked in the Group’s consolidated financial statements as of December 31, 2011. | (1) | This amount does not take into account a case that led to Arkema, prior to Arkema’s spin-off from TOTAL, and Elf Aquitaine being fined jointly€45 million and Arkema being fined€13.5 million. |
Downstream Pursuant to a statement of objections received by Total Nederland N.V. and TOTAL S.A. (based on its status as parent company) from the European Commission, Total Nederland N.V. was fined€20.25 million in 2006, for which TOTAL S.A. was held jointly liable for€13.5 million. TOTAL S.A. appealed this decision before the relevant court and this appeal is still pending. In addition, pursuant to a statement of objections received by Total Raffinage Marketing (formerly Total France) and TOTAL S.A. from the European Commission regarding another product line of the Refining & Marketing division, Total Raffinage Marketing was fined€128.2 million in 2008, which has been paid, and for which TOTAL S.A. was held jointly liable based on its status as parent company. TOTAL S.A. also appealed this decision before the relevant court and this appeal is still pending. In addition, civil proceedings against TOTAL S.A and Total Raffinage Marketing and other companies were initiated before U.K and Dutch courts by third parties for alleged damages in connection with the prosecutions brought by the European Commission in this case. At this point, the probability to have a favorable verdict and the financial impacts of these procedures are uncertain due to the number of legal difficulties they gave rise to, the lack of documented claims and evaluations of the alleged damages. Within the framework of the legal proceedings described above, a€30 million reserve is booked in the Group’s consolidated financial statements as of December 31, 2011. Whatever the evolution of the proceedings described above, the Group believes that their outcome should not have a material adverse effect on the Group’s financial situation or consolidated results. Grande Paroisse An explosion occurred at the Grande Paroisse industrial site in the city of Toulouse in France on September 21, 2001. Grande Paroisse, a former subsidiary of Atofina which became a subsidiary of Elf Aquitaine Fertilisants on December 31, 2004, pursuant toas part of the reorganization of the Chemicals segment, was principally engaged in the production and sale of agricultural fertilizers. The explosion, which involved a stockpile of ammonium nitrate pellets, destroyed a portion of the site and caused the death of 31thirty-one people, including 21twenty-one workers at the site, and injured many others. The explosion also caused significant damage to certain property in part of the city of Toulouse. This plant has been closed and individual assistance packages have been provided for employees. The site has been restored.rehabilitated. On December 14, 2006, Grande Paroisse signed, under the supervision of the city of Toulouse, the deed whereby it donated the former site of the AZF plant to the greater agglomeration of Toulouse (CAGT) and theCaisse des dépôts et consignations and its subsidiary ICADE. Under this deed, TOTAL S.A. guaranteed the site restoration obligations of Grande Paroisse and granted a 10 M€10 million endowment to the InNaBioSanté research foundation in the frameworkas part of the citysetting up of Toulouse’s project to create a cancer research center at the site.site by the city of Toulouse. Regarding the cause of the explosion, the hypothesis that the explosion was caused by Grande Paroisse through the accidental mixing of hundreds of kilos of a chlorine compound at a storage site for ammonium nitrate was discredited over the course of the investigation. As a result, proceedings against ten of the eleven Grande Paroisse employees charged during the criminal investigation conducted by the Toulouse Regional Court (Tribunal de grande instance) were dismissed and this dismissal was upheld by the Court of Appeal of Toulouse.on appeal. Nevertheless, the final experts’ report filed on May 11, 2006 continued to focus on the hypothesis of a chemical accident, although this hypothesis was not confirmed during the attempt to reconstruct the accident at the site. After having articulated several hypotheses, the experts no longer maintain that the accident was caused by pouring a large quantity of a chlorine compound over ammonium nitrate. Instead, the experts have retained a scenario where a container of chlorine compound sweepings was poured between a layer of wet ammonium nitrate covering the floor and a quantity of dry agricultural nitrate at a location not far from the principal storage site. This is claimed to have caused an explosion which then spread into the main storage site. Grande Paroisse was investigated based on this new hypothesis in 2006.2006; Grande Paroisse is contesting this explanation, which it believes to be based on elements that are not factually accurate. The Court of Appeal of Toulouse rejected allAll the requests for additional investigations that were submitted by Grande Paroisse, the former site manager and various plaintiffs were denied on appeal after the end of the criminal investigation procedure. On July 9, 2007, the investigating judge brought charges against Grande Paroisse and the former siteplant manager before the criminal chamber of the Court of Appeal of Toulouse. In late 2008, TOTAL S.A. and Mr. Thierry Desmarest were summoned to appear in Court pursuant to a request by a victims
association. The trial for this case began on February 23, 2009, and is scheduled to lastlasted approximately four months. Furthermore, On November 19, 2009, the Toulouse Criminal Court acquitted both the former Plant Manager, and Grande Paroisse due to the lack of reliable evidence for the explosion. The Court also ruled that the summonses against TOTAL S.A. and Mr. Thierry Desmarest, receivedChairman and CEO at the time of the disaster, were inadmissible. Due to the presumption of civil liability that applied to Grande Paroisse, the Court declared Grande Paroisse civilly liable for the damages caused by the explosion to the victims in its capacity as custodian and operator of the plant. The Prosecutor’s office, together with certain third parties, has appealed the Toulouse Criminal Court verdict. In order to preserve its rights, Grande Paroisse lodged a requestcross-appeal with respect to appearcivil charges. The appeal proceedings before the court in the contextCourt of this trial.Appeal of Toulouse was completed on March 16, 2012. The decision is expected on September 24, 2012. Pursuant to applicable French law, Grande Paroisse is presumed to bear sole responsibilityA compensation mechanism for the explosion as long as the cause of the explosion remains unknown. While awaiting the conclusion of the investigation, Grande Paroisse hasvictims was set up a compensation system for victims. At this stage,immediately following the estimateexplosion.€2.3 billion was paid for the compensation of all claims and related expenses amounts to 2.19 B€. This figure exceeds by 1.39 B€ Grande Paroisse’s insurance coverage for legal liability (capped at 0.8 B€).
After taking into account payments previously made and new claims in 2008, the provision for potential liability and complementary claims appearing in the Consolidated Balance Sheet stands at 256 M€ asamounts. As of December 31, 2008 (which includes2011, a€21 million reserve was recorded in the Group’s consolidated balance sheet.
Buncefield On December 11, 2005, several explosions, followed by a major fire, occurred at an increaseoil storage depot at Buncefield, north of 140 M€London. This depot was operated by Hertfordshire Oil Storage Limited (HOSL), a company in 2008), comparedwhich TOTAL’s UK subsidiary holds 60% and another oil group holds 40%. The explosion caused injuries, most of which were minor injuries, to a provisionnumber of 134 M€ as of December 31, 2007. Antitrust investigations
•
| | Following investigations into certain commercial practices in the chemicals industry in the United States, some subsidiaries of the Arkema(1) group are involved in civil liability lawsuits in the United States and Canada for violations of antitrust laws. TOTAL S.A. has been named in certain of these suits as the parent company.
|
| In Europe, the European Commission commenced investigations in 2000, 2003 and 2004 into alleged anti-competitive practices involving certain products sold by Arkema. In January 2005, under one of these investigations, the European Commission fined Arkema 13.5 M€ and jointly fined Arkema and Elf Aquitaine 45 M€. Arkema and Elf Aquitaine have appealed these decisions to the Court of First Instance of the European Union. |
| The Commission notified Arkema, TOTAL S.A. and Elf Aquitaine of complaints concerning two other product lines in January and August 2005, respectively. Arkema has cooperated with the authorities in these procedures and investigations. In May 2006, the European Commission fined Arkema 78.7 M€ and 219.1 M€, as a result of, respectively, each of these two proceedings. Elf Aquitaine was held jointly and severally liable for, respectively, 65.1 M€ and 181.35 M€ of these fines while TOTAL S.A. was held jointly and severally liable, respectively, for 42 M€ and 140.4 M€. TOTAL S.A., Arkema and Elf Aquitaine have appealed these decisions to the Court of First Instance of the European Union. |
| Arkema and Elf Aquitaine received a statement of objections from the European Commission in August 2007 concerning alleged anti-competitive practices related to another line of chemical products. As a result, Arkema and Elf Aquitaine have been jointly and severally fined in an amount of 22.7 M€ and individually in an amount of 20.43 M€ for Arkema and 15.89 M€ for Elf Aquitaine. The companies concerned appealed this decision to the relevant European court. |
| Arkema and Elf Aquitaine received a statement of objections from the European Commission in March 2009 concerning alleged anti-competitive practices related to another line of chemical products. As of today, the Commission has not rendered a decision. |
| No facts have been alleged that would implicate TOTAL S.A. or Elf Aquitaine in the practices questioned in these proceedings, and the fines received are based solely on their status as parent companies. |
| Arkema began implementing compliance procedures in 2001 that are designed to prevent its employees from violating antitrust provisions. However, it is not possible to exclude the possibility that the relevant authorities could commence additional proceedings involving Arkema, as well as TOTAL S.A. and Elf Aquitaine. |
(1) | Arkema is used in this section to designate those companies of the Arkema group whose ultimate parent company is Arkema S.A., which became an independent company after being spun off from TOTAL S.A. in May 2006. |
As part of the agreement relatingpeople and caused property damage to the spin-offdepot and the buildings and homes located nearby. The official Independent Investigation Board has indicated that the explosion was caused by the overflow of Arkema, TOTAL S.A. or certain other Group companies agreeda tank at the depot. The Board’s final report was released on December 11, 2008. The civil procedure for claims, which had not yet been settled, took place between October and December 2008. The Court’s decision of March 20, 2009, declared TOTAL’s UK subsidiary liable for the accident and solely liable for indemnifying the victims. The subsidiary appealed the decision. The appeal trial took place in January 2010. The Court of Appeals, by a decision handed down on March 4, 2010, confirmed the prior judgment. The Supreme Court of United Kingdom has partially authorized TOTAL’s UK subsidiary to grant Arkema guarantees for certain risks relatedcontest the decision. TOTAL’s UK subsidiary finally decided to antitrust proceedings arising
withdraw from events priorthis recourse due to the spin-off.settlement agreements reached in mid-February 2011. | These guarantees cover, for a period of ten years that began in 2006, 90% of amounts paid by Arkema related to (i) fines imposed by European authorities or European member-states for competition law violations, (ii) fines imposed by U.S. courts or antitrust authorities for federal antitrust violations or violations of the competition laws of U.S. states, (iii) damages awarded in civil proceedings related to the government proceedings mentioned above, and (iv) certain costs related to these proceedings. |
| The guarantee covering the risks related to anti-competition violations in Europe applies to amounts above a 176.5 M€ threshold. |
| If one or more individuals or legal entities, acting alone or together, directly or indirectly holds more than one-third of the voting rights of Arkema, or if Arkema transfers more than 50% of its assets (as calculated under the enterprise valuation method, as of the date of the transfer) to a third party or parties acting together, irrespective of the type or number of transfers, these guarantees will become void. |
| On the other hand, the agreements provide that Arkema will indemnify TOTAL S.A. or any Group company for 10% of any amount that TOTAL S.A. or any Group company are required to pay under any of the proceedings covered by these guarantees. |
The Group has recorded provisions amountingcarries insurance for damage to 85 M€its interests in itsthese facilities, business interruption and civil liability claims from third parties. The provision for the civil liability that appears in the Group’s consolidated financial statements as of December 31, 2008 to cover2011, stands at€80 million after taking into account the risks mentioned above.payments previously made. Moreover, as a result of investigations started by the European Commission in October 2002 concerning certain Refining & Marketing subsidiaries of the Group, Total Nederland N.V. and TOTAL S.A. received a statement of objections in October 2004. These proceedings resulted, in September 2006, in Total Nederland N.V. being fined 20.25 M€ and in TOTAL S.A. as its parent company being held jointly responsible for 13.5 M€ of this amount, although no facts implicating TOTAL S.A. in the practices under investigation were alleged. TOTAL S.A. and Total Nederland N.V. have appealed this decision to the Court of First Instance of the European Union.
| In addition, in May 2007, Total France and TOTAL S.A. received a statement of objections regarding |
| alleged antitrust practices concerning another product line of the Refining & Marketing division. These proceedings resulted, in October 2008, in Total France being fined 128.2 M€ and in TOTAL S.A., as its parent company, being held jointly responsible although no facts implicating TOTAL S.A. in the practices under investigation were alleged. TOTAL S.A. and Total Raffinage & Marketing (the new corporate name of Total France) have appealed this decision to the Court of First Instance of the European Union.
|
Given the discretionary powers granted to the European Commission for determining fines relating to antitrust regulations, it is not currently possible to determine with certainty the outcome of these investigations and proceedings. TOTAL S.A. and Elf Aquitaine are contesting their liability and the method of determining these fines. Although it is not possible to predict the ultimate outcome of these proceedings, theThe Group believes that, they willbased on the information currently available, on a reasonable estimate of its liability and on provisions recognized, this accident should not have a material adverse effectsignificant impact on itsthe Group’s financial conditionsituation or consolidated results.
In addition, on December 1, 2008, the Health and Safety Executive (HSE) and the Environment Agency (EA) issued a Notice of prosecution against five companies, including TOTAL’s UK subsidiary. By a judgment on July 16, 2010, the subsidiary was fined £3.6 million and paid it. The decision takes into account a number of elements that have mitigated the impact of the charges brought against it. Sinking of the Erika Following the sinking in December 1999 of the Erika, a tanker that was transporting products belonging to one of the Group companies, theTribunal de grande instance of Paris convicted TOTAL S.A. of marine pollution pursuant to a judgment issued on January 16, 2008, finding that TOTAL S.A. was negligent in its vetting procedure for vessel selection.selection, and ordering TOTAL S.A. was finedto pay a fine of€375,000. The courtCourt also ordered compensation to be paid to those affected by the victims of pollution from the Erika up to an aggregate amount of 192 M€,192 million, declaring TOTAL S.A. jointly and severally liable for such payments together with the Erika’s inspection and classification firm, the Erika’s owner and the Erika’s manager. TOTAL believes that the finding of negligence and the related conviction for marine pollution are without substance as a matter of fact and as a matter of law. TOTAL also considers that this verdict is contrary to the intended aim of enhancing maritime transport safety.
TOTAL has appealed the verdict of January 16, 2008. In the meantime, it has nevertheless proposed to pay third parties who so requestrequested definitive compensation as determined by the court. As of today, thirty-sixCourt. Forty-two third parties have received compensation payments, representingbeen compensated for an aggregate amount of 170.1 M€.171.5 million. The hearing of the appeal beforeBy a decision dated March 30, 2010, the Court of AppealsAppeal of Paris is expectedupheld the lower Court verdict pursuant to beginwhich TOTAL S.A. was convicted of marine pollution and fined€375,000. However, the Court of Appeal ruled that TOTAL S.A. bears no civil liability according to the applicable international conventions and consequently ruled that TOTAL S.A. be not convicted.
TOTAL challenged the criminal law-related issues of this decision before the French Supreme Court (Cour de cassation). To facilitate the payment of damages awarded by the Court of Appeal in October 2009. AtParis to third parties against Erika’s controlling and classification firm, the current stageship-owner and the ship-manager, a global settlement agreement was signed late 2011 between these parties and TOTAL S.A. under the auspices of the proceedings, TOTAL S.A. believes that, based on a reasonable estimate of its liability, the case will not have a material impact on the Group’s financial situation or consolidated results.
Buncefield
On December 11, 2005, several explosions, followed by a major fire, occurred at an oil storage depot at Buncefield, north of London. This depot is operated by Hertfordshire Oil Storage Limited (HOSL), a company in which the British subsidiary of TOTAL holds 60% and another oil group holds 40%.
The explosion caused minor injuries to a number of people and caused property damageIOPC Fund. Under this global settlement agreement, each party agreed to the depot andwithdrawal of all civil proceedings initiated against all other parties to the buildings and homes located nearby. The official Independent Investigation Board has indicated that the explosion was caused by the overflow of a tank at the depot. The Board’s final report was released on December 11, 2008. The civil procedure for claims, which have not yet been settled, took place between October and December 2008. The Court’s decision of March 20, 2009, declared the British subsidiary of agreement.
TOTAL liable for the accident and solely liable for indemnifying the victims. TOTAL’s British subsidiary intends to appeal this decision. The Group carries insurance for damage to its interests in these facilities, business interruption and civil liability claims from third parties, andS.A. believes that, based on the information currently available, this accidentthe case should not have a significant impact on the Group’s financial situation or consolidated results.
On December 1, 2008, the Health and Safety Executive (HSE)Blue Rapid and the Environment Agency (EA) issuedRussian Olympic Committee — Russian regions and Interneft
Blue Rapid, a Notice of prosecutionPanamanian company, and the Russian Olympic Committee filed a claim for damages with the Paris Commercial Court against five companies, including the BritishElf Aquitaine, alleging a so-called non-completion by a former subsidiary of TOTAL. An initial court hearing is expectedElf Aquitaine of a contract related to an exploration and production project in Russia negotiated in the second quarter 2009. Myanmar
Underearly 1990s. Elf Aquitaine believed this claim to be unfounded and opposed it. On January 12, 2009, the Belgian “universal jurisdiction” lawsCommercial Court of June 16, 1993Paris rejected Blue Rapid’s claim against Elf Aquitaine and February 10, 1999, a complaint was filedfound that the Russian Olympic Committee did not have standing in Belgium on April 25, 2002, against the Company, its Chairmanmatter. Blue Rapid and the former president of its subsidiary in Myanmar. These laws were repealed by the Belgian law of August 5, 2003 on “serious violations of international human rights”, which also provided a procedure for terminating certain proceedings that were underway. InRussian Olympic Committee appealed this framework, the BelgianCour de cassation terminated the proceedings against TOTAL in a decision dateddecision. On June 29, 2005. The plaintiffs’ request to withdraw this decision was rejected by theCour de cassation on March 28, 2007.
Despite this decision, the Belgian Ministry of Justice asked the Belgian federal prosecutor to request that the investigating judge reopen the case. The Belgian federal prosecutor decided to submit the admissibility of this request to30, 2011, the Court of Appeal of Brussels. Paris dismissed as inadmissible the claim of Blue Rapid and the Russian Olympic Committee against Elf Aquitaine, notably on the grounds of the contract’s termination. Blue Rapid and the Russian Olympic Committee appealed this decision to the French Supreme Court.
In its decision of March 5, 2008,connection with the Court of Appeal confirmedsame facts, and fifteen years after the termination of the proceedingsexploration and production contract, a Russian company, which was held not to be the contracting party to the contract, and two regions of the Russian Federation which were not even parties to the contract, have launched an arbitration procedure against TOTAL, its Chairman the aforementioned former subsidiary of Elf Aquitaine that was liquidated in 2005, claiming alleged damages of U.S.$22.4 billion. For the same reasons as those successfully adjudicated by Elf Aquitaine against Blue Rapid and the former president of its subsidiary, based onRussian Olympic Committee, the principle ofres judicata applyingGroup considers this claim to theCour de cassation’s decision of June 29, 2005. The plaintiffs have appealed the decision of March 5, 2008. On October 29, 2008, theCour de cassation rejected the plaintiffs’ appeal, thus ending definitively the proceedings.
TOTAL has always maintained that the accusations made against the Company and its management arising out of the activities of its subsidiary in Myanmar were without substancebe unfounded as to a matter of factlaw or fact. The Group has lodged a criminal complaint to denounce the fraudulent claim which the Group believes it is a victim of and, as a matter of law.has taken and reserved its rights to take other actions and measures to defend its interests.
South Africa
In a threatened class action proceeding in the United States, TOTAL, together with approximately 100 other multinational companies, is the subject of accusations by certain South African citizens who alleged that their human rights were violated during the era of apartheid by the army, the police or militias, and who consider that these companies were accomplices in the actions by the South African authorities at the time.
The claims against the companies named in the class action, which were not officially brought against TOTAL, were dismissed by a federal judge in New York. The plaintiffs appealed this dismissal and, after a procedural hearing on November 3, 2008, decided to remove TOTAL from the list of companies against which it was bringing claims.
Iran In 2003, the SECUnited States Securities and Exchange Commission (SEC) followed by the Department of Justice (DoJ) issued a non-public formal order directing a privatean investigation in the matter of certain oil companies (including, among others, TOTAL), in connection with the pursuit of business in Iran.Iran, by certain oil companies including, among others, TOTAL. The inquiry concerns an agreement concluded by the Company with a consultant concerning a gas field in Iran and aims to verify whether certain payments made under this agreement would have benefited Iranian officials in violation of the Foreign Corrupt Practices Act (FCPA) and the Company’s accounting obligations. Investigations are still pending and the Company is cooperating with the SEC and the DoJ. In 2006,2010, the Company opened talks with U.S. authorities, without any acknowledgement of facts, to consider an out-of-court settlement as it is often the case in this kind of proceeding. Late in 2011, the SEC and the DoJ proposed to TOTAL out-of-court settlements that would close their inquiries, in exchange for TOTAL’s committing to a number of obligations and paying fines. As TOTAL was unable to agree to several substantial elements of the proposal, the Company is continuing discussions with the U.S. authorities. The Company is free not to accept an out-of-court settlement solution, in which case it would be exposed to the risk of prosecution in the United States. In this same affair, a parallel judicial inquiry related to TOTAL was initiated in France.France in 2006. In 2007, the Company’s Chief Executive Officer was placed under formal investigation in relation to this inquiry, as the former President of the Middle East department of the Group’s Exploration & Production division. The inquiry concerns an agreement concluded by the Group that relates to the South Pars gas field and allegations that certain payments were made under this agreement to Iranian officials in connection with contracts entered into between the Group and the National Iranian Oil Company (NIOC). The Company has not been notified of any significant developments in the proceedings since the formal investigation was launched. The Company believes that the negotiation and execution of the agreement did not violate any applicable laws or applicable international conventions. However,
At this point, the Company cannot excludedetermine when these investigations will terminate, and cannot predict their results, or the possibilityoutcome of the talks that additional procedures may be initiatedhave been initiated. Resolving these cases is not expected to have a significant impact on the Group’s financial situation or consequences on its future planned operations. Libya In June 2011, the SEC issued to certain oil companies — including, among others, TOTAL — a formal request for information related to their operations in Libya. TOTAL is cooperating with respect to this matter.non-public investigation. Italy
As part of an investigation led by the Prosecutor of the Republic of the Potenza court, Total Italia is the subject of an investigation related to certain calls for tenders that it made for the preparation and development of the Tempa Rossa oil field. On February 16, 2009, as a preliminary measure before the proceedings go before the court, the preliminary investigating judge of Potenza served notice to Total Italia of a decision that would suspend the concession for this field for one year.
Total Italia is contesting the allegations and has appealed the decision by the preliminary investigation judge to the court of appeals of Potenza.
Oil-for-Food Program Several countries have commencedlaunched investigations concerning possible violations related to the United Nations (UN) Oil-for-Food program in Iraq. Pursuant to a French criminal investigation, certain current or former Group employees were placed under formal criminal investigation for possible charges as accessories to the misappropriation of corporate assets and as accessories to the corruption of foreign public agents. The Chairman and Chief Executive Officer of the Company, formerly presidentPresident of the Group’s Exploration & Production division, was also placed under formal investigation in October 2006. In 2007, the criminal investigation was closed and the case was transferred to the prosecutor’sProsecutor’s office. The prosecutor’sIn 2009, the Prosecutor’s office must now submitrecommended to the investigating judge itsthat the case against the Group’s current and former employees and TOTAL’s Chairman and Chief Executive Officer not be pursued. In early 2010, despite the recommendation of the Prosecutor’s office, a new investigating judge, having taken over the case, decided to indict TOTAL S.A. on whether orbribery charges as well as complicity and influence peddling. The indictment was brought eight years after the beginning of the investigation without any new evidence being introduced. In October 2010, the Prosecutor’s office recommended to the investigating judge that the case against TOTAL S.A., the Group’s current and former employees and TOTAL’s Chairman and Chief Executive Officer not be pursued. However, by ordinance notified in early August 2011, the investigating judge on the matter decided to pursuesend the case.case to trial. The hearings are expected in the first quarter of 2013. The Company believes that its activities related to the Oil-for-Food program have been in compliance with this program, as organized by the UN in 1996. The Volcker report released by the independent investigating committee set up by the UN had discarded any bribery grievance within the framework of the Oil-For-Food program with respect to TOTAL. Blue RapidItaly
As part of an investigation led by the Prosecutor of the Republic of the Potenza Court, Total Italia and certain Group’s employees are the Russian Olympic Committee Blue Rapid,subject of an investigation related to certain calls for tenders that Total Italia made for the preparation and development of an oil field. On February 16, 2009, as a Panamanian company, andpreliminary measure before the Russian Olympic Committee filed a claim for damages withproceedings go before the Court, the preliminary investigation judge of Potenza served notice to Total Italia
Paris Commercialof a decision that would suspend the concession for this field for one year. Total Italia has appealed the decision by the preliminary investigation judge before the Court against Elf Aquitaine concerning its withdrawal from anof Appeal of Potenza. In a decision dated April 8, 2009, the Court reversed the suspension of the Gorgoglione concession and appointed for one year,i.e.until February 16, 2010, a judicial administrator to supervise the operations related to the development of the concession, allowing the Tempa Rossa project to continue.
The criminal investigation was closed in the first half of 2010. The preliminary hearing judge, who will decide whether the case shall be returned to the Criminal Court to be judged on the merits, held the first hearing on December 6, 2010. The proceedings before the Judge of the preliminary hearing are still pending. In 2010, Total Italia’s exploration and production project in Russia that was negotiated early in the 1990s. Elf Aquitaine believes this claimoperations were transferred to be unfounded.
On January 12, 2009, the Commercial CourtTotal E&P Italia and refining and marketing operations were merged with those of Paris rejected Blue Rapid’s claim and found that the Russian Olympic Committee did not have standing in the matter. This decision has been appealed.Erg Petroli.
Dividend policy The Company has paid dividends on its share capital in each year since 1946. Future dividends will depend on the Company’s earnings, financial condition and other factors. The payment and amount of dividends are subject to the recommendation of the Board of Directors and resolution by the Company’s shareholders’shareholders at the annual shareholders’ meeting.Shareholders’ Meeting. ForUntil the 2008 fiscal year,payment of the Board2010 dividend, the Company paid an interim dividend in November and the remainder after the Shareholders’ Meeting held in May of Directors has proposed a dividend of€2.28 per share. This proposed dividend will be voted on by the shareholders’ meeting to be held on May 15, 2009. Aneach year. Consequently, for 2010, an interim dividend of€1.14 per share was paid on November 19, 2008. If approved,and the balanceremainder of€1.14 per share will bewere paid respectively on November 17, 2010 and May 26, 2011.
On October 28, 2010, the Board of Directors decided to change its interim dividend policy and to adopt a new policy based on quarterly dividend payments, starting in 2011. TOTAL paid three quarterly interim dividends for 2011: The Board of Directors decided on the first quarterly interim dividend on April 28, 2011, with an ex-dividend date on September 19, 2011 and a payment date on September 22, 2011; The Board of Directors decided on the second quarterly interim dividend on July 28, 2011, with an ex-dividend date on December 19, 2011 and a payment date on December 22, 2011; The Board of Directors decided on the third quarterly interim dividend on October 27, 2011, with an ex-dividend date on March 19, 2012 and a payment date on March 22, 2011. For 2011, TOTAL plans to continue its dividend policy by proposing a dividend of€2.28 per share at the Shareholders’ Meeting on May 22, 2009.11, 2012, including a remainder of€0.57 per share, with an ex-dividend date on June 18, 2012, and a payment on June 21, 2012. This€2.28 per share dividend is stable compared to the previous year. Subject to the applicable legislative and regulatory provisions, and pending the approval by the Board of Directors for the interim dividends and by the shareholders at the Shareholders’ Meeting for the accounts and the final dividend, the ex-date calendar for the interim quarterly dividends and the final dividend for 2012 should be as follows: | • | | 1st interim dividend: September 24, 2012; |
| • | | 2nd interim dividend: December 17, 2012; |
| • | | 3rd interim dividend: March 18, 2013; |
remainder: June 24, 2013. The provisional ex-dividend dates above relate to the TOTAL shares traded on the Euronext Paris. Dividends paid to holders of ADRs will be subject to a charge by the Depositary for any expenses incurred by the Depositary in the conversion of euro to dollars. See “Item 10. Additional Information — Taxation”, for a summary of certain U.S. federal and French tax consequences to holders of shares and ADRs. Significant changes For a description of significant changes that have occurred since the date of the Company’s Consolidated Financial Statements, see “Item 4. Information on the Company” and “Item 5. Operating and Financial Review and Prospects”, which include descriptions of certain recent 20092012 activities. ITEM 9. THE OFFER AND LISTING Markets The principal trading market for the shares is the Euronext Paris exchange in France. The shares are also listed on Euronext Brussels and the London Stock Exchange. Offer and listing details Trading on Euronext Paris Official trading of listed securities on Euronext Paris, including the shares, is transacted through French investment service providers that are members of Euronext Paris and takes place continuously on each business day in Paris from 9:00 a.m. to 5:30 p.m. (Paris time), with a fixing of the closing price at 5:35 p.m. Euronext Paris may suspend or resume trading in a security listed on Euronext Paris, if the quoted price of the security exceeds certain price limits defined by the regulations of Euronext Paris. The markets of Euronext Paris settle and transfer ownership three trading days after a transaction (T+3). Highly liquid shares, including those of the Company, are eligible for deferred settlement ((Service de Règlement Différé — SRD). Payment and delivery for shares under the SRD occurs on the last trading day of each month. Use of the SRD service requires payment of a commission. Under this system, the determination date for settlement on the following month occurs on the fifth trading day prior to the last trading day (inclusive) of each month. In France, the shares are included in the principal index published by Euronext Paris (the “CAC 40 Index”). The CAC 40 Index is derived daily by comparing the total market capitalization of 40 stocks traded on Euronext Paris to the total market capitalization of the stocks that made up the CAC 40 Index on December 31, 1987. Adjustments are made to allow for expansion of the sample due to new issues. The CAC 40 Index indicates trends in the French stock market as a whole and is one of the most widely followed stock price indices in France. In the UK, the shares are listed in both the FTSE Eurotop 100 and FTSEurofirst 300 index. As a result of the creation of Euronext, the shares are included in Euronext 100, the index representing Euronext’s blue chip companies based on market capitalization. The shares are also included in the Dow Jones Stoxx 50 and Dow Jones Euro Stoxx 50, blue chip indices comprised of the 50fifty most highly capitalized and most actively traded equities throughout Europe and within the European Monetary Union, respectively. Since June 2000, the shares have been included in the Dow Jones Global Titans Index which consists of 50fifty global companies selected based on market capitalization, book value, assets, revenue and earnings. Pursuant to the vote of the May 12, 2006, shareholders’ meeting approving TOTAL’s four-for-one stock split, each shareholder received on May 18, 2006, four new TOTAL shares, par value of€2.50 per share, in return for each old share with a par value of€10. The table below sets forth, for the periods indicated, the reported high and low quoted prices in euros for the currently outstanding shares on Euronext Paris. Data prior to May 18, 2006, reported in this table has been adjusted to reflect this stock split by dividing stock prices by four. The May 12, 2006, shareholders’ meeting also approved the spin-off of Arkema and the allocation, as of May 18, 2006, of one Arkema share allocation right for each TOTAL share with a par value of€10, ten allocation rights entitling the holder to one Arkema share. Data prior to May 18, 2006, reported in the third and fourth columns of this table are adjusted in order to consider Arkema’s share allocation right partition.
| | | | | | | | | | Price per share (€) | | High | | | Low | | 2007 | | | 63.40 | | | | 48.33 | | 2008 | | | 59.50 | | | | 31.52 | | 2009 | | | 45.785 | | | | 34.25 | | 2010 | | | 46.735 | | | | 35.655 | | First Quarter | | | 46.735 | | | | 40.050 | | Second Quarter | | | 44.625 | | | | 36.210 | | Third Quarter | | | 41.000 | | | | 35.655 | | Fourth Quarter | | | 41.275 | | | | 36.910 | | 2011 | | | 44.550 | | | | 29.400 | | First Quarter | | | 44.550 | | | | 39.710 | | Second Quarter | | | 43.730 | | | | 37.305 | | Third Quarter | | | 40.895 | | | | 29.400 | | September | | | 34.820 | | | | 29.400 | | Fourth Quarter | | | 39.810 | | | | 31.730 | | October | | | 39.810 | | | | 31.730 | | November | | | 38.705 | | | | 34.570 | | December | | | 39.605 | | | | 35.940 | | 2012 (through February 29) | | | 42.400 | | | | 38.570 | | January | | | 40.890 | | | | 38.570 | | February | | | 42.400 | | | | 40.225 | |
| | | | | | | | | | Price per share (€) | | High | | Low | | High adjusted | | Low adjusted | 2004 | | 42.95 | | 34.85 | | 42.40 | | 34.40 | 2005 | | 57.28 | | 39.50 | | 56.54 | | 38.99 | 2006 | | 58.15 | | 46.52 | | 57.40 | | 46.52 | 2007 | | 63.40 | | 48.33 | | — | | — | First Quarter | | 55.45 | | 48.33 | | — | | — | Second Quarter | | 60.31 | | 52.05 | | — | | — | Third Quarter | | 63.40 | | 50.52 | | — | | — | Fourth Quarter | | 57.98 | | 53.00 | | — | | — | | | | | | 2008 | | 59.50 | | 31.52 | | — | | — | First Quarter | | 59.50 | | 45.45 | | — | | — | Second Quarter | | 58.25 | | 46.35 | | — | | — | Third Quarter | | 54.24 | | 40.50 | | — | | — | Fourth Quarter | | 44.55 | | 31.52 | | — | | — | October | | 43.90 | | 31.52 | | — | | — | November | | 44.55 | | 36.115 | | — | | — | December | | 42.00 | | 35.44 | | — | | — | | | | | | 2009 (through March 31) | | 42.465 | | 34.25 | | — | | — | First Quarter | | 42.465 | | 34.25 | | — | | — | January | | 42.465 | | 34.35 | | — | | — | February | | 42.185 | | 36.64 | | — | | — | March | | 39.42 | | 34.25 | | — | | — |
Trading on the New York Stock Exchange ADSs evidenced by ADRs have been listed on the New York Stock Exchange since October 25, 1991. The Bank of New York Mellon serves as depositary with respect to the ADSs evidenced by ADRs traded on the New York Stock Exchange. One ADS corresponds to one TOTAL share. The table below sets forth, for the periods indicated, the reported high and low prices quoted in dollars for the currently outstanding ADSs evidenced by ADRs on the New York Stock Exchange. After the four-for-one stock split, which was approved by the shareholders’ meeting on May 12, 2006, and effective on May 18, 2006, and after the split of the ADRs by two on May 23, 2006, one ADR corresponds to one TOTAL share. Data prior to May 23, 2006, reported in this table has been adjusted to take into account this stock split by dividing ADR prices by two. The May 12, 2006, shareholders’ meeting also approved the spin-off of Arkema and the allocation, as from May 18, 2006, of one Arkema share allocation right for each TOTAL share with a par value of€10, ten allocation rights entitling the holder to one Arkema share. Data prior to May 23, 2006, reported in the third and fourth columns of this table has been adjusted in order to reflect Arkema’s share allocation right partition.
| | Price Per ADR ($) | | High | | Low | | High adjusted | | Low adjusted | | 2004 | | 55.28 | | 43.88 | | 54.39 | | 43.17 | | 2005 | | 68.97 | | 51.87 | | 67.86 | | 51.03 | | 2006 | | 73.46 | | 58.06 | | 73.46 | | 58.06 | | | Price per ADR ($) | | | High | | | Low | | 2007 | | 87.34 | | 63.89 | | — | | — | | | 87.34 | | | | 63.89 | | 2008 | | | | 91.34 | | | | 42.60 | | 2009 | | | | 65.98 | | | | 42.88 | | 2010 | | | | 67.52 | | | | 43.07 | | First Quarter | | 72.65 | | 63.89 | | — | | — | | | 67.52 | | | | 54.01 | | Second Quarter | | 81.55 | | 69.57 | | — | | — | | | 60.24 | | | | 43.07 | | Third Quarter | | 87.34 | | 68.01 | | — | | — | | | 54.14 | | | | 44.43 | | Fourth Quarter | | 84.46 | | 76.66 | | — | | — | | | 58.06 | | | | 48.08 | | | 2008 | | 91.34 | | 42.60 | | — | | — | | 2011 | | | | 64.44 | | | | 40.00 | | First Quarter | | 86.90 | | 67.11 | | — | | — | | | 62.31 | | | | 52.61 | | Second Quarter | | 91.34 | | 73.09 | | — | | — | | | 64.44 | | | | 53.04 | | Third Quarter | | 83.99 | | 57.19 | | — | | — | | | 58.25 | | | | 40.00 | | September | | | | 49.79 | | | | 40.00 | | Fourth Quarter | | 60.90 | | 42.60 | | — | | — | | | 55.93 | | | | 41.85 | | October | | 60.90 | | 42.60 | | — | | — | | | 55.93 | | | | 41.85 | | November | | 58.17 | | 43.93 | | — | | — | | | 52.89 | | | | 46.72 | | December | | 60.19 | | 44.90 | | — | | — | | | 52.46 | | | | 47.00 | | | 2009 (through March 31) | | 57.85 | | 42.88 | | — | | — | | First Quarter | | 57.85 | | 42.88 | | — | | — | | 2012 (through February 29) | | | | 57.06 | | | | 48.82 | | January | | 57.85 | | 44.73 | | — | | — | | | 53.41 | | | | 48.82 | | February | | 55.09 | | 46.35 | | — | | — | | | 57.06 | | | | 53.01 | | March | | 53.32 | | 42.88 | | — | | — | |
ITEM 10. ADDITIONAL INFORMATION Memorandum and Articles of Association Register Informationinformation TOTAL S.A. is registered with the Nanterre Trade Register under the registration number 542 051 180. Objects and Purposespurposes The Company’s purpose can be found in Article 3 of its bylaws (statuts (the Company’s bylaws)). Generally, the Company may engage in all activities relating to: (i) the exploration and extraction of mining deposits and the performance of industrial refining, processing, and trading of these materials, as well as their derivatives and by-products; (ii) the production and distribution of all forms of energy; (iii) the chemicals, rubber and health industries; (iv) the transportation and shipping of hydrocarbons and other products or materials relating to the Company’s business purpose; and (v) all financial, commercial, and industrial operations and operations relating to any fixed or unfixed assets and real estate, acquisitions of interests or holdings in any business or company that may relate to any of the above-mentioned purposes or to any similar or related purposes, of such nature as to promote the Company’s extension or its development. Director Issuesissues Compensation Directors receive attendance fees, the maximum aggregate amount of which, determined by the shareholders acting at a shareholders’ meeting, remains in effect until a new decision is made. The Board of Directors may apportion this amount among its members in whatever way it considers appropriate. TheIn addition, the Board may also grant its Chairman compensation in addition to attendance fees.compensation. Retirement The number of directors of TOTAL who are acting in their own capacity or as permanent representatives of a legal entity and are over 70seventy years old may not exceed one-third of the number of directors in office at the end of the fiscal year. If such number is exceeded, the oldest Board member is automatically deemed to have resigned. Directors who are the permanent representative of a legal person may not continue in office beyond their 70thseventieth birthday. Currently, the duties of the Chairman of the Board automatically cease on his 65thsixty-fifth birthday at the latest. At itstheir meeting of February 11,May 15, 2009, the Board resolved to propose to the shareholders’ meeting to be held on May 15, 2009,shareholders adopted an amendment of the bylaws pertaining to the rules relating to the nomination of the Chairman. The amendment will allowallows the Board, as an exception to the currently applicable 65-yearsixty-five year age limit, to appoint as Chairman of the Board for a period of up to two years a director who is more than 65sixty-five years old but less than 70seventy years old. Shareholdings Each director must own at least 1,000 shares of TOTAL during his or her term of office.office, except the director representing the employees shareholder who shall hold, either individually or through an investment trust governed by Article L.214-40 of the Monetary & Financial Code (French FCPE), at least one share or a number of stocks in such investment trust amounting to at least one share. Election Directors are elected for a term of three years. In 2003, TOTAL amended its Articles of Incorporation to provide for the election of one director to represent employee shareholders. This director was appointed for the first time at the shareholders’ meeting held on May 14, 2004. Description of Sharesshares The following is a summary of the material rights of holders of fully paid shares and is based on thestatuts bylaws of the Company and French Company Law as codified in Volume II (Livre II) of the French Commercial Code (referred to herein as the “French Company Law”). For more complete information, please read thestatuts bylaws of TOTAL S.A., a copy of which has been filed as an exhibit to this Annual Report. Dividend rights The Company may make dividend distributions to its shareholders from net income in each fiscal year, after deduction of the overhead and other social charges, as well as of any amortization of the business assets and of any provisions for commercial and industrial contingencies, as reduced by any loss carried forward from prior years, and less any contributions to reserves or amounts that the shareholders decide to carry forward. These distributions are also subject to the requirements of French Company Law and the Company’sstatuts. bylaws. Under French Company Law, the Company must allocate 5% of its net profits in each fiscal year to a legal reserve fund until the amount in that fund is equal to 10% of the nominal amount of its share capital. The Company’sstatuts bylaws provide that its shareholders may decide to allocate all or a part of any distributable profits among special or general reserves, to carry them forward to the next fiscal year as retained earnings, or to allocate them to the shareholders as dividends. Thestatuts bylaws provide that the remaindershareholders’ meeting held to approve the financial statements for the financial year may decide to grant an option to each shareholder between payment of any distributable profits shall be distributed among the shareholders in the form of dividends, eitherdividend in cash and payment in shares with respect to all or in shares.part of the dividend or interim dividends. Under French Company Law, the Company must distribute dividends to its shareholders pro rata, according to their shareholdings. Dividends are payable to holders of outstanding shares on the date fixed by the shareholders’ meeting approving the distribution of dividends or, in the case of interim dividends, on the date fixed by the Company’s Board of Directors at the meeting that approves the distribution of interim dividends. Under French Company Law,law, dividends not claimed within five years of the date of payment revert to the French State. Voting rights Each shareholder of the Company is entitled to the number of votes he or she possesses, or for which he or she holds proxies. According to French Company Law, voting rights may not be exercised in respect of fractional shares. EachAccording to the Company’s bylaws, each registered share that is fully paid and registered in the name of the same shareholder for a continuous period of at least two years is granted a double voting right after such two-year period. Upon capital increase by capitalization of reserves, profits or premiums on shares, a double voting right is granted to each registered share allocated to a shareholder relating to previously existing shares that already carry double voting rights. The double voting right is automatically canceled when the share is converted into a bearer share or when the share is transferred, unless the transfer is due to inheritance, division of community property between spouses, or a donation during the lifetime of the shareholder to the benefit of a spouse or relatives eligible to inherit.
French Company Law limits a shareholder’s right to vote notably in the following circumstances: shares held by the Company or by entities controlled by the Company under certain conditions, which cannot be voted; shares held by shareholders making a contribution in-kind to the Company, which cannot be voted with respect to resolutions relating to such in-kind contributions; and shares held by interested parties, which cannot be voted with respect to resolutions relating to such shareholders. Under the Company’sstatuts, bylaws, the voting rights exercisable by a shareholder, directly, indirectly or by proxy, at any shareholders’ meeting are limited to 10% of the total number of voting rights attached to the shares on the date of such shareholders’ meeting. This 10% limitation may be increased by taking into account double voting rights held directly or indirectly by the shareholder or by proxy, provided that the voting rights exercisable by a shareholder at any shareholders’ meeting may never exceed 20% of the total number of voting rights attached to the shares. TheseAccording to the Company’s bylaws, these limitations on voting lapse automatically if any individual or entity acting
alone or in concert with an individual or entity holds at least two-thirds of the total number of shares as a result of a tender offer for 100% of the shares. Liquidation rights In the event the Company is liquidated, its assets remaining after payment of its debts, liquidation expenses and all of its other remaining obligations will first be distributed to repay the nominal value of the shares. After these payments have been made, any surplus will be distributed pro rata among the holders of shares based on the nominal value of their shareholdings. Redemption provisions The Company’s shares are not subject to any redemption provisions. Sinking fund provisions The Company’s shares are not subject to any sinking fund provisions. Future capital calls Shareholders are not liable to the Company for further capital calls on their shares. Preferential subscription rights Holders of shares have preferential rights to subscribe on a pro rata basis for additional shares issued for cash. Shareholders may waive their preferential rights, either individually or, under certain circumstances, as a specifically named group at an extraordinary shareholders’ meeting. During the subscription period relating to a particular offering of shares, shareholders may transfer their preferential subscription rights that they have not previously waived. Changes in share capital Under French Company Law, the Company may increase its share capital only with the approval of its shareholders at an extraordinary shareholders’ meeting (or with a delegation of authority from its shareholders). There are two methods to increase share capital: (i) by issuing additional shares, including the creation of a new class of securities and (ii) by increasing the nominal value of existing shares. The Company may issue additional shares for cash or for assets contributed in kind, upon the conversion of debt securities, or other securities giving access to its share capital, that it may have issued, by capitalization of its reserves, profits or issuance premiums or, subject to certain conditions, in satisfaction of its indebtedness. Under French Company Law, TOTAL S.A.the Company may decrease its share capital only with the approval of its shareholders at an extraordinary shareholders’ meeting (or with a delegation of authority from its shareholders). There are two methods to reduce share capital: (i) by reducing the number of shares outstanding, and (ii) by decreasing the nominal value of existing shares. The conditions under which the share capital may be reduced will vary depending upon whether the reduction is attributable to losses. The Company may reduce the number of outstanding shares either by an exchange of shares or by the repurchase and cancellation of its shares. If the reduction is attributable to losses, shares are cancelled through offsetting the Company’s losses. Any decrease must meet the requirements of French Company Law, which states, among other things, that all the holders of shares in each class of shares must be treated equally, unless the affected shareholders otherwise agree. Form of shares The Company has only one class of shares, par value€2.50 per share. Shares may be held in either bearer or registered form. Shares traded on Euronext Paris are cleared and settled through Euroclear France. The Company may use any lawful means to identify holders of shares, including a procedure known astitres au porteur identifiableaccording to which Euroclear France will, upon the Company’s request, disclose to the Company the name, nationality, address and number of shares held by each shareholder in bearer form. The information may only be requested by the Company and may not be communicated to third parties. Holding of shares Under French Company Law concerningand since the “dematerialization” of securities, the ownership rights of shareholders are represented by book entries instead of share certificates (other than certificates representing French securities, which are outstanding exclusively outside the territory of France and are not held by French residents). Registered shares are entered into an account maintained by the Company or by a representative that it has nominated, while shares in bearer form must be held in an account maintained by an accredited financial intermediary on the shareholder’s behalf. For all shares in registered form, the Company maintains a share account with Euroclear France which is administered by BNP Paribas Securities Services. In addition, the Company maintains accounts in the name of each registered shareholder either directly or, at a shareholder’s request, through a shareholder’s accredited intermediary, in separate accounts maintained by BNP Paribas Securities Services on behalf of the Company. Each shareholder’s account shows the name and number of shares held and, in the case of shares registered through an accredited financial intermediary, the fact that they are so held. BNP Paribas Securities Services, as a matter of course, issues confirmations to each registered shareholder as to shares registered in a shareholder’s account, but these confirmations do not constitute documents of title. Shares held in bearer form are held and registered on the shareholder’s behalf in an account maintained by an accredited financial intermediary and are credited to an account at Euroclear France maintained by the intermediary. Each accredited financial intermediary maintains a record of shares held through it and will issue certificates of inscription for the shares that it holds. Transfers of shares held in bearer form only may be made through accredited financial intermediaries and Euroclear France. Cancellation of treasury shares After receiving authorization through a shareholders’ meeting, the Board of Directors of the Company may cancel treasury shares owned by the Company in accordance with French Company Law up to a maximum of 10% of the share capital within any period of 24twenty-four months. Description of TOTAL Share Certificatesshare certificates
The TOTAL share certificates are issued by Euroclear France. French law allows Euroclear France to create certificates representing French securities provided that these certificates are intended to be outstanding exclusively outside the territory of France and cannot be held by residents of France. Furthermore, TOTAL share certificates may not be held by a foreign resident in France, either personally or in the form of a bank deposit, but the coupons and rights may be exercised in France. Certificates for TOTAL shares are either in bearer form or registered in a securities trading account. Under Euroclear France regulations applicable to bearer stock certificates, TOTAL share certificates cannot be categorized as secondary securities, such as ADSs, issued by a foreign company to represent TOTAL shares. TOTAL share certificates have the characteristics of a bearer security, meaning they are: negotiable outside France; transmitted by delivery; and fungible with TOTAL share certificates, which may be converted freely from bearer form to registration in an account. All rights attached to TOTAL shares must be exercised directly by the bearer of the TOTAL share certificates. Other Issues
Share capital history | | | | | Fiscal 2009 | | | | | July 30, 2009 | | Reduction of the share capital from€5,929,520,185 to€5,867,520,185, through the cancellation of 24,800,000 treasury shares, par value€2.50. | | | January 1, 2010 | | Certification of the issuance of 1,414,810 new shares, par value€2.50 per share, between January 1 and December 31, 2009, raising the share capital by€3,537,025 from€5,867,520,185 to€5,871,057,210 (of which 934,780 new shares issued through the exercise of the Company’s stock options and 480,030 new shares through the exchange of 80,005 shares of Elf Aquitaine stock resulting from the exercise of Elf Aquitaine stock options and eligible for a guaranteed exchange for TOTAL shares). | | | Fiscal 2010 | | | | | January 12, 2011 | | Certification of the issuance of 1,218,047 new shares, par value€2.50, through the exercise of the Company’s stock options between January 1 and December 31, 2010, raising the share capital by€3,045,117.50 from€5,871,057,210 to€5,874,102,327.50. | | | Fiscal 2011 | | | | | April 28, 2011 | | Certification of the subscription to 8,902,717 new shares, par value€2.50, as part of the capital increase reserved for Group employees approved by the Board of Directors on October 28, 2010, raising the share capital by€22,256,792.50, from€5,874,102,327.50 to€5,896,359,120. | | | January 12, 2012 | | Certification of the issuance of 5,223,665 new shares, par value€2.50, through the exercise of the Company’s stock options between January 1 and December 31, 2011, raising the share capital by€13,059,162.50 from€5,896,359,120 to€5,909,418,282.50. |
Authorized share capital not issued as of December 31, 2011 The following is a summary of the currently valid delegations and authorizations to increase share capital that have been granted by the Shareholders’ meetingsMeeting to the Board of Directors. Seventeenth resolution of the Shareholders’ Meeting held on May 21, 2010 Delegation of authority granted by the Shareholders’ Meeting to the Board of Directors to increase the share capital by issuing common shares or other securities granting immediate or future rights to the Company’s share capital, maintaining shareholders’ pre-emptive subscription rights up to a maximum nominal amount of€2.5 billion,i.e., 1 billion shares (delegation of authority valid for twenty-six months). Furthermore, the maximum nominal amount of the debt securities granting rights to the Company’s share capital that may be issued pursuant to the seventeenth resolution and the eighteenth resolution (mentioned below) may not exceed€10 billion, or their exchange value, on the date of issuance. Eighteenth resolution of the Shareholders’ Meeting held on May 21, 2010 Delegation of authority granted by the Shareholders’ Meeting to the Board of Directors to increase the share capital by issuing common shares or other securities granting immediate or future rights to the Company’s share capital, canceling shareholders’ pre-emptive subscription rights, including the compensation comprised of securities as part of a public exchange offer, provided that they meet the requirements of Article L. 225-148 of the French Commercial Code. This resolution grants the Board of Directors the authority to grant a priority period for shareholders to subscribe to these securities pursuant to the provisions of Article L. 225-135 of the French Commercial Code. The total amount of the capital increases without pre-emptive subscription rights likely to occur immediately or in the future cannot exceed the nominal amount of€850 million,i.e., 340 million shares, par value€2.50 (delegation of authority valid for twenty-six months). The nominal amount of the capital increases is counted against the maximum aggregate nominal amount of€2.5 billion authorized by the seventeenth resolution of the Shareholders’ Meeting held on May 21, 2010. Furthermore, the maximum nominal amount of the debt securities granting rights to the Company’s share capital that may be issued pursuant to the above mentioned seventeenth and eighteenth resolutions may not exceed€10 billion, or their exchange value, on the date of issuance. Nineteenth resolution of the Shareholders’ Meeting held on May 21, 2010 Delegation of power granted by the Shareholders’ Meeting to the Board of Directors to increase the share capital by issuing new ordinary shares or other securities granting immediate or future rights to the Company’s share capital as compensation of in-kind contribution granted to the Company, by an amount not exceeding 10% of the share capital outstanding at the date of the Shareholders’ Meeting on May 21, 2010 (delegation of authority valid for twenty-six months). The nominal amount of the capital increases is counted against the maximum aggregate nominal amount of€850 million authorized by the eighteenth resolution of the Shareholders’ Meeting held on May 21, 2010. Twentieth resolution of the Shareholders’ Meeting held on May 21, 2010 Delegation of authority to the Board of Directors to complete capital increases reserved for employees participating in the Company Savings Plan (Plan d’épargne d’entreprise), up to a maximum amount equal to 1.5% of the outstanding share capital on the date of the decision of the Board of Directors to proceed with the issue (delegation of authority valid for twenty-six months). It is being specified that the amount of the capital increase is counted against the maximum aggregate nominal amount of€2.5 billion authorized by the seventeenth resolution of the Shareholders’ Meeting held on May 21, 2010. Given that the Board of Directors made use of this delegation of authority on October 28, 2010, under which 8,902,717 new TOTAL shares were issued in 2011, the authorized share capital not issued with respect to capital increases reserved for employees participating in a Company Savings Plan was€66,384,480 as of December 31, 2011, representing 26,553,792 shares. As a result of the use of the delegation authorizing capital increases reserved for employees decided by the Board on October 28, 2010, and given that the Board of Directors did not make use of the delegations of authority granted by the seventeenth, eighteenth and nineteenth resolutions of the Shareholders’ Meeting held on May 21, 2010, the authorized capital not issued was€2.48 billion as of December 31, 2011, representing 991 million shares. Eleventh resolution of the Shareholders’ Meeting held on May 13, 2011 Authority to grant restricted outstanding or new TOTAL shares to employees of the Group and to executive officers up to a maximum of 0.8% of the share capital outstanding on the date of the meeting of the Board of Directors that approves the restricted share grants. In addition, the shares granted to the Company’s executive officers cannot exceed 0.01% of the outstanding share capital on the date of the meeting of the Board of Directors that approves the grants (authorization valid for thirty-eight months). Pursuant to this authorization: 3,700,000 outstanding shares were awarded by the Board of Directors on September 14, 2011, including 16,000 outstanding shares awarded to the Chairman and Chief Executive. As of December 31, 2011, 15,210,138 shares, including 220,376 to the Company’s corporate executive officers could, therefore, still be awarded pursuant to this authorization. Twenty-first resolution of the Shareholders’ Meeting held on May 21, 2010 Authority to grant stock options reserved for TOTAL employees and to executive and officers up to a maximum of 1.5% of the share capital outstanding on the date of the meeting of the Board of Directors that approves the stock option grant. In addition, the options granted to the Company’s corporate executive officers cannot exceed 0.1% of the outstanding share capital on the date of the meeting of the Board of Directors that approves the grants (authorization valid for thirty-eight months). Pursuant to this authorization: 4,925,000 stock options were awarded by the Board of Directors at its meeting on September 14, 2010, including 240,000 stock options to the Chairman and Chief Executive Officer; 1,600,000 stock options were awarded by the Board of Directors at its meeting on September 14, 2011, including 160,000 stock options to the Chairman and Chief Executive Officer. As of December 31, 2011, 28,931,509 stock options, including 1,963,767 to the Company’s corporate executive officers, could still be awarded pursuant to this authorization. Seventeenth resolution of the Shareholders’ Meeting held on May 11, 2007 Authority to cancel shares up to a maximum of 10% of the share capital of the Company existing as of the date of the operation within a twenty-four-month period. This authorization is effective until the Shareholders’ Meeting called to approve the financial statements for the year ending December 31, 2011. The Board did not make use of this delegation of authority during fiscal year 2011. Based on 2,363,767,313 shares outstanding on December 31, 2011, the Company may, up until the conclusion of the Shareholders’ Meeting called to approve the financial statements for the fiscal year ending on December 31, 2011, cancel a maximum of 236,376,731 shares before reaching the cancellation threshold of 10% of share capital canceled during a twenty-four-month period. Other issues Shareholders’ meetings French companies may hold either ordinary or extraordinary shareholders’ meetings. Ordinary shareholders’ meetings are required for matters that are not specifically reserved by law to extraordinary shareholders’ meetings: the election of the members of the Board of Directors, the appointment of statutory auditors, the approval of a management report prepared by the Board of Directors, the approval of the annual financial statements, the declaration of dividends and the issuance of bonds.bonds (if the bylaws so provide). Extraordinary shareholders’ meetings are required for approval of amendments to a company’sstatuts, bylaws, modification of shareholders’ rights, mergers, increases or decreases in share capital, including a waiver of preferential subscription rights, the creation of a new class of shares, the authorization of the issuance of investment certificates or securities convertible, exchangeable or redeemable into shares and for the sale or transfer of substantially all of a company’s assets. The Company’s Board of Directors is required to convene an annual shareholders’ meeting for approval of the annual financial statements. This meeting must be held within six months of the end of the fiscal year. However, the president of theTribunal de Commerceof Nanterre, the local French commercial court, may grant an extension of this six-month period. The Company may convene other ordinary and extraordinary meetings at any time during the year. Meetings of shareholders may be convened by the Board of Directors or, if it fails to call a meeting, by the Company’s statutory auditors or by a court-appointed agent. A shareholder or group of shareholders holding at least 5% of the share capital, the employee committee or another interested party under certain exceptional circumstances, may request that the court appoint an agent. The notice of meeting must state the agenda for the meeting. French Company Law requires that a preliminary notice of a listed company’s shareholders’ meeting be published in theBulletin des annonces légales obligatoires(“BALO”) at least 35thirty-five days prior to the meeting (or 15fifteen days in the event the Company is subject to a tender offer and the Company calls a shareholders’ meeting to approve measures, the implementation of which would be likely to cause such tender offer to fail). The preliminary notice must first be sent to the French Financial Markets Authority (Autorité des marchés financiers) (“AMF”) with an indication of the date it is to be published in the BALO. The preliminary notice must include the agenda of the meeting and the proposed resolutions that will be submitted to a shareholders’ vote. Within 10 days of publication, one One or more shareholders holding a certain percentage of the Company’s share capital determined on the basis of a formula related to capitalization may propose to add on the shareholders’ meeting’s agenda additional resolutions.resolutions to be submitted to a shareholders’ vote and/or matters without a shareholders’ vote (points), provided that the text of additional resolutions or matters be received by the Company on at least the twenty-fifth day preceding the meeting (or at least the tenth day in the event the Company is subject to a tender offer and the Company calls a shareholders’ meeting to approve measures that, if implemented, would likely cause such tender offer to fail). The demand of the shareholders’ that are eligible to require for the inscription of matters on the meeting agenda has to be duly motivated. French Company Law also requires that the preliminary notice of a listed company’s shareholders’ meeting, as well as the additional resolutions and/or matters presented by the shareholders under the terms and conditions prescribed under French law, be published on the Company’s Web site during a period starting at the latest on the twenty-first day prior to the meeting (or the fifteenth day in the event the Company is subject to a tender offer and the Company calls a shareholders’ meeting to approve measures that, if implemented, would likely cause such tender offer to fail). Notice of a shareholders’ meeting is sent by postal or electronic mail at least 15fifteen days (or six days in the event of shareholders’ meetings convened in the situation where the Company was subject to a tender offer to approve measures, the implementation of which would be likely to cause such tender offer to fail) before the meeting to all holders of registered shares who have held their shares for more than one month. However, in the case where the original meeting was adjourned because a quorum was not met, this time period is reduced to sixten days (or four days in the event of shareholders’ meetings convened in the situation where the Company were subject to a tender offer to approve measures, the implementation of which would be likely to cause such tender offer to fail). Attendance and the exercise of voting rights at both ordinary and extraordinary shareholders’ meetings are subject to certain conditions. Pursuant to French Company Law, participation at shareholders’ meetings is subject to the condition that an entry of registration has been made, for the owner of registered shares, in the records maintained by the Company, or, for the owner of bearer shares, in the records of an authorized intermediary, in each case at 12:00 a.m. (Paris time) on the third trading day preceding the shareholders’ meeting. For the owner of bearer shares, the registration is evidenced by a certificate of participation ((attestation de participation)participation) issued by the authorized intermediary. Subject to the above restrictions, all of the Company’s shareholders have the right to participate in the Company’s shareholders’ meetings, either in person or by proxy. NoEach shareholder may delegate voting authority to another person exceptshareholder, the shareholder’s spouse, or another shareholder or, ifthe companion with whom the shareholder is nothas registered a resident of France, bycivil partnership (PACS). Every shareholder may also delegate voting authority to any other individual or legal entity he or she may choose, provided, among other things, that a registered intermediary in conformity with applicable regulations.written proxy be provided to the Company. Shareholders may vote, either in person, by proxy, or by postal or electronic mail, and each is entitled to as many votes as he or she possesses or as many shares as he or she holds proxies for.for, subject to the voting rights limitations provided by the Company’s bylaws. If the shareholder is a legal entity, it may be represented by a legal representative. A shareholder may grant a proxy to the Company by returning a blank proxy form. In this last case, the chairman of the shareholders’ meeting may vote the shares in favor of all resolutions proposed or agreed to by the Board of Directors and against all others. The Company will send proxy forms to shareholders upon request. In order to be counted, proxies must be received at least one daythree days prior to the shareholders’ meeting at the Company’s registered office or at another address indicated in the notice convening the meeting.meeting, or by 3:00 p.m. on the day prior to the shareholders’ meeting for electronic proxy forms. Under French Company Law, shares held by the Company or by entities controlled directly or indirectly by the Company are not entitled to voting rights. There is no requirement that a shareholder have a minimum number of shares in order to be able to attend or be represented at shareholders’ meetings. Under French Company Law, a quorum requires the presence, in person or by proxy, including those voting by mail, of shareholders having at least 20% of the shares entitled to vote in the case of (i) an ordinary shareholders’ meeting, (ii) an extraordinary meeting where shareholders are voting on a capital increase by capitalization of reserves, profits or share premium, or (iii) an extraordinary general meeting of shareholders convened in the situation where the Company is subject to a tender offer in order to approve an issuance of warrants allowing the subscription, at preferential conditions, of shares of the Company and the free allotment of such warrants to existing shareholders of the Company, the implementation of which would be likely to cause such tender offer to fail, or 25% of the shares entitled to vote in the case of any other extraordinary shareholders’ meeting. If a quorum is not present at any meeting, the meeting is adjourned. There is no quorum requirement when an ordinary shareholders’ meeting is reconvened, but the reconvened meeting may consider only questions whichthat were on the agenda of the adjourned meeting. When an extraordinary shareholders’ meeting is reconvened, the quorum required is 20% of the shares entitled to vote, except where the reconvened meeting is considering capital increases through capitalization of reserves, profits or share premium.premium or an issuance of warrants allowing the subscription, at preferential conditions, of shares of the Company and the free allotment of such warrants to existing shareholders of the Company, the implementation of which would be likely to cause such tender offer to fail. For these matters, no quorum is required at the reconvened meeting. If a quorum is not present at a reconvened meeting requiring a quorum, then the meeting may be adjourned for a maximum of two months. At an ordinary shareholders’ meeting, approval of any resolution requires the affirmative vote of a simple majority of the votes of the shareholders present or represented by proxy. The approval of any resolution at an extraordinary shareholders’ meeting requires the affirmative vote of a two-thirds majority of the votes cast, except that (i) any resolution to approve a capital increase by capitalization of reserves profits, or share premium, or (ii) any resolution, in the situation where the Company is subject to a tender offer in order to approve an issuance of warrants allowing the subscription, at preferential conditions, of shares of the Company and the free allotment of such warrants to existing shareholders of the Company, the implementation of which would be likely to cause such tender offer to fail, only requires the affirmative vote of a simple majority of the votes cast. Notwithstanding these rules, a unanimous vote is required to increase shareholders’ liabilities. Abstention from voting by those present or represented by proxy is counted as a vote against any resolution submitted to a vote. As set forth in the Company’sstatuts, bylaws, shareholders’ meetings are held at the Company’s registered office or at any other location specified in the written notice. Requirements for temporary transfer of securities French Company Law provides that any legal entity or individual (with the exception of those described in paragraph IV- 3°of Article L. 233-7 of the French Commercial Code) holding alone or in concert a number of shares representing more than 0.5% of the Company’s voting rights as a result of one or several temporary stock transfers or assimilated transactions within the meaning of Article L. 225-126 of the French Commercial Code is required to inform the Company and the AMF of the number of the shares that are temporarily possessed no later than the third business day preceding the shareholders’ meeting at midnight. If such declaration is not made, the shares bought under any of the above described temporary stock transfers or assimilated transactions shall be deprived of their voting rights at the relevant shareholders’ meeting and at any shareholders’ meeting that would be held until such shares are transferred again or returned. Ownership of shares by non-French persons There is no limitation on the right of non-resident or foreign shareholders to voteown securities of the Company, either under French Company Law or under thestatuts bylaws of the Company. Requirement for holdings exceeding certain percentages French Company Law provides that any individual or entity, acting alone or in concert with others, that holds, directly or indirectly, more than 5%, 10%, 15%, 20%, 25%, 33 1/30%, 1/3,%, 50%, 66 2/2/3,%, 90% or 95% of the outstanding shares or of the voting rights(1) attached to the shares, or that increases or decreases its shareholding or voting rights by any of the above percentages must notify the Company by registered letter, with return receipt, within fivefour business days of crossing that threshold,any of the above-mentioned thresholds, of the number of shares and voting rights it holds. An individual or entity must also notify the AMF, the self-regulatoryself- regulatory organization that has general regulatory authority over the French stock exchanges and whose members include representatives of French stockbrokers, by registered letter, with return receipt, within fivefour trading days of crossing that threshold.any of the above-mentioned thresholds. In addition, every shareholder who, directly or indirectly, acting alone or in concert with others, acquires ownership or control of shares representing 10%, 15%, 20% or 25% of the Company’s share capital must notify the Company and the AMF of its intentions for the six months following such an acquisition. Any shareholder who fails to comply with thesethe above requirements (thresholds and intentions notifications) will have its voting rights in excess of such thresholds suspended for a period of two years from the date such shareholder complies with the notification requirements and may have all or part of its voting rights suspended for up to five years by the commercial court at the request of the Company’s Chairman, any of the Company’s shareholders or theAutorité des marchés financiers. In addition, every shareholder who, directly or indirectly, acting alone or in concert with others, acquires ownership or control of shares representing 10% or 20% of the Company’s share capital must notify the Company and theAutorité des marchés financiersof its intentions for the 12 months following such an acquisition. Failure to comply with this notification of intentions will result in the suspension of the voting rights attached to the shares exceeding this 10% or 20% threshold held by the shareholder for a period of two years from the date on which the shareholder has cured such default and, upon a decision of the commercial court part or all the shares held by such shareholder may be suspended for up to five years. AMF.
In addition, the Company’sstatuts bylaws provide that any person, whether a natural person or a legal entity, who comes to hold, directly or indirectly, 1% or more, or any multiple of 1%, of the Company’s share capital or voting rights or of securities that may include future voting rights or futuregive access to the Company’s share capital or voting rights, must notify the Company by registered letter with return receipt requested, within 15fifteen calendar days of crossing any such threshold. Failure to comply with these notification provisions will result in the suspension of the voting rights attached to the shares exceeding this 1% threshold held by the shareholder if acknowledged at a shareholders’ meeting and if requested at asuch shareholders’ meeting by one or more shareholders together holding shares representing at least 3% of the share capital.capital or voting rights. Any individual or legal entity whose direct or indirect holding of shares falls below each of the levels mentioned must also notify the Company in the manner and within the time limits set forth above. Subject to certain limited exemptions, any person, or persons acting in concert, owning in excess of 33 1/1/3% of the share capital or voting rights of the Company must initiate a public tender offer for the balance of the share capital, voting rights and securities giving access to such share capital or voting rights. Material Contracts There have been no material contracts (not entered into in the ordinary course of business) entered into by members of the Group since March 31, 2006.23, 2010. | (1) | For purposes of shareholding threshold declarations, pursuant to Article 223-11 of the General Regulation of the AMF, voting rights are calculated on the basis of all outstanding shares, whether or not these shares would have rights to vote at a shareholders’ meeting. |
Exchange Controls Under current French exchange control regulations, no limits exist on the amount of payments that TOTAL may remit to residents of the United States. Laws and regulations concerning foreign exchange controls do require, however, that an accredited intermediary must handle all payments or transfer of funds made by a French resident to a non-resident. (1) | For purposes of shareholding threshold declarations, pursuant to Article 223-11 of the General Regulation of the AMF, voting rights are calculated on the basis of all outstanding shares, whether or not these shares would have rights to vote at a shareholders’ meeting. |
Taxation General This section generally summarizes the material U.S. federal income tax and French tax consequences of owning and disposing of shares and ADSs of TOTAL to U.S. Holders that hold their shares or ADSs as capital assets for tax purposes. A U.S. Holder is a beneficial owner of shares or ADSs that is (i) a citizen or resident of the United States for U.S. federal income tax purposes, (ii) a domestic corporation or other domestic entity treated as a corporation for U.S. federal income tax purposes, (iii) an estate whose income is subject to U.S. federal income tax regardless of its source, or (iv) a trust if a U.S. court can exercise primary supervision over the trust’s administration and one or more U.S. persons are authorized to control all substantial decisions of the trust. This section does not apply to members of special classes of holders subject to special rules, including: traders in securities that elect to use a mark-to-market method of accounting for their securities holdings; tax-exempt organizations; life insurance companies; persons liable for alternative minimum tax; persons that actually or constructively own 5%10% or more of the share capital or voting rights in TOTAL; persons that purchase or sell shares or ADSs as part of a wash sale for U.S. federal income tax purposes; persons that hold the shares or ADSs as part of a straddle or a hedging or conversion transaction; or persons whose functional currency is not the U.S. dollar. If a partnership holds ordinary shares or ADSs, the tax treatment of a partner will generally depend upon the status of the partner and upon the activities of the partnership. Partners of a partnership holding these ordinary shares or ADSs should consult their tax advisors as to the tax consequences of owning or disposing of ordinary shares or ADSs, as applicable. In addition, the discussion of the material French tax consequences is limited to U.S. Holders that (i) are residents of the United States for purposes of the Treaty (as defined below), (ii) do not maintain a permanent establishment or fixed base in France to which the shares or ADSs are attributable and through which the respective U.S. Holders carry on, or have carried on, a business (or, if the holder is an individual, performs or has performed independent personal services), and (iii) are otherwise eligible for the benefits of the Treaty in respect of income and gain from the shares or ADSs. In addition, this section is based in part upon the representations of the Depositary and the assumption that each obligation in the Deposit Agreement and any related agreement will be performed in accordance with its terms. This section is based on the Internal Revenue Code of 1986, as amended, its legislative history, existing and proposed regulations, published rulings and court decisions, and with respect to the description of the material French tax consequences, the laws of the Republic of France and French tax regulations, all as currently in effect, as well as on the Convention Between the United States and the Republic of France for the Avoidance of Double Taxation and the Prevention of Fiscal Evasion with respect to Taxes on Income and Capital dated August 31, 1994 as amended (the “Treaty”) as currently in effect.. These laws, regulations and the Treaty are subject to change, possibly on a retroactive basis. This discussion is intended only as a descriptive summary and does not purport to be a complete analysis or listing of all potential tax effects of the ownership or disposition of the shares and ADSs and is not intended to substitute competent professional advice. Individual situations of holders of shares and ADSs may vary from the description made below. The following summary does not address the French tax treatment applicable to dividends transferred to so-called “Non Cooperative Countries and Territories” within the meaning of Section 238-0 A of the French Tax Code. Holders are urged to consult their own tax advisoradvisors regarding the U.S. federal, state and local, and French and other tax consequences of owning and disposing shares or ADSs of TOTAL in their respective circumstances. In particular, a holder is encouraged to confirm with its advisor whether the holder is a U.S. Holder eligible for the benefits of the Treaty with its advisor.Treaty. Taxation of dividends Taxation of Dividends
French taxestaxation The term “dividends” used in the following discussion means dividends within the meaning of applicable income tax treaties, or, where not defined by such treaties, within the meaning of the French domestic tax law as set forth in administrative guidelines dated February 25, 2005 (4 J-1-05) (the “Administrative Guidelines”). Dividends paid to non-residents of France are subject to French withholding tax at a rate of 25%30%. As a result of the 2008 French Finance Law, thisThis withholding tax is reduced to 18%21% with respect to dividends distributed toreceived as from January 1, 2012 by non-residents of France who are residents of certain States located within the European Economic Area. However, the rate may be reduced pursuant to a tax treaty or similar agreement. Under the Treaty, a U.S. Holder is generally entitled to a reduced rate of French withholding tax of 15% with respect to dividends, provided the ownership of shares or ADSs is not effectively attributable to a permanent establishment or to a fixed base in France and certain other requirements are satisfied. Residents of France who are individuals and who receive dividends are taxed on 60% of the amount of the dividends received. In addition, French resident shareholders who are individuals are entitled to a tax credit (Crédit d’impôt) equal to 50% of the amount of dividends received but with an overall annual cap of€230 or, as the case may be,€115 depending on the marital status of the individual holder. In addition, residents of France may instead opt for a withholding tax equal to 18% of the dividends received and, in such a case, will not be eligible for the receipt ofCrédit d’impôt.
Under French domestic law, shareholders who are not residents of France for tax purposes are not eligible to the benefit of theCrédit d’impôt. However, U.S. Holders who benefit from the Treaty may be entitled to the refund of theCrédit d’impôt(less applicable withholding tax). Please note that the French tax authorities have not yet provided for the procedure of refund of such credit.
U.S. Holders should consult their own tax advisors in order to determine the effect of the Treaty and the applicable procedures in respect of the Administrative Guidelines, in light of such particular circumstances. The Administrative Guidelines set forth the conditions under which the reduced French withholding tax at the rate of 15% may be available. The immediate application of the reduced 15% rate is available to those U.S. Holders that may benefit from the so-called “simplified procedure” (within the meaning of the Administrative Guidelines). Under the “simplified procedure”, U.S. Holders may claim the immediate application of withholding tax at the rate of 15% on the dividends to be received by them, provided that: | (i) | they furnish to the U.S. financial institution managing their securities account a certificate of residence conforming with the model attached to the Administrative Guidelines. The immediate application of the 15% withholding tax will be available only if the certificate of residence is sent to the U.S. financial institution managing their securities account before the dividend payment date. Furthermore, each financial institution managing the U.S. Holders’ securities account must also send to the French paying agent the figure of the total amount of dividends to be received which are eligible to the reduced withholding tax rate before the dividend payment date; |
| (ii) | the U.S. financial institution managing the U.S. Holder’s securities account provides to the French paying agent a list of the eligible U.S. Holders and |
| other pieces of information set forth in the Administrative Guidelines. Furthermore, the financial institution managing the U.S. Holders’ securities account should certify that each U.S. Holder is, to the best of its knowledge, a United States resident within the meaning of the Treaty. These documents must be sent as soon as possible, in all cases before the end of the third month computed as from the end of the month of the dividend payment date. |
Where the U.S. Holder’s identity and tax residence are known by the French paying agent, the latter may release such U.S. Holder from furnishing to (i) the financial institution managing its securities account, or (ii) as the case may be, the Internal Revenue Service, the abovementioned certificate of residence, and apply the 15% withholding tax rate to dividends it pays to such U.S. Holder. U.S. Pension Funds and Other Tax-Exempt Entities created and operating in accordance with the provisions of Sections 401 (a)401(a), 403 (b)403(b), 457 or 501 (c) 501(c)(3) of the U.S. Internal Revenue Code (IRC) are subject to the same general filing requirements except that, in addition, they have to supply a certificate issued by the U.S. Internal Revenue Service (“IRS”) or any other document stating that they have been created and are operating in accordance with the provisions of the abovementionedabove-mentioned Code Sections. This certificate must be produced together with the first request of application of the reduced rate, once together with the first request of immediate application of the 15% withholding tax and at French Tax AuthoritiesAuthorities’s specific request. In the same way, regulated companies such as RIC, REIT or REMIC will have to send to the financial institution managing their securities account a certificate from the IRS indicating that they are classified as Regulated Companies (RIC, REIT or REMIC) within the provisions of the relevant sections of the IRC. In principle, this certification must be produced each year and before the dividend payment. For a U.S. Holder that is not entitled to the “simplified” procedure and whose identity and tax residence are not known by the paying agent at the time of the payment, the 25%30% French withholding tax will be levied at the time the dividends are paid. Such U.S. Holder, however, may however, be entitled to a refund of the withholding tax in excess of the 15% rate under the “standard”, as opposed to the “simplified”, procedure, provided that the U.S. Holder furnishes to the French paying agent an application for refund on forms No. 5000-FR and/or 5001-FR (or any other relevant form to be issued by the French tax authorities), certified by the U.S. financial institution managing the U.S. Holder’s securities account (or, if not, by the competent U.S. tax authorities), before December 31 of the second year following the date of payment of the withholding tax at the 25%30% rate to the French tax authorities, according to the requirements provided by the Administrative Guidelines. However, it will not be paid before January 15 of the year following the year in which the dividend was paid. Copies of forms No. 5000-FR and 5001-FR (or any other relevant form to be issued by the French tax authorities) as well as the form of the certificate of residence and the U.S. financial institution certification, together with instructions, are available from the U.S. Internal Revenue Service and the FrenchCentre des Impôts des Non-Residentsat 10, rue du Centre, 93463 Noisy le Grand, France. These forms, together with instructions, will also be provided by the Depositary to all U.S. Holders of ADRs registered with the Depositary. The Depositary will use reasonable efforts to follow the procedures established by the French tax authorities for U.S. Holders to benefit from the immediate application of the 15% French withholding tax rate or, as the case may be, to recover the excess 10%15% French withholding tax initially withheld and deducted in respect of dividends distributed to them by TOTAL, and obtain, in respect to dividend distributions made to U.S. Holders who are individuals, the refund of theCrédit d’impôt (less applicable withholding tax), in accordance with the procedures established by the French tax authorities.TOTAL. To effect such benefit recovery and/or refund,recovery, the Depositary shall advise such U.S. Holder to return the relevant forms to it, properly completed and executed. Upon receipt of the relevant forms properly completed and executed by such U.S. Holder, the Depositary shall cause them to be filed with the appropriate French tax authorities, and upon receipt of any resulting remittance, the Depositary shall distribute to the U.S. Holder entitled thereto, as soon as practicable, the proceeds thereof in U.S. dollars. The identity and address of the French paying agent isare available from TOTAL. U.S. taxation For U.S. federal income tax purposes and subject to the passive foreign investment company rules discussed below, the gross amount of any dividend a U.S. Holder must include in gross income equals the amount paid by TOTAL plus any amount of theCrédit d’impôt described above (see “— French Taxes” above) transferred to the U.S. Holder with respect to this amount (including any French tax withheld with respect to the distribution made by TOTAL and theCrédit d’impôt) to the extent of the current and accumulated earnings and profits of TOTAL (as determined for U.S. federal income tax purposes). The dividend will be income from foreign sources. Dividends paid to a noncorporatenon-corporate U.S. Holder in taxable years beginning before January 1, 20112013, that constitute qualified dividend income will be taxable to the holder at a maximum tax rate of 15%, provided that the shares or ADSs are held for more than 60sixty days during the 121-day period beginning 60sixty days before the ex-dividend date and the holder meets other holding period requirements. TOTAL believes that dividends paid by TOTAL with respect to its shares or ADSs will be qualified dividend income. The dividend will not be eligible for the dividends-received deduction allowed to a U.S. corporation under Section 243 of the Code. The dividend is taxable to the U.S. Holder when the holder, in the case of shares, or the Depositary, in the case of ADSs, receives the dividend, actually or constructively. To the extent that an amount received by a U.S. Holder exceeds the allocable share of TOTAL’s current and accumulated earnings and profits, it will be applied first to reduce such holder’s tax basis in shares or ADSs owned by such holder and then, to the extent it exceeds the holder’s tax basis, it will constitute capital gain. The amount of any dividend distribution includible in the income of a U.S. Holder equals the U.S. dollar value of the euro payment made, determined at the spot dollar/euroeuro/dollar exchange rate on the date the dividend distribution is includible in the U.S. Holder’s income, regardless of whether the payment is in fact converted into U.S. dollars. Any gain or loss resulting from currency exchange fluctuations during the period from the date the dividend payment is includible in the U.S. Holder’s income to the date the payment is converted into U.S. dollars will generally be treated as ordinary income or loss from sources within the United States and will not be eligible for the special tax rate applicable to qualified dividend income. Subject to certain conditions and limitations, French taxes withheld in accordance with the Treaty will generally be eligible for credit against the U.S. Holder’s U.S. federal income tax liability. The limitation on foreign taxes eligible for credit is calculated separately with respect to specific classes of income. In addition, special rules apply in determining the foreign tax credit limitation with respect to dividends that are subject to the maximum 15% tax rate. To the extent a refund of the tax withheld is available to a U.S. Holder under French law or under the Treaty, the amount of tax withheld that is refundable will not be eligible for credit against such an individual’s United States federal income tax liability. For this purpose, dividends distributed by TOTAL and the relatedCrédit d’impôt payments paid in taxable years beginning before January 1, 2007 generally will constitute “passive income”, or, in the case of certain U.S. Holders, “financial services income”, and dividends paid in taxable years beginning after December 31, 2006 will constitute “passive income”, or, in the case of certain U.S. Holders, “general income”, which in either case, isare treated separately from other types of incomeone another for purposes of computing the foreign tax credit allowable to the U.SU.S. Holder. Alternatively, a U.S. Holder may claim all foreign taxes paid as an itemized deduction in lieu of claiming a foreign tax credit. Taxation of Dispositiondisposition of Sharesshares In general, a U.S. Holder who is eligible for the benefits of the Treaty will not be subject to French tax on any capital gain from the sale or exchange of the ADSs or redemption of the underlying shares unless those ADSs or shares form part of a business property of a permanent establishment or fixed base that the U.S. Holder has in France. Special rules may apply to individuals who are residents of more than one country. A 3% registration dutytransfer tax assessed on the higher of the purchase price and the fair market value of the shares (subject to a maximum of€5,000 per transfer) applies to certain transfers of shares in French companies. Such transfer tax is equal to: 3% for the portion of the purchase price (or the fair market value, if higher) below€200,000; 0.5% for the portion of the purchase price (or the fair market value, if higher) between€200,000 and€500 million; 0.25% for the portion of the purchase price (or the fair market value, if higher) above€500 million. The dutytransfer tax does not apply to transfers of shares in TOTAL, provided that the transfer is not evidenced by a written agreement, oragreement. Recently enacted legislation applicable as from August 1, 2012, has introduced, under certain conditions, a financial transaction tax on the acquisition of shares of publicly traded companies registered in France having a market capitalization over€1 billion. A list of the companies within the scope of the financial transaction tax will be published in a forthcoming decree. We expect that TOTAL will be included in this list. The financial transaction tax will be due at a rate of 0.1% on the value of the acquired shares. Transactions that are subject to the financial transaction tax are exempt from the above-mentioned transfer tax (which was also modified by the same legislation). U.S. Holders should consult their tax advisors as to the tax consequences of such written agreement is executed outside France.reforms. For U.S. federal income tax purposes and subject to the passive foreign investment company rules discussed below, a U.S. Holder generally will recognize capital gain or loss upon the sale or disposition of shares or ADSs equal to the difference between the U.S. dollar value of the amount realized on the sale or disposition and the holder’s tax basis, determined in U.S. dollars, in the shares or ADSs. The gain or loss generally will be U.S. source gain or loss and will be long-term capital gain or loss if the U.S. Holder’s holding period of the shares or ADSs is more than one year at the time of the disposition. Long-term capital gain of a non-corporate U.S. Holder that is recognized in taxable years beginning before January 1, 2011 is generally taxed at a maximum rate of 15%.preferential rates. The deductibility of capital losses is subject to limitation. Passive Foreign Investment Statusforeign investment status TOTAL believes that the Sharesshares or ADSs will not be treated as stock of a passive foreign investment company, or PFIC, for United States federal income tax purposes, but this conclusion is a factual determination that is made annually and thus is subject to change. If TOTAL is treated as a PFIC, unless a U.S. Holder elects to be taxed annually on a mark-to-market basis with respect to the Sharesshares or ADSs, gain realized on the sale or other disposition of the Sharesshares or ADSs would in general not be treated as capital gain. Instead, a U.S. Holder would be treated as if he or she had realized such gain and certain “excess distributions” ratably over the holding period for the Sharesshares or ADSs and would be taxed at the highest tax rate in effect for each such year to which the gain was allocated, in addition to which an interest charge in respect of the tax attributable to each such year would apply. With certain exceptions, a U.S. Holder’s shares or ADSs will be treated as stock in a PFIC if TOTAL were a PFIC at any time during his or her holding period in the shares or ADSs. Dividends paid will not be eligible for the special tax rates applicable to qualified dividend income if TOTAL is treated as a PFIC with respect to a U.S. Holder either in the taxable year of the distribution or the preceding taxable year, but instead will be taxable at rates applicable to ordinary income. French Estateestate and Gift Taxesgift taxes In general, a transfer of ADSs or shares by gift or by reason of the death of a U.S. Holder that would otherwise be subject to French gift or inheritance tax, respectively, will not be subject to such French tax by reason of the Convention between the United States of America and the French Republic for the Avoidance of Double Taxation and the Prevention of Fiscal Evasion with Respect to Taxes on Estates, Inheritances and Gifts, dated November 24, 1978 as amended, unless the donor or the transferor is domiciled in France at the time of making the gift, or at the time of his death, or if the ADSs or shares were used in, or held for use in, the conduct of a business through a permanent establishment or a fixed base in France. French Wealth Taxwealth tax The French wealth tax does not apply to a U.S. Holder (i) that is not an individual, or (ii) in the case of individuals who are eligible for the benefits of the Treaty and who own, alone or with related persons, directly or indirectly, TOTAL shares which give right to less than 25 per cent25% of TOTAL’s earnings. U.S. Statestate and Local Taxeslocal taxes In addition to U.S. federal income tax, U.S. Holders of shares or ADSs may be subject to U.S. state and local taxes with respect to their shares or ADSs. U.S. Holders should consult their own tax advisors. Dividends and Paying Agents After BNP Paribas Securities Services performs centralizing procedures, dividends are paid through the accounts of financial intermediaries participating in Euroclear France’s direct payment procedures. The Bank of New York Mellon acts as paying agent for dividends distributed to ADS holders. Documents on Display TOTAL files annual, periodic, and other reports and information with the Securities and Exchange Commission. You may read and copyinspect any reports, statements or other information TOTAL files with the United States Securities and Exchange Commission (“SEC”) at the Securities and Exchange Commission’sSEC’s public reference rooms by calling the Securities and Exchange CommissionSEC for more information at 1-800-SEC-0330. All of TOTAL’s Securities and Exchange CommissionSEC filings made after December 31, 2001, are available to the public at the Securities and Exchange Commission webSEC Web site at http://www.sec.gov and from certain commercial document retrieval services. You may also read and copyinspect any document the Company files with the Securities and Exchange CommissionSEC at the offices of The New York Stock Exchange, 20 Broad Street, New York, New York 10005. ITEM 11. QUANTITATIVE AND QUALITATIVE DISCLOSURES ABOUT MARKET RISK Please refer to Note 31 to the Consolidated Financial Statements included elsewhere herein for a qualitative and quantitative discussion of the Group’s exposure to market risks. Please also refer to NoteNotes 29 and 30 to the Consolidated Financial Statements included elsewhere herein for details of the different derivatives owned by the Group in these markets. As part of its financing and cash management activities, the Group uses derivative instruments to manage its exposure to changes in interest rates and foreign exchange rates. These instruments are principally interest rate and currency swaps. The Group may also use, on a less frequent basis, futures caps, floors and options contracts. These operations and their accounting treatment are detailed in Note 1 paragraph M and Notes 20, 28 and 29 to the Consolidated Financial Statements included elsewhere herein. The financial performance of TOTAL is sensitive to a number of factors, the most significant being oil and gas prices, generally expressed in dollars, and exchange rates, in particular that of the dollar versus the euro. Generally, a rise in the price of crude oil has a positive effect on earnings as a result of an increase in revenues from oil and gas production. Conversely, a decline in crude oil prices reduces revenues. The impact of changes in crude oil prices on Downstream and Chemicals operations depends upon the speed at which the prices of finished products adjust to reflect these changes. All of the Group’s activities are, to various degrees, sensitive to fluctuations in the dollar/euro exchange rate. ITEM 12. DESCRIPTION OF SECURITIES OTHER THAN EQUITY SECURITIES Not applicable.American Depositary Receipts fees and charges
The Bank of New York Mellon, as a depositary, collects its fees for delivery and surrender of ADRs directly from investors depositing shares or surrendering ADRs for the purpose of withdrawal or from intermediaries acting for them. The depositary collects fees for making distributions to investors by deducting those fees from the amounts distributed or by selling a portion of distributable property to pay the fees. The depositary may generally refuse to provide fee-attracting services until its fees for those services are paid. | | | | Investors must pay: | | For: | | $5.00 (or less) per 100 ADSs (or portion of 100 ADSs) | | • Issuance of ADRs, including issuances resulting from a distribution of shares or rights or other property, stocks splits or merger • Cancellation of ADRs for the purpose of withdrawal, including if the deposit agreement terminates | | A fee equivalent to the fee that would be payable if securities distributed to the investor had been shares and the shares had been deposited for issuance of ADSs | | • Distribution of securities distributed to holders of deposited securities that are distributed by the depositary to ADS registered holders | | Registration or transfer fees | | • Transfer and registration of shares on the Company’s share register to or from the name of the depositary or its agent when the investor deposits or withdraws shares | | Expenses of the depositary | | • Cable, telex and facsimile transmissions (when expressly provided in the deposit agreement) • Converting foreign currency to U.S. dollars | | Taxes and other governmental charges the depositary or the custodian have to pay on any ADS or share underlying an ADS, for example, stock transfer taxes, stamp duty or withholding taxes | | • As necessary | Any charges incurred by the depositary or its agents for servicing the deposited securities | | • As necessary |
The depositary has agreed to reimburse expenses (“Reimbursed Expenses”) incurred by the Company for the establishment and maintenance of the ADS program that include, but are not limited to, exchange listing fees, annual meeting expenses, standard out-of-pocket maintenance costs for the ADRs (e.g., the expenses of postage and envelopes for mailing annual and interim financial reports, printing and distributing dividend checks, electronic filing of U.S. Federal tax information, mailing required tax forms, stationery, postage, facsimile, and telephone calls), shareholder identification, investor relations activities or programs in North America, accounting fees (such as external audit fees incurred in connection with the Sarbanes-Oxley Act, the preparation of the Company’s Form 20-F and paid to the FASB and the PCAOB), legal fees and other expenses incurred in connection with the preparation of regulatory filings and other documentation related to ongoing SEC, NYSE and U.S. securities law compliance. In certain instances, the depositary has agreed to provide additional payments to the Company based on certain applicable performance indicators relating to the ADR facility. There are limits on the amount of expenses for which the depositary will reimburse the Company, but the amount of reimbursement available to the Company is not necessarily tied to the amount of fees the depositary collects from investors. From March 16, 2011 to March 15, 2012, the Company received from the depositary a payment of $3,327,796.00 with respect to certain Reimbursed Expenses. ITEM 13. DEFAULTS, DIVIDEND ARREARAGES AND DELINQUENCIES None. ITEM 14. MATERIAL MODIFICATIONS TO THE RIGHTS OF SECURITY HOLDERS AND USE OF PROCEEDS None. ITEM 15. CONTROLS AND PROCEDURES Disclosure Controls and Procedures An evaluation was carried out under the supervision and with the participation of the Group’s management, including the Chief Executive Officer and the Chief Financial Officer, of the effectiveness, as of the end of the period covered by this report, of the design and operation of the Group’s disclosure controls and procedures, which are defined as those controls and procedures designed to ensure that information required to be disclosed in reports filed under the U.S. Securities Exchange Act of 1934, as amended, is recorded, summarized and reported within specified time periods. There are inherent limitations to the effectiveness of any system of disclosure controls and procedures, including the possibility of human error and the circumvention or overriding of the controls and procedures. Accordingly, even effective disclosure controls and procedures can provide only reasonable assurance of achieving their control objectives. Based on this evaluation, the Chief Executive Officer and Chief Financial Officer concluded that the design and operation of these disclosure controls and procedures were effective to provide reasonable assurance that information required to be disclosed in the reports that the Company files under the Exchange Act is recorded, processed, summarized and reported, within the time periods specified in the applicable rules and forms, and that it is accumulated and communicated to management, including the Chief Executive Officer and Chief Financial Officer, as appropriate to allow timely decisions regarding required disclosure. Management’s Annual Report on Internal Control Over Financial Reporting The Group’s management is responsible for establishing and maintaining adequate internal control over financial reporting. Because of its inherent limitations, internal control over financial reporting may not prevent or detect misstatements and even when determined to be effective, can only provide reasonable assurance with respect to financial statement preparation and presentation. Also, the effectiveness of an internal control system may change over time. The Group’s management, including the Chief Executive Officer and the Chief Financial Officer, conducted an evaluation of the effectiveness of internal control over financial reporting using the criteria set forth in the Internal Control — Integrated Framework issued by the Committee of Sponsoring Organizations of the Treadway Commission (“COSO”). Based on the results of this evaluation, the Group’s management concluded that its internal control over financial reporting was effective as of December 31, 2008.2011. The effectiveness of internal control over financial reporting as of December 31, 2008,2011, was audited by KPMG S.A. and Ernst & Young Audit, independent registered public accounting firms, as stated in their report beginning on page F-2 of this Annual Report. Changes in Internal Control Over Financial Reporting There were no changes in the Group’s internal control over financial reporting that occurred during the period covered by this report that have materially affected, or that were reasonably likely to materially affect, the Group’s internal control over financial reporting. ITEM 16A. AUDIT COMMITTEE FINANCIAL EXPERT Mr. Antoine Jeancourt-Galignani
Ms. Patricia Barbizet is the Audit Committee financial expert. Mr. Jeancourt-GalignaniMs. Barbizet is an independent member of the Board of Directors in accordance with the NYSE listing standards applicable to TOTAL, as are the other members of the Audit Committee. ITEM 16B. CODE OF ETHICS At its meeting on February 18, 2004, the Board of Directors adopted a code of ethics that applies to its Chief Executive Officer, Chief Financial Officer, Chief Accounting Officer and the financial and accounting officers for its principal activities. A copy of this code of ethics is included as an exhibit to this Annual Report. ITEM 16C. PRINCIPAL ACCOUNTANT FEES AND SERVICES During the fiscal years ended December 31, 20082011 and 2007,2010, fees for services provided by Ernst & Young Audit and KPMG were as follows: | | | | KPMG Year Ended December 31, | | Ernst & Young Audit Year Ended December 31, | | KPMG Year Ended December 31, | | | Ernst & Young Audit Year Ended December 31, | | | (M€) | | 2008 | | 2007 | | 2008 | | 2007 | | 2011 | | | 2010 | | | 2011 | | | 2010 | | Audit Fees | | 15.9 | | 15.7 | | 17.7 | | 17.3 | | | 14.1 | | | | 15.1 | | | | 15.6 | | | | 15.2 | | Audit-Related Fees(a) | | 3.4 | | 2.6 | | 1.0 | | 0.7 | | | 3.8 | | | | 3.6 | | | | 1.9 | | | | 0.7 | | Tax Fees(b) | | 1.2 | | 1.2 | | 1.8 | | 1.7 | | | 1.6 | | | | 1.2 | | | | 1.4 | | | | 1.7 | | All Other Fees(c) | | 0.2 | | 0.2 | | 0.0 | | 0.1 | | | 0.2 | | | | 0.1 | | | | 0.2 | | | | 0.2 | | Total | | 20.7 | | 19.7 | | 20.5 | | 19.8 | | | 19.7 | | | | 20.0 | | | | 19.1 | | | | 17.8 | |
| (a) | Audit-related fees are generally fees billed for services that are closely related to the performance of the audit or review of financial statements. These include due diligence services related to business combinations, attestation services not required by statute or regulation, agreed upon or expanded auditing procedures related to accounting or billing records required to respond to or comply with financial, accounting or regulatory reporting matters, consultations concerning financial accounting and reporting standards, information system reviews, internal control reviews and assistance with internal control reporting requirements. |
| (b) | Tax fees are fees for services related to international and domestic tax compliance, including the preparation of tax returns and claims for refund, tax planning and tax advice, including assistance with tax audits and tax appeals, and tax services regarding statutory, regulatory or administrative developments and expatriate tax assistance and compliance. |
| (c) | All other fees are principally for risk management advisory services. |
Audit Committee Pre-Approval Policy The Audit Committee has adopted an Audit and Non-Audit Services Pre-Approval Policy that sets forth the procedures and the conditions pursuant to which services proposed to be performed by the statutory auditors may be pre-approved.pre-approved and that are not prohibited by regulatory or other professional requirements. This policy provides for both general pre-approval of certain types of services through the use of an annual budget approved by the Audit Committee for these types of services and special pre-approval of services by the Audit Committee on a case-by-case basis. The Audit Committee reviews on an annual basis the services provided by the statutory auditors. During 2008,2011, no audit-related fees, tax fees or other non-audit fees were approved by the Audit Committee pursuant to thede minimisexception to the pre-approval requirement provided by paragraph (c)(7)(i)(C) of Rule 2-01 of Regulation S-X. ITEM 16D. EXEMPTIONS FROM THE LISTING STANDARDS FOR AUDIT COMMITTEES None. ITEM 16E. PURCHASES OF EQUITY SECURITIES BY THE ISSUER AND AFFILIATED PURCHASERS | | | | | | | | | | | Period | | Total Number Of Shares
Purchased | | Average Price
Paid Per
Share (€) | | Total Number Of
Shares Purchased,
As Part Of Publicly
Announced Plans Or
Programs | | | Maximum Number
Of Shares That May
Yet Be Purchased Under The Plans Or
Programs(c) | January 2008 | | 4,100,000 | | 51.39 | | 4,100,000 | (b) | | 84,436,108 | February 2008 | | 1,624,000 | | 50.01 | | 1,624,000 | (b) | | 82,881,230 | March 2008 | | 3,276,000 | | 47,80 | | 3,276,000 | (a) | | 79,659,940 | April 2008 | | 1,250,000 | | 49.12 | | 1,250,000 | (a) | | 79,254,626 | May 2008 | | 1,868,000 | | 54.85 | | 1,868,000 | (a)(b) | | 78,708,334 | June 2008 | | 3,882,000 | | 52.97 | | 3,882,000 | (b) | | 75,379,616 | July 2008 | | 2,120,000 | | 50.65 | | 2,120,000 | (b) | | 103,468,536 | August 2008 | | 2,198,500 | | 48.16 | | 2,198,500 | (b) | | 101,316,940 | September 2008 | | 3,681,500 | | 44.10 | | 3,681,500 | (b) | | 97,660,059 | October 2008 | | 3,600,000 | | 40.32 | | 3,600,000 | (b) | | 94,063,057 | November 2008 | | — | | — | | — | | | 94,074,937 | December 2008 | | — | | — | | — | | | 94,098,712 | January 2009 | | — | | — | | — | | | 94,103,139 | February 2009 | | — | | — | | — | | | 94,121,817 |
| | | | | | | | | | | | | | | | | | Period | | Total Number Of Shares Purchased | | | Average Price Paid Per Share (€) | | | Total Number Of Shares Purchased, As Part Of Publicly Announced Plans Or Programs(a) | | | Maximum Number Of Shares That May Yet Be Purchased Under The Plans Or Programs(b) | | January 2011 | | | — | | | | — | | | | — | | | | 122,526,633 | | February 2011 | | | — | | | | — | | | | — | | | | 122,588,776 | | March 2011 | | | — | | | | — | | | | — | | | | 122,626,999 | | April 2011 | | | — | | | | — | | | | — | | | | 123,539,732 | | May 2011 | | | — | | | | — | | | | — | | | | 123,567,601 | | June 2011 | | | — | | | | — | | | | — | | | | 123,655,175 | | July 2011 | | | — | | | | — | | | | — | | | | 123,891,589 | | August 2011 | | | — | | | | — | | | | — | | | | 123,892,274 | | September 2011 | | | — | | | | — | | | | — | | | | 126,818,649 | | October 2011 | | | — | | | | — | | | | — | | | | 126,819,834 | | November 2011 | | | — | | | | — | | | | — | | | | 126,822,199 | | December 2011 | | | — | | | | — | | | | — | | | | 126,822,558 | | January 2012 | | | — | | | | — | | | | — | | | | 126,824,217 | | February 2012 | | | — | | | | — | | | | — | | | | 126,836,267 | |
| (a) | SinceThe shareholders’ meeting of May 14, 2007:13, 2011, cancelled and replaced the previous resolution from the shareholders’ meeting of May 11, 2007, authorized21, 2010, authorizing the Board of Directors to trade in the company’sCompany’s own shares on the market for a period of 18 months within the framework of the sharestock purchase program. The maximum number of shares that may be purchased by virtue of this authorization or under the previous authorization may not exceed 10% of the total number of shares constituting the share capital, this amount being periodically adjusted to take into account operations modifying the share capital after each shareholders’ meeting. Under no circumstances may the total number of shares the Company holds, either directly or indirectly through its subsidiaries, exceed 10% of the share capital. Under this authorization, 35,615,355 shares have been repurchased from May 14, 2007 to May 16, 2008. |
| (b) | Since May 19, 2008: the shareholders’ meeting of May 16, 2008, cancelled and replaced the previous resolution from the shareholders’ meeting of May 11, 2007, authorizing the Board of Directors to trade in the Company’s own shares on the market for a period of 18 months within the framework of the stock purchase program. The maximum number of shares that may be purchased by virtue of this authorization may not exceed 10% of the total number of shares constituting the share capital, this amount being periodically adjusted to take into account operations modifying the share capital after each shareholders’ meeting. Under no circumstances may the total number of shares the Company holds, either directly or indirectly through its subsidiaries, exceed 10% of the share capital. Under this authorization, 16,422,000 shares have been repurchased from May 19, 2008 to February 28, 2009, including 2,800,000 shares that were purchased to cover restricted share grants to Group employees. |
(c) | Based on 10% of the Company’s share capital, and after deducting the shares held by the Company for cancellation and the shares held by the Company to cover the share purchase option plans for Company employees and restricted share grants for Company employees, as well as after deducting the shares held by the subsidiaries. |
ITEM 16F. CHANGE IN REGISTRANT’S CERTIFYING ACCOUNTANT Not applicable. ITEM 16G. CORPORATE GOVERNANCE Summary of Significant Differences between French Corporate Governance Practices and the NYSE’s Corporate Governance Standards Overview The following paragraphs provide a brief, general summary of significant differences between the corporate governance standards followed by TOTAL under French law and guidelines, and those required by the listing standards of the New York Stock Exchange (the “NYSE”) for U.S. companies that have common stock listed on the NYSE. The principal sources of corporate governance standards in France are the French Commercial Code (Code de Commerce) and, the French Financial and Monetary Code (Code monétaire et financier), both as amended inter alia in August 2003 from time to time, and the regulations and recommendations provided by the French Financial Security ActMarkets Authority (Loi de sécurité financièreAutorité des)marchés financiers, AMF), as well as a number of general recommendations and guidelines on corporate governance, most notably the Corporate Governance Code for Listed Companies published in December 2008 (as amended in April 2010) by the principal French business confederations, theAssociation Française des Entreprises Privées(AFEP) and theMouvement des Entreprises de France(MEDEF) (the “AFEP-MEDEF Code”). The AFEP-MEDEF Code includes, among other things, recommendations relating to the role and operation of the board of directors (creation, composition and evaluation of the board of directors and the audit, compensation and nominating committees) and the independence criteria for board members. TheArticles L. 820-1et seq. of the French Financial Security ActCommercial Code prohibits statutory auditors from providing certain non-audit services and defines certain criteria for the independence of statutory auditors. In France, the independence of statutory auditors is also monitored by an independent body, the High Council for Statutory Auditors (Haut Conseil du commissariat aux comptes). Composition of Board of Directors; Independence The NYSE listing standards provide that the board of directors of a U.S. listed company must consist of a majority of independent directors and that certain committees must consist solely of independent directors. A director qualifies as independent only if the board affirmatively determines that the director has no material relationship with the company, either directly or indirectly. In addition, the listing standards enumerate a number of relationships that preclude independence. French law does not contain any independence requirement for the members of the board of directors of a French company, unless the board establishes an audit committee, as described below, andbelow. Under French law, the functions of board chairman and chief executive officer are frequentlymay be performed by the same person. The AFEP- MEDEF Code recommends, however, that (i) at least half of the members of the board of directors be independent in companies that have a dispersed ownership structure and no controlling shareholder, and (ii) at least a third of the members of the board of directors be independent in companies that have a controlling shareholder. The AFEP-MEDEF Code states that a director is independent when “he or she has no relationship of any nature with the company, its group or the management of either, that may compromise the exercise of his or her freedom of judgment.” The AFEP-MEDEF Code also enumerates specific criteria for determining independence, which are on the whole consistent with the goals of the NYSE’s rules although the specific tests under the two standards may vary on some points. Based on the proposal of TOTAL’s Nominating & Corporate Governance Committee, the Board of Directors of TOTAL considersat its meeting on February 9, 2012, examined the independence of the Company’s directors as of December 31, 2011, and considered that all of the directors of the Company are independent, with the exceptions of Mr. de Margerie, Chairman and Chief Executive Officer of the Company since May 21, 2010, Mr. Desmarest, Chairman of the Board of Directors until May 21, 2010, and Mr. de Margerie, Chief Executive Officer of the Company, Mr. Boeuf, theClément, director representing employee shareholders,shareholders. Representation of women on corporate boards The FrenchJournal Officielpublished law No. 2011-103 dated January 27, 2011, relating to the representation of women on the boards of certain French companies, including French companies listed on Euronext Paris. New rules provide for legally binding quotas to boost the percentage of women on boards of directors of French listed companies, requiring that women represent: (i) at least 20% within two years (following the first ordinary shareholders’ meeting held after January 1, 2014), and Mrs. Lauvergeon, CEO(ii) at least 40% within five years (following the first ordinary shareholders’ meeting held after January 1, 2017). When the board of directors consists of less than nine members, the difference between the number of directors of each gender at the end of the five-year period should not be higher than two. Any appointment of a companydirector made in violation of which Mr. Desmarest sits onthese rules shall be declared null and void and the board.payment of the directors’ compensation shall be suspended until the board composition complies with the law’s requirements (the management report shall also indicate the suspension of the directors’ compensation until the board composition complies with the law’s requirements). However, decisions of a board of directors that fails to comply with these quotas may not be declared null and void. Board committees Overview.The NYSE listing standards require that a U.S. listed company have an audit committee, a nominating/corporate governance committee and a compensation committee. Each of these committees must consist solely of independent directors and must have a written charter that addresses certain matters specified in the listing standards. With the exception of an audit committee, as described below, French law requires neither the establishment of board committees nor the adoption of written charters. The AFEP-MEDEF Code recommends, however, that the board of directors setsets up, in addition to an audit committee, a nominating committee and a compensation committee, indicating that the nominating and compensation committees may form only one committee. The AFEP-MEDEF Code also recommends that at least two-thirds of the audit committee members and a majority of the members of each of the compensation committee and the nominating committee be independent directors. TOTAL has established an Audit Committee, a Nominating & Corporate Governance Committee and a Compensation Committee, and considers all of the members of these committees to be independent with the exception of Mr. Desmarest, who is a member of the Compensation Committee and chairs the Nominating & Corporate Governance Committee. For the membership of each committee, see “Item 6. Corporate Governance”. Each of these committees has a charter that defines the scope of its activity. Audit committee. The NYSE listing standards contain detailed requirements for the audit committees of U.S. listed companies. Some, but not all, of these requirements also apply to non-U.S. listed companies, such as TOTAL. French law requires the board of directors of companies listed in France either to establish an audit committee or to perform itself(Article L. 823-19 of the functions of an audit committee. If the board appoints an audit committee,French Commercial Code), at least one member of which must be an independent director and must be competent in finance or accounting. Pursuant to French law and the AFEP-MEDEF Code, the audit committee is responsible for, among other things, reviewing the financial statements and ensuring the relevance and consistency of accounting methods used in drawing up the consolidated and corporate accounts, examining the company’s risk exposure and material off-balance sheet commitments and the scope of consolidation, reviewingmonitoring the process for the preparation of financial statements,information, monitoring the efficiency of internal control procedures and risk management systems, managing the process of selecting statutory auditors, expressing an opinion on the amount of their fees and monitoring compliance with rules designed to ensure auditor independence, regularly interviewing statutory auditors without the executive management being present and calling upon outside experts if necessary. Although the audit committee requirements under French law and recommendations under the AFEP-MEDEF Code are less detailed than those contained in the NYSE listing standards, the NYSE listing standards, French law and the AFEP-MEDEF Code share the goal of establishing a system for overseeing the company’s accounting that is independent from management and that ensures auditor independence. As a result, they address similar topics, and there is some overlap. For the specific tasks performed by the Audit Committee of TOTAL that exceed those required by French law and those recommended by the AFEP-MEDEF Code, see “Item 6. Corporate Governance — Audit Committee”. One structural difference between the legal status of the audit committee of a U.S. listed company and that of a French listed company concerns the degree of the committee’s involvement in managing the relationship between the company and the auditor. French law requires French companies that publish consolidated financial statements, such as TOTAL, to have two co-auditors. While the NYSE listing standards require that the audit committee of a U.S. listed company have direct responsibility for the appointment, compensation, retention, and oversight of the work of the auditor, French law provides that the election of the co-auditors is the sole responsibility of the shareholders’ meeting. In making its decision, the shareholdersshareholders’ meeting may rely on proposals submitted to it by the board of directors, the decision of the latter being taken upon consultation with the audit committee. The shareholders’ meeting elects the auditors for an audit period of six fiscal years. The auditors may only be dismissed by a court and only on grounds of professional negligence or incapacity to perform their mission. Disclosure The NYSE listing standards require U.S. listed companies to adopt, and post on their websites, a set of corporate governance guidelines. The guidelines must address, among other things: director qualification standards, director responsibilities, director access to management and independent advisers, director compensation, director orientation and continuing education, management succession, and an annual performance evaluation.evaluation of the board. In addition, the chief executive officer of a U.S. listed company must certify to the NYSE annually that he or she is not aware of any violations by the company of the NYSE’s corporate governance listing standards. The certification must be disclosed in the company’s annual report to shareholders. French law requires neither the adoption of such guidelines nor the publicationprovision of such certifications.certification. The AFEP-MEDEF Code recommends, however, that the board of directors of a French listed company perform an annual review of its operation and that a formal evaluation, possibly with the assistance of an outside consultant, be undertaken every three years, which for TOTAL took place in November 2006,early 2012 without the assistance of an outside consultant, and that shareholders be informed each year in the annual report of the evaluations. In addition, the AFEP-MEDEF Code addresses deontology rules that the directors are expected to comply with. Code of business conduct and ethics The NYSE listing standards require each U.S. listed company to adopt, and post on its website, a code of business conduct and ethics for its directors, officers and employees. There is no similar requirement or recommendation under French law. However, under the SEC’s rules and regulations, all companies required to submit periodic reports to the SEC, including TOTAL, must disclose in their annual reports whether they have adopted a code of ethics for their principal executive officer and senior financial officers. In addition, they must file a copy of the code with the SEC, post the text of the code on their website or undertake to provide a copy upon request to any person without charge. There is significant, though not complete, overlap between the code of ethics required by the NYSE listing standards and the code of ethics for senior financial officers required by the SEC’s rules. For a discussion of the code of ethics adopted by TOTAL, see “Item 6. Corporate Governance” and “Item 16B. Code of Ethics”. ITEM 17. FINANCIAL STATEMENTS Not applicable. ITEM 18. FINANCIAL STATEMENTS The following financial statements, together with the report of Ernst & Young Audit and KPMG S.A. thereon, are held as part of this annual report. | | | | | | | | Page | | Report of Independent Registered Public Accounting Firms on the Consolidated Financial Statements | | | F-1 | | Report of Independent Registered Public Accounting Firms on the Internal Control over Financial Reporting | | | F-2 | | Consolidated Statement of Income for the Years Ended December 31, 2008, 20072011, 2010 and 20062009 | | | F-3 | | Consolidated Statement of Comprehensive Income for the Years Ended December 31, 2011, 2010 and 2009 | | | F-4 | | Consolidated Balance Sheet at December 31, 2008, 20072011, 2010 and 20062009 | | F-4 | F-5 | | Consolidated Statement of Cash Flow for the Years Ended December 31, 2008, 20072011, 2010 and 20062009 | | F-5 | F-6 | | Consolidated Statement of Changes in Shareholders’ Equity for the years endedYears Ended December 31, 2008, 20072011, 2010 and 20062009 | | F-6 | F-7 | | Notes to the Consolidated Financial Statements | | F-7 | F-8 | | | | Supplemental Oil and Gas Information (Unaudited) | | | S-1 | |
Schedules have been omitted since they are not required under the applicable instructions or the substance of the required information is shown in the financial statements. ITEM 19. EXHIBITS The following documents are filed as part of this annual report: | | | | | 1.1 | | Bylaws (Statuts) of TOTAL S.A. (as amended through December 31, 2008)2011) | | | 8.8 | | List of Subsidiaries (see Note 35 to the Consolidated Financial Statements included in this Annual Report) | | | 11.11 | | Code of Ethics (incorporated by reference to the Company’s Annual Report on Form 20-F for the year ended December 31, 2005) | | | 12.1 | | Certification of Chairman and Chief Executive Officer | | | 12.2 | | Certification of Chief Financial Officer | | | 13.1 | | Certification of Chairman and Chief Executive Officer | | | 13.2 | | Certification of Chief Financial Officer | | | 15 | | Consent of ERNST & YOUNG AUDIT and of KPMG S.A. |
SIGNATURE The registrant hereby certifies that it meets all of the requirements for filing on Form 20-F and that it has duly caused and authorized the undersigned to sign this annual report on its behalf. | | | TOTAL S.A. | | | By: | | /s/ CHRISTOPHEDE MARGERIE | | | Name: Christophe de Margerie | | | Title: Chairman and Chief Executive Officer |
Date: April 3, 2009March 26, 2012 REPORT OF INDEPENDENT REGISTERED PUBLIC ACCOUNTING FIRMS ON THE CONSOLIDATED FINANCIAL STATEMENTS Year ended December 31, 20082011 The Board of Directors and Shareholders TOTAL S.A.
We have audited the accompanying consolidated balance sheets of TOTAL S.A. and subsidiaries (the “Company”) as of December 31, 2008, 20072011, 2010 and 2006,2009, and the related consolidated statements of income, comprehensive income, cash flows and changes in shareholders’ equity for each of the three years in the period ended December 31, 2008.2011. These consolidated financial statements are the responsibility of the Company’s management. Our responsibility is to express an opinion on these consolidated financial statements based on our audits. We conducted our audits in accordance with the standards of the Public Company Accounting Oversight Board (United States). Those standards require that we plan and perform the audit to obtain reasonable assurance about whether the financial statements are free of material misstatement. An audit includes examining, on a test basis, evidence supporting the amounts and disclosures in the financial statements. An audit also includes assessing the accounting principles used and significant estimates made by management, as well as evaluating the overall financial statement presentation. We believe that our audits provide a reasonable basis for our opinion. In our opinion, the consolidated financial statements referred to above present fairly, in all material respects, the consolidated financial position of the Company atas of December 31, 2008, 20072011, 2010 and 2006,2009, and the consolidated results of its operations and its consolidated cash flows for each of the three years in the period ended December 31, 2008,2011, in conformity with International Financial Reporting Standards as adopted by the European Union and in conformity with International Financial Reporting Standards as issued by the International Accounting Standards Board. We also have audited, in accordance with the standards of the Public Company Accounting Oversight Board (United States), the Company’s internal control over financial reporting as of December 31, 2008,2011, based on criteria established in Internal Control-Integrated Framework issued by the Committee of Sponsoring Organizations of the Treadway Commission (the COSO criteria) and our report dated April 2, 2009March 7, 2012 expressed an unqualified opinion on the effectiveness of the Company’s internal control over financial reporting. Paris-LaParis La Défense, France
April 2, 2009March 7, 2012
| | | | | | | KPMG AUDITAudit A division of KPMG S.A. | | ERNST & YOUNG Audit | A division of KPMG S.A. | | | /s/ JAY NIRSIMLOO | | /s/ PS/ GABRIELASCAL GMALET ACIOCE | | /s/ LAURENT VITSE | | Jay Nirsimloo | | Pascal Macioce | | Laurent Vitse | | Partner | | /S/ PHILIPPE DIU | /S/ RENÉ AMIRKHANIAN Partner | | Gabriel Galet | | Philippe Diu | René Amirkhanian | | | | Partner |
REPORT OF INDEPENDENT REGISTERED PUBLIC ACCOUNTING FIRMS ON THE INTERNAL CONTROL OVER FINANCIAL REPORTING Year ended December 31, 20082011 The Board of Directors and Shareholders TOTAL S.A.
We have audited TOTAL S.A. and subsidiaries’ (“the Company”) internal control over financial reporting as of December 31, 2008,2011, based on criteria established in Internal Control-IntegratedControl - Integrated Framework issued by the Committee of Sponsoring Organizations of the Treadway Commission (the COSO criteria). The Company’s management is responsible for maintaining effective internal control over financial reporting, and for its assessment of the effectiveness of internal control over financial reporting included in the accompanying management’s annual report on internal control over financial reporting. Our responsibility is to express an opinion on the Company’s internal control over financial reporting based on our audit. We conducted our audit in accordance with the standards of the Public Company Accounting Oversight Board (United States). Those standards require that we plan and perform the audit to obtain reasonable assurance about whether effective internal control over financial reporting was maintained in all material respects. Our audit included obtaining an understanding of internal control over financial reporting, assessing the risk that a material weakness exists, and testing and evaluating the design and operating effectiveness of internal control based on the assessed risk. Our audit also included performing such other procedures as we considered necessary in the circumstances. We believe that our audit provides a reasonable basis for our opinion. A company’s internal control over financial reporting is a process designed to provide reasonable assurance regarding the reliability of financial reporting and the preparation of financial statements for external purposes in accordance with generally accepted accounting principles. A company’s internal control over financial reporting includes those policies and procedures that (1) pertain to the maintenance of records that, in reasonable detail, accurately and fairly reflect the transactions and dispositions of the assets of the company; (2) provide reasonable assurance that transactions are recorded as necessary to permit preparation of financial statements in accordance with generally accepted accounting principles, and that receipts and expenditures of the company are being made only in accordance with authorizations of management and directors of the company; and (3) provide reasonable assurance regarding prevention or timely detection of unauthorized acquisition, use or disposition of the company’s assets that could have a material effect on the financial statements. Because of its inherent limitations, internal control over financial reporting may not prevent or detect misstatements. Also, projections of any evaluation of effectiveness to future periods are subject to the risk that controls may become inadequate because of changes in conditions, or that the degree of compliance with the policies or procedures may deteriorate. In our opinion, the Company maintained, in all material respects, effective internal control over financial reporting as of December 31, 2008,2011, based on the COSO criteria. We also have audited, in accordance with the standards of the Public Company Accounting Oversight Board (United States), the consolidated balance sheets of the Company as of December 31, 2008, 20072011, 2010 and 20062009 and the related consolidated statements of income, comprehensive income, cash flows and changes in shareholders’ equity for each of the three years in the period ended December 31, 2008,2011, and our report dated April 2, 2009March 7, 2012 expressed an unqualified opinion on those consolidated financial statements. Paris-La-DéParis La Défense, France
April 2, 2009March 7, 2012
| | | | | | | KPMG AUDITAudit A division of KPMG S.A. | | ERNST & YOUNG Audit | A division of KPMG S.A. | | | /s/ JAY NIRSIMLOO | | /s/ PS/ GABRIELASCAL GMALET ACIOCE | | /s/ LAURENT VITSE | | Jay Nirsimloo | | Pascal Macioce | | Laurent Vitse | | Partner | | /S/ PHILIPPE DIU | /S/ RENÉ AMIRKHANIAN Partner | | Gabriel Galet | | Philippe Diu | René Amirkhanian | | | | Partner |
CONSOLIDATED STATEMENT OF INCOME TOTAL | For the year ended December 31,(M€)(a) | | | 2008 | | | 2007 | | | 2006 | | | | | 2011 | | 2010 | | 2009 | | Sales | | (Notes 4 & 5) | | 179,976 | | | 158,752 | | | 153,802 | | | | (Notes 4 & 5 | ) | | | 184,693 | | | | 159,269 | | | | 131,327 | | Excise taxes | | | | (19,645 | ) | | (21,928 | ) | | (21,113 | ) | | | | | (18,143 | ) | | | (18,793 | ) | | | (19,174 | ) | Revenues from sales | | | | 160,331 | | | 136,824 | | | 132,689 | | | | | | 166,550 | | | | 140,476 | | | | 112,153 | | | Purchases net of inventory variation | | (Note 6) | | (111,024 | ) | | (87,807 | ) | | (83,334 | ) | | | (Note 6 | ) | | | (113,892 | ) | | | (93,171 | ) | | | (71,058 | ) | Other operating expenses | | (Note 6) | | (19,101 | ) | | (17,414 | ) | | (19,536 | ) | | | (Note 6 | ) | | | (19,843 | ) | | | (19,135 | ) | | | (18,591 | ) | Exploration costs | | (Note 6) | | (764 | ) | | (877 | ) | | (634 | ) | | | (Note 6 | ) | | | (1,019 | ) | | | (864 | ) | | | (698 | ) | Depreciation, depletion and amortization of tangible assets and mineral interests | | | | (5,755 | ) | | (5,425 | ) | | (5,055 | ) | | | | | (7,506 | ) | | | (8,421 | ) | | | (6,682 | ) | Other income | | (Note 7) | | 369 | | | 674 | | | 789 | | | | (Note 7 | ) | | | 1,946 | | | | 1,396 | | | | 314 | | Other expense | | (Note 7) | | (554 | ) | | (470 | ) | | (703 | ) | | | (Note 7 | ) | | | (1,247 | ) | | | (900 | ) | | | (600 | ) | | Financial interest on debt | | | | (1,000 | ) | | (1,783 | ) | | (1,731 | ) | | | | | (713 | ) | | | (465 | ) | | | (530 | ) | Financial income from marketable securities & cash equivalents | | | | 473 | | | 1,244 | | | 1,367 | | | | | | 273 | | | | 131 | | | | 132 | | Cost of net debt | | (Note 29) | | (527 | ) | | (539 | ) | | (364 | ) | | | (Note 29 | ) | | | (440 | ) | | | (334 | ) | | | (398 | ) | Other financial income | | (Note 8) | | 728 | | | 643 | | | 592 | | | | (Note 8 | ) | | | 609 | | | | 442 | | | | 643 | | Other financial expense | | (Note 8) | | (325 | ) | | (274 | ) | | (277 | ) | | | (Note 8 | ) | | | (429 | ) | | | (407 | ) | | | (345 | ) | | Equity in income (loss) of affiliates | | (Note 12) | | 1,721 | | | 1,775 | | | 1,693 | | | | (Note 12 | ) | | | 1,925 | | | | 1,953 | | | | 1,642 | | | Income taxes | | (Note 9) | | (14,146 | ) | | (13,575 | ) | | (13,720 | ) | | | (Note 9 | ) | | | (14,073 | ) | | | (10,228 | ) | | | (7,751 | ) | Net income from continuing operations (Group without Arkema) | | | | 10,953 | | | 13,535 | | | 12,140 | | | Net income from discontinued operations (Arkema) | | (Note 34) | | — | | | — | | | (5 | ) | | Consolidated net income | | | 10,953 | | | 13,535 | | | 12,135 | | | | | 12,581 | | | | 10,807 | | | | 8,629 | | Group share | | | | 10,590 | | | 13,181 | | | 11,768 | | | | | | 12,276 | | | | 10,571 | | | | 8,447 | | Minority interests | | | 363 | | | 354 | | | 367 | | | Earnings per share (€)(b) | | | | 4.74 | | | 5.84 | | | 5.13 | | | Fully-diluted earnings per share (€)(b) | | | 4.71 | | | 5.80 | | | 5.09 | | | Non-controlling interests | | | | | 305 | | | | 236 | | | | 182 | | Earnings per share (€) | | | | | | 5.46 | | | | 4.73 | | | | 3.79 | | Fully-diluted earnings per share (€) | | | | | 5.44 | | | | 4.71 | | | | 3.78 | |
| (a) | Except for per share amounts. |
(b) | The earnings per share from continuing and discontinued operations are disclosed in Note 34 to the Consolidated Financial Statements. |
CONSOLIDATED STATEMENT OF COMPREHENSIVE INCOME TOTAL | | | | | | | | | | | | | | For the year ended December 31, (M€) | | 2011 | | | 2010 | | | 2009 | | Consolidated net income | | | 12,581 | | | | 10,807 | | | | 8,629 | | Other comprehensive income | | | | | | | | | | | | | Currency translation adjustment | | | 1,498 | | | | 2,231 | | | | (244 | ) | Available for sale financial assets | | | 337 | | | | (100 | ) | | | 38 | | Cash flow hedge | | | (84 | ) | | | (80 | ) | | | 128 | | Share of other comprehensive income of associates, net amount | | | (15 | ) | | | 302 | | | | 234 | | Other | | | (2 | ) | | | (7 | ) | | | (5 | ) | Tax effect | | | (55 | ) | | | 28 | | | | (38 | ) | Total other comprehensive income (net amount)(note 17) | | | 1,679 | | | | 2,374 | | | | 113 | | Comprehensive income | | | 14,260 | | | | 13,181 | | | | 8,742 | | — Group share | | | 13,911 | | | | 12,936 | | | | 8,500 | | — Non-controlling interests | | | 349 | | | | 245 | | | | 242 | |
CONSOLIDATED BALANCE SHEET TOTAL | | As of December 31,(M€) | | | 2008 | | 2007 | | 2006 | | | | | 2011 | | 2010 | | 2009 | | ASSETS | | | | | | | | | | | | | | | | | Non-current assets | | | | | | | | | | | | | | | | | Intangible assets, net | | (Notes 5 & 10) | | 5,341 | | | 4,650 | | | 4,705 | | | | (Notes 5 & 10 | ) | | | 12,413 | | | | 8,917 | | | | 7,514 | | Property, plant and equipment, net | | (Notes 5 & 11) | | 46,142 | | | 41,467 | | | 40,576 | | | | (Notes 5 & 11 | ) | | | 64,457 | | | | 54,964 | | | | 51,590 | | Equity affiliates: investments and loans | | (Note 12) | | 14,668 | | | 15,280 | | | 13,331 | | | | (Note 12 | ) | | | 12,995 | | | | 11,516 | | | | 13,624 | | Other investments | | (Note 13) | | 1,165 | | | 1,291 | | | 1,250 | | | | (Note 13 | ) | | | 3,674 | | | | 4,590 | | | | 1,162 | | Hedging instruments of non-current financial debt | | (Note 20) | | 892 | | | 460 | | | 486 | | | | (Note 20 | ) | | | 1,976 | | | | 1,870 | | | | 1,025 | | Other non-current assets | | (Note 14) | | 3,044 | | | 2,155 | | | 2,088 | | | | (Note 14 | ) | | | 4,871 | | | | 3,655 | | | | 3,081 | | Total non-current assets | Total non-current assets | | 71,252 | | | 65,303 | | | 62,436 | | | | | | 100,386 | | | | 85,512 | | | | 77,996 | | Current assets | | | | | | | | | | | | | | | | | Inventories, net | | (Note 15) | | 9,621 | | | 13,851 | | | 11,746 | | | | (Note 15 | ) | | | 18,122 | | | | 15,600 | | | | 13,867 | | Accounts receivable, net | | (Note 16) | | 15,287 | | | 19,129 | | | 17,393 | | | | (Note 16 | ) | | | 20,049 | | | | 18,159 | | | | 15,719 | | Other current assets | | (Note 16) | | 9,642 | | | 8,006 | | | 7,247 | | | | (Note 16 | ) | | | 10,767 | | | | 7,483 | | | | 8,198 | | Current financial assets | | (Note 20) | | 187 | | | 1,264 | | | 3,908 | | | | (Note 20 | ) | | | 700 | | | | 1,205 | | | | 311 | | Cash and cash equivalents | | (Note 27) | | 12,321 | | | 5,988 | | | 2,493 | | | | (Note 27 | ) | | | 14,025 | | | | 14,489 | | | | 11,662 | | Total current assets | | | 47,058 | | | 48,238 | | | 42,787 | | | | | 63,663 | | | | 56,936 | | | | 49,757 | | Assets classified as held for sale | | | | (Note 34 | ) | | | — | | | | 1,270 | | | | — | | Total assets | | | 118,310 | | | 113,541 | | | 105,223 | | | | | 164,049 | | | | 143,718 | | | | 127,753 | | LIABILITIES & SHAREHOLDERS’ EQUITY | | | | | | | | | | | | | | | | | Shareholders’ equity | | | | | | | | | | | | | | | | | Common shares | | | | 5,930 | | | 5,989 | | | 6,064 | | | | | | 5,909 | | | | 5,874 | | | | 5,871 | | Paid-in surplus and retained earnings | | | | 52,947 | | | 48,797 | | | 41,460 | | | | | | 66,506 | | | | 60,538 | | | | 55,372 | | Currency translation adjustment | | | | (4,876 | ) | | (4,396 | ) | | (1,383 | ) | | | | | (988 | ) | | | (2,495 | ) | | | (5,069 | ) | Treasury shares | | | (5,009 | ) | | (5,532 | ) | | (5,820 | ) | | | | (3,390 | ) | | | (3,503 | ) | | | (3,622 | ) | Total shareholders’ equity - Group share | | (Note 17) | | 48,992 | | | 44,858 | | | 40,321 | | | Minority interests | | | 958 | | | 842 | | | 827 | | | Total shareholders’ equity — Group share | | | | (Note 17 | ) | | | 68,037 | | | | 60,414 | | | | 52,552 | | Non-controlling interests | | | | | 1,352 | | | | 857 | | | | 987 | | Total shareholders’ equity | | | 49,950 | | | 45,700 | | | 41,148 | | | | | | 69,389 | | | | 61,271 | | | | 53,539 | | Non-current liabilities | | | | | | | | | | | | | | | | | Deferred income taxes | | (Note 9) | | 7,973 | | | 7,933 | | | 7,139 | | | | (Note 9 | ) | | | 12,260 | | | | 9,947 | | | | 8,948 | | Employee benefits | | (Note 18) | | 2,011 | | | 2,527 | | | 2,773 | | | | (Note 18 | ) | | | 2,232 | | | | 2,171 | | | | 2,040 | | Provisions and other non-current liabilities | | (Note 19) | | 7,858 | | | 6,843 | | | 6,467 | | | | (Note 19 | ) | | | 10,909 | | | | 9,098 | | | | 9,381 | | Non-current financial debt | | | | (Note 20 | ) | | | 22,557 | | | | 20,783 | | | | 19,437 | | Total non-current liabilities | | | 17,842 | | | 17,303 | | | 16,379 | | | | | 47,958 | | | | 41,999 | | | | 39,806 | | Non-current financial debt | | (Note 20) | | 16,191 | | | 14,876 | | | 14,174 | | | Current liabilities | | | | | | | | | | | | | | | | | Accounts payable | | | | 14,815 | | | 18,183 | | | 15,080 | | | | | | 22,086 | | | | 18,450 | | | | 15,383 | | Other creditors and accrued liabilities | | (Note 21) | | 11,632 | | | 12,806 | | | 12,509 | | | | (Note 21 | ) | | | 14,774 | | | | 11,989 | | | | 11,908 | | Current borrowings | | (Note 20) | | 7,722 | | | 4,613 | | | 5,858 | | | | (Note 20 | ) | | | 9,675 | | | | 9,653 | | | | 6,994 | | Other current financial liabilities | | (Note 20) | | 158 | | | 60 | | | 75 | | | | (Note 20 | ) | | | 167 | | | | 159 | | | | 123 | | Total current liabilities | | | 34,327 | | | 35,662 | | | 33,522 | | | | | 46,702 | | | | 40,251 | | | | 34,408 | | Liabilities directly associated with the assets classified as held for sale | | | | (Note 34 | ) | | | — | | | | 197 | | | | — | | Total liabilities and shareholders’ equity | | | 118,310 | | | 113,541 | | | 105,223 | | | | | 164,049 | | | | 143,718 | | | | 127,753 | |
CONSOLIDATED STATEMENT OF CASH FLOW TOTAL (Note 27) | | | | | | | | | | (Note 27) | | | | | | | | | | For the year ended December 31,(M€) | | 2008 | | | 2007 | | | 2006 | | CASH FLOW FROM OPERATING ACTIVITIES | | | | | | | | | | Consolidated net income | | 10,953 | | | 13,535 | | | 12,135 | | Depreciation, depletion and amortization | | 6,197 | | | 5,946 | | | 5,555 | | Non-current liabilities, valuation allowances, and deferred taxes | | (150 | ) | | 826 | | | 601 | | Impact of coverage of pension benefit plans | | (505 | ) | | — | | | (179 | ) | (Gains) losses on disposals of assets | | (257 | ) | | (639 | ) | | (789 | ) | Undistributed affiliates’ equity earnings | | (311 | ) | | (821 | ) | | (952 | ) | (Increase) decrease in working capital | | 2,571 | | | (1,476 | ) | | (441 | ) | Other changes, net | | 171 | | | 315 | | | 131 | | Cash flow from operating activities | | 18,669 | | | 17,686 | | | 16,061 | | CASH FLOW USED IN INVESTING ACTIVITIES | | | | | | | | | | Intangible assets and property, plant and equipment additions | | (11,861 | ) | | (10,549 | ) | | (9,910 | ) | Acquisitions of subsidiaries, net of cash acquired | | (559 | ) | | (20 | ) | | (127 | ) | Investments in equity affiliates and other securities | | (416 | ) | | (351 | ) | | (402 | ) | Increase in non-current loans | | (804 | ) | | (802 | ) | | (1,413 | ) | Total expenditures | | (13,640 | ) | | (11,722 | ) | | (11,852 | ) | Proceeds from disposal of intangible assets and property, plant and equipment | | 130 | | | 569 | | | 413 | | Proceeds from disposal of subsidiaries, net of cash sold | | 88 | | | 5 | | | 18 | | Proceeds from disposal of non-current investments | | 1,233 | | | 527 | | | 699 | | Repayment of non-current loans | | 1,134 | | | 455 | | | 1,148 | | Total divestments | | 2,585 | | | 1,556 | | | 2,278 | | Cash flow used in investing activities | | (11,055 | ) | | (10,166 | ) | | (9,574 | ) | CASH FLOW USED IN FINANCING ACTIVITIES | | | | | | | | | | Issuance (repayment) of shares: | | | | | | | | | | - Parent company shareholders | | 262 | | | 89 | | | 511 | | - Treasury shares | | (1,189 | ) | | (1,526 | ) | | (3,830 | ) | - Minority shareholders | | (4 | ) | | 2 | | | 17 | | Dividends paid: | | | | | | | | | | - Parent company shareholders | | (4,945 | ) | | (4,510 | ) | | (3,999 | ) | - Minority shareholders | | (213 | ) | | (228 | ) | | (326 | ) | Net issuance (repayment) of non-current debt | | 3,009 | | | 3,220 | | | 3,722 | | Increase (decrease) in current borrowings | | 1,437 | | | (2,654 | ) | | (6 | ) | Increase (decrease) in current financial assets and liabilities | | 850 | | | 2,265 | | | (3,496 | ) | Cash flow used in financing activities | | (793 | ) | | (3,342 | ) | | (7,407 | ) | Net increase (decrease) in cash and cash equivalents | | 6,821 | | | 4,178 | | | (920 | ) | Effect of exchange rates | | (488 | ) | | (683 | ) | | (905 | ) | Cash and cash equivalents at the beginning of the period | | 5,988 | | | 2,493 | | | 4,318 | | Cash and cash equivalents at the end of the period | | 12,321 | | | 5,988 | | | 2,493 | |
| | | | | | | | | | | | | | For the year ended December 31, (M€) | | 2011 | | | 2010 | | | 2009 | | CASH FLOW FROM OPERATING ACTIVITIES | | | | | | | | | | | | | Consolidated net income | | | 12,581 | | | | 10,807 | | | | 8,629 | | Depreciation, depletion and amortization | | | 8,628 | | | | 9,117 | | | | 7,107 | | Non-current liabilities, valuation allowances, and deferred taxes | | | 1,665 | | | | 527 | | | | 441 | | Impact of coverage of pension benefit plans | | | — | | | | (60 | ) | | | — | | (Gains) losses on disposals of assets | | | (1,590 | ) | | | (1,046 | ) | | | (200 | ) | Undistributed affiliates’ equity earnings | | | (107 | ) | | | (470 | ) | | | (378 | ) | (Increase) decrease in working capital | | | (1,739 | ) | | | (496 | ) | | | (3,316 | ) | Other changes, net | | | 98 | | | | 114 | | | | 77 | | Cash flow from operating activities | | | 19,536 | | | | 18,493 | | | | 12,360 | | CASH FLOW USED IN INVESTING ACTIVITIES | | | | | | | | | | | | | Intangible assets and property, plant and equipment additions | | | (17,950 | ) | | | (13,812 | ) | | | (11,849 | ) | Acquisitions of subsidiaries, net of cash acquired | | | (854 | ) | | | (862 | ) | | | (160 | ) | Investments in equity affiliates and other securities | | | (4,525 | ) | | | (654 | ) | | | (400 | ) | Increase in non-current loans | | | (1,212 | ) | | | (945 | ) | | | (940 | ) | Total expenditures | | | (24,541 | ) | | | (16,273 | ) | | | (13,349 | ) | Proceeds from disposals of intangible assets and property, plant and equipment | | | 1,439 | | | | 1,534 | | | | 138 | | Proceeds from disposals of subsidiaries, net of cash sold | | | 575 | | | | 310 | | | | — | | Proceeds from disposals of non-current investments | | | 5,691 | | | | 1,608 | | | | 2,525 | | Repayment of non-current loans | | | 873 | | | | 864 | | | | 418 | | Total divestments | | | 8,578 | | | | 4,316 | | | | 3,081 | | Cash flow used in investing activities | | | (15,963 | ) | | | (11,957 | ) | | | (10,268 | ) | CASH FLOW USED IN FINANCING ACTIVITIES | | | | | | | | | | | | | Issuance (repayment) of shares: | | | | | | | | | | | | | — Parent company shareholders | | | 481 | | | | 41 | | | | 41 | | — Treasury shares | | | — | | | | 49 | | | | 22 | | Dividends paid: | | | | | | | | | | | | | — Parent company shareholders | | | (5,140 | ) | | | (5,098 | ) | | | (5,086 | ) | — Non-controlling interests | | | (172 | ) | | | (152 | ) | | | (189 | ) | Other transactions with non-controlling interests | | | (573 | ) | | | (429 | ) | | | — | | Net issuance (repayment) of non-current debt | | | 4,069 | | | | 3,789 | | | | 5,522 | | Increase (decrease) in current borrowings | | | (3,870 | ) | | | (731 | ) | | | (3,124 | ) | Increase (decrease) in current financial assets and liabilities | | | 896 | | | | (817 | ) | | | (54 | ) | Cash flow used in financing activities | | | (4,309 | ) | | | (3,348 | ) | | | (2,868 | ) | Net increase (decrease) in cash and cash equivalents | | | (736 | ) | | | 3,188 | | | | (776 | ) | Effect of exchange rates | | | 272 | | | | (361 | ) | | | 117 | | Cash and cash equivalents at the beginning of the period | | | 14,489 | | | | 11,662 | | | | 12,321 | | Cash and cash equivalents at the end of the period | | | 14,025 | | | | 14,489 | | | | 11,662 | |
CONSOLIDATED STATEMENT OF CHANGES IN SHAREHOLDERS’ EQUITY TOTAL | | | | | | | | | | | | | | | | | | | | | | | | | | | | | | | Common shares issued | | | Paid in
surplus
and
retained
earnings | | | Currency
translation
adjustment | | | Treasury shares | | | Shareholders’
equity
Group share | | | Minority
interests | | | Total
shareholders’
equity | | | (M€) | | Number | | | Amount | | | | | Number | | | Amount | | | | | As of January 1, 2006 | | 615,116,296 | | | 6,151 | | | 37,504 | | | 1,421 | | | (34,249,332 | ) | | (4,431 | ) | | 40,645 | | | 838 | | | 41,483 | | Net income 2006 | | — | | | — | | | 11,768 | | | — | | | — | | | — | | | 11,768 | | | 367 | | | 12,135 | | Items recognized directly in equity (Note 17) | | — | | | — | | | (37 | ) | | (2,595 | ) | | — | | | — | | | (2,632 | ) | | (44 | ) | | (2,676 | ) | Total excluding transactions with shareholders | | — | | | — | | | 11,731 | | | (2,595 | ) | | — | | | — | | | 9,136 | | | 323 | | | 9,459 | | Four-for-one stock split | | 1,845,348,888 | | | — | | | — | | | — | | | (102,747,996 | ) | | — | | | — | | | — | | | — | | Spin-off of Arkema | | — | | | — | | | (2,061 | ) | | (209 | ) | | — | | | 16 | | | (2,254 | ) | | (8 | ) | | (2,262 | ) | Dividend | | — | | | — | | | (3,999 | ) | | — | | | — | | | — | | | (3,999 | ) | | (326 | ) | | (4,325 | ) | Issuance of common shares (Note 17) | | 12,322,769 | | | 30 | | | 469 | | | — | | | — | | | — | | | 499 | | | — | | | 499 | | Purchase of treasury shares | | — | | | — | | | — | | | — | | | (78,220,684 | ) | | (4,095 | ) | | (4,095 | ) | | — | | | (4,095 | ) | Sale of treasury shares | | — | | | — | | | — | | | — | | | 6,997,305 | | | 232 | | | 232 | | | — | | | 232 | | Share-based payments (Note 25) | | — | | | — | | | 157 | | | — | | | — | | | — | | | 157 | | | — | | | 157 | | Transactions with shareholders | | 1,857,671,657 | | | 30 | | | (5,434 | ) | | (209 | ) | | (173,971,375 | ) | | (3,847 | ) | | (9,460 | ) | | (334 | ) | | (9,794 | ) | Share cancellation (Note 17) | | (47,020,000 | ) | | (117 | ) | | (2,341 | ) | | — | | | 47,020,000 | | | 2,458 | | | — | | | — | | | — | | As of December 31, 2006 | | 2,425,767,953 | | | 6,064 | | | 41,460 | | | (1,383 | ) | | (161,200,707 | ) | | (5,820 | ) | | 40,321 | | | 827 | | | 41,148 | | Net income 2007 | | — | | | — | | | 13,181 | | | — | | | — | | | — | | | 13,181 | | | 354 | | | 13,535 | | Items recognized directly in equity (Note 17) | | — | | | — | | | 117 | | | (3,013 | ) | | — | | | — | | | (2,896 | ) | | (111 | ) | | (3,007 | ) | Total excluding transactions with shareholders | | — | | | — | | | 13,298 | | | (3,013 | ) | | — | | | — | | | 10,285 | | | 243 | | | 10,528 | | Dividend | | — | | | — | | | (4,510 | ) | | — | | | — | | | — | | | (4,510 | ) | | (228 | ) | | (4,738 | ) | Issuance of common shares (Note 17) | | 2,769,144 | | | 7 | | | 82 | | | — | | | — | | | — | | | 89 | | | — | | | 89 | | Purchase of treasury shares | | — | | | — | | | — | | | — | | | (32,387,355 | ) | | (1,787 | ) | | (1,787 | ) | | — | | | (1,787 | ) | Sale of treasury shares | | — | | | — | | | (77 | ) | | — | | | 9,161,830 | | | 341 | | | 264 | | | — | | | 264 | | Share-based payments (Note 25) | | — | | | — | | | 196 | | | — | | | — | | | — | | | 196 | | | — | | | 196 | | Transactions with shareholders | | 2,769,144 | | | 7 | | | (4,309 | ) | | — | | | (23,225,525 | ) | | (1,446 | ) | | (5,748 | ) | | (228 | ) | | (5,976 | ) | Share cancellation (Note 17) | | (33,005,000 | ) | | (82 | ) | | (1,652 | ) | | — | | | 33,005,000 | | | 1,734 | | | — | | | — | | | — | | As of December 31, 2007 | | 2,395,532,097 | | | 5,989 | | | 48,797 | | | (4,396 | ) | | (151,421,232 | ) | | (5,532 | ) | | 44,858 | | | 842 | | | 45,700 | | Net income 2008 | | — | | | — | | | 10,590 | | | — | | | — | | | — | | | 10,590 | | | 363 | | | 10,953 | | Items recognized directly in equity (Note 17) | | — | | | — | | | (258 | ) | | (480 | ) | | — | | | — | | | (738 | ) | | (34 | ) | | (772 | ) | Total excluding transactions with shareholders | | — | | | — | | | 10,332 | | | (480 | ) | | — | | | — | | | 9,852 | | | 329 | | | 10,181 | | Dividend | | — | | | — | | | (4,945 | ) | | — | | | — | | | — | | | (4,945 | ) | | (213 | ) | | (5,158 | ) | Issuance of common shares (Note 17) | | 6,275,977 | | | 16 | | | 246 | | | — | | | — | | | — | | | 262 | | | — | | | 262 | | Purchase of treasury shares | | — | | | — | | | — | | | — | | | (27,600,000 | ) | | (1,339 | ) | | (1,339 | ) | | — | | | (1,339 | ) | Sale of treasury shares | | — | | | — | | | (71 | ) | | — | | | 5,939,137 | | | 221 | | | 150 | | | — | | | 150 | | Share-based payments (Note 25) | | — | | | — | | | 154 | | | — | | | — | | | — | | | 154 | | | — | | | 154 | | Transactions with shareholders | | 6,275,977 | | | 16 | | | (4,616 | ) | | — | | | (21,660,863 | ) | | (1,118 | ) | | (5,718 | ) | | (213 | ) | | (5,931 | ) | Share cancellation (Note 17) | | (30,000,000 | ) | | (75 | ) | | (1,566 | ) | | — | | | 30,000,000 | | | 1,641 | | | — | | | — | | | — | | As of December 31, 2008 | | 2,371,808,074 | | | 5,930 | | | 52,947 | | | (4,876 | ) | | (143,082,095 | ) | | (5,009 | ) | | 48,992 | | | 958 | | | 49,950 | |
| | | | | | | | | | | | | | | | | | | | | | | | | | | | | | | | | | | | | | | | Common shares
issued | | | Paid-in surplus
and retained
earnings | | | Currency
translation
adjustment | | | Treasury shares | | | Shareholders’
equity - Group
share | | | Non-controlling
interests | | | Total
shareholders’
equity | | | (M€) | | Number | | | Amount | | | | | Number | | | Amount | | | | | As of Janurary 1, 2009 | | | 2,371,808,074 | | | | 5,930 | | | | 52,947 | | | | (4,876 | ) | | | (143,082,095 | ) | | | (5,009 | ) | | | 48,992 | | | | 958 | | | | 49,950 | | Net income 2009 | | | — | | | | — | | | | 8,447 | | | | — | | | | — | | | | — | | | | 8,447 | | | | 182 | | | | 8,629 | | Other comprehensive income (Note 17) | | | — | | | | — | | | | 246 | | | | (193 | ) | | | — | | | | — | | | | 53 | | | | 60 | | | | 113 | | Comprehensive income | | | — | | | | — | | | | 8,693 | | | | (193 | ) | | | — | | | | — | | | | 8,500 | | | | 242 | | | | 8,742 | | Dividend | | | — | | | | — | | | | (5,086 | ) | | | — | | | | — | | | | — | | | | (5,086 | ) | | | (189 | ) | | | (5,275 | ) | Issuance of common shares (Note 17) | | | 1,414,810 | | | | 3 | | | | 38 | | | | — | | | | — | | | | — | | | | 41 | | | | — | | | | 41 | | Purchase of treasury shares | | | — | | | | — | | | | — | | | | — | | | | — | | | | — | | | | — | | | | — | | | | — | | Sale of treasury shares(a) | | | — | | | | — | | | | (143 | ) | | | — | | | | 2,874,905 | | | | 165 | | | | 22 | | | | — | | | | 22 | | Share-based payments (Note 25) | | | — | | | | — | | | | 106 | | | | — | | | | — | | | | — | | | | 106 | | | | — | | | | 106 | | Share cancellation (Note 17) | | | (24,800,000 | ) | | | (62 | ) | | | (1,160 | ) | | | — | | | | 24,800,000 | | | | 1,222 | | | | — | | | | — | | | | — | | Other operations with non-controlling interests | | | — | | | | — | | | | (23 | ) | | | — | | | | — | | | | — | | | | (23 | ) | | | (24 | ) | | | (47 | ) | Other items | | | — | | | | — | | | | — | | | | — | | | | — | | | | — | | | | — | | | | — | | | | — | | As of December 31, 2009 | | | 2,348,422,884 | | | | 5,871 | | | | 55,372 | | | | (5,069 | ) | | | (115,407,190 | ) | | | (3,622 | ) | | | 52,552 | | | | 987 | | | | 53,539 | | Net income 2010 | | | — | | | | — | | | | 10,571 | | | | — | | | | — | | | | — | | | | 10,571 | | | | 236 | | | | 10,807 | | Other comprehensive income (Note 17) | | | — | | | | — | | | | (216 | ) | | | 2,581 | | | | — | | | | — | | | | 2,365 | | | | 9 | | | | 2,374 | | Comprehensive income | | | — | | | | — | | | | 10,355 | | | | 2,581 | | | | — | | | | — | | | | 12,936 | | | | 245 | | | | 13,181 | | Dividend | | | — | | | | — | | | | (5,098 | ) | | | — | | | | — | | | | — | | | | (5,098 | ) | | | (152 | ) | | | (5,250 | ) | Issuance of common shares (Note 17) | | | 1,218,047 | | | | 3 | | | | 38 | | | | — | | | | — | | | | — | | | | 41 | | | | — | | | | 41 | | Purchase of treasury shares | | | — | | | | — | | | | — | | | | — | | | | — | | | | — | | | | — | | | | — | | | | — | | Sale of treasury shares(a) | | | — | | | | — | | | | (70 | ) | | | — | | | | 2,919,511 | | | | 119 | | | | 49 | | | | — | | | | 49 | | Share-based payments (Note 25) | | | — | | | | — | | | | 140 | | | | — | | | | — | | | | — | | | | 140 | | | | — | | | | 140 | | Share cancellation (Note 17) | | | — | | | | — | | | | — | | | | — | | | | — | | | | — | | | | — | | | | — | | | | — | | Other operations with non-controlling interests | | | — | | | | — | | | | (199 | ) | | | (7 | ) | | | — | | | | — | | | | (206 | ) | | | (223 | ) | | | (429 | ) | Other items | | | — | | | | — | | | | — | | | | — | | | | — | | | | — | | | | — | | | | — | | | | — | | As of December 31, 2010 | | | 2,349,640,931 | | | | 5,874 | | | | 60,538 | | | | (2,495 | ) | | | (112,487,679 | ) | | | (3,503 | ) | | | 60,414 | | | | 857 | | | | 61,271 | | Net income 2011 | | | — | | | | — | | | | 12,276 | | | | — | | | | — | | | | — | | | | 12,276 | | | | 305 | | | | 12,581 | | Other comprehensive income (Note 17) | | | — | | | | — | | | | 231 | | | | 1,404 | | | | — | | | | — | | | | 1,635 | | | | 44 | | | | 1,679 | | Comprehensive income | | | — | | | | — | | | | 12,507 | | | | 1,404 | | | | — | | | | — | | | | 13,911 | | | | 349 | | | | 14,260 | | Dividend | | | — | | | | — | | | | (6,457 | ) | | | — | | | | — | | | | — | | | | (6,457 | ) | | | (172 | ) | | | (6,629 | ) | Issuance of common shares (Note 17) | | | 14,126,382 | | | | 35 | | | | 446 | | | | — | | | | — | | | | — | | | | 481 | | | | — | | | | 481 | | Purchase of treasury shares | | | — | | | | — | | | | — | | | | — | | | | — | | | | — | | | | — | | | | — | | | | — | | Sale of treasury shares(a) | | | — | | | | — | | | | (113 | ) | | | — | | | | 2,933,506 | | | | 113 | | | | — | | | | — | | | | — | | Share-based payments (Note 25) | | | — | | | | — | | | | 161 | | | | — | | | | — | | | | — | | | | 161 | | | | — | | | | 161 | | Share cancellation (Note 17) | | | — | | | | — | | | | — | | | | — | | | | — | | | | — | | | | — | | | | — | | | | — | | Other operations with non-controlling interests | | | — | | | | — | | | | (553 | ) | | | 103 | | | | — | | | | — | | | | (450 | ) | | | (123 | ) | | | (573 | ) | Other items | | | — | | | | — | | | | (23 | ) | | | — | | | | — | | | | — | | | | (23 | ) | | | 441 | | | | 418 | | As of December 31, 2011 | | | 2,363,767,313 | | | | 5,909 | | | | 66,506 | | | | (988 | ) | | | (109,554,173 | ) | | | (3,390 | ) | | | 68,037 | | | | 1,352 | | | | 69,389 | |
| (a) | Treasury shares related to the stock option purchase plans and restricted stock grants. |
TOTAL NOTES TO THE CONSOLIDATED FINANCIAL STATEMENTS On February 11, 2009,9, 2012, the Board of Directors established and authorized the publication of the Consolidated Financial Statements of TOTAL S.A. for the year ended December 31, 2008,2011, which will be submitted for approval to the shareholders’ meeting to be held on May 15, 2009.11, 2012. INTRODUCTION The Consolidated Financial Statements of TOTAL S.A. and its subsidiaries (the Group) are presented in Euros and have been prepared on the basis of IFRS (International Financial Reporting Standards) as adopted by the European Union and IFRS as issued by the IASB (International Accounting Standard Board) as of December 31, 2008.2011. The accounting principles applied in the Consolidated Financial Statements as of December 31, 2008,2011 were the same as those that were used as of December 31, 2007,2010 except for amendments and interpretations of IFRS which were mandatory for the periods beginning after January 1, 20082011 (and not early adopted). Their adoption has no material impact on the Consolidated Financial Statements as of December 31, 2008.2011. The preparation of financial statements in accordance with IFRS requires the management to make estimates and assumptions that affect the reported amounts of assets, liabilities and contingent liabilities at the date of preparation of the financial statements and reported income and expenses for the period. The management reviews these estimates and assumptions on an ongoing basis, by reference to past experience and various other factors considered as reasonable which form the basis for assessing the carrying amount of assets and liabilities. Actual results may differ significantly from these estimates, if different assumptions or circumstances apply. These judgments and estimates relate principally to the application of the successful efforts method for the oil and gas accounting, the valuation of long-lived assets, the provisions for asset retirement obligations and environmental remediation, the pensions and post-retirements benefits and the income tax computation. Lastly,Furthermore, where the accounting treatment of a specific transaction is not addressed by any accounting standard or interpretation, the management applies its judgment to
judgment to define and apply accounting policies that will lead to relevant and reliable information, so that the financial statements:
give a true and fair view of the Group’s financial position, financial performance and cash flows; reflect the substance of transactions; are prepared on a prudent basis; and are complete in all material aspects. 1)ACCOUNTING POLICIES Pursuant to the accrual basis of accounting followed by the Group, the financial statements reflect the effects of transactions and other events when they occur. Assets and liabilities such as property, plant and equipment and intangible assets are usually measured at amortized cost. Financial assetsAssets and liabilities are usually measured at fair value.value when required by the standards. Accounting policies used by the Group are described below: A) PRINCIPLES OF CONSOLIDATION
| A) | | PRINCIPLES OF CONSOLIDATION |
Subsidiaries that are directly controlled by the parent company or indirectly controlled by other consolidated subsidiaries are fully consolidated. Investments in jointly-controlled entities are proportionately consolidated.consolidated under the equity method. The Group accounts for jointly-controlled operations and jointly-controlled assets by recognising its share of assets, liabilities, income and expenses. Investments in associates, in which the Group has significant influence, are accounted for by the equity method. Significant influence is presumed when the Group holds, directly or indirectly (e.g.(e.g. through subsidiaries), 20% or more of the voting rights. Companies in which ownership interest is less than 20%, but over which the Company has the abilityis deemed to exercise significant influence, are also accounted for by the equity method. All significant intercompany balances, transactions and income have beenare eliminated. B) BUSINESS COMBINATIONS
Business combinations are accounted for using the purchaseacquisition method. This method implies the recognition of the acquired identifiable assets, assumed liabilities and contingent liabilities ofany non-controlling interests in the companies acquired by the Group at their fair value. The difference between the acquisition cost of the shares and fair value of the acquired share of the assets, liabilities and contingent liabilities identified onacquirer shall recognize goodwill at the acquisition date, is recorded as goodwill.being the excess of: The consideration transferred, the amount of non-controlling interests and, in business combinations achieved in stages, the fair value at the acquisition date of the investment previously held in the acquired company; Over the fair value at the acquisition date of acquired identifiable assets and assumed liabilities. If the cost of an acquisitionconsideration transferred is lesslower than the fair value of netacquired identifiable assets of the subsidiary acquired,and assumed liabilities, an additional analysis is performed on the identification and valuation of the identifiable elements of the assets and liabilities. Any residual negative goodwillbadwill is recorded as income. In transactions with non-controlling interests, the difference between the price paid (received) and the book value of non-controlling interests acquired (sold) is recognized directly in equity. The analysis of goodwillpurchase price allocation is finalized within one year from the acquisition date. C) FOREIGN CURRENCY TRANSLATIONNon-monetary contributions by venturers to a jointly-controlled entity in exchange for an equity interest in the jointly-controlled entity are accounted for by applying guidance provided in SIC 13 “Jointly Controlled Entities — Non-Monetary Contributions by Venturers”. A gain or loss on disposal of the previously held investment is recorded up to the share of the co-venturer in the jointly controlled entity.
| C) | | FOREIGN CURRENCY TRANSLATION |
The financial statements of subsidiaries are prepared in the currency that most clearly reflects their business environment. This is referred to as their functional currency. Transactions denominated in foreign currencies other than the functional currency of the entity are translated at the exchange rate on the transaction date. At each balance sheet date, monetary assets and liabilities are translated at the closing rate and the resulting exchange differences are recognized in “Other income” or “Other expense”.the statement of income. | (ii) | Translation of financial statements denominated in foreign currencies |
Assets and liabilities of foreign entities are translated into euros on the basis of the exchange rates at the end of the period. The income and cash flow statements are translated using the average exchange rates for the period. Foreign exchange differences resulting from such translations are either recorded in shareholders’ equity under “Currency translation adjustment”adjustments” (for the Group share) or under “Minority“Non-controlling interests” (for the minority share)share of non-controlling interests) as deemed appropriate. D) SALES AND REVENUES FROM SALES
| D) | | SALES AND REVENUES FROM SALES |
Revenues from sales are recognized when the significant risks and rewards of ownership have been passed to the buyer and the amount can be reasonably measured. Sales figures include excise taxes collected by the Group within the course of its oil distribution operations. Excise taxes are deducted from sales in order to obtain the “Revenues from sales”. indicator.
Revenues from sales are recognized when the significant risks and rewards of ownership have been passed to the buyer and when the amount is recoverable and can be reasonably measured. Revenues from sales of crude oil, natural gas and coal are recorded upon transfer of title, according to the terms of the sales contracts. Revenues from the production of crude oil and natural gas properties, in which the Group has an interest with other producers, are recognized based on actual volumes sold during the period. Any difference between volumes sold and entitlement volumes, based on the Group net working interest, areis recognized as “Crude oil and natural gas inventories” or “Accounts receivable, net”“Other current assets” or “Accounts payable”“Other creditors and accrued liabilities”, as appropriate. Revenues from gas transport are recognized when services are rendered. These revenues are based on the quantities transported and measured according to procedures defined in each service contract.
Revenues from sales of electricity are recorded upon transfer of title, according to the terms of the related contracts.
Revenues from services are recognized when the services have been rendered.
Shipping revenues and expenses from time-charter activities are recognized on a pro rata basis over a period that commences upon the unloading of the previous voyage and terminates upon the unloading of the current voyage. Shipping revenue recognition starts only when a charter has been agreed to by both the Group and the customer.
Oil and gas sales are inclusive of quantitiesQuantities delivered that represent production royalties and taxes, when paid in cash, are included in oil and outsidegas sales, except for the United States and Canada.
Certain transactions within the trading activities (contracts involving quantities that are purchased to third parties then resold to third parties) are shown at their net value in sales. Exchanges of crude oil and petroleum products within normal trading activities do not generate any income and therefore these flows are shown at their net value in both the statement of income and the balance sheet. E) SHARE-BASED PAYMENTS
Revenues from services are recognized when the services have been rendered. Revenues from gas transport are recognized when services are rendered. These revenues are based on the quantities transported and measured according to procedures defined in each service contract. Shipping revenues and expenses from time-charter activities are recognized on a pro rata basis over a period that commences upon the unloading of the previous voyage and terminates upon the unloading of the current voyage. Shipping revenue recognition starts only when a charter has been agreed to by both the Group and the customer. The Group may grant employees stock options, create employee share purchase plans and offer its employees the opportunity to subscribe to reserved capital increases. These employee benefits are recognized as expenses with a corresponding credit to shareholders’ equity. The expense is equal to the fair value of the instruments granted. The fair value of the options is calculated using the Black-Scholes model at the grant date. The expense is recognized on a straight-line basis between the grant date and vesting date. For restricted share plans, the expense is calculated using the market price at the grant date after deducting the expected distribution rate during the vesting period. The cost of employee-reserved capital increases is immediately expensed. A discount reduces the expense in order to account for the nontransferability of the shares awarded to the employees over a period of five years. F) INCOME TAXES
Income taxes disclosed in the statement of income include the current tax expenses and the deferred tax expenses. The Group uses the liability method whereby deferred income taxes are recorded based on the temporary differences between the carrying amounts of assets and liabilities recorded in the balance sheet and their tax bases, and on carryforwardscarry-forwards of unused tax losses and tax credits. Deferred tax assets and liabilities are measured using the tax rates that have been enacted or substantially enacted at the balance sheet date. The tax rates used depend on the timing of reversals of temporary differences, tax losses and other tax credits. The effect of a change in tax rate is recognized either in the Consolidated Statement of Income or in shareholders’ equity depending on the item it relates to. Deferred tax assets are recognized when future recovery is probable. Asset retirement obligations and finance leases give rise to the recognition of assets and liabilities for accounting purposes as described in paragraph K “Leases” and paragraph Q “Asset retirement obligations” of this Note. Deferred income taxes resulting from temporary differences between the carrying amounts and tax bases of such assets and liabilities are recognized. Deferred tax liabilities resulting from temporary differences between the carrying amounts of equity-method investments and their tax bases are recognized. The deferred tax calculation is based on the expected future tax effect (dividend distribution rate or tax rate on the gain or loss upon disposal of these investments). Taxes paid on the Upstream production are included in operating expenses, including those related to historical concessions held by the Group in the Middle East producing countries.
G) EARNINGS PER SHARE
Earnings per share is calculated by dividing net income (Group share) by the weighted-average number of common shares outstanding during the period.period, excluding TOTAL shares held by TOTAL S.A. (Treasury shares) and TOTAL shares held by the Group subsidiaries which are deducted from consolidated shareholders’ equity. Diluted earnings per share is calculated by dividing net income (Group share) by the fully-diluted weighted-average number of common shares outstanding during the period. For both of these calculations, treasury Treasury shares held by the parent company, TOTAL S.A., and TOTAL shares held by the Group subsidiaries are deducted from consolidated shareholders’ equity. These shares are not considered outstanding for purposes of these calculations.
In addition, in the case of the diluted earnings per sharethis calculation the calculationwhich also takes into account the dilutive effect of stock options, restricted share grants and capital increases with a subscription period closing after the end of the fiscal year.
The weighted-average number of fully-diluted shares is calculated in accordance with the treasury stock method provided for by IAS 33. The proceeds, which would be recovered in the event of an exercise of rights related to dilutive instruments, are presumed to be a share buyback at the average market price over the period. The number of shares thereby obtained leads to a reduction in the total number of shares that would result from the exercise of rights. H) OIL AND GAS EXPLORATION AND PRODUCING PROPERTIES AND MINING ACTIVITY The Group applies IFRS 6 “Exploration for and Evaluation of Mineral Resources”. Oil and gas exploration and production properties and assets are accounted for in accordance with the successful efforts method. Geological and geophysical costs, including seismic surveys for exploration purposes are expensed as incurred. Mineral interests are capitalized as intangible assets when acquired. These acquired interests are tested for impairment on a regular basis, property-by-property, based on the results of the exploratory activity and the management’s evaluation. In the event of a discovery, the unproved mineral interests are transferred to proved mineral interests at their net book value as soon as proved reserves are booked. Exploratory wells are tested for impairment on a well-by-well basis and accounted for as follows: Costs of exploratory wells which result in proved reserves are capitalized and then depreciated using the unit-of-production method based on proved developed reserves; Costs of dry exploratory wells and wells that have not found proved reserves are charged to expense; Costs of exploratory wells are temporarily capitalized until a determination is made as to whether the well has found proved reserves if both of the following conditions are met: The well has found a sufficient quantity of reserves to justify its completion as a producing well, if appropriate, assuming that the required capital expenditures are made; The Group is making sufficient progress assessing the reserves and the economic and operating viability of the project. This progress is evaluated on the basis of indicators such as whether additional exploratory works are under way or firmly planned (wells, seismic or significant studies), whether costs are being incurred for development studies and whether the Group is waiting for governmental or other third-party authorization of a proposed project, or availability of capacity on an existing transport or processing facility. Costs of exploratory wells not meeting these conditions are charged to expense. | (ii) | Oil and Gas producing assets |
Development costs incurred for the drilling of development wells and for the construction of production facilities are capitalized, together with borrowing costs incurred during the period of construction and the present value of estimated future costs of asset retirement obligations. The depletion rate is usually equal to the ratio of oil and gas production for the period to proved developed reserves (unit-of-production method). With respect to production sharing contracts, this computation is based on the portion of production and reserves assigned to the Group taking into account estimates based on the contractual clauses regarding the reimbursement of exploration, development and developmentproduction costs (cost oil) as well as the sharing of hydrocarbon rights (profit oil). Transportation assets are depreciated using the unit-of-production method based on throughput or by using the straight-line method whichever best reflects the economic life of the asset. Proved mineral interests are depreciated using the unit-of-production method based on proved reserves. Before an assessment can be made on the existence of resources, exploration costs, including studies and core drilling campaigns as a whole, are expensed. When the assessment concludes that resources exist, the costs engaged subsequently to this assessment are capitalized temporarily while waiting for the field final development decision, if a positive decision is highly probable. Otherwise, these costs are expensed. Once the development decision is taken, the predevelopment costs capitalized temporarily are integrated with the cost of development and depreciated from the start of production at the same pace than development assets. Mining development costs include the initial stripping costs and all costs incurred to access resources, and particularly the costs of: Machinery and mobile equipment which are significantly costly; These costs are capitalized and depreciated either on a straight line basis or depleted using the UOP method from the start of production. I) GOODWILL AND OTHER INTANGIBLE ASSETS EXCLUDING MINERAL INTERESTS Other intangible assets include goodwill, patents, trademarks, and mineral interests.lease rights. Intangible assets are carried at cost, after deducting any accumulated depreciation and accumulated impairment losses. GoodwillGuidance for calculating goodwill is presented in a consolidated subsidiary is calculated asNote 1 paragraph B to the excess of the cost of shares, including transaction expenses, over the fair value of the Group’s share of the net assets at the acquisition date.Consolidated Financial Statements. Goodwill is not amortized but is tested for impairment annually or as soon as there is any indication of impairment (see Note 1 paragraph L “Impairment of long-lived assets” of this Note)to the Consolidated Financial Statements).
In equity affiliates, goodwill is included in the investment carrying amount.book value. Other intangible assets (except goodwill) have a finite useful life and are amortized on a straight-line basis over 103 to 4020 years depending on the useful life of the assets. Research and development Research costs are charged to expense as incurred. Development expenses are capitalized when the following can be demonstrated: the technical feasibility of the project and the availability of the adequate resources for the completion of the intangible asset; the ability of the asset to generate probable future economic benefits; the ability to measure reliably the expenditures attributable to the asset; and the feasibility and intention of the Group to complete the intangible asset and use or sell it. Advertising costs are charged to expense as incurred. J) OTHER PROPERTY, PLANT AND EQUIPMENT
| J) | | OTHER PROPERTY, PLANT AND EQUIPMENT |
Other property, plant and equipment are carried at cost, after deducting any accumulated depreciation and accumulated impairment losses. This cost includes borrowing costs directly attributable to the acquisition or production of a qualifying asset incurred until assets are placed in service. Borrowing costs are capitalized as follows: if the project benefits from a specific funding, the capitalization of borrowing costs is based on the borrowing rate; if the project is financed by all the Group’s debt, the capitalization of borrowing costs is based on the weighted average borrowing cost for the period. Routine maintenance and repairs are charged to expense as incurred. The costs of major turnarounds of refineries and large petrochemical units are capitalized as incurred and depreciated over the period of time between two consecutive major turnarounds. Other property, plant and equipment are depreciated using the straight-line method over their useful lives, which are as follows: | | | | | • Furniture, office equipment, machinery and tools | | | 3-12 years | | • Transportation equipments | | | 5-20 years | | • Storage tanks and related equipment | | | 10-15 years | | • Specialized complex installations and pipelines | | | 10-30 years | | • Buildings | | | 10-50 years | |
K) LEASES
A finance lease transfers substantially all the risks and rewards incidental to ownership from the lessor to the lessee. These contracts are capitalized as assets at fair value or, if lower, at the present value of the minimum lease payments according to the contract. A corresponding financial debt is recognized as a financial liability. These assets are depreciated over the corresponding useful life used by the Group. Leases that are not finance leases as defined above are recorded as operating leases. Certain arrangements do not take the legal form of a lease but convey the right to use an asset or a group of assets in return for fixed payments. Such arrangements are accounted for as leases and are analyzed to determine whether they should be classified as operating leases or as finance leases. L) IMPAIRMENT OF LONG-LIVED ASSETS
| L) | | IMPAIRMENT OF LONG-LIVED ASSETS |
The recoverable amounts of intangible assets and property, plant and equipment are tested for impairment as soon as any indication of impairment exists. This test is performed at least annually for goodwill. The recoverable amount is the higher of the fair value (less costs to sell) or its value in use. Assets are grouped into cash-generating units (or CGUs) for testing purposes.and tested. A cash-generating unit is a homogeneous group of assets that generates cash inflows that are largely independent of the cash inflows from other groups of assets. The value in use of a CGU is determined by reference to the discounted expected future cash flows, based upon the management’s expectation of future economic and operating conditions. IfWhen this value is less than the carrying amount of the CGU, an impairment loss on property, plant and equipment and mineral interests, or on other intangible assets,is recorded. It is recognized eitherallocated first to goodwill in counterpart of “Other expenses”. These impairment losses are then allocated to “Depreciation, depletion and amortization of tangible assets and mineral interests” or infor property, plant and mineral interests and to “Other expense”, respectively. This impairment loss is first allocated to reduce the carrying amount of any goodwill.expenses” for other intangible assets. Impairment losses recognized in prior periods can be reversed up to the original carrying amount, had the impairment loss not been recognized. Impairment losses recognized for goodwill cannot be reversed. M) FINANCIAL ASSETS AND LIABILITIES
| M) | | FINANCIAL ASSETS AND LIABILITIES |
Financial assets and liabilities are financial loans and receivables, investments in non-consolidated companies, publicly traded equity securities, derivatives instruments and current and non-current financial liabilities. The accounting treatment of these financial assets and liabilities is as follows: Financial loans and receivables are recognized at amortized cost. They are tested for impairment, by comparing the carrying amount of the assets to estimates of the discounted future recoverable cash flows. These tests are conducted as soon as there is any evidence that their fair value is less than their carrying amount, and at least annually. Any impairment loss is recorded in the statement of income. | (ii) | Investments in non-consolidated companies and publicly-traded equity securitiesOther investments |
These assets are classified as financial assets available for sale and therefore measured at their fair value. For listed securities, this fair value is equal to the market price. For unlisted securities, if the fair value is not reliably determinable, securities are recorded at their historical value. Changes in fair value are recorded in shareholders’ equity. If there is any evidence of a significant or prolonged decline in the fair value of the investments below their cost, anlong-lasting impairment loss, a loss is recorded in the statementStatement of income.Income. This impairment is reversed in the statement of income only when the securities are sold. | (iii) | Derivative instruments |
The Group uses derivative instruments to manage its exposure to risks of changes in interest rates, foreign exchange rates and commodity prices. Changes in fair value of derivative instruments are recognized in the statement of income or in shareholders’ equity and are recognized in the balance sheet in the accounts corresponding to their nature, according to the risk management strategy described in Note 31 to the Consolidated Financial Statements. The derivative instruments used by the Group are the following: Financial instruments used for cash management purposes are part of a hedging strategy of currency and interest rate risks within global limits set by the Group and are considered as heldto be used for trading.transactions (held for trading). Changes in fair value are systematically recorded in the statement of income. The balance sheet value of those instruments is included in “Current financial assets” or “Other current financial liabilities”. | • | | Long-term financing (other than euro) |
When an external long-term financing is set up, specifically to finance subsidiaries, in a currency other than the euro, which is mainly the case for subsidiaries whose functional currency is the dollar, and when this financing involves currency and interest rate derivatives, these instruments qualify as fair value hedges of the interest rate risk on the external debt and of the currency risk of the loans to subsidiaries. Changes in fair value of derivatives are recognized in the statement of income as are changes in fair value of financial debts and loans to subsidiaries.qualified as: | i. | Fair value hedge of the interest rate risk on the external debt and of the currency risk of the loans to subsidiaries. Changes in fair value of derivatives are recognized in the statement of income as are changes in fair value of underlying financial debts and loans to subsidiaries. |
The fair value of those hedging instruments of long-term financing is included in the assets under “Hedging instruments ofon non-current financial debt” or in the liabilities under “Non-current financial debt” fordebt “for the non-current portion. The current portion (less than one year) is accounted for in “Current financial assets” or “Other current financial liabilities”. In case of the anticipated termination of derivative instruments accounted for as fair value hedges, the amount paid or received is recognized in the statement of income and: If this termination is due to an early cancellation of the hedged items, the adjustment previously recorded as revaluation of those hedged items is also recognized in the statement of income.income; If the hedged items remain in the balance sheet, the adjustment previously recorded as a revaluation of those hedged items is spread over the remaining life of those items. | ii. | Cash flow hedge of the currency risk of the external debt. Changes in fair value are recorded in equity for the effective portion of the hedging and in the statement of income for the ineffective portion of the hedging. Amounts recorded in |
| equity are transferred to the income statement when the hedged transaction affects profit or loss. |
The fair value of those hedging instruments of long-term financing is included in the assets under “Hedging instruments on non-current financial debt” or in the liabilities under “Non-current financial debt” for the non-current portion. The current portion (less than one year) is accounted for in “Current financial assets” or “Other current financial liabilities”. If the hedging instrument expires, is sold or terminated by anticipation, gains or losses previously recognized in equity remain in equity. Amounts are recycled in the income statement only when the hedged transaction affects profit or loss. | • | | Foreign subsidiaries’ equity hedge |
Certain financial instruments hedge against risks related to the equity of foreign subsidiaries whose functional currency is not the euro (mainly the dollar). These instruments qualify as “net investment hedges”. Changes in fair value are recorded in shareholders’ equity. The fair value of these instruments is recorded under “Current financial assets” or “Other current financial liabilities”. | • | | Financial instruments related to commodity contracts |
Financial instruments related to commodity contracts, including crude oil, petroleum products, natural gas, power and power purchasing/sellingcoal purchase/sales contracts related towithin the trading activities, together with the commodity contract derivative instruments such as energy contracts and forward freight agreements, are used to adjust the Group’s exposure to price fluctuations within global trading limits. According to the industry practice, these instruments are considered as held for trading. Changes in fair value are recorded in the statement of income. The fair value of these instruments is recorded in “Other current assets” or “Other creditors and accrued liabilities” depending on whether they are assets or liabilities. Detailed information about derivatives positions is disclosed in Notes 20, 28, 29, 30 and 31 to the Consolidated Financial Statements. | (iv) | Current and non-current financial liabilities |
Current and non-current financial liabilities (excluding derivatives) are recognized at amortized cost, except those for which a hedge accounting iscan be applied as described in the previous paragraph. | (v) | Fair value of financial instruments |
Fair values are estimated for the majority of the Group’s financial instruments, with the exception of publicly traded equity securities and marketable securities for which the market price is used. Estimated fair values, which are based on principles such as discounting future cash flows to present value, must be weighted by the fact that the value of a financial instrument at a given time may be influenced by the market environment (liquidity especially), and also the fact that subsequent changes in interest rates and exchange rates are not taken into account. As a consequence, the use of different estimates, methodologies and assumptions could have a material effect on the estimated fair value amounts. The methods used are as follows: Financial debts, swaps:
The market value of swaps and of bonds that are hedged by those swaps havehas been determined on an individual basis by discounting future cash flows with the zero coupon interest rate curves existing at year-end;year-end. Financial instruments related to commodity contracts:
| • | | Financial instruments related to commodity contracts |
The valuation methodology is to mark to market all open positions for both physical and derivatives risks.paper transactions. The valuations are determined on a daily basis using observable market data based on organized markets and over the counter (OTC) markets. In particular cases when market data are not directly available, the valuations are derived from observable data such as arbitrages, freight or spreads and market corroboration. For valuation of risks based on calculated data,which are the result of a calculation, such as options for example, commonly known models are used to compute the fair value. Other financial instruments:
| • | | Other financial instruments |
The fair value of the interest rate swaps and of FRA (Forward Rate Agreement) are calculated by discounting future cash flows on the basis of zero coupon interest rate curves existing at year-end after adjustment for interest accrued but unpaid. Forward exchange contracts and currency swaps are valued on the basis of a comparison of the negociated forward rates with the rates in effect on the financial markets at year-end for similar maturities. Exchange options are valued based on the Garman-Kohlhagen model including market quotations at year-end. N) INVENTORIES
IFRS 7 “Financial instruments: disclosures”, amended in 2009, introduces a fair value hierarchy for financial instruments and proposes the following three-level classification : level 1: quotations for assets and liabilities (identical to the ones that are being valued) obtained at the valuation date on an active market to which the entity has access; level 2: the entry data are observable data but do not correspond to quotations for identical assets or liabilities; level 3: the entry data are not observable data. For example: these data come from extrapolation. This level applies when there is no market or observable data and the company has to use its own hypotheses to estimate the data that other market players would have used to determine the fair value of the asset. Fair value hierarchy is disclosed in Notes 29 and 30 to the Consolidated Financial Statements. Inventories are measured in the Consolidated Financial Statements at the lower of historical cost or market value. Costs for petroleum and petrochemical products are determined according to the FIFO (First-In, First-Out) method and other inventories are measured using the weighted-average cost method. Downstream (Refining — Marketing) Petroleum product inventories are mainly comprised of crude oil and refined products. Refined products principally consist of gasoline, kerosene, diesel, fuel oil and heating oil produced by the Group’s refineries. The turnover of petroleum products does not exceed two months on average. Crude oil costs include raw material and receiving costs. Refining costs principally include the crude oil costs, production costs (energy, labor, depreciation of producing assets) and allocation of production overhead (taxes, maintenance, insurance, etc.). Start-up costs and general administrative costs are excluded from the carrying amountcost price of refined products. Chemicals Costs of chemical products inventories consist of raw material costs, direct labor costs and an allocation of production overhead. Start-up costs and general administrative costs are excluded from the cost of inventories of chemicals products. O) TREASURY SHARES
Treasury shares of the parent company held by its subsidiaries or itself are deducted from consolidated shareholders’ equity. Gains or losses on sales of treasury shares are excluded from the determination of net income and are recognized in shareholders’ equity. P) PROVISIONS AND OTHER NON-CURRENT LIABILITIES
| P) | | PROVISIONS AND OTHER NON-CURRENT LIABILITIES |
Provisions and non-current liabilities are comprised of liabilities for which the amount and the timing are uncertain. They arise from environmental risks, legal and tax risks, litigation and other risks. A provision is recognized when the Group has a present obligation (legal or constructive) as a result of a past event for which it is probable that an outflow of resources will be required and when a reliable estimate can be made regarding the amount of the obligation. The amount of the liability corresponds to the best possible estimate. Q) ASSET RETIREMENT OBLIGATIONS
| Q) | | ASSET RETIREMENT OBLIGATIONS |
Asset retirement obligations, which result from a legal or constructive obligation, are recognized based on a reasonable estimate of their fair value in the period in which the obligation arises. The associated asset retirement costs are capitalized as part of the carrying amount of the underlying asset and depreciated over the useful life of this asset. ChangesAn entity is required to measure changes in the liability for an asset retirement obligation due to the passage of time (accretion) are measured by applying a risk-free discount rate to the amount of the liability. The increase of the provision due to the passage of time is recognized as “Other financial expense”.
R) EMPLOYEE BENEFITS
In accordance with the laws and practices of each country, the Group participates in employee benefit plans offering retirement, death and disability, healthcare and special termination benefits. These plans provide benefits based on various factors such as length of service, salaries, and contributions made to the governmental bodies responsible for the payment of benefits. These plans can be either defined contribution or defined benefit pension plans and may be entirely or partially funded with investments made in various non-Group instruments such as mutual funds, insurance contracts, and other instruments. For defined contribution plans, expenses correspond to the contributions are expensed as incurred.paid. Defined benefit obligations are determined according to the Projected Unit Method. Actuarial gains and losses may arise from differences between actuarial valuation and projected commitments (depending on new calculations or assumptions) and between projected and actual return of plan assets. The Group applies the corridor method to amortize its actuarial gains and losses. This method amortizes the net cumulative actuarial gains and losses that exceed 10% of the greater of the present value of the defined benefit obligation and the fair value of plan assets at the opening balance sheet date, over the average expected remaining working lives of the employees participating in the plan. In case of a change in or creation of a plan, the vested portion of the cost of past services is recorded immediately in the statement of income, and the unvested past service cost is amortized over the vesting period. The net periodic pension cost is recognized under “Other operating expenses”. S) CONSOLIDATED STATEMENT OF CASH FLOW
| S) | | CONSOLIDATED STATEMENT OF CASH FLOWS |
The Consolidated Statement of Cash flowsFlows prepared in foreign currencies arehas been translated into euros using the exchange rate on the transaction date or the average exchange rate for the period. Currency translation differences arising from the translation of monetary assets and liabilities denominated in foreign currency into euros using the closing exchange rates are shown in the Consolidated Statement of Cash FlowFlows under “Effect of exchange rates”. Therefore, the Consolidated Statement of Cash FlowFlows will not agree with the figures derived from the Consolidated Balance Sheet. Cash and cash equivalents Cash and cash equivalents are comprised of cash on hand and highly liquid short-term investments that are easily convertible into known amounts of cash and are subject to insignificant risks of changes in value. Investments with maturity greater than three months and less than twelve months are shown under “Current financial assets”. Changes in current financial assets and liabilities are included in the financing activities section of the Consolidated Statement of Cash Flow.Flows. Non-current financial debt Changes in non-current financial debt have beenare presented as athe net variation to reflect significant changes mainly related to revolving credit agreements. T) CARBON DIOXIDE EMISSION RIGHTS
| T) | | CARBON DIOXIDE EMISSION RIGHTS |
In the absence of a current IFRS standard or interpretation on accounting for emission rights of carbon dioxide, the following principles have beenare applied: Emission rights are managed as a cost of production and as such are recognized in inventories: Emission rights allocated for free are booked in inventories with a nil carrying amount, Purchased emission rights granted freeare booked at acquisition cost, Sales or annual restorations of chargeemission rights consist of decreases in inventories recognized based on a weighted average cost, If the carrying amount of inventories at closing date is higher than the market value, an impairment loss is recorded. At each closing, a provision is recorded in order to materialize the obligation of emission rights restoration related to the emissions of the period. This provision is calculated based on estimated emissions of the period, valued at weighted average cost of the inventories at the end of the period. It is reversed when the emission rights are accounted for at zero carrying amount;restored. liabilities resulting from potential differences between available quotas and quotasIf emission rights to be delivered at the end of the compliance period are higher than emission rights (allocated and purchased) booked in inventories, the shortage is accounted for as liabilities and measureda liability at fair market value;value.
spot market transactions are recognized in income at cost; and
forwardForward transactions are recognized at their fair market value on the face ofin the balance sheet. Changes in the fair value of such forward transactions are recognized in the statement of income.
U) NON-CURRENT ASSETS HELD FOR SALE AND DISCONTINUED OPERATIONS
| U) | | NON-CURRENT ASSETS HELD FOR SALE AND DISCONTINUED OPERATIONS |
Pursuant to IFRS 5 “Non-current assets held for sale and discontinued operations”, assets and liabilities of affiliates that are held for sale are presented separately on the face of the balance sheet. Net income from discontinued operations is presented separately on the face of the statement of income. Therefore, the notes to the Consolidated Financial Statements related to the statement of income only refer to continuing operations. A discontinued operation is a component of the Group for which cash flows are independent. It represents a major line of business or geographical area of operations which has been disposed of or is currently being held for sale. V) ALTERNATIVE IFRS METHODS
| V) | | ALTERNATIVE IFRS METHODS |
For measuring and recognizing assets and liabilities, the following choices among alternative methods allowable under IFRS have been made: property, plant and equipment, and intangible assets are measured using historical cost model instead of revaluation model; borrowing costs incurred during the construction and acquisition period of property, plant and equipment and intangible assets are capitalized, as provided for under IAS 23 “Borrowing Costs”;
actuarial gains and losses on pension and other post-employment benefit obligations are recognized according to the corridor method (see Note 1 paragraph R of this Note)to the Consolidated Financial Statements); and jointly-controlled entities are consolidated usingunder the proportionateequity method, as provided for in the alternative method of IAS 31 “Interests in joint ventures”. W) NEW ACCOUNTING PRINCIPLES NOT YET IN EFFECT The standards or interpretations published respectively by the International Accounting Standards Board (IASB) and the International Financial Reporting Interpretations Committee (IFRIC) which were not yet in effect and not adopted by the European Union at December 31, 2008, were2011, are as follows: Revised IAS 1 “Presentation of financial statements”
In September 2007,November 2009, the IASB issued a revised version of IAS 1 “Presentationstandard IFRS 9 “Financial Instruments” that introduces new requirements for the classification and measurement of financial statements”. The revised standard deals with the presentationassets, and included in October 2010 requirements regarding classification and measurement of financial statementsliabilities. This standard shall be completed with texts on impairment and introduces the presentation of a comprehensive income statement. It is effective for annual periods beginning onhedge accounting. Under standard IFRS 9, financial assets and liabilities are generally measured either at fair value through profit or after January 1, 2009.loss or at amortised cost if certain conditions are met. The application of revised IAS 1standard should not have any material impact for the Group given the disclosures already presented in the Consolidated Financial Statements for the year ended December 31, 2008. Revised IAS 23 “Borrowing costs”
In March 2007, the IASB issued a revised version of IAS 23 “Borrowing costs”. Under the revised standard, an entity shall capitalize borrowing costs that are directly attributable to the acquisition or production of a qualifying asset. The revised standard is effective for annual periods beginning on or after January 1, 2009. The application of revised IAS 23 should not have any material impact on the Group’s balance sheet, income statement and shareholders’ equity, given that the Group has already applied this method (see paragraph V of this Note).
Revised IFRS 3 “Business Combinations” and revised IAS 27 “Consolidated and Separate Financial Statements”
In January 2008, the IASB issued revised versions of IFRS 3 “Business Combinations” and IAS 27 “Consolidated and Separate Financial Statements”. These revised standards introduce new provisions regarding the accounting for business combinations. They are effective as of the first annual period starting after July 1, 2009 (i.e. as of January 1, 2010 for the Group). Their application is prospective.
IFRS 8 “Operating segments”
In November 2006, the IASB issued IFRS 8 “Operating segments”. The new standard replaces IAS 14 “Segment reporting”. It requires entities to adopt an approach based on internal information used by the management
of the entity to determine reportable segments, whereas IAS 14 is based on segment risks and profitability. Entities shall apply IFRS 8 to annual periods beginning on or after January 1, 2009. The application of IFRS 8 should not have any material impact on the presentation of information by business segment in the Consolidated Financial Statements of the Group.
IFRIC 16 “Hedges of a Net Investment in a Foreign Operation”
In July 2008, the IFRIC issued interpretation IFRIC 16 “Hedges of a Net Investment in a Foreign Operation”. The interpretation provides guidance on accounting for the hedge of a net investment in a foreign operation as defined by IAS 39. The interpretation is effectivebe applicable for annual periods starting on or after October 1, 2008 (i.e.starting January 1, 2009 for the Group).2015. The application of IFRIC 16the standard as published in 2010 should not have any material effect on the Group’s consolidated balance sheet, statement of income and shareholders’shareholder’s equity.
IFRIC 17 “DistributionsIn May 2011, the IASB issued a package of Non-cash Assetsstandards on consolidation : standard IFRS 10 “Consolidated financial statements”, standard IFRS 11 “Joint arrangements”, standard IFRS 12 “Disclosure of interests in other entities”, revised standard IAS 27 “Separate financial statements” and revised standard IAS 28 “Investments in associates and joint ventures”. These standards are applicable for annual periods beginning on or after January 1, 2013. The impact of the application of these standards is currently assessed by the Group.
In June 2011, the IASB issued revised standard IAS 19 “Employee benefits”, which leads in particular to Owners” In November 2008, the IFRIC issued interpretation IFRIC 17 “Distributions of Non-cash Assets to Owners”. The interpretation addresses the accounting of non-cash assets distributed among two entities which are not jointly-controlled. It provides that the dividend payable should be measured at the fair valuefull recognition of the net assetsposition in respect of employee benefits obligations (liabilities net of assets) in the balance sheet, to be distributed and that any difference with the carrying amountelimination of the netcorridor approach currently used by the Group and to the obligation to evaluate the expected return on plan assets distributed should be recognised in profit or loss. The interpretationon a normative basis (via the discount rate used to value the debt). This standard is effectiveapplicable for annual periods startingbeginning on or after January 1, 2013. The impact of the application of this standard is currently assessed by the Group.
In addition, the IASB published in May 2011 standard IFRS 13 “Fair value measurement”, applicable for annual periods beginning on or after January 1, 2013, and in June 2011 revised standard IAS 1 “Presentation of financial statements”, applicable for annual periods beginning on or after July 1, 2009 (i.e. starting January 1, 2010 for the Group). 2012. The application of IFRIC 17these standards should not have any material effect on the Group’s consolidated balance sheet, statement of income and shareholders’shareholder’s equity. 2)MAIN INDICATORS — INFORMATION BY BUSINESS SEGMENT Performance indicators excluding the adjustment items, such as adjusted operating income, adjusted net operating income, and adjusted net income are meant to facilitate the analysis of the financial performance and the comparison of income between periods. Adjustment items The detail of these adjustment items is presented in Note 4 to the Consolidated Financial Statements. Adjustment items include : Due to their unusual nature or particular significance, certain transactions qualified as “special items” are excluded from the business segment figures. In general, special items relate to transactions that are significant, infrequent or unusual. However, in certain instances, transactions such as restructuring costs or assets disposals, which are not considered to be representative of the normal course of business, may be qualified as special items although they may have occurred within prior years or are likely to occur again within the coming years. | (ii) | The inventory valuation effect |
The adjusted results of the Downstream and Chemicals segments are presented according to the replacement cost method. This method is used to assess the segments’ performance and ensurefacilitate the comparability of the segments’ performance with those of the Group’s competitors, mainly North-American.its competitors. In the replacement cost method, which approximates the LIFO (Last-In, First-Out) method, the variation of inventory values in the statement of income is, depending on the nature of the inventory, determined byusing either the month-end prices differential between one period and another or the average prices of the period rather than the historical value. The inventory valuation effect is the difference between the results according to the FIFO (First-In, First-Out) and the replacement cost. | (iii) | Equity shareEffect of amortization of intangible assets related to the Sanofi-Aventis mergerchanges in fair value |
As from January 1, 2011, the effect of changes in fair value presented as adjustment item reflects for some transactions differences between internal measure of performance used by TOTAL’s management and the accounting for these transactions under IFRS. IFRS requires that trading inventories be recorded at their fair value using period end spot prices. In order to best reflect the management of economic exposure through derivative transactions, internal indicators used to measure performance include valuations of trading inventories based on forward prices. Furthermore, TOTAL, in its trading activities, enters into storage contracts, which future effects are recorded at fair value in Group’s internal economic performance. IFRS precludes recognition of this fair value effect. Main(iv) | indicators:Until June 30, 2010, TOTAL’s equity share of adjustment items reconciling “Business net income” to Net income attributable to equity holders of Sanofi (see Note 3, paragraph on the sales of Sanofi shares and loss of significant influence over Sanofi) |
Main indicators | (i) | Operating income (measure used to evaluate operating performance) |
RevenuesRevenue from sales after deducting cost of goods sold and inventory variations, other operating expenses,
exploration expenses and depreciation, depletion, and amortization. Operating income excludes the amortization of intangible assets other than mineral interests, currency translation adjustmentadjustments and gains or losses on the disposal of assets. | (ii) | Net operating income (measure used to evaluate the return on capital employed) |
Operating income after taking into account the amortization of intangible assets other than mineral interests, currency translation adjustment,adjustments, gains or losses on the disposal of assets, as well as all other income and expenses related to capital employed (dividends from non-consolidated companies, equity in income of affiliates, capitalized interest expenses), and after income taxes applicable to the above. The only income and expense not included in net operating income but included in net income are interest expenses related to net financial debt, only, after applicable income taxes (net cost of net debtdebt) and minority interests).non-controlling interests. Operating income, net operating income, or net income excluding the effect of adjustment items described above. | (iv) | Fully-diluted adjusted earnings per share |
Adjusted net income divided by the fully-diluted weighted-average number of common shares. Non-current assets and working capital, at replacement cost, net of deferred income taxes and non-current liabilities. (v)(vi) | ROACE (Return on Average Capital Employed) |
Ratio of adjusted net operating income to average capital employed between the beginning and the end of the period. (vi)(vii) | ROE (Return on Equity) |
Ratio of adjusted consolidated net income to average adjusted shareholders’ equity (after distribution) between the beginning and the end of the period. Non-current debt, including current portion, current borrowings, other current financial liabilities less cash and cash equivalents and other current financial assets. 3) CHANGES IN THE GROUP STRUCTURE, MAIN ACQUISITIONS AND DIVESTMENTS | | CHANGES IN THE GROUP STRUCTURE, MAIN ACQUISITIONS AND DIVESTMENTS |
During 2011, 2010 and 2009, main changes in the Group structure and main acquisitions and divestments were as follows: 20082011
TOTAL finalized in March 2011 the acquisition from Santos of an additional 7.5% interest in Australia’s GLNG project. This increases TOTAL’s overall stake in the project to 27.5%. The acquisition cost amounts to€202 million ($281 million) and mainly corresponds to the tender offer describedvalue of mineral interests that have been recognized as intangible assets in the prospectus on May 13, 2008consolidated balance sheet for€227 million. In March 2011, Total E&P Canada Ltd., a TOTAL subsidiary, and renewed bySuncor Energy Inc. (Suncor) have finalized a strategic oil sands alliance encompassing the notices on June 19, July 4Suncor-operated Fort Hills mining project, the TOTAL-operated Joslyn mining project and July 16, 2008, the Suncor-operated Voyageur upgrader project. All three assets are located in the Athabasca region of the province of Alberta, in Canada. TOTAL acquired 100%19.2% of Synenco Energy Inc’s Class A ordinary shares. Synenco’s main asset is a 60%Suncor’s interest in the Northern LightsFort Hills project, increasing TOTAL’s overall interest in the project to 39.2%. Suncor, as operator, holds 40.8%. TOTAL also acquired a 49% stake in the Suncor-operated Voyageur upgrader project. For those two acquisitions, the Group paid€1,937 million (CAD 2,666 million) mainly representing the value of intangible assets for€474 million and the value of tangible assets for€1,550 million. Furthermore, TOTAL sold to Suncor 36.75% interest in the Joslyn project for€612 million (CAD 842 million). The Group, as operator, retains a 38.25% interest in the project. TOTAL finalized in April 2011 the sale of its 75.8% interest in its upstream Cameroonian affiliate Total E&P Cameroun to Perenco, for an amount of€172 million ($247 million), net of cash sold. TOTAL and the Russian company Novatek signed in March 2011 two Memorandums of Cooperation to develop the cooperation between TOTAL on one side, and Novatek and its main shareholders on the other side. This cooperation is developed around the two following axes: In April 2011, TOTAL took a 12.09% shareholding in Novatek for an amount of€2,901 million ($4,108 million). In December 2011, TOTAL finalized the acquisition of an additional 2% interest in Novatek for an amount of€596 million ($796 million), increasing TOTAL’s overall interest in Novatek to 14.09%. TOTAL considers that it has a significant influence especially through its representation on the Board of Directors of Novatek and its participation in the major Yamal LNG project. Therefore, the interest in Novatek has been accounted for by the equity method since the second quarter of 2011. In October 2011, TOTAL finalized the acquisition of a 20% interest in the Yamal LNG project and has become Novatek’s partner in this project. After the all-cash tender of $23.25 per share launched on April 28, 2011 and completed on June 21, 2011, TOTAL has acquired a 60% stake in SunPower Corp., a U.S. company listed on Nasdaq with headquarters in San Jose (California), one of the most established players in the American solar industry. Shares of SunPower Corp. continue to be traded on the Nasdaq. The acquisition cost, whose cash payment occurred on June 21, 2011, amounts to€974 million ($1,394 million). In accordance with revised IFRS 3, TOTAL is currently assessing the fair value of identifiable acquired assets, liabilities and contingent liabilities. Based on available information, provisional fair value of net assets acquired at 100% amounts to $1,512 million. Given the estimated fair value of instruments that are likely to confer rights to non-controlling interests, provisional goodwill amounts to $533 million. This goodwill must be allocated within twelve months from the acquisition date. Provisional allocation of the acquisition price and the amount of non-controlling interests at the acquisition date are as follows: | | | | | | | | | | (M$) | | Fair value at the
acquisition date | | | | | Intangible assets | | | 465 | | | | | | Tangible assets | | | 589 | | | | | | Accounts receivable, net | | | 396 | | | | | | Other current assets | | | 223 | | | | | | Other capital employed | | | 292 | | | | | | Net debt | | | (453 | ) | | | | | Net assets of SunPower (100%) as of June 21, 2011 | | | 1,512 | | | | | | Share attributable at 100% to non-controlling interests | | | (76 | ) | | | | | Net assets of SunPower (100%) as of June 21, 2011 to share | | | 1,436 | | | | | | Group share 60% | | | | | | | 861 | | Goodwill | | | | | | | 533 | | Acquisition cost of SunPower’s shares | | | | | | | 1,394 | | Non-controlling interests (40%) | | | | | | | 575 | | Reinclusion of the share attributable at 100% to non-controlling interests | | | | | | | 76 | | Non-controlling interests as of June 21, 2011 | | | | | | | 651 | |
Since the acquisition date, sales and net income Group share (before impairment of goodwill) realized by SunPower amount respectively to $1,447 million and $(56) million. The goodwill arising from the acquisition of SunPower has been impaired in 2011 (see Note 4E to the Consolidated Financial Statements). Acquisition-related costs recognized in the statement of income for the period amount to€9 million. As part of the transaction, various agreements were signed, including a financial guarantee agreement through which TOTAL guarantees up to $1 billion SunPower’s repayments obligations under letters of credit that would be issued during the next five years for the development of solar power plants and large roofs activities. Furthermore, SunPower’s off-balance sheet commitments and contractual obligations are now included in TOTAL’s notes to the Consolidated Financial Statements (see Note 23 to the Consolidated Financial Statements). TOTAL finalized in July 2011 the sale of 10% of its interest in the Colombian pipeline OCENSA. The Group still holds a 5.2% interest in this asset. TOTAL finalized in September 2011 the acquisition of Esso Italiana’s interests respectively in the Gorgoglione concession (25% interest), which contains the Tempa Rossa field, and in two exploration licenses located in the same area (51.7% for each one). The acquisition increases TOTAL’s interest in the operated Tempa Rossa field to 75%. TOTAL finalized in December 2011 the sale to Silex Gas Norway AS, a wholly owned subsidiary of Allianz, of its entire stake in Gassled (6.4%) and related entities for an amount of€477 million (NOK 3.7 billion). Total E&P USA Inc. signed in December 2011 an agreement to enter into a Joint Venture with Chesapeake Exploration L.L.C., a subsidiary of Chesapeake Energy Corporation, and its partner EnerVest Ltd. Under the terms of this agreement, TOTAL acquired a 25% share in Chesapeake’s and EnerVest’s liquids-rich area of the Utica shale play. TOTAL paid to Chesapeake and EnerVest€500 million ($696 million) in cash for the acquisition of these assets. TOTAL will also be committed to pay additional amounts up to $1.63 billion over a maximum period of 7 years in the form of a 60% carry of Chesapeake and EnerVest’s future capital expenditures on drilling and completion of wells within the Joint Venture. Furthermore, TOTAL will also acquire a 25% share in any new acreage which will be acquired by Chesapeake in the liquids-rich area of the Utica shale play. TOTAL and International Petroleum Investment Company (a company wholly-owned by the Government of Abu Dhabi) entered into an agreement on February 15, 2011 for the sale, to International Petroleum Investment Company (IPIC), of the 48.83% equity interest held by TOTAL in the share capital of CEPSA, to be completed within the framework of a public tender | | offer being launched by IPIC for all the CEPSA shares not yet held by IPIC, at a unit purchase price of€28 per CEPSA share. TOTAL sold to IPIC all of its equity interest in CEPSA and received, as of July 29, 2011, an amount of€3,659 million. |
TOTAL finalized in October 2011 the sale of most of its Marketing assets in the United Kingdom, the Channel Islands and the Isle of Man, to Rontec Investments LLP, a consortium led by Snax 24, one of the leading independent forecourt operators in the United Kingdom, for an amount of€424 million (£368 million). TOTAL finalized in July 2011 the sale of its photocure and coatings resins businesses to Arkema for an amount of€520 million, net of cash sold. 2010 Total E&P Canada Ltd., a TOTAL subsidiary, signed in July 2010 an agreement with UTS Energy Corporation (UTS) to acquire UTS Corporation with its main asset, a 20% interest in the Fort Hills mining project in the Athabasca region of the Canadian province of Alberta. TheTotal E&P Canada completed on September 30, 2010 the acquisition cost, net of all UTS shares for a cash amount of 3.08 Canadian dollars per share. Taking into account the cash held by UTS and acquired (161 Mby TOTAL (€)232 million), the cost of the acquisition for all sharesTOTAL amounted to 352 M€.862 million. This cost essentially representsamount mainly represented the value of the company’s mineral interests that have been recognized as “Intangible assets, net” on the face of the Consolidated Balance Sheet for 221 M€.
Synenco Energy Inc. is fully consolidated in TOTAL’s Consolidated Financial Statements. Its contribution to the consolidated net income for fiscal year 2008 is not material.
In August, TOTAL acquired the Dutch company Goal Petroleum B.V. The acquisition cost amounted to 349 M€. This cost essentially represents the value of the company’s mineral interests that have been recognized as intangible assets on the face of the Consolidated Balance Sheet for 292 M€.
Goal Petroleum B.V. is fully consolidated in TOTAL’s Consolidated Financial Statements. Its contribution to the consolidated net incomebalance sheet for fiscal year 2008 is not material.€646 million and the value of tangible assets that have been recognized in the consolidated balance sheet for€217 million.
PursuantTOTAL completed in September 2010 an agreement for the sale to BP and Hess of its interests in the agreementsValhall (15.72%) and Hod (25%) fields, in the Norwegian North Sea, for an amount of€800 million.
TOTAL signed between the partners in November, the Group’sSeptember 2010 an agreement with Santos and Petronas to acquire a 20% interest in the Kashagan field decreased from 18.52%GLNG project in Australia. Upon completion of this transaction finalised in October 2010, the project brought together Santos (45%, operator), Petronas (35%) and TOTAL (20%). The acquisition cost amounted to 16.81% (see Note 32€566 million and it mainly represented the value of mineral interests that have been recognized as intangible assets in the consolidated balance sheet for€617 million. In addition, TOTAL announced in December 2010 the signature of an agreement to acquire an additional 7.5% interest in this project. TOTAL sold in December 2010 its 5% interest in Block 31, located in the Angolan ultra deep offshore, to the company China Sonangol International Holding Limited. | • | | TOTAL and ERG announced in January 2010 that they signed an agreement to create a joint venture, named TotalErg, by contribution of the major part of their activities in the refining and marketing business in Italy. TotalErg has been operational since October 1st, 2010. The shareholder pact calls for joint governance as well as operating independence for the new entity. TOTAL’s interest in TotalErg is 49% and is accounted for by the equity method (see Note 12 to the Consolidated Financial Statements). |
TOTAL closed on April 1, 2010 the sale of its consumer specialty chemicals business, Mapa Spontex, to U.S.-based Jarden Corporation for an enterprise value of€335 million. On March 24, 2010, TOTAL S.A. filed a public tender offer followed by a squeeze out with the French Autorité des Marchés Financiers (AMF) in order to buy the 1,468,725 Elf Aquitaine shares that it did not already hold, representing 0.52% of Elf Aquitaine’s share capital and 0.27% of its voting rights, at a price of€305 per share (including the remaining 2009 dividend). On April 13, 2010, the French Autorité des marchés financiers (AMF) issued its clearance decision for this offer. The public tender offer was open from April 16 to April 29, 2010 inclusive. The Elf Aquitaine shares targeted by the offer which were not tendered to the offer have been transferred to TOTAL S.A. under the squeeze out upon payment to the shareholders equal to the offer price on the first trading day after the offer closing date, i.e. on April 30, 2010. On April 30, 2010, TOTAL S.A. announced that, following the squeeze out, it held 100% of Elf Aquitaine shares, with the transaction amounting to€450 million. In application of revised standard IAS 27 “Consolidated and Separate Financial Statements”, effective for annual periods beginning on or after January 1, 2010, transactions with non-controlling interests are accounted for as equity transactions, i.e. in consolidated shareholder’s equity. As a consequence, following the squeeze out of the Elf Aquitaine shares by TOTAL S.A., the difference between the consideration paid and the book value of non-controlling interests acquired was recognized directly as a decrease in equity. During 2010, TOTAL progressively sold 1.88% of Sanofi’s share capital, thus reducing its interest to 5.51%. As from July 1, 2010, given its reduced representation on the Board of Directors and the decrease in the percentage of voting rights, TOTAL ceased to have a significant influence over Sanofi-Aventis and no longer consolidated this investment under the equity method. The investment in Sanofi is accounted for as a financial asset available for sale in the line “Other investments” of the consolidated balance sheet at its fair value, i.e. at the stock price. Net income as of December 31, 2010 included a€135 million gain relating to this change in the accounting treatment. 2009 In December 2009, TOTAL signed an agreement with Chesapeake Energy Corporation whereby TOTAL acquired a 25% share in Chesapeake’s Barnett shale gas portfolio located in the United States (State of Texas). The acquisition cost of these assets amounted to€1,562 million and it represented the value of mineral interests that have been recognized as intangible assets in the consolidated balance sheet for€1,449 million and the value of tangible assets that have been recognized in the consolidated balance sheet for€113 million. As no cash payment has occurred in 2009, a corresponding debt has been recognized | | in the sections “Provisions and other non-current liabilities” and “Other creditors and accrued liabilities” for€818 million and€744 million respectively. |
During 2008,2009, TOTAL progressively sold 1.68%3.99% of Sanofi-Aventis’ share capital, thus reducing its interest to 11.38%7.39%. Sanofi-Aventis is accounted for by the equity method in TOTAL’s Consolidated Financial Statements.Statements for the year ended December 31, 2009. 2007
The changes in TOTAL’s activities in Venezuela and their consequences in the Consolidated Financial Statements are presented in Note 32 “Other risks and contingent liabilities”.
In December 2007, TOTAL completed the sale of its 70% interest in the Milford Haven Refinery in Wales (UK) to its partner Murco Petroleum Company. This operation will allow TOTAL to concentrate its UK refining operations at the wholly-owned Lindsey Oil Refinery.
During the fourth quarter 2007, TOTAL progressively sold 0.4% of Sanofi-Aventis’ share capital, thus reducing its interest to 13.06%. Sanofi-Aventis is accounted for by the equity method in TOTAL’s Consolidated Financial Statements.
2006
After approval on October 13, 2006 by the European Commission, Banco Santander Central Hispano (Santander) sold 4.35% of CEPSA’s share
| capital to TOTAL at a price of€4.54 per share, for a total transaction amount of approximately 53 M€. The transaction follows the agreement signed on August 2, 2006 by TOTAL and Santander to implement the provisions of the partial award rendered on March 24, 2006 by the Netherlands Arbitration Institute, which adjudicated the dispute concerning CEPSA.
|
As a result, TOTAL now holds 48.83% of CEPSA.
In 2004, TOTAL announced a reorganization of its Chemicals segment to regroup its chlorochemicals, intermediates and performance polymers in a new entity that was named Arkema on October 1, 2004.
The shareholders’ meeting on May 12, 2006 approved a resolution related to the spin-off of Arkema and the distribution of Arkema shares to TOTAL shareholders. Pursuant to this approval, Arkema shares were publicly listed on May 18, 2006 on the Eurolist by Euronext market in Paris. For all periods presented, the contribution of Arkema entities to the consolidated net income is presented on the line “Net income from discontinued operations” on the face of the statement of income. Detailed information on the impact of this transaction is presented in Note 34 to the Consolidated Financial Statements.
4)BUSINESS SEGMENT INFORMATION Financial information by business segment is reported in accordance with the internal reporting system and shows internal segment information that is used to manage and measure the performance of TOTAL. The Group’s activities are conducted through three business segments: Upstream, Downstream and Chemicals. the Upstream segment includes the activities of the Exploration & Production division and the Gas & Power division; the Downstream segment includes activities of the Refining & Marketing division and the Trading & Shipping division; and the Chemicals segment includes Base Chemicals and Specialties. The Corporate segment includes the operating and financial activities of the holding companies as well as healthcare activity (Sanofi-Aventis)(including the investment in Sanofi). The operational profit and assets are broken down by business segment prior to the consolidation and inter-segment adjustments. Sales prices between business segments approximate market prices. Furthermore, the Group announced in October 2011 a plan of reorganization of its business segments Downstream and Chemicals. The consultation and notification process towards employee representatives is finished and this reorganization became effective as of January 1st, 2012. A) INFORMATION BY BUSINESS SEGMENTThis plan changed the organization through the creation of:
| | | | | | | | | | | | | | | | | | | For the year ended December 31, 2008 (M€) | | Upstream | | | Downstream | | | Chemicals | | | Corporate | | | Intercompany | | | Total | | Non-Group sales | | 24,256 | | | 135,524 | | | 20,150 | | | 46 | | | — | | | 179,976 | | Intersegment sales | | 25,132 | | | 5,574 | | | 1,252 | | | 120 | | | (32,078 | ) | | — | | Excise taxes | | — | | | (19,645 | ) | | — | | | — | | | — | | | (19,645 | ) | Revenues from sales | | 49,388 | | | 121,453 | | | 21,402 | | | 166 | | | (32,078 | ) | | 160,331 | | Operating expenses | | (21,915 | ) | | (119,425 | ) | | (20,942 | ) | | (685 | ) | | 32,078 | | | (130,889 | ) | Depreciation, depletion and amortization of tangible assets and mineral interests | | (4,005 | ) | | (1,202 | ) | | (518 | ) | | (30 | ) | | — | | | (5,755 | ) | Operating income | | 23,468 | | | 826 | | | (58 | ) | | (549 | ) | | — | | | 23,687 | | Equity in income (loss) of affiliates and other items | | 1,541 | | | (158 | ) | | (34 | ) | | 590 | | | — | | | 1,939 | | Tax on net operating income | | (14,563 | ) | | (143 | ) | | 76 | | | 315 | | | — | | | (14,315 | ) | Net operating income | | 10,446 | | | 525 | | | (16 | ) | | 356 | | | — | | | 11,311 | | Net cost of net debt | | | | | | | | | | | | | | | | | (358 | ) | Minority interests | | | | | | | | | | | | | | | | | (363 | ) | Net income from continuing operations | | | | | | | | | | | | | | | | | 10,590 | | Net income from discontinued operations | | | | | | | | | | | | | | | | | — | | Net income | | | | | | | | | | | | | | | | | 10,590 | |
a Refining & Chemicals segment that is a major production hub combining TOTAL’s refining, petrochemicals, fertilizers and specialty chemicals operations. This segment also includes Trading & Shipping activities ; | | | | | | | | | | | | | | | | | | For the year ended December 31, 2008
(adjustments)(a) (M€) | | Upstream | | | Downstream | | | Chemicals | | | Corporate | | | Intercompany | | Total | | Non-Group sales | | | | | | | | | | | | | | | | | | Intersegment sales | | | | | | | | | | | | | | | | | | Excise taxes | | | | | | | | | | | | | | | | | | Revenues from sales | | | | | | | | | | | | | | | | | | Operating expenses | | — | | | (2,776 | ) | | (925 | ) | | — | | | | | (3,701 | ) | Depreciation, depletion and amortization of tangible assets and mineral interests | | (171 | ) | | — | | | (6 | ) | | — | | | | | (177 | ) | Operating income(b) | | (171 | ) | | (2,776 | ) | | (931 | ) | | — | | | | | (3,878 | ) | Equity in income (loss) of affiliates and other items(c) | | (164 | ) | | (195 | ) | | (82 | ) | | (345 | ) | | | | (786 | ) | Tax on net operating income | | 57 | | | 927 | | | 329 | | | (2 | ) | | | | 1,311 | | Net operating income(b) | | (278 | ) | | (2,044 | ) | | (684 | ) | | (347 | ) | | | | (3,353 | ) | Net cost of net debt | | | | | | | | | | | | | | | | — | | Minority interests | | | | | | | | | | | | | | | | 23 | | Net income from continuing operations | | | | | | | | | | | | | | | | (3,330 | ) | Net income from discontinued operations | | | | | | | | | | | | | | | | — | | Net income | | | | | | | | | | | | | | | | (3,330 | ) |
a Supply & Marketing segment that is dedicated to the global supply and marketing of petroleum products. | A) | | INFORMATION BY BUSINESS SEGMENT |
| | | | | | | | | | | | | | | | | | | | | | | | | For the year ended December 31, 2011
(M€) | | Upstream | | | Downstream | | | Chemicals | | | Corporate | | | Intercompany | | | Total | | Non-Group sales | | | 23,298 | | | | 141,907 | | | | 19,477 | | | | 11 | | | | — | | | | 184,693 | | Intersegment sales | | | 27,301 | | | | 5,983 | | | | 1,234 | | | | 185 | | | | (34,703 | ) | | | — | | Excise taxes | | | — | | | | (18,143 | ) | | | — | | | | — | | | | — | | | | (18,143 | ) | Revenues from sales | | | 50,599 | | | | 129,747 | | | | 20,711 | | | | 196 | | | | (34,703 | ) | | | 166,550 | | Operating expenses | | | (23,079 | ) | | | (126,145 | ) | | | (19,566 | ) | | | (667 | ) | | | 34,703 | | | | (134,754 | ) | Depreciation, depletion and amortization of tangible assets and mineral interests | | | (5,076 | ) | | | (1,908 | ) | | | (487 | ) | | | (35 | ) | | | — | | | | (7,506 | ) | Operating income | | | 22,444 | | | | 1,694 | | | | 658 | | | | (506 | ) | | | — | | | | 24,290 | | Equity in income (loss) of affiliates and other items | | | 1,596 | | | | 401 | | | | 471 | | | | 336 | | | | — | | | | 2,804 | | Tax on net operating income | | | (13,506 | ) | | | (409 | ) | | | (225 | ) | | | (38 | ) | | | — | | | | (14,178 | ) | Net operating income | | | 10,534 | | | | 1,686 | | | | 904 | | | | (208 | ) | | | — | | | | 12,916 | | Net cost of net debt | | | | | | | | | | | | | | | | | | | | | | | (335 | ) | Non-controlling interests | | | | | | | | | | | | | | | | | | | | | | | (305 | ) | Net income | | | | | | | | | | | | | | | | | | | | | | | 12,276 | |
| | | | | | | | | | | | | | | | | | | | | | | | | For the year ended December 31, 2011
(adjustments(a)) (M€) | | Upstream | | | Downstream | | | Chemicals | | | Corporate | | | Intercompany | | | Total | | Non-Group sales | | | 45 | | | | | | | | | | | | | | | | | | | | 45 | | Intersegment sales | | | | | | | | | | | | | | | | | | | | | | | — | | Excise taxes | | | | | | | | | | | | | | | | | | | | | | | — | | Revenues from sales | | | 45 | | | | | | | | | | | | | | | | | | | | 45 | | Operating expenses | | | — | | | | 1,156 | | | | (33 | ) | | | — | | | | | | | | 1,123 | | Depreciation, depletion and amortization of tangible assets and mineral interests | | | (75 | ) | | | (700 | ) | | | (6 | ) | | | — | | | | | | | | (781 | ) | Operating income(b) | | | (30 | ) | | | 456 | | | | (39 | ) | | | — | | | | — | | | | 387 | | Equity in income (loss) of affiliates and other items | | | 191 | | | | 256 | | | | 209 | | | | 90 | | | | | | | | 746 | | Tax on net operating income | | | (32 | ) | | | (109 | ) | | | (41 | ) | | | (80 | ) | | | | | | | (262 | ) | Net operating income(b) | | | 129 | | | | 603 | | | | 129 | | | | 10 | | | | | | | | 871 | | Net cost of net debt | | | | | | | | | | | | | | | | | | | | | | | — | | Non-controlling interests | | | | | | | | | | | | | | | | | | | | | | | (19 | ) | Net income | | | | | | | | | | | | | | | | | | | | | | | 852 | |
| (a) | adjustmentsAdjustments include special items, inventory valuation effect and, equity shareas from January 1st, 2011, the effect of amortization of intangible assets related to the Sanofi-Aventis merger.changes in fair value. |
| | | | | | | | | | | | | | | | (b) Of which inventory valuation effect | | | | | | | | | | | | | | | | On operating income
| | — | | (2,776 | ) | | (727 | ) | | — | | | | | | On net operating income
| | — | | (1,971 | ) | | (504 | ) | | — | | | | | | (c) Of which equity share of amortization of intangible assets related to the Sanofi-Aventis merger.
| | — | | — | | | — | | | (393 | ) | | | | |
| | | | | | | | | | | | | | | | | | | For the year ended December 31, 2008 (adjusted) (M€) | | Upstream | | | Downstream | | | Chemicals | | | Corporate | | | Intercompany | | | Total | | Non-Group sales | | 24,256 | | | 135,524 | | | 20,150 | | | 46 | | | — | | | 179,976 | | Intersegment sales | | 25,132 | | | 5,574 | | | 1,252 | | | 120 | | | (32,078 | ) | | — | | Excise taxes | | — | | | (19,645 | ) | | — | | | — | | | — | | | (19,645 | ) | Revenues from sales | | 49,388 | | | 121,453 | | | 21,402 | | | 166 | | | (32,078 | ) | | 160,331 | | Operating expenses | | (21,915 | ) | | (116,649 | ) | | (20,017 | ) | | (685 | ) | | 32,078 | | | (127,188 | ) | Depreciation, depletion and amortization of tangible assets and mineral interests | | (3,834 | ) | | (1,202 | ) | | (512 | ) | | (30 | ) | | — | | | (5,578 | ) | Adjusted operating income | | 23,639 | | | 3,602 | | | 873 | | | (549 | ) | | — | | | 27,565 | | Equity in income (loss) of affiliates and other items | | 1,705 | | | 37 | | | 48 | | | 935 | | | — | | | 2,725 | | Tax on net operating income | | (14,620 | ) | | (1,070 | ) | | (253 | ) | | 317 | | | — | | | (15,626 | ) | Adjusted net operating income | | 10,724 | | | 2,569 | | | 668 | | | 703 | | | — | | | 14,664 | | Net cost of net debt | | | | | | | | | | | | | | | | | (358 | ) | Minority interests | | | | | | | | | | | | | | | | | (386 | ) | Adjusted net income from continuing operations | | | | | | | | | | | | | | | | | 13,920 | | Adjusted net income from discontinued operations | | | | | | | | | | | | | | | | | — | | Adjusted net income | | | | | | | | | | | | | | | | | 13,920 | |
| | | | | | | | | | | | | | | | | | | For the year ended December 31, 2008(M€) | | Upstream | | | Downstream | | | Chemicals | | | Corporate | | | Intercompany | | Total | | Total expenditures | | 10,017 | | | 2,418 | | | 1,074 | | | 131 | | | | | 13,640 | | Total divestments | | 1,130 | | | 216 | | | 53 | | | 1,186 | | | | | 2,585 | | Cash flow from operating activities | | 13,765 | | | 3,111 | | | 920 | | | 873 | | | | | 18,669 | | Balance sheet as of December 31, 2008 | | | | | | | | | | | | | | | | | | Property, plant and equipment, intangible assets, net | | 37,090 | | | 8,823 | | | 5,323 | | | 247 | | | | | 51,483 | | Investments in equity affiliates | | 3,892 | | | 1,958 | | | 677 | | | 6,134 | | | | | 12,661 | | Loans to equity affiliates and other non-current assets | | 3,739 | | | 1,170 | | | 762 | | | 545 | | | | | 6,216 | | Working capital | | 570 | | | 5,317 | | | 2,348 | | | (132 | ) | | | | 8,103 | | Provisions and other non-current liabilities | | (12,610 | ) | | (2,191 | ) | | (1,903 | ) | | (1,138 | ) | | | | (17,842 | ) | Capital Employed (balance sheet) | | 32,681 | | | 15,077 | | | 7,207 | | | 5,656 | | | | | 60,621 | | Less inventory valuation effect | | — | | | (1,454 | ) | | (46 | ) | | 387 | | | | | (1,113 | ) | Capital Employed (Business
segment information) | | 32,681 | | | 13,623 | | | 7,161 | | | 6,043 | | | | | 59,508 | | ROACE as a percentage
(of continuing operations) | | 36 | % | | 20 | % | | 9 | % | | | | | | | 26 | % |
| | | | | | | | | | | | | | | | | | | For the year ended December 31, 2007
(M€) | | Upstream | | | Downstream | | | Chemicals | | | Corporate | | | Intercompany | | | Total | | Non-Group sales | | 19,706 | | | 119,212 | | | 19,805 | | | 29 | | | — | | | 158,752 | | Intersegment sales | | 21,173 | | | 5,125 | | | 1,190 | | | 181 | | | (27,669 | ) | | — | | Excise taxes | | — | | | (21,928 | ) | | — | | | — | | | — | | | (21,928 | ) | Revenues from sales | | 40,879 | | | 102,409 | | | 20,995 | | | 210 | | | (27,669 | ) | | 136,824 | | Operating expenses | | (17,697 | ) | | (96,367 | ) | | (19,076 | ) | | (627 | ) | | 27,669 | | | (106,098 | ) | Depreciation, depletion and amortization of tangible assets and mineral interests | | (3,679 | ) | | (1,218 | ) | | (495 | ) | | (33 | ) | | — | | | (5,425 | ) | Operating income | | 19,503 | | | 4,824 | | | 1,424 | | | (450 | ) | | — | | | 25,301 | | Equity in income (loss) of affiliates and other items | | 1,330 | | | 284 | | | (11 | ) | | 745 | | | — | | | 2,348 | | Tax on net operating income | | (11,996 | ) | | (1,482 | ) | | (426 | ) | | 128 | | | — | | | (13,776 | ) | Net operating income | | 8,837 | | | 3,626 | | | 987 | | | 423 | | | — | | | 13,873 | | Net cost of net debt | | | | | | | | | | | | | | | | | (338 | ) | Minority interests | | | | | | | | | | | | | | | | | (354 | ) | Net income from continuing operations | | | | | | | | | | | | | | | | | 13,181 | | Net income from discontinued operations | | | | | | | | | | | | | | | | | — | | Net income | | | | | | | | | | | | | | | | | 13,181 | |
| | | | | | | | | | | | | | | | | | For the year ended December 31, 2007
(M€) (adjustments)(a) | | Upstream | | | Downstream | | | Chemicals | | | Corporate | | | Intercompany | | Total | | Non-Group sales | | | | | | | | | | | | | | | | | | Intersegment sales | | | | | | | | | | | | | | | | | | Excise taxes | | | | | | | | | | | | | | | | | | Revenues from sales | | | | | | | | | | | | | | | | | | Operating expenses | | (11 | ) | | 1,580 | | | 273 | | | — | | | | | 1,842 | | Depreciation, depletion and amortization of tangible assets and mineral interests | | — | | | (43 | ) | | (4 | ) | | — | | | | | (47 | ) | Operating income(b) | | (11 | ) | | 1,537 | | | 269 | | | — | | | | | 1,795 | | Equity in income (loss) of affiliates and other items(c) | | (4 | ) | | 24 | | | (54 | ) | | (225 | ) | | | | (259 | ) | Tax on net operating income | | 3 | | | (470 | ) | | (75 | ) | | (2 | ) | | | | (544 | ) | Net operating income(b) | | (12 | ) | | 1,091 | | | 140 | | | (227 | ) | | | | 992 | | Net cost of net debt | | | | | | | | | | | | | | | | — | | Minority interests | | | | | | | | | | | | | | | | (14 | ) | Net income from continuing operations | | | | | | | | | | | | | | | | 978 | | Net income from discontinued operations | | | | | | | | | | | | | | | | — | | Net income | | | | | | | | | | | | | | | | 978 | |
(a) | adjustments include special items, inventory valuation effect and equity share of amortization of intangible assets related to the Sanofi-Aventis merger. |
| | | | | | | | | | | | | | (b) Of which inventory valuation effect
| | | | | | | | | | | | | | on operating income
| �� | — | | 1,529 | | 301 | | — | | | | | | on net operating income
| | — | | 1,098 | | 201 | | — | | | | | | (c) Of which equity share of amortization of intangible
assets related to the Sanofi-Aventis merger.
| | — | | — | | — | | (318 | ) | | | | |
| | | | | | | | | | | | | | | | | | | For the year ended December 31, 2007
(adjusted)(M€) | | Upstream | | | Downstream | | | Chemicals | | | Corporate | | | Intercompany | | | Total | | Non-Group sales | | 19,706 | | | 119,212 | | | 19,805 | | | 29 | | | — | | | 158,752 | | Intersegment sales | | 21,173 | | | 5,125 | | | 1,190 | | | 181 | | | (27,669 | ) | | — | | Excise taxes | | — | | | (21,928 | ) | | — | | | — | | | — | | | (21,928 | ) | Revenues from sales | | 40,879 | | | 102,409 | | | 20,995 | | | 210 | | | (27,669 | ) | | 136,824 | | Operating expenses | | (17,686 | ) | | (97,947 | ) | | (19,349 | ) | | (627 | ) | | 27,669 | | | (107,940 | ) | Depreciation, depletion and amortization of tangible assets and mineral interests | | (3,679 | ) | | (1,175 | ) | | (491 | ) | | (33 | ) | | — | | | (5,378 | ) | Adjusted operating income | | 19,514 | | | 3,287 | | | 1,155 | | | (450 | ) | | — | | | 23,506 | | Equity in income (loss) of affiliates and other items | | 1,334 | | | 260 | | | 43 | | | 970 | | | — | | | 2,607 | | Tax on net operating income | | (11,999 | ) | | (1,012 | ) | | (351 | ) | | 130 | | | — | | | (13,232 | ) | Adjusted net operating income | | 8,849 | | | 2,535 | | | 847 | | | 650 | | | — | | | 12,881 | | Net cost of net debt | | | | | | | | | | | | | | | | | (338 | ) | Minority interests | | | | | | | | | | | | | | | | | (340 | ) | Adjusted net income from continuing operations | | | | | | | | | | | | | | | | | 12,203 | | Adjusted net income from discontinued operations | | | | | | | | | | | | | | | | | — | | Adjusted net income | | | | | | | | | | | | | | | | | 12,203 | |
| | | | | | | | | | | | | | | | | | For the year ended December 31, 2007
(M€) | | Upstream | | | Downstream | | | Chemicals | | | Corporate | | | Intercompany | | Total | | Capital expenditures | | 8,882 | | | 1,875 | | | 911 | | | 54 | | | | | 11,722 | | Divestments at selling price | | 751 | | | 394 | | | 83 | | | 328 | | | | | 1,556 | | Cash flow from operating activities | | 12,692 | | | 4,148 | | | 1,096 | | | (250 | ) | | | | 17,686 | | Balance sheet as of December 31,
2007 | | | | | | | | | | | | | | | | | | Property, plant and equipment, intangible assets, net | | 32,535 | | | 8,308 | | | 5,061 | | | 213 | | | | | 46,117 | | Investments in equity affiliates | | 3,021 | | | 2,105 | | | 728 | | | 6,851 | | | | | 12,705 | | Loans to equity affiliates and other non-current assets | | 3,748 | | | 1,183 | | | 456 | | | 634 | | | | | 6,021 | | Working capital | | (94 | ) | | 6,811 | | | 2,774 | | | 506 | | | | | 9,997 | | Provisions and other non-current liabilities | | (12,147 | ) | | (2,018 | ) | | (1,697 | ) | | (1,441 | ) | | | | (17,303 | ) | Capital Employed (balance sheet) | | 27,063 | | | 16,389 | | | 7,322 | | | 6,763 | | | | | 57,537 | | Less inventory valuation effect | | — | | | (4,198 | ) | | (424 | ) | | 1,112 | | | | | (3,510 | ) | Capital Employed (Business segment information) | | 27,063 | | | 12,191 | | | 6,898 | | | 7,875 | | | | | 54,027 | | ROACE as a percentage (of continuing operations) | | 34% | | | 21% | | | 12% | | | | | | | | 24% | |
| | | | | | | | | | | | | | | | | | | For the year ended December 31, 2006
(M€) | | Upstream | | | Downstream | | | Chemicals | | | Corporate | | | Intercompany | | | Total | | Non-Group sales | | 20,782 | | | 113,887 | | | 19,113 | | | 20 | | | — | | | 153,802 | | Intersegment sales | | 20,603 | | | 4,927 | | | 1,169 | | | 177 | | | (26,876 | ) | | — | | Excise taxes | | — | | | (21,113 | ) | | — | | | — | | | — | | | (21,113 | ) | Revenues from sales | | 41,385 | | | 97,701 | | | 20,282 | | | 197 | | | (26,876 | ) | | 132,689 | | Operating expenses | | (17,759 | ) | | (93,209 | ) | | (18,706 | ) | | (706 | ) | | 26,876 | | | (103,504 | ) | Depreciation, depletion and amortization of tangible assets and mineral interests | | (3,319 | ) | | (1,120 | ) | | (580 | ) | | (36 | ) | | — | | | (5,055 | ) | Operating income | | 20,307 | | | 3,372 | | | 996 | | | (545 | ) | | — | | | 24,130 | | Equity in income (loss) of affiliates and other items | | 1,211 | | | 384 | | | (298 | ) | | 797 | | | — | | | 2,094 | | Tax on net operating income | | (12,764 | ) | | (1,125 | ) | | (191 | ) | | 206 | | | — | | | (13,874 | ) | Net operating income | | 8,754 | | | 2,631 | | | 507 | | | 458 | | | — | | | 12,350 | | Net cost of net debt | | | | | | | | | | | | | | | | | (210 | ) | Minority interests | | | | | | | | | | | | | | | | | (367 | ) | Net income from continuing operations | | | | | | | | | | | | | | | | | 11,773 | | Net income from discontinued operations | | | | | | | | | | | | | | | | | (5 | ) | Net income | | | 11,768 | |
| | | | | | | | | | | | | | | | | | For the year ended December 31, 2006
(adjustments)(a) (M€) | | Upstream | | | Downstream | | | Chemicals | | | Corporate | | | Intercompany | | Total | | | | | | | | | | | | | | | | Non-Group sales | | | | | | | | | | | | | | | | | | Intersegment sales | | | | | | | | | | | | | | | | | | Excise taxes | | | | | | | | | | | | | | | | | | Revenues from sales | | | | | | | | | | | | | | | | | | Operating expenses | | — | | | (272 | ) | | (158 | ) | | (27 | ) | | | | (457 | ) | Depreciation, depletion and amortization of tangible assets and mineral interests | | — | | | — | | | (61 | ) | | — | | | | | (61 | ) | Operating income(b) | | — | | | (272 | ) | | (219 | ) | | (27 | ) | | | | (518 | ) | Equity in income (loss) of affiliates and other items(c) | | 195 | | | 178 | | | (327 | ) | | (295 | ) | | | | (249 | ) | Tax on net operating income | | (150 | ) | | (59 | ) | | 169 | | | (5 | ) | | | | (45 | ) | Net operating income(b) | | 45 | | | (153 | ) | | (377 | ) | | (327 | ) | | | | (812 | ) | Net cost of net debt | | — | | Minority interests | | 14 | | Net income from continuing operations | | (798 | ) | Net income from discontinued operations | | (19 | ) | Net income | | (817 | ) |
(a) | adjustments include special items, inventory valuation effect and equity share of amortization of intangible assets related to the Sanofi-Aventis merger. |
| | | | | | | | | | | | | | | | (b) Of which inventory valuation effect | | | Upstream | | | | | | Downstream | | | | Chemicals | | | | Corporate | | | | | | On on operating income
| | — | | (272 | )— | | | (42 | )1,224 | | | | (9 | ) | | | — | | | | | | On on net operating income
| | — | | (327 | )— | | | (28 | )859 | | | | 10 | | | | — | | | | | |
| | | | | | | | | | | | | | | | | | | | | | | | | For the year ended December 31, 2011
(adjusted) (M€) (a) | | Upstream | | | Downstream | | | Chemicals | | | Corporate | | | Intercompany | | | Total | | Non-Group sales | | | 23,253 | | | | 141,907 | | | | 19,477 | | | | 11 | | | | — | | | | 184,648 | | Intersegment sales | | | 27,301 | | | | 5,983 | | | | 1,234 | | | | 185 | | | | (34,703 | ) | | | — | | Excise taxes | | | — | | | | (18,143 | ) | | | — | | | | — | | | | — | | | | (18,143 | ) | Revenues from sales | | | 50,554 | | | | 129,747 | | | | 20,711 | | | | 196 | | | | (34,703 | ) | | | 166,505 | | Operating expenses | | | (23,079 | ) | | | (127,301 | ) | | | (19,533 | ) | | | (667 | ) | | | 34,703 | | | | (135,877 | ) | Depreciation, depletion and amortization of tangible assets and mineral interests | | | (5,001 | ) | | | (1,208 | ) | | | (481 | ) | | | (35 | ) | | | — | | | | (6,725 | ) | Adjusted operating income | | | 22,474 | | | | 1,238 | | | | 697 | | | | (506 | ) | | | — | | | | 23,903 | | Equity in income (loss) of affiliates and other items | | | 1,405 | | | | 145 | | | | 262 | | | | 246 | | | | — | | | | 2,058 | | Tax on net operating income | | | (13,474 | ) | | | (300 | ) | | | (184 | ) | | | 42 | | | | — | | | | (13,916 | ) | Adjusted net operating income | | | 10,405 | | | | 1,083 | | | | 775 | | | | (218 | ) | | | — | | | | 12,045 | | Net cost of net debt | | | | | | | | | | | | | | | | | | | | | | | (335 | ) | Non-controlling interests | | | | | | | | | | | | | | | | | | | | | | | (286 | ) | Adjusted net income | | | | | | | | | | | | | | | | | | | | | | | 11,424 | | Adjusted fully-diluted earnings per share (€) | | | | | | | | | | | | | | | | | | | | | | | 5.06 | |
| (a) | Except for earnings per share |
| | | | | | | | | | | | | | | | | | | | | | | For the year ended December 31, 2011
(M€) | | Upstream | | | Downstream | | | Chemicals | | | Corporate | | | Intercompany | | Total | | Total expenditures | | | 21,689 | | | | 1,870 | | | | 847 | | | | 135 | | | | | | 24,541 | | Total divestments | | | 2,656 | | | | 3,235 | | | | 1,164 | | | | 1,523 | | | | | | 8,578 | | Cash flow from operating activities | | | 17,054 | | | | 2,165 | | | | 512 | | | | (195 | ) | | | | | 19,536 | | Balance sheet as of December 31, 2011 | | | | | | | | | | | | | | | | | | | | | | | Property, plant and equipment, intangible assets, net | | | 64,069 | | | | 7,918 | | | | 4,638 | | | | 245 | | | | | | 76,870 | | Investments in equity affiliates | | | 8,932 | | | | 699 | | | | 1,118 | | | | — | | | | | | 10,749 | | Loans to equity affiliates and other non-current assets | | | 4,793 | | | | 1,749 | | | | 1,144 | | | | 3,105 | | | | | | 10,791 | | Working capital | | | 1,240 | | | | 9,627 | | | | 2,585 | | | | (1,374 | ) | | | | | 12,078 | | Provisions and other non-current liabilities | | | (20,095 | ) | | | (2,577 | ) | | | (1,593 | ) | | | (1,136 | ) | | | | | (25,401 | ) | Assets and liabilities classified as held for sale | | | — | | | | — | | | | — | | | | — | | | | | | — | | Capital Employed (balance sheet) | | | 58,939 | | | | 17,416 | | | | 7,892 | | | | 840 | | | | | | 85,087 | | Less inventory valuation effect | | | — | | | | (3,615 | ) | | | (419 | ) | | | 13 | | | | | | (4,021 | ) | Capital Employed (Business segment information) | | | 58,939 | | | | 13,801 | | | | 7,473 | | | | 853 | | | | | | 81,066 | | ROACE as a percentage | | | 20% | | | | 7% | | | | 10% | | | | | | | | | | 16% | |
| | | | | | | | | | | | | | | | | | | | | | | | | For the year ended December 31, 2010
(M€) | | Upstream | | | Downstream | | | Chemicals | | | Corporate | | | Intercompany | | | Total | | Non-Group sales | | | 18,527 | | | | 123,245 | | | | 17,490 | | | | 7 | | | | — | | | | 159,269 | | Intersegment sales | | | 22,540 | | | | 4,693 | | | | 981 | | | | 186 | | | | (28,400 | ) | | | — | | Excise taxes | | | — | | | | (18,793 | ) | | | — | | | | — | | | | — | | | | (18,793 | ) | Revenues from sales | | | 41,067 | | | | 109,145 | | | | 18,471 | | | | 193 | | | | (28,400 | ) | | | 140,476 | | Operating expenses | | | (18,271 | ) | | | (105,660 | ) | | | (16,974 | ) | | | (665 | ) | | | 28,400 | | | | (113,170 | ) | Depreciation, depletion and amortization of tangible assets and mineral interests | | | (5,346 | ) | | | (2,503 | ) | | | (533 | ) | | | (39 | ) | | | — | | | | (8,421 | ) | Operating income | | | 17,450 | | | | 982 | | | | 964 | �� | | | (511 | ) | | | — | | | | 18,885 | | Equity in income (loss) of affiliates and other items | | | 1,533 | | | | 141 | | | | 215 | | | | 595 | | | | — | | | | 2,484 | | Tax on net operating income | | | (10,131 | ) | | | (201 | ) | | | (267 | ) | | | 263 | | | | — | | | | (10,336 | ) | Net operating income | | | 8,852 | | | | 922 | | | | 912 | | | | 347 | | | | — | | | | 11,033 | | Net cost of net debt | | | | | | | | | | | | | | | | | | | | | | | (226 | ) | Non-controlling interests | | | | | | | | | | | | | | | | | | | | | | | (236 | ) | Net income | | | | | | | | | | | | | | | | | | | | | | | 10,571 | |
| | | | | | | | | | | | | | | | | | | | | | | For the year ended December 31, 2010
(adjustments(a)) (M€) | | Upstream | | | Downstream | | | Chemicals | | | Corporate | | | Intercompany | | Total | | Non-Group sales | | | | | | | | | | | | | | | | | | | | | | | Intersegment sales | | | | | | | | | | | | | | | | | | | | | | | Excise taxes | | | | | | | | | | | | | | | | | | | | | | | Revenues from sales | | | | | | | | | | | | | | | | | | | | | | | Operating expenses | | | — | | | | 923 | | | | 92 | | | | — | | | | | | 1,015 | | Depreciation, depletion and amortization of tangible assets and mineral interests | | | (203 | ) | | | (1,192 | ) | | | (21 | ) | | | — | | | | | | (1,416 | ) | Operating income(b) | | | (203 | ) | | | (269 | ) | | | 71 | | | | — | | | | | | (401 | ) | Equity in income (loss) of affiliates and other items(c) | | | 183 | | | | (126 | ) | | | (16 | ) | | | 227 | | | | | | 268 | | Tax on net operating income | | | 275 | | | | 149 | | | | — | | | | (6 | ) | | | | | 418 | | Net operating income(b) | | | 255 | | | | (246 | ) | | | 55 | | | | 221 | | | | | | 285 | | Net cost of net debt | | | | | | | | | | | | | | | | | | | | | — | | Non-controlling interests | | | | | | | | | | | | | | | | | | | | | (2 | ) | Net income | | | | | | | | | | | | | | | | | | | | | 283 | |
| | | | | | | | | | | | | | | | | | | | | (a) Adjustments include special items, inventory valuation effect and, until June 30, 2010, equity share of adjustments related to Sanofi. | (b) Of which inventory valuation effect | | | Upstream | | | | Downstream | | | | Chemicals | | | | Corporate | | | | | | on operating income | | | — | | | | 863 | | | | 130 | | | | — | | | | | | on net operating income | | | — | | | | 640 | | | | 113 | | | | — | | | | | | (c) Of which equity share of amortization of intangible assetsadjustments related to the Sanofi-Aventis merger.Sanofi | | — | | — | | | | — | | | | — | | | | (31181 | ) | | | | |
| For the year ended December 31, 2006
(adjusted) (M€) | | Upstream | | Downstream | | Chemicals | | Corporate | | Intercompany | | Total | | | For the year ended December 31, 2010
(adjusted) (M€)(a) | | | Upstream | | Downstream | | Chemicals | | Corporate | | Intercompany | | Total | | Non-Group sales | | 20,782 | | | 113,887 | | | 19,113 | | | 20 | | | — | | | 153,802 | | | | 18,527 | | | | 123,245 | | | | 17,490 | | | | 7 | | | | — | | | | 159,269 | | Intersegment sales | | 20,603 | | | 4,927 | | | 1,169 | | | 177 | | | (26,876 | ) | | — | | | | 22,540 | | | | 4,693 | | | | 981 | | | | 186 | | | | (28,400 | ) | | | — | | Excise taxes | | — | | | (21,113 | ) | | — | | | — | | | — | | | (21,113 | ) | | | — | | | | (18,793 | ) | | | — | | | | — | | | | — | | | | (18,793 | ) | Revenues from sales | | 41,385 | | | 97,701 | | | 20,282 | | | 197 | | | (26,876 | ) | | 132,689 | | | | 41,067 | | | | 109,145 | | | | 18,471 | | | | 193 | | | | (28,400 | ) | | | 140,476 | | Operating expenses | | (17,759 | ) | | (92,937 | ) | | (18,548 | ) | | (679 | ) | | 26,876 | | | (103,047 | ) | | | (18,271 | ) | | | (106,583 | ) | | | (17,066 | ) | | | (665 | ) | | | 28,400 | | | | (114,185 | ) | Depreciation, depletion and amortization of tangible assets and mineral interests | | (3,319 | ) | | (1,120 | ) | | (519 | ) | | (36 | ) | | — | | | (4,994 | ) | | | (5,143 | ) | | | (1,311 | ) | | | (512 | ) | | | (39 | ) | | | — | | | | (7,005 | ) | Adjusted operating income | | 20,307 | | | 3,644 | | | 1,215 | | | (518 | ) | | — | | | 24,648 | | | | 17,653 | | | | 1,251 | | | | 893 | | | | (511 | ) | | | — | | | | 19,286 | | Equity in income (loss) of affiliates and other items | | 1,016 | | | 206 | | | 29 | | | 1,092 | | | — | | | 2,343 | | | | 1,350 | | | | 267 | | | | 231 | | | | 368 | | | | — | | | | 2,216 | | Tax on net operating income | | (12,614 | ) | | (1,066 | ) | | (360 | ) | | 211 | | | — | | | (13,829 | ) | | | (10,406 | ) | | | (350 | ) | | | (267 | ) | | | 269 | | | | — | | | | (10,754 | ) | Adjusted net operating income | | 8,709 | | | 2,784 | | | 884 | | | 785 | | | — | | | 13,162 | | | | 8,597 | | | | 1,168 | | | | 857 | | | | 126 | | | | — | | | | 10,748 | | Net cost of net debt | | | | | | | | | | | | (210 | ) | | | | | | | | | | | | | (226 | ) | Minority interests | | | | | | | | | | | | (381 | ) | | Adjusted net income from continuing operations | | | 12,571 | | | Adjusted net income from discontinued operations | | | | | | | | | | | | 14 | | | Non-controlling interests | | | | | (234 | ) | Adjusted net income | | | 12,585 | | | | | 10,288 | | Adjusted fully-diluted earnings per share (€) | | Adjusted fully-diluted earnings per share (€) | | | | 4.58 | |
| | | | | | | | | | | | | | | | | | For the year ended December 31, 2006
(M€) | | Upstream | | | Downstream | | | Chemicals | | | Corporate | | | Intercompany | | Total | | Capital expenditures | | 9,001 | | | 1,775 | | | 995 | | | 81 | | | | | 11,852 | | Divestments at selling price | | 1,458 | | | 428 | | | 128 | | | 264 | | | | | 2,278 | | Cash flow from operating activities | | 11,524 | | | 3,626 | | | 972 | | | (61 | ) | | | | 16,061 | | Balance sheet as of December 31,
2006 | | | | | | | | | | | | | | | | | | Property, plant and equipment, intangible assets, net | | 31,875 | | | 8,211 | | | 4,983 | | | 212 | | | | | 45,281 | | Investments in equity affiliates | | 2,153 | | | 1,922 | | | 713 | | | 7,010 | | | | | 11,798 | | Loans to equity affiliates and other non-current assets | | 2,744 | | | 1,065 | | | 477 | | | 585 | | | | | 4,871 | | Working capital | | 199 | | | 6,067 | | | 2,609 | | | (78 | ) | | | | 8,797 | | Provisions and other non-current liabilities | | (11,427 | ) | | (2,093 | ) | | (1,807 | ) | | (1,052 | ) | | | | (16,379 | ) | Capital Employed (balance sheet) | | 25,544 | | | 15,172 | | | 6,975 | | | 6,677 | | | | | 54,368 | | Less inventory valuation effect | | — | | | (2,789 | ) | | (231 | ) | | 738 | | | | | (2,282 | ) | Capital Employed (Business segment information) | | 25,544 | | | 12,383 | | | 6,744 | | | 7,415 | | | | | 52,086 | | ROACE as a percentage (of continuing operations) | | 35% | | | 23% | | | 13% | | | | | | | | 26% | |
B) RECONCILIATION BETWEEN BUSINESS SEGMENT INFORMATION AND THE CONSOLIDATED STATEMENT OF INCOME
The table below reconciles the information presented above with the Consolidated Statement of Income:
| (a) | Except for earnings per share |
| | | | | | | | | | For the year ended December 31, 2008
(M€) | | Adjusted | | | Adjustments(a) | | | Consolidated
statement of
income | | Sales | | 179,976 | | | — | | | 179,976 | | Excise taxes | | (19,645 | ) | | — | | | (19,645 | ) | Revenues from sales | | 160,331 | | | — | | | 160,331 | | | | | | Purchases, net of inventory variation | | (107,521 | ) | | (3,503 | ) | | (111,024 | ) | Other operating expenses | | (18,903 | ) | | (198 | ) | | (19,101 | ) | Exploration costs | | (764 | ) | | — | | | (764 | ) | Depreciation, depletion and amortization of tangible assets and mineral interests | | (5,578 | ) | | (177 | ) | | (5,755 | ) | Other income | | 153 | | | 216 | | | 369 | | Other expense | | (147 | ) | | (407 | ) | | (554 | ) | | | | | Financial interest on debt | | (1,000 | ) | | — | | | (1,000 | ) | Financial income from marketable securities & cash equivalents | | 473 | | | — | | | 473 | | Cost of net debt | | (527 | ) | | — | | | (527 | ) | Other financial income | | 728 | | | — | | | 728 | | Other financial expense | | (325 | ) | | — | | | (325 | ) | | | | | Equity in income (loss) of affiliates | | 2,316 | | | (595 | ) | | 1,721 | | | | | | Income taxes | | (15,457 | ) | | 1,311 | | | (14,146 | ) | Net income from continuing operations (Group without Arkema) | | 14,306 | | | (3,353 | ) | | 10,953 | | Net income from discontinued operations (Arkema) | | — | | | — | | | — | | Consolidated net income | | 14,306 | | | (3,353 | ) | | 10,953 | | Group share | | 13,920 | | | (3,330 | ) | | 10,590 | | Minority interests | | 386 | | | (23 | ) | | 363 | |
| | | | | | | | | | | | | | | | | | | | | | | For the year ended December 31, 2010
(M€) | | Upstream | | | Downstream | | | Chemicals | | | Corporate | | | Intercompany | | Total | | Total expenditures | | | 13,208 | | | | 2,343 | | | | 641 | | | | 81 | | | | | | 16,273 | | Total divestments | | | 2,067 | | | | 499 | | | | 347 | | | | 1,403 | | | | | | 4,316 | | Cash flow from operating activities | | | 15,573 | | | | 1,441 | | | | 934 | | | | 545 | | | | | | 18,493 | | Balance sheet as of December 31, 2010 | | | | | | | | | | | | | | | | | | | | | | | Property, plant and equipment, intangible assets, net | | | 50,565 | | | | 8,675 | | | | 4,388 | | | | 253 | | | | | | 63,881 | | Investments in equity affiliates | | | 5,002 | | | | 2,782 | | | | 1,349 | | | | — | | | | | | 9,133 | | Loans to equity affiliates and other non-current assets | | | 4,184 | | | | 1,366 | | | | 979 | | | | 4,099 | | | | | | 10,628 | | Working capital | | | (363 | ) | | | 9,154 | | | | 2,223 | | | | (211 | ) | | | | | 10,803 | | Provisions and other non-current liabilities | | | (16,076 | ) | | | (2,328 | ) | | | (1,631 | ) | | | (1,181 | ) | | | | | (21,216 | ) | Assets and liabilities classified as held for sale | | | 660 | | | | — | | | | 413 | | | | — | | | | | | 1,073 | | Capital Employed (balance sheet) | | | 43,972 | | | | 19,649 | | | | 7,721 | | | | 2,960 | | | | | | 74,302 | | Less inventory valuation effect | | | — | | | | (4,088 | ) | | | (409 | ) | | | 1,061 | | | | | | (3,436 | ) | Capital Employed (Business segment information) | | | 43,972 | | | | 15,561 | | | | 7,312 | | | | 4,021 | | | | | | 70,866 | | ROACE as a percentage | | | 21% | | | | 8% | | | | 12% | | | | | | | | | | 16% | |
| | | | | | | | | | | | | | | | | | | | | | | | | For the year ended December 31, 2009
(M€) | | Upstream | | | Downstream | | | Chemicals | | | Corporate | | | Intercompany | | | Total | | Non-Group sales | | | 16,072 | | | | 100,518 | | | | 14,726 | | | | 11 | | | | — | | | | 131,327 | | Intersegment sales | | | 15,958 | | | | 3,786 | | | | 735 | | | | 156 | | | | (20,635 | ) | | | — | | Excise taxes | | | — | | | | (19,174 | ) | | | — | | | | — | | | | — | | | | (19,174 | ) | Revenues from sales | | | 32,030 | | | | 85,130 | | | | 15,461 | | | | 167 | | | | (20,635 | ) | | | 112,153 | | Operating expenses | | | (14,752 | ) | | | (81,281 | ) | | | (14,293 | ) | | | (656 | ) | | | 20,635 | | | | (90,347 | ) | Depreciation, depletion and amortization of tangible assets and mineral interests | | | (4,420 | ) | | | (1,612 | ) | | | (615 | ) | | | (35 | ) | | | — | | | | (6,682 | ) | Operating income | | | 12,858 | | | | 2,237 | | | | 553 | | | | (524 | ) | | | — | | | | 15,124 | | Equity in income (loss) of affiliates and other items | | | 846 | | | | 169 | | | | (58 | ) | | | 697 | | | | — | | | | 1,654 | | Tax on net operating income | | | (7,486 | ) | | | (633 | ) | | | (92 | ) | | | 326 | | | | — | | | | (7,885 | ) | Net operating income | | | 6,218 | | | | 1,773 | | | | 403 | | | | 499 | | | | — | | | | 8,893 | | Net cost of net debt | | | | | | | | | | | | | | | | | | | | | | | (264 | ) | Non-controlling interests | | | | | | | | | | | | | | | | | | | | | | | (182 | ) | Net income | | | | | | | | | | | | | | | | | | | | | | | 8,447 | |
| | | | | | | | | | | | | | | | | | | | | | | For the year ended December 31, 2009
(adjustments(a)) (M€) | | Upstream | | | Downstream | | | Chemicals | | | Corporate | | | Intercompany | | Total | | Non-Group sales | | | | | | | | | | | | | | | | | | | | | | | Intersegment sales | | | | | | | | | | | | | | | | | | | | | | | Excise taxes | | | | | | | | | | | | | | | | | | | | | | | Revenues from sales | | | | | | | | | | | | | | | | | | | | | | | Operating expenses | | | (17 | ) | | | 1,558 | | | | 344 | | | | — | | | | | | 1,885 | | Depreciation, depletion and amortization of tangible assets and mineral interests | | | (4 | ) | | | (347 | ) | | | (40 | ) | | | — | | | | | | (391 | ) | Operating income(b) | | | (21 | ) | | | 1,211 | | | | 304 | | | | — | | | | | | 1,494 | | Equity in income (loss) of affiliates and other items(c) | | | (160 | ) | | | 22 | | | | (123 | ) | | | (117 | ) | | | | | (378 | ) | Tax on net operating income | | | 17 | | | | (413 | ) | | | (50 | ) | | | (3 | ) | | | | | (449 | ) | Net operating income(b) | | | (164 | ) | | | 820 | | | | 131 | | | | (120 | ) | | | | | 667 | | Net cost of net debt | | | | | | | | | | | | | | | | | | | | | — | | Non-controlling interests | | | | | | | | | | | | | | | | | | | | | (4 | ) | Net income | | | | | | | | | | | | | | | | | | | | | 663 | |
| (a) | Adjustments include special items, inventory valuation effect and equity share of amortization of intangible assetsadjustments related to Sanofi. |
| | | | | | | | | | | | | | | | | | | | | (b) Of which inventory valuation effect | | | Upstream | | | | Downstream | | | | Chemicals | | | | Corporate | | | | | | on operating income | | | — | | | | 1,816 | | | | 389 | | | | — | | | | | | on net operating income | | | — | | | | 1,285 | | | | 254 | | | | — | | | | | | (c) Of which equity share of adjustments related to Sanofi | | | — | | | | — | | | | — | | | | (300 | ) | | | | |
| | | | | | | | | | | | | | | | | | | | | | | | | For the year ended December 31, 2009
(adjusted) (M€)(a) | | Upstream | | | Downstream | | | Chemicals | | | Corporate | | | Intercompany | | | Total | | Non-Group sales | | | 16,072 | | | | 100,518 | | | | 14,726 | | | | 11 | | | | — | | | | 131,327 | | Intersegment sales | | | 15,958 | | | | 3,786 | | | | 735 | | | | 156 | | | | (20,635 | ) | | | — | | Excise taxes | | | — | | | | (19,174 | ) | | | — | | | | — | | | | — | | | | (19,174 | ) | Revenues from sales | | | 32,030 | | | | 85,130 | | | | 15,461 | | | | 167 | | | | (20,635 | ) | | | 112,153 | | Operating expenses | | | (14,735 | ) | | | (82,839 | ) | | | (14,637 | ) | | | (656 | ) | | | 20,635 | | | | (92,232 | ) | Depreciation, depletion and amortization of tangible assets and mineral interests | | | (4,416 | ) | | | (1,265 | ) | | | (575 | ) | | | (35 | ) | | | — | | | | (6,291 | ) | Adjusted operating income | | | 12,879 | | | | 1,026 | | | | 249 | | | | (524 | ) | | | — | | | | 13,630 | | Equity in income (loss) of affiliates and other items | | | 1,006 | | | | 147 | | | | 65 | | | | 814 | | | | — | | | | 2,032 | | Tax on net operating income | | | (7,503 | ) | | | (220 | ) | | | (42 | ) | | | 329 | | | | — | | | | (7,436 | ) | Adjusted net operating income | | | 6,382 | | | | 953 | | | | 272 | | | | 619 | | | | — | | | | 8,226 | | Net cost of net debt | | | | | | | | | | | | | | | | | | | | | | | (264 | ) | Non-controlling interests | | | | | | | | | | | | | | | | | | | | | | | (178 | ) | Adjusted net income | | | | | | | | | | | | | | | | | | | | | | | 7,784 | | Adjusted fully-diluted earnings per share (€) | | | | | | | | | | | | | | | | | | | | 3.48 | |
| (a) | Except for earnings per share |
| | | | | | | | | | | | | | | | | | | | | | | For the year ended December 31, 2009
(M€) | | Upstream | | | Downstream | | | Chemicals | | | Corporate | | | Intercompany | | Total | | Total expenditures | | | 9,855 | | | | 2,771 | | | | 631 | | | | 92 | | | | | | 13,349 | | Total divestments | | | 398 | | | | 133 | | | | 47 | | | | 2,503 | | | | | | 3,081 | | Cash flow from operating activities | | | 10,200 | | | | 1,164 | | | | 1,082 | | | | (86 | ) | | | | | 12,360 | | Balance sheet as of December 31, 2009 | | | | | | | | | | | | | | | | | | | | | | | Property, plant and equipment, intangible assets, net | | | 43,997 | | | | 9,588 | | | | 5,248 | | | | 271 | | | | | | 59,104 | | Investments in equity affiliates | | | 4,260 | | | | 2,110 | | | | 652 | | | | 4,235 | | | | | | 11,257 | | Loans to equity affiliates and other non-current assets | | | 3,844 | | | | 1,369 | | | | 850 | | | | 547 | | | | | | 6,610 | | Working capital | | | 660 | | | | 7,624 | | | | 2,151 | | | | 58 | | | | | | 10,493 | | Provisions and other non-current liabilities | | | (15,364 | ) | | | (2,190 | ) | | | (1,721 | ) | | | (1,094 | ) | | | | | (20,369 | ) | Assets and liabilities classified as held for sale | | | — | | | | — | | | | — | | | | — | | | | | | — | | Capital Employed (balance sheet) | | | 37,397 | | | | 18,501 | | | | 7,180 | | | | 4,017 | | | | | | 67,095 | | Less inventory valuation effect | | | — | | | | (3,202 | ) | | | (282 | ) | | | 840 | | | | | | (2,644 | ) | Capital Employed (Business segment information) | | | 37,397 | | | | 15,299 | | | | 6,898 | | | | 4,857 | | | | | | 64,451 | | ROACE as a percentage | | | 18% | | | | 7% | | | | 4% | | | | | | | | | | 13% | |
The Group evaluates the return on equity as the ratio of adjusted consolidated net income to average adjusted shareholders’ equity between the beginning and the end of the period. Thus, adjusted shareholders’ equity for the year ended December 31, 2011 is calculated after payment of a dividend of€2.28 per share, subject to approval by the shareholders’ meeting on May 11, 2012. The ROE is calculated as follows: | | | | | | | | | | | | | | For the year ended December 31, (M€) | | 2011 | | | 2010 | | | 2009 | | Adjusted net income — Group share | | | 11,424 | | | | 10,288 | | | | 7,784 | | Adjusted non-controlling interests | | | 286 | | | | 234 | | | | 178 | | Adjusted consolidated net income | | | 11,710 | | | | 10,522 | | | | 7,962 | | Shareholders’ equity — Group share | | | 68,037 | | | | 60,414 | | | | 52,552 | | Distribution of the income based on existing shares at the closing date | | | (1,255 | ) | | | (2,553 | ) | | | (2,546 | ) | Non-controlling interests | | | 1,352 | | | | 857 | | | | 987 | | Adjusted shareholders’ equity(a) | | | 68,134 | | | | 58,718 | | | | 50,993 | | ROE | | | 18% | | | | 19% | | | | 16% | |
| (a) | Adjusted shareholders’ equity as of December 31, 2008 amounted to€47,410 million. |
| C) | | RECONCILIATION OF THE INFORMATION BY BUSINESS SEGMENT WITH CONSOLIDATED FINANCIAL STATEMENTS |
The table below presents the impact of adjustment items on the Consolidated Statement of Income: | | | | | | | | | | | | | | For the year ended December 31, 2011 (M€) | | Adjusted | | | Adjustments(a) | | | Consolidated
statement of
income | | Sales | | | 184,648 | | | | 45 | | | | 184,693 | | Excise taxes | | | (18,143 | ) | | | — | | | | (18,143 | ) | Revenues from sales | | | 166,505 | | | | 45 | | | | 166,550 | | Purchases, net of inventory variation | | | (115,107 | ) | | | 1,215 | | | | (113,892 | ) | Other operating expenses | | | (19,751 | ) | | | (92 | ) | | | (19,843 | ) | Exploration costs | | | (1,019 | ) | | | — | | | | (1,019 | ) | Depreciation, depletion and amortization of tangible assets and mineral interests | | | (6,725 | ) | | | (781 | ) | | | (7,506 | ) | Other income | | | 430 | | | | 1,516 | | | | 1,946 | | Other expense | | | (536 | ) | | | (711 | ) | | | (1,247 | ) | Financial interest on debt | | | (713 | ) | | | — | | | | (713 | ) | Financial income from marketable securities & cash equivalents | | | 273 | | | | — | | | | 273 | | Cost of net debt | | | (440 | ) | | | — | | | | (440 | ) | Other financial income | | | 609 | | | | — | | | | 609 | | Other financial expense | | | (429 | ) | | | — | | | | (429 | ) | Equity in income (loss) of affiliates | | | 1,984 | | | | (59 | ) | | | 1,925 | | Income taxes | | | (13,811 | ) | | | (262 | ) | | | (14,073 | ) | Consolidated net income | | | 11,710 | | | | 871 | | | | 12,581 | | Group share | | | 11,424 | | | | 852 | | | | 12,276 | | Non-controlling interests | | | 286 | | | | 19 | | | | 305 | |
| (a) | Adjustments include special items, inventory valuation effect and, as from January 1st, 2011, the Sanofi-Aventis merger.effect of changes in fair value. |
| For the year ended December 31, 2007 (M€) | | Adjusted | | Adjustments(a) | | Consolidated
statement of
income | | | | For the year ended December 31, 2010 (M€) | | | Adjusted | | Adjustments(a) | | Consolidated
statement of
income | | Sales | | 158,752 | | | — | | | 158,752 | | | | 159,269 | | | | — | | | | 159,269 | | Excise taxes | | (21,928 | ) | | — | | | (21,928 | ) | | | (18,793 | ) | | | — | | | | (18,793 | ) | Revenues from sales | | 136,824 | | | — | | | 136,824 | | | | 140,476 | | | | — | | | | 140,476 | | Purchases, net of inventory variation | | (89,688 | ) | | 1,881 | | | (87,807 | ) | | | (94,286 | ) | | | 1,115 | | | | (93,171 | ) | Other operating expenses | | (17,375 | ) | | (39 | ) | | (17,414 | ) | | | (19,035 | ) | | | (100 | ) | | | (19,135 | ) | Exploration costs | | (877 | ) | | — | | | (877 | ) | | | (864 | ) | | | — | | | | (864 | ) | Depreciation, depletion and amortization of tangible assets and mineral interests | | (5,378 | ) | | (47 | ) | | (5,425 | ) | | | (7,005 | ) | | | (1,416 | ) | | | (8,421 | ) | Other income | | 384 | | | 290 | | | 674 | | | | 524 | | | | 872 | | | | 1,396 | | Other expense | | (225 | ) | | (245 | ) | | (470 | ) | | | (346 | ) | | | (554 | ) | | | (900 | ) | Financial interest on debt | | (1,783 | ) | | — | | | (1,783 | ) | | | (465 | ) | | | — | | | | (465 | ) | Financial income from marketable securities & cash equivalents | | 1,244 | | | — | | | 1,244 | | | | 131 | | | | — | | | | 131 | | Cost of net debt | | (539 | ) | | — | | | (539 | ) | | | (334 | ) | | | — | | | | (334 | ) | Other financial income | | 643 | | | — | | | 643 | | | | 442 | | | | — | | | | 442 | | Other financial expense | | (274 | ) | | — | | | (274 | ) | | | (407 | ) | | | — | | | | (407 | ) | Equity in income (loss) of affiliates | | 2,079 | | | (304 | ) | | 1,775 | | | | 2,003 | | | | (50 | ) | | | 1,953 | | Income taxes | | (13,031 | ) | | (544 | ) | | (13,575 | ) | | | (10,646 | ) | | | 418 | | | | (10,228 | ) | Net income from continuing operations (Group without Arkema) | | 12,543 | | | 992 | | | 13,535 | | | Net income from discontinued operations (Arkema) | | — | | | — | | | — | | | Consolidated net income | | 12,543 | | | 992 | | | 13,535 | | | | 10,522 | | | | 285 | | | | 10,807 | | Group share | | 12,203 | | | 978 | | | 13,181 | | | | 10,288 | | | | 283 | | | | 10,571 | | Minority interests | | 340 | | | 14 | | | 354 | | | Non-controlling interests | | | | 234 | | | | 2 | | | | 236 | |
| (a) | Adjustments include special items, inventory valuation effect and, until June 30, 2010, equity share of adjustments related to Sanofi. |
| | | | | | | | | | | | | | For the year ended December 31, 2009 (M€) | | Adjusted | | | Adjustments(a) | | | Consolidated
statement of
income | | Sales | | | 131,327 | | | | — | | | | 131,327 | | Excise taxes | | | (19,174 | ) | | | — | | | | (19,174 | ) | Revenues from sales | | | 112,153 | | | | — | | | | 112,153 | | Purchases, net of inventory variation | | | (73,263 | ) | | | 2,205 | | | | (71,058 | ) | Other operating expenses | | | (18,271 | ) | | | (320 | ) | | | (18,591 | ) | Exploration costs | | | (698 | ) | | | — | | | | (698 | ) | Depreciation, depletion and amortization of tangible assets and mineral interests | | | (6,291 | ) | | | (391 | ) | | | (6,682 | ) | Other income | | | 131 | | | | 183 | | | | 314 | | Other expense | | | (315 | ) | | | (285 | ) | | | (600 | ) | Financial interest on debt | | | (530 | ) | | | — | | | | (530 | ) | Financial income from marketable securities & cash equivalents | | | 132 | | | | — | | | | 132 | | Cost of net debt | | | (398 | ) | | | — | | | | (398 | ) | Other financial income | | | 643 | | | | — | | | | 643 | | Other financial expense | | | (345 | ) | | | — | | | | (345 | ) | Equity in income (loss) of affiliates | | | 1,918 | | | | (276 | ) | | | 1,642 | | Income taxes | | | (7,302 | ) | | | (449 | ) | | | (7,751 | ) | Consolidated net income | | | 7,962 | | | | 667 | | | | 8,629 | | Group share | | | 7,784 | | | | 663 | | | | 8,447 | | Non-controlling interests | | | 178 | | | | 4 | | | | 182 | |
| (a) | Adjustments include special items, inventory valuation effect and equity share of amortization of intangible assetsadjustments related to the Sanofi-Aventis merger.Sanofi. |
| | | | | | | | | | For the year ended December 31, 2006 (M€) | | Adjusted | | | Adjustments(a) | | | Consolidated
statement of
income | | Sales | | 153,802 | | | —�� | | | 153,802 | | Excise taxes | | (21,113 | ) | | — | | | (21,113 | ) | Revenues from sales | | 132,689 | | | — | | | 132,689 | | Purchases, net of inventory variation | | (83,020 | ) | | (314 | ) | | (83,334 | ) | Other operating expenses | | (19,393 | ) | | (143 | ) | | (19,536 | ) | Exploration costs | | (634 | ) | | — | | | (634 | ) | Depreciation, depletion and amortization of tangible assets and mineral interests | | (4,994 | ) | | (61 | ) | | (5,055 | ) | Other income | | 423 | | | 366 | | | 789 | | Other expense | | (330 | ) | | (373 | ) | | (703 | ) | Financial interest on debt | | (1,731 | ) | | — | | | (1,731 | ) | Financial income from marketable securities & cash equivalents | | 1,367 | | | — | | | 1,367 | | Cost of net debt | | (364 | ) | | — | | | (364 | ) | Other financial income | | 592 | | | — | | | 592 | | Other financial expense | | (277 | ) | | — | | | (277 | ) | Equity in income (loss) of affiliates | | 1,935 | | | (242 | ) | | 1,693 | | Income taxes | | (13,675 | ) | | (45 | ) | | (13,720 | ) | Net income from continuing operations (Group without Arkema) | | 12,952 | | | (812 | ) | | 12,140 | | Net income from discontinued operations (Arkema) | | 14 | | | (19 | ) | | (5 | ) | Consolidated net income | | 12,966 | | | (831 | ) | | 12,135 | | Group share | | 12,585 | | | (817 | ) | | 11,768 | | Minority interests | | 381 | | | (14 | ) | | 367 | |
(a)D) | | Adjustments include special items, inventory valuation effect and equity share of amortization of intangible assets related to the Sanofi-Aventis merger.ADJUSTMENT ITEMS BY BUSINESS SEGMENT |
C) ADJUSTMENT ITEMS BY BUSINESS SEGMENT
The adjustment items for income as per Note 2 to the Consolidated Financial Statements are detailed as follows: Adjustments to operating income
| | | | | | | | | | | | | | | | | | | | | Adjustments to operating income
For the year ended December 31, 2011 (M€) | | Upstream | | | Downstream | | | Chemicals | | | Corporate | | | Total | | Inventory valuation effect | | | — | | | | 1,224 | | | | (9 | ) | | | — | | | | 1,215 | | Effect of changes in fair value | | | 45 | | | | — | | | | — | | | | — | | | | 45 | | Restructuring charges | | | — | | | | — | | | | — | | | | — | | | | — | | Asset impairment charges | | | (75 | ) | | | (700 | ) | | | (6 | ) | | | — | | | | (781 | ) | Other items | | | — | | | | (68 | ) | | | (24 | ) | | | — | | | | (92 | ) | Total | | | (30 | ) | | | 456 | | | | (39 | ) | | | — | | | | 387 | |
| | | | | | | | | | | | | | | | | | | | | Adjustments to net income, Group share
For the year ended December 31, 2011 (M€) | | Upstream | | | Downstream | | | Chemicals | | | Corporate | | | Total | | Inventory valuation effect | | | — | | | | 824 | | | | 10 | | | | — | | | | 834 | | Effect of changes in fair value | | | 32 | | | | — | | | | — | | | | — | | | | 32 | | Restructuring charges | | | — | | | | (113 | ) | | | (9 | ) | | | — | | | | (122 | ) | Asset impairment charges | | | (531 | ) | | | (478 | ) | | | (5 | ) | | | — | | | | (1,014 | ) | Gains (losses) on disposals of assets | | | 843 | | | | 412 | | | | 209 | | | | 74 | | | | 1,538 | | Other items | | | (202 | ) | | | (74 | ) | | | (76 | ) | | | (64 | ) | | | (416 | ) | Total | | | 142 | | | | 571 | | | | 129 | | | | 10 | | | | 852 | |
| | | | | | | | | | | | | | | | For the year ended December 31, 2008(M€) | | Upstream | | | Downstream | | | Chemicals | | | Corporate | | Total | | Inventory valuation effect | | — | | | (2,776 | ) | | (727 | ) | | — | | (3,503 | ) | Restructuring charges | | — | | | — | | | — | | | — | | — | | Asset impairment charges | | (171 | ) | | — | | | (6 | ) | | — | | (177 | ) | Other items | | — | | | — | | | (198 | ) | | — | | (198 | ) | Total | | (171 | ) | | (2,776 | ) | | (931 | ) | | — | | (3,878 | ) |
Adjustments to net income
| | | | | | | | | | | | | | | | | | | | | Adjustments to operating income
For the year ended December 31, 2010 (M€) | | Upstream | | | Downstream | | | Chemicals | | | Corporate | | | Total | | Inventory valuation effect | | | — | | | | 863 | | | | 130 | | | | — | | | | 993 | | Restructuring charges | | | — | | | | — | | | | — | | | | — | | | | — | | Asset impairment charges | | | (203 | ) | | | (1,192 | ) | | | (21 | ) | | | — | | | | (1,416 | ) | Other items | | | — | | | | 60 | | | | (38 | ) | | | — | | | | 22 | | Total | | | (203 | ) | | | (269 | ) | | | 71 | | | | — | | | | (401 | ) |
| | | | | | | | | | | | | | | | | For the year ended December 31, 2008(M€) | | Upstream | | | Downstream | | | Chemicals | | | Corporate | | | Total | | Inventory valuation effect | | — | | | (1,949 | ) | | (503 | ) | | — | | | (2,452 | ) | TOTAL’s equity share of special items recorded by Sanofi-Aventis | | — | | | — | | | — | | | — | | | — | | TOTAL’s equity share of adjustments related to the Sanofi-Aventis merger | | — | | | — | | | — | | | (393 | ) | | (393 | ) | Restructuring charges | | — | | | (47 | ) | | (22 | ) | | — | | | (69 | ) | Asset impairment charges | | (172 | ) | | (26 | ) | | (7 | ) | | — | | | (205 | ) | Gains (losses) on disposals of assets | | 130 | | | — | | | — | | | 84 | | | 214 | | Other items | | (236 | ) | | — | | | (151 | ) | | (38 | ) | | (425 | ) | Total | | (278 | ) | | (2,022 | ) | | (683 | ) | | (347 | ) | | (3,330 | ) |
Adjustments to operating income | | | | | | | | | | | | | | | | | | | | | Adjustments to net income, Group share
For the year ended December 31, 2010 (M€) | | Upstream | | | Downstream | | | Chemicals | | | Corporate | | | Total | | Inventory valuation effect | | | — | | | | 635 | | | | 113 | | | | — | | | | 748 | | TOTAL’s equity share of adjustments related to Sanofi | | | — | | | | — | | | | — | | | | (81 | ) | | | (81 | ) | Restructuring charges | | | — | | | | (12 | ) | | | (41 | ) | | | — | | | | (53 | ) | Asset impairment charges | | | (297 | ) | | | (913 | ) | | | (14 | ) | | | — | | | | (1,224 | ) | Gains (losses) on disposals of assets | | | 589 | | | | 122 | | | | 33 | | | | 302 | | | | 1,046 | | Other items | | | (37 | ) | | | (83 | ) | | | (33 | ) | | | — | | | | (153 | ) | Total | | | 255 | | | | (251 | ) | | | 58 | | | | 221 | | | | 283 | |
| | | | | | | | | | | | | | | | For the year ended December 31, 2007(M€) | | Upstream | | | Downstream | | | Chemicals | | | Corporate | | Total | | Inventory valuation effect | | — | | | 1,529 | | | 301 | | | — | | 1,830 | | Restructuring charges | | — | | | — | | | — | | | — | | — | | Asset impairment charges | | — | | | (43 | ) | | (4 | ) | | — | | (47 | ) | Other items | | (11 | ) | | 51 | | | (28 | ) | | — | | 12 | | Total | | (11 | ) | | 1,537 | | | 269 | | | — | | 1,795 | |
Adjustments to net income
| | | | | | | | | | | | | | | | | For the year ended December 31, 2007(M€) | | Upstream | | | Downstream | | | Chemicals | | | Corporate | | | Total | | Inventory valuation effect | | — | | | 1,084 | | | 201 | | | — | | | 1,285 | | TOTAL’s equity share of special items recorded by Sanofi-Aventis | | — | | | — | | | — | | | 75 | | | 75 | | TOTAL’s equity share of adjustments related to the Sanofi-Aventis merger | | — | | | — | | | — | | | (318 | ) | | (318 | ) | Restructuring charges | | — | | | (20 | ) | | (15 | ) | | — | | | (35 | ) | Asset impairment charges | | (93 | ) | | (61 | ) | | (8 | ) | | — | | | (162 | ) | Gains (losses) on disposals of assets | | 89 | | | 101 | | | — | | | 116 | | | 306 | | Other items | | (8 | ) | | (27 | ) | | (38 | ) | | (100 | ) | | (173 | ) | Total | | (12 | ) | | 1,077 | | | 140 | | | (227 | ) | | 978 | |
Adjustments to operating income
| | | | | | | | | | | | | | | For the year ended December 31, 2006 (M€) | | Upstream | | Downstream | | | Chemicals | | | Corporate | | | Total | | Inventory valuation effect | | — | | (272 | ) | | (42 | ) | | — | | | (314 | ) | Restructuring charges | | — | | — | | | (25 | ) | | — | | | (25 | ) | Asset impairment charges | | — | | — | | | (61 | ) | | — | | | (61 | ) | Other items | | — | | — | | | (91 | ) | | (27 | ) | | (118 | ) | Total | | — | | (272 | ) | | (219 | ) | | (27 | ) | | (518 | ) |
Adjustments to net income
| For the year ended December 31, 2006 (M€) | | Upstream | | Downstream | | Chemicals | | Corporate | | Total | | | Adjustments to operating income For the year ended December 31, 2009 (M€) | | | Upstream | | Downstream | | Chemicals | | Corporate | | Total | | Inventory valuation effect | | — | | | (330 | ) | | (28 | ) | | — | | | (358 | ) | | | — | | | | 1,816 | | | | 389 | | | | — | | | | 2,205 | | TOTAL’s equity share of special items recorded by Sanofi-Aventis | | — | | | — | | | — | | | (81 | ) | | (81 | ) | | TOTAL’s equity share of adjustments related to the Sanofi-Aventis merger | | — | | | — | | | — | | | (309 | ) | | (309 | ) | | Restructuring charges | | | | — | | | | — | | | | — | | | | — | | | | — | | Asset impairment charges | | | | (4 | ) | | | (347 | ) | | | (40 | ) | | | — | | | | (391 | ) | Other items | | | | (17 | ) | | | (258 | ) | | | (45 | ) | | | — | | | | (320 | ) | Total | | | | (21 | ) | | | 1,211 | | | | 304 | | | | — | | | | 1,494 | | | | | | Adjustments to net income, Group share For the year ended December 31, 2009 (M€) | | | Upstream | | Downstream | | Chemicals | | Corporate | | Total | | Inventory valuation effect | | | | — | | | | 1,279 | | | | 254 | | | | — | | | | 1,533 | | TOTAL’s equity share of adjustments related to Sanofi | | | | — | | | | — | | | | — | | | | (300 | ) | | | (300 | ) | Restructuring charges | | — | | | — | | | (154 | ) | | — | | | (154 | ) | | | — | | | | (27 | ) | | | (102 | ) | | | — | | | | (129 | ) | Asset impairment charges | | — | | | — | | | (40 | ) | | — | | | (40 | ) | | | (52 | ) | | | (253 | ) | | | (28 | ) | | | — | | | | (333 | ) | Gains (losses) on disposals of assets | | 130 | | | 174 | | | — | | | — | | | 304 | | | | — | | | | — | | | | — | | | | 179 | | | | 179 | | Other items | | (71 | ) | | — | | | (172 | ) | | 64 | | | (179 | ) | | | (112 | ) | | | (182 | ) | | | 7 | | | | — | | | | (287 | ) | Total | | 59 | | | (156 | ) | | (394 | ) | | (326 | ) | | (817 | ) | | | (164 | ) | | | 817 | | | | 131 | | | | (121 | ) | | | 663 | |
D) ADDITIONAL INFORMATION ON IMPAIRMENTS
| E) | | ADDITIONAL INFORMATION ON IMPAIRMENTS |
In the Upstream, Downstream and Chemicals segments, impairments of assets have been recognized for the year ended December 31, 2008,2011, with an impact of 216 M€781 million in operating income and 244 M€1,014 million in net income, Group share. These impairments werehave been disclosed as adjustments to operating income for 177 M€and adjustments to net income, for 205 M€.Group share. These items are identified in paragraph 4C4D above as adjustment items with the heading “Asset impairment charges”. The impairment losses impact certain Cash Generating Units (CGU) for which there were indications of impairment, due mainly to changes in the operating conditions or the economic environment of their specific businesses. The CGUs ofprinciples applied are the Upstream segment affected by these impairments are oil fields and associates accounted for by the equity method. The impairments recorded during 2008 are mainly due to the deterioration in the operating conditions of the specific assets. Economic assumptions, notably on hydrocarbon prices, made by management have not triggered the recognition of impairments and would not have even if hydrocarbon prices had been 25% lower than assumed by management. The CGUs of the Dowstream segment are affiliates or groups of affiliates organized mostly by country.
The CGUs of the Chemicals segment are worldwide business units, including activities or products with common strategic, commercial and industrial characteristics.
In addition,following:
the recoverable amount of CGUs has been based on their value in use, as defined in Note 1 paragraph L to the Consolidated Financial Statements "Impairment“Impairment of long-lived assets"assets”; and future cash flows includinghave been determined with the assumptions in the long-term plan of the Group. These assumptions (including future prices of products, supply and demand for products, future production volumes) represent the best estimate by management of the Group of all economic conditions during the remaining life of assets; future cash flows, based on the long-term plan, are prepared over a period consistent with the life of the assets within the CGU. They are prepared post-tax and include specific risks attached to CGU assets have beenassets. They are discounted using aan 8% after taxpost-tax discount rate. This rate, isthis rate being a weighted-average capital cost estimated from historical market data. These assumptions have This rate has been applied consistently for the years 2006, 2007ending in 2009, 2010 and 2008.2011.
SunPower is a CGU acquired in 2011 for which specific assumptions were applied because of its own financing and its listing on Nasdaq. Thus, future cash flows of this CGU have been discounted using a 14% post-tax discount rate, corresponding to the weighted-average capital cost of this CGU. value in use calculated by discounting the above post-tax cash flows using an 8% post-tax discount rate is not materially different from value in use calculated by discounting pre-tax cash flows using a pre-tax discount rate determined by an iterative computation from the post-tax value in use. These pre-tax discount rates are in a range from 10% to 13% in 2011. SunPower’s pre-tax discount rate is 16%. The CGUs of the Upstream segment affected by these impairments are oil fields, assets in solar energy and investments in associates accounted for by the equity method. For the year ended December 31, 2011, the Group has recognized impairments with an impact of€75 million in operating income and€531 million in net income, Group share. A 10% decrease in hydrocarbons prices would not lead to additional impairment losses. In 2011, impairment losses accounted for mainly include the impairment of the whole goodwill arising from the acquisition of SunPower for€383 million. Indeed, the stress on public debt markets of some European states during the second half of 2011, successive austerity plans adopted by these states and their impact on financial incentives specific to the solar industry have greatly worsened the financial situation and forecasts of future cash flows of the solar industry companies, including SunPower. The market capitalization of these companies fell sharply in 2011, thus the share price of SunPower as of December 31, 2011 stood at $6.23 per share, down 73% compared to the share price at the acquisition date. The CGUs of the Downstream segment are affiliates or groups of affiliates (or industrial assets) organized mostly by country for the refining activities and by relevant geographical area for the marketing activities. For the refining activities, the unfavorable trends observed in 2010 have continued in 2011, with a worldwide context of surplus in refining capacities compared to the demand for petroleum products. This surplus is still based in Europe with a falling demand, whereas the emerging countries (Middle East and Asia) report a strong growth in the consumption of petroleum products. In this persistent context of deteriorated margins, the refining CGUs in France and in the United Kingdom have suffered substantial operating losses despite the constant efforts to improve operations. This situation, coupled with less favorable outlooks, led the Group to recognize impairments within the CGUs Refining France and United Kingdom with an impact of€700 million in operating income and€478 million in net income, Group share. A variation of +5% of projections of gross margin in identical operating conditions would have a positive impact of€676 million in operating income and€443 million in net income, Group share. A variation of (1) % of the discount rate would have a positive impact of€335 million in operating income and€219 million in net income, Group share. Inverse variations of projections of gross margin and discount rate would have impacts of respectively €(683) million and€(249) million in operating income and€(448) million and€(164) million in net income, Group share. The CGUs of the Chemicals segment are worldwide business units, including activities or products with common strategic, commercial and industrial characteristics. The different scenarios of sensitivity would not lead to additional impairment losses. For the year ended December 31, 2007,2010, impairments of assets have been recognized in the Upstream, Downstream and Chemicals segments with an impact of 47 M€1,416 million in operating income and 162 M€1,224 million in net income, Group share. These impairments have been disclosed as adjustments to operating income and adjustments to net income, Group share. For the year ended December 31, 2006, changes in the economic environment of certain business units of the Chemicals segment had triggered the recognition of2009, impairments of assets for 61 M€ in operating income and 40M€ in net income, Group share. For the year ended December 31, 2008, reversals of impairment losses have been recognized in the Upstream, segmentDownstream and Chemicals segments with an impact of 41 M€413 million in operating income and 29 M€382 million in net income, Group share. These impairments have been disclosed as adjustments to operating income for€391 million and adjustments to net income, Group share for€333 million.
NoFor the years ended December 31, 2011, 2010 and 2009, no reversal of impairment losses has been recognized in 2006 and 2007.recognized.
5)INFORMATION BY GEOGRAPHICAL AREA | | | | | | | | | | | | | | (M€) | | France | | Rest of
Europe | | North
America | | Africa | | Asia-Pacific
and rest of world | | Total | For the year ended December 31, 2008 | | | | | | | | | | | | | Non-Group sales | | 43,616 | | 82,761 | | 14,002 | | 12,482 | | 27,115 | | 179,976 | Property, plant and equipment, intangible assets, net | | 7,260 | | 13,485 | | 5,182 | | 15,460 | | 10,096 | | 51,483 | Capital expenditures | | 1,997 | | 2,962 | | 1,255 | | 4,500 | | 2,926 | | 13,640 | For the year ended December 31, 2007 | | | | | | | | | | | | | Non-Group sales | | 37,949 | | 73,757 | | 12,404 | | 10,401 | | 24,241 | | 158,752 | Property, plant and equipment, intangible assets, net | | 6,437 | | 14,554 | | 4,444 | | 11,872 | | 8,810 | | 46,117 | Capital expenditures | | 1,627 | | 2,538 | | 740 | | 3,745 | | 3,072 | | 11,722 | For the year ended December 31, 2006 | | | | | | | | | | | | | Non-Group sales(a) | | 36,890 | | 70,992 | | 13,031 | | 10,086 | | 22,803 | | 153,802 | Property, plant and equipment, intangible assets, net | | 5,860 | | 14,066 | | 4,318 | | 10,595 | | 10,442 | | 45,281 | Capital expenditures | | 1,919 | | 2,355 | | 881 | | 3,326 | | 3,371 | | 11,852 |
(a) | Non-Group sales from continuing operations. |
| | | | | | | | | | | | | | | | | | | | | | | | | | (M€) | | France | | | Rest of
Europe | | | North
America | | | Africa | | | Rest of the
world | | | Total | | For the year ended December 31, 2011 | | | | | | | | | | | | | | | | | | | | | | | | | Non-Group sales | | | 42,626 | | | | 81,453 | | | | 15,917 | | | | 15,077 | | | | 29,620 | | | | 184,693 | | Property, plant and equipment, intangible assets, net | | | 5,637 | | | | 15,576 | | | | 14,518 | | | | 23,546 | | | | 17,593 | | | | 76,870 | | Capital expenditures | | | 1,530 | | | | 3,802 | | | | 5,245 | | | | 5,264 | | | | 8,700 | | | | 24,541 | | For the year ended December 31, 2010 | | | | | | | | | | | | | | | | | | | | | | | | | Non-Group sales | | | 36,820 | | | | 72,636 | | | | 12,432 | | | | 12,561 | | | | 24,820 | | | | 159,269 | | Property, plant and equipment, intangible assets, net | | | 5,666 | | | | 14,568 | | | | 9,584 | | | | 20,166 | | | | 13,897 | | | | 63,881 | | Capital expenditures | | | 1,062 | | | | 2,629 | | | | 3,626 | | | | 4,855 | | | | 4,101 | | | | 16,273 | | For the year ended December 31, 2009 | | | | | | | | | | | | | | | | | | | | | | | | | Non-Group sales | | | 32,437 | | | | 60,140 | | | | 9,515 | | | | 9,808 | | | | 19,427 | | | | 131,327 | | Property, plant and equipment, intangible assets, net | | | 6,973 | | | | 15,218 | | | | 8,112 | | | | 17,312 | | | | 11,489 | | | | 59,104 | | Capital expenditures | | | 1,189 | | | | 2,502 | | | | 1,739 | | | | 4,651 | | | | 3,268 | | | | 13,349 | |
6)OPERATING EXPENSES | | For the year ended December 31,(M€) | | 2008 | | 2007 | | 2006 | | | 2011 | | 2010 | | 2009 | | Purchases, net of inventory variation(a) | | (111,024 | ) | | (87,807 | ) | | (83,334 | ) | | | (113,892 | )(b) | | | (93,171 | ) | | | (71,058 | ) | Exploration costs | | (764 | ) | | (877 | ) | | (634 | ) | | | (1,019 | ) | | | (864 | ) | | | (698 | ) | Other operating expenses(b)(c) | | (19,101 | ) | | (17,414 | ) | | (19,536 | ) | | | (19,843 | ) | | | (19,135 | ) | | | (18,591 | ) | of which non-current operating liabilities (allowances) reversals | | 459 | | | 781 | | | 454 | | | | 615 | | | | 387 | | | | 515 | | of which current operating liabilities (allowances) reversals | | (29 | ) | | (42 | ) | | (111 | ) | | | (150 | ) | | | (101 | ) | | | (43 | ) | Operating expenses | | (130,889 | ) | | (106,098 | ) | | (103,504 | ) | | | (134,754 | ) | | | (113,170 | ) | | | (90,347 | ) |
| (a) | Includes royaltiestaxes paid on oil and gas production in the Upstream segment, (seenamely royalties. |
| (b) | As of December 31, 2011, the Group valued under / over lifting at market value. The impact in particular the taxes paid to Middle East oil producing countries for the Group’s concessionsoperating expenses is€577 million and€103 million in net income, Group share as detailed in Note 33 to the Consolidated Financial Statements “Other information”).of December 31, 2011. |
(b)(c) | Principally composed of production and administrative costs (see in particular the payroll costs as detailed in Note 26 to the Consolidated Financial Statements “Payroll and staff”). |
7)
| 7) | | OTHER INCOME AND OTHER EXPENSE |
| | | | | | | | | | | | | For the year ended
December 31, (M€) | | 2011 | | | 2010 | | | 2009 | | Gains (losses) on disposal of assets | | | 1,650 | | | | 1,117 | | | | 200 | | Foreign exchange gains | | | 118 | | | | — | | | | — | | Other | | | 178 | | | | 279 | | | | 114 | | Other income | | | 1,946 | | | | 1,396 | | | | 314 | | Foreign exchange losses | | | — | | | | — | | | | (32 | ) | Amortization of other intangible assets (excl. mineral interests) | | | (592 | ) | | | (267 | ) | | | (142 | ) | Other | | | (655 | ) | | | (633 | ) | | | (426 | ) | Other expense | | | (1,247 | ) | | | (900 | ) | | | (600 | ) |
Other income | | | | | | | | | | | As of December 31,(M€) | | 2008 | | | 2007 | | | 2006 | | Gains (losses ) on disposal of assets | | 257 | | | 639 | | | 789 | | Foreign exchange gains | | 112 | | | 35 | | | — | | Other income | | 369 | | | 674 | | | 789 | | Foreign exchange losses | | — | | | — | | | (30 | ) | Amortization of other intangible assets (excluding mineral interests ) | | (162 | ) | | (178 | ) | | (182 | ) | Other | | (392 | ) | | (292 | ) | | (491 | ) | Other expense | | (554 | ) | | (470 | ) | | (703 | ) |
In 2008,2011, gains and losses on disposal of assets are mainly related to salesthe sale of non-currentthe interest in CEPSA, to the sale of assets in the Upstream segment as well as disposal(especially the sale of shares of Sanofi-Aventis. The “Other” heading is mainly comprised of: 107 M€ of restructuring charges10% Group’s interest in the Upstream, DownstreamColombian pipeline OCENSA) and Chemicals segments;to the sale of photocure and
48 M€ of changes in provisions related to various antitrust investigations as coatings resins businesses. These disposals are described in Note 323 to the Consolidated Financial Statements “Other risks and contingent liabilities”.Statements.
In 2007,2010, gains and losses on disposal of assets were mainly related to sales of non-current assets in the Upstream segment (sale of the interests in the Valhall and Downstream segments,Hod fields in Norway and sale of the interest in Block 31 in Angola, see Note 3 to the Consolidated Financial Statements), as well as the change in the accounting treatment and the disposal of shares of Sanofi-Aventis. The “Other” heading was mainly comprised of: 51 M€ of restructuring charges in the Downstream and Chemicals segments; and
100 M€ of changes in provisions related to various antitrust investigations as described inSanofi (see Note 323 to the Consolidated Financial Statements “Other risks and contingent liabilities”Statements).
In 2006,2009, gains and losses on disposal of assets were mainly related to salesthe disposal of financial assets. Theshares of Sanofi. Other expense In 2011, the heading “Other” heading wasis mainly comprised of: 100 Mof€ of changes in provisions related to the Toulouse-AZF plant explosion (civil liability);
188 M€243 million of restructuring charges in the Upstream, Downstream and Chemicals segment;segments.
In 2010, the heading “Other” was mainly comprised of€248 million of restructuring charges in the Downstream and Chemicals segments. In 2009, the heading “Other” was mainly comprised of€190 million of restructuring charges in the Downstream and Chemicals segments. 32 M€ of changes in provisions related to various antitrust investigations as described in Note 32 to the Consolidated Financial Statements “Other risks and contingent liabilities”.
| 8) | | OTHER FINANCIAL INCOME AND EXPENSE |
| | | | | | | | | | | | | | As of December 31, (M€) | | 2011 | | | 2010 | | | 2009 | | Dividend income on non-consolidated subsidiaries | | | 330 | | | | 255 | | | | 210 | | Capitalized financial expenses | | | 171 | | | | 113 | | | | 117 | | Other | | | 108 | | | | 74 | | | | 316 | | Other financial income | | | 609 | | | | 442 | | | | 643 | | Accretion of asset retirement obligations | | | (344 | ) | | | (338 | ) | | | (283 | ) | Other | | | (85 | ) | | | (69 | ) | | | (62 | ) | Other financial expense | | | (429 | ) | | | (407 | ) | | | (345 | ) |
8) OTHER FINANCIAL INCOME AND EXPENSE
| | | | | | | | | | | As of December 31, (M€) | | 2008 | | | 2007 | | | 2006 | | Dividend income on non-consolidated companies | | 238 | | | 218 | | | 237 | | Capitalized financial expenses | | 271 | | | 322 | | | 236 | | Other | | 219 | | | 103 | | | 119 | | Other financial income | | 728 | | | 643 | | | 592 | | | | | | Accretion of asset retirement obligations | | (229 | ) | | (189 | ) | | (182 | ) | Other | | (96 | ) | | (85 | ) | | (95 | ) | Other financial expense | | (325 | ) | | (274 | ) | | (277 | ) |
9)INCOME TAXES Since 1966, the Group hashad been taxed in accordance with the consolidated income tax treatment approved on a three-year renewable basis by the French Ministry of Economy, IndustryFinance and Employment.Industry. The approval for the period 2008-2010 expired on December 31, 2010 and TOTAL S.A. announced in July 2011 that it took the decision not to proceed with its initial application for the renewal of this agreement. As a consequence, TOTAL S.A. is taxed in accordance with the approval forcommon tax regime as from 2011. The exit of the consolidated income tax treatment has been requested for 2008 to 2010. It is being reviewed byno significant impact, neither on the French Ministry of Budget.Group’s financial situation nor on the consolidated results. No deferred tax is recognized for the temporary differences between the carrying amounts and tax bases of investments in foreign subsidiaries which are considered to be permanent investments. Undistributed earnings from foreign subsidiaries considered to be reinvested indefinitely amounted to 20,661 M€27,444 million as of December 31, 2008.2011. The determination of the tax effect relating to such reinvested income is not practicable. In addition, no deferred tax is recognized on unremitted earnings (approximately 13,534 M€)22,585 million) of the Group’s French subsidiaries since the remittance of such earnings would be tax exempt for the subsidiaries in which the Company owns 95% or more of the outstanding shares. Income taxes are detailed as follows: | | For the year ended December 31, (M€) | | 2008 | | 2007 | | 2006 | | | 2011 | | 2010 | | 2009 | | Current income taxes | | (14,117 | ) | | (12,141 | ) | | (12,997 | ) | | | (12,495 | ) | | | (9,934 | ) | | | (7,213 | ) | Deferred income taxes | | (29 | ) | | (1,434 | ) | | (723 | ) | | | (1,578 | ) | | | (294 | ) | | | (538 | ) | Total income taxes | | (14,146 | ) | | (13,575 | ) | | (13,720 | ) | | | (14,073 | ) | | | (10,228 | ) | | | (7,751 | ) |
Before netting deferred tax assets and liabilities by fiscal entity, the components of deferred tax balances as of December 31, 2008, 2007 and 2006 are as follows: | | As of December 31,(M€) | | 2008 | | 2007 | | 2006 | | | 2011 | | 2010 | | 2009 | | Net operating losses and tax carry forwards | | 1,031 | | | 560 | | | 633 | | | | 1,584 | | | | 1,145 | | | | 1,114 | | Employee benefits | | 519 | | | 760 | | | 830 | | | | 621 | | | | 535 | | | | 517 | | Other temporary non-deductible provisions | | 2,075 | | | 2,341 | | | 2,157 | | | | 3,521 | | | | 2,757 | | | | 2,184 | | Gross deferred tax assets | | 3,625 | | | 3,661 | | | 3,620 | | | | 5,726 | | | | 4,437 | | | | 3,815 | | Valuation allowance | | (475 | ) | | (449 | ) | | (572 | ) | | | (667 | ) | | | (576 | ) | | | (484 | ) | Net deferred tax assets | | 3,150 | | | 3,212 | | | 3,048 | | | | 5,059 | | | | 3,861 | | | | 3,331 | | Excess tax over book depreciation | | (8,836 | ) | | (9,254 | ) | | (8,180 | ) | | | (12,831 | ) | | | (10,966 | ) | | | (9,791 | ) | Other temporary tax deductions | | (1,171 | ) | | (1,209 | ) | | (1,237 | ) | | | (2,721 | ) | | | (1,339 | ) | | | (1,179 | ) | Gross deferred tax liability | | (10,007 | ) | | (10,463 | ) | | (9,417 | ) | | | (15,552 | ) | | | (12,305 | ) | | | (10,970 | ) | Net deferred tax liability | | (6,857 | ) | | (7,251 | ) | | (6,369 | ) | | | (10,493 | ) | | | (8,444 | ) | | | (7,639 | ) |
Net operating losses and tax carry forwards only come from foreign subsidiaries. After netting deferred tax assets and liabilities by fiscal entity, deferred taxes are presented on the balance sheet as follows: | | As of December 31,(M€) | | | 2008 | | 2007 | | 2006 | | | 2011 | | 2010 | | 2009 | | Deferred tax assets, non-current | | (Note 14 | ) | | 1,010 | | | 797 | | | 806 | | | Deferred tax assets, current | | (Note 16 | ) | | 206 | | | 112 | | | 94 | | | Deferred tax assets, non-current(note 14) | | | | 1,767 | | | | 1,378 | | | | 1,164 | | Deferred tax assets, current(note 16) | | | | — | | | | 151 | | | | 214 | | Deferred tax liabilities, non-current | | | | (7,973 | ) | | (7,933 | ) | | (7,139 | ) | | | (12,260 | ) | | | (9,947 | ) | | | (8,948 | ) | Deferred tax liabilities, current | | | (100 | ) | | (227 | ) | | (130 | ) | | | — | | | | (26 | ) | | | (69 | ) | Net amount | | | (6,857 | ) | | (7,251 | ) | | (6,369 | ) | | | (10,493 | ) | | | (8,444 | ) | | | (7,639 | ) |
The net deferred tax variation in the balance sheet is analyzed as follows: | | As of December 31,(M€) | | 2008 | | 2007 | | 2006 | | | 2011 | | 2010 | | 2009 | | Opening balance | | (7,251 | ) | | (6,369 | ) | | (5,670 | ) | | | (8,444 | ) | | | (7,639 | ) | | | (6,857 | ) | Deferred tax on income for continuing operations | | (29 | ) | | (1,434 | ) | | (723 | ) | | Deferred tax on income for discontinued operations | | — | | | — | | | (10 | ) | | Deferred tax on income | | | | (1,578 | ) | | | (294 | ) | | | (538 | ) | Deferred tax on shareholders’ equity(a) | | 30 | | | (6 | ) | | (17 | ) | | | (55 | ) | | | 28 | | | | (38 | ) | Changes in scope of consolidation(b) | | (1 | ) | | 158 | | | (311 | ) | | Changes in scope of consolidation | | | | (17 | ) | | | (59 | ) | | | (1 | ) | Currency translation adjustment | | 394 | | | 400 | | | 362 | | | | (399 | ) | | | (480 | ) | | | (205 | ) | Closing balance | | (6,857 | ) | | (7,251 | ) | | (6,369 | ) | | | (10,493 | ) | | | (8,444 | ) | | | (7,639 | ) |
| (a) | This amount includes mainly current income taxes and deferred taxes for changes in fair value of listed securities classified as financial assets available for sale.sale as well as deferred taxes related to the cash flow hedge (see Note 17 to the Consolidated Financial Statements). |
(b)
| This amount includes mainly the impact of the spin-off of Arkema for 2006. |
Reconciliation between provision for income taxes and pre-tax income: | | | | | | | | | | | For the year ended December 31,(M€) | | 2008 | | | 2007 | | | 2006(a) | | Net income | | 10,953 | | | 13,535 | | | 12,140 | | Provision for income taxes | | 14,146 | | | 13,575 | | | 13,720 | | Pre-tax income | | 25,099 | | | 27,110 | | | 25,860 | | French statutory tax rate | | 34.43% | | | 34.43% | | | 34.43% | | Theoretical tax charge | | (8,642 | ) | | (9,334 | ) | | (8,904 | ) | Difference between French and foreign income tax rates | | (6,326 | ) | | (5,118 | ) | | (5,484 | ) | Tax effect of equity in income (loss) of affiliates | | 593 | | | 611 | | | 583 | | Permanent differences | | 315 | | | 122 | | | 324 | | Adjustments on prior years income taxes | | 12 | | | 75 | | | (87 | ) | Adjustments on deferred tax related to changes in tax rates | | (31 | ) | | (16 | ) | | (88 | ) | Changes in valuation allowance of deferred tax assets | | (63 | ) | | 80 | | | (62 | ) | Other | | (4 | ) | | 5 | | | (2 | ) | Net provision for income taxes | | (14,146 | ) | | (13,575 | ) | | (13,720 | ) |
(a) | Excluding discontinued operations. |
| | | | | | | | | | | | | | For the year ended December 31, (M€) | | 2011 | | | 2010 | | | 2009 | | Consolidated net income | | | 12,581 | | | | 10,807 | | | | 8,629 | | Provision for income taxes | | | 14,073 | | | | 10,228 | | | | 7,751 | | Pre-tax income | | | 26,654 | | | | 21,035 | | | | 16,380 | | French statutory tax rate | | | 36.10% | | | | 34.43% | | | | 34.43% | | Theoretical tax charge | | | (9,622 | ) | | | (7,242 | ) | | | (5,640 | ) | Difference between French and foreign income tax rates | | | (5,740 | ) | | | (4,921 | ) | | | (3,214 | ) | Tax effect of equity in income (loss) of affiliates | | | 695 | | | | 672 | | | | 565 | | Permanent differences | | | 889 | | | | 1,375 | | | | 597 | | Adjustments on prior years income taxes | | | (19 | ) | | | (45 | ) | | | (47 | ) | Adjustments on deferred tax related to changes in tax rates | | | (201 | ) | | | 2 | | | | (1 | ) | Changes in valuation allowance of deferred tax assets | | | (71 | ) | | | (65 | ) | | | (6 | ) | Other | | | (4 | ) | | | (4 | ) | | | (5 | ) | Net provision for income taxes | | | (14,073 | ) | | | (10,228 | ) | | | (7,751 | ) |
The French statutory tax rate includes the standard corporate tax rate (33.33%) and additional applicable taxes that bring the overall tax rate to 36.10% in 2011 (versus 34.43% in 2008 (34.43% in 20072010 and 2006)2009). Permanent differences are mainly due to impairment of goodwill and to dividends from non-consolidated companies as well as the specific taxation rules applicable to certain activities and within the consolidated income tax treatment.activities. Net operating losses and tax credit carryforwards Deferred tax assets related to net operating losses and tax carryforwards were available in various tax jurisdictions, expiringexpire in the following years: | | | | | | | | | | | | | | As of December 31,(M€) | | 2008 | | 2007 | | 2006 | | | | Basis | | Tax | | Basis | | Tax | | Basis | | Tax | 2007 | | — | | — | | — | | — | | 234 | | 115 | 2008 | | — | | — | | 290 | | 141 | | 210 | | 102 | 2009 | | 233 | | 115 | | 222 | | 109 | | 157 | | 80 | 2010 | | 167 | | 79 | | 129 | | 59 | | 299 | | 104 | 2011(a) | | 93 | | 42 | | 33 | | 13 | | 23 | | 9 | 2012(b) | | 61 | | 19 | | 68 | | 22 | | — | | — | 2013 and after | | 1,765 | | 587 | | — | | — | | — | | — | Unlimited | | 560 | | 189 | | 641 | | 216 | | 638 | | 223 | Total | | 2,879 | | 1,031 | | 1,383 | | 560 | | 1,561 | | 633 |
| | | | | | | | | | | | | | | | | | | | | | | | | | | | 2011 | | | 2010 | | | 2009 | | As of December 31, (M€) | | Basis | | | Tax | | | Basis | | | Tax | | | Basis | | | Tax | | 2010 | | | — | | | | — | | | | — | | | | — | | | | 258 | | | | 126 | | 2011 | | | — | | | | — | | | | 225 | | | | 110 | | | | 170 | | | | 83 | | 2012 | | | 242 | | | | 115 | | | | 177 | | | | 80 | | | | 121 | | | | 52 | | 2013 | | | 171 | | | | 81 | | | | 146 | | | | 59 | | | | 133 | | | | 43 | | 2014(a) | | | 104 | | | | 47 | | | | 1,807 | | | | 602 | | | | 1,804 | | | | 599 | | 2015(b) | | | 8 | | | | 2 | | | | 190 | | | | 62 | | | | — | | | | — | | 2016 and after | | | 2,095 | | | | 688 | | | | — | | | | — | | | | — | | | | — | | Unlimited | | | 2,119 | | | | 651 | | | | 774 | | | | 232 | | | | 661 | | | | 211 | | Total | | | 4,739 | | | | 1,584 | | | | 3,319 | | | | 1,145 | | | | 3,147 | | | | 1,114 | |
| (a) | Net operating losses and tax credit carryforwards in 20112014 and after for 2006.2009. |
| (b) | Net operating losses and tax credit carryforwards in 20122015 and after for 2007.2010. |
10)INTANGIBLE ASSETS | | | | | | | | | As of December 31, 2008(M€) | | | | | | Cost | | Amortization
and
impairment | | | Net | Goodwill | | 1,690 | | (616 | ) | | 1,074 | Proved and unproved mineral interests | | 6,010 | | (2,268 | ) | | 3,742 | Other intangible assets | | 2,519 | | (1,994 | ) | | 525 | Total intangible assets | | 10,219 | | (4,878 | ) | | 5,341 |
| | As of December 31, 2007(M€) | | | | | | | Cost | | Amortization and impairment | | Net | | | As of December 31, 2011 (M€) | | | Cost | | | Amortization and
impairment | | Net | | Goodwill | | 1,684 | | (617 | ) | | 1,067 | | | 1,903 | | | | (993 | ) | | | 910 | | Proved and unproved mineral interests | | 5,327 | | (2,310 | ) | | 3,017 | | | 13,719 | | | | (3,181 | ) | | | 10,538 | | Other intangible assets | | 2,452 | | (1,886 | ) | | 566 | | | 3,377 | | | | (2,412 | ) | | | 965 | | Total intangible assets | | 9,463 | | (4,813 | ) | | 4,650 | | 18,999 | | | (6,586) | | 12,413 | |
| | As of December 31, 2006(M€) | | | | | | | Cost | | Amortization and impairment | | Net | | | As of December 31, 2010 (M€) | | | Cost | | | Amortization and
impairment | | Net | | Goodwill | | 1,759 | | (635 | ) | | 1,124 | | | 1,498 | | | | (596 | ) | | | 902 | | Proved and unproved mineral interests | | 5,457 | | (2,473 | ) | | 2,984 | | | 10,099 | | | | (2,712 | ) | | | 7,387 | | Other intangible assets | | 2,377 | | (1,780 | ) | | 597 | | | 2,803 | | | | (2,175 | ) | | | 628 | | Total intangible assets | | 9,593 | | (4,888 | ) | | 4,705 | | | 14,400 | | | | (5,483 | ) | | | 8,917 | |
| | | | | | | | | | | | | | As of December 31, 2009 (M€) | | Cost | | | Amortization and
impairment | | | Net | | Goodwill | | | 1,776 | | | | (614 | ) | | | 1,162 | | Proved and unproved mineral interests | | | 8,204 | | | | (2,421 | ) | | | 5,783 | | Other intangible assets | | | 2,712 | | | | (2,143 | ) | | | 569 | | Total intangible assets | | | 12,692 | | | | (5,178 | ) | | | 7,514 | |
Changes in net intangible assets are analyzed in the following table: | | | | | | | | | | | | | | | | | | | (M€) | | Net amount as of
January 1, | | Acquisitions | | Disposals | | | Amortization and impairment | | | Currency
translation
adjustment | | | Other | | Net amount as of
December 31, | 2008 | | 4,650 | | 404 | | (3 | ) | | (259 | ) | | (93 | ) | | 642 | | 5,341 | 2007 | | 4,705 | | 472 | | (160 | ) | | (274 | ) | | (208 | ) | | 115 | | 4,650 | 2006 | | 4,384 | | 675 | | (25 | ) | | (282 | ) | | (337 | ) | | 290 | | 4,705 |
| | | | | | | | | | | | | | | | | | | | | | | | | | | | | | (M€) | | Net
amount
as of
January 1, | | | Acquisitions | | | Disposals | | | Amortization
and
impairment | | | Currency
translation
adjustment | | | Other | | | Net amount
as of
December 31, | | 2011 | | | 8,917 | | | | 2,504 | | | | (428 | ) | | | (991 | ) | | | 358 | | | | 2,053 | | | | 12,413 | | 2010 | | | 7,514 | | | | 2,466 | | | | (62 | ) | | | (553 | ) | | | 491 | | | | (939 | ) | | | 8,917 | | 2009 | | | 5,341 | | | | 629 | | | | (64 | ) | | | (345 | ) | | | 2 | | | | 1,951 | | | | 7,514 | |
In 2008,2011, the heading “Other” mainly includes mainlyChesapeake’s Barnett shale mineral interests reclassified into the impact of “proved and unproved mineral interests” from Synenco Energy Inc.acquisitions for 221 M€(649) million, the not yet paid part of the acquisition of Chesapeake’s mineral interests in Utica for€1,216 million, the reclassification of Joslyn’s mineral interests sold in 2011 and Goal Petroleum B.V.formerly classified in accordance with IFRS 5 “Non-current assets held for 292 Msale and discontinued operations” for€384 million, and€697 million related to the acquisition of SunPower. In 2010, the heading “Other” mainly included Chesapeake’s Barnett shale mineral interests reclassified into the acquisitions for€(975) million and the reclassification of Joslyn’s mineral interests in accordance with IFRS 5 “Non-current assets held for sale and discontinued operations” for€(390) million, including the currency translation adjustment, partially compensated by the acquisition of UTS for€646 million (see Note 3 to the Consolidated Financial Statements). In 2009, the heading “Other” mainly included Chesapeake’s Barnett shale mineral interests for€1,449 million (see Note 3 to the Consolidated Financial Statements). A summary of changes in the carrying amount of goodwill by business segment for the year ended December 31, 20082011 is as follows: | | (M€) | | Net goodwill as of
January 1, 2008 | | Increases | | Impairments | | Other | | Net goodwill as of
December 31, 2008 | | Net goodwill as of
January 1, 2011 | | | Increases | | | Impairments | | Other | | Net goodwill as of
December 31, 2011 | | Upstream | | 78 | | — | | — | | | — | | | 78 | | | 78 | | | | 396 | | | | (383 | ) | | | (2 | ) | | | 89 | | Downstream | | 132 | | 4 | | — | | | (6 | ) | | 130 | | | 82 | | | | — | | | | (1 | ) | | | (12 | ) | | | 69 | | Chemicals | | 832 | | 24 | | (3 | ) | | (12 | ) | | 841 | | | 717 | | | | 23 | | | | (4 | ) | | | (9 | ) | | | 727 | | Corporate | | 25 | | — | | — | | | — | | | 25 | | | 25 | | | | — | | | | — | | | | — | | | | 25 | | Total | | 1,067 | | 28 | | (3 | ) | | (18 | ) | | 1,074 | | | 902 | | | | 419 | | | | (388 | ) | | | (23 | ) | | | 910 | |
In 2011, impairments of goodwill in the Upstream segment amount to€383 million and correspond to the impairment of the whole goodwill arising from the acquisition of SunPower (see Note 4E to the Consolidated Financial Statements). 11)PROPERTY, PLANT AND EQUIPMENT | | As of December 31, 2008(M€) | | | | | | | Cost | | Depreciation
and
impairment | | Net | | | As of December 31, 2011 (M€) | | | Cost | | | Depreciation and
impairment | | Net | | Upstream properties | | | | | | | | | | | | | Proved properties | | 61,727 | | (39,315 | ) | | 22,412 | | | 84,222 | | | | (54,589 | ) | | | 29,633 | | Unproved properties | | 106 | | (1 | ) | | 105 | | | 209 | | | | — | | | | 209 | | Work in progress | | 9,586 | | — | | | 9,586 | | | 21,190 | | | | (15 | ) | | | 21,175 | | Subtotal | | 71,419 | | (39,316 | ) | | 32,103 | | | 105,621 | | | | (54,604 | ) | | | 51,017 | | Other property, plant and equipment | | | | | | | | | | | | | Land | | 1,446 | | (429 | ) | | 1,017 | | | 1,346 | | | | (398 | ) | | | 948 | | Machinery, plant and equipment (including transportation equipment) | | 21,734 | | (14,857 | ) | | 6,877 | | | 25,838 | | | | (18,349 | ) | | | 7,489 | | Buildings | | 5,739 | | (3,441 | ) | | 2,298 | | | 6,241 | | | | (4,131 | ) | | | 2,110 | | Work in progress | | 2,226 | | (10 | ) | | 2,216 | | | 1,534 | | | | (306 | ) | | | 1,228 | | Other | | 6,258 | | (4,627 | ) | | 1,631 | | | 6,564 | | | | (4,899 | ) | | | 1,665 | | Subtotal | | 37,403 | | (23,364 | ) | | 14,039 | | | 41,523 | | | | (28,083 | ) | | | 13,440 | | Total property, plant and equipment | | 108,822 | | (62,680 | ) | | 46,142 | | | 147,144 | | | | (82,687 | ) | | | 64,457 | |
| | | | | | | | | As of December 31, 2007 (M€) | | | | | | Cost | | Depreciation
and
impairment | | | Net | Upstream properties | | | | | | | | Proved properties | | 60,124 | | (38,735 | ) | | 21,389 | Unproved properties | | 48 | | (1 | ) | | 47 | Work in progress | | 7,010 | | — | | | 7,010 | Subtotal | | 67,182 | | (38,736 | ) | | 28,446 | Other property, plant and equipment | | | | | | | | Land | | 1,460 | | (417 | ) | | 1,043 | Machinery, plant and equipment (including transportation equipment) | | 20,575 | | (14,117 | ) | | 6,458 | Buildings | | 5,505 | | (3,430 | ) | | 2,075 | Work in progress | | 1,832 | | (4 | ) | | 1,828 | Other | | 6,291 | | (4,674 | ) | | 1,617 | Subtotal | | 35,663 | | (22,642 | ) | | 13,021 | Total property, plant and equipment | | 102,845 | | (61,378 | ) | | 41,467 |
| | As of December 31, 2006(M€) | | | | | | | Cost | | Depreciation
and
impairment | | Net | | | As of December 31, 2010 (M€) | | | Cost | | | Depreciation and
impairment | | Net | | Upstream properties | | | | | | | | | | | | | Proved properties | | 60,063 | | (39,211 | ) | | 20,852 | | | 77,183 | | | | (50,582 | ) | | | 26,601 | | Unproved properties | | 20 | | (1 | ) | | 19 | | | 347 | | | | (1 | ) | | | 346 | | Work in progress | | 7,080 | | (22 | ) | | 7,058 | | | 14,712 | | | | (37 | ) | | | 14,675 | | Subtotal | | 67,163 | | (39,234 | ) | | 27,929 | | | 92,242 | | | | (50,620 | ) | | | 41,622 | | Other property, plant and equipment | | | | | | | | | | | | | Land | | 1,550 | | (445 | ) | | 1,105 | | | 1,304 | | | | (393 | ) | | | 911 | | Machinery, plant and equipment (including transportation equipment) | | 20,724 | | (14,131 | ) | | 6,593 | | | 23,831 | | | | (17,010 | ) | | | 6,821 | | Buildings | | 5,392 | | (3,289 | ) | | 2,103 | | | 6,029 | | | | (3,758 | ) | | | 2,271 | | Work in progress | | 1,228 | | (14 | ) | | 1,214 | | | 2,350 | | | | (488 | ) | | | 1,862 | | Other | | 6,154 | | (4,522 | ) | | 1,632 | | | 6,164 | | | | (4,687 | ) | | | 1,477 | | Subtotal | | 35,048 | | (22,401 | ) | | 12,647 | | | 39,678 | | | | (26,336 | ) | | | 13,342 | | Total property, plant and equipment | | 102,211 | | (61,635 | ) | | 40,576 | | | 131,920 | | | | (76,956 | ) | | | 54,964 | |
| | | | | | | | | | | | | | As of December 31, 2009 (M€) | | Cost | | | Depreciation and
impairment | | | Net | | Upstream properties | | | | | | | | | | | | | Proved properties | | | 71,082 | | | | (44,718 | ) | | | 26,364 | | Unproved properties | | | 182 | | | | (1 | ) | | | 181 | | Work in progress | | | 10,351 | | | | (51 | ) | | | 10,300 | | Subtotal | | | 81,615 | | | | (44,770 | ) | | | 36,845 | | Other property, plant and equipment | | | | | | | | | | | | | Land | | | 1,458 | | | | (435 | ) | | | 1,023 | | Machinery, plant and equipment (including transportation equipment) | | | 22,927 | | | | (15,900 | ) | | | 7,027 | | Buildings | | | 6,142 | | | | (3,707 | ) | | | 2,435 | | Work in progress | | | 2,774 | | | | (155 | ) | | | 2,619 | | Other | | | 6,506 | | | | (4,865 | ) | | | 1,641 | | Subtotal | | | 39,807 | | | | (25,062 | ) | | | 14,745 | | Total property, plant and equipment | | | 121,422 | | | | (69,832 | ) | | | 51,590 | |
Changes in net property, plant and equipment are analyzed in the following table: | | | | | | | | | | | | | | | | | | | | (M€) | | Net amount
as of
January 1, | | Acquisitions | | Disposals | | | Depreciation
and
impairment | | | Currency
translation
adjustment | | | Other | | | Net amount
as of
December 31, | 2008 | | 41,467 | | 11,442 | | (102 | ) | | (5,941 | ) | | (1,151 | ) | | 427 | | | 46,142 | 2007 | | 40,576 | | 10,241 | | (729 | ) | | (5,674 | ) | | (2,347 | ) | | (600 | ) | | 41,467 | 2006 | | 40,568 | | 9,209 | | (175 | ) | | (5,010 | ) | | (2,373 | ) | | (1,643 | ) | | 40,576 |
| | | | | | | | | | | | | | | | | | | | | | | | | | | | | | (M€) | | Net amount as
of January 1, | | | Acquisitions | | | Disposals | | | Depreciation and
impairment | | | Currency
translation
adjustment | | | Other | | | Net amount as of
December 31, | | 2011 | | | 54,964 | | | | 15,443 | | | | (1,489 | ) | | | (7,636 | ) | | | 1,692 | | | | 1,483 | | | | 64,457 | | 2010 | | | 51,590 | | | | 11,346 | | | | (1,269 | ) | | | (8,564 | ) | | | 2,974 | | | | (1,113 | ) | | | 54,964 | | 2009 | | | 46,142 | | | | 11,212 | | | | (65 | ) | | | (6,765 | ) | | | 397 | | | | 669 | | | | 51,590 | |
In 2008,2011, the “Other” heading “Disposals” mainly includes the impact of sales of assets in the Upstream segment (disposal of the interests in Gassled in Norway and in Joslyn’s field in Canada) and in the Downstream segment (disposal of Marketing assets in the United Kingdom) (see Note 3 to the Consolidated Financial Statements). In 2011, the heading “Depreciation and impairment” includes the impact of impairments of assets recognized for€781 million (see Note 4D to the Consolidated Financial Statements). In 2011, the heading “Other” corresponds to the increase of the asset for sites restitution for an amount of€653 million. It also includes€428 million related to the reclassification of tangible assets of Joslyn and resins businesses sold in 2011 and formerly classified in accordance with IFRS 5 “Non-current assets held for sale and discontinued operations”. In 2010, the heading “Disposals” mainly included the impact of sales of assets in the Upstream segment (sale of the interests in the Valhall and Hod fields in Norway and sale of the interest in Block 31 in Angola, see Note 3 to the Consolidated Financial Statements). In 2010, the heading “Depreciation and impairment” included the impact of impairments of assets recognized for€1,416 million (see Note 4D to the Consolidated Financial Statements). In 2010, the heading “Other” mainly corresponded to the change in the consolidation method of Samsung Total Petrochemicals (see Note 12 to the Consolidated Financial Statements) for€(541) million and the reclassification for€(537) million, including the currency translation adjustment, of property, plant and equipment related to Joslyn, Total E&P Cameroun, and resins businesses subject to a disposal project in accordance with IFRS 5 “Non-current assets held for sale and discontinued operations”, partially compensated by the acquisition of UTS for€217 million (see Note 3 to the Consolidated Financial Statements). In 2009, the heading “Other” mainly included changes in net property, plant and equipment related to asset retirement obligations. In 2007,obligations and Chesapeake’s Barnett shale tangible assets for€113 million (see Note 3 to the “Disposals” heading mainly included the impact of conversion of the Sincor project and the disposal of the Group’s interest in the Milford Haven refinery. The “Other” heading mainly included the impact of conversion of Sincor and the changes in Property, plant and equipment related to asset retirement obligations.
In 2006, the “Other” heading mainly included the impact of the spin-off of Arkema for 1,310 M€Consolidated Financial Statements).
Property, plant and equipment presented above include the following amounts for facilities and equipment under finance leases that have been capitalized: | | | | | | | | | As of December 31, 2008(M€) | | | | | | Cost | | Depreciation
and
impairment | | | Net | Machinery, plant and equipment | | 558 | | (316 | ) | | 242 | Buildings | | 35 | | (28 | ) | | 7 | Other | | — | | — | | | — | Total | | 593 | | (344 | ) | | 249 |
| | | | | | | | | As of December 31, 2007(M€) | | | | | | Cost | | Depreciation
and
impairment | | | Net | Machinery, plant and equipment | | 503 | | (265 | ) | | 238 | Buildings | | 35 | | (29 | ) | | 6 | Other | | — | | — | | | — | Total | | 538 | | (294 | ) | | 244 |
| | As of December 31, 2006(M€) | | | | | | | Cost | | Depreciation
and
impairment | | Net | | | As of December 31, 2011 (M€) | | | Cost | | | Depreciation and
impairment | | Net | | Machinery, plant and equipment | | 518 | | (244 | ) | | 274 | | | 414 | | | | (284 | ) | | | 130 | | Buildings | | 40 | | (27 | ) | | 13 | | | 54 | | | | (25 | ) | | | 29 | | Other | | — | | — | | | — | | | — | | | | — | | | | — | | Total | | 558 | | (271 | ) | | 287 | | | 468 | | | | (309 | ) | | | 159 | | | | As of December 31, 2010 (M€) | | | Cost | | | Depreciation and
impairment | | Net | | Machinery, plant and equipment | | | | 480 | | | | (332 | ) | | | 148 | | Buildings | | | | 54 | | | | (24 | ) | | | 30 | | Other | | | | — | | | | — | | | | — | | Total | | | | 534 | | | | (356 | ) | | | 178 | | | | As of December 31, 2009 (M€) | | | Cost | | | Depreciation and
impairment | | Net | | Machinery, plant and equipment | | | | 548 | | | | (343 | ) | | | 205 | | Buildings | | | | 60 | | | | (30 | ) | | | 30 | | Other | | | | — | | | | — | | | | — | | Total | | | | 608 | | | | (373 | ) | | | 235 | |
12)EQUITY AFFILIATES: INVESTMENTS AND LOANS | | | | | | | | | | | | | | | | | As of December 31, | | | Equity value (M€) | | As of December 31, | | 2011 | | 2010 | | 2009 | | 2011 | | | 2010 | | | 2009 | | | | | 2008 | | 2007 | | 2006 | | 2008 | | 2007 | | 2006 | | | | | | % owned | | | | Equity value | | Equity value (M€) | | | % owned | | equity value | | | | 15.00 | % | | 15.00 | % | | 15.00 | % | | 1,135 | | 1,062 | | 887 | | | 15.00 | % | | | 15.00 | % | | | 15.00 | % | | | 953 | | | | 1,108 | | | | 1,136 | | PetroCedeño — EM(b) | | 30.32 | % | | 30.32 | % | | — | | | 760 | | 534 | | — | | | 30.32 | % | | | 30.32 | % | | | 30.32 | % | | | 1,233 | | | | 1,136 | | | | 874 | | CEPSA (Upstream share) | | 48.83 | % | | 48.83 | % | | 48.83 | % | | 403 | | 246 | | 253 | | | — | | | | 48.83 | % | | | 48.83 | % | | | — | | | | 340 | | | | 385 | | Angola LNG Ltd.(b) | | 13.60 | % | | 13.60 | % | | — | | | 326 | | 155 | | — | | | 13.60 | % | | | 13.60 | % | | | 13.60 | % | | | 869 | | | | 710 | | | | 490 | | Qatargas | | 10.00 | % | | 10.00 | % | | 10.00 | % | | 251 | | 172 | | 186 | | | 10.00 | % | | | 10.00 | % | | | 10.00 | % | | | 97 | | | | 85 | | | | 83 | | Société du Terminal Méthanier de Fos Cavaou(a) | | 30.30 | % | | 30.30 | % | | 30.30 | % | | 114 | | 92 | | 63 | | | 27.60 | % | | | 28.03 | % | | | 28.79 | % | | | 119 | | | | 125 | | | | 124 | | SCP Limited | | 10.00 | % | | 10.00 | % | | 10.00 | % | | 96 | | 91 | | 100 | | Dolphin Energy Ltd (Del) Abu Dhabi | | 24.50 | % | | 24.50 | % | | 24.50 | % | | 85 | | 37 | | 16 | | | 24.50 | % | | | 24.50 | % | | | 24.50 | % | | | 208 | | | | 172 | | | | 118 | | Qatar Liquefied Gas Company Limited II(a) | | 8.35 | % | | 8.35 | % | | 8.35 | % | | 82 | | 86 | | 55 | | Moattama Gas Transportation Cy | | 31.24 | % | | 31.24 | % | | 31.24 | % | | 65 | | 53 | | 61 | | Ocensa | | 15.20 | % | | 15.20 | % | | 15.20 | % | | 60 | | 57 | | 64 | | Gasoducto Gasandes Argentina | | 56.50 | % | | 56.50 | % | | 56.50 | % | | 58 | | 74 | | 115 | | GazTransport et Technigaz(b) | | 30.00 | % | | 30.00 | % | | — | | | 53 | | 46 | | — | | Laffan Refinery | | 10.00 | % | | 10.00 | % | | 10.00 | % | | 53 | | 39 | | 22 | | Qatar Liquefied Gas Company Limited II (Train B) | | | | 16.70 | % | | | 16.70 | % | | | 16.70 | % | | | 209 | | | | 184 | | | | 143 | | Yemen LNG Co | | | | 39.62 | % | | | 39.62 | % | | | 39.62 | % | | | 169 | | | | 25 | | | | (15 | ) | Shtokman Development AG | | | | 25.00 | % | | | 25.00 | % | | | 25.00 | % | | | 248 | | | | 214 | | | | 162 | | AMYRIS(a) | | | | 21.37 | % | | | 22.03 | % | | | — | | | | 79 | | | | 101 | | | | — | | Novatek(e) | | | | 14.09 | % | | | — | | | | — | | | | 3,368 | | | | — | | | | — | | Other | | — | | | — | | | — | | | 350 | | 277 | | 331 | | | — | | | | — | | | | — | | | | 803 | | | | 724 | | | | 760 | | Total associates | | | | | | | | | | 8,355 | | | | 4,924 | | | | 4,260 | | Yamal LNG(e) | | | | 20.01 | % | | | — | | | | — | | | | 495 | | | | — | | | | — | | Ichthys LNG Ltd(e) | | | | 24.00 | % | | | — | | | | — | | | | 82 | | | | — | | | | — | | Other | | | | — | | | | — | | | | — | | | | — | | | | 78 | | | | — | | Total jointly-controlled entities | | | | | 577 | | | | 78 | | | | — | | Total Upstream | | | | | | | | 3,891 | | 3,021 | | 2,153 | | | | | | | | | 8,932 | | | | 5,002 | | | | 4,260 | | CEPSA (Downstream share) | | 48.83 | % | | 48.83 | % | | 48.83 | % | | 1,810 | | 1,932 | | 1,735 | | Saudi Aramco Total Refining & Petrochemicals(c) | | 37.50 | % | | — | | | — | | | 75 | | — | | — | | Wepec | | 22.41 | % | | 22.41 | % | | 22.41 | % | | — | | 70 | | 62 | | CEPSA (Downstream share)(d) | | | | — | | | | 48.83 | % | | | 48.83 | % | | | — | | | | 2,151 | | | | 1,927 | | Saudi Aramco Total Refining & Petrochemicals (Downstream share) | | | | 37.50 | % | | | 37.50 | % | | | 37.50 | % | | | 112 | | | | 47 | | | | 60 | | Other | | | 73 | | 103 | | 125 | | | — | | | | — | | | | — | | | | 166 | | | | 159 | | | | 123 | | Total associates | | | | | | | | | | 278 | | | | 2,357 | | | | 2,110 | | SARA(c) | | | | 50.00 | % | | | 50.00 | % | | | — | | | | 125 | | | | 134 | | | | — | | TotalErg(a) | | | | 49.00 | % | | | 49.00 | % | | | — | | | | 296 | | | | 289 | | | | — | | Other | | | | — | | | | — | | | | — | | | | — | | | | 2 | | | | — | | Total jointly-controlled entities | | | | | 421 | | | | 425 | | | | — | | Total Downstream | | | | | | | | 1,958 | | 2,105 | | 1,922 | | | | | | | | | 699 | | | | 2,782 | | | | 2,110 | | CEPSA (Chemicals share) | | 48.83 | % | | 48.83 | % | | 48.83 | % | | 424 | | 524 | | 503 | | Qatar Petrochemical Company Ltd | | 20.00 | % | | 20.00 | % | | 20.00 | % | | 192 | | 150 | | 147 | | CEPSA (Chemicals share)(d) | | | | — | | | | 48.83 | % | | | 48.83 | % | | | — | | | | 411 | | | | 396 | | Qatar Petrochemical Company Ltd. | | | | 20.00 | % | | | 20.00 | % | | | 20.00 | % | | | 240 | | | | 221 | | | | 205 | | Saudi Aramco Total Refining & Petrochemicals (Chemicals share) | | | | 37.50 | % | | | 37.50 | % | | | 37.50 | % | | | 9 | | | | 4 | | | | 5 | | Qatofin Company Limited | | | | 36.36 | % | | | 36.36 | % | | | 36.36 | % | | | 136 | | | | 27 | | | | 9 | | Other | | | 61 | | 54 | | 63 | | | — | | | | — | | | | — | | | | 27 | | | | 41 | | | | 37 | | Total associates | | | | | | | | | | 412 | | | | 704 | | | | 652 | | Samsung Total Petrochemicals(c) | | | | 50.00 | % | | | 50.00 | % | | | — | | | | 706 | | | | 645 | | | | — | | Total jointly-controlled entities | | | | | 706 | | | | 645 | | | | — | | Total Chemicals | | | | | | | | 677 | | 728 | | 713 | | | | | | | | | 1,118 | | | | 1,349 | | | | 652 | | Sanofi-Aventis | | 11.38 | % | | 13.06 | % | | 13.13 | % | | 6,137 | | 6,851 | | 7,010 | | Other | | | — | | — | | — | | Sanofi(b) | | | | — | | | | — | | | | 7.39 | % | | | — | | | | — | | | | 4,235 | | Total associates | | | | | | | | | | — | | | | — | | | | 4,235 | | Total jointly-controlled entities | | | | | — | | | | — | | | | — | | Total Corporate | | | 6,137 | | 6,851 | | 7,010 | | | | — | | | | — | | | | 4,235 | | Total investments | | | 12,663 | | 12,705 | | 11,798 | | | | | | | | | 10,749 | | | | 9,133 | | | | 11,257 | | Loans | | | 2,005 | | 2,575 | | 1,533 | | | | 2,246 | | | | 2,383 | | | | 2,367 | | Total investments and loans | | | 14,668 | | 15,280 | | 13,331 | | | | 12,995 | | | | 11,516 | | | | 13,624 | |
| (a) | Investment accounted for by the equity method as from 2006.2010. |
| (b) | End of the accounting for by the equity method of Sanofi as of July 1st, 2010 (see Note 3 to the Consolidated Financial Statements). |
| (c) | Change in the consolidation method as of January 1st, 2010. |
| (d) | Sale of CEPSA on July 29th, 2011. |
| (e) | Investment accounted for by the equity method as from 2007. |
(c) | Investment accounted for by the equity method as from 2008.2011. |
| | | | | As of December 31, | | For the year ended December 31, | | | | | | | | | | | | | | | | 2011 | | 2010 | | 2009 | | 2011 | | 2010 | | 2009 | | | Equity in income (loss) (M€) | | As of December 31, | | For the year ended December 31, | | | % owned | | Equity in income (loss) | | | | | 2008 | | 2007 | | 2006 | | 2008 | | 2007 | | 2006 | | | | | | | % owned | | | | Equity in income (loss) | | | NLNG | | 15.00 | % | | 15.00 | % | | 15.00 | % | | 554 | | | 477 | | | 329 | | | | 15.00 | % | | | 15.00 | % | | | 15.00 | % | | | 374 | | | | 207 | | | | 227 | | PetroCedeño — EM(b) | | 30.32 | % | | 30.32 | % | | — | | | 193 | | | — | | | — | | | | 30.32 | % | | | 30.32 | % | | | 30.32 | % | | | 55 | | | | 195 | | | | 166 | | CEPSA (Upstream share) | | 48.83 | % | | 48.83 | % | | 48.83 | % | | 50 | | | 88 | | | 104 | | | | — | | | | 48.83 | % | | | 48.83 | % | | | 15 | | | | 57 | | | | 23 | | Angola LNG Ltd.(b) | | 13.60 | % | | 13.60 | % | | — | | | 10 | | | 7 | | | — | | | | 13.60 | % | | | 13.60 | % | | | 13.60 | % | | | 6 | | | | 8 | | | | 9 | | Qatargas | | 10.00 | % | | 10.00 | % | | 10.00 | % | | 126 | | | 74 | | | 119 | | | | 10.00 | % | | | 10.00 | % | | | 10.00 | % | | | 196 | | | | 136 | | | | 114 | | Société du Terminal Méthanier de Fos Cavaou(a) | | 30.30 | % | | 30.30 | % | | 30.30 | % | | (5 | ) | | (2 | ) | | (4 | ) | | | 27.60 | % | | | 28.03 | % | | | 28.79 | % | | | 13 | | | | — | | | | — | | SCP Limited | | 10.00 | % | | 10.00 | % | | 10.00 | % | | 4 | | | 1 | | | — | | | Dolphin Energy Ltd (Del) Abu Dhabi | | 24.50 | % | | 24.50 | % | | 24.50 | % | | 83 | | | 5 | | | (2 | ) | | | 24.50 | % | | | 24.50 | % | | | 24.50 | % | | | 131 | | | | 121 | | | | 94 | | Qatar Liquefied Gas Company Limited II(a) | | 8.35 | % | | 8.35 | % | | 8.35 | % | | (11 | ) | | (5 | ) | | — | | | Moattama Gas Transportation Cy | | 31.24 | % | | 31.24 | % | | 31.24 | % | | 81 | | | 67 | | | 63 | | | Ocensa | | 15.20 | % | | 15.20 | % | | 15.20 | % | | — | | | — | | | — | | | Gasoducto Gasandes Argentina | | 56.50 | % | | 56.50 | % | | 56.50 | % | | (10 | ) | | (22 | ) | | 7 | | | GazTransport et Technigaz(b) | | 30.00 | % | | 30.00 | % | | — | | | 51 | | | 45 | | | — | | | Laffan Refinery | | 10.00 | % | | 10.00 | % | | 10.00 | % | | 2 | | | — | | | — | | | Qatar Liquefied Gas Company Limited II (Train B) | | | | 16.70 | % | | | 16.70 | % | | | 16.70 | % | | | 446 | | | | 288 | | | | 8 | | Yemen LNG Co | | | | 39.62 | % | | | 39.62 | % | | | 39.62 | % | | | 130 | | | | 37 | | | | 34 | | Shtokman Development AG | | | | 25.00 | % | | | 25.00 | % | | | 25.00 | % | | | 1 | | | | (5 | ) | | | 4 | | AMYRIS(a) | | | | 21.37 | % | | | 22.03 | % | | | — | | | | (23 | ) | | | (3 | ) | | | — | | Novatek(e) | | | | 14.09 | % | | | — | | | | — | | | | 24 | | | | — | | | | — | | Other | | — | | | — | | | — | | | 50 | | | 6 | | | 30 | | | | — | | | | — | | | | — | | | | 274 | | | | 140 | | | | 180 | | Total associates | | | | | | | | | | 1,642 | | | | 1,181 | | | | 859 | | Yamal LNG(e) | | | | 20.01 | % | | | — | | | | — | | | | — | | | | — | | | | — | | Ichthys LNG Ltd(e) | | | | 24.00 | % | | | — | | | | — | | | | (7 | ) | | | — | | | | — | | Other | | | | — | | | | — | | | | — | | | | (56 | ) | | | 6 | | | | — | | Total jointly-controlled entities | | | | | (63 | ) | | | 6 | | | | — | | Total Upstream | | | | | | | | 1,178 | | | 741 | | | 646 | | | | | | | | | | 1,579 | | | | 1,187 | | | | 859 | | CEPSA (Downstream share) | | 48.83 | % | | 48.83 | % | | 48.83 | % | | 76 | | | 253 | | | 246 | | | Saudi Aramco Total Refining & Petrochemicals(c) | | 37.50 | % | | — | | | — | | | — | | | — | | | — | | | Wepec | | 22.41 | % | | 22.41 | % | | 22.41 | % | | (110 | ) | | 14 | | | 1 | | | CEPSA (Downstream share)(d) | | | | — | | | | 48.83 | % | | | 48.83 | % | | | 26 | | | | 172 | | | | 149 | | Saudi Aramco Total Refining & Petrochemicals (Downstream share) | | | | 37.50 | % | | | 37.50 | % | | | 37.50 | % | | | (27 | ) | | | (19 | ) | | | (12 | ) | Other | | | (13 | ) | | (1 | ) | | 26 | | | | — | | | | — | | | | — | | | | 24 | | | | 76 | | | | 81 | | Total associates | | | | | | | | | | 23 | | | | 229 | | | | 218 | | SARA(c) | | | | 50.00 | % | | | 50.00 | % | | | — | | | | 11 | | | | 31 | | | | — | | TotalErg(a) | | | | 49.00 | % | | | 49.00 | % | | | — | | | | 7 | | | | (11 | ) | | | — | | Other | | | | — | | | | — | | | | — | | | | 1 | | | | 2 | | | | — | | Total jointly-controlled entities | | | | | 19 | | | | 22 | | | | — | | Total Downstream | | | | | | | | (47 | ) | | 266 | | | 273 | | | | | | | | | | 42 | | | | 251 | | | | 218 | | CEPSA (Chemicals share) | | 48.83 | % | | 48.83 | % | | 48.83 | % | | 10 | | | 24 | | | 26 | | | Qatar Petrochemical Company Ltd | | 20.00 | % | | 20.00 | % | | 20.00 | % | | 66 | | | 55 | | | 45 | | | CEPSA (Chemicals share)(d) | | | | — | | | | 48.83 | % | | | 48.83 | % | | | 19 | | | | 78 | | | | 10 | | Qatar Petrochemical Company Ltd. | | | | 20.00 | % | | | 20.00 | % | | | 20.00 | % | | | 89 | | | | 84 | | | | 74 | | Saudi Aramco Total Refining & Petrochemicals (Chemicals share) | | | | 37.50 | % | | | 37.50 | % | | | 37.50 | % | | | (3 | ) | | | (1 | ) | | | (1 | ) | Qatofin Company Limited | | | | 36.36 | % | | | 36.36 | % | | | 36.36 | % | | | 98 | | | | 36 | | | | (5 | ) | Other | | | (1 | ) | | 1 | | | — | | | | — | | | | — | | | | — | | | | (13 | ) | | | 5 | | | | 1 | | Total associates | | | | | | | | | | 190 | | | | 202 | | | | 79 | | Samsung Total Petrochemicals(c) | | | | 50.00 | % | | | 50.00 | % | | | — | | | | 114 | | | | 104 | | | | — | | Total jointly-controlled entities | | | | | 114 | | | | 104 | | | | — | | Total Chemicals | | | | | | | | 75 | | | 80 | | | 71 | | | | | | | | | | 304 | | | | 306 | | | | 79 | | Sanofi-Aventis | | 11.38 | % | | 13.06 | % | | 13.13 | % | | 515 | | | 688 | | | 556 | | | CEPSA (Corporate share) | | 48.83 | % | | 48.83 | % | | 48.83 | % | | — | | | — | | | 147 | | | Other | | | — | | | — | | | — | | | Sanofi(b) | | | | — | | | | — | | | | 7.39 | % | | | — | | | | 209 | | | | 486 | | Total associates | | | | | | | | | | — | | | | 209 | | | | 486 | | Total jointly-controlled entities | | | | | — | | | | — | | | | — | | Total Corporate | | | 515 | | | 688 | | | 703 | | | | | — | | | | 209 | | | | 486 | | Total investments | | | 1,721 | | | 1,775 | | | 1,693 | | | | | 1,925 | | | | 1,953 | | | | 1,642 | |
| (a) | Investment accounted for by the equity method as from 2006.2010. |
| (b) | End of the accounting for by the equity method of Sanofi as of July 1st, 2010 (see Note 3 to the Consolidated Financial Statements). |
| (c) | Change in the consolidation method as of January 1st, 2010. |
| (d) | Sale of CEPSA on July 29th, 2011. |
| (e) | Investment accounted for by the equity method as from 2007.2011. |
(c) | Investment accounted for by the equity method as from 2008. |
The market value of the Group's share in CEPSA amounted to 8,833 M€ as of December 31, 2008 for an equity value of 2,637 M€.
The market value of the Group’s share in Sanofi-Aventis amountedNovatek amounts to 6,744 M€4,034 million as of December 31, 2008.2011 for an equity value of€3,368 million. In Group share, the main financial items of the equity affiliates are as follows: follows:
| | | As of December 31, (M€) | | 2008 | Assets
| | 23,173 | Shareholders' equity
| | 12,663 | Liabilities
| | 10,510 |
| | | | For the year ended December 31,(M€)
| | 2008 | | Revenues from sales
| | 19,982 | | Pre-tax income
| | 2,412 | | Income tax
| | (691 | ) | Net income
| | 1,721 | |
| | | | | | | | | | | | | | | | | | | | | | | | | As of December 31, (M€) | | 2011 | | | 2010 | | | 2009 | | | | Associates | | | Jointly-
controlled
entities | | | Associates | | | Jointly-
controlled
entities | | | Associates | | | Jointly-
controlled
entities | | Assets | | | 18,088 | | | | 3,679 | | | | 19,192 | | | | 2,770 | | | | 22,681 | | | | — | | Shareholders’ equity | | | 9,045 | | | | 1,704 | | | | 7,985 | | | | 1,148 | | | | 11,257 | | | | — | | Liabilities | | | 9,043 | | | | 1,975 | | | | 11,207 | | | | 1,622 | | | | 11,424 | | | | — | | | | | | | | | | | | | | | | | | | | | | | | | | | | | | | 2011 | | | 2010 | | | 2009 | | | For the year ended December 31, (M€) | | Associates | | | Jointly-
controlled
entities | | | Associates | | | Jointly-
controlled
entities | | | Associates | | | Jointly-
controlled
entities | | Revenues from sales | | | 9,948 | | | | 5,631 | | | | 16,529 | | | | 2,575 | | | | 14,434 | | | | — | | Pre-tax income | | | 2,449 | | | | 119 | | | | 2,389 | | | | 166 | | | | 2,168 | | | | — | | Income tax | | | (594 | ) | | | (49 | ) | | | (568 | ) | | | (34 | ) | | | (526 | ) | | | — | | Net income | | | 1,855 | | | | 70 | | | | 1,821 | | | | 132 | | | | 1,642 | | | | | |
13)OTHER INVESTMENTS The investments detailed below are classified as “Financial assets available for sale” (see Note 1 paragraph M(ii) to the Consolidated Financial Statements). | | As of December 31,2008(M€) | | Carrying
amount | | Unrealized gain (loss) | | Balance
Sheet value | | Areva(a) | | 69 | | 59 | | | 128 | | As of December 31, 2011 (M€) | | | Carrying
amount | | | Unrealized gain (loss) | | Balance sheet value | | Sanofi(a) | | | | 2,100 | | | | 351 | | | | 2,451 | | Areva(b) | | | | 69 | | | | 1 | | | | 70 | | Arkema | | 16 | | 15 | | | 31 | | | — | | | | — | | | | — | | Chicago Mercantile Exchange Group(b) | | 1 | | 5 | | | 6 | | Olympia Energy Fund(c) | | 36 | | (5 | ) | | 31 | | Chicago Mercantile Exchange Group | | | | 1 | | | | 6 | | | | 7 | | Olympia Energy Fund — energy investment fund | | | | 38 | | | | (5 | ) | | | 33 | | Gevo | | | | 15 | | | | (3 | ) | | | 12 | | Other publicly traded equity securities | | — | | — | | | — | | | 3 | | | | (1 | ) | | | 2 | | Total publicly traded equity securities(d) | | 122 | | 74 | | | 196 | | Total publicly traded equity securities(c) | | | | 2,226 | | | | 349 | | | | 2,575 | | BBPP | | | | 62 | | | | — | | | | 62 | | Ocensa(d) | | | | 85 | | | | — | | | | 85 | | BTC Limited | | | | 132 | | | | — | | | | 132 | | Other equity securities | | | | 820 | | | | — | | | | 820 | | Total other equity securities(c) | | | | 1,099 | | | | — | | | | 1,099 | | Other investments | | | | 3,325 | | | | 349 | | | | 3,674 | | | | | | | | | As of December 31, 2010 (M€) | | | Carrying
amount | | | Unrealized gain (loss) | | Balance sheet value | | Sanofi(a) | | | | 3,510 | | | | (56 | ) | | | 3,454 | | Areva(b) | | | | 69 | | | | 63 | | | | 132 | | Arkema | | | | — | | | | — | | | | — | | Chicago Mercantile Exchange Group | | | | 1 | | | | 9 | | | | 10 | | Olympia Energy Fund — energy investment fund | | | | 37 | | | | (3 | ) | | | 34 | | Other publicly traded equity securities | | | | 2 | | | | (1 | ) | | | 1 | | Total publicly traded equity securities(c) | | | | 3,619 | | | | 12 | | | | 3,631 | | BBPP | | 75 | | — | | | 75 | | | 60 | | | | — | | | | 60 | | BTC Limited | | 161 | | — | | | 161 | | | 141 | | | | — | | | | 141 | | Other equity securities | | 733 | | — | | | 733 | | | 758 | | | | — | | | | 758 | | Total other equity securities(d) | | 969 | | — | | | 969 | | Total other equity securities(c) | | | | 959 | | | | — | | | | 959 | | Other investments | | 1,091 | | 74 | | | 1,165 | | | 4,578 | | | | 12 | | | | 4,590 | | | | | | | | | | | As of December 31, 2007(M€) | | Carrying
amount | | Unrealized gain (loss) | | Balance
Sheet value | | Areva(a) | | 69 | | 216 | | | 285 | | Arkema | | 16 | | 97 | | | 113 | | Nymex Holdings Inc | | 1 | | 15 | | | 16 | | Other publicly traded equity securities | | — | | — | | | — | | Total publicly traded equity securities(d) | | 86 | | 328 | | | 414 | | BBPP | | 71 | | — | | | 71 | | BTC Limited | | 161 | | — | | | 161 | | Other equity securities | | 645 | | — | | | 645 | | Total other equity securities(d) | | 877 | | — | | | 877 | | Other investments | | 963 | | 328 | | | 1,291 | |
| | As of December 31,(M€) | | 2006 | | | | | Carrying
amount | | Unrealized
gain (loss) | | Balance
sheet value | | Areva(a) | | 69 | | 135 | | 204 | | As of December 31, 2009 (M€) | | | Carrying
amount | | | Unrealized gain (loss) | | Balance sheet value | | Areva(b) | | | | 69 | | | | 58 | | | | 127 | | Arkema | | 16 | | 82 | | 98 | | | 15 | | | | 47 | | | | 62 | | Chicago Mercantile Exchange Group | | | | 1 | | | | 9 | | | | 10 | | Olympia Energy Fund — energy investment fund | | | | 35 | | | | (2 | ) | | | 33 | | Other publicly traded equity securities | | 1 | | 1 | | 2 | | | — | | | | — | | | | — | | Total publicly traded equity securities(d) | | 86 | | 218 | | 304 | | Total publicly traded equity securities(c) | | | | 120 | | | | 112 | | | | 232 | | BBPP | | 80 | | — | | 80 | | | 72 | | | | — | | | | 72 | | BTC Limited | | 185 | | — | | 185 | | | 144 | | | | — | | | | 144 | | Other equity securities | | 681 | | — | | 681 | | | 714 | | | | — | | | | 714 | | Total other equity securities(d) | | 946 | | — | | 946 | | Total other equity securities(c) | | | | 930 | | | | — | | | | 930 | | Other investments | | 1,032 | | 218 | | 1,250 | | | 1,050 | | | | 112 | | | | 1,162 | |
| (a) | End of the accounting for by the equity method of Sanofi as of July 1st, 2010 (see Note 3 to the Consolidated Financial Statements). |
| (b) | Unrealized gain based on the investment certificate. |
(b) | The Nymex Holdings Inc. securities have been exchanged during the acquisition process running from June 11 to August 22, 2008 through which Chicago Mercantile Exchange Group acquired all the Nymex Holdings Inc. securities. |
| (c) | Securities acquiredIncluding cumulative impairments of€604 million in 2008.2011,€597 million in 2010 and€599 million in 2009. |
| (d) | Including cumulative impairmentsEnd of 608 M€the accounting for by the equity method of Ocensa in 2008, 632 M€ in 2007 and 668 M€ in 2006.July 2011 (see Note 3 to the Consolidated Financial Statements). |
These investments are classified as financial assets available for sale (see Note 1 paragraph Mii to the Consolidated Financial Statements).
14)OTHER NON-CURRENT ASSETS | | As of December 31, 2008(M€) | | Gross
value | | Valuation
allowance | | Net
value | | As of December 31, 2011 (M€) | | | Gross value | | | Valuation
allowance | | Net value | | Deferred income tax assets | | 1,010 | | — | | | 1,010 | | | 1,767 | | | | — | | | | 1,767 | | Loans and advances(a) | | 1,932 | | (529 | ) | | 1,403 | | | 2,454 | | | | (399 | ) | | | 2,055 | | Other | | 631 | | — | | | 631 | | | 1,049 | | | | — | | | | 1,049 | | Total | | 3,573 | | (529 | ) | | 3,044 | | | 5,270 | | | | (399 | ) | | | 4,871 | |
| | As of December 31, 2007(M€) | | Gross
value | | Valuation
allowance | | Net
value | | As of December 31, 2010 (M€) | | | Gross value | | | Valuation
allowance | | Net value | | Deferred income tax assets | | 797 | | — | | | 797 | | | 1,378 | | | | — | | | | 1,378 | | Loans and advances(a) | | 1,378 | | (527 | ) | | 851 | | | 2,060 | | | | (464 | ) | | | 1,596 | | Other | | 507 | | — | | | 507 | | | 681 | | | | — | | | | 681 | | Total | | 2,682 | | (527 | ) | | 2,155 | | | 4,119 | | | | (464 | ) | | | 3,655 | |
| | As of December 31, 2006(M€) | | Gross
value | | Valuation
allowance | | Net
value | | As of December 31, 2009 (M€) | | | Gross value | | | Valuation
allowance | | Net value | | Deferred income tax assets | | 806 | | — | | | 806 | | | 1,164 | | | | — | | | | 1,164 | | Loans and advances(a) | | 1,513 | | (488 | ) | | 1,025 | | | 1,871 | | | | (587 | ) | | | 1,284 | | Other | | 257 | | — | | | 257 | | | 633 | | | | — | | | | 633 | | Total | | 2,576 | | (488 | ) | | 2,088 | | | 3,668 | | | | (587 | ) | | | 3,081 | |
| (a) | Excluding loans to equity affiliates. |
Changes in the valuation allowance on loans and advances are detailed as follows: | | | | | | | | | | | | | | | (M€) For the year ended December 31, | | Valuation
allowance as of
January 1, | | | Increases | | | Decreases | | Currency
translation
adjustment and
other variations | | | Valuation
allowance as of
December 31, | | 2008 | | (527 | ) | | (33 | ) | | 52 | | (21 | ) | | (529 | ) | 2007 | | (488 | ) | | (13 | ) | | 6 | | (32 | ) | | (527 | ) | 2006 | | (584 | ) | | (6 | ) | | 23 | | 79 | | | (488 | ) |
| | | | | | | | | | | | | | | | | | | | | For the year ended December 31, (M€) | | Valuation
allowance as
of January 1, | | | Increases | | | Decreases | | | Currency
translation
adjustment and
other variations | | | Valuation
allowance as of
December 31, | | 2011 | | | (464 | ) | | | (25 | ) | | | 122 | | | | (32 | ) | | | (399 | ) | 2010 | | | (587 | ) | | | (33 | ) | | | 220 | | | | (64 | ) | | | (464 | ) | 2009 | | | (529 | ) | | | (19 | ) | | | 29 | | | | (68 | ) | | | (587 | ) |
15)INVENTORIES | | As of December 31, 2008(M€) | | Gross value | | Valuation
allowance | | Net value | | As of December 31, 2011 (M€) | | | Gross value | | | Valuation
allowance | | Net value | | Crude oil and natural gas | | 2,772 | | (326 | ) | | 2,446 | | | 4,735 | | | | (24 | ) | | | 4,711 | | Refined products | | 4,954 | | (416 | ) | | 4,538 | | | 9,706 | | | | (36 | ) | | | 9,670 | | Chemicals products | | 1,419 | | (105 | ) | | 1,314 | | | 1,489 | | | | (103 | ) | | | 1,386 | | Other inventories | | 1,591 | | (268 | ) | | 1,323 | | | 2,761 | | | | (406 | ) | | | 2,355 | | Total | | 10,736 | | (1,115 | ) | | 9,621 | | | 18,691 | | | | (569 | ) | | | 18,122 | |
| | | | | | | | | | | | | | As of December 31, 2010 (M€) | | Gross value | | | Valuation
allowance | | | Net value | | Crude oil and natural gas | | | 4,990 | | | | — | | | | 4,990 | | Refined products | | | 7,794 | | | | (28 | ) | | | 7,766 | | Chemicals products | | | 1,350 | | | | (99 | ) | | | 1,251 | | Other inventories | | | 1,911 | | | | (318 | ) | | | 1,593 | | Total | | | 16,045 | | | | (445 | ) | | | 15,600 | |
| | | | | | | | | As of December 31, 2007(M€) | | Gross value | | Valuation
allowance | | | Net value | Crude oil and natural gas | | 4,746 | | — | | | 4,746 | Refined products | | 6,874 | | (11 | ) | | 6,863 | Chemicals products | | 1,188 | | (91 | ) | | 1,097 | Other inventories | | 1,368 | | (223 | ) | | 1,145 | Total | | 14,176 | | (325 | ) | | 13,851 |
| | As of December 31, 2006(M€) | | Gross value | | Valuation
allowance | | Net value | | | As of December 31, 2009 (M€) | | | Gross value | | | Valuation
allowance | | Net value | | Crude oil and natural gas | | 4,038 | | (90 | ) | | 3,948 | | | 4,581 | | | | — | | | | 4,581 | | Refined products | | 5,373 | | (44 | ) | | 5,329 | | | 6,647 | | | | (18 | ) | | | 6,629 | | Chemicals products | | 1,544 | | (90 | ) | | 1,454 | | | 1,234 | | | | (113 | ) | | | 1,121 | | Other inventories | | 1,231 | | (216 | ) | | 1,015 | | | 1,822 | | | | (286 | ) | | | 1,536 | | Total | | 12,186 | | (440 | ) | | 11,746 | | | 14,284 | | | | (417 | ) | | | 13,867 | |
Changes in the valuation allowance on inventories are as follows: | | | | | | | | | | | | | (M€) For the year ended December 31, | | Valuation allowance
as of
January 1, | | | Increase
(net) | | | Currency
translation
adjustment
and other
variations | | | Valuation
allowance
as of
December 31, | | 2008 | | (325 | ) | | (740 | ) | | (50 | ) | | (1,115 | ) | 2007 | | (440 | ) | | 124 | | | (9 | ) | | (325 | ) | 2006 | | (413 | ) | | (118 | ) | | 91 | | | (440 | ) |
| | | | | | | | | | | | | | | | | | For the year ended December 31, (M€) | | Valuation
allowance as
of January 1, | | | Increase (net) | | | Currency
translation
adjustment and
other variations | | | Valuation
allowance as of
December 31, | | 2011 | | | (445 | ) | | | (83 | ) | | | (41 | ) | | | (569 | ) | 2010 | | | (417 | ) | | | (39 | ) | | | 11 | | | | (445 | ) | 2009 | | | (1,115 | ) | | | 700 | | | | (2 | ) | | | (417 | ) |
16)ACCOUNTS RECEIVABLE AND OTHER CURRENT ASSETS | | As of December 31, 2008(M€) | | Gross
value | | Valuation
allowance | | Net
value | | | As of December 31, 2011 (M€) | | | Gross
value | | | Valuation
allowance | | Net
value | | Accounts receivable | | 15,747 | | (460 | ) | | 15,287 | | | 20,532 | | | | (483 | ) | | | 20,049 | | Recoverable taxes | | 2,510 | | — | | | 2,510 | | | 2,398 | | | | — | | | | 2,398 | | Other operating receivables | | 6,227 | | (19 | ) | | 6,208 | | | 7,750 | | | | (283 | ) | | | 7,467 | | Deferred income tax | | 206 | | — | | | 206 | | | — | | | | — | | | | — | | Prepaid expenses | | 650 | | — | | | 650 | | | 840 | | | | — | | | | 840 | | Other current assets | | 68 | | — | | | 68 | | | 62 | | | | — | | | | 62 | | Other current assets | | 9,661 | | (19 | ) | | 9,642 | | | 11,050 | | | | (283 | ) | | | 10,767 | |
| | As of December 31, 2007(M€) | | Gross
value | | Valuation
allowance | | Net
value | | | As of December 31, 2010 (M€) | | | Gross
value | | | Valuation
allowance | | Net
value | | Accounts receivable | | 19,611 | | (482 | ) | | 19,129 | | | 18,635 | | | | (476 | ) | | | 18,159 | | Recoverable taxes | | 2,735 | | — | | | 2,735 | | | 2,227 | | | | — | | | | 2,227 | | Other operating receivables | | 4,457 | | (27 | ) | | 4,430 | | | 4,543 | | | | (136 | ) | | | 4,407 | | Deferred income tax | | 112 | | — | | | 112 | | | 151 | | | | — | | | | 151 | | Prepaid expenses | | 687 | | — | | | 687 | | | 657 | | | | — | | | | 657 | | Other current assets | | 42 | | — | | | 42 | | | 41 | | | | — | | | | 41 | | Other current assets | | 8,033 | | (27 | ) | | 8,006 | | | 7,619 | | | | (136 | ) | | | 7,483 | |
| | As of December 31, 2006(M€) | | Gross
value | | Valuation
allowance | | Net
value | | | As of December 31, 2009 (M€) | | | Gross
value | | | Valuation
allowance | | Net
value | | Accounts receivable | | 17,882 | | (489 | ) | | 17,393 | | | 16,187 | | | | (468 | ) | | | 15,719 | | Recoverable taxes | | 2,098 | | — | | | 2,098 | | | 2,156 | | | | — | | | | 2,156 | | Other operating receivables | | 4,306 | | (39 | ) | | 4,267 | | | 5,214 | | | | (69 | ) | | | 5,145 | | Deferred income tax | | 94 | | — | | | 94 | | | 214 | | | | — | | | | 214 | | Prepaid expenses | | 745 | | — | | | 745 | | | 638 | | | | — | | | | 638 | | Other current assets | | 43 | | — | | | 43 | | | 45 | | | | — | | | | 45 | | Other current assets | | 7,286 | | (39 | ) | | 7,247 | | | 8,267 | | | | (69 | ) | | | 8,198 | |
Changes in the valuation allowance on “Accounts receivable” and “Other current assets” are as follows: | | | | | | | | | | | | | (in M€) | | Valuation
allowance as of
January 1, | | | Increase (net) | | | Currency translation
adjustments and
other variations | | Valuation
allowance as of
December 31, | | Accounts receivable | | | | | | | | | | | | 2008 | | (482 | ) | | 9 | | | 13 | | (460 | ) | 2007 | | (489 | ) | | (25 | ) | | 32 | | (482 | ) | 2006 | | (562 | ) | | 6 | | | 67 | | (489 | ) | | | | | | Other current assets | | | | | | | | | | | | 2008 | | (27 | ) | | 7 | | | 1 | | (19 | ) | 2007 | | (39 | ) | | (4 | ) | | 16 | | (27 | ) | 2006 | | (63 | ) | | (1 | ) | | 25 | | (39 | ) |
| | | | | | | | | | | | | | | | | | (M€) | | Valuation
allowance
as of
January 1, | | | Increase
(net) | | | Currency
translation
adjustments
and other
variations | | | Valuation
allowance as of
December 31, | | Accounts receivable | | | | | | | | | | | | | | | | | 2011 | | | (476 | ) | | | 4 | | | | (11 | ) | | | (483 | ) | 2010 | | | (468 | ) | | | (31 | ) | | | 23 | | | | (476 | ) | 2009 | | | (460 | ) | | | (17 | ) | | | 9 | | | | (468 | ) | Other current assets | | | | | | | | | | | | | | | | | 2011 | | | (136 | ) | | | (132 | ) | | | (15 | ) | | | (283 | ) | 2010 | | | (69 | ) | | | (66 | ) | | | (1 | ) | | | (136 | ) | 2009 | | | (19 | ) | | | (14 | ) | | | (36 | ) | | | (69 | ) |
As of December 31, 2008,2011, the net portion of the past dueoverdue receivables includes in “Accounts receivable” and “Other current assets” is€3,556 million, of which€1,857 million has expired for less than 90 days,€365 million has expired between 90 days and 6 months,€746 million has expired between 6 and 12 months and€588 million has expired for more than 12 months. As of December 31, 2010, the net portion of the overdue receivables includes in “Accounts receivable” and “Other current assets” is€3,141 million, of which€1,885 million has expired for less than 90 days,€292 million has expired between 90 days and 6 months,€299 million has expired between 6 and 12 months and€665 million has expired for more than 12 months. As of December 31, 2009, the net portion of the overdue receivables included in “Accounts receivable” and “Other current assets” is 3,744 M€,3,610 million, of which 2,420 M€2,116 million has been overdueexpired for less than 90 days, 729 M€486 million has expired between 90 days and 6 months, 54 M€246 million has expired between 6 and 12 months and 541 M€762 million has expired for more than 12 months. 17)SHAREHOLDERS’ EQUITY NUMBER OFNumber of TOTAL SHARESshares
The Company’s common shares, par value€2.50, as of December 31, 20082011 are the only category of shares. Shares may be held in either bearer or registered form. Double voting rights are granted to holders of shares that are fully-paid and held in the name of the same shareholder for at least two years, with due consideration for the total portion of the share capital represented. Double voting rights are also assigned to restricted shares in the event of an increase in share capital by incorporation of reserves, profits or premiums based on shares already held that are entitled to double voting rights. Pursuant to the Company’s bylaws (Statuts), no shareholder may cast a vote at a shareholders’ meeting, either by himself or through an agent, representing more than 10% of the total voting rights for the Company’s shares. This limit applies to the aggregated amount of voting rights held directly, indirectly or through voting proxies. However, in the case of double voting rights, this limit may be extended to 20%. These restrictions no longer apply if any individual or entity, acting alone or in concert, acquires at least two-thirds of the total share capital of the Company, directly or indirectly, following a public tender offer for all of the Company’s shares. The authorized share capital amounts to 3,413,204,0253,446,401,650 shares as of December 31, 20082011 compared to 4,042,585,6053,439,391,697 shares as of December 31, 20072010 and 4,081,629,7943,381,921,458 as of December 31, 2006.2009. Variation of the share capital | | | | | | | | | | | | | | Historical figures | | | Restated
historical
figures(a) | | As of January 1, 2006 | | | | 615,116,296 | | | 2,460,465,184 | | Shares issued in connection with: | | Four-for-one stock split of share par value | | 1,845,348,888 | | | | | | | Capital increase reserved for employees | | 11,141,320 | | | 11,141,320 | | | | Exercise of TOTAL share subscription options | | 849,319 | | | 849,319 | | | | Exchange guarantee offered to the beneficiaries of Elf Aquitaine share subscription options | | 332,130 | | | 332,130 | | Cancellation of shares(b) | | | | (47,020,000 | ) | | (47,020,000 | ) | As of January 1, 2007 | | | | 2,425,767,953 | | | 2,425,767,953 | | Shares issued in connection with: | | Exercise of TOTAL share subscription options | | 2,453,832 | | | | | | | Exchange guarantee offered to the beneficiaries of Elf Aquitaine share subscription options | | 315,312 | | | | | Cancellation of shares(c) | | | | (33,005,000 | ) | | | | As of January 1, 2008 | | | | 2,395,532,097 | | | | | Shares issued in connection with: | | Capital increase reserved for employees | | 4,870,386 | | | | | | | Exercise of TOTAL share subscription options | | 1,178,167 | | | | | | | Exchange guarantee offered to the beneficiaries of Elf Aquitaine share subscription options | | 227,424 | | | | | Cancellation of shares(d) | | | | (30,000,000 | ) | | | | As of December 31, 2008(e) | | | | 2,371,808,074 | | | | |
| | | | | | | As of January 1, 2009 | | | | | 2,371,808,074 | | Shares issued in connection with: | | Exercise of TOTAL share subscription options | | | 934,780 | | | | Exchange guarantee offered to the beneficiaries of Elf Aquitaine share subscription options | | | 480,030 | | Cancellation of shares(a) | | | | | (24,800,000 | ) | As of January 1, 2010 | | | | | 2,348,422,884 | | Shares issued in connection with: | | Exercise of TOTAL share subscription options | | | 1,218,047 | | As of January 1, 2011 | | | | | 2,349,640,931 | | Shares issued in connection with: | | Capital increase reserved for employees | | | 8,902,717 | | | | Exercise of TOTAL share subscription options | | | 5,223,665 | | As of December 31, 2011(b) | | | | | 2,363,767,313 | |
| (a) | Historical figures are restated to take into account the four-for-one stock split on May 18, 2006. |
(b) | Decided by the Board of Directors on July 18, 2006.30, 2009. |
(c) | Decided by the Board of Directors on January 10, 2007. |
(d) | Decided by the Board of Directors on July 31, 2008. |
(e)(b) | Including 143,082,095109,554,173 treasury shares deducted from consolidated shareholders’ equity. |
The calculationvariation of theboth weighted-average number of shares and weighted-average number of diluted shares respectively used forin the presentationcalculation of the earnings per share and the dilutedfully-diluted earnings per share respectively is detailed as follows: | | | | 2008 | | 2007 | | 2006(a) | | | 2011 | | 2010 | | 2009 | | | Number of shares as of January 1, | | 2,395,532,097 | | 2,425,767,953 | | 2,460,465,184 | | | | 2,349,640,931 | | | | 2,348,422,884 | | | | 2,371,808,074 | | Number of shares issued during the year (pro rated) | | | | | | | | | | | | | — | | Exercise of TOTAL share subscription options | | 742,588 | | | 1,020,190 | | | 304,461 | | | | 3,412,123 | | | | 412,114 | | | | 221,393 | | Exercise of TOTAL share purchase options | | 2,426,827 | | | 4,141,186 | | | 3,756,803 | | | | — | | | | 984,800 | | | | 93,827 | | Exchange guarantee offered to the beneficiaries of Elf Aquitaine share subscription options | | 86,162 | | | 163,074 | | | 169,146 | | | | — | | | | — | | | | 393,623 | | TOTAL restricted shares | | 1,112,393 | | | 1,114,796 | | | — | | | TOTAL performance shares | | | | 978,503 | | | | 416,420 | | | | 1,164,389 | | Global free TOTAL share plan(a) | | | | 506 | | | | 15 | | | | — | | Capital increase reserved for employees | | 3,246,924 | | | — | | | 9,284,433 | | | | 5,935,145 | | | | — | | | | — | | TOTAL shares held by TOTAL S.A. or by its subsidiaries and deducted from shareholders’ equity | | (168,290,440 | ) | | (176,912,968 | ) | | (180,916,837 | ) | | | (112,487,679 | ) | | | (115,407,190 | ) | | | (143,082,095 | ) | Weighted-average number of shares | | 2,234,856,551 | | | 2,255,294,231 | | | 2,293,063,190 | | | | 2,247,479,529 | | | | 2,234,829,043 | | | | 2,230,599,211 | | Dilutive effect | | | | | | | | | | | | | — | | TOTAL share subscription and purchase options | | 6,784,200 | | | 13,698,928 | | | 14,758,984 | | | | 470,095 | | | | 1,758,006 | | | | 1,711,961 | | TOTAL restricted shares | | 4,172,944 | | | 4,387,761 | | | 3,218,410 | | | TOTAL performance shares | | | | 6,174,808 | | | | 6,031,963 | | | | 4,920,599 | | Global free TOTAL share plan(a) | | | | 2,523,233 | | | | 1,504,071 | | | | Exchange guarantee offered to the beneficiaries of Elf Aquitaine share subscription options | | 460,935 | | | 655,955 | | | 833,908 | | | | — | | | | — | | | | 60,428 | | Capital increase reserved for employees | | 383,912 | | | 348,109 | | | 430,160 | | | | 303,738 | | | | 371,493 | | | | — | | Weighted-average number of diluted shares | | 2,246,658,542 | | | 2,274,384,984 | | | 2,312,304,652 | | | | 2,256,951,403 | | | | 2,244,494,576 | | | | 2,237,292,199 | |
| (a) | Figures are restated to take into account the four-for-one stock splitThe Board of Directors approved on May 18, 2006.21, 2010 the implementation and conditions of a global free share plan intended for the Group employees. |
CAPITAL INCREASE RESERVED FOR GROUP EMPLOYEESCapital increase reserved for Group employees
At the shareholders’ meeting held on May 11, 2007,21, 2010, the shareholders delegated to the Board of Directors the authority to increase the share capital of the Company in one or more transactions and within a maximum period of 26 months from the date of the meeting, by an amount not exceeding 1.5% of the share capital outstanding on the date of the meeting of the Board of Directors at which a decision to proceed with an issuance is made reserving subscriptions for such issuance to the Group employees participating in a company savings plan. It wasis being specified that the amount of any such capital increase reserved for Group employees would bewas counted against the aggregate maximum nominal amount of share capital increases authorized by the shareholders’ meeting held on May 11, 200721, 2010 for issuing new ordinary shares or other securities granting immediate or future access to the Company’s share capital with preferential subscription rights (4 B(€2.5 billion in nominal value). Pursuant to this delegation of authorization, the Board of Directors, during its November 6, 2007October 28, 2010 meeting, implementeddecided to proceed with a first capital increase reserved for employees in 2011 within the limit of 12 million shares par value€2.50, at a price of€44.40 per share, with dividend rights as of the January 1, 2007. The2010 and delegated to the Chairman and Chief Executive Officer all powers to determine the opening and closing of the subscription period wasand the subscription price. open
On March 14, 2011, the Chairman and Chief Executive Officer decided that the subscription period would be set from March 10, 2008,16, 2011 to March 28, 2008,April 1, 2011 included, and 4,870,386 newacknowledged that the subscription price per ordinary share would be set at€34.80. With respect to this capital increase, 8,902,717 TOTAL shares were issued in 2008.subscribed and created on April 28, 2011. SHARE CANCELLATIONShare cancellation
Pursuant to the authorization granted by the shareholders’ meeting held on May 11, 2007 authorizing reduction of capital by cancellation of shares held by the Company within the limit of 10% of the outstanding capital every 24 months, the Board of Directors decided on July 31, 200830, 2009 to cancel 30,000,00024,800,000 shares acquired in 20072008 at an average price of€54.6949.28 per share. TREASURY SHARESTreasury shares (TOTAL SHARES HELD BYshares held by TOTAL S.A.)
As of December 31, 2008,2011, TOTAL S.A held 42,750,827S.A. holds 9,222,905 of its own shares, representing 1.80%0.39% of its share capital, detailed as follows: 12,627,5226,712,528 shares allocated to coveringTOTAL share grant plans for Group employees;
2,510,377 shares intended to be allocated to new TOTAL share purchase option plans for Group employees;or to new share grant plans. 5,323,305 shares allocated to TOTAL restricted shares plans for Group employees; and
24,800,000 shares purchased for cancellation between January and October 2008 pursuant to the authorization granted by the shareholders’ meetings held on May 11, 2007 and May 16, 2008.
These shares are deducted from the consolidated shareholders’ equity. As of December 31, 2007,2010, TOTAL S.A. held 51,089,96412,156,411 of its own shares, representing 2.13%0.52% of its share capital, detailed as follows: 16,343,3496,012,460 shares allocated to coveringTOTAL share grant plans for Group employees;
6,143,951 shares intended to be allocated to new TOTAL share purchase option plans for Group employees; 4,746,615 shares allocatedor to TOTAL restrictednew share plans for Group employees; and
30,000,000 shares purchased for cancellation between February and December 2007 pursuant to the authorization granted by the shareholders’ meetings held on May 12, 2006 and May 11, 2007. The Board of Directors on July 31, 2008 decided to cancel these 30,000,000 shares acquired at an average price of€54.69 per share.grant plans.
These shares were deducted from the consolidated shareholders’ equity. As of December 31, 2006,2009, TOTAL S.A. held 60,869,43915,075,922 of its own shares, representing 2.51%0.64% of its share capital, detailed as follows: 23,272,7556,017,499 shares allocated to covering TOTAL share purchase option plans for Group employees;employees and executive officers;
4,591,6845,799,400 shares allocated to TOTAL restricted share grant plans for Group employees; and
33,005,0003,259,023 shares purchased for cancellation between July and December 2006 pursuantintended to the authorization granted by the shareholders’ meetings held on May 12, 2006. The Board of Directors decided on January 10, 2007be allocated to cancel 33,005,000 shares, at an average price of€52.52 per share.new TOTAL share purchase option plans or to new share grant plans.
These shares were deducted from the consolidated shareholders’ equity. TOTAL SHARES HELD BY THE GROUP SUBSIDIARIESshares held by Group subsidiaries As of December 31, 2008, 20072011, 2010 and 2006,2009, TOTAL S.A. held indirectly through its subsidiaries 100,331,268 of its own shares, representing 4.23%4.24% of its share capital as of December 31, 2008, 4.19%2011, 4.27% of its share capital as of December 31, 2007,2010 and 4.14%4.27% of its share capital as of December 31, 2006,2009 detailed as follows: 2,023,672 shares held by a consolidated subsidiary, Total Nucléaire, a wholly-owned subsidiary100% indirectly controlled by TOTAL S.A.; and 98,307,596 shares held by subsidiaries of Elf Aquitaine (Financière Valorgest, Sogapar and Fingestval), 100% indirectly controlled by TOTAL S.A. These shares are deducted from the consolidated shareholders’ equity. DIVIDENDDividend
In 2008, TOTAL S.A. paid on May 23, 2008,26, 2011 the balance of the dividend of€1.07 per share for the 2007 fiscal year (the ex-dividend date was May 20, 2008.). In addition, TOTAL S.A. paid on November 19, 2008, an interim dividend of€1.14 per share for the 2010 fiscal year 2008 (the ex-dividend date was November 14, 2008)May 23, 2011). In addition, TOTAL S.A. paid two quarterly interim dividends for the fiscal year 2011:
The first quarterly interim dividend of€0.57 per share for the fiscal year 2011, decided by the Board of Directors on April 28, 2011, was paid on September 22, 2011 (the ex-dividend date was September 19, 2011); The second quarterly interim dividend of€0.57 per share for the fiscal year 2011, decided by the Board of Directors on July 28, 2011, was paid on December 22, 2011 (the ex-dividend date was December 19, 2011). The Board of Directors, during its October 27, 2011 meeting, decided to set the third quarterly interim dividend for the fiscal year 2011 at€0.57 per share. This interim dividend will be paid on March 22, 2012 (the ex-dividend date will be March 19, 2012). A resolution will be submitted at the shareholders’ meeting on May 15, 200911, 2012 to pay a dividend of€2.28 per share for the 20082011 fiscal year,i.e., a balance of€1.140.57 per share to be distributed after deducting the three quarterly interim dividenddividends of€1.140.57 per share that will have already been paid. PAID-IN SURPLUSPaid-in surplus
In accordance with French law, the paid-in surplus corresponds to share premiums of the parent company which can be capitalized or used to offset losses if the legal reserve has reached its minimum required level. The amount of the paid-in surplus may also be distributed subject to taxation unless the unrestricted reserves of the parent company are distributed prior to or simultaneously with this item. As of December 31, 2008,2011, paid-in surplus amounted to 28,284 M€ (29,59827,655 million (€27,208 million as of December 31, 2007,2010 and 31,156 M€27,171 million as of December 31, 2006)2009). RESERVESReserves
Under French laws,law, 5% of net income must be transferred to the legal reserve until the legal reserve reaches 10% of the nominal value of the share capital. This reserve cannot be distributed to the shareholders other than upon liquidation but can be used to offset losses. If wholly distributed, the unrestricted reserves of the parent company would be taxed for an approximate amount of 70 M€539 million as of December 31, 2008 (70 M2011 (€514 million as of December 31, 20062010 and 2007)as of December 31, 2009). ITEMS RECOGNIZED DIRECTLY IN EQUITYOther comprehensive income
Shareholders’Detail of other comprehensive income showing items reclassified from equity to net income is directly debited for 772 M€presented in 2008 duethe table below:
| | | | | | | | | | | | | | | | | | | | | | | | | | For the year ended December 31, (M€) | | 2011 | | | 2010 | | | 2009 | | Currency translation adjustment | | | | | | | 1,498 | | | | | | | | 2,231 | | | | | | | | (244 | ) | — Unrealized gain/(loss) of the period | | | 1,435 | | | | | | | | 2,234 | | | | | | | | (243 | ) | | | | | — Less gain/(loss) included in net income | | | (63 | ) | | | | | | | 3 | | | | | | | | 1 | | | | | | Available for sale financial assets | | | | | | | 337 | | | | | | | | (100 | ) | | | | | | | 38 | | — Unrealized gain/(loss) of the period | | | 382 | | | | | | | | (50 | ) | | | | | | | 38 | | | | | | — Less gain/(loss) included in net income | | | 45 | | | | | | | | 50 | | | | | | | | — | | | | | | Cash flow hedge | | | | | | | (84 | ) | | | | | | | (80 | ) | | | | | | | 128 | | — Unrealized gain/(loss) of the period | | | (131 | ) | | | | | | | (195 | ) | | | | | | | 349 | | | | | | — Less gain/(loss) included in net income | | | (47 | ) | | | | | | | (115 | ) | | | | | | | 221 | | | | | | | | | | | | | Share of other comprehensive income of equity affiliates, net amount | | | | | | | (15 | ) | | | | | | | 302 | | | | | | | | 234 | | Other | | | | | | | (2 | ) | | | | | | | (7 | ) | | | | | | | (5 | ) | — Unrealized gain/(loss) of the period | | | (2 | ) | | | | | | | (7 | ) | | | | | | | (5 | ) | | | | | — Less gain/(loss) included in net income | | | — | | | | | | | | — | | | | | | | | — | | | | | | Tax effect | | | | | | | (55 | ) | | | | | | | 28 | | | | | | | | (38 | ) | Total other comprehensive income, net amount | | | | | | | 1,679 | | | | | | | | 2,374 | | | | | | | | 113 | |
Tax effects relating to the following items. Items recognized directly in equityeach component of other comprehensive income are as follows: | | | | | | | | | | | For the year ended(M€) | | 2008 | | | 2007 | | | 2006 | | Currency translation adjustment, Group share | | (480 | ) | | (3,013 | ) | | (2,595 | ) | Changes in fair value of financial assets available for sale | | (224 | ) | | 104 | | | (61 | ) | Others | | (34 | ) | | 13 | | | 24 | | Group share | | (738 | ) | | (2,896 | ) | | (2,632 | ) | Minority interests | | (34 | ) | | (111 | ) | | (44 | ) | Total items recognized directly in equity | | (772 | ) | | (3,007 | ) | | (2,676 | ) |
| | | | | | | | | | | | | | | | | | | | | | | | | | | | | | | | | | | | | | | | 2011 | | | 2010 | | | 2009 | | For the year ended
December 31, (M€) | | Pre-tax
amount | | | Tax
effect | | | Net
amount | | | Pre-tax
amount | | | Tax
effect | | | Net
amount | | | Pre-tax
amount | | | Tax
effect | | | Net
amount | | Currency translation adjustment | | | 1,498 | | | | — | | | | 1,498 | | | | 2,231 | | | | — | | | | 2,231 | | | | (244 | ) | | | — | | | | (244 | ) | Available for sale financial assets | | | 337 | | | | (93 | ) | | | 244 | | | | (100 | ) | | | 2 | | | | (98 | ) | | | 38 | | | | 4 | | | | 42 | | Cash flow hedge | | | (84 | ) | | | 38 | | | | (46 | ) | | | (80 | ) | | | 26 | | | | (54 | ) | | | 128 | | | | (42 | ) | | | 86 | | Share of other comprehensive income of equity affiliates, net amount | | | (15 | ) | | | — | | | | (15 | ) | | | 302 | | | | — | | | | 302 | | | | 234 | | | | — | | | | 234 | | Other | | | (2 | ) | | | — | | | | (2 | ) | | | (7 | ) | | | — | | | | (7 | ) | | | (5 | ) | | | — | | | | (5 | ) | Total other comprehensive income | | | 1,734 | | | | (55 | ) | | | 1,679 | | | | 2,346 | | | | 28 | | | | 2,374 | | | | 151 | | | | (38 | ) | | | 113 | |
18)EMPLOYEE BENEFITS OBLIGATIONS Liabilities for employee benefits obligations consist of the following: | | As of December 31,(M€) | | 2008 | | 2007 | | 2006 | | 2011 | | | 2010 | | | 2009 | | Pension benefits liabilities | | 1,187 | | 1,721 | | 1,918 | | | 1,268 | | | | 1,268 | | | | 1,236 | | Other benefits liabilities | | 608 | | 611 | | 647 | | | 620 | | | | 605 | | | | 592 | | Restructuring reserves (early retirement plans) | | 216 | | 195 | | 208 | | | 344 | | | | 298 | | | | 212 | | Total | | 2,011 | | 2,527 | | 2,773 | | | 2,232 | | | | 2,171 | | | | 2,040 | |
The Group’s main defined benefit pension plans are located in France, in the United Kingdom, in the United States, in Belgium and in Germany. Their main characteristics are the following: The benefits are usually based on the final salary and seniority; They are usually funded (pension fund or insurer); and They are closed to new employees who benefit from defined contribution pension plans. The pension benefits include also termination indemnities and early retirement benefits. The other benefits are the employer contribution to post-employment medical care. The fair value of the defined benefit obligation and plan assets in the Consolidated Financial Statements is detailed as follows: | | | | | | | | | | | | | | | | | | | | | | Pension benefits | | | Other benefits | | | As of December 31,(M€) | | 2008 | | | 2007 | | | 2006 | | | 2008 | | | 2007 | | | 2006 | | | | | | | | | Change in benefit obligation | | | | | | | | | | | | | | | | | | | Benefit obligation at beginning of year | | 8,129 | | | 8,742 | | | 9,647 | | | 583 | | | 648 | | | 774 | | Service cost | | 143 | | | 160 | | | 174 | | | 14 | | | 12 | | | 11 | | Interest cost | | 416 | | | 396 | | | 392 | | | 24 | | | 28 | | | 30 | | Curtailments | | (3 | ) | | (9 | ) | | (6 | ) | | — | | | — | | | (1 | ) | Settlements | | (5 | ) | | (20 | ) | | (243 | ) | | (4 | ) | | — | | | — | | Special termination benefits | | — | | | — | | | — | | | — | | | — | | | — | | Plan participants’ contributions | | 12 | | | 10 | | | 11 | | | — | | | — | | | — | | Benefits paid | | (463 | ) | | (448 | ) | | (444 | ) | | (37 | ) | | (40 | ) | | (36 | ) | Plan amendments | | 12 | | | (70 | ) | | 17 | | | (12 | ) | | (2 | ) | | 7 | | Actuarial losses (gains) | | (248 | ) | | (384 | ) | | (151 | ) | | (27 | ) | | (38 | ) | | (21 | ) | Foreign currency translation and other(a) | | (588 | ) | | (248 | ) | | (655 | ) | | 3 | | | (25 | ) | | (116 | ) | Benefit obligation at year-end | | 7,405 | | | 8,129 | | | 8,742 | | | 544 | | | 583 | | | 648 | | | | | | | | | Change in fair value of plan assets | | | | | | | | | | | | | | | | | | | Fair value of plan assets at beginning of year | | (6,604 | ) | | (6,401 | ) | | (6,274 | ) | | — | | | — | | | — | | Expected return on plan assets | | (402 | ) | | (387 | ) | | (353 | ) | | — | | | — | | | — | | Actuarial losses (gains) | | 1,099 | | | 140 | | | (104 | ) | | — | | | — | | | — | | Settlements | | 2 | | | 8 | | | 201 | | | — | | | — | | | — | | Plan participants’ contributions | | (12 | ) | | (10 | ) | | (11 | ) | | — | | | — | | | — | | Employer contributions(b) | | (855 | ) | | (556 | ) | | (617 | ) | | — | | | — | | | — | | Benefits paid | | 375 | | | 349 | | | 327 | | | — | | | — | | | — | | Foreign currency translation and other(c) | | 633 | | | 253 | | | 430 | | | — | | | — | | | — | | Fair value of plan assets at year-end | | (5,764 | ) | | (6,604 | ) | | (6,401 | ) | | — | | | — | | | — | | | | | | | | | Unfunded status | | 1,641 | | | 1,525 | | | 2,341 | | | 544 | | | 583 | | | 648 | | Unrecognized prior service cost | | (48 | ) | | (49 | ) | | (149 | ) | | 21 | | | 18 | | | 23 | | Unrecognized actuarial (losses) gains | | (953 | ) | | (160 | ) | | (423 | ) | | 43 | | | 10 | | | (24 | ) | Asset ceiling | | 5 | | | 5 | | | 4 | | | — | | | — | | | — | | Net recognized amount | | 645 | | | 1,321 | | | 1,773 | | | 608 | | | 611 | | | 647 | | Pension benefits and other benefits liabilities | | 1,187 | | | 1,721 | | | 1,918 | | | 608 | | | 611 | | | 647 | | Other non-current assets | | (542 | ) | | (400 | ) | | (145 | ) | | — | | | — | | | — | |
(a) | In 2006, the variation in foreign currency translation and other included the spin-off of Arkema which amounted to (587) M€ for benefit obligation and 375 M€ for fair value of plan assets related to pension benefits, and (107) M€ for benefit obligation related to other pension benefits. |
(b) | In 2008, the Group covered certain employee pension benefit plans through insurance companies for an amount of 757 M€ (269 M€ in 2006). |
(c) | In 2006, the variation in foreign currency translation and other included the spin-off of Arkema which amounted to 375 M€ of fair value of plan assets. |
| | | | | | | | | | | | | | | | | | | | | | | | | | | | Pension benefits | | | Other benefits | | | As of December 31, (M€) | | 2011 | | | 2010 | | | 2009 | | | 2011 | | | 2010 | | | 2009 | | Change in benefit obligation | | | | | | | | | | | | | | | | | | | | | | | | | Benefit obligation at beginning of year | | | 8,740 | | | | 8,169 | | | | 7,405 | | | | 623 | | | | 547 | | | | 544 | | Service cost | | | 163 | | | | 159 | | | | 134 | | | | 13 | | | | 11 | | | | 10 | | Interest cost | | | 420 | | | | 441 | | | | 428 | | | | 28 | | | | 29 | | | | 30 | | Curtailments | | | (24 | ) | | | (4 | ) | | | (5 | ) | | | (1 | ) | | | (3 | ) | | | (1 | ) | Settlements | | | (111 | ) | | | (60 | ) | | | (3 | ) | | | — | | | | — | | | | — | | Special termination benefits | | | — | | | | — | | | | — | | | | — | | | | 1 | | | | — | | Plan participants’ contributions | | | 9 | | | | 11 | | | | 10 | | | | — | | | | — | | | | — | | Benefits paid | | | (451 | ) | | | (471 | ) | | | (484 | ) | | | (34 | ) | | | (33 | ) | | | (33 | ) | Plan amendments | | | 33 | | | | 28 | | | | 118 | | | | 4 | | | | 1 | | | | (2 | ) | Actuarial losses (gains) | | | 435 | | | | 330 | | | | 446 | | | | (9 | ) | | | 57 | | | | — | | Foreign currency translation and other | | | 108 | | | | 137 | | | | 120 | | | | 4 | | | | 13 | | | | (1 | ) | Benefit obligation at year-end | | | 9,322 | | | | 8,740 | | | | 8,169 | | | | 628 | | | | 623 | | | | 547 | | Change in fair value of plan assets | | | | | | | | | | | | | | | | | | | | | | | | | Fair value of plan assets at beginning of year | | | (6,809 | ) | | | (6,286 | ) | | | (5,764 | ) | | | — | | | | — | | | | — | | Expected return on plan assets | | | (385 | ) | | | (396 | ) | | | (343 | ) | | | — | | | | — | | | | — | | Actuarial losses (gains) | | | 155 | | | | (163 | ) | | | (317 | ) | | | — | | | | — | | | | — | | Settlements | | | 80 | | | | 56 | | | | 2 | | | | — | | | | — | | | | — | | Plan participants’ contributions | | | (9 | ) | | | (11 | ) | | | (10 | ) | | | — | | | | — | | | | — | | Employer contributions | | | (347 | ) | | | (269 | ) | | | (126 | ) | | | — | | | | — | | | | — | | Benefits paid | | | 386 | | | | 394 | | | | 396 | | | | — | | | | — | | | | — | | Foreign currency translation and other | | | (99 | ) | | | (134 | ) | | | (124 | ) | | | — | | | | — | | | | — | | Fair value of plan assets at year-end | | | (7,028 | ) | | | (6,809 | ) | | | (6,286 | ) | | | — | | | | — | | | | — | | Unfunded status | | | 2,294 | | | | 1,931 | | | | 1,883 | | | | 628 | | | | 623 | | | | 547 | | Unrecognized prior service cost | | | (78 | ) | | | (105 | ) | | | (153 | ) | | | 9 | | | | 10 | | | | 15 | | Unrecognized actuarial (losses) gains | | | (1,713 | ) | | | (1,170 | ) | | | (1,045 | ) | | | (17 | ) | | | (28 | ) | | | 30 | | Asset ceiling | | | 10 | | | | 9 | | | | 9 | | | | — | | | | — | | | | — | | Net recognized amount | | | 513 | | | | 665 | | | | 694 | | | | 620 | | | | 605 | | | | 592 | | Pension benefits and other benefits liabilities | | | 1,268 | | | | 1,268 | | | | 1,236 | | | | 620 | | | | 605 | | | | 592 | | Other non-current assets | | | (755 | ) | | | (603 | ) | | | (542 | ) | | | — | | | | — | | | | — | |
As of December 31, 2008,2011, the fair value of pension benefits and other pension benefits which are entirely or partially funded amountedamounts to 6,515 M€8,277 million and the present value of the unfunded benefits amountedamounts to 1,434 M€ (7,175 M1,673 million (against€7,727 million and 1,537 M€,1,636 million respectively as of December 31, 2007,2010 and 7,358 M€7,206 million and 2,032 M€,1,510 million respectively as of December 31, 2006)2009). The experience actuarial gains (losses)(gains) losses related to the defined benefit obligation and the fair value of plan assets are as follows: | | | | | | | | For the year ended(M€) | | 2008 | | | 2007 | | Experience actuarial gains (losses) related to the defined benefit obligation | | (12 | ) | | (80 | ) | Experience actuarial gains (losses) related to the fair value of plan assets | | (1,099 | ) | | (140 | ) |
| | | | | | | | | | | | | | | | | | | | | | For the year ended December 31, (M€) | | 2011 | | | 2010 | | | 2009 | | | 2008 | | | 2007 | | Experience actuarial (gains) losses related to the defined benefit obligation | | | (58 | ) | | | (54 | ) | | | (108 | ) | | | 12 | | | | 80 | | Experience actuarial (gains) losses related to the fair value of plan assets | | | 155 | | | | (163 | ) | | | (317 | ) | | | 1,099 | | | | 140 | |
| | As of December 31,(M€) | | 2008 | | 2007 | | 2006 | | 2005 | | 2004 | | | 2011 | | 2010 | | 2009 | | 2008 | | 2007 | | Pension benefits | | | | | | | | | | | | | | | | | | | | | Benefit obligation | | 7,405 | | | 8,129 | | | 8,742 | | | 9,647 | | | 8,117 | | | | 9,322 | | | | 8,740 | | | | 8,169 | | | | 7,405 | | | | 8,129 | | Fair value of plan assets | | (5,764 | ) | | (6,604 | ) | | (6,401 | ) | | (6,274 | ) | | (5,362 | ) | | | (7,028 | ) | | | (6,809 | ) | | | (6,286 | ) | | | (5,764 | ) | | | (6,604 | ) | Unfunded status | | 1,641 | | | 1,525 | | | 2,341 | | | 3,373 | | | 2,755 | | | | 2,294 | | | | 1,931 | | | | 1,883 | | | | 1,641 | | | | 1,525 | | Other benefits | | | | | | | | | | | | | | | | | | | | | Benefits obligation | | 544 | | | 583 | | | 648 | | | 774 | | | 675 | | | | 628 | | | | 623 | | | | 547 | | | | 544 | | | | 583 | | Fair value of plan assets | | — | | | — | | | — | | | — | | | — | | | | — | | | | — | | | | — | | | | — | | | | — | | Unfunded status | | 544 | | | 583 | | | 648 | | | 774 | | | 675 | | | | 628 | | | | 623 | | | | 547 | | | | 544 | | | | 583 | |
The Group expects to contribute 82 M€182 million to its pension plans in 2009.2012. | | | | | Estimated future payments (M€) | | Pension benefits | | Other benefits | 2009 | | 518 | | 35 | 2010 | | 497 | | 36 | 2011 | | 494 | | 37 | 2012 | | 501 | | 37 | 2013 | | 527 | | 39 | 2014-2018 | | 2,652 | | 180 |
| | | | | | | | | | Estimated future payments (M€) | | Pension benefits | | | Other benefits | | 2012 | | | 479 | | | | 35 | | 2013 | | | 467 | | | | 35 | | 2014 | | | 505 | | | | 35 | | 2015 | | | 511 | | | | 35 | | 2016 | | | 512 | | | | 37 | | 2017-2021 | | | 2,767 | | | | 191 | |
| | Asset allocation | | Pension benefits | | Pension benefits | | | As of December 31,(M€) | | 2008 | | 2007 | | 2006 | | | As of December 31, | | | 2011 | | 2010 | | 2009 | | Equity securities | | 25% | | 36% | | 42% | | | 29 | % | | | 34 | % | | | 31% | | Debt securities | | 56% | | 56% | | 48% | | | 64 | % | | | 60 | % | | | 62% | | Monetary | | 16% | | 4% | | 6% | | | 4 | % | | | 3 | % | | | 3% | | Real estate | | 3% | | 4% | | 4% | | | 3 | % | | | 3 | % | | | 4% | |
The Group’s assumptions of expected returns on assets are built up by asset class and by country based on long-term bond yields and risk premiums. The discount rate retained corresponds to the rate of high qualityprime corporate bonds based onaccording to a benchmark per country of different market data on the closing date. | | Assumptions used to determine benefits obligations | | Pension benefits | | | Other benefits | | Pension benefits | | Other benefits | | | As of December 31,(M€) | | 2008 | | 2007 | | 2006 | | | | 2008 | | 2007 | | 2006 | | Discount rate | | 5.93% | | 5.50% | | 4.69% | | | | 6.00% | | 5.50% | | 4.89% | | | As of December 31, | | | 2011 | | 2010 | | 2009 | | 2011 | | 2010 | | 2009 | | Discount rate (weighted average for all regions) | | | | | | 4.61 | % | | | 5.01 | % | | | 5.41 | % | | | 4.70 | % | | | 5.00 | % | | | 5.60% | | | | | Of which Euro zone | | | 4.21 | % | | | 4.58 | % | | | 5.12 | % | | | 4.25 | % | | | 4.55 | % | | | 5.18% | | | | | Of which United States | | | 5.00 | % | | | 5.49 | % | | | 6.00 | % | | | 4.97 | % | | | 5.42 | % | | | 5.99% | | | | | Of which United Kingdom | | | 4.75 | % | | | 5.50 | % | | | 5.50 | % | | | — | | | | — | | | | — | | Average expected rate of salary increase | | 4.56% | | 4.29% | | 4.14% | | | | — | | — | | — | | | | | 4.69 | % | | | 4.55 | % | | | 4.50 | % | | | — | | | | — | | | | — | | Expected rate of healthcare inflation | | | | | | | | | | | | | | | | | | | | | | | | | | | | | — initial rate | | — | | — | | — | | | | 4.88% | | 5.16% | | 5.57% | | | | | — | | | | — | | | | — | | | | 4.82 | % | | | 4.82 | % | | | 4.91% | | — ultimate rate | | — | | — | | — | | | | 3.64% | | 3.64% | | 3.65% | | | | | — | | | | — | | | | — | | | | 3.77 | % | | | 3.75 | % | | | 3.79% | | | | | | | Assumptions used to determine the net periodic
benefit cost (income) | | | Pension benefits | | Other benefits | | | For the year ended December 31, | | | 2011 | | 2010 | | 2009 | | 2011 | | 2010 | | 2009 | | Discount rate (weighted average for all regions) | | | | | | 5.01 | % | | | 5.41 | % | | | 5.93 | % | | | 5.00 | % | | | 5.60 | % | | | 6.00% | | | | | Of which Euro zone | | | 4.58 | % | | | 5.12 | % | | | 5.72 | % | | | 4.55 | % | | | 5.18 | % | | | 5.74% | | | | | Of which United States | | | 5.49 | % | | | 6.00 | % | | | 6.23 | % | | | 5.42 | % | | | 5.99 | % | | | 6.21% | | | | | Of which United Kingdom | | | 5.50 | % | | | 5.50 | % | | | 6.00 | % | | | — | | | | — | | | | 6.00% | | Average expected rate of salary increase | | | | | | 4.55 | % | | | 4.50 | % | | | 4.56 | % | | | — | | | | — | | | | — | | Expected return on plan assets | | | | | | 5.90 | % | | | 6.39 | % | | | 6.14 | % | | | — | | | | — | | | | — | | Expected rate of healthcare inflation | | | | | | | | | | | | | | | | — initial rate | | | | | | — | | | | — | | | | — | | | | 4.82 | % | | | 4.91 | % | | | 4.88% | | — ultimate rate | | | | | | — | | | | — | | | | — | | | | 3.75 | % | | | 3.79 | % | | | 3.64% | |
| | | | | | | | | | | | | | | Assumptions used to determine the net periodic benefit cost (income) | | Pension benefits | | | | Other benefits | | As of December 31,(M€) | | 2008 | | 2007 | | 2006 | | | | 2008 | | 2007 | | 2006 | Discount rate | | 5.50% | | 4.69% | | 4.51% | | | | 5.50% | | 4.89% | | 4.56% | Average expected rate of salary increase | | 4.29% | | 4.14% | | 3.63% | | | | — | | — | | — | Expected return on plan assets | | 6.60% | | 6.26% | | 6.14% | | | | — | | — | | — | Expected rate of healthcare inflation | | | | | | | | | | | | | | | — initial rate | | — | | — | | — | | | | 5.16% | | 5.57% | | 5.41% | — ultimate rate | | — | | — | | — | | | | 3.64% | | 3.65% | | 4.00% |
A 0,5%0.5% increase or decrease in discount rates –— all other things being equal –— would have the following approximate impact: | | | | | | | (M€) | | 0.5%
increase | | | 0.5%
decrease | Benefit obligation as of December 31, 2008 | | (420 | ) | | 475 | Net periodic benefit cost (income) | | (30 | ) | | 37 |
| | | | | | | | | | (M€) | | 0.5% increase | | | 0.5% decrease | | Benefit obligation as of December 31, 2011 | | | (513 | ) | | | 551 | | 2012 net periodic benefit cost (income) | | | (41 | ) | | | 56 | |
A 10%0.5% increase or decrease in the fair value ofexpected return on plan assets –rate — all other things being equal –— would have the following approximate impact:an impact of€31 million on 2012 net periodic benefit cost (income). | | | | | | | | (M€) | | 10%
increase | | | 10%
decrease | | Fair value of plan assets as of December 31, 2008 | | 576 | | | (576 | ) | Net periodic benefit cost (income) | | (86 | ) | | 105 | |
The components of the net periodic benefit cost (income) in 2008, 20072011, 2010 and 20062009 are: | | | | Pension benefits | | | | | Other benefits | | | Pension benefits | | Other benefits | | | As of December 31,(M€) | | 2008 | | 2007 | | 2006 | | | | 2008 | | 2007 | | 2006 | | | | For the year ended December 31, (M€) | | | 2011 | | 2010 | | 2009 | | 2011 | | 2010 | | 2009 | | Service cost | | 143 | | | 160 | | | 174 | | | | | 14 | | | 12 | | | 11 | | | | 163 | | | | 159 | | | | 134 | | | | 13 | | | | 11 | | | | 10 | | Interest cost | | 416 | | | 396 | | | 392 | | | | | 24 | | | 28 | | | 30 | | | | 420 | | | | 441 | | | | 428 | | | | 28 | | | | 29 | | | | 30 | | Expected return on plan assets | | (402 | ) | | (387 | ) | | (353 | ) | | | | — | | | — | | | — | | | | (385 | ) | | | (396 | ) | | | (343 | ) | | | — | | | | — | | | | — | | Amortization of prior service cost | | 34 | | | 31 | | | 41 | | | | | (10 | ) | | (5 | ) | | (2 | ) | | | 58 | | | | 74 | | | | 13 | | | | 2 | | | | (5 | ) | | | (7 | ) | Amortization of actuarial losses (gains) | | 22 | | | 17 | | | 26 | | | | | (2 | ) | | (1 | ) | | (2 | ) | | | 46 | | | | 66 | | | | 50 | | | | — | | | | (4 | ) | | | (6 | ) | Asset ceiling | | 1 | | | — | | | — | | | | | — | | | — | | | — | | | | 2 | | | | (3 | ) | | | 4 | | | | — | | | | — | | | | — | | Curtailments | | (3 | ) | | (8 | ) | | (4 | ) | | | | — | | | — | | | (1 | ) | | | (22 | ) | | | (3 | ) | | | (4 | ) | | | (1 | ) | | | (3 | ) | | | (1 | ) | Settlements | | (2 | ) | | (12 | ) | | (15 | ) | | | | (3 | ) | | (1 | ) | | — | | | | (9 | ) | | | 7 | | | | (1 | ) | | | — | | | | — | | | | — | | Special termination benefits | | — | | | — | | | — | | | | — | | | — | | | — | | | | — | | | | — | | | | — | | | | — | | | | 1 | | | | — | | Net periodic benefit cost (income) | | 209 | | | 197 | | | 261 | | | | 23 | | | 33 | | | 36 | | | | 273 | | | | 345 | | | | 281 | | | | 42 | | | | 29 | | | | 26 | | Net periodic benefit cost (income) from continuing operations | | 209 | | | 197 | | | 256 | | | | | 23 | | | 33 | | | 35 | | | Net periodic benefit cost (income) from discontinued operations | | — | | | — | | | 5 | | | | — | | | — | | | 1 | | |
A positive or negative change of one-percentage-point in the healthcare inflation rate would have the following approximate impact: | | | | | | | (M€) | | 1% point
increase | | 1% point
decrease | | Benefit obligation as of December 31, 2008 | | 69 | | (52 | ) | Net periodic benefit cost (income) | | 6 | | (4 | ) |
| | | | | | | | | | (M€) | | 1% point
increase | | | 1% point
decrease | | Benefit obligation as of December 31, 2011 | | | 53 | | | | (63 | ) | 2011 net periodic benefit cost (income) | | | 5 | | | | (5 | ) |
19)PROVISIONS AND OTHER NON-CURRENT LIABILITIES | | As of December 31,(M€) | | 2008 | | 2007 | | 2006 | | 2011 | | | 2010 | | | 2009 | | Litigation and accrued penalty claims | | 546 | | 601 | | 497 | | Litigations and accrued penalty claims | | | | 572 | | | | 485 | | | | 423 | | Provisions for environmental contingencies | | 558 | | 552 | | 574 | | | 600 | | | | 644 | | | | 623 | | Asset retirement obligations | | 4,500 | | 4,206 | | 3,893 | | | 6,884 | | | | 5,917 | | | | 5,469 | | Other non-current provisions | | 1,804 | | 1,188 | | 1,215 | | | 1,099 | | | | 1,116 | | | | 1,331 | | Other non-current liabilities | | 450 | | 296 | | 288 | | | 1,754 | | | | 936 | | | | 1,535 | | Total | | 7,858 | | 6,843 | | 6,467 | | | 10,909 | | | | 9,098 | | | | 9,381 | |
In 2008,2011, litigation reserves mainly include a provision covering risks concerning antitrust investigations related to Arkema amounting to 85 M€17 million as of December 31, 2008. Other risks and commitments that give rise to contingent liabilities are described in Note 32 to the Consolidated Financial Statements. In 2008, other non current provisions include the contingency reserve related to the Toulouse-AZF plant explosion (civil liability) for 256 M€ as of December 31, 2008.
In 2007, litigation reserves included a provision covering risks concerning antitrust investigations related to Arkema amounting to 138 M€ as of December 31, 2007.2011. Other risks and commitments that give rise to contingent liabilities are described in Note 32 to the Consolidated Financial Statements.
In 2007,2011, other non-current provisions mainly include: The contingency reserve related to the Toulouse-AZF plant explosion (civil liability) for€21 million as of December 31, 2011; Provisions related to restructuring activities in the Downstream and Chemicals segments for€211 million as of December 31, 2011; and The contingency reserve related to the Buncefield depot explosion (civil liability) for€80 million as of December 31, 2011. In 2011, other non-current liabilities mainly include debts (whose maturity is more than one year) related to fixed assets acquisitions. This heading is mainly composed of a€991 million debt related to the acquisition of an interest in the liquids-rich area of the Utica shale play (see Note 3 to the Consolidated Financial Statements). In 2010, litigation reserves mainly included a provision covering risks concerning antitrust investigations related to Arkema amounting to€17 million as of December 31, 2010. Other risks and commitments that give rise to contingent liabilities are described in Note 32 to the Consolidated Financial Statements. In 2010, other non-current provisions mainly included: The contingency reserve related to the Toulouse-AZF plant explosion (civil liability) for 134 M€31 million as of December 31, 2007; and2010; Provisions related to restructuring activities in the Downstream and Chemicals segmentsegments for 49 M€261 million as of December 31, 2007.2010; and The contingency reserve related to the Buncefield depot explosion (civil liability) for€194 million as of December 31, 2010. In 2010, other non-current liabilities mainly included debts (whose maturity is more than one year) related to fixed assets acquisitions. In 2006,2009, litigation reserves mainly included a provision covering risks concerning antitrust investigations related to Arkema amounting to 138 M€43 million as of December 31, 2006.2009. Other risks and commitments that give rise to contingent liabilities are described in Note 32 to the Consolidated Financial Statements. In 2006, the2009, other non-current provisions mainly included: The contingency reserve related to the Toulouse-AZF plant explosion (civil liability) for€40 million as of December 31, 2009; Provisions related to restructuring activities in the Downstream and Chemicals segments for€130 million as of December 31, 2009; and The contingency reserve related to the Buncefield depot explosion (civil liability) for€295 million as of December 31, 2009. In 2009, other non-current liabilities mainly included debts (whose maturity is more than one year) related to fixed assets acquisitions. This heading was mainly composed of a€818 million debt related to Chesapeake acquisition (see Note 3 to the Consolidated Financial Statements). Changes in provisions and other non-current liabilities Changes in provisions and other non-current liabilities are as follows: | | | | | | | | | | | | | | | | | | | | | | | | | | (M€) | | As of
January 1, | | | Allowances | | | Reversals | | | Currency
translation
adjustment | | | Other | | | As of
December 31, | | 2011 | | | 9,098 | | | | 921 | | | | (798 | ) | | | 227 | | | | 1,461 | | | | 10,909 | | 2010 | | | 9,381 | | | | 1,052 | | | | (971 | ) | | | 497 | | | | (861 | ) | | | 9,098 | | 2009 | | | 7,858 | | | | 1,254 | | | | (1,413 | ) | | | 202 | | | | 1,480 | | | | 9,381 | |
Allowances In 2011, allowances of the period (€921 million) mainly include: Asset retirement obligations for€344 million (accretion); Environmental contingencies for€100 million in the Downstream and Chemicals segments ; and Provisions related to restructuring of activities for€79 million. In 2010, allowances of the period (€1,052 million) mainly included: Asset retirement obligations for€338 million (accretion); Environmental contingencies for€88 million in the Downstream and Chemicals segments ; The contingency reserve related to the Buncefield depot explosion (civil liability) for€79 million ; and Provisions related to restructuring of activities for€226 million. In 2009, allowances of the period (€1,254 million) mainly included: Asset retirement obligations for€283 million (accretion); Environmental contingencies for€147 million in the Downstream and Chemicals segments; The contingency reserve related to the Buncefield depot explosion (civil liability) for€223 million; and Provisions related to restructuring of activities for€121 million. Reversals In 2011, reversals of the period (€798 million) are mainly related to the following incurred expenses: Provisions for asset retirement obligations for€189 million; Environmental contingencies written back for€70 million; The contingency reserve related to the Toulouse-AZF plant explosion (civil liability), written back for 176 M€ as of December 31, 2006; and10 million; Provisions related to restructuring activities in the Chemicals segment for 72 M€ as of December 31, 2006.
CHANGES IN PROVISIONS AND OTHER NON-CURRENT LIABILITIES
| | | | | | | | | | | | | | | | | (M€) | | As of January 1, | | Allowances | | Reversals | | | Currency
translation
adjustment | | | Other | | | As of December 31, | 2008 | | 6,843 | | 1,424 | | (864 | ) | | (460 | ) | | 915 | | | 7,858 | 2007 | | 6,467 | | 747 | | (927 | ) | | (303 | ) | | 859 | | | 6,843 | 2006 | | 7,051 | | 884 | | (821 | ) | | (273 | ) | | (374 | ) | | 6,467 |
In 2008, allowances of the period (1,424 M€) mainly include:
asset retirement obligations for 229 M€ (accretion);
theThe contingency reserve related to the Toulouse-AZF plantBuncefield depot explosion (civil liability), written back for 140 M€;
environmental contingencies for 89 M€;
an allowance of 48 M€ for litigation reserves in connection with antitrust investigations, as described in Note 32 to the Consolidated Financial Statements “Other risks and contingent liabilities”;116 million; and
provisions related toProvisions for restructuring of activitiesand social plans written back for 27 M€.164 million.
In 2007, allowances2010, reversals of the period (747 M(€)971 million) were mainly included:related to the following incurred expenses: provisionsProvisions for asset retirement obligations for 189 M€ (accretion);214 million;
an allowance of 100 M€ for litigation reserves in connection with antitrust investigations, as described in Note 32 to the Consolidated Financial Statements “Other risks and contingent liabilities”;
environmental contingencies in the Chemicals segment for 23 M€; and
provisions related to restructuring of activities in the Chemicals segment for 15 M€.
In 2006, allowances of the period (884 M€) mainly included:
provisions for asset retirement obligations for 182 M€ (accretion);
an additional allowance of the contingency reserve related to the Toulouse-AZF plant explosion (civil liability), for 100 M€;
environmental contingencies in the Chemicals segment for 96 M€;
provisions related to restructuring of activities in the Chemicals segment for 88 M€; and
an allowance of 32 M€ for litigation reserves in connection with antitrust investigations, as described in Note 32 to the Consolidated Financial Statements “Other risks and contingent liabilities”.
In 2008, the main reversals of the period (864 M€) relate to the incurred expenses, which mainly include:
provisions for asset retirement obligations for 280 M€;
163 M€26 million for litigation reserves in connection with antitrust investigations;
environmentalEnvironmental contingencies written back for 96 M€;66 million;
theThe contingency reserve related to the Toulouse-AZF plant explosion (civil liability), written back for 18 M€;9 million;
The contingency reserve related to the Buncefield depot explosion (civil liability), written back for€190 million; and provisionsProvisions for restructuring and social plans written back for 10 M€.60 million.
In 2007, the main2009, reversals of the period (927 M(€)1,413 million) were mainly related to the following incurred expenses which mainly included:expenses: provisionsProvisions for asset retirement obligations for 209 M€;191 million;
environmental€52 million for litigation reserves in connection with antitrust investigations;
Environmental contingencies in the Chemicals segment written back for 52 M€;86 million; theThe contingency reserve related to the Toulouse-AZF plant explosion (civil liability), written back for 42 M€;216 million;
The contingency reserve related to the Buncefield depot explosion (civil liability), written back for€375 million; and provisionsProvisions for restructuring and social plans written back for 37 M€.
In 2006, the main reversals of the period (821 M€) were related to the incurred expenses, which mainly included:
provisions for asset retirement obligations for 174 M€;
the contingency reserve related to the Toulouse-AZF plant explosion (civil liability), written back for 57 M€;
environmental contingencies in the Chemicals segment written back for 56 M€; and
provisions for restructuring and social plans written back for 43 M€.28 million.
CHANGES IN THE ASSET RETIREMENT OBLIGATIONChanges in the asset retirement obligation
Changes in the asset retirement obligation are as follows: | | | | | | | | | | | | | | | | | | | | | (M€) | | As of
January 1, | | Accretion | | Revision
in
estimates | | New
obligations | | Spending
on existing
obligations | | | Currency
translation
adjustment | | | Other | | | As of
December 31, | 2008 | | 4,206 | | 229 | | 563 | | 188 | | (280 | ) | | (414 | ) | | 8 | | | 4,500 | 2007 | | 3,893 | | 189 | | 203 | | 371 | | (209 | ) | | (206 | ) | | (35 | ) | | 4,206 | 2006 | | 3,710 | | 182 | | 66 | | 274 | | (174 | ) | | (191 | ) | | 26 | | | 3,893 |
| | | | | | | | | | | | | | | | | | | | | | | | | | | | | | | | | | (M€) | | As of
January 1, | | | Accretion | | | Revision in
estimates | | | New
obligations | | | Spending
on existing
obligations | | | Currency
translation
adjustment | | | Other | | | As of
December 31, | | 2011 | | | 5,917 | | | | 344 | | | | 330 | | | | 323 | | | | (189 | ) | | | 150 | | | | 9 | | | | 6,884 | | 2010 | | | 5,469 | | | | 338 | | | | 79 | | | | 175 | | | | (214 | ) | | | 316 | | | | (246 | ) | | | 5,917 | | 2009 | | | 4,500 | | | | 283 | | | | 447 | | | | 179 | | | | (191 | ) | | | 232 | | | | 19 | | | | 5,469 | |
20)FINANCIAL DEBT AND RELATED FINANCIAL INSTRUMENTS A) NON-CURRENT FINANCIAL DEBT AND RELATED FINANCIAL INSTRUMENTS
| | | | | | | | | | As of December 31, 2008(M€) | | Secured | | Unsecured | | | Total | | (Assets)/Liabilities | | | | | | | | | | | | | Non-current financial debt | | 895 | | 15,296 | | | 16,191 | | of which hedging instruments of non-current financial debt (liabilities) | | — | | 440 | | | 440 | | Hedging instruments of non-current financial debt (assets)(a) | | — | | (892 | ) | | (892 | ) | Non-current financial debt - net of hedging instruments | | 895 | | 14,404 | | | 15,299 | | Bonds, net of hedging instruments | | — | | 13,667 | | | 13,667 | | Bank and other, floating rate | | 553 | | 665 | | | 1,218 | | Bank and other, fixed rate | | 140 | | 6 | | | 146 | | Financial lease obligations | | 202 | | 66 | | | 268 | | Non-current financial debt - net of hedging instruments | | 895 | | 14,404 | | | 15,299 | |
| A) | | NON-CURRENT FINANCIAL DEBT AND RELATED FINANCIAL INSTRUMENTS |
| | | | | | | | | | As of December 31, 2007(M€) | | Secured | | Unsecured | | | Total | | (Assets)/Liabilities | | | | | | | | | | | | | Non-current financial debt | | 772 | | 14,104 | | | 14,876 | | of which hedging instruments of non-current financial debt (liabilities) | | — | | 369 | | | 369 | | Hedging instruments of non-current financial debt (assets)(a) | | — | | (460 | ) | | (460 | ) | Non-current financial debt - net of hedging instruments | | 772 | | 13,644 | | | 14,416 | | Bonds, net of hedging instruments | | — | | 11,650 | | | 11,650 | | Bank and other, floating rate | | 453 | | 1,781 | | | 2,234 | | Bank and other, fixed rate | | 2 | | 213 | | | 215 | | Financial lease obligations | | 317 | | — | | | 317 | | Non-current financial debt - net of hedging instruments | | 772 | | 13,644 | | | 14,416 | |
| | As of December 31, 2006(M€) | | Secured | | Unsecured | | Total | | | | (Assets)/Liabilities | | | | | | | As of December 31, 2011 (M€)
(Assets) / Liabilities | | | Secured | | | Unsecured | | Total | | Non-current financial debt | | 771 | | 13,403 | | | 14,174 | | | | 349 | | | | 22,208 | | | | 22,557 | | of which hedging instruments of non-current financial debt (liabilities) | | — | | 193 | | | 193 | | | | — | | | | 146 | | | | 146 | | Hedging instruments of non-current financial debt (assets)(a) | | — | | (486 | ) | | (486 | ) | | | — | | | | (1,976 | ) | | | (1,976 | ) | Non-current financial debt - net of hedging instruments | | 771 | | 12,917 | | | 13,688 | | | Bonds, net of hedging instruments | | — | | 11,120 | | | 11,120 | | | Non-current financial debt — net of hedging instruments | | | | 349 | | | | 20,232 | | | | 20,581 | | Bonds after fair value hedge | | | | — | | | | 15,148 | | | | 15,148 | | Fixed rate bonds and bonds after cash flow hedge | | | | — | | | | 4,424 | | | | 4,424 | | Bank and other, floating rate | | 398 | | 1,589 | | | 1,987 | | | | 129 | | | | 446 | | | | 575 | | Bank and other, fixed rate | | 2 | | 208 | | | 210 | | | | 76 | | | | 206 | | | | 282 | | Financial lease obligations | | 371 | | — | | | 371 | | | | 144 | | | | 8 | | | | 152 | | Non-current financial debt - net of hedging instruments | | 771 | | 12,917 | | | 13,688 | | | Non-current financial debt — net of hedging instruments | | | | 349 | | | | 20,232 | | | | 20,581 | |
| (a) | See the description of these hedging instruments in NoteNotes 1 paragraph M(iii) “Long-term financing” and Notes, 28 and 29 to the Consolidated Financial Statements. |
| | | | | | | | | | | | | As of December 31, 2010 (M€)
(Assets) / Liabilities | | Secured | | | Unsecured | | | Total | | Non-current financial debt | | | 287 | | | | 20,496 | | | | 20,783 | | of which hedging instruments of non-current financial debt (liabilities) | | | — | | | | 178 | | | | 178 | | Hedging instruments of non-current financial debt (assets)(a) | | | — | | | | (1,870 | ) | | | (1,870 | ) | Non-current financial debt — net of hedging instruments | | | 287 | | | | 18,626 | | | | 18,913 | | Bonds after fair value hedge | | | — | | | | 15,491 | | | | 15,491 | | Fixed rate bonds and bonds after cash flow hedge | | | — | | | | 2,836 | | | | 2,836 | | Bank and other, floating rate | | | 47 | | | | 189 | | | | 236 | | Bank and other, fixed rate | | | 65 | | | | 110 | | | | 175 | | Financial lease obligations | | | 175 | | | | — | | | | 175 | | Non-current financial debt — net of hedging instruments | | | 287 | | | | 18,626 | | | | 18,913 | |
| (a) | See the description of these hedging instruments in Notes 1 paragraph M(iii) “Long-term financing”, 28 and 29 to the Consolidated Financial Statements. |
| | | | | | | | | | | | | As of December 31, 2009 (M€)
(Assets) / Liabilities | | Secured | | | Unsecured | | | Total | | Non-current financial debt | | | 312 | | | | 19,125 | | | | 19,437 | | of which hedging instruments of non-current financial debt (liabilities) | | | — | | | | 241 | | | | 241 | | Hedging instruments of non-current financial debt (assets)(a) | | | — | | | | (1,025 | ) | | | (1,025 | ) | Non-current financial debt — net of hedging instruments | | | 312 | | | | 18,100 | | | | 18,412 | | Bonds after fair value hedge | | | — | | | | 15,884 | | | | 15,884 | | Fixed rate bonds and bonds after cash flow hedge | | | — | | | | 1,700 | | | | 1,700 | | Bank and other, floating rate | | | 60 | | | | 379 | | | | 439 | | Bank and other, fixed rate | | | 50 | | | | 79 | | | | 129 | | Financial lease obligations | | | 202 | | | | 58 | | | | 260 | | Non-current financial debt — net of hedging instruments | | | 312 | | | | 18,100 | | | | 18,412 | |
| (a) | See the description of these hedging instruments in Notes 1 paragraph M(iii) “Long-term financing”, 28 and 29 to the Consolidated Financial Statements. |
Fair value of bonds, as of December 31, 2008,2011, after taking into account hedging currency and interest rates swaps, can beis detailed as follows: | | | | | | Fair value after hedging as of | | | | | | | | | (M€) | | Year of
issue | | December 31,
2008 | | December 31,
2007 | | December 31,
2006 | | Currency | | Maturity | | Initial rate before
hedging instruments | | Bonds after fair value
hedge (M€) | | | Year of
issue | | | Fair value
after hedging
as of
December 31,
2011 | | | Fair value
after hedging
as of
December 31,
2010 | | | Fair value
after hedging
as of
December 31,
2009 | | Currency | | | Maturity | | | Initial rate
before
hedging
instruments | Parent company | | | | | | | | | | | | | | | | | | | | | | | | | | | | | Bond | | 1996 | | — | | | 324 | | | 362 | | | FRF | | 2008 | | 6.750% | | Bond | | 1997 | | — | | | — | | | 75 | | | FRF | | 2007 | | 5.030% | | Bond | | 1997 | | — | | | — | | | 63 | | | ESP | | 2007 | | 6.800% | | Bond | | 1997 | | 124 | | | 118 | | | 126 | | | FRF | | 2009 | | 6.200% | | Bond | | 1998 | | — | | | 26 | | | 29 | | | FRF | | 2008 | | Pibor 3 months + 0.380% | | Bond | | 1998 | | 119 | | | 113 | | | 132 | | | FRF | | 2009 | | 5.125% | | Bond | | 1998 | | 121 | | | 114 | | | 128 | | | FRF | | 2013 | | 5.000% | | | 1998 | | | | 129 | | | | 125 | | | | 116 | | | | FRF | | | | 2013 | | | 5.000% | Bond | | 2000 | | 63 | | | 60 | | | 68 | | | EUR | | 2010 | | 5.650% | | | 2000 | | | | — | | | | — | | | | 61 | | | | EUR | | | | 2010 | | | 5.650% | Current portion (less than one year) | | | | (243 | ) | | (349 | ) | | (138 | ) | | | | | | | | | | | — | | | | — | | | | (61 | ) | | | | | | Total parent company | | 184 | | | 406 | | | 845 | | | | | | | 129 | | | | 125 | | | | 116 | | | | | | | Elf Aquitaine S.A. | | | | | | | | | | | | | | | | Bond | | 1999 | | 1,003 | | | 998 | | | 996 | | | EUR | | 2009 | | 4.500% | | Current portion (less than one year) | | | | (1,003 | ) | | — | | | — | | | | | | | | | Total Elf Aquitaine S.A. | | — | | | 998 | | | 996 | | | |
| | | | | | Fair value after hedging as of | | | | | | | | | (M€) | | Year of
issue | | December 31,
2008 | | December 31,
2007 | | December 31,
2006 | | Currency | | Maturity | | Initial rate before hedging instruments | | | TOTAL CAPITAL | | | | | | | | | | | | | | | | Bonds after fair value
hedge (M€) | | | Year of
issue | | | Fair value
after hedging
as of
December 31,
2011 | | | Fair value
after hedging
as of
December 31,
2010 | | | Fair value
after hedging
as of
December 31,
2009 | | | Currency | | | Maturity | | | Initial rate before hedging instruments | TOTAL CAPITAL(a) | | | | | | | | | | | | | | | | Bond | | 2002 | | — | | — | | 276 | | CHF | | 2007 | | 3.000% | | | 2002 | | | | 15 | | | | 15 | | | | 14 | | | | USD | | | | 2012 | | | 5.890% | Bond | | 2002 | | — | | — | | 183 | | CHF | | 2007 | | 3.000% | | | 2003 | | | | — | | | | — | | | | 160 | | | | CHF | | | | 2010 | | | 2.385% | Bond | | 2002 | | — | | — | | 101 | | CHF | | 2007 | | 2.500% | | | 2003 | | | | 23 | | | | 22 | | | | 21 | | | | USD | | | | 2013 | | | 4.500% | Bond | | 2002 | | — | | — | | 174 | | GBP | | 2007 | | 5.000% | | | 2004 | | | | — | | | | — | | | | 53 | | | | CAD | | | | 2010 | | | 4.000% | Bond | | 2002 | | — | | — | | 90 | | GBP | | 2007 | | 5.000% | | | 2004 | | | | — | | | | — | | | | 113 | | | | CHF | | | | 2010 | | | 2.385% | Bond | | 2002 | | — | | — | | 57 | | USD | | 2007 | | 4.740% | | | 2004 | | | | — | | | | — | | | | 438 | | | | EUR | | | | 2010 | | | 3.750% | Bond | | 2002 | | — | | — | | 228 | | USD | | 2007 | | 5.125% | | | 2004 | | | | — | | | | — | | | | 322 | | | | GBP | | | | 2010 | | | 4.875% | Bond | | 2002 | | 14 | | 14 | | 15 | | USD | | 2012 | | 5.890% | | | 2004 | | | | — | | | | — | | | | 128 | | | | GBP | | | | 2010 | | | 4.875% | Bond | | 2002 | | — | | — | | 190 | | USD | | 2007 | | 4.750% | | | 2004 | | | | — | | | | — | | | | 185 | | | | GBP | | | | 2010 | | | 4.875% | Bond | | 2002 | | — | | — | | 38 | | USD | | 2007 | | LIBOR USD 3 months + 0.060% | | | 2004 | | | | — | | | | 57 | | | | 53 | | | | AUD | | | | 2011 | | | 5.750% | Bond | | 2002 | | — | | — | | 38 | | USD | | 2007 | | LIBOR USD 3 months + 0.065% | | | 2004 | | | | — | | | | 116 | | | | 107 | | | | CAD | | | | 2011 | | | 4.875% | Bond | | 2003 | | — | | 39 | | 43 | | AUD | | 2008 | | 5.000% | | Bond | | 2003 | | — | | 41 | | 46 | | AUD | | 2008 | | 5.000% | | Bond | | 2003 | | 52 | | 49 | | 55 | | AUD | | 2009 | | 6.250% | | Bond | | 2003 | | — | | 44 | | 50 | | CAD | | 2008 | | 4.250% | | Bond | | 2003 | | — | | 148 | | 165 | | CHF | | 2008 | | 2.010% | | Bond | | 2003 | | 154 | | 145 | | 162 | | CHF | | 2009 | | 2.385% | | Bond | | 2003 | | — | | 98 | | 110 | | CHF | | 2008 | | 2.010% | | Bond | | 2003 | | 166 | | 157 | | 175 | | CHF | | 2010 | | 2.385% | | Bond | | 2003 | | — | | 360 | | 402 | | EUR | | 2008 | | 3.500% | | Bond | | 2003 | | — | | 72 | | 81 | | EUR | | 2008 | | 3.500% | | Bond | | 2003 | | — | | 113 | | 127 | | EUR | | 2008 | | 3.500% | | Bond | | 2003 | | — | | — | | 61 | | GBP | | 2007 | | 5.000% | | Bond | | 2003 | | 22 | | 20 | | 23 | | USD | | 2013 | | 4.500% | | Bond | | 2003 | | — | | 170 | | 190 | | USD | | 2008 | | 3.250% | | Bond | | 2003-2004 | | 395 | | 373 | | 418 | | USD | | 2009 | | 3.500% | | Bond | | 2004 | | 57 | | 54 | | 60 | | AUD | | 2009 | | 6.000% | |
| | | | | | Fair value after hedging as of | | | | | | | | | (M€) | | Year of
issue | | December 31,
2008 | | December 31,
2007 | | December 31,
2006 | | Currency | | Maturity | | Initial rate before hedging instruments | | Bonds after fair value
hedge (M€) | | | Year of
issue | | | Fair value
after hedging
as of
December 31,
2011 | | | Fair value
after hedging
as of
December 31,
2010 | | | Fair value
after hedging
as of
December 31,
2009 | | | Currency | | | Maturity | | | Initial rate before hedging instruments | Bond | | 2004 | | 28 | | 26 | | 29 | | AUD | | 2009 | | 6.000% | | | 2004 | | | | — | | | | 235 | | | | 203 | | | | USD | | | | 2011 | | | 4.125% | Bond | | 2004 | | 55 | | 52 | | 58 | | AUD | | 2011 | | 5.750% | | | 2004 | | | | — | | | | 75 | | | | 69 | | | | USD | | | | 2011 | | | 4.125% | Bond | | 2004 | | 55 | | 52 | | 58 | | CAD | | 2010 | | 4.000% | | | 2004 | | | | 129 | | | | 125 | | | | 116 | | | | CHF | | | | 2012 | | | 2.375% | Bond | | 2004 | | 111 | | 105 | | 118 | | CAD | | 2011 | | 4.875% | | | 2004 | | | | 52 | | | | 51 | | | | 47 | | | | NZD | | | | 2014 | | | 6.750% | Bond | | 2004 | | 117 | | 110 | | 123 | | CHF | | 2010 | | 2.385% | | | 2005 | | | | — | | | | 57 | | | | 53 | | | | AUD | | | | 2011 | | | 5.750% | Bond | | 2004 | | 120 | | 114 | | 127 | | CHF | | 2012 | | 2.375% | | | 2005 | | | | — | | | | 60 | | | | 56 | | | | CAD | | | | 2011 | | | 4.000% | Bond | | 2004 | | 454 | | 429 | | 479 | | EUR | | 2010 | | 3.750% | | | 2005 | | | | — | | | | 120 | | | | 112 | | | | CHF | | | | 2011 | | | 1.625% | Bond | | 2004 | | 334 | | 316 | | 353 | | GBP | | 2010 | | 4.875% | | | 2005 | | | | — | | | | 226 | | | | 226 | | | | CHF | | | | 2011 | | | 1.625% | Bond | | 2004 | | 132 | | 125 | | 140 | | GBP | | 2010 | | 4.875% | | | 2005 | | | | — | | | | 139 | | | | 144 | | | | USD | | | | 2011 | | | 4.125% | Bond | | 2004 | | 191 | | 181 | | 202 | | GBP | | 2010 | | 4.875% | | | 2005 | | | | 63 | | | | 63 | | | | 63 | | | | AUD | | | | 2012 | | | 5.750% | Bond | | 2004 | | — | | — | | 103 | | GBP | | 2007 | | 5.000% | | | 2005 | | | | 200 | | | | 194 | | | | 180 | | | | CHF | | | | 2012 | | | 2.135% | Bond | | 2004 | | 49 | | 46 | | 51 | | NZD | | 2014 | | 6.750% | | | 2005 | | | | 65 | | | | 65 | | | | 65 | | | | CHF | | | | 2012 | | | 2.135% | Bond | | 2004 | | — | | 34 | | 38 | | USD | | 2008 | | 3.250% | | | 2005 | | | | 97 | | | | 97 | | | | 97 | | | | CHF | | | | 2012 | | | 2.375% | Bond | | 2004 | | — | | 34 | | 38 | | USD | | 2008 | | 3.250% | | | 2005 | | | | 404 | | | | 391 | | | | 363 | | | | EUR | | | | 2012 | | | 3.250% | Bond | | 2004 | | — | | 68 | | 76 | | USD | | 2008 | | 3.250% | | | 2005 | | | | 57 | | | | 57 | | | | 57 | | | | NZD | | | | 2012 | | | 6.500% | Bond | | 2004 | | 216 | | 204 | | 228 | | USD | | 2011 | | 4.125% | | | 2006 | | | | — | | | | — | | | | 75 | | | | GBP | | | | 2010 | | | 4.875% | Bond | | 2004 | | 72 | | 68 | | 76 | | USD | | 2011 | | 4.125% | | | 2006 | | | | — | | | | — | | | | 50 | | | | EUR | | | | 2010 | | | 3.750% | Bond | | 2005 | | 55 | | 52 | | 58 | | AUD | | 2011 | | 5.750% | | | 2006 | | | | — | | | | — | | | | 50 | | | | EUR | | | | 2010 | | | 3.750% | Bond | | 2005 | | 63 | | 63 | | 63 | | AUD | | 2012 | | 5.750% | | | 2006 | | | | — | | | | — | | | | 100 | | | | EUR | | | | 2010 | | | 3.750% | Bond | | 2005 | | 58 | | 55 | | 61 | | CAD | | 2011 | | 4.000% | | | 2006 | | | | — | | | | 42 | | | | 42 | | | | EUR | | | | 2011 | | | EURIBOR
3 months +0.040% | Bond | | 2005 | | 187 | | 177 | | 197 | | CHF | | 2012 | | 2.135% | | | 2006 | | | | — | | | | 300 | | | | 300 | | | | EUR | | | | 2011 | | | 3.875% | Bond | | 2005 | | 116 | | 109 | | 122 | | CHF | | 2011 | | 1.625% | | | 2006 | | | | — | | | | 150 | | | | 150 | | | | EUR | | | | 2011 | | | 3.875% | Bond | | 2005 | | 65 | | 65 | | 65 | | CHF | | 2012 | | 2.135% | | | 2006 | | | | — | | | | 300 | | | | 300 | | | | EUR | | | | 2011 | | | 3.875% | Bond | | 2005 | | 226 | | 226 | | 226 | | CHF | | 2011 | | 1.625% | | | 2006 | | | | — | | | | 120 | | | | 120 | | | | USD | | | | 2011 | | | 5.000% | Bond | | 2005 | | 98 | | 97 | | 97 | | CHF | | 2012 | | 2.375% | | | 2006 | | | | — | | | | 300 | | | | 300 | | | | EUR | | | | 2011 | | | 3.875% | Bond | | 2005 | | 376 | | 356 | | 397 | | EUR | | 2012 | | 3.250% | | | 2006 | | | | — | | | | 472 | | | | 472 | | | | USD | | | | 2011 | | | 5.000% | Bond | | 2005 | | 287 | | 286 | | 284 | | GBP | | 2012 | | 4.625% | | | 2006 | | | | 62 | | | | 62 | | | | 62 | | | | AUD | | | | 2012 | | | 5.625% | Bond | | 2005 | | 36 | | 34 | | 38 | | USD | | 2009 | | 3.500% | | | 2006 | | | | 72 | | | | 72 | | | | 72 | | | | CAD | | | | 2012 | | | 4.125% | Bond | | 2005 | | 144 | | 136 | | 152 | | USD | | 2011 | | 4.125% | | | 2006 | | | | 100 | | | | 100 | | | | 100 | | | | EUR | | | | 2012 | | | 3.250% | Bond | | 2005 | | 57 | | 57 | | 57 | | NZD | | 2012 | | 6.500% | | | 2006 | | | | 74 | | | | 74 | | | | 74 | | | | GBP | | | | 2012 | | | 4.625% | Bond | | 2006 | | 130 | | 130 | | 130 | | CHF | | 2016 | | 2.385% | | | 2006 | | | | 100 | | | | 100 | | | | 100 | | | | EUR | | | | 2012 | | | 3.250% | Bond | | 2006 | | 62 | | 62 | | 62 | | AUD | | 2012 | | 5.625% | | | 2006 | | | | 125 | | | | 125 | | | | 125 | | | | CHF | | | | 2013 | | | 2.510% | Bond | | 2006 | | 72 | | 72 | | 72 | | CAD | | 2012 | | 4.125% | | | 2006 | | | | 127 | | | | 127 | | | | 127 | | | | CHF | | | | 2014 | | | 2.635% | Bond | | 2006 | | 100 | | 100 | | 100 | | EUR | | 2012 | | 3.250% | | | 2006 | | | | 130 | | | | 130 | | | | 130 | | | | CHF | | | | 2016 | | | 2.385% | Bond | | 2006 | | — | | — | | 147 | | GBP | | 2007 | | 5.000% | | | 2006 | | | | 65 | | | | 65 | | | | 65 | | | | CHF | | | | 2016 | | | 2.385% | Bond | | 2006 | | 65 | | 65 | | 65 | | CHF | | 2016 | | 2.385% | | | 2006 | | | | 64 | | | | 64 | | | | 64 | | | | CHF | | | | 2016 | | | 2.385% | Bond | | 2006 | | 64 | | 64 | | 64 | | CHF | | 2016 | | 2.385% | | | 2006 | | | | 63 | | | | 63 | | | | 63 | | | | CHF | | | | 2016 | | | 2.385% | Bond | | 2006 | | 64 | | 64 | | 63 | | CHF | | 2016 | | 2.385% | | | 2006 | | | | 129 | | | | 129 | | | | 129 | | | | CHF | | | | 2018 | | | 3.135% | Bond | | 2006 | | 129 | | 129 | | 129 | | CHF | | 2018 | | 3.135% | | | 2007 | | | | — | | | | — | | | | 60 | | | | CHF | | | | 2010 | | | 2.385% | Bond | | 2006 | | 102 | | 100 | | 100 | | EUR | | 2010 | | 3.750% | | | 2007 | | | | — | | | | — | | | | 74 | | | | GBP | | | | 2010 | | | 4.875% | Bond | | 2006 | | 74 | | 74 | | 74 | | GBP | | 2012 | | 4.625% | | | 2007 | | | | — | | | | 77 | | | | 77 | | | | USD | | | | 2011 | | | 5.000% | Bond | | 2006 | | 300 | | 300 | | 300 | | EUR | | 2011 | | 3.875% | | | 2007 | | | | 370 | | | | 370 | | | | 370 | | | | USD | | | | 2012 | | | 5.000% | Bond | | 2006 | | 50 | | 50 | | 50 | | EUR | | 2010 | | 3.750% | | | 2007 | | | | 222 | | | | 222 | | | | 222 | | | | USD | | | | 2012 | | | 5.000% | Bond | | 2006 | | 127 | | 127 | | 127 | | CHF | | 2014 | | 2.635% | | | 2007 | | | | 61 | | | | 61 | | | | 61 | | | | AUD | | | | 2012 | | | 6.500% | Bond | | 2006 | | 473 | | 474 | | 474 | | USD | | 2011 | | 5.000% | | | 2007 | | | | 72 | | | | 72 | | | | 72 | | | | CAD | | | | 2012 | | | 4.125% | Bond | | 2006 | | 100 | | 100 | | 100 | | EUR | | 2012 | | 3.250% | | | 2007 | | | | 71 | | | | 71 | | | | 71 | | | | GBP | | | | 2012 | | | 4.625% | Bond | | 2006 | | 42 | | 42 | | 42 | | EUR | | 2011 | | EURIBOR 3 months +0.040% | | | 2007 | | | | 300 | | | | 300 | | | | 300 | | | | EUR | | | | 2013 | | | 4.125% | Bond | | 2006 | | 300 | | 300 | | 300 | | EUR | | 2011 | | 3.875% | | | 2007 | | | | 73 | | | | 73 | | | | 73 | | | | GBP | | | | 2013 | | | 5.500% | Bond | | 2006 | | 150 | | 150 | | 151 | | EUR | | 2011 | | 3.875% | | | 2007 | | | | 306 | | | | 306 | | | | 306 | | | | GBP | | | | 2013 | | | 5.500% | Bond | | 2006 | | 120 | | 120 | | 120 | | USD | | 2011 | | 5.000% | | | 2007 | | | | 72 | | | | 72 | | | | 72 | | | | GBP | | | | 2013 | | | 5.500% | Bond | | 2006 | | 75 | | 75 | | 74 | | GBP | | 2010 | | 4.875% | | | 2007 | | | | 248 | | | | 248 | | | | 248 | | | | CHF | | | | 2014 | | | 2.635% | Bond | | 2006 | | 50 | | 50 | | 50 | | EUR | | 2010 | | 3.750% | | | 2007 | | | | 31 | | | | 31 | | | | 31 | | | | JPY | | | | 2014 | | | 1.505% | Bond | | 2006 | | 300 | | 300 | | 300 | | EUR | | 2011 | | 3.875% | | | 2007 | | | | 61 | | | | 61 | | | | 61 | | | | CHF | | | | 2014 | | | 2.635% | Bond | | | | 2007 | | | | 49 | | | | 49 | | | | 49 | | | | JPY | | | | 2014 | | | 1.723% | Bond | | | | 2007 | | | | 121 | | | | 121 | | | | 121 | | | | CHF | | | | 2015 | | | 3.125% | Bond | | | | 2007 | | | | 300 | | | | 300 | | | | 300 | | | | EUR | | | | 2017 | | | 4.700% | Bond | | | | 2007 | | | | 76 | | | | 76 | | | | 76 | | | | CHF | | | | 2018 | | | 3.135% |
| | | | | | | | | | | | | | | | | December 31, | | | | December 31, | | | | December 31, | | | | December 31, | | | | December 31, | | | | December 31, | | | December 31, | | | | | | Fair value after hedging as of | | | | | | | | | (M€) | | Year of
issue | | December 31,
2008 | | December 31,
2007 | | December 31,
2006 | | Currency | | Maturity | | Initial rate before hedging instruments | | Bonds after fair value
hedge (M€) | | | Year of
issue | | | Fair value
after hedging
as of
December 31,
2011 | | | Fair value
after hedging
as of
December 31,
2010 | | | Fair value
after hedging
as of
December 31,
2009 | | | Currency | | | Maturity | | | Initial rate before hedging instruments | Bond | | 2006 | | 125 | | 126 | | 126 | | CHF | | 2013 | | 2.510% | | | 2007 | | | | 60 | | | | 60 | | | | 60 | | | | CHF | | | | 2018 | | | 3.135% | Bond | | 2007 | | 300 | | 301 | | | | EUR | | 2013 | | 4.125% | | | 2008 | | | | — | | | | — | | | | 63 | | | | GBP | | | | 2010 | | | 4.875% | Bond | | 2007 | | 306 | | 305 | | | | GBP | | 2013 | | 5.500% | | | 2008 | | | | — | | | | — | | | | 66 | | | | GBP | | | | 2010 | | | 4.875% | Bond | | 2007 | | 77 | | 77 | | | | USD | | 2011 | | 5.000% | | | 2008 | | | | — | | | | 92 | | | | 92 | | | | AUD | | | | 2011 | | | 7.500% | Bond | | 2007 | | 248 | | 248 | | | | CHF | | 2014 | | 2.635% | | | 2008 | | | | — | | | | 100 | | | | 100 | | | | EUR | | | | 2011 | | | 3.875% | Bond | | 2007 | | 370 | | 371 | | | | USD | | 2012 | | 5.000% | | | 2008 | | | | — | | | | 150 | | | | 150 | | | | EUR | | | | 2011 | | | 3.875% | Bond | | 2007 | | 73 | | 74 | | | | GBP | | 2013 | | 5.500% | | | 2008 | | | | — | | | | 50 | | | | 50 | | | | EUR | | | | 2011 | | | 3.875% | Bond | | 2007 | | 61 | | 61 | | | | AUD | | 2012 | | 6.500% | | | 2008 | | | | — | | | | 50 | | | | 50 | | | | EUR | | | | 2011 | | | 3.875% | Bond | | 2007 | | 300 | | 302 | | | | EUR | | 2017 | | 4.700% | | | 2008 | | | | — | | | | 60 | | | | 60 | | | | JPY | | | | 2011 | | | EURIBOR
6 months
+ 0.018% | Bond | | 2007 | | 74 | | 74 | | | | GBP | | 2010 | | 4.875% | | | 2008 | | | | — | | | | 102 | | | | 102 | | | | USD | | | | 2011 | | | 3.750% | Bond | | 2007 | | 222 | | 222 | | | | USD | | 2012 | | 5.000% | | | 2008 | | | | 62 | | | | 62 | | | | 62 | | | | CHF | | | | 2012 | | | 2.135% | Bond | | 2007 | | 49 | | 49 | | | | JPY | | 2014 | | 1.723% | | | 2008 | | | | 124 | | | | 124 | | | | 124 | | | | CHF | | | | 2012 | | | 3.635% | Bond | | 2007 | | 121 | | 122 | | | | CHF | | 2015 | | 3.125% | | | 2008 | | | | 46 | | | | 46 | | | | 46 | | | | CHF | | | | 2012 | | | 2.385% | Bond | | 2007 | | 76 | | 76 | | | | CHF | | 2018 | | 3.135% | | | 2008 | | | | 92 | | | | 92 | | | | 92 | | | | CHF | | | | 2012 | | | 2.385% | Bond | | 2007 | | 71 | | 71 | | | | GBP | | 2012 | | 4.625% | | | 2008 | | | | 64 | | | | 64 | | | | 64 | | | | CHF | | | | 2012 | | | 2.385% | Bond | | 2007 | | 61 | | 61 | | | | CHF | | 2014 | | 2.635% | | | 2008 | | | | 50 | | | | 50 | | | | 50 | | | | EUR | | | | 2012 | | | 3.250% | Bond | | 2007 | | 74 | | 73 | | | | GBP | | 2013 | | 5.500% | | | 2008 | | | | 63 | | | | 63 | | | | 63 | | | | GBP | | | | 2012 | | | 4.625% | Bond | | 2007 | | 72 | | 72 | | | | CAD | | 2012 | | 4.125% | | | 2008 | | | | 63 | | | | 63 | | | | 63 | | | | GBP | | | | 2012 | | | 4.625% | Bond | | 2007 | | 60 | | 60 | | | | CHF | | 2010 | | 2.385% | | | 2008 | | | | 63 | | | | 63 | | | | 63 | | | | GBP | | | | 2012 | | | 4.625% | Bond | | 2007 | | 60 | | 60 | | | | CHF | | 2018 | | 3.135% | | | 2008 | | | | 62 | | | | 62 | | | | 62 | | | | NOK | | | | 2012 | | | 6.000% | Bond | | 2007 | | 31 | | 31 | | | | JPY | | 2014 | | 1.505% | | | 2008 | | | | 69 | | | | 69 | | | | 69 | | | | USD | | | | 2012 | | | 5.000% | Bond | | 2008 | | 92 | | | | | | AUD | | 2011 | | 7.500% | | | 2008 | | | | 60 | | | | 60 | | | | 60 | | | | AUD | | | | 2013 | | | 7.500% | Bond | | 2008 | | 60 | | | | | | AUD | | 2013 | | 7.500% | | | 2008 | | | | 61 | | | | 61 | | | | 61 | | | | AUD | | | | 2013 | | | 7.500% | Bond | | 2008 | | 61 | | | | | | AUD | | 2013 | | 7.500% | | | 2008 | | | | 128 | | | | 127 | | | | 127 | | | | CHF | | | | 2013 | | | 3.135% | Bond | | 2008 | | 62 | | | | | | CHF | | 2012 | | 2.135% | | | 2008 | | | | 62 | | | | 62 | | | | 62 | | | | CHF | | | | 2013 | | | 3.135% | Bond | | 2008 | | 124 | | | | | | CHF | | 2012 | | 3.635% | | | 2008 | | | | 200 | | | | 200 | | | | 200 | | | | EUR | | | | 2013 | | | 4.125% | Bond | | 2008 | | 46 | | | | | | CHF | | 2012 | | 2.385% | | | 2008 | | | | 100 | | | | 100 | | | | 100 | | | | EUR | | | | 2013 | | | 4.125% | Bond | | 2008 | | 92 | | | | | | CHF | | 2012 | | 2.385% | | | 2008 | | | | 1,000 | | | | 1,000 | | | | 1,000 | | | | EUR | | | | 2013 | | | 4.750% | Bond | | 2008 | | 64 | | | | | | CHF | | 2012 | | 2.385% | | | 2008 | | | | 63 | | | | 63 | | | | 63 | | | | GBP | | | | 2013 | | | 5.500% | Bond | | 2008 | | 128 | | | | | | CHF | | 2013 | | 3.135% | | | 2008 | | | | 149 | | | | 149 | | | | 149 | | | | JPY | | | | 2013 | | | EURIBOR
6 months
+ 0.008% | Bond | | 2008 | | 63 | | | | | | CHF | | 2013 | | 3.135% | | | 2008 | | | | 191 | | | | 191 | | | | 191 | | | | USD | | �� | | 2013 | | | 4.000% | Bond | | 2008 | | 61 | | | | | | CHF | | 2015 | | 3.135% | | | 2008 | | | | 61 | | | | 61 | | | | 61 | | | | CHF | | | | 2015 | | | 3.135% | Bond | | 2008 | | 62 | | | | | | CHF | | 2015 | | 3.135% | | | 2008 | | | | 62 | | | | 62 | | | | 62 | | | | CHF | | | | 2015 | | | 3.135% | Bond | | 2008 | | 62 | | | | | | CHF | | 2015 | | 3.135% | | | 2008 | | | | 61 | | | | 61 | | | | 61 | | | | CHF | | | | 2015 | | | 3.135% | Bond | | 2008 | | 62 | | | | | | CHF | | 2018 | | 3.135% | | | 2008 | | | | 62 | | | | 62 | | | | 62 | | | | CHF | | | | 2018 | | | 3.135% | Bond | | 2008 | | 100 | | | | | | EUR | | 2011 | | 3.875% | | | 2009 | | | | 56 | | | | 56 | | | | 56 | | | | AUD | | | | 2013 | | | 5.500% | Bond | | 2008 | | 151 | | | | | | EUR | | 2011 | | 3.875% | | | 2009 | | | | 54 | | | | 54 | | | | 54 | | | | AUD | | | | 2013 | | | 5.500% | Bond | | 2008 | | 50 | | | | | | EUR | | 2012 | | 3.250% | | | 2009 | | | | 236 | | | | 236 | | | | 236 | | | | CHF | | | | 2013 | | | 2.500% | Bond | | 2008 | | 200 | | | | | | EUR | | 2013 | | 4.125% | | | 2009 | | | | 77 | | | | 77 | | | | 77 | | | | USD | | | | 2013 | | | 4.000% | Bond | | 2008 | | 100 | | | | | | EUR | | 2013 | | 4.125% | | | 2009 | | | | 131 | | | | 131 | | | | 131 | | | | CHF | | | | 2014 | | | 2.625% | Bond | | 2008 | | 1,002 | | | | | | EUR | | 2013 | | 4.750% | | | 2009 | | | | 998 | | | | 997 | | | | 998 | | | | EUR | | | | 2014 | | | 3.500% | Bond | | 2008 | | 50 | | | | | | EUR | | 2011 | | 3.875% | | | 2009 | | | | 150 | | | | 150 | | | | 150 | | | | EUR | | | | 2014 | | | 3.500% | Bond | | 2008 | | 50 | | | | | | EUR | | 2011 | | 3.875% | | | 2009 | | | | 40 | | | | 40 | | | | 40 | | | | HKD | | | | 2014 | | | 3.240% | Bond | | 2008 | | 63 | | | | | | GBP | | 2012 | | 4.625% | | | 2009 | | | | 107 | | | | 103 | | | | 96 | | | | AUD | | | | 2015 | | | 6.000% | Bond | | 2008 | | 63 | | | | | | GBP | | 2010 | | 4.875% | | | 2009 | | | | 550 | | | | 550 | | | | 550 | | | | EUR | | | | 2015 | | | 3.625% | Bond | | 2008 | | 66 | | | | | | GBP | | 2010 | | 4.875% | | | 2009 | | | | 684 | | | | 684 | | | | 684 | | | | USD | | | | 2015 | | | 3.125% | Bond | | 2008 | | 63 | | | | | | GBP | | 2012 | | 4.625% | | | 2009 | | | | 232 | | | | 224 | | | | 208 | | | | USD | | | | 2015 | | | 3.125% | Bond | | 2008 | | 64 | | | | | | GBP | | 2012 | | 4.625% | | | 2009 | | | | 99 | | | | 99 | | | | 99 | | | | CHF | | | | 2016 | | | 2.385% | Bond | | 2008 | | 63 | | | | | | GBP | | 2013 | | 5.500% | | | 2009 | | | | 115 | | | | 115 | | | | 115 | | | | GBP | | | | 2017 | | | 4.250% | Bond | | 2008 | | 60 | | | | | | JPY | | 2011 | | EURIBOR 6 months +0.018% | | | 2009 | | | | 225 | | | | 225 | | | | 225 | | | | GBP | | | | 2017 | | | 4.250% | Bond | | 2008 | | 149 | | | | | | JPY | | 2013 | | EURIBOR 6 months +0.008% | | | 2009 | | | | 448 | | | | 448 | | | | 448 | | | | EUR | | | | 2019 | | | 4.875% | Bond | | | | 2009 | | | | 69 | | | | 69 | | | | 69 | | | | HKD | | | | 2019 | | | 4.180% | Bond | | | | 2009 | | | | — | | | | 374 | | | | 347 | | | | USD | | | | 2021 | | | 4.250% | Bond | | | | 2010 | | | | 105 | | | | 102 | | | | — | | | | AUD | | | | 2014 | | | 5.750% |
| | | | | | | | | | | | | | | | | December 31, | | | | December 31, | | | | December 31, | | | | December 31, | | | | December 31, | | | | December 31, | | | December 31, | | | | | | Fair value after hedging as of | | | | | | | | | | (M€) | | Year of
issue | | December 31,
2008 | | December 31,
2007 | | December 31,
2006 | | Currency | | Maturity | | Initial rate before hedging instruments | | | Bonds after fair value
hedge (M€) | | | Year of
issue | | | Fair value
after hedging
as of
December 31,
2011 | | Fair value
after hedging
as of
December 31,
2010 | | Fair value
after hedging
as of
December 31,
2009 | | Currency | | | Maturity | | | Initial rate before hedging instruments | Bond | | | | 2010 | | | | 111 | | | | 108 | | | | — | | | | CAD | | | | 2014 | | | 2.500% | Bond | | | | 2010 | | | | 54 | | | | 53 | | | | — | | | | NZD | | | | 2014 | | | 4.750% | Bond | | | | 2010 | | | | 193 | | | | 187 | | | | — | | | | USD | | | | 2015 | | | 2.875% | Bond | | | | 2010 | | | | 966 | | | | 935 | | | | — | | | | USD | | | | 2015 | | | 3.000% | Bond | | | | 2010 | | | | 70 | | | | 68 | | | | — | | | | AUD | | | | 2015 | | | 6.000% | Bond | | | | 2010 | | | | 71 | | | | 69 | | | | — | | | | AUD | | | | 2015 | | | 6.000% | Bond | | | | 2010 | | | | 64 | | | | 64 | | | | — | | | | AUD | | | | 2015 | | | 6.000% | Bond | | 2008 | | 62 | | | | | | | NOK | | 2012 | | 6.000 | % | | | 2010 | | | | 773 | | | | 748 | | | | — | | | | USD | | | | 2016 | | | 2.300% | Bond | | 2008 | | 102 | | | | | | | USD | | 2011 | | 3.750 | % | | | 2010 | | | | 491 | | | | 476 | | | | — | | | | EUR | | | | 2022 | | | 3.125% | Bond | | 2008 | | 69 | | | | | | | USD | | 2012 | | 5.000 | % | | | 2011 | | | | 116 | | | | — | | | | — | | | | USD | | | | 2016 | | | 6.500% | Bond | | 2008 | | 194 | | | | | | | USD | | 2013 | | 4.000 | % | | | 2011 | | | | 597 | | | | — | | | | — | | | | USD | | | | 2018 | | | 3.875% | Current portion (less than one year) | | (722 | ) | | (1,222 | ) | | (1,686 | ) | | | | | | (2 992 | ) | | | (3 450 | ) | | | (1,937 | ) | | | | | | Total TOTAL CAPITAL(a) | | | | 13,380 | | | 10,136 | | | 9,206 | | | | | | | | | | | | | | | | | | | | | | | | | Total TOTAL CAPITAL | | | | | | 12,617 | | | | 15,143 | | | | 15,615 | | | | | | | TOTAL CAPITAL CANADA Ltd.(b) | | | | | | | | | | | | | | | | Bond | | | | 2011 | | | | 565 | | | | — | | | | — | | | | CAD | | | | 2014 | | | 1.625% | Bond | | | | 2011 | | | | 565 | | | | — | | | | — | | | | CAD | | | | 2014 | | | USLIBOR
3 months
+ 0.38 % | Bond | | | | 2011 | | | | 75 | | | | — | | | | — | | | | CAD | | | | 2014 | | | 5.750% | Bond | | | | 2011 | | | | 738 | | | | — | | | | — | | | | CAD | | | | 2013 | | | USLIBOR
3 months
+ 0.09 % | Bond | | | | 2011 | | | | 82 | | | | — | | | | — | | | | CAD | | | | 2016 | | | 4.000% | Bond | | | | 2011 | | | | 69 | | | | — | | | | — | | | | CAD | | | | 2016 | | | 3.625% | Current portion (less than one year) | | | | | | — | | | | — | | | | — | | | | | | | | Total TOTAL CAPITAL CANADA Ltd | | | | | | 2,094 | | | | | | | TOTAL CAPITAL INTERNATIONAL(c) | | | | | | — | | | | — | | | | — | | | | | | | | Other consolidated subsidiaries | | 103 | | | 110 | | | 73 | | | | | | | 308 | | | | 223 | | | | 153 | | | | | | | | Total | | 13,667 | | | 11,650 | | | 11,120 | | | | Total bonds after fair value hedge | | | | | | 15,148 | | | | 15,491 | | | | 15,884 | | | | | | |
| | | December 31, | | | | December 31, | | | | December 31, | | | | December 31, | | | | December 31, | | | | December 31, | | | | December 31, | | Bonds after cash flow
hedge and fix rate
bonds
(€ million) | | Year of
issue | | | Amount after
hedging as of
December 31,
2011 | | | Amount after
hedging as of
December 31,
2010 | | | Amount after
hedging as of
December 31,
2009 | | | Currency | | | Maturity | | | Initial rate
before hedging
instruments | | TOTAL CAPITAL(a) | | | | | | | | | | | | | | | | | | | | | | | | | | | | | Bond | | | 2005 | | | | 294 | | | | 293 | | | | 292 | | | | GBP | | | | 2012 | | | | 4.625 | % | Bond | | | 2009 | | | | 744 | | | | 691 | | | | 602 | | | | EUR | | | | 2019 | | | | 4.875 | % | Bond | | | 2009 | | | | 386 | | | | — | | | | — | | | | USD | | | | 2021 | | | | 4.250 | % | Bond | | | 2009 | | | | 1,016 | | | | 917 | | | | 806 | | | | EUR | | | | 2024 | | | | 5.125 | % | Bond | | | 2010 | | | | 966 | | | | 935 | | | | — | | | | USD | | | | 2020 | | | | 4.450 | % | Bond | | | 2011 | | | | 386 | | | | — | | | | — | | | | USD | | | | 2021 | | | | 4.125 | % | Current portion (less than one year) | | | | | | | (294 | ) | | | — | | | | — | | | | | | | | | | | | | | Total TOTAL CAPITAL | | | | | | | 3,498 | | | | 2,836 | | | | 1,700 | | | | | | | | | | | | | | Other consolidated subsidiaries(d) | | | | | | | 926 | | | | — | | | | — | | | | | | | | | | | | | | Total Bonds after cash flow hedge | | | | | | | 4,424 | | | | 2,836 | | | | 1,700 | | | | | | | | | | | | | |
| (a) | TOTAL CAPITAL S.A. is a wholly-owned indirect subsidiary of the CompanyTOTAL S.A. (with the exception of one share each held by the memberseach member of its Board of Directors, as required under French law)Directors). It acts as a financing vehicle for the Group. Its debt securities are fully and unconditionally guaranteed by the CompanyTOTAL S.A. as to payment of principal, premium, if any, interest and any other amounts due. |
| (b) | TOTAL CAPITAL CANADA Ltd. is a wholly-owned direct subsidiary of TOTAL S.A. It acts as a financing vehicle for the activities of the Group in Canada. Its debt securities are fully and unconditionally guaranteed by TOTAL S.A. as to payment of principal, premium, if any, interest and any other amounts due. |
| (c) | TOTAL CAPITAL INTERNATIONAL is a wholly-owned direct subsidiary of TOTAL S.A. It acts as a financing vehicle for the Group. Its debt securities are fully and unconditionally guaranteed by TOTAL S.A. as to payment of principal, premium, if any, interest and any other amounts due. |
| (d) | This amount includes SunPower’s convertible bonds for an amount of€355 million. |
Loan repayment schedule (excluding current portion) | | | | | | | | | | | | As of December 31, 2008 (M€) | | Non-current
financial debt | | of which hedging
instruments of
non-current
financial debt
(liabilities) | | Hedging instruments
of non-current
financial debt (assets) | | | Non-current financial
debt - net of hedging
instruments | | % | 2010 | | 3,160 | | 170 | | (168 | ) | | 2,992 | | 20% | 2011 | | 3,803 | | 24 | | (145 | ) | | 3,658 | | 24% | 2012 | | 3,503 | | 115 | | (179 | ) | | 3,324 | | 22% | 2013 | | 3,430 | | 127 | | (198 | ) | | 3,232 | | 21% | 2014 and beyond | | 2,295 | | 4 | | (202 | ) | | 2,093 | | 13% | Total | | 16,191 | | 440 | | (892 | ) | | 15,299 | | 100% |
| | | | | | | | | | | | As of December 31, 2007
(M€) | | Non-current
financial debt | | of which hedging
instruments of
non-current
financial debt
(liabilities) | | Hedging instruments
of non-current
financial debt (assets) | | | Non-current financial
debt - net of hedging
instruments | | % | 2009 | | 2,137 | | 6 | | (114 | ) | | 2,023 | | 14% | 2010 | | 2,767 | | 16 | | (207 | ) | | 2,560 | | 18% | 2011 | | 3,419 | | 123 | | (65 | ) | | 3,354 | | 23% | 2012 | | 3,517 | | 90 | | (30 | ) | | 3,487 | | 24% | 2013 and beyond | | 3,036 | | 134 | | (44 | ) | | 2,992 | | 21% | Total | | 14,876 | | 369 | | (460 | ) | | 14,416 | | 100% |
| | | | | | | | | | | | As of December 31, 2006 (M€) | | Non-current
financial debt | | of which hedging
instruments of
non-current
financial debt
(liabilities) | | Hedging instruments
of non-current
financial debt (assets) | | | Non-current financial
debt - net of hedging
instruments | | % | 2008 | | 2,604 | | 4 | | (245 | ) | | 2,359 | | 17% | 2009 | | 2,320 | | 14 | | (82 | ) | | 2,238 | | 16% | 2010 | | 3,083 | | 2 | | (104 | ) | | 2,979 | | 22% | 2011 | | 3,177 | | 75 | | (20 | ) | | 3,157 | | 23% | 2012 and beyond | | 2,990 | | 98 | | (35 | ) | | 2,955 | | 22% | Total | | 14,174 | | 193 | | (486 | ) | | 13,688 | | 100% |
| | | | | | | | | | | | | | | | | | | | | As of December 31, 2011
(M€) | | Non-current financial
debt | | | of which hedging
instruments of
non-current financial
debt (liabilities) | | | Hedging instruments
of non-current
financial debt (assets) | | | Non-current financial
debt - net of hedging
instruments | | | % | | 2013 | | | 5,021 | | | | 80 | | | | (529 | ) | | | 4,492 | | | | 22% | | 2014 | | | 4,020 | | | | 3 | | | | (390 | ) | | | 3,630 | | | | 18% | | 2015 | | | 4,070 | | | | 6 | | | | (456 | ) | | | 3,614 | | | | 18% | | 2016 | | | 1,712 | | | | 9 | | | | (193 | ) | | | 1,519 | | | | 7% | | 2017 and beyond | | | 7,734 | | | | 48 | | | | (408 | ) | | | 7,326 | | | | 35% | | Total | | | 22,557 | | | | 146 | | | | (1,976 | ) | | | 20,581 | | | | 100% | | | | | | | | | As of December 31, 2010
(M€) | | Non-current financial
debt | | | of which hedging
instruments of
non-current financial
debt (liabilities) | | | Hedging instruments
of non-current
financial debt (assets) | | | Non-current financial
debt - net of hedging
instruments | | | % | | 2012 | | | 3,756 | | | | 34 | | | | (401 | ) | | | 3,355 | | | | 18% | | 2013 | | | 4,017 | | | | 76 | | | | (473 | ) | | | 3,544 | | | | 19% | | 2014 | | | 2,508 | | | | 1 | | | | (290 | ) | | | 2,218 | | | | 12% | | 2015 | | | 3,706 | | | | 2 | | | | (302 | ) | | | 3,404 | | | | 18% | | 2016 and beyond | | | 6,796 | | | | 65 | | | | (404 | ) | | | 6,392 | | | | 33% | | Total | | | 20,783 | | | | 178 | | | | (1,870 | ) | | | 18,913 | | | | 100% | | | | | | | | | As of December 31, 2009
(M€) | | Non-current financial
debt | | | of which hedging
instruments of
non-current financial
debt (liabilities) | | | Hedging instruments
of non-current
financial debt (assets) | | | Non-current financial
debt - net of hedging
instruments | | | % | | 2011 | | | 3,857 | | | | 42 | | | | (199 | ) | | | 3,658 | | | | 20% | | 2012 | | | 3,468 | | | | 48 | | | | (191 | ) | | | 3,277 | | | | 18% | | 2013 | | | 3,781 | | | | 95 | | | | (236 | ) | | | 3,545 | | | | 19% | | 2014 | | | 2,199 | | | | 6 | | | | (90 | ) | | | 2,109 | | | | 11% | | 2015 and beyond | | | 6,132 | | | | 50 | | | | (309 | ) | | | 5,823 | | | | 32% | | Total | | | 19,437 | | | | 241 | | | | (1,025 | ) | | | 18,412 | | | | 100% | |
Analysis by currency and interest rate These analyses take into account interest rate and foreign currency swaps to hedge non-current financial debt. | | As of December 31,(M€) | | 2008 | | % | | 2007 | | % | | 2006 | | % | | 2011 | | | % | | | 2010 | | | % | | | 2009 | | | % | | U.S. Dollar | | 3,990 | | 26% | | 4,700 | | 33% | | 6,981 | | 51% | | | 8,645 | | | | 42% | | | | 7,248 | | | | 39% | | | | 3,962 | | | | 21% | | Euro | | 10,685 | | 70% | | 8,067 | | 56% | | 5,382 | | 39% | | | 9,582 | | | | 47% | | | | 11,417 | | | | 60% | | | | 14,110 | | | | 77% | | Other currencies | | 624 | | 4% | | 1,649 | | 11% | | 1,325 | | 10% | | | 2,354 | | | | 11% | | | | 248 | | | | 1% | | | | 340 | | | | 2% | | Total | | 15,299 | | 100% | | 14,416 | | 100% | | 13,688 | | 100% | | | 20,581 | | | | 100% | | | | 18,913 | | | | 100% | | | | 18,412 | | | | 100% | |
| | As of December 31,(M€) | | 2008 | | % | | 2007 | | % | | 2006 | | % | | 2011 | | | % | | | 2010 | | | % | | | 2009 | | | % | | Fixed rate | | 633 | | 4% | | 893 | | 6% | | 896 | | 7% | | | 4,854 | | | | 24% | | | | 3,177 | | | | 17% | | | | 2,064 | | | | 11% | | Floating rate | | 14,666 | | 96% | | 13,523 | | 94% | | 12,792 | | 93% | | | 15,727 | | | | 76% | | | | 15,736 | | | | 83% | | | | 16,348 | | | | 89% | | Total | | 15,299 | | 100% | | 14,416 | | 100% | | 13,688 | | 100% | | | 20,581 | | | | 100% | | | | 18,913 | | | | 100% | | | | 18,412 | | | | 100% | |
B) CURRENT FINANCIAL ASSETS AND LIABILITIES
| B) | | CURRENT FINANCIAL ASSETS AND LIABILITIES |
Current borrowings consist mainly of commercial papers or treasury bills or draws on bank loans. These instruments bear interest at rates that are close to market rates. | | | | | | | | | | | As of December 31,(M€) | | | | | | | | | | | (Assets)/Liabilities | | 2008 | | | 2007 | | | 2006 | | Current financial debt | | 5,586 | | | 2,530 | | | 3,348 | | Current portion of non-current financial debt | | 2,136 | | | 2,083 | | | 2,510 | | Current borrowings | | 7,722 | | | 4,613 | | | 5,858 | | Current portion of financial instruments for interest rate swaps liabilities | | 12 | | | 1 | | | — | | Other current financial instruments - liabilities | | 146 | | | 59 | | | 75 | | Other current financial liabilities(note 28) | | 158 | | | 60 | | | 75 | | Current deposits beyond three months | | (1 | ) | | (850 | ) | | (3,496 | ) | Current portion of financial instruments for interest rate swaps - assets | | (100 | ) | | (388 | ) | | (341 | ) | Other current financial instruments - assets | | (86 | ) | | (26 | ) | | (71 | ) | Current financial assets(note 28) | | (187 | ) | | (1,264 | ) | | (3,908 | ) | Current borrowings and related financial assets and liabilities, net | | 7,693 | | | 3,409 | | | 2,025 | |
| | | | | | | | | | | | | | As of December 31, (M€) | | 2011 | | | 2010 | | | 2009 | | (Assets) / Liabilities | | | | | | | | | | | | | Current financial debt(a) | | | 5,819 | | | | 5,867 | | | | 4,761 | | Current portion of non-current financial debt | | | 3,856 | | | | 3,786 | | | | 2,233 | | Current borrowings(note 28) | | | 9,675 | | | | 9,653 | | | | 6,994 | | Current portion of hedging instruments of debt (liabilities) | | | 40 | | | | 12 | | | | 97 | | Other current financial instruments (liabilities) | | | 127 | | | | 147 | | | | 26 | | Other current financial liabilities(note 28) | | | 167 | | | | 159 | | | | 123 | | Current deposits beyond three months | | | (101 | ) | | | (869 | ) | | | (55 | ) | Current portion of hedging instruments of debt (assets) | | | (383 | ) | | | (292 | ) | | | (197 | ) | Other current financial instruments (assets) | | | (216 | ) | | | (44 | ) | | | (59 | ) | Current financial assets(note 28) | | | (700 | ) | | | (1,205 | ) | | | (311 | ) | Current borrowings and related financial assets and liabilities, net | | | 9,142 | | | | 8,607 | | | | 6,806 | |
C) NET-DEBT-TO-EQUITY RATIO
| (a) | As of December 31, 2011 and as of December 31, 2010, the current financial debt includes a commercial paper program in Total Capital Canada Ltd. Total Capital Canada Ltd. is a wholly-owned direct subsidiary of TOTAL S.A. It acts as a financing vehicle for the activities of the Group in Canada. Its debt securities are fully and unconditionally guaranteed by TOTAL S.A. as to payment of principal, premium, if any, interest and any other amounts due. |
| C) | | NET-DEBT-TO-EQUITY RATIO |
For its internal and external communication needs, the Group calculates a debt ratio by dividing its net financial debt by equity. Shareholders’Adjusted shareholders’ equity as offor the year ended December 31, 20082011 is calculated after distributionpayment of a dividend of 2.28€2.28 per share, of which 1.14€ per share was paidsubject to approval by the shareholders’ meeting on November 19, 2008.May 11, 2012. The net-debt-to-equity ratio is calculated as follows: | | | | | | | | | | | As of December 31,(M€) | | | | | | | | | | | (Assets)/Liabilities | | 2008 | | | 2007 | | | 2006 | | Current borrowings | | 7,722 | | | 4,613 | | | 5,858 | | Other current financial liabilities | | 158 | | | 60 | | | 75 | | Current financial assets | | (187 | ) | | (1,264 | ) | | (3,908 | ) | Non-current financial debt | | 16,191 | | | 14,876 | | | 14,174 | | Hedging instruments of non-current financial debt | | (892 | ) | | (460 | ) | | (486 | ) | Cash and cash equivalents | | (12,321 | ) | | (5,988 | ) | | (2,493 | ) | Net financial debt | | 10,671 | | | 11,837 | | | 13,220 | | Shareholders’ equity - Group share | | 48,992 | | | 44,858 | | | 40,321 | | Estimated dividend payable | | (2,540 | ) | | (2,397 | ) | | (2,258 | ) | Minority interest | | 958 | | | 842 | | | 827 | | Total shareholder’s equity | | 47,410 | | | 43,303 | | | 38,890 | | Net-debt-to-equity ratio | | 22.5% | | | 27.3% | | | 34.0% | |
| | | | | | | | | | | | | | As of December 31, (M€) | | 2011 | | | 2010 | | | 2009 | | (Assets) / Liabilities | | | | | | | | | | | | | Current borrowings | | | 9,675 | | | | 9,653 | | | | 6,994 | | Other current financial liabilities | | | 167 | | | | 159 | | | | 123 | | Current financial assets | | | (700 | ) | | | (1,205 | ) | | | (311 | ) | Non-current financial debt | | | 22,557 | | | | 20,783 | | | | 19,437 | | Hedging instruments on non-current financial debt | | | (1,976 | ) | | | (1,870 | ) | | | (1,025 | ) | Cash and cash equivalents | | | (14,025 | ) | | | (14,489 | ) | | | (11,662 | ) | Net financial debt | | | 15,698 | | | | 13,031 | | | | 13,556 | | Shareholders’ equity — Group share | | | 68,037 | | | | 60,414 | | | | 52,552 | | Distribution of the income based on existing shares at the closing date | | | (1,255 | ) | | | (2,553 | ) | | | (2,546 | ) | Non-controlling interests | | | 1,352 | | | | 857 | | | | 987 | | Adjusted shareholders’ equity | | | 68,134 | | | | 58,718 | | | | 50,993 | | Net-debt-to-equity ratio | | | 23.0% | | | | 22.2% | | | | 26.6% | |
21)OTHER CREDITORS AND ACCRUED LIABILITIES | | As of December 31,(M€) | | 2008 | | 2007 | | 2006 | | 2011 | | | 2010 | | | 2009 | | Accruals and deferred income | | 151 | | 137 | | 163 | | | 231 | | | | 184 | | | | 223 | | Payable to States (including taxes and duties) | | 6,256 | | 7,860 | | 7,204 | | | 8,040 | | | | 7,235 | | | | 6,024 | | Payroll | | 928 | | 909 | | 879 | | | 1,062 | | | | 996 | | | | 955 | | Other operating liabilities | | 4,297 | | 3,900 | | 4,263 | | | 5,441 | | | | 3,574 | | | | 4,706 | | Total | | 11,632 | | 12,806 | | 12,509 | | | 14,774 | | | | 11,989 | | | | 11,908 | |
As of December 31, 2011, the heading “Other operating liabilities” mainly includes the third quarterly interim dividend for the fiscal year 2011 for€1,317 million. This interim dividend will be paid on March 2012. As of December 31, 2009, the heading “Other operating liabilities” mainly included€744 million related to Chesapeake acquisition (see Note 3 to the Consolidated Financial Statements). 22)LEASE CONTRACTS The Group leases real estate, retail stations, ships, and other equipments (see Note 11 to the Consolidated Financial Statements). The future minimum lease payments on operating and finance leases to which the Group is committed are shown as follows: | For the year ended December 31,
2008(M€) | | Operating
leases | | Finance
leases | | | 2009 | | 429 | | 47 | | | 2010 | | 306 | | 42 | | | 2011 | | 243 | | 42 | | | For the year ended December 31,
2011 (M€) | | | Operating
leases | | | Finance
leases | | 2012 | | 208 | | 42 | | | | 762 | | | | 41 | | 2013 | | 166 | | 40 | | | | 552 | | | | 40 | | 2014 and beyond | | 675 | | 148 | | | 2014 | | | | 416 | | | | 37 | | 2015 | | | | 335 | | | | 36 | | 2016 | | | | 316 | | | | 34 | | 2017 and beyond | | | | 940 | | | | 20 | | Total minimum payments | | 2,027 | | 361 | | | | 3,321 | | | | 208 | | Less financial expenses | | | | (70 | ) | | | — | | | | (31 | ) | Nominal value of contracts | | | | 291 | | | | — | | | | 177 | | Less current portion of finance lease contracts | | | | (23 | ) | | | — | | | | (25 | ) | Outstanding liability of finance lease contracts | | | | 268 | | | | — | | | | 152 | |
| | | | | | For the year ended December 31,
2007(M€) | | Operating
leases | | Finance
leases | | 2008 | | 427 | | 50 | | 2009 | | 352 | | 47 | | 2010 | | 291 | | 46 | | 2011 | | 210 | | 46 | | 2012 | | 149 | | 47 | | 2013 and beyond | | 492 | | 154 | | Total minimum payments | | 1,921 | | 390 | | Less financial expenses | | | | (47 | ) | Nominal value of contracts | | | | 343 | | Less current portion of finance lease contracts | | | | (26 | ) | Outstanding liability of finance lease contracts | | | | 317 | |
| | | | | | | | | For the year ended December 31,
2010 (M€) | | Operating
leases | | | Finance
leases | | 2011 | | | 582 | | | | 39 | | 2012 | | | 422 | | | | 39 | | 2013 | | | 335 | | | | 39 | |
| | | | | | | | | For the year ended December 31,
2010 (M€) | | Operating
leases | | | Finance
leases | | 2014 | | | 274 | | | | 35 | | 2015 | | | 230 | | | | 35 | | 2016 and beyond | | | 1,105 | | | | 54 | | Total minimum payments | | | 2,948 | | | | 241 | | Less financial expenses | | | — | | | | (43 | ) | Nominal value of contracts | | | — | | | | 198 | | Less current portion of finance lease contracts | | | — | | | | (23 | ) | Outstanding liability of finance lease contracts | | | — | | | | 175 | |
| For the year ended December 31,
2006(M€) | | Operating
leases | | Finance
leases | | | 2007 | | 381 | | 52 | | | 2008 | | 378 | | 56 | | | 2009 | | 307 | | 56 | | | For the year ended December 31,
2009 (M€) | | | Operating
leases | | | Finance
leases | | 2010 | | 246 | | 51 | | | | 523 | | | | 42 | | 2011 | | 153 | | 54 | | | | 377 | | | | 43 | | 2012 and beyond | | 422 | | 218 | | | 2012 | | | | 299 | | | | 42 | | 2013 | | | | 243 | | | | 41 | | 2014 | | | | 203 | | | | 39 | | 2015 and beyond | | | | 894 | | | | 128 | | Total minimum payments | | 1,887 | | 487 | | | | 2,539 | | | | 335 | | Less financial expenses | | | | (87 | ) | | | — | | | | (53 | ) | Nominal value of contracts | | | | 400 | | | | — | | | | 282 | | Less current portion of finance lease contracts | | | | (29 | ) | | | — | | | | (22 | ) | Outstanding liability of finance lease contracts | | | | 371 | | | | — | | | | 260 | |
Net rental expense incurred under operating leases for the year ended December 31, 2008, was 426 M2011 is€ (383 M645 million (against€605 million in 20072010 and 380 M€613 million in 2006)2009). 23)COMMITMENTS AND CONTINGENCIES | | | | Maturity and installments | | Maturity and installments | | | As of December 31, 2008(M€) | | Total | | Less than
1 year | | Between 1 and 5 years | | More than
5 years | | As of December 31, 2011 (M€) | | | Total | | | Less than
1 year | | | Between 1
and 5 years | | | More than
5 years | | Non-current debt obligations net of hedging instruments(Note 20) | | 15,031 | | — | | 13,064 | | 1,967 | | | 20,429 | | | | — | | | | 13,121 | | | | 7,308 | | Current portion of non-current debt obligations net of hedging instruments(Note 20) | | 2,025 | | 2,025 | | — | | — | | | 3,488 | | | | 3,488 | | | | — | | | | — | | Finance lease obligations(Note 22) | | 291 | | 23 | | 142 | | 126 | | | 177 | | | | 25 | | | | 134 | | | | 18 | | Asset retirement obligations(Note 19) | | 4,500 | | 154 | | 653 | | 3,693 | | | 6,884 | | | | 272 | | | | 804 | | | | 5,808 | | Contractual obligations recorded in the balance sheet | | 21,847 | | 2,202 | | 13,859 | | 5,786 | | | 30,978 | | | | 3,785 | | | | 14,059 | | | | 13,134 | | Operating lease obligations(Note 22) | | 2,027 | | 429 | | 923 | | 675 | | | 3,321 | | | | 762 | | | | 1,619 | | | | 940 | | Purchase obligations | | 60,226 | | 4,420 | | 13,127 | | 42,679 | | | 77,353 | | | | 11,049 | | | | 20,534 | | | | 45,770 | | Contractual obligations not recorded in the balance sheet | | 62,253 | | 4,849 | | 14,050 | | 43,354 | | | 80,674 | | | | 11,811 | | | | 22,153 | | | | 46,710 | | Total of contractual obligations | | 84,100 | | 7,051 | | 27,909 | | 49,140 | | | 111,652 | | | | 15,596 | | | | 36,212 | | | | 59,844 | | Guarantees given for excise taxes | | 1,720 | | 1,590 | | 58 | | 72 | | | 1,765 | | | | 1,594 | | | | 73 | | | | 98 | | Collateral given against borrowings | | 2,870 | | 1,119 | | 519 | | 1,232 | | Guarantees given against borrowings | | | | 4,778 | | | | 3,501 | | | | 323 | | | | 954 | | Indemnities related to sales of businesses | | 39 | | 3 | | 1 | | 35 | | | 39 | | | | — | | | | 34 | | | | 5 | | Guarantees of current liabilities | | 315 | | 119 | | 164 | | 32 | | | 376 | | | | 262 | | | | 35 | | | | 79 | | Guarantees to customers / suppliers | | 2,866 | | 68 | | 148 | | 2,650 | | | 3,265 | | | | 1,634 | | | | 57 | | | | 1,574 | | Letters of credit | | 1,080 | | 1,024 | | 17 | | 39 | | | 2,408 | | | | 1,898 | | | | 301 | | | | 209 | | Other operating commitments | | 648 | | 246 | | 132 | | 270 | | | 2,477 | | | | 433 | | | | 697 | | | | 1,347 | | Total of other commitments given | | 9,538 | | 4,169 | | 1,039 | | 4,330 | | | 15,108 | | | | 9,322 | | | | 1,520 | | | | 4,266 | | Mortgages and liens received | | 321 | | 72 | | 110 | | 139 | | | 408 | | | | 7 | | | | 119 | | | | 282 | | Goods and services sale obligations(a) | | | | 62,216 | | | | 4,221 | | | | 17,161 | | | | 40,834 | | Other commitments received | | 4,218 | | 2,440 | | 234 | | 1,544 | | | 6,740 | | | | 4,415 | | | | 757 | | | | 1,568 | | Total of commitments received | | 4,539 | | 2,512 | | 344 | | 1,683 | | | 69,364 | | | | 8,643 | | | | 18,037 | | | | 42,684 | |
| | | | | | | | | | | | Maturity and installments | | As of December 31, 2007(M€) | | Total | | Less than
1 year | | Between
1 and 5 years | | More than
5 years | Non-current debt obligations net of hedging instruments(Note 20) | | 14,099 | | — | | 11,251 | | 2,848 | Current portion of non-current debt obligations net of hedging instruments(Note 20) | | 1,669 | | 1,669 | | — | | — | Finance lease obligations(Note 22) | | 343 | | 26 | | 173 | | 144 | Asset retirement obligations(Note 19) | | 4,206 | | 189 | | 503 | | 3,514 | Contractual obligations recorded in the balance sheet | | 20,317 | | 1,884 | | 11,927 | | 6,506 | Operating lease obligations(Note 22) | | 1,921 | | 427 | | 1,002 | | 492 | Purchase obligations | | 61,794 | | 3,210 | | 15,419 | | 43,165 | Contractual obligations not recorded in the balance sheet | | 63,715 | | 3,637 | | 16,421 | | 43,657 | Total of contractual obligations | | 84,032 | | 5,521 | | 28,348 | | 50,163 | Guarantees given for excise taxes | | 1,796 | | 590 | | 58 | | 1,148 | Collateral given against borrowings | | 781 | | 9 | | 624 | | 148 | Indemnities related to sales of businesses | | 40 | | — | | 3 | | 37 | Guarantees of current liabilities | | 97 | | 16 | | 48 | | 33 | Guarantees to customers/suppliers | | 1,197 | | 23 | | 6 | | 1,168 | Letters of credit | | 1,677 | | 1,677 | | — | | — | Other operating commitments | | 1,280 | | 207 | | 151 | | 922 | Total of other commitments given | | 6,868 | | 2,522 | | 890 | | 3,456 | Mortgages and liens received | | 353 | | 7 | | 69 | | 277 | Other commitments received | | 3,887 | | 2,781 | | 377 | | 729 | Total of commitments received | | 4,240 | | 2,788 | | 446 | | 1,006 |
| (a) | As from December 31, 2011, the Group discloses its goods and services sale obligations. |
| | | | Maturity and installments | | Maturity and installments | | | As of December 31, 2006(M€) | | Total | | Less than
1 year | | Between
1 and 5 years | | More than 5 years | | | As of December 31, 2010 (M€) | | | Total | | | Less than
1 year | | | Between 1
and 5 years | | | More than
5 years | | Non-current debt obligations net of hedging instruments(Note 20) | | 13,317 | | — | | 10,548 | | 2,769 | | | 18,738 | | | | — | | | | 12,392 | | | | 6,346 | | Current portion of non-current debt obligations net of hedging instruments(Note 20) | | 2,140 | | 2,140 | | — | | — | | | 3,483 | | | | 3,483 | | | | — | | | | — | | Finance lease obligations(Note 22) | | 400 | | 29 | | 185 | | 186 | | | 198 | | | | 23 | | | | 129 | | | | 46 | | Asset retirement obligations(Note 19) | | 3,893 | | 221 | | 576 | | 3,096 | | | 5,917 | | | | 177 | | | | 872 | | | | 4,868 | | Contractual obligations recorded in the balance sheet | | 19,750 | | 2,390 | | 11,309 | | 6,051 | | | 28,336 | | | | 3,683 | | | | 13,393 | | | | 11,260 | | Operating lease obligations(Note 22) | | 1,887 | | 381 | | 1,084 | | 422 | | | 2,948 | | | | 582 | | | | 1,261 | | | | 1,105 | | Purchase obligations | | 37,327 | | 3,551 | | 9,696 | | 24,080 | | | 61,293 | | | | 6,347 | | | | 14,427 | | | | 40,519 | | Contractual obligations not recorded in the balance sheet | | 39,214 | | 3,932 | | 10,780 | | 24,502 | | | 64,241 | | | | 6,929 | | | | 15,688 | | | | 41,624 | | Total of contractual obligations | | 58,964 | | 6,322 | | 22,089 | | 30,553 | | | 92,577 | | | | 10,612 | | | | 29,081 | | | | 52,884 | | Guarantees given for excise taxes | | 1,807 | | 587 | | 22 | | 1,198 | | | 1,753 | | | | 1,594 | | | | 71 | | | | 88 | | Collateral given against borrowings | | 1,079 | | 16 | | 691 | | 372 | | Guarantees given against borrowings | | | | 5,005 | | | | 1,333 | | | | 493 | | | | 3,179 | | Indemnities related to sales of businesses | | 113 | | 38 | | 40 | | 35 | | | 37 | | | | — | | | | 31 | | | | 6 | | Guarantees of current liabilities | | 68 | | 21 | | 15 | | 32 | | | 171 | | | | 147 | | | | 19 | | | | 5 | | Guarantees to customers/suppliers | | 1,544 | | 150 | | 181 | | 1,213 | | Guarantees to customers / suppliers | | | | 3,020 | | | | 1,621 | | | | 96 | | | | 1,303 | | Letters of credit | | 1,416 | | 1,416 | | — | | — | | | 1,250 | | | | 1,247 | | | | — | | | | 3 | | Other operating commitments | | 1,127 | | 107 | | 205 | | 815 | | | 2,057 | | | | 467 | | | | 220 | | | | 1,370 | | Total of other commitments given | | 7,154 | | 2,335 | | 1,154 | | 3,665 | | | 13,293 | | | | 6,409 | | | | 930 | | | | 5,954 | | Mortgages and liens received | | 329 | | 11 | | 77 | | 241 | | | 429 | | | | 2 | | | | 114 | | | | 313 | | Other commitments received | | 2,965 | | 2,089 | | 315 | | 561 | | | 6,387 | | | | 3,878 | | | | 679 | | | | 1,830 | | Total of commitments received | | 3,294 | | 2,100 | | 392 | | 802 | | | 6,816 | | | | 3,880 | | | | 793 | | | | 2,143 | |
| | | | | | | | | | | | | | | | | | | | Maturity and installments | | | As of December 31,2009 (M€) | | Total | | | Less than
1 year | | | Between 1
and 5 years | | | More than
5 years | | Non-current debt obligations net of hedging instruments(Note 20) | | | 18,152 | | | | — | | | | 12,443 | | | | 5,709 | | Current portion of non-current debt obligations net of hedging instruments(Note 20) | | | 2,111 | | | | 2,111 | | | | — | | | | — | | Finance lease obligations(Note 22) | | | 282 | | | | 22 | | | | 146 | | | | 114 | | Asset retirement obligations(Note 19) | | | 5,469 | | | | 235 | | | | 972 | | | | 4,262 | | Contractual obligations recorded in the balance sheet | | | 26,014 | | | | 2,368 | | | | 13,561 | | | | 10,085 | | Operating lease obligations(Note 22) | | | 2,539 | | | | 523 | | | | 1,122 | | | | 894 | | Purchase obligations | | | 49,808 | | | | 4,542 | | | | 9,919 | | | | 35,347 | | Contractual obligations not recorded in the balance sheet | | | 52,347 | | | | 5,065 | | | | 11,041 | | | | 36,241 | | Total of contractual obligations | | | 78,361 | | | | 7,433 | | | | 24,602 | | | | 46,326 | | Guarantees given for excise taxes | | | 1,765 | | | | 1,617 | | | | 69 | | | | 79 | | Guarantees given against borrowings | | | 2,882 | | | | 1,383 | | | | 709 | | | | 790 | | Indemnities related to sales of businesses | | | 36 | | | | — | | | | 1 | | | | 35 | | Guarantees of current liabilities | | | 203 | | | | 160 | | | | 38 | | | | 5 | | Guarantees to customers / suppliers | | | 2,770 | | | | 1,917 | | | | 70 | | | | 783 | | Letters of credit | | | 1,499 | | | | 1,485 | | | | 2 | | | | 12 | | Other operating commitments | | | 765 | | | | 582 | | | | 103 | | | | 80 | | Total of other commitments given | | | 9,920 | | | | 7,144 | | | | 992 | | | | 1,784 | | Mortgages and liens received | | | 330 | | | | 5 | | | | 106 | | | | 219 | | Other commitments received | | | 5,637 | | | | 3,187 | | | | 481 | | | | 1,969 | | Total of commitments received | | | 5,967 | | | | 3,192 | | | | 587 | | | | 2,188 | |
| A. | | CONTRACTUAL OBLIGATIONS |
A. CONTRACTUAL OBLIGATIONS
Debt obligations “Non-current debt obligations” are included in the items “Non-current financial debt” and “Hedging instruments of non-current financial debt” of the Consolidated Balance Sheet. It includes the non-current portion of issue swaps and swaps hedging bonds, and excludes non-current finance lease obligations of 268 M€.152 million. The current portion of non-current debt is included in the items “Current borrowings”, “Current financial assets” and “Other current financial liabilities” of the Consolidated Balance Sheet. It includes the current portion of issue swaps and swaps hedging bonds, and excludes the current portion of finance lease obligations of 23 M€.25 million. The information regarding contractual obligations linked to indebtedness is presented in Note 20 to the Consolidated Financial Statements. Lease contracts The information regarding operating and finance leases is presented in Note 22 to the Consolidated Financial Statements. Asset retirement obligations This item represents the discounted present value of Upstream asset retirement obligations, primarily asset removal costs at the completion date. The information regarding contractual obligations linked to asset retirement obligations is presented in Notes 1Q and 19 to the Consolidated Financial Statements. Purchase obligations Purchase obligations are obligations under contractual agreements to purchase goods or services, including capital projects. These obligations are enforceable and legally binding on the company and specify all significant terms, including the amount and the timing of the payments. These obligations mainly include: hydrocarbon unconditional purchase contracts (except where an active, highly-liquid market exists and when the hydrocarbons are expected to be re-sold shortly after purchase), reservation of transport capacities in pipelines, unconditional exploration works and development works in the Upstream segment, and contracts for capital investment projects in the Downstream segment. | B. | | OTHER COMMITMENTS GIVEN |
B. OTHER COMMITMENTS GIVEN
Guarantees given for excise taxes They consist of guarantees given to other oil and gas companies in order to comply with French tax authorities’ requirements for oil and gas imports in France. A payment would be triggered by a failure of the guaranteed party with respect to the French tax authorities. The default of the guaranteed parties is however considered to be highly remote by the Group. Guarantees given against borrowings The Group guarantees bank debt and finance lease obligations of certain non-consolidated companiessubsidiaries and equity affiliates. Maturity dates vary, and guarantees will terminate on payment and/or cancellation of the obligation. A payment would be triggered by failure of the guaranteed party to fulfill its obligation covered by the guarantee, and no assets are held as collateral for these guarantees. As of December 31, 2008,2011, the maturities of these guarantees are up to 2023. Guarantees given against borrowings include the guarantee given in 2008 by TOTAL S.A. in connection with the financing of the Yemen LNG project for an amount of€1,208 million. In turn, certain partners involved in this project have given commitments that could, in the case of Total S.A.’s guarantees being called for the maximum amount, reduce the Group’s exposure by up to€404 million, recorded under “Other commitments received”. In 2010, TOTAL S.A. provided guarantees in connection with the financing of the Jubail project (operated by SAUDI ARAMCO TOTAL Refining and Petrochemical Company (SATORP)) of up to€2,463 million, proportional to TOTAL’s share in the project (37.5%). In addition, TOTAL S.A. provided in 2010 a guarantee in favor of its partner in the Jubail project (Saudi Arabian Oil Company) with respect to Total Refining Saudi Arabia SAS’s obligations under the shareholders agreement with respect to SATORP. As of December 31, 2011, this guarantee is of up to€1,095 million and has been recorded under “Other operating commitments”. Indemnities related to sales of businesses In the ordinary course of business, the Group executes contracts involving standard indemnities in theoil industry and indemnities specific to a transactiontransactions such as salesales of a business.businesses. These indemnities might include claims against any of the following: environmental, tax and shareholder matters, intellectual property rights, governmental regulations and employment-related matters, dealer, supplier, and other commercial contractual relationships. Performance under these indemnities would generally be triggered by a breach of terms of the contract or by a third party claim. The Group regularly evaluates the probability of having to incur costs associated with these indemnities. The guarantees related to antitrust investigations granted as part of the agreement relating to the spin-off of Arkema are described in Note 32 to the Consolidated Financial Statements. Other guarantees given Non-consolidated companiessubsidiaries The Group also guarantees the current liabilities of certain non-consolidated companies.subsidiaries. Performance under these guarantees would be triggered by a financial default of the entity. Operating agreements As part of normal ongoing business operations and consistent with generally and accepted recognized industry practices, the Group enters into numerous agreements with thirdother parties. These commitments are often entered into for commercial purposes, for regulatory purposes andor for other operating agreements. Goods and services sale obligations These amounts represent binding obligations under contractual agreements to sell goods or services, including in particular hydrocarbon unconditional sale contracts (except when an active, highly-liquid market exists and volumes are re-sold shortly after purchase). 24)RELATED PARTIES The main transactions and balances with related parties (principally non-consolidated companiessubsidiaries and equity affiliates) are detailed as follows: | Balance sheet As of December 31,(M€) | | 2008 | | 2007 | | 2006 | | | As of December 31, (M€) | | | 2011 | | | 2010 | | | 2009 | | Balance sheet | | | | | | | | Receivables | | | | | | | | | | | | | Debtors and other debtors | | 244 | | 277 | | 411 | | | 585 | | | | 432 | | | | 293 | | Loans (excl. loans to equity affiliates) | | 354 | | 378 | | 457 | | | 331 | | | | 315 | | | | 438 | | Payables | | | | | | | | | | | | | Creditors and other creditors | | 136 | | 460 | | 424 | | | 724 | | | | 497 | | | | 386 | | Debts | | 50 | | 28 | | 25 | | | 31 | | | | 28 | | | | 42 | | Statement of income For the year ended
December 31,(M€) | | 2008 | | 2007 | | 2006 | | | | | | | | | | | For the year ended December 31, (M€) | | | 2011 | | | 2010 | | | 2009 | | Statement of income | | | | | | | | Sales | | 3,082 | | 2,635 | | 1,996 | | | 4,400 | | | | 3,194 | | | | 2,183 | | Purchases | | 4,061 | | 3,274 | | 3,123 | | | 5,508 | | | | 5,576 | | | | 2,958 | | Financial expense | | — | | — | | — | | | — | | | | 69 | | | | 1 | | Financial income | | 114 | | 29 | | 60 | | | 79 | | | | 74 | | | | 68 | |
Compensation for the administration and management bodies The aggregate amount paid directly or indirectlyof direct and indirect compensation accounted for by the French and foreign affiliates of the Company as compensation tofor the executive officers of TOTAL (the members of the Management Committee and the Treasury)Treasurer) and tofor the members of the Board of Directors who are employees of the Group, is detailed as follows: | | | | | | | For the year ended December 31,
(M€) | | 2008 | | 2007 | | 2006 | Number of people | | 30 | | 30 | | 32 | Direct or indirect compensation | | 20.4 | | 19.9 | | 19.8 | Share-based payment expense (IFRS 2)(a) | | 16.6 | | 18.4 | | 16.6 | Pension expenses(b) | | 11.9 | | 12.2 | | 14.0 |
| | | | | | | | | | | | | | For the year ended December 31, (M€) | | 2011 | | | 2010 | | | 2009 | | Number of people | | | 30 | | | | 26 | | | | 27 | | Direct or indirect compensation received | | | 20.4 | | | | 20.8 | | | | 19.4 | | Pension expenses(a) | | | 9.4 | | | | 12.2 | | | | 10.6 | | Other long-term benefits expenses | | | — | | | | — | | | | — | | Termination benefits expenses | | | 4.8 | | | | — | | | | — | | Share-based payments expense (IFRS 2)(b) | | | 10.2 | | | | 10.0 | | | | 11.2 | |
| (a) | The benefits provided for executive officers and certain members of the Board of Directors, employees and former employees of the Group, include severance to be paid on retirement, supplementary pension schemes and insurance plans, which represent€139.7 million provisioned as of December 31, 2011 (against€113.8 million as of December 31, 2010 and€96.6 million as of December 31, 2009). |
| (b) | Share-based payments expense computed for the executive officers and the members of the Board of Directors who are employees of the Group as described in Note 25 paragraph E to the Consolidated Financial Statements and based on the principles of IFRS 2 “Share-based payments” described in Note 1 paragraph E to the Consolidated Financial Statements. |
(b) | The benefits provided for executive officers and certain members of the Board of Directors, employees and former employees of the Group, include severance to be paid on retirement, supplementary pension schemes and insurance plans, which represent 98.0 M€ provisioned as of December 31, 2008, against 102.9 M€ as of December 31, 2007 and 113.2 M€ as of December 31, 2006. |
The compensation allocated to members of the Board of Directors for directors’ fees totaled 0.83 M€1.07 million in 2008 (0.82 M2011 (€0.96 million in 20072010 and 0.82 M€0.97 million in 2006)2009).
25) SHARE BASEDSHARE-BASED PAYMENTS A. TOTAL SHARE SUBSCRIPTION OPTIONS PLANS
| | | | | | | | | | | | | | | | | | | | | | | | | | | 2003 Plan(a) | | | 2004 Plan(b) | | | 2005 Plan(c) | | | 2006 Plan(d) | | | 2007 Plan(e) | | | 2008 Plan(f) | | | Total | | | Weighted- average exercise price | Exercise price until May 23, 2006 included(g) | | 33.30 | | | 39.85 | | | 49.73 | | | | | | | | | | | | | | | | Exercise price since May 24, 2006(g) | | 32.84 | | | 39.30 | | | 49.04 | | | 50.60 | | | 60.10 | | | 42.90 | | | | | | | Expiration date | | 07/16/2011 | | | 07/20/2012 | | | 07/19/2013 | | | 07/18/2014 | | | 07/17/2015 | | | 10/09/2016 | | | | | | | Number of options(h) | | | | | | | | | | | | | | | | | | | | | | | | Outstanding options as of January 1, 2006 | | 11,196,796 | | | 13,411,320 | | | 6,094,080 | | | | | | | | | | | | 30,702,196 | | | 39.42 | Granted | | — | | | — | | | 134,400 | | | 5,727,240 | | | | | | | | | 5,861,640 | | | 50.58 | Cancelled | | (22,200 | ) | | (57,263 | ) | | (43,003 | ) | | (1,080 | ) | | | | | | | | (123,546 | ) | | 41.74 | Adjustment following the spin-off of Arkema(i) | | 163,180 | | | 196,448 | | | 90,280 | | | — | | | | | | | | | 449,908 | | | | Exercised | | (729,186 | ) | | (120,133 | ) | | — | | | — | | | | | | | | | (849,319 | ) | | 33.85 | Outstanding options as of January 1, 2007 | | 10,608,590 | | | 13,430,372 | | | 6,275,757 | | | 5,726,160 | | | | | | | | | 36,040,879 | | | 40.89 | Granted | | — | | | — | | | — | | | — | | | 5,937,230 | | | | | | 5,937,230 | | | 60.10 | Cancelled | | (22,138 | ) | | (20,093 | ) | | (11,524 | ) | | (13,180 | ) | | (17,125 | ) | | | | | (84,060 | ) | | 44.94 | Exercised | | (2,218,074 | ) | | (213,043 | ) | | (20,795 | ) | | (1,920 | ) | | — | | | | | | (2,453,832 | ) | | 33.55 | Outstanding options as of January 1, 2008 | | 8,368,378 | | | 13,197,236 | | | 6,243,438 | | | 5,711,060 | | | 5,920,105 | | | | | | 39,440,217 | | | 44.23 | Granted | | — | | | — | | | — | | | — | | | — | | | 4,449,810 | | | 4,449,810 | | | 42.90 | Cancelled | | (25,184 | ) | | (118,140 | ) | | (34,032 | ) | | (53,304 | ) | | (34,660 | ) | | (6,000 | ) | | (271,320 | ) | | 44.88 | Exercised | | (841,846 | ) | | (311,919 | ) | | (17,702 | ) | | (6,700 | ) | | — | | | — | | | (1,178,167 | ) | | 34.89 | Outstanding options as of December 31, 2008 | | 7,501,348 | | | 12,767,177 | | | 6,191,704 | | | 5,651,056 | | | 5,885,445 | | | 4,443,810 | | | 42,440,540 | | | 44.35 |
| A. | | TOTAL SHARE SUBSCRIPTION OPTION PLANS |
| | | | | | | | | | | | | | | | | | | | | | | | | | | | | | | | | | | | | | | | | | | | | | | | 2003 Plan | | | 2004 Plan | | | 2005 Plan | | | 2006 Plan | | | 2007 Plan | | | 2008 Plan | | | 2009 Plan | | | 2010 Plan | | | 2011 Plan | | | Total | | | Weighted
average
exercise
price | | Date of the shareholders’ meeting | | | 05/17/2001 | | | | 05/14/2004 | | | | 05/14/2004 | | | | 05/14/2004 | | | | 05/11/2007 | | | | 05/11/2007 | | | | 05/11/2007 | | | | 05/21/2010 | | | | 05/21/2010 | | | | | | | | | | Date of the award(a) | | | 07/16/2003 | | | | 07/20/2004 | | | | 07/19/2005 | | | | 07/18/2006 | | | | 07/17/2007 | | | | 10/09/2008 | | | | 09/15/2009 | | | | 09/14/2010 | | | | 09/14/2011 | | | | | | | | | | Exercise price until May 23, 2006 included(b) | | | 33.30 | | | | 39.85 | | | | 49.73 | | | | — | | | | — | | | | — | | | | — | | | | — | | | | — | | | | | | | | | | Exercise price since May 24, 2006(b) | | | 32.84 | | | | 39.30 | | | | 49.04 | | | | 50.60 | | | | 60.10 | | | | 42.90 | | | | 39.90 | | | | 38.20 | | | | 33.00 | | | | | | | | | | Expiry date | | | 07/16/2011 | | | | 07/20/2012 | | | | 07/19/2013 | | | | 07/18/2014 | | | | 07/17/2015 | | | | 10/09/2016 | | | | 09/15/2017 | | | | 09/14/2018 | | | | 09/14/2019 | | | | | | | | | | Number of options(c) | | | | | | | | | | | | | | | | | | | | | | | | | | | | | | | | | | | | | | | | | | | | | Existing options as of January 1, 2008 | | | 8,368,378 | | | | 13,197,236 | | | | 6,243,438 | | | | 5,711,060 | | | | 5,920,105 | | | | — | | | | — | | | | — | | | | — | | | | 39,440,217 | | | | 44.23 | | Granted | | | — | | | | — | | | | — | | | | — | | | | — | | | | 4,449,810 | | | | — | | | | ��� | | | | — | | | | 4,449,810 | | | | 42.90 | | Cancelled | | | (25,184 | ) | | | (118,140 | ) | | | (34,032 | ) | | | (53,304 | ) | | | (34,660 | ) | | | (6,000 | ) | | | — | | | | — | | | | — | | | | (271,320 | ) | | | 44.88 | | Exercised | | | (841,846 | ) | | | (311,919 | ) | | | (17,702 | ) | | | (6,700 | ) | | | — | | | | — | | | | — | | | | — | | | | — | | | | (1,178,167 | ) | | | 34.89 | | Existing options as of January 1, 2009 | | | 7,501,348 | | | | 12,767,177 | | | | 6,191,704 | | | | 5,651,056 | | | | 5,885,445 | | | | 4,443,810 | | | | — | | | | — | | | | — | | | | 42,440,540 | | | | 44.35 | | Granted | | | — | | | | — | | | | — | | | | — | | | | — | | | | — | | | | 4,387,620 | | | | — | | | | — | | | | 4,387,620 | | | | 39.90 | | Cancelled | | | (8,020 | ) | | | (18,387 | ) | | | (6,264 | ) | | | (5,370 | ) | | | (13,780 | ) | | | (2,180 | ) | | | (10,610 | ) | | | — | | | | — | | | | (64,611 | ) | | | 45.04 | | Exercised | | | (681,699 | ) | | | (253,081 | ) | | | — | | | | — | | | | — | | | | — | | | | — | | | | — | | | | — | | | | (934,780 | ) | | | 34.59 | | Existing options as of January 1, 2010 | | | 6,811,629 | | | | 12,495,709 | | | | 6,185,440 | | | | 5,645,686 | | | | 5,871,665 | | | | 4,441,630 | | | | 4,377,010 | | | | — | | | | — | | | | 45,828,769 | | | | 44.12 | | Granted | | | — | | | | — | | | | — | | | | — | | | | — | | | | — | | | | — | | | | 4,788,420 | | | | — | | | | 4,788,420 | | | | 38.20 | | Cancelled(d) | | | (1,420 | ) | | | (15,660 | ) | | | (6,584 | ) | | | (4,800 | ) | | | (5,220 | ) | | | (92,472 | ) | | | (4,040 | ) | | | (1,120 | ) | | | — | | | | (131,316 | ) | | | 43.50 | | Exercised | | | (1,075,765 | ) | | | (141,202 | ) | | | — | | | | — | | | | — | | | | — | | | | (1,080 | ) | | | — | | | | — | | | | (1,218,047 | ) | | | 33.60 | | Existing options as of January 1, 2011 | | | 5,734,444 | | | | 12,338,847 | | | | 6,178,856 | | | | 5,640,886 | | | | 5,866,445 | | | | 4,349,158 | | | | 4,371,890 | | | | 4,787,300 | | | | — | | | | 49,267,826 | | | | 43.80 | | Granted | | | — | | | | — | | | | — | | | | — | | | | — | | | | — | | | | — | | | | — | | | | 1,518,840 | | | | 1,518,840 | | | | 33.00 | | Cancelled(e) | | | (738,534 | ) | | | (28,208 | ) | | | (16,320 | ) | | | (17,380 | ) | | | (16,080 | ) | | | (13,260 | ) | | | (14,090 | ) | | | (85,217 | ) | | | (1,000 | ) | | | (930,089 | ) | | | 34.86 | | Exercised | | | (4,995,910 | ) | | | (216,115 | ) | | | — | | | | — | | | | — | | | | (200 | ) | | | — | | | | (2,040 | ) | | | (9,400 | ) | | | (5,223,665 | ) | | | 33.11 | | Existing options as of December 31, 2011 | | | — | | | | 12,094,524 | | | | 6,162,536 | | | | 5,623,506 | | | | 5,850,365 | | | | 4,335,698 | | | | 4,357,800 | | | | 4,700,043 | | | | 1,508,440 | | | | 44,632,912 | | | | 44.87 | |
| (a) | Grants approved by the Board of Directors on July 16, 2003 pursuant to the authorization given by the shareholders’ meeting held on May 17, 2001. The options are exercisable only after a two-year period fromgrant date is the date of the Board meeting awarding the share subscription options, and must be exercised within eight years from this date. Underlying shares may not be soldexcept for four years from the dategrant of grant.October 9, 2008, decided by the Board on September 9, 2008. |
| (b) | Grants approved by the Board of Directors on July 20, 2004 pursuant to the authorization given by the shareholders’ meeting held on May 14, 2004. The options are exercisable only after a two-year period from the date of the Board meeting awarding the options and must be exercised within eight years from this date. Underlying shares may not be sold for four years from the date of grant. |
(c) | Grants approved by the Board of Directors on July 19, 2005 pursuant to the authorization given by the shareholders’ meeting held on May 14, 2004. The options are exercisable only after a two-year period from the date of the Board meeting awarding the options and must be exercised within eight years from this date. Underlying shares may not be sold for four years from the date of grant. |
(d) | Grants approved by the Board of Directors on July 18, 2006 pursuant to the authorization given by the shareholders’ meeting held on May 14, 2004. The options are exercisable only after a two-year period from the date of the Board meeting awarding the options and must be exercised within eight years from this date. Underlying shares may not be sold for four years from the date of grant. |
(e) | Grants approved by the Board of Directors on July 17, 2007 pursuant to the authorization given by the shareholders’ meeting held on May 11, 2007. The options are exercisable only after a two-year period from the date of the Board meeting awarding the options and must be exercised within eight years from this date. Underlying shares may not be sold for four years from the date of grant. Beneficiaries working for a non-French subsidiary as of July 17, 2007 are authorized to transfer the shares issued upon exercise of options starting from July 18, 2009. Furthermore, the Board of Directors decided that for each beneficiary of more than 25,000 stock options, one third of the options granted in excess of this number will definitely be awarded following the two-year vesting period, under a performance condition based on the return on equity of the Group and calculated on the Consolidated Financial Statements of the Group for the fiscal year 2008. The performance condition states that the grant rate is null if the return on equity is less than or equal to 10%, varies on a straight-line basis between 0% and 80% if the return on equity is more than 10% and less than 18%, varies on a straight-line basis between 80% and 100% if the return on equity is more than or equal to 18% and less than 30%, and is equal to 100% if the return on equity is more than or equal to 30% |
(f) | Grants on October 9, 2008 approved by the Board of Directors on September 9, 2008 pursuant to the authorization given by the shareholders’ meeting held on May 11, 2007. The options are exercisable only after a two-year period from the date of the Board meeting awarding the options and must be exercised within eight years from this date. Underlying shares may not be sold for four years from the date of grant. Beneficiaries working for a non-French subsidiary as of October 9, 2008, are authorized to transfer the shares issued upon exercise of options starting from October 10, 2010. Furthermore, the Board of Directors decided that for each beneficiary of more than 25,000 stock options, one third of the options granted in excess of this number will finally be awarded following the two-year vesting period, under a performance condition based on the return on equity of the Group and calculated on the Consolidated Financial Statements of the Group for the fiscal year 2009 (performance condition described in footnote (e) above). |
(g) | Exercise price in euro. The exercise prices of TOTAL subscription shares of the plans in force at that date were multiplied by 0.25 to take into account the four-for-one stock split on May 18, 2006. Moreover, following the spin-off of Arkema, the exercise prices of TOTAL subscription shares of these plans were multiplied by an adjustment factor equal to 0.986147 with effecteffective as of May 24, 2006. |
(h)(c) | The number of options awarded, outstanding, cancelledcanceled or exercised before May 23, 2006 included, was multiplied by four to reflecttake into account the four-for-one stock split approved by the shareholders’ meeting on May 12, 2006. |
(i)(d) | Adjustments approved byOut of 92,472 options awarded under the Board of Directors on March 14, 2006, in application of Articles 174-9, 174-12 and 174-132008 Plan that were canceled, 88,532 options were canceled due to the performance condition. The acquisition rate applicable to the subscription options that were subject to the performance condition of the decree No. 67-236 of March 23, 1967 in force during this Board of Directors and during TOTAL S.A. shareholders’ meeting of May 12, 2006, as part2008 Plan was 60%. |
| (e) | Out of the spin-off930,089 options canceled in 2011, 738,534 options that were not exercised expired due to the expiry of Arkema. These adjustments have been madethe 2003 subscription option Plan on May 22, 2006 with effect as of May 24, 2006.July 16, 2011. |
Options are exercisable, subject to a continuous employment condition, after a 2-year period from the date of the Board meeting awarding the options and expire eight years after this date. The underlying shares may not be transferred during four years from the date of grant. For the 2007 to 2011 Plans, the 4-year transfer restriction period does not apply to employees of non-French subsidiaries as of the date of the grant, who may transfer the underlying shares after a 2-year period from the date of the grant. B. TOTAL SHARE PURCHASE OPTIONS PLANS2011 Plan
For the 2011 Plan, the Board of Directors decided that for each grantee other than the Chairman and Chief Executive Officer, the options will be finally granted to their beneficiary provided that the performance condition is fulfilled. The performance condition states that the number of options finally granted is based on the average of the Return On Equity (ROE) of the Group. The average ROE is calculated by the Group from the consolidated balance sheet and statement of income of the Group for fiscal years 2011 and 2012. The acquisition rate: | | | | | | | | | | | | | | | | | | | | | | | | 1998 Plan(a) | | | 1999 Plan(b) | | | 2000 Plan(c) | | | 2001 Plan(d) | | | 2002 Plan(e) | | | Total | | | Weighted- average exercise price | Exercise price until May 23, 2006 included(f) | | 23.44 | | | 28.25 | | | 40.68 | | | 42.05 | | | 39.58 | | | | | | | Exercise price since May 24, 2006(f) | | | | | 27.86 | | | 40.11 | | | 41.47 | | | 39.03 | | | | | | | Expiration date | | 03/17/2006 | | | 06/15/2007 | | | 07/11/2008 | | | 07/10/2009 | | | 07/09/2010 | | | | | | | Number of options(g) | | | | | | | | | | | | | | | | | | | | | Outstanding options as of January 1, 2006 | | 589,652 | | | 2,052,432 | | | 6,509,944 | | | 8,735,900 | | | 11,283,480 | | | 29,171,408 | | | 39.44 | Granted | | — | | | — | | | — | | | — | | | — | | | — | | | — | Cancelled(h) | | (72,692 | ) | | — | | | (7,272 | ) | | (15,971 | ) | | (26,694 | ) | | (122,629 | ) | | 30.20 | Adjustment following the spin-off of Arkema(i) | | — | | | 25,772 | | | 84,308 | | | 113,704 | | | 165,672 | | | 389,456 | | | | Exercised | | (516,960 | ) | | (707,780 | ) | | (1,658,475 | ) | | (1,972,348 | ) | | (2,141,742 | ) | | (6,997,305 | ) | | 37.87 | Outstanding options as of January 1, 2007 | | — | | | 1,370,424 | | | 4,928,505 | | | 6,861,285 | | | 9,280,716 | | | 22,440,930 | | | 39.33 | Granted | | | | | — | | | — | | | — | | | — | | | — | | | — | Cancelled | | | | | (138,023 | ) | | (3,452 | ) | | (7,316 | ) | | (7,104 | ) | | (155,895 | ) | | 29.28 | Exercised | | | | | (1,232,401 | ) | | (1,782,865 | ) | | (1,703,711 | ) | | (2,210,429 | ) | | (6,929,406 | ) | | 37.92 | Outstanding options as of January 1, 2008 | | | | | — | | | 3,142,188 | | | 5,150,258 | | | 7,063,183 | | | 15,355,629 | | | 40.07 | Granted | | | | | | | | — | | | — | | | — | | | — | | | — | Cancelled | | | | | | | | (480,475 | ) | | (3,652 | ) | | (13,392 | ) | | (497,519 | ) | | 40.09 | Exercised | | | | | | | | (2,661,713 | ) | | (455,180 | ) | | (598,934 | ) | | (3,715,827 | ) | | 40.10 | Outstanding options as of December 31, 2008 | | | | | | | | — | | | 4,691,426 | | | 6,450,857 | | | 11,142,283 | | | 40.06 |
is equal to zero if the average ROE is less than or equal to 7%; varies on straight-line basis between 0% and 100% if the average ROE is more than 7% and less than 18%; and is equal to 100% if the average ROE is more than or equal to 18%. In addition, as part of the 2011 Plan, the Board of Directors decided that the number of share subscription options finally awarded to the Chairman and Chief Executive Officer will be subject to two performance conditions: For 50% of the share subscription options granted, the performance condition states that the number of options finally granted is based on the average ROE of the Group. The average ROE is calculated by the Group from the consolidated balance sheet and statement of income of the Group for fiscal years 2011 and 2012. The acquisition rate is equal to zero if the average ROE is less than or equal to 7%; varies on a straight-line basis between 0% and 100% if the average ROE is more than 7% and less than 18%; and is equal to 100% if the average ROE is more than or equal to 18%. For 50% of the share subscription options granted, the performance condition states that the number of | | options finally granted is based on the average of the Return On Average Capital Employed (ROACE) of the Group. The average ROACE is calculated by the Group from the consolidated balance sheet and statement of income of the Group for fiscal years 2011 and 2012. The acquisition rate is equal to zero if the average ROACE is less than or equal to 6%; varies on a straight-line basis between 0% and 100% if the average ROACE is more than 6% and less than 15%; and is equal to 100% if the average ROACE is more than or equal to 15%. |
2010 Plan For the 2010 Plan, the Board of Directors decided that: For each grantee of up to 3,000 options, other than the Chairman and Chief Executive Officer, the options will be finally granted to their beneficiary. For each grantee of more than 3,000 options and less or equal to 50,000 options (other than the Chairman and Chief Executive Officer): The first 3,000 options and two-thirds above the first 3,000 options will be finally granted to their beneficiary; The outstanding options, that is one-third of the options above the first 3,000 options, will be finally granted provided that the performance condition described below is fulfilled. For each grantee of more than 50,000 options (other than the Chairman and Chief Executive Officer): The first 3,000 options, two-thirds of the options above the first 3,000 options and below the first 50,000 options, and one-third of the options above the first 50,000 options, will be finally granted to their beneficiary; The outstanding options, that is one-third of the options above the first 3,000 options and below the first 50,000 options and two-thirds of the options above the first 50,000 options, will be finally granted provided that the performance condition is fulfilled. The performance condition states that the number of options finally granted is based on the average ROE of the Group. The average ROE is calculated by the Group based on TOTAL’s consolidated balance sheet and statement of income for fiscal years 2010 and 2011. The acquisition rate: is equal to zero if the average ROE is less than or equal to 7%; varies on straight-line basis between 0% and 100% if the average ROE is more than 7% and less than 18%; and is equal to 100% if the average ROE is more than or equal to 18%. In addition, as part of the 2010 Plan, the Board of Directors decided that the number of share subscription options finally awarded to the Chairman and Chief Executive Officer will be subject to two performance conditions: For 50% of the share subscription options granted, the performance condition states that the number of options finally granted is based on the average ROE of the Group. The average ROE is calculated by the Group based on TOTAL’s consolidated balance sheet and statement of income for fiscal years 2010 and 2011. The acquisition rate is equal to zero if the average ROE is less than or equal to 7%; varies on a straight-line basis between 0% and 100% if the average ROE is more than 7% and less than 18%; and is equal to 100% if the average ROE is more than or equal to 18%. For 50% of the share subscription options granted, the performance condition states that the number of options finally granted is based on the average ROACE of the Group. The average ROACE is calculated by the Group based on TOTAL’s consolidated balance sheet and statement of income for fiscal years 2010 and 2011. The acquisition rate is equal to zero if the average ROACE is less than or equal to 6%; varies on a straight-line basis between 0% and 100% if the average ROACE is more than 6% and less than 15%; and is equal to 100% if the average ROACE is more than or equal to 15%. 2009 Plan For the 2009 Plan, the Board of Directors decided that for each beneficiary, other than the Chief Executive Officer, of more than 25,000 options, one third of the options granted in excess of this number will be finally granted subject to a performance condition. This condition states that the final number of options finally granted is based on the average ROE of the Group as published by TOTAL. The average ROE is calculated based on the Group’s consolidated balance sheet and statement of income for fiscal years 2009 and 2010. The acquisition rate: is equal to zero if the average ROE is less than or equal to 7%; varies on straight-line basis between 0% and 100% if the average ROE is more than 7% and less than 18%; and is equal to 100% if the average ROE is more than or equal to 18%. In addition, the Board of Directors decided that, for the Chief Executive Officer, the number of share subscription options finally granted will be subject to two performance conditions: For 50% of the share subscription options granted, the performance condition states that the number of options finally granted is based on the average ROE of the Group as published by TOTAL. The average ROE is calculated based on the Group’s consolidated balance sheet and statement of income for fiscal years 2009 and 2010. The acquisition rate is equal to zero if the average ROE is less than or equal to 7%; varies on a straight-line basis between 0% and 100% if the average ROE is more than 7% and less than 18%; and is equal to 100% if the average ROE is more than or equal to 18%. For 50% of the share subscription options granted, the performance condition states that the number of options finally granted is based on the average ROACE of the Group as published by TOTAL. The average ROACE is calculated based on the Group’s consolidated balance sheet and statement of income for fiscal years 2009 and 2010. The acquisition rate is equal to zero if the average ROACE is less than or equal to 6%; varies on a straight-line basis between 0% and 100% if the average ROACE is more than 6% and less than 15%; and is equal to 100% if the average ROACE is more than or equal to 15%. Due to the application of the performance condition, the acquisition rates were 100% for the 2009 Plan. | B. | | TOTAL SHARE PURCHASE OPTION PLANS |
| | | | | | | | | | | | | | | | | | | | 2001 Plan(a) | | | 2002 Plan(b) | | | Total | | | Weighted
average exercise
price | | Date of the shareholders’ meeting | | | 05/17/2001 | | | | 05/17/2001 | | | | | | | | | | Grant date(c) | | | 07/10/2001 | | | | 07/09/2002 | | | | | | | | | | Exercise price until May 23, 2006 included(d) | | | 42.05 | | | | 39.58 | | | | | | | | | | Exercise price since May 24, 2006(d) | | | 41.47 | | | | 39.03 | | | | | | | | | | Expiry date | | | 07/10/2009 | | | | 07/09/2010 | | | | | | | | | | Number of options(e) | | | | | | | | | | | | | | | | | | | | | | Outstanding as of January 1, 2009 | | | 4,691,426 | | | | 6,450,857 | | | | 11,142,283 | | | | 40.06 | | Awarded | | | — | | | | — | | | | — | | | | — | | Cancelled | | | (4,650,446 | ) | | | (7,920 | ) | | | (4,658,366 | ) | | | 41.47 | | Exercised | | | (40,980 | ) | | | (507,676 | ) | | | (548,656 | ) | | | 39.21 | | Outstanding as of January 1, 2010 | | | — | | | | 5,935,261 | | | | 5,935,261 | | | | 39.03 | | Awarded | | | — | | | | — | | | | — | | | | — | | Cancelled(f) | | | — | | | | (4,671,989 | ) | | | (4,671,989 | ) | | | 39.03 | | Exercised | | | — | | | | (1,263,272 | ) | | | (1,263,272 | ) | | | 39.03 | | Outstanding as of January 1, 2011 | | | — | | | | — | | | | — | | | | — | | Awarded | | | — | | | | — | | | | — | | | | — | | Cancelled | | | — | | | | — | | | | — | | | | — | | Exercised | | | — | | | | — | | | | — | | | | — | | Outstanding as of December 31, 2011 | | | — | | | | — | | | | — | | | | — | |
| (a) | Grants approved by the Board of Directors on March 17, 1998 pursuant to the authorization given by the shareholders’ meeting held on May 21, 1997. The optionsOptions were exercisable, onlysubject to a continued employment condition, after a five-year3.5-year vesting period from the date of the Board meeting awarding the options and had toexpired 8 years after this date. The underlying shares may not be exercised within eight yearstransferred during the 4-year period from this date.the date of the grant. This plan expired on March 17, 2006.July 10, 2009. |
| (b) | Grants approved by the Board of Directors on June 15, 1999 pursuant to the authorization given by the shareholders’ meeting held on May 21, 1997. The optionsOptions were exercisable, onlysubject to a continued employment condition, after a five-year2-year vesting period from the date of the Board meeting awarding the options and had to be exercised within eightexpired 8 years fromafter this date. The underlying shares may not be transferred during the 4-year period from the date of the grant. This plan has expired on June 15, 2007.July 9, 2010. |
| (c) | Grants approved by the Board of Directors on July 11, 2000 pursuant to the authorization given by the shareholders’ meeting held on May 21, 1997. The options were exercisable only after a four-year period fromgrant date is the date of the Board meeting awarding the options and has to be exercised within eight years from this date. For beneficiaries holding contracts with French companies or working in France, the shares arising from the exercise of options may not be sold for five years from the date of grant. This plan expired on July 11, 2008.options. |
| (d) | Grants approved by the Board of Directors on July 10, 2001 pursuant to the authorization given by the shareholders’ meeting held on May 17, 2001. The options are exercisable only after January 1, 2005 and must be exercised within eight years from the date of grant. For beneficiaries holding contracts with French companies or working in France, the shares arising from the exercise of options may not be sold for four years from the date of grant. Underlying shares may not be sold for four years from the date of grant. |
(e) | Grants approved by the Board of Directors on July 9, 2002 pursuant to the authorization given by the shareholders’ meeting held on May 17, 2001. The options are exercisable only after a two-year period from the date of the Board meeting awarding the options and must be exercised within eight years from this date. Underlying shares may not be sold for four years from the date of grant. |
(f) | Exercise price in euro. The exercise prices of TOTAL share purchase options of the plans at that date were multiplied by 0.25 to take into account the four-for-one stock split on May 18, 2006. Moreover, following the spin-off of Arkema, the exercise prices of TOTAL share purchase options of these plans were multiplied by an adjustment factor equal to 0.986147 with effecteffective as of May 24, 2006. |
(g)(e) | The number of options awarded, outstanding, cancelledcanceled or exercised before May 23, 2006 included, was multiplied by four to reflecttake into account the four-for-one stock split approved by the shareholders’ meeting on May 12, 2006. |
(h)(f) | Including the confirmation in 2006 by the CompanyOut of the award4,671,989 options canceled in 2010, 4,671,145 options that were not exercised expired due to the expiry of 500 stock options, par value€10, that had been cancelled erroneously in 2001 (Plan 2000).the 2002 purchase option Plan on July 9, 2010. |
(i)C. | | Adjustments approved by the Board of Directors on March 14, 2006 in application of Articles 174-9, 174-12 and 174-13 of the decree n°67-236 of March 23, 1967 in force during this Board of Directors and during TOTAL S.A. shareholders’ meeting of May 12, 2006, as part of the spin-off of Arkema. These adjustments have been made on May 22, 2006 with effect as of May 24, 2006.EXCHANGE GUARANTEE GRANTED TO THE HOLDERS OF ELF AQUITAINE SHARE SUBSCRIPTION OPTIONS |
C. EXCHANGE GUARANTEE GRANTED TO THE HOLDERS OF ELF AQUITAINE SHARE SUBSCRIPTION OPTIONS
Pursuant to the public exchange offer for Elf Aquitaine shares which was made in 1999, the Group made a commitment to guarantee the holders of Elf Aquitaine share subscription options, at the end of the period referred to in Article 163 bis C of the French Tax Code (CGI), and until the end of the period for the exercise of the options, the possibility to exchange their future Elf Aquitaine shares for TOTAL shares, on the basis of the exchange ratio of the offer (19(nineteen TOTAL shares for 13thirteen Elf Aquitaine shares). In order to take into account the spin-off of S.D.A. (Société de Développement Arkema) by Elf Aquitaine, the spin-off of Arkema by TOTAL S.A. and the four-for-one TOTAL stock split, the Board of Directors of TOTAL S.A., in accordance with the terms of the share exchange undertaking, approved on March 14, 2006 to adjust the exchange ratio described above (see pages 24 and 25 of the “Prospectus for the purpose of listing Arkema shares on Eurolist by Euronext Paris in connection with the allocation of Arkema shares to TOTAL S.A. shareholders”). Following the approval by Elf Aquitaine shareholders’ meeting on May 10, 2006 of the spin-off of S.D.A. by Elf Aquitaine, the approval by TOTAL S.A. shareholders’ meeting on May 12, 2006 of the spin-off of Arkema by TOTAL S.A. and the four-for-one TOTAL stock split, the exchange ratio was adjusted to six TOTAL shares for one Elf Aquitaine share on May 22, 2006. AsThis exchange guarantee expired on September 12, 2009, due to the expiry of December 31, 2008, a maximumthe Elf Aquitaine share subscription option plan No. 2 of 101,6811999. Subsequently, no Elf Aquitaine shares either outstanding or to be created, wereare covered by this guarantee, as follows:the exchange guarantee.
| D. | | TOTAL PERFORMANCE SHARE GRANTS |
| | | | | | | | | | Elf Aquitaine subscription plan(a) | | 1999 Plan
n°1 | | 1999 Plan
n°2 | | Total | | Weighted-
average
exercise
price(b) | Exercise price until May 23, 2006 included(b) | | 115.60 | | 171.60 | | | | | Exercise price since May 24, 2006(b) | | 114.76 | | 170.36 | | | | | Expiration date | | 03/30/2009 | | 09/12/2009 | | | | | Outstanding position as of December 31, 2008 | | 90,342 | | 6,044 | | 96,386 | | 118.25 | | Outstanding Elf Aquitaine shares covered by the exchange guarantee as of December 31, 2008 | | 5,295 | | — | | 5,295 | | 114.76 | | Total of Elf Aquitaine shares, either outstanding or to be created, covered by the exchange guarantee for TOTAL shares as of December 31, 2008 | | 95,637 | | 6,044 | | 101,681 | | | | TOTAL shares likely to be created within the scope of the application of the exchange guarantee as of December 31, 2008 | | 573,822 | | 36,264 | | 610,086 | | |
| | | | | | | | | | | | | | | | | | | | | | | | | | | | | | | | | | | | 2005 Plan | | | 2006 Plan | | | 2007 Plan | | | 2008 Plan | | | 2009 Plan | | | 2010 Plan | | | 2011 Plan | | | Total | | Date of the shareholders’ meeting | | | 05/17/2005 | | | | 05/17/2005 | | | | 05/17/2005 | | | | 05/16/2008 | | | | 05/16/2008 | | | | 05/16/2008 | | | | 05/13/2011 | | | | | | Grant date(a) | | | 07/19/2005 | | | | 07/18/2006 | | | | 07/17/2007 | | | | 10/09/2008 | | | | 09/15/2009 | | | | 09/14/2010 | | | | 09/14/2011 | | | | | | Final grant date (end of the vesting period) | | | 07/20/2007 | | | | 07/19/2008 | | | | 07/18/2009 | | | | 10/10/2010 | | | | 09/16/2011 | | | | 09/15/2012 | | | | 09/15/2013 | | | | | | Transfer possible from | | | 07/20/2009 | | | | 07/19/2010 | | | | 07/18/2011 | | | | 10/10/2012 | | | | 09/16/2013 | | | | 09/15/2014 | | | | 09/15/2015 | | | | | | Number of performance shares | | | | | | | | | | | | | | | | | | | | | | | | | | | | | | | | | | | | | | | | | | Outstanding as of January 1, 2009 | | | — | | | | — | | | | 2,333,217 | | | | 2,772,748 | | | | | | | | | | | | | | | | 5,105,965 | | Awarded | | | — | | | | — | | | | — | | | | — | | | | 2,972,018 | | | | | | | | | | | | 2,972,018 | | Canceled | | | 1,928 | | | | 2,922 | | | | (12,418 | ) | | | (9,672 | ) | | | (5,982 | ) | | | | | | | | | | | (23,222 | ) | Finally granted(b)(c) | | | (1,928 | ) | | | (2,922 | ) | | | (2,320,799 | ) | | | (600 | ) | | | — | | | | | | | | | | | | (2,326,249 | ) | Outstanding as of January 1, 2010 | | | — | | | | — | | | | — | | | | 2,762,476 | | | | 2,966,036 | | | | | | | | | | | | 5,728,512 | | Awarded | | | — | | | | — | | | | — | | | | — | | | | — | | | | 3,010,011 | | | | | | | | 3,010,011 | | Canceled(d) | | | 1,024 | | | | 3,034 | | | | 552 | | | | (1,113,462 | ) | | | (9,796 | ) | | | (8,738 | ) | | | | | | | (1,127,386 | ) | Finally granted(b)(c) | | | (1,024 | ) | | | (3,034 | ) | | | (552 | ) | | | (1,649,014 | ) | | | (1,904 | ) | | | (636 | ) | | | | | | | (1,656,164 | ) | Outstanding as of January 1, 2011 | | | — | | | | — | | | | — | | | | — | | | | 2,954,336 | | | | 3,000,637 | | | | | | | | 5,954,973 | | Awarded | | | — | | | | — | | | | — | | | | — | | | | — | | | | — | | | | 3,649,770 | | | | 3,649,770 | | Canceled | | | 800 | | | | 700 | | | | 792 | | | | 356 | | | | (26,214 | ) | | | (10,750 | ) | | | (19,579 | ) | | | (53,895 | ) | Finally granted(b)(c)(e) | | | (800 | ) | | | (700 | ) | | | (792 | ) | | | (356 | ) | | | (2,928,122 | ) | | | (1,836 | ) | | | — | | | | (2,932,606 | ) | Outstanding as of December 31, 2011 | | | — | | | | — | | | | — | | | | — | | | | — | | | | 2,988,051 | | | | 3,630,191 | | | | 6,618,242 | |
| (a) | AdjustmentsThe grant date is the date of the numberBoard of options approvedDirectors meeting that awarded the shares, except for the shares awarded by the Board of Directors at their meeting of Elf AquitaineSeptember 9, 2008, and granted on March 10, 2006 in application of articles 174-9, 174-12 and 174-13 of the decree No. 67-236 of March 23, 1967 in force on March 10, 2006 and during Elf Aquitaine shareholders’ meeting on May 10, 2006 , as part of the spin-off of SDA. These adjustments have been made on May 22, 2006 with effect as of May 24, 2006.October 9, 2008. |
| (b) | Exercise price in euro. To take into accountPerformance shares finally granted following the spin-offdeath of S.D.A., the exercise prices of Elf Aquitaine share subscription options were multiplied by an adjustment factor equal to 0.992769 with effect on May 24, 2006. |
Thus, as of December 31, 2008, at most 610,086 shares of the Group were likely to be created as part of the application of this exchange guarantee.
D. TOTAL restricted share grants
| | | | | | | | | | | | | | | | | | | 2005 Plan(a)(b) | | | 2006 Plan(c) | | | 2007 Plan(d) | | | 2008 Plan(e) | | | Total | | Date of grant(f) | | 07/19/2005 | | | 07/18/2006 | | | 07/17/2007 | | | 10/9/2008 | | | | | Number of restricted shares | | | | | | | | | | | | | | | | Outstanding as of January 1, 2006 | | 2,274,528 | | | | | | | | | | | | 2,274,528 | | Notified | | — | | | 2,275,364 | | | | | | | | | 2,275,364 | | Cancelled | | (7,432 | ) | | (3,068 | ) | | | | | | | | (10,500 | ) | Finally granted | | — | | | — | | | | | | | | | — | | Outstanding as of January 1, 2007 | | 2,267,096 | | | 2,272,296 | | | | | | | | | 4,539,392 | | Notified | | — | | | — | | | 2,366,365 | | | | | | 2,366,365 | | Cancelled | | (38,088 | ) | | (6,212 | ) | | (2,020 | ) | | | | | (46,320 | ) | Finally granted(g) | | (2,229,008 | ) | | (2,128 | ) | | (1,288 | ) | | | | | (2,232,424 | ) | Outstanding as of January 1, 2008 | | — | | | 2,263,956 | | | 2,363,057 | | | | | | 4,627,013 | | Notified | | — | | | — | | | — | | | 2,791,968 | | | 2,791,968 | | Cancelled(h) | | 2,840 | | | (43,822 | ) | | (29,504 | ) | | (19,220 | ) | | (89,706 | ) | Finally granted(g)(h) | | (2,840 | ) | | (2,220,134 | ) | | (336 | ) | | — | | | (2,223,310 | ) | Outstanding as of December 31, 2008 | | — | | | — | | | 2,333,217 | | | 2,772,748 | | | 5,105,965 | |
(a) | Grants approved by the Board of Directors on July 19, 2005 pursuant to the authorization given by the shareholders’ meeting held on May 17, 2005. The grant of these shares, which have been bought back in 2005 by the Company on the market, became final after a two-year vesting period (acquisition of the right to restricted shares) on July 20, 2007, and after fulfilling the performance condition (see below). The Board of Directors on May 3, 2007 noticed that the acquisition rate, linked to the performance condition amounted to 100%. Moreover, the transfer of the restricted shares, that were definitely granted, will not be permitted between the date of final grant and the end of a two-year mandatory holding period, i.e. from July 20, 2009. |
(b) | The number of restricted shares was multiplied by four to take into account the four-for-one stock split approved by the shareholders’ meeting on May 12, 2006.their beneficiaries. |
| (c) | Grants approved by the Board of Directors on July 18, 2006 pursuant to the authorization given by the shareholders’ meeting held on May 17, 2005. The grant of these shares, which were bought back in 2006 by the Company on the market, became final after a two-year vesting period (acquisition of the right to restricted shares) on July 19, 2008, subject to aIncluding performance condition (see below). The Board of Directors on May 6, 2008 noticed that the acquisition rate, linked to the performance condition amounted to 100%. Moreover, the transfer of the restricted shares, that were finally granted, will not be permitted between the date of final grant and the end of a two-year mandatory holding period, i.e. from July 19, 2010. |
(d) | Grants approved by the Board of Directors on July 17, 2007 pursuant to the authorization given by the shareholders’ meeting held on May 17, 2005. The grant of these shares, which were bought back in 2007 by the Company on the market, will become final after a two-year vesting period (acquisition of the right to restricted shares) on July 18, 2009, subject to a performance condition (see below). Moreover, the transfer of the restricted shares, that might hence be finally granted, will not be permitted between the date of final grant and the end of a two-year mandatory holding period, i.e. from July 18, 2011. |
(e) | Grants on October 9, 2008, approved by the Board of Directors on September, 9 2008 pursuant to the authorization given by the shareholders’ meeting held on May 16, 2008. The grant of these shares, which have been bought back in 2008 by the Company on the market, will become final after a two-year vesting period (acquisition of the right to restricted shares) on October 10, 2010, subject to a performance condition (see below). Moreover, the transfer of the restricted shares, that might hence be finally granted, will not be permitted between the date of final grant and the end of a two-year mandatory holding period on October 10, 2012. |
(f) | The grant date corresponds to the date of the Board of Directors that approved the grant of restricted shares, except for the grant of restricted shares approved by the Board of Directors on September, 9 2008 that decided the grant of restricted shares on October 9, 2008. |
(g) | Restricted shares finally granted following the death of their beneficiaries (2005, 2006 and 2007 Plans for fiscal year 2007, and Plan 2007 for fiscal year 2008). |
(h) | For the 2005 Plan: restricted shares finally granted for which the entitlement right had been cancelledcanceled erroneously. |
| (d) | Out of the 1,113,462 canceled rights to the grant share under the 2008 Plan, 1,094,914 entitlement rights were canceled due to the performance condition. The acquisition rate for the 2008 Plan was 60%. |
| (e) | The acquisition rate for the 2009 Plan was 100%. |
The performance shares, which are bought back by the Company on the market, are finally granted to their beneficiaries after a 2-year vesting period from the date of the grant. The final grant is subject to a continued employment condition and a performance condition. Moreover, the transfer of the performance shares finally granted will not be permitted until the end of a 2-year mandatory holding period from the date of the final grant. 2011 Plan For the 2006, 20072011 Plan, the Board of Directors decided that, for each senior executive (other than the Chairman and 2008 Plans,Chief Executive Officer), the restricted share grants areshares will be finally granted subject to a performance condition. This condition which states that the number of restricted shares finally granted is based on the Return On Equity (ROE) ofaverage ROE as published by the Group. The ROE isGroup and calculated based on the Group’s consolidated accounts published by TOTALbalance sheet and related to thestatement of income for fiscal year preceding the final grant.
Thisyears 2011 and 2012. The acquisition rate:
is equal to zero if the average ROE is less than or equal to 10%7%; varies on a straight-line basis between 0% and 80%100% if the average ROE is moregreater than 10%7% and less than 18%; varies on a straight-line basis between 80% and 100% if the ROE is more than or equal to 18% and less than 30%; and
is equal to 100% if the average ROE is moregreater than or equal to 30%18%. The 2005 Plan wasBoard of Directors decided also that, for each for each beneficiary (other than the Chairman and Chief Executive Officer and the senior executives) of more than 100 shares, the shares in excess of this number will be finally granted subject to athe performance condition that statedmentioned before. In addition, as part of the 2011 plan, the Board of Directors decided that the number of performance share finally granted to the Chairman and Chief Executive Officer will be subject to two performance conditions: For 50% of the share granted, the performance condition states that the number of shares finally granted is based on the average ROE of the Group. The average ROE is calculated by the Group from the consolidated balance sheet and statement of income of the Group for fiscal years 2011 and 2012. The acquisition rate of the restricted shares granted wasis equal to zero if the average ROE for 2006 wasis less than 10%,or equal to 100% if the ROE was more than 20%, and varied7%; varies on a straight-line basis between 0% and 100% if the average ROE is more than 7% and less than 18%; and is equal to 100% if the average ROE is more than or equal to 18%. For 50% of the share granted, the performance condition states that the number of shares finally | | granted is based on the average ROACE of the Group. The average ROACE is calculated by the Group from the consolidated balance sheet and statement of income of the Group for fiscal years 2011 and 2012. The acquisition rate is equal to zero if the average ROACE is less than or equal to 6%; varies on a straight-line basis between 0% and 100% if the average ROACE is more than 6% and less than 15%; and is equal to 100% if the average ROACE is more than or equal to 15%. |
2010 Plan For the 2010 Plan, the Board of Directors decided that, for each beneficiary of more than 100 shares, half of the shares in excess of this number will be finally granted subject to a performance condition. This condition is based on the average ROE calculated by the Group based on TOTAL’s consolidated balance sheet and statement of income for fiscal years 2010 and 2011. The acquisition rate: is equal to zero if the average ROE is less than or equal to 7%; varies on a straight-line basis between 0% and 100% if the average ROE is greater than 7% and less than 18%; and is equal to 100% if the average ROE is greater than or equal to 18%. 2009 Plan For the 2009 Plan, the Board of Directors decided that, for each beneficiary of more than 100 shares, half of the shares in excess of this number will be finally granted subject to a performance condition. This condition states that the number of shares finally granted is based on the average ROE as published by the Group and calculated based on the Group’s consolidated balance sheet and statement of income for fiscal years 2009 and 2010. The acquisition rate: is equal to zero if the average ROE is less than or equal to 7%; varies on a straight-line basis between 0% and 100% if the average ROE is greater than 7% and less than 18%; and is equal to 100% if the average ROE is greater than or equal to 18%. Due to the application of the performance condition, the acquisition rate was 100% for the 2009 Plan. | E. | | GLOBAL FREE TOTAL SHARE PLAN |
The Board of Directors approved at its meeting on May 21, 2010 the implementation and conditions of a global free share plan intended for the Group employees. On June 30, 2010, entitlement rights to 25 free shares were granted to every employee. The final grant is subject to a continued employment condition during the plan’s vesting period. The shares are not subject to any performance condition. Following the vesting period, the shares awarded will be new shares. | | | | | | | | | | | | | | | | 2010 Plan
(2+2) | | | 2010 Plan
(4+0) | | | Total | | Date of the shareholders’ meeting | | | 05/16/2008 | | | | 05/16/2008 | | | | | | Date of the award(a) | | | 06/30/2010 | | | | 06/30/2010 | | | | | | Date of the final award | | | 07/01/2012 | | | | 07/01/2014 | | | | | | Transfer authorized as from | | | 07/01/2014 | | | | 07/01/2014 | | | | | | Number of free shares | | | | | | | | | | | | | | | | | Outstanding as of January 1, 2010 | | | | | | | | | | | | | Notified | | | 1,508,850 | | | | 1,070,650 | | | | 2,579,500 | | Cancelled | | | (125 | ) | | | (75 | ) | | | (200 | ) | Finally granted(b) | | | (75 | ) | | | — | | | | (75 | ) | Outstanding as of January 1, 2011 | | | 1,508,650 | | | | 1,070,575 | | | | 2,579,225 | | Notified | | | — | | | | — | | | | — | | Cancelled | | | (29,175 | ) | | | (54,625 | ) | | | (83,800 | ) | Finally granted(b) | | | (475 | ) | | | (425 | ) | | | (900 | ) | Outstanding as of December 31, 2011 | | | 1,479,000 | | | | 1,015,525 | | | | 2,494,525 | |
| (a) | The June 30, 2010, grant was decided by the Board of Directors on May 21, 2010. |
| (b) | Final grant following the death or disability of the beneficiary of the shares. |
SunPower has three stock incentive plans: the 1996 Stock Plan (“1996 Plan”), the Second Amended and Restated 2005 SunPower Corporation Stock Incentive Plan (“2005 Plan”) and the PowerLight Corporation Common Stock Option and Common Stock Purchase Plan (“PowerLight Plan”). The PowerLight Plan was assumed by SunPower by way of the acquisition of PowerLight in fiscal 2007. Under the terms of all three plans, SunPower may issue incentive or non-statutory stock options or stock purchase rights to directors, employees and consultants to purchase common stock. The 2005 Plan was adopted by SunPower’s Board of Directors in August 2005, and was approved by shareholders in November 2005. The 2005 Plan replaced the 1996 Plan and allows not only for the grant of options, but also for the grant of stock appreciation rights, restricted stock grants, restricted stock units and other equity rights. The 2005 Plan also allows for tax withholding obligations related to stock option exercises or restricted stock awards to be satisfied through the retention of shares otherwise released upon vesting. The PowerLight Plan was adopted by PowerLight’s Board of Directors in October 2000. In May 2008, SunPower’s stockholders approved an automatic annual increase available for grant under the 2005 Plan, beginning in fiscal 2009. The automatic annual increase is equal to the lower of three percent of the outstanding shares of all classes of SunPower’s common stock measured on the last day of the immediately preceding fiscal quarter, 6.0 million shares, or such other number of shares as determined by SunPower’s Board of Directors. As of January 1, 2012, approximately 3.3 million shares were available for grant under the 2005 Plan. No new awards are being granted under the 1996 Plan or the PowerLight Plan. Incentive stock options may be granted at no less than the fair value of the common stock on the date of grant. Non-statutory stock options and stock purchase rights may be granted at no less than 85% of the fair value of the common stock at the date of grant. The options and rights become exercisable when and as determined by SunPower’s Board of Directors, although these terms generally do not exceed ten years for stock options. Under the ROE1996 and 2005 Plans, the options typically vest over five years with a one-year cliff and monthly vesting thereafter. Under the PowerLight Plan, the options typically vest over five years with yearly cliff vesting. Under the 2005 Plan, the restricted stock grants and restricted stock units typically vest in three equal installments annually over three years. The majority of shares issued are net of the minimum statutory withholding requirements that SunPower pays on behalf of its employees. During the six months ended January 1, 2012 SunPower withheld 221,262 shares to satisfy the employees’ tax obligations. SunPower pays such withholding requirements in cash to the appropriate taxing authorities. Shares withheld are treated as common stock repurchases for accounting and disclosure purposes and reduce the number of shares outstanding upon vesting. The following table summarizes SunPower’s stock option activities: | | | | | | | | | | | | | | | | | | | | Outstanding Stock Options | | | | Shares
(in thousands) | | | Weighted-Average
Exercise Price
Per Share
(in dollars) | | | Weighted-Average
Remaining
Contractual Term
(in years) | | | Aggregate
Intrinsic Value
(in thousands
dollars) | | Outstanding as of July 3, 2011 | | | 519 | | | | 25.39 | | | | | | | | | | Exercised | | | (29 | ) | | | 3.93 | | | | | | | | | | Forfeited | | | (6 | ) | | | 31.29 | | | | | | | | | | | | | | | | | | | | | | | Outstanding as of January 1, 2012 | | | 484 | | | | 26.62 | | | | 4.71 | | | | 480 | | | | | | | | | | | | | | | Exercisable as of January 1, 2012 | | | 441 | | | | 24.52 | | | | 4.53 | | | | 480 | | Expected to vest after January 1, 2012 | | | 40 | | | | 48.08 | | | | 6.64 | | | | — | |
The intrinsic value of options exercised in the six months ended January 1, 2012 was between 10%$0.3 million. There were no stock options granted in the six months ended January 1, 2012. The aggregate intrinsic value in the preceding table represents the total pre-tax intrinsic value, based on SunPower’s closing stock price of $6.23 at December 30, 2011, which would have been received by the option holders had all option holders exercised their options as of that date. The total number of in-the-money options exercisable was 0.1 million shares as of January 1, 2012. The following table summarizes SunPower’s non-vested stock options and 20%.restricted stock activities thereafter: E. SHARE-BASED PAYMENT EXPENSE
| | | | | | | | | | | | | | | | | | | | Stock Options | | | Restricted Stock Awards and Units | | | | Shares
(in thousands) | | | Weighted-Average
Exercise Price
Per Share
(in dollars) | | | Shares
(in thousands) | | | Weighted-Average
Grant Date Fair
Value Per Share
(in dollars)(1) | | Outstanding as of July 3, 2011 | | | 67 | | | | 41.34 | | | | 7,198 | | | | 16.03 | | Granted | | | — | | | | — | | | | 2,336 | | | | 6.91 | | Vested(2) | | | (19 | ) | | | 28.73 | | | | (691 | ) | | | 18.96 | | Forfeited | | | (5 | ) | | | 31.29 | | | | (1,473 | ) | | | 14.10 | | Outstanding as of December 31, 2011 | | | 43 | | | | 48.33 | | | | 7,370 | | | | 13.25 | |
| (1) | The Company estimates the fair value of the restricted stock unit awards as the stock price on the grant date. |
| (2) | Restricted stock awards and units vested include shares withheld on behalf of employees to satisfy the minimum statutory tax withholding requirements. |
| G. | | SHARE-BASED PAYMENT EXPENSE |
Share-based payment expense before tax for the year 2008 amounted2011 amounts to 154 M€178 million and can beis broken down as follows: 61 M€27 million for TOTAL share subscription plans;
105 M€134 million for TOTAL restricted shares plans; and
(12) M€17 million for the adjustment to the expense booked in 2007 related to TOTAL capital increase reserved for employees (see Note 17 to the Consolidated Financial Statements).SunPower plans.
Share-based payment expense before tax for the year 20072010 amounted to 196 M€140 million and can bewas broken down as follows: 65 M€31 million for TOTAL share subscription plans; and
109 M€109 million for TOTAL restricted shares plans;
22 M€ for TOTAL capital increase reserved for employees (see Note 17 to the Consolidated Financial Statements).plans.
Share-based payment expense before tax for the year 20062009 amounted to 157 M€106 million and can bewas broken down as follows: 74 M€38 million for TOTAL share subscription plans; and
83 M€68 million for TOTAL restricted shares plans.
The fair value of the options granted in 2008, 20072011, 2010 and 20062009 has been measured according to the Black-Scholes method and based on the following assumptions: | | For the year ended December 31, | | 2008 | | 2007 | | 2006 | | 2011 | | | 2010 | | | 2009 | | Risk free interest rate (%)(a) | | 4.3 | | 4.9 | | 4.1 | | | 2.0 | | | | 2.1 | | | | 2.9 | | Expected dividends (%)(b) | | 8.4 | | 3.9 | | 4.2 | | | 5.6 | | | | 5.9 | | | | 4.8 | | Expected volatility (%)(c) | | 32.7 | | 25.3 | | 29.3 | | | 27.5 | | | | 25.0 | | | | 31.0 | | Vesting period (years) | | 2 | | 2 | | 2 | | | 2 | | | | 2 | | | | 2 | | Exercise period (years) | | 8 | | 8 | | 8 | | Exercice period (years) | | | | 8 | | | | 8 | | | | 8 | | Fair value of the granted options
(€ per option) | | 5.0 | | 13.9 | | 11.3 | | | 4.4 | | | | 5.8 | | | | 8.4 | |
| (a) | 6-year zeroZero coupon Euro swap rate.rate at 6 years. |
| (b) | The expected dividends are based on the price of TOTAL share derivatives traded on the markets. |
| (c) | The expected volatility is based on the implied volatility of TOTAL share options and of share indices options traded on the markets. |
At the shareholders’ meeting held on May 21, 2010, the shareholders delegated to the Board of Directors the authority to increase the share capital of the Company in one or more transactions and within a maximum period of 26 months from the date of the meeting, by an amount not exceeding 1.5% of the share capital outstanding on the date of the meeting of the Board of Directors at which a decision to proceed with an issuance is made reserving subscriptions for such issuance to the Group employees participating in a company savings plan. It is being specified that the amount of any such capital increase reserved for Group employees was counted against the aggregate maximum nominal amount of share capital increases authorized by the shareholders’ meeting held on May 21, 2010 for issuing new ordinary shares or other securities granting immediate or future access to the Company’s share capital with preferential subscription rights (€2.5 billion in nominal value). Pursuant to this delegation of authorization, the Board of Directors, during its October 28, 2010 meeting, implemented a capital increase reserved for employees within the limit of 12 million shares, with dividend rights as of the January 1, 2010 and delegated all power to the Chairman and Chief Executive Officer to determine the opening and closing of subscription period and the subscription price. On March 14, 2011, the Chairman and Chief Executive Officer decided that the subscription period would be set from March 16, 2011 to April 1, 2011 and acknowledged that the subscription price per ordinary share would be set at€34.80. During this capital increase, 8,902,717 TOTAL shares were subscribed and created on April 28, 2011. The cost of capital increases reserved for employees is reduced to take into account the nontransferabilitynon-transferability of the shares that could be subscribed by the employees over a period of five years. The valuation method of nontransferabilitynon-transferability of the shares is based on a strategy cost in two steps consisting, first, in a five years forward sale of the nontransferablenon-transferable shares, and second, in purchasing the same number of shares in cash with a loan financing reimbursablein fine “in fine”. During the year 2007,2011, the main assumptions used for the valuation of the cost of capital increase reserved for employees arewere the following: | | | | | | For the year ended December 31, | | 20072011 | | Date of the Board of Directors meeting that decided the issue | | November 6, 2007 | October 28, 2010 | | Subscription price (€) | | 44.4 | 34.80 | | Share price at the reference date of the Board meeting (€) | | 54.6 | Number of shares (in millions)(a)
| | 10.6 | 41.60 | | Number of shares (in millions) | | | 8.90 | | Risk free interest rate (%)(b) | | 4.1 | 2.82 | | Employees loan financing rate (%)(c) | | 7.5 | 7.23 | | Non transferability cost (% of the reference’s share price at the date of the Board meeting)price) | | 14.9 | Expense amount (€ per share)
17.6 | | 2.1 |
| (a) | The estimated expense as of December 31, 2007 was based on aShare price at the date which the Chairman and Chief Executive Officer decided the subscription of the capital increase reserved for employees for 10.6 million shares. The subscription was opened from March 10 to 28, 2008 included, leading to the creation of 4,870,386 TOTAL shares in 2008 (see Note 17 to the Consolidated Financial Statements).period. |
| (b) | The risk-free interestZero coupon Euro swap rate is based on the French Treasury bonds rate for the appropriate maturity.at 5 years. |
| (c) | The employees loan financing rate is based on a 5 year5-year consumer’s credit rate. |
Due to the fact that the non-transferability cost is higher than the discount, no cost has been accounted to the fiscal year 2011. 26)PAYROLL AND STAFF | For the year ended
December 31,(M€) | | 2008 | | 2007 | | 2006 | | Personnel expenses(a) | | | | | | | | For the year ended
December 31, | | | 2011 | | | 2010 | | | 2009 | | Personnel expenses (M€) | | | | | | | | Wages and salaries (including social charges) | | 6,014 | | 6,058 | | 5,828 | | | 6,579 | | | | 6,246 | | | | 6,177 | | Group employees(a) | | | | | | | | | | | | | France | | | | | | | | | | | | | • Management | | 10,688 | | 10,517 | | 10,313 | | | 11,123 | | | | 10,852 | | | | 10,906 | | • Other | | 26,413 | | 26,779 | | 27,518 | | | 23,914 | | | | 24,317 | | | | 25,501 | | International | | | | | | | | | | | | | • Management | | 14,709 | | 14,225 | | 13,263 | | | 15,713 | | | | 15,146 | | | | 15,243 | | • Other | | 45,149 | | 44,921 | | 43,976 | | | 45,354 | | | | 42,540 | | | | 44,737 | | Total | | 96,959 | | 96,442 | | 95,070 | | | 96,104 | | | | 92,855 | | | | 96,387 | |
The number of employees includes only employees of fully consolidated subsidiaries. The increase in the number of employees between December 31, 2011 and December 31, 2010 is mainly explained by the acquisition of SunPower, partially compensated by the sale of the photocure and coatings resins businesses (see Note 3 to the Consolidated Financial Statements). 27)STATEMENT OF CASH FLOWS (a)A) | | Number of employees and personnel expenses of fully consolidated subsidiaries.CASH FLOW FROM OPERATING ACTIVITIES |
27) STATEMENT OF CASH FLOW
A) Cash flow from operating activities
The following table gives additional information on cash paid or received in the cash flow from operating activities: | For the year ended
December 31,(M€) | | 2008 | | 2007 | | 2006 | | | 2011 | | 2010 | | 2009 | | Interests paid | | (958 | ) | | (1,680 | ) | | (1,648 | ) | | | (679 | ) | | | (470 | ) | | | (678 | ) | Interests received | | 505 | | | 1,277 | | | 1,261 | | | | 277 | | | | 132 | | | | 148 | | Income tax paid | | (10,631 | ) | | (9,687 | ) | | (10,439 | ) | | | (12,061 | ) | | | (8,848 | ) | | | (7,027 | ) | Dividends received | | 1,590 | | | 1,109 | | | 899 | | | | 2,133 | | | | 1,722 | | | | 1,456 | |
| (a) | These amounts include taxes paid in kind under production-sharing contracts in the exploration-production. |
Changes in working capital are detailed as follows: | For the year ended
December 31,(M€) | | 2008 | | 2007 | | 2006 | | | 2011 | | 2010 | | 2009 | | Inventories | | 4,020 | | | (2,706 | ) | | (500 | ) | | | (1,845 | ) | | | (1,896 | ) | | | (4,217 | ) | Accounts receivable | | 3,222 | | | (2,963 | ) | | 494 | | | | (1,287 | ) | | | (2,712 | ) | | | (344 | ) | Other current assets | | (982 | ) | | (1,341 | ) | | (1,425 | ) | | | (2,409 | ) | | | 911 | | | | 1,505 | | Accounts payable | | (3,056 | ) | | 4,508 | | | 141 | | | | 2,646 | | | | 2,482 | | | | 571 | | Other creditors and accrued liabilities | | (633 | ) | | 1,026 | | | 849 | | | | 1,156 | | | | 719 | | | | (831 | ) | Net amount | | 2,571 | | | (1,476 | ) | | (441 | ) | | | (1,739 | ) | | | (496 | ) | | | (3,316 | ) |
B) Cash flow used in financing activities
| B) | | Cash flow used in financing activities |
Changes in non-current financial debt are detailed in the following table under a net value due to the high number of multiple drawings: | For the year ended December 31,
(M€) | | 2008 | | 2007 | | 2006 | | | 2011 | | 2010 | | 2009 | | Issuance of non-current debt | | 5,513 | | | 3,313 | | | 3,857 | | | | 4,234 | | | | 3,995 | | | | 6,309 | | Repayment of non-current debt | | (2,504 | ) | | (93 | ) | | (135 | ) | | | (165 | ) | | | (206 | ) | | | (787 | ) | Net amount | | 3,009 | | | 3,220 | | | 3,722 | | | | 4,069 | | | | 3,789 | | | | 5,522 | |
C) Cash and cash equivalents
| C) | | Cash and cash equivalents |
Cash and cash equivalents are detailed as follows: | For the year ended December 31,
(M€) | | 2008 | | 2007 | | 2006 | | 2011 | | | 2010 | | | 2009 | | Cash | | 1,836 | | 1,930 | | 1,823 | | | 4,715 | | | | 4,679 | | | | 2,448 | | Cash equivalents | | 10,485 | | 4,058 | | 670 | | | 9,310 | | | | 9,810 | | | | 9,214 | | Total | | 12,321 | | 5,988 | | 2,493 | | | 14,025 | | | | 14,489 | | | | 11,662 | |
Cash equivalents are mainly composed of deposits less than three months deposited in government institutions or deposit banks selected in accordance with strict criteria. 28)FINANCIAL ASSETS AND LIABILITIES ANALYSIS PER INSTRUMENTS CLASS AND STRATEGY The financial assets and liabilities disclosed on the face ofin the balance sheet are detailed as follows: | As of December 31, 2008 (M€) Assets/(Liabilities) | | Financial instruments related to financing and trading activities | | Other financial
instruments | | Total | | Fair value | | | | | | Amortized
cost | | Fair value | | | | | | | | | | | | | | | | | | | | | | | | | | | | Available
for sale | | Held for
trading | | Financial
debt(a) | | Hedging of
financial debt | | Net investment
hedge and other | | | | Financial instruments related to financing and trading activities | | Other financial
instruments | | Total | | Fair
value | | | | | | Amortized
cost | | Fair value | | | | | | | | | | As of December 31, 2011 (M€) Assets / (Liabilities) | | | | | Available
for sale(a) | | Held for
trading | | Financial
debt(b) | | Hedging of
financial debt | | Cash flow
hedge | | Net investment
hedge and other | | | | | | | | Equity affiliates: loans | | 2,005 | | | | | | | | | | | | | | | 2,005 | | | 2,005 | | | | 2,246 | | | | | | | | | | | | | | | | | | 2,246 | | | | 2,246 | | Other investments | | | | 1,165 | | | | | | | | | | | | 1,165 | | | 1,165 | | | | | | 3,674 | | | | | | | | | | | | | | | | 3,674 | | | | 3,674 | | Hedging instruments of non-current financial debt | | | | | | | | | | 892 | | | | | | | 892 | | | 892 | | | | | | | | | | | | 1,971 | | | | 5 | | | | | | | | 1,976 | | | | 1,976 | | Other non-current assets | | 1,403 | | | | | | | | | | | | | | | 1,403 | | | 1,403 | | | | 2,055 | | | | | | | | | | | | | | | | | | 2,055 | | | | 2,055 | | Accounts receivable, net | | | | | | — | | | | | | | | | 15,287 | | | 15,287 | | | 15,287 | | | | | | | | | | | | | | | | | | 20,049 | | | | 20,049 | | | | 20,049 | | Other operating receivables | | | | | | 1,664 | | | | | | | | | 4,544 | | | 6,208 | | | 6,208 | | | | | | | | 1,074 | | | | | | | | | | | | 6,393 | | | | 7,467 | | | | 7,467 | | Current financial assets | | 1 | | | | | 86 | | | | | 100 | | | — | | | | 187 | | | 187 | | | | 146 | | | | | | 159 | | | | | | 383 | | | | 12 | | | | — | | | | | | 700 | | | | 700 | | Cash and cash equivalents | | | | | | 12,321 | | | 12,321 | | | 12,321 | | | | 14,025 | | | | 14,025 | | | | 14,025 | | Total financial assets | | 3,409 | | | 1,165 | | 1,750 | | | 992 | | | — | | 32,152 | | | 39,468 | | | 39,468 | | | | 4,447 | | | | 3,674 | | | | 1,233 | | | | — | | | | 2,354 | | | | 17 | | | | — | | | | 40,467 | | | | 52,192 | | | | 52,192 | | Total non-financial assets | | | | | | | | | | | | | | | | 78,842 | | | | | | 111,857 | | | Total assets | | | | | | | | | | | | | | | | 118,310 | | | | | | 164,049 | | | | Non-current financial debt | | (414 | ) | | | | | | (15,337 | ) | | (440 | ) | | | | | | (16,191 | ) | | (16,191 | ) | | | (4,858 | ) | | | | | | | (17,551 | ) | | | (97 | ) | | | (49 | ) | | | | | (2 | ) | | | (22,557 | ) | | | (23,247 | ) | Accounts payable | | | | | | — | | | | | | | | | (14,815 | ) | | (14,815 | ) | | (14,815 | ) | | | | | | | | | | | | | | | | | (22,086 | ) | | | (22,086 | ) | | | (22,086 | ) | Other operating liabilities | | | | | | (1,033 | ) | | | | | | | | (3,264 | ) | | (4,297 | ) | | (4,297 | ) | | | | | | | (606 | ) | | | | | | | | | | | (4,835 | ) | | | (5,441 | ) | | | (5,441 | ) | Current borrowings | | (5,721 | ) | | | | | | (2,001 | ) | | | | | | | | (7,722 | ) | | (7,722 | ) | | | (6,158 | ) | | | | | | | (3,517 | ) | | | | | | | | | | | (9,675 | ) | | | (9,675 | ) | Other current financial liabilities | | | | (146 | ) | | (12 | ) | | | | (158 | ) | | (158 | ) | | | (87 | ) | | | (40 | ) | | | (14 | ) | | | (26 | ) | | | (167 | ) | | | (167 | ) | Total financial liabilities | | (6,135 | ) | | | (1,179 | ) | | (17,338 | ) | | (452 | ) | | | (18,079 | ) | | (43,183 | ) | | (43,183 | ) | | | (11,016 | ) | | | — | | | | (693 | ) | | | (21,068 | ) | | | (137 | ) | | | (63 | ) | | | (26 | ) | | | (26,923 | ) | | | (59,926 | ) | | | (60,616 | ) | Total non-financial liabilities | | | | | | | | | | | | | | | | (75,127 | ) | | | | | (104,123 | ) | | Total liabilities | | | | | | | | | | | | | | | | (118,310 | ) | | | | | (164,049 | ) | |
| (a) | Financial assets available for sale are measured at their fair value except for unlisted securities (see Note 1 paragraph M(ii) and Note 13 to the Consolidated Financial Statements). |
| (b) | The financial debt is adjusted to the hedged risks value (currency and interest rate) as part of hedge accounting (see Note 1 paragraph MiiiM(iii) to the Consolidated Financial Statements). |
| As of December 31, 2007 (M€) Assets/(Liabilities) | | Financial instruments related to financing and trading activities | | Other financial
instruments | | Total | | Fair value | | | | | | Amortized
cost | | Fair value | | | | | | | | | | | | | | | | | | | | | | | | | | | | Available
for sale | | Held for
trading | | Financial
debt(a) | | Hedging of
financial debt | | Net investment
hedge and other | | | | Financial instruments related to financing and trading activities | | Other financial
instruments | | Total | | Fair
value | | | | | | Amortized
cost | | | | Fair value | | | | | | | | | | | | | | As of December 31, 2010 (M€) Assets / (Liabilities) | | | | | Available
for sale(a) | | Held for
trading | | Financial
debt(b) | | Hedging of
financial debt | | Cash flow
hedge | | Net investment
hedge and other | | | | | | | | Equity affiliates: loans | | 2,575 | | | | | | | | | | | | | | | 2,575 | | | 2,575 | | | | 2,383 | | | | | | | | | | | | | | | | | | 2,383 | | | | 2,383 | | Other investments | | | | 1,291 | | | | | | | | | | | | 1,291 | | | 1,291 | | | | | | 4,590 | | | | | | | | | | | | | | | | 4,590 | | | | 4,590 | | Hedging instruments of non-current financial debt | | | | | | | | | | 460 | | | | | | | 460 | | | 460 | | | | | | | | | | | | 1,814 | | | | 56 | | | | | | | | 1,870 | | | | 1,870 | | Other non-current assets | | 851 | | | | | | | | | | | | | | | 851 | | | 851 | | | | 1,596 | | | | | | | | | | | | | | | | | | 1,596 | | | | 1,596 | | Accounts receivable, net | | | | | | 464 | | | | | | | | | 18,665 | | | 19,129 | | | 19,129 | | | | | | | | | | | | | | | | | | 18,159 | | | | 18,159 | | | | 18,159 | | Other operating receivables | | | | | | 519 | | | | | | | | | 3,911 | | | 4,430 | | | 4,430 | | | | | | | | 499 | | | | | | | | | | | | 3,908 | | | | 4,407 | | | | 4,407 | | Current financial assets | | 850 | | | | | 12 | | | | | 388 | | | 14 | | | | 1,264 | | | 1,264 | | | | 869 | | | | | | 38 | | | | | | 292 | | | | | | 6 | | | | | | 1,205 | | | | 1,205 | | Cash and cash equivalents | | | | | | 5,988 | | | 5,988 | | | 5,988 | | | | 14,489 | | | | 14,489 | | | | 14,489 | | Total financial assets | | 4,276 | | | 1,291 | | 995 | | | 848 | | | 14 | | 28,564 | | | 35,988 | | | 35,988 | | | | 4,848 | | | | 4,590 | | | | 537 | | | | — | | | | 2,106 | | | | 56 | | | | 6 | | | | 36,556 | | | | 48,699 | | | | 48,699 | | Total non-financial assets | | | | | | | | | | | | | | | | 77,553 | | | | | | 95,019 | | | Total assets | | | | | | | | | | | | | | | | 113,541 | | | | | | 143,718 | | | | Non-current financial debt | | (532 | ) | | | | | | (13,975 | ) | | (369 | ) | | | | | | (14,876 | ) | | (14,876 | ) | | | (3,186 | ) | | | | | | | (17,419 | ) | | | (178 | ) | | | | | | | | | (20,783 | ) | | | (21,172 | ) | Accounts payable | | | | | | (243 | ) | | | | | | | | (17,940 | ) | | (18,183 | ) | | (18,183 | ) | | | | | | | | | | | | | | | | | (18,450 | ) | | | (18,450 | ) | | | (18,450 | ) | Other operating liabilities | | | | | | (490 | ) | | | | | | | | (3,410 | ) | | (3,900 | ) | | (3,900 | ) | | | | | | | (559 | ) | | | | | | | | | | | (3,015 | ) | | | (3,574 | ) | | | (3,574 | ) | Current borrowings | | (2,655 | ) | | | | | | (1,958 | ) | | | | | | | | (4,613 | ) | | (4,613 | ) | | | (5,916 | ) | | | | | | | (3,737 | ) | | | | | | | | | | | (9,653 | ) | | | (9,653 | ) | Other current financial liabilities | | | | (59 | ) | | (1 | ) | | | | (60 | ) | | (60 | ) | | | (147 | ) | | | (12 | ) | | | — | | | | (159 | ) | | | (159 | ) | Total financial liabilities | | (3,187 | ) | | | (792 | ) | | (15,933 | ) | | (370 | ) | | | (21,350 | ) | | (41,632 | ) | | (41,632 | ) | | | (9,102 | ) | | | (706 | ) | | | (21,156 | ) | | | (190 | ) | | | — | | | | — | | | | (21,465 | ) | | | (52,619 | ) | | | (53,008 | ) | Total non-financial liabilities | | | | | | | | | | | | | | | | (71,909 | ) | | | | | (91,099 | ) | | Total liabilities | | | | | | | | | | | | | | | | (113,541 | ) | | | | | (143,718 | ) | |
| (a) | Financial assets available for sale are measured at their fair value except for unlisted securities (see Note 1 paragraph M(ii) and Note 13 to the Consolidated Financial Statements). |
| (b) | The financial debt is adjusted to the hedged risks value (currency and interest rate) as part of hedge accounting (see Note 1 paragraph MiiiM(iii) to the Consolidated Financial Statements). |
| As of December 31, 2006 (M€) Assets/(Liabilities) | | Financial instruments related to financing and trading activities | | Other financial
instruments | | Total | | Fair value | | | | | | Amortized
cost | | Fair value | | | | | | | | | | | | | | | | | | | | | | | | | | | | Available
for sale | | Held for
trading | | Financial
debt(a) | | Hedging of
financial debt | | Net investment
hedge and other | | | | Financial instruments related to financing and trading activities | | Other financial
instruments | | Total | | Fair
value | | | | | | Amortized
cost | | | | Fair value | | | | | | | | | | | | | | As of December 31, 2009 (M€) Assets / (Liabilities) | | | | | Available
for sale(a) | | Held for
trading | | Financial
debt(b) | | Hedging of
financial debt | | Cash flow
hedge | | Net investment
hedge and other | | | | | | | | Equity affiliates: loans | | 1,533 | | | | | | | | | | | | | | | 1,533 | | | 1,533 | | | | 2,367 | | | | | | | | | | | | | | | | | | 2,367 | | | | 2,367 | | Other investments | | | | 1,250 | | | | | | | | | | | | 1,250 | | | 1,250 | | | | | | 1,162 | | | | | | | | | | | | | | | | 1,162 | | | | 1,162 | | Hedging instruments of non-current financial debt | | | | | | | | | | 486 | | | | | | | 486 | | | 486 | | | | | | | | | | | | 889 | | | | 136 | | | | | | | | 1,025 | | | | 1,025 | | Other non-current assets | | 1,025 | | | | | | | | | | | | | | | 1,025 | | | 1,025 | | | | 1,284 | | | | | | | | | | | | | | | | | | 1,284 | | | | 1,284 | | Accounts receivable, net | | | | | | 341 | | | | | | | | | 17,052 | | | 17,393 | | | 17,393 | | | | | | | | | | | | | | | | | | 15,719 | | | | 15,719 | | | | 15,719 | | Other operating receivables | | | | | | 311 | | | | | | | | | 3,956 | | | 4,267 | | | 4,267 | | | | | | | | 1,029 | | | | | | | | | | | | 4,116 | | | | 5,145 | | | | 5,145 | | Current financial assets | | 3,496 | | | | | 71 | | | | | 341 | | | | | | | 3,908 | | | 3,908 | | | | 55 | | | | | | 53 | | | | | | 197 | | | | | | 6 | | | | | | 311 | | | | 311 | | Cash and cash equivalents | | | | | | 2,493 | | | 2,493 | | | 2,493 | | | | 11,662 | | | | 11,662 | | | | 11,662 | | Total financial assets | | 6,054 | | | 1,250 | | 723 | | | 827 | | | | 23,501 | | | 32,355 | | | 32,355 | | | | 3,706 | | | | 1,162 | | | | 1,082 | | | | — | | | | 1,086 | | | | 136 | | | | 6 | | | | 31,497 | | | | 38,675 | | | | 38,675 | | Total non-financial assets | | | | | | | | | | | | | | | | 72,868 | | | | | | 89,078 | | | Total assets | | | | | | | | | | | | | | | | 105,223 | | | | | | 127,753 | | | | Non-current financial debt | | (581 | ) | | | | | | (13,400 | ) | | (193 | ) | | | | | | (14,174 | ) | | (14,171 | ) | | | (2,089 | ) | | | | | | | (17,107 | ) | | | (241 | ) | | | | | | | | | (19,437 | ) | | | (19,905 | ) | Accounts payable | | | | | | (426 | ) | | | | | | | | (14,654 | ) | | (15,080 | ) | | (15,080 | ) | | | | | | | | | | | | | | | | | (15,383 | ) | | | (15,383 | ) | | | (15,383 | ) | Other operating liabilities | | | | | | (203 | ) | | | | | | | | (4,060 | ) | | (4,263 | ) | | (4,263 | ) | | | | | | | (923 | ) | | | | | | | | | | | (3,783 | ) | | | (4,706 | ) | | | (4,706 | ) | Current borrowings | | (3,538 | ) | | | | | | (2,320 | ) | | | | | | | | (5,858 | ) | | (5,858 | ) | | | (4,849 | ) | | | | | | | (2,145 | ) | | | | | | | | | | | (6,994 | ) | | | (6,994 | ) | Other current financial liabilities | | | | (75 | ) | | | | (75 | ) | | (75 | ) | | | (25 | ) | | | (97 | ) | | | (1 | ) | | | (123 | ) | | | (123 | ) | Total financial liabilities | | (4,119 | ) | | | (704 | ) | | (15,720 | ) | | (193 | ) | | | (18,714 | ) | | (39,450 | ) | | (39,447 | ) | | | (6,938 | ) | | | (948 | ) | | | (19,252 | ) | | | (338 | ) | | | — | | | | (1 | ) | | | (19,166 | ) | | | (46,643 | ) | | | (47,111 | ) | Total non-financial liabilities | | | | | | | | | | | | | | | | (65,773 | ) | | | | | (81,110 | ) | | Total liabilities | | | | | | | | | | | | | | | | (105,223 | ) | | | | | (127,753 | ) | |
| (a) | Financial assets available for sale are measured at their fair value except for unlisted securities (see Note 1 paragraph M(ii) and Note 13 to the Consolidated Financial Statements). |
| (b) | The financial debt is adjusted to the hedged risks value (currency and interest rate) as part of hedge accounting (see Note 1 paragraph MiiiM(iii) to the Consolidated Financial Statements). |
29)FAIR VALUE OF FINANCIAL INSTRUMENTS (EXCLUDING COMMODITY CONTRACTS) A) IMPACT ON THE STATEMENT OF INCOME PER NATURE OF FINANCIAL INSTRUMENTS
| A) | | IMPACT ON THE STATEMENT OF INCOME PER NATURE OF FINANCIAL INSTRUMENTS |
Operating assets and liabilities The impact on the statement of income is detailed as follows: | For the year ended December 31, (M€) | | 2008 | | 2007 | | 2006 | | | 2011 | | 2010 | | 2009 | | Assets available for sale (investments): | | | | | | | | | | | | | — dividend income on non-consolidated companies | | 238 | | | 218 | | | 237 | | | — dividend income on non-consolidated subsidiaries | | | | 330 | | | | 255 | | | | 210 | | — gains (losses) on disposal of assets | | 15 | | | 170 | | | 428 | | | | 103 | | | | 60 | | | | 6 | | — others | | (15 | ) | | (63 | ) | | (46 | ) | | — other | | | | (29 | ) | | | (17 | ) | | | (18 | ) | Loans and receivables | | 100 | | | (2 | ) | | 88 | | | | (34 | ) | | | 90 | | | | 41 | | Impact on net operating income | | 338 | | | 323 | | | 707 | | | | 370 | | | | 388 | | | | 239 | |
The impact in the statement of income mainly includes: Dividends and gains or losses on disposal of other investments classified as “Assets available for sale”“Other investments”; Financial gains and depreciation on loans related to equity affiliates, non-consolidated companies and on receivables reported in “Loans and receivables”. Assets and liabilities from financing activities The impact on the statement of income of financing assets and liabilities is detailed as follows: | | | | | | | | | | For the year ended December 31, (M€) | | 2008 | | | 2007 | | | 2006 | | Loans and receivables | | 547 | | | 1,135 | | | 976 | | Financing liabilities and associated hedging instruments | | (996 | ) | | (1,721 | ) | | (1,597 | ) | Fair value hedge (ineffective portion) | | (4 | ) | | (26 | ) | | 25 | | Assets and liabilities held for trading | | (74 | ) | | 73 | | | 232 | | Impact on the cost of net debt | | (527 | ) | | (539 | ) | | (364 | ) |
| | | | | | | | | | | | | For the year ended December 31,
(M€) | | 2011 | | | 2010 | | | 2009 | | Loans and receivables | | | 271 | | | | 133 | | | | 158 | | Financing liabilities and associated hedging instruments | | | (730 | ) | | | (469 | ) | | | (563 | ) | Fair value hedge (ineffective portion) | | | 17 | | | | 4 | | | | 33 | | Assets and liabilities held for trading | | | 2 | | | | (2 | ) | | | (26 | ) | Impact on the cost of net debt | | | (440 | ) | | | (334 | ) | | | (398 | ) |
The impact on the statement of income mainly includes: Financial income on cash, cash equivalents, and current financial assets (notably current deposits beyond three months) classified as “Loans and receivables”; | | beyond three months) classified as “Loans and receivables”; |
Financial expense of long term subsidiaries financing, associated hedging instruments (excluding ineffective portion of the hedge detailed below) and financial expense of short term financing classified as “Financing liabilities and associated hedging instruments”; Ineffective portion of bond hedging; and Financial income, financial expense and fair value of derivative instruments used for cash management purposes classified as “Assets and liabilities held for trading”. Financial derivative instruments used for cash management purposes (interest rate and foreign exchange) are considered to be held for trading. Based on practical documentation issues, the Group did not elect to set up hedge accounting for such instruments. The impact on income of the derivatives is offset by the impact of loans and current liabilities they are related to. Therefore these transactions taken as a whole do not have a significant impact on the Consolidated Financial Statements. B) IMPACT OF THE HEDGING STRATEGIES
| B) | | IMPACT OF THE HEDGING STRATEGIES |
Fair value hedge The impact on the statement of income of the bond hedging instruments which is recorded in the item “Financial interest on debt” in the Consolidated Statement of Income is detailed as follows: | For the year ended December 31, (M€) | | 2008 | | 2007 | | 2006 | | | 2011 | | 2010 | | 2009 | | Revaluation at market value of bonds | | (66 | ) | | 137 | | | (221 | ) | | | (301 | ) | | | (1,164 | ) | | | (183 | ) | Swap hedging of bonds | | 62 | | | (163 | ) | | 246 | | | | 318 | | | | 1,168 | | | | 216 | | Ineffective portion of the fair value hedge | | (4 | ) | | (26 | ) | | 25 | | | | 17 | | | | 4 | | | | 33 | |
The ineffective portion is not representative of the Group’s performance considering the Group’s objective to hold swaps to maturity. The current portion of the swaps valuation is not subject to active management. Net investment hedge These instruments are recorded directly in shareholders’ equity under “Currency translation adjustments”. The variations of the period are detailed in the table below: | | | | | | | | | | | | | For the year ended December 31,(M€) | | As of January 1, | | | Variations | | | Disposals | | As of December 31, | | 2008 | | 29 | | | 95 | | | — | | 124 | | 2007 | | (188 | ) | | 217 | | | — | | 29 | | 2006 | | (183 | ) | | (5 | ) | | — | | (188 | ) |
| | | | | | | | | | | | | | | | | | For the year ended December 31, (M€) | | As of January 1, | | | Variations | | | Disposals | | | As of December 31, | | 2011 | | | (243 | ) | | | 139 | | | | — | | | | (104 | ) | 2010 | | | 25 | | | | (268 | ) | | | — | | | | (243 | ) | 2009 | | | 124 | | | | (99 | ) | | | — | | | | 25 | |
TheAs of December 31, 2011, the fair value of the open instruments is equalamounts to zero as of December 31, 2008€(26) million compared to 14 M€6 million in 2007.2010 and€
There was no open instrument as of December 31, 2006.
5 million in 2009. Cash flow hedge TheseThe impact on the statement of income and on equity of the hedging instruments qualified as cash flow hedges are not significant considering the Group’s policy not to hedge future cash flowsis detailed as follows:
| | | | | | | | | | | | | | For the year ended December 31, (M€) | | 2011 | | | 2010 | | | 2009 | | Profit (Loss) recorded in equity during the period | | | (84 | ) | | | (80 | ) | | | 128 | | Recycled amount from equity to the income statement during the period | | | (47 | ) | | | (115 | ) | | | 221 | |
As of December 31, 2008, 20072011, 2010 and 2006.2009, the ineffective portion of these financial instruments is equal to zero. C) MATURITY OF DERIVATIVE INSTRUMENTS
| C) | | MATURITY OF DERIVATIVE INSTRUMENTS |
The maturity of the notional amounts of derivativesderivative instruments, excluding the commodity contracts, is detailed in the following table: | | | | | | | | | | | | | | | | | | | As of December 31, 2008 (M€) | | | | | Notional value(a) | | Assets/(Liabilities) | | Fair value | | | Total | | 2009 | | 2010 | | 2011 | | 2012 | | 2013 | | 2014
and
after | Fair value hedge | | | | | | | | | | | | | | | | | | Issue swaps and swaps hedging bonds
(liabilities) | | 440 | | | 9,309 | | | | | | | | | | | | | Issue swaps and swaps hedging bonds
(assets) | | (892 | ) | | 4,195 | | | | | | | | | | | | | Total issue swaps and swaps hedging bonds
(assets and liabilities) | | (452 | ) | | 13,504 | | | | 2,048 | | 3,373 | | 3,233 | | 3,032 | | 1,818 | Currency swaps hedging of bank and other loans | | | | | | | | | | | | | | | | | | Issue swaps and swaps hedging bonds
(current portion) (liabilities) | | 100 | | | 1,871 | | | | | | | | | | | | | Issue swaps and swaps hedging bonds
(current portion) (assets) | | (12 | ) | | 92 | | | | | | | | | | | | | Total issue swaps and swaps hedging bonds
(current portion) (assets and liabilities) | | 88 | | | 1,963 | | 1,963 | | | | | | | | | | | Net investment hedge | | | | | | | | | | | | | | | | | | Currency swaps and forward exchange contracts
(assets) | | — | | | 1,347 | | 1,347 | | | | | | | | | | | Cash flow hedge | | | | | | | | | | | | | | | | | | Other interest rate swaps (assets) | | — | | | 2,853 | | | | | | | | | | | | | Other interest rate swaps (liabilities) | | (4 | ) | | 5,712 | | | | | | | | | | | | | Other interest rate swaps (assets and liabilities) | | (4 | ) | | 8,565 | | 8,559 | | 4 | | | | | | | | 2 | Currency swaps and forward exchange contracts (assets) | | 86 | | | 5,458 | | | | | | | | | | | | | Currency swaps and forward exchange contracts (liabilities) | | (142 | ) | | 2,167 | | | | | | | | | | | | | Currency swaps and forward exchange contracts (assets and liabilities) | | (56 | ) | | 7,625 | | 6,595 | | 483 | | 114 | | 67 | | 76 | | 290 |
| | | | | | | | | | | | | | | | | | | | | | | | | | | | | | | | | As of December 31, 2011 (M€) Assets / (Liabilities) | | Fair
value | | | Notional value(a) | | | | | Total | | | 2012 | | | 2013 | | | 2014 | | | 2015 | | | 2016 | | | 2017
and
after | | Fair value hedge | | | | | | | | | | | | | | | | | | | | | | | | | | | | | | | | | Swaps hedging fixed-rates bonds (liabilities) | | | (97 | ) | | | 1,478 | | | | | | | | | | | | | | | | | | | | | | | | | | Swaps hedging fixed-rates bonds (assets) | | | 1,971 | | | | 15,653 | | | | | | | | | | | | | | | | | | | | | | | | | | Total swaps hedging fixed-rates bonds (assets and liabilities) | | | 1,874 | | | | 17,131 | | | | | | | | 4,204 | | | | 4,215 | | | | 3,380 | | | | 1,661 | | | | 3,671 | | Swaps hedging fixed-rates bonds (current portion) (liabilities) | | | (40 | ) | | | 642 | | | | | | | | | | | | | | | | | | | | | | | | | | Swaps hedging fixed-rates bonds (current portion) (assets) | | | 383 | | | | 2,349 | | | | | | | | | | | | | | | | | | | | | | | | | | Total swaps hedging fixed-rates bonds (current portion) (assets and liabilities) | | | 343 | | | | 2,991 | | | | 2,991 | | | | | | | | | | | | | | | | | | | | | | Cash flow hedge | | | | | | | | | | | | | | | | | | | | | | | | | | | | | | | | | Swaps hedging fixed-rates bonds (liabilities) | | | (49 | ) | | | 967 | | | | | | | | | | | | | | | | | | | | | | | | | | Swaps hedging fixed-rates bonds (assets) | | | 5 | | | | 749 | | | | | | | | | | | | | | | | | | | | | | | | | | Total swaps hedging fixed-rates bonds (assets and liabilities) | | | (44 | ) | | | 1,716 | | | | | | | | — | | | | — | | | | — | | | | — | | | | 1,716 | | Swaps hedging fixed-rates bonds (current portion) (liabilities) | | | (14 | ) | | | 582 | | | | | | | | | | | | | | | | | | | | | | | | | | Swaps hedging fixed-rates bonds (current portion) (assets) | | | 12 | | | | 908 | | | | | | | | | | | | | | | | | | | | | | | | | | Total swaps hedging fixed-rates bonds (current portion) (assets and liabilities) | | | (2 | ) | | | 1,490 | | | | 1,490 | | | | | | | | | | | | | | | | | | | | | | Net investment hedge | | | | | | | | | | | | | | | | | | | | | | | | | | | | | | | | | Currency swaps and forward exchange contracts (assets) | | | — | | | | — | | | | | | | | | | | | | | | | | | | | | | | | | | Currency swaps and forward exchange contracts (liabilities) | | | (26 | ) | | | 881 | | | | | | | | | | | | | | | | | | | | | | | | | | Total swaps hedging net investments | | | (26 | ) | | | 881 | | | | 881 | | | | | | | | | | | | | | | | | | | | | | Held for trading | | | | | | | | | | | | | | | | | | | | | | | | | | | | | | | | | Other interest rate swaps (assets) | | | 1 | | | | 3,605 | | | | | | | | | | | | | | | | | | | | | | | | | | Other interest rate swaps (liabilities) | | | (2 | ) | | | 14,679 | | | | | | | | | | | | | | | | | | | | | | | | | | Total other interest rate swaps (assets and liabilities) | | | (1 | ) | | | 18,284 | | | | 18,284 | | | | — | | | | — | | | | — | | | | — | | | | — | | Currency swaps and forward exchange contracts (assets) | | | 158 | | | | 6,984 | | | | | | | | | | | | | | | | | | | | | | | | | | Currency swaps and forward exchange contracts (liabilities) | | | (85 | ) | | | 4,453 | | | | | | | | | | | | | | | | | | | | | | | | | | Total currency swaps and forward exchange contracts (assets and liabilities) | | | 73 | | | | 11,437 | | | | 11,176 | | | | 80 | | | | 58 | | | | 36 | | | | 31 | | | | 56 | |
| (a) | These amounts set the levels of notional commitment and are not indicative of a contingent gain or loss. |
| | | | | | | | | | | | | | | | | | | As of December 31, 2007(M€) | | | | | Notional value(a) | | Assets/(Liabilities) | | Fair
value | | | Total | | 2008 | | 2009 | | 2010 | | 2011 | | 2012 | | 2013
and
after | Fair value hedge | | | | | | | | | | | | | | | | | | Issue swaps and swaps hedging bonds (liabilities) | | (369 | ) | | 7,506 | | | | | | | | | | | | | Issue swaps and swaps hedging bonds
(assets) | | 460 | | | 3,982 | | | | | | | | | | | | | Total issue swaps and swaps hedging bonds
(assets and liabilities) | | 91 | | | 11,488 | | | | 1,910 | | 1,836 | | 2,725 | | 2,437 | | 2,580 | Currency swaps hedging of bank and other loans | | | | | | | | | | | | | | | | | | Issue swaps and swaps hedging bonds
(current portion) (liabilities) | | (1 | ) | | 306 | | | | | | | | | | | | | Issue swaps and swaps hedging bonds
(current portion) (assets) | | 388 | | | 1,265 | | | | | | | | | | | | | Total issue swaps and swaps hedging bonds
(current portion) (assets and liabilities) | | 387 | | | 1,571 | | 1,571 | | | | | | | | | | | Net investment hedge | | | | | | | | | | | | | | | | | | Currency swaps and forward exchange contracts (assets) | | 14 | | | 695 | | 695 | | | | | | | | | | | Cash flow hedge | | | | | | | | | | | | | | | | | | Other interest rate swaps (assets) | | 1 | | | 8,249 | | | | | | | | | | | | | Other interest rate swaps (liabilities) | | — | | | 3,815 | | | | | | | | | | | | | Other interest rate swaps (assets and liabilities) | | 1 | | | 12,064 | | 12,058 | | | | 4 | | | | | | 2 | Currency swaps and forward exchange contracts (assets) | | 11 | | | 2,594 | | | | | | | | | | | | | Currency swaps and forward exchange contracts (liabilities) | | (59 | ) | | 3,687 | | | | | | | | | | | | | Currency swaps and forward exchange contracts (assets and liabilities) | | (48 | ) | | 6,281 | | 6,207 | | 42 | | 2 | | 6 | | 8 | | 16 |
| | | | | | | | | | | | | | | | | | | | | | | | | | | | | | | | | As of December 31, 2010 (M€) Assets / (Liabilities) | | | | | Notional value(a) | | | | Fair
value | | | Total | | | 2011 | | | 2012 | | | 2013 | | | 2014 | | | 2015 | | | 2016
and
after | | Fair value hedge | | | | | | | | | | | | | | | | | | | | | | | | | | | | | | | | | Swaps hedging fixed-rates bonds (liabilities) | | | (178 | ) | | | 2,244 | | | | | | | | | | | | | | | | | | | | | | | | | | Swaps hedging fixed-rates bonds (assets) | | | 1,814 | | | | 13,939 | | | | | | | | | | | | | | | | | | | | | | | | | | Total swaps hedging fixed-rates bonds (assets and liabilities) | | | 1,636 | | | | 16,183 | | | | | | | | 2,967 | | | | 3,461 | | | | 2,421 | | | | 3,328 | | | | 4,006 | | Swaps hedging fixed-rates bonds (current portion) (liabilities) | | | (12 | ) | | | 592 | | | | | | | | | | | | | | | | | | | | | | | | | | Swaps hedging fixed-rates bonds (current portion) (assets) | | | 292 | | | | 2,815 | | | | | | | | | | | | | | | | | | | | | | | | | | Total swaps hedging fixed-rates bonds (current portion) (assets and liabilities) | | | 280 | | | | 3,407 | | | | 3,407 | | | | | | | | | | | | | | | | | | | | | | Cash flow hedge | | | | | | | | | | | | | | | | | | | | | | | | | | | | | | | | | Swaps hedging fixed-rates bonds (liabilities) | | | — | | | | — | | | | | | | | | | | | | | | | | | | | | | | | | | Swaps hedging fixed-rates bonds (assets) | | | 56 | | | | 1,957 | | | | | | | | | | | | | | | | | | | | | | | | | | Total swaps hedging fixed-rates bonds (assets and liabilities) | | | 56 | | | | 1,957 | | | | | | | | 295 | | | | | | | | | | | | | | | | 1,662 | | Swaps hedging fixed-rates bonds (current portion) (liabilities) | | | | | | | | | | | | | | | | | | | | | | | | | | | | | | | | | Swaps hedging fixed-rates bonds (current portion) (assets) | | | | | | | | | | | | | | | | | | | | | | | | | | | | | | | | | Total swaps hedging fixed-rates bonds (current portion) (assets and liabilities) | | | — | | | | — | | | | — | | | | | | | | | | | | | | | | | | | | | | Net investment hedge | | | | | | | | | | | | | | | | | | | | | | | | | | | | | | | | | Currency swaps and forward exchange contracts (assets) | | | 6 | | | | 381 | | | | | | | | | | | | | | | | | | | | | | | | | | Currency swaps and forward exchange contracts (liabilities) | | | — | | | | — | | | | | | | | | | | | | | | | | | | | | | | | | | Total swaps hedging net investments | | | 6 | | | | 381 | | | | 381 | | | | | | | | | | | | | | | | | | | | | | Held for trading | | | | | | | | | | | | | | | | | | | | | | | | | | | | | | | | | Other interest rate swaps (assets) | | | 1 | | | | 6,463 | | | | | | | | | | | | | | | | | | | | | | | | | | Other interest rate swaps (liabilities) | | | (3 | ) | | | 11,395 | | | | | | | | | | | | | | | | | | | | | | | | | | Total other interest rate swaps (assets and liabilities) | | | (2 | ) | | | 17,858 | | | | 17,667 | | | | 189 | | | | — | | | | — | | | | 2 | | | | — | | Currency swaps and forward exchange contracts (assets) | | | 37 | | | | 1,532 | | | | | | | | | | | | | | | | | | | | | | | | | | Currency swaps and forward exchange contracts (liabilities) | | | (144 | ) | | | 6,757 | | | | | | | | | | | | | | | | | | | | | | | | | | Total currency swaps and forward exchange contracts (assets and liabilities) | | | (107 | ) | | | 8,289 | | | | 8,102 | | | | — | | | | 25 | | | | 49 | | | | 31 | | | | 82 | |
| (a) | These amounts set the levels of notional commitment and are not indicative of a contingent gain or loss. |
| | | | | | | | | | | | | | | | | | | As of December 31, 2006 (M€) | | | | | Notional value(a) | | ASSETS/(LIABILITIES) | | Fair
value | | | Total | | 2007 | | 2008 | | 2009 | | 2010 | | 2011 | | 2012 and
after | Fair value hedge | | | | | | | | | | | | | | | | | | Issue swaps and swaps hedging bonds
(liabilities) | | (193 | ) | | 5,691 | | | | | | | | | | | | | Issue swaps and swaps hedging bonds
(assets) | | 486 | | | 5,317 | | | | | | | | | | | | | Total issue swaps and swaps hedging bonds (assets and liabilities) | | 293 | | | 11,008 | | | | 1,756 | | 2,018 | | 1,870 | | 2,740 | | 2,624 | Currency swaps hedging of bank and other loans | | | | | | | | | | | | | | | | | | Issue swaps and swaps hedging bonds
(current portion) (liabilities) | | | | | 475 | | | | | | | | | | | | | Issue swaps and swaps hedging bonds
(current portion) (assets) | | 341 | | | 1,341 | | | | | | | | | | | | | Total issue swaps and swaps hedging bonds (current portion) (assets and liabilities) | | 341 | | | 1,816 | | 1,816 | | | | | | | | | | | Net investment hedge | | | | | | | | | | | | | | | | | | N/A | | | | | | | | | | | | | | | | | | Cash flow hedge | | | | | | | | | | | | | | | | | | Other interest rate swaps (assets) | | 12 | | | 6,488 | | | | | | | | | | | | | Other interest rate swaps (liabilities) | | (8 | ) | | 9,580 | | | | | | | | | | | | | Other interest rate swaps (assets and liabilities) | | 4 | | | 16,068 | | 16,062 | | | | | | 4 | | | | 2 | Currency swaps and forward exchange contracts (assets) | | 59 | | | 5,003 | | | | | | | | | | | | | Currency swaps and forward exchange contracts (liabilities) | | (67 | ) | | 6,065 | | | | | | | | | | | | | Currency swaps and forward exchange contracts (assets and liabilities) | | (8 | ) | | 11,068 | | 10,513 | | 287 | | 201 | | 45 | | 22 | | |
| | | | | | | | | | | | | | | | | | | | | | | | | | | | | | | | | As of December 31, 2009 (M€) Assets / (Liabilities) | | | | | Notional value(a) | | | | Fair
value | | | Total | | | 2010 | | | 2011 | | | 2012 | | | 2013 | | | 2014 | | | 2015
and
after | | Fair value hedge | | | | | | | | | | | | | | | | | | | | | | | | | | | | | | | | | Swaps hedging fixed-rates bonds (liabilities) | | | (241 | ) | | | 4,615 | | | | | | | | | | | | | | | | | | | | | | | | | | Swaps hedging fixed-rates bonds (assets) | | | 889 | | | | 11,076 | | | | | | | | | | | | | | | | | | | | | | | | | | Total swaps hedging fixed-rates bonds (assets and liabilities) | | | 648 | | | | 15,691 | | | | — | | | | 3,345 | | | | 2,914 | | | | 3,450 | | | | 1,884 | | | | 4,098 | | Swaps hedging fixed-rates bonds (current portion) (liabilities) | | | (97 | ) | | | 912 | | | | | | | | | | | | | | | | | | | | | | | | | | Swaps hedging fixed-rates bonds (current portion) (assets) | | | 197 | | | | 1,084 | | | | | | | | | | | | | | | | | | | | | | | | | | Total swaps hedging fixed-rates bonds (current portion) (assets and liabilities) | | | 100 | | | | 1,996 | | | | 1,996 | | | | | | | | | | | | | | | | | | | | | | Cash flow hedge | | | | | | | | | | | | | | | | | | | | | | | | | | | | | | | | | Swaps hedging fixed-rates bonds (liabilities) | | | | | | | | | | | | | | | | | | | | | | | | | | | | | | | | | Swaps hedging fixed-rates bonds (assets) | | | 136 | | | | 1,837 | | | | | | | | | | | | 295 | | | | | | | | | | | | 1,542 | | Total swaps hedging fixed-rates bonds (assets and liabilities) | | | 136 | | | | 1,837 | | | | | | | | | | | | 295 | | | | | | | | | | | | 1,542 | | Swaps hedging fixed-rates bonds (current portion) (liabilities) | | | | | | | | | | | | | | | | | | | | | | | | | | | | | | | | | Swaps hedging fixed-rates bonds (current portion) (assets) | | | | | | | | | | | | | | | | | | | | | | | | | | | | | | | | | Total swaps hedging fixed-rates bonds (current portion) (assets and liabilities) | | | | | | | | | | | | | | | | | | | | | | | | | | | | | | | | | Net investment hedge | | | | | | | | | | | | | | | | | | | | | | | | | | | | | | | | | Currency swaps and forward exchange contracts (assets) | | | 6 | | | | 701 | | | | | | | | | | | | | | | | | | | | | | | | | | Currency swaps and forward exchange contracts (liabilities) | | | (1 | ) | | | 224 | | | | | | | | | | | | | | | | | | | | | | | | | | Total swaps hedging net investments | | | 5 | | | | 925 | | | | 925 | | | | | | | | | | | | | | | | | | | | | | Held for trading | | | | | | | | | | | | | | | | | | | | | | | | | | | | | | | | | Other interest rate swaps (assets) | | | | | | | 1,459 | | | | | | | | | | | | | | | | | | | | | | | | | | Other interest rate swaps (liabilities) | | | (1 | ) | | | 10,865 | | | | | | | | | | | | | | | | | | | | | | | | | | Total other interest rate swaps (assets and liabilities) | | | (1 | ) | | | 12,324 | | | | 12,208 | | | | 114 | | | | | | | | | | | | | | | | 2 | | Currency swaps and forward exchange contracts (assets) | | | 53 | | | | 4,017 | | | | | | | | | | | | | | | | | | | | | | | | | | Currency swaps and forward exchange contracts (liabilities) | | | (24 | ) | | | 3,456 | | | | | | | | | | | | | | | | | | | | | | | | | | Total currency swaps and forward exchange contracts (assets and liabilities) | | | 29 | | | | 7,473 | | | | 7,224 | | | | | | | | 52 | | | | 50 | | | | 47 | | | | 100 | |
| (a) | These amounts set the levels of notional commitment and are not indicative of a contingent gain or loss. |
The fair value hierarchy for financial instruments excluding commodity contracts is as follows: | | | | | | | | | | | | | | | | | | As of December 31, 2011 (M€) | | Quoted prices in
active markets
for identical
assets
(level 1) | | | Prices based on
observable data
(level 2) | | | Prices based on non-
observable data
(level 3) | | | Total | | Fair value hedge instruments | | | — | | | | 2,217 | | | | — | | | | 2,217 | | Cash flow hedge instruments | | | — | | | | (46 | ) | | | — | | | | (46 | ) | Net investment hedge instruments | | | — | | | | (26 | ) | | | — | | | | (26 | ) | Assets and liabilities held for trading | | | — | | | | 72 | | | | — | | | | 72 | | Assets available for sale | | | 2,575 | | | | — | | | | — | | | | 2,575 | | Total | | | 2,575 | | | | 2,217 | | | | — | | | | 4,792 | |
| | | | | | | | | | | | | | | | | | As of December 31, 2010 (M€) | | Quoted prices in
active markets
for identical
assets
(level 1) | | | Prices based on
observable data
(level 2) | | | Prices based on
non-observable
data
(level 3) | | | Total | | Fair value hedge instruments | | | — | | | | 1,916 | | | | — | | | | 1,916 | | Cash flow hedge instruments | | | — | | | | 56 | | | | — | | | | 56 | | Net investment hedge instruments | | | — | | | | 6 | | | | — | | | | 6 | | Assets and liabilities held for trading | | | — | | | | (109 | ) | | | — | | | | (109 | ) | Assets available for sale | | | 3,631 | | | | — | | | | — | | | | 3,631 | | Total | | | 3,631 | | | | 1,869 | | | | — | | | | 5,500 | |
| | | | | | | | | | | | | | | | | | As of December 31, 2009 (M€) | | Quoted prices in
active markets
for identical
assets
(level 1) | | | Prices based on
observable data
(level 2) | | | Prices based on
non-observable
data
(level 3) | | | Total | | Fair value hedge instruments | | | — | | | | 748 | | | | — | | | | 748 | | Cash flow hedge instruments | | | — | | | | 136 | | | | — | | | | 136 | | Net investment hedge instruments | | | — | | | | 5 | | | | — | | | | 5 | | Assets and liabilities held for trading | | | — | | | | 28 | | | | — | | | | 28 | | Assets available for sale | | | 232 | | | | — | | | | — | | | | 232 | | Total | | | 232 | | | | 917 | | | | — | | | | 1,149 | |
The description of each fair value level is presented in Note 1 paragraph M(v) to the Consolidated Financial Statements. 30)FINANCIAL INSTRUMENTS RELATED TO COMMODITY CONTRACTS Financial instruments related to oil, gas and power activities as well as related currency derivatives are recorded at fair value under “Other current assets” or “Other creditors and accrued liabilities” depending on whether they are assets or liabilities. | | | | | | | | | | | | As of December 31, 2008(M€) | | | | | | | | | | | | ASSETS/(LIABILITIES) | | Notional
value -
purchase(a) | | Notional
value -
sale(a) | | Carrying
amount | | | Fair
value(e) | | Crude oil, petroleum products and freight rates activities | | | | | | | | | | | Petroleum products and crude oil swaps(a) | | 9,977 | | 10,530 | | 141 | | | 141 | | Freight rate swaps(a) | | 5 | | 29 | | 8 | | | 8 | | Forwards(b) | | 4,398 | | 3,429 | | (120 | ) | | (120 | ) | Options(c) | | 6,132 | | 6,174 | | — | | | — | | Futures(d) | | 1,132 | | 3,053 | | 17 | | | 17 | | Options on futures(c) | | 435 | | 422 | | (7 | ) | | (7 | ) | Total crude oil, petroleum products and freight rates | | | | | | 39 | | | 39 | | Gas & Power activities | | | | | | | | | | | Swaps(a) | | 3,180 | | 2,983 | | (48 | ) | | (48 | ) | Forwards(b) | | 12,541 | | 10,483 | | 659 | | | 659 | | Options(c) | | 13 | | 9 | | — | | | — | | Futures(d) | | 632 | | 498 | | (19 | ) | | (19 | ) | Total Gas & Power | | | | | | 592 | | | 592 | | Total | | | | | | 631 | | | 631 | | Total of fair value non recognized in the balance sheet | | | | | | | | | — | |
| | As of December 31, 2007(M€) | | | | | | | ASSETS/(LIABILITIES) | | Notional
value -
purchase(a) | | Notional
value -
sale(a) | | Carrying
amount | | Fair
value(e) | | | | As of December 31, 2011 (M€) | | | | | | | Assets / (Liabilities) | | | Carrying amount | | Fair value(b) | | Crude oil, petroleum products and freight rates activities | | | | | | | | | | | | | Petroleum products and crude oil swaps(a) | | 9,048 | | 9,671 | | (149 | ) | | (149 | ) | | | 3 | | | | 3 | | Freight rate swaps(a) | | 69 | | 93 | | (3 | ) | | (3 | ) | | | — | | | | — | | Forwards(b) | | 7,060 | | 7,233 | | (4 | ) | | (4 | ) | | Options(c) | | 4,852 | | 4,143 | | 272 | | | 272 | | | Forwards(a) | | | | (16 | ) | | | (16 | ) | Options | | | | (4 | ) | | | (4 | ) | Futures(d) | | 1,734 | | 3,510 | | (97 | ) | | (97 | ) | | | (14 | ) | | | (14 | ) | Options on futures(c) | | 365 | | 280 | | (1 | ) | | (1 | ) | | | (6 | ) | | | (6 | ) | Total crude oil, petroleum products and freight rates | | | | | | 18 | | | 18 | | | | (37 | ) | | | (37 | ) | Gas & Power activities | | | | | | | | | | | | | Swaps(a) | | 1,496 | | 1,670 | | 4 | | | 4 | | | | 57 | | | | 57 | | Forwards(b) | | 9,558 | | 8,306 | | 213 | | | 213 | | | Options(c) | | 3 | | 10 | | — | | | — | | | Forwards(a) | | | | 452 | | | | 452 | | Options | | | | (3 | ) | | | (3 | ) | Futures(d) | | 115 | | 94 | | 15 | | | 15 | | | | — | | | | — | | Total Gas & Power | | | | | | 232 | | | 232 | | | | 506 | | | | 506 | | Total | | | | | | 250 | | | 250 | | | | 469 | | | | 469 | | Total of fair value non recognized in the balance sheet | | | | | | | — | | | Total of fair value non-recognized in the balance sheet | | | | | | — | |
| (a) | Swaps (including “Contracts for differences”): the “Notional value” columns correspond to receive-fixed and pay-fixed swaps. |
(b) | Forwards: contracts resulting in physical delivery are accounted for as derivative commodity contracts and included in the amounts shown. |
(c)(b) | Options: the “Notional value” columns correspond to the nominal value of options (calls or puts) purchased and sold, valued based on the strike price. |
(d) | Futures: the “Notional value” columns correspond to the net purchasing/selling positions, valued based on the transaction historical price on the organized exchange market. |
(e) | From 2008, whenWhen the fair value of derivatives listed on an organized exchange market (futures, options on futures and swaps) is offset with the margin call received or paid on the face ofin the balance sheet, this fair value is set to zero. |
| | | | | | | | | | | | As of December 31, 2006(M€) | | | | | | | | | | | | ASSETS/(LIABILITIES) | | Notional
value -
purchase(a) | | Notional
value -
sale(a) | | Carrying
amount | | | Fair
value(e) | | Crude oil, petroleum products and freight rates activities | | | | | | | | | | | Petroleum products and crude oil swaps(a) | | 7,987 | | 9,303 | | (30 | ) | | (30 | ) | Freight rate swaps(a) | | 56 | | 86 | | 2 | | | 2 | | Forwards(b) | | 5,145 | | 5,830 | | (11 | ) | | (11 | ) | Options(c) | | 6,046 | | 4,835 | | 66 | | | 66 | | Futures(d) | | 1,274 | | 2,434 | | 79 | | | 79 | | Options on futures(c) | | 143 | | 165 | | (4 | ) | | (4 | ) | Total crude oil, petroleum products and freight rates | | | | | | 102 | | | 102 | | Gas & Power activities | | | | | | | | | | | Swaps(a) | | 1,161 | | 872 | | (38 | ) | | (38 | ) | Forwards(b) | | 9,973 | | 9,441 | | (73 | ) | | (73 | ) | Options(c) | | 18 | | 58 | | 1 | | | 1 | | Futures(d) | | 92 | | 46 | | 31 | | | 31 | | Total Gas & Power | | | | | | (79 | ) | | (79 | ) | Total | | | | | | 23 | | | 23 | | Total of fair value non recognized in the balance sheet | | | | | | | | | — | |
| | | | | | | | | As of December 31, 2010 (M€) Assets / (Liabilities) | | Carrying amount | | | Fair value(b) | | Crude oil, petroleum products and freight rates activities | | | | | | | | | Petroleum products and crude oil swaps | | | (2 | ) | | | (2 | ) | Freight rate swaps | | | — | | | | — | | Forwards(a) | | | 5 | | | | 5 | | Options | | | 51 | | | | 51 | | Futures | | | (12 | ) | | | (12 | ) | Options on futures | | | (4 | ) | | | (4 | ) | Total crude oil, petroleum products and freight rates | | | 38 | | | | 38 | | Gas & Power activities | | | | | | | | | Swaps | | | (1 | ) | | | (1 | ) | Forwards(a) | | | (102 | ) | | | (102 | ) | Options | | | 5 | | | | 5 | | Futures | | | — | | | | — | | Total Gas & Power | | | (98 | ) | | | (98 | ) | Total | | | (60 | ) | | | (60 | ) | Total of fair value non-recognized in the balance sheet | | | | | | | — | |
| (a) | Swaps (including “Contracts for differences”): the “Notional value” columns correspond to receive-fixed and pay-fixed swaps. |
(b) | Forwards: contracts resulting in physical delivery are accounted for as derivative commodity contracts and included in the amounts shown. |
(c)(b) | Options: the “Notional value” columns correspond to the nominal value of options (calls or puts) purchased and sold, valued based on the strike price. |
(d) | Futures: the “Notional value” columns correspond to the net purchasing/selling positions, valued based on the transaction historical price on the organized exchange market. |
(e) | From 2008, whenWhen the fair value of derivatives listed on an organized exchange market (futures, options on futures and swaps) is offset with the margin call received or paid in the balance sheet, this fair value is set to zero. |
| | | | | | | | | As of December 31, 2009 (M€) Assets / (Liabilities) | | Carrying amount | | | Fair value(b) | | Crude oil, petroleum products and freight rates activities | | | | | | | | | Petroleum products and crude oil swaps | | | (29 | ) | | | (29 | ) | Freight rate swaps | | | — | | | | — | | Forwards(a) | | | (9 | ) | | | (9 | ) | Options | | | 21 | | | | 21 | | Futures | | | (17 | ) | | | (17 | ) | Options on futures | | | 6 | | | | 6 | | Total crude oil, petroleum products and freight rates | | | (28 | ) | | | (28 | ) | Gas & Power activities | | | | | | | | | Swaps | | | 52 | | | | 52 | | Forwards(a) | | | 78 | | | | 78 | | Options | | | 4 | | | | 4 | | Futures | | | — | | | | — | | Total Gas & Power | | | 134 | | | | 134 | | Total | | | 106 | | | | 106 | | Total of fair value non-recognized in the balance sheet | | | | | | | — | |
| (a) | Forwards: contracts resulting in physical delivery are accounted for as derivative commodity contracts and included in the amounts shown. |
| (b) | When the fair value of derivatives listed on an organized exchange market (futures, options on futures and swaps) is offset with the face ofmargin call received or paid in the balance sheet, this fair value is set to zero. |
Most commitments on crude oil and refined products have a short term maturity (less than one year). The maturity of most Gas & Power energy derivatives is less than three years forward. The changes in fair value of financial instruments related to commodity contracts are detailed as follows: | | | | | | | | | | | | | | | For the year ended December 31,(M€) | | Fair value as
of January 1, | | | Impact on
income | | Settled
contracts | | | Other | | | Fair value as of
December 31, | | Crude oil, petroleum products and freight rates activities | | 2008 | | 18 | | | 1,734 | | (1,715 | ) | | 2 | | | 39 | | 2007 | | 102 | | | 1,381 | | (1,460 | ) | | (5 | ) | | 18 | | 2006 | | 28 | | | 1,577 | | (1,496 | ) | | (7 | ) | | 102 | | | | | | | | Gas & Power activities | | | | | | | | | | | | | | | 2008 | | 232 | | | 787 | | (310 | ) | | (117 | ) | | 592 | | 2007 | | (79 | ) | | 489 | | (163 | ) | | (15 | ) | | 232 | | 2006 | | 110 | | | 557 | | (744 | ) | | (2 | ) | | (79 | ) |
| | | | | | | | | | | | | | | | | | | | | | For the year ended December 31, (M€) | | Fair value as of January 1, | | | Impact on income | | | Settled contracts | | | Other | | | Fair value as of December 31, | | Crude oil, petroleum products and freight rates activities | | | | | | | | | �� | | | | | | | | | | | | 2011 | | | 38 | | | | 1,572 | | | | (1,648 | ) | | | 1 | | | | (37 | ) | 2010 | | | (28 | ) | | | 1,556 | | | | (1,488 | ) | | | (2 | ) | | | 38 | | 2009 | | | 39 | | | | 1,713 | | | | (1,779 | ) | | | (1 | ) | | | (28 | ) | Gas & Power activities | | | | | | | | | | | | | | | | | | | | | 2011 | | | (98 | ) | | | 899 | | | | (295 | ) | | | 0 | | | | 506 | | 2010 | | | 134 | | | | 410 | | | | (648 | ) | | | 6 | | | | (98 | ) | 2009 | | | 592 | | | | 327 | | | | (824 | ) | | | 39 | | | | 134 | |
The fair value hierarchy for financial instruments related to commodity contracts is as follows: | | | | | | | | | | | | | | | | | | As of December 31, 2011 (M€) | | Quoted prices in active markets for identical assets (level 1) | | | Prices based on observable data (level 2) | | | Prices based on non-observable data (level 3) | | | Total | | Crude oil, petroleum products and freight rates activities | | | (38 | ) | | | 1 | | | | — | | | | (37 | ) | Gas & Power activities | | | (44 | ) | | | 550 | | | | — | | | | 506 | | Total | | | (82 | ) | | | 551 | | | | — | | | | 469 | |
| | | | | | | | | | | | | | | | | | As of December 31, 2010 (M€) | | Quoted prices in active markets for
identical assets (level 1) | | | Prices based on observable data (level 2) | | | Prices based on non-observable
data (level 3) | | | Total | | Crude oil, petroleum products and freight rates activities | | | (10 | ) | | | 48 | | | | — | | | | 38 | | Gas & Power activities | | | 50 | | | | (148 | ) | | | — | | | | (98 | ) | Total | | | 40 | | | | (100 | ) | | | — | | | | (60 | ) |
| | | | | | | | | | | | | | | | | | As of December 31, 2009 (M€) | | Quoted prices in active markets for identical assets (level 1) | | | Prices based on observable data (level 2) | | | Prices based on non-observable data (level 3) | | | Total | | Crude oil, petroleum products and freight rates activities | | | (45 | ) | | | 17 | | | | — | | | | (28 | ) | Gas & Power activities | | | 140 | | | | (6 | ) | | | — | | | | 134 | | Total | | | 95 | | | | 11 | | | | — | | | | 106 | |
The description of each fair value level is presented in Note 1 paragraph M(v) to the Consolidated Financial Statements. 31) MARKETFINANCIAL RISKS MANAGEMENT Oil and gas market related risks Due to the nature of its business, the Group has significant oil and gas trading activities as part of its day-to-day operations in order to optimize revenues from its oil and gas production and to obtain favorable pricing to supply its refineries. In its international oil trading activities,business, the Group follows a policy of not selling its future oil and gas production for future delivery.production. However, in connection with thesethis trading activities,business, the Group, like most other oil companies, uses energy derivative instruments to adjust its exposure to price fluctuations of crude oil, refined products, natural gas, power and electricity.coal. The Group also uses freight rate derivative contracts in its shipping activitiesbusiness to adjust its exposure to freight-rate fluctuations. To hedge against this risk, the Group uses various instruments such as futures, forwards, swaps and options on organizedorganised markets or over-the-counter markets. The list of the different derivatives held by the Group in these markets is detailed in Note 30 to the Consolidated Financial Statements. The Trading & Shipping division measures its market risk exposure,i.e., potential loss in fair values, on its crude oil, refined products and freight rates trading activities using a value-at-risk technique. This technique is based on an historical model and makes an assessment of the market risk arising from possible future changes in market values over a 24-hour period. The calculation of the range of potential changes in fair values takes into account a snapshot of the end-of-day exposures and the set of historical price movements for the last 400 business days for all instruments and maturities in the global trading activities. Options are systematically reevaluated using appropriate models. The potential movement in fair values corresponds to a 97.5% value-at-risk type confidence level. This means that the Group’s portfolio result is likely to exceed the value-at-risk loss measure once over 40 business days if the portfolio exposures were left unchanged. Trading & Shipping:Shipping : value-at-risk with a 97.5% probability | | | | | | | | | | As of December 31,(M€) | | High | | Low | | Average | | Year
end | 2008 | | 13.5 | | 2.8 | | 6.9 | | 11.8 | 2007 | | 11.6 | | 3.3 | | 6.7 | | 5.4 | 2006 | | 12.9 | | 4.3 | | 8.6 | | 11.4 |
| | | | | | | | | | | | | | | | | As of December 31,
(M€) | | High | | | Low | | | Average | | | Year end | | 2011 | | | 10.6 | | | | 3.7 | | | | 6.1 | | | | 6.3 | | 2010 | | | 23.1 | | | | 3.4 | | | | 8.9 | | | | 3.8 | | 2009 | | | 18.8 | | | | 5.8 | | | | 10.2 | | | | 7.6 | |
As part of its gas, power and powercoal trading activity, the Group also uses derivative instruments such as futures, forwards, swaps and options in both organizedorganised and over-the-counter markets. In general, the transactions are settled at maturity date through physical delivery. The Gas & Power division measures its market risk exposure,i.e. potential loss in fair values, on its trading activitiesbusiness using a value-at-risk technique. This technique is based on an historical model and makes an assessment of the market risk arising from possible future changes in market values over a one dayone-day period. The calculation of the range of potential changes in fair values takes into account a snapshot of the end-of-day exposures and the set of historical price movements for the past two years for all instruments and maturities in the global trading activities.business. Gas & Power trading:trading : value-at-risk with a 97.5% probability | | | | | | | | | | As of December 31,(M€) | | High | | Low | | Average | | Year
end | 2008 | | 16.3 | | 1.3 | | 5.0 | | 1.4 | 2007(a) | | 18.2 | | 3.2 | | 7.9 | | 4.3 | 2006(a) | | 21.7 | | 3.5 | | 9.1 | | 6.0 |
(a) | These calculations are based on the set of historical price movements for the past year. |
| | | | | | | | | | | | | | | | | As of December 31,
(M€) | | High | | | Low | | | Average | | | Year end | | 2011 | | | 21.0 | | | | 12.7 | | | | 16.0 | | | | 17.6 | | 2010 | | | 13.9 | | | | 2.7 | | | | 6.8 | | | | 10.0 | | 2009 | | | 9.8 | | | | 1.9 | | | | 5.0 | | | | 4.8 | |
The Group has implemented strict policies and procedures to manage and monitor these market risks. These are based on the splittingseparation of supervisory functions from operationalcontrol and front-office functions and on an integrated information system that enables real-time monitoring of trading activities. Limits on trading positions are approved by the Group’s Executive Committee and are monitored daily. To increase flexibility and encourage liquidity, hedging operations are performed with numerous independent operators, including other oil companies, major energy producers or consumers and financial institutions. The Group has established counterparty limits and monitors outstanding amounts with each counterparty on an ongoing basis. Financial markets related risks As part of its financing and cash management activities, the Group uses derivative instruments to manage its exposure to changes in interest rates and foreign exchange rates. These instruments are principally interest rate and currency swaps. The Group may also use, on a less frequent basis, futures caps, floors and options contracts. These operations and their accounting treatment are detailed in Notes 1 paragraph M, 20, 28 and 29 to the Consolidated Financial Statements. Risks relative to cash management activitiesoperations and to interest rate and foreign exchange financial instruments are managed according to rules set by the Group’s senior management, and thatwhich provide for regular pooling of available cash balances, open positions and management of the financial instruments by the treasury/financing department.Treasury Department. Excess cash of the Group is deposited mainly in government institutions, or deposit banks, selected in accordance with strict criteria, or is used to buy deposit certificates issued by these banks.major companies through deposits, reverse repurchase agreements and purchase of commercial paper. Liquidity positions and the management of financial instruments are centralized by the treasury/financing department,Treasury Department, where they are managed by a team specialized in foreign exchange and interest rate market transactions. The cash monitoring/management teamCash Monitoring-Management Unit within the treasury/financing departmentTreasury Department monitors limits and positions per bank on a daily basis and reports results.results of the Front Office. This teamunit also prepares marked-to-market valuations of used financial instruments and, when necessary, performs sensitivity analysis. Counterparty risk The Group has established standards for market transactions under which bank counterparties must be approved in advance, based on an assessment of the counterparty’s financial soundness (multi-criteria analysis including a review of market prices and of the Credit Default Swap (CDS), its ratings with Standard & Poor’s and Moody’s, which must be of high quality.quality, and its overall financial condition). An overall authorized credit limit is set for each bank and is allotted among the subsidiaries and the Group’s central treasury entities according to their needs. Due toTo reduce the recent changesmarket values risk on its commitments, in particular for swaps set as part of bonds issuance, the financial markets, the Group has taken additional measures to reinforce its managementTreasury Department also developed a system of its exposure to counterparty risk. The Group takes into account the banks’ financial situation, share price and Credit Default Swap (CDS) rate when selectingmargin call that is gradually implemented with significant counterparties.
Currency exposure The Group seeks to minimize the currency exposure of each entity to its functional currency (primarily the euro, the dollar, the Canadian dollar, the pound sterling and the Norwegian krone). For currency exposure generated by commercial activity, the hedging of revenues and costs in foreign currencies is typically performed using currency operations on the spot market and, in some cases, on the forward market. The Group rarely hedges future cash flows, although it may use options to do so. With respect to currency exposure linked to non-current assets booked in a currency other than the euro, the Group has a policy of reducing the related currency exposure by financing these assets in the same currency. Net short-term currency exposure is periodically monitored against limits set by the Group’s senior management. The non-current debt described in Note 20 to the Consolidated Financial Statements is generally raised by the corporate treasury entities either directly in dollars, in euros or euros,in Canadian dollars, or in other currencies which are then systematically exchanged for dollars or euros through swaps issues to appropriately match general corporate needs. The proceeds from these debt issuances are loaned to affiliates whose accounts are kept in dollars, in Canadian dollars or in euros. Thus, the net sensitivity of these positions to currency exposure is not significant. The Group’s short-term currency swaps, the notional value of which appears in Note 29 to the Consolidated Financial Statements, are used to attempt to optimize the centralized cash management of the Group. Thus, the sensitivity to currency fluctuations which may be induced is likewise considered negligible. Short-term interest rate exposure and cash Cash balances, which are primarily composed of euros and dollars, are managed according to the guidelines established by the Group’s senior management (maintain maximuman adequate level of liquidity, optimize revenue from investments considering existing interest rate yield curves, and minimize the cost of borrowing) over a less than twelve-month horizon and on the basis of a daily interest rate benchmark, primarily through short-term interest rate swaps and short-term currency swaps, without modifying currency exposure. Interest rate risk on non-current debt The Group’s policy consists of incurring non-current debt primarily at a floating rate, or, if the opportunity arises at the time of an issuance, at a fixed rate. Debt is incurred in dollars, in euros or in eurosCanadian dollars according to general corporate needs. Long-term interest rate and currency swaps may be used to hedge bonds at their issuance in order to create a variable or fixed rate synthetic debt. In order to partially modify the interest rate structure of the long-term debt, TOTAL may also enter into long-term interest rate swaps. Sensitivity analysis on interest rate and foreign exchange risk The tables below present the potential impact of an increase or decrease of 10 basis points on the interest rate yield curves for each of the currencies on the fair value of the current financial instruments as of December 31, 2008, 20072011, 2010 and 2006.2009. | | | | | | | | | | | | | | | | | | | | | | Change in fair value due to a
change in interest rate by | | | ASSETS/(LIABILITIES) | | Carrying
amount | | | Estimated
fair value | | | + 10 basis points | | | - 10 basis points | | As of December 31, 2008(M€) | | | | | | | | | | | | | Bonds (non-current portion, before swaps) | | (14,119 | ) | | (14,119 | ) | | 47 | | | (43 | ) | Issue swaps and swaps hedging bonds (liabilities) | | (440 | ) | | (440 | ) | | | | | | | Issue swaps and swaps hedging bonds (assets) | | 892 | | | 892 | | | | | | | | Total issue swaps and swaps hedging bonds (assets and liabilities) | | 452 | | | 452 | | | (44 | ) | | 44 | | | Current portion of non-current debt after swap (excluding capital lease obligations) | | (2,025 | ) | | (2,025 | ) | | 3 | | | (3 | ) | Other interest rates swaps | | (4 | ) | | (4 | ) | | 1 | | | (1 | ) | Currency swaps and forward exchange contracts | | (56 | ) | | (56 | ) | | — | | | — | | | | | | | | | | | | | | | | | As of December 31, 2007 (M€) | | | | | | | | | | | | | Bonds (non-current portion, before swaps) | | (11,741 | ) | | (11,741 | ) | | 37 | | | (37 | ) | Issue swaps and swaps hedging bonds (liabilities) | | (369 | ) | | (369 | ) | | | | | | | Issue swaps and swaps hedging bonds (assets) | | 460 | | | 460 | | | | | | | | Total issue swaps and swaps hedging bonds (assets and liabilities) | | 91 | | | 91 | | | (39 | ) | | 38 | | | Current portion of non-current debt after swap (excluding capital lease obligations) | | (1,669 | ) | | (1,669 | ) | | (1 | ) | | 1 | | Other interest rates swaps | | 1 | | | 1 | | | — | | | — | | Currency swaps and forward exchange contracts | | (34 | ) | | (34 | ) | | — | | | — | | | | | | | | | | | | | | | | | As of December 31, 2006 (M€) | | | | | | | | | | | | | Bonds (non-current portion, before swaps) | | (11,413 | ) | | (11,413 | ) | | 26 | | | (26 | ) | Issue swaps and swaps hedging bonds (liabilities) | | (193 | ) | | (193 | ) | | | | | | | Issue swaps and swaps hedging bonds (assets) | | 486 | | | 486 | | | | | | | | Total issue swaps and swaps hedging bonds (assets and liabilities) | | 293 | | | 293 | | | (26 | ) | | 26 | | | Current portion of non-current debt after swap (excluding capital lease obligations) | | (2,140 | ) | | (2,140 | ) | | 1 | | | (1 | ) | Other interest rates swaps | | 4 | | | 4 | | | (1 | ) | | 1 | | Currency swaps and forward exchange contracts | | (8 | ) | | (8 | ) | | 1 | | | (1 | ) |
| | | | | | | | | | | | | | | | | | | | | | | | | | Change in fair
value due to a change
in interest rate by | | Assets / (Liabilities) (M€) | |
| Carrying
amount |
| |
| Estimated
fair value |
| |
| + 10 basis
points |
| |
| - 10 basis
points |
| As of December 31, 2011 | | | | | | | | | | | | | | | | | Bonds (non-current portion, before swaps) | | | (21,402 | ) | | | (22,092 | ) | | | 83 | | | | (83 | ) | Swaps hedging fixed-rates bonds (liabilities) | | | (146 | ) | | | (146 | ) | | | | | | | | | Swaps hedging fixed-rates bonds (assets) | | | 1,976 | | | | 1,976 | | | | | | | | | | Total swaps hedging fixed-rates bonds (assets and liabilities) | | | 1,830 | | | | 1,830 | | | | (49 | ) | | | 49 | | Current portion of non-current debt after swap (excluding capital lease obligations) | | | 3,488 | | | | 3,488 | | | | 3 | | | | (3 | ) | Other interest rates swaps | | | (1 | ) | | | (1 | ) | | | 3 | | | | (3 | ) | Currency swaps and forward exchange contracts | | | 47 | | | | 47 | | | | — | | | | — | | As of December 31, 2010 | | | | | | | | | | | | | | | | | Bonds (non-current portion, before swaps) | | | (20,019 | ) | | | (20,408 | ) | | | 86 | | | | (84 | ) | Swaps hedging fixed-rates bonds (liabilities) | | | (178 | ) | | | (178 | ) | | | | | | | | | Swaps hedging fixed-rates bonds (assets) | | | 1,870 | | | | 1,870 | | | | | | | | | | Total swaps hedging fixed-rates bonds (assets and liabilities) | | | 1,692 | | | | 1,692 | | | | (59 | ) | | | 59 | | Current portion of non-current debt after swap (excluding capital lease obligations) | | | 3,483 | | | | 3,483 | | | | 4 | | | | (4 | ) | Other interest rates swaps | | | (2 | ) | | | (2 | ) | | | 3 | | | | (3 | ) | Currency swaps and forward exchange contracts | | | (101 | ) | | | (101 | ) | | | — | | | | — | | As of December 31, 2009 | | | | | | | | | | | | | | | | | Bonds (non-current portion, before swaps) | | | (18,368 | ) | | | (18,836 | ) | | | 75 | | | | (75 | ) | Swaps hedging fixed-rates bonds (liabilities) | | | (241 | ) | | | (241 | ) | | | | | | | | | Swaps hedging fixed-rates bonds (assets) | | | 1,025 | | | | 1,025 | | | | | | | | | | Total swaps hedging fixed-rates bonds (assets and liabilities) | | | 784 | | | | 784 | | | | (57 | ) | | | 57 | | Current portion of non-current debt after swap (excluding capital lease obligations) | | | (2,111 | ) | | | (2,111 | ) | | | 3 | | | | (3 | ) | Other interest rates swaps | | | (1 | ) | | | (1 | ) | | | 1 | | | | (1 | ) | Currency swaps and forward exchange contracts | | | 34 | | | | 34 | | | | — | | | | — | |
The impact of changes in interest raterates on the cost of net debt before tax is as follows: | | | | | | | | | | | For the year ended December 31,(M€) | | 2008 | | | 2007 | | | 2006 | | Cost of net debt | | (527 | ) | | (539 | ) | | (364 | ) | Interest rate translation of + 10 basis points | | (11 | ) | | (12 | ) | | (12 | ) | Interest rate translation of - 10 basis points | | 11 | | | 12 | | | 12 | | Interest rate translation of + 100 basis points | | (113 | ) | | (116 | ) | | (118 | ) | Interest rate translation of - 100 basis points | | 113 | | | 116 | | | 118 | |
| | | | | | | | | | | | | | For the year ended December 31, (M€) | | 2011 | | | 2010 | | | 2009 | | Cost of net debt | | | (440 | ) | | | (334 | ) | | | (398 | ) | Interest rate translation of : | | | | | | | | | | | | | + 10 basis points | | | (10 | ) | | | (11 | ) | | | (11 | ) | - 10 basis points | | | 10 | | | | 11 | | | | 11 | | + 100 basis points | | | (103 | ) | | | (107 | ) | | | (108 | ) | - 100 basis points | | | 103 | | | | 107 | | | | 108 | |
As a result of the policy for the management of currency exposure previously described, the Group’s sensitivity to currency exposure is primarily influenced by the net equity of the subsidiaries whose functional accounting currency is the dollar and, to a lesser extent, the pound sterling, the Norwegian krone and the Norwegian krone.Canadian dollar. This sensitivity is reflected in the historical evolution of the currency translation adjustment recorded in the statement of changes in shareholders’ equity which, in the course of the last three fiscal years, is essentially related to the evolutionfluctuation of dollar and pound sterling and is set forth in the table below: | | | | | | | | Euro / Dollar
exchange rates | | Euro / Pound sterling
exchange rates | As of December 31, 2008 | | 1.39 | | 0.95 | As of December 31, 2007 | | 1.47 | | 0.73 | As of December 31, 2006 | | 1.32 | | 0.67 |
| | | | | | | | | | | | Euro / Dollar
exchange rates | | | Euro / Pound sterling
exchange rates | | As of December 31, 2011 | | | 1.29 | | | | 0.84 | | As of December 31, 2010 | | | 1.34 | | | | 0.86 | | As of December 31, 2009 | | | 1.44 | | | | 0.89 | |
| | As of December 31, 2008(M€) | | Total | | Euro | | Dollar | | Pound
sterling | | Other
currencies
and equity
affiliates | | | | As of December 31, 2011 (M€) | | | Total | | Euro | | | Dollar | | Pound
sterling | | Other currencies and
equity affiliates(a) | | Shareholders’ equity at historical exchange rate | | 53,868 | | | 25,084 | | 15,429 | | | 5,587 | | | 7,768 | | | | 69,025 | | | | 41,396 | | | | 21,728 | | | | 4,713 | | | | 1,188 | | Currency translation adjustment before net investment hedge | | (4,876 | ) | | — | | (2,191 | ) | | (1,769 | ) | | (916 | ) | | | (962 | ) | | | | | 127 | | | | (923 | ) | | | (166 | ) | Net investment hedge — open instruments | | — | | | — | | — | | | — | | | — | | | | (26 | ) | | | | | (25 | ) | | | (1 | ) | | | — | | Shareholders’ equity at exchange rate as of December 31, 2008 | | 48,992 | | | 25,084 | | 13,238 | | | 3,818 | | | 6,852 | | | Shareholders’ equity at exchange rate as of December 31, 2011 | | | | 68,037 | | | | 41,396 | | | | 21,830 | | | | 3,789 | | | | 1,022 | | | | | | | | | | | | | | | As of December 31, 2007(M€) | | Total | | Euro | | Dollar | | Pound
sterling | | Other
currencies
and equity
affiliates | | | | As of December 31, 2010 (M€) | | | Total | | Euro | | | Dollar | | Pound
sterling | | Other currencies and
equity affiliates(a) | | Shareholders’ equity at historical exchange rate | | 49,254 | | | 22,214 | | 12,954 | | | 5,477 | | | 8,609 | | | | 62,909 | | | | 32,894 | | | | 22,242 | | | | 4,997 | | | | 2,776 | | Currency translation adjustment before net investment hedge | | (4,410 | ) | | — | | (3,501 | ) | | (289 | ) | | (620 | ) | | | (2,501 | ) | | | — | | | | (1,237 | ) | | | (1,274 | ) | | | 10 | | Net investment hedge — open instruments | | 14 | | | — | | 14 | | | — | | | — | | | | 6 | | | | — | | | | 6 | | | | — | | | | — | | Shareholders’ equity at exchange rate as of December 31, 2007 | | 44,858 | | | 22,214 | | 9,467 | | | 5,188 | | | 7,989 | | | Shareholders’ equity at exchange rate as of December 31, 2010 | | | | 60,414 | | | | 32,894 | | | | 21,011 | | | | 3,723 | | | | 2,786 | | | | | | | | | | | | | | | As of December 31, 2006(M€) | | Total | | Euro | | Dollar | | Pound
sterling | | Other
currencies
and equity
affiliates | | | | As of December 31, 2009 (M€) | | | Total | | Euro | | | Dollar | | Pound
sterling | | Other currencies and
equity affiliates | | Shareholders’ equity at historical exchange rate | | 41,704 | | | 17,253 | | 11,166 | | | 4,940 | | | 8,345 | | | | 57,621 | | | | 27,717 | | | | 18,671 | | | | 5,201 | | | | 6,032 | | Currency translation adjustment before net investment hedge | | (1,383 | ) | | — | | (1,393 | ) | | 203 | | | (193 | ) | | | (5,074 | ) | | | — | | | | (3,027 | ) | | | (1,465 | ) | | | (582 | ) | Net investment hedge — open instruments | | — | | | — | | — | | | — | | | — | | | | 5 | | | | — | | | | 6 | | | | (1 | ) | | | — | | Shareholders’ equity at exchange rate as of December 31, 2006 | | 40,321 | | | 17,253 | | 9,773 | | | 5,143 | | | 8,152 | | | Shareholders’ equity at exchange rate as of December 31, 2009 | | | | 52,552 | | | | 27,717 | | | | 15,650 | | | | 3,735 | | | | 5,450 | |
| (a) | The decrease in the heading “Other currencies and equity affiliates” is mainly explained by the change in the consolidation method of Sanofi (see Note 3 to the Consolidated Financial Statements). The contribution to the shareholders’ equity of this investment is now reclassified into the heading for the Eurozone. |
As a result of this policy, the impact of currency exchange rate fluctuations on consolidated income, as illustrated in Note 7 to the Consolidated Financial Statements, has not been significant over the last three fiscal years despite the considerable fluctuation of the dollar (gain of 112 M€118 million in 2008, gain2011, nil result in 2010, loss of 35 M€32 million in 2007, loss of 30 M€ in 2006)2009). Stock market risk The Group holds interests in a number of publicly-traded companies (see Notes 12 and 13 to the Consolidated Financial Statements). The market value of these holdings fluctuates due to various factors, including the global economic environment, stock market trends, valuations of the sectors in which the companies operate, and the economic and financial condition of each individual company.
Liquidity risk TOTAL S.A. has confirmed lines of credit granted by international banks, which are calculated to allow it to manage its short-term liquidity needs as required. As of December 31, 2008,2011, these lines of credit amounted to $8,966$10,139 million, of which $8,725$10,096 million werewas unused. The agreements for the lines of credit granted to TOTAL S.A. do not contain conditions related to the Company’s financial ratios, to its financial ratings from specialized agencies, or to the occurrence of events that could have a material adverse effect on its financial position. As of December 31, 2008,2011, the aggregate amount of the principal confirmed lines of credit granted by international banks to Group companies, including TOTAL S.A., was $9,621$11,447 million, of which $9,380$11,154 million was unused. The lines of credit granted to Group companies other than TOTAL S.A. are not intended to finance the Group’s general needs; they are intended to finance either the general needs of the borrowing subsidiary or a specific project. The following tables show the maturity of the financial assets and liabilities of the Group as of December 31, 2008, 20072011, 2010 and 20062009 (see Note 20 to the Consolidated Financial Statements). | ASSETS/(LIABILITIES) As of December 31, 2008(M€) | | Less than
one year | | Between 1 year
and 5 years | | More than
5 years | | Total | | | Non-current financial debt — net of hedging instruments | | | | (13,206 | ) | | (2,093 | ) | | (15,299 | ) | | As of December 31, 2011 (M€)
Assets/(Liabilities) | | | Less than
one year | | 1-2 years | | 2-3 years | | 3-4 years | | 4-5 years | | More than
5 years | | Total | | Non-current financial debt (notional value excluding interests) | | | | | | (4,492 | ) | | | (3,630 | ) | | | (3,614 | ) | | | (1,519 | ) | | | (7,326 | ) | | | (20,581 | ) | Current borrowings | | (7,722 | ) | | | | | | (7,722 | ) | | | (9,675 | ) | | | | | | | | | | | | | (9,675 | ) | Other current financial liabilities | | (158 | ) | | | | | | (158 | ) | | | (167 | ) | | | | | | | | | | | | | (167 | ) | Current financial assets | | 187 | | | | | | | 187 | | | | 700 | | | | | | | | | | | | | | 700 | | Cash and cash equivalents | | 12,321 | | | 12,321 | | | | 14,025 | | | | 14,025 | | Net amount before financial expense | | 4,628 | | | (13,206 | ) | | (2,093 | ) | | (10,671 | ) | | | 4,883 | | | | (4,492 | ) | | | (3,630 | ) | | | (3,614 | ) | | | (1,519 | ) | | | (7,326 | ) | | | (15,698 | ) | Financial expense | | (436 | ) | | (1,021 | ) | | (181 | ) | | (1,638 | ) | | Financial expense on non-current financial debt | | | | (785 | ) | | | (691 | ) | | | (521 | ) | | | (417 | ) | | | (302 | ) | | | (1,075 | ) | | | (3,791 | ) | Interest differential on swaps | | | | 320 | | | | 331 | | | | 221 | | | | 120 | | | | 55 | | | | 44 | | | | 1,091 | | Net amount | | 4,192 | | | (14,227 | ) | | (2,274 | ) | | (12,309 | ) | | | 4,418 | | | | (4,852 | ) | | | (3,930 | ) | | | (3,911 | ) | | | (1,766 | ) | | | (8,357 | ) | | | (18,398 | ) | | | | | | | | As of December 31, 2007(M€) | | Less than
one year | | Between 1 year
and 5 years | | More than
5 years | | Total | | | Non-current financial debt — net of hedging instruments | | | | (11,424 | ) | | (2,992 | ) | | (14,416 | ) | | | As of December 31, 2010
(M€) Assets/(Liabilities) | | | Less than
one year | | 1-2 years | | 2-3 years | | 3-4 years | | 4-5 years | | More than
5 years | | Total | | Non-current financial debt (notional value excluding interests) | | | | | | (3,355 | ) | | | (3,544 | ) | | | (2,218 | ) | | | (3,404 | ) | | | (6,392 | ) | | | (18,913 | ) | Current borrowings | | (4,613 | ) | | | | | | (4,613 | ) | | | (9,653 | ) | | | | | | | | | | | | | (9,653 | ) | Other current financial liabilities | | (60 | ) | | | | | | (60 | ) | | | (159 | ) | | | | | | | | | | | | | (159 | ) | Current financial assets | | 1,264 | | | | | | | 1,264 | | | | 1,205 | | | | | | | | | | | | | | 1,205 | | Cash and cash equivalents | | 5,988 | | | 5,988 | | | | 14,489 | | | | 14,489 | | Net amount before financial expense | | 2,579 | | | (11,424 | ) | | (2,992 | ) | | (11,837 | ) | | | 5,882 | | | | (3,355 | ) | | | (3,544 | ) | | | (2,218 | ) | | | (3,404 | ) | | | (6,392 | ) | | | (13,031 | ) | Financial expense | | (561 | ) | | (1,389 | ) | | (270 | ) | | (2,220 | ) | | Financial expense on non-current financial debt | | | | (843 | ) | | | (729 | ) | | | (605 | ) | | | (450 | ) | | | (358 | ) | | | (1,195 | ) | | | (4,180 | ) | Interest differential on swaps | | | | 461 | | | | 334 | | | | 153 | | | | 33 | | | | 2 | | | | (78 | ) | | | 905 | | Net amount | | 2,018 | | | (12,813 | ) | | (3,262 | ) | | (14,057 | ) | | | 5,500 | | | | (3,750 | ) | | | (3,996 | ) | | | (2,635 | ) | | | (3,760 | ) | | | (7,665 | ) | | | (16,306 | ) | | | | | | | | As of December 31, 2006(M€) | | Less than
one year | | Between 1 year
and 5 years | | More than
5 years | | Total | | | Non-current financial debt — net of hedging instruments | | | | (10,733 | ) | | (2,955 | ) | | (13,688 | ) | | | As of December 31, 2009
(M€) Assets/(Liabilities) | | | Less than
one year | | 1-2 years | | 2-3 years | | 3-4 years | | 4-5 years | | More than
5 years | | Total | | Non-current financial debt (notional value excluding interests) | | | | | | (3,658 | ) | | | (3,277 | ) | | | (3,545 | ) | | | (2,109 | ) | | | (5,823 | ) | | | (18,412 | ) | Current borrowings | | (5,858 | ) | | | | | | (5,858 | ) | | | (6,994 | ) | | | | | | | | | | | | | (6,994 | ) | Other current financial liabilities | | (75 | ) | | | | | | (75 | ) | | | (123 | ) | | | | | | | | | | | | | (123 | ) | Current financial assets | | 3,908 | | | | | | | 3,908 | | | | 311 | | | | | | | | | | | | | | 311 | | Cash and cash equivalents | | 2,493 | | | 2,493 | | | | 11,662 | | | | 11,662 | | Net amount before financial expense | | 468 | | | (10,733 | ) | | (2,955 | ) | | (13,220 | ) | | | 4,856 | | | | (3,658 | ) | | | (3,277 | ) | | | (3,545 | ) | | | (2,109 | ) | | | (5,823 | ) | | | (13,556 | ) | Financial expense | | (567 | ) | | (1,302 | ) | | (160 | ) | | (2,029 | ) | | Financial expense on non-current financial debt | | | | (768 | ) | | | (697 | ) | | | (561 | ) | | | (448 | ) | | | (301 | ) | | | (1,112 | ) | | | (3,887 | ) | Interest differential on swaps | | | | 447 | | | | 233 | | | | 100 | | | | 25 | | | | (16 | ) | | | (55 | ) | | | 734 | | Net amount | | (99 | ) | | (12,035 | ) | | (3,115 | ) | | (15,249 | ) | | | 4,535 | | | | (4,122 | ) | | | (3,738 | ) | | | (3,968 | ) | | | (2,426 | ) | | | (6,990 | ) | | | (16,709 | ) |
In addition, the Group guarantees bank debt and finance lease obligations of certain non-consolidated companies and equity affiliates. A payment would be triggered by failure of the guaranteed party to fulfill its obligation covered by the guarantee, and no assets are held as collateral for these guarantees. Maturity dates and amounts are set forth in Note 23 to the Consolidated Financial Statements (“Guarantees given against borrowings”). The Group also guarantees the current liabilities of certain non-consolidated companies. Performance under these guarantees would be triggered by a financial default of these entities. Maturity dates and amounts are set forth in Note 23 to the Consolidated Financial Statements (“Guarantees of current liabilities”). The following table sets forth financial assets and liabilities related to operating activities as of December 31, 2011, 2010 and 2009 (see Note 28 to the Consolidated Financial Statements). | | | | | | | | | | | | | As of December 31 (M€)
Assets/(Liabilities) | | 2011 | | | 2010 | | | 2009 | | Accounts payable | | | (22,086 | ) | | | (18,450 | ) | | | (15,383 | ) | Other operating liabilities | | | (5,441 | ) | | | (3,574 | ) | | | (4,706 | ) | including financial instruments related to commodity contracts | | | (606 | ) | | | (559 | ) | | | (923 | ) | Accounts receivable, net | | | 20,049 | | | | 18,159 | | | | 15,719 | | Other operating receivables | | | 7,467 | | | | 4,407 | | | | 5,145 | | including financial instruments related to commodity contracts | | | 1,074 | | | | 499 | | | | 1,029 | | Total | | | (11 | ) | | | 542 | | | | 775 | |
These financial assets and liabilities mainly have a maturity date below one year. Credit risk Credit risk is defined as the risk of the counterparty to a contract failing to perform or pay the amounts due. The Group is exposed to credit risks in its operating and financing operations.activities. The Group’s maximum exposure to credit risk is partially related to financial assets recorded on its balance sheet, including energy derivative instruments that have a positive market value. The following table presents the Group’s maximum credit risk exposure: | | As of December 31,(M€) | | | | ASSETS/(LIABILITIES) | | 2008 | | 2007 | | 2006 | | As of December 31, (M€) Assets/
(Liabilities) | | | 2011 | | 2010 | | 2009 | | Loans to equity affiliates
(Note 12) | | 2,005 | | 2,575 | | 1,533 | | | 2,246 | | | | 2,383 | | | | 2,367 | | Loans and advances(Note 14) | | 1,403 | | 851 | | 1,025 | | | 2,055 | | | | 1,596 | | | | 1,284 | | Hedging instruments of non-current financial debt(Note 20) | | 892 | | 460 | | 486 | | | 1,976 | | | | 1,870 | | | | 1,025 | | Accounts receivable(Note 16) | | 15,287 | | 19,129 | | 17,393 | | | 20,049 | | | | 18,159 | | | | 15,719 | | Other operating receivables (Note 16) | | 6,208 | | 4,430 | | 4,267 | | | 7,467 | | | | 4,407 | | | | 5,145 | | Current financial assets
(Note 20) | | 187 | | 1,264 | | 3,908 | | | 700 | | | | 1,205 | | | | 311 | | Cash and cash equivalents(Note 27) | | 12,321 | | 5,988 | | 2,493 | | | 14,025 | | | | 14,489 | | | | 11,662 | | Total | | 38,303 | | 34,697 | | 31,105 | | | 48,518 | | | | 44,109 | | | | 37,513 | |
The valuation allowance on loans and advances and on accounts receivable and other operating receivables is detailed respectively in Notes 14 and 16 to the Consolidated Financial Statements. As part of its credit risk management related to operating and financing activities, the Group has developed margin call contracts with certain counterparties. As of December 31, 2011, the net amount received as part of these margin calls was€1,682 million (against€1,560 million as of December 31, 2010 and€693 million as of December 31, 2009). Credit risk is managed by the Group’s business segments as follows: | - | Exploration & Production |
Risks arising under contracts with government authorities or other oil companies or under long-term supply contracts necessary for the development of projects are evaluated during the project approval process. The long-term aspect of these contracts and the high-quality of the other parties lead to a low level of credit risk. Risks related to commercial operations, other than those described above (which are, in practice, directly monitored by subsidiaries), are subject to procedures for establishing and reviewing credit. Customer receivables are subject to provisions on a case-by-case basis, based on prior history and management’s assessment of the facts and circumstances. The Gas & Power division deals with counterparties in the energy, industrial and financial sectors throughout the world, primarily in Europe and North America.world. Financial institutions providing credit risk coverage are highly rated international bank and insurance groups. Potential counterparties are subject to credit assessment and approval before concluding transactions and are thereafter subject to regular review, including re-appraisal and approval of the limits previously granted. The creditworthiness of counterparties is assessed based on an analysis of quantitative and qualitative data regarding financial standing and business risks, together with the review of any relevant third party and market information, such as data published by rating agencies. On this basis, credit limits are defined for each potential counterparty and, where appropriate, transactions are subject to specific authorizations.authorisations. Credit exposure, which is essentially an economic exposure or an expected future physical exposure, is permanently monitored and subject to sensitivity measures. Credit risk is mitigated by the systematic use of industry standard contractual frameworks that permit netting, enable to requirerequiring added security in case of adverse change in the counterparty risk, and allow for termination of the contract upon occurrence of certain events of default. Downstream SegmentRefining & Marketing
Internal procedures for the Refining & Marketing division include rules on credit risk that describe the basis of internal control in this domain, including the separation of authority between commercial and financial operations. Credit policies are defined at the local level, complemented by the implementation of procedures to monitor customer risk (credit committees at the subsidiary level, the creation of credit limits for corporate customers, portfolio guarantees, etc.). Each entity also implements monitoring of its outstanding receivables. Risks related to credit may be mitigated or limited by subscription of credit insurance and/or requiring security or guarantees. Bad debts are provisioned on a case-by-case basis at a rate determined by management based on an assessment of the facts and circumstances.risk of credit loss. Trading & Shipping deals with commercial counterparties and financial institutions located throughout the world. Counterparties to physical and derivative transactions are primarily entities involved in the oil and gas industry or in the trading of energy commodities, or financial institutions. Credit risk coverage is concluded with financial institutions, international banks and insurance groups selected in accordance with strict criteria. The Trading & Shipping division has a strict policy of internal delegation of authority governing establishment of country and counterparty credit limits and approval of specific transactions. Credit exposures contracted under these limits and approvals are monitored on a daily basis. Potential counterparties are subject to credit assessment and approval prior to any transaction being concluded and all active counterparties are subject to regular reviews, including re-appraisal and approval of granted limits. The creditworthiness of counterparties is assessed based on an analysis of quantitative and qualitative data regarding financial standing and business risks, together with the review of any relevant third party and market information, such as ratings published by Standard & Poor’s, Moody’s Investors Service and other agencies. Contractual arrangements are structured so as to maximize the risk mitigation benefits of netting between transactions wherever possible and additional protective terms providing for the provision of security in the event of financial deterioration and the termination of transactions on the occurrence of defined default events are used to the greatest permitted extent. Credit risks in excess of approved levels are secured by means of letters of credit and other guarantees, cash deposits and insurance arrangements. In respect of derivative transactions, risks are secured by formal margining agreementsmargin call contracts wherever possible. Credit risk in the Chemicals segment is primarily related to commercial receivables. Each division implements procedures for managing and provisioning credit risk that differ based on the size of the subsidiary and the market in which it operates. The principal elements of these procedures are: implementation of credit limits with different authorization procedures for possible credit overruns; use of insurance policies or specific guarantees (letters of credit); regular monitoring and assessment of overdue accounts (aging balance), including collection procedures; and provisioning of bad debts on a customer-by-customer basis, according to payment delays and local payment practices.practices (provisions may also be calculated based on statistics). 32) OTHER RISKS AND CONTINGENT LIABILITIES
| 32) | | OTHER RISKS AND CONTINGENT LIABILITIES |
TOTAL is not currently aware of any exceptional event, litigation,dispute, risks or contingent liabilities that could have a material impact on the assets and liabilities, results, financial condition, assets, resultsposition or businessoperations of the Group. Antitrust InvestigationsThe contingent commitments and contractual obligations are detailed in note 23 to the consolidated financial statement.
1) Following investigations into certain commercial practicesANTITRUST INVESTIGATIONS
The principal antitrust proceedings in which the chemicals industry in the United States, some subsidiaries of the Arkema(1) groupGroup’s companies are involved in civil liability lawsuits in the United States and Canada for violations of antitrust laws. TOTAL S.A. has been named in certain of these suits as the parent company.are described hereafter. F-81
Chemicals (1)• | | Arkema is used in this section to designate those companiesAs part of the spin-off of Arkema group whose ultimate parent company is Arkema S.A. Arkema became an independent company after being spun-off from(1) in 2006, TOTAL S.A. in May 2006.or certain other Group companies agreed to grant Arkema a guarantee for potential monetary consequences related to antitrust proceedings arising from events prior to the spin-off.
|
In Europe, the European Commission commenced investigations in 2000, 2003 and 2004 into alleged anti-competitive practices involving certain products sold by Arkema. In January 2005, under one of these investigations, the European Commission fined Arkema 13.5 M€ and jointly fined Arkema and Elf Aquitaine 45 M€. Arkema and Elf Aquitaine have appealed these decisions to the Court of First Instance of the European Union.
The Commission notified Arkema, TOTAL S.A. and Elf Aquitaine of complaints concerning two other product lines in January and August 2005, respectively. Arkema has cooperated with the authorities in these procedures and investigations. In May 2006, the European Commission fined Arkema 78.7 M€ and 219.1 M€, as a result of, respectively, each of these two proceedings. Elf Aquitaine was held jointly and severally liable for, respectively, 65.1 M€ and 181.35 M€ of these fines while TOTAL S.A. was held jointly and severally liable, respectively, for 42 M€ and 140.4 M€. TOTAL S.A., Arkema and Elf Aquitaine have appealed these decisions to the Court of First Instance of the European Union.
Arkema and Elf Aquitaine received a statement of objections from the European Commission in August 2007 concerning alleged anti-competitive practices related to another line of chemical products. As a result, Arkema and Elf Aquitaine have been jointly and severally fined in an amount of 22.7 M€ and individually in an amount of 20.43 M€ for Arkema and 15.89 M€ for Elf Aquitaine. The companies concerned appealed this decision to the relevant European court.
No facts have been alleged that would implicate TOTAL S.A. or Elf Aquitaine in the practices questioned in these proceedings, and the fines received are based solely on their status as parent companies.
Arkema began implementing compliance procedures in 2001 that are designed to prevent its employees from violating antitrust provisions. However, it is not possible to exclude the possibility that the relevant authorities could commence additional proceedings involving Arkema, as well as TOTAL S.A. and Elf Aquitaine.
2) As part of the agreement relating to the spin-off of Arkema, TOTAL S.A. or certain other Group companies agreed to grant Arkema guarantees for certain risks related to antitrust proceedings arising from events prior to the spin-off.
These guarantees cover,This guarantee covers, for a period of ten years that began in 2006,from the date of the spin-off, 90% of amounts paid by Arkema related to (i) fines imposed by European authorities or European member-states for competition law violations, (ii) fines imposed by U.S. courts or antitrust authorities for federal antitrust violations or violations of the competition laws of U.S. states, (iii) damages awarded in civil proceedings related to the government proceedings mentioned above, and (iv) certain costs related to these proceedings.
The guarantee covering the risks related to anti-competition violations in Europe applies to amounts above a 176.5 M€176.5 million threshold. On the other hand, the agreements provide that Arkema will indemnify TOTAL S.A. or any Group company for 10% of any amount that TOTAL S.A. or any Group company are required to pay under any of the proceedings covered by this guarantee, in Europe. If one or more individuals or legal entities, acting alone or together, directly or indirectly holds more than one-third of the voting rights of Arkema, or if Arkema transfers more than 50% of its assets (as calculated under the enterprise valuation method, as of the date of the transfer) to a third party or parties acting together, irrespective of the type or number of transfers, these guaranteesthis guarantee will become void. On
In the other hand, the agreements provide that Arkema will indemnifyUnited States, civil liability lawsuits, for which TOTAL S.A. or any Group company for 10% of any amount that TOTAL S.A. or any Grouphas been named as the parent company, are required to pay under any ofclosed without significant impact on the proceedings covered by these guarantees.Group’s financial position. 3) The Group has recorded provisions amounting to 85 M€ in its consolidated financial statements as of December 31, 2008 to cover the risks mentioned above.
4) Moreover, as a result of investigations started byIn Europe, since 2006, the European Commission in October 2002 concerning certain Refining & Marketing subsidiarieshas fined companies of the Group Total Nederland N.V. andin its configuration prior to the spin-off an overall amount of€385.47 million, of which Elf Aquitaine and/or TOTAL S.A. receivedwere held jointly liable for€280.17 million, Elf Aquitaine being personally fined€23.6 million for deterrence. These fines are entirely settled as of today.
As a statementresult, since the spin-off, the Group has paid the overall amount of objections in October 2004. These proceedings€188.07 million(2), corresponding to 90% of the fines overall amount once the threshold provided for by the guarantee is deducted to which an amount of€31.31 million of interest has been added as explained hereinafter. The European Commission imposed these fines following investigations between 2000 and 2004 into commercial practices involving eight products sold by Arkema. Five of these investigations resulted in September 2006, in Total Nederland N.V. being fined 20.25 M€ and in TOTAL S.A. as its parent company being held jointly responsible for 13.5 M€ of this amount, although no facts implicating TOTAL S.A. in the practices under investigation were alleged. TOTAL S.A. and Total Nederland N.V. have appealed this decision to the Court of First Instance of the European Union. In addition, in May 2007, Total France and TOTAL S.A. received a statement of objections regarding alleged antitrust practices concerning another product line of the Refining & Marketing division. These proceedings resulted, in October 2008, in Total France being fined 128.2 M€ and in TOTAL S.A., as its parent company, being held jointly responsible although no facts implicating TOTAL S.A. in the practices under investigation were alleged. TOTAL S.A. and Total
Raffinage & Marketing (the new corporate name of Total France) have appealed this decision to the Court of First Instance of the European Union.
5) Given the discretionary powers granted toprosecutions from the European Commission for determining fines relating to antitrust regulations, it is not currently possible to determine with certaintywhich Elf Aquitaine has been named as the outcomeparent company, and two of these investigations and proceedings. named TOTAL S.A. as the ultimate parent company of the Group.
TOTAL S.A. and Elf Aquitaine are contesting their liability based solely on their status as parent companies and appealed for cancellation and reformation of the rulings that are still pending before the relevant EU court of appeals or supreme court of appeals. During the year 2011, four of the proceedings have evolved and are closed as far as Arkema is concerned: | – | | In one of these proceedings, the Court of Justice of the European Union (CJEU) has rejected the action of Arkema while the decisions of the European Commission and of the General Court of the European Union against the parent companies have been squashed. Consequently, this proceeding is definitively closed regarding Arkema as well as the parent companies. |
| – | | In two other proceedings, previous decisions against Arkema and the parent companies have been upheld by the General Court of the European Union. While the parent companies have introduced an appeal before the CJEU, Arkema did not appeal to the CJEU. |
| – | | Finally, in a last proceeding, the General Court has decided to reduce the amount of the fine initially ordered against Arkema while, in parallel, it has rejected the actions of the parent companies that have remained obliged to pay the whole amount of the fine initially ordered by the European Commission. Arkema has accepted this decision while the parent companies have introduced an appeal before the CJEU. |
F-90 | (1) | Arkema is used in this section to designate those companies of the Arkema group whose ultimate parent company is Arkema S.A. Arkema became an independent company after being spun-off from TOTAL S.A. in May 2006. |
| (2) | This amount does not take into account a case that led to Arkema, prior to Arkema’s spin-off from TOTAL, and Elf Aquitaine being fined jointly€45 million and Arkema being fined€13.5 million. |
With the exception of the€31.31 million of interest charged by the European Commission to the parent companies, which has been required to pay in accordance with the decision concerning the last proceeding referred hereinabove, the evolution of the proceedings during the year 2011 did not modify the global amount assumed by the Group in execution of the guarantee. In addition, civil proceedings against Arkema and other groups of companies were initiated in 2009 and 2011, respectively, before German and Dutch courts by third parties for alleged damages pursuant to two of the above mentioned legal proceedings. TOTAL S.A. was summoned to serve notice of the dispute before the German court. At this point, the probability to have a favorable verdict and the methodfinancial impacts of determining these fines. Althoughproceedings are uncertain due to the number of legal difficulties they give rise to, the lack of documented claims and evaluations of the alleged damages. Arkema began implementing compliance procedures in 2001 that are designed to prevent its employees from violating antitrust provisions. However, it is not possible to predictexclude the ultimate outcomepossibility that the relevant authorities could commence additional proceedings involving Arkema regarding events prior to the spin-off, as well as Elf Aquitaine and/or TOTAL S.A. based on their status as parent company. Within the framework of all of the legal proceedings described above, a€17 million reserve remains booked in the Group’s consolidated financial statements as of December 31, 2011. Downstream Pursuant to a statement of objections received by Total Nederland N.V. and TOTAL S.A. (based on its status as parent company) from the European Commission, Total Nederland N.V. was fined€20.25 million in 2006, for which TOTAL S.A. was held jointly liable for€13.5 million. TOTAL S.A. appealed this decision before the relevant court and this appeal is still pending. In addition, pursuant to a statement of objections received by Total Raffinage Marketing (formerly Total France) and TOTAL S.A. from the European Commission regarding another product line of the Refining & Marketing division, Total Raffinage Marketing was fined€128.2 million in 2008, which has been paid, and for which TOTAL S.A. was held jointly liable based on its status as parent company. TOTAL S.A. also appealed this decision before the relevant court and this appeal is still pending. In addition, civil proceedings against TOTAL S.A and Total Raffinage Marketing and other companies were initiated before U.K and Dutch courts by third parties for alleged damages in connection with the prosecutions brought by the European Commission in this case. At this point, the probability to have a favorable verdict and the financial impacts of these procedures are uncertain due to the number of legal difficulties they gave rise to, the lack of documented claims and evaluations of the alleged damages. Within the framework of the legal proceedings described above, a€30 million reserve is booked in the Group’s consolidated financial statements as of December 31, 2011. Whatever the evolution of the proceedings described above, the Group believes that they willtheir outcome should not have a material adverse effect on the Group’s financial situation or consolidated results. GRANDE PAROISSE An explosion occurred at the Grande Paroisse industrial site in the city of Toulouse in France on September 21, 2001. Grande Paroisse, a former subsidiary of Atofina which became a subsidiary of Elf Aquitaine Fertilisants on December 31, 2004, as part of the reorganization of the Chemicals segment, was principally engaged in the production and sale of agricultural fertilizers. The explosion, which involved a stockpile of ammonium nitrate pellets, destroyed a portion of the site and caused the death of thirty-one people, including twenty-one workers at the site, and injured many others. The explosion also caused significant damage to certain property in part of the city of Toulouse. This plant has been closed and individual assistance packages have been provided for employees. The site has been rehabilitated. On December 14, 2006, Grande Paroisse signed, under the supervision of the city of Toulouse, the deed whereby it donated the former site of the AZF plant to the greater agglomeration of Toulouse (CAGT) and theCaisse des dépôts et consignations and its financial condition or results.subsidiary ICADE. Under this deed, TOTAL S.A. guaranteed the site restoration obligations of Grande Paroisse and granted a€10 million endowment to the InNaBioSanté research foundation as part of the setting up of a cancer research center at the site by the city of Toulouse. Regarding the cause of the explosion, the hypothesis that the explosion was caused by Grande Paroisse through the accidental mixing of hundreds of kilos of a chlorine compound at a storage site for ammonium nitrate was discredited over the course of the investigation. As a result, proceedings against ten of the eleven Grande Paroisse employees charged during the criminal investigation conducted by the Toulouse Regional Court (Tribunal de grande instance) were dismissed and this dismissal was upheld on appeal. Nevertheless, the final experts’ report filed on May 11, 2006 continued to focus on the hypothesis of a chemical accident, although this hypothesis was not confirmed during the attempt to reconstruct the accident at the site. After having articulated several hypotheses, the experts no longer maintain that the accident was caused by pouring a large quantity of a chlorine compound over ammonium nitrate. Instead, the experts have retained a scenario where a container of chlorine compound sweepings was poured between a layer of wet ammonium nitrate covering the floor and a quantity of dry agricultural nitrate at a location not far from the principal storage site. This is claimed to have caused an explosion which then spread into the main storage site. Grande Paroisse was investigated based on this new hypothesis in 2006; Grande Paroisse is contesting this explanation, which it believes to be based on elements that are not factually accurate. All the requests for additional investigations that were submitted by Grande Paroisse, the former site manager and various plaintiffs were denied on appeal after the end of the criminal investigation procedure. On July 9, 2007, the investigating judge brought charges against Grande Paroisse and the former plant manager before the criminal chamber of the Court of Appeal of Toulouse. In late 2008, TOTAL S.A. and Mr. Thierry Desmarest were summoned to appear in Court pursuant to a request by a victims association. The trial for this case began on February 23, 2009, and lasted approximately four months. On November 19, 2009, the Toulouse Criminal Court acquitted both the former Plant Manager, and Grande Paroisse due to the lack of reliable evidence for the explosion. The Court also ruled that the summonses against TOTAL S.A. and Mr. Thierry Desmarest, Chairman and CEO at the time of the disaster, were inadmissible. Due to the presumption of civil liability that applied to Grande Paroisse, the Court declared Grande Paroisse civilly liable for the damages caused by the explosion to the victims in its capacity as custodian and operator of the plant. The Prosecutor’s office, together with certain third parties, has appealed the Toulouse Criminal Court verdict. In order to preserve its rights, Grande Paroisse lodged a cross-appeal with respect to civil charges. The appeal proceedings before the Court of Appeal of Toulouse started on November 3, 2011. A compensation mechanism for victims was set up immediately following the explosion.€2.3 billion was paid for the compensation of claims and related expenses amounts. As of December 31, 2011, a€21 million reserve was recorded in the Group’s consolidated balance sheet. BUNCEFIELD On December 11, 2005, several explosions, followed by a major fire, occurred at an oil storage depot at Buncefield, north of London. This depot iswas operated by Hertfordshire Oil Storage Limited (HOSL), a company in which the BritishTOTAL’s UK subsidiary of TOTAL holds 60% and another oil group holds 40%. The explosion caused injuries, most of which were minor injuries, to a number of people and caused property damage to the depot and the buildings and homes located nearby. The official Independent Investigation Board has indicated that the explosion was caused by the overflow of a tank at the depot. The Board’s final report was released on December 11, 2008. At this stage, responsibility for the explosion has not yet been determined. The civil procedure for claims, which havehad not yet been settled, took place between October and December 2008. The Court’s decision of March 20, 2009, declared TOTAL’s UK subsidiary liable for the accident and solely liable for indemnifying the victims. The subsidiary appealed the decision. The appeal trial court is expectedtook place in January 2010. The Court of Appeals, by a decision handed down on March 4, 2010, confirmed the first quarter 2009.prior judgment. The Supreme Court of United Kingdom has partially authorized TOTAL’s UK subsidiary to contest the decision. TOTAL’s UK subsidiary finally decided to withdraw from this recourse due to settlement agreements reached in mid-February 2011. The Group carries insurance for damage to its interests in these facilities, business interruption and civil liability claims from third parties, andparties. The provision for the civil liability that appears in the Group’s consolidated financial statements as of December 31, 2011, stands at€80 million after taking into account the payments previously made. The Group believes that, based on the information currently available, on a reasonable estimate of its liability and on provisions recognized, this accident should not have a significant impact on the Group’s financial situation or consolidated results. OnIn addition, on December 1, 2008, the Health and Safety Executive (HSE) and the Environment Agency (EA) issued a Notice of prosecution against five companies, including TOTAL’s UK subsidiary. By a judgment on July 16, 2010, the British subsidiary was fined £3.6 million and paid it. The decision takes into account a number of TOTAL. An initial court hearing is expected inelements that have mitigated the second quarter 2009.
VENEZUELA
On February 26, 2007 the Venezuelan president signed a decree providing for the transformationimpact of the Strategic Associations fromcharges brought against it.
ERIKA Following the Faja region (including Sincor), into mixed companies with the government having a minimum interest of 60%. The legislation further stated that operations were to be transferred to PDVSA no later than May 1, 2007, and that the private companies were to have a four-month period to reach an agreement on the terms and conditions of their interestsinking in the mixed companies.
Within this framework, TOTAL signed two agreements with PDVSA and Statoil, with the approvalDecember 1999 of the ministry in charge of energy and oil:
On April 25, 2007, an agreement accordingErika, a tanker that was transporting products belonging to which the control of Sincor operations was transferred temporarily, from May 1, 2007, to PDVSA;
On June 26, 2007, heads of agreement providing for the transformationone of the Sincor association into a mixed company. Pursuant to these headsGroup companies, theTribunal de grande instance of agreement, TOTAL’s share in the project decreased from 47% to 30.323%, PDVSA’s interest increased from 38% to 60% and Statoil’s interest decreased from 15% to 9.677%. This agreement also provides for compensation to be awarded toParis convicted TOTAL with the amount to be negotiated based on the valueS.A. of the assets.
The conditions of this transformation were approved by the National Assembly in October 2007. Presidential decrees regarding the creation of the mixed company, PetroCedeño and the transfer of the rights to conduct the principal activities were published in the Venezuelan official gazette on November 9, 2007 and January 10, 2008, respectively. The finalization of the transformation process occurred on February 8, 2008.
In the Group’s financial statements, PetroCedeño (formerly Sincor) was consolidated by the equity method as of December 31, 2007 at 30.323%; special items related to this transformation into a mixed company were booked as of the first quarter 2008.
KAZAKHSTAN
On January 14, 2008, members of NCSPSA (North Caspian Sea Production Sharing Agreement) and the Kazakh authorities signed a Memorandum of Understanding to end the dispute among them that began at the end of August 2007. The final agreements, which are necessary to the implementation of this Memorandum of Understanding and of the additional protocol signed on June 25, 2008, were signed on October 31, 2008. An update of the costs and schedule of the first development phase has been proposed to and accepted by the authorities.
According to these protocols and agreements:
A decrease in the foreign partners’ interest in favor of KMG (KazMunaiGas) decreases TOTAL’s share in this permit from 18.52% to 16.81%; and
The financial terms are modified in favor of the Republic of Kazakhstan by (i) the implementation of a priority payment representing a percentage of the sales depending on crude oil prices, (ii) an increase in the production bonus, and (iii) a decrease in the interest rate on recoverable investments depending on crude oil prices.
SINKING OF THE ERIKA
Pursuantmarine pollution pursuant to a judgment issued on January 16, 2008, theTribunal de grande instance of Paris foundfinding that TOTAL S.A. was negligent in its vetting procedure for vessel selection.selection, and ordering TOTAL S.A. was finedto pay a fine of€375,000. The courtCourt also ordered compensation to be paid to those affected by the victims of pollution from the Erika up to an aggregate amount of 192 M€,192 million, declaring TOTAL S.A. jointly and severally liable for such payments together with the Erika’s inspection and classification firm, the Erika’s owner and the Erika’s manager.
TOTAL believes that the finding of negligence and the related conviction for marine pollution are without substance as a matter of fact and as a matter of law. TOTAL also considers that this verdict is contrary to the intended aim of enhancing maritime transport safety.
TOTAL has appealed the verdict of January 16, 2008. In the meantime, it has nevertheless proposed to pay third parties who so requestrequested definitive compensation as determined by the court. As of today, thirty-sixCourt. Forty-two third parties have received compensation payments, representingbeen compensated for an aggregate amount of 170.1 M€.171.5 million. The hearing of the appeal beforeBy a decision dated March 30, 2010, the Court of AppealsAppeal of Paris is expectedupheld the lower Court verdict pursuant to beginwhich TOTAL S.A. was convicted of marine pollution and fined€375,000. TOTAL appealed this decision to the French Supreme Court (Cour de cassation).
However, the Court of Appeal ruled that TOTAL S.A. bears no civil liability according to the applicable international conventions and consequently ruled that TOTAL S.A. be not convicted. To facilitate the payment of damages awarded by the Court of Appeal in October 2009. AtParis to third parties against Erika’s controlling and classification firm, the current stageship-owner and the ship-manager, a global settlement agreement was signed late 2011 between these parties and TOTAL S.A. under the auspices of the IOPC Fund. Under this global settlement agreement, each party agreed to the withdrawal of all civil proceedings initiated against all other parties to the agreement.
TOTAL S.A. believes that, based on a reasonable estimate of its liability,the information currently available, the case willshould not have a materialsignificant impact on the Group’s financial situation or consolidated results. BLUE RAPID AND THE RUSSIAN OLYMPIC COMMITTEE — RUSSIAN REGIONS AND INTERNEFT Blue Rapid, a Panamanian company, and the Russian Olympic Committee filed a claim for damages with the Paris Commercial Court against Elf Aquitaine, alleging a so-called non-completion by a former subsidiary of Elf Aquitaine of a contract related to an exploration and production project in Russia negotiated in the early 1990s. Elf Aquitaine believed this claim to be unfounded and opposed it. On January 12, 2009, the Commercial Court of Paris rejected Blue Rapid’s claim against Elf Aquitaine and found that the Russian Olympic Committee did not have standing in the matter. Blue Rapid and the Russian Olympic Committee appealed this decision. On June 30, 2011, the Court of Appeal of Paris dismissed as inadmissible the claim of Blue Rapid and the Russian Olympic Committee against Elf Aquitaine, notably on the grounds of the contract’s termination. Blue Rapid and the Russian Olympic Committee appealed this decision to the French Supreme Court. In connection with the same facts, and fifteen years after the termination of the exploration and production contract, a Russian company, which was held not to be the contracting party to the contract, and two regions of the Russian Federation which were not even parties to the contract, have launched an arbitration procedure against the aforementioned former subsidiary of Elf Aquitaine that was liquidated in 2005, claiming alleged damages of U.S.$ 22.4 billion. For the same reasons as those successfully adjudicated by Elf Aquitaine against Blue Rapid and the Russian Olympic Committee, the Group considers this claim to be unfounded as to a matter of law or fact. The Group has lodged a criminal complaint to denounce the fraudulent claim which the Group believes it is a victim of and, has taken and reserved its rights to take other actions and measures to defend its interests. IRAN In 2003, the United States Securities and Exchange Commission (SEC) followed by the Department of Justice (DoJ) issued a formal order directing an investigation in connection with the pursuit of business in Iran, by certain oil companies including, among others, TOTAL. The inquiry concerns an agreement concluded by the Company with a consultant concerning a gas field in Iran and aims to verify whether certain payments made under this agreement would have benefited Iranian officials in violation of the Foreign Corrupt Practices Act (FCPA) and the Company’s accounting obligations. Investigations are still pending and the Company is cooperating with the SEC and the DoJ. In 2010, the Company opened talks with U.S. authorities, without any acknowledgement of facts, to consider an out-of-court settlement as it is often the case in this kind of proceeding. Late in 2011, the SEC and the DoJ proposed to TOTAL out-of-court settlements that would close their inquiries, in exchange for TOTAL’s committing to a number of obligations and paying fines. As TOTAL was unable to agree to several substantial elements of the proposal, the Company is continuing discussions with the U.S. authorities. The Company is free not to accept an out-of-court settlement solution, in which case it would be exposed to the risk of prosecution in the United States. In this same affair, a parallel judicial inquiry related to TOTAL was initiated in France in 2006. In 2007, the Company’s Chief Executive Officer was placed under formal investigation in relation to this inquiry, as the former President of the Middle East department of the Group’s Exploration & Production division. The Company has not been notified of any significant developments in the proceedings since the formal investigation was launched. At this point, the Company cannot determine when these investigations will terminate, and cannot predict their results, or the outcome of the talks that have been initiated. Resolving these cases is not expected to have a significant impact on the Group’s financial situation or consequences on its future planned operations. OIL-FOR-FOOD PROGRAM Several countries have launched investigations concerning possible violations related to the United Nations (UN) Oil-for-Food program in Iraq. Pursuant to a French criminal investigation, certain current or former Group employees were placed under formal criminal investigation for possible charges as accessories to the misappropriation of corporate assets and as accessories to the corruption of foreign public agents. The Chairman and Chief Executive Officer of the Company, formerly President of the Group’s Exploration & Production division, was also placed under formal investigation in October 2006. In 2007, the criminal investigation was closed and the case was transferred to the Prosecutor’s office. In 2009, the Prosecutor’s office recommended to the investigating judge that the case against the Group’s current and former employees and TOTAL’s Chairman and Chief Executive Officer not be pursued. In early 2010, despite the recommendation of the Prosecutor’s office, a new investigating judge, having taken over the case, decided to indict TOTAL S.A. on bribery charges as well as complicity and influence peddling. The indictment was brought eight years after the beginning of the investigation without any new evidence being introduced. In October 2010, the Prosecutor’s office recommended to the investigating judge that the case against TOTAL S.A., the Group’s current and former employees and TOTAL’s Chairman and Chief Executive Officer not be pursued. However, by ordinance notified in early August 2011, the investigating judge on the matter decided to send the case to trial. The Company believes that its activities related to the Oil-for-Food program have been in compliance with this program, as organized by the UN in 1996. The Volcker report released by the independent investigating committee set up by the UN had discarded any bribery grievance within the framework of the Oil-For-Food program with respect to TOTAL. ITALY 33) OTHER INFORMATIONAs part of an investigation led by the Prosecutor of the Republic of the Potenza Court, Total Italia and certain Group’s employees are the subject of an investigation related to certain calls for tenders that Total Italia made for the preparation and development of an oil field. On February 16, 2009, as a preliminary measure before the proceedings go before the Court, the preliminary investigation judge of Potenza served notice to Total Italia of a decision that would suspend the concession for this field for one year. Total Italia has appealed the decision by the preliminary investigation judge before the Court of Appeal of Potenza. In a decision dated April 8, 2009, the Court reversed the suspension of the concession and appointed for one year,i.e.until February 16, 2010, a judicial administrator to supervise the operations related to the development of the concession, allowing the Tempa Rossa project to continue.
The criminal investigation was closed in the first half of 2010. The preliminary hearing judge, who will decide whether the case shall be returned to the Criminal Court to be judged on the merits, held the first hearing on December 6, 2010. The proceedings before the Judge of the preliminary hearing are still pending. In 2010, Total Italia’s exploration and production operations were transferred to Total E&P Italia and refining and marketing operations were merged with those of Erg Petroli. LIBYA During the financial year 2011, the Group’s activities were affected by the security context in Libya, and the Group’s production was gradually shut down as from the end of February. The Group’s production started up again at the end of September 2011 on the offshore Al Jurf field located in zones 15, 16 & 32 (ex C137) at the level existing before the events, and has gradually restarted since October 2011 in onshore zones 129, 130 and 131. The restart of the Group’s production on the other onshore zones is expected to occur progressively in 2012. In June 2011, the United States Securities and Exchange Commission (SEC) issued to certain oil companies — including, among others, TOTAL — a formal request for information related to their operations in Libya. TOTAL is cooperating with this non public investigation. YEMEN During the financial year 2011, the Group’s activities were not significantly impacted by the security context in Yemen, but the Group nevertheless reorganized locally to minimize the risks to its personnel. In addition, on October 15, 2011, the gas pipeline supplying Yemen LNG was sabotaged, and then repaired with no delay, enabling LNG production to resume as from October 26, 2011. SYRIA In May 2011, the European Union adopted measures with criminal and financial penalties that prohibit the supply of certain equipment to Syria, as well as certain financial and asset transactions with respect to a list of named individuals and entities. These measures apply to European persons and to entities constituted under the laws of a EU Member State. In September 2011, the EU adopted further measures, including, notably, a prohibition on the purchase, import or transportation from Syria of crude oil and petroleum products. Since early September 2011, the Group ceased to purchase hydrocarbons from Syria. On December 1, 2011, the EU extended sanctions against, among others, three state-owned Syrian oil firms, including General Petroleum Corporation, the Group’s co-contracting partner in PSA 1988 (Deir Es Zor license) and the Tabiyeh contract. Since early December 2011, TOTAL has ceased its activities that contribute to oil and gas production in Syria. A) RESEARCH AND DEVELOPMENT COSTS33)OTHER INFORMATION
Research and development costs incurred by the Group in 20082011 amounted to 612 M€ (594 M776 million (€715 million in 20072010 and 569 M€650 million in 2006)2009), corresponding to 0.3%0.4% of the sales. The staff dedicated in 20082011 to these research and development activities are estimated at 4,2853,946 people (4,216(4,087 in 20072010 and 4,0914,016 in 2006)2009). | 34) | | CHANGES IN PROGRESS IN THE GROUP STRUCTURE |
B) TAXES PAID TO MIDDLE EAST OIL-PRODUCING COUNTRIES FOR THE PORTION WHICH TOTAL HELD HISTORICALLY AS CONCESSIONS
Taxes paidsigned in March 2011 agreements for the portion thatacquisition in Uganda of a one-third interest in Blocks 1, 2 and 3A held by Tullow Oil plc for $1,467 million (amount as of January 1, 2010, to which will add costs of interim period). Following this acquisition, TOTAL held historically as concessions (Abu Dhabi offshorewould become an equal partner with Tullow and onshore, Dubai offshore, OmanCNOOC in the blocks, each with a one-third interest and Abu Al Bu Khoosh) included in operating expenses amounted to 3,301 M€ in 2008 (2,505 M€ in 2007 and 2,906 M€ in 2006).
C) CARBON DIOXIDE EMISSION RIGHTS
The principles governingeach being an operator of one of the accounting for emission rights are presented in Note 1 paragraph Tblocks. Subject to the Consolidated Financial Statements.decision of the Authorities, TOTAL would be the operator of Block 1.
TOTAL announced in February 2012 the signature of an agreement with Sinochem to sell its interests in the Cusiana field and in OAM and ODC pipelines. This transaction is subject to approval by the relevant authorities. As of December 31, 2010, the sections “Assets classified as held for sale” and “Liabilities directly associated with the assets classified as held for sale” included the assets and liabilities of Total E&P Cameroun, of Joslyn and of photocure and coatings resins businesses. 35)CONSOLIDATION SCOPE As of December 31, 2008,2011, 870 entities are consolidated of which 783 are fully consolidated, and 87 are accounted for under the equity method (identified with the letter E). This simplified organizational chart shows the main consolidated entities. For each of them, the Group sites’ position for emission rightsinterest is balancedmentioned between delivered or acquired emission rights and emissions for the year 2008. 34) SPIN-OFF OF ARKEMA (2006)
The spin-offbrackets. This chart of Arkema that took place in 2006 led to the distribution of Arkema shares to TOTAL shareholders (other than TOTAL S.A). This operation can be analyzed as an exchange of non-monetary assets for TOTAL S.A. shareholders.
As IFRS do not contain specific rules for this type of transaction, the accounting treatment for the spin-off in TOTAL’s Consolidated Financial Statements has been based on Generally Accepted Accounting Principles in the United States (U.S. GAAP), and more particularly on opinion APB 29 (Accounting Principles Board Opinions) “Accounting for Non-monetary Transactions”.
All assets and liabilities which were spun-off have been derecognized on the basis of their net book value, with a corresponding decrease of consolidated shareholders’ equity and no impact on the Group’s Consolidated Statement of Income.
The spin-off of Arkema was approved by the shareholders’ meeting held on May 12, 2006. Since Arkema’s results for the period between April 1, 2006 and May 12, 2006, were not material, the deconsolidation has been completed on the basis of Arkema book values as of March 31, 2006, also taking into account the capital increase that took place in April 2006.
In accordance with IFRS 5 “Non-current assets held for sale and discontinued operations”, the contribution of Arkema entities has been reported as discontinued operations since Arkema can be clearly distinguished and has been spun off in a single and coordinated plan.
Financial information related to Arkema’s contribution to the Consolidated Financial Statements is presented below. This contributive informationlegal detentions is not directly comparable toexhaustive and does not reflect neither the combined and pro-forma accounts filed by Arkema foroperational structure nor the purposerelative economic size of the public listing of its shares, asGroup entities and the latter have been based on specific conventions mainly related to the consolidation scope, accounting options and indicators.business segments.
Tax losses of Arkema entities, as they occurred, have been used in the consolidated tax return of the Group.
| | | | Statement of income
As of December 31,(M€)
| | 2006 | | Revenues from sales
| | 1,497 | | Purchases and other operating expenses
| | (1,377 | ) | Depreciation of tangible assets
| | (53 | ) | | | Operating income
| | 67 | | Equity in income (loss) of affiliates, others
| | (42 | ) | Taxes
| | (30 | ) | | | Net income
| | (5 | ) | | | | | | | Balance sheet
As of December 31,(M€)
| | 2006(1) | | Non-current assets
| | 1,995 | | Working capital
| | 1,501 | | Provisions and other non-current liabilities
| | (1,090 | ) | Capital employed
| | 2,406 | | Net debt
| | (144 | ) | Shareholders’ equity
| | 2,262 | |
(1) | Detailed assets and liabilities which have been spun-off as of May 12, 2006. |
| | | | Statement of cash flow
For the year ended December 31,(M€)
| | 2006 | | Cash flow from operating activities
| | 53 | | Cash flow used in investing activities
| | (76 | ) | Cash flow from financing activities
| | (109 | ) | Net increase/decrease in cash and cash equivalents
| | (132 | ) | Effect of exchange rates and changes in consolidation scope
| | 113 | | Cash and cash equivalents at the beginning of the period
| | 84 | | Cash and cash equivalent at the end of the period
| | 65 | |
Earnings per share and fully-diluted earnings per share are presented below for continuing and discontinued operations.
| | | Earnings per share
For the year ended December 31,(€)
| | 2006 | Earnings per share of continuing operations
| | 5.13 | Earnings per share of discontinued operations
| | 0.00 | Earnings per share
| | 5.13 | | | Diluted earnings per share
For the year ended December 31,(€)
| | 2006 | Diluted earnings per share of continuing operations
| | 5.09 | Diluted earnings per share of discontinued operations
| | 0.00 | Diluted earnings per share
| | 5.09 |
35) CONSOLIDATION SCOPE
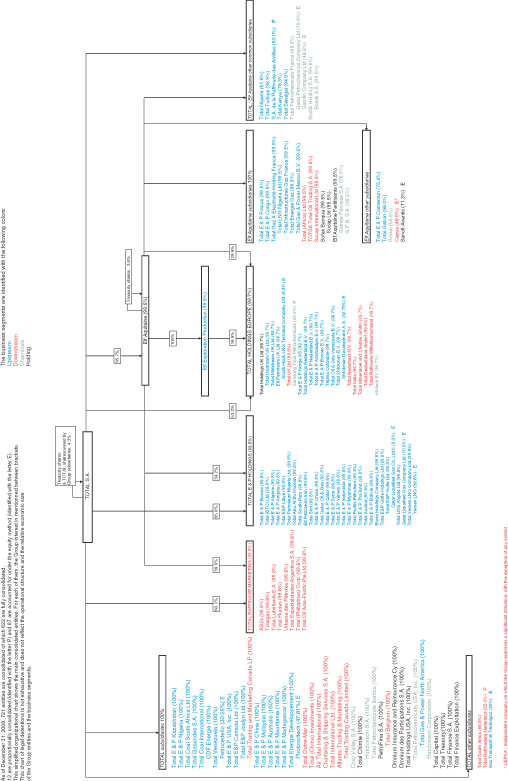 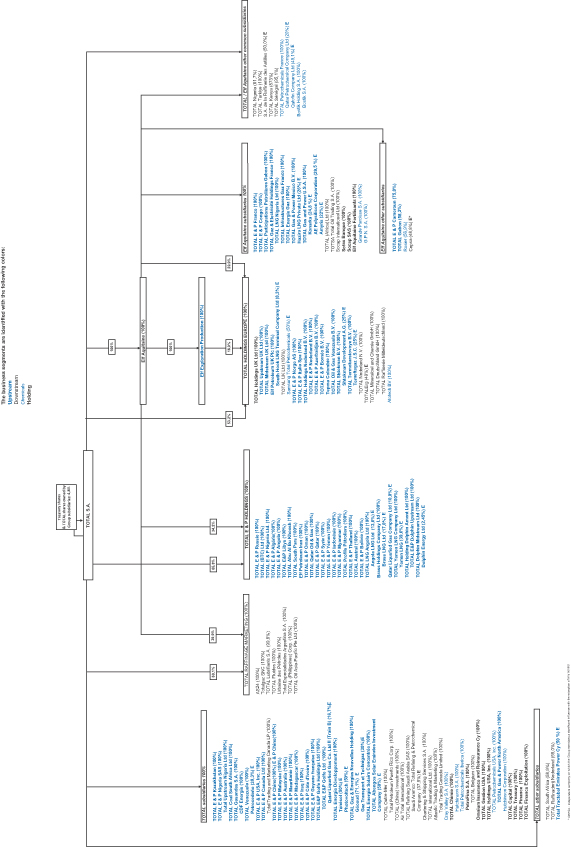
TOTAL SUPPLEMENTAL OIL AND GAS INFORMATION (Unaudited) As from 2009, the amendments to the Securities and Exchange Commission (SEC) Rule 4-10 of Regulation S-X set forth in the “Modernization of Oil and Gas Reporting” release (SEC Release n° 33-8995) and the Financial Accounting Standard Board (FASB) Accounting Standards Update regarding Extractive Activities-Oil and Gas (ASC 932) change a number of reserves estimation and disclosure requirements. As a reminder, in terms of reserves estimation, the main changes are: the use of an average price instead of a single year-end price; the use of new reliable technologies to assess proved reserves; and the inclusion, under certain conditions, of non-traditional sources as oil and gas producing activities. The revised rules form the basis of the 2011, 2010 and 2009 year-end estimation of proved reserves. Preparation of reserves estimates The estimation of reserves is an ongoing process which is done within affiliates by experienced geoscientists, engineers and economists under the supervision of each affiliate’s General Management. Persons involved in reserves evaluation are trained to follow SEC-compliant internal guidelines and policies regarding criteria that must be met before reserves can be considered as proved. The technical validation process relies on a Technical Reserves Committee that is responsible for approving proved reserves changes above a certain threshold and technical evaluations of reserves associated with any investment decision that requires approval from the Exploration & Production Executive Committee. The Chairman of the Technical Reserves Committee is appointed by the Senior Management of Exploration & Production and its members represent expertise in reservoir engineering, production geology, production geophysics, drilling, and development studies. An internal control process related to reserves estimation is well established within TOTAL and involves the following elements: A central Reserve Entity whose responsibility is to consolidate, document and archive the Group’s reserves; to ensure coherence of evaluations worldwide; to maintain the Corporate Reserves Guidelines Standards in line with SEC guidelines and policies; to deliver training on reserves | | evaluation and classification; and to conduct periodically in-depth technical review of reserves for each affiliate. |
An annual review of affiliates reserves conducted by an internal group of specialists selected for their expertise in geosciences and engineering or their knowledge of the affiliate. All members of this group chaired by the Reserves Vice-president and composed of at least three Technical Reserves Committee members are knowledgeable in the SEC guidelines for proved reserves evaluation. Their responsibility is to provide an independent review of reserves changes proposed by affiliates and ensure that reserves are estimated using appropriate standards and procedures. At the end of the annual review carried out by the Development Division, an SEC Reserves Committee chaired by the Exploration & Production Finance Senior Vice President and comprised of the Development, Exploration, Strategy and Legal Senior Vice Presidents, or their representatives, as well as the Chairman of the Technical Reserves Committee and the Reserves Vice-President, approves the SEC reserve booking proposals regarding criteria that are not dependent upon reservoir and geosciences techniques. The results of the annual review and the proposals for including revisions or additions of SEC Proved Reserves are presented to the Exploration & Production Executive Committee for approval before final validation by the Group Executive Management. The reserves evaluation and control process is audited periodically by the Group’s internal auditors who verify the effectiveness of the reserves evaluation process and control procedures. The Reserves Vice-President (RVP) is the technical person responsible for preparing the reserves estimates for the Group. Appointed by the President of Exploration & Production, the RVP supervises the Reserve Entity, chairs the annual review of reserves, and is a member of the Technical Reserves Committee and the SEC Reserves Committee. The RVP has over thirty years of experience in the oil & gas industry. He previously held several management positions in the Group in reservoir engineering and geosciences, and has more than fifteen years of experience in the field of reserves evaluation and control process. He holds an engineering degree from Institut National des Sciences Appliquées, Lyon, France, and a petroleum engineering degree from Ecole Nationale Supérieure du Pétrole et des Moteurs (IFP School), France. He is a past member and past chairman of the Society of Petroleum Engineering Oil and Gas Reserves Committee and a member of the UNECE (United Nations Economic Commission for Europe) Expert Group on Resource Classification. Proved developed reserves At the end of 2011, proved developed reserves of oil and gas were 6,046 Mboe and represented 53% of the proved reserves. At the end of 2010, proved developed reserves of oil and gas were 5,708 Mboe and represented 53% of the proved reserves. At the end of 2009, proved developed reserves of oil and gas were 5,835 Mboe and represented 56% of the proved reserves. Over the past three years, the level of proved developed reserves has remained above 5.7 Bboe and over 53% of proved reserves, illustrating TOTAL’s ability to consistently transfer proved undeveloped reserves into developed status. Proved undeveloped reserves As of December 31, 2011, TOTAL’s combined proved undeveloped reserves of oil and gas were 5,377 Mboe as compared to 4,987 Mboe at the end of 2010. The net increase of 390 Mboe of proved undeveloped reserves is due to the addition of +639 Mboe of undeveloped reserves related to extensions and discoveries, a net increase of +401 Mboe due to acquisitions/divestitures, the revision of -168 Mboe of previous estimates (partly resulting from negative price effects), and the transfer of 482 Mboe from proved undeveloped reserves to proved developed reserves. In 2011, the costs incurred to develop proved undeveloped reserves (PUDs) was€10.2 billion, which represents 84% of 2011 development costs incurred, and was related to projects located for the most part in Angola, Australia, Canada, Kazakhstan, Nigeria, Norway, United Kingdom and Russia. Approximately 57% of the Group’s proved undeveloped reserves are associated with producing projects and are located for the most part in Angola, Canada, Nigeria, Norway, and Venezuela. These reserves are expected to be developed over time as part of initial field development plans or additional development phases. The timing to bring these proved reserves into production will depend upon several factors including reservoir performance, surface facilities or plant capacity constraints and contractual limitations on production level. The remaining proved undeveloped reserves correspond to undeveloped fields or assets for which a development has been sanctioned or is in progress. The Group’s portfolio of projects includes a few large scale and complex developments for which it anticipates that it may take more than five years from the time of recording proved reserves to the start of production. These specific projects represent approximately 26% of the Group’s proved undeveloped reserves and include the development of a giant field in Kazakhstan, deep offshore developments in Angola, Nigeria and the United Kingdom and development of oil sands in Canada. These projects are highly complex to develop due to a combination of factors that include, among others, the nature of the reservoir rock and fluid properties, challenging operating environments and the size of the projects. In addition, some of these projects are generally designed and optimized for a given production capacity that controls the pace at which the field is developed and the wells are drilled. At production start-up, only a portion of the proved reserves are developed in order to deliver sufficient production potential to meet capacity constraints and contractual obligations. The remaining PUD’s associated with the complete development plan will therefore remain undeveloped for more than five years following project approval and booking. Under these specific circumstances, the Group believes that it is justified to report as proved reserves the level of reserves used in connection with the approved project, despite the fact that some of these PUDs may remain undeveloped for more than five years. In addition, TOTAL has demonstrated in recent years the Group’s ability to successfully develop and bring into production similar large scale and complex projects, including the development of deep-offshore fields in Angola, Nigeria, the Republic of Congo, HP/HT fields in the United Kingdom, heavy oil projects in Venezuela and LNG projects in Qatar, Yemen, Nigeria and Indonesia. Information shown in the following tables is presented in accordance with Statementthe FASB’s ASC 932 and the requirements of Financial Accounting Standards No. 69 (FAS No. 69, “Disclosures About Oilthe SEC Regulation S-K (Items 1200 to 1208). The tables provided below are presented by the following geographic areas: Europe, Africa, the Americas, Middle East and Gas Producing Activities”)Asia (including CIS). Oil and gas reservesESTIMATED PROVED RESERVES OF OIL, BITUMEN AND GAS RESERVES
The following tables present, for crude oil, condensatesbitumen and natural gas liquids reserves and for natural gas reserves, an estimate of the Group’s oil, bitumen and gas quantities by geographicalgeographic areas as of December 31, 2008, 20072011, 2010 and 2006. 2009. Quantities shown concern proved developed and undeveloped reserves together with changes in quantities for 2008, 20072011, 2010 and 2006.2009. The definitions used for proved, proved developed and proved undeveloped oil and gas reserves, proved developed oil and gas reserves and proved undeveloped reserves are in accordance with the applicable United States Securities & Exchange Commission (SEC) regulation,revised Rule 4-10 of SEC Regulation S-X. Proved All references in the following tables to reserves or production are estimated using geological and engineering data to determine with reasonable certainty whether the crude oilGroup’s entire share of such reserves or natural gas in known reservoirs is recoverable under existing economic and operating conditions. This process involves making subjective judgments. Consequently, estimates of reserves are not exact measurements and are subject to revision. The reserve estimates shown below do not include quantities that may or may not be produced, due to changes in economic conditions or pursuant to new technologies. For additional information onproduction. TOTAL’s reserves estimation process, see “Item 4. Information on the Company — Exploration & Production — Reserves”.
The percentage of proved developed reserves has remained relatively stable over the past three years, indicating thatworldwide proved reserves are consistently moved from undeveloped to developed status. Over time, undeveloped reserves will be reclassified toinclude the developed category as new wells are drilled, existing wells are recompleted and/or facilities to produce from existing and future wells are installed. Major development projects typically take two to four years from the time of recording proved reserves to the start of production from these reserves.
Estimated proved reserves of its consolidated subsidiaries as well as its proportionate share of the proved reserves of equity affiliates.
Changes in oil, bitumen and gas reserves | | | | | | | | | | | | | | | | | | | | | | | | | | Proved developed and undeveloped reserves | | Consolidated subsidiaries | | (in million barrels of oil equivalent) | | Europe | | | Africa | | | Americas | | | Middle
East | | | Asia | | | Total | | Balance as of December 31, 2008 | | | 1,815 | | | | 3,646 | | | | 732 | | | | 530 | | | | 1,242 | | | | 7,965 | | Revisions of previous estimates | | | 46 | | | | 76 | | | | 14 | | | | (7 | ) | | | 25 | | | | 154 | | Extensions, discoveries and other | | | 18 | | | | 53 | | | | 284 | | | | 76 | | | | — | | | | 431 | | Acquisitions of reserves in place | | | 12 | | | | — | | | | 130 | | | | — | | | | — | | | | 142 | | Sales of reserves in place | | | (2 | ) | | | (43 | ) | | | (14 | ) | | | — | | | | — | | | | (59 | ) | Production for the year | | | (224 | ) | | | (266 | ) | | | (56 | ) | | | (55 | ) | | | (101 | ) | | | (702 | ) | Balance as of December 31, 2009 | | | 1,665 | | | | 3,466 | | | | 1,090 | | | | 544 | | | | 1,166 | | | | 7,931 | | Revisions of previous estimates | | | 92 | | | | 200 | | | | 82 | | | | (10 | ) | | | 1 | | | | 365 | | Extensions, discoveries and other | | | 182 | | | | — | | | | 18 | | | | 96 | | | | 30 | | | | 326 | | Acquisitions of reserves in place | | | 23 | | | | — | | | | 425 | | | | — | | | | 9 | | | | 457 | | Sales of reserves in place | | | (45 | ) | | | (26 | ) | | | (5 | ) | | | — | | | | (8 | ) | | | (84 | ) | Production for the year | | | (211 | ) | | | (269 | ) | | | (70 | ) | | | (56 | ) | | | (99 | ) | | | (705 | ) | Balance as of December 31, 2010 | | | 1,706 | | | | 3,371 | | | | 1,540 | | | | 574 | | | | 1,099 | | | | 8,290 | | Revisions of previous estimates | | | 117 | | | | (61 | ) | | | (36 | ) | | | (68 | ) | | | (19 | ) | | | (67 | ) | Extensions, discoveries and other | | | 57 | | | | 6 | | | | — | | | | — | | | | 588 | | | | 651 | | Acquisitions of reserves in place | | | 44 | | | | — | | | | 309 | | | | — | | | | 2 | | | | 355 | | Sales of reserves in place | | | — | | | | (65 | ) | | | — | | | | — | | | | — | | | | (65 | ) | Production for the year | | | (187 | ) | | | (237 | ) | | | (75 | ) | | | (56 | ) | | | (93 | ) | | | (648 | ) | Balance as of December 31, 2011 | | | 1,737 | | | | 3,014 | | | | 1,738 | | | | 450 | | | | 1,577 | | | | 8,516 | | | | | | | Minority interest in proved developed and undeveloped reserves as of | | | | | | | | | | | | | | | | | | December 31, 2009 | | | 26 | | | | 98 | | | | — | | | | — | | | | — | | | | 124 | | December 31, 2010 | | | 26 | | | | 100 | | | | — | | | | — | | | | — | | | | 126 | | December 31, 2011 | | | — | | | | 98 | | | | — | | | | — | | | | — | | | | 98 | | | | | Proved developed and undeveloped reserves | | Equity affiliates | | (in million barrels of oil equivalent) | | Europe | | | Africa | | | Americas | | | Middle
East | | | Asia | | | Total | | Balance as of December 31, 2008 | | | — | | | | 98 | | | | 527 | | | | 1,868 | | | | — | | | | 2,493 | | Revisions of previous estimates | | | — | | | | 10 | | | | (7 | ) | | | 51 | | | | — | | | | 54 | | Extensions, discoveries and other | | | — | | | | — | | | | — | | | | 136 | | | | — | | | | 136 | | Acquisitions of reserves in place | | | — | | | | — | | | | — | | | | — | | | | — | | | | — | | Sales of reserves in place | | | — | | | | — | | | | — | | | | — | | | | — | | | | — | | Production for the year | | | — | | | | (8 | ) | | | (18 | ) | | | (105 | ) | | | — | | | | (131 | ) | Balance as of December 31, 2009 | | | — | | | | 100 | | | | 502 | | | | 1,950 | | | | — | | | | 2,552 | | Revisions of previous estimates | | | — | | | | 14 | | | | 4 | | | | (2 | ) | | | — | | | | 16 | | Extensions, discoveries and other | | | — | | | | — | | | | — | | | | — | | | | — | | | | — | | Acquisitions of reserves in place | | | — | | | | — | | | | — | | | | — | | | | — | | | | — | | Sales of reserves in place | | | — | | | | — | | | | — | | | | — | | | | — | | | | — | | Production for the year | | | — | | | | (7 | ) | | | (20 | ) | | | (136 | ) | | | — | | | | (163 | ) | Balance as of December 31, 2010 | | | — | | | | 107 | | | | 486 | | | | 1,812 | | | | — | | | | 2,405 | | Revisions of previous estimates | | | — | | | | (1 | ) | | | (8 | ) | | | (20 | ) | | | — | | | | (29 | ) | Extensions, discoveries and other | | | — | | | | — | | | | — | | | | — | | | | — | | | | — | | Acquisitions of reserves in place | | | — | | | | — | | | | — | | | | — | | | | 779 | | | | 779 | | Sales of reserves in place | | | — | | | | (24 | ) | | | (4 | ) | | | (11 | ) | | | — | | | | (39 | ) | Production for the year | | | — | | | | (4 | ) | | | (18 | ) | | | (152 | ) | | | (35 | ) | | | (209 | ) | Balance as of December 31, 2011 | | | — | | | | 78 | | | | 456 | | | | 1,629 | | | | 744 | | | | 2,907 | |
| | | | | | | | | | | | | | | | | | | | | | | | | | | | | | Consolidated subsidiaries and equity affiliates | | (in million barrels of oil equivalent) | | Europe | | | Africa | | | Americas | | | Middle
East | | | Asia | | | Total | | As of December 31, 2009 | | | | | | | | | | | | | | | | | | | | | | | | | Proved developed and undeveloped reserves | | | 1,665 | | | | 3,566 | | | | 1,592 | | | | 2,494 | | | | 1,166 | | | | 10,483 | | Consolidated subsidiaries | | | 1,665 | | | | 3,466 | | | | 1,090 | | | | 544 | | | | 1,166 | | | | 7,931 | | Equity affiliates | | | — | | | | 100 | | | | 502 | | | | 1,950 | | | | — | | | | 2,552 | | Proved developed reserves | | | 1,096 | | | | 1,775 | | | | 631 | | | | 1,918 | | | | 415 | | | | 5,835 | | Consolidated subsidiaries | | | 1,096 | | | | 1,745 | | | | 503 | | | | 482 | | | | 415 | | | | 4,241 | | Equity affiliates | | | — | | | | 30 | | | | 128 | | | | 1,436 | | | | — | | | | 1,594 | | Proved undeveloped reserves | | | 569 | | | | 1,791 | | | | 961 | | | | 576 | | | | 751 | | | | 4,648 | | Consolidated subsidiaries | | | 569 | | | | 1,721 | | | | 587 | | | | 62 | | | | 751 | | | | 3,690 | | Equity affiliates | | | — | | | | 70 | | | | 374 | | | | 514 | | | | — | | | | 958 | | As of December 31, 2010 | | | | | | | | | | | | | | | | | | | | | | | | | Proved developed and undeveloped reserves | | | 1,706 | | | | 3,478 | | | | 2,026 | | | | 2,386 | | | | 1,099 | | | | 10,695 | | Consolidated subsidiaries | | | 1,706 | | | | 3,371 | | | | 1,540 | | | | 574 | | | | 1,099 | | | | 8,290 | | Equity affiliates | | | — | | | | 107 | | | | 486 | | | | 1,812 | | | | — | | | | 2,405 | | Proved developed reserves | | | 962 | | | | 1,692 | | | | 638 | | | | 2,055 | | | | 361 | | | | 5,708 | | Consolidated subsidiaries | | | 962 | | | | 1,666 | | | | 505 | | | | 427 | | | | 361 | | | | 3,921 | | Equity affiliates | | | — | | | | 26 | | | | 133 | | | | 1,628 | | | | — | | | | 1,787 | | Proved undeveloped reserves | | | 744 | | | | 1,786 | | | | 1,388 | | | | 331 | | | | 738 | | | | 4,987 | | Consolidated subsidiaries | | | 744 | | | | 1,705 | | | | 1,035 | | | | 147 | | | | 738 | | | | 4,369 | | Equity affiliates | | | — | | | | 81 | | | | 353 | | | | 184 | | | | — | | | | 618 | | As of December 31, 2011 | | | | | | | | | | | | | | | | | | | | | | | | | Proved developed and undeveloped reserves | | | 1,737 | | | | 3,092 | | | | 2,194 | | | | 2,079 | | | | 2,321 | | | | 11,423 | | Consolidated subsidiaries | | | 1,737 | | | | 3,014 | | | | 1,738 | | | | 450 | | | | 1,577 | | | | 8,516 | | Equity affiliates | | | — | | | | 78 | | | | 456 | | | | 1,629 | | | | 744 | | | | 2,907 | | Proved developed reserves | | | 894 | | | | 1,660 | | | | 647 | | | | 1,869 | | | | 976 | | | | 6,046 | | Consolidated subsidiaries | | | 894 | | | | 1,639 | | | | 524 | | | | 371 | | | | 321 | | | | 3,749 | | Equity affiliates | | | — | | | | 21 | | | | 123 | | | | 1,498 | | | | 655 | | | | 2,297 | | Proved undeveloped reserves | | | 843 | | | | 1,432 | | | | 1,547 | | | | 210 | | | | 1,345 | | | | 5,377 | | Consolidated subsidiaries | | | 843 | | | | 1,375 | | | | 1,214 | | | | 79 | | | | 1,256 | | | | 4,767 | | Equity affiliates | | | — | | | | 57 | | | | 333 | | | | 131 | | | | 89 | | | | 610 | |
Changes in oil reserves The oil reserves for the years prior to 2009 include crude oil, and natural gas liquids (condensates, LPG) and bitumen reserves. Bitumen reserves as from 2009 are shown separately. | | | | | | | | | | | | | | | | | | | | | | | | | | Proved developed and undeveloped reserves | | Consolidated subsidiaries | | | | | Europe | | | Africa | | | Americas | | | Middle
East | | | Asia | | | Total | | (in million barrels) | | | | | | | Balance as of December 31, 2008 | | | 798 | | | | 2,597 | | | | 252 | | | | 225 | | | | 538 | | | | 4,410 | | Revisions of previous estimates | | | 34 | | | | 92 | | | | (170 | ) | | | (4 | ) | | | 51 | | | | 3 | | Extensions, discoveries and other | | | 8 | | | | 38 | | | | 22 | | | | 1 | | | | — | | | | 69 | | Acquisitions of reserves in place | | | 1 | | | | — | | | | — | | | | — | | | | — | | | | 1 | | Sales of reserves in place | | | — | | | | (44 | ) | | | (1 | ) | | | — | | | | — | | | | (45 | ) | Production for the year | | | (108 | ) | | | (223 | ) | | | (15 | ) | | | (34 | ) | | | (17 | ) | | | (397 | ) | Balance as of December 31, 2009 | | | 733 | | | | 2,460 | | | | 88 | | | | 188 | | | | 572 | | | | 4,041 | | Revisions of previous estimates | | | 46 | | | | 131 | | | | 7 | | | | (2 | ) | | | — | | | | 182 | | Extensions, discoveries and other | | | 146 | | | | — | | | | 2 | | | | 82 | | | | 4 | | | | 234 | | Acquisitions of reserves in place | | | 2 | | | | — | | | | — | | | | — | | | | — | | | | 2 | | Sales of reserves in place | | | (37 | ) | | | (23 | ) | | | (2 | ) | | | — | | | | (7 | ) | | | (69 | ) | Production for the year | | | (98 | ) | | | (218 | ) | | | (16 | ) | | | (29 | ) | | | (15 | ) | | | (376 | ) | Balance as of December 31, 2010 | | | 792 | | | | 2,350 | | | | 79 | | | | 239 | | | | 554 | | | | 4,014 | | Revisions of previous estimates | | | 49 | | | | (19 | ) | | | 9 | | | | (33 | ) | | | (24 | ) | | | (18 | ) | Extensions, discoveries and other | | | 17 | | | | 6 | | | | — | | | | — | | | | 58 | | | | 81 | | Acquisitions of reserves in place | | | 42 | | | | — | | | | — | | | | — | | | | — | | | | 42 | | Sales of reserves in place | | | — | | | | (57 | ) | | | — | | | | — | | | | — | | | | (57 | ) | Production for the year | | | (88 | ) | | | (185 | ) | | | (15 | ) | | | (25 | ) | | | (15 | ) | | | (328 | ) | Balance as of December 31, 2011 | | | 812 | | | | 2,095 | | | | 73 | | | | 181 | | | | 573 | | | | 3,734 | | | | | | | | | Minority interest in proved developed and undeveloped reserves as of | | | | | | | | | | | | | | | | | | | | | | | | | December 31, 2009 | | | 12 | | | | 88 | | | | — | | | | — | | | | — | | | | 100 | | December 31, 2010 | | | 11 | | | | 89 | | | | — | | | | — | | | | — | | | | 100 | | December 31, 2011 | | | — | | | | 88 | | | | — | | | | — | | | | — | | | | 88 | | | | | Proved developed and undeveloped reserves | | Equity affiliates | | | | | Europe | | | Africa | | | Americas | | | Middle
East | | | Asia | | | Total | | (in million barrels) | | | | | | | Balance as of December 31, 2008 | | | — | | | | 58 | | | | 508 | | | | 719 | | | | — | | | | 1,285 | | Revisions of previous estimates | | | — | | | | (14 | ) | | | (5 | ) | | | (15 | ) | | | — | | | | (34 | ) | Extensions, discoveries and other | | | — | | | | — | | | | — | | | | 136 | | | | — | | | | 136 | | Acquisitions of reserves in place | | | — | | | | — | | | | — | | | | — | | | | — | | | | — | | Sales of reserves in place | | | — | | | | — | | | | — | | | | — | | | | — | | | | — | | Production for the year | | | — | | | | (7 | ) | | | (18 | ) | | | (79 | ) | | | — | | | | (104 | ) | Balance as of December 31, 2009 | | | — | | | | 37 | | | | 485 | | | | 761 | | | | — | | | | 1,283 | | Revisions of previous estimates | | | — | | | | 4 | | | | 4 | | | | 3 | | | | — | | | | 11 | | Extensions, discoveries and other | | | — | | | | — | | | | — | | | | — | | | | — | | | | — | | Acquisitions of reserves in place | | | — | | | | — | | | | — | | | | — | | | | — | | | | — | | Sales of reserves in place | | | — | | | | — | | | | — | | | | — | | | | — | | | | — | | Production for the year | | | — | | | | (7 | ) | | | (19 | ) | | | (84 | ) | | | — | | | | (110 | ) | Balance as of December 31, 2010 | | | — | | | | 34 | | | | 470 | | | | 680 | | | | — | | | | 1,184 | | Revisions of previous estimates | | | — | | | | 2 | | | | (6 | ) | | | (12 | ) | | | — | | | | (16 | ) | Extensions, discoveries and other | | | — | | | | — | | | | — | | | | — | | | | — | | | | — | | Acquisitions of reserves in place | | | — | | | | — | | | | — | | | | — | | | | 51 | | | | 51 | | Sales of reserves in place | | | — | | | | (22 | ) | | | (4 | ) | | | (12 | ) | | | — | | | | (38 | ) | Production for the year | | | — | | | | (4 | ) | | | (17 | ) | | | (91 | ) | | | (3 | ) | | | (115 | ) | Balance as of December 31, 2011 | | | — | | | | 10 | | | | 443 | | | | 565 | | | | 48 | | | | 1,066 | |
| | | | | | | | | | | | | | | | | | | | | | | | | | | | | | Consolidated subsidiaries and equity affiliates | | | | | Europe | | | Africa | | | Americas | | | Middle
East | | | Asia | | | Total | | (in million barrels) | | | | | | | As of December 31, 2009 | | | | | | | | | | | | | | | | | | | | | | | | | Proved developed and undeveloped reserves | | | 733 | | | | 2,497 | | | | 573 | | | | 949 | | | | 572 | | | | 5,324 | | Consolidated subsidiaries | | | 733 | | | | 2,460 | | | | 88 | | | | 188 | | | | 572 | | | | 4,041 | | Equity affiliates | | | — | | | | 37 | | | | 485 | | | | 761 | | | | — | | | | 1,283 | | Proved developed reserves | | | 457 | | | | 1,331 | | | | 187 | | | | 728 | | | | 65 | | | | 2,768 | | Consolidated subsidiaries | | | 457 | | | | 1,303 | | | | 66 | | | | 174 | | | | 65 | | | | 2,065 | | Equity affiliates | | | — | | | | 28 | | | | 121 | | | | 554 | | | | — | | | | 703 | | Proved undeveloped reserves | | | 276 | | | | 1,166 | | | | 386 | | | | 221 | | | | 507 | | | | 2,556 | | Consolidated subsidiaries | | | 276 | | | | 1,157 | | | | 22 | | | | 14 | | | | 507 | | | | 1,976 | | Equity affiliates | | | — | | | | 9 | | | | 364 | | | | 207 | | | | — | | | | 580 | | As of December 31, 2010 | | | | | | | | | | | | | | | | | | | | | | | | | Proved developed and undeveloped reserves | | | 792 | | | | 2,384 | | | | 549 | | | | 919 | | | | 554 | | | | 5,198 | | Consolidated subsidiaries | | | 792 | | | | 2,350 | | | | 79 | | | | 239 | | | | 554 | | | | 4,014 | | Equity affiliates | | | — | | | | 34 | | | | 470 | | | | 680 | | | | — | | | | 1,184 | | Proved developed reserves | | | 394 | | | | 1,250 | | | | 180 | | | | 662 | | | | 58 | | | | 2,544 | | Consolidated subsidiaries | | | 394 | | | | 1,226 | | | | 53 | | | | 151 | | | | 58 | | | | 1,882 | | Equity affiliates | | | — | | | | 24 | | | | 127 | | | | 511 | | | | — | | | | 662 | | Proved undeveloped reserves | | | 398 | | | | 1,134 | | | | 369 | | | | 257 | | | | 496 | | | | 2,654 | | Consolidated subsidiaries | | | 398 | | | | 1,124 | | | | 26 | | | | 88 | | | | 496 | | | | 2,132 | | Equity affiliates | | | — | | | | 10 | | | | 343 | | | | 169 | | | | — | | | | 522 | | As of December 31, 2011 | | | | | | | | | | | | | | | | | | | | | | | | | Proved developed and undeveloped reserves | | | 812 | | | | 2,105 | | | | 516 | | | | 746 | | | | 621 | | | | 4,800 | | Consolidated subsidiaries | | | 812 | | | | 2,095 | | | | 73 | | | | 181 | | | | 573 | | | | 3,734 | | Equity affiliates | | | — | | | | 10 | | | | 443 | | | | 565 | | | | 48 | | | | 1,066 | | Proved developed reserves | | | 351 | | | | 1,206 | | | | 165 | | | | 565 | | | | 91 | | | | 2,378 | | Consolidated subsidiaries | | | 351 | | | | 1,202 | | | | 48 | | | | 116 | | | | 50 | | | | 1,767 | | Equity affiliates | | | — | | | | 4 | | | | 117 | | | | 449 | | | | 41 | | | | 611 | | Proved undeveloped reserves | | | 461 | | | | 899 | | | | 351 | | | | 181 | | | | 530 | | | | 2,422 | | Consolidated subsidiaries | | | 461 | | | | 893 | | | | 25 | | | | 65 | | | | 523 | | | | 1,967 | | Equity affiliates | | | — | | | | 6 | | | | 326 | | | | 116 | | | | 7 | | | | 455 | |
Changes in bitumen reserves Bitumen reserves as of December 31, 2008 and before are included in oil reserves presented in the table “Changes in oil reserves”. | | | | | | | | | | | | | | | | | | | | | | | | | | Proved developed and undeveloped reserves | | Consolidated subsidiaries | | (in million barrels) | | Europe | | | Africa | | | Americas | | | Middle
East | | | Asia | | | Total | | Balance as of December 31, 2008 | | | — | | | | — | | | | — | | | | — | | | | — | | | | — | | Revisions of previous estimates | | | — | | | | — | | | | 176 | | | | — | | | | — | | | | 176 | | Extensions, discoveries and other | | | — | | | | — | | | | 192 | | | | — | | | | — | | | | 192 | | Acquisitions of reserves in place | | | — | | | | — | | | | — | | | | — | | | | — | | | | — | | Sales of reserves in place | | | — | | | | — | | | | — | | | | — | | | | — | | | | — | | Production for the year | | | — | | | | — | | | | (3 | ) | | | — | | | | — | | | | (3 | ) | Balance as of December 31, 2009 | | | — | | | | — | | | | 365 | | | | — | | | | — | | | | 365 | | Revisions of previous estimates | | | — | | | | — | | | | 3 | | | | — | | | | — | | | | 3 | | Extensions, discoveries and other | | | — | | | | — | | | | — | | | | — | | | | — | | | | — | | Acquisitions of reserves in place | | | — | | | | — | | | | 425 | | | | — | | | | — | | | | 425 | | Sales of reserves in place | | | — | | | | — | | | | — | | | | — | | | | — | | | | — | | Production for the year | | | — | | | | — | | | | (4 | ) | | | — | | | | — | | | | (4 | ) | Balance as of December 31, 2010 | | | — | | | | — | | | | 789 | | | | — | | | | — | | | | 789 | | Revisions of previous estimates | | | — | | | | — | | | | (109 | ) | | | — | | | | — | | | | (109 | ) | Extensions, discoveries and other | | | — | | | | — | | | | — | | | | — | | | | — | | | | — | | Acquisitions of reserves in place | | | — | | | | — | | | | 308 | | | | — | | | | — | | | | 308 | | Sales of reserves in place | | | — | | | | — | | | | — | | | | — | | | | — | | | | — | | Production for the year | | | — | | | | — | | | | (4 | ) | | | — | | | | — | | | | (4 | ) | Balance as of December 31, 2011 | | | — | | | | — | | | | 984 | | | | — | | | | — | | | | 984 | | | | | | | | | Proved developed reserves as of | | | | | | | | | | | | | | | | | | | | | | | | | December 31, 2009 | | | — | | | | — | | | | 19 | | | | — | | | | — | | | | 19 | | December 31, 2010 | | | — | | | | — | | | | 18 | | | | — | | | | — | | | | 18 | | December 31, 2011 | | | — | | | | — | | | | 21 | | | | — | | | | — | | | | 21 | | | | | | | | | Proved undeveloped reserves as of | | | | | | | | | | | | | | | | | | | | | | | | | December 31, 2009 | | | — | | | | — | | | | 346 | | | | — | | | | — | | | | 346 | | December 31, 2010 | | | — | | | | — | | | | 771 | | | | — | | | | — | | | | 771 | | December 31, 2011 | | | — | | | | — | | | | 963 | | | | — | | | | — | | | | 963 | |
There are no bitumen reserves for equity affiliates. There are no minority interests for bitumen reserves. Changes in gas reserves | | | | | | | | | | | | | | | | | | | | | | | | | | Proved developed and undeveloped reserves | | Consolidated subsidiaries | | (in billion cubic feet) | | Europe | | | Africa | | | Americas | | | Middle
East | | | Asia | | | Total | | Balance as of December 31, 2008 | | | 5,507 | | | | 5,529 | | | | 2,714 | | | | 1,769 | | | | 4,098 | | | | 19,617 | | Revisions of previous estimates | | | 73 | | | | (127 | ) | | | 25 | | | | (18 | ) | | | (165 | ) | | | (212 | ) | Extensions, discoveries and other | | | 55 | | | | 61 | | | | 382 | | | | 399 | | | | — | | | | 897 | | Acquisitions of reserves in place | | | 58 | | | | — | | | | 752 | | | | — | | | | — | | | | 810 | | Sales of reserves in place | | | (13 | ) | | | — | | | | (64 | ) | | | — | | | | — | | | | (77 | ) | Production for the year | | | (633 | ) | | | (217 | ) | | | (212 | ) | | | (122 | ) | | | (467 | ) | | | (1,651 | ) | Balance as of December 31, 2009 | | | 5,047 | | | | 5,246 | | | | 3,597 | | | | 2,028 | | | | 3,466 | | | | 19,384 | | Revisions of previous estimates | | | 271 | | | | 346 | | | | 415 | | | | (80 | ) | | | 15 | | | | 967 | | Extensions, discoveries and other | | | 193 | | | | — | | | | 88 | | | | 70 | | | | 138 | | | | 489 | | Acquisitions of reserves in place | | | 111 | | | | — | | | | — | | | | — | | | | 51 | | | | 162 | | Sales of reserves in place | | | (43 | ) | | | (20 | ) | | | (16 | ) | | | — | | | | (4 | ) | | | (83 | ) | Production for the year | | | (617 | ) | | | (258 | ) | | | (278 | ) | | | (151 | ) | | | (472 | ) | | | (1,776 | ) | Balance as of December 31, 2010 | | | 4,962 | | | | 5,314 | | | | 3,806 | | | | 1,867 | | | | 3,194 | | | | 19,143 | | Revisions of previous estimates | | | 358 | | | | (216 | ) | | | 367 | | | | (180 | ) | | | 1 | | | | 330 | | Extensions, discoveries and other | | | 211 | | | | — | | | | — | | | | — | | | | 2,824 | | | | 3,035 | | Acquisitions of reserves in place | | | 11 | | | | — | | | | 7 | | | | — | | | | 13 | | | | 31 | | Sales of reserves in place | | | — | | | | (46 | ) | | | — | | | | — | | | | — | | | | (46 | ) | Production for the year | | | (528 | ) | | | (259 | ) | | | (317 | ) | | | (169 | ) | | | (445 | ) | | | (1,718 | ) | Balance as of December 31, 2011 | | | 5,014 | | | | 4,793 | | | | 3,863 | | | | 1,518 | | | | 5,587 | | | | 20,775 | | | Minority interest in proved developed and undeveloped reserves as of | | December 31, 2009 | | | 73 | | | | 60 | | | | — | | | | — | | | | — | | | | 133 | | December 31, 2010 | | | 83 | | | | 67 | | | | — | | | | — | | | | — | | | | 150 | | December 31, 2011 | | | — | | | | 62 | | | | — | | | | — | | | | — | | | | 62 | | | | | Proved developed and undeveloped reserves | | Equity affiliates | | (in billion cubic feet) | | Europe | | | Africa | | | Americas | | | Middle
East | | | Asia | | | Total | | Balance as of December 31, 2008 | | | — | | | | 215 | | | | 110 | | | | 6,276 | | | | — | | | | 6,601 | | Revisions of previous estimates | | | — | | | | 127 | | | | (13 | ) | | | 363 | | | | — | | | | 477 | | Extensions, discoveries and other | | | — | | | | — | | | | — | | | | — | | | | — | | | | — | | Acquisitions of reserves in place | | | — | | | | — | | | | — | | | | — | | | | — | | | | — | | Sales of reserves in place | | | — | | | | — | | | | — | | | | — | | | | — | | | | — | | Production for the year | | | — | | | | (1 | ) | | | (2 | ) | | | (141 | ) | | | — | | | | (144 | ) | Balance as of December 31, 2009 | | | — | | | | 341 | | | | 95 | | | | 6,498 | | | | — | | | | 6,934 | | Revisions of previous estimates | | | — | | | | 50 | | | | (2 | ) | | | (52 | ) | | | — | | | | (4 | ) | Extensions, discoveries and other | | | — | | | | — | | | | — | | | | — | | | | — | | | | — | | Acquisitions of reserves in place | | | — | | | | — | | | | — | | | | — | | | | — | | | | — | | Sales of reserves in place | | | — | | | | — | | | | — | | | | — | | | | — | | | | — | | Production for the year | | | — | | | | (1 | ) | | | (2 | ) | | | (282 | ) | | | — | | | | (285 | ) | Balance as of December 31, 2010 | | | — | | | | 390 | | | | 91 | | | | 6,164 | | | | — | | | | 6,645 | | Revisions of previous estimates | | | — | | | | (16 | ) | | | (10 | ) | | | (31 | ) | | | — | | | | (57 | ) | Extensions, discoveries and other | | | — | | | | — | | | | — | | | | — | | | | — | | | | — | | Acquisitions of reserves in place | | | — | | | | — | | | | — | | | | — | | | | 3,865 | | | | 3,865 | | Sales of reserves in place | | | — | | | | (10 | ) | | | — | | | | — | | | | — | | | | (10 | ) | Production for the year | | | — | | | | (1 | ) | | | (2 | ) | | | (331 | ) | | | (167 | ) | | | (501 | ) | Balance as of December 31, 2011 | | | — | | | | 363 | | | | 79 | | | | 5,802 | | | | 3,698 | | | | 9,942 | |
| | | | | | | | | | | | | | | | | | | | | | | | | | | | Consolidated subsidiaries and equity affiliates | | (in billion cubic feet) | | Europe | | | Africa | | | Americas | | | Middle
East | | | Asia | | | Total | | As of December 31, 2009 | | | | | | | | | | | | | | | | | | | | | | | | | Proved developed and undeveloped reserves | | | 5,047 | | | | 5,587 | | | | 3,692 | | | | 8,526 | | | | 3,466 | | | | 26,318 | | Consolidated subsidiaries | | | 5,047 | | | | 5,246 | | | | 3,597 | | | | 2,028 | | | | 3,466 | | | | 19,384 | | Equity affiliates | | | — | | | | 341 | | | | 95 | | | | 6,498 | | | | — | | | | 6,934 | | Proved developed reserves | | | 3,463 | | | | 2,272 | | | | 2,388 | | | | 6,606 | | | | 2,059 | | | | 16,788 | | Consolidated subsidiaries | | | 3,463 | | | | 2,261 | | | | 2,343 | | | | 1,773 | | | | 2,059 | | | | 11,899 | | Equity affiliates | | | — | | | | 11 | | | | 45 | | | | 4,833 | | | | — | | | | 4,889 | | Proved undeveloped reserves | | | 1,584 | | | | 3,315 | | | | 1,304 | | | | 1,920 | | | | 1,407 | | | | 9,530 | | Consolidated subsidiaries | | | 1,584 | | | | 2,985 | | | | 1,254 | | | | 255 | | | | 1,407 | | | | 7,485 | | Equity affiliates | | | — | | | | 330 | | | | 50 | | | | 1,665 | | | | — | | | | 2,045 | | As of December 31, 2010 | | | | | | | | | | | | | | | | | | | | | | | | | Proved developed and undeveloped reserves | | | 4,962 | | | | 5,704 | | | | 3,897 | | | | 8,031 | | | | 3,194 | | | | 25,788 | | Consolidated subsidiaries | | | 4,962 | | | | 5,314 | | | | 3,806 | | | | 1,867 | | | | 3,194 | | | | 19,143 | | Equity affiliates | | | — | | | | 390 | | | | 91 | | | | 6,164 | | | | — | | | | 6,645 | | Proved developed reserves | | | 3,089 | | | | 2,240 | | | | 2,474 | | | | 7,649 | | | | 1,790 | | | | 17,242 | | Consolidated subsidiaries | | | 3,089 | | | | 2,229 | | | | 2,439 | | | | 1,578 | | | | 1,790 | | | | 11,125 | | Equity affiliates | | | — | | | | 11 | | | | 35 | | | | 6,071 | | | | — | | | | 6,117 | | Proved undeveloped reserves | | | 1,873 | | | | 3,464 | | | | 1,423 | | | | 382 | | | | 1,404 | | | | 8,546 | | Consolidated subsidiaries | | | 1,873 | | | | 3,085 | | | | 1,367 | | | | 289 | | | | 1,404 | | | | 8,018 | | Equity affiliates | | | — | | | | 379 | | | | 56 | | | | 93 | | | | — | | | | 528 | | As of December 31, 2011 | | | | | | | | | | | | | | | | | | | | | | | | | Proved developed and undeveloped reserves | | | 5,014 | | | | 5,156 | | | | 3,942 | | | | 7,320 | | | | 9,285 | | | | 30,717 | | Consolidated subsidiaries | | | 5,014 | | | | 4,793 | | | | 3,863 | | | | 1,518 | | | | 5,587 | | | | 20,775 | | Equity affiliates | | | — | | | | 363 | | | | 79 | | | | 5,802 | | | | 3,698 | | | | 9,942 | | Proved developed reserves | | | 2,943 | | | | 2,308 | | | | 2,600 | | | | 7,170 | | | | 4,854 | | | | 19,875 | | Consolidated subsidiaries | | | 2,943 | | | | 2,216 | | | | 2,567 | | | | 1,450 | | | | 1,594 | | | | 10,770 | | Equity affiliates | | | — | | | | 92 | | | | 33 | | | | 5,720 | | | | 3,260 | | | | 9,105 | | Proved undeveloped reserves | | | 2,071 | | | | 2,848 | | | | 1,342 | | | | 150 | | | | 4,431 | | | | 10,842 | | Consolidated subsidiaries | | | 2,071 | | | | 2,577 | | | | 1,296 | | | | 68 | | | | 3,993 | | | | 10,005 | | Equity affiliates | | | — | | | | 271 | | | | 46 | | | | 82 | | | | 438 | | | | 837 | |
RESULTS OF OPERATIONS FOR OIL AND GAS PRODUCING ACTIVITIES The following tables reflect the estimated proved reserves of crudedo not include revenues and expenses related to oil and natural gas as of December 31, 2006, 2007transportation activities and 2008,LNG liquefaction and the changes therein.transportation activities. | | | | | | | | | | | | | | | | | | | | | | | | | Crude Oil, Condensate and Natural Gas Liquids (Mb) | | | | | Europe | | | Africa | | | North America | | | Asia-
Pacific | | | Rest of World(a) | | | Total | | | Equity Affiliates and Non- Consolidated | | Balance as of January 1, 2006 | | 978 | | | 2,463 | | | 231 | | | 62 | | | 1,848 | | | 5,582 | | | 1,010 | | Revisions of previous estimates | | 40 | | | 146 | | | 1 | | | 6 | | | 65 | | | 258 | | | 4 | | Extensions, discoveries and other | | 13 | | | 113 | | | — | | | — | | | — | | | 126 | | | 60 | | Acquisitions of reserves in place | | — | | | — | | | 22 | | | — | | | — | | | 22 | | | 3 | | Sales of reserves in place | | (6 | ) | | — | | | (2 | ) | | — | | | (21 | ) | | (29 | ) | | (16 | ) | Production for the year | | (132 | ) | | (220 | ) | | (2 | ) | | (11 | ) | | (78 | ) | | (443 | ) | | (106 | ) | Balance as of December 31, 2006 | | 893 | | | 2,502 | | | 250 | | | 57 | | | 1,814 | | | 5,516 | | | 955 | | Revisions of previous estimates | | 108 | | | 149 | | | (4 | ) | | (1 | ) | | (550 | ) | | (298 | ) | | 525 | | Extensions, discoveries and other | | 4 | | | 90 | | | 2 | | | 6 | | | 1 | | | 103 | | | 7 | | Acquisitions of reserves in place | | — | | | — | | | — | | | — | | | — | | | — | | | — | | Sales of reserves in place | | (3 | ) | | (2 | ) | | (6 | ) | | — | | | (459 | ) | | (470 | ) | | (9 | ) | Production for the year | | (122 | ) | | (241 | ) | | (5 | ) | | (10 | ) | | (77 | ) | | (455 | ) | | (96 | ) | Balance as of December 31, 2007 | | 880 | | | 2,498 | | | 237 | | | 52 | | | 729 | | | 4,396 | | | 1,382 | | Revisions of previous estimates | | 15 | | | 297 | | | (32 | ) | | 21 | | | 112 | | | 413 | | | 21 | | Extensions, discoveries and other | | 12 | | | 107 | | | — | | | 3 | | | — | | | 122 | | | 3 | | Acquisitions of reserves in place | | 2 | | | — | | | — | | | — | | | — | | | 2 | | | 6 | | Sales of reserves in place | | — | | | (74 | ) | | — | | | — | | | (43 | ) | | (117 | ) | | — | | Production for the year | | (111 | ) | | (231 | ) | | (4 | ) | | (10 | ) | | (50 | ) | | (406 | ) | | (127 | ) | Balance as of December 31, 2008 | | 798 | | | 2,597 | | | 201 | | | 66 | | | 748 | | | 4,410 | | | 1,285 | | | Minority interests in proved developed and undeveloped reserves as of (Mb): | | | | | | | | | | December 31, 2006 | | 17 | | | 82 | | | — | | | — | | | — | | | 99 | | | | | December 31, 2007 | | 15 | | | 116 | | | — | | | — | | | — | | | 131 | | | | | December 31, 2008 | | 12 | | | 89 | | | — | | | — | | | — | | | 101 | | | | | | Proved developed and undeveloped reserves of equity and non-consolidated affiliates as of (Mb): | | | | | | | | | | December 31, 2006 | | — | | | 56 | | | — | | | — | | | 899 | | | | | | 955 | | December 31, 2007 | | — | | �� | 43 | | | — | | | — | | | 1,339 | | | | | | 1,382 | | December 31, 2008 | | — | | | 58 | | | — | | | — | | | 1,227 | | | | | | 1,285 | | | Proved developed reserves as of (Mb): | | | | | | | | | | December 31, 2006 | | 629 | | | 1,436 | | | 19 | | | 40 | | | 418 | | | 2,542 | | | 665 | | December 31, 2007 | | 560 | | | 1,389 | | | 25 | | | 33 | | | 253 | | | 2,260 | | | 735 | | December 31, 2008 | | 516 | | | 1,313 | | | 10 | | | 34 | | | 278 | | | 2,151 | | | 651 | | | Proved developed reserves of equity and non-consolidated affiliates as of (Mb): | | | | | | | | | | December 31, 2006 | | — | | | 49 | | | — | | | — | | | 616 | | | | | | 665 | | December 31, 2007 | | — | | | 30 | | | — | | | — | | | 705 | | | | | | 735 | | December 31, 2008 | | — | | | 44 | | | — | | | — | | | 607 | | | | | | 651 | |
| | | | | | | | | | | | | | | | | | | | | | | | | | | | Consolidated subsidiaries | | (M€) | | Europe | | | Africa | | | Americas | | | Middle
East | | | Asia | | | Total | | 2009 | | | | | | | | | | | | | | | | | | | | | | | | | Non-Group sales | | | 2,499 | | | | 1,994 | | | | 583 | | | | 859 | | | | 1,926 | | | | 7,861 | | | Group sales | | | 4,728 | | | | 7,423 | | | | 310 | | | | 556 | | | | 597 | | | | 13,614 | | Total Revenues | | | 7,227 | | | | 9,417 | | | | 893 | | | | 1,415 | | | | 2,523 | | | | 21,475 | | Production costs | | | (1,155 | ) | | | (1,122 | ) | | | (193 | ) | | | (204 | ) | | | (243 | ) | | | (2,917 | ) | Exploration expenses | | | (160 | ) | | | (265 | ) | | | (121 | ) | | | (81 | ) | | | (70 | ) | | | (697 | ) | Depreciation, depletion and amortization and valuation allowances | | | (1,489 | ) | | | (1,471 | ) | | | (262 | ) | | | (314 | ) | | | (613 | ) | | | (4,149 | ) | Other expenses(a) | | | (261 | ) | | | (895 | ) | | | (181 | ) | | | (170 | ) | | | (56 | ) | | | (1,563 | ) | Pre-tax income from producing activities | | | 4,162 | | | | 5,664 | | | | 136 | | | | 646 | | | | 1,541 | | | | 12,149 | | Income tax | | | (2,948 | ) | | | (3,427 | ) | | | (103 | ) | | | (309 | ) | | | (747 | ) | | | (7,534 | ) | Results of oil and gas producing activities | | | 1,214 | | | | 2,237 | | | | 33 | | | | 337 | | | | 794 | | | | 4,615 | | 2010 | | | | | | | | | | | | | | | | | | | | | | | | | | Non-Group sales | | | 2,839 | | | | 2,639 | | | | 628 | | | | 1,038 | | | | 2,540 | | | | 9,684 | | | Group sales | | | 5,599 | | | | 9,894 | | | | 540 | | | | 644 | | | | 683 | | | | 17,360 | | Total Revenues | | | 8,438 | | | | 12,533 | | | | 1,168 | | | | 1,682 | | | | 3,223 | | | | 27,044 | | Production costs | | | (1,281 | ) | | | (1,187 | ) | | | (222 | ) | | | (259 | ) | | | (279 | ) | | | (3,228 | ) | Exploration expenses | | | (266 | ) | | | (275 | ) | | | (216 | ) | | | (8 | ) | | | (99 | ) | | | (864 | ) | Depreciation, depletion and amortization and valuation allowances | | | (1,404 | ) | | | (1,848 | ) | | | (368 | ) | | | (264 | ) | | | (830 | ) | | | (4,714 | ) | Other expenses(a) | | | (299 | ) | | | (1,014 | ) | | | (218 | ) | | | (241 | ) | | | (72 | ) | | | (1,844 | ) | Pre-tax income from producing activities | | | 5,188 | | | | 8,209 | | | | 144 | | | | 910 | | | | 1,943 | | | | 16,394 | | Income tax | | | (3,237 | ) | | | (5,068 | ) | | | (83 | ) | | | (402 | ) | | | (950 | ) | | | (9,740 | ) | Results of oil and gas producing activities | | | 1,951 | | | | 3,141 | | | | 61 | | | | 508 | | | | 993 | | | | 6,654 | | 2011 | | | | | | | | | | | | | | | | | | | | | | | | | | Non-Group sales | | | 3,116 | | | | 3,188 | | | | 776 | | | | 1,159 | | | | 3,201 | | | | 11,440 | | | Group sales | | | 7,057 | | | | 11,365 | | | | 764 | | | | 737 | | | | 712 | | | | 20,635 | | Total Revenues | | | 10,173 | | | | 14,553 | | | | 1,540 | | | | 1,896 | | | | 3,913 | | | | 32,075 | | Production costs | | | (1,235 | ) | | | (1,179 | ) | | | (250 | ) | | | (286 | ) | | | (304 | ) | | | (3,254 | ) | Exploration expenses | | | (343 | ) | | | (323 | ) | | | (48 | ) | | | (11 | ) | | | (294 | ) | | | (1,019 | ) | Depreciation, depletion and amortization and valuation allowances | | | (1,336 | ) | | | (1,845 | ) | | | (352 | ) | | | (278 | ) | | | (791 | ) | | | (4,602 | ) | Other expenses(a) | | | (307 | ) | | | (1,181 | ) | | | (274 | ) | | | (276 | ) | | | (95 | ) | | | (2,133 | ) | Pre-tax income from producing activities | | | 6,952 | | | | 10,025 | | | | 616 | | | | 1,045 | | | | 2,429 | | | | 21,067 | | Income tax | | | (5,059 | ) | | | (6,484 | ) | | | (293 | ) | | | (465 | ) | | | (1,302 | ) | | | (13,603 | ) | Results of oil and gas producing activities | | | 1,893 | | | | 3,541 | | | | 323 | | | | 580 | | | | 1,127 | | | | 7,464 | |
| (a) | Including the Middle East.Included production taxes and accretion expense as provided for by IAS 37 (€271 million in 2009,€326 million in 2010 and€338 million in 2011). |
| | | | | | | | | | | | | | | | | | | | | | | | | Natural Gas (Bcf) | | | | | Europe | | | Africa | | | North America | | | Asia-
Pacific | | | Rest of World(a) | | | Total | | | Equity Affiliates and Non- Consolidated | | Balance as of January 1st, 2006 | | 5,790 | | | 4,798 | | | 224 | | | 4,057 | | | 5,401 | | | 20,270 | | | 4,480 | | Revisions of previous estimates | | 127 | | | 133 | | | (8 | ) | | 116 | | | (106 | ) | | 262 | | | (9 | ) | Extensions, discoveries and other | | 283 | | | 32 | | | — | | | — | | | — | | | 315 | | | 2,105 | | Acquisitions of reserves in place | | — | | | — | | | 12 | | | — | | | — | | | 12 | | | 1 | | Sales of reserves in place | | (31 | ) | | — | | | (160 | ) | | — | | | (1 | ) | | (192 | ) | | — | | Production for the year | | (717 | ) | | (176 | ) | | (16 | ) | | (470 | ) | | (222 | ) | | (1,601 | ) | | (104 | ) | Balance as of December 31, 2006 | | 5,452 | | | 4,787 | | | 52 | | | 3,703 | | | 5,072 | | | 19,066 | | | 6,473 | | Revisions of previous estimates | | 487 | | | 805 | | | 2 | | | (61 | ) | | (95 | ) | | 1,138 | | | 155 | | Extensions, discoveries and other | | 265 | | | 12 | | | 3 | | | 263 | | | — | | | 543 | | | 126 | | Acquisitions of reserves in place | | — | | | — | | | — | | | — | | | — | | | — | | | — | | Sales of reserves in place | | — | | | (1 | ) | | — | | | — | | | — | | | (1 | ) | | (4 | ) | Production for the year | | (673 | ) | | (232 | ) | | (12 | ) | | (470 | ) | | (276 | ) | | (1,663 | ) | | (103 | ) | Balance as of December 31, 2007 | | 5,531 | | | 5,371 | | | 45 | | | 3,435 | | | 4,701 | | | 19,083 | | | 6,647 | | Revisions of previous estimates | | 145 | | | 381 | | | (17 | ) | | 415 | | | 726 | | | 1,650 | | | (13 | ) | Extensions, discoveries and other | | 377 | | | 17 | | | — | | | 90 | | | — | | | 484 | | | 76 | | Acquisitions of reserves in place | | 76 | | | — | | | — | | | — | | | — | | | 76 | | | — | | Sales of reserves in place | | — | | | — | | | — | | | — | | | (15 | ) | | (15 | ) | | — | | Production for the year | | (622 | ) | | (240 | ) | | (6 | ) | | (453 | ) | | (340 | ) | | (1,661 | ) | | (109 | ) | Balance as of December 31, 2008 | | 5,507 | | | 5,529 | | | 22 | | | 3,487 | | | 5,072 | | | 19,617 | | | 6,601 | | | | | | Minority interests in proved developed and undeveloped reserves as of (Bcf): | | | | | | | | | | | December 31, 2006 | | 92 | | | 88 | | | — | | | — | | | — | | | 180 | | | | | December 31, 2007 | | 80 | | | 111 | | | — | | | — | | | — | | | 191 | | | | | December 31, 2008 | | 75 | | | 64 | | | — | | | — | | | — | | | 139 | | | | | | | | Proved developed and undeveloped reserves of equity and non-consolidated affiliates as of (Bcf): | | | | | December 31, 2006 | | — | | | 20 | | | — | | | — | | | 6,453 | | | | | | 6,473 | | December 31, 2007 | | — | | | 140 | | | — | | | — | | | 6,507 | | | | | | 6,647 | | December 31, 2008 | | — | | | 215 | | | — | | | — | | | 6,386 | | | | | | 6,601 | | | | | | | | | | | Proved developed reserves as of (Bcf): | | | | | | | | | | | | | | | | | | | | | | December 31, 2006 | | 3,632 | | | 2,643 | | | 39 | | | 2,592 | | | 2,395 | | | 11,301 | | | 1,331 | | December 31, 2007 | | 3,602 | | | 2,560 | | | 30 | | | 2,221 | | | 3,427 | | | 11,840 | | | 1,267 | | December 31, 2008 | | 3,989 | | | 2,280 | | | 8 | | | 2,180 | | | 3,825 | | | 12,282 | | | 1,181 | | | | | Proved developed reserves of equity and non-consolidated affiliates as of (Bcf): | | | | | | | | December 31, 2006 | | — | | | 20 | | | — | | | — | | | 1,311 | | | | | | 1,331 | | December 31, 2007 | | — | | | 14 | | | — | | | — | | | 1,253 | | | | | | 1,267 | | December 31, 2008 | | — | | | 12 | | | — | | | — | | | 1,169 | | | | | | 1,181 | |
(a) | Including the Middle East. |
| | | | | | | | | | | | | | | | | | | | | | | | | | | | Equity affiliates | | (M€) | | Europe | | | Africa | | | Americas | | | Middle
East | | | Asia | | | Total | | 2009 | | | | | | | | | | | | | | | | | | | | | | | | | Non-Group sales | | | — | | | | 203 | | | | 528 | | | | 231 | | | | — | | | | 962 | | | Group sales | | | — | | | | — | | | | — | | | | 3,382 | | | | — | | | | 3,382 | | Total Revenues | | | — | | | | 203 | | | | 528 | | | | 3,613 | | | | — | | | | 4,344 | | Production costs | | | — | | | | (31 | ) | | | (41 | ) | | | (271 | ) | | | — | | | | (343 | ) | Exploration expenses | | | — | | | | — | | | | (17 | ) | | | — | | | | — | | | | (17 | ) | Depreciation, depletion and amortization and valuation allowances | | | — | | | | (42 | ) | | | (73 | ) | | | (247 | ) | | | — | | | | (362 | ) | Other expenses | | | — | | | | (9 | ) | | | (205 | ) | | | (2,800 | ) | | | — | | | | (3,014 | ) | Pre-tax income from producing activities | | | — | | | | 121 | | | | 192 | | | | 295 | | | | — | | | | 608 | | Income tax | | | — | | | | (93 | ) | | | (74 | ) | | | (101 | ) | | | — | | | | (268 | ) | Results of oil and gas producing activities | | | — | | | | 28 | | | | 118 | | | | 194 | | | | — | | | | 340 | | 2010 | | | | | | | | | | | | | | | | | | | | | | | | | | Non-Group sales | | | — | | | | 148 | | | | 120 | | | | 596 | | | | — | | | | 864 | | Group sales | | | — | | | | 3 | | | | 565 | | | | 4,646 | | | | — | | | | 5,214 | | Total Revenues | | | — | | | | 151 | | | | 685 | | | | 5,242 | | | | — | | | | 6,078 | | Production costs | | | — | | | | (44 | ) | | | (53 | ) | | | (195 | ) | | | (1 | ) | | | (293 | ) | Exploration expenses | | | — | | | | (7 | ) | | | (23 | ) | | | — | | | | — | | | | (30 | ) | Depreciation, depletion and amortization and valuation allowances | | | — | | | | (44 | ) | | | (89 | ) | | | (259 | ) | | | — | | | | (392 | ) | Other expenses | | | — | | | | — | | | | (268 | ) | | | (4,034 | ) | | | — | | | | (4,302 | ) | Pre-tax income from producing activities | | | — | | | | 56 | | | | 252 | | | | 754 | | | | (1 | ) | | | 1,061 | | Income tax | | | — | | | | — | | | | (44 | ) | | | (142 | ) | | | — | | | | (186 | ) | Results of oil and gas producing activities | | | — | | | | 56 | | | | 208 | | | | 612 | | | | (1 | ) | | | 875 | | 2011 | | | | | | | | | | | | | | | | | | | | | | | | | Non-Group sales | | | — | | | | 26 | | | | 15 | | | | 1,080 | | | | 256 | | | | 1,377 | | Group sales | | | — | | | | — | | | | 831 | | | | 6,804 | | | | — | | | | 7,635 | | Total Revenues | | | — | | | | 26 | | | | 846 | | | | 7,884 | | | | 256 | | | | 9,012 | | Production costs | | | — | | | | (7 | ) | | | (48 | ) | | | (250 | ) | | | (28 | ) | | | (333 | ) | Exploration expenses | | | — | | | | — | | | | — | | | | — | | | | (4 | ) | | | (4 | ) | Depreciation, depletion and amortization and valuation allowances | | | — | | | | (7 | ) | | | (44 | ) | | | (225 | ) | | | (109 | ) | | | (385 | ) | Other expenses | | | — | | | | — | | | | (550 | ) | | | (6,101 | ) | | | (36 | ) | | | (6,687 | ) | Pre-tax income from producing activities | | | — | | | | 12 | | | | 204 | | | | 1,308 | | | | 79 | | | | 1,603 | | Income tax | | | — | | | | — | | | | (95 | ) | | | (285 | ) | | | (34 | ) | | | (414 | ) | Results of oil and gas producing activities | | | — | | | | 12 | | | | 109 | | | | 1,023 | | | | 45 | | | | 1,189 | |
Results of operations of oil and gas producing activitiesCOST INCURRED
The following tables include revenues and expenses associated directly with the Group’s oil and gas producing activities. They do not include any interest costs. | | | | | | | | | | | | | | | | | | | | | | Consolidated subsidiaries | | | (M€) | | Europe | | | Africa | | | North
America | | | Asia-
Pacific | | | Rest of
World(a) | | | Total | | Year ended December 31, 2008 | | | | | | | | | | | | | | | | | | | Revenues | | | | | | | | | | | | | | | | | | | Sales to unaffiliated parties | | 4,521 | | | 2,930 | | | 94 | | | 2,785 | | | 2,205 | | | 12,535 | | Transfers to affiliated parties | | 6,310 | | | 11,425 | | | 89 | | | 403 | | | 903 | | | 19,130 | | Total Revenues | | 10,831 | | | 14,355 | | | 183 | | | 3,188 | | | 3,108 | | | 31,665 | | Production costs | | (1,280 | ) | | (1,055 | ) | | (117 | ) | | (210 | ) | | (398 | ) | | (3,060 | ) | Exploration expenses | | (185 | ) | | (209 | ) | | (99 | ) | | (156 | ) | | (115 | ) | | (764 | ) | Depreciation, depletion and amortization and valuation allowances | | (1,266 | ) | | (1,195 | ) | | (239 | ) | | (422 | ) | | (492 | ) | | (3,614 | ) | Other expenses(b) | | (260 | ) | | (1,214 | ) | | (3 | ) | | (34 | ) | | (605 | ) | | (2,116 | ) | Pretax income from producing activities | | 7,840 | | | 10,682 | | | (275 | ) | | 2,366 | | | 1,498 | | | 22,111 | | Income tax | | (5,376 | ) | | (7,160 | ) | | 74 | | | (1,199 | ) | | (677 | ) | | (14,338 | ) | Results of oil and gas producing activities | | 2,464 | | | 3,522 | | | (201 | ) | | 1,167 | | | 821 | | | 7,773 | | | | | | | | | Year ended December 31, 2007 | | | | | | | | | | | | | | | | | | | Revenues | | | | | | | | | | | | | | | | | | | Sales to unaffiliated parties | | 3,715 | | | 2,497 | | | — | | | 2,123 | | | 3,076 | | | 11,411 | | Transfers to affiliated parties | | 5,484 | | | 9,724 | | | 247 | | | 384 | | | 665 | | | 16,504 | | Total Revenues | | 9,199 | | | 12,221 | | | 247 | | | 2,507 | | | 3,741 | | | 27,915 | | Production costs | | (1,102 | ) | | (906 | ) | | (100 | ) | | (195 | ) | | (385 | ) | | (2,688 | ) | Exploration expenses | | (113 | ) | | (480 | ) | | (49 | ) | | (54 | ) | | (180 | ) | | (876 | ) | Depreciation, depletion and amortization and valuation allowances | | (1,287 | ) | | (932 | ) | | (136 | ) | | (340 | ) | | (616 | ) | | (3,311 | ) | Other expenses(b) | | (244 | ) | | (1,238 | ) | | — | | | (26 | ) | | (841 | ) | | (2,349 | ) | Pretax income from producing activities | | 6,453 | | | 8,665 | | | (38 | ) | | 1,892 | | | 1,719 | | | 18,691 | | Income tax | | (4,180 | ) | | (5,772 | ) | | 24 | | | (915 | ) | | (1,040 | ) | | (11,883 | ) | Results of oil and gas producing activities | | 2,273 | | | 2,893 | | | (14 | ) | | 977 | | | 679 | | | 6,808 | | | | | | | | | Year ended December 31, 2006 | | | | | | | | | | | | | | | | | | | Revenues | | | | | | | | | | | | | | | | | | | Sales to unaffiliated parties | | 3,285 | | | 2,550 | | | 1 | | | 2,276 | | | 2,457 | | | 10,569 | | Transfers to affiliated parties | | 7,333 | | | 8,179 | | | 167 | | | 374 | | | 1,124 | | | 17,177 | | Total Revenues | | 10,618 | | | 10,729 | | | 168 | | | 2,650 | | | 3,581 | | | 27,746 | | Production costs | | (910 | ) | | (731 | ) | | (57 | ) | | (184 | ) | | (307 | ) | | (2,189 | ) | Exploration expenses | | (140 | ) | | (246 | ) | | (40 | ) | | (58 | ) | | (149 | ) | | (633 | ) | Depreciation, depletion and amortization and valuation allowances | | (1,256 | ) | | (844 | ) | | (78 | ) | | (301 | ) | | (519 | ) | | (2,998 | ) | Other expenses(b) | | (227 | ) | | (1,274 | ) | | (3 | ) | | (25 | ) | | (881 | ) | | (2,410 | ) | Pretax income from producing activities | | 8,085 | | | 7,634 | | | (10 | ) | | 2,082 | | | 1,725 | | | 19,516 | | Income tax | | (5,115 | ) | | (5,335 | ) | | (14 | ) | | (1,008 | ) | | (803 | ) | | (12,275 | ) | Results of oil and gas producing activities | | 2,970 | | | 2,299 | | | (24 | ) | | 1,074 | | | 922 | | | 7,241 | |
(a) | Including the Middle East. |
(b) | Including production taxes and IAS 37 accretion expense (162 M€ in 2006, 169 M€ in 2007 and 223 M€ in 2008). |
Group’s share of equity affiliates’ results of oil and gas producing activities:
| | | | | | | | | | | | | December 31, 2008 | | — | | 49 | | — | | — | | 532 | | 581 | December 31, 2007 | | — | | 95 | | — | | — | | 179 | | 274 | December 31, 2006 | | — | | 125 | | — | | — | | 257 | | 382 |
Costs incurred
The tables below presentset forth the costs incurred in the Group’s oil and gas property acquisition, exploration and development activities, including both capitalized and expensed amounts. They do not include costs incurred related to oil and gas transportation and LNG liquefaction and transportation activities.
| | | | Consolidated subsidiaries | | Consolidated subsidiaries | | | (M€) | | Europe | | Africa | | North
America | | Asia- Pacific | | Rest of World(a) | | Total | | Europe | | | Africa | | | Americas | | | Middle
East | | | Asia | | | Total | | December 31, 2008 | | | | | | | | | | | | | | 2009 | | | | | | | | | | | | | | Proved property acquisition | | 269 | | 78 | | — | | — | | 26 | | 373 | | | 71 | | | | 45 | | | | 1,551 | | | | 105 | | | | — | | | | 1,772 | | Unproved property acquisition | | 24 | | 143 | | 19 | | 3 | | 8 | | 197 | | | 26 | | | | 8 | | | | 403 | | | | — | | | | 21 | | | | 458 | | Exploration costs | | 228 | | 493 | | 109 | | 222 | | 147 | | 1,199 | | | 284 | | | | 475 | | | | 222 | | | | 87 | | | | 123 | | | | 1,191 | | Development costs(b) | | 2,035 | | 3,121 | | 320 | | 689 | | 1,276 | | 7,441 | | | Total costs incurred | | 2,556 | | 3,835 | | 448 | | 914 | | 1,457 | | 9,210 | | | December 31, 2007 | | | | | | | | | | | | | | Development costs(a) | | | | 1,658 | | | | 3,288 | | | | 618 | | | | 250 | | | | 1,852 | | | | 7,666 | | Total cost incurred | | | | 2,039 | | | | 3,816 | | | | 2,794 | | | | 442 | | | | 1,996 | | | | 11,087 | | 2010 | | | | | | | | | | | | | | Proved property acquisition | | — | | 50 | | — | | 1 | | 10 | | 61 | | | 162 | | | | 137 | | | | 26 | | | | 139 | | | | 21 | | | | 485 | | Unproved property acquisition | | — | | 265 | | 9 | | 18 | | 10 | | 302 | | | 5 | | | | 124 | | | | 1,186 | | | | 8 | | | | 619 | | | | 1,942 | | Exploration costs | | 230 | | 586 | | 49 | | 158 | | 172 | | 1,195 | | | 361 | | | | 407 | | | | 276 | | | | 17 | | | | 250 | | | | 1,311 | | Development costs(b) | | 1,762 | | 2,853 | | 429 | | 622 | | 1,159 | | 6,825 | | | Total costs incurred | | 1,992 | | 3,754 | | 487 | | 799 | | 1,351 | | 8,383 | | | December 31, 2006 | | | | | | | | | | | | | | Development costs(a) | | | | 1,565 | | | | 3,105 | | | | 718 | | | | 247 | | | | 2,007 | | | | 7,642 | | Total cost incurred | | | | 2,093 | | | | 3,773 | | | | 2,206 | | | | 411 | | | | 2,897 | | | | 11,380 | | 2011 | | | | | | | | | | | | | | Proved property acquisition | | 58 | | 3 | | 125 | | — | | 53 | | 239 | | | 298 | | | | 10 | | | | 413 | | | | 2 | | | | 251 | | | | 974 | | Unproved property acquisition | | — | | 20 | | 31 | | 240 | | 11 | | 302 | | | 1 | | | | 397 | | | | 1,692 | | | | 3 | | | | 14 | | | | 2,107 | | Exploration costs | | 229 | | 538 | | 112 | | 69 | | 204 | | 1,152 | | | 505 | | | | 384 | | | | 239 | | | | 17 | | | | 417 | | | | 1,562 | | Development costs(b) | | 1,284 | | 2,272 | | 403 | | 544 | | 1,251 | | 5,754 | | | Total costs incurred | | 1,571 | | 2,833 | | 671 | | 853 | | 1,519 | | 7,447 | | Development costs(a) | | | | 2,352 | | | | 3,895 | | | | 1,329 | | | | 329 | | | | 2,823 | | | | 10,728 | | Total cost incurred | | | | 3,156 | | | | 4,686 | | | | 3,673 | | | | 351 | | | | 3,505 | | | | 15,371 | |
| | | | | | | | | | | | | | | | | | | | | | | | | | | | Equity affiliates | | (M€) | | Europe | | | Africa | | | Americas | | | Middle
East | | | Asia | | | Total | | 2009 | | | | | | | | | | | | | | | | | | | | | | | | | Proved property acquisition | | | — | | | | — | | | | — | | | | — | | | | — | | | | — | | Unproved property acquisition | | | — | | | | — | | | | — | | | | — | | | | — | | | | — | | Exploration costs | | | — | | | | — | | | | 22 | | | | 3 | | | | — | | | | 25 | | Development costs(a) | | | — | | | | 28 | | | | 93 | | | | 293 | | | | 23 | | | | 437 | | Total cost incurred | | | — | | | | 28 | | | | 115 | | | | 296 | | | | 23 | | | | 462 | | 2010 | | | | | | | | | | | | | | | | | | | | | | | | | Proved property acquisition | | | — | | | | — | | | | — | | | | — | | | | — | | | | — | | Unproved property acquisition | | | — | | | | — | | | | — | | | | — | | | | — | | | | — | | Exploration costs | | | — | | | | 4 | | | | 30 | | | | 4 | | | | — | | | | 38 | | Development costs(a) | | | — | | | | 20 | | | | 99 | | | | 476 | | | | 73 | | | | 668 | | Total cost incurred | | | — | | | | 24 | | | | 129 | | | | 480 | | | | 73 | | | | 706 | | 2011 | | | | | | | | | | | | | | | | | | | | | | | | | Proved property acquisition | | | — | | | | — | | | | — | | | | — | | | | 2,691 | | | | 2,691 | | Unproved property acquisition | | | — | | | | — | | | | — | | | | — | | | | 1,116 | | | | 1,116 | | Exploration costs | | | — | | | | — | | | | 2 | | | | — | | | | — | | | | 2 | �� | Development costs(a) | | | — | | | | 2 | | | | 106 | | | | 314 | | | | 939 | | | | 1,361 | | Total cost incurred | | | — | | | | 2 | | | | 108 | | | | 314 | | | | 4,746 | | | | 5,170 | |
| (a) | Including the Middle East. |
(b) | Including asset retirement costs capitalized during the year and any gains or losses recognized upon settlement of asset retirement obligationsobligation during the year. |
Group’s share of equity affiliates’ costs of property acquisition, exploration and development:
| | | | | | | | | | | | | December 31, 2008(a) | | — | | 360 | | — | | — | | 612 | | 972 | December 31, 2007(a) | | — | | 48 | | — | | — | | 599 | | 647 | December 31, 2006(a) | | — | | 71 | | — | | — | | 716 | | 787 |
(a) | Including 33 M€ of exploration costs in 2008, 58 M€ in 2007 and 56 M€ in 2006. |
Costs to develop Proved Undeveloped Reserves
The following table presents the amounts spent to develop the proved undeveloped reserves in 2006, 2007 and 2008, as well as the amounts included in the most recent standardized measure of future net cash flows to develop proved undeveloped reserves in each of the next three years.
| | | | | | | | | | | | | | | | | (M€) | | 2006 | | 2007 | | 2008 | | 2009 | | | 2010 | | | 2011 | | Costs to develop Proved Undeveloped
Reserves (consolidated subsidiaries) | | 5,128 | | 6,035 | | 6,636 | | 7,702 | (a) | | 7,721 | (a) | | 6,417 | (a) |
Capitalized costsCAPITALIZED COSTS RELATED TO OIL AND GAS PRODUCING ACTIVITIES
Capitalized costs represent the amounts of capitalized proved and unproved property costs, including support equipment and facilities, along with the related accumulated depreciation, depletion and amortization.
The following tables present details ofdo not include capitalized costs related to the Group’s oil and gas explorationtransportation and production activities as of the datesLNG liquefaction and on the basis indicated.transportation activities. | | | | Consolidated subsidiaries | | | Consolidated subsidiaries | | | (M€) | | Europe | | Africa | | North America | | Asia-
Pacific | | Rest of World(a) | | Total | | | Europe | | Africa | | Americas | | Middle
East | | Asia | | Total | | December 31, 2008 | | | | | | | | | | | | | | | As of December 31, 2009 | | | | | | | | | | | | | | Proved properties | | 26,030 | | | 25,136 | | | 2,400 | | | 4,857 | | | 10,911 | | | 69,334 | | | | 30,613 | | | | 27,557 | | | | 7,123 | | | | 5,148 | | | | 10,102 | | | | 80,543 | | Unproved properties | | 132 | | | 1,145 | | | 131 | | | 377 | | | 131 | | | 1,916 | | | | 337 | | | | 1,138 | | | | 839 | | | | 30 | | | | 555 | | | | 2,899 | | Total capitalized costs | | 26,162 | | | 26,281 | | | 2,531 | | | 5,234 | | | 11,042 | | | 71,250 | | | | 30,950 | | | | 28,695 | | | | 7,962 | | | | 5,178 | | | | 10,657 | | | | 83,442 | | Accumulated depreciation | | (18,382 | ) | | (12,339 | ) | | (660 | ) | | (2,265 | ) | | (5,144 | ) | | (38,790 | ) | | Accumulated depreciation, depletion and amortization | | | | (21,870 | ) | | | (13,510 | ) | | | (2,214 | ) | | | (3,325 | ) | | | (3,085 | ) | | | (44,004 | ) | Net capitalized costs | | 7,780 | | | 13,942 | | | 1,871 | | | 2,969 | | | 5,898 | | | 32,460 | | | | 9,080 | | | | 15,185 | | | | 5,748 | | | | 1,853 | | | | 7,572 | | | | 39,438 | | Company’s share of equity affiliates’ net capitalized costs | | — | | | 403 | | | — | | | — | | | 2,452 | | | 2,855 | | | December 31, 2007 | | | | | | | | | | | | | | As of December 31, 2010 | | | | | | | | | | | | | | Proved properties | | 29,263 | | | 20,035 | | | 2,112 | | | 3,891 | | | 9,246 | | | 64,547 | | | | 31,735 | | | | 32,494 | | | | 7,588 | | | | 5,715 | | | | 12,750 | | | | 90,282 | | Unproved properties | | 215 | | | 993 | | | 104 | | | 305 | | | 151 | | | 1,768 | | | | 402 | | | | 1,458 | | | | 2,142 | | | | 49 | | | | 1,433 | | | | 5,484 | | Total capitalized costs | | 29,478 | | | 21,028 | | | 2,216 | | | 4,196 | | | 9,397 | | | 66,315 | | | | 32,137 | | | | 33,952 | | | | 9,730 | | | | 5,764 | | | | 14,183 | | | | 95,766 | | Accumulated depreciation | | (21,092 | ) | | (10,484 | ) | | (432 | ) | | (1,737 | ) | | (4,380 | ) | | (38,125 | ) | | Accumulated depreciation, depletion and amortization | | | | (23,006 | ) | | | (16,716 | ) | | | (2,302 | ) | | | (3,849 | ) | | | (4,092 | ) | | | (49,965 | ) | Net capitalized costs | | 8,386 | | | 10,544 | | | 1,784 | | | 2,459 | | | 5,017 | | | 28,190 | | | | 9,131 | | | | 17,236 | | | | 7,428 | | | | 1,915 | | | | 10,091 | | | | 45,801 | | Company’s share of equity affiliates’ net capitalized costs | | — | | | 233 | | | — | | | — | | | 1,477 | | | 1,710 | | | December 31, 2006 | | | | | | | | | | | | | | As of December 31, 2011 | | | | | | | | | | | | | | Proved properties | | 28,217 | | | 19,569 | | | 1,884 | | | 3,678 | | | 9,861 | | | 63,209 | | | | 34,308 | | | | 37,032 | | | | 8,812 | | | | 6,229 | | | | 17,079 | | | | 103,460 | | Unproved properties | | 89 | | | 807 | | | 193 | | | 243 | | | 181 | | | 1,513 | | | | 460 | | | | 1,962 | | | | 4,179 | | | | 62 | | | | 911 | | | | 7,574 | | Total capitalized costs | | 28,306 | | | 20,376 | | | 2,077 | | | 3,921 | | | 10,042 | | | 64,722 | | | | 34,768 | | | | 38,994 | | | | 12,991 | | | | 6,291 | | | | 17,990 | | | | 111,034 | | Accumulated depreciation | | (20,456 | ) | | (11,271 | ) | | (553 | ) | | (1,588 | ) | | (4,604 | ) | | (38,472 | ) | | Accumulated depreciation, depletion and amortization | | | | (24,047 | ) | | | (18,642 | ) | | | (2,294 | ) | | | (4,274 | ) | | | (5,066 | ) | | | (54,323 | ) | Net capitalized costs | | 7,850 | | | 9,105 | | | 1,524 | | | 2,333 | | | 5,438 | | | 26,250 | | | | 10,721 | | | | 20,352 | | | | 10,697 | | | | 2,017 | | | | 12,924 | | | | 56,711 | | Company’s share of equity affiliates’ net capitalized costs | | — | | | 321 | | | — | | | — | | | 1,331 | | | 1,652 | | |
(a) | Including the Middle East. |
| | | | | | | | | | | | | | | | | | | | | | | | | | | | Equity affiliates | | (M€) | | Europe | | | Africa | | | Americas | | | Middle
East | | | Asia | | | Total | | As of December 31, 2009 | | | | | | | | | | | | | | | | | | | | | | | | | Proved properties | | | — | | | | 610 | | | | 726 | | | | 2,404 | | | | — | | | | 3,740 | | Unproved properties | | | — | | | | — | | | | 135 | | | | — | | | | 62 | | | | 197 | | Total capitalized costs | | | — | | | | 610 | | | | 861 | | | | 2,404 | | | | 62 | | | | 3,937 | | Accumulated depreciation, depletion and amortization | | | — | | | | (387 | ) | | | (171 | ) | | | (1,723 | ) | | | — | | | | (2,281 | ) | Net capitalized costs | | | — | | | | 223 | | | | 690 | | | | 681 | | | | 62 | | | | 1,656 | | As of December 31, 2010 | | | | | | | | | | | | | | | | | | | | | | | | | Proved properties | | | — | | | | 639 | | | | 887 | | | | 3,110 | | | | — | | | | 4,636 | | Unproved properties | | | — | | | | 25 | | | | 168 | | | | — | | | | 138 | | | | 331 | | Total capitalized costs | | | — | | | | 664 | | | | 1,055 | | | | 3,110 | | | | 138 | | | | 4,967 | | Accumulated depreciation, depletion and amortization | | | — | | | | (462 | ) | | | (307 | ) | | | (2,029 | ) | | | — | | | | (2,798 | ) | Net capitalized costs | | | — | | | | 202 | | | | 748 | | | | 1,081 | | | | 138 | | | | 2,169 | | As of December 31, 2011 | | | | | | | | | | | | | | | | | | | | | | | | | Proved properties | | | — | | | | — | | | | 731 | | | | 3,496 | | | | 3,973 | | | | 8,200 | | Unproved properties | | | — | | | | — | | | | — | | | | — | | | | 1,146 | | | | 1,146 | | Total capitalized costs | | | — | | | | — | | | | 731 | | | | 3,496 | | | | 5,119 | | | | 9,346 | | Accumulated depreciation, depletion and amortization | | | — | | | | — | | | | (96 | ) | | | (2,337 | ) | | | (213 | ) | | | (2,646 | ) | Net capitalized costs | | | — | | | | — | | | | 635 | | | | 1,159 | | | | 4,906 | | | | 6,700 | |
Standardized measure of discounted future net cash flowsSTANDARDIZED MEASURE OF
DISCOUNTED FUTURE NET CASH FLOWS (EXCLUDING TRANSPORTATION) The standardized measure of discounted future net cash flows from production ofrelating to proved reservesoil and gas reserve quantities was developed as follows: 1. | Estimates of proved reserves and the corresponding production profiles are based on technical and economic conditions at year end; |
estimates of proved reserves and the corresponding production profiles are based on existing technical and economic conditions; 2. | The estimated future cash flows from proved reserves are determined based on prices at December 31, with future price changes considered only to the extent provided by contractual arrangements in existence at year end; |
the estimated future cash flows are determined based on prices used in estimating the Group’s proved oil and gas reserves; 3. | The future cash flows incorporate estimated production costs (including production taxes), future development costs and asset retirement costs. All |
the future cash flows incorporate estimated production costs (including production taxes), future development costs and asset retirement costs. All cost estimates are based on year-end technical and economic conditions; | estimates are based on year-end technical and economic conditions;
|
4. | Future income taxes are computed by applying the year-end statutory tax rate to future net cash flows after consideration of permanent differences and future income tax credits; and |
future income taxes are computed by applying the year-end statutory tax rate to future net cash flows after consideration of permanent differences and future income tax credits; and 5. | Future net cash flows are discounted at a standard discount rate of 10%. |
future net cash flows are discounted at a standard discount rate of 10%. These principles applied are those required by FAS No. 69ASC 932 and do not necessarily reflect the expectations of real revenues from these reserves, nor their present value; hence, they do not constitute criteria offor investment decision.decisions. An estimate of the fair value of reserves should also take into account, among other things, the recovery of reserves not presently classified as proved, anticipated future changes in prices and costs and a discount factor more representative of the time value of money and the risks inherent in reservereserves estimates. | | | | | | | | | | | | | | | | | | | | | | | | | | | | Consolidated subsidiaries | | (M€) | | Europe | | | Africa | | | Americas | | | Middle
East | | | Asia | | | Total | | As of December 31, 2009 | | | | | | | | | | | | | | | | | | | | | | | | | Future cash inflows | | | 50,580 | | | | 107,679 | | | | 18,804 | | | | 9,013 | | | | 32,004 | | | | 218,080 | | Future production costs | | | (11,373 | ) | | | (23,253 | ) | | | (8,286 | ) | | | (2,831 | ) | | | (6,996 | ) | | | (52,739 | ) | Future development costs | | | (12,795 | ) | | | (21,375 | ) | | | (5,728 | ) | | | (698 | ) | | | (6,572 | ) | | | (47,168 | ) | Future income taxes | | | (17,126 | ) | | | (36,286 | ) | | | (1,293 | ) | | | (2,041 | ) | | | (5,325 | ) | | | (62,071 | ) | Future net cash flows, after income taxes | | | 9,286 | | | | 26,765 | | | | 3,497 | | | | 3,443 | | | | 13,111 | | | | 56,102 | | Discount at 10% | | | (3,939 | ) | | | (13,882 | ) | | | (2,696 | ) | | | (1,558 | ) | | | (8,225 | ) | | | (30,300 | ) | Standardized measure of discounted future net cash flows | | | 5,347 | | | | 12,883 | | | | 801 | | | | 1,885 | | | | 4,886 | | | | 25,802 | | As of December 31, 2010 | | | | | | | | | | | | | | | | | | | | | | | | | Future cash inflows | | | 65,644 | | | | 142,085 | | | | 42,378 | | | | 14,777 | | | | 41,075 | | | | 305,959 | | Future production costs | | | (16,143 | ) | | | (29,479 | ) | | | (19,477 | ) | | | (4,110 | ) | | | (6,476 | ) | | | (75,685 | ) | Future development costs | | | (18,744 | ) | | | (25,587 | ) | | | (8,317 | ) | | | (3,788 | ) | | | (8,334 | ) | | | (64,770 | ) | Future income taxes | | | (20,571 | ) | | | (51,390 | ) | | | (3,217 | ) | | | (2,541 | ) | | | (7,281 | ) | | | (85,000 | ) | Future net cash flows, after income taxes | | | 10,186 | | | | 35,629 | | | | 11,367 | | | | 4,338 | | | | 18,984 | | | | 80,504 | | Discount at 10% | | | (5,182 | ) | | | (16,722 | ) | | | (8,667 | ) | | | (2,106 | ) | | | (11,794 | ) | | | (44,471 | ) | Standardized measure of discounted future net cash flows | | | 5,004 | | | | 18,907 | | | | 2,700 | | | | 2,232 | | | | 7,190 | | | | 36,033 | | As of December 31, 2011 | | | | | | | | | | | | | | | | | | | | | | | | | Future cash inflows | | | 85,919 | | | | 167,367 | | | | 53,578 | | | | 14,297 | | | | 67,868 | | | | 389,029 | | Future production costs | | | (18,787 | ) | | | (31,741 | ) | | | (22,713 | ) | | | (3,962 | ) | | | (12,646 | ) | | | (89,849 | ) | Future development costs | | | (21,631 | ) | | | (22,776 | ) | | | (11,548 | ) | | | (3,110 | ) | | | (11,044 | ) | | | (70,109 | ) | Future income taxes | | | (28,075 | ) | | | (71,049 | ) | | | (4,361 | ) | | | (2,794 | ) | | | (12,963 | ) | | | (119,242 | ) | Future net cash flows, after income taxes | | | 17,426 | | | | 41,801 | | | | 14,956 | | | | 4,431 | | | | 31,215 | | | | 109,829 | | Discount at 10% | | | (9,426 | ) | | | (17,789 | ) | | | (12,298 | ) | | | (2,186 | ) | | | (20,717 | ) | | | (62,416 | ) | Standardized measure of discounted future net cash flows | | | 8,000 | | | | 24,012 | | | | 2,658 | | | | 2,245 | | | | 10,498 | | | | 47,413 | | | | | | | | | Minority interests in future net cash flows as of | | | | | | | | | | | | | | | | | | | | | | | | | December 31, 2009 | | | 212 | | | | 60 | | | | — | | | | — | | | | — | | | | 272 | | December 31, 2010 | | | 273 | | | | 344 | | | | — | | | | — | | | | — | | | | 617 | | December 31, 2011 | | | — | | | | 558 | | | | — | | | | — | | | | — | | | | 558 | | | | | | | Equity affiliates | | (M€) | | Europe | | | Africa | | | Americas | | | Middle
East | | | Asia | | | Total | | As of December 31, 2009 | | | | | | | | | | | | | | | | | | | | | | | | | Future cash inflows | | | — | | | | 1,432 | | | | 16,750 | | | | 48,486 | | | | — | | | | 66,668 | | Future production costs | | | — | | | | (624 | ) | | | (6,993 | ) | | | (30,739 | ) | | | — | | | | (38,356 | ) | Future development costs | | | — | | | | (26 | ) | | | (1,924 | ) | | | (3,891 | ) | | | — | | | | (5,841 | ) | Future income taxes | | | — | | | | (245 | ) | | | (3,650 | ) | | | (1,843 | ) | | | — | | | | (5,738 | ) | Future net cash flows, after income taxes | | | — | | | | 537 | | | | 4,183 | | | | 12,013 | | | | — | | | | 16,733 | | Discount at 10% | | | — | | | | (239 | ) | | | (2,816 | ) | | | (6,383 | ) | | | — | | | | (9,438 | ) | Standardized measure of discounted future net cash flows | | | — | | | | 298 | | | | 1,367 | | | | 5,630 | | | | — | | | | 7,295 | | As of December 31, 2010 | | | | | | | | | | | | | | | | | | | | | | | | | Future cash inflows | | | — | | | | 1,814 | | | | 22,293 | | | | 59,472 | | | | — | | | | 83,579 | | Future production costs | | | — | | | | (765 | ) | | | (8,666 | ) | | | (40,085 | ) | | | — | | | | (49,516 | ) | Future development costs | | | — | | | | (26 | ) | | | (2,020 | ) | | | (3,006 | ) | | | — | | | | (5,052 | ) | Future income taxes | | | — | | | | (349 | ) | | | (5,503 | ) | | | (2,390 | ) | | | — | | | | (8,242 | ) | Future net cash flows, after income taxes | | | — | | | | 674 | | | | 6,104 | | | | 13,991 | | | | — | | | | 20,769 | | Discount at 10% | | | — | | | | (203 | ) | | | (3,946 | ) | | | (7,386 | ) | | | — | | | | (11,535 | ) | Standardized measure of discounted future net cash flows | | | — | | | | 471 | | | | 2,158 | | | | 6,605 | | | | — | | | | 9,234 | | As of December 31, 2011 | | | | | | | | | | | | | | | | | | | | | | | | | Future cash inflows | | | — | | | | 210 | | | | 29,887 | | | | 64,977 | | | | 7,116 | | | | 102,190 | | Future production costs | | | — | | | | (95 | ) | | | (17,393 | ) | | | (39,800 | ) | | | (2,683 | ) | | | (59,971 | ) | Future development costs | | | — | | | | — | | | | (1,838 | ) | | | (2,809 | ) | | | (1,297 | ) | | | (5,944 | ) | Future income taxes | | | — | | | | (29 | ) | | | (5,152 | ) | | | (3,942 | ) | | | (2,280 | ) | | | (11,403 | ) | Future net cash flows, after income taxes | | | — | | | | 86 | | | | 5,504 | | | | 18,426 | | | | 856 | | | | 24,872 | | Discount at 10% | | | — | | | | (36 | ) | | | (3,652 | ) | | | (9,757 | ) | | | (196 | ) | | | (13,641 | ) | Standardized measure of discounted future net cash flows | | | — | | | | 50 | | | | 1,852 | | | | 8,669 | | | | 660 | | | | 11,231 | |
The following is the projected standardized measure of discounted future net cash flows relating to proved oil and gas reserves:CHANGES IN THE STANDARDIZED MEASURE OF DISCOUNTED
FUTURE NET CASH FLOWS | | | | | | | | | | | | | | | | | | | | | | Consolidated subsidiaries | | | (M€) | | Europe | | | Africa | | | North America | | | Asia-
Pacific | | | Rest of World(a) | | | Total | | December 31, 2006 | | | | | | | | | | | | | | | | | | | Future cash inflows | | 59,051 | | | 108,847 | | | 5,915 | | | 16,061 | | | 59,065 | | | 248,939 | | Future production costs | | (10,057 | ) | | (19,223 | ) | | (2,443 | ) | | (2,136 | ) | | (18,706 | ) | | (52,565 | ) | Future development costs | | (9,379 | ) | | (15,929 | ) | | (968 | ) | | (3,866 | ) | | (6,121 | ) | | (36,263 | ) | Future income taxes | | (28,069 | ) | | (45,714 | ) | | (459 | ) | | (4,522 | ) | | (12,271 | ) | | (91,035 | ) | Future net cash flows, after income taxes | | 11,546 | | | 27,981 | | | 2,045 | | | 5,537 | | | 21,967 | | | 69,076 | | Discount at 10% | | (4,545 | ) | | (12,171 | ) | | (1,092 | ) | | (1,927 | ) | | (14,293 | ) | | (34,028 | ) | Standardized measure of discounted future net cash flows | | 7,001 | | | 15,810 | | | 953 | | | 3,610 | | | 7,674 | | | 35,048 | | December 31, 2007 | | | | | | | | | | | | | | | | | | | Future cash inflows | | 87,540 | | | 157,199 | | | 8,585 | | | 20,268 | | | 46,282 | | | 319,874 | | Future production costs | | (12,897 | ) | | (23,109 | ) | | (3,110 | ) | | (2,379 | ) | | (10,074 | ) | | (51,569 | ) | Future development costs | | (10,764 | ) | | (19,012 | ) | | (1,641 | ) | | (4,225 | ) | | (4,525 | ) | | (40,167 | ) | Future income taxes | | (43,851 | ) | | (75,557 | ) | | (887 | ) | | (6,200 | ) | | (9,284 | ) | | (135,779 | ) | Future net cash flows, after income taxes | | 20,028 | | | 39,521 | | | 2,947 | | | 7,464 | | | 22,399 | | | 92,359 | | Discount at 10% | | (8,070 | ) | | (17,474 | ) | | (1,511 | ) | | (2,664 | ) | | (14,176 | ) | | (43,895 | ) | Standardized measure of discounted future net cash flows | | 11,958 | | | 22,047 | | | 1,436 | | | 4,800 | | | 8,223 | | | 48,464 | | December 31, 2008 | | | | | | | | | | | | | | | | | | | Future cash inflows | | 42,749 | | | 67,761 | | | 3,487 | | | 10,444 | | | 20,824 | | | 145,265 | | Future production costs | | (8,593 | ) | | (15,372 | ) | | (1,638 | ) | | (2,003 | ) | | (7,565 | ) | | (35,171 | ) | Future development costs | | (10,423 | ) | | (21,594 | ) | | (1,157 | ) | | (3,659 | ) | | (5,277 | ) | | (42,110 | ) | Future income taxes | | (15,651 | ) | | (14,571 | ) | | 2 | | | (2,047 | ) | | (2,444 | ) | | (34,711 | ) | Future net cash flows, after income taxes | | 8,082 | | | 16,224 | | | 694 | | | 2,735 | | | 5,538 | | | 33,273 | | Discount at 10% | | (3,645 | ) | | (8,144 | ) | | (286 | ) | | (1,072 | ) | | (4,140 | ) | | (17,287 | ) | Standardized measure of discounted future net cash flows | | 4,437 | | | 8,080 | | | 408 | | | 1,663 | | | 1,398 | | | 15,986 | |
| | | | | | | | | | | | | | | | Consolidated subsidiaries | | (M€) | | 2009 | | | 2010 | | | 2011 | | Beginning of year | | | 15,986 | | | | 25,802 | | | | 36,033 | | Sales and transfers, net of production costs | | | (17,266 | ) | | | (22,297 | ) | | | (27,026 | ) | Net change in sales and transfer prices and in production costs and other expenses | | | 35,738 | | | | 30,390 | | | | 44,315 | | Extensions, discoveries and improved recovery | | | (267 | ) | | | 716 | | | | 1,680 | | Changes in estimated future development costs | | | (4,847 | ) | | | (7,245 | ) | | | (4,798 | ) | Previously estimated development costs incurred during the year | | | 7,552 | | | | 7,896 | | | | 9,519 | | Revisions of previous quantity estimates | | | 164 | | | | 5,523 | | | | 1,288 | | Accretion of discount | | | 1,599 | | | | 2,580 | | | | 3,603 | | Net change in income taxes | | | (12,455 | ) | | | (6,773 | ) | | | (16,925 | ) | Purchases of reserves in place | | | 230 | | | | 442 | | | | 885 | | Sales of reserves in place | | | (632 | ) | | | (1,001 | ) | | | (1,161 | ) | End of year | | | 25,802 | | | | 36,033 | | | | 47,413 | | | | | | | Equity affiliates | | (M€) | | 2009 | | | 2010 | | | 2011 | | Beginning of year | | | 5,301 | | | | 7,295 | | | | 9,234 | | Sales and transfers, net of production costs | | | (987 | ) | | | (1,583 | ) | | | (1,991 | ) | Net change in sales and transfer prices and in production costs and other expenses | | | 2,789 | | | | 2,366 | | | | 3,715 | | Extensions, discoveries and improved recovery | | | 407 | | | | — | | | | — | | Changes in estimated future development costs | | | (88 | ) | | | 195 | | | | (383 | ) | Previously estimated development costs incurred during the year | | | 854 | | | | 651 | | | | 635 | | Revisions of previous quantity estimates | | | (790 | ) | | | 308 | | | | (749 | ) | Accretion of discount | | | 530 | | | | 730 | | | | 923 | | Net change in income taxes | | | (721 | ) | | | (728 | ) | | | (1,341 | ) | Purchases of reserves in place | | | — | | | | — | | | | 1,812 | | Sales of reserves in place | | | — | | | | — | | | | (624 | ) | End of year | | | 7,295 | | | | 9,234 | | | | 11,231 | |
OTHER INFORMATION Net gas production, production prices and production costs | | | | | | | | | | | | | | | | | | | | | | | | | | | | Consolidated subsidiaries | | | | Europe | | | Africa | | | Americas | | | Middle
East | | | Asia | | | Total | | | 2009 | | | | | | | | | | | | | | | | | | | | | | | | | Natural gas production available for sale (Mcf/d)(a) | | | 1,643 | | | | 480 | | | | 545 | | | | 297 | | | | 1,224 | | | | 4,189 | | Production prices(b) | | | | | | | | | | | | | | | | | | | | | | | | | Oil (€/b) | | | 40.76 | | | | 40.77 | | | | 36.22 | | | | 39.94 | | | | 37.66 | | | | 40.38 | | Bitumen (€/b) | | | — | | | | — | | | | 23.17 | | | | — | | | | — | | | | 23.17 | | Natural gas (€/kcf) | | | 4.81 | | | | 1.33 | | | | 1.56 | | | | 0.72 | | | | 4.47 | | | | 3.70 | | Production costs per unit of production (€/boe)(c) | | | | | | | | | | | | | | | | | | | | | | | | | Total liquids and natural gas | | | 5.30 | | | | 4.35 | | | | 3.59 | | | | 3.86 | | | | 2.52 | | | | 4.30 | | Bitumen | | | — | | | | — | | | | 25.45 | | | | — | | | | — | | | | 25.45 | | | | | | | Equity affiliates | | | | Europe | | | Africa | | | Americas | | | Middle
East | | | Asia | | | Total | | | 2009 | | | | | | | | | | | | | | | | | | | | | | | | | Natural gas production available for sale (Mcf/d)(a) | | | — | | | | — | | | | — | | | | 268 | | | | — | | | | 268 | | Production prices(b) | | | | | | | | | | | | | | | | | | | | | | | | | Oil (€/b) | | | — | | | | 42.98 | | | | 33.14 | | | | 43.98 | | | | — | | | | 42.18 | | Bitumen (€/b) | | | — | | | | — | | | | — | | | | — | | | | — | | | | — | | Natural gas (€/kcf) | | | — | | | | — | | | | — | | | | 3.53 | | | | — | | | | 3.53 | | Production costs per unit of production (€/boe)(c) | | | | | | | | | | | | | | | | | | | | | | | | | Total liquids and natural gas | | | — | | | | 4.21 | | | | 2.24 | | | | 2.81 | | | | — | | | | 2.81 | | Bitumen | | | — | | | | — | | | | — | | | | — | | | | — | | | | — | | | | | | | Consolidated subsidiaries | | | | Europe | | | Africa | | | Americas | | | Middle
East | | | Asia | | | Total | | 2010 | | | | | | | | | | | | | | | | | | | | | | | | | Natural gas production available for sale (Mcf/d)(a) | | | 1,603 | | | | 608 | | | | 732 | | | | 375 | | | | 1,234 | | | | 4,552 | | Production prices(b) | | | | | | | | | | | | | | | | | | | | | | | | | Oil (€/b) | | | 55.70 | | | | 56.18 | | | | 45.28 | | | | 55.83 | | | | 52.33 | | | | 55.39 | | Bitumen (€/b) | | | — | | | | — | | | | 33.19 | | | | — | | | | — | | | | 33.19 | | Natural gas (€/kcf) | | | 5.17 | | | | 1.55 | | | | 1.83 | | | | 0.63 | | | | 5.67 | | | | 3.94 | | Production costs per unit of production (€/boe)(c) | | | | | | | | | | | | | | | | | | | | | | | | | Total liquids and natural gas | | | 6.23 | | | | 4.53 | | | | 3.29 | | | | 4.82 | | | | 2.93 | | | | 4.72 | | Bitumen | | | — | | | | — | | | | 17.49 | | | | — | | | | — | | | | 17.49 | | | | | | | Equity affiliates | | | | Europe | | | Africa | | | Americas | | | Middle
East | | | Asia | | | Total | | 2010 | | | | | | | | | | | | | | | | | | | | | | | | | Natural gas production available for sale (Mcf/d)(a) | | | — | | | | — | | | | — | | | | 650 | | | | — | | | | 650 | | Production prices(b) | | | | | | | | | | | | | | | | | | | | | | | | | Oil (€/b) | | | — | | | | 53.96 | | | | 43.81 | | | | 57.03 | | | | — | | | | 54.95 | | Bitumen (€/b) | | | — | | | | — | | | | — | | | | — | | | | — | | | | — | | Natural gas (€/kcf) | | | — | | | | — | | | | — | | | | 2.30 | | | | — | | | | 2.30 | | Production costs per unit of production (€/boe)(c) | | | | | | | | | | | | | | | | | | | | | | | | | Total liquids and natural gas | | | — | | | | 6.31 | | | | 2.76 | | | | 1.54 | | | | — | | | | 1.91 | | Bitumen | | | — | | | | — | | | | — | | | | — | | | | — | | | | — | |
| | | | | | | | | | | | | | | | | | | | | | | | | | | | Consolidated subsidiaries | | | | | Europe | | | Africa | | | Americas | | | Middle
East | | | Asia | | | Total | | 2011 | | | | | | | | | | | | | | | | | | | | | | | | | Natural gas production available for sale (Mcf/d)(a) | | | 1,350 | | | | 607 | | | | 839 | | | | 424 | | | | 1,162 | | | | 4,382 | | Production prices(b) | | | | | | | | | | | | | | | | | | | | | | | | | Oil (€/b) | | | 74.24 | | | | 74.72 | | | | 55.13 | | | | 73.73 | | | | 68.76 | | | | 73.34 | | Bitumen (€/b) | | | — | | | | — | | | | 31.36 | | | | — | | | | — | | | | 31.36 | | Natural gas (€/kcf) | | | 6.58 | | | | 1.81 | | | | 2.06 | | | | 0.54 | | | | 7.45 | | | | 4.72 | | Production costs per unit of production (€/boe)(c) | | | | | | | | | | | | | | | | | | | | | | | | | Total liquids and natural gas | | | 6.86 | | | | 5.14 | | | | 3.41 | | | | 5.36 | | | | 3.40 | | | | 5.20 | | Bitumen | | | — | | | | — | | | | 20.70 | | | | — | | | | — | | | | 20.70 | | | | | | | Equity affiliates | | | | | Europe | | | Africa | | | Americas | | | Middle
East | | | Asia | | | Total | | 2011 | | | | | | | | | | | | | | | | | | | | | | | | | Natural gas production available for sale (Mcf/d)(a) | | | — | | | | — | | | | — | | | | 891 | | | | 457 | | | | 1,348 | | Production prices(b) | | | | | | | | | | | | | | | | | | | | | | | | | Oil (€/b) | | | — | | | | 66.21 | | | | 61.15 | | | | 77.07 | | | | 30.75 | | | | 73.61 | | Bitumen (€/b) | | | — | | | | — | | | | — | | | | — | | | | — | | | | — | | Natural gas (€/kcf) | | | — | | | | — | | | | — | | | | 1.29 | | | | 0.95 | | | | 1.23 | | Production costs per unit of production (€/boe)(c) | | | | | | | | | | | | | | | | | | | | | | | | | Total liquids and natural gas | | | — | | | | 1.99 | | | | 2.75 | | | | 1.66 | | | | 0.79 | | | | 1.61 | | Bitumen | | | — | | | | — | | | | — | | | | — | | | | — | | | | — | |
| (a) | IncludingThe reported volumes are different from those shown in the Middle East.reserves table due to gas consumed in operations. |
Minority interests in future net cash flows as of:
| (b) | The volumes used for calculation of the average sales prices are the ones sold from the Group’s own production. |
| (c) | The volumes of liquids used for this computation are shown in the proved reserves tables of this report. The reported volumes for natural gas are different from those shown in the reserves table due to gas consumed in operations. |
| | | | | | | | | | | | | | December 31, 2006 | | 255 | | 418 | | | — | | — | | — | | 673 | December 31, 2007 | | 407 | | 654 | | | — | | — | | — | | 1,061 | December 31, 2008 | | 217 | | (50 | ) | | — | | — | | — | | 167 |
Group’s share of equity affiliates’ future net cash flows as of:S-19
| | | | | | | | | | | | | December 31, 2006 | | — | | 549 | | — | | — | | 3,545 | | 4,094 | December 31, 2007 | | — | | 526 | | — | | — | | 9,552 | | 10,078 | December 31, 2008 | | — | | 418 | | — | | — | | 4,883 | | 5,301 |
Changes in the standardized measure of discounted future net cash flows
The following table indicates the changes in the standardized measure of discounted future net cash flows for the periods indicated.
| | | | | | | | | | | | | For the year ended
December 31, | | | (M€) | | 2008 | | | 2007 | | | 2006 | | Consolidated | | | | | | | | | | Beginning of year | | 48,464 | | | 35,048 | | | 49,394 | | Sales and transfers, net of production costs | | (26,109 | ) | | (19,095 | ) | | (21,335 | ) | Net change in sales and transfer prices, net of production costs | | (81,358 | ) | | 56,678 | | | (11,481 | ) | Extensions, discoveries and improved recovery, net of future production and development costs | | 556 | | | 2,895 | | | 1,534 | | Changes in estimated future development costs | | (2,227 | ) | | (6,491 | ) | | (7,666 | ) | Previously estimated development costs incurred during the year | | 6,960 | | | 6,581 | | | 5,150 | | Revisions of previous quantity estimates | | 2,693 | | | (6,521 | ) | | (1,382 | ) | Accretion of discount | | 4,846 | | | 3,505 | | | 4,939 | | Net change in income taxes | | 63,611 | | | (22,585 | ) | | 16,268 | | Purchases of reserves in place | | 50 | | | — | | | 574 | | Sales of reserves in place | | (1,500 | ) | | (1,551 | ) | | (947 | ) | End of year | | 15,986 | | | 48,464 | | | 35,048 | |
S-9
|
|
|
|
|
|
|
|
|
|