| • | following the open season launched in 2009, TIGF intends to develop two new projects, the Artère du Béarn and phase B of the Artère de Guyenne gas pipelines.• | | The increase by 3.5 Bcf (100 Mm3) of the storage capacity at LussagnetArtère de Guyenne gas pipelines, which are scheduled to be commissioned in April,2013; and
|
| | | • | another open season launched in compliance with the authorization provided by the decree published on April 9, 2008. |
• | | The acquisition of a 26.2% interest (through its interest in Géosud) in Géométhane, an Economic Interest Grouping that owns natural gas storage in a salt cavern with a capacity of 10.5 Bcf (0.3 Bm3), located in Manosque,2010, which involved four French and Spanish transport operators including TIGF, is expected to result in the southeastcompletion of France. Athe Euskadour project to increase the storage capacity by 7 Bcf (0.2 Bm3) is under study for a commissioning scheduled in 2016.
2015. |
In addition, following the European Union adopted, on July 13, 2009,enactment of the Third Energy Package by the European Union in July 2009, which includes two directives and three regulations related to the natural gas and electricity markets. TOTAL will assess the potential impact on its gas and electricity transport, storageprovides for splitting network operations from production and supply operations, as soon asTOTAL and TIGF are reviewing adaptations to be implemented before the legislation is transposed into French law.Regarding itsmarketing business, TOTAL is mainly developing on three major European markets.
InFrance, TOTAL operates through its marketing subsidiary Total Énergie Gaz (TEGAZ) which sold
1. | GIE data (Gaz Infrastructures Europe), June 2009. |
208 Bcf of natural gas (5.9 Bm3)regulation becomes effective in 2009, compared to 229 Bcf (6.5 Bm3)France starting in 2008 and 245 Bcf (7 Bm3) in 2007. Despite a sharp decline in demand due to the economic crisis, TEGAZ posted a strong increase in sales to industrial and commercial customers, which are the subsidiary’s main market segments.
March 2012. In Spain, Cepsa Gas Comercializadora markets gas in the industrial and commercial sectors. This company is held by TOTAL (35%), CEPSA (35%) and the Algerian national oil company, Sonatrach (30%). In 2009, Cepsa Gas Comercializadora sold approximately 70 Bcf (2 Bm3) of natural gas to industrial and commercial customers, similar to 2008, compared to 59 Bcf (1.7 Bm3) in 2007.In theUnited Kingdom, TOTAL’s subsidiary Total Gas & Power Ltd markets gas and power to the industrial and commercial markets. The subsidiary is also active in gas, electricity and LNG trading worldwide. In 2009, 130 Bcf (3.7 Bm3) of natural gas was sold to industrial and commercial customers, compared to 134 Bcf (3.8 Bm3) in 2008 and 124 Bcf (3.5 Bm3) in 2007. Electricity sales amounted to 4.1 TWh in 2009, compared to 4.6 TWh in 2008 and 3.6 TWh in 2007. In 2007, TOTAL disposed of its 10% interest in Interconnector UK Ltd, a gas pipeline connecting Bacton in the United Kingdom to Zeebrugge in Belgium. This disposal did not affect TOTAL’s rights to transport gas through the pipeline.
The Americas
In theUnited States, the Group’s subsidiary Total Gas & Power North America Inc. marketed 1,586 Bcf (45 Bm3) of natural gas in 2009, compared to approximately 1,652 Bcf (46.9 Bm3) in 2008 and 1,606 Bcf (45.5 Bm3) in 2007, supplied by its own production and external sources.
InMexico, Gas del Litoral, a company in which TOTAL holds a 25% interest, sold approximately 173 Bcf (4.9 Bm3) of natural gas in 2009, its third full year of activity, similar to 2008, compared to 95 Bcf (2.7 Bm3) in 2007.
InSouth America, TOTAL owns interests in several natural gas transport companies in Argentina, Chile and Brazil, including the following:
a 15.4% interest in Transportadora de Gas del Norte (TGN), which operates a gas transport network covering the northern half of Argentina;
a 56.5% interest in the companies that own the GasAndes pipeline, which connects the TGN network to the Santiago del Chile region; and
a 9.7% interest in Transportadora Gasoducto Bolivia-Brasil (TBG), whose gas pipeline supplies southern Brazil from the Bolivian border.
Brazil. These assets represent a total integrated network of approximately 9,500 km of pipelines serving the Argentine, Chilean and Brazilian markets from gas-producing basins in Bolivia and Argentina, where the Group has natural gas reserves. The actions taken by In Argentina, in the Argentine government afterabsence of an increase in the 2001 economic crisistariff granted to utilities and the subsequent energy crisis, marked in 2007 by a severe gas shortage during the southern winter, put TOTAL’s Argentine subsidiaries in difficult financial and operational situations, even after taking into account the restructuring of TGN’s debt, which was completed in 2006. The sale of the Group’s Argentine power generation assets was completed in 2007 and procedures to protect TOTAL’s investments, initiated in 2002 with the International Center for Settlement of Investment Disputes (ISCID), are ongoing.
During 2008 and 2009, gas production in Argentina decreased substantially, reducing the export of gas to Chile and prompting commercial discussions between GasAndes and its shippers about transportation contracts and their commitments.
Due to the deterioration of TGN’s financial situation as a result of the freeze of domestic tariffs andgiven the restrictions on gas exports, TGN applied forthe Group continued to manage its assets in the most appropriate way in a suspensiondifficult operating and financial environment.
Storage of payments in December 2008, and launched a new process to restructure its debt. These decisions led the Argentinean authorities to set up a formal monitoring of TGN’s management.Asia
TOTAL markets natural gas transported through pipelines in Indonesia, Thailand and Myanmar, and,LPG
InFrance, the Group’s storage operations located in the formsouthwest are grouped under TIGF. This subsidiary operates two storage units under a negotiated scheme with a usable capacity of LNG,92 Bcf (2.6 Bm3). Highlights of 2010 included an increase in Lussagnet’s storage capacity by 3.5 Bcf (0.1 Bm3). TOTAL, through its interest in Géosud, also participates in Géométhane, an Economic Interest Grouping that owns natural gas storage in a salt cavern with a capacity of 10.5 Bcf (0.3 Bm3), located in Manosque, in southeastern France. In March 2010, the Group’s interest in Géométhane increased to Japan, South Korea, China, Taiwan and India. The Group35.5% from 26.2% following the buyback of a partner’s stake. A project is also developing its re-gasified LNG marketing business in new emerging markets.under study to increase the storage capacity by 7 Bcf (0.2 Bm3). In India, Hazira LNG Private Limited, a company in which TOTAL holds a 26%50% interest sold approximately 74 Bcf (2.1 Bm3)in South Asian LPG Limited (SALPG), a company that operates an underground import and storage LPG terminal located on the east coast of natural gasthe country. This cavern, the first of its kind in India, has a storage capacity of 60 kt. In 2010, it received 779 kt of LPG, compared to 606 kt in 2009 its fourth full yearand 535 kt in operation, compared to 87 Bcf (2.5 Bm3) in 2008 and 76 Bcf (2.2 Bm3) in 2007.2008. Liquified Natural GasIn the LNG chain, the Gas & Power division is responsible for operations downstream from liquefaction plants(1), including purchase, shipping, re-gasification storage and marketing.
Through its subsidiaries Total Gas & Power Ltd and Total Gas & Power North America Inc.,
TOTAL has entered into agreements to obtain long-term access to
1. | The Exploration & Production division is in charge of the Group’s natural gas liquefaction operations. |
LNG re-gasification capacity on the three continents that are the largest consumers of natural gas: North America (the United States and Mexico), Europe (France and the United Kingdom), and Asia (India). This diversified market presence allows the Group to access new liquefaction projects by becoming a long-term buyer of a portion of the LNG produced at the plants, thereby consolidatingstrengthening its LNG supply portfolio. Europe
InFrance, TOTAL acquired in June 2006 anTOTAL’s interest in Société du Terminal Méthanier de Fos Cavaou (STMFC). decreased to 28.03% from 28.8% in 2010 without impacting the re-gasification volumes reserved by TOTAL. This terminal is expected to havehas a re-gasification capacity of 291 Bcf/y (8.25 Bm3/y), of whichnatural gas, 79 Bcf/y (2.25 Bm3/y) of which has been reserved by TOTAL. The Group’sCommercial operations started in April 2010 and prefectorial authorities authorized the terminal to operate at full capacity in August 2010. (1) Held by TOTAL (35%), CEPSA (35%) and Sonatrach (30%). In February 2011, TOTAL signed an agreement to dispose of its 48.83% interest in STMFC’s share capital decreased to 28.8% from 30.3% in late 2009 pursuant to the provisions of the shareholders’ agreement, without impacting the re-gasification volumes reserved by TOTAL. In October 2009, the terminal was authorized by the prefectorial authorities to conduct commissioning tests and operate at reduced capacity. Commercial start-upCEPSA. The transaction is expected in the second quarter of 2010.conditioned on obtaining all requisite approvals.
36
In addition,
TOTAL and EDF signed in March 2010 a letter of intent whereby TOTAL will reserve re-gasification capacity in the planned Dunkirk LNG terminal being developed by Dunkerque LNG, a wholly-owned EDF subsidiary, and will also acquire an interest in thisthe company. In the United Kingdom, TOTAL acquired in December 2006holds an 8.35% interest in the South Hook LNG re-gasification terminal project in connection with its entrythe interest held in the Qatargas 2 project. Phase 1 (371 Bcf/y representing 10.5 Bm3/y) of theThe terminal was commissioned in October 2009 for phase 1 (371 Bcf/y or 10.5 Bm3/y) and Phasein April 2010 for phase 2, expected to come onstream in the first half of 2010, is expected to increase theincreasing its overall capacity of the terminal to 742 Bcf/y (21 Bm3/y).In NorwayCroatia, as part of the Snøhvit project, in which TOTAL holds an 18.4% interest and where the first deliveries started in October 2007, the Group signed in November 2004 a purchase agreement for 35 Bcf/y (1 Bm3/y) of natural gas primarily intended for North America and Europe. To transport this LNG, TOTAL also charters the Arctic Lady, a 145,000 m3 LNG tanker that was delivered in April 2006.InCroatia, TOTAL owns an interest in Adria LNG, a company in charge of studying the construction of an LNG re-gasification terminal on Krk island, on the northern Adriatic coast. In December 2009, TOTAL’s interest increased from 25.58% to 27.36% pursuant to the withdrawal of a partner from the project. This terminal is expected to have an initial re-gasification
capacity of 353 Bcf/y (10 Bm3/y)
InMexico, which could be subsequently increased to 494 Bcf/y (14 Bm3/y).In addition, TOTAL holds a 30% interest in Gaztransport & Technigaz (GTT), which focuses mainly on the design and engineering of membrane cryogenic tanks for LNG tankers. At year-end 2009, 225 active LNG tankers were equipped with membrane tanks built under GTT licenses out of a world tonnage estimated at 344 LNG tankers.(1)
North America
InMexico, the Altamira re-gasification terminal, in which TOTAL holds a 25% interest has been operating sincein the summer ofAltamira re-gasification terminal that was commissioned in 2006. This terminal, located on the east coast of Mexico,the country, has a re-gasification capacity of 236 Bcf/y (6.7 Bm3/y). This capacity that has been entirely reserved by Gas del Litoral in which TOTAL has a 25% interest. The terminal received forty cargos in 2009, compared to forty-two in 2008 and thirty-three in 2007. In November 2009, Altamira received its first Q-Flex vessel from Qatar.
In the United States, the Sabine Pass terminal in Louisiana was inaugurated in April 2008. TOTAL has reserved re-gasification capacity of approximately353 Bcf/y (approximately 10 Bm3/y (1 Bcf/d)y) at thisthe Sabine Pass terminal (Louisiana) for a renewable 20-year period starting in April 2009, concurrent with the delivery of the Group’s first LNG cargo. As part of this agreement, TOTAL plans to supply the Sabine PassThe terminal though its LNG purchase contracts associated with its various production projects, notably in the Middle East, Norway and Western Africa.Asia
InIndia, the Hazira re-gasification terminal (TOTAL 26%), located on the west coast in the Gujarat state, was inaugurated in April 2005 with an initial2008.
InIndia, TOTAL holds a 26% interest in the Hazira terminal that has natural gas re-gasification capacity of approximately 120 Bcf/y (3.4 Bm3/y). Its capacity reached 177 Bcf/y (5 Bm3/y) after de-bottlenecking operations conducted. The terminal, located on the west coast of India in 2008. Hazirathe Gujarat state, is a merchant terminal with operations that includecover both LNG re-gasification and natural gas marketing. TOTAL has agreed to provide up to 26% of the LNG for the Hazira terminal. Due to market conditions in 2009,2010, Hazira was operated on the basis of short-term contracts, both for the sale of gas on the Indian market and the purchase of LNG from international markets. Twenty-seven cargos were delivered in 2009, compared to thirty in 2008 and twenty-eight in 2007. InChina, a context of increasing global demand for electricity, TOTAL signed in December 2008 an LNG sale agreement with CNOOC (China National Offshore Oil Company). As part of this agreement, TOTAL is expected to supply CNOOC with up to 1 Mt/y of LNG starting in 2010. The gas supplied will come from the Group’s global LNG resources. 1. | Gaztransport & Technigaz data. |
Middle East
InQatar, TOTAL signed purchase agreements in July 2006 for up to 5.2 Mt/y of LNG from the second train of Qatargas 2 over a 25-year period. This LNG is expected to be marketed principally in France, the United Kingdom and North America. The Group’s acquisition of a 16.7% interesthas developed expertise in the second train of Qatargas 2 was concluded in December 2006. LNG production from this train started in September 2009.
InYemen, TOTAL signed in July 2005 an agreement with Yemen LNG Ltd (TOTAL, 39.62%) to purchase 2 Mt/y of LNG over a 20-year period, beginning in 2009, to be delivered to the United States. LNG production from the first train of Yemen LNG started in October 2009. Construction of the second train is nearing completion for a start-up by the summer of 2010.
Africa
InAngola, TOTAL is involved in the construction of the Angola LNG plant (13.6%), comprised of a 5.2 Mt/y train, which is expected to start up in 2012. As part of this project, TOTAL signed a re-gasified natural gas purchase agreement in December 2007 for 13.6% of the quantities to be delivered to the Gulf LNG Clean Energy terminal in Mississippi in the United States.
InNigeria, as part of the expansions of the Nigeria LNG (NLNG) plant, in which the Group holds a 15% interest, TOTAL signed an LNG purchase agreement for an initial 0.23 Mt/y over a 20-year period, to which an additional 0.9 Mt/y was added when the sixth train came onstream.
As part of the project to build an additional LNG train (train 7) with a capacity of approximately 8.5 Mt/y, TOTAL signed a purchase agreement in February 2007 for 1.375 Mt/y of LNG over a 20-year period. This agreement is subject to NLNG’s final investment decision for this new train.
TOTAL also acquired a 17% interest in the Brass LNG project in July 2006. This liquefaction project calls for the construction of two liquefaction trains, each with a capacity of 5 Mt/y. In conjunction with this acquisition, TOTAL signed a preliminary agreement with Brass LNG Ltd setting forth the principal terms of an agreement to purchase approximately one-sixth of the plant’s capacity over a 20-year period. This LNG would be delivered primarily to North America and Western Europe. The purchase agreement is subject to final investment decision for the Brass LNG project.
Trading
TOTAL, through its subsidiary Total Gas & Power Ltd, has conducted trading activities primarily for spot LNG between 2001 and 2006. In 2007, this subsidiary began
receiving cargos under its long-term supply contracts with Nigeria and Norway. Since 2009, the new purchase agreements for LNG from Qatargas 2 and Yemen LNG have allowed a substantial development of the Group’s operations in LNG marketing. This mix of spot and long term LNG purchases allows TOTAL to supply its main customers around the world with gas, while retaining a certain degree of flexibility to react to market opportunities or unexpected fluctuations in supply and demand.
In 2009, Total Gas & Power Ltd purchased twenty-three contractual cargos and twelve spot cargos from Norway, Nigeria, Equatorial Guinea, Indonesia, Trinidad & Tobago, Qatar and Yemen.
Liquified Petroleum Gas
In 2009, TOTAL traded and sold nearly 4.4 Mt of LPG (butane and propane) worldwide (compared to 5.2 Mt in 2008 and 2007), including 0.9 Mt in the Middle East and Asia, approximately 0.6 Mt in Europe on small coastal trading vessels and approximately 2.8 Mt on large vessels in the Atlantic and Mediterranean regions. Approximately 40% of these quantities come from fields or refineries operated by the Group. LPG trading involved the use of four time-charters and approximately sixty spot charters.
Since January 2008, SALPG (South Asian LPG Limited, a company in which TOTAL holds a 50% interest, in partnership with Hindustan Petroleum Company Ltd) has operated the underground import and storage LPG terminal located in Visakhapatnam, on the east coast of India in the state of Andhra Pradesh. This terminal, the first of its kind in India, has a storage capacity of 60 kt. In 2009, the cavern received 606 kt of LPG, compared to 535 kt in 2008.
Electricity and Cogeneration
As a refiner and petrochemical producer, TOTAL has interests in several cogeneration facilities. Cogeneration is a process whereby the steam produced to turn turbines to generate electricity is then captured and used for industrial purposes. TOTAL also participates in another type of cogeneration, which combines power generation with water desalinationsector, especially through cogeneration and gas-fired electricity generation, as part of its strategy of pursuing opportunities throughout the gas value chain. As part of its diversification strategy for new energies, thecombined cycle power plant projects.
The Group is also involved in power generation projects to generate electricity from solar orrenewable sources and has a long-term goal of becoming a nuclear sources.Inoperator.
Electricity from conventional energy sources InAbu Dhabi, the Taweelah A1 cogeneration plant in operation since May 2003, combines powerelectricity generation and water desalination. It is owned and operated by Gulf Total Tractebel Power Cy, in which TOTAL has a 20% interest. The Taweelah A1 power plant, in operation since 2003, currently has a net power generation capacity of 1,600 MW (following the start-up of the 250 MW expansion in July 2009) and a water desalination capacity of 385,000 m3 per day. In addition, TOTAL, in partnership with the Spanish company Abengoa Solar, participated in a bidding process launched by Abu The plant’s production is sold to ADWEC (Abu Dhabi Future Energy Company (ADFEC) in early 2008Water and Electricity Company) as part of the MASDAR initiative to support new energies. This call for tenders concerns the construction of a 110 MW concentrated solar power plant.
TOTAL, together with GDF Suez, EDF and Areva, acknowledged ENEC’s (Emirates Nuclear Energy Corporation) decision, announced in December 2009, to deny the bid they made as part of the call for tenders launched for the supply of nuclear power plants. The Group pursues its objective to eventually become a recognized nuclear operator.
long-term agreement. In FranceNigeria, TOTAL has an 8.33% interest in the project to build and operate the second French EPR in Penly, in the northwest of the country, in partnership with GDF Suez and EDF.InThailand, TOTAL owns 28% of Eastern Power and Electric Company Ltd (EPEC), which has operated the combined-cycle gas-fired power plant of Bang Bo, with a capacity of 350 MW, since March 2003.
InNigeria, TOTAL and its partner, the state-owned NNPC (Nigerian National Petroleum Corporation), own interests in two projects to build gas-fired power plantsplant projects that are part of the government’s objectives to develop power generation and increase the share of natural gas production for domestic use:
| | | • | The Afam VI project, part of the SPDC (Shell Petroleum Development Company) joint venture in which TOTAL holds a 10% interest, concerns the development of a 630 MW combined-cycle power plant. Commercial operations started in December 2010. | | | • | The development of a new 400 MW combined-cycle power plant near the city of Obite (Niger Delta) in connection with the OML 58 gas project, part of the joint venture between NNPC and TOTAL (40%, operator). A final investment decision is expected in the first half of 2011 and commissioning is scheduled in the first half of 2013 in open cycle and in early 2014 in closed cycle. The power plant will be connected to the existing power grid through a new 108 km high-voltage transmission line. |
InThailand, TOTAL owns 28% of EPEC (Eastern Power and Electric Company Ltd), which operates the combined-cycle gas power plant of Bang Bo, with a capacity of 350 MW, in operation since 2003. The plant’s production is sold to EGAT (Electricity Generating Authority of Thailand) as part of a long-term agreement. Electricity from nuclear energy sources InFrance, TOTAL partners with EDF and other players through its 8.33% interest in the second French EPR project in Penly, in the northwest of the country, for which studies are underway. The Group continues to review other opportunities in the countries where it operates and favors partnerships with experienced, recognized nuclear operators, and is closely monitoring the impact that the serious situation in Japan may have on the development of certain nuclear projects worldwide.
37
Electricity from renewable energy sources In concentrated solar power, TOTAL (20%), in partnership with Spanish Abengoa (20%), won the call for tenders for the construction and operation for twenty years of a 109 MW concentrated solar power plant in Abu Dhabi. As part of this project, TOTAL is partnering with MASDAR through the Abu Dhabi Future Energy Company (ADFEC), which owns a 60% interest in the joint venture created for the project. Construction work started in July 2010 andstart-up is expected in the summer of 2012. The production will be sold to Abu Dhabi Water and Electricity Company (ADWEC). In wind power, TOTAL owns a 12 MW wind farm in Mardyck (near Dunkirk, France), which was commissioned in 2003. With respect to marine energy, TOTAL holds a 10%16% interest which concernsin Scotrenewables Marine Power, located in the developmentOrkney Islands in Scotland.Start-up and tests of a 630 MW combined-cycle power plant with a start-up of commercial operations scheduled for the second half of 2010. The development of a new 400 MW combined-cycle power plant near the city of Obite (Niger Delta)250 kW prototype are expected in connection with the OML 58 gas project, part of the joint venture between NNPC and TOTAL (40%, operator). Commissioning is scheduled in early 2013. The combined-cycle power plant will be connected to the existing power grid through a 108 km high-voltage transmission line.
2011.Renewable EnergySolar photovoltaicAs part of its strategy to develop energy resources to complement oil and gas, the Gas & Power divisionTOTAL continued in 20092010 to strengthen its positions in renewable energies, with a particular focus on solar-photovoltaic solar photovoltaic power, where the Group has been present since 1983.
Solar-photovoltaic power
In the photovoltaic sector based on crystalline silicon technology, TOTAL is involved in the development of the photovoltaic cells production business as well as in thedeveloping upstream operations through industrial production and downstream marketing of solar modules and systems.activities. The Group is pursuing R&D in this field through several partnerships,partnerships. Regarding channels other than crystalline silicon, TOTAL is pursuingbroadening its business portfolio through industrial and R&D programpartnerships, in particular for this technologyorganic and hasthin film technologies. The Group is also committed to developingresearch programs for solar energy storage. Production of solar-grade polysilicon In June 2010, TOTAL announced that it acquired a 25.4% interest in theU.S. start-up AE Polysilicon Corporation (AEP), which has developed a new innovativeprocess that operates continuously to produce cost-competitive solar-grade granular polysilicon. The technology developed by AEP is currently being industrialized. This production unit, the commissioning of which started in 2010, is expected to eventually have a nominal capacity equivalent to 1,800 t/y of solar-grade polysilicon. Production of photovoltaic solar technologies. Furthermore, cells TOTAL conducts projects to display solar application solutions at some Group sites, both for educational purposesholds a 50% interest in France and as part of decentralized rural electrification projects in other countries.TOTAL isPhotovoltech, a shareholder inPhotovoltech, aBelgian company specialized in manufacturing high-efficiencymulticrystalline photovoltaic cells. The Group now holds 50% of Photovoltech’s share capital, alongside GDF Suez, pursuant to the buyout in September 2009 by both companies of the 4.4% interest held by IMEC (Interuniversity MicroElectronics Centre). In 2009,2010, Photovoltech pursued its project to increaseincreased the overall production capacity of its Tirlemont (Tienen) plant (Tienen, Belgium) from 80 Mwp/y in 2009Belgium to 155 MWp/MWc/y following the installation of a third production line. Photovoltech’s sales in late 2010. In a challenging market and given the sharp decrease2010 were approximately €104 million in the price2010, an increase of cells, Photovoltech’s 2009 sales were€80 million,about 30% compared to€106 million in 2008 and€73 million in 2007.
TOTAL also plans to build an industrial photovoltaic plant in the Carling region in eastern France in partnership with GDF Suez.
TOTAL holds a 50% interest inTenesol, in partnership with EDF. Tenesol, whose headquarters are located in Lyon (France), designs, manufactures, markets and operates solar-photovoltaic power systems. Its principal markets are for network connections in France, in the French Overseas Territories and in Europe. Tenesol is also active in certain professional applications (telecommunications, oil & gas sites, etc.). Tenesol owns two solar panel manufacturing plants: Tenesol Manufacturing in South Africa, with production capacity of 60 MWp/y; and Tenesol Technologies in the Toulouse region of France, with production capacity of 50 MWp/y. 2009.
In 2009, despite strong pressure on the price of modules, Tenesol’s consolidated sales increased by nearly 30% to€249 million (compared to nearly€193 million in 2008 and€133 million in 2007), representing a marketed production of 85 MWp.Regarding R&D, TOTAL GDF Suez and Photovoltech confirmed their cooperationis continuing its partnership with the IMEC by signing an agreement in September 2009 as part(Interuniversity MicroElectronics Center), based at the University of the IIAP (IMEC Industrial Affiliation Program)Leuven (Belgium), a multi-partner program
on crystalline silicon solar cells. The objective of the IIAP is to sharply reduce the use of silicon while increasing the efficiency of cells in order to substantially lower costs of this technology.
Production of solar panels and marketing of photovoltaic solar systems TOTAL holds a 50% interest in Tenesol, a French company that designs, manufactures, markets, installs and operates solar photovoltaic systems. Tenesol owns a solar panel manufacturing plant in South Africa, the cost forannual production capacity of which increased to 85 MWp/y from 60 MWp/y in 2010, and another in France, the annual production capacity of which also increased to 85 MWp/y from 50 MWp/y. In 2010, Tenesol’s consolidated sales were approximately €304 million, an increase of about 22% compared to 2009. In November 2010, TOTAL announced the construction of a solar energy.panel production and assembly plant in French northeastern region of Moselle, which is expected to eventually have an overall capacity of 50 MWp/y.Start-up of construction work is expected in the first half of 2011 with a commissioning at year-end. The Group also conducts projects to display solar application solutions as part of decentralized rural electrification projects in a number of countries, notably in South Africa. New projects are under study in Africa and Asia. New solar technologies TOTAL has committed to developing innovative technologies to improve its portfolio of solar projects. The Group has major R&D programs through partnerships with major laboratories and international research institutes in France and abroad (including the United States, Switzerland, Belgium and Germany). In September 2009,solar organic technologies, the Group alsoacquired a stake in theU.S. start-up Konarka in 2008 and owns approximately 25%. Since 2009, Konarka has carried out research projects in cooperation with TOTAL to develop solar film on a large scale. Regarding thin-film technologies and silicon-based nano-materials, the Group partnered with LPICM (Laboratoire de Physique des Interfaces et desCouches Minces), a research unit comprised of the French National Center for Scientific Research (CNRS) and France’s Ecole Polytechnique engineering school in 2009 to set up a joint research team — named Nano PV — in the Saclay area near Paris focusing on thin-film technologies and silicon-based nano-materials.in France. TOTAL committed€8 million for the first 4-year phase.also
38
In December 2008, TOTAL acquired an interest in
entered into a U.S. start-up company,Konarka, which specializes in the development of organic solar technologies. In 2009, Konarka implemented new research projects in cooperationpartnership with the Gas & Power division and other Group Chemicals subsidiariesToulouse-basedLaboratoire d’analyse et d’architecture des systèmes (LAAS) to develop associated electrical systems. Regarding solar film on a large scale. The Group is confident in the potential of this promising technology and decided to increase its interest in Konarka to nearly 25% of the share capital in early 2010.Total Énergie Solaire, the subsidiary created in July 2008 as part of the Group’s contribution to the “Grenelle de l’environnement”, a program launched by the French government, started operatingenergy storage, TOTAL entered in 2009 with the installation of solar panels at two Group’s sites in Pau and Lacq (France). A total of five educational projects are expected to be completed in late 2010 to display different photovoltaic applications at the Group’s sites, with an overall installed capacity of between 2 MWp and 3 MWp and an investment of€15 million.
Furthermore, TOTAL conducts decentralized rural electrification operations by responding to calls for tenders from authorities in several countries, notably in South Africa where KES (Kwazulu Energy Services Company), in which TOTAL holds a 35% interest, intends to equip 30,000 isolated homes. New projects are under study related to Africa, Asia and the Middle East.
In addition,Temasol, a wholly-owned subsidiary of Tenesol since the transfer in 2008 of the respective shares of Total Maroc and EDF EDEV, is involved in decentralized rural electrification projects in Morocco. Since its creation in 2001, approximately 25,500 households have been equipped and are now operated by Temasol.
Solar power storage
In November 2009, TOTAL announced the signature ofinto a research agreement with the MassachussettsMIT (Massachussetts Institute of Technology (MIT)Technology) in the United States to develop a new stationary battery technology.
Conversion of biomass TOTAL is exploring a number of avenues for developing biomass depending on the resource used (type, location, harvesting, transportation, etc.), the type of molecules and markets targeted (fuels, lubricants, petrochemicals, specialty chemicals, etc.) and the conversion processes. The Group focuses on biological and thermochemical biomass conversion processes. Biotechnologies In June 2010, TOTAL entered into a strategic partnership with Amyris Inc., aU.S. start-up specializing in biotechnologies. The Group acquired an interest in Amyris’ share capital (approximately 22% at year-end 2010) and signed a framework agreement that includes research, development, production and marketing partnerships as well as the creation of an R&D team. Amyris owns a cutting-edge industrial synthetic biological platform to create and optimize micro-organisms (yeasts, algae, bacteria) that can convert sugar into fuels and chemicals. Amyris owns research laboratories and a pilot unit in California as well as a pilot plant and a demonstration facility in Brazil. Today, the project is in the industrialization phase and production is expected tostart-up in 2012. In April 2010, the Group announced that it had acquired an interest in Coskata, a company based in Chicago that develops a technology allowing biological conversion of synthetic gas into alcohols for fuels and petrochemical usages. Coskata deployed this technology on a large scale on a demonstration unit that produces bioethanol and continues its efforts towards commercialization. In addition, the Group continues to develop a network of R&D collaborations in the field of technologies that are complementary with Amyris’ platform: deconstruction of ligno-cellulose, new biosynthesis, processes and bio-engineering for microalgae and other phototrophic organisms. DME InJapan, TOTAL is involved with eight Japanese companies in a program intended to heighten consumer awareness of DME (Di-Methyl Ether), a new generation fuel. The 80 kt/y production plant (TOTAL, 10%), located in Niigata, started up in 2009. InSweden, TOTAL is involved in the “bio-DME” European project, which is intended to test the whole DME chain, from its production using black liquor, a paper pulp residue, to its use by a fleet of trucks in four Swedish cities. Productionstart-up at the pilot plant located in Pitea is expected in the first half of 2011. Carbon capture and storage TOTAL is involved in a program to develop new stationary batteries that are designedcarbon capture and storage technologies to enablereduce the storage of solar power. This $4 million agreement over five years is partenvironmental footprint of the MIT Energy Initiative, whichGroup’s industrial projects based on fossil energy.
In partnership with the FrenchIFP Énergies Nouvelles(French Oil and New Energies Institute), TOTAL joined asis involved in an R&D program related to chemical looping combustion, a membernew process to burn solid and gas feedstock that includes carbon capture at a very low energy cost. In 2010, this partnership resulted in November 2008.Wind power
TOTAL operates a 12 MW wind farm in Mardyck (near its Flanders refinery, located in Dunkirk, France).
Marine energy
In marine energy, TOTAL acquired a 10% interest in a pilot project located offshore Santona, on the northern coast of Spain, in June 2005. The construction of a first buoy, with a capacity of 40 kW, was completed anddemonstration pilot at the buoy was launchedSolaize site (France). A large-scale pilot is expected to be commissioned in September 2008. This project2013.
The Group is intended to assess the technical and economic potential of this technology.With respect to tidal current energy, TOTAL held as of the end of 2007 a 24.9% interest in Scotrenewables Marine Power, locatedalso involved in the Orkney IslandsEU-co-funded Carbolab project that intends to validate the carbon storage technology in Scotland. Agreements bringing new partners into the company’s share capital were signed in January 2008. As a result, the Group’s participation was diluted to 16%. Scotrenewables Marine Power is developing tidal current energy converter technology. A 1/5 scale model was successfully tested offshore in 2009. Construction of a full-scale prototype is scheduled for 2010.
coal seams. Coal productionFor nearly thirty years,
TOTAL has exported steam coal for nearly thirty years from South Africa primarily to Europe and Asia. The Group also trades steam coal through its subsidiaries Total Gas & Power Ltd and Total Energy Resources (Pacific Basin). In addition, TOTAL markets coal to French customers through its subsidiary CDF Énergie.With the start-up of production on the Tumelo mine in January 2009, the subsidiary Total Coal South Africa (TCSA) owns and operates four mines in South Africa. A fifth mine is under developmentconstruction in Dorstfontein, with start-up expected at year-end 2011, and development of a sixth mine is underway in Forzando withstart-up expected in late 2011.2013. The Group is also looking intostudying several other mining development projects. The South African coal produced by TCSA or bought from third-party’s mines is exported through the port of Richard’s Bay, in which TOTAL has a 5.36%5.7% interest. In 2008, TOTAL and its partner Mmakau Mining acquired an additional 1 Mt/y of harbor handling rights through the interests they hold in the fifth phase of the port’s development.
39
TOTAL sold approximately 7.3 Mt of coal worldwide in 2009 (compared to 8.4 Mt in 2008 and 10 Mt in 2007), mainly intended for power generation, of which 3.6 Mt was South African coal. Half of this volume was sold in Europe and the other half in Asia. On the South African domestic market, sales amounted to 0.3 Mt in 2009, primarily destined for the industrial and metallurgic sectors.
DME (Di-Methyl Ether)DownstreamIn Japan, TOTAL is involved with eight Japanese companies in a program intended to heighten consumer awareness regarding this new generation fuel. The 80 kt/y DME production plant, located in Niigata (Honshu Island, Japan), started up in January 2009 (TOTAL, 10%).
As part of the consortium led by Volvo, TOTAL is involved in the “bio-DME” European project, which is intended to test the whole DME chain, from its
production from black liquor, a paper pulp residue, to its use by a fleet of trucks in four Swedish cities. This project, which includes the construction of a pilot in Pitea (Sweden), started in September 2009 and is expected to end in 2012. It is partly funded by the Swedish Energy Agency and the EU Seventh Framework Program.
In addition, the international working group established as part of the ISO standardization process for DME pursued its activities in 2009. For two years as from January 1, 2009, TOTAL will also chair the IDA (International DME Association).
DOWNSTREAM
The Downstream segment comprises TOTAL’s Refining & Marketing and Trading & Shipping divisions. TOTAL’s worldwide refining capacity was 2,363 kb/d at year end 2010, compared to 2,594 kb/ d. Ind in 2009 theand 2,604 kb/d in 2008. The Group’s worldwide refined products sales in 2010 were 3,6163,776 kb/d (including trading operations), compared to 3,616 kb/d in 2009 and 3,658 kb/d in 2008 and 3,774 kb/d in 2007.2008. TOTAL is the largest refiner/marketer in Western Europe (1), and the largestleading marketer in Africa (2). As of December 31, 2009, TOTAL’s worldwide marketing network consisted of 17,490 service stations in 2010, compared to 16,299 retail stations (compared toin 2009 and 16,425 in 2008, and 16,497 in 2007), more than 50% of which are owned by the Group. In addition, TOTAL’s refining operationsrefineries allow the Group to produce a broad range of specialty products, such as lubricants, liquefied petroleum gas (LPG), jet fuel, special fluids, bitumen, marine fuelsfuel and petrochemical feedstock. The Group is adapting its Refining business to an environment that is depressed due to weaker demand for refined products. TOTAL continues to adapt its business and improve its positions in a context of recovering demand worldwide, mainly in non-OECD countries, by focusing on three key areas: adapting its European refining system to market changes; modernizing its Port Arthur refinerymature markets in the United States and building a refinery in Jubail in Saudi Arabia.Regarding its Marketing business, the Group intends to consolidate its position in Western Europe, pursue targeted developmentssupporting growth in Africa, Asia and the growing markets of the Asia-Pacific regionMiddle East, and expand itsdeveloping specialty products business worldwide.
Consistent with
As part of the optimization of itsthe Group’s Downstream portfolio in Europe, TOTAL signed an agreement with ERGTotalErg (TOTAL 49%) was created in JanuaryOctober 2010 to create a joint venture in the Refining and Marketing business in Italy(3). “TotalErg” will be the name of this newly created company through the by merger of Total Italia and ERG Petroli. The shareholdersTotalErg has become the third largest operator in the Italian market.(3) In addition, in the United Kingdom, TOTAL offered for sale in 2010 its marketing business and the Lindsey refinery.
In February 2011, TOTAL announced that it had signed an agreement calls forto sell to IPIC its 48.83% interest in CEPSA pursuant to a joint governancepublic takeover bid on the entire share capital of the company as well as the operating independence of the joint-venture. TOTAL and Erg will hold a 49% and a 51% interest, respectively.CEPSA. The transaction is subject to approval by the relevant authorities.conditioned on obtaining all requisite approvals. In operating terms in Refining & Marketing, this sale concerns mainly four refineries (Huelva, Algesiras, Tenerife, Tarragone) and some marketing activities in Spain and Portugal. RefiningAs of December 31, 2009,
TOTAL heldholds interests in twenty-four refineries (including twelveten that it operates), located in Europe, the United States, the French West Indies, Africa and China. 2009 was marked by the deteriorationHighlights of 2010 included a slight recovery of the refining environment that led to sharp declines inimproved refining margins and decreasing utilization rates in refineries worldwide.worldwide, even though margins are still recording low levels. In 2009,2010, TOTAL continued its program of selective investments in Refining focusedfocusing on three areas: pursuing major ongoing projects (Port(deep conversion at Port Arthur, coker, Jubail refinery), adapting the European refining system to structural market changes, and strengthening safety and energy efficiency. • | | | • | InWestern Europe, TOTAL’s refining capacity was 2,2822,049 kb/d in 2009,2010, accounting for more than 85% of the Group’s overall refining capacity.capacity at year-end 2010. The Group |
| operates elevennine refineries in Western Europe, and |
1. | Based on publicly available information, refining and/or sales capacities and quantities sold. |
2. | PFC Energy December 2009, based on quantities sold. |
3. | Excluding Sicilia and excluding jet fuels and AS24 payment cards. |
| | holds interests in the German refinery of Schwedt, and in four Spanish refineries through its holdinginterest in CEPSA(1)(4). and in two refineries in Italy through its interest in TotalErg. Once finalized, the Group’s disposal of its interest in CEPSA is expected to lead to a decrease of nearly 260 kb/d in TOTAL’s refining capacities in Europe. |
| | | | | •— | | InFrance,the Group continues to adapt its refining capacities and to shift the production emphasis to diesel, in a context of structural decline in demand for petroleum products demand in Europe and an increase in gasoline surpluses. |
TOTAL announced in March 2009 | | | | | In October 2010, TOTAL was authorized by a court ruling to implement its project to repurpose the Flanders site (Dunkirk refinery with a distillation capacity of 7 Mt/y). The shutdown of the refining business will lead to gradually dismantling the units. The Group confirmed its project of repurposing the site through the creation of a technical support center, a refining training school, an oil depot and business offices. |
In addition, the industrial plan started in 2009 to adapt itsthe Group’s refining base primarily by reconfiguringin France is ongoing. This plan is intended to reconfigure the Normandy refinery and rescalingrescale certain corporate departments at itsthe Paris headquarters. At the Normandy refinery, the project willis intended to upgrade the refinery and shift the production (1) Based on publicly available information, refining capacities and quantities sold. (2) PFC Energy January 2011, based on quantities sold. (3) Based on publicly available information. (4) Group’s share in CEPSA: 48.83% as of December 31, 2010.
40
emphasis to diesel. ToFor this end, anpurpose, investment program estimated at€770 millionscheduled over four years will enable TOTAL to upgraderesult in the refinery:eventual reduction of the refinery’s annual distillation capacity will be reduced to 12 Mt from 16 Mt, andupsizing the distillate hydrocracker (DHC) commissioned in 2006 will be expanded. These investments are designed to improveand improving the energy efficiency and reduceby lowering carbon dioxide emissions, while increasing the annual average diesel output by 10% and reducing gasoline surpluses by 60%. Consultation with employee representatives ended inemissions. In July 2009. Implementation of the project has started and is scheduled to last until 2013.In March 2010, the Group announced a plan to repurpose its Flanders refinery site. This plan calls for shutting down refining operations atclosed the site (capacitydisposal of 137 kb/d), developing new refining operations support and petroleum logistics activities and implementing the planned LNG terminal project in partnership with French utility EDF, for which the final investment decision is expected before summer 2010 with a view to commissioning in 2014(2). The permanent refinery shutdown will result in a gradual dismantling of units that could continue to 2013. Implementation of this project is subject to consultation with employee representative organizations. Furthermore, TOTAL pledged not to close or sell any French refinery over the next five years, with the exception of the planned repurposing of the Flanders refinery.
In December 2009, the Group signed an agreement to divest its minority interest (40%) in the Société de la Raffinerie de Dunkerque (SRD), a company specializedthat specializes in the production of bitumen and base oils, subject to the approval by the relevant authorities.
oil production. | | | | | •— | | In theUnited Kingdom, constructioncommissioning of the hydrodesulphurization (HDS) unit at the Lindsey refinery started in June 2007 on a |
| | hydrodesulphurization unit (HDS) and a steam methane reformer (SMR) to process high-sulphur crudes and to increase its low-sulphur diesel production. The HDS unit is expected to be commissioned in the first half of 2010 and is designed2011. This will result in processing up to increase the portion70% of high-sulphur crudecrudes, compared to 10% currently, and increase low-sulphur diesel production. In parallel, TOTAL announced that it offered for sale the plant can process from 10% to nearly 70%.
Lindsey refinery in 2010. |
| | | •— | | InGermany, a new desulphurizationthe HDS unit that started up in September 2009 at the Leuna refinery started upwas operated successfully in September 2009.2010. This unit is designed to supply the German market with low-sulphur heating oil. |
| | | | | •— | | In theNetherlandsItaly, TOTAL, as the majority shareholder in the Vlissingen refinery (55%), exercised its pre-emptive rights over the shares (45%TotalErg (TOTAL, 49%) of this asset that were offered for sale by Dow Chemical in June 2009. Concurrently, TOTAL received from Lukoil a binding purchase offer for these shares (45%) and sold these shares to Lukoil, which constituted the development of a new partnership between the two companies. |
| • | | InItaly, following the agreement signed in January 2010, the TotalErg joint venture will hold a 100% interest inhas operated the Rome refinery (100%) since October 2010 and holds a 25.9% interest in the Trecate refinery.
|
| | | •— | | InSpain, CEPSA has been pursuingcompleted its investment planinvestments intended to improve the conversion capacity of its refineriesthe Huelva refinery so as to meet the growing demand for middle-distillatesmiddle distillates in the Spanish market. The construction of aA hydrocracker unit, two additional distillation units (one atmospheric and one vacuum) and a desulphurization unit were inaugurated in October 2010. Distillation capacity increased to 178 kb/d from 100 kb/d. In February 2011, the Group announced the signature of an agreement with IPIC to dispose of its 48.83% interest in CEPSA. The transaction is underway at the Huelva refinery. Commissioning is currently expected in the summer of 2010. conditioned on obtaining all requisite approvals. |
• | | | • | In theUnited States, TOTAL operates the Port Arthur refinery in Texas, with a capacity of 174 kb/d. In 2008, TOTAL beganlaunched a modernization program at this refinery in 2008, whichthat includes the construction of a deep-conversiondesulphurization unit (or coker),commissioned in July 2010, a vacuum distillation unit, a desulphurizationdeep-conversion unit (or coker) and other associated units to enable the refineryunits. This project is designed to process more heavy and high-sulphur crudes and to increase production of lighter products, in particular low-sulphur distillates. Construction is ongoingcompleted and commissioning is expectedwas ongoing in the first quarter ofMarch 2011. |
| | • | | InSaudi Arabia, TOTAL and Saudi Arabian Oil Company (Saudi Aramco) created a joint venture in September 2008,Saudi Aramco Total Refining and Petrochemical Company (SATORP), to build a400 kb/d refinery in Jubail held by Saudi Aramco (62.5%) and TOTAL (37.5%). Eventually, TOTAL and Saudi Aramco each plans to retain a 37.5% interest |
1. | Group’s share in CEPSA: 48.83% as of December 31, 2009. |
2. | For additional information on the Dunkirk LNG project, see “Item 4. Business Overview—Gas & Power”. |
| | with the remaining 25% expected to be listed on the Saudi stock exchange, in late 2011, subject to approval by the relevant authorities. Signing theThe main contracts for the construction of the refinery were signed in July 2009, markedconcurrent with thestart-up of work. Commissioning is expected in 2013. |
The heavy conversion process for this refinery is designed for the processing of heavier crudes (Arabian Heavy) and for the production of fuels and lighter products that meet strict specifications, and are mainly intended for export.
• | | | The heavy conversion process of this refinery is designed for processing heavier crudes (Arabian Heavy) and producing fuels and lighter products that meet strict specifications and are mainly intended for export. | | | • | InAfrica, TOTALthe Group holds minority interests in five refineries as of December 31, 2009. In October 2009, TOTAL disposed of its 50% interest in the Indeni refinery in Zambia. In addition, TOTAL decreased its interest to 20% from 34% in Société africaine de raffinage (SAR) inSouth Africa, Senegal, in December 2009.Côte d’Ivoire, Cameroon and Gabon. |
• | | InInChina, TOTAL has a 22.4% interest in the WEPEC refinery, located in Dalian, in partnership with Sinochem and PetroChina. China, TOTAL has a 22.4% interest in the WEPEC refinery, located in Dalian, in partnership with Sinochem and PetroChina.
|
Crude oil refining capacity The table below sets forth TOTAL’s daily crude oil refining capacity (a): | | | | | | | | As of December 31, (kb/d) | | 2009 | | 2008 | | 2007 | Refineries operated by the Group | | | | | | | Normandy (France) | | 338 | | 339 | | 331 | Provence (France) | | 158 | | 158 | | 158 | Flanders (France) | | 137 | | 137 | | 141 | Donges (France) | | 230 | | 230 | | 230 | Feyzin (France) | | 117 | | 117 | | 117 | Grandpuits (France) | | 101 | | 101 | | 101 | Antwerp (Belgium) | | 350 | | 350 | | 350 | Leuna (Germany) | | 230 | | 230 | | 227 | Rome (Italy)(b) | | 64 | | 64 | | 63 | Lindsey — Immingham (United Kingdom) | | 221 | | 221 | | 221 | Vlissingen (Netherlands)(c) | | 81 | | 81 | | 81 | Port Arthur, Texas (United States) | | 174 | | 174 | | 174 | Sub-total | | 2,201 | | 2,202 | | 2,194 | Other refineries in which the Group has an interest(d) | | 393 | | 402 | | 404 | Total | | 2,594 | | 2,604 | | 2,598 |
| | | | | | | | | | | | | | | As of December 31, (kb/d) | | 2010 | | | 2009 | | | 2008 | | Refineries operated by the Group | | | | | | | | | | | | | | | | Normandy (France) | | | 199 | | | | 338 | | | | 339 | | | | | Provence (France) | | | 158 | | | | 158 | | | | 158 | | | | | Flanders (France) | | | — | | | | 137 | | | | 137 | | | | | Donges (France) | | | 230 | | | | 230 | | | | 230 | | | | | Feyzin (France) | | | 117 | | | | 117 | | | | 117 | | | | | Grandpuits (France) | | | 101 | | | | 101 | | | | 101 | | | | | Antwerp (Belgium) | | | 350 | | | | 350 | | | | 350 | | | | | Leuna (Germany) | | | 230 | | | | 230 | | | | 230 | | | | Rome (Italy)(b) | | | — | | | | 64 | | | | 64 | | | | | Lindsey — Immingham (United Kingdom) | | | 221 | | | | 221 | | | | 221 | | | | Vlissingen (Netherlands)(c) | | | 81 | | | | 81 | | | | 81 | | | | | Port Arthur, Texas (United States) | | | 174 | | | | 174 | | | | 174 | | | | Sub-total | | | 1,861 | | | | 2,201 | | | | 2,202 | | | | Other refineries in which the Group has an interest(d) | | | 502 | | | | 393 | | | | 402 | | | | Total | | | 2,363 | | | | 2,594 | | | | 2,604 | | | |
(a) | | | | (a) | | For refineries not 100% owned by TOTAL, the indicated capacity shown represents TOTAL’s share of the site’s overall refining capacity of the refinery.capacity. |
| (b) | | TOTAL’s interest iswas 71.9%. until September 30, 2010. |
| (c) | | TOTAL’s interest is 55%. |
| (d) | | TOTAL has interests ranging from 16.7%12% to 50% in twelvefourteen refineries (five in Africa, four in Spain, two in Italy, one in Germany, one in Martinique and one in China). Since October 1, 2010, including the Group’s share in the Rome and Trecate refineries through its interest in TotalErg. TOTAL disposed of its 50% interest in the Indeni refinery in Zambia in 2009 and of its 55.6% interest in the Luanda refinery in Angola in 2007.2009. |
41
The table below sets forth by product category TOTAL’s net share of refined quantities produced at the Group’s refineries (a): | | | | | | | | (kb/d) | | 2009 | | 2008 | | 2007 | Gasoline | | 407 | | 443 | | 501 | Jet fuel(b) | | 186 | | 208 | | 208 | Diesel and heating oils | | 851 | | 987 | | 964 | Heavy fuel oils | | 245 | | 257 | | 254 | Other products | | 399 | | 417 | | 412 | Total | | 2,088 | | 2,312 | | 2,339 |
| | | | | | | | | | | | | | | (kb/d) | | 2010 | | | 2009 | | | 2008 | | | Gasoline | | | 345 | | | | 407 | | | | 443 | | | | Avgas and jet fuel(b) | | | 168 | | | | 186 | | | | 208 | | | | | Diesel and heating oils | | | 775 | | | | 851 | | | | 987 | | | | | Heavy fuels | | | 233 | | | | 245 | | | | 257 | | | | | Other products | | | 359 | | | | 399 | | | | 417 | | | | Total | | | 1,880 | | | | 2,088 | | | | 2,312 | | | |
(a) | | | | (a) | | Including TOTAL’sequity share of refineries in CEPSA.which the Group holds interests. |
| (b) | | Avgas, jet fuel and kerosene. |
The tabletables below setsset forth the utilization rate of the Group’s refineries(a): | | | | | | | | | | | | | 2009 | | | 2008 | | | 2007 | | Crude | | 78 | % | | 88 | % | | 87 | % | Crude and other feedstock | | 83 | % | | 91 | % | | 89 | % |
| | | | | | | | | | | | | | | | | 2010 | | | 2009 | | | 2008 | | On crude and other feedstock(a)(b) | | | | | | | | | | | | | | | | France | | | 64 | % | | | 77 | % | | | 89 | % | | | | Rest of Europe | | | 85 | % | | | 88 | % | | | 93 | % | | | | Americas | | | 83 | % | | | 77 | % | | | 88 | % | | | | Asia | | | 81 | % | | | 80 | % | | | 76 | % | | | | Africa | | | 76 | % | | | 77 | % | | | 79 | % | | | Net share of CEPSA and TotalErg(c) | | | 94 | % | | | 93 | % | | | 106 | % | | | Average | | | 77 | % | | | 83 | % | | | 91 | % | | |
(a) | | | | (a) | | Including TOTAL’sequity share of refineries in CEPSA.which the Group holds interests. | | (b) | | Crude + crackers’ feedstock/capacity and distillation at the beginning of the year. | | (c) | | For TotalErg: calculation of the utilization rate based on production and prorated capacity. |
In 2009, TOTAL had to reduce the utilization rate of its refineries to adapt to weaker demand. In particular, the Port Arthur, Lindsey and Flanders refineries as well as a distillation unit at the Normandy refinery were temporarily shut down for economic reasons.
In 2009, five refineries underwent major turnarounds.
| | | | | | | | | | | | | | | | | 2010 | | 2009 | | 2008 | On crude(a)(b) | | | | | | | | | | | | | | | Average | | | 73 | % | | | 78 | % | | | 88 | % | | |
| | | | (a) | | Including equity share of refineries in which the Group holds interests. | | (b) | | Crude/capacity and distillation at the beginning of the year. |
TOTAL is one of the leading marketers in Western Europe (1). The Group is also the largest marketer in Africa, with a market share of nearly 10%14%(2). TOTAL markets a wide range of specialty products, which it produces from its refineries and other facilities. TOTAL is among the leading companies in the specialty products market(3), in particular for lubricants, LPG, jet fuel, special fluids, bitumen, and marine fuels, with products marketed in approximately 150 countries(4). 1.
| Based on publicly available information, quantities sold. Portfolio: France, Benelux, United Kingdom, Germany, Italy and, through CEPSA, Spain and Portugal. |
2. | PFC Energy December 2009, based on quantities sold. |
3. | Based on publicly available information, quantities sold. |
4. | Including through national distributors. |
In Europe, as of December 31, 2009, TOTAL has a network of 10,82512,062 service stations in France, Belgium, the Netherlands, Luxembourg, Germany and the United Kingdom, Italy,as well as Spain and Portugal through its interest in CEPSA Spain(48.83%) and Portugal. Italy through its interest in TotalErg (49%). TOTAL also hasoperates a network of more than 540579 AS24-branded service stations dedicated to commercial transporters. TOTAL is among the leaders in Europe for fuel-payment cards, with approximately 3.5 million cards issued in twenty-eight European countries. In France,, the TOTAL-branded network benefits from a largewide number of service stations and a diverse selection of products (such as theBonjourconvenience stores and car washes). Elf-branded service stations offer quality fuels at prices that are particularly competitive. As of December 31, 2009, nearly 2,300Nearly 2,100 TOTAL-branded service stations and 281280 Elf-branded service stations were operatingare operated in France. TOTAL also markets fuels at nearly 1,8001,900 Elan-branded serviceretail stations, generally located in rural areas.In Western Europe, TOTAL continued in 20092010 its efforts to optimize its Marketing business.• | | | • | InItaly, the agreement signed between TOTALTotalErg was created in October 2010 and ERG in January 2010 to create the TotalErg joint venture will enable the Group to becomebecame the third marketing operator in Italylargest marketer with a retailnetwork market share of nearly 13%(1)(5) and more than 3,4003,200 service stations. | | | • | InFrance, TOTAL started to implement the project to adapt oil logistics operations in January 2010. Closure of the Pontet and Saint Julien oil depots is ongoing. Hauconcourt’s operations were transferred to the Raffinerie du Midi company on October 1, 2010. Transfer of the Mans oil depot’s operations and divesting of the Ouistreham oil depot are scheduled in the first half of 2011. |
• | | | | | | In January 2010, TOTAL also closed the disposal of half of its share (50%) in Société des Dépôts Pétroliers de Corse. |
| | | • | In theFranceUnited Kingdom,TOTAL announced in JanuarySeptember 2010 a restructuring plan of its petroleum product logistics operations. This plan callsintention to offer for outsourcing the operations of five depots to specialized logistics companies, closing the Pontet depot and doubling the capacity of the Port-la-Nouvelle depot. Implementation of this project is subject to consultation with employee representative organizations.sale its marketing business, except for certain specialties (lubricants, etc.). |
TOTAL signed in July 2009 an agreement to acquire thirty-seven service stations. In October 2009,
(1) Based on publicly available information, quantities sold. Scope: France, Benelux, United Kingdom, Germany, Italy, and, through CEPSA, Spain and Portugal. (2) Market share for the markets where the Group also signed an agreement to dispose of thirty-four service stations located in Corsica. These transactions have been approved by the relevant authorities. In January 2010, TOTAL also finalized the disposal of half of its share (50%) in Société des Dépôts Pétroliers de Corse.operates, based on publicly available information, quantities sold. (3) Based on publicly available information, quantities sold. (4) Including via national distributors. (5) PFC Energy, Unione Petrolifera, based on quantities sold.
42
In July 2009, the Group inaugurated a logistic platform in Rouen designed to supply Europe and
other continents with lubricants and grease. This investment is intended to improve the competitiveness of the Lubricants business line.
• | | InPortugal, since TOTAL and CEPSA merged their oil marketing businesses in 2008, TOTAL has had a leading position in the country with a market share of nearly 11%(2), a network of 300 service stations and a strengthened position in the specialty products market. |
InNorthern, Central andEastern Europe, the Group is developing its positions primarily in the specialty products market. In 2009,2010, TOTAL continued to expand its direct presence in the growing markets of Eastern Europe, in particular for lubricants. The Group intends to accelerate the growth of its specialty products business in Russia and Ukraine through the development of its direct presence in these markets since 2008.
AS24, which is presentactive in twenty-twotwenty-five European countries, and in Russia, continued to expand its network in 20092010 by opening new marketing outlets, in Europe, in particular in threetwo new countries (Croatia, Bulgaria, Republic of Macedonia)(Sweden and Serbia). During the next few years, theThe AS24 network is expected to continue to grow and expand to other countries in Europe, the Caucasus and the Mediterranean Basin. Africa & the Middle EastAs of December 31, 2009,
TOTAL is the leading marketer of petroleum products inon the African continent, with a market share of nearly 10%14%.(3)(1), over Following the acquisition of marketing and logistics assets in Kenya and Uganda in 2009, the Group runs more than 3,600 service stations in more than forty countries and operates two major networks in South Africa and Nigeria. As part of the optimization of its portfolio, the Group divested its subsidiary in Benin in December 2010. TOTAL also has a large presence in the Mediterranean Basin, principally in Turkey, Morocco and Tunisia. In the Middle East, the Group is active mainly in the specialty products market and is pursuing its growth strategy in the region, notably through the production and marketing of lubricants. In 2009, the Group continued to strengthen its positions on the African continent. In the second quarter of 2009, TOTAL completed the acquisition of marketing and logistics assets in Kenya and Uganda. The transaction covers 165 service stations, aviation products distribution as well as several logistics sites and a lubricant manufacturing plant.
Asia-PacificAs of December 31, 2009,
At year-end 2010, TOTAL was present in nearly twenty countries in the Asia-Pacific region, primarily in the specialty products market. The Group is developing 1. | PFC Energy, Unione Petrolifera, based on quantities sold. |
2. | Based on publicly available information, quantities sold. |
3. | PFC Energy December 2009, based on quantities sold. |
its position as a fuel marketer in the region, in particular in China, andChina. TOTAL operates networksservice stations in Pakistan, the Philippines, Cambodia, Indonesia, and Cambodia. TOTAL is also a significant player in the Pacific Islands. In addition, five service stations opened in Indonesia in 2009. In China, the Group has approximately 110 service stations as of December 31, 2009, following two joint venture agreements signed in 2005 by TOTAL and Sinochem to develop a network of 500operated nearly 130 service stations in the Beijing and Shanghai areas.2010 through two TOTAL/Sinochem joint ventures. In Vietnam, TOTAL continues to strengthen its position in the specialty products market. After the acquisition of an LPG marketing company in December 2008, theThe Group finalized in December 2009 the acquisition of lubricants assets, making TOTALbecame one of the leaders ofin the Vietnamese lubricants market.The Americas
Inmarket due to the acquisitions of lubricants assets at year-end 2009.
Americas InLatin Americaand theCaribbean, TOTAL is active in nearly twenty countries, primarily in the specialty products market. In the Caribbean, the Group holds a significant position in the fuel distribution business, thatwhich was strengthened by the acquisition in the second half of 2008 of marketing and logistics assets in Puerto Rico, Jamaica and the Virgin Islands. In North America, TOTAL markets lubricants and is continuing to grow with the signature in Decemberacquisition at year-end 2009 of an agreement to acquire lubricant assets in the province of Quebec in Canada.Sales of refined products The table below sets forth TOTAL’s volumessales of refined petroleum products sold by geographic arearegion(a): | | | | | | | | | (kb/d) | | 2009 | | 2008 | | 2007 | | France | | 808 | | 822 | | 846 | | Europe excluding France(a) | | 1,245 | | 1,301 | | 1,432 | | United States | | 118 | | 147 | | 162 | (b) | Africa | | 281 | | 279 | | 286 | | Rest of world | | 189 | | 171 | | 167 | | Total excluding Trading | | 2,641 | | 2,720 | | 2,893 | (b) | Trading | | 975 | | 938 | | 881 | | Total including trading | | 3,616 | | 3,658 | | 3,774 | (b) |
| | | | | | | | | | | | | | | (kb/d) | | 2010 | | | 2009 | | | 2008 | | | France | | | 725 | | | | 808 | | | | 822 | | | | | | | | | | | | | | | | Europe, excluding France(a) | | | 1,204 | | | | 1,245 | | | | 1,301 | | | | | | | | | | | | | | | | | United States | | | 65 | | | | 118 | | | | 147 | | | | | | | | | | | | | | | | | Africa | | | 292 | | | | 281 | | | | 279 | | | | | | | | | | | | | | | | | Rest of world | | | 209 | | | | 189 | | | | 171 | | | | | | | | | | | | | | | | Total excluding Trading | | | 2,495 | | | | 2,641 | | | | 2,720 | | | | | | | | | | | | | | | | | Trading | | | 1,281 | | | | 975 | | | | 938 | | | | | | | | | | | | | | | | Total including trading | | | 3,776 | | | | 3,616 | | | | 3,658 | | | | | | | | | | | | | | | |
(a) | | | | (a) | | Including TOTAL’s share in CEPSA.CEPSA and, as from October 1, 2010, in TotalErg. |
(b) | The amount is different from that in TOTAL’s 2007 Form 20-F due to a change in the calculation method for sales of the Port Arthur refinery. |
The table below sets forth the number of service stations in TOTAL’s network by geographic area(a): | | | | | | | | | As of December 31, | | 2009 | | | 2008 | | 2007 | France | | 4,606 | (b) | | 4,782 | | 4,992 | Europe excluding France and CEPSA | | 4,485 | | | 4,541 | | 4,762 | CEPSA(c) | | 1,734 | | | 1,811 | | 1,680 | Africa | | 3,647 | | | 3,500 | | 3,549 | Rest of world | | 1,827 | | | 1,791 | | 1,514 | Total | | 16,299 | | | 16,425 | | 16,497 |
| | | | | | | | | | | | | | | As of December 31, | | 2010 | | | 2009 | | | 2008 | | | France | | | 4,272 | (b) | | | 4,606 | (b) | | | 4,782 | | | | | | | | | | | | | | | | CEPSA and TotalErg(c) | | | 4,958 | | | | 1,734 | | | | 1,811 | | | | | | | | | | | | | | | | | Europe, excl. France, CEPSA and TotalErg | | | 2,832 | | | | 4,485 | | | | 4,541 | | | | | | | | | | | | | | | | | Africa | | | 3,570 | | | | 3,647 | | | | 3,500 | | | | | | | | | | | | | | | | | Rest of world | | | 1,858 | | | | 1,827 | | | | 1,791 | | | | | | | | | | | | | | | | Total | | | 17,490 | | | | 16,299 | | | | 16,425 | | | | | | | | | | | | | | | |
(a) | | | | (a) | | Excluding AS24-branded service stations. |
| (b) | | Of which nearly 2,3002,100 TOTAL-branded service stations, nearly 281280 Elf-branded service stations and more than 1,8001,900 Elan-branded service stations. |
| (c) | | Including all1,737 CEPSA-branded service stations within the CEPSA network.and, as from October 1, 2010, 3,221 TotalErg-branded service stations. |
TOTAL is presentactive in the biodiesel and biogasoline biofuel sectors. In 2009,2010, TOTAL produced and blended 560549 kt of ethanol(1)(2) in gasoline at twelveits European refineries(3) (compared to 560 kt in (1) Market share for the markets where the Group operates, based on publicly available information, quantities sold. (2) Including ethanol from ETBE(compared toEthyl-Tertio-Buthyl-Ether) and methanol form MTBE (Methyl-Tertio-Butyl-Ether). (3) Including the Algesiras and Huelva refineries (CEPSA).
43
2009 and 425 kt in 20082008) and 350 kt in 2007) and 1,8702,023 kt of VOME (3)(1) in diesel at fifteenits European refineries (4)(2) and several oil depots (compared to 1,870 kt in 2009 and 1,470 kt in 2008 and 880 kt in 2007)2008). TOTAL, in partnership with the leading companies in this area, is developing second generation biofuels derived from biomass. The Group is also participating in French, European and international bioenergy development programs. In this framework, the Group announced in 2009 that it would participate in the BioTfueL research project intended to develop a technology to transform biomass into biodiesel. In April 2009, the Group announced that it had acquired an interest in Gevo, a U.S. company developing a portfolio of bioproducts intended for the transportation fuel and chemicals markets. Gevo is developing an innovative technology to convert sugars derived from biomass into higher alcohols and hydrocarbons.
The Group is also involved in Futurol, ana R&D project for cellulosic bioethanol, which intends to develop and promote on an industrial scale a production process for bioethanol by fermentation of lignocellulosicnon-food ligno-cellulosic biomass. 1.
| Including ethanol from ETBE (Ethyl-Tertio-Buthyl-Ether). |
2. | Including the Algeciras and Huelva refineries (CEPSA). |
3. | VOME: Vegetable-Oil-Methyl-Ester. |
4. | Including the Algeciras, Huelva and Tarragona refineries (CEPSA). |
Hydrogen and electric mobility For several years, TOTAL has been involved in research and testing programs for fuel cell and hydrogen fuel technologies. The Group is a founding member of the industrial groupEuropean Industry Grouping for a Fuel Cell and Hydrogen Joint Technology Initiative created in 2007 to participate in the European Joint Technology Initiative to promote the development of hydrogen technology.research in the field.In 2009,2010, as part of the Clean Energy Partnership Berlin project, TOTAL builtinaugurated a new prototype hydrogen fueling station. Construction of a second hydrogen fueling station in Germany. Three other service stations of the Group are marketing hydrogen in Germany and Belgium.In Germany, theis underway.
The Group is also involved in a demonstration project for marketing electricity atin four TOTAL-branded service stations in Berlin, in partnership with the utility company Vattenfall. In 2010, TOTAL inaugurated the first of twelve prototype electric fueling stations in the area of Brussels in Belgium. The Trading & Shipping division: sells and markets the Group’s crude oil production;
provides a supply of crude oil for the Group’s refineries;
| | | • | sells and markets the Group’s crude oil production; |
| | | • | provides a supply of crude oil for the Group’s refineries; | | • | imports and exports the appropriate petroleum products for the Group’s refineries to be able to adjust their production to the needs of local markets; | | • | charters appropriate ships for these activities; and | | • | undertakes trading on various derivatives markets. |
imports and exports the appropriate petroleum products for the Group’s refineries to be able to adjust their production to the needs of local markets;
charters appropriate ships for these activities; and
undertakes trading on various derivatives markets.
Although theThe Trading & Shipping division’s main focus is serving the Group, its know-how andGroup. In addition, the expertise acquired also allowallows this division to extend itsthe scope of operationsits activities beyond meeting the strict needs of the Group.
its primary focus. Trading & Shipping’s worldwide activities are conducted through various wholly-owned subsidiaries, including TOTSA Total Oil Trading S.A., Total International Ltd, Socap International Ltd, Atlantic Trading & Marketing Inc., Total Trading Asia Pte, Total Trading and Marketing Canada L.P., Total Trading Atlantique S.A. and Chartering & Shipping Services S.A. TOTAL is one of the world’s largest traders of crude oil and refined products on the basis of volumes traded. The table below sets forth selected information with respect to TOTAL’sthe worldwide sales and source of supply of crude oil of the Group’s Trading division for each of the last three years. (1) VOME: Vegetable-Oil-Methyl-Ester. (2) Including CEPSA’s Algesiras, Huelva and Tarragona refineries in Spain and TotalErg’s Rome and Trecate refineries in Italy.
44
SupplyTrading division’s supply and sales of crude oil | | | | | | | | For the year ended December 31, (kb/d, except %) | | 2009 | | 2008 | | 2007 | Sales of crude oil | | 3,679 | | 3,839 | | 4,194 | Sales to Group Refining & Marketing division(a) | | 1,771 | | 1,995 | | 2,042 | Share of sales to external customers | | 1,908 | | 1,844 | | 2,152 | Sales to external customers/total sales | | 52% | | 48% | | 51% | Supply of crude oil | | 3,679 | | 3,839 | | 4,194 | Share of production sold(b)(c) | | 1,310 | | 1,365 | | 1,502 | Purchased from external suppliers | | 2,370 | | 2,474 | | 2,692 | Production sold/total supply | | 36% | | 36% | | 36% |
| | | | | | | | | | | | | | | For the year ended December 31, (kb/d) | | 2010 | | | 2009 | | | 2008 | | Worldwide liquids production | | | 1,340 | | | | 1,381 | | | | 1,456 | | | | | | | | | | | | | | | | | Purchased by the Trading division from the Group’s Exploration & Production division | | | 1,044 | | | | 1,054 | | | | 1,102 | | | | | | | | | | | | | | | | | Purchased by the Trading division from external suppliers | | | 2,084 | | | | 2,351 | | | | 2,495 | | | | | | | | | | | | | | | | Total of Trading division’s supply(a) | | | 3,128 | | | | 3,405 | | | | 3,597 | | | | | | | | | | | | | | | | | Sales of Trading division to Group Refining & Marketing division | | | 1,575 | | | | 1,752 | | | | 1,994 | | | | | | | | | | | | | | | | | Sales of Trading division to external customers | | | 1,553 | | | | 1,653 | | | | 1,603 | | | | | | | | | | | | | | | | Total of Trading division’s sales(a) | | | 3,128 | | | | 3,405 | | | | 3,597 | | | | | | | | | | | | | | | |
(a) | Excluding share of CEPSA. | |
(b)(a) | | Including condensates and natural gas liquids. |
(c) | Including TOTAL’S proportionate share of joint ventures production. |
The Trading division operates extensively on physical and derivatives markets, both organized and over the counter. In connection with its trading business,activities, TOTAL, like most other oil companies, uses derivative energy instruments (futures, forwards, swaps, options) to adjust its exposure to fluctuations in the price of crude oil and refined products. These transactions are entered into with various counterparties. For additional information concerning Trading & Shipping’s derivatives, see Notes 30 (Financial instruments related to commodity contracts) and 31 (Market risks) to the Consolidated Financial Statements. All of TOTAL’s trading operationsactivities are subject to strict internal controls and trading limits. Throughout 2009,2010, the Trading division maintained a level of activity similar to the levels attainedthose recorded in 2009 and 2008, and 2007,with trading physical volumes of crude oil and refined products amounting to an average of approximately 5 Mb/d. In 2009,2010, the main market benchmarks were characterizedindicators extended the trends recorded since mid-2009. Theyear-on-year evolution was marked by increased crude and diesel spot prices, a strong contango(1): | | | | | | | | | | | | | | | | | | | | | | | | 2009 | | 2008 | | 2007 | | min 2009 | | | max 2009 | | Brent ICE — 1st Line(a) | | ($/b) | | 62.73 | | 98.52 | | 72.67 | | 39.6 | | (Feb. 11 | ) | | 79.7 | | (Oct. 14 | ) | Brent ICE — 12th Line(b) | | ($/b) | | 70.43 | | 102.19 | | 73.24 | | 48.3 | | (Feb. 11 | ) | | 86.4 | | (Nov. 24 | ) | Contango time structure (12th-1st) | | ($/b) | | 7.70 | | 3.59 | | 0.57 | | 3.8 | | (Aug. 07 | ) | | 15.2 | | (Jan. 02 | ) | Gasoil ICE — 1st Line(c) | | ($/t) | | 522.20 | | 920.65 | | 637.84 | | 361.3 | | (Feb. 24 | ) | | 653.8 | | (Oct. 15 | ) | VLCC Ras Tanura Chiba — BITR(c) | | ($/t) | | 10.43 | | 24.09 | | 13.93 | | 6.3 | | (May 05 | ) | | 17.9 | | (Jan. 08 | ) |
| | | | | | | | | | | | | | | | | | | | | | | | | | | | | | | | | | | | | | 2010 | | 2009 | | | 2008 | | | min 2010 | | | max 2010 | | Brent ICE — 1st Line(a) | | ($ | /b | ) | | 80.34 | | | 62.73 | | | | 98.52 | | | | 69.55 | | | | (May 18 | ) | | | 94.75 | | | | (Dec. 24 | ) | Brent ICE — 12th Line(b) | | ($ | /b | ) | | 84.61 | | | 70.43 | | | | 102.19 | | | | 75.29 | | | | (Jan. 29 | ) | | | 95.15 | | | | (Dec. 24 | ) | Contango time structure (12th-1st) | | ($ | /b | ) | | 4.27 | | | 7.70 | | | | 3.59 | | | | (0.55 | ) | | | (Nov. 29 | ) | | | 6.98 | | | | (May 31 | ) | Gasoil ICE — 1st Line(c) | | ($ | /t | ) | | 673.88 | | | 522.20 | | | | 920.65 | | | | 567.25 | | | | (Feb. 01 | ) | | | 784.50 | | | | (Dec. 16 | ) | VLCC Ras Tanura Chiba — BITR(c) | | ($ | /t | ) | | 13.41 | | | 10.43 | | | | 24.09 | | | | 8.24 | | | | (Oct. 01 | ) | | | 23.66 | | | | (Jan. 12 | ) |
(a) | | | | (a) | | 1stline: Quotation for first month nearby delivery ICE Futures for delivery during the month M+1. |
(b)Futures. | (b) | | 12thLine: Quotation for ICE Futures for delivery during the month M+12. |
| (c) | | VLCC: Very Large Crude Carrier. BITR: Baltic International Tanker Routes. |
Highlights of 2009 included a significant oversupply of
In 2010, the oil market was marked by recovering demand, due mainly to economic growth in emerging countries (China, India, Latin America, the Middle East). Meanwhile, crude oil and petroleum products comparedother liquids production (LPG, LNG, biofuels) outside of OPEC countries grew rapidly while production from OPEC countries increased only slightly despite a softening of quotas that have been effective since year-end 2008. The increase in global oil storage, which has prevailed since early 2008, finally stopped in mid-2010 with a first major decrease mainly due to demand. Demand recovered slightlythe strong increase in demand in the second halfthird quarter of the year.The oversupply led to increased inventory levels. This trend was exacerbated by the steepening of the contango structure for future oil prices. In early 2009, the contango reached its maximum for the year (15.2 $/b) and then decreased but remained high enough to finance2010. Following this reversal, oil storage in onshore tanks and, once saturated, in offshore oil tankers (floating storage).
at year-end 2010 was at the year-end 2009 level. The Group’s Shipping division arranges the transportation of crude oil and refined products necessary forto develop the Group’s activities. The Shipping division provides a wide range of shipping services required by the Group to develop its activities and maintainsIt has a rigorous safety policy.policy that is due mainly to the strict selection of the vessels that the division charters. Like a certain number of other oil companies and shipowners, the Group uses freight rate derivative contracts in its shipping activity to adjust its exposure to freight ratefreight-rate fluctuations. In 2009,2010, the Shipping division chartered approximately 3,0002,900 voyages to transport approximately 123119 Mt. At year-end 2009,As of December 31, 2010, the Group employed a fleet of fifty-fiveforty-seven vessels chartered under long-term or medium-term agreements (including fourfive LPG carriers and no single-hulled vessels). The fleet has an average age of approximately four years. In 2009,2010, the oiltanker freight market was adversely affectedsuffered strong fluctuations. Highlights of the first half of 2010 included: | | | • | increased crude oil imports to consumer countries, driven by the economic recovery and increased |
45
| | | onshore and offshore crude oil storage in the United States, Europe and China; and |
| | | • | the resumption of crude oil floating storage that involved up to forty-five vessels in early May 2010 and resulted in limited growth of the active fleet of tankers despite the disposal of fewer vessels than expected. |
The combination of these two factors:A strong increasetrends led to the relative resilience of more than 10%the freight market for crude oil transport as recorded in the tonnagefirst half of 2010.
However, from the second half of 2010, the fundamentals of the global supplyfreight market deteriorated sharply, leading to a collapse of tankersfreight rates at the end of over 10,000 deadweight tons, mainlyJuly. This trend was the result of the sustained growth of the active fleet due to the deliverysignificant decrease in floating storage and the continued growth of numerousthe fleet. Throughout 2010, the number of new vessels in every segment and few disposalsdelivered by shipyards exceeded the number of vessels.A decline invessels disposed of, despite the entry into force of the international regulation providing for the gradual disposal of single-hulled vessels, which led to an oversupply of vessels compared to demand for transport due to the 1.6% decrease in the average demand for oil in 2009. This global decrease, primarily due to the worldwide recession, led to a reduction in OPEC’s production in late 2008. As a result, crude transport dropped, especially on long-haul VLCC routes from the Persian Gulf.
Freight rates decreased throughout 2009 and, starting in the second quarter, reached levels that barely covered the vessels’ operating costs. Within a few months, the market turned from historically high levels in 2008 to record low levels in 2009. The weak freight rates and pricing structure for the crude oil market followed by the petroleum products market led to using vessels as floating storage.
transport. The Chemicals segment includes the Base Chemicals and Specialty Chemicals divisions: | | | • | Base Chemicals encompasses the Group’s petrochemicals and fertilizers businesses; and | | | • | Specialty Chemicals encompasses the Group’s rubber processing, resins, adhesives and electroplating businesses. |
TOTAL is one of the world’s largest integrated chemical producers.(1) Base Chemicals encompasses the Group’s petrochemicals and fertilizers businesses; and Specialty Chemicals encompasses the Group’s rubber processing, resins, adhesives and electroplating businesses.
1. | Contango is defined as a market situation in which the price of a good in the future is higher than its prompt price in the spot market. |
Base Chemicals
The Base Chemicals division includes TOTAL’s petrochemicalpetrochemicals and fertilizer businesses. fertilizers activities. In 2009,2010, Base Chemicals sales were€8.66 €10.7 billion, compared to€13.18 €8.7 billion in 20082009 and€12.56 €13.2 billion in 2007.2008. The 20092010 market environment for the Base Chemicals division was marked by a decreasing recovering demand for petrochemical products in Europe and the United States and a decline in margins of products from steam crackers.improved integrated margins. The Group’s operations Group strengthened positions in Qatar with thestart-up of the steam cracker in Ras Laffan and Korea helped to offsetof the challenging environmentlinear low-density polyethylene plant in mature areas. TheMessaied. In 2010, the Fertilizers business was adversely affected by decreasing volumes and very weak margins throughoutmanufacturing incidents, whereas the year.European market was recovering. BREAKDOWN OF TOTAL’S PRODUCTION CAPACITIES BYMAIN PRODUCT GROUPS AND REGIONS
| | | | | | | | | | | | | | | | 2009 | | 2008 | | 2007 | | (kt) | | Europe | | North
America | | Asia and
Middle
East(c) | | Worldwide | | Worldwide | | Worldwide | Olefins(a) | | 4,695 | | 1,195 | | 1,005 | | 6,895 | | 7,285 | | 7,175 | Aromatics | | 2,500 | | 940 | | 755 | | 4,195 | | 4,360 | | 4,335 | Polyethylene | | 1,320 | | 440 | | 280 | | 2,040 | | 2,035 | | 2,035 | Polypropylene | | 1,335 | | 1,150 | | 295 | | 2,780 | | 2,750 | | 2,575 | Styrenics(b) | | 1,110 | | 1,350 | | 630 | | 3,090 | | 3,220 | | 3,160 |
| | | | | | | | | | | | | | | | | | | | | | | | | | | | | 2010 | | | 2009 | | | 2008 | | | | | | | | | | | Asia and
| | | | | | | | | | | | | | | | | North
| | | Middle
| | | | | | | | | | | | (in millions of tons) | | Europe | | | America | | | East(a) | | | Worldwide | | | Worldwide | | | Worldwide | | Olefins(b) | | | 4,695 | | | | 1,195 | | | | 1,300 | | | | 7,190 | | | | 6,895 | | | | 7,285 | | | | | | | | | | | | | | | | | | | | | | | | | | | | | Aromatics | | | 2,500 | | | | 940 | | | | 755 | | | | 4,195 | | | | 4,195 | | | | 4,360 | | | | | | | | | | | | | | | | | | | | | | | | | | | | | Polyethylene | | | 1,180 | | | | 460 | | | | 500 | | | | 2,140 | | | | 2,040 | | | | 2,035 | | | | | | | | | | | | | | | | | | | | | | | | | | | | | Polypropylene | | | 1,335 | | | | 1,150 | | | | 295 | | | | 2,780 | | | | 2,780 | | | | 2,750 | | | | | | | | | | | | | | | | | | | | | | | | | | | | Styrenics(c) | | | 1,050 | | | | 1,260 | | | | 640 | | | | 2,950 | | | | 3,090 | | | | 3,220 | | | | | | | | | | | | | | | | | | | | | | | | | | | |
(a) | Ethylene, propylene and butadiene. | |
(b)(a) | Styrene and polystyrene. |
(c) | Including minority interests in Qatar and 50% of Samsung-Total Petrochemicals capacities in Daesan (South Korea).capacities. | | (b) | | Ethylene, propylene and butadiene. | | (c) | | Styrene and polystyrene. |
The petrochemical business, grouped under Total Petrochemicals, includes base petrochemicals (olefins and aromatics) and their polymer derivatives (polyethylene, polypropylene and styrenics). InEurope, TOTAL’s main petrochemicalpetrochemicals sites are located in Belgium (Antwerp, Feluy), and in France (Carling, Feyzin, Gonfreville, Lavéra),. (1) Based on publicly available information, consolidated sales.
46
In the United States, (Carvillethey are located in Louisiana (Carville) and Bayport,Texas (Bayport, La Porte, and Port ArthurArthur). InAsia, TOTAL owns, in Texas),partnership with Samsung, a 50% interest in the Daesan integrated petrochemical site in South Korea. The Group is also active through its Singapore and China (Foshan). Foshan (China) plants. InQatar, the Group holds interests in two steam crackers and several polyethylene lines. Most of these sites are either adjacent to or connected by pipelines to Group refineries. As a result, most of TOTAL’s petrochemical operations are closely integrated within the Group’s refining operations. TOTAL owns a 50% interest in the Daesan petrochemical site in South Korea, in partnership with Samsung. This integrated site is located 400 km off the Chinese coast.In Qatar, the Group holds interests in two steam crackers and several polyethylene lines.
TOTAL has continuedcontinues to strengthen its leadership positions in the industry by focusing on the following three strategic areas:
In mature markets, TOTAL is improving the competitiveness of its long-established sites notably through costs management, better energy efficiency at its facilities and more flexibility in the choice of feedstock.
| | | • | In mature markets, TOTAL is improving the competitiveness of its long-established sites notably through cost management, better energy efficiency at its facilities and more flexibility in the choice of feedstock. |
In an increasingly competitive environment, the Group launched two reorganization plans, one in 2006 and another in 2009,mainly for the sites in Carling (eastern France) and Gonfreville sites in France:(northwestern France): | | | | | •– | | The first plan launched in 2006 called for the closingclosure of a steam cracker and the styrene plant at Carling and the construction of a new world-class(1) styrene plant at Gonfreville to replace the plant closed in late 2008. The reorganization plan was completed in the first quarter of 2009. |
The second plan is focused on a project to consolidate the petrochemical business to improve competitiveness. This project includes
1. | Facilities ranking among the first quartile for production capacities based on publicly available information. | |
| | – | The second plan launched in 2009 is focused on a consolidation project to improve sites competitiveness. This project includes a plan to upgrade the Group’s most efficient units by investing approximately€230 €230 million over three years to increase energy efficiency to the most efficient level and improve the competitive strengthcompetitiveness of the steam cracker and the high-density polyethylene unit in Gonfreville, and to consolidate polystyrene production at the Carling facility. It will also lead toincludes the closingshutdown of two structurally loss-making units: two low-density polyethylene lines, one in Carling (eastern France) and one in Gonfreville, (northwestern France), and a polystyrene line in Gonfreville. The three lines were shut down at year-end 2009. This reorganization plan is also intended to improve the efficiency offor the support services at both sites and of the central services at Total Petrochemicals France. |
Furthermore, following the sole customer’s termination of the supply contract for the secondary butyl alcohol produced at the Notre-Dame-de-Gravenchon facility in Normandy, this dedicated facility will havehad to be closed. Closure is expectedclosed in 2010.TOTAL is continuing to expand in growth areas.
In Asia, the joint venturesecond half of 2010.
| | | • | TOTAL is continuing to expand in growth areas. |
InAsia, the Samsung-Total Petrochemicals Co. Ltd inaugurated in September 2009 a polypropylene compounding plant located in Dongguang, China, and continues to optimize operations with the construction of a jet fuel production plant to develop co-products and a butane storage tank. This storage tank is intended to increase flexibility for the steam cracker feedstocks. In 2008, the joint venture (TOTAL, 50%) completed in 2008 the first modernization phase of the Daesan site in South Korea.Korea, its main production site in the region. This major development increased the site’s initial production capacity by nearly one-third throughthanks to the expansionextension of the steam cracking and styrene units, and the constructionstart-up of a new polypropylene line in 2007and a new metathesis plant. A further debottlenecking of the steam cracker and the polyolefin and aromatic units was approved in 2010. The capacity extensions are scheduled to be effective in 2011 for the steam cracker and the polyolefin unit and in 2012 for the aromatic unit. The joint venture continues to expand its operations with thestart-up of a new metathesis(1)polypropylene compounding plant in 2008.China in 2009 and, on the Daesan site, thestart-ups of a jet fuel production plant to develop co-products in June 2010 and a butane storage tank to increase flexibility for the steam cracker feedstock at year-end 2010. In the Middle East, construction of a 700 kt/y paraxylene unit at the Jubail refinery in Saudi Arabia was approved in May 2008 by TOTAL and Saudi Aramco. This world-class unit (2) is intended to supply the Asian market. Start-upThe main construction contracts were signed in 2009 andstart-up is scheduled forexpected in 2013. TOTAL is developing sites in countries with favorable access to raw materials.
| | | • | TOTAL is developing sites in countries with favorable access to raw materials. |
InQatar, through its interest in Qatofin and Qacpo,Qapco, TOTAL holds a 49% interest in a Qatofin-operated world-class linear low-density polyethylene plant with a capacity of 450 kt/y in Mesaieed, which Mesaieed. This unit, operated by Qatofin, started productionup in August 2009, as well as2009. The Group also holds a 22% interest in an ethane-based steam cracker in Ras Laffan designed for processing 1.3 Mt/y of ethylene. The steam cracker started in March 2010. In addition, construction of a 300 kt/y low-density polyethylene line is expectedhas started at Qapco, in which TOTAL holds a 20% interest, with commissioning scheduled in 2012. (1) Facilities ranking among the first quartile for production capacities based on publicly available information.
47
Pursuant to the contract signed in July 2007,
InAlgeria, TOTAL is continuing discussions withand Sonatrach, the Algerian nationalstate-owned oil company, relatedare studying a project to the constructionbuild a petrochemical site in Arzew (Algeria). The contemplatedArzew. This world class project includeswould include an ethane-based steam cracker with production capacity of 1.1 Mt/y, two polyethylene units and a monoethylene glycol production unit. This world-class projectIt would benefit from favorable access to ethane gas, a particularly competitive feedstockraw material, and would be ideally located to supply Europe, the Americas and Asia. In addition,China, TOTAL inauguratedand China Investment Corporation signed in October 2008November 2010 an agreement to study a pilot MTOproject to build acoal-to-olefins plant (Methanoland a polyolefins plant. TOTAL will bring to Olefins)this partnership its expertise in the Methanol to Olefins (MTO) and the Olefin Cracking Process (OCP) technologies that Total Petrochemicals has tested extensively at its purpose-built semi-commercial plant in Feluy, site (Belgium). This project, one ofBelgium. TOTAL will also study solutions with respect to carbon capture and storage (CCS) using the Group’s most important research projects, is intended to assess, on a semi-industrial scale, the technical and economical feasibility of producing olefins from methanol derived from natural gas, coal and biomass, and to consider new methods to produce polyolefins.In 2009, the Chemicals segment continued to improve its safety performance by focusing on on-the-job safety, safety management systems and major risk prevention. However, in the second half of 2009, the Chemicals segment faced four serious accidents. As a result, TOTAL launched a general review of thirteen French sites presenting technological risks, including two petrochemical sites (Gonfreville and Carling) and three sitesknow-how gained from its Fertilizers business (Mazingarbe, Grandpuits and Grand Quevilly). The Group is concerned by these events, especially since safety results were steadily improving on the whole and work accident indicators were halved between 2005 and 2009.
CCS pilot project in Lacq, France. Base petrochemicals include olefins and aromatics (monomers) produced by the steam cracking of petroleum cuts, mainly naphtha, as well as propylene and aromatics manufactured in the Group’s refineries. The economic environment for this businessthese activities is strongly influenced by the balance between supply and demand and by changes in the price of naphtha, the principal raw material used. 1. | Conversion of ethylene and butene into propylene. |
2009 was marked by a deterioration of margins due to a continuous increase in feedstock prices, especially naphtha.
Highlights of 2010 included the recovery of global demand for monomers and improved margins in all geographical areas. TOTAL’s production volumes increased by 8% in 2010. TOTAL is consolidating positions in Asia and the declineMiddle East with thestart-up of the Ras Laffan steam cracker in demand for olefins2010 in Qatar and aromaticscontinued investments to increase capacities in Korea. In Europe and the United States. The estimated utilization rateStates, TOTAL is improving energy efficiency at its sites, strengthening synergies with refining and increasing the flexibility of the steam crackers(1) in the industry worldwide decreased from 91% in 2005-2007 to 86% in 2008 and 85% in 2009 due to the commissioning of new capacities in the Middle East and the decrease in global demand.cracker feedstock. Polyethylene is a plastic produced by the polymerization of ethylene manufactured in the Group’s steam crackers. It is primarily intended for the packaging, automotive, food, cable and pipe markets. Margins are strongly influenced by the level of demand and by competition from expanding production in the Middle East, which benefits from favorable access to ethane, the raw material ethane, to produce ethylene.In 2009, demand growthused in ethylene production.
2010 was weak, estimated at +0.8% worldwide, with strong differences depending on regions: fallingmarked by the recovery of global demand in mature zones (Europe and the United States) and strong growthevery region, especially in China (more than 25%), driven by a domestic demand satisfied by the significant increaseChina. TOTAL’s sales volumes increased 4.7% in importations.TOTAL’s polyethylene sales volume dropped by 4% in 20092010 compared to 2008 and2009 thanks to thestart-up of the linear low-density plant in Qatar. High density polyethylene margins remained weak in Europe. In the United States, margins maintained at a higher levelremained high mainly due to the competitive price of ethane-based ethylene. In Europe, the pressure on margins is expected to persist with the start-up of new ethane-based units in the Middle East, which began in late 2009, and in Asia.
In this context,
TOTAL intends to focus on lowering the break-evenbreakeven point in its plants in Europe and strengthening its effortscontinuing to better differentiate its range of products. Polypropylene is a plastic produced by the polymerization of propylene manufactured in the Group’s steam crackers and refineries. It is primarily intended for the automotive, packaging, carpet, household, appliances, fabricsfibers and health carehygiene markets. Margins are mainly influenced by the level of demand and the availability and price of propylene. Highlights of 2009 included the slight recovery
2010 was marked by sustained growth in the global marketplace, estimated at +1.8%, thatpolypropylene market and all geographical areas, in particular North America and China. However, the European industry was driven, like polyethylene,affected by increasing Chinese domestic demand.ongoing production difficulties throughout the year. TOTAL’s sales volumes only slightly increased by 6% duecompared to positive contributions from every region.2009 (+1%). Margins strongly increased in Europe in a tight market environment but they remained stable at a relatively weak level in the United States. To face the increasing competition from new plants in the Middle East, TOTAL owns plants with industrial performance, both in Europe and the United States whichthat place the Group among the industry’s leaders. This line of business activity includes the production of styrene and polystyrene. Most of the styrene manufactured by the Group is used to produce polystyrene, a plastic principally used in food packaging, insulation, refrigeration, domestic appliances and electronic devices. Margins are strongly influenced by the level of polystyrene demand and the price of benzene, which is polystyrene’s principal raw material. In 2009,
After two years of decrease, the global styrene market decreased by 3%.increased in 2010 thanks to the resilience of the automotive, electronics and insulation markets. The global polystyrene market decreasedalso increased in 2010, driven by approximately 4% due to the weakness of the construction, refrigeration and television marketsdomestic demand in mature zones. Nonetheless, 2009 was also marked by the recovery of growth in China, exceeding 10%, due to programs implemented to stimulate domestic demand.China.
48
In 2009,2010, TOTAL’s polystyrene sales volumes increased by 1%, driven by an increase1.5% consistently in salesall geographical areas. Styrene margins remained weak in Asia (+13%).2010 whereas polystyrene margins strongly increased due to the market stabilization and capacity reductions in mature areas. Through its subsidiary GPN, TOTAL manufactures and markets nitrogen fertilizers made from natural gas. Margins are strongly influenced by the price of natural gas. After
In 2010, GPN’s production was affected by a record highnumber of manufacturing incidents that resulted in 2008,long shutdowns for maintenance of the Grandpuits and Rouen ammonia plants in France and a reduction of the downstream plants’ production (nitric acid, urea and ammonium nitrate). These incidents adversely affected GPN’s results, which could not take advantage of the improved European fertilizers market decreased by more than 10% in 2009 and returned to the levels recorded in 2005-2006. Following the collapse of urea prices in late 2008, prices of nitrogen products decreased sharply in early 2009, leading to a drop in margins.market. The Fertilizers business continued its major restructuring plan initiated insince 2006: In France, GPN ceased production of complex fertilizers that are made from nitrogen, phosphorus and potassium products, due to the declining market for these products, and closed its plants in Bordeaux, Basse Indre and Granville. In addition, TOTAL sold its Dutch affiliate, Zuid Chemie, to Engrais Rosier, in which the Group holds a 57% share, to create a more competitive player in the Benelux market.
1. | Based on publicly available information. |
| • | The complex fertilizers business was shut down in France, resulting in the closure of three sites (Bordeaux, Basse Indre and Granville). In addition, TOTAL sold its Dutch affiliate, Zuid Chemie, to Engrais Rosier (TOTAL, 57%). | | | • | The core activity of the Fertilizers business, which is the production of nitrogen fertilizers, was strengthened through a major investment in the construction of a competitive nitric acid plant in Rouen, which started up in the second half of 2009, and a urea plant in Grandpuits, the start-up of which is expected to start upwas ongoing in the second quarter of 2010.March 2011. This additional urea production is expectedenables GPN to position GPN in the growing markets of products that contribute to reducing nitrogen oxide emissions(1): DENOX® for industrial applications, and Adblue® for transportation applications. |
| | | • | In France, the Oissel site and three obsolete nitric acid units in Rouen and Mazingarbe were closed in 2009 and 2010. |
| | | • | In early 2010, the Group launched a process to divest GPN’s mines and quarries business in Mazingarbe, northern France. This project was submitted for prior consultation with employee representative organizations and to the approval by the relevant authorities. This transaction was closed in January 2011. |
In France, the Oissel site and three obsolete nitric acid units in Rouen and Mazingarbe were closed in 2009.
The Group is considering the sale of its mine and quarries business at Mazingarbe. Sale of this business has been submitted to prior consultation with employee representative organizations and to the approval by the relevant authorities.
This plan is expected to improve the competitiveness of GPN by regrouping its operations at two sites whichthat feature production capacity greater than the European average. TOTAL’s Specialty Chemicals division includes the rubber processing (Hutchinson) , consumer products (Mapa® and Spontex®), resins (Cray Valley, Sartomer and Cook Composites & Polymers), adhesives (Bostik) and electroplating (Atotech) businesses.. The division serves consumer and industrial markets for which customer-oriented marketing and service as well as innovation are key drivers. The GroupTOTAL markets specialty products in more than fifty-five countries. Its strategy iscountries and intends to pursue its international expansiondevelop in the global market by combining internal growth and targeted acquisitions while concentratingacquisitions. This development is focused on growingexpanding markets and focusing on the marketing of newinnovative products with high added value.value that meet the Group’s sustainable development approach. The Consumers business (Mapa® and Spontex®) was divested in April 2010. Sales for the divested lines of business were €530 million in 2009. In 2009,late 2010, TOTAL also launched a process to partially dispose of the Resins business (coatings and photocure resins). Sales for these lines of business were €860 million in 2010. Disposal is subject to prior consultation with employee representatives and approval by the relevant authorities, and may be effective by the second quarter of 2011. In 2010, the market environment for Specialty Chemicals faced a difficult environment duewas favorable thanks to the global economic slowdown, especiallyrecovery in the first half of the year.mature markets, which had faced difficult conditions in late 2008 and early 2009, and ongoing growth in emerging countries. In this adverse environment, Specialty Chemicalscontext and on alike-for-like basis (excluding Consumers products), 2010 sales decreased by 13%were €6.8 billion, a 21% increase compared to 2008. Results substantially increased in the second half of 2009 compared to the same period in 2008, due to improving margins and cost reduction programs.2009. Hutchinson manufactures and markets products derived from rubber processing that are principally intended for the automotive, aerospace and defense industries. Hutchinson, among the industry’s leaders (2), provides its customers with innovative solutions in the areas of fluid transfer, waterair and airtightness,fluid (or water) seals, transmission, mobility and vibration, as well as sound and thermal insulation. Hutchinson’s 2009 sales decreased by 11%were €2.7 billion in 2010, up 19% compared to 2009 in an uneven environment depending on the lines of business. Automotive products sales decreasedSales for the automotive business substantially comparedincreased thanks to 2008the recovery in a challenging market (1) Nitrogen oxide emissions are noxious to the environment and subject to regulation. (2) Based on publicly available information, consolidated sales.
49
especially in
the first half ofEuropean and North American markets and the year, both in North Americagrowing Latin American and in Europe.Chinese markets. In other industrial markets, sales increaseddecreased slightly in 20092010 compared to 20082009, due to sustained demand from the defense, aerospacedecline in markets for business planes, helicopters and defense. The decline was partially offset by an increase in the railway industries.market. To strengthen its position in the aerospace industry, Hutchinson acquired Strativer in late 2008, a company that specializesspecialized in the expanding composite materials industry.market. Throughout 2009,2010, Hutchinson continued to develop in expanding markets, primarily Eastern Europe, South America and China, relying notably on the sites opened in 2006 in Brasov (Romania), Lodz (Poland) and Suzhou (China) sites and in 2009 in Sousse (Tunisia).Consumer products
The Consumer products business is organized into baby care products (Nuk® and Tigex®) and household specialties (Mapa® and Spontex®). The baby care products sector strengthened in 2009 with the acquisition of Gerber in late 2008. As a result, sales increased by 11% in 2009 compared to 2008. These markets depend heavily on the level of household consumption and due to the economic slowdown, like-for-like consumption was lower on both markets. Thanks to brand recognition, the Consumer products business is expected to continue to growSousse site (Tunisia) opened in Europe, the United States and emerging countries.
In early 2010, TOTAL launched a process to sell its Consumer products business. Sale of this business has been submitted to prior consultation with employee representative organizations and to the approval by the relevant authorities.
2009.1.
| Nitrogen oxide emissions are harmful to the environment and subject to regulation. |
2. | Based on publicly available information, consolidated sales. |
TOTAL produces and markets resins for adhesives, inks, paints, coatings and composite materials through three subsidiaries: Cray Valley, Sartomer, and Cook Composites & Polymers. In 2009,2010, sales decreased by 22%,were €1.8 billion, up 24% compared to 2009, reflecting the ongoing economic slowdownrecovery in the United States,North America and Europe, which isare the main market segmentsegments for the Resins business, and decreasing volumes in Europe.In this environment, all thebusiness.
The subsidiaries acceleratedcontinued their programs to reduce fixed costs reduction programs in Europe and the United States. In addition, they continued to refocusfocus on their most profitable lines of business through a selective investment policy targeting in particular the most dynamic geographical areas. For instance, Sartomer continued In late 2010, TOTAL launched a process to expand in China from its Nansha plant that started up in April 2008.partially dispose of the Resins business (coatings and photocure resins). Bostik is one of the world leaders in itsthe adhesive sector based on sales(1), with leading positions in the industrial, hygiene, construction and consumer and commercialprofessional distribution markets. In 2009, Bostik’s2010, sales decreased by 8%were €1.4 billion, up 14% compared to 2008. These comparatively positive results in an adverse economy confirm2009. This strong performance confirms Bostik’s strategy of strengthening its position in the industrial market, which has been less affected than the construction industry, and continuing its development in growing markets, especially in the Asia-Pacific region. Bostik expects to start up new production units were commissioned in Egypt, Vietnam and China (Zhuhai)in the second half of 2011 and Australia (Sydney). In September 2009, Bostik launched the construction of a plant in Changshu (China) that is expected to eventually become the company’s largest plant.Furthermore, India in 2012.
Bostik is actively pursuing its program for innovation and is focusing notablybased on new products and applications contributing tointegrated solutions, and focused on sustainable development. Atotech, which encompasses TOTAL’s electroplating business, is the second largest company in this sector based on worldwide sales (1). It is active in both the electronics (printed circuits, semiconductors) and general metal finishing markets (automotive, sanitary goods, furnishing). The electroplating business was impactedstrongly recovered in 2010, driven in particular by the global economic slowdown that affected thegrowing automotive and the electronics industries. Sales decreased bymarkets. After decreasing 20% between 2008 and 2009, Atotech’s sales were €0.8 billion in 20092010, up 31% compared to 2008.2009. In this context of economic slowdown, Germany, a new production unit intended for the semiconductor market was inaugurated in 2010. Atotech successfully pursued its strategy designed to better differentiate its products through comprehensive service provided to its customers in terms of equipment, processes, design, chemical products and through the development of green, innovative technologies to reduce the environmental footprint. This strategy relies on global coverage provided by its technical centers located near customers. Finally, Atotech intends to continue to develop in Asia, which represents more than 50% of its global sales. (1) Based on publicly available information, consolidated sales.
50
Various factors, including certain events or circumstances discussed below, have affected or may affect TOTAL’s business and results. Exploration and production legal considerations TOTAL’s exploration and production activities are conducted in many different countries and are therefore subject to an extremely broad range of regulations. These cover virtually all aspects of exploration and production activities, including matters such as leasehold rights, production rates, royalties, environmental protection, exports, taxes and foreign exchange rates. The terms of the concessions, licenses, permits and contracts governing the Group’s ownership of oil and gas interests vary from country to country. These concessions, licenses, permits and contracts are generally granted by or entered into with a government entity or a state-owned company and are sometimes entered into with private owners. These arrangements usually take the form of concessions or production sharing agreements. The oil concession agreement remains the traditional model for agreements entered into with States: the oil company owns the assets and the facilities and is entitled to the entire production. In exchange, the operating risks, costs and investments are the oil company’s responsibility and it agrees to remit to the relevant State, usually the owner of the subsoil resources, a production-based royalty, income tax, and possibly other taxes that may apply under local tax legislation. 1. | Based on publicly available information. |
The production sharing contract (PSC) involves a more complex legal framework than the concession agreement: it defines the terms and conditions of production sharing and sets the rules governing the cooperation between the company or consortium in possession of the license and the host State, which is generally represented by a state-owned company. The latter can thus be involved in operating decisions, cost accounting and production allocation. The consortium agrees to undertake and finance all exploration, development and production activities at its own risk. In exchange, it is entitled to a portion of the production, known as “cost oil”, the sale of which should cover all of these expenses (investments and operating costs). The balance of production, known as “profit oil”, is then shared in varying proportions, between the company or consortium, on the one hand, and with the State or the state-owned company, on the other hand. In some instances, concession agreements and PSCs coexist, sometimes in the same country. Even though other contractual structures still exist, TOTAL’s license portfolio is comprised mainly of concession agreements. In all countries, the authorities of the host State, often assisted by international accounting firms, perform joint venture and PSC cost audits and ensure the observance of contractual obligations. In some countries, TOTAL has also signed contracts called “contracts for risk services”,“risked service contracts” which are similar to production sharing contracts, withcontracts. However, the main difference being thatprofit oil is replaced by risked monetary remuneration, agreed by contract, which depends notably on the repayment of expenses andfield performance. Thus, the compensation for services are establishedremuneration under the Iraqi contract is based on a monetary basis. Current contracts for risk services are backed by a compensation agreement (buyback), which allows TOTAL to receive part of the production equal to the cash value of its expenses and compensation.an amount calculated per barrel produced. Hydrocarbon exploration and production activities are subject to public authorizationsauthorities (permits), which can be different for each of these activities. These permits are granted for limited periods of time and include an obligation to return a large portion, in case of failure the entire portion, of the permit area at the end of the exploration period. TOTAL is required to pay income taxtaxes on income generated from its oil and gas production and sales activities under its concessions, or licenses.production sharing contracts and risked service contracts, as provided for by local regulations. In addition, depending on the country, TOTAL’s production and sale activities may be subject to a range of other taxes, fees and withholdings, including special petroleum taxes and fees. The taxes imposed on oil and gas production and sale activities may be substantially higher than those imposed on other businesses. The legal framework of TOTAL’s exploration and production activities, established through concessions, licenses, permits and contracts granted by or entered into with a government entity, a state-owned company or, sometimes, private owners, is subject to certain risks which in certain cases can diminish or challenge the protections offered by this legal framework. Industrial and environmental considerations TOTAL’s activities involve certain industrial and environmental risks which are inherent in the production of products that are flammable, explosive or toxic. Its activities are therefore subject to government regulations concerning environmental protection and industrial safety in most countries. More specifically, in Europe, TOTAL
51
operates industrial sites that meet the criteria of the European Union Seveso II directive for classification as high-risk sites. Some of TOTAL’s operated sites in the United States are subject to the Occupational Safety and Health Administration (“OSHA”) Process Safety Management of Highly Hazardous Materials, as well as other OSHA regulations. The broad scope of TOTAL’s activities, which include drilling, oil and gas production, on-site processing, transportation, refining and petrochemical activities, storage and distribution of petroleum products, and production of base chemical and specialty products, involve a wide range of operational risks. Among these risks are those of explosion, fire or leakage of toxic products. In the transportation area, the type of risk depends not only on the hazardous nature of the products transported, but also on the transportation methods used (mainly pipelines, maritime, river-maritime, rail, road), the volumes involved, and the sensitivity of the regions through which the transport passes (population density, environmental considerations).
Most of these activities also involve environmental risks related to emissions into the air, water or soil and the creation of waste, and also require environmental site remediation and closure and decommissioning after production is discontinued.
Certain branches or activities face specific risks. In Exploration & Production, there are risks related to the physical characteristics of an oil or gas field. These include eruptions of crude oil or of natural gas, discovery of hydrocarbon pockets with abnormal pressure, crumbling of well openings, leaks generating toxic risks and risks of fire or explosion. All these events could possibly cause injury or even death, damage or even destroy crude oil or natural gas wells as well as related equipment and other property, lead to a disruption of activity or cause environmental damage. In addition, since exploration and production activities may take
place on sites that are ecologically sensitive (tropical forest, marine environment, etc.), each site requires a risk-based approach to avoid or minimize the impact on human health, the related ecosystem and biodiversity.
TOTAL’s activities in the Chemicals segment and the Refining & Marketing division may also have health, safety and environmental risks related to the overall life cycle of the products manufactured, as well as raw materials used in the manufacturing process, such as catalysts, additives and monomer feedstocks. These risks can arise from the intrinsic characteristics of the products involved, which may, for example, be flammable, toxic, or result in long-term environmental impacts such as greenhouse gas emissions. Risk of facility contamination and off-site impacts may also arise from emissions and discharges resulting from processing or refining, and from recycling or disposing of materials and wastes at the end of their useful life.
Health, safety and environment regulations TOTAL is subject to extensive and increasingly strict health, safety and environmental (“HSE”) regulations in the European Union, the United States and worldwide. The following is a non-exhaustive list of HSE regulations and directives that affect TOTAL’s operations and products in the European Union: The Integrated Pollution Prevention and Control Directive (“IPCC”) provides for a cost/benefit framework used to comprehensively assess the environmental quality standards, prior environmental impacts, and potential additional emissions limits on, large industrial plants, including refineries and chemical sites. A proposed Industrial Emission Directive would replace a number of existing industrial emission directives, including the IPPC Directive and the Large Combustion Plant Directive, and could result in stricter emission limits on some of TOTAL’s facilities.
The Air Quality Framework Directive and related directives on ambient air quality assessment and management, among other things, limit emissions for sulphur dioxide, oxides of nitrogen, particulate matter, lead, carbon monoxide, benzene and ozone.
The Sulphur Content Directive limits sulphur in diesel fuel to 0.1% (since January 2008) and limits sulphur in heavy fuel oil to 1% (since January 2003), with certain exceptions for combustion plants provided that local air quality standards are met.
The Large Combustion Plant Directive, effective since 2008, limits certain emissions, including sulphur dioxide, nitrogen oxides and particulates, from large combustion plants.
| | | • | The Integrated Pollution Prevention and Control Directive (“IPPC”) provides for a cost/benefit framework used to comprehensively assess the environmental quality standards of, and prior environmental impacts and potential additional emissions limits on, large industrial plants, including refineries and chemical sites. The Industrial Emission Directive (IED), adopted in 2010, is expected to replace in 2013 a number of existing industrial emission directives, including the IPPC and the Large Combustion Plant Directive. It will progressively result in stricter emission limits on some of TOTAL’s facilities by making compulsory certain rules described in BREFs (Best available techniques REFerence documents), some of which are dedicated to specific industrial sectors. Certain BREFs are already published and will be revised (e.g., refining), and others will have to be developed. | | | • | The Air Quality Framework Directive and related directives on ambient air quality assessment and management, among other things, limit emissions for sulphur dioxide, oxides of nitrogen, particulate matter, lead, carbon monoxide, benzene and ozone. | | | • | The Sulphur Content Directive limits sulphur in diesel fuel to 0.1% (since January 2008) and limits sulphur in heavy fuel oil to 1% (since January 2003), with certain exceptions for combustion plants provided that local air quality standards are met. | | | • | The Large Combustion Plant Directive, effective since 2008, limits certain emissions, including sulphur dioxide, nitrogen oxides and particulates, from large combustion plants. It will be partly replaced in 2013 by the IED (see above). | | | • | Existing Directives controlling and limiting exhaust emissions from cars and other motor vehicles are expected to continue to become more stringent over time. Since 2009, a maximum sulphur content of 10 ppm is mandatory throughout the European Union. | | | • | The 1996 Major Hazards Directive (Seveso II) requires emergency planning, public disclosure of emergency plans, assessment of hazards and effective emergency management systems. A revision process has just begun. | | | • | The Framework Directive on Waste Disposal is intended to ensure that waste is recovered or disposed of without endangering human health and without using processes or methods that could unduly harm the environment. Numerous related directives regulate specific categories of waste. In November 2008, the Framework Directive on Waste Disposal was partially modified by the Directive on Waste 2008/98, which features more precise definitions and stronger provisions. Transposition of this Directive in France occurred in December 2010. | | | • | A number of Maritime Safety Directives were passed in the wake of the Erika and Prestige spills. Those regulations, found in the three Maritime Safety Packages, require that tankers have double hulls and that ship owners acquire improved insurance coverage, mandate improvements to traffic monitoring, accident investigations and in-port vessel inspection (Port State Control), and further regulate organizations that inspect and confirm conformity to applicable regulations (Classification Societies). The last package will enter into force in 2012. | | | • | Numerous Directives impose water quality standards based on the various uses of inland and coastal waters, including ground water, by setting limits on the discharges of many dangerous substances and by imposing information gathering and reporting requirements. |
Existing Directives controlling and limiting exhaust emissions from cars and other motor vehicles are expected to continue to become more stringent over time. Since 2009, a maximum sulphur content of 10 ppm is mandatory throughout the European Union.
The 1996 Major Hazards Directive (Seveso II) requires emergency planning, public disclosure of emergency plans, assessment of hazards and effective emergency management systems. EU Member States have implemented this Directive and provided for associated criminal sanctions.
The Framework Directive on Waste Disposal is intended to ensure that waste is recovered or disposed of without endangering human health and without using processes or methods that could unduly harm the environment. Numerous related directives regulate specific categories of waste. In November 2008, the Framework Directive on Waste Disposal was partially modified by the Directive on Waste 2008/98, which features more precise definitions and stronger provisions. This Directive is expected to completely enter into force and replace the Framework Directive and certain other waste related directives by 2010.
A number of Maritime Safety Directives were passed in the wake of the Erika spill. Recent regulations require that tankers have double hulls and that ship owners acquire improved insurance coverage, mandate improvements to traffic monitoring, accident investigations and in-port vessel inspection (Port State Control), and further regulate organizations that inspect and confirm conformity to applicable regulations (Classification Societies).
Numerous Directives impose water quality standards based on the various uses of inland and coastal waters, including ground water, by setting limits on the discharges of many dangerous substances and by imposing information gathering and reporting requirements.
Adopted and effective since 2003, a comprehensive Framework Water Directive has beenis progressively replacing numerous existing Directives with a comprehensive set of requirements, including additional regulations obligating member countries to classify all water courses according to their biological, chemical and ecological quality, and to completely ban the discharges of approximately thirty toxic substances by 2017. Numerous Directives regulate the classification, labellingand packaging of chemical substances and their preparation, as well as restrict and ban the use
| | | • | Numerous Directives regulate the classification, labelling and packaging of chemical substances and their preparation, as well as restrict and ban the use of certain chemical substances and products. On the one hand, the EU Parliament and Council adopted a new regulation in December 2008 on the Classification, Labelling and Packaging of Substances and Mixtures that incorporates the classification criteria and labelling rules agreed at the UN level (the so-called Globally Harmonised System of classification and labelling of Chemicals (GHS)). |
52
On the one hand, the EU Parliament and Council adopted a regulation in December 2008 (now in force) on the Classification, Labelling and Packaging of Substances and Mixtures that incorporates the classification criteria and labelling rules agreed at the UN level (the so-called Globally Harmonised System of classification and labelling of Chemicals (GHS)). On the other hand, the EU Member States, the European Commission and the European Chemical Agency are in the process of implementing the Regulation adopted in 2006 for the Registration, Evaluation and Authorization of Chemicals (REACH) that replaces or complements the existing rules in this area. REACH required the pre-registration of chemical substances manufactured and imported into the EU by December 1, 2008, to qualify for full registration under a phase in during the period2010-2018. The European Commission notified that the European Chemical Agency received more than 3 million notifications related to chemical substances classification at the end of phase 1, in December 2010. This regulation requires the registration and identification of chemical substances manufactured or imported in EU Member States, and can result in restrictions on the sales or uses of such substances. REACH imposes substantial costs on TOTAL’s operations in the European Union. | | | • | In March 2004, the European Union adopted a Directive on Environmental Liability. This Directive was transposed into EU Member State national legislations in 2007 and 2008, and in France in August 2008. The Directive seeks to implement a strict liability approach for damage to water resources, soils and protected species and habitats by authorized industrial activities. | | | • | Directives implementing the Aarhus Convention concerning public information rights and certain public participation rights in a variety of activities affecting the environment were adopted in January and May 2003, respectively, and implemented in most national EU legislations. | | | • | In November 2008, the European Union adopted a Directive on the protection of the environment through criminal law that obliges EU Member States to provide for criminal penalties in respect of serious infringements of EC law. EU Member States were to have transposed this Directive into their national legislation by December 26, 2010. | | | • | TOTAL’s facilities in the EU are also subject to extensive workplace safety regulations initiated by the European CommissionCommunity and defined and promulgated by each Member State. | | | • | With respect to the European Chemical Agency are in the process of implementing the Regulation adopted in 2006 for the Registration, Evaluation and Authorization of Chemicals (REACH) that replaces or complements the existing rules in this area. REACH required the pre-registration of chemical substances manufactured and imported into the EU by December 1, 2008, to qualify for full registration under a phase in during the period 2010-2018. As of December 2008, 165,000 substances had been pre-registered. This regulation is expected to impose substantial costs on TOTAL’s operationsclimate change issue, numerous initiatives in the European Union.Union are pending or currently being revised, including: |
In March 2004, the European Union adopted a Directive on Environmental Liability. This Directive was transposed into EU Member State national legislations in 2007 and 2008, and in France in August 2008. The Directive seeks to implement a strict liability approach for damage to water resources, soils and protected species and habitats by authorized industrial activities.
Directives implementing the Aarhus Convention concerning public information rights and certain public participation rights in a variety of activities affecting the environment were adopted in January and May 2003, respectively, and implemented in most national EU legislations.
In November 2008, the European Union adopted a Directive on the protection of the environment through criminal law that obliges EU Member States to provide for criminal penalties in respect of serious infringements of EC law. EU Member States must transpose this Directive into their national legislation by December 26, 2010.
TOTAL’s facilities in the EU are also subject to extensive workplace safety regulations initiated by the European Community and defined and promulgated by each Member State.
With respect to the climate change issue, numerous initiatives in the European Union are pending or currently being revised, including:
A September 2003 Directive implementing the Kyoto Protocol within the European Union
| | | | | – | A 2003 Directive implementing the Kyoto Protocol within the European Union established a systeman emissions trading scheme effective as of January 2005 for greenhouse gas (“GHG”) emissions quotas. On the basis of this directive, carbon dioxide emissions permits are then delivered. This system requires EUtrading scheme required Member States to prepare, under the supervision of the EU Commission, national emissionsallocation plans identifying a global amount of quotas to be shared and delivered for free by the governments to each industrial installation of specific sectors, in particular the energy one. On the basis of theseintensive installations that have to surrender quotas in respect to their annually verified carbon dioxide emissions permits are then distributed.emissions. In accordance with the 2009 revision of the aforementioned directive, a progressive quota auctioning mechanism is scheduled to be set up in 2013.2013 together with transitional Community-wide rules for harmonized free allocation up to a level based on benchmarks for sectors exposed to international carbon leakage. When this system iswill be established, TOTAL’s industrial facilities may incur capital and operating costs to comply with such legislation including the partial acquisition of emissions allowances. | | | – | At the UN summit in Copenhagen in December 2009, world leaders recognized the need to limit global temperature increases to two degrees Celsius above pre-industrial levels, but did not approve an international agreement on climate change, which could result in a future stringent reduction of GHG emissions in the European Union. | | | – | The first period of the Kyoto Protocol is reaching an end in 2012. Although debates occurred at the 2009 UN Summit in Copenhagen, no decision as to thefollow-up was made. The Cancun UN conference at the end of 2010 reaffirmed the principles of Kyoto, but did not result in the adoption of any new legally binding agreement with respect to the continuation of the Kyoto Protocol. The next conference is expected to be held in Durban in late 2011. |
At the UN summit in Copenhagen in December 2009, world leaders recognized the need to limit global temperature increases to two degrees celsius above pre-industrial levels, which could result in future directives limiting emissions of greenhouse gases in the European Union, or potential international agreements.
53
The Kyoto Protocol is reaching an end in 2012. Although debates occurred at the December 2009 UN Summit in Copenhagen, no decision as to the follow-up was made. The future conferences on the subject scheduled for 2010 could result in the adoption of international agreements with respect to the continuation of the Kyoto Protocol.
The Climate Action and Renewable Energy Package commits EU Member States to reduce overall emissions to at least 20% below 1990 levels by 2020, and requires Member States to improve energy efficiency and increase renewable energy usage. This legislation is likely to affect TOTAL’s operations in the future.
The 2009 Directive on Carbon Capture and Storage (CCS) has been adopted and is currently being transposed into Member States’ national legislations. This legal framework forms the basis for developing CCS projects that are expected to serve as one of the most valuable solutions for the reduction of carbon dioxide emissions. Such projects are likely to have technical and financial impacts.
| | | | – | The Climate Action and Renewable Energy Package commits EU Member States to reduce overall emissions to at least 20% below 1990 levels by 2020, requires Member States to improve energy efficiency and increase renewable energy usage. These latter issues are expected to be further addressed in 2011 in a way likely to affect TOTAL’s operations in the future. | | | – | The 2009 Directive on Carbon Capture and Storage (CCS) was transposed in France in 2010. This legal framework forms the basis for developing CCS projects that are expected to serve as one of the most valuable solutions for the reduction of carbon dioxide emissions. Such regulations will have technical and financial impacts, including on TOTAL’s projects. | | | – | In France, the provisions of the 2010 financial bill establishing a carbon tax was deemed unconstitutional and referred back to the French government, which is currently
| | preparing a new proposal. Should a carbon tax similar to the one in the 2010 financial bill be adopted, TOTAL’s industrial facilities may incur capitalestablishing a carbon tax was deemed unconstitutional and operating costs.
referred back to the French government, which did not make a new proposal. The provisions of the 2011 financial bill made subject to payment a minor part of GHG emission allowance delivery for 2011 and 2012, which was initially allocated for free in the national plan of2008-2012. |
With respect to biodiversity issues, this subject is increasingly taken into consideration. Following the 2010 Nagoya summit, the UN’s 65th General Assembly decided to form the IPBES (Intergovernmental Science-Policy Platform on Biodiversity) to share knowledge and future policies on biodiversity and ecosystem services. In the United States, where TOTAL’s operations are less extensive than in Europe, TOTAL is also subject to significant HSE regulations at both the state and federal levels. Of particular relevance to TOTAL’s lines of business are: The Clean Air Act and its regulations, which require, among other measures: stricter phased-in fuel specifications and sulphur reductions; enhanced emissions controls and monitoring at major sources of volatile organic compounds, nitrogen oxides, and other designated hazardous and non-hazardous air pollutants; stringent pollutant emission limits; construction and operating permits for major air emission sources at chemical plants, refineries, marine and distribution terminals and other facilities; and risk management plans for the handling and storage of hazardous substances.
The Clean Water Act, which regulates the discharge of wastewater and other pollutants from both onshore and offshore operations and, among other measures, requires industrial facilities to obtain permits for most wastewater and surface water discharges, install control equipment and treatment systems, implement operational controls, and preventative measures, including spill prevention and control plans and practices to control storm water runoff.
The Resource Conservation and Recovery Act (RCRA), which regulates the generation, storage, handling, treatment, transportation and disposal of hazardous waste and imposes corrective action requirements on regulated facilities requiring investigation and remediation of potentially contaminated areas at these facilities.
The Comprehensive Environmental Response, Compensation, and Liability Act (also known as CERCLA or Superfund), under which waste generators, former and current site owners and operators, and certain other parties can be held jointly and severally liable for the entire cost of remediating active, abandoned or non-operating sites contaminated by releases of hazardous substances regardless of fault or the amount or share of hazardous substances sent by a party to a site. The U.S. Environmental Protection Agency (“EPA”) has authority under Superfund to order responsible parties to clean up contaminated sites and may seek recovery of the government’s response costs from responsible parties. States have similar legal authority to compel site
| | | • | The Clean Air Act and its regulations, which require, among other measures: stricter phased-in fuel specifications and sulphur reductions; enhanced emissions controls and monitoring at major sources of volatile organic compounds, nitrogen oxides, and other designated hazardous and non-hazardous air pollutants; GHG regulation; stringent pollutant emission limits; construction and operating permits for major air emission sources at chemical plants, refineries, marine and distribution terminals and other facilities; and risk management plans for the handling and storage of hazardous substances. | | | | • | The Clean Water Act, which regulates the discharge of wastewater and other pollutants from both onshore and offshore operations and, among other measures, requires industrial facilities to obtain permits for most wastewater and surface water discharges, install control equipment and treatment systems, implement operational controls, and preventative measures, including spill prevention and control plans and practices to control storm water runoff. | | | • | The Resource Conservation and Recovery Act (RCRA), which regulates the generation, storage, handling, treatment, transportation and disposal of hazardous waste and imposes corrective action requirements on regulated facilities requiring investigation and remediation of potentially contaminated areas at these facilities. | | | • | The Comprehensive Environmental Response, Compensation, and Liability Act (also known as CERCLA or Superfund), under which waste generators, former and current site owners and operators, and certain other parties can be held jointly and severally liable for the entire cost of remediating active, abandoned or non-operating sites contaminated by releases of hazardous substances regardless of fault or the amount or share of hazardous substances sent by a party to a site. The U.S. Environmental Protection Agency (“EPA”) has authority under Superfund to order responsible parties to clean up contaminated sites and may seek recovery of the government’s response costs from responsible parties. States have similar legal authority to compel site investigations and cleanups and to recover costs from responsible parties. The U.S. government and states may also sue responsible parties for injuries to natural resources (e.g., rivers and wetlands) arising from contamination. | | | • | National and international maritime oil spill laws, regulations and conventions, including the Oil Pollution Act of 1990, which imposes significant oil spill prevention requirements, spill response planning obligations, ship design requirements (including phased in double hull requirements for tankers), operational restrictions, spill liability for tankers and barges transporting oil, offshore oil platform facilities and onshore terminals and sets up an oil liability spill fund paid for by taxes on imported and domestic oil. | | | • | Although no substantive legislation has yet been passed following the April 2010 Deep Water Horizon accident in the Gulf of Mexico, many legislative proposals have been proposed and more will likely follow. New regulations have been issued regarding technical and safety issues. Amendments related to |
54
National and international maritime oil spill laws, regulations and conventions,
| | | liability under OPA 90 and the Clean Water Act also may be forthcoming. |
Similar initiatives are expected in Europe. The European Commission is considering amendments to several directives, including to the Oil Pollution Act of 1990, which imposes significant oil spill prevention requirements, spill response planning obligations, ship design requirements (including in certain instances double hull requirements), operational restrictions, spill liability for tankers and barges transporting oil, offshore oil platform facilities and onshore terminals and sets up an oil liability spill fund paid for by taxes on imported and domestic oil.Environmental Impact Assessment Directive, Environmental Liability Directive or Seveso Directive. Other significant U.S. environmental legislation includes the Toxic Substances Control Act, which regulates the development, testing, import, export and introduction of new chemical products into commerce and the Emergency Planning and Community Right-to-Know Act, which requires emergency planning and spill notification as well as public disclosure of chemical usage and emissions. TOTAL facilities in the United States are also subject to extensive workplace safety regulations promulgated by OSHA. Most notable among OSHA regulations is the Process Safety Management of Highly Hazardous Chemicals (PSM), a comprehensive regulatory program that requires major industrial sources, including petroleum refineries and chemical manufacturing facilities, to undertake significant hazard assessments during the design of new industrial processes and during modifications to existing processes.processes, as well as a comprehensive and continual monitoring and management process for these chemicals. In 2009, the EPA issued a finding that greenhouse gas (“GHG”)GHG emissions endanger public health and the environment. This endangerment finding would allowallows the EPA to regulate these emissions under the Clean Air Act. Based on its endangerment finding, the EPA issued final rules in 2010 that apply the federal Clean Air Act’s Prevention of Significant Deterioration and Title V operating permit programs to stationary sources of GHGs. GHG permitting requirements apply to certain stationary sources in two steps beginning on January 2, 2011, with the largest industrial facilities first to become subject to permitting. The EPA has also proposed to regulate GHG emissions from automobiles and new or existing industrial facilities and plansintends to issue future rulemakings, beyond 2011, to phase in permitting of smaller industrial sources. Depending upon the outcome of legal challenges and on the content of future GHG regulations in 2010. These proposed rules may result in limits being placed on GHG emissions from petroleum refineries, chemical plants and other large industrial sources, including TOTAL’s facilitiesby the EPA, TOTAL subsidiaries in the United States.States may incur additional capital and operating costs to comply with control technologyand/or facility upgrade requirements for reducing GHG emissions. In response to public concerns over the effects of climate change, a number of legislative initiatives are currently pendinghave also been proposed in the U.S. Congress, including the American Clean Energy and Security Act (ACES), passed by the U.S. House of Representatives in June 2009, and draft legislation in the U.S. Senate that contain requirements intendedseeking to limit GHG emissions from industrial sources either through“cap-and-trade” market mechanisms or through “cap-and-trade” market mechanisms.other means. To date these efforts have not been successful. Should a GHGcap-and-trade system, carbon tax or other GHG regulation become law in the future, industrial facilities owned by TOTAL subsidiaries in the United States may incur additional capital and operating costs to comply with such legislation including the acquisition of emissions allowances to continue operating. Proceedings instituted by governmental authorities are pending or known to be contemplated against certain U.S.-based subsidiaries of TOTAL under applicable environmental laws that could result in monetary sanctions in excess of $100,000. No individual proceeding is, nor are the proceedings as a group,whole, expected to have a material adverse effect on TOTAL’s consolidated financial position or profitability. Prior to developing their activities and ongoing during their operation, business units evaluate the related industrial and environmental risks, taking into account regulatory requirements in the countries where these activities are located as well as recognized and generally accepted good engineering practices. On sites with significant technological risks, Process Hazard Analyses are performed on all new processes and on existing processes where significant changes are proposed.processes. These analyses are generally re-evaluated every five years.years and updated when significant changes are proposed on existing installations. To ensure risks are appropriately analyzedstandardize and monitored,strengthen risk management, TOTAL has developed a Group-wideshared risk management approach, which is being implemented progressively throughout the sites it operates. On the basis of these analyses, relevant sites are finalizinghave drafted safety management plans and emergency plans in the event of accidents. InFor example, regarding its petrochemical business in the United States, TOTAL is implementing a Process Safety Management Improvement Plan (PSMIP). In France, all the sites that meet the criteria of the European Union Seveso II directive are developingcontributing to drafting Risk Management Plans pursuant to the French law of July 30, 2003. Each of these plans will introduce various urban planning measures to reduce risks to urban environments surrounding industrial sites that are considered as high risk according to the criteria of the Seveso II directive criteria.directive. French administrative authorities are preparing such plans while taking into account input from site operators and neighboring residents. Following the blow-out on the Macondo well in the Gulf of Mexico, TOTAL created three Task Forces in order to analyze risks and make recommendations. In Exploration & Production, Task Force No. 1 is responsible
55
for reviewing the safety aspects of deep offshore drilling operations (architecture of wells, design of blow-out preventers, training of personnel based on lessons learned from the serious accidents that occurred recently in the industry). The two other Task Forces are described in the “Risk management” section hereafter. Similarly, environmental impact studies are carried out prior to any industrial development through a thoroughan initial site analysis, taking into account any special sensitivity as well as developing plans to prevent and reduce the impact of accidents. These studies also take into account the health impact of such operations on the local population, based on a shared methodology.population. In countries where prior administrative authorization and supervision is required, projects are not undertaken without the authorization of the relevant authorities and are developed according to studies provided to the studies the authorities are provided with. authorities. For new products,substances, risk characterizations and evaluations are carried out. Furthermore, life cycle analyses for related risks are performed on certain products to study all the stages of a product’s life cycle from its conception until the end of its useful life. TOTAL’s entities actively monitor regulatory developments to comply with local and international rules and standards for the evaluation and management of industrial and environmental risks. In case of operations being stopped, the Group’s environmental contingencies and asset retirement obligations are addressed in “Asset retirement obligation” and “Provisions for environmental contingencies” in Note 19 to the Consolidated Financial Statements. Future expenses related to asset retirement obligations are accounted for in accordance with the principles described in paragraph Q of Note 1 to the Consolidated Financial Statements. Risk management control measures involve the design of equipment design,and structures to be built, the reinforcement of safety devices, the design of structures to be built and the protection against the consequences of environmental events. TOTAL seeks to minimize industrial and environmental risks that are inherent to its operations and, to this end, has developed efficient organizations as well as quality, safety and environmental management systems. The Group is also targeting the certification for or assessment of its management systems (including International Safety Rating System, ISO 14001, European Management and Audit Scheme) and conducts thoroughdetailed inspections and audits, trains appropriate personnel, heightens awareness of all the parties involved and implements an active investment policy. More specifically, following up on the Group’s2002-2005 plan, and2006-2009 plans, an action plan was defined by the Group for the 2006-20092010-2013 period that focusedfocuses on two initiatives for improvement: reducing the frequency and severity of on-the-jobwork-related accidents, and strengthening the management of technological risks. The results related to reducingon-the-job accidents are in line with the goals, set by the plan, with a significant decrease in the rate of accidents (with or without time-lost)time-loss) per million hours worked by more than 75%nearly 80% between the end of 2001 and the end of 2009.2010. In terms of technological risks, this plan’s initiatives include specific organization and behavioral plans as well as plans to minimize risks at the source and to increase safety for people and for equipment use.equipment. Several environmental action plans have been implemented for different activities of the Group covering periods up to 2012.Group. These plans are designed to improve environmental performance, particularly regarding the use of natural resources, air and water pollution, waste production and treatment, and pollution and site decontamination. They also containinclude quantified objectives to reduce, most notably, greenhouse gas emissions, water pollution as well as sulphur dioxide emissions and to improve energy efficiency. As part of its efforts to combat climate change and reduce greenhouse gases,gas emissions, the Group committed to reducing gas flaring at its Exploration & Production sitessites. The Group intends to reduce gas flared by 50% by 2014 compared to 50% of the 2005 level. 2005. By the end of 2012, the Group intends to obtain ISO 14001 certification for all of its sites that it considers particularly important to the environment according to criteria updated in 2009. As of today, 89%At year-end 2010, 92% of such sites are ISO 14001-certified, representing14001-certified. A total of more than 280 of the Group’s sites worldwide.worldwide are certified. These activities are monitored through periodic and coordinated reporting by the Group’s entities. In addition to Task Force No. 1 created following the blow-out on the Macondo well in the Gulf of Mexico that is described above, TOTAL has set two other internal Task Forces: | | | • | Task Force No. 2, coordinated with the Global Industry Response Group (GIRG) created by the OGP (International Association of Oil and Gas Producers) is responsible for studyingdeep-offshore oil capture and containment operations in case a pollution event occurs in deep waters. The Group is also a member of the Coordination Group and other GIRG working |
56
| | | groups that pay special attention to prevention and procedures for and time of response. |
| | | • | Task Force No. 3 relates to plans to fight accidental spills in order to strengthen the Group’s ability to respond to a major accidental pollution, such as a blow out or a total loss of containment from an FPSO (Floating Production, Storage and Offloading facility). Although the current response to accidental oil spills implemented in the industry proves to be efficient globally, TOTAL pays special attention to technical changes including those related tosub-sea dispersants that were recently used in the Gulf of Mexico. The Group is jointly reviewing these issues with the OGP and the IPIECA (Global oil and gas association for environmental and social issues). |
TOTAL has response plans and procedures in place to deal with the environmental impact that would occur in the event of an oil spill or leak from its offshore operations. These response plans and procedures are specific to each of TOTAL’s affiliates, and are consistent with a global plan at the Group level. In order to minimize the risk and extent of environmental impact in the event of an oil spill or leak, TOTAL periodically reviews and regularly tests these emergency plans and procedures. Each affiliate or operational site of TOTAL is required to have in place an emergency response plan taking into account its specific activities (e.g., drilling, production, transport) and risks. Moreover, whenever an affiliate’s activities expose it to the risk of an oil spill, it has one or more oil spill contingency plan(s) and blowout contingency plan(s) to address any uncontrolled release. These specific response plans take into account the organization adopted at all levels (site, affiliate, division and Group entities.level) for managing any emergency or crisis situation. They are generally designed to cover, among others, the following matters: | | | • | listing all pertinent data and characteristics that may be useful in appraising the context (local, geographical, environmental, geological, etc., as the case may be); | | | • | conducting risk analysis to identify the parameters, methods and tools necessary for evaluating the situation and its probable development, together with a definition of the appropriate measures or solutions; | | | • | detailing the actions to be taken in response to the relevant situation(s), emphasizing the initial emergency actions; | | • | stipulating the interfaces and liaisons required for the specific situation(s) under consideration; and | | | • | identifying the emergency/backup means and resources potentially necessary, and how they are to be mobilized. |
At the Group level, TOTAL has set up the alert scheme PARAPOL (Plan to mobilize Resources Against Pollution) to facilitate crisis management and assist with mobilizing resources in case of pollution. PARAPOL is made available to TOTAL’s affiliates and its main aim is to facilitate access to both internal and external response resources in the event of a pollution of marine, coastal or inland waters, without geographical restriction. The PARAPOL Procedure describes the organization of the emergency response team’s efforts, which is led by a PARAPOL Coordinator who manages or monitors the incident in order to access additional resources, both in terms of equipment and response experts. PARAPOL allows the mobilization of Group experts previously cleared to provide specific assistance to emergency response teams. Furthermore, TOTAL and its affiliates are currently registered with certain external oil spill cooperatives able to provide expertise, resources and equipment in all geographic areas where TOTAL conducts its activities, including in particular: Oil Spill Response, CEDRE, and Clean Caribbean and Americas. The Group believes that accordingit is impossible to its current estimates,guarantee that the contingencies or liabilities related to the above mentioned health, safety and environmental concerns wouldwill not have a material impact on its business, assets and liabilities, consolidated financial situation, its cash flow or its income. Due toincome in the nature of such concerns, however, it is impossible to predict whether additional future commitments or liabilities could have a material adverse effect on the Group’s activities.future. Like many other industrial groups, TOTAL is affected by reports of occupational diseases caused by asbestos exposure. The circumstances described in these reports generally concern activities prior to the beginning of the 1980s, long before the adoption of more comprehensive bans on the new installation of asbestos-containing products in most of the countries where the Group operates (January 1, 1997, in France). The Group’s various businesses are not particularly likely to lead to significant exposure to asbestos-related risks, since this material was generally not used in manufacturing processes, except in limited cases. The main potential sources of exposure are related to the use of certain insulating components in industrial equipment. These components are being gradually eliminated from the Group’s equipment through asbestos-elimination plans
57
that have been underway for several years. However, considering the long period of time that may elapse before the harmful results of exposure to asbestos arise (up to 40 years), TOTAL anticipates that other reports may be filed in the years to come. Asbestos-related issues have been subject to close monitoring in all the Group’s business units. As of December 31, 2009,2010, the Group estimates that the ultimate cost of all asbestos-related claims paid or pending is not likely to have a material effect on the financial situation of the Group. Oil and gas exploration and production operations Oil and gas exploration and production require high levels of investment and are associated with particular risks and opportunities. These activities are subject to risks related specifically to the difficulties of exploring underground, to the characteristics of hydrocarbons and to the physical characteristics of an oil or gas field. Of risks related to oil and gas exploration, geologic risks are the most important. For example, exploratory wells may not result in the discovery of hydrocarbons, or may result in amounts that would be insufficient to allow for economic development. Even if an economic analysis of estimated hydrocarbon reserves justifies the development of a discovery, the reserves can prove lower than the estimates during the production process, thus adversely affecting the economic development. Almost all the exploration and production operations of TOTAL are accompanied by a high level of risk of loss of the invested capital due to the risks related to economic or political factors detailed hereafter. It is impossible to guarantee that new resources of crude oil or of natural gas will be discovered in sufficient amounts to replace the reserves currently being developed, produced and sold to enable TOTAL to recover the capital it has invested. The development of oil and gas fields, the construction of facilities and the drilling of production or injection wells require advanced technology in order to extract and exploit fossil fuels with complex properties over several decades. The deployment of this technology in such a difficult environment makes cost projections uncertain. TOTAL’s operations can be limited, delayed or cancelled as a result of numerous factors, such as administrative delays, particularly in terms of the host states’ approval processes for development projects, shortages, late delivery of equipment and weather conditions, including the risk of hurricanes in the Gulf of Mexico. Some of these risks may also affect TOTAL’s projects and facilities further down the oil and gas chain. Economic or political factors The oil sector is subject to domestic regulations and the intervention of governments or state-owned companies in such areas as: the award of exploration and production interests;
authorizations by governments or by a state-controlled partner, especially for development projects, annual programs or the selection of contractors or suppliers;
| | | • | the award of exploration and production interests; | | • | authorizations by governments or by a state-controlled partner, especially for development projects, annual programs or the selection of contractors or suppliers; | | • | the imposition of specific drilling obligations; | | • | environmental protection controls; | | • | control over the development and abandonment of a field causing restrictions on production; | | • | calculating the costs that may be recovered from the relevant authority and what expenditures are deductible from taxes; | | • | cases of expropriation or reconsideration of contractual rights; and | | • | cases of nationalization. |
the imposition of specific drilling obligations;
environmental protection controls;
control over the development and abandonment of a field causing restrictions on production;
calculating the costs that may be recovered from the relevant authority and what expenditures are deductible from taxes; and
possible, though exceptional, nationalization, expropriation or reconsideration of contractual rights.
The oil industry is also subject to the payment of royalties and taxes, which may be high compared with those imposed with respect to other commercial activities and which may be subject to material modifications by the governments of certain countries. Substantial portions of TOTAL’s oil and gas reserves are located in certain countries whichthat may be considered as politically and economically unstable. These reserves and the related operations are subject to certain additional risks, including: the establishment of production and export quotas;
the compulsory renegotiation of contracts;
| | | • | the establishment of production and export quotas; | | • | the compulsory renegotiation of contracts; | | • | the expropriation or nationalization of assets; | | • | risks relating to changes of local governments or resulting changes in business customs and practices; | | • | payment delays; | | • | currency exchange restrictions; | | • | depreciation of assets due to the devaluation of local currencies or other measures taken by governments that might have a significant impact on the value of activities; and | | • | losses and decreased activity due to armed conflicts, civil unrest or the actions of terrorist groups. |
the expropriation or nationalization of assets;
risks relating to changes of local governments or resulting changes in business customs and practices;
currency exchange restrictions;
depreciation of assets due to the devaluation of local currencies or other measures taken by governments that might have a significant impact on the value of activities; and
losses and impairment of operations due to armed conflicts, civil unrest or the actions of terrorist groups.
TOTAL, like other major international oil companies, has a geographically diverse portfolio of reserves and operational sites, which allows it to conduct its business and financial affairs so as to reduce its exposure to such political and economic risks. However, there can be no assurance that such events will not adversely affect the Group.
58
Business Activities in Cuba, Iran, Sudan and Syria The U.S. Department of State has identified Cuba, Iran, Sudan and Syria as state sponsors of terrorism. Provided in this section is certain information relating to TOTAL’s activities in these jurisdictions.
For more information on U.S. and Other Legal RestrictionsIn 1996, the United States adopted legislation implementing sanctions against non-U.S. companies doing business in Iran and Libya (the Iran and Libya
Sanction Act, referredother legal restrictions relevant to as “ILSA”), which in 2006 was amended to concern only business in Iran (then renamed the Iran Sanctions Act, referred to as “ISA”).
The ISA is set to expire in December 2011. Pursuant to this statute, the President of the United States is authorized to initiate an investigation into the activities of non-U.S. companies in Iran and the possible imposition of sanctions (from a list that includes denial of financing by the U.S. Export-Import Bank, limitations on the amount of loans or credits available from U.S. financial institutions and prohibition of U.S. federal procurements from sanctioned persons) against persons found, in particular, to have knowingly made investments of $20 million or more in any 12-month period in the petroleum sector in Iran. In May 1998, the U.S. government waived the application of sanctions for TOTAL’s investment in the South Pars gas field. This waiver, which has not been modified since it was granted, does not address TOTAL’s otherour activities in Iran, although TOTAL has not been notified of any related sanctions.
In November 1996, the Council of the European Union adopted regulations which prohibit TOTAL from complying with any requirement or prohibition based on or resulting directly or indirectly from certain enumerated legislation, including the ILSA (now ISA). It also prohibits TOTAL from having its waiver for South Pars extended to other activities.
In each of the years since the passage of the ILSA and until 2007, TOTAL made investments in Iran in excess of $20 million (excluding the investments made as part of the development of South Pars). Since 2008, TOTAL’s position has consisted essentially in being reimbursed for its past investments as part of buyback contracts signed between 1995 and 1999 with respect to permits on which the Group is no longer the operator. In 2009, TOTAL’s production in Iran represented approximately 0.4% of the Group’s worldwide production. TOTAL does not believe that its operations in Iranthese jurisdictions, see “Item 3. Risk Factors — We have a material impact on the Group’s results.
In the future, TOTAL may decide to invest amounts in excess of $20 million per year in Iran. To our knowledge, sanctions under the ISA have not been imposed on any non-U.S. oil and gas company which has investments in Iran. However, TOTAL cannot predict whether the U.S. government will take any action under the ISA with respect to its previous or possible future activities in Iran. It is possible, however, that the United States may determine that these or other activities constitute activity prohibited by the ISA and will subject TOTAL to sanctions. TOTAL does not believe that enforcement of the ISA against TOTAL, including the imposition of the maximum sanctions under the current version of the ISA, would have a material adverse effect on its results of operations or financial condition, although it could result in reputational harm.
However, the U.S. House of Representatives and the Senate have recently passed billscertain countries which if adopted, would expand the scope of the ISA and could restrict
the President’s ability to grant waivers. The proposed legislation would, among other things, require imposition of specific sanctions against companies that supply refined petroleum products to Iran, contribute to Iran’s ability to maintain or expand domestic production or engage in certain related conduct. The sanctions to be imposed against violating firms would generally prohibit transactions in foreign exchange by the sanctioned company, prohibit any transfers of credit or payments between, by, through or to any financial institution to the extent that such transfers or payments involve any interest of the sanctioned company, and require blocking of any property of the sanctioned company that isare subject to the jurisdiction of the United States. The bills would also generally forbid federal procurements fromU.S. and assistance to non-U.S. companies that engage in sanctions-triggering actions.
TOTAL is closely monitoring legislativeEU sanctions and other developments in the United States in order to determine whether its limitedour activities in Iran could subject itlead to application of either current or any future ISA sanctions. sanctions under relevant U.S. and EU legislation”.
Cuba In the event the proposed legislation were adopted in its current form, such new legislation could potentially have a material adverse effect on TOTAL.France and the European Union have adopted measures, based on United Nations Security Council resolutions, which restrict the movement of certain individuals and goods to or from Iran as well as certain financial transactions with Iran, in each case when such individuals, goods or transactions are related to nuclear proliferation and weapons activities or likely to contribute to their development. As currently applicable, the Group believes that these measures are not applicable to its activities and projects in this country.
The United States also imposes sanctions based on the United Nations Security Council resolutions described above, as well as broad and comprehensive economic sanctions, which are administrated by the U.S. Treasury Department’s Office of Foreign Assets Control (referred to as “OFAC”). These OFAC sanctions generally apply to U.S. persons and activities taking place in the United States or that are otherwise subject to U.S. jurisdiction. Sanctions administered by OFAC target Cuba, Iran, Myanmar (Burma), Sudan and Syria. TOTAL does not believe that these sanctions are applicable to any of its activities in these countries.
In addition, many U.S. states have adopted legislation requiring state pension funds to divest themselves of investments in any company with active business operations in Iran or Sudan. Recently, there have been similar initiatives by state insurance regulators relating to investments by insurance companies in companies doing business with the Iranian oil and gas, nuclear and defense sectors. TOTAL has no business operations in Sudan and, to date, has not made any significant
investments or industrial investments there. The Genocide Intervention Network (formerly known as Sudan Divestment Task Force) report states that TOTAL should be regarded as “inactive” in Sudan by the U.S. states that have adopted such divestment legislation. On December 31, 2007, the U.S. Congress adopted the Sudan Accountability and Divestment Act, which supports these state legislative initiatives. Similar legislation is pending in the U.S. Congress that supports state legislative initiatives regarding Iran. If TOTAL’s operations in Iran or Sudan were determined to fall within the prohibited scope of these laws, and TOTAL were to not qualify for any available exemptions, certain U.S. state pension funds holding interests in TOTAL may be required to sell their interests. If significant, sales resulting from such laws and/or regulatory initiatives could have an adverse effect on TOTAL’s share price.
Activities in Cuba, Iran, Sudan and Syria
Provided below is certain information on TOTAL’s activities in Cuba, Iran, Sudan and Syria.
Cuba
In 2009,2010, TOTAL had limited marketing activities for the sale of specialty products to non-state entities in Cuba and paid taxes on such activities. In addition, TOTAL’s Trading & Shipping division purchased hydrocarbons pursuant to spot contracts from a state-controlled entity for approximately €83 million.
TOTAL’s Exploration & Production division has been active in Iran through buyback contracts. Under such contracts, the contractor is responsible for and finances development operations. Once development is completed, operations are handed over to the national oil company, which then operates the field. The contractor receives payments in cash or in kind to recover its expenditures as well as a remuneration based on the field’s performance. Furthermore, upon the national oil company’s request, a technical services agreement may be implemented in conjunction with a buyback contract to provide qualified personnel and services until full repayment of all amounts due to the contractor. To date, TOTAL has entered into such buyback contracts with respect to the development of four fields: Sirri, South Pars 2 & 3, Balal and Dorood. For all of these contracts, development operations have been completed and TOTAL retains no operational responsibilities. In addition, aA technical services agreement exists with respect tofor the Dorood field.field expired in December 2010. As TOTAL is no longer involved in the operation of these fields, TOTAL has no information on the production from these fields. Some payments are yet to be reimbursed to TOTAL with respect to South Pars 2 & 3, Balal and Dorood. In 2009,2010, TOTAL’s production in Iran, corresponding to such payments in kind, was approximately 82 kboe/d. No royalties or fees are paid by the Group in connection with these buyback and service contracts. In 2009,2010, TOTAL made non-material payments to the Iranian administration with respect to certain taxes and social security. With respect to TOTAL’s Refining & Marketing division’s activities in Iran, Beh Total, a company held 50/50 by Behran Oil and Total Outre-Mer, a subsidiary of the Group, produces and markets small quantities of lubricants (16,000 tons) for sale to domestic consumers in Iran. In 2009,2010, revenue generated from Beh Total’s activities was €27.4 €34.9 million and cash flow was €5.6 €5.9 million. Beh Total paid €605,000 €800,000 in taxes. TOTAL does not own or operate any refineries or chemicals plants in Iran. In 2010, Beh Total paid €5.6 million of dividends for fiscal year 2009 (share of TOTAL: €2.8 million). In 2010, TOTAL’s Trading & Shipping division purchased in Iran pursuant to a mix of spot and term contracts approximately fifty-eightforty-five million barrels of hydrocarbons from state-controlled entities for approximately €2.5 billion. €Sudan2.6 billion, and paid to a state-owned entity approximately€24 million pursuant to shipping contracts.Sudan
TOTAL holds an interest in Block B in Southern Sudan through a 1980 Exploration and Production Sharing Agreement (EPSA). Operations were voluntarily suspended in 1985 because of escalating security concerns, but the company maintained its exploration rights. The Group’s initial interest was 32.5%. Despite the withdrawal of a partner, TOTAL does not intend to increase its interest above its initial level. Consequently, the Group has entered into negotiations with new partners to transfer the former partner’s interests for which the Group financially carries a share. The EPSA was revised, effective December 21, 2004,January 1, 2005, to provide that the parties (the Government of Sudan and the consortium partners) would mutually agree upon a resumption date when the petroleum operations could be safely undertaken in the contract area. Such resumption date would mark the starting point of the Group’s work obligations as foreseen in the contract. A joint decision on the resumption date has not yet been taken.made. Pursuant to the EPSA in 2009,2010, TOTAL, paid toon behalf of the Government of Sudan an annual surface rental fee of approximately $200,000 andconsortium, disbursed nearly $3$2.2 million as scholarship bonus,scholarships, social development contributioncontributions and contributioncontributions to the construction of social infrastructures,infrastructure, schools and water wells along with non-governmental organizations and other stakeholders involved in Southern Sudan. As of March 23, 2011, TOTAL remains inactive in Sudan. Considering the current situation in Sudan, TOTAL will continue to monitor political changes and discuss with all stakeholders that are present in the country. If TOTAL were to resume its activities in Southern Sudan, it would make sure to do so in strict compliance with applicable national, European and international laws and regulations, as well as with the Group’s Code of Conduct and Ethics
59
Charter. Within its scope of operationsRegarding humanitarian activities, TOTAL has entered into agreements with NGOs and authority, the Group is committed to upholding human rightsprovides financial and fundamental freedoms, including social, economictechnical support for educational, health and cultural rights, and the rights and interests of local residents and minorities. In particular, the Group is studying the situation with non-governmental organizations (NGOs) and stakeholders involvedinfrastructure projects in Southern Sudan and conducting socio-economic programs adapted to the needs of the local population.Sudan. In Syria, in 2009,2010, TOTAL had two contracts relating to oil and gas Exploration & Production activities: a Production Sharing Agreement entered into in 1988 (“PSA 1988”) for an initial period of twenty years and renewed at the end of 2008 for an additional 10-year period, and the Tabiyeh Gas Project risked Service Contract (the “Tabiyeh contract”) effective from the end of October 2009. TOTAL owns 100% of the rights and obligations under PSA 1988, and is operating on various oil fields in the Deir Ez Zor area through a dedicated non-profit operating company owned equally by the Group and the state-owned Syrian Petroleum Company (“SPC”). The main terms of PSA 1988 are similar to those normally used in the oil and gas industry. The Group’s revenues derived from PSA 1988 are made up of a combination of “cost oil” and “profit oil”. “Cost oil” represents the reimbursement of operating and capital expenditures and is accounted for in accordance with normal industry practices. The Group’s share of “profit oil” depends on the total annual production level. TOTAL receives its revenues in cash payments made by SPC. TOTAL pays to the state-owned Syrian company SCOT a transportation fee equal to $2/ blb for the oil produced in the area, as well as non-material payments to the Syrian government related to PSA 1988 for such items as withholding taxes and Syrian social security. The Tabiyeh contract may be considered as an addition to PSA 1988 as production, costs and revenues for the oil and part of the condensates coming from the Tabiyeh field are governed by the contractual terms of PSA 1988. This project is designed to enhance liquids and gas output from the Tabiyeh field through the drilling of “commingled” wells and through process modifications in Deir Ez Zor Gas Plant operated by the Syrian Gas Company. TOTAL is financing and implementing the Tabiyeh Gas Project and operates the Tabiyeh field. In 2010, technical production for PSA 1988 (for full year 2009) and the Tabiyeh contract (since October 2009, the effective date of the contract) taken together amounted to 3674 kboe/d, of which 2039 kboe/d were accounted for as the Group’s share of production. The amount identified as technical production under the agreements, minus the amount accounted for as the Group’s share of production, does not constitute the total economic benefit accruing to Syria under the terms of the agreements since Syria retains a margin on a portion of the Group’s production and receives certain production taxes. In 2009,2010, through its subsidiary Total Middle East based in Dubai, TOTAL sold 6,000 tons of lubricants in Syria via a distributor. In 2010, TOTAL’s Trading & Shipping division purchased in Syria pursuant to a mix of spot and term contracts nearly twelveten million barrels of hydrocarbons from state-controlled entities for approximately €472 €580 million. CompetitionThe Group is subject to intense competition within the oil sector and between the oil sector and other sectors aiming to fulfill the energy needs of the industry and of individuals.
TOTAL is subject to competition from other oil companies in the acquisition of assets and licenses for the exploration and production of oil and natural gas. Competition is particularly strong with respect to the acquisition of resources of oil and natural gas. Competition is also intense ingas as well as for the sale of manufactured products based on crude and refined oil. TOTAL’s competitors are comprised of national oil companies and international oil companies. In this regard, the major international oil companies in competition with TOTAL are ExxonMobil, Royal Dutch Shell, Chevron and BP. As of December 31, 2009,2010, TOTAL ranked fifth among these companies in terms of market capitalization. (1)Insurance and risk management TOTAL has its own insurance and reinsurance company, Omnium Insurance and Reinsurance Company (OIRC). OIRC is integrated into the Group’s insurance management and is used as a centralized global operations tool for covering the Group’s risks. It allows the Group to implement its worldwide insurance program in compliance with the various regulatory environments in the countries where the Group operates. Some countries require the purchase of insurance from a local insurance company. If the local insurer accepts to cover the subsidiary of the Group in compliance with its worldwide insurance program, OIRC requests a retrocession of the covered risks from the local insurer. As a result, OIRC negotiates reinsurance contracts with the subsidiaries’ local insurance companies, which transfer most of the risk to OIRC. When a local insurer covers the risks at a lower level than that defined by the Group, OIRC provides additional coverage so as to standardize coverage throughout the Group. At the same time, OIRC negotiates a reinsurance program at the Group level with mutual insurance companies for the oil industry and commercial reinsurers. OIRC enablespermits the Group to better manage changesprice variations in price in the (1) Source: Reuters.
60
insurance market by taking on a greater or lesser amount of risk corresponding to the price trends in the insurance market. In 2009,2010, the net amount of risk retained by OIRC after reinsurance was at a maximum of €50 million per property/business interruption insurance claim and€50 €50 million per third-party liability insurance claim and €50 million per property damageand/or business interruption insurance claim. Accordingly, in the event of any loss giving rise to an insurable claim, the effect on OIRC would be limited to its maximum retention of €100 million per event. Risk and insurance management policy In this context, the Group risk and insurance management policy is to work with the relevant internal department of each subsidiary to: define scenarios of major disaster risks (estimated maximum loss);
assess the potential financial impact on the Group in case these catastrophic events should occur;
| | | • | define scenarios of major disaster risks (estimated maximum loss); | | • | assess the potential financial impact on the Group in case these catastrophic events should occur; | | • | help in implementing measures to limit the probability that a catastrophic event occurs and the extent of such events; and | | • | manage the level of risk from such events to be either covered internally by the Group or to be transferred to the insurance market. |
help in implementing measures to limit the probability that a catastrophic event occurs and the extent of such events; and
manage the level of risk from such events to be either covered internally by the Group or to be transferred to the insurance market.
Insurance policy The Group has worldwide third-party liability and property insurance coverage for all its subsidiaries. These programs are contracted with first-class insurers (or reinsurers and mutual insurance companies of the oil industry through OIRC). The amounts insured depend on the financial risks defined in the disaster scenarios and the coverage terms offered by the market (available capacities and price conditions). Third-party liability insurance: since the maximum financial risk cannot be evaluated by a systematic approach, the amounts insured are based on market conditions and industry practice, in particular, the oil industry. The insurance cap in 2009 for general and product liability was $800 million.
1. | Source: Reuters. | | • | Third-party liability insurance: since the maximum financial risk cannot be evaluated by a systematic approach, the amounts insured are based on market conditions and industry practice, in particular, the oil industry. In 2010, the Group’s third-party liability insurance for any liability (including potential accidental environmental liabilities) was capped at $850 million. | | | • | Property damage and business interruption: the amounts insured vary by sector and by site and are based on the estimated cost of and reconstruction under maximum loss scenarios and on insurance market conditions. The Group subscribed for business interruption coverage in 2010 for its main refining and petrochemical sites. |
Property damage and business disruption: the amounts insured by sector and by site are based on estimated costs and reconstruction scenarios under the estimated maximum loss scenarios and on insurance market conditions. The Group subscribed for business disruption coverage in 2009 for its main refining and petrochemical sites.
For example, forwith respect to the highest estimated risks of the Group (floating production, storage and offloading units (FPSO) in Angola and the Group’s main European refineries), the limitGroup’s share of indemnitycoverage in 2010 was close toapproximately $1.5 billion in 2009. billion.Deductibles for property damagesdamage and third-party liability fluctuate between €0.1 €0.1 million and €10 €10 million depending on the level of risk and liability, and are borne by the relevant subsidiary. For business interruption, they representcoverage begins sixty days.days after the event giving rise to the interruption. Other insurance contracts are bought by the Group in addition to property damage and third-party liability coverage, mainly for car fleets, credit insurance and employee benefits. These risks are entirely underwritten by outside insurance companies. The above-described policy is given as an example of past practice over a certain period of time and cannot be considered as representative of future conditions. The Group’s insurance policy may be changed at any time depending on the market conditions, specific circumstances and on management’s assessment of the risks incurred and the adequacy of their coverage. While TOTAL believes its insurance coverage is in line with industry practice and sufficient to cover normal risks in its operations, it is not insured against all possible risks. In the event of a major environmental disaster, for example, TOTAL’s liability may exceed the maximum coverage provided by its third-party liability insurance. The loss TOTAL could suffer in the event of such a disaster would depend on all the facts and circumstances and would be subject to a whole range of uncertainties, including legal uncertainty as to the scope of liability for consequential damages, which may include economic damage not directly connected to the disaster. The Group cannot guarantee that it will not suffer any uninsured loss.loss and there can be no assurance, particularly in the case of a major environmental disaster or industrial accident, that such loss would not have a material adverse effect on the Group. TOTAL S.A. is the parent company of the TOTAL Group. As of December 31, 2009,2010, there were 712687 consolidated subsidiaries, of which 617596 were fully consolidated 12 were proportionately consolidated and 8391 were accounted for under the equity method. For a list of the principal subsidiaries of the Company, see Note 35 to the Consolidated Financial Statements.
61
Tender Offer by TOTAL S.A. for Outstanding Elf Aquitaine SharesAs of December 31, 2009, TOTAL S.A. held, directly and indirectly, 279,875,134 shares of Elf Aquitaine, taking into account
Pursuant to the 10,635,844 Elf Aquitaine treasury shares held by Elf Aquitaine. This represented 99.48% of Elf Aquitaine’s share capital (281,343,859 shares) and 538,308,099 voting rights, or 99.72% of the 539,811,865 voting rights exercisable at Shareholders Meetings.On March 24, 2010, TOTAL S.A. filed a public tender offer followed by a squeeze out withannounced on March 24, 2010, TOTAL S.A. now owns 100% of the FrenchAutorité des marchés financiers (AMF) in ordersecurities issued by Elf Aquitaine.
The offer, which took place from April 16 to buy29, 2010, at the 1,468,725 Elf Aquitaine shares that it does not already hold at a price of€305 €305 per share (including the remaining 2009 dividend), was intended for all of the Elf Aquitaine shares that were not held directly or indirectly by TOTAL S.A., representing 1,468,725 Elf Aquitaine shares (0.52% of the share capital and 0.27% of the company’s voting rights). Subject The squeeze out procedure was implemented on April 30, 2010 to a clearance decision from the AMF,acquire all the Elf Aquitaine shares targeted by the offer and which havehad not been tendered to the offer will be transferred to TOTAL S.A. underby the squeeze out onminority shareholders upon payment of a compensation per share set at the first trading day afterprice of the offer closing date, upon payment to(i.e., €305 per Elf Aquitaine share (including the shareholders equal to the offer price. After the squeeze out, TOTAL S.A. will hold all remaining 2009 dividend)). Elf Aquitaine shares either directly or indirectly. These shares will then bewere delisted from the Compartment of the delisted securities on the regulated market managed by Euronext Paris S.A.on April 30, 2010 (AMF notice No. 210C0376). Property, Plants and Equipment TOTAL has freehold and leasehold interests in numerous countries throughout the world, none of which is material to TOTAL. See “— Business Overview — Upstream” for a description of TOTAL’s reserves and sources of crude oil and natural gas.
ITEM 4A. UNRESOLVED STAFF COMMENTS None. ITEM 5. OPERATING AND FINANCIAL REVIEW AND PROSPECTS This section is the Company’s analysis of its financial performance and of significant trends that may affect its future performance. It should be read in conjunction with the Consolidated Financial Statements included elsewhere in this Annual Report. The Consolidated Financial Statements are prepared in accordance with International Financial Reporting Standards (IFRS) as issued by the IASB and IFRS as adopted by the European Union. This section contains forward-looking statements which are subject to risks and uncertainties. For a list of important factors that could cause actual results to differ materially from those expressed in the forward-looking statements, see “Cautionary Statement Concerning Forward-Looking Statements” on page vi. OVERVIEW
Overview
TOTAL’s results are affected by a variety of factors, including changes in crude oil and natural gas prices as well as refining and marketing margins, which are all generally expressed in dollars, and changes in exchange rates, particularly the value of the euro compared to the dollar. Higher crude oil and natural gas prices generally have a positive effect on the income of TOTAL, since its Upstream oil and gas business benefits from the resulting increase in revenues realized from production. Lower crude oil and natural gas prices generally have a corresponding negative effect. The effect of changes in crude oil prices on TOTAL’s Downstream activities depends upon the speed at which the prices of refined petroleum products adjust to reflect such changes. In the past several years, crude oil and natural gas prices have varied greatly, with prices increasing sharply until the fourth quarter of 2008, when prices dropped significantly.greatly. As TOTAL reports its results in euros, but conducts its operations mainly in dollars, the effect of an increase in crude oil and natural gas prices is partly offset by the effect of the variation in exchange rates during periods of weakening of the dollar relative to the euro and strengthened during periods of strengthening of the dollar relative to the euro. TOTAL’s results are also significantly affected by the costs of its activities, in particular those related to exploration and production, and by the outcome of its strategic decisions with respect to cost reduction efforts in the current period of significant economic uncertainty.efforts. TOTAL’s results are also affected by general economic and political conditions and changes in governmental laws and regulations, as well as by the impact of decisions by OPEC on production levels. For more information, see “Item 3. Key Information — Risk Factors” and “Item 4. Information on the Company — Other Matters”. In 2009,2010, the market environment for the oil and gas market environmentindustry was marked by a sharp declinethe rebound in the demand for oil, natural gas and refined products.petroleum products, driven by the global economic growth, in particular in emerging countries. Crude oil prices nonetheless, rebounded duringincreased in 2010 to reach an average $80/b. Spot gas prices in Europe and Asia also recovered. Following the year2009 record low levels, refining margins recovered to average $61.7/b primarily thanks to$27/t in Europe. In the support from OPEC reductions and the anticipation by the market of an economic recovery. In contrast, natural gas spot prices remained depressed and refining margins fell to historically low levels, under pressure from significant overcapacity. In Chemicals despite strongsegment, demand for polymers improved in China, the environment was hurt by low marginsall consuming areas and a sharp drop in demand in OECD markets.led to recovering petrochemical margins.
62
In this context, TOTAL’s 20092010 net income (Group share) was €8,447 €10,571 million, a decrease of 20%up 25% compared to 2008, mainly due to€8,447 million in 2009, reflecting the negative impactimproved environment and the sound performance of lower hydrocarbon prices and refining margins, partially offset primarily by the positive after-tax impact of prices on inventory valuation. In the fourth quarter 2009, based on a 6% increaseGroup, in particular with production growing in the Upstream segment higher oil prices and Downstream segment results that remained slightly positive despite very weak refining margins, net income (Group share) rose to€2,065 million, an increase of 7%by more than 4% compared to the third quarter 2009. With
Benefiting from a strong increase in its strongcash flow from operations, TOTAL strengthened its balance sheet with a net debt to equity ratio of 22% at year-end 2010, down from 27% at year-end 2009 (for the computation of the net debt to equity ratio, see the Consolidated Financial Statements included elsewhere herein, Note 20) Financial debt and related financial flexibility, TOTAL has been able to continue its investmentinstruments — C) Net-debt-to-equity ratio). The year 2010 also marks a new dynamic in the implementation of TOTAL’s strategy, with a bolder exploration program and dividend policyprofound changes to the portfolio in 2009, while keeping its net-debt-to-equity ratio, in line with its objectives, at 27% ateach business segment. With a higher level of acquisitions and disposals, the end of December 2009.In the Upstream segment, five major projects started production in 2009 in Nigeria, the Gulf of Mexico, Angola, Qatar and Yemen. The Group also approved the investmentshowed its intention to launch the Surmont Phase II project in Canada, and, to further strengthenoptimize its portfolio entered into a number of joint ventures, notably with Chesapeake and Cobalt inbusinesses.
In 2010, TOTAL reasserted the United States, Novatek in Russia, and Sonatrach in Algeria. These additions were made within the framework of the company’s strict financial criteria. In addition, cost reduction plans launched in late 2008 led to an 8% reduction in operating costs per barrel and allowed the company to maintain its technical costs at $15.4/boe, the same level as in 2008.The Downstream and Chemicals segments continued to implement plans to adapt to the particularly difficult conditions they faced in 2009 that included reducing capacity to restore profitability to these activities in an environment undergoing profound transformation. The measures taken in the modernization of the refining and
petrochemicals site at Normandy demonstrate the Group’s will to be socially responsible as it adapts its industrial operations to structural changes in the market.
In addition, outlays for research and development rose to€650 million in 2009, an increase of 6% compared to 2008. In particular, this allowed the Group to start up this year the pilot project for CO2 capture and storage at Lacq, which illustrates its commitment to the fight against global climate change.
In reaffirming the prioritypriorities of safety and the environment as part of its operations and by building oninvestments throughout its investment discipline, its high-quality portfolio and its recognized expertise, TOTAL is confident in its ability to pursue its strategy of profitable and responsible growth to create value forbusiness. For all of its stakeholders.
Outlook
projects conducted in a large number of countries, the Group put an emphasis on corporate social responsibility (CSR) challenges and the development of local industries. The process initiated in 2004 to increase R&D budgets continued with expenditures of €715 million, up 10% compared to 2009, with the aim of, in particular, the continued improvement of the Group’s technological expertise in the development of oil and gas resources and the development of solar, biomass, carbon capture and storage technologies in order to contribute to changes in the global energy mix. In the Upstream segment, 2010 production is expected to increase thanks to the ramp-up on projects started up in 2009. TOTAL intends to continue to build onGroup continued its large and diversified portfolio, its recognized expertise in project management and cost control. Following the launch of the Surmont Phase II project announced in January 2010, TOTAL expects to launch several other major ambitious investment program that includes launching seven new projects, including CLOV in Angola, Laggan/Tormore in the United Kingdom,North Sea and Ofon IICLOV in Angola. Highlights of 2010 also included the announcement of the acquisition of an interest in two major projects: the Fort Hills field and EginaVoyageur upgrader in Nigeria. Canada and GLNG in Australia. The Group continued to add to its acreage with new exploration plays focused on pre-salt projects, unconventional gas and new frontier areas. Finally, in 2010, TOTAL divested its interests in the Valhall and Hod fields in Norway and Block 31 in Angola, and announced the sale of its Exploration & Production subsidiary in Cameroon. In the Downstream and Chemicals segments, major changes took place in 2010 that included the Group plans to continue to adapt its activities in mature areas and reinforce its portfolio in growing markets, notably with the constructionshutdown of the JubailDunkirk refinery in France and the upgrading of the refinery and the benefit frompetrochemical plant in Normandy. This demonstrated the Group’s intention to adapt to changing demand in Europe while thestart-up of a new ethanethe Ras Laffan steam cracker in Qatar.The Group is continuingQatar will contribute to pursue its growth policy in 2010 with an investment budget of approximately€13 billion(1), relatively stable compared to 2009; 80%taking better advantage of the investments will be dedicatedgrowth in Middle Eastern and Asian markets. In Marketing and Specialty Chemicals, the Group continued to optimize its business by setting up TotalErg in Italy, offering for sale its marketing network in the United Kingdom and disposing of Mapa Spontex while seeking to consolidate its leading position with respect to these businesses.
Outlook In 2011, TOTAL intends to consolidate its drivers for growth and enhance the priority given to the Upstream segment.safety, reliability and acceptability of its operations. Budgeted capital expenditures of the business segments for 2011 amount to €15.4 billion ($20 billion)(1). In addition, TOTAL intends to divest non-strategiccontinue to acquire targeted assets and dispose of non strategic assets. Capital expenditures will mostly be focused on the Upstream segment with an allocation of €12.3 billion ($16 billion)(1). 35% of the investments in the Upstream segment should be dedicated to producing assets while 65% should be assigned to develop new projects. In the Downstream and Chemicals segments, capital expenditures will amount to nearly €3.1 billion ($4 billion)(1) in 2011, in particular dedicated to upgrading the Normandy refinery and petrochemical plant and building the Jubail refinery in Saudi Arabia. In addition, major turnarounds of Group refineries should increase compared with the lower number recorded in 2010. The Group also confirms its commitment with respect to R&D with a budget increasing to nearly €0.8 billion ($1 billion)(1) in 2011. In the Upstream segment, TOTAL expects tostart-up a new wave of major projects starting in mid-2011 with, in particular, thestart-up of Pazflor in Angola scheduled in the fourth quarter of the year. The Group will also carry on the study of a number of projects in Russia, Australia, Canada and China. Commencement of construction over the course of the next couple of years, subject to final investment decisions, will contribute to increasing visibility on middle-term growth. With an exploration budget increasing to €1.6 billion ($2.1 billion)(1) for 2011, the Group will also implement a bolder and more diversified approach with the expectation of making greater discoveries in the years to come. (1) Converted at a rate of $1.30/€.
63
In the Downstream and Chemicals segments, TOTAL will strive to improve competitiveness by continuing to adapt its assets portfolio in Europe, starting up new units at the Port Arthur refinery in the United States and developing positions in growth markets. With a sound balance sheet at year-end 2010 and increased leeway in an environment marked with crude oil prices over $80/b, TOTAL will continue to develop its various projects in 2011 through an ambitious investment program while sticking to a targeted net debt to equity ratio between 25% and 30% and a dividend policy with an average pay-out ratio of 50% based on adjusted fully-diluted earnings per share(1). The Group also confirms its intention to divest the progressive saleremainder of its sharesstake in Sanofi-Aventis and a project to sell Mapa-Spontex, a subsidiary in its Specialty chemicals sector. Based on this, the Group maintains its net-debt-to-equity ratio objective of around 25-to-30%. TOTAL is confident in its ability to maintain its dividend policy.Since the beginningby 2012, which represented 5.5% of the first quarteroutstanding share capital of Sanofi-Aventis as of December 31, 2010, the pricefor an estimated market value of Brent has traded between $70/b and $80/b and natural gas prices have recovered somewhat. The environment for refining and petrochemicals remains difficult.
€3.5 billion ($4.6 billion)(2). Critical Accounting Policies
CRITICAL ACCOUNTING POLICIES A summary of the Group accounting policies is included in Note 1 to the Consolidated Financial Statements. Management believes that the application of these policies on a consistent basis enables the Group to report useful and reliable information about the Group’s financial condition and results of operations. The Company has changed its method for reserve estimates due to the adoption of the Accounting Standards Update No. 2010-03, Oil and Gas Reserve Estimation and Disclosures, effective for annual reporting periods ended on or after December 31, 2009. The preparation of financial statements in accordance with IFRS requires management to make estimates and assumptions that affect the reported amounts of assets, liabilities and contingent liabilities at the date of preparation of the financial statements and reported income and expenses for the period. Management reviews these estimates and assumptions on an ongoing basis, by reference to past experience and various other factors considered as reasonable which form the basis for assessing the book value of assets and liabilities. Actual results may differ significantly from these estimates, if different assumptions or circumstances apply. Lastly, where the accounting treatment of a specific transaction is not addressed by any accounting standards or interpretation, management applies its judgment to define and apply accounting policies that will lead to relevant and reliable information, so that the financial statements: give a true and fair view of the Group’s financial position, financial performance and cash flows;
reflect the substance of transactions;
| | | • | give a true and fair view of the Group’s financial position, financial performance and cash flows; |
| | | • | reflect the substance of transactions; | | • | are neutral; | | • | are prepared on a prudent basis; and | | • | are complete in all material aspects. |
are prepared on a prudent basis; and
are complete in all material aspects.
The following summary provides further information about the critical accounting policies, which could have a significant impact on the results of the Group. It should be read in conjunction with Note 1 to the Consolidated Financial Statements. 1. | Including net investments in equity affiliates and non-consolidated companies, excluding acquisitions, based on€1 = $1.40 for 2010. |
The assessment of critical accounting policies below is not meant to be an all-inclusive discussion of the uncertainties in financial results that can occur from the application of the full range of the Company’s accounting policies. Materially different financial results could occur in the application of other accounting policies as well. Likewise, materially different results can occur upon the adoption of new accounting standards promulgated by the various rule-making bodies. Successful efforts method of oil and gas accounting The Group follows the successful efforts method of accounting for its oil and gas activities. The Group’s oil and gas reserves are estimated by the Group’s petroleum engineers in accordance with industry standards and SEC regulations. In December 2008, the SEC published a revised set of rules for the estimation of reserves. These revised rules were used for the 2009 year-end estimation of reserves.reserves beginning in 2009. Proved oil and gas reserves are those quantities of oil and gas, which, by analysis of geoscience and engineering data, can be estimated with reasonable certainty to be economically producible from a given date forward, from known reservoirs, and under existing economic conditions, operating methods, and government regulations, prior to the time at which contracts providing the right to operate expire, unless evidence indicates that renewal is reasonably certain, regardless of whether deterministic or probabilistic methods are used for the estimation. These estimates do not include probable or possible reserves. Estimated oil (1) For the adjusted fully-diluted earnings per share, see the Consolidated Financial Statements included elsewhere herein, Note 4) Business segment information — A) Information by business segment. (2) Converted at a rate of $1.30/€.
64
and gas reserves are based on available reservoir data and prices and costs in the accounting period during which the estimate is made and are subject to future revision. The Group reassesses its oil and gas reserves at least once a year on all its properties. Exploration leasehold acquisition costs are capitalized when acquired. During the exploration phase, management exercises judgment on the probability that prospects ultimately would partially or fully fail to find proved oil and gas reserves. Based on this judgmental approach, a leasehold impairment charge may be recorded. This position is assessed and adjusted throughout the contractual period of the leasehold based in particular on the results of exploratory activity and any impairment is adjusted prospectively. When a discovery is made, exploratory drilling costs continue to be capitalized pending determination of whether potentially economic oil and gas reserves have been discovered by the drilling effort. The length of time necessary for this determination depends on the specific technical or economic difficulties in assessing the recoverability of the reserves. If a determination is made that the well did not encounter oil and gas in economically viable quantities, the well costs are expensed and are reported in exploration expense. Exploratory drilling costs are temporarily capitalized pending determination of whether the well has found proved reserves if both of the following conditions are met: the well has found a sufficient quantity of reserves to justify, if appropriate, its completion as a producing well, assuming that the required capital expenditure is made; and
| | | • | the well has found a sufficient quantity of reserves to justify, if appropriate, its completion as a producing well, assuming that the required capital expenditure is made; and | | | • | satisfactory progress toward ultimate development of the reserves is being achieved, with the Company making sufficient progress assessing the reserves and the economic and operating viability of the project. |
satisfactory progress toward ultimate development of the reserves is being achieved, with the Company making sufficient progress assessing the reserves and the economic and operating viability of the project.
The Company evaluates the progress made on the basis of regular project reviews which take into account the following factors: First, if additional exploratory drilling or other exploratory activities (such as seismic work or other significant studies) are either underway or firmly planned, the Company deems there is satisfactory progress. For these purposes, exploratory activities are considered firmly planned only if they are included in the Company’s three-year exploration plan/budget.
| | | • | First, if additional exploratory drilling or other exploratory activities (such as seismic work or other significant studies) are either underway or firmly planned, the Company deems there is satisfactory progress. For these purposes, exploratory activities are considered firmly planned only if they are included in the Company’s three-year exploration plan/budget. | | | • | In cases where exploratory activity has been completed, the evaluation of satisfactory progress takes into account indicators such as the fact that costs for development studies are incurred in the current period, or that governmental or other third-party authorizations are pending or that the availability of capacity on an existing transport or processing facility awaits confirmation. |
In cases where exploratory activity has been completed, the evaluation of satisfactory progress takes into account indicators such as the fact that costs for development studies are incurred in the current period, or that governmental or other third-party authorizations are pending or that the availability of capacity on an existing transport or processing facility awaits confirmation.
The successful efforts method requires, among other things, requires that the capitalized costs for proved oil and gas properties (which include the costs of drilling successful wells) be amortized on the basis of reserves that are produced in a period as a percentage of the total estimated proved reserves. The impact of changes in estimated proved reserves is dealt with prospectively by amortizing the remaining book value of the asset over the expected future production. If proved reserve estimates are revised downward, earnings could be affected by higher depreciation expense or an immediate write-down of the property’s book value. Conversely, if the oil and gas quantities were revised upwards, future per-barrel depreciation and depletion expense would be lower. Valuation of long-lived assets In addition to oil and gas assets that could become impaired under the application of successful efforts accounting, other assets could become impaired and require write-down if circumstances warrant. Conditions that could cause an asset to become impaired includelower-than-forecasted commodity sales prices, changes in the Group’s business plans or a significant adverse change in the local or national business climate. The amount of an impairment charge would be based on estimates of an asset’s fair value compared with its book value. The fair value usually is based on the present values of expected future cash flows using assumptions commensurate with the risks involved in the asset group. The expected future cash flows used for impairment reviews are based on judgmental assessments of future production volumes, prices and costs, considering information available at the date of review. Asset retirement obligations and environmental remediation When legal and contractual obligations require it, the Group, upon application of International Accounting Standard (IAS) 37 and IAS 16, records provisions for the future decommissioning of production facilities at the end of their economic lives. Management makes judgments and estimates in recording liabilities. Most of these removal obligations are many years in the future and the precise requirements that will have to be met when the removal event actually occurs are uncertain. Asset removal technologies and costs are constantly changing,
65
as well as political, environmental, safety and public expectations. The Group also makes judgments and estimates in recording costs and establishing provisions for environmental clean-up and remediation costs, which are based on current information on costs and expected plans for remediation. For environmental provisions, actual costs can differ from estimates because of changes in laws and regulations, public expectations, discovery and analysis of site conditions and changes in clean-up technology. Pensions and post-retirement benefits Accounting for pensions and other post-retirement benefits involves judgments about uncertain events, including estimated retirement dates, salary levels at retirement, mortality rates, rates of return on plan assets, determination of discount rates for measuring plan obligations, healthcare cost-trend rates and rates of utilization of healthcare services by retirees. These assumptions are based on the environment in each country. The assumptions used are reviewed at the end of each year and may vary from year-to-year, based on the evolution of the situation, which will affect future results of operations. Any differences between these assumptions and the actual outcome will also impact future results of operations. The significant assumptions used to account for pensions and other post-retirement benefits are determined as follows: Discount and inflation rates reflect the rates at which the benefits could be effectively settled, taking into account the duration of the obligation. Indications used in selecting the discount rate include rates of annuity contracts and rates of return on high-quality fixed-income investments (such as government bonds). The inflation rates reflect market conditions observed on a country-by-country basis. Salary increase assumptions (when relevant) are determined by each entity. They reflect an estimate of the actual future salary levels of the individual employees involved, including future changes attributed to general price levels (consistent with inflation rate assumptions), productivity, seniority, promotion and other factors. Healthcare cost trend assumptions (when relevant) reflect an estimate of the actual future changes in the cost of the healthcare relatedhealthcare-related benefits provided to the plan participants and are based on past and current healthcare cost trends including healthcare inflation, changes in healthcare utilization, and changes in health status of the participants. Demographic assumptions such as mortality, disability and turnover reflect the best estimate of these future events for the individual employees involved, based principally on available actuarial data. Determination of expected rates of return on assets is made through compound averaging. For each plan, the distribution of investments among bonds, equities and cash and the expected rates of return on bonds, equities and cash are taken into account. A weighted-average rate is then calculated. The effect pensions had on results of operations, cash flow and liquidity is fully set out in Note 18 to the Consolidated Financial Statements. Net employee benefit expense in 20092010 amounted to €307 €374 million and the Company’s contributions to pension plans were €126 €269 million. Differences between projected and actual costs and between the projected return and the actual return on plan assets routinely occur and are called actuarial gains and losses. The Group applies the corridor method to amortize its actuarial losses and gains. This method amortizes the net cumulative actuarial gains and losses that exceed 10% of the greater of (i) the present value of the defined benefit obligation, and (ii) the fair value of plan assets, over the average expected remaining working lives of the employees participating in the plan. The unrecognized actuarial losses of pension benefits as of December 31, 2009,2010, were €1,045 €1,170 million compared to €953 €1,045 million for 2008.2009. The increase in unrecognized actuarial losses is explained by actuarial losses due to a decrease in discount rates in 20092010 partially offset by an increase in the value of plan assets.assets. As explained above, pension accounting principles allow that such actuarial losses be deferred and amortized over future periods, in the Company’s case a period of fifteen years. While the Company has not completed its calculations for 2010,2011, it is considering an increaseda decreased weighted-average expected return on pension plan assets for the year (6.39%(5.90% compared to the 2009 rate of 6.14%6.39%), due to a change in the pension assets allocation as of December 31, 2009, that was offset by a decrease in discount rates in 2009.2010. The Company does not believe that it will be significantly modifying its discount rate in the near future. The Company’s estimates indicate that a 1% increase or decrease in the expected rate of return on pension plan assets would have caused a€58 €60 million decrease or increase, respectively, in the 20092010 net periodic pension
66
cost. The estimated impact on expense of the amortization of the unrecognized actuarial losses of €1,045 €1,170 million as of December 31, 2009,2010, is €58 €51 million for 2010,2011, compared to €50 €66 million 2009.for 2010. The computation of the Group’s income tax expense requires the interpretation of complex tax laws and regulations in many taxing jurisdictions around the world, the determination of expected outcomes from pending litigation, and the assessment of audit findings that are performed by numerous taxing authorities. Actual income tax expense may differ from management’s estimates. RESULTS2008-2010 | | | | | | | | | | | | | | | As of and for the year ended December 31, (M€, except per share data) | | 2010 | | | 2009 | | | 2008 | | | Non-Group sales | | | 159,269 | | | | 131,327 | | | | 179,976 | | | Net income (Group share) | | | 10,571 | | | | 8,447 | | | | 10,590 | | | Diluted earnings per share | | | 4.71 | | | | 3.78 | | | | 4.71 | |
Group Results 2010 vs. 2009 In 2010, the oil and gas market environment was characterized by increased demand for oil and natural gas products. Crude oil prices were relatively stable during 2010, with an average Brent oil price of $79.5/b, an increase of 29% compared to $61.7/b in 2009. In 2010, TOTAL’s average liquids price realization(1) increased 31% to $76.3/b from $58.1/b in 2009, in line with the increase in the average Brent price of oil. TOTAL’s average natural gas price realization(1) decreased to $5.15/MBtu in 2010 from $5.17/MBtu in 2009. The average euro-dollar exchange rate was 1.33 $/€ on average in 2010 compared to 1.39 $/€ in 2009. Refining margins rebounded in 2010 from historically low levels in 2009. For the full year 2010, the Group’s European Refining Margin Indicator (ERMI) was 27.4 $/t, an increase of 54% compared to $17.8/t in 2009. For the full year 2010, the Chemicals segment benefited from a strong rebound in demand and margins in the Base chemicals market, as well as an increase in demand in the Specialties chemicals market. Consolidated sales of TOTAL were €159.3 billion in 2010, an increase of 21% from €131.3 billion in 2009, as a result of an increase in non-Group sales in the Upstream, Downstream and Chemicals segments of 15%, 23% and 19%, respectively. Reported net income (Group share) in 2010 increased by 25% to €10,571 million from €8,447 million in 2009, mainly due to the increase in hydrocarbon prices and production, as well as a rebound in the Chemicals segment. The after-tax impact of prices on inventory valuation accounted for in the Downstream and Chemicals segments had a positive impact on net income (Group share) of €748 million in 2010 and a positive impact of €1,533 million in 2009, in each case due to the increase in oil prices. For a discussion of the impact of prices on inventory valuation in the Downstream and Chemicals segments see ‘‘— Business Segment Reporting” below. Special items had a negative impact on net income (Group share) of €384 million in 2010, comprised essentially of asset impairments that had a negative impact of €1,224 million and gains on asset sales that had a positive impact of €1,046 million. Special items had a negative impact of €570 million in 2009. Effective July 1, 2010, the Group no longer accounts for its interest in Sanofi-Aventis as an equity affiliate, but treats such interest as a financial asset available for sale in the line “Other investments” of the balance sheet. The Group’s share of adjustment items related to Sanofi-Aventis had a negative impact on net income (Group share) of €81 million in 2010 (six months) and a negative impact of €300 million in 2009 (full year). In 2010, income taxes amounted to €10,228 million, an increase of 32% compared to €7,751 in 2009, primarily as a result of the increase in taxable income. The increase in the effective tax rate from 47% in 2009 to 49% in 2010 was mainly due to an increase in the portion of the Group income before tax attributable to entities with a local tax rate much higher than the French tax rate (34.43%). The portion of the Upstream income before tax represented 89% in 2010 compared with 82% in 2009, with a mechanical impact on the Group effective tax rate. The Group did not buy back shares in 2010. The number of fully-diluted shares at December 31, 2010, was 2,249.3 million compared to 2,243.7 million at December 31, 2009. (1) Consolidated subsidiaries, excluding fixed margin and buyback contracts.
67
Results 2007-2009
| | | | | | | | As of and for the year ended December 31, (M€, except per share data) | | 2009 | | 2008 | | 2007 | Non-Group sales | | 131,327 | | 179,976 | | 158,752 | Net income (Group share) | | 8,447 | | 10,590 | | 13,181 | Diluted earnings per share | | 3.78 | | 4.71 | | 5.80 |
Fully-diluted earnings per share, based on 2,244.5 million weighted-average shares, was €4.71 in 2010, compared to €3.78 in 2009, an increase of 25%. Group Results 2009 vs. 2008 In 2009, the oil and gas market environment was characterized by a sharp decline in the demand for oil, natural gas and refined products. Following a significant decrease in the fourth quarter of 2008, crude oil prices rebounded during 2009 to an average Brent oil price of $61.7/b, which represents a decrease of approximately 37% compared to the average Brent oil price of $97.30/b in 2008. Natural gas spot prices remained depressed throughout 2009, with an average of $5.17/Mbtu, which represents a decrease of 30% compared to $7.38/Mbtu in 2008. The decrease in oil and gas prices was partially offset by the slight strengthening of the dollar comparative to the euro: the average euro-dollar exchange rate was $1.39/ € in 2009 compared to $1.47/ € in 2008. Comparing 2009 to 2008, TOTAL’s average realized liquids price realization.(1) decreased by 36% and average realized natural gas price realization decreased by 30%. Refining margins fell in 2009 to historically low levels, with TOTAL’s European Refining Margin Indicator (ERMI) falling by 65% to $17.8/t compared to $51.1/t in 2008. ERMI is a new indicator, reported by TOTAL since January 2010, intended to represent the margin after variable costs for a theoretical complex refinery located around Rotterdam in Northern Europe that processes a mix of crude oil and other inputs commonly supplied to this region to produce and market the main refined products at prevailing prices in this region. The indicator margin may not be representative of the actual margins achieved by TOTAL in any period because of TOTAL’s particular refinery configurations, product mix effects or other company-specific operating conditions. TOTAL’s refining margin indicator reported in previous quarters was TRCV. For comparative purposes, TRCV fell by 61% to $14.8/t in 2009, compared to $37.8/t in 2008. TRCV was discontinued effective in the first quarter 2010. In the Chemicals segment, despite strong demand for polymers in China, the environment was affected by low margins and a sharp drop in demand for polymers and specialty chemicals in OECD markets. Consolidated sales of TOTAL were €131.3 €131.3 billion in 2009, a decrease of 27% from €180 €180 billion in 2008, as a result of a decline in sales in the Upstream, Downstream and Chemicals segments of 34%, 26% and 27%, respectively. TOTAL’s net income (Group share) decreased to€8,447 €8,447 million in 2009 from€10,590 €10,590 million in 2008. The 20% decrease in net income (Group share) in 2009 compared to 2008 was mainly due to the negative impact of lower hydrocarbon prices and refining margins (-€6.8 billion). Other factors contributing to a decrease in net income (Group share) in 2009 compared to 2008 included special items (-€0.1 billion). These negative impacts were partially offset by the positive impacts of: the after-tax impact of prices on inventory valuation accounted for in the Downstream and Chemicals segments (+€4.0 billion); the Group’s equity share of adjustments (concerning amortization and impairment of intangibles related to the Sanofi-Aventis merger) and, from 2009, selected items related to Sanofi-Aventis (+€0.1 billion); and a stronger dollar (+€0.5 billion). In 2009, income taxes amounted to €7,751 €7,751 million, a decrease of 45% compared to €14,146 €14,146 in 2008, primarily as a result of the decline in taxable income. The decrease in the effective tax rate from 56% in 2008 to 47% in 2009 was mainly due to the fall in the portion of the Group income before tax attributable to entities with a local tax rate much higher than the French tax rate (34.43%), mainly entities from the Upstream segment. The portion of the Upstream income before tax represented 82% in 2009 compared with 99% in 2008, with a mechanical impact on the Group effective tax rate. The Group did not buy back shares in 2009. The number of fully-diluted shares at December 31, 2009, was 2,243.7 million compared to 2,235.3 million at December 31, 2008. Fully-diluted earnings per share, based on 2,237.3 million weighted-average shares, was €3.78 €3.78 compared to €4.71 €4.71 in 2008, a decrease of 20%. Group Results 2008 vs. 2007
Unprecedented volatility marked the 2008 oil market environment. In the first part of the year, the price of Brent crude climbed rapidly toward $150/b. In the second part of the year, the global economy suffered a sharp slowdown, which contributed to driving Brent down to a new low for the year of $35/b in December. The average Brent oil price in 2008 increased by 34% to $97.30/b from $72.40/b in 2007, and its price averaged $55/b for the fourth quarter of 2008. Refining margins also increased in 2008, with the European refining margin indicator used by TOTAL’s management (TRCV) up 16% to $37.80/t from $32.50/t in 2007. The Chemicals environment weakened in 2008 compared to 2007, turning sharply negative at year-end due to decreasing demand resulting from the global economic slowdown. While the dollar lost 7% of its value against the euro during 2008, with the average dollar/euro exchange rate being $1.47/€ in 2008 compared to $1.37/€ in 2007, it did gain 14% against the euro during the fourth quarter.
TOTAL’s consolidated sales increased by 13% to€180.0 billion in 2008 from€158.8 billion in 2007.
TOTAL’s net income (Group share) was€10,590 million in 2008 compared to€13,181 million in 2007. The 20% decrease in net income in 2008 compared to 2007 was mainly due to the negative after-tax impact of prices on inventory valuation (-€3.8 billion), due to the sharp drop in oil prices in the last quarter of 2008. Other factors contributing to the decrease in net income in 2008
compared to 2007 consisted mainly of: the weaker dollar (-€0.8 billion); special items (-€0.5 billion); higher Upstream costs (-€0.5 billion); lower production (-€0.5 billion); less favorable results from U.S. refining, mainly due to a less favorable business environment and hurricanes (-€0.2 billion); a less favorable environment in the Chemicals business (-€0.2 billion); the Group’s equity share of the amortization of intangibles related to the Sanofi-Aventis merger (-€0.1 billion); and a decrease in income from equity affiliates in the Downstream segment, mainly due to losses incurred through TOTAL’s participation in Wepec, its affiliate for refining in China (-€0.1 billion). These negative impacts were partially offset by the positive impacts of higher hydrocarbon prices (+€3.5 billion) and a more favorable Downstream business environment (+€0.6 billion).
In 2008, the Group bought back 27.6 million of its shares(1)for€1,339 million. The number of fully-diluted shares at December 31, 2008, was 2,235 million compared to 2,265 million at December 31, 2007.
Diluted earnings per share, based on 2,247 million fully-diluted weighted-average shares, decreased by 19% to€4.71 in 2008 from€5.80 in 2007.
Business Segment Reporting The financial information for each business segment is reported on the same basis as that used internally by the chief operating decision maker in assessing segment performance and the allocation of segment resources. Due to their particular nature or significance, certain transactions qualified as “special items” are excluded from the business segment figures. In general, special items relate to transactions that are significant, infrequent or unusual. However, in certain instances, certain transactions such as restructuring costs or assetsasset disposals, which are not considered to be representative of the normal course of business, may be qualified as special items although they may have occurred in prior years or are likely to recur in following years. (1) Consolidated subsidiaries, excluding fixed margin and buyback contracts.
68
In accordance with IAS 2, the Group values inventories of petroleum products in the financial statements according to the FIFO (First-In,(First-In, First-Out) method and other inventories using the weighted-average cost method. Under the FIFO method, inventories are valued atbased on the lasthistoric cost of acquisition or productionmanufacture rather than the current replacement cost. In volatile energy markets, this can have a significant distorting effect on the reported income. Accordingly, the segment measure of profitability for the Downstream segment and Chemicals segmentssegment is based on athe replacement cost method in order to excludefacilitate the comparability of the Group’s results with those of its competitors and to help illustrate the operating performance of these segments excluding the impact of oil price changes on the replacement of inventories, as 1. | Includes 2.8 million shares purchased to cover restricted share grants pursuant toinventories. In the decision of the Board on September 9, 2008. |
management believes such measure reflects more accurately the operating performance of these segments. In this replacement cost method, which is conceptually close to the LIFO (Last-In,(Last-In, First-Out) method, decreasesthe variation of inventory values in inventories are valued using the monthly averagestatement of income is, depending on the nature of the acquisitioninventory, determined using either the month-end prices differential between one period and another or production costs for the month in question rather than the costaverage prices of the oldest articles in the inventories.period. The inventory valuation effect is the difference between the results according to the FIFO method and thisusing the replacement cost method. When the replacement cost is higher than the cost of the oldest articles ininventory, use of the inventories (i.e., positive inventory valuation effect), a provision for oil price changes in the adjusted results is established and affects operating expenses.replacement cost method lowers results. When the replacement cost is lower than the cost of the oldest articles ininventory, use of the inventories (i.e., negativereplacement cost method, as opposed to FIFO, increases results. In the discussion of net income (Group share) we separately disclose the after-tax amount of the inventory valuation effect),effect.
Until June 30, 2010, the provision for oil price changes is reversed.The Group also adjustsadjusted for its equity share of adjustments (concerning amortization and impairment of intangibles related to the Sanofi-Aventis merger) and, from 2009, selectedadjustment items related to Sanofi-Aventis.
As of July 1, 2010, Sanofi-Aventis is no longer accounted for as an equity affiliate (but is instead treated as a financial asset available for sale in the line “Other investments” of the balance sheet). The adjusted business segment results (adjusted operating income and adjusted net operating income) are defined as replacement cost results, adjusted for special items and Sanofi-Aventis related items. For further information on the adjustments affecting operating income on asegment-by-segment basis, and for a reconciliation of segment figures to figures reported in the Company’s audited consolidated financial statements, see Note 4 to the Consolidated Financial Statements. The
In addition, the Group measures performance at the segment level on the basis of net operating income and adjusted net operating income. Net operating income comprises operating income of the relevant segment after deducting the amortization and the depreciation of intangible assets other than leasehold rights, translation adjustments and gains or losses on the sale of assets, as well as all other income and expenses related to capital employed (dividends from non-consolidated companies, income from equity affiliates, capitalized interest expenses), and after income taxes applicable to the above. The income and expenses not included in net operating income but included in net income are interest expenses related to net financial debt only, after applicable income taxes (net cost of net debt and minority interests). Adjusted net operating income excludes the effect of the adjustments (special items, the inventory valuation effect and, until June 30, 2010, Sanofi-Aventis related items) described above. For further discussion on the calculation of net operating income and the calculation of return on average capital employed (ROACE)(1), see Note 2 to the Consolidated Financial Statements. Upstream results | | | | | | | | | | | (M€) | | 2009 | | | 2008 | | | 2007 | | Non-Group sales | | 16,072 | | | 24,256 | | | 19,706 | | Operating income(a) | | 12,858 | | | 23,468 | | | 19,503 | | Equity in income (loss) of affiliates and other items | | 846 | | | 1,541 | | | 1,330 | | Tax on net operating income | | (7,486 | ) | | (14,563 | ) | | (11,996 | ) | Net operating income(a) | | 6,218 | | | 10,446 | | | 8,837 | | Adjustments affecting net operating income | | 164 | | | 278 | | | 12 | | Adjusted net operating income(b) | | 6,382 | | | 10,724 | | | 8,849 | | Investments | | 9,855 | | | 10,017 | | | 8,882 | | Divestments | | 398 | | | 1,130 | | | 751 | | | | | | ROACE | | 18% | | | 36% | | | 34% | |
| | | | | | | | | | | | | | | (M€) | | 2010 | | | 2009 | | | 2008 | | | Non-Group sales | | | 18,527 | | | | 16,072 | | | | 24,256 | | Operating income(a) | | | 17,450 | | | | 12,858 | | | | 23,468 | | | Equity in income (loss) of affiliates and other items | | | 1,533 | | | | 846 | | | | 1,541 | | | Tax on net operating income | | | (10,131 | ) | | | (7,486 | ) | | | (14,563 | ) | Net operating income(a) | | | 8,852 | | | | 6,218 | | | | 10,446 | | | Adjustments affecting net operating income | | | (255 | ) | | | 164 | | | | 278 | | Adjusted net operating income(b) | | | 8,597 | | | | 6,382 | | | | 10,724 | | | Investments | | | 13,208 | | | | 9,855 | | | | 10,017 | | | Divestments | | | 2,067 | | | | 398 | | | | 1,130 | | | | | | | | | | | | | | | | | ROACE | | | 21% | | | | 18% | | | | 36% | |
(a) | | | | (a) | | For the definition of operating income and net operating income, see Note 2 to the Consolidated Financial Statements. |
| (b) | | Adjusted for special items. See Notes 2 and 4 to the Consolidated Financial Statements. |
(1) ROACE = adjusted net operating income divided by average capital employed.
69
2010 vs. 2009 Upstream segment sales (excluding sales to other segments) increased by 15% to €18,527 million in 2010 from €16,072 million in 2009, reflecting essentially the impact of higher hydrocarbon prices and production growth. For the full year 2010, oil and gas production averaged 2,378 kboe/d, compared to 2,281 kboe/d in 2009. This 4.3% increase was essentially the result of productionramp-ups on new projects, net of the normal decline, and a lower level of turnarounds (+3%), changes in the portfolio (+2%), lower OPEC reductions and an increase in gas demand (+1.5%) and improved security conditions in Nigeria (+1%), partially offset by the price effect(1) (-3%). Proved reserves based on SEC rules were 10,695 Mboe at December 31, 2010 (Brent at $79.02/b), compared to 10,483 Mboe at December 31, 2009 (Brent at $59.91/b). At the 2010 average rate of production, the reserve life is more than twelve years. See “Item 4. Information on the Company — Exploration & Production — Reserves” for a discussion of proved reserves and “Supplemental Oil and Gas Information (Unaudited)” contained elsewhere herein for additional information on proved reserves, including tables showing changes in proved reserves by region. Upstream net operating income in 2010 amounted to €8,852 million (for 2009, €6,218 million) from operating income of €17,450 million (for 2009, €12,858 million), with the difference resulting primarily from taxes on net operating income of €10,131 (for 2009, €7,486 million), partially offset by income from equity affiliates and other items of €1,533 million (for 2009, €846 million). Over the full year 2010, adjusted net operating income for the Upstream segment was €8,597 million compared to €6,382 million in 2009, an increase of 35%, essentially due to hydrocarbon prices (+€2.3 billion). Technical costs for consolidated subsidiaries, in accordance with ASC 932(2) were $16.6/boe in 2010, compared to $15.4 boe in 2009, mainly due to depreciation, depletion and amortization (DD&A) charges related notably to thestart-up of new projects and increased operating expenses per barrel. Adjusted net operating income for the Upstream segment excludes special items. In 2010, the exclusion of special items (comprised principally of capital gains on asset sales partially offset by asset impairments) had a negative impact of €255 million on adjusted net operating income for the Upstream segment compared to a positive impact of €164 million in 2009 (comprised principally of asset impairments and other elements). The Upstream segment’s total capital expenditures increased by 34% to €13,208 million in 2010 from €9,855 million in 2009. The capital expenditures in 2010 mainly included projects in the following countries: Angola, the United States, Nigeria, Canada, Norway, Kazakhstan, Australia, the United Kingdom, Indonesia, the Republic of the Congo, Libya, Gabon and Thailand. ROACE for the Upstream segment increased to 21% in 2010 from 18% in 2009. The increase was mainly due to the adjusted net operating income having increased, principally due to increased hydrocarbon prices and production. Upstream segment sales (excluding sales to other segments) were down 34% to €16,072 €16,072 million in 2009 compared to €24,256 €24,256 million in 2008, reflecting essentially lower average hydrocarbon prices and a decrease in production, which were partially offset by the impact of the appreciation of the dollar compared to the euro. In 2009, TOTAL’s average liquids price realization(2)(3)decreased 36% to $58.1/b from $91.1/b in 2008, in line with the decrease in the average Brent price of oil, which was $61.7/b in 2009 compared to $97.3/b in 2008. TOTAL’s average natural gas price realization(2)(3) decreased 30% to $5.17/MBtu in 2009 from $7.38/MBtu in 2008.
1. | ROACE = adjusted net operating income divided by average capital employed. |
2. | Consolidated subsidiaries, excluding fixed margin and buyback contracts. |
For the full year 2009, oil and gas production averaged 2,281 kboe/d, compared to 2,341 kboe/d in 2008. This 2.6% decrease was due mainly to the negative impacts of OPEC reductions and lower gas demand (-3%), changes in the portfolio, essentially in Venezuela and Libya (-2%), and disruptions in Nigeria related to security issues (-1%), partially offset by the positive impact of ramp-ups and start-ups of new fields net of the normal decline on existing fields (+2%) and the price effect (1)(+1.5%). Excluding the impact of OPEC reductions, production was stable compared to 2008. Proved reserves based on the revised rules published by the SEC in December 2008 were 10,483 Mboe at December 31, 2009 (Brent at $59.91/b), compared to 10,458 Mboe at December 31, 2008. At the 2009 average rate of production, the reserve life is more than twelve years. See “Item 4. Information on the Company — Exploration & Production — Reserves” for a discussion of proved reserves and “Supplemental Oil and Gas Information (Unaudited)” contained elsewhere herein for additional (1) The “price effect” refers to the impact of hydrocarbon prices on entitlement volumes from production sharing and buyback contracts. For example, as the price of oil or gas increases above certain pre-determined levels, TOTAL’s share of production normally decreases. (2) Accounting Standards Codification Topic 932, Extractive industries — Oil and Gas. (3) Consolidated subsidiaries, excluding fixed margin and buyback contracts.
70
information on proved reserves, including tables showing changes in proved reserves by region. Upstream net operating income in 2009 amounted to €6,218 €6,218 million (for 2008, €10,446 €10,446 million) from operating income of €12,858 €12,858 million (for 2008, €23,468 €23,468 million), with the difference resulting primarily from taxes on net operating income of €7,486 €7,486 million (€(€14,563 million in 2008), partially offset by income from equity affiliates and other items of €846 €846 million (€(€1,541 million in 2008). Over the full year 2009, adjusted net operating income for the Upstream segment was €6,382 €6,382 million compared to €10,724 €10,724 million in 2008, a decrease of 40%, essentially due to lower hydrocarbon prices (- €4.6 billion), partially offset by the positive impact of a slightly stronger dollar compared to the euro (+ €0.4 billion). Technical costs for consolidated subsidiaries, in accordance with ASC 932 (2) (previously FAS69) were $15.4/boe in 2009, stable compared to 2008, with a decrease of 8% in operating expenses per barrel offsetting an increase in depreciation, depletion and amortization (DD&A) charges related notably to the start-up of new projects. Adjusted net operating income for the Upstream segment excludes special items. In 2009, the exclusion of special items (comprised principally of asset impairments and other elements) had a positive impact of€164 €164 million on adjusted net operating income for the Upstream segment compared to a positive impact of€278 €278 million in 2008 (comprised principally of an asset impairment of€171 €171 million on the Joslyn project and the net impact of contract renegotiations of€106 €106 million). The Upstream segment’s total capital expenditures decreased by 2% to €9,855 €9,855 million in 2009 from €10,017 €10,017 million in 2008. The capital expenditures in 2009 mainly included the following projects: Kashagan in Kazakhstan; Pazflor, Angola LNG and Tombua Landana in Angola; Akpo, Usan and Ofon II in Nigeria; Ekofisk in Norway; the Mahakam zone in Indonesia; the Alwyn zone in the United Kingdom; Moho Bilondo in the Republic of the Congo; and Anguille in Gabon. ROACE for the Upstream segment decreased to 18.2% in 2009 from 35.9% in 2008. The decrease was mainly due to the adjusted net operating income having decreased, principally due to lower hydrocarbon prices. 2008 vs. 2007
Upstream segment sales (excluding sales to other segments) were up 23% to€24,256 million in 2008 compared to€19,706 million in 2007, reflecting higher average hydrocarbon prices, which more than offset the impacts of the decrease of the dollar compared to the euro and a decrease in production.
TOTAL’s average liquids price realization(3) in 2008 increased 32% to $91.1/b from $68.9/b in 2007, in line with the increase in the average Brent price of oil, which was $97.3/b in 2008 compared to $72.4/b in 2007. TOTAL’s average natural gas price realization(3) increased 37% to $7.38/MBtu in 2008 from $5.40/MBtu in 2007.
For 2008, adjusted net operating income for the Upstream segment increased 21% to€10,724 million compared to€8,849 million in 2007. The increase in adjusted net operating income was mainly due to the positive impacts of the price of hydrocarbons (+€3.5 billion) partially offset by the negative impacts of the weaker dollar (-€0.6 billion), lower production (-€0.5 billion) and higher production costs (-€0.5 billion).
The exclusion of special items (which in 2008 comprised principally an asset impairment of€171 million on the Joslyn project and the net impact of contract renegotiations of€106 million) had a positive impact of€278 million on adjusted net operating income for the Upstream segment in 2008 compared to a positive impact of€12 million in 2007 (comprised principally of asset impairments of€93 million largely offset by capital gains of€89 million).
1. | The “price effect” refers to the impact of hydrocarbon prices on entitlement volumes from production sharing and buyback contracts. For example, as the price of oil or gas increases above certain pre-determined levels, TOTAL’s share of production normally decreases. |
2. | FASB Accounting Standards Codification Topic 932, Extractive industries — Oil and Gas. |
3. | Consolidated subsidiaries, excluding fixed margin and buyback contracts. |
ROACE for the Upstream segment increased to 35.9% in 2008 from 33.6% in 2007. The increase was mainly due to adjusted net operating income having increased more than the average level of capital employed, which was principally due to higher hydrocarbon prices.
In 2008, Upstream net operating income amounted to€10,446 million (for 2007,€8,837 million) from operating income of€23,468 million (for 2007,€19,503 million), with the difference resulting primarily from taxes on net operating income of€14,563 million (€11,996 million in 2007), partially offset by income from equity affiliates and other items of€1,541 million (€1,330 million in 2007).
Oil and gas production in 2008 averaged 2,341 kboe/d compared to 2,391 kboe/d in 2007. This 2% decrease was due to the negative impacts of the price effect (-2%), unscheduled shutdowns (-2.5%, mainly on the Elgin Franklin field in February, the Bruce and Alwyn fields in the summer and the Al Jurf field from April to the end of December 2008, as described in Item 4 of this Annual Report) and changes in the portfolio (-1%) partially offset by the positive impact of underlying production growth (+3.5%, primarily from production ramp-ups and start-ups of major TOTAL-operated projects, including Dolphin, Rosa, Jura and Dalia, net of the normal decline on existing fields). Underlying
production growth in 2008, excluding the price effect and changes in the portfolio, was +1%.
The Group’s proved reserves at December 31, 2008, remained steady at 10,458 Mboe compared to 10,449 Mboe at December 31, 2007. At the 2008 average rate of production, these reserves represent approximately 12 years of production.
See “Item 4. Information on the Company — Exploration & Production — Reserves” for a table showing changes in proved reserves by year and “Supplemental Oil and Gas Information (Unaudited)” contained elsewhere herein for additional information on proved reserves, including tables showing changes in proved reserves by region.
Total capital expenditures of the Upstream segment increased by 13% to€10,017 million in 2008 from€8,882 million in 2007. In 2008, capital expenditures mainly included the following projects: Kashagan in Kazakhstan; Akpo, Usan and OML 58 in Nigeria; Pazflor, Angola LNG and Tombua Landana in Angola; Ekofisk in Norway; the Mahakam zone in Indonesia; the Alwyn zone in the United Kingdom; Moho Bilondo in the Republic of the Congo and Anguille in Gabon.
Downstream results | | | | | | | | | | | (M€) | | 2009 | | | 2008 | | | 2007 | | Non-Group sales | | 100,518 | | | 135,524 | | | 119,212 | | Operating income(a) | | 2,237 | | | 826 | | | 4,824 | | Equity in income (loss) of affiliates and other items | | 169 | | | (158 | ) | | 284 | | Tax on net operating income | | (633 | ) | | (143 | ) | | (1,482 | ) | Net operating income(a) | | 1,773 | | | 525 | | | 3,626 | | Adjustments affecting net operating income | | (820 | ) | | 2,044 | | | (1,091 | ) | Adjusted net operating income(b) | | 953 | | | 2,569 | | | 2,535 | | Investments | | 2,771 | | | 2,418 | | | 1,875 | | Divestments | | 133 | | | 216 | | | 394 | | | | | | ROACE | | 7% | | | 20% | | | 21% | |
| | | | | | | | | | | | | | | (M€) | | 2010 | | | 2009 | | | 2008 | | | Non-Group sales | | | 123,245 | | | | 100,518 | | | | 135,524 | | Operating income(a) | | | 982 | | | | 2,237 | | | | 826 | | | Equity in income (loss) of affiliates and other items | | | 141 | | | | 169 | | | | (158 | ) | | Tax on net operating income | | | (201 | ) | | | (633 | ) | | | (143 | ) | Net operating income(a) | | | 922 | | | | 1,773 | | | | 525 | | | Adjustments affecting net operating income | | | 246 | | | | (820 | ) | | | 2,044 | | Adjusted net operating income(b) | | | 1,168 | | | | 953 | | | | 2,569 | | | Investments | | | 2,343 | | | | 2,771 | | | | 2,418 | | | Divestments | | | 499 | | | | 133 | | | | 216 | | | | | | | | | | | | | | | | | ROACE | | | 8% | | | | 7% | | | | 20% | |
(a) | | | | (a) | | For the definition of operating income and net operating income, see Note 2 to the Consolidated Financial Statements. |
| (b) | | Adjusted for special items and the inventory valuation effect. See Notes 2 and 4 to the Consolidated Financial Statements. |
For the full year 2010, the European Refining Margin Indicator (ERMI) was 27.4 $/t, an increase of 54% compared to 2009. Downstream segment sales (excluding sales to other segments) were €123,245 million in 2010, an increase of 23% from €100,518 million in 2009. Refined product sales (including trading operations) were 3,776 kb/d in 2010, an increase of 4% compared to 3,616 kb/d in 2009. Refinery throughput in 2010 was 2,009 kb/d, a 7% decrease compared to 2,151 kb/d in 2009. For the full year 2010, the refinery utilization rate based on crude throughput was 73% (77% for crude and other feedstock) compared to 78% in 2009 (83% for crude and other feedstock), reflecting essentially the shutdown of the Dunkirk refinery and a distillation unit at the Normandy refinery as well as impacts from strikes in France. In 2010, the level of scheduled turnarounds for refinery maintenance was low, with turnaround activity expected to increase notably in 2011. In 2010, Downstream net operating income decreased to €922 million (for 2009, €1,773 million) from operating income of €982 million (for 2009, €2,237 million), with the difference between net operating income and operating income resulting primarily from taxes on net operating income of €201 million (for 2009, €633 million), partially offset by income from equity affiliates and other items of
71
€141 million (for 2009, €169 million). The decrease in 2010 compared to 2009 was due primarily to the impairment charge for French and UK refining assets referred to below. The Downstream segment’s adjusted net operating income in 2010 was €1,168 million compared to €953 million in 2009. The increase is essentially due to the positive impact of the refining margin improvement, which was partially offset by lower throughput and reliability of the Group’s refineries in 2010 and less favorable conditions for supply optimization. Adjusted net operating income for the Downstream segment excludes any after-tax inventory valuation effect and special items. The adjustment for the inventory valuation effect had a negative impact on Downstream adjusted net operating income in 2010 of €640 million compared to a negative impact of €1,285 million in 2009. The exclusion of special items (comprised essentially of impairments on European refining assets (as described below), partially offset by gains on asset sales) in 2010 had a positive impact of €886 million on adjusted net operating income. In 2009, the exclusion of special items (relating mainly to refining asset impairments and other elements) had a positive impact of €465 million on adjusted net operating income. The persistence of an unfavorable economic environment for refining, affecting Europe in particular, led the Group to recognize an impairment in the Downstream segment, essentially on French and UK refining assets, in the fourth quarter 2010 in the amount of €1,192 million in operating income and €913 million in net operating income. These elements have been treated as adjustment items. Investments by the Downstream segment were €2,343 million in 2010, compared to €2,771 million in 2009. ROACE for the Downstream segment was 8% in 2010 compared to 7% in 2009. €2009 vs. 2008100,518
For the full year 2009, the ERMI was 17.8 $/t, a decrease of 65% compared to 2008. Downstream segment sales (excluding sales to other segments) were €100,518 million in 2009, a decrease of 26% from €135,524 €135,524 million in 2008. Refined product sales averaged(including trading operations) were 3,616 kb/d in 2009, decreasing slightly from 3,658 kb/d in 2008. Refinery throughput in 2009 was 2,151 kb/d, a 9% decrease compared to 2,362 kb/d in 2008. For the full year 2009, the refinery utilization rate based on crude throughput was 78% (83% for crude and other feedstock) compared to 88% in 2008 (91% for crude and other feedstock), reflecting the voluntary throughput reductions in the Group’s refineries. Five refineries had scheduled turnarounds for maintenance in 2009 compared to six in 2008. Turnaround activity in 2010 is expected to be lower than in 2009. In 2009, Downstream net operating income increased to€1,773 €1,773 million (for 2008,€525 €525 million) from operating income of€2,237 €2,237 million (for 2008,€826 €826 million), with the difference between net operating income and operating income resulting primarily from taxes on net operating income of€633 €633 million (for 2008,€143 €143 million), partially offset by income from equity affiliates and other items of€169 €169 million (for 2008, loss of€158 €158 million). The Downstream segment’s adjusted net operating income in 2009 decreased 63% to €953 €953 million compared to €2,569 €2,569 million in 2008, reflecting essentially the sharp decrease in the demand for refined products and in refining margins. Adjusted net operating income for the Downstream segment excludes any after-tax inventory valuation effect and special items. The adjustment for the inventory valuation effect had a negative impact on Downstream adjusted net operating income of €1,285 €1,285 million compared to a positive impact of €1,971 €1,971 million in 2008. The exclusion of special items (relating mainly to refining asset impairments and other elements) in 2009 had a positive impact of €465 €465 million on the adjusted net operating income. In 2008, the exclusion of special items (relating principally to restructuring charges of €70 €70 million and other special items) had a positive impact of €73 €73 million on adjusted net operating income. Investments by the Downstream segment were €2,771 €2,771 million in 2009, compared to €2,418 €2,418 million in 2008. ROACE for the Downstream segment was 6.6% in 2009 compared to 19.9% in 2008 due principally to the significant decrease in adjusted net operating income.
72
2008 vs. 2007
Downstream segment sales (excluding sales to other segments) increased 14% to€135,524 million in 2008 compared to€119,212 million in 2007.
In 2008, refined product sales averaged 3,658 kb/d, down 3% from 3,774 kb/d in 2007. 2008 refinery throughput decreased slightly to 2,362 kb/d from 2,413 kb/d in 2007. The refinery utilization rate for 2008 based on crude throughput was 88% (91% based on crude and other feedstock) compared to 87% (89% based on crude and other feedstock) in 2007. In 2008, six refineries were affected by turnarounds compared to
ten in 2007. The level of refinery turnarounds in 2009 is expected to be comparable to the 2008 level.
For 2008, adjusted net operating income for the Downstream segment increased 1% to€2,569 million compared to€2,535 million in 2007. This result mainly reflects the generally satisfactory environment, with gains in Europe (€0.55 billion) in 2008 offset by losses in U.S. refining (-€0.2 billion) stemming from the negative environment and from hurricanes, as well as benefits recorded from increased productivity and supply optimization, particularly during the fourth quarter of 2008. However, net operating income was negatively affected by a 70% decrease in income from equity affiliates to€77 million in 2008 from€258 million in 2007, mainly due to losses incurred through TOTAL’s participation in Wepec, its Chinese refining affiliate.
The adjustment for the inventory valuation effect had a positive impact on Downstream adjusted net operating income of€1,971 million in 2008 compared to a negative impact of€1,098 million in 2007. In 2008, the exclusion of special items (relating principally to restructuring charges of€70 million and other special items) had a positive impact of€73 million on adjusted net operating income. The exclusion of special items in 2007 had a negative impact of€7 million, with capital gains of€101 million more than offsetting restructuring charges, asset impairments and other special items.
ROACE for the Downstream segment was 19.9% in 2008 compared to 20.6% in 2007 due principally to increased investment in 2008.
In 2008, Downstream net operating income decreased to€525 million (for 2007,€3,626 million) from operating income of€826 million (for 2007,€4,824 million), with the difference resulting primarily from taxes on net operating income of€143 million (for 2007,€1,482 million) and from the loss from equity affiliates and other items of€158 million (for 2007, income of€284 million).
Investments by the Downstream segment were€2,418 million in 2008 compared to€1,875 million in 2007.
Chemicals | | | | | | | | | | | (M€) | | 2009 | | | 2008 | | | 2007 | | Non-Group sales | | 14,726 | | | 20,150 | | | 19,805 | | Operating income(a) | | 553 | | | (58 | ) | | 1,424 | | Equity in income (loss) of affiliates and other items | | (58 | ) | | (34 | ) | | (11 | ) | Tax on net operating income | | (92 | ) | | 76 | | | (426 | ) | Net operating income(a) | | 403 | | | (16 | ) | | 987 | | Adjustments affecting net operating income | | (131 | ) | | 684 | | | (140 | ) | Adjusted net operating income(b) | | 272 | | | 668 | | | 847 | | Investments | | 631 | | | 1,074 | | | 911 | | Divestments | | 47 | | | 53 | | | 83 | | | | | | ROACE | | 4% | | | 9% | | | 12% | |
| | | | | | | | | | | | | | | (M€) | | 2010 | | | 2009 | | | 2008 | | | Non-Group sales | | | 17,490 | | | | 14,726 | | | | 20,150 | | Operating income(a) | | | 964 | | | | 553 | | | | (58 | ) | | Equity in income (loss) of affiliates and other items | | | 215 | | | | (58 | ) | | | (34 | ) | | Tax on net operating income | | | (267 | ) | | | (92 | ) | | | 76 | | Net operating income(a) | | | 912 | | | | 403 | | | | (16 | ) | | Adjustments affecting net operating income | | | (55 | ) | | | (131 | ) | | | 684 | | Adjusted net operating income(b) | | | 857 | | | | 272 | | | | 668 | | | Investments | | | 641 | | | | 631 | | | | 1,074 | | | Divestments | | | 347 | | | | 47 | | | | 53 | | | | | | | | | | | | | | | | | ROACE | | | 12% | | | | 4% | | | | 9% | |
(a) | | | | (a) | | For the definition of operating income and net operating income, see Note 2 to the Consolidated Financial Statements. |
| (b) | | Adjusted for special items and the inventory valuation effect. See Notes 2 and 4 to the Consolidated Financial Statements. |
2010 vs. 2009 For the full year 2010, Chemicals segment sales, excluding intra-Group sales, were €17,490 million, an increase of 19% compared to 2009. In 2010, net operating income for the Chemicals segment was €912 million (for 2009, €403 million) from an operating income of €964 million (for 2009, €553 million), with the difference between net operating income and operating income resulting primarily from a gain from equity affiliates and other items of €215 million (for 2009, a loss of €58 million) offset by a loss from taxes on net operating income of €267 million (for 2009, a tax loss of €92 million). The adjusted net operating income for the Chemicals segment in 2010 was €857 million compared to €272 million in 2009. The adjusted net operating income for the Base chemicals increased by €377 million from 2009 to 2010, due to an improved environment and the ramp up of new production units in Qatar. In 2010, the Specialties chemicals benefited from strong operational performance and good positioning in growth markets. Adjusted net operating income for the Chemicals segment excludes any after-tax inventory valuation effect and special items. The exclusion of the inventory valuation effect had a negative impact on Chemicals adjusted net operating income of €113 million in 2010, compared to a negative impact of €254 million in 2009. In 2010, the exclusion of special items had a positive impact on Chemicals adjusted net operating income of €58 million. In 2009, the exclusion of special items (comprised primarily of asset impairments and other elements) had a positive impact on Chemicals adjusted net operating income of €123 million. Investments by the Chemicals segment increased to €641 million in 2010 compared to €631 million in 2009. ROACE for the Chemicals segment was 12% in 2010 compared to 4% in 2009 due principally to the significant increase in adjusted net operating income. Chemicals segment sales (excluding sales to other segments) were €14,726 €14,726 million in 2009, a decrease of 27% from €20,150 €20,150 million in 2008. In 2009, net operating income for the Chemicals segment was €403 €403 million (for 2008, a loss of €16 €16 million) from an operating income of € 553 million (for 2008, an operating loss of €58 €58 million), with the difference between net operating income and operating income resulting primarily from losses from equity affiliates and other items of €58 €58 million (for 2008, €34 €34 million) and taxes on net operating income of €92 €92 million (for 2008, a tax gain of €76 €76 million). The Chemicals segment’s adjusted net operating income in 2009 was €272 €272 million as compared to €668 €668 million in 2008, a decrease of 59% that was essentially due to the significantly weaker market conditions for the Base chemicals activity and, to a lesser degree, lower sales and results from the Specialties activity. Adjusted net operating income for the Chemicals segment excludes any after-tax inventory valuation effect and special items. The exclusion of the inventory valuation effect had a negative impact on Chemicals adjusted net operating income of €254 €254 million in 2009, compared to a positive impact of €504 €504 million in 2008. In 2009, the exclusion of special items (comprised primarily of asset impairments and other elements) had a positive impact on Chemicals adjusted net operating income of €123 €123 million. In 2008, the exclusion of special items (relating principally to restructuring costs, asset impairment and other elements) had a positive impact of €180 €180 million on adjusted net operating income. Investments by the Chemicals segment decreased to €631 €631 million in 2009 compared to €1,074 €1,074 million in 2008. ROACE for the Chemicals segment was 3.8% in 20082009 compared to 9.2% in 2008 due principally to the significant decrease in adjusted net operating income.
73
2008 vs. 2007
Chemicals segment sales (excluding sales to other segments) increased by 2% to€20,150 million in 2008 from€19,805 million in 2007.
Adjusted net operating income for the Chemicals segment decreased by 21% to€668 million in 2008 from€847 million in 2007, due to the negative market environment faced by the Chemicals segment. In the first half of 2008, the Chemicals segment was challenged by the rapid increase in oil prices, while in the second half of the year, despite benefiting from a rebound in margins, it suffered from falling demand linked to the worldwide economic downturn.
The adjustment for the inventory valuation effect had a positive impact of€504 million on adjusted net operating income for the Chemicals segment in 2008, compared to a negative impact of€201 million in 2007. In 2008, the exclusion of special items (relating principally to restructuring costs, asset impairment and other elements) had a positive impact of€180 million on adjusted net operating income. In 2007, the exclusion of special items (comprised of restructuring charges, asset impairments and other elements) had a positive impact of€61 million on adjusted net operating income.
ROACE for the Chemicals segment was 9.2% in 2008 compared to 12.1% in 2007 due principally to a decrease in adjusted net operating income.
In 2008, net operating income amounted to a loss of€LIQUIDITY AND CAPITAL RESOURCES16 million (for 2007, a gain of€987 million) from an operating loss of€58 million (for 2007, operating income of€1,424 million), with the difference resulting primarily from losses from equity affiliates and other items of€34 million (for 2007,€11 million), and gains on taxes on
net operating income of€76 million (for 2007, a loss of€426 million).
Investments by the Chemicals segment increased to€1,074 million in 2008 compared to€911 million in 2007.
Liquidity And Capital Resources
| | | | | | | | | | | (M€) | | 2009 | | | 2008 | | | 2007 | | Cash flow from operating activities | | 12,360 | | | 18,669 | | | 17,686 | | Including (increase) decrease in working capital | | (3,316 | ) | | 2,571 | | | (1,476 | ) | Cash flow used in investing activities | | (10,268 | ) | | (11,055 | ) | | (10,166 | ) | Total expenditures | | (13,349 | ) | | (13,640 | ) | | (11,722 | ) | Total divestments | | 3,081 | | | 2,585 | | | 1,556 | | Cash flow used in financing activities | | (2,868 | ) | | (793 | ) | | (3,342 | ) | Net increase (decrease) in cash and cash equivalents | | (776 | ) | | 6,821 | | | 4,178 | | Effect of exchange rates | | 117 | | | (488 | ) | | (683 | ) | Cash and cash equivalents at the beginning of the period | | 12,321 | | | 5,988 | | | 2,493 | | | | | | Cash and cash equivalents at the end of the period | | 11,662 | | | 12,321 | | | 5,988 | |
| | | | | | | | | | | | | | | (M€) | | 2010 | | | 2009 | | | 2008 | | Cash flow from operating activities | | | 18,493 | | | | 12,360 | | | | 18,669 | | | Including (increase) decrease in working capital | | | (496 | ) | | | (3,316 | ) | | | 2,571 | | Cash flow used in investing activities | | | (11,957 | ) | | | (10,268 | ) | | | (11,055 | ) | | Total expenditures | | | (16,273 | ) | | | (13,349 | ) | | | (13,640 | ) | | Total divestments | | | 4,316 | | | | 3,081 | | | | 2,585 | | Cash flow used in financing activities | | | (3,348 | ) | | | (2,868 | ) | | | (793 | ) | Net increase (decrease) in cash and cash equivalents | | | 3,188 | | | | (776 | ) | | | 6,821 | | | Effect of exchange rates | | | (361 | ) | | | 117 | | | | (488 | ) | | Cash and cash equivalents at the beginning of the period | | | 11,662 | | | | 12,321 | | | | 5,988 | | | | | | | | | | | | | | | | Cash and cash equivalents at the end of the period | | | 14,489 | | | | 11,662 | | | | 12,321 | |
TOTAL’s cash requirements for working capital, share buybacks, capital expenditures and acquisitions over the past three years were financed primarily by a combination of funds generated from operations, borrowings and divestments of non-core assets. In the current environment, TOTAL expects its external debt to be principally financed from the international debt capital markets. The Group continually monitors the balance between cash flow from operating activities and net expenditures. In the Company’s opinion, its working capital is sufficient for its present requirements. The largest part (approximately 90%85%) of TOTAL’s capital expenditures is made up of additions to intangible assets and property, plant and equipment, with the remainder attributable to equity-method affiliates and to acquisitions of subsidiaries. In the Upstream segment, as described in more detail under “Supplemental Oil and Gas Information (Unaudited) — Costs incurred in oil and gas property acquisition, exploration and development activities”, capital expenditures are principally development costs (approximately 80%65% mainly for construction of new production facilities), exploration expenditures (successful or unsuccessful, approximately 10%) and acquisitions of proved and unproved properties (approximately 5%25%). In the Downstream segment, about 65%70% of capital expenditures are related to refining activities (essentially 35%40% for existing units including maintenance and major turnarounds and 65%60% for new construction), the balance being used in marketing/retail activities and for information systems. In the Chemicals segment, capital expenditures relate to all activities, and are split between Base Chemicals (approximately 65%75%) and Specialties (approximately 35% 25%). For detailed information on expenditures by business segment, please refer to the discussion of TOTAL’s results for each segment above.
Cash flow from operating activities was €12,360 €18,493 million in 2010 compared to €12,360 million in 2009 compared to€18,669and €18,669 million in 2008 and€17,6862008. The €6,133 million in 2007. The€6,309 million decreaseincrease in cash flow from operating activities from 20082009 to 20092010 was due in part to lowerhigher net income (Group share), which decreasedincreased by €2,143 €2,124 million over the same period. The cash flow from operating activities was also affected by the effect of changes in oil and oil productsproduct prices on the Group’s working capital requirement. As IFRS rules require TOTAL to account for inventories of petroleum products according to the FIFO method, an increase in oil and oil productsproduct prices at the end of the relevant period compared to the beginning of the same period generates, all other factors remaining equal, an increase in inventories and accounts receivable net of an increase in accounts payable, resulting in an increase in working capital requirements. Similarly, a decrease in oil and oil products prices generates a decrease in working capital requirements. Whereas in 2008In 2010, the Group’s working capital requirement had decreasedincreased by €2,571 million due primarily to the decrease in oil and oil products prices particularly in the fourth quarter of the year, in €496 million. In 2009, the Group’s working capital requirement increased by €3,316 €3,316 million, mainly as a result of risingdue primarily to the increase in oil and oil products prices over the course of the year. Cash flow used in investing activities was€10,268 €11,957 million in 2010, compared to €10,268 million in 2009 compared to€11,055and €11,055 million in 2008 and€10,1662008. Total expenditures were €16,273 million in 2007. Total expenditures were€13,3492010, up 22% from €13,349 million in 2009, downafter having decreased 2% from€13,640 €13,640 million in 2008, after having increased 16% from€11,722 million in 2007.2008. During 2009, 74%2010, 81% of the expenditures were made by the Upstream segment (as compared to 74% in 2009 and 73% in 2008 and 76% in 2007)2008), 21%14% by the Downstream segment (as compared to 21% in 2009 and 18% in 20082008) and 16% in 2007) and 5%4% by the Chemicals segment (as compared to 5% in 2009 and 8% in 2008 and 2007)2008). The main source of funding for these expenditures has been cash from operating activities.
Divestments, based on selling price and net of cash sold, were€3,081 €4,316 million in 2010 compared to €3,081 million in 2009 compared to€2,585and €2,585 million in 20082008. In 2010, the Group’s principal divestments were asset sales of €3,442 million, consisting mainly of Sanofi-Aventis shares and€1,556 million the
74
Group’s interests in 2007.the Valhall/Hod fields in Norway and in Block 31 in Angola. In 2009, the Group’s principal divestments were asset sales of €2,663 €2,663 million, consisting mainly of Sanofi-Aventis shares. In 2008, the Group’s principal divestments were asset sales of €1,451 €1,451 million, consisting mainly of Sanofi-Aventis shares and reimbursements for carried investments in Yemen, Venezuela and Nigeria. In 2007, the Group sold certain Upstream assets in Canada, the UK and Norway and Downstream assets in the UK. The Group also sold 0.4% of the share capital of Sanofi-Aventis in the fourth quarter of 2007 for€316 million. Cash flow used in financing activities was €2,868 €3,348 million in 2010, compared to €2,868 million in 2009 compared to€793and €793 million in 2008 and€3,342 million in 2007.2008. The increase in cash flow used in financing activities compared to 20082009 is due primarily to a decrease in current borrowings in 2009 compared to an increase in 2008, partially offset by a higherlower issuance of non-current financial debt in 2010, partially offset by a lower decrease in current borrowings in 2010 compared to 2009. TOTAL’s non-current financial debt was €19,437 €20,783 million at year-end 2010 compared to €19,437 million at year-end 2009 compared to€16,191and €16,191 million at year-end 2008 and€14,876 million at year-end 2007.2008. For further information on the Company’s level of borrowing and the type of financial instruments, including maturity profile of debt and currency and interest rate structure, see Note 20 to the Consolidated Financial Statements. For further information on the Company’s treasury policies, including the use of instruments for hedging purposes and the currencies in which cash and cash equivalents are held, see “Item 11. Quantitative and Qualitative Disclosures About Market Risk”. Cash and cash equivalents were €11,662 €14,489 million at year-end 2010 compared to €11,662 million at year-end 2009 compared to€12,321and €12,321 million at year-end 2008 and€5,988 million at year-end 2007.2008. Shareholders’ equity was €53,539 €61,271 million at December 31, 2009,2010, compared to €49,950 €53,539 million at year-end 20082009 and €45,700 €49,950 million at year-end 2007.2008. Changes in shareholders’ equity in 2010 were primarily due to the addition of net income and translation adjustments, which were only partially offset by the payment of dividends. Changes in shareholders’ equity in 2009 were primarily due to the addition of net income, which was only partially offset by the payment of dividends and translation adjustments. During 2009, TOTAL did not repurchase any of its own shares. Changes in shareholders’ equity in 2008 were primarily due to the addition of net income, which was only partially offset by the payment of dividends, translation adjustments and share buybacks. During 2008,Whereas during 2010 and 2009, TOTAL did not repurchase any of its own shares, TOTAL repurchased 27.6 million of its own shares for €1,339 million. Changes in shareholders’ equity in 2007 were primarily due to the addition of net income, which was only partially offset by the payment of dividends, translation adjustments and share buybacks. During 2007, TOTAL repurchased 32.4 €1,339 million of its own shares for€1,787 million.during 2008. As of December 31, 2009,2010, TOTAL’s net-debt-to-equity ratio, which is the sum of current borrowings, other current financial liabilities and non-current financial debt, net of current financial assets, hedging instruments on non-current financial debt and cash and cash equivalents, divided by the sum of shareholders’ equity and minority interests after expected dividends payable, was 27%22%, compared to 23%27% and 27%23% at year-ends 20082009 and 2007,2008, respectively. Over the 2007-20092008-2010 period, TOTAL used its net cash flow (cash flow from operating activities less investments plus divestments) to maintain this ratio generally in its target range of around 25% to 30%, primarily by managing net debt (financial short-term debt plus non-current debt less cash and cash equivalents)(as described above), while net income increased shareholders’ equity and dividends paid throughout the period and repurchases of shares performed in 2007 and 2008 decreased shareholders’ equity. As of December 31, 2009,2010, TOTAL S.A. had $9,322$9,592 million of long-term confirmed lines of credit, of which $9,289$9,581 million were unused. In 2010,2011, based on the Group’s capital expenditures budget and after payment of dividends, the Company expects to maintain its netdebt-to-equity ratio in the targeted range of around 25% to 30%. in an $80 per barrel market environment.
75
Guarantees and Other Off-balance Sheet Arrangements
GUARANTEES AND OTHER OFF-BALANCE SHEET ARRANGEMENTS As part of certain project financing arrangements, Total S.A. has provided in 2008 guarantees for a maximum aggregate amount of€1.3 billion in connection with the financing of the Yemen LNG project for an amount of €1,335 million, presented under “Guarantees given against borrowings” in Note 23 to the Consolidated Financial Statements. In turn, certain partners involved in this project have given commitments that could, in the case of Total S.A.’s guarantees being called for the maximum amount, reduce the Group’s exposure by up to€0.4 billion, €427 million, recorded under “Other commitments received” in the same Note. “Guarantees given against borrowings” also include the guarantees provided in 2010 by Total S.A. in connection with the financing of the Jubail project (operated by SAUDI ARAMCO TOTAL Refining and Petrochemical Company (SATORP)) of up to €2,385 million, proportional to TOTAL’s share in the project (37.5%). In addition, Total S.A. provided in 2010 a guarantee in favor of its partner in the Jubail project (Saudi Arabian Oil Company) with respect to Total Refining Saudi Arabia SAS’s obligations under the shareholders agreement with respect to SATORP. As of December 31, 2010, this guarantee is of up to €1,271 million and has been presented under “Other operating commitments” in Note 23 to the Consolidated Financial Statements. These guarantees and other information on the Company’s commitments and contingencies are presented in Note 23 to the Consolidated Financial Statements. The Group does not currently consider that these guarantees, or any other off-balance sheet arrangements of Total S.A. nor any other members of the Group, currently have or are reasonably likely to have, currently or in the future, to have a material effect on the Group’s financial condition, changes in financial condition, revenues or expenses, results of operation, liquidity, capital expenditureexpenditures or capital resources. Contractual Obligations
| | | | | | | | | | | | Payment due by period (M€) | | Less
than 1 year | | 1-3
years | | 3-5
years | | More
than 5 years | | Total | Non-current debt obligations(a) | | — | | 6,860 | | 5,583 | | 5,709 | | 18,152 | Current portion of non-current debt obligations(b) | | 2,111 | | — | | — | | — | | 2,111 | Finance lease obligations(c) | | 22 | | 75 | | 71 | | 114 | | 282 | Asset retirement obligations(d) | | 235 | | 453 | | 519 | | 4,262 | | 5,469 | Operating lease obligations(c) | | 523 | | 675 | | 447 | | 894 | | 2,539 | Purchase obligations(e) | | 4,542 | | 4,320 | | 5,599 | | 35,347 | | 49,808 | Total | | 7,433 | | 12,383 | | 12,219 | | 46,326 | | 78,361 |
CONTRACTUAL OBLIGATIONS | | | | | | | | | | | | | | | | | | | | | | | | | Less
| | | | | | | | | More
| | | | | | | | than
| | | 1-3
| | | 3-5
| | | than
| | | | | | Payment due by period (M€) | | 1 year | | | years | | | years | | | 5 years | | | Total | | Non-current debt obligations(a) | | | — | | | | 6,831 | | | | 5,561 | | | | 6,346 | | | | 18,738 | | Current portion of non-current debt obligations(b) | | | 3,483 | | | | — | | | | — | | | | — | | | | 3,483 | | Finance lease obligations(c) | | | 23 | | | | 68 | | | | 61 | | | | 46 | | | | 198 | | Asset retirement obligations(d) | | | 177 | | | | 486 | | | | 386 | | | | 4,868 | | | | 5,917 | | Operating lease obligations(c) | | | 582 | | | | 757 | | | | 504 | | | | 1,105 | | | | 2,948 | | Purchase obligations(e) | | | 6,347 | | | | 7,511 | | | | 6,916 | | | | 40,519 | | | | 61,293 | | | | | | | | | | | | | | | | | | | | | | | | Total | | | 10,612 | | | | 15,653 | | | | 13,428 | | | | 52,884 | | | | 92,577 | | | | | | | | | | | | | | | | | | | | | | | |
(a) | | | | (a) | | Non-current debt obligations are included in the items “Non-current financial debt” and “Hedging instruments of non-current financial debt” of the Consolidated Balance Sheet. The figure in this table is net of the non-current portion of issue swaps and swaps hedging bonds, and excludes non-current finance lease obligations of€ €175 million.260 million. |
| (b) | | The current portion of non-current debt is included in the items “Current borrowings”, “Current financial assets” and “Other current financial liabilities” of the balance sheet. The figure in this table is net of the current portion of issue swaps and swaps hedging bonds and excludes the current portion of finance lease obligations of€ €23 million.22 million. |
| (c) | | Finance lease obligations and operating lease obligations: the Group leases real estate, retail stations, ships, and other equipment through non-cancelable capital and operating leases. These amounts represent the future minimum lease payments on non-cancelable leases to which the Group is committed as of December 31, 2009,2010, less the financial expense due on finance lease obligations for€ €43 million.53 million. |
| (d) | | The discounted present value of Upstream asset retirement obligations, primarily asset removal costs at the completion date. |
| (e) | | Purchase obligations are obligations under contractual agreements to purchase goods or services, including capital projects. These obligations are enforceable and legally binding on TOTAL and specify all significant terms, including the amount and the timing of the payments. These obligations mainly include: hydrocarbon unconditional purchase contracts (except where an active, highly liquid market exists and when the hydrocarbons are expected to be re-sold shortly after purchase), reservation of transport capacities in pipelines, unconditional exploration works and development works in Upstream, and contracts for capital investment projects in Downstream. This disclosure does not include contractual exploration obligations with host states where a monetary value is not attributed and purchases of booking capacities in pipelines where the Group has a participation superior to the capacity used. |
For additional information on the Group’s contractual obligations, see Note 23 to the Consolidated Financial Statements. The Group has other obligations in connection with pension plans which are described in Note 18 to the Consolidated Financial Statements. As these obligations are not contractually fixed as to timing and amount, they have not been included in this disclosure. Other non-current liabilities, detailed in Note 19 to the Consolidated Financial Statements, are liabilities related to risks that are probable and amounts that can be reasonably estimated. However, no contractual agreements exist related to the settlement of such liabilities, and the timing of the settlement is not known.
76
Research and Development
RESEARCH AND DEVELOPMENT In 2009, Research2010, research & Development (“R&D”)development (R&D) expenses amounted to €650 €715 million, compared to €612 €650 million in 20082009 and €594 €612 million in 2007.2008.(1) The process initiated in 2004 to increase R&D budgets continued in 2009.2010. In addition, the Group implemented in 2009 a financial device to contribute to the development of start-ups that specialize in the development of innovative technologies in the field of energy. In 2009, 4,0162010, 4,087 employees were dedicated to R&D, compared to 4,016 in 2009 and 4,285 in 2008 and 4,216 in 2007.2008. There are six major axes for research and developmentR&D focuses at TOTAL: developing knowledge, tools and technological mastery to discover and operate technologically complex oil and gas resources to meet global demand for energy;
developing and industrializing solar, biomass and carbon capture and storage technologies to contribute to the evolution of the global energy mix;
| | | • | developing knowledge, tools and technological mastery to discover and operate complex oil and gas resources to help meet the global demand for energy; |
| | | • | developing and industrializing solar, biomass and carbon capture and storage technologies to contribute to changes in the global energy mix; | | • | developing practical, innovative and competitive materials that meet the market’s specific needs, contribute to the emergence of new features and systems, enable current materials to be replaced by materials showing higher performance for users, and address the challenges of improved energy efficiency, lower environmental impact and toxicity and achieve better management of their life cycle; | | • | developing, industrializing and improving conversion processes of oil, coal and biomass to adapt to changes in resources and markets, improve reliability and safety, achieve better energy efficiency, reduce the environmental footprint, and maintain the Group’s economic margins in the long-term; | | • | understanding and measuring the impacts of the Group’s operations and products on ecosystems (water, soil, air, biodiversity) to improve environmental safety, as part of the regulation in place, and reduce their environmental footprint to achieve sustainability in the Group’s operations; and | | • | mastering and using innovative technologies such as biotechnologies, nanotechnologies, high-performance computing, information and communications technologies and new analytic techniques. |
understanding and measuring the impacts of the Group’s operations and products on ecosystems (water, soil, air, biodiversity) to strengthen environmental safety, as part of the regulation in place, and reduce their environmental footprint to achieve sustainability in the Group’s operations;
developing practical, innovative and competitive materials that meet the market’s specific needs, contribute to the emergence of new features and systems, enable current materials to be replaced by materials achieving higher performance, address the challenges of improved energy efficiency, lower environmental impact and toxicity and achieve better management of product life cycle;
developing, industrializing and improving conversion processes of oil, coal and biomass resources to adapt to changes in resources and markets, improve reliability and safety, achieve better energy efficiency, reduce the environmental footprint and maintain economic margins on the long term; and
mastering and using innovative technologies such as biotechnologies, nanotechnologies, high-performance computing, information and communications technologies and new analytic techniques.
These issues are addressed synergistically within a portfolio of projects. Different aspects may be looked at independently by different divisions.
The Group intends to increase R&D atin all theof its business units through cross-functional themes and technologies. Attention is paid to synergies of R&D efforts between business units. The Group has twenty-two R&D sites worldwide and has developed approximately 600 partnerships with other industrial groups and academic or special research institutes. TOTAL also has a permanently renewed network of scientific advisors worldwide that monitor and advise on matters of interest to the Group’s R&D activities. Long-term partnerships with universities and academic laboratories, deemed strategic in Europe, the United States, Japan and China, as well as innovatinginnovative small businesses are part of the Group’s approach. Each business unit is developing an active intellectual property activity, aimed at protecting its developments,innovations, allowing its activity to develop without constraints as well as facilitating its partnerships. In 2009, close to2010, more than 250 new patentspatent applications were issued by the Group. ITEM 6. DIRECTORS, SENIOR MANAGEMENT AND EMPLOYEES Composition of the Board of Directors Directors are appointed by the shareholders for a 3-yearthree-year term (Article 11 of the Company’s bylaws)by-laws). In case of the resignation or death of a director between two shareholders’ meetings,Shareholders’ Meetings, the Board may temporarily appoint a replacement director. This appointment must be ratified by the next shareholders’ meeting.Shareholders’ Meeting. The terms of office of the members of the Board are staggered to more evenly space the renewal of appointments. The Board of Directors appoints the Chairman of the Board of Directors from among its members. The Board of Directors also appoints the Chief Executive Officer who may or may not be a member of the Board. As of December 31, 2009,2010, the Board of Directors hadhas fifteen members. Of these, one director hadhas been elected by the shareholders to represent employee shareholders. (1) Including, starting in 2009, expenses for Exploration & Production pilot facilities.
77
The following individuals were members of the Board of Directors of TOTAL S.A. in 2009.(1)Thierry Desmarest
64 years old.
A graduate(information as of theÉcole Polytechnique and a Mining Engineer, Mr. Desmarest served as Director of Mines and Geology in New Caledonia, then as technical advisor on the staffs of the Minister of Industry and the Minister of Economy. He joined TOTAL in 1981, where he held various management positions, then served as President of Exploration & Production until 1995. He served as Chairman and Chief Executive Officer of TOTAL from May 1995 until February 2007, and continues to serve as Chairman of the Board of TOTAL.
December 31, 2010).Director of TOTAL S.A. since 1995 and until 2010 (last renewal: May 11, 2007).
Holds 380,576 shares.
Principal other directorships
• | | Director of Sanofi-Aventis.*
|
Director of Air Liquide.*
Director of Bombardier Inc. (Canada).*
Christophe de Margerie 58 years old.
Born on August 6, 1951 (French) Mr. de Margerie joined the Group after graduating from theÉcole Supérieure de Commercein Paris in 1974. He served in several positions in the Group’s Finance Department and Exploration & Production division. He became presidentPresident of Total Middle East in 1995 before joining the Group’s executive committee as the President of the Exploration & Production division in May 1999. He then became Senior Executive Vice President of Exploration & Production of the new TotalFinaElf group in 2000. In January 2002 he became President of the Exploration & Production division of TOTAL. He was appointed a member of the Board of Directors by the Shareholders’ Meeting held on May 12, 2006 and became Chief Executive Officer of TOTAL on February 14, 2007. On May 21, 2010, he was appointed Chairman and Chief Executive Officer of TOTAL. Director of TOTAL S.A. since 2006 and until 2012 (last renewal: May 15, 2009). Holds 85,230 TOTAL shares and 43,71448,529 shares of the TOTAL ACTIONNARIAT FRANCE collective investment fund. Principal other directorships | | | • | Member of the Supervisory Board ofVivendi* |
Thierry Desmarest Born on December 18, 1945 (French) A graduate of theÉcole Polytechniqueand an Engineer of the FrenchCorps des Mines, Mr. Desmarest served as Director of Mines and Geology in New Caledonia, then as technical advisor at the Offices of the Minister of Industry and the Minister of Economy. He joined TOTAL in 1981, where he held various management positions, then served as President of Exploration & Production until 1995. He served as Chairman and Chief Executive Officer of Elf Aquitaine.* MemberTOTAL from May 1995 until February 2007, and then as Chairman of the Supervisory Board of Vivendi.*
TOTAL until May 21, 2010. He was appointed Honorary Chairman and remains a director of TOTAL and Chairman of the TOTAL foundation.Director of TOTAL S.A. since 1995 and until 2013 (last renewal: May 21, 2010). Holds 360,576 shares. Principal other directorships | | | • | Director of Sanofi-Aventis* | | • | Director ofAir Liquide* | | • | Director ofRenault SA* | | • | Director ofRenault SAS | | • | Director ofBombardier Inc. (Canada)* |
Patrick Artus58 years old.
Born on October 14, 1951 (French) Independent director A graduate from theÉcole Polytechnique,, theÉcole École Nationale de la Statistique et de l’Administration de l’Économie (ENSEA)(ENSAE) and theInstitut d’Études Politiques de Paris, Mr. Artus began his career at the INSEE (French National Institute for Statistics and Economic Studies) where his work included economic forecasting and modelling.modeling. He then worked at the Economics Department of the OECD (1980), later becoming the Head of Research at the ENSAE from 1982 to 1985. He was scientific adviser at the research department of theBanque de France, before joining the Natixis Group as the head of the research department. He is a professor at theÉcoleEcole Polytechniqueand associate professor at the University of Paris I, Sorbonne. He is also a member of the council of economic advisors to the French Prime Minister and of the French National Economic Commission. He has authored many articles and books. Director of TOTAL S.A. since May 5,15, 2009 and until 2012. Principal other directorships * | Company names marked with an asterisk are publicly listed companies. | | • | Director ofIPSOS |
1. | Information as of December 31, 2009. |
* Company names marked with an asterisk are publicly listed companies. Underlined companies are companies excluded from the group in which the director has his or her main duties.
78
Patricia Barbizet54 years old.
Born on April 17, 1955 (French) Independent director A graduate of the École Supérieure de Commerceof Paris in 1976, Mrs. Barbizet started her career in the Renault Group as the Treasurer of Renault Véhicules Industriels and Chief Financial Officer of Renault Crédit International. She joined the Pinault group in 1989 as the Chief Financial Officer and then served from 1992 as the Chief Executive Officer (non director) of Financière Pinault until 2009. Since 1992, she has been theand Director and Chief Executive Officer of Artémis. Since 2005, she has been the Vice Chairman of the PPR Board of Directors and Chairman of Christie’s. Director of TOTAL S.A. since May 18,16, 2008 and until 2011. Principal other directorships • | | | • | Vice Chairman of PPR* Board. Board | | • | Chief Executive Officer and Director of Artémis | | • | Non executive Director of Tawa Plc* | | • | Director ofAir France-KLM* | | • | Director ofBouygues* | | • | Director ofTF1* |
Chief Executive Officer and Director of Artémis.
Director of Air France-KLM.*
Daniel Boeuf
61 years old.
A graduate of theÉcole Supérieure des Sciences Économiques et Commerciales(ESSEC), Mr. Boeuf joined the Group in October 1973 and served in several sales positions before holding various operational positions in Refining & Marketing entities, until, in his last operational position, he was responsible for training and skills management in specialties within the Refining & Marketing division. An elected member of the
Supervisory Board of the TOTAL ACTIONNARIAT FRANCE collective investment fund from 1999 to 2009, he served as the Chairman of its Supervisory Board from 2003 to 2006.
Director of TOTAL S.A. since 2004 (last renewal: May 11, 2007; end of office: December 31, 2009, pursuant to Article 11 of the Company’s bylaws).
Holds 4,396 TOTAL shares and 4,394 shares of the TOTAL ACTIONNARIAT FRANCE collective investment fund.
Daniel Bouton 59 years old.
Born on April 10, 1950 (French) Independent director Inspector General of Finance, Mr. Bouton has held various positions within the French Ministry of Economy. He served as Budget Director at the Ministry of Finance from 1988 to 1990. He joined Société Générale in 1991, where he was appointed Chief Executive Officer in 1993, then Chairman and Chief Executive Officer in November 1997. He has been serving as the Chairman of the Société Générale group since May 12, 2008, and has been the honorary PresidentHonorary Chairman since May 6, 2009. Director of TOTAL S.A. since 1997 and until 2012 (last renewal: May 15, 2009). Principal other directorships | | | • | Director ofVeolia Environnement* |
Gunnar Brock Born on April 12, 1950 (Swedish) Independent director Graduated from the Stockholm School of Economics with an MBA grade in Economics and Business Administration, Mr. Brock held various international positions at Tetra Pak. He served as Chief Executive Officer of Alfa Laval from 1992 to 1994 and as Chief Executive Officer of Tetra Pak from 1994 to 2000. After he served as Chief Executive Officer of Thule International, he was appointed Chief Executive Officer of Atlas Copco AB from 2002 to 2009. He is currently Chairman of the Board of Stora Enso Oy. Mr. Brock is also a member of the Royal Swedish Academy of Engineering Sciences and of the Board of the Stockholm School of Economics. Director of Veolia Environnement.*TOTAL S.A. since May 21, 2010 and until 2013.
Holds 1,000 shares. Principal other directorships * | Company names marked with an asterisk are publicly listed companies. | | • | Chairman of the Board of Stora Enso Oy. |
| | | • | Chairman of the Board ofMölnlycke Health Care Group | | • | Chairman of the Board ofInvestor AB | | • | Member of the Supervisory Board ofSpencer Stuart Scandinavia |
* Company names marked with an asterisk are publicly listed companies. Underlined companies are companies excluded from the group in which the director has his or her main duties. 79
Claude Clément Born on November 17, 1956 (French) Mr. Clément joined the Group in February 1977 and started his career at Compagnie Française de Raffinage which offered him professional training. He held various positions at the Refining Manufacturing Department in French and African refineries (Gabon, Cameroon). He is currently Manager of the Refining Manufacturing Methods at the Refining Manufacturing Division. Mr. Clément has been an elected member of the Supervisory Board of the TOTAL ACTIONNARIAT FRANCE collective investment fund since 2009 and has served as the Chairman of the TOTAL ACTIONS EUROPEENNES collective investment fund since 2010. Director of TOTAL S.A. since May 21, 2010 and until 2013. Holds 820 TOTAL shares and 2,599 shares of the TOTAL ACTIONNARIAT FRANCE collective investment fund. Bertrand Collomb67 years old.
Born on August 14, 1942 (French) Independent director A graduate of the École Polytechniqueand a Mining Engineer,member of France’s engineeringCorps des Mines, Mr. Collomb held a number of positions within the Ministry of Industry and other staffcabinet positions from 1966 to 1975. He joined the Lafarge group in 1975, where he served in various management positions. He served as Chairman and Chief Executive Officer of Lafarge from 1989 to 2003, then as Chairman of the Lafarge Board of Directors from 2003 to 2007 and has been the honorary PresidentHonorary Chairman since 2007. He is also President of the Institut des Hautes Études pour la Science et la Technologie(IHEST) and the Institut Français des Relations Internationales(IFRI). Director of TOTAL S.A. since 2000 and until 2012 (last renewal: May 15, 2009). Principal other directorshipsDirector of DuPont* (United States).
| | | • | Director of Lafarge* | | • | Director ofDuPont* (United States) | | • | Director ofAtco* (Canada) |
Director of Atco* (Canada).
Paul Desmarais Jr.(1) 55 years old.
Born on July 3, 1954 (Canadian) Independent director A graduate of McGill University in Montreal and INSEAD in Fontainebleau, Mr. Desmarais was elected Vice Chairman (1984) then Chairman of the Board (1990) of Corporation Financière Power, a company he helped to found. Since 1996, he has served as Chairman of the Board and Co-Chief Executive Officer of Power Corporation of Canada. Director of TOTAL S.A. since 2002 and until 2011 (last renewal: May 16, 2008). Holds 2,000 ADRs (corresponding to 2,000 shares). Principal other directorships • | | | • | Chairman of the Board, Co-Chief Executive Officer and Member of the Executive Committee of Power Corporation of Canada.Canada * |
Member of the Board, Co-Chief Executive Officer and Chairman of the Executive Committee of Corporation Financière Power* (Canada).
Vice Chairman of the Board of Directors and Acting Managing Director of Pargesa Holding S.A.* (Switzerland).
Member of the Board of Directors and Executive Committee of Great-West Lifeco Inc.* (Canada).
| | | • | Co-Chairman of the Board and member of the executive committee of Power Financial Corporation * (Canada) | | • | Vice Chairman and Acting Managing Director of Pargesa Holding S.A.* (Switzerland) | | • | Member of the Board of Directors and Executive Committee of Great-West Lifeco Inc.* (Canada) | | • | Member of the Board of Directors and Executive Committee of Groupe Bruxelles Lambert S.A.* (Belgium) | | • | Director ofGDF Suez* (France) | | • | Director ofLafarge* |
| | | • | Director and member of the Executive Committee of IGM Financial Inc.* (Canada) |
(1) Mr. Desmarais Jr. is a director of Groupe Bruxelles Lambert, S.A.which acting in concert with Compagnie Nationale à Portefeuille, to the Company’s knowledge, owns 5.6% of the Company’s shares and 5.6% of the voting rights. Mr. Demarais Jr. disclaims beneficial ownership of such shares. * (Belgium).Company names marked with an asterisk are publicly listed companies. Underlined companies are companies excluded from the group in which the director has his or her main duties.
80
Director of GDF Suez* (France).
Director of IGM Financial Inc.* (Canada).
Bertrand Jacquillat 65 years old.
Born on April 11, 1944 (French) Independent director A graduate of École des Hautes Études Commerciales(HEC), Institut d’Éétudes Politiquespolitiques de Parisand Harvard Business School, Mr. Jacquillat holds a PhD in management. He has been a university professor (in both France and the United States) since 1969, and is a professor at the Institut d’Études Politiquesin Paris Vice Presidentsince 1999, Vice-President of the Cercle des Economistes, and member of the Economic Analysis Board to the Prime Minister. He is the founding chairman of Associés en Finance. Director of TOTAL S.A. since 1996 and until 2011 (last renewal: May 16, 2008). Principal other directorshipsChairman and Chief Executive Officer of Associés en Finance.
Member of the Supervisory Board of Klépierre.*
Member of the Supervisory Board of Presses Universitaires de France (PUF).
* | Company names marked with an asterisk are publicly listed companies. | | • | Chairman and Chief Executive Officer of Associés en Finance | | • | Member of the Supervisory Board ofKlépierre* |
1. | Mr. Desmarais Jr. is a director of Groupe Bruxelles Lambert, which acting in concert with Compagnie Nationale à Portefeuille, to the Company’s knowledge, owns 5.4% | | • | Member of the Company’s shares and 5.5%Supervisory Board of the voting rights. Mr. Demarais Jr. disclaims beneficial ownership of such shares.Presses Universitaires de France (PUF) |
Antoine Jeancourt-Galignani
72 years old.
Inspector of Finance, Mr. Jeancourt-Galignani held various positions within the Ministry of Finance before serving as Deputy Managing Director of Crédit Agricole from 1973 to 1979. He became Chief Executive Officer of Indosuez bank in 1979 before serving as its Chairman from 1988 to 1994. He then served as Chairman of Assurances Générales de France (AGF) from 1994 to 2001, before serving as Chairman of Gecina from 2001 to 2005, where he served as a director until 2009.
Director of TOTAL S.A. since 1994 (last renewal: May 12, 2006; end of office: May 15, 2009).
Principal other directorships
Chairman of the Supervisory Board of Euro Disney SCA.*
Director of Kaufman & Broad S.A.*
Member of the Supervisory Board of Oddo et Cie.
Anne Lauvergeon(1) 50 years old.
Born on August 2, 1959 (French) Independent director Chief Mining Engineer and a graduate of the École Normale Supérieurewith a doctorate in physical sciences, Mrs. Lauvergeon held various positions in industry before becoming Deputy Chief of Staff in the Office of the President of the Republic in 1990. She joined Lazard Frères et Cie as Managing Partner in 1995. From 1997 to 1999, she was Executive Vice President and member of the Executive Committee of Alcatel, in charge of industrial partnerships. Mrs. Anne Lauvergeon has served as Chairman of the Management Board of AREVA since July 2001 and Chairman and Chief Executive Officer of Areva NC (formerly Cogema) since June 1999. Director of TOTAL S.A. since 2000 and until 2012 (last renewal: May 15, 2009). Principal other directorships • | | | • | Chairperson of the Management Board of Areva.Areva* | | • | Chairperson and CEO of Areva NC | | • | Director ofGDF Suez*(1) | | • | Director ofVodafone Group Plc* |
Chairperson and CEO of Areva NC.
Director of Vodafone Group Plc.*
Lord Levene of Portsoken 68 years old.
Born on December 8, 1941 (British) Independent director Lord Levene served in various positions within the Ministry of Defense, the office of the Secretary of State for the Environment, the office of the Prime Minister and the Ministry of Trade in the United Kingdom from 1984 to 1995. He then served as senior adviser at Morgan Stanley from 1996 to 1998 before becoming theand was then appointed Chairman of Bankers Trust International from 1998 to 2002. He was Lord Mayor of London from 1998 to 1999. He is currently Chairman of Lloyd’s. Director of TOTAL S.A. since 2005 and until 2011 (last renewal: May 16, 2008). Principal other directorshipsChairman of International Financial Services.
Chairman of General Dynamics UK Ltd.
Director of Haymarket Group Ltd.
Director of China Construction Bank.*
* | Company names marked with an asterisk are publicly listed companies. | | • | Chairman of Lloyd’s | | • | Chairman ofGeneral Dynamics UK Ltd | | • | Director ofHaymarket Group Ltd | | • | Director ofChina Construction Bank* | | • | Director ofNBNK Investments Plc* |
1.
| Mrs. Lauvergeon is Chairperson of the Management Board of Areva, which, to the Company’s knowledge, owns 0.0% of the Company’s shares and 0.0% of the voting rights. Mrs. Lauvergeon disclaims beneficial ownership of such shares. |
Claude Mandil 67 years old.
Born on January 9, 1942 (French) Independent director A graduate of theÉcole Polytechniqueand a General Mining Engineer from the Corps des Mines, Mr. Mandil served as a Mining Engineer in the Lorraine and Bretagne provinces.regions. He then served as a Project Manager at theDélégation de l’Aménagement du Territoire et de l’Action Régionale (City (City * Company names marked with an asterisk are publicly listed companies. Underlined companies are companies excluded from the group in which the director has his or her main duties.
81
and Department planning/DATAR) and as the Interdepartmental Head of Industry and Research and regional delegate of ANVAR. From 1981 to 1982, he served as the technical advisor on the staff of the Prime Minister, in charge of the industry, energy and research sectors. He was appointed Chief Executive Officer, then Chairman and Chief Executive Officer of theInstitut de Développement Industriel (Industry Development Institute) until 1988. He was Chief Executive Officer of Bureau de Recherches Géologiques et Minières(BRGM) from 1988 to 1990. From 1990 to 1998, Mr. Mandil was Chief Executive Officer for Energy and Commodities at the French Industry Ministry and the first representative for France at the Management Board of the Energy International Agency (EIA) Executive Committee. He served as the Chairman of the EIA in 1997 and 1998. In 1998, he was appointed Deputy Chief Executive Officer of Gaz de France and, in April 2000, Chairman of theInstitut Français du Pétrole (French Institute of Oil). From 2003 to 2007, he was the Executive Director of the EIA. Director of TOTAL S.A. since May 16, 2008 and until 2011. Principal other directorships Director of Institut Veolia Environnement.
| | | • | Director of Institut Veolia Environnement |
Michel Pébereau(1)67 years old.
Born on January 23, 1942 (French) Independent director Honorary Inspector General of Finance, Mr. Pébereau held various positions in the Ministry of Economy and Finance, before serving, from 1982 to 1993, as Chief Executive Officer and then as Chairman and CEO of Crédit Commercial de France (CCF). He was Chairman and Chief Executive Officer of BNP then BNP Paribas from 1993 to 2003, and is currently Chairman of the Board of BNP Paribas. He has also been the Chairman of European Financial Round Table (EFRT) since 2009. Director of TOTAL S.A. since 2000 and until 2012 (last renewal: May 15, 2009). Principal other directorships • | | | • | Chairman of the Board of Directors of BNP Paribas.* Paribas* |
Director of Saint-Gobain.*
Member of the Supervisory Board of AXA.*
Director of Pargesa Holding S.A.* (Switzerland).
Member of the Supervisory Board of Banque marocaine pour le Commerce et l’Industrie.*
• | | | • | Non-voting member (Censeur)Director ofLafarge
| | • | Director ofSaint-Gobain* |
| | | • | Member of the Supervisory Board of Galeries Lafayette.AXA* |
| | | • | Director ofEADS N.V.* | | • | Director of Pargesa Holding S.A.* (Switzerland) | | • | Member of the Supervisory Board of Banque marocaine pour le Commerce et l’Industrie* |
Thierry de Rudder(2)60 years old.
Born on September 3, 1949 (Belgium and French) Independent director A graduate of the Université de Genèvein mathematics, the Université Libre de Bruxellesand Wharton (MBA), Mr. de Rudder served in various positions at Citibank from 1975 to 1986 before joining Groupe Bruxelles Lambert, where he was appointed Acting Managing Director. Director of TOTAL S.A. since 1999 and until 20102013 (last renewal: May 11, 2007)21, 2010). Principal other directorships | | | • | Acting Managing Director of Groupe Bruxelles Lambert* | | • | Director of Compagnie Nationale à Portefeuille* | | • | Director ofGDF Suez* | | • | Director ofLafarge* |
(1) Mr. Pébereau is Chairman of Imerys.* DirectorBNP Paribas, which, to the Company’s knowledge, owns 0.2% of GDF Suez.*
Directorthe Company’s shares and 0.2% of Lafarge.*
Directorthe voting rights. Mr. Pébereau is also a director of Pargesa Holding SA, part of Group Bruxelles Lambert, which acting in concert with Compagnie Nationale à Portefeuille.*
Portefeuille, to the Company’s knowledge, owns 5.6% of the Company’s shares and 5.6% of the voting rights. Mr. Pébereau disclaims beneficial ownership of such shares.Director of Suez-Tractebel.
Acting Managing Director(2) Mr. de Rudder is acting managing director of Groupe Bruxelles Lambert.Lambert which, acting in concert with Compagnie Nationale à Portefeuille and to the Company’s knowledge, owns 5.6% of the Company’s shares and 5.6% of the voting rights. Mr. de Rudder disclaims beneficial ownership of such shares.
* Company names marked with an asterisk are publicly listed companies. Underlined companies are companies excluded from the group in which the director has his or her main duties.
82
* | Company names marked with an asterisk are publicly listed companies. |
1. | Mr. Pébereau is Chairman of BNP Paribas, which, to the Company’s knowledge, owns 0.2% of the Company’s shares and 0.2% of the voting rights. Mr. Pébereau is also a director of Pargesa Holding SA, part of Group Bruxelles Lambert, which acting in concert with Compagnie Nationale à Portefeuille, to the Company’s knowledge, owns 5.4% of the Company’s shares and 5.5% of the voting rights. Mr. Pébereau disclaims beneficial ownership of such shares. |
2. | Mr. de Rudder is acting managing director of Groupe Bruxelles Lambert which, acting in concert with Compagnie Nationale à Portefeuille and to the Company’s knowledge, owns 5.4% of the Company’s shares and 5.5% of the voting rights. Mr. de Rudder disclaims beneficial ownership of such shares. |
Serge Tchuruk72 years old.
Born on November 13, 1937 (French) Independent director A graduate of theÉcole Polytechniqueand anIngénieur de l’armement, Mr. Tchuruk held various management positions with Mobil Corporation, then with Rhône-Poulenc, where he was named Chief Executive Officer in 1983. He served as Chairman and CEO of CDF-Chimie/Orkem from 1986 to 1990, then as Chairman and CEO of TOTAL from 1990 to 1995. In 1995, he became Chairman and Chief Executive Officer of Alcatel. From 2006 to 2008, he was appointed Chairman of the Board of Alcatel-Lucent. Director of TOTAL S.A. since 1989 and until 2010 (last renewal: May 11, 2007)2007; term of office: May 21, 2010). Holds 61,060 shares.
Principal other directorshipsDirector of Weather Investment SPA.
Pierre Vaillaud
74 years old.
A graduate of theÉcole Polytechnique, a Mining Engineer and a graduate of theÉcole Nationale Supérieure du Pétrole et des Moteurs, Mr. Vaillaud worked as an engineer with Technip and Atochem before joining TOTAL. He served as Chief Executive Officer of TOTAL from 1989 to 1992, before becoming Chairman and Chief
Executive Officer of Technip from 1992 to 1999, and of Elf Aquitaine from 1999 to 2000.
Director of TOTAL S.A. since 2000 (last renewal: May 12, 2006; end of office: May 15, 2009).
Principal other directorships
| | | • | Director of Weather Investment SPA |
Member of the Supervisory Board of Oddo et Cie.
At its meeting on September 15, 2009, the Board of Directors appointed Mr. Charles Paris de Bollardière Secretary of the Board. He succeeds Thierry Reveau de Cyrières.The current members of the Board of Directors of the Company have informed the Company that they have not been convicted, have not been associated with a bankruptcy, receivership or liquidation, and have not been incriminated or publicly sanctioned or disqualified, as stipulated in item 14.1 of Annex I of EC Regulation 809/2004 of April 29, 2004. Representative of the Worker’s Council: according to Article L.2323- 62 of the French Labour Code, two members of the Worker’s Council attend, with consultative rights, all meetings of the Board. In compliance with the second paragraph of the above article, this number increased to four members as of July 7, 2010. At its meeting on February 10, 2010,2011, the Board of Directors, acting on a proposal from the Nominating & Governance Committee, reviewed the independence of the Company’s directors as of December 31, 2009.2010. Also based on the Committee’s proposal, the Board considered that, pursuant to the AFEP-MEDEF Code, a director is independent when “he or she has no relationship, of any nature, with the company, its group, or the management of either, that may compromise the exercise of his or her freedom of judgement”judgment”. Mrs. Barbizet, Messrs. Artus, Bouton, Collomb, Desmarais, Jacquillat, Mandil, Pébereau, de Rudder,
Tchuruk and Lord Levene of Portsoken were deemed to be independent directors.
These directors meet
For each director, this assessment relies on the independence criteria set forth in the AFEP-MEDEF Code withas reminded thereafter: | | | • | not to be an employee or a director of the Company, or a Group company, and not having been in such a position for the previous five years; | | • | not to be an executive director of a company in which the Company holds a directorship or in which an employee appointed as such or an executive director of the company is a director; | | • | not to be a customer, supplier, investment banker or commercial banker for a significant part of whose business the company or its Group accounts; | | • | not to be related by close family ties to an executive director; | | • | not to have been an auditor of the Company within the previous five years; | | • | not to have been a director of the Company for more than twelve years (upon expiry term of office during which the12-year limit is reached). |
In addition, the exceptionBoard of one individual who has been a director for longer than twelve years. For a company that has long-term investments and activities, a longerDirectors acknowledged Mr. Desmarest’s term of office gives experience and authority, and thereby reinforcesas member of the independenceSupervisory Board of directors. Areva has terminated since March 5, 2010. The AFEP-MEDEF Code expressly stipulates that the Board concludedcan decide that Mr. Tchuruk, the only director concerned by this criterion, should be considered as independent.implementation of certain defined criteria is not relevant or induces an interpretation that is particular to the Company. Concerning “material” relationships, as a client, supplier, investment or finance banker, between a director and the Company, the Board deemed that the level of activity between Group companies and the bank at which one of its Directors is an officer, which is less than 0.1% of its net banking income and less than 5% of the Group’s overall assets, represents neither a material portion of the overall activity of such bank nor a material portion of the Group’s external financing. The Board concluded that Mr. Pébereau should be considered as independent. 73%
Mrs. Barbizet and Lauvergeon, Messrs. Artus, Bouton, Brock, Collomb, Desmarais, Jacquillat, Mandil, Pébereau, de Rudder, and Lord Levene of Portsoken were deemed to be independent directors. 80% of the directors are independent. The Board also noted the absence of potential conflicts ofbetween the interests betweenof the Company and the private interests of its directors. To the Company’s knowledge, the members of the Board of TOTAL S.A. are not related
83
by close family ties; there are no arrangements or agreements with clients or suppliers that facilitated their appointment; there is no service agreement binding a director of TOTAL S.A. to one of its subsidiary and providing for special benefits upon termination of such agreement. General ManagementAt its meeting
Based on February 13, 2007,the recommendation by the Nominating and Governance Committee, the Board of Directors baseddecided at its meeting on the recommendation of the then existing Nominating & Compensation Committee(1), resolvedMay 21, 2010, to have separate individuals serve inreunify the positions of Chairman of the Board and Chief Executive Officer and appoint the Chief Executive Officer to the position of Chairman of the Board until its term of office expires, that is until the Shareholders’ Meeting called to approve the financial statements for the fiscal year 2011. As a result, Mr. de Margerie has been appointed Chairman and Chief Executive Officer of the Company to ensure continuity during changesGroup since May 21, 2010. The Board of Directors deemed that the unified management form was the most appropriate to the Group’s management.business and specificities of the oil and gas sector. This decision was made taking into account the advantage of the unified management and the majority of independent directors appointed to the Committees of the Board, which ensures balanced authority. The management form selected shall remain in effect until a decision to the contrary is made by the Board of Directors. The Executive Committee, under the responsibility of the Chairman and Chief Executive Officer, is the primary decision-making body of the Group. It implements the strategy formulated by the Board of Directors and authorizes related investments, subject to the approval by the Board of Directors for investments exceeding 3% of the Group’s equity. The following individuals were serving as members of the Executive Committee as of December 31, 2009:Christophe de Margerie, Chairman of the Executive Commitee (Chief Executive Officer);
2010:François Cornélis, Vice Chairman of the Executive Committee (President of the Chemicals segment);
| | | • | Christophe de Margerie, Chairman of the Executive Committee (Chairman and Chief Executive Officer); | | • | François Cornélis, Vice Chairman of the Executive Committee (President of the Chemicals segment); | | • | Michel Bénézit (President of the Refining & Marketing division); | | • | Yves-Louis Darricarrère (President of the Exploration & Production division); | | • | Jean-Jacques Guilbaud (Chief Administrative Officer); and | | • | Patrick de La Chevardière (Chief Financial Officer). |
Michel Bénézit (President of the Refining & Marketing division);
Yves-Louis Darricarrère (President of the Exploration & Production division);
Jean-Jacques Guilbaud (Chief Administrative Officer); and
Patrick de La Chevardière (Chief Financial Officer).
The Management Committee The Group Management Committee facilitates coordination among the divisions and monitors the operating results and activity reports of these divisions. In addition to the members of the Executive Committee, the following eighteen individuals from various non-operating departments and operating divisions served as members of the Management Committee as of December 31, 2009: Corporate
René Chappaz, Vice President, Executive Career Management.
2010:Yves-Marie Dalibard, Vice President, Corporate Communications.
Peter Herbel, General Counsel.
CorporateJean-Marc Jaubert, Senior Vice President, Industrial Safety.
| | | • | René Chappaz, Vice President, Executive Career Management | | • | Yves-Marie Dalibard, Vice President, Corporate Communications | | • | Peter Herbel, General Counsel | | • | Jean-Marc Jaubert, Senior Vice President, Industrial Safety | | • | Manoelle Lepoutre, Executive Vice President, Sustainable Development and the Environment | | • | Jean-François Minster, Senior Vice President, Scientific Development | | • | Jean-Jacques Mosconi, Vice President, Strategic Planning | | • | François Viaud, Senior Vice President, Human Resources |
Manoelle Lepoutre, Executive Vice President, Sustainable Development and the Environment.
UpstreamJean-François Minster, Senior Vice President, Scientific Development.
| | | • | Marc Blaizot, Senior Vice President, Geosciences, Exploration & Production | | • | Philippe Boisseau, President, Gas & Power | | • | Jacques Marraud des Grottes, Senior Vice President, Africa, Exploration & Production | | • | Patrick Pouyanné, Senior Vice President, Strategy, Business Development and R&D, Exploration & Production |
Jean-Jacques Mosconi, Vice President, Strategic Planning.
DownstreamFrançois Viaud, Senior Vice President, Human Resources.
Upstream
| | | • | Pierre Barbé, Senior Vice President, Trading & Shipping | | • | Alain Champeaux, Senior Vice President, Overseas | | • | Bertrand Deroubaix, General Secretary, Refining & Marketing | | • | Eric de Menten, Senior Vice President, Marketing Europe, Refining & Marketing | | • | André Tricoire, Senior Vice President, Refining, Refining & Marketing |
Marc Blaizot, Senior Vice President, Geosciences, Exploration & Production.
Philippe Boisseau, President, Gas & Power.
ChemicalsJacques Marraud des Grottes, Senior Vice President, Africa, Exploration & Production.
| | | • | Françoise Leroy, General Secretary, Chemicals |
Patrick Pouyanné, Senior Vice President, Strategy, Business Development and R&D, Exploration & Production.
Downstream
Pierre Barbé, Senior Vice President, Trading & Shipping.
Alain Champeaux, Senior Vice President, Overseas.
Eric de Menten, Senior Vice President, Marketing Europe, Refining & Marketing.
Bertrand Deroubaix, General Secretrary, Refining & Marketing.
André Tricoire, Senior Vice President, Refining, Refining & Marketing.
Chemicals
Françoise Leroy, General Secretary, Chemicals.
In addition, Jérôme Schmitt serves as the Group’s Treasurer.
84
1. | In February 2007, the then existing Nominating & Compensation Committee was separated into the existing Nominating & Governance Committee and the Compensation Committee (see “Item 6. Corporate Governance”). |
Compensation
The overall amount paidof directors’ fees allocated to members of the Board of Directors was set at €1.1 million by the Shareholders’ Meeting on May 11, 2007. In 2010, the overall amount of directors’ fees allocated to the members of the Board of Directors as directors’ fees was€0.97 €0.96 million, in 2009 in accordance with the decision of the Shareholders’ Meeting held on May 11, 2007. Therenoting that there were fifteen directors as of December 31, 2009, compared2010, as at year-end 2009. The allocation of the overall amount of fees remains based on an allocation scheme comprised of a fixed compensation and a variable compensation based on fixed amounts per meeting, which contributes to sixteen directors as of December 31, 2008.Compensation was paidtaking into account each director’s effective attendance to the membersmeetings of the Board and its Committees. At its meeting on February 10, 2010, the Board of Directors in 2009 based ondecided to readjust the following principles, which remained unchanged from 2008:
a fixed amount of€20,000 was paid to each director (paid prorata temporis in case of a change during the period), apart from the Chairman of the Audit Committee who was paid€30,000 and the other Audit Committee members who were paid€25,000;
each director was paid€5,000 for eachvariable amounts per meeting, of the Board of Directors, of the Audit Committee, of the Compensation Committee or of the Nominating & Governance Committee attended, such amount being increased to€7,000 for those directors who reside outside of France; and
neither the Chairman of the Board, nor the Chief Executive Officer received directors’ fees as directors of TOTAL S.A. or any other company of the Group.
follows: | | | • | a fixed amount of €20,000 was paid to each director (paidprorata temporisin case of a change during the period), apart from the Chairman of the Audit Committee who was paid €30,000 and the other Audit Committee members who were paid €25,000; | | | • | an amount of €5,000 per director for each Board of Directors’ meeting effectively attended; | | | • | an amount of €3,500 per director for each Compensation Committee or Nominating & Governance Committee’s meetings effectively attended; | | | • | an amount of €7,000 per director for each Audit Committee’s meeting effectively attended; | | | • | a premium of €2,000 in case the attendance to a Board of Directors or Committee meeting involves a trip from a country other than France; | | | • | the Chairman and Chief Executive Officer does not receive directors’ fees as director of TOTAL S.A. or any other company of the Group; and | | | • | until his duties of Chairman of the Board of TOTAL S.A. expired, Mr. Desmarest did not receive any directors’ fees as director of TOTAL S.A. |
See the table “Directors’ Fees and Other Compensation Received by Directors” below for additional compensation information. Policy for determining the compensation and other benefits of the Chairman and the Chief Executive Officer Based on a proposal by the Compensation Committee, the Board adopted the following policy for determining the compensation and other benefits of the Chairman and of the Chief Executive Officer: Compensation and benefits for the Chairman and the Chief Executive Officer are set by the Board of Directors after considering proposals from the Compensation Committee. Such compensation shall be reasonable and fair, in a context that values both teamwork and motivation within the Company.
| | | • | Compensation and benefits for the Chairman and the Chief Executive Officer are set by the Board of Directors after considering proposals from the Compensation Committee. Such compensation shall be reasonable and fair, in a context that values both teamwork and motivation within the Company. |
Compensation for the Chairman and the Chief Executive Officer is related to market practice, work performed, results achievedobtained and responsibilities held. Compensation for the Chairman and the Chief Executive Officer includes both a fixed portion and a variable portion, each of which is reviewed annually.
The amount of variable compensation may not exceed a stated percentage of fixed compensation.
| | | • | Compensation for the Chairman and the Chief Executive Officer includes both a fixed portion and a variable portion, each of which is reviewed annually. | | | | • | The amount of variable compensation may not exceed a stated percentage of fixed compensation. Variable compensation is determined based on pre-defined quantitative and qualitative criteria. Quantitative criteria are limited in number, objective, measurable and adapted to the Group’s strategy. |
Variable compensation is designed to reward short-term performance and progress towards medium-term objectives. The qualitative criteria for variable compensation are designed to allow exceptional circumstances to be taken into account, when appropriate. | | | • | The Group does not have a specific pension plan for the Chairman and the Chief Executive Officer. They are eligible for retirement benefits and pensions available to other employees of the Group under conditions determined by the Board. | | | • | Stock options are designed to align the long-term interests of the Chairman and the Chief Executive Officer with those of the shareholders. | | | • | Awards of stock options are considered in light of the amount of the total compensation paid to the Chairman and the Chief Executive Officer. The exercise of stock options to which the Chairman and the Chief Executive Officer are entitled is subject to a performance condition. |
85
The Group does not have any specific pension plan for the Chairman and the Chief Executive Officer. They are eligible for retirement benefits and pensions available to other employees of the Group under conditions determined by the Board.
Stock options are designed to align the long-term interests of the Chairman and the Chief Executive Officer with those of the shareholders.
Awards of stock options are considered in light of the amount of the total compensation paid to the Chairman and the Chief Executive Officer. The exercise of stock options to which the Chairman and the Chief Executive Officer are entitled is subject to a performance condition.
The exercise price for stock options awarded is not discounted compared to the market price, at the time of the grant, for the underlying share. Stock options are awarded at regular intervals to prevent any opportunistic behavior. The Board has put in place restrictions on the transfer of a portion of shares issued upon the exercise of options. | | | • | After three years in office, the Chairman and Chief Executive Officer are required to hold at least the number of Company shares set by the Board. |
Compensation of the Chairman of the Board (until May 21, 2010) Mr. Desmarest served in the position of Chairman of the Board of Directors until May 21, 2010, concurrent with the reunification of the positions of Chairman of the Board and Chief Executive Officer are requiredand the appointment of Mr. de Margerie to hold at leastserve in this position. Having regard for his esteemed services for the numberGroup, the Board of Company shares set by the Board. TheDirectors decided to appoint Mr. Desmarest as Honorary Chairman and Chief Executive Officer do not receive restricted share grants.
Compensation of the Company and member of the Compensation Committee, and retain him in the position of Chairman
of the Nominating & Governance Committee. The total gross compensation paid to Mr. Desmarest for fiscal 2009his duties as Chairman of the Board between January 1, 2010 and May 21, 2010, was set by the Board of Directors of TOTAL S.A. based upon the proposal ofon a recommendation by the Compensation Committee. This compensation is composed ofIt includes a fixed base salary of€1,100,000that amounted to €1,100,000, unchanged compared with fiscal year 2009 (€428,763 for the period between January 1 and May 21, 2010), and a variable portion.portion paid in 2011 for the period between January 1, 2010 and May 21, 2010. The variable portion is calculated by taking into account the Group’s return on equity, the Group’s earnings compared to those of the other major international oil companies that are its competitors, as well as the Chairman’sChairman of the Board’s personal contribution to the Group’s strategy, corporate governance and performance. The variable portion can reach a maximum amount of 100% of the fixed base salary. The objectives related to personal contribution were considered to be mostlysubstantially fulfilled, and taking into account the comparison of TOTAL’s earnings with the major international oil companies that are its competitors, the variable portion paid to the Chairman and Chief Executive Officer in 20102011 for his contribution in 2009between January 1, 2010 and May 21, 2010, amounted to€871,852.
The total gross compensation paid to the Chairman for fiscal year 2009 amounted to€1,971,852.
€322,644. Mr. Thierry Desmarest’s total gross compensation for fiscal 2008,2009, as Chairman of the Board of Directors, amounted to €2,069,430, €1,971,852, composed of a fixed base salary of €1,100,000 €1,100,000 and a variable portion of €969,430 €871,852 paid in 2009.Mr. Desmarest does not receive any in-kind benefits.
2010. See the tables “Summary of Compensation, Stock Optionscompensation, stock options and Restricted Shares Grantedrestricted shares awarded to the Chairman and the Chief Executive Officer” and “Compensation of the Chairman and the Chief Executive Officer” below for additional compensation information. Compensation of the Chairman and Chief Executive Officer In 2010, Mr. de Margerie served in the position of Chief Executive Officer of TOTAL S.A. until May 21, 2010 and in the position of Chairman and Chief Executive Officer as of that date. The total gross compensation paid to Mr. de Margerie for fiscal 2009his duties as Chief Executive Officer between January 1, 2010, and May 21, 2010, was set by the Board of Directors of TOTAL S.A. based upon the proposal ofon a recommendation by the Compensation Committee. This compensation is composed of aIt includes an annual fixed base salary of €1,310,000 €1,310,000, unchanged compared with fiscal year 2009 (€507,097 for the period between January 1 and May 21, 2010), and a variable portion.portion paid in 2011 for the period between January 1, 2010 and May 21, 2010. The variable portion is calculated by taking into account the Group’s return on equity, the Group’s earnings performance compared to thosethat of the other major international oil companies that are its competitors, as well as the Chief Executive Officer’s personal contribution to the Group’s strategy, evaluated on the basis of objective operational criteria related to the Group’s business segments. The variable portion can reach a maximum amount of 140% of the fixed base salary, which may be increasedor up to 165% for exceptional performance. The objectives related to personal contribution were considered to be mostlysubstantially fulfilled, and taking into account the comparison of TOTAL’s earnings performance with the major international oil companies that are its competitors, the variable portion paid to the Chief Executive Officer in 20102011 for his contribution in 2009between January 1, 2010 and May 21, 2010, amounted to €1,356,991.The €523,262.
Mr. de Margerie’s total gross compensation paid to theas Chief Executive Officer for fiscal year 2009 amounted to €2,666,991.Mr. Christophe de Margerie’s total gross compensation for fiscal 2008 amounted to€2,802,875, €2,666,991, composed of a fixed base salary of€1,250,000 €1,310,000 and a variable portion of€1,552,875 €1,356,991 paid in 2009.2010.
As Chief Executive Officer, Mr. de Margerie had the use of a company car. The compensation paid to Mr. de Margerie for his duties as Chairman and Chief Executive Officer was set by the
86
Board of Directors of TOTAL S.A. at its meeting of May 21, 2010, based on a recommendation by the Compensation Committee in line with the guidance of the AFEP-MEDEF Corporate Governance Code. It includes an annual fixed base salary of €1,500,000, and a variable portion not to exceed 165% of the fixed base salary. The fixed base salary was set by comparison with the compensation paid to the Chairman and Chief Executive Officer of other French companies included in the CAC 40 index. The maximum percentage of the fixed base salary represented by the variable portion is based on equivalent practice at a reference sample of companies, including oil and gas companies. The variable portion is based on criteria determined by the Board of Directors. The equivalent of up to 100% of the fixed base salary is linked to economic criteria, which varies on astraight-line basis to avoid threshold effects. The criteria based on the Chairman and Chief Executive Officer’s personal contribution account for an additional amount that cannot exceed 65% of the fixed base salary. The economic criteria have been selected so as to not only reward short-term performance in terms of return on investment for shareholders, but also the progress made by the Group toward medium-term objectives by comparison with data for the oil and gas industry as a whole. They include: | | | • | return on equity; | | | • | the Company’s earnings performance compared with that of the four other major international oil companies that are its competitors(1), assessed by reference to the average growth over three years of two indicators, earnings per share and consolidated net income. |
The Chairman and Chief Executive Officer’s personal contribution is evaluated on the basis of objective, mainly operational criteria related to the Group’s business segments, including health, safety and environment (HSE) performance and oil and gas production and reserves growth. At its meeting of February 10, 2011, the Board of Directors found that the Chairman and Chief Executive Officer’s objectives related to personal contribution were substantially fulfilled in 2010. After assessing to what extent financial performance criteria had been met, the Board, based on a recommendation by the Compensation Committee, set the variable portion payable to Mr. Christophede Margerie in 2011 at €1,058,408 for his contribution between May 22 and December 31, 2010, equivalent to 115.1% of his fixed base salary. Mr. de Margerie’s total gross compensation as Chairman and Chief Executive Officer for the period between May 22 and December 31, 2010, consisted of a fixed base salary of €919,355 (prorated from an annual fixed base salary of €1,500,000) and a variable portion of €1,058,408 paid in 2011. As Chairman and Chief Executive Officer, Mr. de Margerie has the use of a company car. See the tables “Summary of Compensation, Stock Optionscompensation, stock options and Restricted Shares Grantedrestricted shares awarded to the Chairman and the Chief Executive Officer” and “Compensation of the Chairman and the Chief Executive Officer” below for additional compensation information. Executive Officer Compensation In 2009,2010, the aggregate amount paid directly or indirectly by the French and foreign affiliates of the Company as compensation to the executive officers of TOTAL in office as of December 31, 20092010 (members of the Management Committee and the Treasurer; twenty-five individuals)Treasurer) as a group was €17.1 €18.9 million (twenty-five individuals), including €8 €8.4 million paid to the six members of the Executive Committee. Variable compensation accounted for 44.5%46% of the aggregate amount of €17.1 €18.9 million paid to executive officers. Pensions and other commitments 1) | The | | 1) | Pursuant to applicable law, the Chairman and the Chief Executive Officer pursuant to applicable law, are eligible for the basic French social security pension and for pension benefits under the ARRCO (French Association for Complementary Pension Schemes) and AGIRC (French executivegovernment-sponsored supplementary pension scheme federation) complementary pensions, RECOSUP (French Collective Supplementary Pension Scheme)schemes. They also participate in the internal defined contribution pension plan and the defined benefit pension plans, and the supplementary pension plan called RECOSUP created by the Company. This supplementary pension plan, which is not limited to the Chairman and the Chief Executive Officer, is detaileddescribed in item 2) below. |
The sum of the supplementary pension plan benefits and external pension plan benefits may not exceed 45% of the compensation used as the calculation basis. In the event this percentage is exceeded, the supplementary pension is reduced accordingly. The compensation taken into account when calculating the supplementary pension is the retiree’s final three-year average gross compensation (fixed and variable portions). (1) ExxonMobil, BP, Shell and Chevron.
87
As of December 31, 2010, Mr. de Margerie’s aggregate benefit entitlement under all of the above pension plans would amount to 24.40% of his gross annual compensation received in 2010 (fixed base salary from January 1 to May 21, 2010, as Chief Executive Officer and from May 22 to December 31, 2010, as Chairman and Chief Executive Officer, and variable portion for 2009, paid in 2010). | | | 2) | The Chairman and the Chief Executive Officer are eligible foralso participate in a defined benefit supplementary pension plan financed and managed by TOTAL S.A. and open to all employees of the Group whose annual compensation is greater than eight times the annualceiling for calculating French social security threshold multiplied by eight.contributions (€35,352 in 2011). Compensation above this amount does not qualify as pensionable compensation under either government-sponsored or industry-wide pension schemes. |
This
To be eligible for this supplementary pension plan, is financedparticipants must meet specific age and managedlength of service criteria. They must also still be employed by TOTAL S.A.the Company upon retirement, unless they retire due to award a pension that is baseddisability or had taken early retirement at the Group’s initiative after the age of 55. Benefits under the plan depend on the periodparticipants’ years of employmentservice (up to a limit of twenty years) and the portion of their gross annual gross compensation (including fixed(fixed and variable portions) that exceeds by at least eight times the annualceiling for calculating French social security threshold. This pension is indexed tocontributions. They are adjusted in line with changes in the value of the ARRCO index.pension point and strictly capped as described in item 1) above. As of December 31, 2009, the Group’s supplementary pension obligations related to the Chairman are the equivalent of an annual pension of 26.3% of the Chairman’s 2009 compensation.For the Chief Executive Officer,2010, the Group’s pension obligations are, as of December 31, 2009,to Mr. de Margerie under the defined benefit supplementary pension plan represented the equivalent of an annual pension of 18.8%19.47% of his 2009 compensation.
gross annual compensation paid in 2010. | | | 3) | The Chairman and the Chief Executive Officer are also entitled to a lump-sum retirement benefit equal to that available to eligible members of the Group under the French National Collective Bargaining Agreement for the Petroleum Industry. This benefit amounts to 25% of the gross annual compensation (fixed and variable portions) received in the12-month period preceding retirement. Pursuant to the provisions of the French law of August 21, 2007, which modifies Article L.225-42-1 of the French Commercial Code, such benefit is subject to the performance conditions detailed in item 7) below. |
Upon his retirement in 2010, Mr. Demarest was paid a retirement benefit of €492,963, the Board of Directors having decided at its meeting of May 21, 2010, that each of the three applicable performance criteria had been met. This retirement benefit cannot be combined with the compensation for loss of office described in item 5) below. | | | 4) | The Company also funds a life insurance policy whichfor the Chairman and the Chief Executive Officer that guarantees a payment, upon death, equal to two years’ gross compensation (both fixed(fixed and variable)variable portions), increased to three years upon accidental death, as well as, in case of disability, a payment proportional to the degree of disability. |
4) | The Chairman and the Chief Executive Officer are also entitled to retirement benefits equal to those available to eligible members of the Group under the French National Collective Bargaining Agreement for the Petroleum. This benefit amounts to 25% of the annual compensation (including fixed and variable portions) of the 12-month period preceding the retirement of the Chairman and the Chief Executive Officer. |
| 5) | If the Chairman or theand Chief Executive Officer’s employmentOfficer is terminatedremoved from office or his term of office is not renewed by the Company, he is eligibleentitled to compensation for severance benefitsloss of office equal to two times hisyears’ gross annual compensation. The calculation will be based on the gross compensation (including both fixed and variable)variable portions) paid in the12-month period preceding the termination or the non-renewal of his term of office. |
The severance benefits
This compensation for loss of office to be paid uponin the event of a change of control or a change of strategy of the Company are cancelledwould not be due in the case of gross negligence or wilfulwillful misconduct or if the Chairman or theand Chief Executive Officer leaves the Company of his own volition, accepts new responsibilities within the Group, or may claim full retirement benefits within a short time period. Since Mr. Desmarest
Pursuant to the provisions of the French law of August 21, 2007, which modifiesArticle L. 225-42-1 of the French Commercial Code, such compensation for loss of office is eligiblesubject to claim his full retirement benefits, these provisions are only relevant to Mr. de Margerie.the performance conditions described in item 7) below. 6) | The commitments related | | 6) | Commitments with regard to the supplementary pension plan,and life insurance plans for the Chairman and Chief Executive Officer and the retirement benefitsbenefit and severance benefits upon termination of employment or termcompensation for loss of office are subject toarrangements were approved on May 21, 2010 by the procedure for regulated agreements set forthBoard of Directors and by the Shareholders’ Meeting. | | | 7) | In addition, in articlecompliance with Article L. 225-38 of the French Commercial Code. |
7) | Pursuant to the provisions of the French law of August 21, 2007, which modifies article L. 225-42-1 of the French Commercial Code, the commitments described in items 43) and 5 above5) are subject to performance conditions. |
These
88
| | | performance conditions that are deemed to be met if at least two of the following three criteria are satisfied: |
| | | | • | The average ROE (Return on Equity) over the three years immediately preceding the year in which the officer retires is at least 12%; | | | • | The average ROACE (Return on Average Capital Employed) over the three years immediately preceding the year in which the officer retires is at least 10%; | | | • | TOTAL’s oil and gas production growth over the three years immediately preceding the year in which the officer retires is greater than or equal to the average production growth rate of the four other major international oil companies that are its competitors: ExxonMobil, Shell, BP and Chevron. |
In compliance with the AFEP-MEDEF Corporate Governance Code, the Board of Directors decided that payment of the lump-sum retirement benefit or compensation for loss of office shall be subject to demanding performance conditions are deemedcombining both internal and external performance criteria. The three criteria were selected to take into account the Company’s general interest, shareholder interests, and standard market practices, especially in the oil and gas industry. More specifically, ROE enables the payment of the retirement benefit or compensation for loss of office to be met if at least twotied to the Company’s overall shareholder return. Shareholders can use ROE to gauge the Company’s ability to generate profit from the capital they have invested and from prior years’ earnings reinvested in the Company. ROACE is used by most oil and gas companies to assess the operational performance of average capital employed, regardless of whether it is funded by equity or debt. ROACE is an indicator of the three following criteria are satisfied:return on capital employed by the Company for operational activities and, as a result, makes it possible to tie the payment of the retirement benefit or compensation for loss of office to the value created for the Company. The average ROE (Return On Equity) overthird and last criterion used by the three years immediately precedingBoard of Directors is the year in which the officer retires is at least 12%. The average ROACE (Return On Average Capital Employed) over the three years immediately preceding the year in which the officer retires is at least 10%.
The Company’sGroup’s oil and gas production growth overcompared with that of its competitors. This indicator is widely used in the three years immediately precedingindustry to measure operational performance and the year in whichability to ensure the officer retiressustainable development of the Group, most of whose capital expenditure is greater than or equalallocated to the averageexploration and production growth of ExxonMobil, Shell, BP and Chevron.
activities. | | | 8) | In addition, regarding the implementation of the pension commitments described in items 1) and 2) above made by the Company hasfor directors for fiscal year 2010: |
| | | | • | Mr. Desmarest received, due to his previous employment by the followingGroup, a supplementary pension commitments, (describedamounting to €320,341 for 2010 (retired since May 22, 2010). The value of the annual supplementary pension, for a complete year, would amount to nearly €549,155 (December 31, 2010 value) adjusted in paragraph 2, above) as defined under French law,line with changes in the value of the ARRCO pension point. | | | • | For Mr. Tchuruk, the annual supplementary pension related to Messrs. Tchuruk and Vaillaud:his previous employment by the Group was approximately €74,914 (December 31, 2010 value), adjusted in line with changes in the value of the ARRCO pension point. |
The Company has funded an annual supplementary pension for Mr. Tchuruk related to his previous employment by the Group of approximately€€74,379 (December 31, 2009 value) indexed to the ARRCO index.
The Company has funded a supplementary pension for Mr. Vaillaud related to his previous employment by the Group of approximately€53,431 indexed to the ARRCO index.
9) | At year end 2009, | | 9) | As of December 31, 2010, the total amount of the Group’s commitments under pension commitments related to the directors of the Groupplans for company officers is equal to€28.1 €28.7 million. |
89
| | | | | | | | | | Summary table
as of February 28, 2010
| | Employment
contract | | | | | | | | | | | | | | | | | | Benefits or advantages
| | | | | Benefits or Advantages
| | | | | due or likely to be
| | | | | due or likely to be due
upon termination or
change of office | | | Benefits related
| | due after
| Summary table
| | Employment
| | upon termination or
| | | to a non-compete
agreement | | Benefits or advantages
due or likely to be
due after
termination or
| | as of February 28, 2011 | | contract | | change of office | | | agreement | | change of office | Thierry Desmarest
Chairman of the Board of Directors
until May 21, 2010(a)
Member of the Board since May 1995(a)
Expiry of current termTerm of office:
May 21, 2010 Shareholders’ Meeting
| | NO | | NO | | | NO | | | NO | | YES
(retirement benefit)(b)(c)
(defined supplementary pension plan and corporate RECOSUP defined contribution pension plan(d)also applicable to somecertain Group employees) | | | | | | | | | | | | | | NO | | | YES | | | NO | | YES | | Chairman and Chief Executive Officer
Member of the Board since February 2007
Expiry(b) Term of current term of office:
The Shareholders’ Meeting called in 2012 to approve the financial statements for
the year ending December 31, 2011
| | NO | | YES
| (termination benefit |
)(c)(e) | | NO | | YES
(retirement benefit)(c)(e)
(defined supplementary pension plan(f) and corporate RECOSUP defined contribution pension plan(g) also applicable to somecertain Group employees) | | | | | | | | | | | |
(a) | | | | (a) | | Chairman and Chief Executive Officer until February 13, 2007, and Chairman of the Board of Directors from February 14, 2007 to May 21, 2010. | | (b) | | Chief Executive Officer since February 14, 2007.13, 2007 and Chairman and Chief Executive Officer since May 21, 2010. |
(b)(c) | | Payment subject to a performance condition in accordance with the decision of the Board of Directors on February 11, 2009. |
(c)(d) | | Mr. Desmarest’s pension benefit represented a booked expense of €813.57 for the period between January 1 and May 21, 2010. | | (e) | | Payment subject to a performance condition in accordance with the decision of the Board of Directors on February 11, 2009, and confirmed by the Board of Directors on May 15, 2009.2009 and May 21, 2010. The retirement benefit cannot be combined with the compensation for loss of office described above. | | (f) | | Representing an annual pension that would be equivalent, as of December 31, 2010, to 19.47% of the annual compensation for 2010. | | (g) | | Mr. de Margerie’s pension benefit represented a booked expense of €2,077.20 for fiscal year 2010. |
Stock options and restricted share grants policy Stock options and restricted share grants concern only TOTAL shares. No options for or restricted grants of shares of any of the Group’s listed subsidiaries are awarded. All plans are approved by the Board of Directors, based on recommendations by the Compensation Committee. For each plan, the Compensation Committee recommends a list of the beneficiaries and the number of options or restricted shares grantedawarded to each beneficiary. The Board of Directors then gives final approval for this list. Stock options have a term of eight years, with an exercise price set at the average of the openingclosing TOTAL share prices on Euronext Paris during the twenty trading days prior to the awardgrant date, without any discount being applied. For the option plans established after 2002, options may only be exercised after an initial 2-yeartwo-year vesting period and the shares issued upon exercise may not be transferred priorare subject to the termination of an additional 2-yeara two-year mandatory holding period. For the 2007, 2008, 2009 and 2009 share subscription2010 option plans, the transfer or conversionoptions awarded to employees of non-French subsidiaries can be converted to bearer form or transfered as soon as the2-year non-transferability period ends. Restricted shares of shares issued from the exercise of stock options, for the beneficiaries of an employment contract with a non-French subsidiary on the date of the award, can take place after the termination of the initial 2-year period. Restricted share grantsawarded under selective plans become final after a 2-yeartwo-year vesting period, subject to a continued employment condition and a performance condition based on the ROEreturn on equity (ROE) of the Group. This performance condition is defined in advance by the Board of Directors on recommendations by the Compensation Committee. At the end of this vesting period, and subject toprovided that the conditions set are satisfied, the restricted share grants become final.are finally awarded. However, these shares may not be transferred prior to the end of an additional 2-yeartwo-year mandatory holding period. For beneficiaries outside of France, the vesting period for restricted shares may be increased to four years; in such case, there would be no mandatory holding period.
For the 2010 restricted share grants, the Board of Directors decided that, provided that the continued employment condition is satisfied, for each beneficiary of more than 100 shares, half of the shares in excess of this number will be finally granted subject to a performance condition. This condition is based on the average ROE 90
calculated by the Group based on TOTAL’s consolidated balance sheet and statement of income for fiscal years 2010 and 2011. The acquisition rate: | | | • | is equal to zero if the average ROE is less than or equal to 7%; | | • | varies on a straight-line basis between 0% and 100% if the average ROE is more than 7% and less than 18%; and | | • | is equal to 100% if the average ROE is more than or equal to 18%. |
For the 2009 restricted share grant,grants, the Board of Directors requireddecided that, provided that the continued employment condition is satisfied, for each beneficiary of more than 100 shares, half of the shares in excess of this number will be finally granted subject to a performance condition. This condition is based on the average ROE of the Group as published by TOTAL. The average ROE is calculated based on the Group’s consolidated balance sheet and statement of income for fiscal years 2009 and 2010. The acquisition rate: is equal to zero if the average ROE is less than or equal to 7%;
varies on a straight-line basis between 0% and 100% if the average ROE is more than 7% and less than 18%; and
| | | • | is equal to zero if the average ROE is less than or equal to 7%; | | • | varies on a straight-line basis between 0% and 100% if the average ROE is more than 7% and less than 18%; and | | • | is equal to 100% if the average ROE is more than or equal to 18%. |
is equal to 100% if the average ROE is more than or equal to 18%.
For the 2007 and 2008 Plans,plan, the performance condition stated that the restricted shares will be finally granted was based on the ROE of the Group related to the fiscal year preceding the year of the final grant. The acquisition rate: | | | • | is equal to zero if the ROE is less than or equal to 10%; | | • | varies on a straight-line basis between 0% and 80% if the ROE is more than 10% and less than 18%; | | • | varies on a straight-line basis between 80% and 100% if the ROE is more than or equal to 18% and less than 30%; and | | • | is equal to 100% if the ROE is more than or equal to 30%. |
Due to zero if the ROE is less than or equal to 10%;application of the performance condition, the acquisition rate was 60% for the 2008 plan. varies on a straight-line basis between 0% and 80% if the ROE is more than 10% or less than 18%;
varies on a straight-line basis between 80% and 100% if the ROE is more than or equal to 18% or less than 30%; and
is equal to 100% if the ROE is more than or equal to 30%.
The grant of these options or restricted shares is used to complement,extend, based upon individual performance assessments at the time of each plan, the Group-wide policy of developing employee shareholding (including savings plans and capital increases reserved for employees), which allows employees to be more closely associated with theTOTAL’s financial and stock market performance. In addition, the Board of Directors decided at its meeting of May 21, 2010 to implement a global free share priceplan intended for the Group’s employees, that is more than 100,000 employees. On June 30, 2010, rights to 25 free shares were granted to every employee. The shares are subject to a vesting period of two to four years depending on the case. The shares granted are not subject to any performance condition. They will be issued at the end of TOTAL.the vesting period. Grants to the Chairman, the Chief Executive Officer and Executive Officers Pursuant to Article L.225-185 of the French Commercial Code as modified by the provisions of French law No. 2006-1770 of December 30,20, 2006, the Board of Directors decided that, for the 2007, 2008, 2009 and 20092010 share subscription option plans, the corporate officers (the Chairman of the Board and the Chief Executive Officer, and as from May 21, 2010 the Chairman and Chief Executive Officer) will have to hold for as long as they remain in office, a number of TOTAL shares representing 50% of the capital gains, net of tax and related contributions,other deductions, resulting from the exercise of stock options under these plans. Once the Chairman and the Chief Executive Officer hold a number of shares (including shares(directly or interests inthrough collective investment funds invested in Company securities)stock) corresponding to more than five times their current gross annual fixed salary,compensation, this holding requirement will be reduced to 10%. If in the future this ratio is no longer met, the previous 50% holding requirement will once again apply. The
Mr. Desmarest, Chairman of the Board of Directors until May 21, 2010, was not grantedawarded any share subscription options under the 2008, 2009 and 20092010 plans. In addition, the Chairman of the Board of Directors and the Chief Executive Officer werehe was not grantedawarded any restricted shares under plans in the 2006,period from 2005 to 2010. The Chairman and Chief Executive Officer has been awarded share subscription options, the exercise of which has been subject, since 2007, 2008to performance conditions based on the Group’s ROE and 2009 plans.AsROACE. The reasons for selecting these criteria are detailed in “— Pensions and Other Commitments — 8)” above.
The Chairman and Chief Executive Officer was not awarded any restricted shares as part of the 2009plans in the period 2006 to 2010. The Chairman and Chief Executive Officer has given a commitment not to hedge the price risk on the TOTAL stock options and shares he has been granted up to date, and on the shares he holds. 2010 share subscription option plan:as part of the 2010 share subscription option plan, the Board of
91
Directors requireddecided that, forprovided that the continued employment condition is satisfied, the number of options finally granted to the Chairman and Chief Executive Officer the number of share subscription options finally granted will be subject to two performance conditions: | | | • | For 50% of the share subscription options granted, the performance condition states that the number of options finally granted is based on the average ROE of the Group. The average ROE is calculated by the Group based on TOTAL’s consolidated balance sheet and statement of income for fiscal years 2010 and 2011. The acquisition rate is equal to zero if the average ROE is less than or equal to 7%, varies on a straight-line basis between 0% and 100% if the average ROE is more than 7% and less than 18%, and is equal to 100% if the average ROE is more than or equal to 18%. | | | • | For 50% of the share subscription options granted, the performance condition states that the number of options finally granted is based on the average ROACE of the Group calculated based on TOTAL’s consolidated balance sheet and statement of income for fiscal years 2010 and 2011. The acquisition rate is equal to zero if the average ROACE is less than or equal to 6%, varies on a straight-line basis between 0% and 100% if the average ROACE is more than 6% and less than 15%; and is equal to 100% if the average ROACE is more than or equal to 15%. |
In addition, as part of the 2010 share subscription options granted,option plan and provided that the continued employment condition is satisfied, the Board of Directors decided that: | | | • | For each grantee of up to 3,000 options, other than the Chairman and Chief Executive Officer, the options will be finally granted. | | • | For each grantee of more than 3,000 options and less than or equal to 50,000 options (other than the Chairman and Chief Executive Officer): |
| | | | – | the first 3,000 options and two-thirds of the options in excess of this number will be finally granted to their beneficiary; | | – | the outstanding options, that is one-third of the options in excess of the first 3,000 options, will be granted provided that the performance condition described below is fulfilled. |
| | | • | For each grantee of more than 50,000 options, other than the Chairman and Chief Executive Officer: |
| | | | – | the first 3,000 options, two-thirds of the options above the first 3,000 options and below the first 50,000 options, and one-third of the options in excess of the first 50,000 options, will be finally granted to their beneficiary; | | – | the remaining options, that is one-third of the options above the first 3,000 options and below the first 50,000 options, and two-thirds of the options in excess of the first 50,000 options will be finally granted provided that the performance condition is fulfilled. |
This condition states that the number of options finally granted is based on the average ROEReturn on Equity (ROE) of the Group as published by TOTAL.Group. The average ROE is calculated by the Group based on the TOTAL’s consolidated balance sheet and statement of income for fiscal years 2010 and 2011. The acquisition rate: | | | • | is equal to zero if the average ROE is less than or equal to 7%; | | • | varies on a straight-line basis between 0% and 100% if the average ROE is more than 7% and less than 18%; and | | • | is equal to 100% if the average ROE is more than or equal to 18%. |
2009 share subscription option plan:as part of the 2009 share subscription option plan, the Board of Directors decided that, provided that the continued employment condition is satisfied, the number of options finally awarded to the Chief Executive Officer will be subject to two performance conditions: | | | • | For 50% of the share subscription options granted, the performance condition states that the number of options finally granted is based on the average ROE of the Group as published by TOTAL. The average ROE is calculated based on the Group’s consolidated balance sheet and statement of income for fiscal years 2009 and 2010. The acquisition rate is equal to zero if the average ROE is less than or equal to 7%, varies on a straight-line basis between 0% and 100% if the average ROE is more than 7% and less than 18%;, and is equal to 100% if the average ROE is more than or equal to 18%. | | • | For 50% of the share subscription options granted, the performance condition states that the number of options granted is related to the average ROACE of the Group as published by TOTAL. The average ROACE is calculated based on the Group’s consolidated balance sheet and statement of income for fiscal years 2009 and 2010. The acquisition rate is equal to zero if the average ROACE is less than or equal to 6%, varies on a straight-line basis between 0% and 100% if the average ROACE is more than 6% and less than 15%; and is equal to 100% if the average ROACE is more than or equal to 15%. |
For 50% of the share subscription options granted, the second performance condition states that the number of options finally granted is related to the average ROACE of the Group as published by TOTAL. The average ROACE is calculated based on the Group’s consolidated balance sheet and statement of income for fiscal years 2009 and 2010. The acquisition rate is equal to zero if the average ROACE is less than or equal to 6%, varies on a straight-line basis between 0% and 100% if the average ROACE is more than 6% and less than 15%, and is equal to 100% if the average ROACE is more than or equal to 15%.
In addition, as part of the 2009 share subscription option plan, the Board of Directors requireddecided that, provided that the continued employment condition is satisfied, for
92
each beneficiary other than the CEOChief Executive Officer of more than 25,000 options, one thirdone-third of the options granted in excess of this number will be finally granted subject to a performance condition. This condition is based on the average ROE of the Group as published by TOTAL. The average ROE is calculated based on the Group’s consolidated balance sheet and statement of income for fiscal years 2009 and 2010. The acquisition rate: is equal to zero if the average ROE is less than or equal to 7%;
varies on a straight-line basis between 0% and 100% if the average ROE is more than 7% and less than 18%; and
| | | • | is equal to zero if the average ROE is less than or equal to 7%; | | • | varies on a straight-line basis between 0% and 100% if the average ROE is more than 7% and less than 18%; and | | • | is equal to 100% if the average ROE is more than or equal to 18%. |
is equal to 100% if the average ROE is more than or equal to 18%.
As part of the 2007 and 2008 share subscription option plans,plan:as part of the 2008 share subscription option plan, the Board requireddecided that, provided that the continued employment condition is satisfied, for each beneficiary of more than 25,000 options, one thirdone-third of the options granted in excess of this number be subject to a performance condition. This performance condition states that the final acquisition ratenumber of options granted is based on the ROE of the Group. The ROE is calculated based on the consolidated accounts published by TOTAL and related to the fiscal year preceding the final grant. The acquisition rate:
| | | • | is equal to zero if the ROE is less than or equal to 10%; | | • | varies on a straight-line basis between 0% and 80% if the ROE is more than 10% and less than 18%; | | • | varies on a straight-line basis between 80% and 100% if the ROE is more than or equal to 18% and less than 30%; and | | • | is equal to 100% if the ROE is more than or equal to 30%. |
The acquisition rate applicable to zero if the ROE is less than or equalsubscription options that were subject to 10%;the performance condition of the 2008 plan was 60%. varies on a straight-line basis between 0% and 80% if the ROE is more than 10% or less than 18%;
varies on a straight-line basis between 80% and 100% if the ROE is more than or equal to 18% or less than 30%; and
is equal to 100% if the ROE is more than or equal to 30%.
SUMMARY OF COMPENSATION, STOCK OPTIONS AND RESTRICTED SHARES GRANTED
AWARDED TO THE CHAIRMAN AND THE CHIEF EXECUTIVE OFFICER | | | | | | For the year ended December 31, (€) | | 2009 | | 2008 | Thierry Desmarest Chairman of the Board of Directors | | | | | | | | | Compensation(a) | | 1,971,852 | | 2,069,430 | | Value of options granted(b) | | — | | — | | Value of restricted shares granted(c) | | — | | — | | Total | | 1,971,852 | | 2,069,430 | Christophe de Margerie Chief Executive Officer | | | | | | | | | Compensation(a) | | 2,673,771 | | 2,808,395 | | Value of options granted(d) | | 1,676,000 | | 998,000 | | Value of restricted shares granted(c) | | — | | — | | Total | | 4,349,771 | | 3,806,395 |
| | | | | | | | | | | For the year ended (€) | | 2010 | | | 2009 | | Thierry Desmarest | | | | | | | | | Chairman of the Board of Directors | | | | | | | | | (until May 21, 2010) | | | | | | | | | | | | | | | | | | | Compensation due for fiscal year(a) | | | 1,604,039 | | | | 1,971,852 | | | Value of options awarded | | | — | | | | — | | | Value of restricted shares awarded | | | — | | | | — | | | | | | | | | | | | Total | | | 1,604,039 | | | | 1,971,852 | | | | | | | | | | | | Christophe de Margerie
Chief Executive Officer | | | | | | | | | (until May 21, 2010) | | | | | | | | | Chairman and Chief Executive Officer | | | | | | | | | (since May 21, 2010) | | | | | | | | | | | | | | | | | | | Compensation due for fiscal year as Chief Executive Officer(a) | | | 1,030,359 | | | | 2,666,991 | | Compensation due for fiscal year as Chairman and Chief Executive Officer(a) | | | 1,977,763 | | | | — | | In-kind benefits(b) | | | 6,908 | | | | 6,780 | | Value of options awarded(c) | | | 1,387,200 | | | | 1,676,000 | | | Value of restricted shares awarded | | | — | | | | — | | | | | | | | | | | | Total | | | 4,402,230 | | | | 4,349,771 | | | | | | | | | | | |
(a) | | | | (a) | | Compensation detailed in the table “— Compensation of the Chairman and the Chief Executive Officer”. |
| (b) | | The ChairmanMr. de Margerie has the use of the Board was not granted any share subscription options as part of the 2008 and 2009 plans.a company car. |
| (c) | The Chairman and Chief Executive Officer were not granted any restricted shares as part of the 2008 and 2009 plans. |
(d) | Options grantedawarded in 20092010 are detailed in the table “— Stock options grantedawarded in 20092010 to the Chairman and the Chief Executive Officer”. The value of options grantedawarded was calculated on the day when they were grantedawarded using the Black-Scholes model based on the assumptions used for the consolidated accounts (see Note 25 to the Consolidated Financial Statement). |
93
COMPENSATION OF THE CHAIRMAN AND THE CHIEF EXECUTIVE OFFICER | | | | | | | | | | | | For the year ended 2009 | | For the year ended 2008 | | (€) | | Amount
due for
2009 | | Amount
paid in
2009(a) | | Amount
due for
2008 | | Amount
paid in
2008(a) | Thierry Desmarest Chairman of the Board of Directors | | | | | | Fixed compensation | | 1,100,000 | | 1,100,000 | | 1,100,000 | | 1,100,000 | Variable compensation(b) | | 871,852 | | 969,430 | | 969,430 | | 1,112,199 | Extraordinary compensation | | — | | — | | — | | — | Directors’ fees | | — | | — | | — | | — | In-kind benefits | | — | | — | | — | | — | Total | | 1,971,852 | | 2,069,430 | | 2,069,430 | | 2,212,199 | Christophe de Margerie | | | | | | | | | Chief Executive Officer | | | | | | | | | | | | | | Fixed compensation | | 1,310,000 | | 1,310,000 | | 1,250,000 | | 1,250,000 | Variable compensation(c) | | 1,356,991 | | 1,552,875 | | 1,552,875 | | 1,496,335 | Extraordinary compensation | | — | | — | | — | | — | Directors’ fees | | — | | — | | — | | — | In-kind benefits(d) | | 6,780 | | 6,780 | | 5,520 | | 5,520 | Total | | 2,673,771 | | 2,869,655 | | 2,808,395 | | 2,751,855 |
| | | | | | | | | | | | | | | | | | | | | For the year ended 2010 | | | For the year ended 2009 | | | | | Amount
| | | Amount
| | | Amount
| | | Amount
| | | | | due for
| | | paid in
| | | due for
| | | paid in
| | | | | 2010 | | �� | 2010(a) | | | 2009 | | | 2009(a) | | Thierry Desmarest | | | | | | | | | | | | | | | | | Chairman of the Board of Directors | | | | | | | | | | | | | | | | | (until May 21, 2010) | | | | | | | | | | | | | | | | | | | | | | | | | | | | | | | | | | | | Fixed compensation | | | 428,763 | | | | 428,763 | | | | 1,100,000 | | | | 1,100,000 | | Variable compensation(b) | | | 322,644 | | | | 871,852 | | | | 871,852 | | | | 969,430 | | Extraordinary compensation(c) | | | 492,963 | | | | 492,963 | | | | — | | | | — | | Pension benefits(d) | | | 320,341 | | | | 320,341 | | | | — | | | | — | | Directors’ fees(e) | | | 39,328 | | | | 39,328 | | | | — | | | | — | | | In-kind benefits | | | — | | | | — | | | | — | | | | — | | | | | | | | | | | | | | | | | | | | Total | | | 1,604,039 | | | | 2,153,247 | | | | 1,971,852 | | | | 2,069,430 | | | | | | | | | | | | | | | | | | | | | | | | | | | | | | | | | | | | | | | | | For the year ended 2010 | | | For the year ended 2009 | | | | | Amount
| | | Amount
| | | Amount
| | | Amount
| | | | | due for
| | | paid in
| | | due for
| | | paid in
| | | | | 2010 | | | 2010(a) | | | 2009 | | | 2009(a) | | Christophe de Margerie | | | | | | | | | | | | | | | | | Chief Executive Officer | | | | | | | | | | | | | | | | | (until May 21, 2010) | | | | | | | | | | | | | | | | | Chairman and Chief Executive Officer | | | | | | | | | | | | | | | | | (since May 21, 2010) | | | | | | | | | | | | | | | | | | | | | | | | | | | | | | | | | | | | Fixed compensation | | | 1,426,452 | (f) | | | 1,426,452 | (f) | | | 1,310,000 | | | | 1,310,000 | | Variable compensation(g) | | | 1,581,670 | (h) | | | 1,356,991 | | | | 1,356,991 | | | | 1,552,875 | | | Extraordinary compensation | | | — | | | | — | | | | — | | | | — | | | Directors’ fees | | | — | | | | — | | | | — | | | | — | | In-kind benefits(i) | | | 6,908 | | | | 6,908 | | | | 6,780 | | | | 6,780 | | | | | | | | | | | | | | | | | | | | Total | | | 3,015,030 | | | | 2,790,351 | | | | 2,673,771 | | | | 2,869,655 | | | | | | | | | | | | | | | | | | | |
(a) | | | | (a) | | Variable portion paid for prior fiscal year. |
| (b) | | The variable portion for the Chairman of the Board is calculated by taking into account the Group’s return on equity during the relevant fiscal year, the Group’s earnings compared to those of the other major international oil companies that are its competitors, as well as the Chairman’sChairman of the Board’s personal contribution to the Group strategy, corporate governance and performance. The variable portion can reach a maximum amount of 100% of the fixed base salary. The objectives related to personal contribution were considered to be mostly metsubstantially fulfilled in 2009.2010. |
| (c) | | Retirement benefit received. | | (d) | | Retirement benefit received in 2010 under the RECOSUP pension scheme and the defined supplementary pension plan. | | (e) | | Directors’ fees received for the directorship after May 21, 2010; Mr. Desmarest did not receive any directors’ fees when serving in the position of Chairman of the Board. | | (f) | | Includes a fixed portion of €507,097 for the period between January 1 and May 21, 2010 and €919,355 for the period between May 22 and December 31, 2010. | | (g) | | The variable portion for the Chairman and Chief Executive Officer is calculated by taking into account the Group’s return on equity during the relevant fiscal year, the Group’s earnings compared to those of the other major international oil companies that are its competitors as well as the Chairman and Chief Executive Officer’s personal contribution based on operational target criteria. The variable portion can reach a maximum amount of 140%165% of the fixed base salary, which may be increased up to 165% for exceptional performance.salary. The objectives related to personal contribution were considered to be mostly met in 2009.2010. |
(d)(h) | | Including a variable portion of €523,262 for the period between January 1 to May 21, 2010, and €1,058,408 for the period between May 22 and December 31, 2010. | | (i) | | Mr. de Margerie has the use of a company car. |
94
DIRECTORS’ FEES AND OTHER COMPENSATION RECEIVED BY DIRECTORS Total compensation (including in-kind benefits) paid to each director in the year indicated (Article L. 225-102-1 of the French Commercial Code, 1 stand 2 ndparagraphs) : | | | | | | | | (€) | | 2009 | | | 2008 | | Thierry Desmarest | | | (a) | | | (a) | Christophe de Margerie | | | (a) | | | (a) | Patrick Artus | | 27,656 | (b) | | — | | Patricia Barbizet | | 94,192 | (c) | | 39,651 | (d) | Daniel Boeuf | | 272,143 | (e) | | 173,910 | (e) | Daniel Bouton | | 60,000 | | | 40,000 | | Bertrand Collomb | | 75,000 | | | 55,000 | | Paul Desmarais Jr. | | 48,000 | | | 48,000 | | Bertrand Jacquillat | | 95,000 | | | 90,000 | | Antoine Jeancourt-Galignani | | 46,013 | (f)(g) | | 95,000 | | Anne Lauvergeon | | 45,000 | | | 45,000 | | Peter Levene of Portsoken | | 69,000 | | | 41,000 | | Claude Mandil | | 55,000 | | | 27,568 | (d) | Michel Pébereau | | 70,000 | | | 70,000 | | Thierry de Rudder | | 116,000 | | | 116,000 | | Serge Tchuruk | | 154,379 | (h) | | 143,427 | (h) | Pierre Vaillaud | | 80,773 | (f)(i) | | 186,873 | (i) |
| | | | | | | | | | | Gross amount (€) | | 2010 | | | 2009 | | | Christophe de Margerie | | | | (a) | | | | (a) | Thierry Desmarest(b) | | | | (a) | | | | (a) | Patrick Artus(b) | | | 55,000 | | | | 27,656 | | Patricia Barbizet(c) | | | 107,000 | | | | 94,192 | | | Daniel Bouton | | | 55,000 | | | | 60,000 | | Gunnar Brock(d) | | | 39,328 | | | | — | | Claude Clément(d) | | | 127,929 | (e) | | | — | | | Bertrand Collomb | | | 71,000 | | | | 75,000 | | | Paul Desmarais Jr. | | | 45,000 | | | | 48,000 | | | Bertrand Jacquillat | | | 95,000 | | | | 95,000 | | | Anne Lauvergeon | | | 45,000 | | | | 45,000 | | | Peter Levene of Portsoken | | | 79,000 | | | | 69,000 | | | Claude Mandil | | | 55,000 | | | | 55,000 | | | Michel Pébereau | | | 71,000 | | | | 70,000 | | | Thierry de Rudder | | | 142,000 | | | | 116,000 | | Serge Tchuruk(f) | | | 104,639 | (g) | | | 154,379 | (g) |
(a) | | | | (a) | | For Mr. Desmarest and the Chairman of the Board of Directors and the Chief Executive Officer, see summary tables “— Summary of compensation, stock options and restricted shares grantedawarded to the Chairman and the Chief Executive Officer” and “— Compensation of the Chairman and the Chief Executive Officer”. Thierry Desmarest and Christophe de Margerie received no directors’ fees for their service on | | (b) | | Member of the Company’s Board of Directors.Compensation Committee since May 21, 2010. |
(b)(c) | Appointed as a director on May 15, 2009. |
(c) | Chairperson of the Audit Committee since July 28, 2009. |
| (d) | | Director since May 21, 2010. | Appointed(e) | | Including the directors fees received, representing €32,328, as a director on May 16, 2008. |
(a) | Includingwell as the compensation received from Total Raffinage Marketing (a subsidiary of TOTAL S.A.), representing€123,910.48 €95,601 in 2008 and€2010.212,143 in 2009. |
| (f) | | Director until May 15, 2009.21, 2010. |
| (g) | Chairman of the Audit Committee until May 15, 2009. |
(h) | Including pension payments related to previous employment by the Group, which amounted to€73,427 €74,379 in 20082009 and€74,379 €74,914 in 2009.2010. |
(i) | Including pension payments related to previous employment by the Group, which amounted to€141,873 in 2008 and€53,431 in 2009. |
Over the past two years, the directors currently in office have not received any compensation or in-kind benefits from companies controlled by TOTAL S.A., except for Mr. Daniel Boeuf,Clément, who is an employee of Total Raffinage Marketing. The compensation indicated in the table above (except for that of the Chairman theand Chief Executive Officer and Messrs. Boeuf, TchurukDesmarest, Clément and Vaillaud)Tchuruk) consists solely of directors’ fees (gross amount) paid during the relevant period. None of the Directorsdirectors of TOTAL S.A. have service contracts which provide for benefits upon termination of employment.
95
STOCK OPTIONS GRANTEDAWARDED IN 20092010 TO THE CHAIRMAN AND
THE CHIEF EXECUTIVE OFFICER | | | | | | | | | | | | | | | | Date of plan | | Type of options | | Value of
options (€)(a) | | Number of options
granted during
fiscal year(b) | | Exercise
price (€) | | Exercise
period | Thierry Desmarest | | 2009 Plan | | Subscription
options | | — | | — | | — | | — | Chairman of the Board of Directors | | 09/15/2009 | | | | | | | | | | | Total | | | | | | — | | — | | | | | Christophe de Margerie | | 2009 Plan | | Subscription
options | | 1,676,000 | | 200,000 | | 39.90 | | 09/16/2010 | Chief Executive Officer | | 09/15/2009 | | | | | | | | | | 09/15/2017 | Total | | | | | | 1,676,000 | | 200,000 | | | | |
| | | | | | | | | | | | | | | | | | | | | | | | | | | | | | | | | | | | | | | | Number of options
| | | | | | | | | | | | | | | | | | | Value of
| | | awarded during
| | | Exercise
| | | Exercise
| | | Performance
| | | | Date of plan | | | Type of options | | | options (€)(a) | | | fiscal year(b) | | | price (€) | | | period | | | conditions | Thierry Desmarest | | | 2010 Plan | | | | Subscription | | | | — | | | | — | | | | — | | | | — | | | — | Chairman of the Board of Directors | | | 09/14/2010 | | | | options | | | | | | | | | | | | | | | | | | | | (until May 21, 2010) | | | | | | | | | | | | | | | | | | | | | | | | | | | | | | | | | | | | | | | | | | | | | | | | | | | | | | | Total | | | | | | | | | | | — | | | | — | | | | | | | | | | | | | | | | | | | | | | | | | | | | | | | | | | | | | | | | Christophe de Margerie | | | 2010 Plan
09/14/2010 | | | | Subscription
options | | | | 1,387,200 | | | | 240,000 | | | | 38.20 | | | | 09/15/2012
09/14/2018 | | | | Chief Executive Officer
(until May 21, 2010)
Chairman and Chief Executive Officer
(since May 21, 2010) | | | | | | | | | | | | | | | | | | | | | | | | | | For 50% of the options, the condition is based on the average ROE for the Group’s 2010 and 2011 fiscal years. | | | | | | | | | | | | | | | | | | | | | | | | | | | | | | | | | | | | | | | | | | | | | | | | | | | | | | | | For 50% of the options, the condition is based on the average ROACE for the Group’s 2010 and 2011 fiscal years. | | | | | | | | | | | | | | | | | | | | | | | | | | | | | Total | | | | | | | | | | | 1,387,200 | | | | 240,000 | | | | | | | | | | | | | | | | | | | | | | | | | | | | | | | | | | | | | | | |
(a) | | | | (a) | | The value of options grantedawarded was calculated on the day they were grantedawarded using the Black-Scholes model based on the assumptions used for the consolidated accounts (see Note 25 to the Consolidated Financial Statement). |
| (b) | | As part of the share subscription option plan awarded on September 15, 2009,14, 2010, the Board of Directors requireddecided that, for the Chairman and Chief Executive Officer, the number of share subscription options finally granted after a 2-year vesting periodthat are likely to be exercised will be subject to performance conditions. |
STOCK OPTIONS EXERCISED IN 20092010 BY THE CHAIRMAN AND
THE CHIEF EXECUTIVE OFFICER
| | | | | | | | | | | | | | | | | | | | Number of options
| | | | | | | | Date of plan
| | | exercised during
| | | Exercise
| | | | | (Grant date) | | | fiscal year | | | price (€) | | Thierry Desmarest | | | 2002 Plan | | | | 25,372 | | | | 39.03 | | Chairman of the Board of Directors | | | 07/09/2002 | | | | | | | | | | (until May 21, 2010) | | | | | | | | | | | | | | | | | | | | | | | | | | | Total | | | | | | | 25,372 | | | | | | | | | | | | | | | | | | | | Christophe de Margerie | | | — | | | | — | | | | — | | Chief Executive Officer | | | | | | | | | | | | | (until May 21, 2010) | | | | | | | | | | | | | Chairman and Chief Executive Officer | | | | | | | | | | | | | (since May 21, 2010) | | | | | | | | | | | | | | | | | | | | | | | | | | | Total | | | | | | | — | | | | | | | | | | | | | | | | | | | |
96
| | | | | | | | | | Date of plan | | Number of options
exercised during
fiscal year | | Exercise
price (€) | Thierry Desmarest | | 2002 Plan | | 45,000 | | 39.03 | Chairman of the Board of Directors | | 07/09/2002 | | | | | Total | | | | 45,000 | | | Christophe de Margerie Chief Executive Officer | | —
— | | —
— | | —
— | Total | | | | — | | |
RESTRICTED SHARE GRANTS AWARDED IN 2009 TO2010 FOR THE CHAIRMAN,
THECHIEF EXECUTIVE OFFICER OR ANY DIRECTOR (CONDITIONAL AWARD)GRANT) | | | | | | | | | | | | | | | | | | | | | | | | | | | | | | Number of shares
| | | | | | | | | | | | | | | | | | | awarded during
| | | Value of
| | | Acquisition
| | | Availability
| | | Performance
| | | | Date of plan | | | fiscal year | | | shares (€) | | | date | | | date | | | condition | Thierry Desmarest | | | 2010 Plan | | | | — | | | | — | | | | — | | | | — | | | — | Chairman of the Board of Directors | | | 09/14/2010 | | | | | | | | | | | | | | | | | | | | (until May 21, 2010) | | | | | | | | | | | | | | | | | | | | | | | | | | | | | | | | | | | | | | | | | | | | | | | Christophe de Margerie | | | 2010 Plan | | | | — | | | | — | | | | — | | | | — | | | — | Chief Executive Officer | | | 09/14/2010 | | | | | | | | | | | | | | | | | | | | (until May 21, 2010) | | | | | | | | | | | | | | | | | | | | | | | Chairman and Chief Executive Officer | | | | | | | | | | | | | | | | | | | | | | | (since May 21, 2010) | | | | | | | | | | | | | | | | | | | | | | | | | | | | | | | | | | | | | | | | | | | | | | | Claude Clément | | | 2010 Plan | | | | 240 | | | | 35.03 | | | | 09/15/2012 | | | | 09/15/2014 | | | | Director representing employee shareholders | | | 09/14/2010 | | | | | | | | | | | | | | | | | | | Condition based on the Group’s average ROE for fiscal years 2010 and 2011(a) | | | | | 2010 Global
Plan | | | | 25 | | | | 32.70 | | | | 07/01/2012 | | | | 07/01/2014 | | | — | | | | | 06/30/2010 | | | | | | | | | | | | | | | | | | | | | | | | | | | | | | | | | | | | | | | | | | | | Total | | | | | | | 265 | | | | | | | | | | | | | | | | | | | | | | | | | | | | | | | | | | | | | | | |
| | | | (a) | | The performance condition applies to half of the shares awarded in excess of 100 shares. |
RESTRICTED SHARES FINALLY AWARDED IN 2010 FOR THE CHAIRMAN, THE CHIEF EXECUTIVE OFFICER OR ANY DIRECTOR | | | | | | | | | | | | | | Date of plan | | | Number of shares
granted during
fiscal year | | Value of
shares
granted (€) | | | | Acquisition
date | | | Availabilityfinally awarded during
date | | | PerformanceAcquisition
condition | | | Date of plan | | | fiscal year(a) | | | condition | | | | 2008 Plan | | | | — | | | — | Chairman of the Board of Directors | | 2009 Plan
09/15/2009
| | — | | — | | — | | — | | — | Christophe de
Margerie
Chief Executive Officer
| | 2009 Plan
10/09/15/2009 | | — | | — | | — | | — | | — | Daniel Boeuf
Director representing the employee shareholders
| | 2009 Plan
09/15/2009 | | — | | — | | — | | — | | — | Total
2008 | | | | — | | | | (until May 21, 2010) | | | | | | | | | | | | | | | | | | | | | | Christophe de Margerie | | | 2008 Plan | | | | — | | | — | Chief Executive Officer | | | 10/09/2008 | | | | | | | | (until May 21, 2010) | | | | | | | | | | | Chairman and Chief Executive Officer | | | | | | | | | | | (since May 21, 2010) | | | | | | | | | | | | | | | | | | | | | | Claude Clément
Director representing employee shareholders | | | 2008 Plan
10/09/2008 | | | | 300 | | | Condition based
on the Group’s
ROE for fiscal
year 2009 | | | | | | | | | | | | Total | | | | | | | 300 | | | | | | | | | | | | | | |
RESTRICTED SHARES FINALLY GRANTED IN 2009 TO THE CHAIRMAN, THE
CHIEF EXECUTIVE OFFICER OR ANY DIRECTOR
| | | | | | | | | (a) | | Date of plan | | Number of shares
finally granted during
fiscal year(a) | | Acquisition
condition | | Thierry Desmarest
Chairman of the Board of Directors
| | 2007 Plan
07/17/2007
| | — | | — | | Christophe de Margerie
Chief Executive Officer
| | 2007 Plan
07/17/2007
| | — | | — | | Daniel Boeuf
Director representing the employee shareholders
| | 2007 Plan
07/17/2007
| | 432 | | (b | ) | Total
| | | | 432 | | | |
(a) | Shares finally grantedawarded to the beneficiaries after a2-year vesting period, i.e. on July 18, 2009.October 10, 2010. |
| (b) | | The acquisition rate connectedof the shares granted, linked to the performance condition, was 100%60%. By decision of the Board of Directors at its meeting on September 9, 2008, Mr. Clément was awarded 500 restricted shares on October 9, 2008. Moreover, the transfer of the restricted shares finally grantedawarded will only be permitted after the end of a2-year mandatory holding period, i.e. from July 18, 2011.October 10, 2012. |
97
TOTAL stock optionsoption plans The following table gives a breakdown of stock options awarded by category of beneficiaries (executive officers, senior managers and other employees) for the plans in effect during 2009.2010. | | | | | | | | | | | | | | | | | | | | | | | | | | | | Number of
| | | | | | Average number
| | | | | | | Number of
| | | options
| | | | | | of options per
| | | | | | | beneficiaries | | | awarded(a) | | | Percentage | | | beneficiary(a) | | 2002 Plan(b)(d)(e): | | | | | | | | | | | | | | | | | | | Purchase options | | Executive officers(c) | | | 28 | | | | 333,600 | | | | 11.6 | % | | | 11,914 | | | Decision of the Board on July 9, 2002 | | Senior managers | | | 299 | | | | 732,500 | | | | 25.5 | % | | | 2,450 | | | Exercise price: €158.30; discount: 0.0% | | Other employees | | | 3,537 | | | | 1,804,750 | | | | 62.9 | % | | | 510 | | Exercise price as of May 24, 2006: €39.03(a) | | | | | | | | | | | | | | | | | | | | | | Total | | | 3,864 | | | | 2,870,850 | | | | 100 | % | | | 743 | | | | | | | | | | | | | | | | | | | | | | 2003 Plan(b)(d): | | | | | | | | | | | | | | | | | | | Subscription options | | Executive officers(c) | | | 28 | | | | 356,500 | | | | 12.2 | % | | | 12,732 | | | Decision of the Board on July 16, 2003 | | Senior managers | | | 319 | | | | 749,206 | | | | 25.5 | % | | | 2,349 | | | Exercise price: €133.20; discount: 0.0% | | Other employees | | | 3,603 | | | | 1,829,600 | | | | 62.3 | % | | | 508 | | Exercise price as of May 24, 2006: €32.84(a) | | | | | | | | | | | | | | | | | | | | | | Total | | | 3,950 | | | | 2,935,306 | | | | 100 | % | | | 743 | | | | | | | | | | | | | | | | | | | | | | 2004 Plan(d): | | | | | | | | | | | | | | | | | | | Subscription options | | Executive officers(c) | | | 30 | | | | 423,500 | | | | 12.6 | % | | | 14,117 | | | Decision of the Board on July 20, 2004 | | Senior managers | | | 319 | | | | 902,400 | | | | 26.8 | % | | | 2,829 | | | Exercise price: €159.40; discount: 0.0% | | Other employees | | | 3,997 | | | | 2,039,730 | | | | 60.6 | % | | | 510 | | Exercise price as of May 24, 2006: €39.30(a) | | | | | | | | | | | | | | | | | | | | | | Total | | | 4,346 | | | | 3,365,630 | | | | 100 | % | | | 774 | | | | | | | | | | | | | | | | | | | | | | 2005 Plan(d): | | | | | | | | | | | | | | | | | | | Subscription options | | Executive officers(c) | | | 30 | | | | 370,040 | | | | 24.3 | % | | | 12,335 | | | Decision of the Board on July 19, 2005 | | Senior managers | | | 330 | | | | 574,140 | | | | 37.6 | % | | | 1,740 | | | Exercise price: €198.90; discount: 0.0% | | Other employees | | | 2,361 | | | | 581,940 | | | | 38.1 | % | | | 246 | | Exercise price as of May 24, 2006: €49.04(a) | | | | | | | | | | | | | | | | | | | | | | Total | | | 2,721 | | | | 1,526,120 | | | | 100 | % | | | 561 | | | | | | | | | | | | | | | | | | | | | | 2006 Plan(d): | | | | | | | | | | | | | | | | | | | Subscription options | | Executive officers(c) | | | 28 | | | | 1,447,000 | | | | 25.3 | % | | | 51,679 | | | Decision of the Board on July 18, 2006 | | Senior managers | | | 304 | | | | 2,120,640 | | | | 37.0 | % | | | 6,976 | | | Exercise price: €50.60; discount: 0.0% | | Other employees | | | 2,253 | | | | 2,159,600 | | | | 37.7 | % | | | 959 | | | | | Total | | | 2,585 | | | | 5,727,240 | | | | 100 | % | | | 2,216 | | | | | | | | | | | | | | | | | | | | | | 2007 Plan(d)(e): | | | | | | | | | | | | | | | | | | | Subscription options | | Executive officers(c) | | | 27 | | | | 1,329,360 | | | | 22.8 | % | | | 49,236 | | | Decision of the Board on July 17, 2007 | | Senior managers | | | 298 | | | | 2,162,270 | | | | 37.1 | % | | | 7,256 | | | Exercise price: €60.10; discount: 0.0% | | Other employees | | | 2,401 | | | | 2,335,600 | | | | 40.1 | % | | | 973 | | | | | Total | | | 2,726 | | | | 5,827,230 | | | | 100 | % | | | 2,138 | | | | | | | | | | | | | | | | | | | | | | 2008 Plan(d)(e)(f): | | | | | | | | | | | | | | | | | | | Subscription options | | Executive officers(c) | | | 26 | | | | 1,227,500 | | | | 27.6 | % | | | 47,212 | | Awarded on October 9, 2008(g) | | Senior managers | | | 298 | | | | 1,988,420 | | | | 44.7 | % | | | 6,673 | | | Exercise price: €42.90; discount: 0.0% | | Other employees | | | 1,690 | | | | 1,233,890 | | | | 27.7 | % | | | 730 | | | | | Total | | | 2,014 | | | | 4,449,810 | | | | 100 | % | | | 2,209 | | | | | | | | | | | | | | | | | | | | | | 2009 Plan(d)(e): | | | | | | | | | | | | | | | | | | | Subscription options | | Executive officers(c) | | | 26 | | | | 1,201,500 | | | | 27.4 | % | | | 46,211 | | | Decision of the Board on September 15, 2009 | | Senior managers | | | 284 | | | | 1,825,540 | | | | 41.6 | % | | | 6,428 | | | Exercise price: €39.90; discount: 0.0% | | Other employees | | | 1,742 | | | | 1,360,460 | | | | 31.0 | % | | | 781 | | | | | Total | | | 2,052 | | | | 4,387,500 | | | | 100 | % | | | 2,138 | | | | | | | | | | | | | | | | | | | | | | 2010 Plan(d)(e): | | | | | | | | | | | | | | | | | | | Subscription options | | Executive officers(c) | | | 25 | | | | 1,348,100 | | | | 28.2 | % | | | 53,924 | | | Decision of the Board on September 14, 2010 | | Senior managers | | | 282 | | | | 2,047,600 | | | | 42.8 | % | | | 7,261 | | | Exercise price: €38.20; discount: 0.0% | | Other employees | | | 1,790 | | | | 1,392,720 | | | | 29.0 | % | | | 778 | | | | | Total | | | 2,097 | | | | 4,788,420 | | | | 100 | % | | | 2,283 | |
98
| | | | | | | | | | | | | | | | | Number of
beneficiaries | | Number of
options
awarded(a) | | Percentage | | | Average number
of options per
beneficiary(a) | 2001 Plan(b)(c): | | | | | | | | | | | | Purchase options | | Executive Officers(d) | | 21 | | 295,350 | | 11.0 | % | | 14,064 | Decision of the Board on July 10, 2001 Exercise price:€168.20; discount: 0.0% Exercise price as of May 24, 2006:€41.47(a) | | Senior managers Other employees | | 281
3,318 | | 648,950
1,749,075 | | 24.1
64.9 | %
% | | 2,309
527 | | | Total | | 3,620 | | 2,693,375 | | 100 | % | | 744 | | | | | | | 2002 Plan(e)(c): | | | | | | | | | | | | Purchase options | | Executive Officers(d) | | 28 | | 333,600 | | 11.6 | % | | 11,914 | | Decision of the Board on July 9, 2002 Exercise price:€158.30; discount: 0.0% Exercise price as of May 24, 2006:€39.03(a) | | Senior managers Other employees | | 299
3,537 | | 732,500
1,804,750 | | 25.5
62.9 | %
% | | 2,450
510 | | | Total | | 3,864 | | 2,870,850 | | 100 | % | | 743 | | | | | | | 2003 Plan(e)(c): | | | | | | | | | | | | Subscription options | | Executive Officers(d) | | 28 | | 356,500 | | 12.2 | % | | 12,732 | | Decision of the Board on July 16, 2003 Exercise price:€133.20; discount: 0.0% Exercise price as of May 24, 2006:€32.84(a) | | Senior managers Other employees | | 319
3,603 | | 749,206
1,829,600 | | 25.5
62.3 | %
% | | 2,349
508 | | | Total | | 3,950 | | 2,935,306 | | 100 | % | | 743 | | | | | | | 2004 Plan(e): | | | | | | | | | | | | Subscription options | | Executive Officers(d) | | 30 | | 423,500 | | 12.6 | % | | 14,117 | | Decision of the Board on July 20, 2004 Exercise price:€159.40; discount: 0.0% Exercise price as of May 24, 2006:€39.30(a) | | Senior managers Other employees | | 319
3,997 | | 902,400
2,039,730 | | 26.8
60.6 | %
% | | 2,829
510 | | | Total | | 4,346 | | 3,365,630 | | 100 | % | | 774 | | | | | | | 2005 Plan(e): | | | | | | | | | | | | Subscription options | | Executive Officers(d) | | 30 | | 370,040 | | 24.3 | % | | 12,335 | | Decision of the Board on July 19, 2005 Exercise price:€198.90; discount: 0.0% Exercise price as of May 24, 2006:€49.04(a) | | Senior managers Other employees | | 330
2,361 | | 574,140
581,940 | | 37.6
38.1 | %
% | | 1,740
246 | | | Total | | 2,721 | | 1,526,120 | | 100 | % | | 561 | | | | | | | 2006 Plan(e): | | | | | | | | | | | | Subscription options | | Executive Officers(d) | | 28 | | 1,447,000 | | 25.3 | % | | 51,679 | | Decision of the Board on July 18, 2006 Exercise price:€50.60; discount: 0.0% | | Senior managers Other employees | | 304
2,253 | | 2,120,640
2,159,600 | | 37.0
37.7 | %
% | | 6,976
959 | | | Total | | 2,585 | | 5,727,240 | | 100 | % | | 2,216 | 2007 Plan(e)(f)(g): | | | | | | | | | | | | Subscription options | | Executive Officers(d) | | 27 | | 1,329,360 | | 22.8 | % | | 49,236 | | Decision of the Board on July 17, 2007 Exercise price:€60.10; discount: 0.0% | | Senior managers Other employees | | 298
2,401 | | 2,162,270
2,335,600 | | 37.1
40.1 | %
% | | 7,256
973 | | | Total | | 2,726 | | 5,827,230 | | 100 | % | | 2,138 | | | | | | | 2008 Plan(e)(f): | | | | | | | | | | | | Subscription options | | Executive Officers(d) | | 26 | | 1,227,500 | | 27.6 | % | | 47,212 | Decision of the Board on September 9, 2008, and awarded on October 9, 2008 Exercise price:€42.90; discount: 0.0% | | Senior managers Other employees | | 298
1,690 | | 1,988,420
1,233,890 | | 44.7
27.7 | %
% | | 6,673
730 | | | Total | | 2,014 | | 4,449,810 | | 100 | % | | 2,209 |
| | | | | | | | | | | | | | | | | Number of
beneficiaries | | Number of
options
awarded(a) | | Percentage | | | Average number
of options per
beneficiary(a) | | | | | | | 2009 Plan(e)(f): | | | | | | | | | | | | Subscription options Decision of the Board on September 15, 2009 Exercise price:€39.90; discount: 0.0% | | Executive Officers(d) | | 26 | | 1,201,500 | | 27.4 | % | | 46,211 | | | Senior managers Other employees | | 284
1,742 | | 1,825,540
1,360,460 | | 41.6
31.0 | %
% | | 6,428
781 | | | Total | | 2,052 | | 4,387,500 | | 100 | % | | 2,138 |
(a) | | | | (a) | | To take into account the spin-off of Arkema, pursuant toArticles 174-9, 174-12174-9,174-12 and174-13 of Decree numberNo. 67-236 of March 23, 1967, effective at that time and as of the date of the shareholders’ meetingShareholders’ Meeting on May 12, 2006, at its meeting of March 14, 2006, the Board of Directors resolved to adjust the rights of holders of TOTAL stock options. For each plan and each holder, the exercise prices for TOTAL stock options were multiplied by 0.986147 and the number of unexercised stock options was multiplied by 1.014048 (and then rounded up), effective as of May 24, 2006. In addition, to take into account thefour-for-one stock split approved by the Shareholders’ Meeting on May 12, 2006, the exercise price for stock options was divided by four and the number of unexercised stock options was multiplied by four. The presentation in this table of the number of options initially awarded has not been adjusted to reflect thefour-for-one stock split. |
| (b) | Options are exercisable after January 1, 2005, subject to a continued employment condition, and expire eight years after the date of the Board meeting awarding the options and expire eight years after this date. The underlying shares may not be transferred during the 4-year period from the date of the Board meeting awarding the options. The continued employment condition states that the termination of the employment contract will also terminate the grantee’s right to exercise the options. |
(c) | Certain employees of the Elf Aquitaine group in 1998 also benefited in 2000, 2001, 2002 and 2003 from the vesting of Elf Aquitaine options awarded in 1998 subject to performance conditions related to the Elf Aquitaine group from 1998 to 2002. These Elf Aquitaine plans expired on March 31, 2005. |
(d)(c) | | Members of the Management Committee and the Treasurer as of the date of the Board meeting awarding the options. The Chairman of the BoardMr. Desmarest has no longer been a member of the Management Committee since February 14, 2007. The Chairman of the Board of DirectorsMr. Desmarest was grantedawarded 110,000 options inunder the 2007 plan and no options inoption under the 2008 and 2009.2009 plans. |
(e)(d) | | OptionsThe options are exercisable, subject to a continued employment condition, after a2-year vesting period from the date of the Board meeting awarding the options and expire eight years after this date. The underlying shares may not be transferred during the4-year period from the date of the Board meeting awarding the options (except for the 2008 plan) and expire eight years after this date. The underlying shares may not be transferred during the 4-year period from the date of the Board meeting awarding the options.. The continued employment condition states that the termination of the employment contract will also terminate the grantee’s right to exercise the options. |
(f)(e) | | The4-year transfer restriction period does not apply to employees of non-French subsidiaries as of the date of the grant, who may transfer the underlying shares after a2-year period formfrom the date of the grant. |
(g)(f) | | For the 20072008 plan, the options acquisition rate, connectedlinked to the performance condition, was 100%60%. | | (g) | | Decision of the Board on September 9, 2008. |
99
TOTAL STOCK OPTIONS AS OF DECEMBER 31, 20092010 | | | | | | | | | | | | | | | | | | | | | | | | | | | | | | | | | | 2001 Plan | | | 2002 Plan | | | 2003 Plan | | | 2004 Plan | | | 2005 Plan | | | 2006 Plan | | | 2007 Plan | | | 2008 Plan | | | 2009 Plan | | | Total | | Type of options | | Purchase
options |
| | Purchase
options |
| | Subscription
options |
| | Subscription
options |
| | Subscription
options |
| | Subscription
options |
| | Subscription
options |
| | Subscription
options |
| | Subscription
options |
| | | | Date of the Shareholders’ Meeting | | May 17,
2001 |
| | May 17,
2001 |
| | May 17,
2001 |
| | May 14,
2004 |
| | May 14,
2004 |
| | May 14,
2004 |
| | May 11,
2007 |
| | May 11,
2007 |
| | May 11,
2007 |
| | | | Date of the award(a) | | July 10,
2001 |
| | July 9,
2002 |
| | July 16,
2003 |
| | July 20,
2004 |
| | July 19,
2005 |
| | July 18,
2006 |
| | July 17,
2007 |
| | October 9,
2008 |
| | September 15,
2009 |
| | | | Total number of options granted, including(b): | | 10,773,500 | | | 11,483,400 | | | 11,741,224 | | | 13,462,520 | | | 6,104,480 | | | 5,727,240 | | | 5,937,230 | | | 4,449,810 | | | 4,387,500 | | | 74,066,904 | | • directors(c) | | 300,000 | | | 240,000 | | | 240,000 | | | 240,000 | | | 240,720 | | | 400,720 | | | 310,840 | | | 200,660 | | | 200,000 | | | 2,372,940 | | • T. Desmarest | | 300,000 | | | 240,000 | | | 240,000 | | | 240,000 | | | 240,000 | | | 240,000 | | | 110,000 | | | — | | | — | | | 1,610,000 | | • C. de Margerie | | n/a | | | n/a | | | n/a | | | n/a | | | n/a | | | 160,000 | | | 200,000 | | | 200,000 | | | 200,000 | | | 760,000 | | • D. Boeuf | | n/a | | | n/a | | | n/a | | | — | | | 720 | | | 720 | | | 840 | | | 660 | | | — | | | 2,940 | | Additional award | | 16,000 | | | — | | | — | | | 24,000 | | | 134,400 | | | — | | | — | | | — | | | — | | | 174,400 | | Adjustments related to the spin-off of Arkema(d) | | 113,704 | | | 165,672 | | | 163,180 | | | 196,448 | | | 90,280 | | | — | | | — | | | — | | | — | | | 729,284 | | Date as of which the options may be exercised | | January 1,
2005 |
| | July 10,
2004 |
| | July 17,
2005 |
| | July 21,
2006 |
| | July 20,
2007 |
| | July 19,
2008 |
| | July 18,
2009 |
| | October 10,
2010 |
| | September 16,
2011 |
| | | | Expiration date | | July 10,
2009 |
| | July 9,
2010 |
| | July 16,
2011 |
| | July 20,
2012 |
| | July 19,
2013 |
| | July 18,
2014 |
| | July 17,
2015 |
| | October 9,
2016 |
| | September 15,
2017 |
| | | | Exercise price (€)(e) | | 41.47 | | | 39.03 | | | 32.84 | | | 39.30 | | | 49.04 | | | 50.60 | | | 60.10 | | | 42.90 | | | 39.90 | | | | | Cumulative number of options exercised as of December 31, 2009 | | 6,156,019 | | | 5,615,101 | | | 4,996,833 | | | 908,976 | | | 38,497 | | | 8,620 | | | — | | | — | | | — | | | | | Cumulative number of options cancelled as of December 31, 2009 | | 4,747,185 | | | 98,710 | | | 95,942 | | | 278,283 | | | 105,223 | | | 72,934 | | | 65,565 | | | 8,180 | | | 10,610 | | | | | Number of options: | | | | | | | | | | | | | | | | | | | | | | | | | | | | | | | • outstanding as of January 1, 2009 | | 4,691,426 | | | 6,450,857 | | | 7,501,348 | | | 12,767,177 | | | 6,191,704 | | | 5,651,056 | | | 5,885,445 | | | 4,443,810 | | | — | | | 53,582,823 | | • granted in 2009(f) | | — | | | — | | | — | | | — | | | — | | | — | | | — | | | — | | | 4,387,620 | | | 4,387,620 | | • cancelled in 2009 | | (4,650,446 | ) | | (7,920 | ) | | (8,020 | ) | | (18,387 | ) | | (6,264 | ) | | (5,370 | ) | | (13,780 | ) | | (2,180 | ) | | (10,610 | ) | | (4,722,977 | ) | • exercised in 2009 | | (40,980 | ) | | (507,676 | ) | | (681,699 | ) | | (253,081 | ) | | — | | | — | | | — | | | — | | | — | | | (1,483,436 | ) | • outstanding as of December 31, 2009 | | — | | | 5,935,261 | | | 6,811,629 | | | 12,495,709 | | | 6,185,440 | | | 5,645,686 | | | 5,871,665 | | | 4,441,630 | | | 4,377,010 | | | 51,764,030 | |
| | | | | | | | | | | | | | | | | | | | | | | | | | | | | | | | | | | | | | | | | | | | | 2002 Plan
| | | 2003 Plan
| | | 2004 Plan
| | | 2005 Plan
| | | 2006 Plan
| | | 2007 Plan
| | | 2008 Plan
| | | 2009 Plan
| | | 2010 Plan
| | | | | | | | Purchase
| | | Subscription
| | | Subscription
| | | Subscription
| | | Subscription
| | | Subscription
| | | Subscription
| | | Subscription
| | | Subscription
| | | | | | Type of options | | options | | | options | | | options | | | options | | | options | | | options | | | options | | | options | | | options | | | Total
| | | Date of the Shareholders’ Meeting | | | 05/17/2001 | | | | 05/17/2001 | | | | 05/14/2004 | | | | 05/14/2004 | | | | 05/14/2004 | | | | 05/11/2007 | | | | 05/11/2007 | | | | 05/11/2007 | | | | 05/21/2010 | | | | | | Grant date(a) | | | 07/09/2002 | | | | 07/16/2003 | | | | 07/20/2004 | | | | 07/19/2005 | | | | 07/18/2006 | | | | 07/17/2007 | | | | 10/09/2008 | | | | 09/15/2009 | | | | 09/14/2010 | | | | | | | | | | | | | | | | | | | | | | | | | | | | | | | | | | | | | | | | | | | | | | | | Total number of options awarded, including(b): | | | 11,483,400 | | | | 11,741,224 | | | | 13,462,520 | | | | 6,104,480 | | | | 5,727,240 | | | | 5,937,230 | | | | 4,449,810 | | | | 4,387,500 | | | | 4,788,420 | | | | 68,081,824 | | directors(c) | | | 240,000 | | | | 240,000 | | | | 240,000 | | | | 240,720 | | | | 400,720 | | | | 310,840 | | | | 200,660 | | | | 200,000 | | | | 240,000 | | | | 2,312,940 | | • D. Boeuf | | | n/a | | | | n/a | | | | — | | | | 720 | | | | 720 | | | | 840 | | | | 660 | | | | 0 | | | | n/a | | | | 2,940 | | • T. Desmarest | | | 240,000 | | | | 240,000 | | | | 240,000 | | | | 240,000 | | | | 240,000 | | | | 110,000 | | | | — | | | | — | | | | — | | | | 1,310,000 | | • C. de Margerie | | | n/a | | | | n/a | | | | n/a | | | | n/a | | | | 160,000 | | | | 200,000 | | | | 200,000 | | | | 200,000 | | | | 240,000 | | | | 1,000,000 | | • C. Clément | | | n/a | | | | n/a | | | | n/a | | | | n/a | | | | n/a | | | | n/a | | | | n/a | | | | n/a | | | | — | | | | — | | | | | | | | | | | | | | | | | | | | | | | | | | | | | | | | | | | | | | | | | | | | Additional grant | | | — | | | | — | | | | 24,000 | | | | 134,400 | | | | — | | | | — | | | | — | | | | — | | | | — | | | | 158,400 | | Adjustments related to the
spin-off of Arkema(d) | | | 165,672 | | | | 163,180 | | | | 196,448 | | | | 90,280 | | | | — | | | | — | | | | — | | | | — | | | | — | | | | 615,580 | | | | | | | | | | | | | | | | | | | | | | | | | | | | | | | | | | | | | | | | | | | | | Date as of which the options may be exercised | | | 07/10/2004 | | | | 07/17/2005 | | | | 07/21/2006 | | | | 07/20/2007 | | | | 07/19/2008 | | | | 07/18/2009 | | | | 10/10/2010 | | | | 09/16/2011 | | | | 09/15/2012 | | | | | | | Expiry date | | | 07/09/2010 | | | | 07/16/2011 | | | | 07/20/2012 | | | | 07/19/2013 | | | | 07/18/2014 | | | | 07/17/2015 | | | | 10/09/2016 | | | | 09/15/2017 | | | | 09/14/2018 | | | | | | Exercise price (€)(e) | | | 39.03 | | | | 32.84 | | | | 39.30 | | | | 49.04 | | | | 50.60 | | | | 60.10 | | | | 42.90 | | | | 39.90 | | | | 38.20 | | | | | | | | | | | | | | | | | | | | | | | | | | | | | | | | | | | | | | | | | | | | | | | | Cumulative number of options exercised as of December 31, 2010 | | | 6,878,373 | | | | 6,072,598 | | | | 1,050,178 | | | | 38,497 | | | | 8,620 | | | | — | | | | — | | | | 1,080 | | | | — | | | | | | Cumulative number of options canceled as of December 31, 2010 | | | 4,770,699 | | | | 97,362 | | | | 293,943 | | | | 111,807 | | | | 77,734 | | | | 70,785 | | | | 100,652 | | | | 14,650 | | | | 1,120 | | | | | | | | | | | | | | | | | | | | | | | | | | | | | | | | | | | | | | | | | | | | | | | | | Number of options: | | | | | | | | | | | | | | | | | | | | | | | | | | | | | | | | | | | | | | | | | | • outstanding as of January 1, 2010 | | | 5,935,261 | | | | 6,811,629 | | | | 12,495,709 | | | | 6,185,440 | | | | 5,645,686 | | | | 5,871,665 | | | | 4,441,630 | | | | 4,377,010 | | | | — | | | | 51,764,030 | | | Awarded in 2010 | | | — | | | | — | | | | — | | | | — | | | | — | | | | — | | | | — | | | | — | | | | 4,788,420 | | | | 4,788,420 | | • Canceled in 2010(f)(g) | | | (4,671,989 | ) | | | (1,420 | ) | | | (15,660 | ) | | | (6,584 | ) | | | (4,800 | ) | | | (5,220 | ) | | | (92,472 | ) | | | (4,040 | ) | | | (1,120 | ) | | | (4,803,305 | ) | | • exercised in 2010 | | | (1,263,272 | ) | | | (1,075,765 | ) | | | (141,202 | ) | | | — | | | | — | | | | — | | | | — | | | | (1,080 | ) | | | — | | | | (2,481,319 | ) | outstanding as of December 31, 2010 | | | — | | | | 5,734,444 | | | | 12,338,847 | | | | 6,178,856 | | | | 5,640,886 | | | | 5,866,445 | | | | 4,349,158 | | | | 4,371,890 | | | | 4,787,300 | | | | 49,267,826 | | | | | | | | | | | | | | | | | | | | | | | | | | | | | | | | | | | | | | | | | | | |
(a) | | | | (a) | | The grant date of the award is the date of the Board meeting awarding the options, except for the share subscription option plan of October 9, 2008, decidedapproved by the Board on September 9, 2008. |
| (b) | | The number of options awarded before May 23, 2006, has been multiplied by four to take into account thefour-for-one stock split approved by the Shareholders’ Meeting on May 12, 2006. |
| (c) | | Options awarded to directors at the time of award.grant. |
| (d) | | Adjustments approved by the Board on its meeting on March 14, 2006 pursuant toArticles 174-9, 174-12174-9,174-12 and174-13 of DecreeNo. 67-236 dated March 23, 1967 in effect at the time of the Board meeting as well as at the time of the Shareholders’ Meeting on May 12, 2006, related to the spin-off of Arkema. These adjustments have beenwere made on May 22, 2006 with an effective dateas of May 24, 2006. |
| (e) | | Exercise price as of May 24, 2006. To take into account thefour-for-one stock split that took place on May 18, 2006, the exercise price of stock options from plans then effective has been divided by four. In addition, to take into account the spin-off of Arkema, the exercise price of stock options was multiplied by an adjustment ratio of 0.986147, effective as of May 24, 2006. Exercise prices prior to May 24, 2006, are shown in Note 25 to the Consolidated Financial Statements. |
| (f) | | ForOut of the 20074,671,989 options canceled in 2010, 4,671,145 options that were not exercised expired due to the expiry of the 2002 purchase option plan on July 9, 2010. | | (g) | | Out of the 92,472 options awarded under the 2008 plan that were canceled, 88,532 options were canceled due to the application of the performance condition. The acquisition rate connectedapplicable to the subscription options that were subject to the performance condition of the 2008 plan was 100%60%. |
If all the outstanding stock options as of December 31, 20092010, were exercised, the corresponding shares would represent 2.16%2.05%(1) of the Company’s potential share capital as of such date. (1) Out of a total potential share capital of 2,398,908,757 shares.
100
1. | Out of a total potential share capital of 2,394,251,653 shares. |
TOTAL STOCK OPTIONS AWARDED TO EXECUTIVE OFFICERS (MANAGEMENT COMMITTEE AND
TREASURER) AS OF DECEMBER 31, 20092010 | | | | | | | | | | | | | | | | | | | | | | | | | | | 2001 Plan | | 2002 Plan | | 2003 Plan | | | 2004 Plan | | | 2005 Plan | | 2006 Plan | | 2007 Plan | | 2008 Plan | | 2009 Plan | | Total | | | Type of options | | Purchase
options | | Purchase
options | | Subscription
options | | | Subscription
options | | | Subscription
options | | Subscription
options | | Subscription
options | | Subscription
options | | Subscription
options | | | | Expiration date | | July 10, 2009 | | July 9, 2010 | | July 16, 2011 | | | July 20, 2012 | | | July 19, 2013 | | July 18, 2014 | | July 17 2015 | | October 9, 2016 | | September 15, 2017 | | | | Exercise price (€)(a) | | 41.47 | | 39.03 | | 32.84 | | | 39.30 | | | 49.04 | | 50.60 | | 60.10 | | 42.90 | | 39.90 | | | | Options granted by the Board(b) | | 492,000 | | 560,200 | | 635,704 | | | 796,800 | | | 689,680 | | 823,720 | | 1,000,840 | | 1,101,200 | | 1,169,800 | | 7,269,944 | | Adjustments related to the spin-off of Arkema(c) | | 3,254 | | 7,568 | | 8,120 | | | 11,248 | | | 9,608 | | — | | — | | — | | — | | 39,798 | | Options outstanding as of January 1, 2009 | | 182,268 | | 243,232 | | 338,337 | | | 795,048 | | | 699,416 | | 823,720 | | 1,000,840 | | 1,101,200 | | — | | 5,184,061 | | Options awarded in 2009(d) | | — | | — | | — | | | — | | | — | | — | | — | | — | | 1,169,800 | | 1,169,800 | | Options exercised in 2009 | | — | | — | | (47,000 | ) | | (90,000 | ) | | — | | — | | — | | — | | — | | (137,000 | ) | Options outstanding as of December 31, 2009 | | — | | 243,232 | | 291,337 | | | 705,048 | | | 699,416 | | 823,720 | | 1,000,840 | | 1,101,200 | | 1,169,800 | | 6,034,593 | |
| | | | | | | | | | | | | | | | | | | | | | | | | | | | | | | | | | | | | | | | | | | | | 2002 Plan
| | | 2003 Plan
| | | 2004 Plan
| | | 2005 Plan
| | | 2006 Plan
| | | 2007 Plan
| | | 2008 Plan
| | | 2009 Plan
| | | 2010 Plan
| | | | | | | |
Purchase
| | |
Subscription
| | |
Subscription
| | |
Subscription
| | |
Subscription
| | |
Subscription
| | |
Subscription
| | |
Subscription
| | |
Subscription
| | | | | | Type of options | | options | | | options | | | options | | | options | | | options | | | options | | | options | | | options | | | options | | | Total
| | | Expiry date | | | 07/09/2010 | | | | 07/16/2011 | | | | 07/20/2012 | | | | 07/19/2013 | | | | 07/18/2014 | | | | 07/17/2015 | | | | 10/09/2016 | | | | 09/15/2017 | | | | 09/14/2018 | | | | | | Exercise price (€)(a) | | | 39.03 | | | | 32.84 | | | | 39.30 | | | | 49.04 | | | | 50.60 | | | | 60.10 | | | | 42.90 | | | | 39.90 | | | | 38.20 | | | | | | | | | | | | | | | | | | | | | | | | | | | | | | | | | | | | | | | | | | | | | | | | Options awarded by the Board(b) | | | 560,200 | | | | 635,704 | | | | 796,800 | | | | 689,680 | | | | 823,720 | | | | 1,000,840 | | | | 1,101,200 | | | | 1,169,800 | | | | 1,348,100 | | | | 8,126,044 | | Adjustments related to the spin-off of Arkema(c) | | | 7,568 | | | | 8,120 | | | | 11,248 | | | | 9,608 | | | | — | | | | — | | | | — | | | | — | | | | — | | | | 36,544 | | | | | | | | | | | | | | | | | | | | | | | | | | | | | | | | | | | | | | | | | | | | | Options outstanding as of 01/01/10 | | | 243,232 | | | | 291,337 | | | | 705,048 | | | | 699,416 | | | | 823,720 | | | | 1,000,840 | | | | 1,101,200 | | | | 1,169,800 | | | | — | | | | 6,034,593 | | | Options awarded in 2010 | | | — | | | | — | | | | — | | | | — | | | | — | | | | — | | | | — | | | | — | | | | 1,348,100 | | | | 1,348,100 | | | Options exercised in 2010 | | | (20,600 | ) | | | (25,172 | ) | | | (90,000 | ) | | | — | | | | — | | | | — | | | | — | | | | — | | | | — | | | | (135,772 | ) | Options canceled in 2010(d)(e) | | | (222,632 | ) | | | — | | | | — | | | | — | | | | — | | | | — | | | | (78,399 | ) | | | — | | | | — | | | | (301,031 | ) | | Options outstanding as of 12/31/10 | | | — | | | | 266,165 | | | | 615,048 | | | | 699,416 | | | | 823,720 | | | | 1,000,840 | | | | 1,022,801 | | | | 1,169,800 | | | | 1,348,100 | | | | 6,945,890 | | | | | | | | | | | | | | | | | | | | | | | | | | | | | | | | | | | | | | | | | | | |
(a) | | | | (a) | | Exercise price as of May 24, 2006. To take into account thefour-for-one stock split that took place on May 18, 2006, the exercise price of stock options from plans then effective has been divided by four. In addition, to take into account the spin-off of Arkema, the exercise price of stock options was multiplied by an adjustment ratio of 0.986147, effective as of May 24, 2006. Exercise prices prior to May 24, 2006, are shown in Note 25 to the Consolidated Financial Statements. |
| (b) | | The number of options awarded before May 23, 2006, has been multiplied by four to take into account thefour-for-one stock split approved by the Shareholders’ Meeting on May 12, 2006. |
| (c) | | Adjustments approved by the Board on its meeting on March 14, 2006 pursuant toArticles 174-9, 174-12174-9,174-12 and174-13 of DecreeNo. 67-236 dated March 23, 1967 in effect at the time of the Board meeting and at the time of the Shareholders’ Meeting on May 12, 2006, related to the spin-off of Arkema. These adjustments have beenwere made on May 22, 2006 with an effective dateas of May 24, 2006. |
| (d) | | The numberOut of the 301,031 options awardedcanceled in 2009 to executive officers, having this title as of December 31, 2009, does2010, 222,632 options that were not match the amount shown in the table “— TOTAL stock options as of December 31, 2009”,exercised expired due to changes among the executive officers afterexpiry of the date2002 purchase option plan on July 9, 2010. | | (e) | | 78,399 options of the Board decided2008 plan were canceled due to the share option plan.application of the performance condition. The acquisition rate applicable to the subscription options that were subject to the performance condition of the 2008 plan was 60%. |
As part of the 2007, 2008 and 2009 share subscription option plans, the Board of Directors requireddecided that for each beneficiary of more than 25,000 options, one thirdone-third of the options grantedawarded in excess of this number be subject to a performance condition. For the 20072010 share subscription option plan, thebeneficiaries of more than 3,000 options acquisition rate, connectedare subject to thea performance condition was 100%.for part of the options. In addition, Mr. Daniel Boeuf,Clément, the director representing employee shareholders, has not exercised any option in 20092010 and has not been awarded any share subscription optionoptions by the 20092010 plan.
101
TOTAL STOCK OPTIONS AWARDED TO MR. THIERRY DESMAREST,
CHAIRMAN OF THE BOARD OF TOTAL S.A. UNTIL MAY 21, 2010 | | | | | | | | | | | | | | | | | | | | | | | | | | 2001 Plan | | 2002 Plan | | | 2003 Plan | | 2004 Plan | | 2005 Plan | | 2006 Plan | | 2007 Plan | | 2008 Plan | | 2009 Plan | | Total | | | Type of options | | Purchase
options | | Purchase
options | | | Subscription
options | | Subscription
options | | Subscription
options | | Subscription
options | | Subscription
options | | Subscription
options | | Subscription
options | | | | Expiration date | | July 10,
2009 | | July 9,
2010 |
| | July 16,
2011 | | July 20,
2012 | | July 19,
2013 | | July 18,
2014 | | July 17,
2015 | | October 9,
2016 | | September 15,
2017 | | | | Exercise price (€)(a) | | 41.47 | | 39.03 | | | 32.84 | | 39.30 | | 49.04 | | 50.60 | | 60.10 | | 42.90 | | 39.90 | | | | Options granted by the Board(b) | | 300,000 | | 240,000 | | | 240,000 | | 240,000 | | 240,000 | | 240,000 | | 110,000 | | — | | — | | 1,610,000 | | Adjustments related to the spin-off of Arkema(c) | | 2,532 | | 3,372 | | | 2,476 | | 3,372 | | 3,372 | | — | | — | | — | | — | | 15,124 | | Options outstanding as of January 1, 2009 | | — | | 70,372 | | | — | | 243,372 | | 243,372 | | 240,000 | | 110,000 | | — | | — | | 907,116 | | Options awarded in 2009 | | — | | — | | | — | | — | | — | | — | | — | | — | | — | | — | | Options exercised in 2009 | | — | | (45,000 | ) | | — | | — | | — | | — | | — | | — | | — | | (45,000 | ) | Options outstanding as of December 31, 2009 | | — | | 25,372 | | | — | | 243,372 | | 243,372 | | 240,000 | | 110,000 | | — | | — | | 862,116 | |
| | | | | | | | | | | | | | | | | | | | | | | | | | | | | | | | | | | | | | | | | | | | | 2002 Plan
| | | 2003 Plan
| | | 2004 Plan
| | | 2005 Plan
| | | 2006 Plan
| | | 2007 Plan
| | | 2008 Plan
| | | 2009 Plan
| | | 2010 Plan
| | | | | | | |
Purchase
| | |
Subscription
| | |
Subscription
| | |
Subscription
| | |
Subscription
| | |
Subscription
| | |
Subscription
| | |
Subscription
| | |
Subscription
| | | | | | Type of options | | options | | | options | | | options | | | options | | | options | | | options | | | options | | | options | | | options | | | Total
| | | Expiry date | | | 07/09/2010 | | | | 07/16/2011 | | | | 07/20/2012 | | | | 07/19/2013 | | | | 07/18/2014 | | | | 07/17/2015 | | | | 10/09/2016 | | | | 09/15/2017 | | | | 09/14/2018 | | | | | | Exercise price (€)(a) | | | 39.03 | | | | 32.84 | | | | 39.30 | | | | 49.04 | | | | 50.60 | | | | 60.10 | | | | 42.90 | | | | 39.90 | | | | 38.20 | | | | | | | | | | | | | | | | | | | | | | | | | | | | | | | | | | | | | | | | | | | | | | | | Options awarded by the Board(b) | | | 240,000 | | | | 240,000 | | | | 240,000 | | | | 240,000 | | | | 240,000 | | | | 110,000 | | | | — | | | | — | | | | — | | | | 1,310,000 | | Adjustments related to the spin-off of Arkema(c) | | | 3,372 | | | | 2,476 | | | | 3,372 | | | | 3,372 | | | | — | | | | — | | | | — | | | | — | | | | — | | | | 12,592 | | | | | | | | | | | | | | | | | | | | | | | | | | | | | | | | | | | | | | | | | | | | | Options outstanding as of 01/01/10 | | | 25,372 | | | | — | | | | 243,372 | | | | 243,372 | | | | 240,000 | | | | 110,000 | | | | — | | | | — | | | | — | | | | 862,116 | | | Options awarded in 2010 | | | — | | | | — | | | | — | | | | — | | | | — | | | | — | | | | — | | | | — | | | | — | | | | — | | | Options exercised in 2010 | | | (25,372 | ) | | | — | | | | — | | | | — | | | | — | | | | — | | | | — | | | | — | | | | — | | | | (25,372 | ) | | Options canceled in 2010 | | | — | | | | — | | | | — | | | | — | | | | — | | | | — | | | | — | | | | — | | | | — | | | | — | | | Options outstanding as of 12/31/10 | | | — | | | | — | | | | 243,372 | | | | 243,372 | | | | 240,000 | | | | 110,000 | | | | — | | | | — | | | | — | | | | 836,744 | | | | | | | | | | | | | | | | | | | | | | | | | | | | | | | | | | | | | | | | | | | |
(a) | | | | (a) | | Exercise price as of May 24, 2006. To take into account thefour-for-one stock split that took place on May 18, 2006, the exercise price of stock options from plans then effective has been divided by four. In addition, to take into account the spin-off of Arkema, the exercise price of stock options was multiplied by an adjustment ratio of 0.986147, effective as of May 24, 2006. Exercise prices prior to May 24, 2006, are shown in Note 25 to the Consolidated Financial Statements. |
| (b) | | The number of options awarded before May 23, 2006, has been multiplied by four to take into account thefour-for-one stock split approved by the Shareholders’ Meeting on May 12, 2006. |
| (c) | | Adjustments approved by the Board on its meeting on March 14, 2006 pursuant toArticles 174-9, 174-12174-9,174-12 and174-13 of DecreeNo. 67-236 dated March 23, 1967 in effect at the time of the Board meeting and at the time of the Shareholders’ Meeting on May 12, 2006, related to the spin-off of Arkema. These adjustments have beenwere made on May 22, 2006 with an effective dateas of May 24, 2006. |
As part of December 31, 2010, the 2007 plan, the Board has conditioned the awardoutstanding options of these options to the Chairman of the Board on the fulfillment of a performance condition. For the 2007 plan, the options acquisition rate, connected to the performance condition, was 100%.TheMr. Desmarest, Chairman of the Board of Directors’ outstanding options as of December 31, 2009, represent 0.036%Directors until May 21, 2010, represented 0.035%(1) of the Company’s potential share capital as of such date.
(1) Out of a total potential share capital of 2,398,908,757 shares.
102
1. | Out of a total potential share capital of 2,394,251,653 shares. |
TOTAL STOCK OPTIONS AWARDED TO MR. CHRISTOPHE DE MARGERIE, CHAIRMAN AND
CHIEF EXECUTIVE OFFICER OF TOTAL S.A. | | | | | | | | | | | | | | | | | | | | | | | | 2001 Plan | | 2002 Plan | | 2003 Plan | | 2004 Plan | | 2005 Plan | | 2006 Plan | | 2007 Plan | | 2008 Plan | | 2009 Plan | | Total | | Type of options | | Purchase
options | | Purchase
options | | Subscription
options | | Subscription
options | | Subscription
options | | Subscription
options | | Subscription
options | | Subscription
options | | Subscription
options | | | Expiration date | | July 10, 2009 | | July 9, 2010 | | July 16, 2011 | | July 20, 2012 | | July 19, 2013 | | July 18, 2014 | | July 17, 2015 | | October 9, 2016 | | September 15, 2017 | | | Exercise price (€)(a) | | 41.47 | | 39.03 | | 32.84 | | 39.30 | | 49.04 | | 50.60 | | 60.10 | | 42.90 | | 39.90 | | | Options granted by the Board(b) | | 88,000 | | 112,000 | | 112,000 | | 128,000 | | 130,000 | | 160,000 | | 200,000 | | 200,000 | | 200,000 | | 1,330,000 | Adjustments related to the spin-off of Arkema(c) | | 1,240 | | 1,576 | | 1,576 | | 1,800 | | 1,828 | | — | | — | | — | | — | | 8,020 | Options outstanding as of January 1, 2009 | | 89,240 | | 113,576 | | 113,576 | | 129,800 | | 131,828 | | 160,000 | | 200,000 | | 200,000 | | — | | 1,138,020 | Options awarded in 2009 | | — | | — | | — | | — | | — | | — | | — | | — | | 200,000 | | 200,000 | Options exercised in 2009 | | — | | — | | — | | — | | — | | — | | — | | — | | — | | — | Options outstanding as of December 31, 2009 | | — | | 113,576 | | 113,576 | | 129,800 | | 131,828 | | 160,000 | | 200,000 | | 200,000 | | 200,000 | | 1,248,780 |
| | | | | | | | | | | | | | | | | | | | | | | | | | | | | | | | | | | | | | | | | | | | | 2002 Plan
| | | 2003 Plan
| | | 2004 Plan
| | | 2005 Plan
| | | 2006 Plan
| | | 2007 Plan
| | | 2008 Plan
| | | 2009 Plan
| | | 2010 Plan
| | | | | | | |
Purchase
| | |
Subscription
| | |
Subscription
| | |
Subscription
| | |
Subscription
| | |
Subscription
| | |
Subscription
| | |
Subscription
| | |
Subscription
| | | | | | Type of options | | options | | | options | | | options | | | options | | | options | | | options | | | options | | | options | | | options | | | Total
| | | Expiry date | | | 07/09/2010 | | | | 07/16/2011 | | | | 07/20/2012 | | | | 07/19/2013 | | | | 07/18/2014 | | | | 07/17/2015 | | | | 10/09/2016 | | | | 09/15/2017 | | | | 09/14/2018 | | | | | | Exercise price (€)(a) | | | 39.03 | | | | 32.84 | | | | 39.30 | | | | 49.04 | | | | 50.60 | | | | 60.10 | | | | 42.90 | | | | 39.90 | | | | 38.20 | | | | | | | | | | | | | | | | | | | | | | | | | | | | | | | | | | | | | | | | | | | | | | | | Options awarded by the Board(b) | | | 112,000 | | | | 112,000 | | | | 128,000 | | | | 130,000 | | | | 160,000 | | | | 200,000 | | | | 200,000 | | | | 200,000 | | | | 240,000 | | | | 1,482,000 | | Adjustments related to the spin-off of Arkema(c) | | | 1,576 | | | | 1,576 | | | | 1,800 | | | | 1,828 | | | | — | | | | — | | | | — | | | | — | | | | — | | | | 6,780 | | | | | | | | | | | | | | | | | | | | | | | | | | | | | | | | | | | | | | | | | | | | | Options outstanding as of 01/01/10 | | | 113,576 | | | | 113,576 | | | | 129,800 | | | | 131,828 | | | | 160,000 | | | | 200,000 | | | | 200,000 | | | | 200,000 | | | | — | | | | 1,248,780 | | | Options awarded in 2010 | | | | | | | | | | | | | | | | | | | | | | | | | | | | | | | | | | | 240,000 | | | | 240,000 | | | Options exercised in 2010 | | | | | | | | | | | | | | | | | | | | | | | | | | | | | | | | | | | — | | | | — | | Options canceled in 2010(d)(e) | | | (113,576 | ) | | | | | | | | | | | | | | | | | | | | | | | (23,333 | ) | | | | | | | | | | | (136,909 | ) | | Options outstanding as of 12/31/10 | | | — | | | | 113,576 | | | | 129,800 | | | | 131,828 | | | | 160,000 | | | | 200,000 | | | | 176,667 | | | | 200,000 | | | | 240,000 | | | | 1,351,871 | | | | | | | | | | | | | | | | | | | | | | | | | | | | | | | | | | | | | | | | | | | |
(a) | | | | (a) | | Exercise price as of May 24, 2006. To take into account thefour-for-one stock split that took place on May 18, 2006, the exercise price of stock options from plans then effective has been divided by four. In addition, to take into account the spin-off of Arkema, the exercise price of stock options was multiplied by an adjustment ratio of 0.986147, effective as of May 24, 2006. Exercise prices prior to May 24, 2006, are shown in Note 25 to the Consolidated Financial Statements. |
| (b) | | The number of options awarded before May 23, 2006, has been multiplied by four to take into account thefour-for-one stock split approved by the Shareholders’ Meeting on May 12, 2006. |
| (c) | | Adjustments approved by the Board on its meeting on March 14, 2006 pursuant toArticles 174-9, 174-12174-9,174-12 and174-13 of DecreeNo. 67-236 dated March 23, 1967 in effect at the time of the Board meeting and at the time of the Shareholders’ Meeting on May 12, 2006, related to the spin-off of Arkema. These adjustments have beenwere made on May 22, 2006 with an effective dateas of May 24, 2006. | | (d) | | 113,576 options that were not exercised expired due to the expiry of the 2002 purchase option plan on July 9, 2010. | | (e) | | The acquisition rate applicable to the subscription options that were subject to the performance condition of the 2008 plan was 60%. |
As part of the 2007, 2008, 2009 and 20092010 plans, the Board has conditioned the awardgrant of these options to the Chairman and Chief Executive Officer on the fulfillmentsatisfaction of performance conditions. For the 20072008 plan, the options acquisition rate, connectedlinked to the performance condition, was 100%60%. The Chief Executive Officer’ outstanding options as
As of December 31, 2009 represent 0.052%2010, the outstanding options of the Chairman and Chief Executive Officer represented 0.056%(1) of the Company’s potential share capital as of such date. (1) Out of a total potential share capital of 2,398,908,757 shares.
103
1. | Out of a total potential share capital of 2,394,251,653 shares. |
STOCK OPTIONS AWARDED TO THE TEN EMPLOYEES (OTHER THAN
DIRECTORS) RECEIVING THE LARGEST AWARDS / STOCK OPTIONS
EXERCISED BY THE TEN EMPLOYEES (OTHER THAN DIRECTORS)
EXERCISING THE LARGEST NUMBER OF OPTIONS | | | | | | | | | | | | | Total number of options
awarded/options
exercised | | Exercise price (€) | | | Date of the award(a) | | Expiration date | Options awarded in 2009 to the ten employees of TOTAL S.A., or any company in the Group, receiving the largest number of options | | 659,000 | | 39.90 | | | 09/15/2009 | | 09/15/2017 | Options exercised in 2009 by the ten employees of TOTAL S.A., or any company in the Group, exercising the largest number of options(b) | | 10,000 | | 41.47 | | | 07/10/2001 | | 07/10/2009 | | | 52,100 | | 39.03 | | | 07/09/2002 | | 07/09/2010 | | | 115,431 | | 32.84 | | | 07/16/2003 | | 07/16/2011 | | | 102,172 | | 39.30 | | | 07/20/2004 | | 07/20/2012 | | | 279,703 | | 36.66 | (c) | | | | |
| | | | | | | | | | | | | | | | | | | | | Total number of options
| | | | | | | | | | | | | | awarded/ options
| | | | | | | | | | | | | | exercised | | | Exercise price (€)
| | | Grant date(a)
| | | Expiry date
| | | Options awarded in 2010 to the ten employees of TOTAL S.A., or any company in the Group, receiving the largest number of options | | | 742,000 | | | | 38.20 | | | | 09/14/2010 | | | | 09/14/2018 | | | | | | | | | | | | | | | | | | | | | Options exercised in 2010 by the ten employees of | | | 75,858 | | | | 39.03 | | | | 07/09/2002 | | | | 07/09/2010 | | | TOTAL S.A., or any company in the Group, | | | 79,793 | | | | 32.84 | | | | 07/16/2003 | | | | 07/16/2011 | | exercising the largest number of options(b) | | | 24,000 | | | | 39.30 | | | | 07/20/2004 | | | | 07/20/2012 | | | | | | | | | | | | | | | | | | | | | | | | 179,651 | | | | 36.32 | (c) | | | | | | | | |
(a) | | | | (a) | | The grant date of the award is the date of the Board meeting awarding the options. |
| (b) | | Exercise price as of May 24, 2006. To take into account thefour-for-one stock split that took place on May 18, 2006, the exercise price of stock options from plans then effective has been divided by four. In addition, to take into account the spin-off of Arkema, the exercise price of stock options was multiplied by an adjustment ratio of 0.986147, effective as of May 24, 2006. Exercise prices prior to May 24, 2006, are shown in Note 25 to the Consolidated Financial Statements. | | (c) | | Weighted-average price. |
(c) | Weighted-average price. |
104
TOTAL restricted share grants GLOBAL FREE TOTAL SHARE PLAN In addition to the restricted shares granted, the Board of Directors decided at its meeting on May 21, 2010, to implement a global free share plan intended for all the Group employees, that is more than 100,000 employees. On June 30, 2010, rights to 25 free shares were granted to every employee. The shares are subject to a vesting period of two to four years depending on the case. However, the shares awarded are not subject to a performance condition. Following the vesting period, the shares will be issued. BREAKDOWN OF RESTRICTED TOTAL SHARE GRANTS The following table gives a breakdown of restricted share grants by category of grantee (executive officers, senior managers and other employees). | | | | | | | | | | | | | | | | Number of
beneficiaries | | Number of
restricted shares
granted(a) | | Percentage | | Average number
of restricted
shares per
beneficiary | 2005 Plan(b) | | Executive officers(c) | | 29 | | 13,692 | | 2.4% | | 472 | Decision of the Board on July 19, 2005 | | Senior managers | | 330 | | 74,512 | | 13.1% | | 226 | | | Other employees(d) | | 6,956 | | 481,926 | | 84.5% | | 69 | | | Total | | 7,315 | | 570,130 | | 100% | | 78 | 2006 Plan(b) | | Executive officers(c) | | 26 | | 49,200 | | 2.2% | | 1,892 | Decision of the Board on July 18, 2006 | | Senior managers | | 304 | | 273,832 | | 12.0% | | 901 | | | Other employees(d) | | 7,509 | | 1,952,332 | | 85.8% | | 260 | | | Total | | 7,839 | | 2,275,364 | | 100% | | 290 | 2007 Plan(b) | | Executive officers(c) | | 26 | | 48,928 | | 2.1% | | 1,882 | Decision of the Board on July 17, 2007 | | Senior managers | | 297 | | 272,128 | | 11.5% | | 916 | | | Other employees(d) | | 8,291 | | 2,045,309 | | 86.4% | | 247 | | | Total | | 8,614 | | 2,366,365 | | 100% | | 275 | 2008 Plan | | Executive officers(c) | | 25 | | 49,100 | | 1.8% | | 1,964 | Decision of the Board on September 9, 2008, and awarded on October 9, 2008 | | Senior managers | | 300 | | 348,156 | | 12.5% | | 1,161 | | | Other employees(d) | | 9,028 | | 2,394,712 | | 85.8% | | 265 | | | Total | | 9,353 | | 2,791,968 | | 100% | | 299 | 2009 Plan | | Executive officers(c) | | 25 | | 48,700 | | 1.6% | | 1,948 | Decision of the Board on September 15, 2009 | | Senior managers | | 284 | | 329,912 | | 11.1% | | 1,162 | | | Other employees(d) | | 9,693 | | 2,593,406 | | 87.3% | | 268 | | | Total | | 10,002 | | 2,972,018 | | 100% | | 297 |
| | | | | | | | | | | | | | | | | | | | | | | | | | | | | | | | | | Average number
| | | | | | | | | | Number of
| | | | | | of restricted
| | | | | | | Number of
| | | restricted shares
| | | | | | shares per
| | | | | | | beneficiaries | | | awarded(a) | | | Percentage | | | beneficiary | | 2005 Plan(b) | | Executive officers(c) | | | 29 | | | | 13,692 | | | | 2.4 | % | | | 472 | | | Decision of the Board on | | Senior managers | | | 330 | | | | 74,512 | | | | 13.1 | % | | | 226 | | | July 19, 2005 | | Other employees(d) | | | 6,956 | | | | 481,926 | | | | 84.5 | % | | | 69 | | | | | Total | | | 7,315 | | | | 570,130 | | | | 100 | % | | | 78 | | | | | | | | | | | | | | | | | | | | | | 2006 Plan(b) | | Executive officers(c) | | | 26 | | | | 49,200 | | | | 2.2 | % | | | 1,892 | | | Decision of the Board on | | Senior managers | | | 304 | | | | 273,832 | | | | 12.0 | % | | | 901 | | | July 18, 2006 | | Other employees(d) | | | 7,509 | | | | 1,952,332 | | | | 85.8 | % | | | 260 | | | | | Total | | | 7,839 | | | | 2,275,364 | | | | 100 | % | | | 290 | | | | | | | | | | | | | | | | | | | | | | 2007 Plan(b) | | Executive officers(c) | | | 26 | | | | 48,928 | | | | 2.1 | % | | | 1,882 | | | Decision of the Board on | | Senior managers | | | 297 | | | | 272,128 | | | | 11.5 | % | | | 916 | | | July 17, 2007 | | Other employees(d) | | | 8,291 | | | | 2,045,309 | | | | 86.4 | % | | | 247 | | | | | Total | | | 8,614 | | | | 2,366,365 | | | | 100 | % | | | 275 | | | | | | | | | | | | | | | | | | | | | | 2008 Plan(b) | | Executive officers(c) | | | 25 | | | | 49,100 | | | | 1.8 | % | | | 1,964 | | | Grant on October 9, | | Senior managers | | | 300 | | | | 348,156 | | | | 12.5 | % | | | 1,161 | | | 2008, by decision of | | Other employees(d) | | | 9,028 | | | | 2,394,712 | | | | 85.8 | % | | | 265 | | | the Board | | | | | | | | | | | | | | | | | | | | on September 9, 2008 | | Total | | | 9,353 | | | | 2,791,968 | | | | 100 | % | | | 299 | | | | | | | | | | | | | | | | | | | | | | | 2009 Plan | | Executive officers(c) | | | 25 | | | | 48,700 | | | | 1.6 | % | | | 1,948 | | | Decision of the Board on | | Senior managers | | | 284 | | | | 329,912 | | | | 11.1 | % | | | 1,162 | | | September 15, 2009 | | Other employees(d) | | | 9,693 | | | | 2,593,406 | | | | 87.3 | % | | | 268 | | | | | Total | | | 10,002 | | | | 2,972,018 | | | | 100 | % | | | 297 | | | | | | | | | | | | | | | | | | | | | | 2010 Plan(e) | | Executive officers(c) | | | 24 | | | | 46,780 | | | | 1.6 | % | | | 1,949 | | | Decision of the Board on | | Senior managers | | | 283 | | | | 343,080 | | | | 11.4 | % | | | 1,212 | | | September 14, 2010 | | Other employees(d) | | | 10,074 | | | | 2,620,151 | | | | 87.0 | % | | | 260 | | | | | Total | | | 10,381 | | | | 3,010,011 | | | | 100 | % | | | 290 | |
(a) | | | | (a) | | The number of restricted shares grantedawarded shown in this table has not been recalculated to take into account thefour-for-one stock split approved by the Shareholders’ Meeting on May 12, 2006. |
| (b) | | For the 2005, 2006 and 2007 plans, the acquisition rates of the shares granted, relatedawarded, linked to the performance conditions, were 100%. For the 2008 plan, the acquisition rate, linked to the performance condition, was 60%. |
| (c) | | Members of the Management Committee and the Treasurer as of the date of the Board meeting granting the restricted shares. The Chairman of the Board and the Chief Executive Officer were not grantedawarded any restricted shares. |
| (d) | | Mr. Daniel Boeuf,Clément, employee of Total Raffinage Marketing, a subsidiary of TOTAL S.A. and the director of TOTAL S.A. representing employee shareholders, was granted 416awarded 320 restricted shares inunder the 2005 416plan, 200 restricted shares in 2006, 432under the 2007 plan, 500 restricted shares in 2007under the 2008 plan and 588 shares in 2008. Mr Boeuf was not granted any240 restricted shares in 2009.under the 2010 plan. | | (e) | | Excluding free shares granted as part of the 2010 global free share plan. |
The grant of these restricted shares, previouslywhich were bought back by the Company on the market, are finally granted to their beneficiarieswill become final after a2-year vesting period from the date of the grant.period. This final grant is subject to continued employment and condition performances. Moreover, the transfer of the restricted shares will not be permitted until the end of a2-year mandatory holding period.
105
RESTRICTED SHARE PLANS AS OF DECEMBER 31, 20092010 | | | | | | | | | | | | | | | | | | | 2005
Plan(a) | | | 2006 Plan | | | 2007 Plan | | | 2008 Plan | | | 2009 Plan | | Date of the Shareholders’ Meeting | | 05/17/2005 | | | 05/17/2005 | | | 05/17/2005 | | | 05/16/2008 | | | 05/16/2008 | | Date of grant(b) | | 07/19/2005 | | | 07/18/2006 | | | 07/17/2007 | | | 10/09/2008 | | | 09/15/2009 | | Closing price on the date of the award(c) | | €52.13 | | | €50.40 | | | €61.62 | | | €35.945 | | | €41.615 | | Average repurchase price per share paid by the Company | | €51.62 | | | €51.91 | | | €61.49 | | | €41.63 | | | €38.54 | | Total number of restricted shares granted, including to | | 2,280,520 | | | 2,275,364 | | | 2,366,365 | | | 2,791,968 | | | 2,972,018 | | • directors(d) | | 416 | | | 416 | | | 432 | | | 588 | | | 0 | | • ten employees with largest grants(e) | | 20,000 | | | 20,000 | | | 20,000 | | | 20,000 | | | 20,000 | | Start of the vesting period: | | 07/19/2005 | | | 07/18/2006 | | | 07/17/2007 | | | 10/09/2008 | | | 09/15/2009 | | Date of final grant, subject to specific condition (end of the vesting period) | | 07/20/2007 | | | 07/19/2008 | | | 07/18/2009 | | | 10/10/2010 | | | 09/16/2011 | | Transfer possible from (end of the mandatory holding period) | | 07/20/2009 | | | 07/19/2010 | | | 07/18/2011 | | | 10/10/2012 | | | 09/16/2013 | | Number of restricted shares: | | | | | | | | | | | | | | | | • Outstanding as of January 1, 2009 | | — | | | — | | | 2,333,217 | | | 2,772,748 | | | | | • Granted in 2009 | | — | | | — | | | — | | | — | | | 2,972,018 | | • Cancelled in 2009 | | 1,928 | (h) | | 2,922 | (h) | | (12,418 | ) | | (9,672 | ) | | (5,982 | ) | • Finally granted in 2009(f) (g) | | (1,928 | )(h) | | (2,922 | )(h) | | (2,320,799 | ) | | (600 | ) | | — | | • Outstanding as of December 31, 2009 | | — | | | — | | | — | | | 2,762,476 | | | 2,966,036 | |
| | | | | | | | | | | | | | | | | | | | | | | | | | | | | 2005
| | | | | | | | | | | | | | | | | | | | Plan(a) | | | 2006 Plan | | | 2007 Plan | | | 2008 Plan | | | 2009 Plan | | | 2010 Plan | | Date of the Shareholders’ Meeting | | | 05/17/2005 | | | | 05/17/2005 | | | | 05/17/2005 | | | | 05/16/2008 | | | | 05/16/2008 | | | | 05/16/2008 | | Grant date(b) | | | 07/19/2005 | | | | 07/18/2006 | | | | 07/17/2007 | | | | 10/09/2008 | | | | 09/15/2009 | | | | 09/14/2010 | | Closing price on grant date(c) | | | €52.13 | | | | €50.40 | | | | €61.62 | | | | €35.945 | | | | €41.615 | | | | €39.425 | | | Average repurchase price per share paid by the Company | | | €51.62 | | | | €51.91 | | | | €61.49 | | | | €41.63 | | | | €38.54 | | | | €39.11 | | | Total number of restricted shares awarded, including to | | | 2,280,520 | | | | 2,275,364 | | | | 2,366,365 | | | | 2,791,968 | | | | 2,972,018 | | | | 3,010,011 | | • Directors(d) | | | 416 | | | | 416 | | | | 432 | | | | 588 | | | | — | | | | 240 | | • Ten employees with largest grants(e) | | | 20,000 | | | | 20,000 | | | | 20,000 | | | | 20,000 | | | | 20,000 | | | | 20,000 | | | Start of the vesting period: | | | 07/19/2005 | | | | 07/18/2006 | | | | 07/17/2007 | | | | 10/09/2008 | | | | 09/15/2009 | | | | 09/14/2010 | | | Date of final grant, subject to specific condition (end of the vesting period) | | | 07/20/2007 | | | | 07/19/2008 | | | | 07/18/2009 | | | | 10/10/2010 | | | | 09/16/2011 | | | | 09/15/2012 | | | Transfer possible from (end of the mandatory holding period) | | | 07/20/2009 | | | | 07/19/2010 | | | | 07/18/2011 | | | | 10/10/2012 | | | | 09/16/2013 | | | | 09/15/2014 | | | | | | | | | | | | | | | | | | | | | | | | | | | | | Number of restricted shares: | | | | | | | | | | | | | | | | | | | | | | | | | | • Outstanding as of January 1, 2010 | | | — | | | | — | | | | — | | | | 2,762,476 | | | | 2,966,036 | | | | | | | • Awarded in 2010 | | | | | | | | | | | — | | | | | | | | — | | | | 3,010,011 | | • Canceled in 2010(f) | | | 1,024 | (h) | | | 3,034 | (h) | | | 552 | (h) | | | (1,113,462 | ) | | | (9,796 | ) | | | (8,738 | ) | • Finally granted in 2010(g) | | | (1,024 | )(h) | | | (3,034 | )(h) | | | (552 | )(h) | | | (1,649,014 | ) | | | (1,904 | ) | | | (636 | ) | | • Outstanding as of December 31, 2010 | | | — | | | | — | | | | — | | | | — | | | | 2,954,336 | | | | 3,000,637 | | | | | | | | | | | | | | | | | | | | | | | | | | | |
(a) | | | | (a) | | The number of restricted shares grantedawarded has been multiplied by four to take into account thefour-for-one stock split approved by TOTAL Shareholders’ Meeting on May 12, 2006. |
| (b) | | The grant date of the award is the date of the Board meeting awarding the restricted share grant, except for the restricted shares awarded on October 9, 2008, decidedapproved by the Board on September 9, 2008. |
| (c) | | To take into account thefour-for-one stock split in May 18, 2006, the closing price for TOTAL shares on July 19, 2005, (€(€208.50) has been divided by four. |
| (d) | | TheMr. Desmarest, Chairman of the Board of Directors until May 21, 2010, was not grantedawarded any restricted shares under the 2005, 2006, 2007, 2008 2009 and 20092010 plans. Furthermore, Mr. de Margerie, director of TOTAL S.A. since May 12, 2006, and Chief Executive Officer of TOTAL S.A. since February 14, 2007, and Chairman and Chief Executive Officer of TOTAL S.A. since May 21, 2010, was not grantedawarded any restricted shares under the 2006, 2007, 2008, 2009 and 20092010 plans. The Chief Executive OfficerMr. de Margerie was finally grantedawarded on July 20, 2007, the 2,000 restricted shares he had been granted byawarded under the 2005 plan since he was not a director of TOTAL S.A as of the date of the grant. Furthermore,In addition, Mr. Boeuf, the director of TOTAL S.A. representing employee.employee shareholders until December 31, 2009, was finally grantedawarded restricted shares under the plans approved by the Board of Directors of TOTAL S.A. on July 19, 2005, July 18, 2009, the 432 shares he had been granted by the2006, July 17, 2007 plan and September 9, 2008. Mr. Boeuf was not grantedawarded any restricted shares under the plan approved by the 2009 plan.Board of Directors of TOTAL S.A. on September 15, 2009. Mr. Clément, director of TOTAL S.A. representing employee shareholders since May 21, 2010, was awarded 240 restricted shares under the plan approved by the Board of Directors of TOTAL S.A. on September 14, 2010. In addition, Mr. Clément was finally awarded 300 shares on October 10, 2010, under the restricted share plan approved by the Board of Directors of TOTAL S.A. on September 9, 2008. |
| (e) | | Employees of TOTAL S.A., or of any Group company, who were not directors of TOTAL S.A. as of the date of grant. |
| (f) | | ForOut of the 1,113,462 canceled rights to the grant share under the 2008 plan, 1,094,914 entitlement rights were canceled due to the performance condition. The acquisition rate for the 2008 plan was 60%. | | (g) | | For the 2009 and 2010 plans, final grants following the death of the beneficiary. |
(g)(h) | For the 2007 plan, the acquisition rate, related to the performance condition, was 100%. |
(h) | Restricted shares finally grantedawarded for which the entitlement right had been cancelledcanceled erroneously. |
In case of a final awardgrant of the outstanding restricted shares as of December 31, 2009,2010, the corresponding shares would represent 0.24%0.25%(1) of the Company’s potential share capital as of such date. (1) Out of a total potential share capital of 2,398,908,757 shares.
106
GLOBAL FREE SHARE PLAN AS OF DECEMBER 31, 2010 | | | | | | | | | | | | | | | | | 2010 plan
| | | 2010 plan
| | | | | | | | (2+2) | | | (4+0) | | | Total | | Date of the Shareholders’ Meeting | | | 05/16/2008 | | | | 05/16/2008 | | | | | | Grant date(a) | | | 06/30/2010 | | | | 06/30/2010 | | | | | | Final grant date (end of vesting period) | | | 07/01/2012 | | | | 07/01/2014 | | | | | | Transfer possible from | | | 07/01/2014 | | | | 07/01/2014 | | | | | | | | | | | | | | | | | | | | Number of restricted shares awarded | | | | | | | | | | | | | Outstanding as of January 1, 2008 | | | — | | | | — | | | | — | | | Awarded | | | — | | | | — | | | | — | | | Canceled | | | — | | | | — | | | | — | | | Finally granted | | | — | | | | — | | | | — | | Outstanding as of January 1, 2009 | | | — | | | | — | | | | — | | | Awarded | | | — | | | | — | | | | — | | | Canceled | | | — | | | | — | | | | — | | | Finally granted | | | — | | | | — | | | | — | | Outstanding as of January 1, 2010 | | | — | | | | — | | | | — | | | Awarded | | | 1,508,850 | | | | 1,070,650 | | | | 2,579,500 | | | Canceled | | | (125 | ) | | | (75 | ) | | | (200 | ) | Finally granted(c) | | | (75 | ) | | | | | | | (75 | ) | Outstanding as of December 31, 2010 | | | 1,508,650 | | | | 1,070,575 | | | | 2,579,225 | | | | | | | | | | | | | | | |
1. | | | | (a) | | OutThe June 30, 2010 grant was decided by the Board of a total potential share capitalDirectors on May 21, 2010. | | (b) | | Final grant following the death or disability of 2,394,251,653the beneficiary of the shares. |
In case of a final grant of the outstanding shares as of December 31, 2010, the corresponding shares would represent 0.11%(1) of the Company’s potential share capital as of such date. TOTAL RESTRICTED SHARES FINALLY GRANTED, FOLLOWING THE DECISION BY THE BOARD MEETING OF SEPTEMBER 15, 2009,SHARE GRANTS TO THE TEN EMPLOYEES (OTHER THAN DIRECTORS) RECEIVING THE LARGEST NUMBERAMOUNT OF GRANTS / TOTAL RESTRICTED SHARE GRANTS FINALLY GRANTED FOLLOWING THE RESTRICTED SHARE PLAN APPROVED BY THE BOARD MEETING ON JULY 17, 2007,AWARDED TO THE TEN EMPLOYEES (OTHER THAN DIRECTORS) RECEIVING THE LARGEST NUMBERAMOUNT OF SHARES | | | | | | | | | | | | | | | | | | | | Restricted share
| | | | | | | | | grants / Shares
finally granted | | Date of the award | | Date of the final grant | | End of the holdingmandatory
period | TOTAL restricted
| | finally awarded | | Grant date
| | Date of final grant
| | holding period
| Restricted share grants decidedapproved by the Board meeting on September 15, 200914, 2010 to the ten TOTAL S.A. employees (other than directors) receiving the largest amount of grants(a) | | | 20,000 | (b) | 09/15/2009 | | 09/16/201114/2010 | | | | 09/16/201315/2012 | | | | 09/15/2014 | | TOTAL restricted
| | | | | | | | | | | | | | | | | Restricted share grants finally grantedawarded in 20092010 following the restricted share plan approved by the Board meeting on July 17, 2007,September 9, 2008, to the ten employees (other than directors) receiving the largest amount of shares(b)(c) | | 20,000 | 12,000 | | 07/17/2007 | | 07/18/200910/09/2008 | | 07/18/2011 | | 10/10/2010 | | | | 10/10/2012 | | | | | | | | | | | | | | | | | | |
(a) | | | | (a) | | Grant approved by the Board on September 15, 2009.14, 2010. Grants of these restricted shares will become final, subject to a performance condition, after a2-year vesting period, i.e. on September 16, 2011.15, 2012. Moreover, the transfer of the restricted shares will not be permitted until the end of a2-year mandatory holding period, i.e. on September 16, 2013.15, 2014. |
| (b) | | In addition, as of June 30, 2010, as part of the global free share plan, the ten employees were granted rights to twenty-five free shares. | Grant(c) | | Restricted share plan approved by the Board of Directors on July 17, 2007.September 9, 2008, and awarded on October 9, 2008. Grants of these restricted shares will become final, subject to a performance condition, after a2-year vesting period, i.e. on July 18, 2009.October 10, 2010. The acquisition rate of the shares granted, connectedawarded, linked to the performance condition, was 100%60%. Moreover, the transfer of the restricted shares finally awarded will notonly be permitted untilafter the end of a2-year mandatory holding period, i.e. from July 18, 2011.October 10, 2012. |
(1) Out of a total potential share capital of 2,398,908,757 shares.
107
Elf Aquitaine share subscription options
ELF AQUITAINE STOCK OPTIONS OF EXECUTIVE OFFICERS
(MEMBERS OF THE MANAGEMENT COMMITTEE AND THE TREASURER)
AS OF DECEMBER 31, 2009
Certain executive officers of TOTAL as of December 31, 2009, who were previously with the Elf Aquitaine group hold Elf Aquitaine options that, upon exercise, benefited from exchange rights for TOTAL shares based upon the exchange ratio used in the public tender offer of TOTAL for Elf Aquitaine in 1999.
This exchange ratio was adjusted on May 22, 2006, as described in Note 25 to the Consolidated Financial Statements.
As of December 31, 2009, the exchange guarantee is no longer in effect and Elf Aquitaine share subscription option plans have expired. Therefore, no Elf Aquitaine shares are covered by the exchange guarantee as of December 31, 2009.
| | | Elf Aquitaine share subscription plan | | 1999 Plan n°1 | Exercise price per Elf Aquitaine share (€)(a)
| | 114.76 | Expiration date
| | 03/30/2009 | Options awarded
| | 14,880 | Adjustments related to the spin-off of S.D.A.(b)
| | 42 | Options outstanding as of January 1, 2009
| | 1,406 | Options exercised in 2009
| | 1,406 | Options outstanding as of December 31, 2009
| | — | Corresponding number of TOTAL shares, as of December 31, 2009, likely to be created pursuant to the exchange guarantee
| | — |
(a) | Exercise price as of May 24, 2006. To take into account the spin-off of S.D.A. (Société de Développement Arkema) by Elf Aquitaine, the exercise price for Elf Aquitaine share subscription options was multiplied the exercise price was multiplied by an adjustment ratio of 0.992769, effective as of May 24, 2006. Exercise prices prior to May 24, 2006, are shown in Note 25 to the Consolidated Financial Statements. |
(b) | Adjustments approved by the Board of Elf Aquitaine on March 10, 2006, pursuant to Articles 174-9, 174-12 and 174-13 of Decree No. 67-236 dated March 23, 1967, in effect at the time of this meeting and at the time of the Shareholders’ Meeting of Elf Aquitaine on May 10, 2006, related to the spin-off of S.D.A. These adjustments have been made on May 22, 2006 with an effective date of May 24, 2006. |
Corporate GovernanceFor several years, TOTAL has been actively examining corporate governance matters. At its meeting on November 4, 2008, the Board of Directors confirmed its decision to use the Corporate Governance Code for Listed Companies published in 2008 by the principal French business confederations, the Association Française des Entreprises Privées(AFEP) and the Mouvement des Entreprises de France (MEDEF) (“AFEP-MEDEF Code”) as its reference for corporate governance matters. The AFEP-MEDEF Code was amended in April 2010 to make recommendations related to the balanced number of men and women sitting in Board and Committees’ meetings. The code recommends that a target of at least 20% of women be reached before April 2013 and at least 40% before April 2016. As of December 31, 2010, the Company’s Board of Directors was comprised of two women out of a total of fifteen members (i.e.,13%). At the Shareholders’ Meeting in May 2011, it will be proposed to appoint two additional women to replace two directors whose terms are coming to an end. If the resolutions are approved by the Shareholders’ Meeting, the percentage of women sitting in the Board will rise to 26%. The Board of Directors will keep examining corporate governance issues to continue diversifying in the years to come. The Company’s corporate governance practices differ from the recommendations contained in the AFEP-MEDEF Code on the following limited matters: The AFEP-MEDEF Code recommends that a director no longer be considered as independent upon the expiry of the term of office during which the length of his service on the board reaches twelve years. The Board has not followed this recommendation in regards to one of its members considering the long-term nature of its investments and operation as well as the experience and authority of which this director is in possession, which reinforce his independence and contribute to the Board’s work.
The Chairman of the Board of Directors chairs the Nominating & Governance Committee of the Board. The Board of Directors and this Committee consider that the participation of the Chairman on the Nominating & Governance Committee enables the Committee to benefit from his experience and his knowledge of the Company’s activities,
| | | • | The AFEP-MEDEF Code recommends that a director no longer be considered as independent upon the expiry of the term of office during which the length of his service on the board reaches twelve years. The Board has not followed this recommendation with regards to one of its members considering the long-term nature of its investments and operation as well as the experience and authority of which this director is in possession, which reinforce his independence and contribute to the Board’s work. This directorship expired on May 21, 2010. | | | • | Mr. Desmarest chairs the Nominating & Governance Committee since it was created in February 2007. Although Mr. Desmarest chaired the Board of Directors until May 2010, the Board and this Committee considered that Mr. Desmarest chairing the Nominating & Governance Committee would enable this Committee to benefit from his experience and his knowledge of the Company’s businesses, environment and executive teams, which is particularly useful to inform the Committee’s deliberations concerning the appointment of executives and directors. The fact that the Chairman of the Board, who does not exercise executive duties, chairs the committee permits close collaboration between the Board and the Committee, the latter being responsible for the review of the Board’s workings and corporate governance matters. This committee is comprised of a majority of independent directors and the Chairman and the Chief Executive Officer do not attend deliberations concerning their own situation. |
Mr. Desmarest, who was appointed Honorary Chairman of TOTAL and renewed as a director on May 21, 2010, can still be entrusted with representative missions for the Group. In compliance with the AFEP-MEDEF Code, the Chairman and the Chief Executive Officer dodoes not attend deliberations concerning their own situation. Pursuant tohave any employment contract with the AFEP-MEDEF Code, on February 11, 2009,Group or any company of the Board of Directors noted that, effective from the same day, the employment contracts of its Chairman and its Chief Executive Officer had been terminated.
Group. Since 2004, the Board of Directors has had a financial codeFinancial Code of ethicsEthics that, in the overall context of the Group’s Code of Conduct, sets forth specific rules for its Chairman, Chief Executive Officer, Chief Financial Officer, Chief Accounting Officer and the financial and accounting officers for its principal activities. The Board has made the Audit Committee responsible for implementing and ensuring compliance with this code. In 2005, the Board approved the procedure for alerting the Audit Committee of complaints or concerns regarding accounting, internal accounting controls or auditing matters. Rules of procedure of the Board of Directors At its meeting on February 13, 2007, the Board of Directors adopted rules of procedure to replace the Directors’ Charter and to take into account the separation of the positions of Chairman of the Board and Chief Executive Officer implemented at the same meeting.Charter. The Board’s rules of procedure specify the obligations of each director and set forth the mission and working procedures of the Board of Directors. They also define the respective responsibilities and authority of the Chairman and of the Chief Executive Officer. It is reviewed on a regular basis to match the changes in rules and practices related to governance. The principal matters covered by the rules of procedure are summarized below.
An unabridged version of these rules and proceduresof procedure is available onherein. Mission of the Board of Directors The mission of the Board of Directors is to determine the strategic direction of the Group and supervise the implementation of this vision. With the exception of the powers and authority expressly reserved for shareholders
108
and within the limits of the Company’s website.Each director undertakeslegal purpose, the Board may address any issue related to maintain the independenceoperation of the Company and take any decision concerning the matters falling within its purview. Within this framework, the Board’s duties and responsibilities include, but are not limited to, the following:
| | | • | appointing the Chairman and the Chief Executive Officer and supervising the handling of their responsibilities; | | • | defining the Company’s strategic orientation and, more generally, that of the Group; | | • | approving investments or divestments under study by the Group that concern amounts greater than 3% of shareholders’ equity, whether or not the project is part of the announced strategy; | | • | reviewing information on significant events related to the Company’s affairs, in particular for investments or divestments that are greater than 1% of shareholders’ equity; | | • | conducting audits and investigations as it may deem appropriate. The Board, with the assistance of the Audit committee where appropriate, ensures that: |
| | | | – | authority within the Company has been properly delegated before it is exercised, and that the various entities of the Company respect the authority, duties and responsibilities they have been given; | | – | no individual is authorized to contract on behalf of the Company or to commit to pay, or to make payments, on behalf of the Company, without proper supervision and control; | | – | the internal control function operates properly and that the statutory auditors are able to conduct their audits under appropriate circumstances; and | | – | the committees it has created duly perform their responsibilities; |
| | | • | monitoring the quality of the information provided to the shareholders and the financial markets through the financial statements that it approves and the annual reports, or when major transactions are conducted; | | • | convening and setting the agenda for Shareholders’ Meetings; | | • | preparing, for each year, a list of the directors it deems to be independent under generally recognized corporate governance criteria; and | | • | the Board of Directors is regularly informed, through the Audit Committee, of the Group’s financial position, cash position and obligations. |
Directors’ obligations Before accepting a directorship, every candidate receives a copy of TOTAL S.A.’s by-laws and Rules of Procedures. He ensures that he has broad knowledge of the general and particular commitments related to his analysis, judgment, decision-makingduty, especially the laws and actionsregulations governing directorships in French limited liability companies (société anonyme) whose shares are listed in one or several regulated markets. Accepting a directorship involves upholding the Rules of Procedures and the Group’s values as well as not to be unduly influenced. described in its Code of Conduct. When a director participatesdirectors participate in and votesvote at Board meetings, he isthey are required to represent the interest of the shareholders and the Company as a whole. Independence of judgment: Directors must actively participate inundertake, under any circumstance, to maintain the affairsindependence of the Board, specifically on the basistheir analysis, judgment, decision making and actions as well as not to be unduly influenced, directly or indirectly, by other directors, particular groups of information communicated to them by the Company.shareholders, creditors, suppliers and, more generally, any third-party. Preparation of each Board’s meeting:Directors undertake to devote the amount of time required to consider the information they are given and otherwise prepare for meetings of the Board and of the committees on which they sit. Directors may request any additional information that they feel is necessary or useful from the Chairman or theand Chief Executive Officer. A director,Directors, if he considersthey consider it necessary, may request training on the Company’s specificities, businesses and activities. Directors participate inattend all Board meetings and all committees or Shareholders’ Meetings, unless they have previously contacted the Chairman to inform him of scheduling conflicts. Files reviewed at each meeting of the Board as well as the information collected before or during the meetings are confidential. Directors cannot use them for or share them with a third party whatever the reason. Directors take any necessary measures to keep them confidential. Confidentiality and privacy are lifted when such information are made publicly available by the Company. The Chairman of the Board makes sure that the Company provides the directors with the relevant information, including criticisms, in particular financial statement reports and press releases. Duty of loyalty: Directors cannot take advantage of his office or duties to ensure, for himself or a third party, any monetary or non-monetary benefit.
109
Each director
They notify the Board of Directors any potential conflicts of interest with the Company or any other company of the Group. They refrain from participating in the vote relating to the corresponding resolution or even to the debate preceding the vote. Directors must inform the Board of conflictsDirectors of interesttheir entering in a transaction that involves directly the Company or any other company of the Group before such transaction is closed. Directors cannot take any responsibility in a personal capacity in companies or businesses that are competing with the Company or any other company of the Group without previously informing the Board. Directors are committed not to seek or accept directly or indirectly from the Company or any other company of the Group benefits that may arise, including the nature and termsbe considered as compromising their independence. Duty of any proposed transactionsexpression: Directors are committed to clearly expressing their opposition if they deem that could give rise to such situations. If he is opposed to a project brought beforedecision made by the Board heof Directors is contrary to the Company’s corporate interest and should strive to convince the Board of the relevancy of their position. Company’s securities and stock exchange rules: While in office, directors are required to clearly express his opposition. He is required to own at leasthold the minimum number of registered shares as set by the Company’s by-laws (i.e., 1,000 company shares in registered form (with— with the exception of the director representing employee shareholders for whom the requirements are more flexible) and comply strictly with provisions regarding the use of material non-public information. The requirement to hold a minimum of 1,000 company shares while in office is accepted by each director as a restriction on his ability to freely dispose of these shares.In addition to stipulating that.
Directors refrain from trading any shares and ADRs of TOTAL S.A. and its publicly traded subsidiaries held byfor which they hold non-public information that could impact the securities’ market value. To this purpose, directors are to be heldact in registered form,compliance with the rules of procedure prohibit buying on margin or short selling those same securities. They also prohibit trading shares of TOTAL S.A. on the dates of the Company’s periodic earnings announcements, as well as the 15 calendar days preceding such dates.Thefollowing procedures:
| | | • | any shares and ADRs of TOTAL S.A. and its publicly traded subsidiaries are to be held in registered form, either bearer shares with the Company or its agent (currently BNP-Paribas Securities Services for TOTAL shares and Bank of New-York Mellon for TOTAL ADRs), or administered registered shares with a French broker (or U.S. broker for ADRs) whose contact details are communicated to the Board’s Secretariat by the director; | | • | buying on margin or short selling (Paris option market (MONEP), warrants, exchangeable obligations, etc.) those same securities is also prohibited; | | • | any transaction of the TOTAL share (or ADR) is strictly prohibited, including hedging transactions, on the day when the Company discloses its periodic earnings (quarterly, interim and annual) as well as the fifteen calendar days preceding such date; and | | • | directors make all necessary arrangements to declare to the French Financial Markets Authority (Autorité des marchés financiers) and inform the Board’s secretary, under the form and timeframe provided for by applicable laws, of any transaction on the company’s securities entered into by himself or any other individual with whom he is closely related. |
Board of Directors’ missionDirectors practicesis to determine the strategic direction of the Group and supervise the implementation of this vision.With the exception of the powers and authority expressly reserved for shareholders and within the limits of the Company’s legal purpose, the Board may address any issue related to the operation of the Company and take any decision concerning the matters falling within its purview.
Within this framework, the Board’s duties and responsibilities include, but are not limited to, the following:
appointing the Chairman and the Chief Executive Officer and supervising the handling of their responsibilities;
defining the Company’s strategic orientation and, more generally, that of the Group;
approving investments or divestments under study by the Group that concern amounts greater than 3% of shareholders’ equity, whether or not the project is part of the announced strategy;
reviewing information on significant events related to the Company’s affairs, in particular for investments or divestments that are greater than 1% of shareholders’ equity;
monitoring the quality of information supplied to shareholders and the financial markets through the financial statements that it approves and the annual reports, or when major transactions are conducted;
convening and setting the agenda for Shareholders’ Meetings;
preparing, for each year, a list of the directors it deems to be independent under generally recognized corporate governance criteria, in particular those defined in the AFEP-MEDEF Code; and
conducting audits and investigations as it may deem appropriate.
The Board, with the assistance of its specialized committees where appropriate, ensures that:
authority within the Company has been properly delegated before it is exercised, and that the various entities of the Company respect the authority, duties and responsibilities they have been given;
no individual is authorized to contract on behalf of the Company or to commit to pay, or to make payments, on behalf of the Company, without proper supervision and control;
the internal control function operates properly and that the statutory auditors are able to conduct their audits under appropriate circumstances; and
the committees it has created duly perform their responsibilities.
The Board of Directors is regularly informed, through the Audit Committee, of the Group’s financial position, cash position and obligations.
Board of Directors’ activity:The Board of Directors meets at least four times a year and as often as circumstances may require.
Directors are generally given written notice eight days prior
Before each meeting of the Board, the agenda is sent out to Board meetings. Documents to be considered for decisions to be made at Board meetings are, whendirectors and, whenever possible, it is sent together with the notice ofdocuments that are necessary to consider. Directors can delegate their authority to another director at the meetings or otherwise delivered to the directors. The minutes of the previousBoard, within the limit of one delegation per director per meeting. Whenever authorized by the law, those directors attending the meeting are expressly approved at eachof the Board meeting.Directors may participate in meetings either by being present, by being represented by another director or via video conference (in compliance with the technical requirements set by applicable regulations).
The Board may establish specialized committees, whether permanent orad hoc, as required by applicable legislation or as it may deem appropriate. are considered present for the calculation of the quorum and majority.
The Board allocates directors’ fees, and may allocate additional directors’ fees, to directors who participate inon specialized committees within the total amount established by the shareholders.Shareholders’ Meeting. The Chairman and the Chief Executive Officer are not awarded directors’ fees for their work on the Board and Committees. The Board of Directors, based on the recommendation of its Chairman, appoints a Secretary. Every member of the Board of Directors can refer to the Secretary and benefit from his assistance. The Secretary is responsible for the working procedures of the Board of Directors. The Board shall review such procedures periodically. The Board conducts, at regular intervals not to exceed three years, an assessment of its practices. It alsoSuch assessment is carried out under the supervision of an independent director or with the contribution of an outside counsel. In addition, the Board of Directors conducts an annual discussion of its methods. Responsibility and authority of the Chairman:Chairman The Chairman represents the Board, and, except under exceptional circumstances, is the sole member authorized to act and speak on behalf of the Board.
110
He is responsible for organizing and presiding over the Board’s activities and monitors corporate bodies to ensure that they are functioning effectively and respecting corporate governance principles. He coordinates the activity of the Board and its committees. He sets the agenda for the meeting by including the issues proposed by the Chief Executive Officer. He ensures that directors have in due course clear and appropriate information that are necessary to carry out their duties. He is responsible, with the Group’s management, for maintaining relations between the Board and the Company’s shareholders. He monitors the quality of the information disclosed by the Company. In close cooperation with the Group’s management, he may represent the Group in high level discussions with government authorities and the Group’s important partners, on both a national and international level. He is regularly informed by the Chief Executive Officer of events and situations that are important for the Group relating to the strategy, organization, monthly financial reporting, major investment and divestment projects and major financial operations. He may request that the Chief Executive Officer provide any useful information for the Board or its committees. committees to carry out their duties. He may also work with the statutory auditors to prepare matters before the Board or the Audit Committee. He presents every year in a report to the Shareholders’ Meeting, practices of the Board of Directors and potential limits set by the Board of Directors concerning the powers of the Chief Executive Officer. For this purpose, he receives from the Chief Executive Officer the relevant information. Authority of the Chief Executive Officer:Officer The Chief Executive Officer is responsible for the general management of the Company. He chairs the Group’s Executive Committee and Management Committee. Subject to the Company’s corporate governance rules and in particular the Rules of Procedures of the Board of Directors (see above: “the Board of Directors’ mission”), he has the full extent of authority to act on behalf of the Company in all instances, with the exception of actions that are, by law, reserved to the Board of Directors or to Shareholders’ meetings. HeMeetings. The Chief Executive Officer is responsible for periodic reporting of the Group’s results and outlook to shareholders and the financial community. He At each meeting of the Board, the Chief Executive Officer reports on significant Group activities to the Board.highlights in the Group’s activity. Committees of the Board of Directors The Board of Directors has three specialized committees:approved the creation of: | | | • | an Audit Committee; | | | • | a Nominating & Governance Committee; and | | | • | a Compensation Committee. |
The missions and composition of these committees are defined in their relevant rules of procedure approved by the Compensation Committee;Board of Directors. The Committees carry out their duty for and report to the Nominating & Governance Committee.Board of Directors. Each committee reports on its activities to the Board of Directors. The Audit Committee’s role is to assist the Board of Directors in ensuring effective internal control and oversight over financial reporting to shareholders and the financial markets. The Audit Committee’s duties include: | | | • | recommending the appointment of statutory auditors and their compensation, ensuring their independence and monitoring their work; | | • | establishing the rules for the use of statutory auditors for non-audit services and verifying their implementation; | | • | supervising the audit by the statutory auditors of the Company’s financial statements and consolidated financial statements; | | • | examining the accounting policies used to prepare the financial statements, examining the parent company’s annual financial statements and the consolidated annual, semi-annual, and quarterly financial statements prior to their examination by the Board, after regularly monitoring the financial situation, cash position and obligations of the Company; | | • | supervising the implementation of internal control and risk management procedures and their effective application, with the assistance of the internal audit department; | | • | supervising procedures for preparing financial information; | | • | monitoring the implementation and activities of the disclosure committee, including reviewing the conclusions of this committee; |
111
recommending the appointment of statutory auditors and their compensation, ensuring their independence and monitoring their work;
| | | • | reviewing the annual work program of internal and external auditors; | | • | receiving information periodically on completed audits and examining annual internal audit reports and other reports (statutory auditors, annual reports, etc.); | | • | reviewing the choice of appropriate accounting principles and methods; | | • | reviewing the Group’s policy for the use of derivative instruments; | | • | reviewing, if requested by the Board, major transactions contemplated by the Group; | | • | reviewing significant litigation annually; | | • | implementing, and monitoring compliance with, the financial code of ethics; | | • | proposing to the Board, for implementation, a procedure for complaints or concerns of employees, shareholders and others, related to accounting, internal accounting controls or auditing matters, and monitoring the implementation of this procedure; and | | • | reviewing the procedure for booking the Group’s proved reserves. |
establishing the rules for the use of statutory auditors for non-audit services and verifying their implementation;
supervising the audit by the statutory auditors of the Company’s financial statements and consolidated financial statements;
examining the accounting policies used to prepare the financial statements, examining the parent company’s annual financial statements and the consolidated annual, semi-annual, and quarterly financial statements prior to their examination by the Board, after regularly monitoring the financial situation, cash position and obligations of the Company;
supervising the implementation of internal control and risk management procedures and their effective application, with the assistance of the internal audit department;
supervising procedures for preparing financial information;
monitoring the implementation and activities of the disclosure committee, including reviewing the conclusions of this committee;
reviewing the annual work program of internal and external auditors;
receiving information periodically on completed audits and examining annual internal audit reports and other reports (statutory auditors, annual reports, etc.);
reviewing the choice of appropriate accounting principles and methods;
reviewing the Group’s policy for the use of derivative instruments;
reviewing, if requested by the Board, major transactions contemplated by the Group;
reviewing significant litigation annually;
implementing, and monitoring compliance with, the financial code of ethics;
proposing to the Board, for implementation, a procedure for complaints or concerns of employees, shareholders and others, related to accounting, internal accounting controls or auditing matters, and monitoring the implementation of this procedure; and
reviewing the procedure for booking the Group’s proved reserves.
Audit Committee membership and practices The Committee is made up of at least three directors designated by the Board of Directors. Members must be independent directors.
In selecting the members of the Committee, the Board pays particular attention to their independence and their financial and accounting qualifications. Members of the Committee may not be executive officers of the Company or one of its subsidiaries, nor own more than 10% of the Company’s shares, whether directly or indirectly, individually or acting together with another party. Members of the Audit Committee may not receive from the Company and its subsidiaries, whether directly or indirectly, any compensation other than: directors’ fees paid for their services as directors or as members of the Audit Committee or, if applicable, another committee of the Board; and
compensation and pension benefits related to prior employment by the Company, or another Group company, which are not dependent upon future work or activities.
| | | • | directors’ fees paid for their services as directors or as members of the Audit Committee or, if applicable, another committee of the Board; and | | • | compensation and pension benefits related to prior employment by the Company, or another Group company, which are not dependent upon future work or activities. |
The Committee appoints its own Chairman. The Chairman appoints the Committee secretary who may be the Chief Financial Officer. The Committee meets at least four times a year to examine the consolidated annual and quarterly financial statements. The Audit Committee may meet with the Chairman of the Board, the Chief Executive Officer, and, if applicable, any acting Managing Director of the Company and perform inspections and consult with managers of operating or non-operating departments, as may be useful in performing its duties. The Committee consults with the statutory auditors and examines their work, and may do soauditors. It has the capacity of consulting them without management being present.Company representatives attending. If it deems it necessary to accomplish its duties, the Committee may request from the Board the resources to engage external consultants. The Committee submits written reports to the Board of Directors regarding its work. In 2009,2010, the Committee’s members were Mrs. Patricia Barbizet and Messrs. Bertrand Jacquillat and Thierry de Rudder as well as, until May 15, 2009, Mr. Antoine Jeancourt-Galignani.Rudder. All of the members of the Committee are independent directors and have recognized experience in the financial and accounting fields, as illustrated in their summary biographies above.(see “— Directors and Senior Management — Composition of the Board of Directors”). The Committee wasis chaired by Mr. Antoine Jeancourt-Galignani, who was determined to be the Audit Committee financial expert by the Board at its meeting on September 5, 2006. Mrs. Patricia Barbizet was appointed by the Committee at its meeting on July 28, 2009, to succeed Mr. Antoine Jeancourt-Galignani for the Committee chairmanship. Barbizet. The Board of Directors, at its meeting on July 30, 2009, decided to appoint Mr. Bertrand Jacquillat to serve as the Audit Committee financial expert based on a recommendation by the Audit Committee. Compensation CommitteeIn February 2007, the
The Compensation Committee was separated from the then existing Nominating & Compensation Committee. The principal objectives of the Compensation Committee are to:is focused on: examine the executive compensation policies implemented by the Group and the compensation of members of the Executive Committee; and
| | | • | examining the executive compensation policies implemented by the Group and the compensation of members of the Executive Committee; and | | | • | evaluating the performance and recommend the compensation of the Chairman of the Board and of the Chief Executive Officer. |
evaluate the performance and recommend the compensation of the Chairman of the Board and of the Chief Executive Officer.
Its duties include the following: examining the criteria and objectives proposed by management for executive compensation and advising on this subject;
| | | • | examining the criteria and objectives proposed by management for executive compensation and advising on this subject; | | | • | presenting recommendations and proposals to the Board concerning: |
presenting recommendations and proposals to the Board concerning:
| | | | | (i)− | compensation, pension and insurance plans, in-kind benefits, and other compensation, including severance benefits, for the Chairman and the Chief Executive Officer of the Company, and |
| | (ii)− | awards of stock options and restricted share grants to the Chairman and the Chief Executive Officer; and |
| | | • | examining stock option plans, restricted share grants, equity-based plans and pension and insurance plans. |
112
Compensation Committee membership and practices The Committee is made up of at least three directors designated by the Board of Directors. A majority of the members must be independent directors. Members of the Compensation Committee may not receive from the Company and its subsidiaries, either directly or indirectly, any compensation other than: directors’ fees paid for their services as directors or as members of the committee, or, if applicable, as members of another committee of the Company’s Board; and
compensation and pension benefits related to prior employment by the Company which are not dependant upon future work or activities.
| | | • | directors’ fees paid for their services as directors or as members of the committee, or, if applicable, as members of another committee of the Company’s Board; and | | • | compensation and pension benefits related to prior employment by the Company which are not dependent upon future work or activities. |
The Committee appoints its chairman and its secretary. The secretary is a Company senior executive. The Committee meets at least twice a year. The Committee invites the Chairman and the Chief Executive Officer of the Company to present their recommendations. Neither the Chairman nor the Chief Executive Officer may be present during deliberations regarding his own situation. While maintaining the appropriate level of confidentiality for its discussions, the Committee may request that the Chief Executive Officer provide it with the assistance of any senior executive of the Company whose skills and qualifications could facilitate the handling of an agenda item. If it deems it necessary to accomplish its duties, the Committee may request from the Board the resources to engage external consultants. The Committee reports on its activities to the Board of Directors. In 2009,2010, the Committee’s members were Messrs. Bertrand Collomb, Michel Pébereau and, until May 21, 2010, Mr. Serge Tchuruk. Messrs. Patrick Artus and Thierry Desmarest were appointed members of this Committee as from May 21, 2010. Messrs. Artus, Collomb, Pébereau, Tchuruk each anare independent director.directors. Mr. Michel Pébereau chairs the Committee. Nominating & Governance CommitteeIn February 2007, the Nominating & Governance
The Committee was separated from the then existing Nominating & Compensation Committee. The principal objectives of the Nominating & Governance Committee are to:recommend to the Board of Directors the persons that are qualified to be appointed as directors, Chairman or Chief Executive Officer;
is focused on:prepare the Company’s corporate governance rules and supervise their implementation; and
| | | • | recommending to the Board of Directors the persons that are qualified to be appointed as directors, Chairman or Chief Executive Officer; | | • | preparing the Company’s corporate governance rules and supervise their implementation; and | | • | examining any questions referred to it by the Board or the Chairman of the Board, in particular questions related to ethics. |
examine any questions referred to it by the Board or the Chairman of the Board, in particular questions related to ethics.
Its duties include the following: presenting recommendations to the Board for its membership and the membership of its committees;
proposing annually to the Board the list of directors who may be considered as “independent directors” of the Company;
| | | • | presenting recommendations to the Board for its membership and the membership of its committees; | | • | proposing annually to the Board the list of directors who may be considered as “independent directors” of the Company; | | • | assisting the Board in the selection and evaluation of the Chairman of the Board and the Chief Executive Officer and examining the preparation of their possible successors, in cooperation with the Compensation Committee; | | • | preparing a list of individuals who might be considered for election as Directors and those who might be named to serve on Board committees; | | • | proposing methods for the Board to evaluate its performance; | | • | proposing the procedure for allocating directors’ fees; | | • | developing and recommending to the Board the corporate governance principles applicable to the Company; and | | • | examining ethical issues at the request of the Board or its Chairman. |
assisting the Board in the selection and evaluation of the Chairman of the Board and the Chief Executive Officer and examining the preparation of their possible successors, in cooperation with the Compensation Committee;
preparing a list of individuals who might be considered for election as Directors and those who might be named to serve on Board committees;
proposing methods for the Board to evaluate its performance;
proposing the procedure for allocating directors’ fees;
developing and recommending to the Board the corporate governance principles applicable to the Company; and
examining ethical issues at the request of the Board or its Chairman.
Nominating & Governance Committee membership and practices The Committee is made up of at least three directors designated by the Board of Directors. A majority of the members must be independent directors. Members of the Nominating & Governance Committee, other than the Chairman of the Board and the Chief Executive Officer, may not receive from the Company and its subsidiaries any compensation other than: | | | • | directors’ fees paid for their services as directors or as members of the committee, or, if applicable, as members of another committee of the Company’s Board; and |
113
directors’ fees paid for their services as directors or as members of the committee, or, if applicable, as members of another committee of the Company’s Board; and
| | | • | compensation and pension benefits related to prior employment by the Company which are not dependent upon future work or activities. |
compensation and pension benefits related to prior employment by the Company which are not dependant upon future work or activities.
The Committee appoints its chairman and its secretary. The secretary is a Company senior executive. The Committee meets at least twice a year. The Committee may invite the Chairman of the Board or the Chief Executive Officer of the Company, as applicable, to present recommendations. Neither the Chairman nor the Chief Executive Officer may be present during deliberations regarding his own situation. While maintaining the appropriate level of confidentiality for its discussions, the Committee may request that the Chief Executive Officer provide it with the assistance of any senior executive of the Company whose skills and qualifications could facilitate the handling of an agenda item. If it deems it necessary to accomplish its duties, the Committee may request from the Board the resources to engage external consultants. The Committee reports on its activities to the Board of Directors. In 2009,2010, the Committee’s members were Messrs. Bertrand Collomb, Thierry Desmarest, Michel Pébereau and, until May 21, 2010, Mr. Serge Tchuruk. Each, with the exception of the Chairman of the Board, is anMessrs. Collomb, Pébereau and Tchuruk are independent director.directors. Mr. Thierry Desmarest chairs the Committee. Board of Directors practices On May 21, 2010, the Board of Directors decided to reunify the positions of Chairman and Chief Executive Officer and appoint the Chief Executive Officer to the duties of Chairman of the Board. This decision was made taking into account the advantage of the unified management and the majority of independent directors appointed at the Committees, which ensures balanced authority. The Board of Directors deemed that the unified management form was the most appropriate to the Group’s business and specificities of the oil and gas sector. At its meeting on February 10, 2010,2011, the Board of Directors discussed the results of its self-evaluation carried outpractices and stated it was globally satisfied with such practices. Compliant with the assistance of a consulting agency, which demonstrated that the Board’s working procedures and the quality of the information provided met the Directors’s expectations.Pursuant to the recommendation ofby the Nominating &and Governance Committee, at its meeting on February 10, 2010, the Board approved themade suggestions for improvement that were proposed, which were mainly relatedwith respect to broadening criteria when benchmarking with other companies, and for a thorough study of the organization of a day for strategic thinking.
Group’s opportunities in the energy sector. Employees and Share OwnershipEMPLOYEES AND SHARE OWNERSHIP The tables below set forth the number of employees, by division and geographic location, of the Group (fully-consolidated(fully consolidated subsidiaries) as of the end of the periods indicated: | | | | | | | | | | | | | | Upstream | | Downstream | | Chemicals | | Corporate | | Total | 2009 | | 16,628 | | 33,760 | | 44,667 | | 1,332 | | 96,387 | 2008 | | 16,005 | | 34,040 | | 45,545 | | 1,369 | | 96,959 | 2007 | | 15,182 | | 34,185 | | 45,797 | | 1,278 | | 96,442 | | | | | | France | | Rest of Europe | | Rest of world | | Total | 2009 | | | | 36,407 | | 26,299 | | 33,681 | | 96,387 | 2008 | | | | 37,101 | | 27,495 | | 32,363 | | 96,959 | 2007 | | | | 37,296 | | 27,374 | | 31,772 | | 96,442 |
| | | | | | | | | | | | | | | | | | | | | | | | | Upstream | | | Downstream | | | Chemicals | | | Corporate | | | Total | | 2010 | | | 17,192 | | | | 32,631 | | | | 41,658 | | | | 1,374 | | | | 92,855 | | | 2009 | | | 16,628 | | | | 33,760 | | | | 44,667 | | | | 1,332 | | | | 96,387 | | | 2008 | | | 16,005 | | | | 34,040 | | | | 45,545 | | | | 1,369 | | | | 96,959 | | | | | | | | | | | | | | | | | | | | | | | | | | | | | | | | | | | | | | | | | | | | | | | | | | | | France | | | Rest of Europe | | | Rest of world | | | Total | | 2010 | | | | | | | 35,169 | | | | 24,931 | | | | 32,755 | | | | 92,855 | | | 2009 | | | | | | | 36,407 | | | | 26,299 | | | | 33,681 | | | | 96,387 | | | 2008 | | | | | | | 37,101 | | | | 27,495 | | | | 32,363 | | | | 96,959 | |
TOTAL believes that the relationship between its management and labor unions is, in general, satisfactory. Arrangements for involving employees in the Company’s share capital Pursuant to agreements signed on March 15, 2002, as amended, the Group created a “Total Group Savings Plan” (PEGT), a “Partnership for Voluntary Wage Savings Plan” (PPESV, later becoming PERCO) and a “Complementary Company Savings Plan” (PEC) for employees of the Group’s French companies.companies having adhered to these plans. These plans allow investments in a number of mutual funds including one invested in Company shares (“TOTAL ACTIONNARIAT FRANCE”). A “Shareholder Group Savings Plan” (PEG-A) has also been in place since November 19, 1999 to facilitate capital increases reserved for employees of the Group’s French and foreign subsidiaries covered by these plans.
114
The various Company savings plans (PEGT, PEC) give the employees of the Group’s French companies Group Companies belonging to these savings plans access to several collective investment funds (Fonds communs de placement), including a Fund invested in shares of the Company (“TOTAL ACTIONNARIAT FRANCE”). The capital increases reserved for employees are conducted under PEG-A through the “TOTAL ACTIONNARIAT FRANCE” fund for employees of the Group’s French subsidiaries and through the “TOTAL ACTIONNARIAT INTERNATIONAL CAPITALISATION” fund for the employees of foreign subsidiaries. In addition, U.S. employees participate in these operations through ADRsAmerican Depositary Receipts (ADRs) and Italian employees (as well as German employees starting in 2011) may participate by directly subscribing to new shares at the Group Caisse Autonomein Belgium. Performance indicators used under the June 26, 2009, profit-sharing agreements for employees of ten Group companies, when permitted by local law, link amounts available for profit sharing to the performance (ROE) of the Group as a whole. The total number of TOTAL shares held by employees as of December 31, 2009,2010, is as follows: | | | | | | | | | | | TOTAL ACTIONNARIAT FRANCE | | 71,010,179 | 73,117,185 | | TOTAL ACTIONNARIAT INTERNATIONAL CAPITALISATION | | 16,267,110 | 16,446,122 | | ELF PRIVATISATION No.1 No. 1 | | 1,208,239 | 977,948 | | Shares held by U.S. employees | | 735,391 | 705,829 | | Group Caisse Autonome (Belgium) | | 310,169 | 295,866 | | TOTAL shares from the exercise of the Company’s stock options and held as registered shares within a Company Savings Plan (PEE)(a)
| | 3,207,451 | 3,185,510 | | | | | | | Total shares held by employee shareholder funds | | 92,738,539 | 94,728,460 | | | | | | |
(a) | | | | (a) | | Company savings plans. |
As of December 31, 2009,2010, the employees of the Group employees held, on the basis of the definition of employee shareholding contained in Article L. 225-102 of the French Commercial Code, 92,738,53994,728,460 TOTAL shares, representing 3.95%4.03% of the Company’s share capital and 7.48%7.72% of the voting rights that could be exercised at a Shareholders’ Meeting on that date. Capital increase reserved for Group employees At the Shareholders’ Meeting held on May 11, 2007,21, 2010, the shareholders delegated to the Board of Directors the authority to increase the share capital of the Company in one or more transactions and within a maximum period of twenty-six months from the date of the meeting, by an amountreserving subscriptions for such issuance to the Group employees participating in a company savings plan in accordance with the provisions of Articles L.3332-2 and L.3332-18 and following of the French Labor Code, and Articles L.225-129-2, L.225-129-6 and L.225-138-1 of the French Commercial Code. The number of ordinary shares that are likely to be issued pursuant to this delegation of authority will not exceedingexceed 1.5% of the share capital outstanding on the date of the meeting of the Board of Directors at which a decision to proceed with an issuance is made, reserving subscriptions for such issuance to the Group employees participating in a company savings plan. It was specified that the amount of any such capital increase reserved for Group employees would be counted against the aggregate maximum nominal amount of share capital increases authorized by the Shareholders’ Meeting held on May 11, 2007 for issuing new ordinary shares or other securities granting immediate or future access to the Company’s share capital with pre-emptive subscription rights (par value€4 billion). This delegation of authority has cancelled and replaced, for the unused part, the one granted by the Shareholders’ Meeting on May 17, 2005.made. Pursuant to this delegation of authority, the Board of Directors decided on October 28, 2010, to proceed with a capital increase of a maximum of 12 million shares reserved for TOTAL employees, bearing dividends as of January 1, 2010. The Board of Directors decided to delegate the authority to set the subscription period to the Chairman and Chief Executive Officer. The Board of Directors had decided on November 6, 2007, to proceed with a capital increase of a maximum of 12 million shares with a subscription price of€44.40 €44.40 per share reserved for TOTAL employees, bearing dividends as of January 1, 2007. In accordance with Article 14 of the French Financial Markets Authority (Autorité desmarchés financiers, AMF) instruction No. 2005-11 as of December 13, 2005, regarding the information to be disclosed in case of a capital increase operation, TOTAL S.A. released on January 16, 2008, on its website and filed with the AMF a press release which specified the terms of the offering. The offering was opened to the employees of TOTAL S.A. and to the employees of its French and foreign subsidiaries in which TOTAL S.A. holds directly or indirectly 50% at least of the capital, who are participants in the TOTAL Group Savings Plan (PEG-A) and for which local regulatory approval was obtained. The offering was also open to former employees of TOTAL S.A. and its French subsidiaries who have retired and still have holdings in TOTAL employee savings plans. Subscription was open from March 10, 2008, through March 28, 2008, and 4,870,386 new TOTAL shares were issued in 2008.
On March 14, 2011, the Chairman and Chief Executive Officer decided that the subscription period would be set from March 16 to April 1, 2011, and acknowledged that the subscription price per ordinary share would be set at €34.80. The management of each of the three employee collective investment funds (Fonds Commun de Placement d’Entreprise) mentioned above is controlled by a dedicated supervisory board, two thirdstwo-third of its members representing holders of fund units and one thirdone-third representing the Company. This board is responsible for:for reviewing the collective investment funds’ management report and annual financial statements as well as the financial, administrative and accounting management;management, exercising voting rights attached to portfolio securities;securities, deciding contribution of securities in case of a public tender offer;offer, deciding mergers, spin-offs or liquidation;liquidations, and granting its approval prior to changes in the rules and procedures of the collective investment fund in the conditions provided for by the rules and procedures.
115
These rules and procedures also stipulate a simple majority vote for decisions, except for decisions requiring a qualified majority vote of two thirdstwo-third plus one related to a change in a fund’s rules and procedures, its conversion or its disposal, and decisions related to contribution of securities of the Elf Privatisation collective investment fund in case of a public tender offer. For employees holding shares outside of the employee collective investment funds mentioned in the charttable above, voting rights are exercised individually. Shares held by Directors and Executive Officers As of December 31, 2009,2010, based uponon information from the members of the Board and the share registrar, the members of the Board and the Group Executive Officers (Management Committee and Treasurer) held a total of less than 0.5% of the share capital: Members of the Board of Directors (including the Chairman and the Chief Executive Officer): 558,086 shares;
Chairman of the Board of Directors: 380,576 shares;
| | | • | Members of the Board of Directors (including the Chairman and Chief Executive Officer): 474,450 shares; | | • | Chairman and Chief Executive Officer: 85,230 shares and 48,529 shares of the TOTAL ACTIONNARIAT FRANCE collective investment plan; | | • | Management Committee (including the Chief Executive Officer) and Treasurer: 572,527 shares. |
Chief Executive Officer: 85,230 shares and 43,714 shares of the TOTAL ACTIONNARIAT FRANCE collective investment plan;
Management Committee (including the Chief Executive Officer) and Treasurer: 542,935 shares.
By decision of the Board of Directors: | | | • | The Chairman and the Chief Executive Officer are required to hold a number of shares of the Company equal in value to two years of the fixed portion of their annual compensation. | | • | Members of the Executive Committee are required to hold a number of shares of the Company equal in value to two years of the fixed portion of their annual compensation.Members of the Executive Committee are required to hold a number of shares of the Company equal in
| | value to two years of the fixed portion of their annual compensation. These shares have to be acquired within three years from the appointment to the Executive Committee. |
The number of TOTAL shares to be considered includes: | | | • | directly held shares, whether or not they are subject to transfer restrictions; and | | • | shares in collective investment funds invested in TOTAL shares. |
116
directly held shares, whether or not they are subject to transfer restrictions; and
shares in collective investment funds (FCPE) invested in TOTAL shares.
Summary of transactions in the Company’s securities The following table presents transactions, of which the Company has been informed, in the Company’s shares or related financial instruments carried out in 20092010 by the individuals concerned under paragraphs a) through c) of Article L. 621-18-2 of the French Monetary and Financial Code. Year 20092010 | | | | | | | | | | | | | | | | | | Acquisition | | Subscription | | Transfer | | Exchange | | Exercise
of stock options | Thierry Desmarest(a) | | TOTAL shares | | | | | | 50,000 | | | | 45,000 | | | | Shares in collective investment plans (FCPE), and other related financial instruments(b) | | | | | | | | | | | Christophe de Margerie(a) | | TOTAL shares | | | | | | | | | | | | | | Shares in collective investment plans (FCPE), and other related financial instruments(b) | | 4,215.92 | | | | | | | | | Michel Bénézit(a) | | TOTAL shares | | | | 30,000 | | 17,000 | | | | | | | | Shares in collective investment plans (FCPE), and other related financial instruments(b) | | 292.48 | | 189.85 | | 5,310.47 | | | | | François Cornélis(a) | | TOTAL shares | | | | | | 90,000 | | | | 90,000 | | | | Shares in collective investment plans (FCPE), and other related financial instruments(b) | | 1,086.47 | | | | | | | | | Yves-Louis Darricarrère(a) | | TOTAL shares | | | | | | 4,200 | | | | | | | | Shares in collective investment plans (FCPE), and other related financial instruments(b) | | 4.04 | | | | | | | | | Jean-Jacques Guilbaud(a) | | TOTAL shares | | | | | | | | | | | | | | Shares in collective investment plans (FCPE), and other related financial instruments(b) | | 322.97 | | 287.90 | | | | | | | Bertrand Jacquillat(a) | | TOTAL shares | | 700 | | | | | | | | | | | | Shares in collective investment plans (FCPE), and other related financial instruments(b) | | | | | | | | | | | Patrick de La Chevardière(a) | | TOTAL shares | | | | | | | | | | | | | | Shares in collective investment plans (FCPE), and other related financial instruments(b) | | 150.86 | | 190.88 | | | | | | |
| | | | | | | | | | | | | | | | | | | | | | | | | | | | | | | | | | | | | | | | | | | Exercise
| | | | | | | | | | | | | | | | | | | | of stock
| | | | | | | | Acquisition | | | Subscription | | | Transfer | | | Exchange | | | options | | Thierry Desmarest(a) | | | TOTAL shares | | | — | | | | — | | | | 45,372 | | | | — | | | | 25,372 | | | | | | | | | | | | | | | | | | | | | | | | | | | | | | | Shares in collective investment plans (FCPE), and other related financial instruments(b) | | | — | | | | — | | | | — | | | | — | | | | — | | | | | | | | | | | | | | | | | | | | | | | | | | | Christophe de Margerie(a) | | | TOTAL shares | | | — | | | | — | | | | — | | | | — | | | | — | | | | | | | | | | | | | | | | | | | | | | | | | | | | | | | Shares in collective investment plans (FCPE), and other related financial instruments(b) | | | 4,815.21 | | | | — | | | | — | | | | — | | | | — | | | | | | | | | | | | | | | | | | | | | | | | | | | Michel Bénézit(a) | | | TOTAL shares | | | — | | | | 3,170 | | | | — | | | | — | | | | — | | | | | | | | | | | | | | | | | | | | | | | | | | | | | | | Shares in collective investment plans (FCPE), and other related financial instruments(b) | | | 27.68 | | | | 47.23 | | | | — | | | | — | | | | — | | | | | | | | | | | | | | | | | | | | | | | | | | | François Cornélis(a) | | | TOTAL shares | | | — | | | | — | | | | — | | | | — | | | | — | | | | | | | | | | | | | | | | | | | | | | | | | | | | | | | Shares in collective investment plans (FCPE), and other related financial instruments(b) | | | 1,241.32 | | | | — | | | | — | | | | — | | | | — | | | | | | | | | | | | | | | | | | | | | | | | | | | Yves-Louis Darricarrère(a) | | | TOTAL shares | | | — | | | | — | | | | — | | | | — | | | | — | | | | | | | | | | | | | | | | | | | | | | | | | | | | | | | Shares in collective investment plans (FCPE), and other related financial instruments(b) | | | 4.61 | | | | — | | | | — | | | | — | | | | — | | | | | | | | | | | | | | | | | | | | | | | | | | | Jean-Jacques Guilbaud(a) | | | TOTAL shares | | | — | | | | — | | | | 5,000 | | | | — | | | | 5,000 | | | | | | | | | | | | | | | | | | | | | | | | | | | | | | | Shares in collective investment plans (FCPE), and other related financial instruments(b) | | | 345.33 | | | | 259.48 | | | | 652.79 | | | | — | | | | — | | | | | | | | | | | | | | | | | | | | | | | | | | | Patrick de La Chevardière(a) | | | TOTAL shares | | | — | | | | — | | | | — | | | | — | | | | — | | | | | | | | | | | | | | | | | | | | | | | | | | | | | | | Shares in collective investment plans (FCPE), and other related financial instruments(b) | | | 79.25 | | | | 12.79 | | | | — | | | | — | | | | — | | | | | | | | | | | | | | | | | | | | | | | | | | |
(a) | | | | (a) | | Including the related individuals in the meaning of the provisions of the Article R.621-43-1 of the French Monetary and Financial Code. |
| (b) | | Collective investment funds (FCPE) primarily investinginvested in Company shares. |
117
ITEM 7. MAJOR SHAREHOLDERS AND RELATED PARTY TRANSACTIONS Holdings of principalmajor shareholders The principalmajor shareholders of TOTAL as of December 31, 2010, 2009 2008 and 20072008 are set forth in the table below: | | | | | | | | | | | | | | | | | | 2009 | | 2008 | | 2007 | | As of December 31, | | % of
share
capital | | % of
voting
rights | | % of
theoretical
voting
rights(a) | | % of
share
capital | | % of
voting
rights | | % of
share
capital | | % of
voting
rights | Groupe Bruxelles Lambert(b)(c) | | 4.0 | | 4.0 | | 3.7 | | 4.0 | | 4.0 | | 3.9 | | 4.0 | Compagnie Nationale à Portefeuille(b)(c) | | 1.4 | | 1.4 | | 1.3 | | 1.4 | | 1.4 | | 1.4 | | 1.4 | Areva(b) | | 0.0 | | 0.0 | | 0.0 | | 0.3 | | 0.6 | | 0.3 | | 0.6 | BNP Paribas(b) | | 0.2 | | 0.2 | | 0.2 | | 0.2 | | 0.2 | | 0.2 | | 0.3 | Group employees(b)(d) | | 3.9 | | 7.5 | | 6.8 | | 3.8 | | 7.4 | | 3.6 | | 7.0 | Other registered shareholders (non-Group) | | 1.4 | | 2.4 | | 2.2 | | 1.2 | | 2.1 | | 1.2 | | 2.1 | Treasury shares | | 4.9 | | — | | 8.5 | | 6.0 | | — | | 6.3 | | — | of which TOTAL S.A. | | 0.6 | | — | | 0.6 | | 1.8 | | — | | 2.1 | | — | of which Total Nucléaire | | 0.1 | | | | 0.2 | | 0.1 | | — | | 0.1 | | — | of which subsidiaries of Elf Aquitaine | | 4.2 | | | | 7.7 | | 4.1 | | — | | 4.1 | | — | Other bearer shareholders | | 84.2 | | 84.5 | | 77.3 | | 83.1 | | 84.3 | | 83.1 | | 84.6 | of which holders of ADS(e) | | 7.5 | | 7.6 | | 6.9 | | 8.2 | | 8.3 | | 8.5 | | 8.6 |
| | | | | | | | | | | | | | | | | | | | | | | | | | | | | | | | | 2010 | | | 2009 | | | 2008 | | | | | | | | | | | % of
| | | | | | | | | | | | | | | | | % of
| | | % of
| | | theoretical
| | | % of
| | | % of
| | | % of
| | | % of
| | | | | share
| | | voting
| | | voting
| | | share
| | | voting
| | | share
| | | voting
| | | As of December 31, | | capital | | | rights | | | rights(a) | | | capital | | | rights | | | capital | | | rights | | Groupe Bruxelles Lambert(b)(c) | | | 4.0 | | | | 4.0 | | | | 3.7 | | | | 4.0 | | | | 4.0 | | | | 4.0 | | | | 4.0 | | Compagnie Nationale à Portefeuille(b)(c) | | | 1.6 | | | | 1.6 | | | | 1.4 | | | | 1.4 | | | | 1.4 | | | | 1.4 | | | | 1.4 | | Areva(b) | | | 0.0 | | | | 0.0 | | | | 0.0 | | | | 0.0 | | | | 0.0 | | | | 0.3 | | | | 0.6 | | BNP Paribas(b) | | | 0.2 | | | | 0.2 | | | | 0.2 | | | | 0.2 | | | | 0.2 | | | | 0.2 | | | | 0.2 | | | | | | | | | | | | | | | | | | | | | | | | | | | | | | | | Group employees(b)(d) | | | 4.0 | | | | 7.7 | | | | 7.1 | | | | 3.9 | | | | 7.5 | | | | 3.8 | | | | 7.4 | | | | | | | | | | | | | | | | | | | | | | | | | | | | | | | | Other registered shareholders (non-Group) | | | 1.4 | | | | 2.5 | | | | 2.3 | | | | 1.4 | | | | 2.4 | | | | 1.2 | | | | 2.1 | | | | | | | | | | | | | | | | | | | | | | | | | | | | | | | | Treasury shares | | | 4.8 | | | | — | | | | 8.3 | | | | 4.9 | | | | — | | | | 6.0 | | | | — | | of which TOTAL S.A. | | | 0.5 | | | | — | | | | 0.5 | | | | 0.6 | | | | — | | | | 1.8 | | | | — | | of which Total Nucléaire | | | 0.1 | | | | | | | | 0.1 | | | | 0.1 | | | | — | | | | 0.1 | | | | — | | of which subsidiaries of Elf Aquitaine | | | 4.2 | | | | | | | | 7.7 | | | | 4.2 | | | | — | | | | 4.1 | | | | — | | | | | | | | | | | | | | | | | | | | | | | | | | | | | | | | Other bearer shareholders | | | 84.0 | | | | 84.0 | | | | 77.0 | | | | 84.2 | | | | 84.5 | | | | 83.1 | | | | 84.3 | | of which holders of ADS(e) | | | 8.0 | | | | 8.0 | | | | 7.4 | | | | 7.5 | | | | 7.6 | | | | 8.2 | | | | 8.3 | | | | | | | | | | | | | | | | | | | | | | | | | | | | | | | |
(a) | | | | (a) | | Pursuant toarticle 223-11 of the AMF General Regulation, the number of theoretical voting rights is calculated on the basis of all outstanding shares to which voting rights are attached, including treasury shares that are deprived of voting rights. |
| (b) | | Shareholders with an executive officer (or a representative of employees) serving as a director of TOTAL S.A. |
| (c) | | Groupe Bruxelles Lambert is a company controlled jointly by the Desmarais family and Frère-Bourgeois S.A., and for the latter mainly through its direct and indirect interest in Compagnie Nationale à Portefeuille. In addition, Groupe Bruxelles Lambert and Compagnie Nationale à Portefeuille declared their acting in concert. |
| (d) | | Based on the definition of employee shareholding pursuant to Article L.225-102 of the French Commercial Code. |
| (e) | | American Depositary Shares listed on the New York Stock Exchange. |
As of December 31, 2009,2010, the holdings of the principalmajor shareholders were calculated based on the basis of 2,348,422,8842,349,640,931 shares, representing 2,339,384,5502,350,274,592 voting rights exercisable at Shareholders’ Meetings or 2,555,123,0082,563,093,539 theoretical voting rights (1) including: 200,662,536 voting rights attached to the 100,331,268 TOTAL shares held by TOTAL S.A. subsidiaries that cannot be exercised at Shareholders’ Meetings; and
| | | • | 200,662,536 voting rights attached to the 100,331,268 TOTAL shares held by TOTAL S.A. subsidiaries that cannot be exercised at Shareholders’ Meetings; and |
15,075,922 voting rights attached to the 15,075,922 TOTAL shares held by TOTAL S.A. deprived of voting rights.
| | | • | 12,156,411 voting rights attached to the 12,156,411 TOTAL shares held by TOTAL S.A. that are deprived of voting rights. |
For prior years, the principal shareholders’ interestsholdings of the major shareholders were established on the basis of 2,348,422,884 shares, to which were attached 2,339,384,550 voting rights that could be exercised at the Shareholders’ Meeting, as of December 31, 2009, and of 2,371,808,074 shares to which were attached 2,339,251,395 voting rights that could be exercised at the Shareholders’ MeetingsMeeting, as of December 31, 2008, and of 2,395,532,097 shares to which were attached 2,353,106,888 voting rights that2008. could be exercised at Shareholders’ Meetings as of December 31, 2007.
As of February 28, 2010, there were 175,744,188 ADSs outstanding in the United States, representing approximately 7.5% of the total outstanding shares.
The Company is not directly or indirectly owned or controlled by another corporation, by any foreign government or by any other natural or legal person. The Company does not know of any arrangements that may, at a subsequent date, result in a change of control of TOTAL.
Identification of the holders of bearer shares In accordance with Article 9 of its bylaws,by-laws, the Company is authorized, to the extent permitted under applicable 1. | Pursuant to Article 223-11 of the AMF General Regulation, the number of voting rights is calculated on the basis of all outstanding shares, including those shares held by the Group that are deprived of voting rights. |
law, to identify the holders of securities that grant immediate or future voting rights at the Company’s Shareholders’ Meetings. In addition to the legal obligation to inform the Company and the French Financial Markets Authority (Autorité des marchés financiers) within four business days when thresholds representing 5%, 10%, 15%, 20%, 25%, 30%, 33 11/3/3%, 50%, 66 22/3/3%, 90% or 95% of the share capital or voting rights(1)(2) are crossed (Article L.233-7 of the French Commercial Code), any individual or entity who directly or indirectly acquires a percentage of the share capital, voting rights or rights giving future access to the share capital of the Company which is equal to or greater than 1%, or a multiple of this percentage, is required to notify the Company within fifteen15 days by registered mail with return receipt requested, and declare the number of securities held. (1) Pursuant toArticle 223-11 of the AMF General Regulation, the number of theoretical voting rights is calculated on the basis of all outstanding shares, including those shares held by the Group that are deprived of voting rights. (2) Pursuant toArticle 223-11 of the AMF General Regulation, the number of voting rights is calculated on the basis of all outstanding shares, including those shares held by the Group that are deprived of voting rights.
118
In case the shares above these thresholds are not declared, any shares held in excess of the threshold and undeclared may be deprived of voting rights at future Shareholders’ Meetings if, at that meeting, the failure to make a declaration is acknowledged and if one or more shareholders holding collectively at least 3% of the Company’s share capital or voting rights so request at that meeting. All individuals and entities are also required to notify the Company in due form and within the time limits stated above when their direct or indirect holdings fall below each of the aforementioned thresholds. Declarations are to be sent to the Vice President of the Investor Relations department in Paris. Temporary transfer of securities Pursuant to legal obligations, any legal entity or individual (with the exception of those described in paragraph 3 of Article L.233-7 of the French Commercial Code) holding alone or together a number of shares representing more than 0.5% of the Company’s voting rights pursuant to one or several temporary transfers or similar operations as described by Article L.225-126 of the French Commercial Code is required to inform the Company and the French Financial Markets Authority of the number of shares temporarily held no later than the third business days preceding the Shareholders’ Meeting at midnight. Declarations are to bee-mailed to the Company at: holding.df-shareholdingnotification@total.com. Failing to declare such information, any share bought under any of the above described temporary transfer operations shall be deprived of voting rights at the relevant Shareholders’ Meeting and at any Shareholders’ Meeting that would be held until such shares are transferred again or returned. Holdings above the legal thresholds In accordance with Article L. 233-13 of the French Commercial Code, only one shareholder, Compagnie Nationale à Portefeuille (CNP) and Groupe Bruxelles Lambert (GBL), acting together,in concert, holds 5% or more of TOTAL’s share capital at year-end 20092010(1). In addition, two known shareholders held 5% or more of the voting rights exercisable at TOTAL Shareholders’ Meetings at year-end 2009:2010:In the AMF notice No. 209C1156 dated September 2, 2009, CNP and GBL acting togetherin concert declared that they held more than the threshold of 5% of the voting rights of TOTAL as of August 25, 2009 and held 127,149,464 TOTAL shares representing 127,745,604 voting rights,i.e.5.42% of the share capital and 5.0009% of the theoretical voting rights(2) (on the basis of a share capital of(based on a share capital of 2,347,601,812 shares representing 2,554,431,468 voting rights). To the Company’s knowledge, CNP, jointly with GBL, held, as of December 31, 2009, 5.41%2010, 5.56% of the share capital representing 5.46%5.59% of the voting rights exercisable at Shareholders’ Meetings and 5%5.12% of the theoretical voting rights(2). • | | | • | The collective investment fund (Fondsfonds commun de placement) “TOTAL ACTIONNARIAT FRANCE”. : |
To the Company’s knowledge, the collective investment fund ( Fondsfonds commun de placement) “TOTAL ACTIONNARIAT FRANCE” held, as of December 31, 2009, 3.02%2010, 3.11% of the share capital representing 5.76%5.94% of the voting rights exercisable at a Shareholders’ Meeting and 5.28%5.44% of the theoretical voting rights (2). ShareholdersShareholders’ agreementsTOTAL is not aware of any agreements among its shareholders. As of December 31, 2009,2010, the Company held 115,407,190112,487,679 TOTAL shares either directly or through its indirect subsidiaries, which represented 4.91%4.79% of the share capital, as of this date. By law, these shares are also deprived of voting rights. TOTAL shares held directly by the Company The Company held 15,075,92212,156,411 treasury shares as of December 31, 2009,2010, representing 0.64%0.52% of the share capital, as of that date. TOTAL shares held directly by Group companies As of December 31, 2009,2010, Total Nucléaire, a Group company wholly-owned indirectly by TOTAL held 2,023,672 TOTAL shares. As of December 31, 2009,2010, Financière Valorgest, Sogapar and Fingestval, indirect subsidiaries of Elf Aquitaine, held respectively 22,203,704, (1) AMF notice No. 207C1811 dated September 2, 2009.
(2) Pursuant toArticle 223-11 of the AMF General Regulation, the number of theoretical voting rights is calculated on the basis of all outstanding shares, including those shares held by the Group that are deprived of voting rights.
119
4,104,000 and 71,999,892 TOTAL shares, representing a total of 98,307,596 TOTAL shares. As of December 31, 2009,2010, the Company held through its indirect subsidiaries, 4.27% of the share capital. 1. | Source: AMF notice No. 209C1156 dated September 2, 2009. |
2. | Pursuant to Article 223-11 of the AMF General Regulation, the number of theoretical voting rights is calculated on the basis of all outstanding shares, including those shares held by the Group that are deprived of voting rights. |
Related Party Transactions The Group’s main transactions with related parties (principally all the investments carried under the equity method) and the balances receivable from and payable to them are shown in Note 24 to the Consolidated Financial Statements. In the ordinary course of its business, TOTAL enters into transactions with various organizations with which certain of its directors or executive officers may be associated, but no such transactions of a material or unusual nature have been entered into during the period commencing on January 1, 2007,2008, and ending on March 31, 2010.24, 2011. ITEM 8. FINANCIAL INFORMATION Consolidated Statements and other supplemental information See pages F-1 through F-90F-97 and S-1 through S-16S-20 for TOTAL’s Consolidated Financial Statements and other supplemental information. Legal or arbitration proceedings While it is not feasible to predict the outcome of the pending claims, proceedings, and investigations described below with certainty, management is of the opinion that their ultimate disposition should not have a material adverse effect on the Company’s financial position, cash flows, or results of operations. An explosion occurred at the Grande Paroisse industrial site in the city of Toulouse in France on September 21, 2001. Grande Paroisse, a former subsidiary of Atofina which became a subsidiary of Elf Aquitaine Fertilisants on December 31, 2004, as part of the reorganization of the Chemicals segment, was principally engaged in the production and sale of agricultural fertilizers. The explosion, which involved a stockpile of ammonium nitrate pellets, destroyed a portion of the site and caused the death of thirty-one people, including twenty-one workers at the site, and injured many others. The explosion also caused significant damage to certain property in part of the city of Toulouse. This plant has been closed and individual assistance packages have been provided for employees. The site has been rehabilitated. On December 14, 2006, Grande Paroisse signed, under the supervision of the city of Toulouse, the deed whereby it donated the former site of the AZF plant to the greater agglomeration of Toulouse (CAGT) and the Caisse des dépôts et consignationsand its subsidiary ICADE. Under this deed, TOTAL S.A. guaranteed the site restoration obligations of Grande Paroisse and granted a €10 €10 million endowment to the InNaBioSanté research foundation as part of the setting up of a cancer research center at the site by the city of Toulouse. Regarding the cause of the explosion, the hypothesis that the explosion was caused by Grande Paroisse through the accidental mixing of hundreds of kilos of a chlorine compound at a storage site for ammonium nitrate was discredited over the course of the investigation. As a result, proceedings against ten of the eleven Grande Paroisse employees charged during the criminal investigation conducted by the Toulouse Regional Court ( Tribunal de grande instance) were dismissed and this dismissal was upheld by the Court of Appeal of Toulouse. Nevertheless, the final experts’ report filed on May 11, 2006 continued to focus on the hypothesis of a chemical accident, although this hypothesis was not confirmed during the attempt to reconstruct the accident at the site. After having articulated several hypotheses, the experts no longer maintain that the accident was caused by pouring a large quantity of a chlorine compound over ammonium nitrate. Instead, the experts have retained a scenario where a container of chlorine compound sweepings was poured between a layer of wet ammonium nitrate covering the floor and a quantity of dry agricultural nitrate at a location not far from the principal storage site. This is claimed to have caused an explosion which then spread into the main storage site. Grande Paroisse was investigated based on this new hypothesis in 2006.2006; Grande Paroisse is contesting this explanation, which it believes to be based on elements that are not factually accurate. The Court of Appeal of Toulouse denied all the requests for additional investigations that were submitted by Grande Paroisse, the former site manager and various plaintiffs after the end of the criminal investigation procedure. On July 9, 2007, the investigating judge brought charges against Grande Paroisse and the former plant manager before the criminal chamber of the Court of Appeal of Toulouse. In late 2008, TOTAL S.A. and Mr. Thierry Desmarest were summoned to appear in court pursuant to a request by a victims association. The trial for this case began on February 23, 2009, and lasted approximately four months.
120
On November 19, 2009, the Toulouse Criminal Court acquitted both the former Plant Manager, and Grande Paroisse due to the lack of reliable evidence for the explosion. The Court also ruled that the summonses against TOTAL S.A. and Thierry Desmarest, Chairman and CEO at the time of the disaster, were inadmissible. Due to the presumption of civil liability that applied to Grande Paroisse, the Court declared Grande Paroisse civilly liable for the damages caused by the explosion to the victims in its capacity as custodian and operator of the plant. The Prosecutor’s office, together with certain third parties, has appealed the Toulouse Criminal Court verdict. In order to preserve its rights, Grande Paroisse lodged a cross-appeal with respect to civil charges. The appeal proceedings are expected to be ruled bystart before the Court of Appeal of Toulouse during the first half ofon November 3, 2011. A compensation mechanism for victims was set up immediately following the explosion and€2.29explosion. €2.3 billion in settlement were paid for the compensation of all claims and related expenses amounts. As of December 31, 2009,2010, a €40 €31 million reserve iswas recorded in the Group’s Consolidated Balance Sheet.consolidated balance sheet. For the year ended 2010, the Group has not been fined pursuant to a Court ruling. The principal antitrust proceedings in which the Group is involved are described hereafter. Chemicals segment | | | • | As part of the spin-off of Arkema(1) in 2006, TOTAL S.A. or certain other Group companies agreed to grant Arkema guarantees for potential monetary consequences related to antitrust proceedings arising from events prior to the spin-off. |
| | | | FollowingThese guarantees cover, for a period of ten years, 90% of amounts paid by Arkema related to (i) fines imposed by European authorities or European member-states for competition law violations, (ii) fines imposed by U.S. courts or antitrust authorities for federal antitrust violations or violations of the competition laws of U.S. states, (iii) damages awarded in civil proceedings related to the government proceedings mentioned above, and (iv) certain costs related to these proceedings. The guarantee related to anti-competition violations in Europe applies to amounts above a €176.5 million threshold. On the other hand, the agreements provide that Arkema will indemnify TOTAL S.A. or any Group company for 10% of any amount that TOTAL S.A. or any Group company are required to pay under any of the proceedings covered by these guarantees.
|
| | | If one or more individuals or legal entities, acting alone or together, directly or indirectly holds more than one-third of the voting rights of Arkema, or if Arkema transfers more than 50% of its assets (as calculated under the enterprise valuation method, as of the date of the transfer) to a third party or parties acting together, irrespective of the type or number of transfers, these guarantees will become void. |
| | | • | In the United States, investigations into certain commercial practices in the chemicals industry in the United States,of some subsidiaries of the Arkema(1) group are involved in several criminal investigations, todayhave been closed and civilsince 2007; no charges have been brought against Arkema. Civil liability lawsuits, for violations of antitrust laws in the United States.which TOTAL S.A. has been named in certain of these suits as the parent company.company, are about to be closed and are not expected to have a significant impact on the Group’s financial position. | | | • | In Europe, since 2006, the European Commission has fined companies of the Group in its configuration prior to the spin-off an overall amount of €385.47 million, of which Elf Aquitaineand/or TOTAL S.A. and their subsidiaries were held jointly liable for €280.17 million, Elf Aquitaine being personally fined €23.6 million for deterrence. These fines are entirely settled as of today. |
In Europe, the European Commission commenced | | | As a result(2), since the spin-off, the Group has paid the overall amount of €188.07 million, corresponding to 90% of the fines overall amount once the threshold provided for by the guarantee is deducted. |
| | | The European Commission imposed these fines following investigations between 2000 and 2004 into commercial practices involving eight products sold by Arkema. Five of these investigations resulted in prosecutions from the European Commission for which Elf Aquitaine has been named as the parent company and two of these investigations named TOTAL S.A. as the ultimate parent company of the Group. |
| | | TOTAL S.A. and Elf Aquitaine are contesting their liability based solely on their status as parent companies and appealed for cancelation and reformation of the rulings that are still pending before the relevant EU court of appeals or supreme court of appeals. |
(1) Arkema is used in 2000, 2003 and 2004 into alleged anti-competitive practices involving certain products sold by Arkema. In January 2005, under one of these investigations, the European Commission fined Arkema€13.5 million and jointly fined Arkema and Elf Aquitaine€45 million. On September 30, 2009, the Court of First Instancethis section to designate those companies of the European Union denied the appealArkema group whose ultimate parent company is Arkema S.A. Arkema became an independent company after being spun-off from Arkema and Elf Aquitaine. An appeal has been filed to the Court of Justice of the European Communities in the allotted time.The Commission notified Arkema, TOTAL S.A. in May 2006.
(2) This amount does not take into account a case that led to Arkema, prior to Arkema’s spin-off from TOTAL, and Elf Aquitaine of complaints concerning two other product lines in January and August 2005, respectively. Arkema has cooperated with the authorities in these procedures and investigations. In May 2006, the European Commissionbeing fined Arkema€78.7 million and€219.1 million as a result of, respectively, each of these two proceedings. Elf Aquitaine was held jointly and severally liable for, respectively,€65.1 million and€181.35 million of these fines while TOTAL S.A. was held jointly and severally liable, respectively, for€42 million and€140.4 million. TOTAL S.A., Arkema and Elf Aquitaine have appealed these decisions to the Court of First Instance of the European Union. Arkema and Elf Aquitaine received a statement of objections from the European Commission in August 2007 concerning alleged anti-competitive practices related to another line of chemical products. As a result, Arkema and Elf Aquitaine have been jointly and severally fined in an amount of€22.7€45 million and individuallyArkema being fined €13.5 million. This case is referred to in an amount of€20.43 million for Arkema and€15.89 million for Elf Aquitaine. The companies concerned have appealed this decision to the relevant European court.past Registration Documents.
121
Arkema and Elf Aquitaine received a statement of objections from the European Commission in March 2009 concerning alleged anti-competitive practices related to another line of chemical products. The decision was rendered by the European Commission in November 2009. Arkema and Elf Aquitaine were jointly and severally fined in an amount of€11 million and individually in an amount of€9.92 million for Arkema and€7.71 million for Elf Aquitaine. The companies concerned will appeal this decision to the relevant European court.
No facts have been alleged that would implicate TOTAL S.A. or Elf Aquitaine in the practices questioned in these proceedings, and the fines received are based solely on their status as parent companies.
Arkema began implementing compliance procedures in 2001 that are designed to prevent its employees from violating antitrust provisions. However, it is not possible to exclude the possibility that the relevant authorities could commence additional proceedings involving Arkema, as well as TOTAL S.A. and Elf Aquitaine.
As part of the agreement relating to the spin-off of Arkema, TOTAL S.A. or certain other Group companies agreed to grant Arkema guarantees for certain risks related to antitrust proceedings arising from events prior to the spin-off.
These guarantees cover, for a period of ten years that began in 2006, 90% of amounts paid by Arkema related to (i) fines imposed by European authorities or European member-states for competition law violations, (ii) fines imposed by U.S. courts or antitrust authorities for federal antitrust violations or violations of the competition laws of U.S. states, (iii) damages awarded in civil proceedings related to the government proceedings mentioned above, and (iv) certain costs related to these proceedings.
The guarantee covering the risks related to anti-competition violations in Europe applies to amounts above a€176.5 million threshold.
1. | | | Besides, a civil proceeding against Arkema is used in this sectionand five groups of companies was initiated before a German regional court by a third party for an alleged damage pursuant to designate those companiesone of the Arkema group whose ultimate parent company is Arkema S.A., which became an independent company after being spun off fromabove described legal proceedings. TOTAL S.A. was summoned to serve notice of the dispute before this court. At this point, the probability to have a favorable verdict and the financial impacts of this procedure are uncertain due to the number of legal difficulties it gave rise to, the lack of documented claim and the complex evaluation of the alleged damage. | | | Arkema began implementing compliance procedures in May 2006.2001 that are designed to prevent its employees from violating antitrust provisions. However, it is not possible to exclude the possibility that the relevant authorities could commence additional proceedings involving Arkema regarding events prior to the spin-off, as well as Elf Aquitaineand/or TOTAL S.A. based on their status as parent company. | | | Within the framework of the legal proceedings described above, a €17 million reserve is booked in the Group’s consolidated financial statements as of December 31, 2010. |
If one or more individuals or legal entities, acting alone or together, directly or indirectly holds more than one-third of the voting rights of Arkema, or if Arkema transfers more than 50% of its assets (as calculated under the enterprise valuation method, as of the date of the transfer) to a third party or parties acting together, irrespective of the type or number of transfers, these guarantees will become void.
On the other hand, the agreements provide that Arkema will indemnify TOTAL S.A. or any Group company for 10% of any amount that TOTAL S.A. or any Group company are required to pay under any of the proceedings covered by these guarantees.
The Group has recorded provisions amounting to€Downstream segment43 million in its consolidated financial statements as of December 31, 2009 to cover the risks mentioned above.
Moreover, as a result of investigations started by the European Commission in October 2002 concerning certain Refining & Marketing subsidiaries of the Group, Total Nederland N.V. and TOTAL S.A. received a statement of objections in October 2004. These proceedings resulted, in September 2006, in Total Nederland N.V. being fined€20.25 million and in TOTAL S.A. as its parent company being held jointly responsible for€13.5 million of this amount, although no facts implicating TOTAL S.A. in the practices under investigation were alleged. TOTAL S.A. and Total Nederland N.V. have appealed this decision to the Court of First Instance of the European Union.
In addition, in May 2007, Total France (new corporate name: Total Raffinage & Marketing) and TOTAL S.A. received a statement of objections regarding alleged antitrust practices concerning another product line of the Refining & Marketing division. These proceedings resulted, in October 2008, in Total France being fined€128.2 million and in TOTAL S.A., as its parent company, being held jointly responsible although no facts implicating TOTAL S.A. in the practices under investigation were alleged. TOTAL S.A. and Total Raffinage & Marketing have appealed this decision to the Court of First Instance of the European Union.
Furthermore, in July 2009, the French antitrust Authority sent to TotalGaz and Total Raffinage Marketing a statement of objections regarding alleged antitrust practices concerning another product line of the Refining & Marketing division.
| | | • | Pursuant to a statement of objections received by Total Nederland N.V. and TOTAL S.A. (based on its status as parent company) from the European Commission, Total Nederland N.V. was fined in 2006 €20.25 million, which has been paid, and for which TOTAL S.A. was held jointly liable for €13.5 million. TOTAL S.A. appealed this decision before the relevant court and this appeal is still pending. |
| | | In addition, pursuant to a statement of objections received by Total Raffinage Marketing (formerly Total France) and TOTAL S.A. from the European Commission regarding another product line of the Refining & Marketing division, Total Raffinage Marketing was fined €128.2 million in 2008, which has been paid, and for which TOTAL S.A. was held jointly liable based on its status as parent company. TOTAL S.A. also appealed this decision that is still pending before the relevant court. |
| | | • | Finally, TotalGaz and Total Raffinage Marketing received in July 2009 a statement of objections from the French Antitrust Authority (Autorité de la concurrence française) regarding alleged antitrust practices concerning another product line of the Refining & Marketing division. The case was dismissed by decision of the French antitrust authorities on December 17, 2010. |
Given the discretionary powers granted to the European Commissionantitrust authorities for determining fines relating to antitrust regulations, it is not currently possible to determine with certainty the outcome of these investigations and proceedings. TOTAL S.A. and Elf Aquitaine are contesting their liability and the method of determining these fines. Although it is not possible to predict the ultimate outcome of these proceedings, the Group believes that they will not have a material adverse effect on its financial situation or consolidated results. | Aquitaine are contesting their liability and the method of determining these fines. Although it is not possible to predict the ultimate outcome of these proceedings, the Group believes that they will not have a material adverse effect on its financial situation or consolidated results.
|
Following the sinking in December 1999 of the Erika, a tanker that was transporting products belonging to one of the Group companies, the Tribunal de grande instanceof Paris convicted TOTAL S.A. of marine pollution pursuant to a judgment issued on January 16, 2008, finding that TOTAL S.A. was negligent in its vetting procedure for vessel selection.selection and ordering TOTAL S.A. was fined€375,000.to pay a fine of €375,000. The court also ordered compensation to be paid to those affected by the victims of pollution from the Erika up to an aggregate amount of €192 €192 million, declaring TOTAL S.A. jointly and severally liable for such payments together with the Erika’s inspection and classification firm, the Erika’s owner and the Erika’s manager. TOTAL believes that the finding of negligence and the related conviction for marine pollution are without substance as a matter of fact and as a matter of law. TOTAL also considers that this verdict is contrary to the intended aim of enhancing maritime transport safety.
TOTAL has appealed the verdict of January 16, 2008. In the meantime, it has nevertheless proposed to pay third parties who so requestrequested definitive compensation as determined by the court. As of today, forty-oneForty-one third parties have been compensated for an aggregate amount of €171.5 €171.5 million. The appeal proceedings were heard by the Court of Appeal of Paris in late 2009.
By a decision dated March 30, 2010, the Court of Appeal of Paris upheld the lower court judgmentverdict pursuant to which TOTAL S.A. was convicted of marine pollution and fined the Company€375,000.€375,000. TOTAL S.A. is considering the possibility of filing an appeal inappealed this decision to the French Supreme Court(Court (Cour de cassation) in this respect.On the other hand,.
However, the Court of Appeal ruled that TOTAL S.A. bears no civil liability according to the applicable international conventions.conventions and consequently ruled that TOTAL S.A. considers, according tobe not convicted. TOTAL S.A. believes that, based on the information currently available, to it, that thisthe case should not have noa significant impact on the Group’s financial situation or consolidated results.
122
On December 11, 2005, several explosions, followed by a major fire, occurred at an oil storage depot at Buncefield, north of London. This depot iswas operated by Hertfordshire Oil Storage Limited (HOSL), a company in which TOTAL’s UK subsidiary holds 60% and another oil group holds 40%. The explosion caused injuries, most of which were minor injuries, to a number of people and caused property damage to the depot and the buildings and homes located nearby. The official Independent Investigation Board has indicated that the explosion was caused by the overflow of a tank at the depot. The Board’s final report was released on December 11, 2008. The civil procedure for claims, which havehad not yet been settled, took place between October and December 2008. The Court’s decision of March 20, 2009, declared TOTAL’s UK subsidiary liable for the accident and solely liable for indemnifying the victims. The subsidiary appealed the decision. The appeal hearings were heldtrial took place in January 2010. The Court of Appeal,Appeals, by a decision handed down on March 4, 2010, confirmed the prior judgment. The Supreme Court of United Kingdom has partially authorized TOTAL’s UK subsidiary is looking intoto contest the possibilitydecision. TOTAL’s UK subsidiary finally decided to file an appeal before the Supreme Court with respectwithdraw from this recourse due to both the extent and sharing of the liabilities incurred.The provision for the civil liability that appearssettlement agreements reached in the Group’s consolidated financial statements as of December 31, 2009, stands at€295 million after taking into account payments previously made.
mid-February 2011. The Group carries insurance for damage to its interests in these facilities, business interruption and civil liability claims from third parties. The residual amount to be received from insurers amounts to€211 millionprovision for the civil liability that appears in the Group’s consolidated financial statements as of December 31, 2009.2010, stands at €194 million after taking into account the payments previously made. The Group believes that, based on the information currently available, on a reasonable estimate of its financial liability and on provisions recognized, this accident should not have a significant impact on the Group’s financial situation or consolidated results. On
In addition, on December 1, 2008, the Health and Safety Executive (HSE) and the Environment Agency (EA) issued a Notice of prosecution against five companies, including TOTAL’s UK subsidiary. In November 2009,By a judgment on July 16, 2010, TOTAL’s UK subsidiary pleaded guilty to the charges brought by the prosecution and intends to raisewas fined £3.6 million. The decision takes into account a number of elements likely to mitigatethat have mitigated the impact of the charges brought against it. Under the Belgian “universal jurisdiction” laws of June 16, 1993 and February 10, 1999, a complaint was filed in Belgium on April 25, 2002, against the Company, its Chairman and the former president of its subsidiary in Myanmar. These laws were repealed by the Belgian law of August 5, 2003 on “serious violations of international human rights”, which also provided a procedure for terminating certain proceedings that were underway. In this framework, the BelgianCour de cassationterminated the proceedings against TOTAL in a decision dated June 29, 2005. The plaintiffs’ request to withdraw this decision was rejected by theCour de cassationon March 28, 2007. Despite this decision, the Belgian Ministry of Justice asked the Belgian federal prosecutor to request that the investigating judge reopen the case. The Belgian federal prosecutor decided to submit the admissibility of this request to the Court of Appeal of Brussels. In its decision of March 5, 2008, the Court of Appeal confirmed the termination of the proceedings against TOTAL, its Chairman and the former president of its subsidiary, based on the principle of res judicataapplying to the Cour de cassation’scassation’s decision of June 29, 2005. The plaintiffs appealed the decision of March 5, 2008. On October 29, 2008, the Cour de cassationrejected the plaintiffs’ appeal, thus ending definitively the proceedings. TOTAL has always maintained that the accusations made against the Company and its management arising out of the activities of its subsidiary in Myanmar were without substance as a matter of fact and as a matter of law. In a threatened class action proceeding in the United States, TOTAL, together with approximately 100 other multinational companies, is the subject of accusations by certain South African citizens who alleged that their human rights were violated during the era of apartheid by the army, the police or militias, and who consider that these companies were accomplices in the actions by the South African authorities at the time. The claims against the companies named in the class action, which were not officially brought against TOTAL, were dismissed by a federal judge in New York. The plaintiffs appealed this dismissal and, after a procedural hearing on November 3, 2008, decided to remove TOTAL from the list of companies against which it was bringing claims. In 2003, the United States Securities and Exchange Commission (SEC) followed by the Department of Justice (DoJ) issued a non-public formal order directing a privatean investigation in the matter of certain oil companies (including, among others, TOTAL), in connection with the pursuit of business in Iran.Iran, by certain oil companies including, among others, TOTAL. The inquiry concerns an agreement concluded by the Company with a consultant concerning a gas field in Iran
123
and aims to verify whether certain payments made under this agreement would have benefited Iranian officials in violation of the Foreign Corrupt Practices Act (FCPA) and the Company’s accounting obligations. Investigations are still pending and the Company is cooperating with the SEC and the DoJ. In 2006,2010, the Company opened talks with U.S. authorities, without any acknowledgement of facts, to consider anout-of-court settlement. Generally,out-of-court settlements with U.S. authorities include payment of fines and the obligation to improve internal compliance systems or other measures. In this same case, a judicial inquiry related to TOTAL was initiated in France.France in 2006. In 2007, the Company’s Chief Executive Officer was placed under formal investigation in relation to this inquiry, as the former President of the Middle East department of the Group’s Exploration & Production division. The inquiry concerns an agreement concluded by the Group that relates to the South Pars gas field and allegations that certain payments were made under this agreement to Iranian officials in connection with contracts entered into between the Group and the National Iranian Oil Company (NIOC). The Company has not been notified of any significant developments in the proceedings since the formal investigation was launched. The Company believes that the negotiation and execution of the agreement did not violate any applicable laws or applicable international conventions. However,
At this point, the Company cannot excludedetermine when these investigations will terminate, and cannot predict their results, or the possibilityoutcome of the talks that additional procedures may behave been initiated, with respector the costs of a potentialout-of-court settlement. Resolving this case is not expected to this matter.have a significant impact on the Group’s financial situation or any impact on its future planned operations. As part of an investigation led by the Prosecutor of the Republic of the Potenza court, Total Italia isand certain Group’s employees are the subject of an investigation related to certain calls for tenders that itTotal Italia made for the preparation and development of anthe Tempa Rossa oil field. On February 16, 2009, as a preliminary measure before the proceedings go before the court, the preliminary investigation judge of Potenza served notice to Total Italia of a decision that would suspend the concession for this field for one year. Total Italia has appealed the decision by the preliminary investigation judge before the Court of Appeal of Potenza. In a decision handed down ondated April 8, 2009, the Court reversed the suspension of the Gorgoglione concession and appointed for one year, i.e.until February 16, 2010, a judicial administrator to supervise the operations related to the development of the concession, allowing the Tempa Rossa project to continue. In January 2010,
The criminal investigation was closed in the Prosecutorfirst half of 2010. The preliminary hearing judge, who will decide whether the Potenzacase shall be returned to the Criminal Court filed for a notice to closebe judged on the criminal investigation.Since in January 1,merits, held the first hearing on December 6, 2010. The next hearing is scheduled during the first half of 2011.
In 2010, Total Italia’s exploration and production operations have beenwere transferred to Total E&P Italia.Italia and refining and marketing operations were merged with those of Erg Petroli. Several countries have commencedlaunched investigations concerning possible violations related to the United Nations (UN) “Oil-for-Food”Oil-for-Food program in Iraq. Pursuant to a French criminal investigation, certain current or former Group employees were placed under formal criminal investigation for possible charges as accessories to the misappropriation of corporate assets and as accessories to the corruption of foreign public agents. The Chairman and Chief Executive Officer of the Company, formerly presidentPresident of the Group’s Exploration & Production division, was also placed under formal investigation in October 2006. In 2007, the criminal investigation was closed and the case was transferred to the Prosecutor’s office. In 2009, the Prosecutor’s office recommended dismissingto the investigating judge that the case for allagainst the Group’s current and former employees and for theTOTAL’s Chairman and Chief Executive Officer. Officer not be pursued. In early 2010, despite the advicerecommendation of the Prosecutor’s office, a new investigating judge, having taken over the case, decided to placeindict TOTAL S.A. under formal investigation with respect toon bribery charges as well as complicity and influence peddling. This formal investigation has been pronouncedThe indictment was brought eight years after the beginning of the investigation without any new evidence being added to the affair. In October 2010, the Prosecutor’s office recommended to the investigating judge that the case against TOTAL S.A. the Group’s current and former employees and TOTAL’s Chairman and Chief Executive Officer not be pursued. The investigating judge’s decision on this matter is pending. The Company believes that its activities related to the “Oil-for-Food”Oil-for-Food program have been in compliance with this program, as organized by the UN in 1996. The VolkerVolcker report released by the independent investigating committee set up by the UN had discarded any bribery grievance within the framework of the “Oil-For-Food” program.Oil-For-Food program with respect to TOTAL. Blue Rapid and the Russian Olympic Committee — Russian regions and Interneft Blue Rapid, a Panamanian company, and the Russian Olympic Committee filed a claim for damages with the Paris Commercial Court against Elf Aquitaine concerning the withdrawal of one of its withdrawalsubsidiaries from an exploration and
124
production project in Russia that was negotiated in the early 1990s. Elf Aquitaine believes this claim to be unfounded. On January 12, 2009, the Commercial Court of Paris rejected Blue Rapid’s claim and found that the Russian Olympic Committee did not have standing in the matter. This decision has been appealed. The hearings are expected to be held during the first half of 2011. In connection with the same facts, and fifteen years after the termination of this exploration and production project, a Russian company and two regions of the Russian Federation have launched an arbitration procedure against a former subsidiary of Elf Aquitaine that was liquidated in 2005, claiming damages of an unspecified amount at this stage of the procedure. The Group considers this claim to be unfounded. The Group has reserved its rights to take any actionsand/or measures that would be appropriate to defend its interests. The Company has paid dividends on its share capital in each year since 1946. Future dividends will depend on the Company’s earnings, financial condition and other factors. The payment and amount of dividends are subject to the recommendation of the Board of Directors and resolution by the Company’s shareholders’shareholders at the annual shareholders’ meeting. Since 2004, the Company has paid an interim dividend in November and the remainder after the Shareholders’ Meeting held in May of each year. The 2010 interim dividend and the remainder will still be paid in compliance with this policy. The Board of Directors met on July 29, 2010, and approved a 2010 interim dividend of €1.14 per share. The ex-dividend date for the interim dividend on Euronext Paris was November 12, 2010 and the payment date was November 17, 2010. For 2010, TOTAL plans to continue its dividend policy by proposing a dividend of €2.28 per share at the 2009Shareholders’ Meeting on May 13, 2011, including a remainder of €1.14 per share, with an ex-dividend date on May 23, 2011, and a payment on May 26, 2011. This €2.28 per share dividend is stable compared to the previous year. Over the past five fiscal year,years, the dividend has increased by an average of 5.1%(1) per year. On October 28, 2010, the Board of Directors has proposeddecided to change its interim dividend policy and to adopt a new policy based on quarterly dividend of€2.28 per share. This proposed dividend will be voted onpayments. Pending the approval by the shareholders’ meetingBoard of Directors for the interim dividends and by the shareholders at the Shareholders’ Meeting for the accounts and the final dividend, the calendar for the interim quarterly dividends and the final dividend for 2011 should be as follows: September 19, 2011; December 19, 2011; March 19, 2012; and June 18, 2012. The provisionalex-dividend dates above relate to be heldthe TOTAL shares traded on May 21, 2010. An interim dividend of€1.14 per share was paid on November 18, 2009. If approved, the balance of€1.14 per share will be paid on June 1, 2010.Euronext Paris. Dividends paid to holders of ADRs will be subject to a charge by the Depositary for any expenses incurred by the Depositary in the conversion of euro to dollars. See “Item 10. Additional Information — Taxation”, for a summary of certain U.S. federal and French tax consequences to holders of shares and ADRs. In February 2011, TOTAL signed an agreement to dispose of its 48.83% interest in CEPSA. The transaction is conditioned on obtaining all requisite approvals. In early March 2011, the Group also announced the signature of two agreements on principle with the Russian Company Novatek and its major shareholders. For a further description of significant changes that have occurred since the date of the Company’s Consolidated Financial Statements, see “Item 4. Information on the Company” and “Item 5. Operating and Financial Review and Prospects”, which include descriptions of certain recent 20102011 activities. ITEM 9. THE OFFER AND LISTING The principal trading market for the shares is the Euronext Paris exchange in France. The shares are also listed on Euronext Brussels and the London Stock Exchange. Offer and listing details Trading on Euronext Paris Official trading of listed securities on Euronext Paris, including the shares, is transacted through French investment service providers that are members of Euronext Paris and takes place continuously on each business day in Paris from 9:00 a.m. to 5:30 p.m. (Paris time), with a fixing of the closing price at 5:35 p.m. Euronext Paris may suspend or resume trading in a security listed on Euronext Paris, if the quoted price of the security exceeds certain price limits defined by the regulations of Euronext Paris. The markets of Euronext Paris settle and transfer ownership three trading days after a transaction (T+3). (1) This increase does not take into account the Arkema share allotment right granted on May 18, 2006.
125
Highly liquid shares, including those of the Company, are eligible for deferred settlement ( Service de Règlement Différé— SRD). Payment and delivery for shares under the SRD occurs on the last trading day of each month. Use of the SRD service requires payment of a commission. Under this system, the determination date for settlement on the following month occurs on the fifth trading day prior to the last trading day (inclusive) of each month. In France, the shares are included in the principal index published by Euronext Paris (the “CAC 40 Index”). The CAC 40 Index is derived daily by comparing the total market capitalization of 40 stocks traded on Euronext Paris to the total market capitalization of the stocks that made up the CAC 40 Index on December 31, 1987. Adjustments are made to allow for expansion of the sample due to new issues. The CAC 40 Index indicates trends in the French stock market as a whole and is one of the most widely followed stock price indices in France. In the UK, the shares are listed in both the FTSE Eurotop 100 and FTSEurofirst 300 index. As a result of the creation of Euronext, the shares are included in Euronext 100, the index representing Euronext’s blue chip companies based on market capitalization. The shares are also included in the Dow Jones Stoxx 50 and Dow Jones Euro Stoxx 50, blue chip indices comprised of the fifty most highly capitalized and most actively traded equities throughout Europe and within the European Monetary Union, respectively. Since June 2000, the shares have been included in the Dow Jones Global Titans Index which consists of fifty global companies selected based on market capitalization, book value, assets, revenue and earnings. Pursuant to the vote of the May 12, 2006, shareholders’ meeting approving TOTAL’sfour-for-one stock split, each shareholder received on May 18, 2006, four new TOTAL shares, par value of€2.50 €2.50 per share, in return for each old share with a par value of€10. €10. The table below sets forth, for the periods indicated, the reported high and low quoted prices in euros for the currently outstanding shares on Euronext Paris. Data prior to May 18, 2006, reported in this table has been adjusted to reflect this stock split by dividing stock prices by four. The May 12, 2006, shareholders’ meeting also approved the spin-off of Arkema and the allocation, as of May 18, 2006, of one Arkema share allocation right for each TOTAL share with a par value of€10, €10, ten allocation rights entitling the holder to one Arkema share. Data prior to May 18, 2006, reported in the third and fourth columns of this table are adjusted in order to consider Arkema’s share allocation right partition. | | | | | | | | | | | | Price per share (€) | | High | | | Low | | | High adjusted | | Low adjusted | 2005 | | 57.28 | | | 39.50 | | | 56.54 | | 38.99 | 2006 | | 58.15 | | | 46.52 | | | 57.40 | | 46.52 | 2007 | | 63.40 | | | 48.33 | | | — | | — | 2008 | | 59.50 | | | 31.52 | | | — | | — | First Quarter | | 59.50 | | | 45.45 | | | — | | — | Second Quarter | | 58.25 | | | 46.35 | | | — | | — | Third Quarter | | 54.24 | | | 40.50 | | | — | | — | Fourth Quarter | | 44.55 | | | 31.52 | | | — | | — | | | | | | 2009 | | 45.785 | | | 34.25 | | | — | | — | First Quarter | | 42.465 | | | 34.25 | | | — | | — | Second Quarter | | 42.455 | | | 34.72 | | | — | | — | Third Quarter | | 42.45 | | | 35.75 | | | — | | — | September | | 42.45 | | | 38.91 | | | — | | — | Fourth Quarter | | 45.785 | | | 39.005 | | | — | | — | October | | 43.11 | | | 39.005 | | | — | | — | November | | 43.495 | | | 40.50 | | | — | | — | December | | 45.785 | | | 41.50 | | | — | | — | | | | | | 2010 (through February 28) | | 46.735 | | | 40.05 | | | — | | — | January | | 46.735 | | | 41.215 | | | — | | — | February | | 43.165 | | | 40.05 | | | — | | — |
| | | | | | | | | | | | | | | | | | | Price per share (€) | | High | | | Low | | | High adjusted | | | Low adjusted | | | 2006 | | | 58.15 | | | | 46.52 | | | | 57.40 | | | | 46.52 | | | 2007 | | | 63.40 | | | | 48.33 | | | | — | | | | — | | | 2008 | | | 59.50 | | | | 31.52 | | | | — | | | | — | | | 2009 | | | 45.785 | | | | 34.25 | | | | — | | | | — | | | First Quarter | | | 42.465 | | | | 34.25 | | | | — | | | | — | | | Second Quarter | | | 42.455 | | | | 34.72 | | | | — | | | | — | | | Third Quarter | | | 42.45 | | | | 35.75 | | | | — | | | | — | | | Fourth Quarter | | | 45.785 | | | | 39.005 | | | | — | | | | — | | 2010 | | | 46.735 | | | | 35.655 | | | | — | | | | — | | | First Quarter | | | 46.735 | | | | 40.05 | | | | — | | | | — | | | Second Quarter | | | 44.625 | | | | 36.21 | | | | — | | | | — | | | Third Quarter | | | 41.00 | | | | 35.655 | | | | — | | | | — | | | September | | | 39.67 | | | | 36.77 | | | | — | | | | — | | | Fourth Quarter | | | 41.275 | | | | 36.91 | | | | — | | | | — | | | October | | | 39.72 | | | | 37.52 | | | | — | | | | — | | | November | | | 41.275 | | | | 36.91 | | | | — | | | | — | | | December | | | 40.79 | | | | 37.195 | | | | — | | | | — | | 2011 (through February 28) | | | 44.47 | | | | 40.01 | | | | — | | | | — | | | January | | | 43.575 | | | | 40.01 | | | | — | | | | — | | | February | | | 44.47 | | | | 42.325 | | | | — | | | | — | |
Trading on the New York Stock Exchange ADRs have been listed on the New York Stock Exchange since October 25, 1991. The Bank of New York Mellon serves as depositary with respect to the ADRs traded on the New York Stock Exchange. The table below sets forth, for the periods indicated, the reported high and low prices quoted in dollars for the currently outstanding ADRs on the New York Stock Exchange. After thefour-for-one stock split, which was approved by the shareholders’ meeting on May 12, 2006, and effective on May 18, 2006, and after the split of the ADRs by two on May 23, 2006, one ADR corresponds to one TOTAL share. Data prior to May 23, 2006, reported in this table
126
has been adjusted to take into account this stock split by dividing ADR prices by two. The May 12, 2006, shareholders’ meeting also approved the spin-off of Arkema and the allocation, as from May 18, 2006, of one Arkema share allocation right for each TOTAL share with a par value of€10, €10, ten allocation rights entitling the holder to one Arkema share. Data prior to May 23, 2006, reported in the third and fourth columns of this table has been adjusted in order to reflect Arkema’s share allocation right partition. | | | | | | | | | | | Price Per ADR ($) | | High | | Low | | | High adjusted | | Low adjusted | 2005 | | 68.97 | | 51.87 | | | 67.86 | | 51.03 | 2006 | | 73.46 | | 58.06 | | | 73.46 | | 58.06 | 2007 | | 87.34 | | 63.89 | | | — | | — | 2008 | | 91.34 | | 42.60 | | | — | | — | First Quarter | | 86.90 | | 67.11 | | | — | | — | Second Quarter | | 91.34 | | 73.09 | | | — | | — | Third Quarter | | 83.99 | | 57.19 | | | — | | — | Fourth Quarter | | 60.90 | | 42.60 | | | — | | — | | | | | | 2009 | | 65.98 | | 42.88 | | | — | | — | First Quarter | | 57.85 | | 42.88 | | | — | | — | Second Quarter | | 59.93 | | 45.02 | | | — | | — | Third Quarter | | 62.43 | | 49.78 | | | — | | — | September | | 62.43 | | 55.53 | | | — | | — | Fourth Quarter | | 65.98 | | 57.05 | | | — | | — | October | | 64.65 | | 57.05 | | | — | | — | November | | 64.50 | | 59.37 | | | — | | — | December | | 65.98 | | 60.62 | | | — | | — | | | | | | 2010 (through February 28) | | 67.52 | | 54.01 | | | — | | — | January | | 67.52 | | 57.38 | | | — | | — | February | | 59.60 | | 54.01 | | | — | | — |
| | | | | | | | | | | | | | | | | | | Price Per ADR ($) | | High | | | Low | | | High adjusted | | | Low adjusted | | | | | 2006 | | | 73.46 | | | | 58.06 | | | | 73.46 | | | | 58.06 | | | 2007 | | | 87.34 | | | | 63.89 | | | | — | | | | — | | | 2008 | | | 91.34 | | | | 42.60 | | | | — | | | | — | | | 2009 | | | 65.98 | | | | 42.88 | | | | — | | | | — | | | First Quarter | | | 57.85 | | | | 42.88 | | | | — | | | | — | | | Second Quarter | | | 59.93 | | | | 45.02 | | | | — | | | | — | | | Third Quarter | | | 62.43 | | | | 49.78 | | | | — | | | | — | | | Fourth Quarter | | | 65.98 | | | | 57.05 | | | | — | | | | — | | 2010 | | | 67.52 | | | | 43.07 | | | | — | | | | — | | | First Quarter | | | 67.52 | | | | 54.01 | | | | — | | | | — | | | Second Quarter | | | 60.24 | | | | 43.07 | | | | — | | | | — | | | Third Quarter | | | 54.14 | | | | 44.43 | | | | — | | | | — | | | September | | | 52.46 | | | | 48.15 | | | | — | | | | — | | | Fourth Quarter | | | 58.06 | | | | 48.08 | | | | — | | | | — | | | October | | | 55.50 | | | | 51.20 | | | | — | | | | — | | | November | | | 58.06 | | | | 48.08 | | | | — | | | | — | | | December | | | 53.97 | | | | 49.03 | | | | — | | | | — | | 2011 (through February 28) | | | 61.44 | | | | 52.61 | | | | — | | | | — | | | January | | | 59.84 | | | | 52.61 | | | | — | | | | — | | | February | | | 61.44 | | | | 58.05 | | | | — | | | | — | |
ITEM 10. ADDITIONAL INFORMATION Memorandum and Articles of Association TOTAL S.A. is registered with the Nanterre Trade Register under the registration number 542 051 180. The Company’s purpose can be found in Article 3 of its bylaws ( statuts). Generally, the Company may engage in all activities relating to: (i) the exploration and extraction of mining deposits and the performance of industrial refining, processing, and trading of these materials, as well as their derivatives and by-products; (ii) the production and distribution of all forms of energy; (iii) the chemicals, rubber and health industries; (iv) the transportation and shipping of hydrocarbons and other products or materials relating to the Company’s business purpose; and (v) all financial, commercial, and industrial operations and operations relating to any fixed or unfixed assets and real estate, acquisitions of interests or holdings in any business or company that may relate to any of the above-mentioned purposes or to any similar or related purposes, of such nature as to promote the Company’s extension or its development. Director IssuesCompensation
Directors receive attendance fees, the maximum aggregate amount of which, determined by the shareholders acting at a shareholders’ meeting, remains in effect until a new decision is made. The Board of Directors may apportion this amount among its members in whatever way it considers appropriate. In addition, the Board may also grant its Chairman compensation. The number of directors of TOTAL who are acting in their own capacity or as permanent representatives of a legal entity and are over seventy years old may not exceed one-third of the number of directors in office at the end of the fiscal year. If such number is exceeded, the oldest Board member is automatically deemed to have resigned. Directors who are the permanent representative of a legal
127
person may not continue in office beyond their seventieth birthday. Currently, the duties of the Chairman of the Board automatically cease on his sixty-fifth birthday at the latest. At their meeting of May 15, 2009, the shareholders adopted an amendment of the bylaws pertaining to the rules relating to the nomination of the Chairman. The amendment allows the Board, as an exception to the currently applicable sixty-five year age limit, to appoint as Chairman of the Board for a period of up to two years a director who is more than sixty-five years old but less than seventy years old. Each director must own at least 1,000 shares of TOTAL during his or her term of office.office, except the director representing the employees shareholder who shall hold, either individually or through an investment trust governed byArticle L.214-40 of the Monetary & Financial Code (French FCPE), at least one share or a number of stocks in such investment trust amounting to at least one share. Directors are elected for a term of three years. In 2003, TOTAL amended its Articles of Incorporation to provide for the election of one director to represent employee shareholders. This director was appointed for the first time at the shareholders’ meeting held on May 14, 2004. The following is a summary of the material rights of holders of fully paid shares and is based on the bylaws of the Company and French Company Law as codified in Volume II (Livre II) of the French Commercial Code (referred to herein as the “French Company Law”). For more complete information, please read the bylaws of TOTAL S.A., a copy of which has been filed as an exhibit to this Annual Report. The Company may make dividend distributions to its shareholders from net income in each fiscal year, after deduction of the overhead and other social charges, as well as of any amortization of the business assets and of any provisions for commercial and industrial contingencies, as reduced by any loss carried forward from prior years, and less any contributions to reserves or amounts that the shareholders decide to carry forward. These distributions are also subject to the requirements of French Company Law and the Company’s bylaws. Under French Company Law, the Company must allocate 5% of its net profits in each fiscal year to a legal reserve fund until the amount in that fund is equal to 10% of the nominal amount of its share capital. The Company’s bylaws provide that its shareholders may decide to allocate all or a part of any distributable profits among special or general reserves, to carry them forward to the next fiscal year as retained earnings, or to allocate them to the shareholders as dividends. The bylaws provide that the remaindershareholders’ meeting held to approve the financial statements for the financial year may decide to grant an option to each shareholder between payment of any distributable profits shall be distributed among the shareholders in the form of dividends, eitherdividend in cash and payment in shares with respect to all or in shares.part of the dividend or interim dividends.Under French Company Law, the Company must distribute dividends to its shareholders pro rata, according to their shareholdings. Dividends are payable to holders of outstanding shares on the date fixed by the shareholders’ meeting approving the distribution of dividends or, in the case of interim dividends, on the date fixed by the Company’s Board of Directors at the meeting that approves the distribution of interim dividends. Under French Company Law,law, dividends not claimed within five years of the date of payment revert to the French State. Each shareholder of the Company is entitled to the number of votes he or she possesses, or for which he or she holds proxies. According to French Company Law, voting rights may not be exercised in respect of fractional shares. According to the Company’s bylaws, each registered share that is fully paid and registered in the name of the same shareholder for a continuous period of at least two years is granted a double voting right after such two-year period. Upon capital increase by capitalization of reserves, profits or premiums on shares, a double voting right is granted to each registered share allocated to a shareholder relating to previously existing shares that already carry double voting rights. The double voting right is automatically canceled when the share is converted into a bearer share or when the share is transferred, unless the transfer is due to inheritance, division of community property between spouses, or a donation during the lifetime of the shareholder to the benefit of a spouse or relatives eligible to inherit.
128
French Company Law limits a shareholder’s right to vote notably in the following circumstances: shares held by the Company or entities controlled by the Company, which cannot be voted;
shares held by shareholders making a contribution in-kind to the Company, which cannot be voted with respect to resolutions relating to such in-kind contributions; and
| | | • | shares held by the Company or by entities controlled by the Company under certain conditions, which cannot be voted; | | • | shares held by shareholders making a contribution in-kind to the Company, which cannot be voted with respect to resolutions relating to such in-kind contributions; and | | • | shares held by interested parties, which cannot be voted with respect to resolutions relating to such shareholders. |
shares held by interested parties, which cannot be voted with respect to resolutions relating to such shareholders.
Under the Company’s bylaws, the voting rights exercisable by a shareholder, directly, indirectly or by proxy, at any shareholders’ meeting are limited to 10% of the total number of voting rights attached to the shares on the date of such shareholders’ meeting. This 10% limitation may be increased by taking into account double voting rights held directly or indirectly by the shareholder or by proxy, provided that the voting rights exercisable by a shareholder at any shareholders’ meeting may never exceed 20% of the total number of voting rights attached to the shares. According to the Company’s bylaws, these limitations on voting lapse automatically if any individual or entity acting alone or in concert with an individual or entity holds at least two-thirds of the total number of shares as a result of a tender offer for 100% of the shares. In the event the Company is liquidated, its assets remaining after payment of its debts, liquidation expenses and all of its other remaining obligations will first be distributed to repay the nominal value of the shares. After these payments have been made, any surplus will be distributed pro rata among the holders of shares based on the nominal value of their shareholdings. Shareholders are not liable to the Company for further capital calls on their shares. Preferential subscription rights Holders of shares have preferential rights to subscribe on a pro rata basis for additional shares issued for cash. Shareholders may waive their preferential rights, either individually or, under certain circumstances, as a specifically named group at an extraordinary shareholders’ meeting. During the subscription period relating to a particular offering of shares, shareholders may transfer their preferential subscription rights that they have not previously waived. Under French Company Law, the Company may increase its share capital only with the approval of its shareholders at an extraordinary shareholders’ meeting (or with a delegation of authority from its shareholders). There are two methods to increase share capital: (i) by issuing additional shares, including the creation of a new class of securities and (ii) by increasing the nominal value of existing shares. The Company may issue additional shares for cash or for assets contributed in kind, upon the conversion of debt securities, or other securities giving access to its share capital, that it may have issued, by capitalization of its reserves, profits or issuance premiums or, subject to certain conditions, in satisfaction of its indebtedness. Under French Company Law, the Company may decrease its share capital only with the approval of its shareholders at an extraordinary shareholders’ meeting (or with a delegation of authority from its shareholders). There are two methods to reduce share capital: (i) by reducing the number of shares outstanding, and (ii) by decreasing the nominal value of existing shares. The conditions under which the share capital may be reduced will vary depending upon whether the reduction is attributable to losses. The Company may reduce the number of outstanding shares either by an exchange of shares or by the repurchase and cancellation of its shares. If the reduction is attributable to losses, shares are cancelled through offsetting the Company’s losses. Any decrease must meet the requirements of French Company Law, which states, among other things, that all the holders of shares in each class of shares must be treated equally, unless the affected shareholders otherwise agree. The Company has only one class of shares, par value€2.50 €2.50 per share. Shares may be held in either bearer or registered form. Shares traded on Euronext Paris are cleared and settled through Euroclear France. The Company may use any lawful means to identify holders of shares, including a procedure known astitres au porteur identifiableaccording to which Euroclear France will, upon the Company’s request, disclose to the Company the name, nationality, address and number of shares held by each shareholder in bearer form. The information may only be requested by the Company and may not be communicated to third parties.
129
Under French Company Law concerningand since the “dematerialization” of securities, the ownership rights of shareholders are represented by book entries instead of share certificates (other than certificates representing French securities which are outstanding exclusively outside the territory of France and are not held by French residents). Registered shares are entered into an account maintained by the Company or by a representative that it has nominated, while shares in bearer form must be held in an account maintained by an accredited financial intermediary on the shareholder’s behalf. For all shares in registered form, the Company maintains a share account with Euroclear France which is administered by BNP Paribas Securities Services. In addition, the Company maintains accounts in the name of each registered shareholder either directly or, at a shareholder’s request, through a shareholder’s accredited intermediary, in separate accounts maintained by BNP Paribas Securities Services on behalf of the Company. Each shareholder’s account shows the name and number of shares held and, in the case of shares registered through an accredited financial intermediary, the fact that they are so held. BNP Paribas Securities Services, as a matter of course, issues confirmations to each registered shareholder as to shares registered in a shareholder’s account, but these confirmations do not constitute documents of title. Shares held in bearer form are held and registered on the shareholder’s behalf in an account maintained by an accredited financial intermediary and are credited to an account at Euroclear France maintained by the intermediary. Each accredited financial intermediary maintains a record of shares held through it and will issue certificates of inscription for the shares that it holds. Transfers of shares held in bearer form only may be made through accredited financial intermediaries and Euroclear France. Cancellation of treasury shares After receiving authorization through a shareholders’ meeting, the Board of Directors of the Company may cancel treasury shares owned by the Company in accordance with French Company Law up to a maximum of 10% of the share capital within any period of twenty-four months. Description of TOTAL ShareCertificates The TOTAL share certificates are issued by Euroclear France. French law allows Euroclear France to create certificates representing French securities provided that these certificates are intended to be outstanding exclusively outside the territory of France and cannot be held by residents of France. Furthermore, TOTAL share certificates may not be held by a foreign resident in France, either personally or in the form of a bank deposit, but the coupons and rights may be exercised in France. Certificates for TOTAL shares are either in bearer form or registered in a securities trading account. Under Euroclear France regulations applicable to bearer stock certificates, TOTAL share certificates cannot be categorized as secondary securities, such as ADSs, issued by a foreign company to represent TOTAL shares. TOTAL share certificates have the characteristics of a bearer security, meaning they are: negotiable outside France;
transmitted by delivery; and
| | | • | negotiable outside France; | | • | transmitted by delivery; and | | • | fungible with TOTAL share certificates, which may be converted freely from bearer form to registration in an account. |
fungible with TOTAL share certificates, which may be converted freely from bearer form to registration in an account.
All rights attached to TOTAL shares must be exercised directly by the bearer of the TOTAL share certificates.
130
Share Capital History | | | Fiscal 2008 | | | | April 25, 2008 | | Certification of the subscription to 4,870,386 new shares, par value €2.50, as part of the capital increase reserved for Group employees approved by the Board of Directors on November 6, 2007, raising the share capital by €12,175,965, from €5,988,830,242.50 to €6,001,006,207.50. | | July 31, 2008 | | Reduction of the share capital from €6,001,006,207.50 to €5,926,006,207.50, through the cancelation of 30,000,000 treasury shares, par value €2.50. | | January 13, 2009 | | Certification of the issuance of 1,405,591 new shares, par value €2.50 per share, between January 1 and December 31, 2008, raising the share capital by €3,513,977.50 from €5,926,006,207.50 to €5,929,520,185 (of which 1,178,167 new shares issued through the exercise of the Company’s stock options and 227,424 new shares through the exchange of 37,904 shares of Elf Aquitaine stock resulting from the exercise of Elf Aquitaine stock options and eligible for a guaranteed exchange for TOTAL shares). | Fiscal 2009 | | | | July 30, 2009 | | Reduction of the share capital from €5,929,520,185 to €5,867,520,185, through the cancelation of 24,800,000 treasury shares, par value €2.50. | | January 12, 2010 | | Certification of the issuance of 1,414,810 new shares, par value €2.50 per share, between January 1 and December 31, 2009, raising the share capital by €3,537,025 from €5,867,520,185 to €5,871,057,210 (of which 934,780 new shares issued through the exercise of the Company’s stock options and 480,030 new shares through the exchange of 80,005 shares of Elf Aquitaine stock resulting from the exercise of Elf Aquitaine stock options and eligible for a guaranteed exchange for TOTAL shares). | Fiscal 2010 | | | | January 12, 2011 | | Certification of the issuance of 1,218,047 new shares, par value €2.50, through the exercise of the Company’s stock options between January 1 and December 31, 2010, raising the share capital by €3,045,117.50 from €5,871,057,210 to €5,874,102,327.50. |
French companies may hold either ordinary or extraordinary shareholders’ meetings. Ordinary shareholders’ meetings are required for matters that are not specifically reserved by law to extraordinary shareholders’ meetings: the election of the members of the Board of Directors, the appointment of statutory auditors, the approval of a management report prepared by the Board of Directors, the approval of the annual financial statements, the declaration of dividends and the issuance of bonds. Extraordinary shareholders’ meetings are required for approval of amendments to a company’s bylaws, modification of shareholders’ rights, mergers, increases or decreases in share capital, including a waiver of preferential subscription rights, the creation of a new class of shares, the authorization of the issuance of investment certificates or securities convertible, exchangeable or redeemable into shares and for the sale or transfer of substantially all of a company’s assets. The Company’s Board of Directors is required to convene an annual shareholders’ meeting for approval of the annual financial statements. This meeting must be held within six months of the end of the fiscal year. However, the president of the Tribunal de Commerceof Nanterre, the local French commercial court, may grant an extension of this six-month period. The Company may convene other ordinary and extraordinary meetings at any time during the year. Meetings of shareholders may be convened by the Board of Directors or, if it fails to call a meeting, by the Company’s statutory auditors or by a court-appointed agent. A shareholder or shareholders holding at least 5% of the share capital, the employee committee or another interested party under certain exceptional circumstances, may request that the court appoint an agent. The notice of meeting must state the agenda for the meeting. French Company Law requires that a preliminary notice of a listed company’s shareholders’ meeting be published in the Bulletin des annonces légales obligatoires(“BALO”) at least thirty-five days prior to the meeting (or fifteen days in the event the Company is subject to a tender offer and the Company calls a shareholders’ meeting to approve measures, the implementation of which would be likely to cause such tender offer to fail). The preliminary notice must first be sent to the French Financial Markets Authority (Autorité des marchés financiers) (“AMF”) with an indication of the date it is to be published in the BALO. The preliminary notice must include the agenda of the meeting and the proposed resolutions that will be submitted to a shareholders’ vote. Within ten days of publication, one One or more shareholders holding a certain percentage of the Company’s share capital determined on the basis of a formula related to capitalization may propose to add on the shareholders’ meeting’s agenda additional resolutions.resolutions to be submitted to a shareholders’ voteand/or matters without a shareholders’ vote (points), provided that the text of additional resolutions or matters be received by the Company on at least the twenty-fifth day preceding the meeting (or at least the tenth day in the event the
131
Company is subject to a tender offer and the Company calls a shareholders’ meeting to approve measures which, if implemented, would likely cause such tender offer to fail). The demand of the shareholders’ that are eligible to require for the inscription of matters on the meeting agenda has to be duly motivated. French Company Law also requires that the preliminary notice of a listed company’s shareholders’ meeting, as well as the additional resolutionsand/or matters presented by the shareholders under the terms and conditions prescribed under French law, be published on the Company’s Web site during a period starting at the latest on the twenty-first day prior to the meeting (or the fifteenth day in the event the Company is subject to a tender offer and the Company calls a shareholders’ meeting to approve measures which, if implemented, would likely cause such tender offer to fail). Notice of a shareholders’ meeting is sent by mail at least fifteen days (or six days in the event of shareholders’ meetings convened in the situation where the Company was subject to a tender offer to approve measures, the implementation of which would be likely to cause such tender offer to fail) before the meeting to all holders of registered shares who have held their shares for more than one month. However, in the case where the original meeting was adjourned because a quorum was not met, this time period is reduced to sixten days (or four days in the event of shareholders’ meetings convened in the situation where the Company were subject to a tender offer to approve measures, the implementation of which would be likely to cause such tender offer to fail). Attendance and the exercise of voting rights at both ordinary and extraordinary shareholders’ meetings are subject to certain conditions. Pursuant to French Company Law, participation at shareholders’ meetings is subject to the condition that an entry of registration has been made, for the owner of registered shares, in the records maintained by the Company, or, for the owner of bearer shares, in the records of an authorized intermediary, in each case at 12:00 a.m. (Paris time) on the third trading day preceding the shareholders’ meeting. For the owner of bearer shares the registration is evidenced by a certificate of participation ((attestation de participation)participation) issued by the authorized intermediary. Subject to the above restrictions, all of the Company’s shareholders have the right to participate in the Company’s shareholders’ meetings, either in person or by proxy. NoEach shareholder may delegate voting authority to another person exceptshareholder, the shareholder’s spouse, or another shareholder or, ifthe companion with whom the shareholder is nothas registered a resident of France, bycivil partnership (PACS). Every shareholder may also delegate voting authority to any other individual or legal entity he or she may choose, provided among other things, that a registered intermediary in conformity with applicable regulations.written proxy be provided to the Company. Shareholders may vote, either in person, by proxy, or by mail, and each is entitled to as many votes as he or she possesses or as many shares as he or she holds proxies for.for, subject to the voting rights limitations provided by the Company’s bylaws. If the shareholder is a legal entity, it may be represented by a legal representative. A shareholder may grant a proxy to the Company by returning a blank proxy form. In this last case, the chairman of the shareholders’ meeting may vote the shares in favor of all resolutions proposed or agreed to by the Board of Directors and against all others. The Company will send proxy forms to shareholders upon request. In order to be counted, proxies must be received at least one day prior to the shareholders’ meeting at the Company’s registered office or at another address indicated in the notice convening the meeting. Under French Company Law, shares held by entities controlled directly or indirectly by the Company are not entitled to voting rights. There is no requirement that a shareholder have a minimum number of shares in order to be able to attend or be represented at shareholders’ meetings. Under French Company Law, a quorum requires the presence, in person or by proxy, including those voting by mail, of shareholders having at least 20% of the shares entitled to vote in the case of (i) an ordinary shareholders’ meeting, (ii) an extraordinary meeting where shareholders are voting on a capital increase by capitalization of reserves, profits or share premium, or (iii) an extraordinary general meeting of shareholders convened in the situation where the Company is subject to a tender offer in order to approve an issuance of warrants allowing the subscription, at preferential conditions, of shares of the Company and the free allotment of such warrants to existing shareholders of the Company, the implementation of which would be likely to cause such tender offer to fail, or 25% of the shares entitled to vote in the case of any other extraordinary shareholders’ meeting. If a quorum is not present at any meeting, the meeting is adjourned. There is no quorum requirement when an ordinary shareholders’ meeting is reconvened, but the reconvened meeting may consider only questions which were on the agenda of the adjourned meeting. When an extraordinary shareholders’ meeting is reconvened, the quorum required is 20% of the shares entitled to vote, except where the reconvened meeting is considering capital increases through capitalization of reserves, profits or share premium. For these matters, no quorum is required at the reconvened meeting. If a quorum is not present at a reconvened meeting requiring a quorum, then the
132
meeting may be adjourned for a maximum of two months. At an ordinary shareholders’ meeting, approval of any resolution requires the affirmative vote of a simple majority of the votes of the shareholders present or represented by proxy. The approval of any resolution at an extraordinary shareholders’ meeting requires the affirmative vote of a two-thirds majority of the votes cast, except that (i) any resolution to approve a capital increase by capitalization of reserves profits, or share premium, or (ii) any resolution, in the situation where the Company is subject to a tender offer in order to approve an issuance of warrants allowing the subscription, at preferential conditions, of shares of the Company and the free allotment of such warrants to existing shareholders of the Company, the implementation of which would be likely to cause such tender offer to fail, only requires the affirmative vote of a simple majority of the votes cast. Notwithstanding these rules, a unanimous vote is required to increase shareholders’ liabilities. Abstention from voting by those present or represented by proxy is counted as a vote against any resolution submitted to a vote. As set forth in the Company’s bylaws, shareholders’ meetings are held at the Company’s registered office or at any other location specified in the written notice. Requirements for temporary transfer of securities French Company Law provides that any legal entity or individual (with the exception of those described inparagraph IV- 3°of Article L.233-7 of the French Commercial Code) holding alone or in concert a number of shares representing more than 0.5% of the Company’s voting rights as a result of one or several temporary stock transfers or assimilated transactions within the meaning of Article L.225-126 of the French Commercial Code is required to inform the Company and the AMF of the number of the shares that are temporarily possessed no later than the third business day preceding the shareholders’ meeting at midnight. If such declaration is not made, the shares bought under any of the above described temporary stock transfers or assimilated transactions shall be deprived of their voting rights at the relevant shareholders’ meeting and at any shareholders’ meeting that would be held until such shares are transferred again or returned. Ownership of shares by non-French persons There is no limitation on the right of non-resident or foreign shareholders to own securities of the Company, either under French Company Law or under the bylaws of the Company. Requirement for holdings exceeding certain percentages French Company Law provides that any individual or entity, acting alone or in concert with others, that holds, directly or indirectly, more than 5%, 10%, 15%, 20%, 25%, 30%, 33 1//3%, 50%, 662//3%, 90% or 95% of the outstanding shares or the voting rights(1) attached to the shares, or that increases or decreases its shareholding or voting rights by any of the above percentages must notify the Company by registered letter, with return receipt, within four business days of crossing that threshold, of the number of shares and voting rights it holds. An individual or entity must also notify the AMF, the self-regulatory organization that has general regulatory authority over the French stock exchanges and whose members include representatives of French stockbrokers, by registered letter, with return receipt, within four trading days of crossing that threshold. Any shareholder who fails to comply with these requirements will have its voting rights in excess of such thresholds suspended for a period of two years from the date such shareholder complies with the notification requirements and may have all or part of its voting rights suspended for up to five years by the commercial court at the request of the Company’s Chairman, any of the Company’s shareholders or the AMF. In addition, every shareholder who, directly or indirectly, acting alone or in concert with others, acquires ownership or control of shares representing 10%, 15%, 20% or 25% of the Company’s share capital must notify the Company and the AMF of its intentions for the six months following such an acquisition. Failure to comply with this notification of intentions will result in the suspension of the voting rights attached to the shares exceeding the applicable threshold held by the shareholder for a period of two years from the date on which the shareholder has cured such default and, upon a decision of the commercial court part or all the shares held by such shareholder may be suspended for up to five years.In addition, the Company’s bylaws provide that any person, whether a natural person or a legal entity, who comes to hold, directly or indirectly, 1% or more, or any multiple of 1%, of the Company’s share capital or voting rights or of securities that may include future voting rights (1) For purposes of shareholding threshold declarations, pursuant toArticle 223-11 of the General Regulation of the AMF, voting rights are calculated on the basis of all outstanding shares, whether or not these shares would have rights to vote at a shareholders’ meeting.
133
or future access to share capital or voting rights, must notify the Company by registered letter with return receipt requested, within 15 calendar days of crossing such threshold. Failure to comply with these notification provisions will result in the suspension of the voting rights attached to the shares exceeding this 1% threshold held by the shareholder if requested at a shareholders’ meeting by one or more shareholders holding shares representing at least 3% of the share capital. Any individual or legal entity whose direct or indirect holding of shares falls below each of the levels mentioned must also notify the Company in the manner and within the time limits set forth above. Subject to certain limited exemptions, any person, or persons acting in concert, owning in excess of 33 1//3% of the share capital or voting rights of the Company must initiate a public tender offer for the balance of the share capital, voting rights and securities giving access to such share capital or voting rights.There have been no material contracts (not entered into in the ordinary course of business) entered into by members of the Group since March 31, 2008.25, 2009. Under current French exchange control regulations, no limits exist on the amount of payments that TOTAL may remit to residents of the United States. Laws and regulations concerning foreign exchange controls do require, however, that an accredited intermediary must handle all payments or transfer of funds made by a French resident to a non-resident. This section generally summarizes the material U.S. federal income tax and French tax consequences of owning and disposing of shares and ADSs of TOTAL to U.S. Holders that hold their shares or ADSs as capital assets for tax purposes. A U.S. Holder is a beneficial owner of shares or ADSs that is (i) a citizen or resident of the United States for U.S. federal income tax purposes, (ii) a domestic corporation or other domestic entity treated as a corporation for U.S. federal income tax purposes, (iii) an estate whose income is subject to U.S. federal income tax regardless of its source, or (iv) a trust if a U.S. court can exercise primary supervision over the trust’s administration and one or more U.S. persons are authorized to control all substantial decisions of the trust. This section does not apply to members of special classes of holders subject to special rules, including: traders in securities that elect to use a mark-to-market method of accounting for their securities holdings;
1. | | | • | dealers in securities; | | • | traders in securities that elect to use aFor purposesmark-to-market method of shareholding threshold declarations, pursuant to Article 223-11accounting for their securities holdings; | | • | tax-exempt organizations; | | • | life insurance companies; | | • | persons liable for alternative minimum tax; | | • | persons that actually or constructively own 10% or more of the General Regulation of the AMF,share capital or voting rights are calculated onin TOTAL; | | • | persons that hold the basisshares or ADSs as part of all outstanding shares, whethera straddle or a hedging or conversion transaction; or | | • | persons whose functional currency is not these shares would have rights to vote at a shareholders’ meeting.the U.S. dollar. |
tax-exempt organizations;
life insurance companies;
persons liable for alternative minimum tax;
persons that actually or constructively own 10% or more of the share capital or voting rights in TOTAL;
persons that hold the shares or ADSs as part of a straddle or a hedging or conversion transaction; or
persons whose functional currency is not the U.S. dollar.
If a partnership holds ordinary shares or ADSs, the tax treatment of a partner will generally depend upon the status of the partner and upon the activities of the partnership. Partners of a partnership holding these ordinary shares or ADSs should consult their tax advisors as to the tax consequences of owning or disposing of ordinary shares or ADSs, as applicable. In addition, the discussion of the material French tax consequences is limited to U.S. Holders that (i) are residents of the United States for purposes of the Treaty (as defined below), (ii) do not maintain a permanent establishment or fixed base in France to which the shares or ADSs are attributable and through which the respective U.S. Holders carry on, or have carried on, a business (or, if the holder is an individual, performs or has performed independent personal services), and (iii) are otherwise eligible for the benefits of the Treaty in respect of income and gain from the shares or ADSs. In addition, this section is based in part upon the representations of the Depositary and the assumption that each obligation in the Deposit Agreement and any related agreement will be performed in accordance with its terms. This section is based on the Internal Revenue Code of 1986, as amended, its legislative history, existing and proposed regulations, published rulings and court decisions, and with respect to the description of the material French tax consequences, the laws of the Republic of France and French tax regulations, all as currently in effect, as well as on the Convention Between the United States and the Republic of France for the Avoidance of Double Taxation and the Prevention of Fiscal Evasion with respect to Taxes on Income and Capital dated August 31, 1994 as amended (the “Treaty”). These laws, regulations and the Treaty are subject to change, possibly on a retroactive basis.
134
This discussion is intended only as a descriptive summary and does not purport to be a complete analysis or listing of all potential tax effects of the ownership or disposition of the shares and ADSs and is not intended to substitute competent professional advice. Individual situations of holders of shares and ADSs may vary from the description made below. The following summary does not address the French tax treatment applicable to dividends transferred to so called “Non Cooperative Countries and Territories” within the meaning of the newSection 230-0A238-0 A of the French Tax Code. Holders are urged to consult their own tax advisoradvisors regarding the U.S. federal, state and local, and French and other tax consequences of owning and disposing shares or ADSs of TOTAL in their respective circumstances. In particular, a holder is encouraged to confirm whether the holder is a U.S. Holder eligible for the benefits of the Treaty with its advisor. The term “dividends” used in the following discussion means dividends within the meaning of applicable income tax treaties, or, where not defined by such treaties, within the meaning of the French domestic tax law as set forth in administrative guidelines dated February 25, 2005 (4(4 J-1-05) (the “Administrative Guidelines”). Dividends paid to non-residents of France are subject to French withholding tax at a rate of 25%. This withholding tax is reduced to 18%19% with respect to dividends distributed toreceived as from January 1, 2011, by non-residents of France who are residents of certain States located within the European Economic Area. However, the rate may be reduced pursuant to a tax treaty or similar agreement. Under the Treaty, a U.S. Holder is generally entitled to a reduced rate of French withholding tax of 15% with respect to dividends, provided the ownership of shares or ADSs is not effectively attributable to a permanent establishment or to a fixed base in France and certain other requirements are satisfied. U.S. Holders should consult their own tax advisors in order to determine the effect of the Treaty and the applicable procedures in respect of the Administrative Guidelines, in light of such particular circumstances. The Administrative Guidelines set forth the conditions under which the reduced French withholding tax at the rate of 15% may be available. The immediate application of the reduced 15% rate is available to those U.S. Holders that may benefit from the so-called “simplified procedure” (within the meaning of the Administrative Guidelines). Under the “simplified procedure”, U.S. Holders may claim the immediate application of withholding tax at the rate of 15% on the dividends to be received by them, provided that: (i) | | | (i) | they furnish to the U.S. financial institution managing their securities account a certificate of |
| residence conforming with the model attached to the Administrative Guidelines. The immediate application of the 15% withholding tax will be available only if the certificate of residence is sent to the U.S. financial institution managing their securities account before the dividend payment date. Furthermore, each financial institution managing the U.S. Holders’ securities account must also send to the French paying agent the figure of the total amount of dividends to be received which are eligible to the reduced withholding tax rate before the dividend payment date; |
| | | (ii) | the U.S. financial institution managing the U.S. Holder’s securities account provides to the French paying agent a list of the eligible U.S. Holders and other pieces of information set forth in the Administrative Guidelines. Furthermore, the financial institution managing the U.S. Holders’ securities account should certify that each U.S. Holder is, to the best of its knowledge, a United States resident within the meaning of the Treaty. These documents must be sent as soon as possible, in all cases before the end of the third month computed as from the end of the month of the dividend payment date. |
Where the U.S. Holder’s identity and tax residence are known by the French paying agent, the latter may release such U.S. Holder from furnishing to (i) the financial institution managing its securities account, or (ii) as the case may be, the Internal Revenue Service, the abovementioned certificate of residence, and apply the 15% withholding tax rate to dividends it pays to such U.S. Holder. U.S. Pension Funds and Other Tax-Exempt Entities created and operating in accordance with the provisions of Sections 401 (a), 403 (b), 457 or 501 (c) (3) of the U.S. Internal Revenue Code (IRC) are subject to the same general filing requirements except that, in addition, they have to supply a certificate issued by the U.S. Internal Revenue Service (“IRS”) or any other document stating that they have been created and are operating in accordance with the provisions of the abovementioned Code Sections. This certificate must be produced
135
together with the first request of application of the reduced rate, once together with the first request of immediate application of the 15% withholding tax and at French Tax Authorities specific request. In the same way, regulated companies such as RIC, REIT or REMIC will have to send to the financial institution managing their securities account a certificate from the IRS indicating that they are classified as Regulated Companies (RIC, REIT or REMIC) within the provisions of the relevant sections of the IRC. In principle, this certification must be produced each year and before the dividend payment. For a U.S. Holder that is not entitled to the “simplified” procedure and whose identity and tax residence are not known by the paying agent at the time of the payment, the 25% French withholding tax will be levied at the time the dividends are paid. Such U.S. Holder may, however, be entitled to a refund of the withholding tax in excess of the 15% rate under the “standard”, as opposed to the “simplified”, procedure, provided that the U.S. Holder furnishes to the French paying agent an application for refund on forms No. 5000-FR and/5000-FRand/or 5001-FR (or any other relevant form to be issued by the French tax authorities), certified by the U.S. financial institution managing the U.S. Holder’s securities account (or, if not, by the competent U.S. tax authorities), before December 31 of the second year following the date of payment of the withholding tax at the 25% rate to the French tax authorities, according to the requirements provided by the Administrative Guidelines. However, it will not be paid before January 15 of the year following the year in which the dividend was paid.Copies of forms No. 5000-FR and 5001-FR (or any other relevant form to be issued by the French tax authorities) as well as the form of the certificate of residence and the U.S. financial institution certification, together with instructions, are available from the U.S. Internal Revenue Service and the French Centre des Impôts des Non-Residentsat 10, rue du Centre, 93463 Noisy le Grand, France. These forms, together with instructions, will also be provided by the Depositary to all U.S. Holders of ADRs registered with the Depositary. The Depositary will use reasonable efforts to follow the procedures established by the French tax authorities for U.S. Holders to benefit from the immediate application of the 15% French withholding tax rate or, as the case may be, to recover the excess 10% French withholding tax initially withheld and deducted in respect of dividends distributed to them by TOTAL. To effect such benefit or recovery, the Depositary shall advise such U.S. Holder to return the relevant forms to it, properly completed and executed. Upon receipt of the relevant forms properly completed and executed by such U.S. Holder, the Depositary shall cause them to be filed with the appropriate French tax authorities, and upon receipt of any resulting remittance, the Depositary shall distribute to the U.S. Holder entitled thereto, as soon as practicable, the proceeds thereof in U.S. dollars. The identity and address of the French paying agent are available from TOTAL. For U.S. federal income tax purposes and subject to the passive foreign investment company rules discussed below, the gross amount of any dividend a U.S. Holder must include in gross income equals the amount paid by TOTAL to the extent of the current and accumulated earnings and profits of TOTAL (as determined for U.S. federal income tax purposes). The dividend will be income from foreign sources. Dividends paid to a noncorporate U.S. Holder in taxable years beginning before January 1, 20112013, that constitute qualified dividend income will be taxable to the holder at a maximum tax rate of 15% provided that the shares or ADSs are held for more than 60 days during the121-day period beginning 60 days before the ex-dividend date and the holder meets other holding period requirements. TOTAL believes that dividends paid by TOTAL with respect to its shares or ADSs will be qualified dividend income. The dividend will not be eligible for the dividends-received deduction allowed to a U.S. corporation under Section 243 of the Code. The dividend is taxable to the U.S. Holder when the holder, in the case of shares, or the Depositary, in the case of ADSs, receives the dividend, actually or constructively. To the extent that an amount received by a U.S. Holder exceeds the allocable share of TOTAL’s current and accumulated earnings and profits, it will be applied first to reduce such holder’s tax basis in shares or ADSs owned by such holder and then, to the extent it exceeds the holder’s tax basis, it will constitute capital gain. The amount of any dividend distribution includible in the income of a U.S. Holder equals the U.S. dollar value of the euro payment made, determined at the spot dollar/euroeuro/dollar exchange rate on the date the dividend distribution is includible in the U.S. Holder’s income, regardless of whether the payment is in fact converted into U.S. dollars. Any gain or loss resulting from currency exchange fluctuations during the period from the date the dividend payment is includible in the U.S. Holder’s income to the date the payment is converted into U.S. dollars will generally be treated as ordinary income or loss from sources within the United States and will not be eligible
136
for the special tax rate applicable to qualified dividend income. Subject to certain conditions and limitations, French taxes withheld in accordance with the Treaty will generally be eligible for credit against the U.S. Holder’s U.S. federal income tax liability. The limitation on foreign taxes eligible for credit is calculated separately with respect to specific classes of income. In addition, special rules apply in determining the foreign tax credit limitation with respect to dividends that are subject to the maximum 15% tax rate. To the extent a refund of the tax withheld is available to a U.S. Holder under French law or under the Treaty, the amount of tax withheld that is refundable will not be eligible for credit against such an individual’s United States federal income tax liability. For this purpose, dividends distributed by TOTAL will constitute “passive income”, or, in the case of certain U.S. Holders, “general income”, which are treated separately from other types of incomeone another for purposes of computing the foreign tax credit allowable to the U.SU.S. Holder. Alternatively, a U.S. Holder may claim all foreign taxes paid as an itemized deduction in lieu of claiming a foreign tax credit. Taxation of Disposition of Shares In general, a U.S. Holder who is eligible for the benefits of the Treaty will not be subject to French tax on any capital gain from the sale or exchange of the ADSs or redemption of the underlying shares unless those ADSs or shares form part of a business property of a permanent establishment or fixed base that the U.S. Holder has in France. Special rules may apply to individuals who are residents of more than one country. A 3% registration duty assessed on the higher of the purchase price and the market value of the shares (subject to a maximum of €5,000 €5,000 per transfer) applies to certain transfers of shares in French companies. The duty does not apply to transfers of shares in TOTAL provided that the transfer is not evidenced by a written agreement, or that such written agreement is executed outside France. For U.S. federal income tax purposes and subject to the passive foreign investment company rules discussed below, a U.S. Holder generally will recognize capital gain or loss upon the sale or disposition of shares or ADSs equal to the difference between the U.S. dollar value of the amount realized on the sale or disposition and the holder’s tax basis, determined in U.S. dollars, in the shares or ADSs. The gain or loss generally will be U.S. source gain or loss and will be long-term capital gain or loss if the U.S. Holder’s holding period of the shares or ADSs is more than one year at the time of the disposition. Long-term capital gain of a non-corporate U.S. Holder that is recognized in taxable years beginning before January 1, 2011, is generally taxed at a maximum rate of 15%.preferential rates. The deductibility of capital losses is subject to limitation. Passive Foreign Investment Status TOTAL believes that the shares or ADSs will not be treated as stock of a passive foreign investment company, or PFIC, for United States federal income tax purposes, but this conclusion is a factual determination that is made annually and thus is subject to change. If TOTAL is treated as a PFIC, unless a U.S. Holder elects to be taxed annually on amark-to-market basis with respect to the shares or ADSs, gain realized on the sale or other disposition of the shares or ADSs would in general not be treated as capital gain. Instead a U.S. Holder would be treated as if he or she had realized such gain and certain “excess distributions” ratably over the holding period for the shares or ADSs and would be taxed at the highest tax rate in effect for each such year to which the gain was allocated, in addition to which an interest charge in respect of the tax attributable to each such year would apply. With certain exceptions, a U.S. Holder’s shares or ADSs will be treated as stock in a PFIC if TOTAL were a PFIC at any time during his or her holding period in the shares or ADSs. Dividends paid will not be eligible for the special tax rates applicable to qualified dividend income if TOTAL is treated as a PFIC with respect to a U.S. Holder either in the taxable year of the distribution or the preceding taxable year, but instead will be taxable at rates applicable to ordinary income. French Estate and Gift Taxes In general, a transfer of ADSs or shares by gift or by reason of the death of a U.S. Holder that would otherwise be subject to French gift or inheritance tax, respectively, will not be subject to such French tax by reason of the Convention between the United States of America and the French Republic for the Avoidance of Double Taxation and the Prevention of Fiscal Evasion with Respect to Taxes on Estates, Inheritances and Gifts, dated November 24, 1978, unless the donor or the transferor is domiciled in France at the time of making the gift, or at the time of his death, or if the ADSs or shares were used in, or held for use in, the conduct of a business through a permanent establishment or a fixed base in France. The French wealth tax does not apply to a U.S. Holder (i) that is not an individual, or (ii) in the case of individuals
137
who are eligible for the benefits of the Treaty and who own, alone or with related persons, directly or indirectly, TOTAL shares which give right to less than 25% of TOTAL’s earnings. U.S. State and Local Taxes In addition to U.S. federal income tax, U.S. Holders of shares or ADSs may be subject to U.S. state and local taxes with respect to their shares or ADSs. U.S. Holders should consult their own tax advisors. Dividends and Paying Agents After BNP Paribas Securities Services performs centralizing procedures, dividends are paid through the accounts of financial intermediaries participating in Euroclear France’s direct payment procedures. The Bank of New York Mellon acts as paying agent for dividends distributed to ADS holders. TOTAL files annual, periodic, and other reports and information with the Securities and Exchange Commission. You may read and copy any reports, statements or other information TOTAL files with the United States Securities and Exchange Commission (“SEC”) at the SEC’s public reference rooms by calling the SEC for more information at1-800-SEC-0330. All of TOTAL’s SEC filings made after December 31, 2001, are available to the public at the SEC Web site athttp://www.sec.gov and from certain commercial document retrieval services. You may also read and copy any document the Company files with the SEC at the offices of The New York Stock Exchange, 20 Broad Street, New York, New York 10005. ITEM 11. QUANTITATIVE AND QUALITATIVE DISCLOSURES ABOUT MARKET RISK Please refer to Note 31 to the Consolidated Financial Statements included elsewhere herein for a qualitative and quantitative discussion of the Group’s exposure to market risks. Please also refer to Notes 29 and 30 to the Consolidated Financial Statements included elsewhere herein for details of the different derivatives owned by the Group in these markets. As part of its financing and cash management activities, the Group uses derivative instruments to manage its exposure to changes in interest rates and foreign exchange rates. These instruments are principally interest rate and currency swaps. The Group may also use, on a less frequent basis, futures caps, floors and options contracts. These operations and their accounting treatment are detailed in Note 1 paragraph M and Notes 20, 28 and 29 to the Consolidated Financial Statements included elsewhere herein. The financial performance of TOTAL is sensitive to a number of factors, the most significant being oil and gas prices, generally expressed in dollars, and exchange rates, in particular that of the dollar versus the euro. Generally, a rise in the price of crude oil has a positive effect on earnings as a result of an increase in revenues from oil and gas production. Conversely, a decline in crude oil prices reduces revenues. The impact of changes in crude oil prices on Downstream and Chemicals operations depends upon the speed at which the prices of finished products adjust to reflect these changes. All of the Group’s activities are, to various degrees, sensitive to fluctuations in the dollar/euro exchange rate.
ITEM 12. DESCRIPTION OF SECURITIES OTHER THAN EQUITY SECURITIES American Depositary Receipts fees and charges The Bank of New York Mellon, as a depositary, collects its fees for delivery and surrender of ADSs directly from investors depositing shares or surrendering ADSs for the purpose of withdrawal or from intermediaries acting for them. The depositary collects fees for making distributions to investors by deducting those fees from the amounts distributed or by selling a portion of distributable property to pay the fees. The depositary may generally refuse to provide fee-attracting services until its fees for those services are paid.
138
| | | | | Investors must pay: | | For: | | | | $5.00 (or less) per 100 ADSs (or portion of 100 ADSs) | | • Issuance of ADSs, including issuances resulting from a distribution of shares or rights or other property, stocks splits or merger
• Cancellation of ADSs for the purpose of withdrawal, including if the deposit agreement terminates
| | | | A fee equivalent to the fee that would be payable if securities distributed to the investor had been shares and the shares had been deposited for issuance of ADSs | | • Distribution of securities distributed to holders of deposited securities that are distributed by the depositary to ADS registered holders | | | | Registration or transfer fees | | • Transfer and registration of shares on the Company’s share register to or from the name of the depositary or its agent when the investor deposits or withdraws shares | | | | Expenses of the depositary | | • Cable, telex and facsimile transmissions (when expressly provided in the deposit agreement)
• Converting foreign currency to U.S. dollars
| | | | Taxes and other governmental charges the depositary or the custodian have to pay on any ADS or share underlying an ADS, for example, stock transfer taxes, stamp duty or withholding taxes | | • As necessary | | | | Any charges incurred by the depositary or its agents for servicing the deposited securities | | • As necessary |
The depositary has agreed to reimburse expenses (“Reimbursed Expenses”) incurred by the Company for certain expenses incurred in connection with the establishment and maintenance of the ADS program. The depositary has agreedprogram that include, but are not limited to, reimburse the Company for its continuing annual stock exchange listing fees, and annual meeting expenses. The depositary has also agreed to pay theexpenses, standard out-of-pocket maintenance costs for the ADRs which consist of(e.g., the expenses of postage and envelopes for mailing annual and interim financial reports, printing and distributing dividend checks, electronic filing of U.S. Federal tax information, mailing required tax forms, stationery, postage, facsimile, and telephone calls. It has also agreed to reimburse the Company annually for certain investor relationship programs or specialcalls), shareholder identification, investor relations promotional activities.activities or programs in North America, accounting fees (such as external audit fees incurred in connection with the Sarbanes-Oxley Act, the preparation of the Company’sForm 20-F and paid to the FASB and the PCAOB), legal fees and other expenses incurred in connection with the preparation of regulatory filings and other documentation related to ongoing SEC, NYSE and U.S. securities law compliance. In certain instances, the depositary has agreed to provide additional payments to the Company based on certain applicable performance indicators relating to the ADR facility. There are limits on the amount of expenses for which the depositary will reimburse the Company, but the amount of reimbursement available to the Company is not necessarily tied to the amount of fees the depositary collects from investors. In the year ended December 31, 2009,
From March 16, 2010 to March 15, 2011, the Company received from the depositary a payment of $586,590, consisting€3,771,262.29 with respect to certain Reimbursed Expenses. The Bank of an amountNew-York Mellon has also paid $347,622 on behalf of $222,243the Company with respect to continuing annual stock exchange listing fees and an amount of $364,347 with respect to annual general meeting of shareholders related expenses in connection with the ADS program, standard out-of-pocket maintenance costs for the ADRs, expenses for investor relations promotional activities, and legal fees. From January 1 to March 15, 2010, the Company received from the depositary a payment of $545,530 corresponding to standard out-of-pocket maintenance costs for the ADRs, expenses for investor relations promotional activities and legal fees.
ITEM 13. DEFAULTS, DIVIDEND ARREARAGES AND DELINQUENCIES ITEM 14. MATERIAL MODIFICATIONS TO THE RIGHTS OF
SECURITY HOLDERS AND USE OF PROCEEDS None. 139 None.
ITEM 15. CONTROLS AND PROCEDURES Disclosure Controls and Procedures An evaluation was carried out under the supervision and with the participation of the Group’s management, including the Chief Executive Officer and the Chief Financial Officer, of the effectiveness, as of the end of the period covered by this report, of the design and operation of the Group’s disclosure controls and procedures, which are defined as those controls and procedures designed to ensure that information required to be disclosed in reports filed under the U.S. Securities Exchange Act of 1934, as amended, is recorded, summarized and reported within specified time periods. There are inherent limitations to the effectiveness of any system of disclosure controls and procedures, including the possibility of human error and the circumvention or overriding of the controls and procedures. Accordingly, even effective disclosure controls and procedures can provide only reasonable assurance of achieving their control objectives. Based on this evaluation, the Chief Executive Officer and Chief Financial Officer concluded that the design and operation of these disclosure controls and procedures were effective to provide reasonable assurance that information required to be disclosed in the reports that the Company files under the Exchange Act is recorded, processed, summarized and reported, within the time periods specified in the applicable rules and forms, and that it is accumulated and communicated to management, including the Chief Executive Officer and Chief Financial Officer, as appropriate to allow timely decisions regarding required disclosure. Management’s Annual Report on Internal Control Over Financial Reporting The Group’s management is responsible for establishing and maintaining adequate internal control over financial reporting. Because of its inherent limitations, internal control over financial reporting may not prevent or detect misstatements and even when determined to be effective, can only provide reasonable assurance with respect to financial statement preparation and presentation. Also, the effectiveness of an internal control system may change over time. The Group’s management, including the Chief Executive Officer and the Chief Financial Officer, conducted an evaluation of the effectiveness of internal control over financial reporting using the criteria set forth in the Internal Control — Integrated Framework issued by the Committee of Sponsoring Organizations of the Treadway Commission (“COSO”). Based on the results of this evaluation, the Group’s management concluded that its internal control over financial reporting was effective as of December 31, 2009. 2010. The effectiveness of internal control over financial reporting as of December 31, 2009,2010, was audited by KPMG S.A. and Ernst & Young Audit, independent registered public accounting firms, as stated in their report beginning on page F-2 of this Annual Report. Changes in Internal Control Over Financial Reporting There were no changes in the Group’s internal control over financial reporting that occurred during the period covered by this report that have materially affected, or that were reasonably likely to materially affect, the Group’s internal control over financial reporting. ITEM 16A. AUDIT COMMITTEE FINANCIAL EXPERT Mr. Bertrand Jacquillat is the Audit Committee financial expert. Mr. Jacquillat is an independent member of the Board of Directors in accordance with the NYSE listing standards applicable to TOTAL, as are the other members of the Audit Committee.
At its meeting on February 18, 2004, the Board of Directors adopted a code of ethics that applies to its Chief Executive Officer, Chief Financial Officer, Chief Accounting Officer and the financial and accounting officers for its principal activities. A copy of this code of ethics is included as an exhibit to this Annual Report.
140
ITEM 16C. PRINCIPAL ACCOUNTANT FEES AND SERVICES During the fiscal years ended December 31, 20092010 and 2008,2009, fees for services provided by Ernst & Young Audit and KPMG were as follows: | | | | | | | | | | | | KPMG
Year Ended December 31, | | Ernst & Young Audit
Year Ended December 31, | | (M€) | | 2009 | | 2008 | | 2009 | | 2008 | Audit Fees | | 16.0 | | 15.9 | | 17.7 | | 17.7 | Audit-Related Fees(a) | | 2.9 | | 3.4 | | 0.8 | | 1.0 | Tax Fees(b) | | 1.2 | | 1.2 | | 1.4 | | 1.8 | All Other Fees(c) | | 0.3 | | 0.2 | | 0.1 | | 0.0 | Total | | 20.4 | | 20.7 | | 20.0 | | 20.5 |
| | | | | | | | | | | | | | | | | | | | | | | | KPMG
| | | Ernst & Young Audit
| | | | | Year Ended December 31, | | | Year Ended December 31, | | | (M€) | | 2010 | | | 2009 | | | 2010 | | | 2009 | | | | | | | | Audit Fees | | | 15.1 | | | | 16.0 | | | | 15.2 | | | | 17.7 | | Audit-Related Fees(a) | | | 3.6 | | | | 2.9 | | | | 0.7 | | | | 0.8 | | Tax Fees(b) | | | 1.2 | | | | 1.2 | | | | 1.7 | | | | 1.4 | | All Other Fees(c) | | | 0.1 | | | | 0.3 | | | | 0.2 | | | | 0.1 | | | | | | Total | | | 20.0 | | | | 20.4 | | | | 17.8 | | | | 20.0 | | | | | |
(a) | | | | (a) | | Audit-related fees are generally fees billed for services that are closely related to the performance of the audit or review of financial statements. These include due diligence services related to business combinations, attestation services not required by statute or regulation, agreed upon or expanded auditing procedures related to accounting or billing records required to respond to or comply with financial, accounting or regulatory reporting matters, consultations concerning financial accounting and reporting standards, information system reviews, internal control reviews and assistance with internal control reporting requirements. |
| (b) | | Tax fees are fees for services related to international and domestic tax compliance, including the preparation of tax returns and claims for refund, tax planning and tax advice, including assistance with tax audits and tax appeals, and tax services regarding statutory, regulatory or administrative developments and expatriate tax assistance and compliance. |
| (c) | | All other fees are principally for risk management advisory services. |
Audit Committee Pre-Approval Policy The Audit Committee has adopted an Audit and Non-Audit Services Pre-Approval Policy that sets forth the procedures and the conditions pursuant to which services proposed to be performed by the statutory auditors may be pre-approved and that are not prohibited by regulatory or other professional requirements. This policy provides for both pre-approval of certain types of services through the use of an annual budget approved by the Audit Committee for these types of services and special pre-approval of services by the Audit Committee on acase-by-case basis. The Audit Committee reviews on an annual basis the services provided by the statutory auditors. During 2009,2010, no audit-related fees, tax fees or other non-audit fees were approved by the Audit Committee pursuant to thede minimisexception to the pre-approval requirement provided by paragraph (c)(7)(i)(C) ofRule 2-01 ofRegulation S-X. ITEM 16D. EXEMPTIONS FROM THE LISTING STANDARDS FOR AUDIT COMMITTEES None.
141
None.
ITEM 16E. PURCHASES OF EQUITY SECURITIES BY THE ISSUER AND AFFILIATED PURCHASERS | | | | | | | | | | | | | | | | | | | | | | | | | | | Total Number Of
| | | | | | | | | | | | | Shares Purchased,
| | | Maximum Number
| | | | | | | | | | As Part Of Publicly
| | | Of Shares That May
| | | | Total Number Of
| | | Average Price
| | | Announced
| | | Yet Be Purchased
| | | | Shares
| | | Paid Per
| | | Plans Or
| | | Under The Plans Or
| | | Period | | Purchased | | | Share (€) | | | Programs(a) | | | Programs(b) | | | | | | January 2010 | | | — | | | | — | | | | — | | | | 119,798,107 | | | February 2010 | | | — | | | | — | | | | — | | | | 119,813,214 | | | March 2010 | | | — | | | | — | | | | — | | | | 119,911,829 | | | April 2010 | | | — | | | | — | | | | — | | | | 120,319,759 | | | May 2010 | | | — | | | | — | | | | — | | | | 120,418,644 | | | June 2010 | | | — | | | | — | | | | — | | | | 120,724,568 | | | July 2010 | | | — | | | | — | | | | — | | | | 120,734,750 | | | August 2010 | | | — | | | | — | | | | — | | | | 120,742,346 | | | September 2010 | | | — | | | | — | | | | — | | | | 120,675,024 | | | October 2010 | | | — | | | | — | | | | — | | | | 122,411,798 | | | November 2010 | | | — | | | | — | | | | — | | | | 122,432,721 | | | December 2010 | | | — | | | | — | | | | — | | | | 122,476,414 | | | January 2011 | | | — | | | | — | | | | — | | | | 122,526,633 | | | February 2011 | | | — | | | | — | | | | — | | | | 122,588,776 | |
| | | Period(a) | | Total Number Of
Shares
Purchased
| | Average Price
Paid Per
Share (€) | | Total Number Of
Shares Purchased,
As Part Of Publicly
Announced
Plans Or
Programs(a)
| | Maximum Number
Of Shares That May
Yet Be Purchased
Under The Plans Or
Programs(b)
| January 2009
| | — | | — | | — | | 94,103,139 | February 2009
| | — | | — | | — | | 94,121,817 | March 2009
| | — | | — | | — | | 94,156,488 | April 2009
| | — | | — | | — | | 94,157,270 | May 2009
| | — | | — | | — | | 94,186,799 | June 2009
| | — | | — | | — | | 94,207,296 | July 2009
| | — | | — | | — | | 118,852,285 | August 2009
| | — | | — | | — | | 118,858,302 | September 2009
| | — | | — | | — | | 118,890,718 | October 2009
| | — | | — | | — | | 118,927,422 | November 2009
| | — | | — | | — | | 119,044,527 | December 2009
| | — | | — | | — | | 119,435,098 | January 2010
| | — | | — | | — | | 119,798,107 | February 2010
| | — | | — | | — | | 119,813,214 |
(a) | The shareholders’ meeting of May 15, 2009,21, 2010, cancelled and replaced the previous resolution from the shareholders’ meeting of May 19, 2008,15, 2009, authorizing the Board of Directors to trade in the Company’s own shares on the market for a period of 18 months within the framework of the stock purchase program. The maximum number of shares that may be purchased by virtue of this authorization or under the previous authorization may not exceed 10% of the total number of shares constituting the share capital, this amount being periodically adjusted to take into account operations modifying the share capital after each shareholders’ meeting. Under no circumstances may the total number of shares the Company holds, either directly or indirectly through its subsidiaries, exceed 10% of the share capital. |
| (b) | | Based on 10% of the Company’s share capital, and after deducting the shares held by the Company for cancellation and the shares held by the Company to cover the share purchase option plans for Company employees and restricted share grants for Company employees, as well as after deducting the shares held by the subsidiaries. |
ITEM 16F. CHANGE IN REGISTRANT’S CERTIFYING ACCOUNTANT Not applicable.
142
ITEM 16G. CORPORATE GOVERNANCE Summary of Significant Differences between French Corporate Governance Practices and the NYSE’s Corporate Governance Standards The following paragraphs provide a brief, general summary of significant differences between the corporate governance standards followed by TOTAL under French law and guidelines, and those required by the listing standards of the New York Stock Exchange (the “NYSE”) for U.S. companies that have common stock listed on the NYSE. The principal sources of corporate governance standards in France are the French Commercial Code ( Code de Commerce) and, the French Financial and Monetary Code ( Code monétaire et financier), both as amended inter alia insince August 2003 by the French Financial Security Act ( Loi de sécurité financière) and the various subsequent acts, and the regulations and recommendations provided by the French Financial Markets Authority (Autorité des marchés financiers, AMF), as well as a number of general recommendations and guidelines on corporate governance, most notably the Corporate Governance Code for Listed Companies published in 2008 (as amended in April 2010) by the principal French business confederations, the Association Française des Entreprises Privées(AFEP) and the Mouvement des Entreprises de France(MEDEF) (the “AFEP-MEDEF Code”). The AFEP-MEDEF Code includes, among other things, recommendations relating to the role and operation of the board of directors (creation, composition and evaluation of the board of directors and the audit, compensation and nominating committees) and the independence criteria for board members. The French Financial Security Act prohibits statutory auditors from providing certain non-audit services and defines certain criteria for the independence of statutory auditors. In France, the independence of statutory auditors is also monitored by an independent body, the High Council for Statutory Auditors ( Haut Conseil du commissariat aux comptes). Composition of Board of Directors; Independence The NYSE listing standards provide that the board of directors of a U.S. listed company must consist of a majority of independent directors and that certain committees must consist solely of independent directors. A director qualifies as independent only if the board affirmatively determines that the director has no material relationship with the company, either directly or indirectly. In addition, the listing standards enumerate a number of relationships that preclude independence. French law does not contain any independence requirement for the members of the board of directors of a French company, unless the board establishes an audit committee, as described below, andbelow. Under French law, the functions of board chairman and chief executive officer are frequentlymay be performed by the same person. The AFEP- MEDEF Code recommends, however, that at least half of the members of the board of directors be independent in companies that have a dispersed ownership structure and no controlling shareholder. The AFEP-MEDEF Code states that a director is independent when “he or she has no relationship of any nature with the company, its group or the management of either, that may compromise the exercise of his or her freedom of judgment.” The Code also enumerates specific criteria for determining independence, which are on the whole consistent with the goals of the NYSE’s rules although the specific tests under the two standards may vary on some points. Based on the proposal of TOTAL’s Nominating & Corporate Governance Committee, the Board of Directors of TOTAL at its meeting on February 10, 2011, examined the independence of the Company’s directors on February 10,as of December 31, 2010, and considered that all of the directors of the Company are independent, with the exceptions of, Mr. de Margerie, Chairman and Chief Executive Officer of the Company since May 21, 2010, Mr. Desmarest, Chairman of the Board of Directors until May 21, 2010, and Mr. de Margerie, Chief Executive OfficerClément, director representing employee shareholders. Representation of women on corporate boards The FrenchJournal Officielpublished a statuten° 2011-103 dated January 27, 2011, relating to the representation of women on the boards of certain French companies, including French companies listed on Euronext-Paris. New rules provide for legally binding quotas to boost the percentage of women on boards of directors of French listed companies, requiring that women represent: (i) at least 20% within three years (following the first ordinary shareholders’ meeting held after January 1, 2014), and (ii) at least 40% within six years (following the first ordinary shareholders’ meeting held after January 1, 2017). When the board of directors consists of less than nine members, the difference between the number of directors of each gender at the end of the Company,six-year period should not be higher than two. Any appointment of a director
143
made in violation of these rules shall be declared null and Mrs. Lauvergeon, Chairpersonvoid and the payment of the Management Boarddirectors’ compensation shall be suspended until the board composition complies with the law’s requirements. However, decisions of the company where Mr. Desmarest was a memberboard of the Supervisory Board atdirectors that time.(1)fails to comply with these quotas may not be declared null and void. Overview.The NYSE listing standards require that a U.S. listed company have an audit committee, a nominating/corporate governance committee and a compensation committee. Each of these committees must consist solely of independent directors and must have a written charter that addresses certain matters specified in the listing standards. With the exception of an audit committee, as described below, French law requires neither the establishment of board committees nor the adoption of written charters. The AFEP-MEDEF Code recommends, however, that the board of directors set up, in addition to an audit committee, a nominating committee and a compensation committee, indicating that the nominating and compensation committees may form one committee. The AFEP-MEDEF Code also recommends that at least two-thirds of the audit committee members and a majority of the members of each of the compensation committee and the nominating committee be independent directors. TOTAL has established an Audit Committee, a Nominating & Corporate Governance Committee and a Compensation Committee, and considers all of the members of these committees to be independent with 1. | Mr. Desmarest was a member of the Supervisory Board of Areva until March 4, 2010. |
the exception of Mr. Desmarest, who is a member of the Compensation Committee and chairs the Nominating & Corporate Governance Committee. For the membership of each committee, see “Item 6. Corporate Governance”. Each of these committees has a charter that defines the scope of its activity. Audit committee. The NYSE listing standards contain detailed requirements for the audit committees of U.S. listed companies. Some, but not all, of these requirements also apply to non-U.S. listed companies, such as TOTAL. French law requires the board of directors of companies listed in France either to establish an audit committee or to perform itself the functions of an audit committee. If the board appoints an audit committee, at least one member of which must be an independent director and must be competent in finance or accounting. Pursuant to French law and the AFEP-MEDEF Code, the audit committee is responsible for, among other things, examining the company’s risk exposure and material off-balance sheet commitments and the scope of consolidation, reviewing the financial statements and ensuring the relevance and consistency of accounting methods used in drawing up the consolidated and corporate accounts, monitoring the process for the preparation of financial information, monitoring the efficiency of internal control procedures and risk management systems, managing the process of selecting statutory auditors, expressing an opinion on the amount of their fees and monitoring compliance with rules designed to ensure auditor independence, regularly interviewing statutory auditors without executive management present and calling upon outside experts if necessary. Although the audit committee requirements under French law and recommendations under the AFEP-MEDEF Code are less detailed than those contained in the NYSE listing standards, the NYSE listing standards, French law and the AFEP-MEDEF Code share the goal of establishing a system for overseeing the company’s accounting that is independent from management and that ensures auditor independence. As a result, they address similar topics, and there is some overlap. For the specific tasks performed by the Audit Committee of TOTAL that exceed those required by French law and those recommended by the AFEP-MEDEF Code, see “Item 6. Corporate Governance — Audit Committee”. One structural difference between the legal status of the audit committee of a U.S. listed company and that of a French listed company concerns the degree of the committee’s involvement in managing the relationship between the company and the auditor. French law requires French companies that publish consolidated financial statements, such as TOTAL, to have two co-auditors. While the NYSE listing standards require that the audit committee of a U.S. listed company have direct responsibility for the appointment, compensation, retention, and oversight of the work of the auditor, French law provides that the election of the co-auditors is the sole responsibility of the shareholders’ meeting. In making its decision, the shareholders’ meeting may rely on proposals submitted to it by the board of directors, the decision of the latter being taken upon consultation with the audit committee. The shareholders’ meeting elects the auditors for an audit period of six fiscal years. The auditors may only be dismissed by a court and only on grounds of professional negligence or incapacity to perform their mission.
144
The NYSE listing standards require U.S. listed companies to adopt, and post on their websites, a set of corporate governance guidelines. The guidelines must address, among other things: director qualification standards, director responsibilities, director access to management and independent advisers, director compensation, director orientation and continuing education, management succession, and an annual performance evaluation of the board. In addition, the chief executive officer of a U.S. listed company must certify to the NYSE annually that he or she is not aware of any violations by the company of the NYSE’s corporate governance listing standards. French law requires neither the adoption of such guidelines nor the provision of such certification. The AFEP-MEDEF Code recommends, however, that the board of directors of a French listed company perform an annual review of its operation and that a formal evaluation, possibly with the assistance of an outside consultant, be undertaken every three years, which for TOTAL took place end of 2009, and that shareholders be informed each year in the annual report of the evaluations. In addition, the AFEP-MEDEF Code addresses deontology rules that the directors are expected to comply with. Code of business conduct and ethics The NYSE listing standards require each U.S. listed company to adopt, and post on its website, a code of business conduct and ethics for its directors, officers and employees. There is no similar requirement or recommendation under French law. However, under the SEC’s rules and regulations, all companies required to submit periodic reports to the SEC, including TOTAL, must disclose in their annual reports whether they have adopted a code of ethics for their principal executive officer and senior financial officers. In addition, they must file a copy of the code with the SEC, post the text of the code on their website or undertake to provide a copy upon request to any person without charge. There is significant, though not complete, overlap between the code of ethics required by the NYSE listing standards and the code of ethics for senior financial officers required by the SEC’s rules. For a discussion of the code of ethics adopted by TOTAL, see “Item 6. Corporate Governance” and “Item 16B. Code of Ethics”. ITEM 17. FINANCIAL STATEMENTS ITEM 18. FINANCIAL STATEMENTS The following financial statements, together with the report of Ernst & Young Audit and KPMG S.A. thereon, are held as part of this annual report. Schedules have been omitted since they are not required under the applicable instructions or the substance of the required information is shown in the financial statements.
145
The following documents are filed as part of this annual report: | | | | | 1. | | | | 1 | | Bylaws (Statuts) of TOTAL S.A. (as amended through December 31, 2009)2010) | | | 8.8 | | List of Subsidiaries (see Note 35 to the Consolidated Financial Statements included in this Annual Report) | | | 11.11 | | Code of Ethics (incorporated by reference to the Company’s Annual Report on Form 20-F for the year ended December 31, 2005) | | | | 12.1 | | Certification of Chairman and Chief Executive Officer | | | | 12.2 | | Certification of Chief Financial Officer | | | | 13.1 | | Certification of Chairman and Chief Executive Officer | | | | 13.2 | | Certification of Chief Financial Officer | | | | 15 | | Consent of ERNST & YOUNG AUDIT and of KPMG S.A. |
146
The registrant hereby certifies that it meets all of the requirements for filing on Form 20-F and that it has duly caused and authorized the undersigned to sign this annual report on its behalf. TOTAL S.A. | | | TOTAL S.A. | | | By: | | /s/ CHRISTOPHEDE MARGERIE
| | | Name: Christophe de Margerie | | | Title: Chief Executive Officer |
Name: Christophe de Margerie Title: Chairman and Chief Executive Officer Date: March 28, 2011 Date: April 1, 2010
147
REPORT OF INDEPENDENT REGISTERED PUBLIC ACCOUNTING FIRMS
ON THE CONSOLIDATED FINANCIAL STATEMENTS
Year ended December 31, 20092010 The Board of Directors and Shareholders TOTAL S.A.
We have audited the accompanying consolidated balance sheets of TOTAL S.A. and subsidiaries (the “Company”) as of December 31, 2010, 2009 2008 and 2007,2008, and the related consolidated statements of income, comprehensive income, cash flows and changes in shareholders’ equity and comprehensive income for each of the three years in the period ended December 31, 2009.2010. These consolidated financial statements are the responsibility of the Company’s management. Our responsibility is to express an opinion on these consolidated financial statements based on our audits. We conducted our audits in accordance with the standards of the Public Company Accounting Oversight Board (United States). Those standards require that we plan and perform the audit to obtain reasonable assurance about whether the financial statements are free of material misstatement. An audit includes examining, on a test basis, evidence supporting the amounts and disclosures in the financial statements. An audit also includes assessing the accounting principles used and significant estimates made by management, as well as evaluating the overall financial statement presentation. We believe that our audits provide a reasonable basis for our opinion. In our opinion, the consolidated financial statements referred to above present fairly, in all material respects, the consolidated financial position of the Company atas of December 31, 2010, 2009 2008 and 2007,2008, and the consolidated results of its operations and its consolidated cash flows for each of the three years in the period ended December 31, 2009,2010, in conformity with International Financial Reporting Standards as adopted by the European Union and in conformity with International Financial Reporting Standards as issued by the International Accounting Standards Board. As discussed in the Introduction of the Notes to the consolidated financial statements, the Company has changed its method for reserve estimates due to the adoption of the Accounting Standards Update No. 2010-03,Oil and Gas Reserve Estimation and Disclosures, effective for annual reporting periods ended on or after Decemberaccounting policy regarding jointly controlled entities under standard IAS 31 2009.“Interests in Joint Ventures”. We also have audited, in accordance with the standards of the Public Company Accounting Oversight Board (United States), the Company’s internal control over financial reporting as of December 31, 2009,2010, based on criteria established in Internal Control-Integrated Framework issued by the Committee of Sponsoring Organizations of the Treadway Commission (the COSO criteria) and our report dated March 8, 201010, 2011 expressed an unqualified opinion on the effectiveness of the Company’s internal control over financial reporting. Paris La Défense, March 8, 2010 10, 2011 | | | | | KPMG AUDIT
A division of KPMG S.A. | | ERNST & YOUNG Audit | A division of KPMG S.A./s/Jay Nirsimloo | |
/s/ Pascal Macioce
| | /s/ Laurent Vitse | | | | | | /s/ JAY NIRSIMLOO Jay Nirsimloo
Partner | | /s/ PASCAL MACIOCE | Jay NirsimlooPascal Macioce
Partner | | Pascal MacioceLaurent Vitse
Partner |
F-1
REPORT OF INDEPENDENT REGISTERED PUBLIC ACCOUNTING FIRMS
ON THE INTERNAL CONTROL OVER FINANCIAL REPORTING
Year ended December 31, 20092010 The Board of Directors and Shareholders TOTAL S.A.
We have audited TOTAL S.A. and subsidiaries’ (“the Company”) internal control over financial reporting as of December 31, 2009,2010, based on criteria established in Internal Control — Integrated Framework issued by the Committee of Sponsoring Organizations of the Treadway Commission (the COSO criteria). The Company’s management is responsible for maintaining effective internal control over financial reporting, and for its assessment of the effectiveness of internal control over financial reporting included in the accompanying management’s annual report on internal control over financial reporting. Our responsibility is to express an opinion on the Company’s internal control over financial reporting based on our audit. We conducted our audit in accordance with the standards of the Public Company Accounting Oversight Board (United States). Those standards require that we plan and perform the audit to obtain reasonable assurance about whether effective internal control over financial reporting was maintained in all material respects. Our audit included obtaining an understanding of internal control over financial reporting, assessing the risk that a material weakness exists, and testing and evaluating the design and operating effectiveness of internal control based on the assessed risk. Our audit also included performing such other procedures as we considered necessary in the circumstances. We believe that our audit provides a reasonable basis for our opinion. A company’s internal control over financial reporting is a process designed to provide reasonable assurance regarding the reliability of financial reporting and the preparation of financial statements for external purposes in accordance with generally accepted accounting principles. A company’s internal control over financial reporting includes those policies and procedures that (1) pertain to the maintenance of records that, in reasonable detail, accurately and fairly reflect the transactions and dispositions of the assets of the company; (2) provide reasonable assurance that transactions are recorded as necessary to permit preparation of financial statements in accordance with generally accepted accounting principles, and that receipts and expenditures of the company are being made only in accordance with authorizations of management and directors of the company; and (3) provide reasonable assurance regarding prevention or timely detection of unauthorized acquisition, use or disposition of the company’s assets that could have a material effect on the financial statements. Because of its inherent limitations, internal control over financial reporting may not prevent or detect misstatements. Also, projections of any evaluation of effectiveness to future periods are subject to the risk that controls may become inadequate because of changes in conditions, or that the degree of compliance with the policies or procedures may deteriorate. In our opinion, the Company maintained, in all material respects, effective internal control over financial reporting as of December 31, 2009,2010, based on the COSO criteria. We also have audited, in accordance with the standards of the Public Company Accounting Oversight Board (United States), the consolidated balance sheets of the Company as of December 31, 2010, 2009 2008 and 20072008 and the related consolidated statements of income, comprehensive income, cash flows and changes in shareholders’ equity and comprehensive income for each of the three years in the period ended December 31, 2009,2010, and our report dated March 8, 201010, 2011 expressed an unqualified opinion on those consolidated financial statements. Paris La Défense, March 8, 2010 10, 2011 | | | | | KPMG AuditAUDIT
A division of KPMG S.A. | | ERNST & YOUNG Audit | A division of KPMG S.A./s/Jay Nirsimloo | |
/s/Pascal Macioce
| | /s/Laurent Vitse | | | | | | /s/ JAY NIRSIMLOO | | /s/ PASCAL MACIOCE | Jay Nirsimloo
Partner | | Pascal Macioce |
Partner | | Laurent Vitse
Partner |
F-2
CONSOLIDATED STATEMENT OF INCOME TOTAL | | | | | | | | | | | | | For the year ended December 31,(€ million)(a) | | | | 2009 | | | 2008 | | | 2007 | | Sales | | (Notes 4 & 5) | | 131,327 | | | 179,976 | | | 158,752 | | Excise taxes | | | | (19,174 | ) | | (19,645 | ) | | (21,928 | ) | Revenues from sales | | | | 112,153 | | | 160,331 | | | 136,824 | | | | | | | Purchases net of inventory variation | | (Note 6) | | (71,058 | ) | | (111,024 | ) | | (87,807 | ) | Other operating expenses | | (Note 6) | | (18,591 | ) | | (19,101 | ) | | (17,414 | ) | Exploration costs | | (Note 6) | | (698 | ) | | (764 | ) | | (877 | ) | Depreciation, depletion and amortization of tangible assets and mineral interests | | | | (6,682 | ) | | (5,755 | ) | | (5,425 | ) | Other income | | (Note 7) | | 314 | | | 369 | | | 674 | | Other expense | | (Note 7) | | (600 | ) | | (554 | ) | | (470 | ) | | | | | | Financial interest on debt | | | | (530 | ) | | (1,000 | ) | | (1,783 | ) | Financial income from marketable securities & cash equivalents | | | | 132 | | | 473 | | | 1,244 | | Cost of net debt | | (Note 29) | | (398 | ) | | (527 | ) | | (539 | ) | Other financial income | | (Note 8) | | 643 | | | 728 | | | 643 | | Other financial expense | | (Note 8) | | (345 | ) | | (325 | ) | | (274 | ) | | | | | | Equity in income (loss) of affiliates | | (Note 12) | | 1,642 | | | 1,721 | | | 1,775 | | | | | | | Income taxes | | (Note 9) | | (7,751 | ) | | (14,146 | ) | | (13,575 | ) | Consolidated net income | | | | 8,629 | | | 10,953 | | | 13,535 | | Group share | | | | 8,447 | | | 10,590 | | | 13,181 | | Minority interests | | | | 182 | | | 363 | | | 354 | | Earnings per share (€) | | | | 3.79 | | | 4.74 | | | 5.84 | | Fully-diluted earnings per share (€) | | | | 3.78 | | | 4.71 | | | 5.80 | |
| | | | | | | | | | | | | | | | | | | | | | | For the year ended December 31, (M€)(a) | | | | | | | 2010 | | | | 2009 | | | | 2008 | | Sales | | | | (Notes 4 & 5 | ) | | | | 159,269 | | | | | 131,327 | | | | | 179,976 | | | Excise taxes | | | | | | | | | (18,793 | ) | | | | (19,174 | ) | | | | (19,645 | ) | | Revenues from sales | | | | | | | | | 140,476 | | | | | 112,153 | | | | | 160,331 | | | Purchases net of inventory variation | | | | (Note 6 | ) | | | | (93,171 | ) | | | | (71,058 | ) | | | | (111,024 | ) | | Other operating expenses | | | | (Note 6 | ) | | | | (19,135 | ) | | | | (18,591 | ) | | | | (19,101 | ) | | Exploration costs | | | | (Note 6 | ) | | | | (864 | ) | | | | (698 | ) | | | | (764 | ) | Depreciation, depletion and amortization of tangible assets and mineral
interests | | | | | | | | | (8,421 | ) | | | | (6,682 | ) | | | | (5,755 | ) | | Other income | | | | (Note 7 | ) | | | | 1,396 | | | | | 314 | | | | | 369 | | | Other expense | | | | (Note 7 | ) | | | | (900 | ) | | | | (600 | ) | | | | (554 | ) | | Financial interest on debt | | | | | | | | | (465 | ) | | | | (530 | ) | | | | (1,000 | ) | | Financial income from marketable securities & cash equivalents | | | | | | | | | 131 | | | | | 132 | | | | | 473 | | | Cost of net debt | | | | (Note 29 | ) | | | | (334 | ) | | | | (398 | ) | | | | (527 | ) | | Other financial income | | | | (Note 8 | ) | | | | 442 | | | | | 643 | | | | | 728 | | | Other financial expense | | | | (Note 8 | ) | | | | (407 | ) | | | | (345 | ) | | | | (325 | ) | | Equity in income (loss) of affiliates | | | | (Note 12 | ) | | | | 1,953 | | | | | 1,642 | | | | | 1,721 | | | Income taxes | | | | (Note 9 | ) | | | | (10,228 | ) | | | | (7,751 | ) | | | | (14,146 | ) | | | Consolidated net income | | | | | | | | | 10,807 | | | | | 8,629 | | | | | 10,953 | | | | | Group share | | | | | | | | | 10,571 | | | | | 8,447 | | | | | 10,590 | | | Minority interests | | | | | | | | | 236 | | | | | 182 | | | | | 363 | | | | | Earnings per share (€) | | | | | | | | | 4.73 | | | | | 3.79 | | | | | 4.74 | | | Fully-diluted earnings per share (€) | | | | | | | | | 4.71 | | | | | 3.78 | | | | | 4.71 | | | |
(a) | | | | (a) | | Except for per share amounts. |
F-3
CONSOLIDATED STATEMENT OF
COMPREHENSIVE INCOME TOTAL | | | | | | | | | | | | | | | For the year ended December 31, (M€) | | 2010 | | | 2009 | | | 2008 | | Consolidated net income | | | 10,807 | | | | 8,629 | | | | 10,953 | | | | Other comprehensive income | | | | | | | | | | | | | | Currency translation adjustment | | | 2,231 | | | | (244 | ) | | | (722 | ) | | Available for sale financial assets | | | (100 | ) | | | 38 | | | | (254 | ) | | Cash flow hedge | | | (80 | ) | | | 128 | | | | — | | | Share of other comprehensive income of associates, net amount | | | 302 | | | | 234 | | | | 173 | | | Other | | | (7 | ) | | | (5 | ) | | | 1 | | | Tax effect | | | 28 | | | | (38 | ) | | | 30 | | | | | | | | | | | | | | | | Total other comprehensive income (net amount)(note 17) | | | 2,374 | | | | 113 | | | | (772 | ) | | | | | | | | | | | | | | | Comprehensive income | | | 13,181 | | | | 8,742 | | | | 10,181 | | | | | | | | | | | | | | | | | - Group share | | | 12,936 | | | | 8,500 | | | | 9,852 | | | - Minority interests | | | 245 | | | | 242 | | | | 329 | |
F-4
CONSOLIDATED BALANCE SHEET TOTAL | | | | | | | | | | | | | | | | | | | | | | | As of December 31, (M€) | | | | | | | 2010 | | | | 2009 | | | | 2008 | | ASSETS | | | | | | | | | | | | | | | | | | | | | Non-current assets | | | | | | | | | | | | | | | | | | | | | | Intangible assets, net | | | | (Notes 5 & 10 | ) | | | | 8,917 | | | | | 7,514 | | | | | 5,341 | | | Property, plant and equipment, net | | | | (Notes 5 & 11 | ) | | | | 54,964 | | | | | 51,590 | | | | | 46,142 | | | Equity affiliates: investments and loans | | | | (Note 12 | ) | | | | 11,516 | | | | | 13,624 | | | | | 14,668 | | | Other investments | | | | (Note 13 | ) | | | | 4,590 | | | | | 1,162 | | | | | 1,165 | | | Hedging instruments of non-current financial debt | | | | (Note 20 | ) | | | | 1,870 | | | | | 1,025 | | | | | 892 | | | Other non-current assets | | | | (Note 14 | ) | | | | 3,655 | | | | | 3,081 | | | | | 3,044 | | | | Total non-current assets | | | | | | | | | 85,512 | | | | | 77,996 | | | | | 71,252 | | | | Current assets | | | | | | | | | | | | | | | | | | | | | | Inventories, net | | | | (Note 15 | ) | | | | 15,600 | | | | | 13,867 | | | | | 9,621 | | | Accounts receivable, net | | | | (Note 16 | ) | | | | 18,159 | | | | | 15,719 | | | | | 15,287 | | | Other current assets | | | | (Note 16 | ) | | | | 7,483 | | | | | 8,198 | | | | | 9,642 | | | Current financial assets | | | | (Note 20 | ) | | | | 1,205 | | | | | 311 | | | | | 187 | | | Cash and cash equivalents | | | | (Note 27 | ) | | | | 14,489 | | | | | 11,662 | | | | | 12,321 | | | | Total current assets | | | | | | | | | 56,936 | | | | | 49,757 | | | | | 47,058 | | | | Assets classified as held for sale | | | | (Note 34 | ) | | | | 1,270 | | | | | — | | | | | — | | | | Total assets | | | | | | | | | 143,718 | | | | | 127,753 | | | | | 118,310 | | | | LIABILITIES & SHAREHOLDERS’ EQUITY | | | | | | | | | | | | | | | | | | | | | Shareholders’ equity | | | | | | | | | | | | | | | | | | | | | | Common shares | | | | | | | | | 5,874 | | | | | 5,871 | | | | | 5,930 | | | Paid-in surplus and retained earnings | | | | | | | | | 60,538 | | | | | 55,372 | | | | | 52,947 | | | Currency translation adjustment | | | | | | | | | (2,495 | ) | | | | (5,069 | ) | | | | (4,876 | ) | | Treasury shares | | | | | | | | | (3,503 | ) | | | | (3,622 | ) | | | | (5,009 | ) | | | Total shareholders’ equity — Group share | | | | (Note 17 | ) | | | | 60,414 | | | | | 52,552 | | | | | 48,992 | | | | Minority interests | | | | | | | | | 857 | | | | | 987 | | | | | 958 | | | | Total shareholders’ equity | | | | | | | | | 61,271 | | | | | 53,539 | | | | | 49,950 | | | | Non-current liabilities | | | | | | | | | | | | | | | | | | | | | | Deferred income taxes | | | | (Note 9 | ) | | | | 9,947 | | | | | 8,948 | | | | | 7,973 | | | Employee benefits | | | | (Note 18 | ) | | | | 2,171 | | | | | 2,040 | | | | | 2,011 | | | Provisions and other non-current liabilities | | | | (Note 19 | ) | | | | 9,098 | | | | | 9,381 | | | | | 7,858 | | | | Total non-current liabilities | | | | | | | | | 21,216 | | | | | 20,369 | | | | | 17,842 | | | | Non-current financial debt | | | | (Note 20 | ) | | | | 20,783 | | | | | 19,437 | | | | | 16,191 | | | | Current liabilities | | | | | | | | | | | | | | | | | | | | | | Accounts payable | | | | | | | | | 18,450 | | | | | 15,383 | | | | | 14,815 | | | Other creditors and accrued liabilities | | | | (Note 21 | ) | | | | 11,989 | | | | | 11,908 | | | | | 11,632 | | | Current borrowings | | | | (Note 20 | ) | | | | 9,653 | | | | | 6,994 | | | | | 7,722 | | | Other current financial liabilities | | | | (Note 20 | ) | | | | 159 | | | | | 123 | | | | | 158 | | | | Total current liabilities | | | | | | | | | 40,251 | | | | | 34,408 | | | | | 34,327 | | | | Liabilities directly associated with the assets classified as held for sale | | | | (Note 34 | ) | | | | 197 | | | | | — | | | | | — | | | | Total liabilities and shareholders’ equity | | | | | | | | | 143,718 | | | | | 127,753 | | | | | 118,310 | | | |
F-5
| | | | | | | | | | | | | As of December 31,(€ million) | | | | 2009 | | | 2008 | | | 2007 | | ASSETS | | | | | | | | | | | | Non-current assets | | | | | | | | | | | | Intangible assets, net | | (Notes 5 & 10) | | 7,514 | | | 5,341 | | | 4,650 | | Property, plant and equipment, net | | (Notes 5 & 11) | | 51,590 | | | 46,142 | | | 41,467 | | Equity affiliates: investments and loans | | (Note 12) | | 13,624 | | | 14,668 | | | 15,280 | | Other investments | | (Note 13) | | 1,162 | | | 1,165 | | | 1,291 | | Hedging instruments of non-current financial debt | | (Note 20) | | 1,025 | | | 892 | | | 460 | | Other non-current assets | | (Note 14) | | 3,081 | | | 3,044 | | | 2,155 | | Total non-current assets | | | | 77,996 | | | 71,252 | | | 65,303 | | Current assets | | | | | | | | | | | | Inventories, net | | (Note 15) | | 13,867 | | | 9,621 | | | 13,851 | | Accounts receivable, net | | (Note 16) | | 15,719 | | | 15,287 | | | 19,129 | | Other current assets | | (Note 16) | | 8,198 | | | 9,642 | | | 8,006 | | Current financial assets | | (Note 20) | | 311 | | | 187 | | | 1,264 | | Cash and cash equivalents | | (Note 27) | | 11,662 | | | 12,321 | | | 5,988 | | Total current assets | | | | 49,757 | | | 47,058 | | | 48,238 | | Total assets | | | | 127,753 | | | 118,310 | | | 113,541 | | LIABILITIES & SHAREHOLDERS’ EQUITY | | | | | | | | | | | | Shareholders’ equity | | | | | | | | | | | | Common shares | | | | 5,871 | | | 5,930 | | | 5,989 | | Paid-in surplus and retained earnings | | | | 55,372 | | | 52,947 | | | 48,797 | | Currency translation adjustment | | | | (5,069 | ) | | (4,876 | ) | | (4,396 | ) | Treasury shares | | | | (3,622 | ) | | (5,009 | ) | | (5,532 | ) | Total shareholders’ equity - Group share | | (Note 17) | | 52,552 | | | 48,992 | | | 44,858 | | Minority interests | | | | 987 | | | 958 | | | 842 | | Total shareholders’ equity | | | | 53,539 | | | 49,950 | | | 45,700 | | Non-current liabilities | | | | | | | | | | | | Deferred income taxes | | (Note 9) | | 8,948 | | | 7,973 | | | 7,933 | | Employee benefits | | (Note 18) | | 2,040 | | | 2,011 | | | 2,527 | | Provisions and other non-current liabilities | | (Note 19) | | 9,381 | | | 7,858 | | | 6,843 | | Total non-current liabilities | | | | 20,369 | | | 17,842 | | | 17,303 | | Non-current financial debt | | (Note 20) | | 19,437 | | | 16,191 | | | 14,876 | | Current liabilities | | | | | | | | | | | | Accounts payable | | | | 15,383 | | | 14,815 | | | 18,183 | | Other creditors and accrued liabilities | | (Note 21) | | 11,908 | | | 11,632 | | | 12,806 | | Current borrowings | | (Note 20) | | 6,994 | | | 7,722 | | | 4,613 | | Other current financial liabilities | | (Note 20) | | 123 | | | 158 | | | 60 | | Total current liabilities | | | | 34,408 | | | 34,327 | | | 35,662 | | Total liabilities and shareholders’ equity | | | | 127,753 | | | 118,310 | | | 113,541 | |
CONSOLIDATED STATEMENT OF CASH FLOW TOTAL (Note 27) | | | | | | | | | | | | | | | For the year ended December 31, (M€) | | 2010 | | | 2009 | | | 2008 | | CASH FLOW FROM OPERATING ACTIVITIES | | | | | | | | | | | | | | Consolidated net income | | | 10,807 | | | | 8,629 | | | | 10,953 | | | Depreciation, depletion and amortization | | | 9,117 | | | | 7,107 | | | | 6,197 | | | Non-current liabilities, valuation allowances, and deferred taxes | | | 527 | | | | 441 | | | | (150 | ) | | Impact of coverage of pension benefit plans | | | (60 | ) | | | — | | | | (505 | ) | | (Gains) losses on disposals of assets | | | (1,046 | ) | | | (200 | ) | | | (257 | ) | | Undistributed affiliates’ equity earnings | | | (470 | ) | | | (378 | ) | | | (311 | ) | | (Increase) decrease in working capital | | | (496 | ) | | | (3,316 | ) | | | 2,571 | | | Other changes, net | | | 114 | | | | 77 | | | | 171 | | | | | | | | | | | | | | | | Cash flow from operating activities | | | 18,493 | | | | 12,360 | | | | 18,669 | | | | | | | | | | | | | | | | CASH FLOW USED IN INVESTING ACTIVITIES | | | | | | | | | | | | | | Intangible assets and property, plant and equipment additions | | | (13,812 | ) | | | (11,849 | ) | | | (11,861 | ) | | Acquisitions of subsidiaries, net of cash acquired | | | (862 | ) | | | (160 | ) | | | (559 | ) | | Investments in equity affiliates and other securities | | | (654 | ) | | | (400 | ) | | | (416 | ) | | Increase in non-current loans | | | (945 | ) | | | (940 | ) | | | (804 | ) | | | | | | | | | | | | | | | Total expenditures | | | (16,273 | ) | | | (13,349 | ) | | | (13,640 | ) | | Proceeds from disposals of intangible assets and property, plant and equipment | | | 1,534 | | | | 138 | | | | 130 | | | Proceeds from disposals of subsidiaries, net of cash sold | | | 310 | | | | — | | | | 88 | | | Proceeds from disposals of non-current investments | | | 1,608 | | | | 2,525 | | | | 1,233 | | | Repayment of non-current loans | | | 864 | | | | 418 | | | | 1,134 | | | | | | | | | | | | | | | | Total divestments | | | 4,316 | | | | 3,081 | | | | 2,585 | | | | | | | | | | | | | | | | Cash flow used in investing activities | | | (11,957 | ) | | | (10,268 | ) | | | (11,055 | ) | | | | | | | | | | | | | | | CASH FLOW USED IN FINANCING ACTIVITIES | | | | | | | | | | | | | | Issuance (repayment) of shares: | | | | | | | | | | | | | | - Parent company shareholders | | | 41 | | | | 41 | | | | 262 | | | - Treasury shares | | | 49 | | | | 22 | | | | (1,189 | ) | | - Minority shareholders | | | — | | | | — | | | | (4 | ) | | Dividends paid: | | | | | | | | | | | | | | - Parent company shareholders | | | (5,098 | ) | | | (5,086 | ) | | | (4,945 | ) | | - Minority shareholders | | | (152 | ) | | | (189 | ) | | | (213 | ) | | Other transactions with minority shareholders | | | (429 | ) | | | — | | | | — | | | Net issuance (repayment) of non-current debt | | | 3,789 | | | | 5,522 | | | | 3,009 | | | Increase (decrease) in current borrowings | | | (731 | ) | | | (3,124 | ) | | | 1,437 | | | Increase (decrease) in current financial assets and liabilities | | | (817 | ) | | | (54 | ) | | | 850 | | | | | | | | | | | | | | | | Cash flow used in financing activities | | | (3,348 | ) | | | (2,868 | ) | | | (793 | ) | | | | | | | | | | | | | | | Net increase (decrease) in cash and cash equivalents | | | 3,188 | | | | (776 | ) | | | 6,821 | | | Effect of exchange rates | | | (361 | ) | | | 117 | | | | (488 | ) | | Cash and cash equivalents at the beginning of the period | | | 11,662 | | | | 12,321 | | | | 5,988 | | | | | | | | | | | | | | | | Cash and cash equivalents at the end of the period | | | 14,489 | | | | 11,662 | | | | 12,321 | | | | | | | | | | | | | | | |
F-6
| | | | | | | | | | (Note 27) | | | | | | | | | | For the year ended December 31,(€ million) | | 2009 | | | 2008 | | | 2007 | | CASH FLOW FROM OPERATING ACTIVITIES | | | | | | | | | | Consolidated net income | | 8,629 | | | 10,953 | | | 13,535 | | Depreciation, depletion and amortization | | 7,107 | | | 6,197 | | | 5,946 | | Non-current liabilities, valuation allowances, and deferred taxes | | 441 | | | (150 | ) | | 826 | | Impact of coverage of pension benefit plans | | — | | | (505 | ) | | — | | (Gains) losses on disposals of assets | | (200 | ) | | (257 | ) | | (639 | ) | Undistributed affiliates’ equity earnings | | (378 | ) | | (311 | ) | | (821 | ) | (Increase) decrease in working capital | | (3,316 | ) | | 2,571 | | | (1,476 | ) | Other changes, net | | 77 | | | 171 | | | 315 | | Cash flow from operating activities | | 12,360 | | | 18,669 | | | 17,686 | | CASH FLOW USED IN INVESTING ACTIVITIES | | | | | | | | | | Intangible assets and property, plant and equipment additions | | (11,849 | ) | | (11,861 | ) | | (10,549 | ) | Acquisitions of subsidiaries, net of cash acquired | | (160 | ) | | (559 | ) | | (20 | ) | Investments in equity affiliates and other securities | | (400 | ) | | (416 | ) | | (351 | ) | Increase in non-current loans | | (940 | ) | | (804 | ) | | (802 | ) | Total expenditures | | (13,349 | ) | | (13,640 | ) | | (11,722 | ) | Proceeds from disposals of intangible assets and property, plant and equipment | | 138 | | | 130 | | | 569 | | Proceeds from disposals of subsidiaries, net of cash sold | | — | | | 88 | | | 5 | | Proceeds from disposals of non-current investments | | 2,525 | | | 1,233 | | | 527 | | Repayment of non-current loans | | 418 | | | 1,134 | | | 455 | | Total divestments | | 3,081 | | | 2,585 | | | 1,556 | | Cash flow used in investing activities | | (10,268 | ) | | (11,055 | ) | | (10,166 | ) | CASH FLOW USED IN FINANCING ACTIVITIES | | | | | | | | | | Issuance (repayment) of shares: | | | | | | | | | | - Parent company shareholders | | 41 | | | 262 | | | 89 | | - Treasury shares | | 22 | | | (1,189 | ) | | (1,526 | ) | - Minority shareholders | | — | | | (4 | ) | | 2 | | Dividends paid: | | | | | | | | | | - Parent company shareholders | | (5,086 | ) | | (4,945 | ) | | (4,510 | ) | - Minority shareholders | | (189 | ) | | (213 | ) | | (228 | ) | Net issuance (repayment) of non-current debt | | 5,522 | | | 3,009 | | | 3,220 | | Increase (decrease) in current borrowings | | (3,124 | ) | | 1,437 | | | (2,654 | ) | Increase (decrease) in current financial assets and liabilities | | (54 | ) | | 850 | | | 2,265 | | Cash flow used in financing activities | | (2,868 | ) | | (793 | ) | | (3,342 | ) | Net increase (decrease) in cash and cash equivalents | | (776 | ) | | 6,821 | | | 4,178 | | Effect of exchange rates | | 117 | | | (488 | ) | | (683 | ) | Cash and cash equivalents at the beginning of the period | | 12,321 | | | 5,988 | | | 2,493 | | Cash and cash equivalents at the end of the period | | 11,662 | | | 12,321 | | | 5,988 | |
CONSOLIDATED STATEMENT OF CHANGES IN SHAREHOLDERS’ EQUITY TOTAL | | | | | | | | | | | | | | | | | | | | | | | | | | | | | | | Common shares issued | | | Paid-in
surplus
and
retained
earnings | | | Currency
translation
adjustment | | | Treasury shares | | | Shareholders’
equity -
Group share | | | Minority
interests | | | Total
shareholders’
equity | | | (€ million) | | Number | | | Amount | | | | | Number | | | Amount | | | | | As of January 1, 2007 | | 2,425,767,953 | | | 6,064 | | | 41,460 | | | (1,383 | ) | | (161,200,707 | ) | | (5,820 | ) | | 40,321 | | | 827 | | | 41,148 | | Net income 2007 | | — | | | — | | | 13,181 | | | — | | | — | | | — | | | 13,181 | | | 354 | | | 13,535 | | Other comprehensive income (Note 17) | | — | | | — | | | 117 | | | (3,013 | ) | | — | | | — | | | (2,896 | ) | | (111 | ) | | (3,007 | ) | Comprehensive income | | — | | | — | | | 13,298 | | | (3,013 | ) | | — | | | — | | | 10,285 | | | 243 | | | 10,528 | | Dividend | | — | | | — | | | (4,510 | ) | | — | | | — | | | — | | | (4,510 | ) | | (228 | ) | | (4,738 | ) | Issuance of common shares (Note 17) | | 2,769,144 | | | 7 | | | 82 | | | — | | | — | | | — | | | 89 | | | — | | | 89 | | Purchase of treasury shares | | — | | | — | | | — | | | — | | | (32,387,355 | ) | | (1,787 | ) | | (1,787 | ) | | — | | | (1,787 | ) | Sale of treasury shares(a) | | — | | | — | | | (77 | ) | | — | | | 9,161,830 | | | 341 | | | 264 | | | — | | | 264 | | Share-based payments (Note 25) | | — | | | — | | | 196 | | | — | | | | | | | | | 196 | | | — | | | 196 | | Other operations with minority interests | | — | | | — | | | — | | | — | | | | | | | | | — | | | — | | | — | | Share cancellation (Note 17) | | (33,005,000 | ) | | (82 | ) | | (1,652 | ) | | — | | | 33,005,000 | | | 1,734 | | | — | | | — | | | — | | Transactions with shareholders | | (30,235,856 | ) | | (75 | ) | | (5,961 | ) | | — | | | 9,779,475 | | | 288 | | | (5,748 | ) | | (228 | ) | | (5,976 | ) | As of December 31, 2007 | | 2,395,532,097 | | | 5,989 | | | 48,797 | | | (4,396 | ) | | (151,421,232 | ) | | (5,532 | ) | | 44,858 | | | 842 | | | 45,700 | | Net income 2008 | | — | | | — | | | 10,590 | | | — | | | — | | | — | | | 10,590 | | | 363 | | | 10,953 | | Other comprehensive income (Note 17) | | — | | | — | | | (258 | ) | | (480 | ) | | — | | | — | | | (738 | ) | | (34 | ) | | (772 | ) | Comprehensive income | | — | | | — | | | 10,332 | | | (480 | ) | | — | | | — | | | 9,852 | | | 329 | | | 10,181 | | Dividend | | — | | | — | | | (4,945 | ) | | — | | | — | | | — | | | (4,945 | ) | | (213 | ) | | (5,158 | ) | Issuance of common shares (Note 17) | | 6,275,977 | | | 16 | | | 246 | | | — | | | — | | | — | | | 262 | | | — | | | 262 | | Purchase of treasury shares | | — | | | — | | | — | | | — | | | (27,600,000 | ) | | (1,339 | ) | | (1,339 | ) | | — | | | (1,339 | ) | Sale of treasury shares(a) | | — | | | — | | | (71 | ) | | — | | | 5,939,137 | | | 221 | | | 150 | | | — | | | 150 | | Share-based payments (Note 25) | | — | | | — | | | 154 | | | — | | | | | | | | | 154 | | | — | | | 154 | | Other operations with minority interests | | — | | | — | | | — | | | — | | | | | | | | | — | | | — | | | — | | Share cancellation (Note 17) | | (30,000,000 | ) | | (75 | ) | | (1,566 | ) | | — | | | 30,000,000 | | | 1,641 | | | — | | | — | | | — | | Transactions with shareholders | | (23,724,023 | ) | | (59 | ) | | (6,182 | ) | | — | | | 8,339,137 | | | 523 | | | (5,718 | ) | | (213 | ) | | (5,931 | ) | As of December 31, 2008 | | 2,371,808,074 | | | 5,930 | | | 52,947 | | | (4,876 | ) | | (143,082,095 | ) | | (5,009 | ) | | 48,992 | | | 958 | | | 49,950 | | Net income 2009 | | — | | | — | | | 8,447 | | | — | | | — | | | — | | | 8,447 | | | 182 | | | 8,629 | | Other comprehensive income (Note 17) | | — | | | — | | | 246 | | | (193 | ) | | — | | | — | | | 53 | | | 60 | | | 113 | | Comprehensive income | | — | | | — | | | 8,693 | | | (193 | ) | | — | | | — | | | 8,500 | | | 242 | | | 8,742 | | Dividend | | — | | | — | | | (5,086 | ) | | — | | | — | | | — | | | (5,086 | ) | | (189 | ) | | (5,275 | ) | Issuance of common shares (Note 17) | | 1,414,810 | | | 3 | | | 38 | | | — | | | — | | | — | | | 41 | | | — | | | 41 | | Purchase of treasury shares | | — | | | — | | | — | | | — | | | — | | | — | | | — | | | — | | | — | | Sale of treasury shares(a) | | — | | | — | | | (143 | ) | | — | | | 2,874,905 | | | 165 | | | 22 | | | — | | | 22 | | Share-based payments (Note 25) | | — | | | — | | | 106 | | | — | | | — | | | — | | | 106 | | | — | | | 106 | | Other operations with minority interests | | — | | | — | | | (23 | ) | | — | | | — | | | — | | | (23 | ) | | (24 | ) | | (47 | ) | Share cancellation (Note 17) | | (24,800,000 | ) | | (62 | ) | | (1,160 | ) | | — | | | 24,800,000 | | | 1,222 | | | — | | | — | | | — | | Transactions with shareholders | | (23,385,190 | ) | | (59 | ) | | (6,268 | ) | | — | | | 27,674,905 | | | 1,387 | | | (4,940 | ) | | (213 | ) | | (5,153 | ) | As of December 31, 2009 | | 2,348,422,884 | | | 5,871 | | | 55,372 | | | (5,069 | ) | | (115,407,190 | ) | | (3,622 | ) | | 52,552 | | | 987 | | | 53,539 | |
| | | | | | | | | | | | | | | | | | | | | | | | | | | | | | | | | | | | | | | | | | | | | | | | Paid-in
| | | | | | | | | | | | | | | | | | | | | | | | | | | | | | | | | surplus
| | | | | | | | | | | | | | | | | | | | | | | | | | | | | | | | | and
| | | | Currency
| | | | | | | | | | Shareholders’
| | | | | | | Total
| | | | | Common shares issued | | | retained
| | | | translation
| | | Treasury shares | | | equity-
| | | Minority
| | | | shareholders’
| | (M€) | | | Number | | | | Amount | | | earnings | | | | adjustment | | | Number | | | | Amount | | | Group share | | | interests | | | | equity | As of January 1, 2008 | | | | 2,395,532,097 | | | | 5,989 | | | | 48,797 | | | | (4,396) | | | | (151,421,232 | ) | | | (5,532) | | | 44,858 | | | | 842 | | | | 45,700 | | | | Net income 2008 | | | | — | | | | — | | | | 10,590 | | | | — | | | | — | | | | — | | | 10,590 | | | | 363 | | | | 10,953 | | Other comprehensive income (Note 17) | | | | — | | | | — | | | | (258 | ) | | | (480) | | | | — | | | | — | | | (738) | | | | (34 | ) | | | (772) | | | Comprehensive income | | | | — | | | | — | | | | 10,332 | | | | (480) | | | | — | | | | — | | | 9,852 | | | | 329 | | | | 10,181 | | | | Dividend | | | | — | | | | — | | | | (4,945 | ) | | | — | | | | — | | | | — | | | (4,945) | | | | (213 | ) | | | (5,158) | | Issuance of common shares (Note 17) | | | | 6,275,977 | | | | 16 | | | | 246 | | | | — | | | | — | | | | — | | | 262 | | | | — | | | | 262 | | Purchase of treasury shares | | | | — | | | | — | | | | — | | | | — | | | | (27,600,000 | ) | | | (1,339) | | | (1,339) | | | | — | | | | (1,339) | Sale of treasury shares(a) | | | | — | | | | — | | | | (71 | ) | | | — | | | | 5,939,137 | | | | 221 | | | 150 | | | | — | | | | 150 | | Share-based payments (Note 25) | | | | — | | | | — | | | | 154 | | | | — | | | | | | | | | | | 154 | | | | — | | | | 154 | | Other operations with minority interests | | | | — | | | | — | | | | — | | | | — | | | | | | | | | | | — | | | | — | | | | — | | | Share cancellation(Note 17) | | | | (30,000,000 | ) | | | (75) | | | | (1,566 | ) | | | — | | | | 30,000,000 | | | | 1,641 | | | — | | | | — | | | | — | | | Transactions with shareholders | | | | (23,724,023 | ) | | | (59) | | | | (6,182 | ) | | | — | | | | 8,339,137 | | | | 523 | | | (5,718) | | | | (213 | ) | | | (5,931) | | | As of December 31, 2008 | | | | 2,371,808,074 | | | | 5,930 | | | | 52,947 | | | | (4,876) | | | | (143,082,095 | ) | | | (5,009) | | | 48,992 | | | | 958 | | | | 49,950 | | | | Net income 2009 | | | | — | | | | — | | | | 8,447 | | | | — | | | | — | | | | — | | | 8,447 | | | | 182 | | | | 8,629 | | Other comprehensive income (Note 17) | | | | — | | | | — | | | | 246 | | | | (193) | | | | — | | | | — | | | 53 | | | | 60 | | | | 113 | | | Comprehensive income | | | | — | | | | — | | | | 8,693 | | | | (193) | | | | — | | | | — | | | 8,500 | | | | 242 | | | | 8,742 | | | | Dividend | | | | — | | | | — | | | | (5,086 | ) | | | — | | | | — | | | | — | | | (5,086) | | | | (189 | ) | | | (5,275) | | Issuance of common shares (Note 17) | | | | 1,414,810 | | | | 3 | | | | 38 | | | | — | | | | — | | | | — | | | 41 | | | | — | | | | 41 | | Purchase of treasury shares | | | | — | | | | — | | | | — | | | | — | | | | — | | | | — | | | — | | | | — | | | | — | Sale of treasury shares(a) | | | | — | | | | — | | | | (143 | ) | | | — | | | | 2,874,905 | | | | 165 | | | 22 | | | | — | | | | 22 | | Share-based payments (Note 25) | | | | — | | | | — | | | | 106 | | | | — | | | | — | | | | — | | | 106 | | | | — | | | | 106 | | Other operations with minority interests | | | | — | | | | — | | | | (23 | ) | | | — | | | | — | | | | — | | | (23) | | | | (24 | ) | | | (47) | | | Share cancellation(Note 17) | | | | (24,800,000 | ) | | | (62) | | | | (1,160 | ) | | | — | | | | 24,800,000 | | | | 1,222 | | | — | | | | — | | | | — | | | Transactions with shareholders | | | | (23,385,190 | ) | | | (59) | | | | (6,268 | ) | | | — | | | | 27,674,905 | | | | 1,387 | | | (4,940) | | | | (213 | ) | | | (5,153) | | | As of December 31, 2009 | | | | 2,348,422,884 | | | | 5,871 | | | | 55,372 | | | | (5,069) | | | | (115,407,190 | ) | | | (3,622) | | | 52,552 | | | | 987 | | | | 53,539 | | | | Net income 2010 | | | | — | | | | — | | | | 10,571 | | | | — | | | | — | | | | — | | | 10,571 | | | | 236 | | | | 10,807 | | Other comprehensive income (Note 17) | | | | — | | | | — | | | | (216 | ) | | | 2,581 | | | | — | | | | — | | | 2,365 | | | | 9 | | | | 2,374 | | | Comprehensive income | | | | — | | | | — | | | | 10,355 | | | | 2,581 | | | | — | | | | — | | | 12,936 | | | | 245 | | | | 13,181 | | | | Dividend | | | | — | | | | — | | | | (5,098 | ) | | | — | | | | — | | | | — | | | (5,098) | | | | (152 | ) | | | (5,250) | | Issuance of common shares (Note 17) | | | | 1,218,047 | | | | 3 | | | | 38 | | | | — | | | | — | | | | — | | | 41 | | | | — | | | | 41 | | Purchase of treasury shares | | | | — | | | | — | | | | — | | | | — | | | | — | | | | — | | | — | | | | — | | | | — | Sale of treasury shares(a) | | | | — | | | | — | | | | (70 | ) | | | — | | | | 2,919,511 | | | | 119 | | | 49 | | | | — | | | | 49 | | Share-based payments (Note 25) | | | | — | | | | — | | | | 140 | | | | — | | | | — | | | | — | | | 140 | | | | — | | | | 140 | | Other operations with minority interests | | | | — | | | | — | | | | (199 | ) | | | (7) | | | | — | | | | — | | | (206) | | | | (223 | ) | | | (429) | | | Share cancellation(Note 17) | | | | — | | | | — | | | | — | | | | — | | | | — | | | | — | | | — | | | | — | | | | — | | | Transactions with shareholders | | | | 1,218,047 | | | | 3 | | | | (5,189 | ) | | | (7) | | | | 2,919,511 | | | | 119 | | | (5,074) | | | | (375 | ) | | | (5,449) | | | As of December 31, 2010 | | | | 2,349,640,931 | | | | 5,874 | | | | 60,538 | | | | (2,495) | | | | (112,487,679 | ) | | | (3,503) | | | 60,414 | | | | 857 | | | | 61,271 | | |
(a) | | | | (a) | | Treasury shares related to the stock option purchase plans and restricted stock grants. |
F-7
CONSOLIDATED STATEMENT OF COMPREHENSIVE INCOME(a)
TOTAL | | | | | | | | | | | For the year ended December 31,(€ million) | | 2009 | | | 2008 | | | 2007 | | Consolidated net income | | 8,629 | | | 10,953 | | | 13,535 | | Other comprehensive income | | | | | | | | | | Currency translation adjustment | | (244 | ) | | (722 | ) | | (2,703 | ) | Available for sale financial assets | | 38 | | | (254 | ) | | 111 | | Cash flow hedge | | 128 | | | — | | | — | | Share of other comprehensive income of associates, net amount | | 234 | | | 173 | | | (406 | ) | Other | | (5 | ) | | 1 | | | (3 | ) | | | | | | | | | — | | Tax effect | | (38 | ) | | 30 | | | (6 | ) | Total other comprehensive income (net amount) (note 17) | | 113 | | | (772 | ) | | (3,007 | ) | Comprehensive income | | 8,742 | | | 10,181 | | | 10,528 | | - Group share | | 8,500 | | | 9,852 | | | 10,285 | | - Minority interests | | 242 | | | 329 | | | 243 | |
(a) | In accordance with revised IAS 1, applicable from January 1, 2009. |
TOTALNOTES TO THE CONSOLIDATED FINANCIAL STATEMENTS On February 10, 2010,2011, the Board of Directors established and authorized the publication of the Consolidated Financial Statements of TOTAL S.A. for the year ended December 31, 2009,2010, which will be submitted for approval to the shareholders’ meeting to be held on May 21, 2010.13, 2011. The Consolidated Financial Statements of TOTAL S.A. and its subsidiaries (the Group) are presented in Euros and have been prepared on the basis of IFRS (International Financial Reporting Standards) as adopted by the European Union and IFRS as issued by the IASB (International Accounting Standard Board) as of December 31, 2009.2010. The accounting principles applied in the Consolidated Financial Statements as of December 31, 20092010 were the same as those that were used as of December 31, 20082009 except for amendments and interpretations of IFRS which were mandatory for the periods beginning after January 1, 20092010 (and not early adopted). Their adoption has no material impact on the Consolidated Financial Statements as of December 31, 2009.2010. Among these new standards or interpretations it should be noted that the revised version of IAS 1 “Presentation of financial statements”, effective for annual periods beginning on or after January 1, 2009, resulted2010, the revised versions of IFRS 3 “Business Combinations” and IAS 27 “Consolidated and Separate Financial Statements” should be noted. These revised standards introduce new provisions regarding the accounting for business combinations. Their application is prospective. In addition, as of January 1, 2010, jointly-controlled entities are consolidated under the equity method, as provided for in the following:presentationalternative method of IAS 31 “Interests in Joint Ventures”. Until December 31, 2009, these entities were consolidated under the consolidated statement of comprehensive income;proportionate consolidation method. This change involves two entities and
information on other comprehensive income presented in is not material (see Note 17 to the Consolidated Financial Statements.
In addition, the IASB issued in 2009 amendments to standard IFRS 7 “Financial instruments: disclosures” which introduce new disclosure requirements, effective for annual periods beginning on or after January 1, 2009. In particular, financial instruments shall be presented according to the fair value measurement method used (three-level hierarchy described in Note 1 M(v)12 to the Consolidated Financial Statements).
Lastly, the Group has applied the new definitions and the new method of estimating oil & gas reserves resulting from U.S. Accounting Standards Update No. 2010-03, “Oil and Gas Reserve Estimation and
Disclosures”, effective for annual reporting periods ended on or after December 31, 2009. The adoption of these new rules had no significant impact on oil & gas reserve estimates and no significant impact on the Consolidated Financial Statements.
The preparation of financial statements in accordance with IFRS requires the management to make estimates and assumptions that affect the reported amounts of assets, liabilities and contingent liabilities at the date of preparation of the financial statements and reported income and expenses for the period. The management reviews these estimates and assumptions on an ongoing basis, by reference to past experience and various other factors considered as reasonable which form the basis for assessing the carrying amount of assets and liabilities. Actual results may differ significantly from these estimates, if different assumptions or circumstances apply. These judgments and estimates relate principally to the application of the successful efforts method for the oil and gas accounting, the valuation of long-lived assets, the provisions for asset retirement obligations and environmental remediation, the pensions and post-retirements benefits and the income tax computation. Furthermore, where the accounting treatment of a specific transaction is not addressed by any accounting standard or interpretation, the management applies its judgment to define and apply accounting policies that will lead to relevant and reliable information, so that the financial statements: give a true and fair view of the Group’s financial position, financial performance and cash flows;
reflect the substance of transactions;
| | | • | give a true and fair view of the Group’s financial position, financial performance and cash flows; | | • | reflect the substance of transactions; | | • | are neutral; | | • | are prepared on a prudent basis; and | | • | are complete in all material aspects. |
are prepared on a prudent basis; and
are complete in all material aspects.
1) ACCOUNTING POLICIES
Pursuant to the accrual basis of accounting followed by the Group, the financial statements reflect the effects of transactions and other events when they occur. Assets and liabilities such as property, plant and equipment and intangible assets are usually measured at amortized cost. Financial assets and liabilities are usually measured at fair value. Accounting policies used by the Group are described below: A) PRINCIPLES OF CONSOLIDATION
| | | A) | PRINCIPLES OF CONSOLIDATION |
Subsidiaries that are directly controlled by the parent company or indirectly controlled by other consolidated subsidiaries are fully consolidated. Investments in jointly-controlled entities are proportionately consolidated.consolidated under the equity method. The Group accounts for jointly-controlled operations and jointly-controlled assets by recognising its share of assets, liabilities, income and expenses.
F-8
Investments in associates, in which the Group has significant influence, are accounted for by the equity method. Significant influence is presumed when the Group holds, directly or indirectly (e.g. through subsidiaries), 20% or more of the voting rights. Companies in which ownership interest is less than 20%, but over which the Company is deemed to exercise significant influence, are also accounted for by the equity method. All significant intercompany balances, transactions and income have beenare eliminated. B) BUSINESS COMBINATIONS
Business combinations are accounted for using the purchaseacquisition method. This method implies the recognition of the acquired identifiable assets, assumed liabilities and contingent liabilities ofany minority interest in the companies acquired by the Group at their fair value. The difference between the acquisition cost of the shares and fair value of the acquired share of the assets, liabilities and contingent liabilities identified onacquirer shall recognize goodwill at the acquisition date, is recorded as goodwill.being the excess of: | | | • | The consideration transferred, the amount of minority interest and, in business combinations achieved in stages, the fair value at the acquisition date of the investment previously held in the acquired company | | • | Over the fair value at the acquisition date of acquired identifiable assets and assumed liabilities. |
If the cost of an acquisitionconsideration transferred is lesslower than the fair value of netacquired identifiable assets of the subsidiary acquired,and assumed liabilities, an additional analysis is performed on the identification and valuation of the identifiable elements of the assets and liabilities. Any residual negative goodwillbadwill is recorded as income. In transactions with minority interests, the difference between the price paid (received) and the book value of minority interests acquired (sold) is recognized directly in equity. The analysis of goodwill is finalized within one year from the acquisition date. C) FOREIGN CURRENCY TRANSLATION
Non-monetary contributions by venturers to a jointly-controlled entity in exchange for an equity interest in the jointly-controlled entity are accounted for by applying guidance provided in SIC 13 “Jointly Controlled Entities — Non-Monetary Contributions by Venturers”. A gain or loss on disposal of the previously held investment is recorded up to the share of the co-venturer in the jointly controlled entity. | | | C) | FOREIGN CURRENCY TRANSLATION |
The financial statements of subsidiaries are prepared in the currency that most clearly reflects their business environment. This is referred to as their functional currency. Transactions denominated in foreign currencies are translated at the exchange rate on the transaction date. At each balance sheet date, monetary assets and liabilities are translated at the closing rate and the resulting exchange differences are recognized in “Other income” or “Other expenses”. | | | (ii) | Translation of financial statements denominated in foreign currencies |
Assets and liabilities of foreign entities are translated into euros on the basis of the exchange rates at the end of the period. The income and cash flow statements are translated using the average exchange rates for the period. Foreign exchange differences resulting from such translations are either recorded in shareholders’ equity under “Currency translation adjustments” (for the Group share) or under “Minority interests” (for the minority share) as deemed appropriate. D) SALES AND REVENUES FROM SALES
| | | D) | SALES AND REVENUES FROM SALES |
Revenues from sales are recognized when the significant risks and rewards of ownership have been passed to the buyer and when the amount is recoverable and can be reasonably measured. Sales figures include excise taxes collected by the Group within the course of its oil distribution operations. Excise taxes are deducted from sales in order to obtain the “Revenues from sales” indicator. Revenues from sales of crude oil, natural gas and coal are recorded upon transfer of title, according to the terms of the sales contracts. Revenues from the production of crude oil and natural gas properties, in which the Group has an interest with other producers, are recognized based on actual volumes sold during the period. Any difference between volumes sold and entitlement volumes, based on the Group net working interest, areis recognized as “Crude oil and natural gas inventories” or “Accounts receivable, net” or “Accounts payable”, as appropriate. Revenues from gas transport are recognized when services are rendered. These revenues are based on the quantities transported and measured according to procedures defined in each service contract. Revenues from sales of electricity are recorded upon transfer of title,ownership, according to the terms of the related contracts. Revenues from services are recognized when the services have been rendered.
F-9
Shipping revenues and expenses from time-charter activities are recognized on a pro rata basis over a period that commences upon the unloading of the previous voyage and terminates upon the unloading of the current voyage. Shipping revenue recognition starts only when a charter has been agreed to by both the Group and the customer. Oil and gas sales are inclusive of quantities delivered that represent production royalties and taxes, when paid in cash, and outside the United States and Canada. Certain transactions within the trading activities (contracts involving quantities that are purchased to third parties then resold to third parties) are shown at their net value in sales. Exchanges of crude oil and petroleum products within normal trading activities do not generate any income and therefore these flows are shown at their net value in both the statement of income and the balance sheet. E) SHARE-BASED PAYMENTS
The Group may grant employees stock options, create employee share purchase plans and offer its employees the opportunity to subscribe to reserved capital increases. These employee benefits are recognized as expenses with a corresponding credit to shareholders’ equity. The expense is equal to the fair value of the instruments granted. The fair value of the options is calculated using the Black-Scholes model at the grant date. The expense is recognized on a straight-line basis between the grant date and vesting date. For restricted share plans, the expense is calculated using the market price at the grant date after deducting the expected distribution rate during the vesting period. The cost of employee-reserved capital increases is immediately expensed. A discount reduces the expense in order to account for the nontransferability of the shares awarded to the employees over a period of five years. F) INCOME TAXES
Income taxes disclosed in the statement of income include the current tax expenses and the deferred tax expenses. The Group uses the liability method whereby deferred income taxes are recorded based on the temporary differences between the carrying amounts of assets and liabilities recorded in the balance sheet and their tax bases, and on carry-forwards of unused tax losses and tax credits. Deferred tax assets and liabilities are measured using the tax rates that have been enacted or substantially enacted at the balance sheet date. The tax rates used depend on the timing of reversals of temporary differences, tax losses and other tax credits. The effect of a change in tax rate is recognized either in the Consolidated Statement of Income or in shareholders’ equity depending on the item it relates to. Deferred tax assets are recognized when future recovery is probable. Asset retirement obligations and finance leases give rise to the recognition of assets and liabilities for accounting purposes as described in paragraph K “Leases” and paragraph Q “Asset retirement obligations” of this Note. Deferred income taxes resulting from temporary differences between the carrying amounts and tax bases of such assets and liabilities are recognized. Deferred tax liabilities resulting from temporary differences between the carrying amounts of equity-method investments and their tax bases are recognized. The deferred tax calculation is based on the expected future tax effect (dividend distribution rate or tax rate on the gain or loss upon disposal of these investments). Taxes paid on the Upstream production are included in operating expenses, including those related to historical concessions held by the Group in the Middle East producing countries.
G) EARNINGS PER SHARE
Earnings per share is calculated by dividing net income (Group share) by the weighted-average number of common shares outstanding during the period.period, excluding TOTAL shares held by TOTAL S.A. (Treasury shares) and TOTAL shares held by the Group subsidiaries which are deducted from consolidated shareholders’ equity. Diluted earnings per share is calculated by dividing net income (Group share) by the fully-diluted weighted-average number of common shares outstanding during the period. Treasury shares held by the parent company, TOTAL S.A., and TOTAL shares held by the Group subsidiaries are deducted from consolidated shareholders’ equity. These shares are not considered outstanding for purposes of this calculation which also takes into account the dilutive effect of stock options, restricted share grants and capital increases with a subscription period closing after the end of the fiscal year. The weighted-average number of fully-diluted shares is calculated in accordance with the treasury stock method provided for by IAS 33. The proceeds, which would be recovered in the event of an exercise of rights related to dilutive instruments, are presumed to be a share buyback at the average market price over the period. The number of shares thereby obtained leads to a reduction in the total number of shares that would result from the exercise of rights.
F-10
H) OIL AND GAS EXPLORATION AND PRODUCING PROPERTIES AND MINING ACTIVITY The Group applies IFRS 6 “Exploration for and Evaluation of Mineral Resources”. Oil and gas exploration and production properties and assets are accounted for in accordance with the successful efforts method. Geological and geophysical costs, including seismic surveys for exploration purposes are expensed as incurred. Mineral interests are capitalized as intangible assets when acquired. These acquired interests are tested for impairment on a regular basis, property-by-property, based on the results of the exploratory activity and the management’s evaluation. In the event of a discovery, the unproved mineral interests are transferred to proved mineral interests at their net book value as soon as proved reserves are booked. Exploratory wells are tested for impairment on a well-by-well basis and accounted for as follows: Costs of exploratory wells which result in proved reserves are capitalized and then depreciated using the unit-of-production method based on proved developed reserves;
Costs of dry exploratory wells and wells that have not found proved reserves are charged to expense;
| | | • | Costs of exploratory wells which result in proved reserves are capitalized and then depreciated using theunit-of-production method based on proved developed reserves; | | • | Costs of dry exploratory wells and wells that have not found proved reserves are charged to expense; | | • | Costs of exploratory wells are temporarily capitalized until a determination is made as to whether the well has found proved reserves if both of the following conditions are met: |
| | | | • | The well has found a sufficient quantity of reserves to justify its completion as a producing well, if appropriate, assuming that the required capital expenditures are made; | | • | The Group is making sufficient progress assessing the reserves and the economic and operating viability of the project. This progress is evaluated on the basis of indicators such as whether additional exploratory works are under way or firmly planned (wells, seismic or significant studies), whether costs are being incurred for development studies and whether the Group is waiting for governmental or other third-party authorization of a proposed project, or availability of capacity on an existing transport or processing facility. |
Costs of exploratory wells are temporarily capitalized until a determination is made as to whether the well has found proved reserves if both of the following conditions are met:
The well has found a sufficient quantity of reserves to justify its completion as a producing well, if appropriate, assuming that the required capital expenditures are made;
The Group is making sufficient progress assessing the reserves and the economic and operating viability of the project. This progress is evaluated on the basis of indicators such as whether additional exploratory works are under way or firmly planned (wells, seismic or significant studies), whether costs are being incurred for development studies and whether the Group is waiting for governmental or other third-party authorization of a proposed project, or availability of capacity on an existing transport or processing facility.
Costs of exploratory wells not meeting these conditions are charged to expense. | | | (ii) | Oil and Gas producing assets |
Development costs incurred for the drilling of development wells and for the construction of production facilities are capitalized, together with borrowing costs incurred during the period of construction and the present value of estimated future costs of asset retirement obligations. The depletion rate is usually equal to the ratio of oil and gas production for the period to proved developed reserves (unit-of-production(unit-of-production method). With respect to production sharing contracts, this computation is based on the portion of production and reserves assigned to the Group taking into account estimates based on the contractual clauses regarding the reimbursement of exploration, development and developmentproduction costs (cost oil) as well as the sharing of hydrocarbon rights (profit oil). Transportation assets are depreciated using the unit-of-production method based on throughput or by using the straight-line method whichever best reflects the economic life of the asset. Proved mineral interests are depreciated using theunit-of-production method based on proved reserves. Before an assessment can be made on the existence of resources, exploration costs, including studies and core drilling campaigns as a whole, are expensed. When the assessment concludes that resources exist, the costs engaged subsequently to this assessment are capitalized temporarily while waiting for the field final development decision, if a positive decision is highly probable. Otherwise, these costs are expensed. Once the development decision is taken, the predevelopment costs capitalized temporarily are integrated with the cost of development and depreciated from the start of production at the same pace than development assets. Mining development costs include the initial stripping costs and all costs incurred to access resources, and particularly the costs of: | | | • | Surface infrastructures; | | • | Machinery and mobile equipment which are significantly costly; | | • | Utilities and off-sites. |
These costs are capitalized and depreciated either on a straight line basis or depleted using the UOP method from the start of production.
F-11
I) GOODWILL AND OTHER INTANGIBLE ASSETS EXCLUDING MINERAL INTERESTS Other intangible assets include goodwill, patents, trademarks, and lease rights. Intangible assets are carried at cost, after deducting any accumulated depreciation and accumulated impairment losses. Goodwill
Guidance for calculating goodwill is presented in a consolidated subsidiary is calculated asNote 1 paragraph B to the excess of the cost of shares, including transaction expenses, over the fair value of the Group’s share of the net assets at the acquisition date.Consolidated Financial Statements. Goodwill is not amortized but is tested for impairment annually or as soon as there is any indication of impairment (see Note 1 paragraph L to the Consolidated Financial Statements “Impairment of long-lived assets”)Statements). In equity affiliates, goodwill is included in the investment book value. Other intangible assets (except goodwill) have a finite useful life and are amortized on a straight-line basis over 103 to 4020 years depending on the useful life of the assets. Research costs are charged to expense as incurred. Development expenses are capitalized when the following can be demonstrated: the technical feasibility of the project and the availability of the adequate resources for the completion of the intangible asset;
the ability of the asset to generate probable future economic benefits;
| | | • | the technical feasibility of the project and the availability of the adequate resources for the completion of the intangible asset; | | • | the ability of the asset to generate probable future economic benefits; | | • | the ability to measure reliably the expenditures attributable to the asset; and | | • | the feasibility and intention of the Group to complete the intangible asset and use or sell it. |
the ability to measure reliably the expenditures attributable to the asset; and
the feasibility and intention of the Group to complete the intangible asset and use or sell it.
Advertising costs are charged to expense as incurred. J) OTHER PROPERTY, PLANT AND EQUIPMENT Other property, plant and equipment are carried at cost, after deducting any accumulated depreciation and accumulated impairment losses. This cost includes borrowing costs directly attributable to the acquisition or production of a qualifying asset incurred until assets are placed in service. Borrowing costs are capitalized as follows: if the project benefits from a specific funding, the capitalization of borrowing costs is based on the borrowing rate;
if the project is financed by all the Group’s debt, the capitalization of borrowing costs is based on the weighted average borrowing cost for the period.
| | | • | if the project benefits from a specific funding, the capitalization of borrowing costs is based on the borrowing rate; | | • | if the project is financed by all the Group’s debt, the capitalization of borrowing costs is based on the weighted average borrowing cost for the period. |
Routine maintenance and repairs are charged to expense as incurred. The costs of major turnarounds of refineries and large petrochemical units are capitalized as incurred and depreciated over the period of time between two consecutive major turnarounds. Other property, plant and equipment are depreciated using the straight-line method over their useful lives, which are as follows: | | | | | • | | Furniture, office equipment, machinery and tools | | 3-12 years | • Transportation equipments | | Transportation equipments | | 5-20 years | • | | Storage tanks and related equipment | | 10-15 years | • | | Specialized complex installations and pipelines | | 10-30 years | • | | Buildings | | 10-50 years |
A finance lease transfers substantially all the risks and rewards incidental to ownership from the lessor to the lessee. These contracts are capitalized as assets at fair value or, if lower, at the present value of the minimum lease payments according to the contract. A corresponding financial debt is recognized as a financial liability. These assets are depreciated over the corresponding useful life used by the Group. Leases that are not finance leases as defined above are recorded as operating leases. Certain arrangements do not take the legal form of a lease but convey the right to use an asset or a group of assets in return for fixed payments. Such arrangements are accounted for as leases and are analyzed to determine whether they should be classified as operating leases or as finance leases. L) IMPAIRMENT OF LONG-LIVED ASSETS
| | | L) | IMPAIRMENT OF LONG-LIVED ASSETS |
The recoverable amounts of intangible assets and property, plant and equipment are tested for impairment as soon as any indication of impairment exists. This test is performed at least annually for goodwill. The recoverable amount is the higher of the fair value (less costs to sell) or its value in use. Assets are grouped into cash-generating units (or CGUs) and tested. A cash-generating unit is a homogeneous group of assets that generates cash inflows that are largely independent of the cash inflows from other groups of assets. The value in use of a CGU is determined by reference to the discounted expected future cash flows, based upon the management’s expectation of future economic and operating conditions. If this value is less than the carrying
F-12
amount, an impairment loss on property, plant and equipment and mineral interests, or on other intangible assets, is recognized either in “Depreciation, depletion and amortization of property, plant and equipment and mineral interests” or in “Other expense”, respectively. This impairment loss is first allocated to reduce the carrying amount of any goodwill. Impairment losses recognized in prior periods can be reversed up to the original carrying amount, had the impairment loss not been recognized. Impairment losses recognized for goodwill cannot be reversed. M) FINANCIAL ASSETS AND LIABILITIES
| | | M) | FINANCIAL ASSETS AND LIABILITIES |
Financial assets and liabilities are financial loans and receivables, investments in non-consolidated companies, publicly traded equity securities, derivatives instruments and current and non-current financial liabilities. The accounting treatment of these financial assets and liabilities is as follows: | | | (i) | Loans and receivablesReceivables |
Financial loans and receivables are recognized at amortized cost. They are tested for impairment, by comparing the carrying amount of the assets to estimates of the discounted future recoverable cash flows. These tests are conducted as soon as there is any evidence that their fair value is less than their carrying amount, and at least annually. Any impairment loss is recorded in the statement of income. | | | (ii) | Investments in non-consolidated companies and publicly traded equity securitiesOther investments |
These assets are classified as financial assets available for sale and therefore measured at their fair value. For listed securities, this fair value is equal to the market price. For unlisted securities, if the fair value is not reliably determinable, securities are recorded at their historical value. Changes in fair value are recorded in shareholders’ equity. If there is any evidence of a significant or long-lasting impairment loss, an impairmenta loss is recorded in the Consolidated Statement of Income. This impairment is reversed in the statement of income only when the securities are sold. These investments are presented in the section “Other investments” of the balance sheet.
| | | (iii) | Derivative instruments |
The Group uses derivative instruments to manage its exposure to risks of changes in interest rates, foreign exchange rates and commodity prices. Changes in fair value of derivative instruments are recognized in the statement of income or in shareholders’ equity and are recognized in the balance sheet in the accounts corresponding to their nature, according to the risk management strategy described in Note 31 to the Consolidated Financial Statements. The derivative instruments used by the Group are the following: Financial instruments used for cash management purposes are part of a hedging strategy of currency and interest rate risks within global limits set by the Group and are considered to be used for transactions (held for trading). Changes in fair value are systematically recorded in the statement of income. The balance sheet value of those instruments is included in “Current financial assets” or “Other current financial liabilities”. When an external long-term financing is set up, specifically to finance subsidiaries, and when this financing involves currency and interest rate derivatives, these instruments are qualified as: | | | | | i. | Fair value hedge of the interest rate risk on the external debt and of the currency risk of the loans to subsidiaries. Changes in fair value of derivatives are recognized in the statement of income as are changes in fair value of underlying financial debts and loans to subsidiaries. |
The fair value of those hedging instruments of long-term financing is included in the assets under “Hedging instruments on non-current financial debt” or in the liabilities under “Non-current financial debt “fordebt” for the non-current portion. The current portion (less than one year) is accounted for in “Current financial assets” or “Other current financial liabilities”. In case of the anticipated termination of derivative instruments accounted for as fair value hedges, the amount paid or received is recognized in the statement of income and: If this termination is due to an early cancellation of the hedged items, the adjustment previously recorded as revaluation of those hedged items is also recognized in the statement of income;
| | | | • | If this termination is due to an early cancellation of the hedged items, the adjustment previously recorded as revaluation of those hedged items is also recognized in the statement of income; | | | • | If the hedged items remain in the balance sheet, the adjustment previously recorded as a revaluation of those hedged items is spread over the remaining life of those items. |
If the hedged items remain in the balance sheet, the adjustment previously recorded as a revaluation of those hedged items is spread over the remaining life of those items.
| | | | | ii. | Cash flow hedge of the currency risk of the external debt. Changes in fair value are recorded in equity for the effective portion of the hedging and in the statement of income for the ineffective portion of |
F-13
| | | | | the hedging. Amounts recorded in equity are transferred to the income statement when the hedged transaction affects profit or loss. |
The fair value of those hedging instruments of long-term financing is included in the assets under “Hedging instruments on non-current financial debt” or in the liabilities under “Non-current financial debt” for the non-current portion. The current portion (less than one year) is accounted for in “Current financial assets” or “Other current financial liabilities”. If the hedging instrument expires, is sold or terminated by anticipation, gains or losses previously recognized in equity remain in equity. Amounts are recycled in the income statement only when the hedged transaction affects profit or loss. • | | | • | Foreign subsidiaries’ equity hedge |
Certain financial instruments hedge against risks related to the equity of foreign subsidiaries whose functional currency is not the euro (mainly the dollar). These instruments qualify as “net investment hedges”. Changes in fair value are recorded in shareholders’ equity. The fair value of these instruments is recorded under “Current financial assets” or “Other current financial liabilities”. • | | | • | Financial instruments related to commodity
contracts |
Financial instruments related to commodity contracts, including crude oil, petroleum products, gas, power and power purchasing/sellingcoal purchase/sales contracts related towithin the trading activities, together with the commodity contract derivative instruments such as energy contracts and forward freight agreements, are used to adjust the Group’s exposure to price fluctuations within global trading limits. These instruments are considered, according to the industry practice, as held for trading.trading. Changes in fair value are recorded in the statement of income. The fair value of these instruments is recorded in “Other current assets” or “Other creditors and accrued liabilities” depending on whether they are assets or liabilities. Detailed information about derivatives positions is disclosed in Notes 20, 28, 29, 30 and 31 to the Consolidated Financial Statements. | | | (iv) | Current and non-current financial liabilities |
Current and non-current financial liabilities (excluding derivatives) are recognized at amortized cost, except those for which a hedge accounting can be applied as described in the previous paragraph. | | | (v) | Fair value of financial instruments |
Fair values are estimated for the majority of the Group’s financial instruments, with the exception of publicly traded equity securities and marketable securities for which the market price is used. Estimated fair values, which are based on principles such as discounting future cash flows to present value, must be weighted by the fact that the value of a financial instrument at a given time may be influenced by the market environment (liquidity especially), and also the fact that subsequent changes in interest rates and exchange rates are not taken into account. As a consequence, the use of different estimates, methodologies and assumptions could have a material effect on the estimated fair value amounts. The methods used are as follows: • | | | • | Financial debts, swaps |
The market value of swaps and of bonds that are hedged by those swaps havehas been determined on an individual basis by discounting future cash flows with the zero coupon interest rate curves existing at year-end. • | | | • | Financial instruments related to commodity
contracts |
The valuation methodology is to mark to market all open positions for both physical and derivative transactions. The valuations are determined on a daily basis using observable market data based on organized and over the counter (OTC) markets. In particular cases when market data are not directly available, the valuations are derived from observable data such as arbitrages, freight or spreads and market corroboration. For valuation of risks which are the result of a calculation, such as options for example, commonly known models are used to compute the fair value. • | | | • | Other financial instruments |
The fair value of the interest rate swaps and of FRA (Forward Rate Agreement) are calculated by discounting future cash flows on the basis of zero coupon interest rate curves existing at year-end after adjustment for interest accrued but unpaid. Forward exchange contracts and currency swaps are valued on the basis of a comparison of the negociated
F-14
forward rates with the rates in effect on the financial markets at year-end for similar maturities. Exchange options are valued based on the Garman-Kohlhagen model including market quotations at year-end. IFRS 7 “Financial instruments: disclosures”, amended in 2009, introduces a fair value hierarchy for financial instruments and proposes the following three-level classification :level 1: quotations for assets and liabilities (identical to the ones that are being valued) obtained at the valuation date on an active market to which the entity has access;
classification:level 2: the entry data are observable data but do not correspond to quotations for identical assets or liabilities;
| | | | • | Level 1: quotations for assets and liabilities (identical to the ones that are being valued) obtained at the valuation date on an active market to which the entity has access; | | • | Level 2: the entry data are observable data but do not correspond to quotations for identical assets or liabilities; | | • | Level 3: the entry data are not observable data. For example: these data come from extrapolation. This level applies when there is no market or observable data and the company has to use its own hypotheses to estimate the data that other market players would have used to determine the fair value of the asset. |
level 3: the entry data are not observable data. For example: these data come from extrapolation. This level applies when there is no market or observable data and the company has to use its own hypotheses to estimate the data that other market players would have used to determine the fair value of the asset.
Fair value hierarchy is disclosed in Notes 29 and 30 to the Consolidated Financial Statements. N) INVENTORIES
Inventories are measured in the Consolidated Financial Statements at the lower of historical cost or market value. Costs for petroleum and petrochemical products are determined according to the FIFO (First-In,(First-In, First-Out) method and other inventories are measured using the weighted-average cost method. Downstream (Refining — Marketing) Petroleum product inventories are mainly comprised of crude oil and refined products. Refined products principally consist of gasoline, kerosene, diesel, fuel oil and heating oil produced by the Group’s refineries. The turnover of petroleum products does not exceed two months on average. Crude oil costs include raw material and receiving costs. Refining costs principally include the crude oil costs, production costs (energy, labor, depreciation of producing assets) and allocation of production overhead (taxes, maintenance, insurance, etc.). Start-up costs and general administrative costs are excluded from the cost price of refined products. Costs of chemical products inventories consist of raw material costs, direct labor costs and an allocation of production overhead.Start-up costs and general administrative costs are excluded from the cost of inventories of chemicals products. Treasury shares of the parent company held by its subsidiaries or itself are deducted from consolidated shareholders’ equity. Gains or losses on sales of treasury shares are excluded from the determination of net income and are recognized in shareholders’ equity. P) PROVISIONS AND OTHER NON-CURRENT LIABILITIES
| | | P) | PROVISIONS AND OTHER NON-CURRENT LIABILITIES |
Provisions and non-current liabilities are comprised of liabilities for which the amount and the timing are uncertain. They arise from environmental risks, legal and tax risks, litigation and other risks. A provision is recognized when the Group has a present obligation (legal or constructive) as a result of a past event for which it is probable that an outflow of resources will be required and when a reliable estimate can be made regarding the amount of the obligation. The amount of the liability corresponds to the best possible estimate. Q) ASSET RETIREMENT OBLIGATIONS
| | | Q) | ASSET RETIREMENT OBLIGATIONS |
Asset retirement obligations, which result from a legal or constructive obligation, are recognized based on a reasonable estimate in the period in which the obligation arises. The associated asset retirement costs are capitalized as part of the carrying amount of the underlying asset and depreciated over the useful life of this asset. An entity is required to measure changes in the liability for an asset retirement obligation due to the passage of time (accretion) by applying a risk-free discount rate to the amount of the liability. The increase of the provision due to the passage of time is recognized as “Other financial expense”. R) EMPLOYEE BENEFITS
In accordance with the laws and practices of each country, the Group participates in employee benefit plans offering retirement, death and disability, healthcare and special termination benefits. These plans provide benefits based on various factors such as length of service, salaries, and contributions made to the governmental bodies responsible for the payment of benefits.
F-15
These plans can be either defined contribution or defined benefit pension plans and may be entirely or partially funded with investments made in various non-Group instruments such as mutual funds, insurance contracts, and other instruments. For defined contribution plans, expenses correspond to the contributions paid. Defined benefit obligations are determined according to the Projected Unit Method. Actuarial gains and losses may arise from differences between actuarial valuation and projected commitments (depending on new calculations or assumptions) and between projected and actual return of plan assets. The Group applies the corridor method to amortize its actuarial gains and losses. This method amortizes the net cumulative actuarial gains and losses that exceed 10% of the greater of the present value of the defined benefit obligation and the fair value of plan assets at the opening balance sheet date, over the average expected remaining working lives of the employees participating in the plan. In case of a change in or creation of a plan, the vested portion of the cost of past services is recorded immediately in the statement of income, and the unvested past service cost is amortized over the vesting period. The net periodic pension cost is recognized under “Other operating expenses”. S) CONSOLIDATED STATEMENT OF CASH FLOWS
| | | S) | CONSOLIDATED STATEMENT OF CASH FLOWS |
The Consolidated Statement of Cash Flows prepared in foreign currencies has been translated into euros using the exchange rate on the transaction date or the average exchange rate for the period. Currency translation differences arising from the translation of monetary assets and liabilities denominated in foreign currency into euros using the closing exchange rates are shown in the Consolidated Statement of Cash Flows under “Effect of exchange rates”. Therefore, the Consolidated Statement of Cash Flows will not agree with the figures derived from the Consolidated Balance Sheet. Cash and cash equivalents Cash and cash equivalents are comprised of cash on hand and highly liquid short-term investments that are easily convertible into known amounts of cash and are subject to insignificant risks of changes in value. Investments with maturity greater than three months and less than twelve months are shown under “Current financial assets”. Changes in current financial assets and liabilities are included in the financing activities section of the Consolidated Statement of Cash Flows. Non-current financial debt Changes in non-current financial debt have beenare presented as the net variation to reflect significant changes mainly related to revolving credit agreements. T) CARBON DIOXIDE EMISSION RIGHTS
| | | T) | CARBON DIOXIDE EMISSION RIGHTS |
In the absence of a current IFRS standard or interpretation on accounting for emission rights of carbon dioxide, the following principles have been applied: emission rights granted free of charge are accounted for at zero carrying amount;
liabilities resulting from potential differences between available quotas and quotas to be delivered at the end of the compliance period are accounted for as liabilities and measured at fair market value;
| | | • | emission rights granted free of charge are accounted for at zero carrying amount; | | • | liabilities resulting from potential differences between available quotas and quotas to be delivered at the end of the compliance period are accounted for as liabilities and measured at fair market value; | | • | spot market transactions are recognized in income at cost; and | | • | forward transactions are recognized at their fair market value on the face of the balance sheet. Changes in the fair value of such forward transactions are recognized in income. |
| | | U) | NON-CURRENT ASSETS HELD FOR SALE AND DISCONTINUED OPERATIONS |
spot market transactions are recognized in income at cost; and
forward transactions are recognized at their fair market value on the face of the balance sheet. Changes in the fair value of such forward transactions are recognized in income.
U) NON-CURRENT ASSETS HELD FOR SALE AND DISCONTINUED OPERATIONS
Pursuant to IFRS 5 “Non-current assets held for sale and discontinued operations”, assets and liabilities of affiliates that are held for sale are presented separately on the face of the balance sheet. Net income from discontinued operations is presented separately on the face of the statement of income. Therefore, the notes to the Consolidated Financial Statements related to the statement of income only refer to continuing operations. A discontinued operation is a component of the Group for which cash flows are independent. It represents a major line of business or geographical area of operations which has been disposed of or is currently being held for sale. V) ALTERNATIVE IFRS METHODS
| | | V) | ALTERNATIVE IFRS METHODS |
For measuring and recognizing assets and liabilities, the following choices among alternative methods allowable under IFRS have been made: | | | • | property, plant and equipment, and intangible assets are measured using historical cost model instead of revaluation model; |
F-16
property, plant and equipment, and intangible assets are measured using historical cost model instead of revaluation model;
actuarial gains and losses on pension and other post-employment benefit obligations are recognized according to the corridor method (see Note 1 paragraph R to the Consolidated Financial Statements);
jointly-controlled entities are consolidated using the proportionate method, as provided for in IAS 31 “Interests in joint ventures”.
W) NEW ACCOUNTING PRINCIPLES NOT YET IN EFFECT
| | | • | actuarial gains and losses on pension and other post-employment benefit obligations are recognized according to the corridor method (see Note 1 paragraph R to the Consolidated Financial Statements); | | • | jointly-controlled entities are consolidated under the equity method, as provided for in the alternative method of IAS 31 “Interests in joint ventures”, as from January 1st, 2010. |
| | | W) | NEW ACCOUNTING PRINCIPLES NOT YET IN EFFECT |
The standards or interpretations published respectively by the International Accounting Standards Board (IASB) and the International Financial Reporting Interpretations Committee (IFRIC) which were not yet in effect at December 31, 2009,2010, were as follows: Revised IFRS 3 “Business Combinations” and IAS 27 “Consolidated and Separate Financial Statements”
In January 2008, the IASB issued revised versions of IFRS 3 “Business Combinations” and IAS 27 “Consolidated and Separate Financial Statements”. These revised standards introduce new provisions regarding the accounting for business combinations. They are effective as of the first annual period starting after July 1, 2009 (i.e. as of January 1, 2010 for the Group). Their application is prospective.
IFRS 9 “Financial Instruments” In November 2009, the IASB issued standard IFRS 9 “Financial Instruments” that introduces new requirements for the classification and measurement of financial assets. This standard shall be completedassets, and included in October 2010 with requirements regarding classification and measurement of liabilities, derecognition of financial instruments,liabilities. This standard shall be completed with texts on impairment and hedge accounting. Under standard IFRS 9, financial assets and liabilities are generally measured either at fair value through profit or loss or at amortised cost if certain conditions are met. The standard is applicable for annual periods starting on or after January 1, 2013. The application of the standard as published in 20092010 should not have any material effect on the Group’s consolidated balance sheet, statement of income and shareholder’s equity. Revised IAS 24 “Related Party Disclosures” In November 2009, the IASB issued revised standard IAS 24 “Related Party Disclosures” that clarifies the definition of a related party and reduces the disclosure requirements for entities controlled by a government. The standard is applicable for annual periods starting on or after January 1, 2011. The application of this standard should not have any material impact on information presented in the notes to the Consolidated Financial Statements. IFRIC 17 “Distributions of Non-cash Assets to Owners”
In November 2008, the IFRIC issued interpretation IFRIC 17 “Distributions of Non-cash Assets to Owners”. The interpretation addresses the accounting of non-cash assets distributed among two entities which are not jointly-controlled. It provides that the dividend payable should be measured at the fair value of the net assets to be distributed and that any difference with the carrying amount of the net assets distributed should be recognised in profit or loss. The interpretation is effective for annual periods starting on or after July 1, 2009 (i.e. starting January 1, 2010 for the Group). The application of IFRIC 17 should not have any material effect on the Group’s consolidated balance sheet, statement of income and shareholder’s equity.
IFRIC 19 “Extinguishing Financial Liabilities with Equity Instruments” In November 2009, the IFRIC issued interpretation IFRIC 19 “Extinguishing Financial Liabilities with Equity Instruments”. The interpretation deals with accounting for debt to equity swaps. It clarifies that equity instruments issued are measured at fair value and that any difference with the carrying amount of the liability is recognised in profit or loss. The interpretation is effective for annual periods starting on or after July 1, 2010 (i.e. starting January 1, 2011 for the Group). The application of IFRIC 19 should not have any material effect on the Group’s consolidated balance sheet, statement of income and shareholder’s equity. 2) MAIN INDICATORS — INFORMATION BY BUSINESS SEGMENT
| | | 2) | MAIN INDICATORS — INFORMATION BY BUSINESS SEGMENT |
Performance indicators excluding the adjustment items, such as adjusted operating income, adjusted net operating income, and adjusted net income are meant to facilitate the analysis of the financial performance and the comparison of income between periods. Adjustment items The detail of these adjustment items is presented in Note 4 to the Consolidated Financial Statements. Adjustment items include : Adjustment items include: | |
Due to their unusual nature or particular significance, certain transactions qualified as “special items” are excluded from the business segment figures. In general, special items relate to transactions that are significant, infrequent or unusual. However, in certain instances, transactions such as restructuring costs or assets disposals, which are not considered to be representative of the normal course of business, may be qualified as special items although they may have occurred within prior years or are likely to occur again within the coming years. | | | (ii) | The inventory valuation effect |
The adjusted results of the Downstream and Chemicals segments are presented according to the replacement cost method. This method is used to assess the segments’ performance and facilitate the comparability of the segments’ performance with those of its competitors. In the replacement cost method, which approximates the LIFO (Last-In,(Last-In, First-Out) method, the variation of inventory values in the statement of income is, depending on the nature of the inventory, determined byusing either the month-end prices differential between one period and another or the average prices of the period rather than the historical value. The inventory valuation effect is the difference between the results according to the FIFO (First-In,(First-In, First-Out) and the replacement cost.
F-17
| | | (iii) | Until June 30, 2010, TOTAL’s equity share of adjustmentsadjustment items reconciling “Business net income” to Net income attributable to equity holders of Sanofi-Aventis (see Note 3, paragraph on the sales of Sanofi-Aventis shares and selected items related to Sanofi-Aventisloss of significant influence over Sanofi-Aventis) |
Main indicators: | (i) | Operating income (measure used to evaluate operating performance) |
Revenue from sales after deducting cost of goods sold and inventory variations, other operating expenses, exploration expenses and depreciation, depletion, and amortization. Operating income excludes the amortization of intangible assets other than mineral interests, currency translation adjustments and gains or losses on the disposal of assets. | | | (ii) | Net operating income (measure used to evaluate the return on capital employed) |
Operating income after taking into account the amortization of intangible assets other than mineral interests, currency translation adjustments, gains or losses on the disposal of assets, as well as all other income and expenses related to capital employed (dividends from non-consolidated companies, equity in income of affiliates, capitalized interest expenses), and after income taxes applicable to the above. The only income and expense not included in net operating income but included in net income are interest expenses related to net financial debt, after applicable income taxes (net cost of net debt) and minority interests. Operating income, net operating income, or net income excluding the effect of adjustment items described above. | | | (iv) | Fully-diluted adjusted earnings per share |
Adjusted net income divided by the fully-diluted weighted-average number of common shares. Non-current assets and working capital, at replacement cost, net of deferred income taxes and non-current liabilities. (v) | | | (vi) | ROACE (Return on Average Capital Employed) |
Ratio of adjusted net operating income to average capital employed between the beginning and the end of the period. Non-current debt, including current portion, current borrowings, other current financial liabilities less cash and cash equivalents and other current financial assets. 3) CHANGES IN THE GROUP STRUCTURE, MAIN ACQUISITIONS AND DIVESTMENTS
2009
| | | 3) | CHANGES IN THE GROUP STRUCTURE, MAIN ACQUISITIONS AND DIVESTMENTS |
During 2010, 2009 TOTAL signed an agreement with Chesapeake Energy Corporation whereby Total acquired a 25% share in Chesapeake’s Barnett shale gas portfolio locatedand 2008, main changes in the United States (StateGroup structure and main acquisitions and divestments were as follows: 2010 | | | | • | Total E&P Canada Ltd., a TOTAL subsidiary, signed in July 2010 an agreement with UTS Energy Corporation (UTS) to acquire UTS Corporation with its main asset, a 20% interest in the Fort Hills mining project in the Athabasca region of the Canadian province of Alberta. |
Total E&P Canada completed on September 30, 2010 the acquisition of Texas). The acquisitionall UTS shares for a cash amount of 3.08 Canadian dollars per share. Taking into account the cash held by UTS and acquired by TOTAL (€232 million), the cost of these assets amountedthe acquisition for TOTAL amounts to€1,562 million and it €862 million. This amount mainly represents the value of mineral interests that have been recognized as intangible assets on the face of the Consolidated Balance Sheet for€1,449 €646 million and the value of tangible assets that have been recognized on the face of the Consolidated Balance Sheet for€113 €217 million. As no cash payment has occurred in 2009, a corresponding debt has | | | | • | TOTAL completed in September 2010 an agreement for the sale to BP and Hess of its interests in the Valhall (15.72%) and Hod (25%) fields, in the Norwegian North Sea, for an amount of €800 million. | | | • | TOTAL signed in September 2010 an agreement with Santos and Petronas to acquire a 20% interest in the GLNG project in Australia. Upon completion of this transaction finalised in October 2010, the project brings together Santos (45%, operator), Petronas (35%) and TOTAL (20%). |
The acquisition cost amounts to €566 million and it mainly represents the value of mineral interests that have been recognized as intangible assets on
F-18
the face of the Consolidated Balance Sheet for €617 million. In addition, TOTAL announced in December 2010 the signature of an agreement to acquire an additional 7.5% interest in this project (see Note 34 to the Consolidated Financial Statements). | | | | • | TOTAL sold in December 2010 its 5% interest in Block 31, located in the Angolan ultra deep offshore, to the company China Sonangol International Holding Limited. |
| | | | • | TOTAL and ERG announced in January 2010 that they have signed an agreement to create a joint venture, named TotalErg, by contribution of the major part of their activities in the refining and marketing business in Italy. TotalErg has been operational since October 1st, 2010. The shareholder pact calls for joint governance as well as operating independence for the new entity. TOTAL’s interest in TotalErg is 49% and is accounted for by the equity method (see Note 12 to the Consolidated Financial Statements). |
| | | | • | TOTAL closed on April 1, 2010 the sale of its consumer specialty chemicals business, Mapa Spontex, toU.S.-based Jarden Corporation for an enterprise value of €335 million. |
| | | | • | On March 24, 2010, TOTAL S.A. filed a public tender offer followed by a squeeze out with the French Autorité des Marchés Financiers (AMF) in order to buy the 1,468,725 Elf Aquitaine shares that it did not already hold, representing 0.52% of Elf Aquitaine’s share capital and 0.27% of its voting rights, at a price of €305 per share (including the remaining 2009 dividend). On April 13, 2010, the French Autorité des Marchés Financiers (AMF) issued its clearance decision for this offer. |
The public tender offer was open from April 16 to April 29, 2010 inclusive. The Elf Aquitaine shares targeted by the offer which were not tendered to the offer have been transferred to TOTAL S.A. under the squeeze out upon payment to the shareholders equal to the offer price on the first trading day after the offer closing date, i.e. on April 30, 2010. On April 30, 2010, TOTAL S.A. announced that, following the squeeze out, it held 100% of Elf Aquitaine shares, with the transaction amounting to €450 million. In application of revised standard IAS 27 “Consolidated and Separate Financial Statements”, effective for annual periods beginning on or after January 1, 2010, transactions with minority interests are accounted for as equity transactions, i.e. in consolidated shareholder’s equity. As a consequence, following the squeeze out of the Elf Aquitaine shares by TOTAL S.A., the difference between the consideration paid and the book value of minority interests acquired was recognized directly as a decrease in equity. | | | | • | During 2010, TOTAL progressively sold 1.88% of Sanofi-Aventis’ share capital, thus reducing its interest to 5.51%. |
As from July 1, 2010, given its reduced representation on the Board of Directors and the decrease in the sections “Provisionspercentage of voting rights, TOTAL ceases to have a significant influence over Sanofi-Aventis and other non-current liabilities” and “Other creditors and accrued liabilities” for€818 million and€744 million respectively. During 2009, TOTAL progressively sold 3.99% of Sanofi-Aventis’ share capital, thus reducing its interest to 7.39%.no longer consolidates this investment under the equity method. The investment in Sanofi-Aventis is accounted for by the equity method in TOTAL’s Consolidated Financial Statements.
2008
Pursuant to the tender offer describedas a financial asset available for sale in the prospectus on May 13, 2008 and renewed byline “Other investments” of the
balance sheet at its fair value, i.e. at the stock price.Net income as of December 31, 2010 includes a €135 million gain relating to this change in the accounting treatment. 2009 | | | | | • | In December 2009, TOTAL signed an agreement with Chesapeake Energy Corporation whereby Total acquired a 25% share in Chesapeake’s Barnett shale gas portfolio located in the United States (State of Texas). The acquisition cost of these assets amounted to €1,562 million and it represented the value of mineral interests that have been recognized as intangible assets on the face of the Consolidated Balance Sheet for €1,449 million and the value of tangible assets that have been recognized on the face of the Consolidated Balance Sheet for €113 million. As no cash payment has occurred in 2009, a corresponding debt has been recognized in the |
F-19
| | | | | sections “Provisions and other non-current liabilities” and “Other creditors and accrued liabilities” for €818 million and €744 million respectively. |
| | | | • | During 2009, TOTAL progressively sold 3.99% of Sanofi-Aventis’ share capital, thus reducing its interest to 7.39%. Sanofi-Aventis is accounted for by the equity method in TOTAL’s Consolidated Financial Statements for the year ended December 31, 2009. |
2008 | | | | • | Pursuant to the tender offer described in the prospectus on May 13, 2008 and renewed by the notices on June 19, July 4 and July 16, 2008, TOTAL acquired 100% of Synenco Energy Inc’s Class A ordinary shares. Synenco’s main asset is a 60% interest in the Northern Lights project in the Athabasca region of the Canadian province of Alberta. |
The acquisition cost, net of cash acquired (€(€161 million) for all shares amounted to €352 €352 million. This cost essentially represented the value of the company’s mineral interests that have been recognized as intangible assets on the face of the Consolidated Balance Sheet for €221 €221 million. Synenco Energy Inc. is fully consolidated in TOTAL’s Consolidated Financial Statements. Its contribution to the consolidated net income for fiscal year 2008 was not material. In August 2008, TOTAL acquired the Dutch company Goal Petroleum BV. The acquisition cost amounted to€349 million. This cost essentially represented the value of the company’s mineral interests that have been recognized as intangible assets on the face of the Consolidated Balance Sheet for€292 million.
Goal Petroleum BV is fully consolidated in TOTAL’s Consolidated Financial Statements. Its contribution to the consolidated net income for fiscal year 2008 was not material.
Pursuant to the agreements signed between the partners in November 2008, the Group’s participation in the Kashagan field decreased from 18.52% to 16.81%.
During 2008, TOTAL progressively sold 1.68% of Sanofi-Aventis’ share capital, thus reducing its interest to 11.38%. Sanofi-Aventis is accounted for by the equity method in TOTAL’s Consolidated Financial Statements.
2007
Pursuant to the agreements signed in 2007, the Group’s participation in Sincor project in Venezuela decreased from 47% to 30.323%.
| | | | • | In August 2008, TOTAL acquired the Dutch company Goal Petroleum BV. The acquisition cost amounted to €349 million. This cost essentially represented the value of the company’s mineral interests that have been recognized as intangible assets on the face of the Consolidated Balance Sheet for €292 million. | | | | Goal Petroleum BV is fully consolidated in TOTAL’s Consolidated Financial Statements. Its contribution to the consolidated net income for fiscal year 2008 was not material. | | | • | Pursuant to the agreements signed between the partners in November 2008, the Group’s participation in the Kashagan field decreased from 18.52% to 16.81%. |
In December 2007, TOTAL completed the sale of its 70% interest in the Milford Haven Refinery in Wales (UK) to its partner Murco Petroleum Company. This operation will allow TOTAL to concentrate its UK refining operations at the wholly-owned Lindsey Oil Refinery.
During the fourth quarter 2007, TOTAL progressively sold 0.4% of Sanofi-Aventis’ share capital, thus reducing its interest to 13.06%. Sanofi-Aventis is accounted for by the equity method in TOTAL’s Consolidated Financial Statements.
4) BUSINESS SEGMENT INFORMATION
| | | | • | During 2008, TOTAL progressively sold 1.68% of Sanofi-Aventis’ share capital, thus reducing its interest to 11.38%. Sanofi-Aventis is accounted for by the equity method in TOTAL’s Consolidated Financial Statements for the year ended December 31, 2008. |
| | | 4) | BUSINESS SEGMENT INFORMATION |
Financial information by business segment is reported in accordance with the internal reporting system and shows internal segment information that is used to manage and measure the performance of TOTAL. The Group’s activities are conducted through three business segments: Upstream, Downstream and Chemicals. the Upstream segment includes the activities of the Exploration & Production division and the Gas & Power division;
the Downstream segment includes activities of the Refining & Marketing division and the Trading & Shipping division; and
| | | • | The Upstream segment includes the activities of the Exploration & Production division and the Gas & Power division; | | • | The Downstream segment includes activities of the Refining & Marketing division and the Trading & Shipping division; and | | • | The Chemicals segment includes Base Chemicals and Specialties. |
the Chemicals segment includes Base Chemicals and Specialties.
The Corporate segment includes the operating and financial activities of the holding companies (including the investment in Sanofi-Aventis). The operational profit and assets are broken down by business segment prior to the consolidation and inter-segment adjustments. Sales prices between business segments approximate market prices.
F-20
A) INFORMATION BY BUSINESS SEGMENT
| | | | | | | | | | | | | | | | | | | For the year ended December 31, 2009 (€ million) | | Upstream | | | Downstream | | | Chemicals | | | Corporate | | | Intercompany | | | Total | | Non-Group sales | | 16,072 | | | 100,518 | | | 14,726 | | | 11 | | | — | | | 131,327 | | Intersegment sales | | 15,958 | | | 3,786 | | | 735 | | | 156 | | | (20,635 | ) | | — | | Excise taxes | | — | | | (19,174 | ) | | — | | | — | | | — | | | (19,174 | ) | Revenues from sales | | 32,030 | | | 85,130 | | | 15,461 | | | 167 | | | (20,635 | ) | | 112,153 | | Operating expenses | | (14,752 | ) | | (81,281 | ) | | (14,293 | ) | | (656 | ) | | 20,635 | | | (90,347 | ) | Depreciation, depletion and amortization of tangible assets and mineral interests | | (4,420 | ) | | (1,612 | ) | | (615 | ) | | (35 | ) | | — | | | (6,682 | ) | Operating income | | 12,858 | | | 2,237 | | | 553 | | | (524 | ) | | — | | | 15,124 | | Equity in income (loss) of affiliates and other items | | 846 | | | 169 | | | (58 | ) | | 697 | | | — | | | 1,654 | | Tax on net operating income | | (7,486 | ) | | (633 | ) | | (92 | ) | | 326 | | | — | | | (7,885 | ) | Net operating income | | 6,218 | | | 1,773 | | | 403 | | | 499 | | | — | | | 8,893 | | Net cost of net debt | | | | | | | | | | | | | | | | | (264 | ) | Minority interests | | | | | | | | | | | | | | | | | (182 | ) | Net income | | | | | | | | | | | | | | | | | 8,447 | |
| | | | | | | | | | | | | | | | | | For the year ended December 31, 2009
(adjustments(a)) (€ million) | | Upstream | | | Downstream | | | Chemicals | | | Corporate | | | Intercompany | | Total | | Non-Group sales | | | | | | | | | | | | | | | | | | Intersegment sales | | | | | | | | | | | | | | | | | | Excise taxes | | | | | | | | | | | | | | | | | | Revenues from sales | | | | | | | | | | | | | | | | | | Operating expenses | | (17 | ) | | 1,558 | | | 344 | | | — | | | | | 1,885 | | Depreciation, depletion and amortization of tangible assets and mineral interests | | (4 | ) | | (347 | ) | | (40 | ) | | — | | | | | (391 | ) | Operating income(b) | | (21 | ) | | 1,211 | | | 304 | | | — | | | | | 1,494 | | Equity in income (loss) of affiliates and other items(c) | | (160 | ) | | 22 | | | (123 | ) | | (117 | ) | | | | (378 | ) | Tax on net operating income | | 17 | | | (413 | ) | | (50 | ) | | (3 | ) | | | | (449 | ) | Net operating income(b) | | (164 | ) | | 820 | | | 131 | | | (120 | ) | | | | 667 | | Net cost of net debt | | | | | | | | | | | | | | | | — | | Minority interests | | | | | | | | | | | | | | | | (4 | ) | Net income | | | | | | | | | | | | | | | | 663 | |
(a) | | | A) | INFORMATION BY BUSINESS SEGMENT |
| | | | | | | | | | | | | | | | | | | | | | | | | | For the year ended December 31, 2010
| | | | | | | | | | | | | | | | | | | | (M€) | | Upstream
| | | Downstream
| | | Chemicals
| | | Corporate
| | | Intercompany
| | | Total
| | | Non-Group sales | | | 18,527 | | | | 123,245 | | | | 17,490 | | | | 7 | | | | — | | | | 159,269 | | | Intersegment sales | | | 22,540 | | | | 4,693 | | | | 981 | | | | 186 | | | | (28,400 | ) | | | — | | | Excise taxes | | | — | | | | (18,793 | ) | | | — | | | | — | | | | — | | | | (18,793 | ) | | | | | | | | | | | | | | | | | | | | | | | | | | | Revenues from sales | | | 41,067 | | | | 109,145 | | | | 18,471 | | | | 193 | | | | (28,400 | ) | | | 140,476 | | | | | | | | | | | | | | | | | | | | | | | | | | | | | Operating expenses | | | (18,271 | ) | | | (105,660 | ) | | | (16,974 | ) | | | (665 | ) | | | 28,400 | | | | (113,170 | ) | | Depreciation, depletion and amortization of tangible assets and mineral interests | | | (5,346 | ) | | | (2,503 | ) | | | (533 | ) | | | (39 | ) | | | — | | | | (8,421 | ) | | | | | | | | | | | | | | | | | | | | | | | | | | | Operating income | | | 17,450 | | | | 982 | | | | 964 | | | | (511 | ) | | | — | | | | 18,885 | | | | | | | | | | | | | | | | | | | | | | | | | | | | | Equity in income (loss) of affiliates and other items | | | 1,533 | | | | 141 | | | | 215 | | | | 595 | | | | — | | | | 2,484 | | | Tax on net operating income | | | (10,131 | ) | | | (201 | ) | | | (267 | ) | | | 263 | | | | — | | | | (10,336 | ) | | | | | | | | | | | | | | | | | | | | | | | | | | | Net operating income | | | 8,852 | | | | 922 | | | | 912 | | | | 347 | | | | — | | | | 11,033 | | | | | | | | | | | | | | | | | | | | | | | | | | | | | Net cost of net debt | | | | | | | | | | | | | | | | | | | | | | | (226 | ) | | Minority interests | | | | | | | | | | | | | | | | | | | | | | | (236 | ) | | | | | | | | | | | | | | | | | | | | | | | | | | | Net income | | | | | | | | | | | | | | | | | | | | | | | 10,571 | | | | | | | | | | | | | | | | | | | | | | | | | | | |
| | | | | | | | | | | | | | | | | | | | | | | | | | For the year ended December 31, 2010 (adjustments(a))
| | | | | | | | | | | | | | | | | | | | (M€) | | Upstream
| | | Downstream
| | | Chemicals
| | | Corporate
| | | Intercompany
| | | Total
| | | Non-Group sales | | | | | | | | | | | | | | | | | | | | | | | | | | Intersegment sales | | | | | | | | | | | | | | | | | | | | | | | | | | Excise taxes | | | | | | | | | | | | | | | | | | | | | | | | | | | | | | | | | | | | | | | | | | | | | | | | | | | Revenues from sales | | | | | | | | | | | | | | | | | | | | | | | | | | | | | | | | | | | | | | | | | | | | | | | | | | | | Operating expenses | | | — | | | | 923 | | | | 92 | | | | — | | | | | | | | 1,015 | | | Depreciation, depletion and amortization of tangible assets and mineral interests | | | (203 | ) | | | (1,192 | ) | | | (21 | ) | | | — | | | | | | | | (1,416 | ) | | | | | | | | | | | | | | | | | | | | | | | | | | | Operating income(b) | | | (203 | ) | | | (269 | ) | | | 71 | | | | — | | | | | | | | (401 | ) | | | | | | | | | | | | | | | | | | | | | | | | | | | Equity in income (loss) of affiliates and other items(c) | | | 183 | | | | (126 | ) | | | (16 | ) | | | 227 | | | | | | | | 268 | | | Tax on net operating income | | | 275 | | | | 149 | | | | — | | | | (6 | ) | | | | | | | 418 | | | | | | | | | | | | | | | | | | | | | | | | | | | | Net operating income(b) | | | 255 | | | | (246 | ) | | | 55 | | | | 221 | | | | | | | | 285 | | | | | | | | | | | | | | | | | | | | | | | | | | | | | Net cost of net debt | | | | | | | | | | | | | | | | | | | | | | | — | | | Minority interests | | | | | | | | | | | | | | | | | | | | | | | (2 | ) | | | | | | | | | | | | | | | | | | | | | | | | | | | Net income | | | | | | | | | | | | | | | | | | | | | | | 283 | | | | | | | | | | | | | | | | | | | | | | | | | | | |
| | | | (a) | | Adjustments include special items, inventory valuation effect and, until June 30, 2010, equity share of adjustments and selected items related to Sanofi-Aventis. |
| | | | | | | | | | | | | | (b) Of which inventory valuation effect | | Upstream | | Downstream | | Chemicals | | Corporate | | | | | | | | | (b) Of which inventory valuation effect | | Upstream | | | Downstream | | | Chemicals | | | Corporate | | | on operating income | | | — | | 1,816 | | 389863 | | — | | | 130 | | | | — | | on net operating income
| | | — | | 1,285 | | 254640 | | — | | | 113 | | | | — | | (c) Of which equity share of adjustments and selected items related to Sanofi-Aventis
| | | — | | — | | — | | (300 | ) | | — | | | | (81 | ) |
F-21
| | | | | | | | | | | | | | | | | | | For the year ended December 31, 2009
(adjusted) (€ million) | | Upstream | | | Downstream | | | Chemicals | | | Corporate | | | Intercompany | | | Total | | Non-Group sales | | 16,072 | | | 100,518 | | | 14,726 | | | 11 | | | — | | | 131,327 | | Intersegment sales | | 15,958 | | | 3,786 | | | 735 | | | 156 | | | (20,635 | ) | | — | | Excise taxes | | — | | | (19,174 | ) | | — | | | — | | | — | | | (19,174 | ) | Revenues from sales | | 32,030 | | | 85,130 | | | 15,461 | | | 167 | | | (20,635 | ) | | 112,153 | | Operating expenses | | (14,735 | ) | | (82,839 | ) | | (14,637 | ) | | (656 | ) | | 20,635 | | | (92,232 | ) | Depreciation, depletion and amortization of tangible assets and mineral interests | | (4,416 | ) | | (1,265 | ) | | (575 | ) | | (35 | ) | | — | | | (6,291 | ) | Adjusted operating income | | 12,879 | | | 1,026 | | | 249 | | | (524 | ) | | — | | | 13,630 | | Equity in income (loss) of affiliates and other items | | 1,006 | | | 147 | | | 65 | | | 814 | | | — | | | 2,032 | | Tax on net operating income | | (7,503 | ) | | (220 | ) | | (42 | ) | | 329 | | | — | | | (7,436 | ) | Adjusted net operating income | | 6,382 | | | 953 | | | 272 | | | 619 | | | — | | | 8,226 | | Net cost of net debt | | | | | | | | | | | | | | | | | (264 | ) | Minority interests | | | | | | | | | | | | | | | | | (178 | ) | Adjusted net income | | | | | | | | | | | | | | | | | 7,784 | |
| | | | | | | | | | | | | | | | | | For the year ended December 31, 2009 (€ million) | | Upstream | | | Downstream | | | Chemicals | | | Corporate | | | Intercompany | | Total | | Total expenditures | | 9,855 | | | 2,771 | | | 631 | | | 92 | | | | | 13,349 | | Total divestments | | 398 | | | 133 | | | 47 | | | 2,503 | | | | | 3,081 | | Cash flow from operating activities | | 10,200 | | | 1,164 | | | 1,082 | | | (86 | ) | | | | 12,360 | | Balance sheet as of December 31, 2009 | | | | | | | | | | | | | | | | | | Property, plant and equipment, intangible assets, net | | 43,997 | | | 9,588 | | | 5,248 | | | 271 | | | | | 59,104 | | Investments in equity affiliates | | 4,260 | | | 2,110 | | | 652 | | | 4,235 | | | | | 11,257 | | Loans to equity affiliates and other non-current assets | | 3,844 | | | 1,369 | | | 850 | | | 547 | | | | | 6,610 | | Working capital | | 660 | | | 7,624 | | | 2,151 | | | 58 | | | | | 10,493 | | Provisions and other non-current liabilities | | (15,364 | ) | | (2,190 | ) | | (1,721 | ) | | (1,094 | ) | | | | (20,369 | ) | Capital Employed (balance sheet) | | 37,397 | | | 18,501 | | | 7,180 | | | 4,017 | | | | | 67,095 | | Less inventory valuation effect | | — | | | (3,202 | ) | | (282 | ) | | 840 | | | | | (2,644 | ) | Capital Employed (Business segment information) | | 37,397 | | | 15,299 | | | 6,898 | | | 4,857 | | | | | 64,451 | | ROACE as a percentage | | 18% | | | 7% | | | 4% | | | | | | | | 13% | |
| | | | | | | | | | | | | | | | | | | For the year ended December 31, 2008 (€ million) | | Upstream | | | Downstream | | | Chemicals | | | Corporate | | | Intercompany | | | Total | | Non-Group sales | | 24,256 | | | 135,524 | | | 20,150 | | | 46 | | | — | | | 179,976 | | Intersegment sales | | 25,132 | | | 5,574 | | | 1,252 | | | 120 | | | (32,078 | ) | | — | | Excise taxes | | — | | | (19,645 | ) | | — | | | — | | | — | | | (19,645 | ) | Revenues from sales | | 49,388 | | | 121,453 | | | 21,402 | | | 166 | | | (32,078 | ) | | 160,331 | | Operating expenses | | (21,915 | ) | | (119,425 | ) | | (20,942 | ) | | (685 | ) | | 32,078 | | | (130,889 | ) | Depreciation, depletion and amortization of tangible assets and mineral interests | | (4,005 | ) | | (1,202 | ) | | (518 | ) | | (30 | ) | | — | | | (5,755 | ) | Operating income | | 23,468 | | | 826 | | | (58 | ) | | (549 | ) | | — | | | 23,687 | | Equity in income (loss) of affiliates and other items | | 1,541 | | | (158 | ) | | (34 | ) | | 590 | | | — | | | 1,939 | | Tax on net operating income | | (14,563 | ) | | (143 | ) | | 76 | | | 315 | | | — | | | (14,315 | ) | Net operating income | | 10,446 | | | 525 | | | (16 | ) | | 356 | | | — | | | 11,311 | | Net cost of net debt | | | | | | | | | | | | | | | | | (358 | ) | Minority interests | | | | | | | | | | | | | | | | | (363 | ) | Net income | | | | | | | | | | | | | | | | | 10,590 | |
| | | | | | | | | | | | | | | | | | For the year ended December 31, 2008
(adjustments(a))
(€ million) | | Upstream | | | Downstream | | | Chemicals | | | Corporate | | | Intercompany | | Total | | Non-Group sales | | | | | | | | | | | | | | | | | | Intersegment sales | | | | | | | | | | | | | | | | | | Excise taxes | | | | | | | | | | | | | | | | | | Revenues from sales | | | | | | | | | | | | | | | | | | | Operating expenses | | — | | | (2,776 | ) | | (925 | ) | | — | | | | | (3,701 | ) | Depreciation, depletion and amortization of tangible assets and mineral interest | | (171 | ) | | — | | | (6 | ) | | — | | | | | (177 | ) | Operating income(b) | | (171 | ) | | (2,776 | ) | | (931 | ) | | — | | | | | (3,878 | ) | Equity in income (loss) of affiliates and other items(c) | | (164 | ) | | (195 | ) | | (82 | ) | | (345 | ) | | | | (786 | ) | Tax on net operating income | | 57 | | | 927 | | | 329 | | | (2 | ) | | | | 1,311 | | Net operating income(b) | | (278 | ) | | (2,044 | ) | | (684 | ) | | (347 | ) | | | | (3,353 | ) | Net cost of net debt | | | | | | | | | | | | | | | | — | | Minority interests | | | | | | | | | | | | | | | | 23 | | Net income | | | | | | | | | | | | | | | | (3,330 | ) |
| | | | | | | | | | | | | | | | | | | | | | | | | | For the year ended December 31, 2010 (adjusted)
| | | | | | | | | | | | | | | | | | | | (M€)(a) | | Upstream
| | | Downstream
| | | Chemicals
| | | Corporate
| | | Intercompany
| | | Total
| | | Non-Group sales | | | 18,527 | | | | 123,245 | | | | 17,490 | | | | 7 | | | | — | | | | 159,269 | | | Intersegment sales | | | 22,540 | | | | 4,693 | | | | 981 | | | | 186 | | | | (28,400 | ) | | | — | | | Excise taxes | | | — | | | | (18,793 | ) | | | — | | | | — | | | | — | | | | (18,793 | ) | | | | | | | | | | | | | | | | | | | | | | | | | | | Revenues from sales | | | 41,067 | | | | 109,145 | | | | 18,471 | | | | 193 | | | | (28,400 | ) | | | 140,476 | | | | | | | | | | | | | | | | | | | | | | | | | | | | | Operating expenses | | | (18,271 | ) | | | (106,583 | ) | | | (17,066 | ) | | | (665 | ) | | | 28,400 | | | | (114,185 | ) | | Depreciation, depletion and amortization of tangible assets and mineral interests | | | (5,143 | ) | | | (1,311 | ) | | | (512 | ) | | | (39 | ) | | | — | | | | (7,005 | ) | | | | | | | | | | | | | | | | | | | | | | | | | | | Adjusted operating income | | | 17,653 | | | | 1,251 | | | | 893 | | | | (511 | ) | | | — | | | | 19,286 | | | | | | | | | | | | | | | | | | | | | | | | | | | | | Equity in income (loss) of affiliates and other items | | | 1,350 | | | | 267 | | | | 231 | | | | 368 | | | | — | | | | 2,216 | | | Tax on net operating income | | | (10,406 | ) | | | (350 | ) | | | (267 | ) | | | 269 | | | | — | | | | (10,754 | ) | | | | | | | | | | | | | | | | | | | | | | | | | | | Adjusted net operating income | | | 8,597 | | | | 1,168 | | | | 857 | | | | 126 | | | | — | | | | 10,748 | | | | | | | | | | | | | | | | | | | | | | | | | | | | | Net cost of net debt | | | | | | | | | | | | | | | | | | | | | | | (226 | ) | | Minority interests | | | | | | | | | | | | | | | | | | | | | | | (234 | ) | | | | | | | | | | | | | | | | | | | | | | | | | | | Adjusted net income | | | | | | | | | | | | | | | | | | | | | | | 10,288 | | | | | | | | | | | | | | | | | | | | | | | | | | | | Adjusted fully-diluted earnings per share (€) | | | | | | | | | | | | | | | | | | | | | | | 4.58 | | | | | | | | | | | | | | | | | | | | | | | | | | | |
(a) | | | | (a) | | Except for earnings per share |
| | | | | | | | | | | | | | | | | | | | | | | | | | For the year ended December 31, 2010
| | | | | | | | | | | | | | | | | | | | (M€) | | Upstream
| | | Downstream
| | | Chemicals
| | | Corporate
| | | Intercompany
| | | Total
| | | Total expenditures | | | 13,208 | | | | 2,343 | | | | 641 | | | | 81 | | | | | | | | 16,273 | | | Total divestments | | | 2,067 | | | | 499 | | | | 347 | | | | 1,403 | | | | | | | | 4,316 | | | Cash flow from operating activities | | | 15,573 | | | | 1,441 | | | | 934 | | | | 545 | | | | | | | | 18,493 | | | | | | | | | | | | | | | | | | | | | | | | | | | | Balance sheet as of December 31, 2010 | | | | | | | | | | | | | | | | | | | | | | | | | | | | | | | | | | | | | | | | | | | | | | | | | | | | Property, plant and equipment, intangible assets, net | | | 50,565 | | | | 8,675 | | | | 4,388 | | | | 253 | | | | | | | | 63,881 | | | Investments in equity affiliates | | | 5,002 | | | | 2,782 | | | | 1,349 | | | | — | | | | | | | | 9,133 | | | Loans to equity affiliates and other non-current assets | | | 4,184 | | | | 1,366 | | | | 979 | | | | 4,099 | | | | | | | | 10,628 | | | Working capital | | | (363 | ) | | | 9,154 | | | | 2,223 | | | | (211 | ) | | | | | | | 10,803 | | | Provisions and other non-current liabilities | | | (16,076 | ) | | | (2,328 | ) | | | (1,631 | ) | | | (1,181 | ) | | | | | | | (21,216 | ) | | Assets and liabilities classified as held for sale | | | 660 | | | | — | | | | 413 | | | | — | | | | | | | | 1,073 | | | | | | | | | | | | | | | | | | | | | | | | | | | | Capital Employed (balance sheet) | | | 43,972 | | | | 19,649 | | | | 7,721 | | | | 2,960 | | | | | | | | 74,302 | | | Less inventory valuation effect | | | — | | | | (4,088 | ) | | | (409 | ) | | | 1,061 | | | | | | | | (3,436 | ) | | | | | | | | | | | | | | | | | | | | | | | | | | | Capital Employed (Business segment information) | | | 43,972 | | | | 15,561 | | | | 7,312 | | | | 4,021 | | | | | | | | 70,866 | | | | | | | | | | | | | | | | | | | | | | | | | | | | ROACE as a percentage | | | 21% | | | | 8% | | | | 12% | | | | | | | | | | | | 16% | | | | | | | | | | | | | | | | | | | | | | | | | | | |
F-22
| | | | | | | | | | | | | | | | | | | | | | | | | | For the year ended December 31, 2009
| | | | | | | | | | | | | | | | | | | | (M€) | | Upstream
| | | Downstream
| | | Chemicals
| | | Corporate
| | | Intercompany
| | | Total
| | | Non-Group sales | | | 16,072 | | | | 100,518 | | | | 14,726 | | | | 11 | | | | — | | | | 131,327 | | | Intersegment sales | | | 15,958 | | | | 3,786 | | | | 735 | | | | 156 | | | | (20,635 | ) | | | — | | | Excise taxes | | | — | | | | (19,174 | ) | | | — | | | | — | | | | — | | | | (19,174 | ) | | | | | | | | | | | | | | | | | | | | | | | | | | | Revenues from sales | | | 32,030 | | | | 85,130 | | | | 15,461 | | | | 167 | | | | (20,635 | ) | | | 112,153 | | | | | | | | | | | | | | | | | | | | | | | | | | | | | Operating expenses | | | (14,752 | ) | | | (81,281 | ) | | | (14,293 | ) | | | (656 | ) | | | 20,635 | | | | (90,347 | ) | | Depreciation, depletion and amortization of tangible assets and mineral interests | | | (4,420 | ) | | | (1,612 | ) | | | (615 | ) | | | (35 | ) | | | — | | | | (6,682 | ) | | | | | | | | | | | | | | | | | | | | | | | | | | | Operating income | | | 12,858 | | | | 2,237 | | | | 553 | | | | (524 | ) | | | — | | | | 15,124 | | | | | | | | | | | | | | | | | | | | | | | | | | | | | Equity in income (loss) of affiliates and other items | | | 846 | | | | 169 | | | | (58 | ) | | | 697 | | | | — | | | | 1,654 | | | Tax on net operating income | | | (7,486 | ) | | | (633 | ) | | | (92 | ) | | | 326 | | | | — | | | | (7,885 | ) | | | | | | | | | | | | | | | | | | | | | | | | | | | Net operating income | | | 6,218 | | | | 1,773 | | | | 403 | | | | 499 | | | | — | | | | 8,893 | | | | | | | | | | | | | | | | | | | | | | | | | | | | | Net cost of net debt | | | | | | | | | | | | | | | | | | | | | | | (264 | ) | | Minority interests | | | | | | | | | | | | | | | | | | | | | | | (182 | ) | | | | | | | | | | | | | | | | | | | | | | | | | | | Net income | | | | | | | | | | | | | | | | | | | | | | | 8,447 | | | | | | | | | | | | | | | | | | | | | | | | | | | |
| | | | | | | | | | | | | | | | | | | | | | | | | | For the year ended December 31, 2009 (adjustments(a))
| | | | | | | | | | | | | | | | | | | | (M€) | | Upstream
| | | Downstream
| | | Chemicals
| | | Corporate
| | | Intercompany
| | | Total
| | | Non-Group sales | | | | | | | | | | | | | | | | | | | | | | | | | | Intersegment sales | | | | | | | | | | | | | | | | | | | | | | | | | | Excise taxes | | | | | | | | | | | | | | | | | | | | | | | | | | | | | | | | | | | | | | | | | | | | | | | | | | | Revenues from sales | | | | | | | | | | | | | | | | | | | | | | | | | | | | | | | | | | | | | | | | | | | | | | | | | | | | Operating expenses | | | (17 | ) | | | 1,558 | | | | 344 | | | | — | | | | | | | | 1,885 | | | Depreciation, depletion and amortization of tangible assets and mineral interests | | | (4 | ) | | | (347 | ) | | | (40 | ) | | | — | | | | | | | | (391 | ) | | | | | | | | | | | | | | | | | | | | | | | | | | | Operating income(b) | | | (21 | ) | | | 1,211 | | | | 304 | | | | — | | | | | | | | 1,494 | | | | | | | | | | | | | | | | | | | | | | | | | | | | Equity in income (loss) of affiliates and other items(c) | | | (160 | ) | | | 22 | | | | (123 | ) | | | (117 | ) | | | | | | | (378 | ) | | Tax on net operating income | | | 17 | | | | (413 | ) | | | (50 | ) | | | (3 | ) | | | | | | | (449 | ) | | | | | | | | | | | | | | | | | | | | | | | | | | | Net operating income(b) | | | (164 | ) | | | 820 | | | | 131 | | | | (120 | ) | | | | | | | 667 | | | | | | | | | | | | | | | | | | | | | | | | | | | | | Net cost of net debt | | | | | | | | | | | | | | | | | | | | | | | — | | | Minority interests | | | | | | | | | | | | | | | | | | | | | | | (4 | ) | | | | | | | | | | | | | | | | | | | | | | | | | | | Net income | | | | | | | | | | | | | | | | | | | | | | | 663 | | | | | | | | | | | | | | | | | | | | | | | | | | | |
| | | | (a) | | Adjustments include special items, inventory valuation effect and equity share of adjustments related to Sanofi-Aventis. |
| | | | | | | | | | | | | | | | | (b) Of which inventory valuation effect | | Upstream | | Downstream | | | ChemicalsDownstream | | | CorporateChemicals | | | Corporate | | | on operating income
| | | — | | (2,776 | ) | | (7271,816 | ) | | — | | | 389 | | | | — | | on net operating income
| | | — | | (1,971 | ) | | (5041,285 | ) | | — | | | 254 | | | | — | | (c) Of which equity share of adjustments related to Sanofi-Aventis
| | | — | | | | — | | | | — | | | | (300 | ) |
F-23
| | | | | | | | | | | | | | | | | | | | | | | | | | For the year ended December 31, 2009
| | | | | | | | | | | | | | | | | | | (adjusted)
| | | | | | | | | | | | | | | | | | | | (M€)(a) | | Upstream
| | | Downstream
| | | Chemicals
| | | Corporate
| | | Intercompany
| | | Total
| | | Non-Group sales | | | 16,072 | | | | 100,518 | | | | 14,726 | | | | 11 | | | | — | | | | 131,327 | | | Intersegment sales | | | 15,958 | | | | 3,786 | | | | 735 | | | | 156 | | | | (20,635 | ) | | | — | | | Excise taxes | | | — | | | | (19,174 | ) | | | — | | | | — | | | | — | | | | (19,174 | ) | | | | | | | | | | | | | | | | | | | | | | | | | | | Revenues from sales | | | 32,030 | | | | 85,130 | | | | 15,461 | | | | 167 | | | | (20,635 | ) | | | 112,153 | | | | | | | | | | | | | | | | | | | | | | | | | | | | | Operating expenses | | | (14,735 | ) | | | (82,839 | ) | | | (14,637 | ) | | | (656 | ) | | | 20,635 | | | | (92,232 | ) | | Depreciation, depletion and amortization of tangible assets and mineral interests | | | (4,416 | ) | | | (1,265 | ) | | | (575 | ) | | | (35 | ) | | | — | | | | (6,291 | ) | | | | | | | | | | | | | | | | | | | | | | | | | | | Adjusted operating income | | | 12,879 | | | | 1,026 | | | | 249 | | | | (524 | ) | | | — | | | | 13,630 | | | | | | | | | | | | | | | | | | | | | | | | | | | | | Equity in income (loss) of affiliates and other items | | | 1,006 | | | | 147 | | | | 65 | | | | 814 | | | | — | | | | 2,032 | | | Tax on net operating income | | | (7,503 | ) | | | (220 | ) | | | (42 | ) | | | 329 | | | | — | | | | (7,436 | ) | | | | | | | | | | | | | | | | | | | | | | | | | | | Adjusted net operating income | | | 6,382 | | | | 953 | | | | 272 | | | | 619 | | | | — | | | | 8,226 | | | | | | | | | | | | | | | | | | | | | | | | | | | | | Net cost of net debt | | | | | | | | | | | | | | | | | | | | | | | (264 | ) | | Minority interests | | | | | | | | | | | | | | | | | | | | | | | (178 | ) | | | | | | | | | | | | | | | | | | | | | | | | | | | Adjusted net income | | | | | | | | | | | | | | | | | | | | | | | 7,784 | | | | | | | | | | | | | | | | | | | | | | | | | | | | Adjusted fully-diluted earnings per share (€) | | | | | | | | | | | | | | | | | | | | | | | 3.48 | | | | | | | | | | | | | | | | | | | | | | | | | | | |
| | | | (a) | | Except for earnings per share |
| | | | | | | | | | | | | | | | | | | | | | | | | | For the year ended December 31, 2009
| | | | | | | | | | | | | | | | | | | | (M€) | | Upstream
| | | Downstream
| | | Chemicals
| | | Corporate
| | | Intercompany
| | | Total
| | | Total expenditures | | | 9,855 | | | | 2,771 | | | | 631 | | | | 92 | | | | | | | | 13,349 | | | Total divestments | | | 398 | | | | 133 | | | | 47 | | | | 2,503 | | | | | | | | 3,081 | | | Cash flow from operating activities | | | 10,200 | | | | 1,164 | | | | 1,082 | | | | (86 | ) | | | | | | | 12,360 | | | | | | | | | | | | | | | | | | | | | | | | | | | | Balance sheet as of December 31, 2009 | | | | | | | | | | | | | | | | | | | | | | | | | | | | | | | | | | | | | | | | | | | | | | | | | | | | Property, plant and equipment, intangible assets, net | | | 43,997 | | | | 9,588 | | | | 5,248 | | | | 271 | | | | | | | | 59,104 | | | Investments in equity affiliates | | | 4,260 | | | | 2,110 | | | | 652 | | | | 4,235 | | | | | | | | 11,257 | | | Loans to equity affiliates and other non-current assets | | | 3,844 | | | | 1,369 | | | | 850 | | | | 547 | | | | | | | | 6,610 | | | Working capital | | | 660 | | | | 7,624 | | | | 2,151 | | | | 58 | | | | | | | | 10,493 | | | Provisions and other non-current liabilities | | | (15,364 | ) | | | (2,190 | ) | | | (1,721 | ) | | | (1,094 | ) | | | | | | | (20,369 | ) | | Assets and liabilities classified as held for sale | | | — | | | | — | | | | — | | | | — | | | | | | | | — | | | | | | | | | | | | | | | | | | | | | | | | | | | | Capital Employed (balance sheet) | | | 37,397 | | | | 18,501 | | | | 7,180 | | | | 4,017 | | | | | | | | 67,095 | | | Less inventory valuation effect | | | — | | | | (3,202 | ) | | | (282 | ) | | | 840 | | | | | | | | (2,644 | ) | | | | | | | | | | | | | | | | | | | | | | | | | | | | Capital Employed (Business segment information) | | | 37,397 | | | | 15,299 | | | | 6,898 | | | | 4,857 | | | | | | | | 64,451 | | | | | | | | | | | | | | | | | | | | | | | | | | | | ROACE as a percentage | | | 18% | | | | 7% | | | | 4% | | | | | | | | | | | | 13% | | | | | | | | | | | | | | | | | | | | | | | | | | | |
F-24
| | | | | | | | | | | | | | | | | | | | | | | | | | For the year ended December 31, 2008
| | | | | | | | | | | | | | | | | | | | (M€) | | Upstream
| | | Downstream
| | | Chemicals
| | | Corporate
| | | Intercompany
| | | Total
| | | Non-Group sales | | | 24,256 | | | | 135,524 | | | | 20,150 | | | | 46 | | | | — | | | | 179,976 | | | Intersegment sales | | | 25,132 | | | | 5,574 | | | | 1,252 | | | | 120 | | | | (32,078 | ) | | | — | | | Excise taxes | | | — | | | | (19,645 | ) | | | — | | | | — | | | | — | | | | (19,645 | ) | | | | | | | | | | | | | | | | | | | | | | | | | | | Revenues from sales | | | 49,388 | | | | 121,453 | | | | 21,402 | | | | 166 | | | | (32,078 | ) | | | 160,331 | | | | | | | | | | | | | | | | | | | | | | | | | | | | | Operating expenses | | | (21,915 | ) | | | (119,425 | ) | | | (20,942 | ) | | | (685 | ) | | | 32,078 | | | | (130,889 | ) | | Depreciation, depletion and amortization of tangible assets and mineral interests | | | (4,005 | ) | | | (1,202 | ) | | | (518 | ) | | | (30 | ) | | | — | | | | (5,755 | ) | | | | | | | | | | | | | | | | | | | | | | | | | | | Operating income | | | 23,468 | | | | 826 | | | | (58 | ) | | | (549 | ) | | | — | | | | 23,687 | | | | | | | | | | | | | | | | | | | | | | | | | | | | | Equity in income (loss) of affiliates and other items | | | 1,541 | | | | (158 | ) | | | (34 | ) | | | 590 | | | | — | | | | 1,939 | | | Tax on net operating income | | | (14,563 | ) | | | (143 | ) | | | 76 | | | | 315 | | | | — | | | | (14,315 | ) | | | | | | | | | | | | | | | | | | | | | | | | | | | Net operating income | | | 10,446 | | | | 525 | | | | (16 | ) | | | 356 | | | | — | | | | 11,311 | | | | | | | | | | | | | | | | | | | | | | | | | | | | | Net cost of net debt | | | | | | | | | | | | | | | | | | | | | | | (358 | ) | | Minority interests | | | | | | | | | | | | | | | | | | | | | | | (363 | ) | | | | | | | | | | | | | | | | | | | | | | | | | | | Net income | | | | | | | | | | | | | | | | | | | | | | | 10,590 | | | | | | | | | | | | | | | | | | | | | | | | | | | |
| | | | | | | | | | | | | | | | | | | | | | | | | | For the year ended December 31, 2008 (adjustments(a))
| | | | | | | | | | | | | | | | | | | | (M€) | | Upstream
| | | Downstream
| | | Chemicals
| | | Corporate
| | | Intercompany
| | | Total
| | | Non-Group sales | | | | | | | | | | | | | | | | | | | | | | | | | | Intersegment sales | | | | | | | | | | | | | | | | | | | | | | | | | | Excise taxes | | | | | | | | | | | | | | | | | | | | | | | | | | | | | | | | | | | | | | | | | | | | | | | | | | | Revenues from sales | | | | | | | | | | | | | | | | | | | | | | | | | | | | | | | | | | | | | | | | | | | | | | | | | | | | Operating expenses | | | — | | | | (2,776 | ) | | | (925 | ) | | | — | | | | | | | | (3,701 | ) | | Depreciation, depletion and amortization of tangible assets and mineral interest | | | (171 | ) | | | — | | | | (6 | ) | | | — | | | | | | | | (177 | ) | | | | | | | | | | | | | | | | | | | | | | | | | | | Operating income(b) | | | (171 | ) | | | (2,776 | ) | | | (931 | ) | | | — | | | | | | | | (3,878 | ) | | | | | | | | | | | | | | | | | | | | | | | | | | | Equity in income (loss) of affiliates and other items(c) | | | (164 | ) | | | (195 | ) | | | (82 | ) | | | (345 | ) | | | | | | | (786 | ) | | Tax on net operating income | | | 57 | | | | 927 | | | | 329 | | | | (2 | ) | | | | | | | 1,311 | | | | | | | | | | | | | | | | | | | | | | | | | | | | Net operating income(b) | | | (278 | ) | | | (2,044 | ) | | | (684 | ) | | | (347 | ) | | | | | | | (3,353 | ) | | | | | | | | | | | | | | | | | | | | | | | | | | | | Net cost of net debt | | | | | | | | | | | | | | | | | | | | | | | — | | | Minority interests | | | | | | | | | | | | | | | | | | | | | | | 23 | | | | | | | | | | | | | | | | | | | | | | | | | | | | Net income | | | | | | | | | | | | | | | | | | | | | | | (3,330 | ) | | | | | | | | | | | | | | | | | | | | | | | | | | |
| | | | (a) | | Adjustments include special items, inventory valuation effect and equity share of adjustments related to Sanofi-Aventis. |
| | | | | | | | | | | | | | | | | | (b) Of which inventory valuation effect | | Upstream | | | Downstream | | | Chemicals | | | Corporate | | | on operating income | | | — | | | | (2,776 | ) | | | (727 | ) | | | — | | on net operating income | | | — | | | | (1,971 | ) | | | (504 | ) | | | — | | (c) Of which equity share of adjustments related to Sanofi-Aventis | | | — | | | | — | | — | | | — | | | (393 | ) | | (393 | ) |
F-25
| | | | | | | | | | | | | | | | | | | | | | | | | | For the year ended December 31, 2008
| | | | | | | | | | | | | | | | | | | (adjusted)
| | | | | | | | | | | | | | | | | | | | (M€)(a) | | Upstream
| | | Downstream
| | | Chemicals
| | | Corporate
| | | Intercompany
| | | Total
| | | Non-Group sales | | | 24,256 | | | | 135,524 | | | | 20,150 | | | | 46 | | | | — | | | | 179,976 | | | Intersegment sales | | | 25,132 | | | | 5,574 | | | | 1,252 | | | | 120 | | | | (32,078 | ) | | | — | | | Excise taxes | | | — | | | | (19,645 | ) | | | — | | | | — | | | | — | | | | (19,645 | ) | | | | | | | | | | | | | | | | | | | | | | | | | | | Revenues from sales | | | 49,388 | | | | 121,453 | | | | 21,402 | | | | 166 | | | | (32,078 | ) | | | 160,331 | | | | | | | | | | | | | | | | | | | | | | | | | | | | | Operating expenses | | | (21,915 | ) | | | (116,649 | ) | | | (20,017 | ) | | | (685 | ) | | | 32,078 | | | | (127,188 | ) | | Depreciation, depletion and amortization of tangible assets and mineral interests | | | (3,834 | ) | | | (1,202 | ) | | | (512 | ) | | | (30 | ) | | | — | | | | (5,578 | ) | | | | | | | | | | | | | | | | | | | | | | | | | | | Adjusted operating income | | | 23,639 | | | | 3,602 | | | | 873 | | | | (549 | ) | | | — | | | | 27,565 | | | | | | | | | | | | | | | | | | | | | | | | | | | | | Equity in income (loss) of affiliates and other items | | | 1,705 | | | | 37 | | | | 48 | | | | 935 | | | | — | | | | 2,725 | | | Tax on net operating income | | | (14,620 | ) | | | (1,070 | ) | | | (253 | ) | | | 317 | | | | — | | | | (15,626 | ) | | | | | | | | | | | | | | | | | | | | | | | | | | | Adjusted net operating income | | | 10,724 | | | | 2,569 | | | | 668 | | | | 703 | | | | — | | | | 14,664 | | | | | | | | | | | | | | | | | | | | | | | | | | | | | Net cost of net debt | | | | | | | | | | | | | | | | | | | | | | | (358 | ) | | Minority interests | | | | | | | | | | | | | | | | | | | | | | | (386 | ) | | | | | | | | | | | | | | | | | | | | | | | | | | | Adjusted net income | | | | | | | | | | | | | | | | | | | | | | | 13,920 | | | | | | | | | | | | | | | | | | | | | | | | | | | | Adjusted fully-diluted earnings per share (€) | | | | | | | | | | | | | | | | | | | | | | | 6.20 | | | | | | | | | | | | | | | | | | | | | | | | | | | |
| | | | (a) | | Except for earnings per share |
| | | | | | | | | | | | | | | | | | | | | | | | | | For the year ended December 31, 2008
| | | | | | | | | | | | | | | | | | | | (M€) | | Upstream
| | | Downstream
| | | Chemicals
| | | Corporate
| | | Intercompany
| | | Total
| | | Total expenditures | | | 10,017 | | | | 2,418 | | | | 1,074 | | | | 131 | | | | | | | | 13,640 | | | Total divestments | | | 1,130 | | | | 216 | | | | 53 | | | | 1,186 | | | | | | | | 2,585 | | | Cash flow from operating activities | | | 13,765 | | | | 3,111 | | | | 920 | | | | 873 | | | | | | | | 18,669 | | | | | | | | | | | | | | | | | | | | | | | | | | | | Balance sheet as of December 31, 2008 | | | | | | | | | | | | | | | | | | | | | | | | | | | | | | | | | | | | | | | | | | | | | | | | | | | | Property, plant and equipment, intangible assets, net | | | 37,090 | | | | 8,823 | | | | 5,323 | | | | 247 | | | | | | | | 51,483 | | | Investments in equity affiliates | | | 3,892 | | | | 1,958 | | | | 677 | | | | 6,134 | | | | | | | | 12,661 | | | Loans to equity affiliates and other non-current assets | | | 3,739 | | | | 1,170 | | | | 762 | | | | 545 | | | | | | | | 6,216 | | | Working capital | | | 570 | | | | 5,317 | | | | 2,348 | | | | (132 | ) | | | | | | | 8,103 | | | Provisions and other non-current liabilities | | | (12,610 | ) | | | (2,191 | ) | | | (1,903 | ) | | | (1,138 | ) | | | | | | | (17,842 | ) | | Assets and liabilities classified as held for sale | | | — | | | | — | | | | — | | | | — | | | | | | | | — | | | | | | | | | | | | | | | | | | | | | | | | | | | | Capital Employed (balance sheet) | | | 32,681 | | | | 15,077 | | | | 7,207 | | | | 5,656 | | | | | | | | 60,621 | | | Less inventory valuation effect | | | — | | | | (1,454 | ) | | | (46 | ) | | | 387 | | | | | | | | (1,113 | ) | | | | | | | | | | | | | | | | | | | | | | | | | | | Capital Employed (Business segment information) | | | 32,681 | | | | 13,623 | | | | 7,161 | | | | 6,043 | | | | | | | | 59,508 | | | | | | | | | | | | | | | | | | | | | | | | | | | | ROACE as a percentage | | | 36% | | | | 20% | | | | 9% | | | | | | | | | | | | 26% | | | | | | | | | | | | | | | | | | | | | | | | | | | |
F-26 | | | | | | | | | | | | | | | | | | | For the year ended December 31, 2008
(adjusted)
(€ million) | | Upstream | | | Downstream | | | Chemicals | | | Corporate | | | Intercompany | | | Total | | Non-Group sales | | 24,256 | | | 135,524 | | | 20,150 | | | 46 | | | — | | | 179,976 | | Intersegment sales | | 25,132 | | | 5,574 | | | 1,252 | | | 120 | | | (32,078 | ) | | — | | Excise taxes | | — | | | (19,645 | ) | | — | | | — | | | — | | | (19,645 | ) | Revenues from sales | | 49,388 | | | 121,453 | | | 21,402 | | | 166 | | | (32,078 | ) | | 160,331 | | Operating expenses | | (21,915 | ) | | (116,649 | ) | | (20,017 | ) | | (685 | ) | | 32,078 | �� | | (127,188 | ) | Depreciation, depletion and amortization of tangible assets and mineral interests | | (3,834 | ) | | (1,202 | ) | | (512 | ) | | (30 | ) | | — | | | (5,578 | ) | Adjusted operating income | | 23,639 | | | 3,602 | | | 873 | | | (549 | ) | | — | | | 27,565 | | Equity in income (loss) of affiliates and other items | | 1,705 | | | 37 | | | 48 | | | 935 | | | — | | | 2,725 | | Tax on net operating income | | (14,620 | ) | | (1,070 | ) | | (253 | ) | | 317 | | | — | | | (15,626 | ) | Adjusted net operating income | | 10,724 | | | 2,569 | | | 668 | | | 703 | | | — | | | 14,664 | | Net cost of net debt | | | | | | | | | | | | | | | | | (358 | ) | Minority interests | | | | | | | | | | | | | | | | | (386 | ) | Adjusted net income | | | | | | | | | | | | | | | | | 13,920 | |
| | | | | | | | | | | | | | | | | | For the year ended December 31, 2008
(€ million) | | Upstream | | | Downstream | | | Chemicals | | | Corporate | | | Intercompany | | Total | | Total expenditures | | 10,017 | | | 2,418 | | | 1,074 | | | 131 | | | | | 13,640 | | Total divestments | | 1,130 | | | 216 | | | 53 | | | 1,186 | | | | | 2,585 | | Cash flow from operating activities | | 13,765 | | | 3,111 | | | 920 | | | 873 | | | | | 18,669 | | Balance sheet as of December 31, 2008 | | | | | | | | | | | | | | | | | | Property, plant and equipment, intangible assets, net | | 37,090 | | | 8,823 | | | 5,323 | | | 247 | | | | | 51,483 | | Investments in equity affiliates | | 3,892 | | | 1,958 | | | 677 | | | 6,134 | | | | | 12,661 | | Loans to equity affiliates and other non-current assets | | 3,739 | | | 1,170 | | | 762 | | | 545 | | | | | 6,216 | | Working capital | | 570 | | | 5,317 | | | 2,348 | | | (132 | ) | | | | 8,103 | | Provisions and other non-current liabilities | | (12,610 | ) | | (2,191 | ) | | (1,903 | ) | | (1,138 | ) | | | | (17,842 | ) | Capital Employed (balance sheet) | | 32,681 | | | 15,077 | | | 7,207 | | | 5,656 | | | | | 60,621 | | Less inventory valuation effect | | — | | | (1,454 | ) | | (46 | ) | | 387 | | | | | (1,113 | ) | | Capital Employed (Business segment information) | | 32,681 | | | 13,623 | | | 7,161 | | | 6,043 | | | | | 59,508 | | ROACE as a percentage | | 36% | | | 20% | | | 9% | | | | | | | | 26% | |
| | | | | | | | | | | | | | | | | | | For the year ended December 31, 2007 (€ million) | | Upstream | | | Downstream | | | Chemicals | | | Corporate | | | Intercompany | | | Total | | Non-Group sales | | 19,706 | | | 119,212 | | | 19,805 | | | 29 | | | — | | | 158,752 | | Intersegment sales | | 21,173 | | | 5,125 | | | 1,190 | | | 181 | | | (27,669 | ) | | — | | Excise taxes | | — | | | (21,928 | ) | | — | | | — | | | — | | | (21,928 | ) | Revenues from sales | | 40,879 | | | 102,409 | | | 20,995 | | | 210 | | | (27,669 | ) | | 136,824 | | Operating expenses | | (17,697 | ) | | (96,367 | ) | | (19,076 | ) | | (627 | ) | | 27,669 | | | (106,098 | ) | Depreciation, depletion and amortization of tangible assets and mineral interests | | (3,679 | ) | | (1,218 | ) | | (495 | ) | | (33 | ) | | — | | | (5,425 | ) | Operating income | | 19,503 | | | 4,824 | | | 1,424 | | | (450 | ) | | — | | | 25,301 | | Equity in income (loss) of affiliates and other items | | 1,330 | | | 284 | | | (11 | ) | | 745 | | | — | | | 2,348 | | Tax on net operating income | | (11,996 | ) | | (1,482 | ) | | (426 | ) | | 128 | | | — | | | (13,776 | ) | Net operating income | | 8,837 | | | 3,626 | | | 987 | | | 423 | | | — | | | 13,873 | | Net cost of net debt | | | | | | | | | | | | | | | | | (338 | ) | Minority interests | | | | | | | | | | | | | | | | | (354 | ) | Net income | | | | | | | | | | | | | | | | | 13,181 | |
| | | | | | | | | | | | | | | | | | For the year ended December 31, 2007
(adjustments(a)) (€ million) | | Upstream | | | Downstream | | | Chemicals | | | Corporate | | | Intercompany | | Total | | Non-Group sales | | | | | | | | | | | | | | | | | | Intersegment sales | | | | | | | | | | | | | | | | | | Excise taxes | | | | | | | | | | | | | | | | | | Revenues from sales | | | | | | | | | | | | | | | | | | Operating expenses | | (11 | ) | | 1,580 | | | 273 | | | — | | | | | 1,842 | | Depreciation, depletion and amortization of tangible assets and mineral interests | | — | | | (43 | ) | | (4 | ) | | — | | | | | (47 | ) | Operating income(b) | | (11 | ) | | 1,537 | | | 269 | | | — | | | | | 1,795 | | Equity in income (loss) of affiliates and other items(c) | | (4 | ) | | 24 | | | (54 | ) | | (225 | ) | | | | (259 | ) | Tax on net operating income | | 3 | | | (470 | ) | | (75 | ) | | (2 | ) | | | | (544 | ) | Net operating income(b) | | (12 | ) | | 1,091 | | | 140 | | | (227 | ) | | | | 992 | | Net cost of net debt | | | | | | | | | | | | | | | | — | | Minority interests | | | | | | | | | | | | | | | | (14 | ) | Net income | | | | | | | | | | | | | | | | 978 | | (a) Adjustments include special items, inventory valuation effect and equity share of adjustments related to Sanofi-Aventis. | | (b) Of which inventory valuation effect | | Upstream | | | Downstream | | | Chemicals | | | Corporate | | | | | | | on operating income | | — | | | 1,529 | | | 301 | | | — | | | | | | | on net operating income | | — | | | 1,098 | | | 201 | | | — | | | | | | | (c) Of which equity share of adjustments related to Sanofi-Aventis | | — | | | — | | | — | | | (318 | ) | | | | | |
| | | | | | | | | | | | | | | | | | | For the year ended December 31, 2007
(adjusted)
(€ million) | | Upstream | | | Downstream | | | Chemicals | | | Corporate | | | Intercompany | | | Total | | Non-Group sales | | 19,706 | | | 119,212 | | | 19,805 | | | 29 | | | — | | | 158,752 | | Intersegment sales | | 21,173 | | | 5,125 | | | 1,190 | | | 181 | | | (27,669 | ) | | — | | Excise taxes | | — | | | (21,928 | ) | | — | | | — | | | — | | | (21,928 | ) | Revenues from sales | | 40,879 | | | 102,409 | | | 20,995 | | | 210 | | | (27,669 | ) | | 136,824 | | Operating expenses | | (17,686 | ) | | (97,947 | ) | | (19,349 | ) | | (627 | ) | | 27,669 | | | (107,940 | ) | Depreciation, depletion and amortization of tangible assets and mineral interests | | (3,679 | ) | | (1,175 | ) | | (491 | ) | | (33 | ) | | — | | | (5,378 | ) | Adjusted operating income | | 19,514 | | | 3,287 | | | 1,155 | | | (450 | ) | | — | | | 23,506 | | Equity in income (loss) of affiliates and other items | | 1,334 | | | 260 | | | 43 | | | 970 | | | — | | | 2,607 | | Tax on net operating income | | (11,999 | ) | | (1,012 | ) | | (351 | ) | | 130 | | | — | | | (13,232 | ) | Adjusted net operating income | | 8,849 | | | 2,535 | | | 847 | | | 650 | | | — | | | 12,881 | | Net cost of net debt | | | | | | | | | | | | | | | | | (338 | ) | Minority interests | | | | | | | | | | | | | | | | | (340 | ) | Adjusted net income | | | | | | | | | | | | | | | | | 12,203 | |
| | | | | | | | | | | | | | | | | | For the year ended December 31, 2007 (€ million) | | Upstream | | | Downstream | | | Chemicals | | | Corporate | | | Intercompany | | Total | | Total expenditures | | 8,882 | | | 1,875 | | | 911 | | | 54 | | | | | 11,722 | | Total divestments | | 751 | | | 394 | | | 83 | | | 328 | | | | | 1,556 | | Cash flow from operating activities | | 12,692 | | | 4,148 | | | 1,096 | | | (250 | ) | | | | 17,686 | | Balance sheet as of December 31, 2007 | | | | | | | | | | | | | | | | | | Property, plant and equipment, intangible assets, net | | 32,535 | | | 8,308 | | | 5,061 | | | 213 | | | | | 46,117 | | Investments in equity affiliates | | 3,021 | | | 2,105 | | | 728 | | | 6,851 | | | | | 12,705 | | Loans to equity affiliates and other non-current assets | | 3,748 | | | 1,183 | | | 456 | | | 634 | | | | | 6,021 | | Working capital | | (94 | ) | | 6,811 | | | 2,774 | | | 506 | | | | | 9,997 | | Provisions and other non-current liabilities | | (12,147 | ) | | (2,018 | ) | | (1,697 | ) | | (1,441 | ) | | | | (17,303 | ) | Capital Employed (balance sheet) | | 27,063 | | | 16,389 | | | 7,322 | | | 6,763 | | | | | 57,537 | | Less inventory valuation effect | | — | | | (4,198 | ) | | (424 | ) | | 1,112 | | | | | (3,510 | ) | Capital Employed (Business segment information) | | 27,063 | | | 12,191 | | | 6,898 | | | 7,875 | | | | | 54,027 | | ROACE as a percentage | | 34% | | | 21% | | | 12% | | | | | | | | 24% | |
B) RECONCILIATION BETWEEN BUSINESS SEGMENT INFORMATION AND THE CONSOLIDATED STATEMENT OF INCOME
| | | B) | RECONCILIATION BETWEEN BUSINESS SEGMENT INFORMATION AND THE CONSOLIDATED STATEMENT OF INCOME |
The table below presents the impact of adjustment items on the Consolidated Statement of Income: | | | | | | | | | | For the year ended December 31, 2009 (€ million) | | Adjusted | | | Adjustments(a) | | | Consolidated
statement of
income | | Sales | | 131,327 | | | — | | | 131,327 | | Excise taxes | | (19,174 | ) | | — | | | (19,174 | ) | Revenues from sales | | 112,153 | | | — | | | 112,153 | | Purchases, net of inventory variation | | (73,263 | ) | | 2,205 | | | (71,058 | ) | Other operating expenses | | (18,271 | ) | | (320 | ) | | (18,591 | ) | Exploration costs | | (698 | ) | | — | | | (698 | ) | Depreciation, depletion and amortization of tangible assets and mineral interests | | (6,291 | ) | | (391 | ) | | (6,682 | ) | Other income | | 131 | | | 183 | | | 314 | | Other expense | | (315 | ) | | (285 | ) | | (600 | ) | Financial interest on debt | | (530 | ) | | — | | | (530 | ) | Financial income from marketable securities & cash equivalents | | 132 | | | — | | | 132 | | Cost of net debt | | (398 | ) | | — | | | (398 | ) | Other financial income | | 643 | | | — | | | 643 | | Other financial expense | | (345 | ) | | — | | | (345 | ) | Equity in income (loss) of affiliates | | 1,918 | | | (276 | ) | | 1,642 | | Income taxes | | (7,302 | ) | | (449 | ) | | (7,751 | ) | Consolidated net income | | 7,962 | | | 667 | | | 8,629 | | Group share | | 7,784 | | | 663 | | | 8,447 | | Minority interests | | 178 | | | 4 | | | 182 | |
| | | | | | | | | | | | | | | | | | | | | | | Consolidated
| | For the year ended December 31, 2010
| | | | | | | | statement of
| | | (M€) | | Adjusted | | | Adjustments(a) | | | income | | | Sales | | | 159,269 | | | | — | | | | 159,269 | | | Excise taxes | | | (18,793 | ) | | | — | | | | (18,793 | ) | | Revenues from sales | | | 140,476 | | | | — | | | | 140,476 | | | Purchases, net of inventory variation | | | (94,286 | ) | | | 1,115 | | | | (93,171 | ) | | Other operating expenses | | | (19,035 | ) | | | (100 | ) | | | (19,135 | ) | | Exploration costs | | | (864 | ) | | | — | | | | (864 | ) | | Depreciation, depletion and amortization of tangible assets and mineral interests | | | (7,005 | ) | | | (1,416 | ) | | | (8,421 | ) | | Other income | | | 524 | | | | 872 | | | | 1,396 | | | Other expense | | | (346 | ) | | | (554 | ) | | | (900 | ) | | Financial interest on debt | | | (465 | ) | | | — | | | | (465 | ) | | Financial income from marketable securities & cash equivalents | | | 131 | | | | — | | | | 131 | | | Cost of net debt | | | (334 | ) | | | — | | | | (334 | ) | | Other financial income | | | 442 | | | | — | | | | 442 | | | Other financial expense | | | (407 | ) | | | — | | | | (407 | ) | | Equity in income (loss) of affiliates | | | 2,003 | | | | (50 | ) | | | 1,953 | | | Income taxes | | | (10,646 | ) | | | 418 | | | | (10,228 | ) | | | | | | | | | | | | | | | Consolidated net income | | | 10,522 | | | | 285 | | | | 10,807 | | | | | | | | | | | | | | | | | Group share | | | 10,288 | | | | 283 | | | | 10,571 | | | Minority interests | | | 234 | | | | 2 | | | | 236 | | | | | | | | | | | | | | | |
(a) | | | | (a) | | Adjustments include special items, inventory valuation effect and, until June 30, 2010, equity share of adjustments and selected items related to Sanofi-Aventis. |
F-27
| | | | | | | | | | For the year ended December 31, 2008 (€ million) | | Adjusted | | | Adjustments(a) | | | Consolidated
statement of
income | | Sales | | 179,976 | | | — | | | 179,976 | | Excise taxes | | (19,645 | ) | | — | | | (19,645 | ) | Revenues from sales | | 160,331 | | | — | | | 160,331 | | Purchases, net of inventory variation | | (107,521 | ) | | (3,503 | ) | | (111,024 | ) | Other operating expenses | | (18,903 | ) | | (198 | ) | | (19,101 | ) | Exploration costs | | (764 | ) | | — | | | (764 | ) | Depreciation, depletion and amortization of tangible assets and mineral interests | | (5,578 | ) | | (177 | ) | | (5,755 | ) | Other income | | 153 | | | 216 | | | 369 | | Other expense | | (147 | ) | | (407 | ) | | (554 | ) | Financial interest on debt | | (1,000 | ) | | — | | | (1,000 | ) | Financial income from marketable securities & cash equivalents | | 473 | | | — | | | 473 | | Cost of net debt | | (527 | ) | | — | | | (527 | ) | Other financial income | | 728 | | | — | | | 728 | | Other financial expense | | (325 | ) | | — | | | (325 | ) | Equity in income (loss) of affiliates | | 2,316 | | | (595 | ) | | 1,721 | | Income taxes | | (15,457 | ) | | 1,311 | | | (14,146 | ) | Consolidated net income | | 14,306 | | | (3,353 | ) | | 10,953 | | Group share | | 13,920 | | | (3,330 | ) | | 10,590 | | Minority interests | | 386 | | | (23 | ) | | 363 | |
| | | | | | | | | | | | | | | | | | | | | | | Consolidated
| | For the year ended December 31, 2009
| | | | | | | | statement of
| | | (M€) | | Adjusted | | | Adjustments(a) | | | income | | | Sales | | | 131,327 | | | | — | | | | 131,327 | | | Excise taxes | | | (19,174 | ) | | | — | | | | (19,174 | ) | | Revenues from sales | | | 112,153 | | | | — | | | | 112,153 | | | Purchases, net of inventory variation | | | (73,263 | ) | | | 2,205 | | | | (71,058 | ) | | Other operating expenses | | | (18,271 | ) | | | (320 | ) | | | (18,591 | ) | | Exploration costs | | | (698 | ) | | | — | | | | (698 | ) | | Depreciation, depletion and amortization of tangible assets and mineral interests | | | (6,291 | ) | | | (391 | ) | | | (6,682 | ) | | Other income | | | 131 | | | | 183 | | | | 314 | | | Other expense | | | (315 | ) | | | (285 | ) | | | (600 | ) | | Financial interest on debt | | | (530 | ) | | | — | | | | (530 | ) | | Financial income from marketable securities & cash equivalents | | | 132 | | | | — | | | | 132 | | | Cost of net debt | | | (398 | ) | | | — | | | | (398 | ) | | Other financial income | | | 643 | | | | — | | | | 643 | | | Other financial expense | | | (345 | ) | | | — | | | | (345 | ) | | Equity in income (loss) of affiliates | | | 1,918 | | | | (276 | ) | | | 1,642 | | | Income taxes | | | (7,302 | ) | | | (449 | ) | | | (7,751 | ) | | | | | | | | | | | | | | | Consolidated net income | | | 7,962 | | | | 667 | | | | 8,629 | | | | | | | | | | | | | | | | | Group share | | | 7,784 | | | | 663 | | | | 8,447 | | | Minority interests | | | 178 | | | | 4 | | | | 182 | | | | | | | | | | | | | | | |
(a) | | | | (a) | | Adjustments include special items, inventory valuation effect and equity share of adjustments related to Sanofi-Aventis. |
| | | | | | | | | | For the year ended December 31, 2007 (€ million) | | Adjusted | | | Adjustments(a) | | | Consolidated
statement of
income | | Sales | | 158,752 | | | — | | | 158,752 | | Excise taxes | | (21,928 | ) | | — | | | (21,928 | ) | Revenues from sales | | 136,824 | | | — | | | 136,824 | | Purchases, net of inventory variation | | (89,688 | ) | | 1,881 | | | (87,807 | ) | Other operating expenses | | (17,375 | ) | | (39 | ) | | (17,414 | ) | Exploration costs | | (877 | ) | | — | | | (877 | ) | Depreciation, depletion and amortization of tangible assets and mineral interests | | (5,378 | ) | | (47 | ) | | (5,425 | ) | Other income | | 384 | | | 290 | | | 674 | | Other expense | | (225 | ) | | (245 | ) | | (470 | ) | Financial interest on debt | | (1,783 | ) | | — | | | (1,783 | ) | Financial income from marketable securities & cash equivalents | | 1,244 | | | — | | | 1,244 | | Cost of net debt | | (539 | ) | | — | | | (539 | ) | Other financial income | | 643 | | | — | | | 643 | | Other financial expense | | (274 | ) | | — | | | (274 | ) | Equity in income (loss) of affiliates | | 2,079 | | | (304 | ) | | 1,775 | | Income taxes | | (13,031 | ) | | (544 | ) | | (13,575 | ) | Consolidated net income | | 12,543 | | | 992 | | | 13,535 | | Group share | | 12,203 | | | 978 | | | 13,181 | | Minority interests | | 340 | | | 14 | | | 354 | |
| | | | | | | | | | | | | | | | | | | | | | | Consolidated
| | For the year ended December 31, 2008
| | | | | | | | statement of
| | | (M€) | | Adjusted | | | Adjustments(a) | | | income | | | Sales | | | 179,976 | | | | — | | | | 179,976 | | | Excise taxes | | | (19,645 | ) | | | — | | | | (19,645 | ) | | Revenues from sales | | | 160,331 | | | | — | | | | 160,331 | | | Purchases, net of inventory variation | | | (107,521 | ) | | | (3,503 | ) | | | (111,024 | ) | | Other operating expenses | | | (18,903 | ) | | | (198 | ) | | | (19,101 | ) | | Exploration costs | | | (764 | ) | | | — | | | | (764 | ) | | Depreciation, depletion and amortization of tangible assets and mineral interests | | | (5,578 | ) | | | (177 | ) | | | (5,755 | ) | | Other income | | | 153 | | | | 216 | | | | 369 | | | Other expense | | | (147 | ) | | | (407 | ) | | | (554 | ) | | Financial interest on debt | | | (1,000 | ) | | | — | | | | (1,000 | ) | | Financial income from marketable securities & cash equivalents | | | 473 | | | | — | | | | 473 | | | Cost of net debt | | | (527 | ) | | | — | | | | (527 | ) | | Other financial income | | | 728 | | | | — | | | | 728 | | | Other financial expense | | | (325 | ) | | | — | | | | (325 | ) | | Equity in income (loss) of affiliates | | | 2,316 | | | | (595 | ) | | | 1,721 | | | Income taxes | | | (15,457 | ) | | | 1,311 | | | | (14,146 | ) | | | | | | | | | | | | | | | Consolidated net income | | | 14,306 | | | | (3,353 | ) | | | 10,953 | | | | | | | | | | | | | | | | | Group share | | | 13,920 | | | | (3,330 | ) | | | 10,590 | | | Minority interests | | | 386 | | | | (23 | ) | | | 363 | | | | | | | | | | | | | | | |
(a) | | | | (a) | | Adjustments include special items, inventory valuation effect and equity share of adjustments related to Sanofi-Aventis. |
F-28
C) ADJUSTMENT ITEMS BY BUSINESS SEGMENT The adjustment items for income as per Note 2 to the Consolidated Financial Statements are detailed as follows: Adjustments to operating income | | | | | | | | | | | | | | | | For the year ended December 31, 2009(€ million) | | Upstream | | | Downstream | | | Chemicals | | | Corporate | | Total | | Inventory valuation effect | | — | | | 1,816 | | | 389 | | | — | | 2,205 | | Restructuring charges | | — | | | — | | | — | | | — | | — | | Asset impairment charges | | (4 | ) | | (347 | ) | | (40 | ) | | — | | (391 | ) | Other items | | (17 | ) | | (258 | ) | | (45 | ) | | — | | (320 | ) | Total | | (21 | ) | | 1,211 | | | 304 | | | — | | 1,494 | |
| | | | | | | | | | | | | | | | | | | | | | | For the year ended December 31, 2010 (M€) | | Upstream | | | Downstream | | | Chemicals | | | Corporate | | | Total | | | Inventory valuation effect | | | — | | | | 863 | | | | 130 | | | | — | | | | 993 | | | Restructuring charges | | | — | | | | — | | | | — | | | | — | | | | — | | | Asset impairment charges | | | (203 | ) | | | (1,192 | ) | | | (21 | ) | | | — | | | | (1,416 | ) | | Other items | | | — | | | | 60 | | | | (38 | ) | | | — | | | | 22 | | | | | | | | | | | | | | | | | | | | | | | | Total | | | (203 | ) | | | (269 | ) | | | 71 | | | | — | | | | (401 | ) | | | | | | | | | | | | | | | | | | | | | | |
Adjustments to net income, Group share | | | | | | | | | | | | | | | | | For the year ended December 31, 2009(€ million) | | Upstream | | | Downstream | | | Chemicals | | | Corporate | | | Total | | Inventory valuation effect | | — | | | 1,279 | | | 254 | | | — | | | 1,533 | | TOTAL’s equity share of adjustments and selected items related to Sanofi-Aventis | | — | | | — | | | — | | | (300 | ) | | (300 | ) | Restructuring charges | | — | | | (27 | ) | | (102 | ) | | — | | | (129 | ) | Asset impairment charges | | (52 | ) | | (253 | ) | | (28 | ) | | — | | | (333 | ) | Gains (losses) on disposals of assets | | — | | | — | | | — | | | 179 | | | 179 | | Other items | | (112 | ) | | (182 | ) | | 7 | | | — | | | (287 | ) | Total | | (164 | ) | | 817 | | | 131 | | | (121 | ) | | 663 | |
| | | | | | | | | | | | | | | | | | | | | | | For the year ended December 31, 2010 (M€) | | Upstream | | | Downstream | | | Chemicals | | | Corporate | | | Total | | | Inventory valuation effect | | | — | | | | 635 | | | | 113 | | | | — | | | | 748 | | | TOTAL’s equity share of adjustments related to Sanofi-Aventis | | | — | | | | — | | | | — | | | | (81 | ) | | | (81 | ) | | Restructuring charges | | | — | | | | (12 | ) | | | (41 | ) | | | — | | | | (53 | ) | | Asset impairment charges | | | (297 | ) | | | (913 | ) | | | (14 | ) | | | — | | | | (1,224 | ) | | Gains (losses) on disposals of assets | | | 589 | | | | 122 | | | | 33 | | | | 302 | | | | 1,046 | | | Other items | | | (37 | ) | | | (83 | ) | | | (33 | ) | | | — | | | | (153 | ) | | | | | | | | | | | | | | | | | | | | | | | Total | | | 255 | | | | (251 | ) | | | 58 | | | | 221 | | | | 283 | | | | | | | | | | | | | | | | | | | | | | | |
Adjustments to operating income | | | | | | | | | | | | | | | | For the year ended December 31, 2008(€ million) | | Upstream | | | Downstream | | | Chemicals | | | Corporate | | Total | | Inventory valuation effect | | — | | | (2,776 | ) | | (727 | ) | | — | | (3,503 | ) | Restructuring charges | | — | | | — | | | — | | | — | | — | | Asset impairment charges | | (171 | ) | | — | | | (6 | ) | | — | | (177 | ) | Other items | | — | | | — | | | (198 | ) | | — | | (198 | ) | Total | | (171 | ) | | (2,776 | ) | | (931 | ) | | — | | (3,878 | ) |
| | | | | | | | | | | | | | | | | | | | | | | For the year ended December 31, 2009 (M€) | | Upstream | | | Downstream | | | Chemicals | | | Corporate | | | Total | | | Inventory valuation effect | | | — | | | | 1,816 | | | | 389 | | | | — | | | | 2,205 | | | Restructuring charges | | | — | | | | — | | | | — | | | | — | | | | — | | | Asset impairment charges | | | (4 | ) | | | (347 | ) | | | (40 | ) | | | — | | | | (391 | ) | | Other items | | | (17 | ) | | | (258 | ) | | | (45 | ) | | | — | | | | (320 | ) | | | | | | | | | | | | | | | | | | | | | | | Total | | | (21 | ) | | | 1,211 | | | | 304 | | | | — | | | | 1,494 | | | | | | | | | | | | | | | | | | | | | | | |
Adjustments to net income, Group share | | | | | | | | | | | | | | | | | | | | | | | For the year ended December 31, 2009 (M€) | | Upstream | | | Downstream | | | Chemicals | | | Corporate | | | Total | | | Inventory valuation effect | | | — | | | | 1,279 | | | | 254 | | | | — | | | | 1,533 | | | TOTAL’s equity share of adjustments related to Sanofi-Aventis | | | — | | | | — | | | | — | | | | (300 | ) | | | (300 | ) | | Restructuring charges | | | — | | | | (27 | ) | | | (102 | ) | | | — | | | | (129 | ) | | Asset impairment charges | | | (52 | ) | | | (253 | ) | | | (28 | ) | | | — | | | | (333 | ) | | Gains (losses) on disposals of assets | | | — | | | | — | | | | — | | | | 179 | | | | 179 | | | Other items | | | (112 | ) | | | (182 | ) | | | 7 | | | | — | | | | (287 | ) | | | | | | | | | | | | | | | | | | | | | | | Total | | | (164 | ) | | | 817 | | | | 131 | | | | (121 | ) | | | 663 | | | | | | | | | | | | | | | | | | | | | | | |
F-29
| | | | | | | | | | | | | | | | | For the year ended December 31, 2008(€ million) | | Upstream | | | Downstream | | | Chemicals | | | Corporate | | | Total | | Inventory valuation effect | | — | | | (1,949 | ) | | (503 | ) | | — | | | (2,452 | ) | TOTAL’s equity share of adjustments related to Sanofi-Aventis | | — | | | — | | | — | | | (393 | ) | | (393 | ) | Restructuring charges | | — | | | (47 | ) | | (22 | ) | | — | | | (69 | ) | Asset impairment charges | | (172 | ) | | (26 | ) | | (7 | ) | | — | | | (205 | ) | Gains (losses) on disposals of assets | | 130 | | | — | | | — | | | 84 | | | 214 | | Other items | | (236 | ) | | — | | | (151 | ) | | (38 | ) | | (425 | ) | Total | | (278 | ) | | (2,022 | ) | | (683 | ) | | (347 | ) | | (3,330 | ) |
Adjustments to operating income | | | | | | | | | | | | | | | | For the year ended December 31, 2007(€ million) | | Upstream | | | Downstream | | | Chemicals | | | Corporate | | Total | | Inventory valuation effect | | — | | | 1,529 | | | 301 | | | — | | 1,830 | | Restructuring charges | | — | | | — | | | — | | | — | | — | | Asset impairment charges | | — | | | (43 | ) | | (4 | ) | | — | | (47 | ) | Other items | | (11 | ) | | 51 | | | (28 | ) | | — | | 12 | | Total | | (11 | ) | | 1,537 | | | 269 | | | — | | 1,795 | |
| | | | | | | | | | | | | | | | | | | | | | | For the year ended December 31, 2008 (M€) | | Upstream | | | Downstream | | | Chemicals | | | Corporate | | | Total | | | Inventory valuation effect | | | — | | | | (2,776 | ) | | | (727 | ) | | | — | | | | (3,503 | ) | | Restructuring charges | | | — | | | | — | | | | — | | | | — | | | | — | | | Asset impairment charges | | | (171 | ) | | | — | | | | (6 | ) | | | — | | | | (177 | ) | | Other items | | | — | | | | — | | | | (198 | ) | | | — | | | | (198 | ) | | | | | | | | | | | | | | | | | | | | | | | Total | | | (171 | ) | | | (2,776 | ) | | | (931 | ) | | | — | | | | (3,878 | ) | | | | | | | | | | | | | | | | | | | | | | |
Adjustments to net income, Group share | | | | | | | | | | | | | | | | | For the year ended December 31, 2007(€ million) | | Upstream | | | Downstream | | | Chemicals | | | Corporate | | | Total | | Inventory valuation effect | | — | | | 1,084 | | | 201 | | | — | | | 1,285 | | TOTAL’s equity share of special items recorded by Sanofi-Aventis | | — | | | — | | | — | | | 75 | | | 75 | | TOTAL’s equity share of adjustments related to Sanofi-Aventis | | — | | | — | | | — | | | (318 | ) | | (318 | ) | Restructuring charges | | — | | | (20 | ) | | (15 | ) | | — | | | (35 | ) | Asset impairment charges | | (93 | ) | | (61 | ) | | (8 | ) | | — | | | (162 | ) | Gains (losses) on disposals of assets | | 89 | | | 101 | | | — | | | 116 | | | 306 | | Other items | | (8 | ) | | (27 | ) | | (38 | ) | | (100 | ) | | (173 | ) | Total | | (12 | ) | | 1,077 | | | 140 | | | (227 | ) | | 978 | |
| | | | | | | | | | | | | | | | | | | | | | | For the year ended December 31, 2008 (M€) | | Upstream | | | Downstream | | | Chemicals | | | Corporate | | | Total | | | Inventory valuation effect | | | — | | | | (1,949 | ) | | | (503 | ) | | | — | | | | (2,452 | ) | TOTAL’s equity share of adjustments related toSanofi-Aventis | | | — | | | | — | | | | — | | | | (393 | ) | | | (393 | ) | | Restructuring charges | | | — | | | | (47 | ) | | | (22 | ) | | | — | | | | (69 | ) | | Asset impairment charges | | | (172 | ) | | | (26 | ) | | | (7 | ) | | | — | | | | (205 | ) | | Gains (losses) on disposals of assets | | | 130 | | | | — | | | | — | | | | 84 | | | | 214 | | | Other items | | | (236 | ) | | | — | | | | (151 | ) | | | (38 | ) | | | (425 | ) | | | | | | | | | | | | | | | | | | | | | | | Total | | | (278 | ) | | | (2,022 | ) | | | (683 | ) | | | (347 | ) | | | (3,330 | ) | | | | | | | | | | | | | | | | | | | | | | |
| | D) ADDITIONAL INFORMATION ON IMPAIRMENTSD) | ADDITIONAL INFORMATION ON IMPAIRMENTS |
In the Upstream, Downstream and Chemicals segments, impairments of assets have been recognized for the year ended December 31, 2009,2010, with an impact of €413 €1,416 million in operating income and €382 €1,224 million in net income, Group share. These impairments have been disclosed as adjustments to operating income for€391 million and as adjustments to net income, Group share for€333 million.share. These items are identified in paragraph 4C above as adjustment items with the heading “Asset impairment charges”. The impairment losses impact certain Cash Generating Units (CGU) for which there were indications of impairment, due mainly to changes in the operating conditions or the economic environment of their specific businesses. The principles applied are the following: the recoverable amount of CGUs has been based on their value in use, as defined in Note 1 paragraph L to the Consolidated Financial Statements “Impairment of long-lived assets”;
future cash flows have been determined with the assumptions in the long-term plan of the Group. These assumptions (including future prices of products, supply and demand for products, future production volumes) represent the best estimate by management of the Group of all economic conditions during the remaining life of assets;
| | | • | The recoverable amount of CGUs has been based on their value in use, as defined in Note 1 paragraph L to the Consolidated Financial Statements “Impairment of long-lived assets”; | | • | Future cash flows have been determined with the assumptions in the long-term plan of the Group. These assumptions (including future prices of products, supply and demand for products, future production volumes) represent the best estimate by management of the Group of all economic conditions during the remaining life of assets; | | • | Future cash flows, based on the long-term plan, are prepared over a period consistent with the life of the assets within the CGU. They are prepared post-tax and include specific risks attached to CGU assets. They are discounted using a 8% post-tax discount rate, this rate being a weighted-average capital cost estimated from historical market data. This rate has been applied consistently for the years ending in 2008, 2009 and 2010; | | • | Value in use calculated by discounting the above post-tax cash flows using a 8% post-tax discount rate is not materially different from value in use calculated by discounting pre-tax cash flows using a pre-tax discount rate determined by an iterative computation from the post-tax value in use. These pre-tax discount rates are in a range from 9% to 12% in 2010. |
future cash flows are based on the long-term plan and are prepared over a period consistent with the life of the assets within the CGU. They include specific risks attached to CGU assets and are discounted using a 8% after tax discount rate. This rate is a weighted-average capital cost estimated from historical market data.
These assumptions have been applied consistently for the years ending in 2007, 2008 and 2009.
The CGUs of the Upstream segment affected by these impairments are oil fields and investments in associates accounted for by the equity method. For the year ended December 31, 2010, the Group has recognized impairments with an impact of €203 million in operating income and €297 million in net income, Group share, mainly including an impairment of assets related to its project to build an upgrader in Edmonton, the Group giving up this project as part of its agreements with Suncor.
F-30
The CGUs of the DowstreamDownstream segment are affiliates or groups of affiliates (or industrial assets) organized mostly by country for the refining activities and by relevant geographical area for the marketing activities. The year 2009 was marked by the deterioration ofIn 2010, the economic environment and especially by the declineof refining activities remained unfavorable, with a worldwide context of surplus in refining capacities compared to the demand for petroleum products. This surplus is more and more based in Europe, where the demand has been decreasing whereas in emerging countries (in Middle East and Asia) the consumption growth is strong. Considering the specificities of industrial tools, this remaining context of deteriorated margins that have resultedhad a particularly negative impact on the results of the refining CGUs in changesFrance and in the operating conditionsUnited Kingdom and lead to strong operational losses despite the efforts made to improve operations. Moreover in the last few months some operators have announced site closures or tried to dispose of assetssome sites although no material transaction has occurred in some business units of the Downstream segment.2010. These factors have triggered off the recognition of impairments of assets impactingin Europe, especially within the CGUs Refining France and United Kingdom, reducing the operating income for€347 millionsby €1,192 million and the net income, for€253Group share by €913 million. Given the deteriorated economic environment, sensitivitySensitivity analysis performed on other European refining CGUs, using a lower refining margin have been performed by the Groupdifferent actualization rates and margins, have not led to additional impairment.impairment charge. The CGUs of the Chemicals segment are worldwide business units, including activities or products with common strategic, commercial and industrial characteristics. For the year ended December 31, 2009, impairments of assets have been recognized in the Upstream, Downstream and Chemicals segments with an impact of €413 million in operating income and €382 million in net income, Group share. These impairments have been disclosed as adjustments to operating income for €391 million and adjustments to net income, Group share for €333 million. For the year ended December 31, 2008, impairments of assets have been recognized in the Upstream, Downstream and Chemicals segments with an impact of €216 €216 million in operating income and €244 €244 million in net income, Group share. These impairments have been disclosed as adjustments to operating income for €177 €177 million and adjustments to net income, Group share for €205 €205 million. For the yearyears ended December 31, 2007, impairments of assets have been recognized in the Upstream, Downstream2010 and Chemicals segments with an impact of€47 million in operating income and€162 million in net income, Group share.For the year ended December 31, 2009, no reversal of impairment has been recognized. For the year ended December 31, 2008, reversals of impairment losses have been recognized in the Upstream segment with an impact of€41 €41 million in operating income and€29 €29 million in net income, Group share. No reversal of impairment losses has been recognized in 2007.
5) INFORMATION BY GEOGRAPHICAL AREA
| | | | | | | | | | | | | | (€ million) | | France | | Rest of
Europe | | North
America | | Africa | | Rest
of
world | | Total | For the year ended December 31, 2009 | | | | | | | | | | | | | Non-Group sales | | 32,437 | | 60,140 | | 9,515 | | 9,808 | | 19,427 | | 131,327 | Property, plant and equipment, intangible assets, net | | 6,973 | | 15,218 | | 8,112 | | 17,312 | | 11,489 | | 59,104 | Capital expenditures | | 1,189 | | 2,502 | | 1,739 | | 4,651 | | 3,268 | | 13,349 | For the year ended December 31, 2008 | | | | | | | | | | | | | Non-Group sales | | 43,616 | | 82,761 | | 14,002 | | 12,482 | | 27,115 | | 179,976 | Property, plant and equipment, intangible assets, net | | 7,260 | | 13,485 | | 5,182 | | 15,460 | | 10,096 | | 51,483 | Capital expenditures | | 1,997 | | 2,962 | | 1,255 | | 4,500 | | 2,926 | | 13,640 | For the year ended December 31, 2007 | | | | | | | | | | | | | Non-Group sales | | 37,949 | | 73,757 | | 12,404 | | 10,401 | | 24,241 | | 158,752 | Property, plant and equipment, intangible assets, net | | 6,437 | | 14,554 | | 4,444 | | 11,872 | | 8,810 | | 46,117 | Capital expenditures | | 1,627 | | 2,538 | | 740 | | 3,745 | | 3,072 | | 11,722 |
6) OPERATING EXPENSES
| | | | | | | | | | | For the year ended December 31,(€ million) | | 2009 | | | 2008 | | | 2007 | | Purchases, net of inventory variation(a) | | (71,058 | ) | | (111,024 | ) | | (87,807 | ) | Exploration costs | | (698 | ) | | (764 | ) | | (877 | ) | Other operating expenses(b) | | (18,591 | ) | | (19,101 | ) | | (17,414 | ) | of which non-current operating liabilities (allowances) reversals | | 515 | | | 459 | | | 781 | | of which current operating liabilities (allowances) reversals | | (43 | ) | | (29 | ) | | (42 | ) | Operating expenses | | (90,347 | ) | | (130,889 | ) | | (106,098 | ) |
(a) | | | 5) | INFORMATION BY GEOGRAPHICAL AREA |
| | | | | | | | | | | | | | | | | | | | | | | | | | | | | | | | Rest of
| | | North
| | | | | | Rest of
| | | | | | (M€) | | France | | | Europe | | | America | | | Africa | | | the world | | | Total | | For the year ended December 31, 2010 | | | | | | | | | | | | | | | | | | | | | | | | | | Non-Group sales | | | 36,820 | | | | 72,636 | | | | 12,432 | | | | 12,561 | | | | 24,820 | | | | 159,269 | | | Property, plant and equipment, intangible assets, net | | | 5,666 | | | | 14,568 | | | | 9,584 | | | | 20,166 | | | | 13,897 | | | | 63,881 | | | Capital expenditures | | | 1,062 | | | | 2,629 | | | | 3,626 | | | | 4,855 | | | | 4,101 | | | | 16,273 | | | | | | | | | | | | | | | | | | | | | | | | | | | | For the year ended December 31, 2009 | | | | | | | | | | | | | | | | | | | | | | | | | | Non-Group sales | | | 32,437 | | | | 60,140 | | | | 9,515 | | | | 9,808 | | | | 19,427 | | | | 131,327 | | | Property, plant and equipment, intangible assets, net | | | 6,973 | | | | 15,218 | | | | 8,112 | | | | 17,312 | | | | 11,489 | | | | 59,104 | | | Capital expenditures | | | 1,189 | | | | 2,502 | | | | 1,739 | | | | 4,651 | | | | 3,268 | | | | 13,349 | | | | | | | | | | | | | | | | | | | | | | | | | | | | For the year ended December 31, 2008 | | | | | | | | | | | | | | | | | | | | | | | | | | Non-Group sales | | | 43,616 | | | | 82,761 | | | | 14,002 | | | | 12,482 | | | | 27,115 | | | | 179,976 | | | Property, plant and equipment, intangible assets, net | | | 7,260 | | | | 13,485 | | | | 5,182 | | | | 15,460 | | | | 10,096 | | | | 51,483 | | | Capital expenditures | | | 1,997 | | | | 2,962 | | | | 1,255 | | | | 4,500 | | | | 2,926 | | | | 13,640 | | | | | | | | | | | | | | | | | | | | | | | | | | | |
F-31
| | | | | | | | | | | | | | | For the year ended December 31, (M€) | | 2010 | | | 2009 | | | 2008 | | Purchases, net of inventory variation(a) | | | (93,171 | ) | | | (71,058 | ) | | | (111,024 | ) | | Exploration costs | | | (864 | ) | | | (698 | ) | | | (764 | ) | Other operating expenses(b) | | | (19,135 | ) | | | (18,591 | ) | | | (19,101 | ) | of which non-current operating liabilities (allowances) reversals | | | 387 | | | | 515 | | | | 459 | | of which current operating liabilities (allowances) reversals | | | (101 | ) | | | (43 | ) | | | (29 | ) | | | | | | | | | | | | | | | Operating expenses | | | (113,170 | ) | | | (90,347 | ) | | | (130,889 | ) | | | | | | | | | | | | | | |
| | | | (a) | | Includes royaltiestaxes paid on oil and gas production in the Upstream segment, (see in particular the taxes paid to Middle East oil producing countries for the Group’s concessions as detailed in Note 33 to the Consolidated Financial Statements “Other information”).namely royalties. |
| (b) | | Principally composed of production and administrative costs (see in particular the payroll costs as detailed in Note 26 to the Consolidated Financial Statements “Payroll and staff”). |
7) OTHER INCOME AND OTHER EXPENSE
| | | | | | | | | | | For the year ended December 31,(€ million) | | 2009 | | | 2008 | | | 2007 | | Gains (losses) on disposal of assets | | 200 | | | 257 | | | 639 | | Foreign exchange gains | | — | | | 112 | | | 35 | | Other | | 114 | | | — | | | — | | Other income | | 314 | | | 369 | | | 674 | | Foreign exchange losses | | (32 | ) | | — | | | — | | Amortization of other intangible assets (excl. mineral interests) | | (142 | ) | | (162 | ) | | (178 | ) | Other | | (426 | ) | | (392 | ) | | (292 | ) | Other expense | | (600 | ) | | (554 | ) | | (470 | ) |
| | | 7) | OTHER INCOME AND OTHER EXPENSE |
| | | | | | | | | | | | | | | For the year ended December 31, (M€) | | 2010 | | | 2009 | | | 2008 | | | Gains (losses) on disposal of assets | | | 1,117 | | | | 200 | | | | 257 | | | Foreign exchange gains | | | — | | | | — | | | | 112 | | | Other | | | 279 | | | | 114 | | | | — | | | | | | | | | | | | | | | | Other income | | | 1,396 | | | | 314 | | | | 369 | | | | | | | | | | | | | | | | | Foreign exchange losses | | | — | | | | (32 | ) | | | — | | | Amortization of other intangible assets (excl. mineral interests) | | | (267 | ) | | | (142 | ) | | | (162 | ) | | Other | | | (633 | ) | | | (426 | ) | | | (392 | ) | | | | | | | | | | | | | | | Other expense | | | (900 | ) | | | (600 | ) | | | (554 | ) | | | | | | | | | | | | | | |
In 2009,2010, gains and losses on disposal of assets are mainly related to sales of assets in the Upstream segment (sale of the interests in the Valhall and Hod fields in Norway and sale of the interest in Block 31 in Angola, see Note 3 to the Consolidated Financial Statements), as well as the change in the accounting treatment and the disposal of shares of Sanofi-Aventis (see Note 3 to the Consolidated Financial Statements). In 2009, gains and losses on disposal of assets were mainly related to the disposal of shares of Sanofi-Aventis. In 2008, gains and losses on disposal of assets were mainly related to sales of non-current assets in the Upstream segment, as well as the disposal of shares of Sanofi-Aventis. In 2007, gains and losses on disposal of assets were mainly related to sales of non-current assets in the Upstream and Downstream segments, as well as the disposal of shares of Sanofi-Aventis.
In 2009,2010, the heading “Other” is mainly comprised of €190 €248 million of restructuring charges in the Downstream and Chemicals segments. In 2008,2009, the heading “Other” was mainly comprised of:€107 million of restructuring charges in the Upstream, Downstream and Chemicals segments; and
€48 million of changes in provisions related to various antitrust investigations as described in Note 32 to the Consolidated Financial Statements “Other risks and contingent liabilities”.
In 2007, the heading “Other” was mainly comprised of:
€51€190 million of restructuring charges in the Downstream and Chemicals segments; andsegments.
In 2008, the heading “Other” was mainly comprised of: | | | • | €107 million of restructuring charges in the Upstream, Downstream and Chemicals segments; and | | • | €48 million of changes in provisions related to various antitrust investigations as described in Note 32 to the Consolidated Financial Statements “Other risks and contingent liabilities”. |
F-32
€100 million of changes in provisions related to various antitrust investigations as described in Note 32 to the Consolidated Financial Statements “Other risks and contingent liabilities”.
8) OTHER FINANCIAL INCOME AND EXPENSE
| | | | | | | | | | | As of December 31,(€ million) | | 2009 | | | 2008 | | | 2007 | | Dividend income on non-consolidated subsidiaries | | 210 | | | 238 | | | 218 | | Capitalized financial expenses | | 117 | | | 271 | | | 322 | | Other | | 316 | | | 219 | | | 103 | | Other financial income | | 643 | | | 728 | | | 643 | | | | | | Accretion of asset retirement obligations | | (283 | ) | | (229 | ) | | (189 | ) | Other | | (62 | ) | | (96 | ) | | (85 | ) | Other financial expense | | (345 | ) | | (325 | ) | | (274 | ) |
9) INCOME TAXES
| | | 8) | OTHER FINANCIAL INCOME AND EXPENSE |
| | | | | | | | | | | | | | | As of December 31, (M€) | | 2010 | | | 2009 | | | 2008 | | | Dividend income on non-consolidated subsidiaries | | | 255 | | | | 210 | | | | 238 | | | Capitalized financial expenses | | | 113 | | | | 117 | | | | 271 | | | Other | | | 74 | | | | 316 | | | | 219 | | Other financial income | | | 442 | | | | 643 | | | | 728 | | | | | | | | | | | | | | | | | Accretion of asset retirement obligations | | | (338 | ) | | | (283 | ) | | | (229 | ) | | Other | | | (69 | ) | | | (62 | ) | | | (96 | ) | | | | | | | | | | | | | | | Other financial expense | | | (407 | ) | | | (345 | ) | | | (325 | ) | | | | | | | | | | | | | | |
Since 1966, the Group has been taxed in accordance with the consolidated income tax treatment approved on a renewable basis by the French Ministry of Economy, IndustryFinance and Employment.Industry. The renewal of this approval has been requested for the2011-2013 period. It is being reviewed by the French Department of Budget, Public Accounts, Civil Service and State Reform. consolidated income tax treatment covers the period 2008-2010.
No deferred tax is recognized for the temporary differences between the carrying amounts and tax bases of investments in foreign subsidiaries which are considered to be permanent investments. Undistributed earnings from foreign subsidiaries considered to be reinvested indefinitely amounted to €22,292€26,458 million as of December 31, 2009.2010. The determination of the tax effect relating to such reinvested income is not practicable. In addition, no deferred tax is recognized on unremitted earnings (approximately€17,968 €21,147 million) of the Group’s French subsidiaries since the remittance of such earnings would be tax exempt for the subsidiaries in which the Company owns 95% or more of the outstanding shares. Income taxes are detailed as follows: | | | | | | | | | | | For the year ended December 31, (€ million) | | 2009 | | | 2008 | | | 2007 | | Current income taxes | | (7,213 | ) | | (14,117 | ) | | (12,141 | ) | Deferred income taxes | | (538 | ) | | (29 | ) | | (1,434 | ) | Total income taxes | | (7,751 | ) | | (14,146 | ) | | (13,575 | ) |
| | | | | | | | | | | | | | | For the year ended December 31, (M€) | | 2010 | | | 2009 | | | 2008 | | | Current income taxes | | | (9,934 | ) | | | (7,213 | ) | | | (14,117 | ) | | Deferred income taxes | | | (294 | ) | | | (538 | ) | | | (29 | ) | | | | | | | | | | | | | | | Total income taxes | | | (10,228 | ) | | | (7,751 | ) | | | (14,146 | ) | | | | | | | | | | | | | | |
Before netting deferred tax assets and liabilities by fiscal entity, the components of deferred tax balances as of December 31, 2009, 2008 and 2007 are as follows: | | | | | | | | | | | | | | | As of December 31, (M€) | | 2010 | | | 2009 | | | 2008 | | | Net operating losses and tax carry forwards | | | 1,145 | | | | 1,114 | | | | 1,031 | | | Employee benefits | | | 535 | | | | 517 | | | | 519 | | | Other temporary non-deductible provisions | | | 2,757 | | | | 2,184 | | | | 2,075 | | | | | | | | | | | | | | | | Gross deferred tax assets | | | 4,437 | | | | 3,815 | | | | 3,625 | | | | | | | | | | | | | | | | | Valuation allowance | | | (576 | ) | | | (484 | ) | | | (475 | ) | | | | | | | | | | | | | | | Net deferred tax assets | | | 3,861 | | | | 3,331 | | | | 3,150 | | | | | | | | | | | | | | | | | Excess tax over book depreciation | | | (10,966 | ) | | | (9,791 | ) | | | (8,836 | ) | | Other temporary tax deductions | | | (1,339 | ) | | | (1,179 | ) | | | (1,171 | ) | | | | | | | | | | | | | | | Gross deferred tax liability | | | (12,305 | ) | | | (10,970 | ) | | | (10,007 | ) | | | | | | | | | | | | | | | Net deferred tax liability | | | (8,444 | ) | | | (7,639 | ) | | | (6,857 | ) | | | | | | | | | | | | | | |
F-33
| | | | | | | | | | | As of December 31, (€ million) | | 2009 | | | 2008 | | | 2007 | | Net operating losses and tax carry forwards | | 1,114 | | | 1,031 | | | 560 | | Employee benefits | | 517 | | | 519 | | | 760 | | Other temporary non-deductible provisions | | 2,184 | | | 2,075 | | | 2,341 | | Gross deferred tax assets | | 3,815 | | | 3,625 | | | 3,661 | | Valuation allowance | | (484 | ) | | (475 | ) | | (449 | ) | Net deferred tax assets | | 3,331 | | | 3,150 | | | 3,212 | | Excess tax over book depreciation | | (9,791 | ) | | (8,836 | ) | | (9,254 | ) | Other temporary tax deductions | | (1,179 | ) | | (1,171 | ) | | (1,209 | ) | Gross deferred tax liability | | (10,970 | ) | | (10,007 | ) | | (10,463 | ) | Net deferred tax liability | | (7,639 | ) | | (6,857 | ) | | (7,251 | ) |
After netting deferred tax assets and liabilities by fiscal entity, deferred taxes are presented on the balance sheet as follows: | | | | | | | | | | | | | | As of December 31, (€ million) | | | | | 2009 | | | 2008 | | | 2007 | | Deferred tax assets, non-current | | (note 14 | ) | | 1,164 | | | 1,010 | | | 797 | | Deferred tax assets, current | | (note 16 | ) | | 214 | | | 206 | | | 112 | | Deferred tax liabilities, non-current | | | | | (8,948 | ) | | (7,973 | ) | | (7,933 | ) | Deferred tax liabilities, current | | | | | (69 | ) | | (100 | ) | | (227 | ) | Net amount | | | | | (7,639 | ) | | (6,857 | ) | | (7,251 | ) |
| | | | | | | | | | | | | | | As of December 31, (M€) | | 2010 | | | 2009 | | | 2008 | | | Deferred tax assets, non-current (note 14) | | | 1,378 | | | | 1,164 | | | | 1,010 | | | Deferred tax assets, current (note 16) | | | 151 | | | | 214 | | | | 206 | | | Deferred tax liabilities, non-current | | | (9,947 | ) | | | (8,948 | ) | | | (7,973 | ) | | Deferred tax liabilities, current | | | (26 | ) | | | (69 | ) | | | (100 | ) | | | | | | | | | | | | | | | Net amount | | | (8,444 | ) | | | (7,639 | ) | | | (6,857 | ) | | | | | | | | | | | | | | |
The net deferred tax variation in the balance sheet is analyzed as follows: | | | | | | | | | | | As of December 31, (€ million) | | 2009 | | | 2008 | | | 2007 | | Opening balance | | (6,857 | ) | | (7,251 | ) | | (6,369 | ) | Deferred tax on income | | (538 | ) | | (29 | ) | | (1,434 | ) | Deferred tax on shareholders’ equity(a) | | (38 | ) | | 30 | | | (6 | ) | Changes in scope of consolidation | | (1 | ) | | (1 | ) | | 158 | | Currency translation adjustment | | (205 | ) | | 394 | | | 400 | | Closing balance | | (7,639 | ) | | (6,857 | ) | | (7,251 | ) |
| | | | | | | | | | | | | | | As of December 31, (M€) | | 2010 | | | 2009 | | | 2008 | | Opening balance | | | (7,639 | ) | | | (6,857 | ) | | | (7,251 | ) | | Deferred tax on income | | | (294 | ) | | | (538 | ) | | | (29 | ) | Deferred tax on shareholders’ equity(a) | | | 28 | | | | (38 | ) | | | 30 | | | Changes in scope of consolidation | | | (59 | ) | | | (1 | ) | | | (1 | ) | | Currency translation adjustment | | | (480 | ) | | | (205 | ) | | | 394 | | | | | | | | | | | | | | | | Closing balance | | | (8,444 | ) | | | (7,639 | ) | | | (6,857 | ) | | | | | | | | | | | | | | |
(a) | | | | (a) | | This amount includes mainly current income taxes and deferred taxes for changes in fair value of listed securities classified as financial assets available for sale as well as deferred taxes related to the cash flow hedge (see Note 17 to the Consolidated Financial Statements). |
Reconciliation between provision for income taxes and pre-tax income: | | | | | | | | | | | For the year ended December 31,(€ million) | | 2009 | | | 2008 | | | 2007 | | Consolidated net income | | 8,629 | | | 10,953 | | | 13,535 | | Provision for income taxes | | 7,751 | | | 14,146 | | | 13,575 | | Pre-tax income | | 16,380 | | | 25,099 | | | 27,110 | | French statutory tax rate | | 34.43% | | | 34.43% | | | 34.43% | | Theoretical tax charge | | (5,640 | ) | | (8,642 | ) | | (9,334 | ) | Difference between French and foreign income tax rates | | (3,214 | ) | | (6,326 | ) | | (5,118 | ) | Tax effect of equity in income (loss) of affiliates | | 565 | | | 593 | | | 611 | | Permanent differences | | 597 | | | 315 | | | 122 | | Adjustments on prior years income taxes | | (47 | ) | | 12 | | | 75 | | Adjustments on deferred tax related to changes in tax rates | | (1 | ) | | (31 | ) | | (16 | ) | Changes in valuation allowance of deferred tax assets | | (6 | ) | | (63 | ) | | 80 | | Other | | (5 | ) | | (4 | ) | | 5 | | Net provision for income taxes | | (7,751 | ) | | (14,146 | ) | | (13,575 | ) |
| | | | | | | | | | | | | | | For the year ended December 31, (M€) | | 2010 | | | 2009 | | | 2008 | | | Consolidated net income | | | 10,807 | | | | 8,629 | | | | 10,953 | | | Provision for income taxes | | | 10,228 | | | | 7,751 | | | | 14,146 | | Pre-tax income | | | 21,035 | | | | 16,380 | | | | 25,099 | | | French statutory tax rate | | | 34.43% | | | | 34.43% | | | | 34.43% | | | | | | | | | | | | | | | | Theoretical tax charge | | | (7,242 | ) | | | (5,640 | ) | | | (8,642 | ) | | | | | | | | | | | | | | | | Difference between French and foreign income tax rates | | | (4,921 | ) | | | (3,214 | ) | | | (6,326 | ) | | Tax effect of equity in income (loss) of affiliates | | | 672 | | | | 565 | | | | 593 | | | Permanent differences | | | 1,375 | | | | 597 | | | | 315 | | | Adjustments on prior years income taxes | | | (45 | ) | | | (47 | ) | | | 12 | | | Adjustments on deferred tax related to changes in tax rates | | | 2 | | | | (1 | ) | | | (31 | ) | | Changes in valuation allowance of deferred tax assets | | | (65 | ) | | | (6 | ) | | | (63 | ) | | Other | | | (4 | ) | | | (5 | ) | | | (4 | ) | | | | | | | | | | | | | | | Net provision for income taxes | | | (10,228 | ) | | | (7,751 | ) | | | (14,146 | ) | | | | | | | | | | | | | | |
The French statutory tax rate includes the standard corporate tax rate (33.33%) and additional applicable taxes that bring the overall tax rate to 34.43% in 20092010 (identical to 20082009 and 2007)2008). Permanent differences are mainly due to impairment of goodwill and to dividends from non-consolidated companies as well as the specific taxation rules applicable to certain activities and within the consolidated income tax treatment.
F-34
Net operating losses and tax credit carryforwards Deferred tax assets related to net operating losses and tax carryforwards were available in various tax jurisdictions, expiringexpire in the following years: | | | | | | | | | | | | | | As of December 31,(€ million) | | 2009 | | 2008 | | 2007 | | | | Basis | | Tax | | Basis | | Tax | | Basis | | Tax | 2008 | | — | | — | | — | | — | | 290 | | 141 | 2009 | | — | | — | | 233 | | 115 | | 222 | | 109 | 2010 | | 258 | | 126 | | 167 | | 79 | | 129 | | 59 | 2011 | | 170 | | 83 | | 93 | | 42 | | 33 | | 13 | 2012(a) | | 121 | | 52 | | 61 | | 19 | | 68 | | 22 | 2013(b) | | 133 | | 43 | | 1,765 | | 587 | | | | | 2014 and after | | 1,804 | | 599 | | — | | — | | — | | — | Unlimited | | 661 | | 211 | | 560 | | 189 | | 641 | | 216 | Total | | 3,147 | | 1,114 | | 2,879 | | 1,031 | | 1,383 | | 560 |
| | | | | | | | | | | | | | | | | | | | | | | | | | | As of December 31, (M€) | | 2010 | | | 2009 | | | 2008 | | | | | Basis | | | Tax | | | Basis | | | Tax | | | Basis | | | Tax | | | 2009 | | | — | | | | — | | | | — | | | | — | | | | 233 | | | | 115 | | | 2010 | | | — | | | | — | | | | 258 | | | | 126 | | | | 167 | | | | 79 | | | 2011 | | | 225 | | | | 110 | | | | 170 | | | | 83 | | | | 93 | | | | 42 | | | 2012 | | | 177 | | | | 80 | | | | 121 | | | | 52 | | | | 61 | | | | 19 | | 2013(a) | | | 146 | | | | 59 | | | | 133 | | | | 43 | | | | 1,765 | | | | 587 | | 2014(b) | | | 1,807 | | | | 602 | | | | 1,804 | | | | 599 | | | | — | | | | — | | | 2015 and after | | | 190 | | | | 62 | | | | — | | | | — | | | | — | | | | — | | | Unlimited | | | 774 | | | | 232 | | | | 661 | | | | 211 | | | | 560 | | | | 189 | | | | | | | | | | | | | | | | | | | | | | | | | | | | Total | | | 3,319 | | | | 1,145 | | | | 3,147 | | | | 1,114 | | | | 2,879 | | | | 1,031 | | | | | | | | | | | | | | | | | | | | | | | | | | | |
(a) | Net operating losses and tax credit carryforwards in 2012 and after for 2007
| |
(b)(a) | | Net operating losses and tax credit carryforwards in 2013 and after for 2008 | | (b) | | Net operating losses and tax credit carryforwards in 2014 and after for 2009 |
10) INTANGIBLE ASSETS
| | | | | | | | | As of December 31, 2009(€ million) | | Cost | | Amortization
and
impairment | | | Net | Goodwill | | 1,776 | | (614 | ) | | 1,162 | Proved and unproved mineral interests | | 8,204 | | (2,421 | ) | | 5,783 | Other intangible assets | | 2,712 | | (2,143 | ) | | 569 | Total intangible assets | | 12,692 | | (5,178 | ) | | 7,514 |
| | | | | | | | | As of December 31, 2008(€ million) | | Cost | | Amortization
and
impairment | | | Net | Goodwill | | 1,690 | | (616 | ) | | 1,074 | Proved and unproved mineral interests | | 6,010 | | (2,268 | ) | | 3,742 | Other intangible assets | | 2,519 | | (1,994 | ) | | 525 | Total intangible assets | | 10,219 | | (4,878 | ) | | 5,341 |
| | | | | | | | | As of December 31, 2007(€ million) | | Cost | | Amortization
and
impairment | | | Net | Goodwill | | 1,684 | | (617 | ) | | 1,067 | Proved and unproved mineral interests | | 5,327 | | (2,310 | ) | | 3,017 | Other intangible assets | | 2,452 | | (1,886 | ) | | 566 | Total intangible assets | | 9,463 | | (4,813 | ) | | 4,650 |
| | | | | | | | | | | | | | | | | | | | Amortization
| | | | | | | | | | | and
| | | | | | As of December 31, 2010 (M€) | | Cost | | | impairment | | | Net | | | Goodwill | | | 1,498 | | | | (596 | ) | | | 902 | | | Proved and unproved mineral interests | | | 10,099 | | | | (2,712 | ) | | | 7,387 | | | Other intangible assets | | | 2,803 | | | | (2,175 | ) | | | 628 | | | | | | | | | | | | | | | | Total intangible assets | | | 14,400 | | | | (5,483 | ) | | | 8,917 | | | | | | | | | | | | | | | |
| | | | | | | | | | | | | | | | | | | | Amortization
| | | | | | | | | | | and
| | | | | | As of December 31, 2009 (M€) | | Cost | | | impairment | | | Net | | | Goodwill | | | 1,776 | | | | (614 | ) | | | 1,162 | | | Proved and unproved mineral interests | | | 8,204 | | | | (2,421 | ) | | | 5,783 | | | Other intangible assets | | | 2,712 | | | | (2,143 | ) | | | 569 | | | | | | | | | | | | | | | | Total intangible assets | | | 12,692 | | | | (5,178 | ) | | | 7,514 | | | | | | | | | | | | | | | |
| | | | | | | | | | | | | | | | | | | | Amortization
| | | | | | | | | | | and
| | | | | | As of December 31, 2008 (M€) | | Cost | | | impairment | | | Net | | | Goodwill | | | 1,690 | | | | (616 | ) | | | 1,074 | | | Proved and unproved mineral interests | | | 6,010 | | | | (2,268 | ) | | | 3,742 | | | Other intangible assets | | | 2,519 | | | | (1,994 | ) | | | 525 | | | | | | | | | | | | | | | | Total intangible assets | | | 10,219 | | | | (4,878 | ) | | | 5,341 | | | | | | | | | | | | | | | |
Changes in net intangible assets are analyzed in the following table: | | | | | | | | | | | | | | | | | | | | | | | | | | | | | | | | | | | | | | | | | | Amortization
| | | Currency
| | | | | | | | | | | Net amount as of
| | | | | | | | | and
| | | translation
| | | | | | Net amount as of
| | | (M€) | | January 1, | | | Acquisitions | | | Disposals | | | impairment | | | adjustment | | | Other | | | December 31, | | 2010 | | | 7,514 | | | | 2,466 | | | | (62 | ) | | | (553 | ) | | | 491 | | | | (939 | ) | | | 8,917 | | | 2009 | | | 5,341 | | | | 629 | | | | (64 | ) | | | (345 | ) | | | 2 | | | | 1,951 | | | | 7,514 | | | 2008 | | | 4,650 | | | | 404 | | | | (3 | ) | | | (259 | ) | | | (93 | ) | | | 642 | | | | 5,341 | | | | | | | | | | | | | | | | | | | | | | | | | | | | | | | |
F-35
| | | | | | | | | | | | | | | | | | | (€ million) | | Net amount as of
January 1, | | Acquisitions | | Disposals | | | Amortization
and
impairment | | | Currency translation adjustment | | | Other | | Net amount as of
December 31, | 2009 | | 5,341 | | 629 | | (64 | ) | | (345 | ) | | 2 | | | 1,951 | | 7,514 | 2008 | | 4,650 | | 404 | | (3 | ) | | (259 | ) | | (93 | ) | | 642 | | 5,341 | 2007 | | 4,705 | | 472 | | (160 | ) | | (274 | ) | | (208 | ) | | 115 | | 4,650 |
In 2009,2010, the heading “Other” mainly includes Chesapeake’s Barnett shale mineral interests reclassified into the acquisitions for €1,449 €(975) million and the reclassification of Joslyn’s mineral interests in accordance with IFRS 5 “Non-current assets held for sale and discontinued operations” for €(390) million, including the currency translation adjustment (see Note 34 to the Consolidated Financial Statements), partially compensated by the acquisition of UTS for €646 million (see Note 3 to the Consolidated Financial Statements). In 2009, the heading “Other” mainly included Chesapeake’s Barnett shale mineral interests for €1,449 million (see Note 3 to the Consolidated Financial Statements). In 2008, the heading “Other” mainly included the impact of “proved and unproved mineral interests” from Synenco Energy Inc. for€221 €221 million and from Goal Petroleum B.V. for€292 €292 million.
A summary of changes in the carrying amount of goodwill by business segment for the year ended December 31, 20092010 is as follows: | | | | | | | | | | | | | | | | | | | | | | | | | Net goodwill as of
| | | | | | | | | | | | Net goodwill as of
| | | (M€) | | January 1, 2010 | | | Increases | | | Impairments | | | Other | | | December 31, 2010 | | | Upstream | | | 78 | | | | — | | | | — | | | | — | | | | 78 | | | Downstream | | | 202 | | | | 22 | | | | (88 | ) | | | (54 | ) | | | 82 | | | Chemicals | | | 857 | | | | — | | | | — | | | | (140 | ) | | | 717 | | | Corporate | | | 25 | | | | — | | | | — | | | | — | | | | 25 | | | | | | | | | | | | | | | | | | | | | | | | Total | | | 1,162 | | | | 22 | | | | (88 | ) | | | (194 | ) | | | 902 | | | | | | | | | | | | | | | | | | | | | | | |
The heading “Other” mainly corresponds to the sale of Mapa Spontex and the reclassification of the goodwill of resins businesses subject to a disposal plan in accordance with IFRS 5 “Non-current assets held for sale and discontinued operations”. | | | 11) | PROPERTY, PLANT AND EQUIPMENT |
| | | | | | | | | | | | | | | | | | | | Depreciation
| | | | | | | | | | | and
| | | | | | As of December 31, 2010 (M€) | | Cost | | | impairment | | | Net | | Upstream properties | | | | | | | | | | | | | | Proved properties | | | 77,183 | | | | (50,582 | ) | | | 26,601 | | | Unproved properties | | | 347 | | | | (1 | ) | | | 346 | | | Work in progress | | | 14,712 | | | | (37 | ) | | | 14,675 | | | | | | | | | | | | | | | | Subtotal | | | 92,242 | | | | (50,620 | ) | | | 41,622 | | | | | | | | | | | | | | | | Other property, plant and equipment | | | | | | | | | | | | | | Land | | | 1,304 | | | | (393 | ) | | | 911 | | | Machinery, plant and equipment (including transportation equipment) | | | 23,831 | | | | (17,010 | ) | | | 6,821 | | | Buildings | | | 6,029 | | | | (3,758 | ) | | | 2,271 | | | Work in progress | | | 2,350 | | | | (488 | ) | | | 1,862 | | | Other | | | 6,164 | | | | (4,687 | ) | | | 1,477 | | | | | | | | | | | | | | | | Subtotal | | | 39,678 | | | | (26,336 | ) | | | 13,342 | | | | | | | | | | | | | | | | Total property, plant and equipment | | | 131,920 | | | | (76,956 | ) | | | 54,964 | | | | | | | | | | | | | | | |
F-36
| | | | | | | | | | | | (€ million) | | Net goodwill as of
January 1, 2009 | | Increases | | Impairments | | Other | | Net goodwill as of
December 31, 2009 | Upstream | | 78 | | — | | — | | — | | 78 | Downstream | | 130 | | 70 | | — | | 2 | | 202 | Chemicals | | 841 | | 11 | | — | | 5 | | 857 | Corporate | | 25 | | — | | — | | — | | 25 | Total | | 1,074 | | 81 | | — | | 7 | | 1,162 |
11) PROPERTY, PLANT AND EQUIPMENT
| | | | | | | | | As of December 31, 2009(€ million) | | Cost | | Depreciation
and
impairment | | | Net | Upstream properties | | | | | | | | Proved properties | | 71,082 | | (44,718 | ) | | 26,364 | Unproved properties | | 182 | | (1 | ) | | 181 | Work in progress | | 10,351 | | (51 | ) | | 10,300 | Subtotal | | 81,615 | | (44,770 | ) | | 36,845 | Other property, plant and equipment | | | | | | | | Land | | 1,458 | | (435 | ) | | 1,023 | Machinery, plant and equipment (including transportation equipment) | | 22,927 | | (15,900 | ) | | 7,027 | Buildings | | 6,142 | | (3,707 | ) | | 2,435 | Work in progress | | 2,774 | | (155 | ) | | 2,619 | Other | | 6,506 | | (4,865 | ) | | 1,641 | Subtotal | | 39,807 | | (25,062 | ) | | 14,745 | Total property, plant and equipment | | 121,422 | | (69,832 | ) | | 51,590 |
| | | | | | | | | As of December 31, 2008(€ million) | | Cost | | Depreciation
and
impairment | | | Net | Upstream properties | | | | | | | | Proved properties | | 61,727 | | (39,315 | ) | | 22,412 | Unproved properties | | 106 | | (1 | ) | | 105 | Work in progress | | 9,586 | | — | | | 9,586 | Subtotal | | 71,419 | | (39,316 | ) | | 32,103 | Other property, plant and equipment | | | | | | | | Land | | 1,446 | | (429 | ) | | 1,017 | Machinery, plant and equipment (including transportation equipment) | | 21,734 | | (14,857 | ) | | 6,877 | Buildings | | 5,739 | | (3,441 | ) | | 2,298 | Work in progress | | 2,226 | | (10 | ) | | 2,216 | Other | | 6,258 | | (4,627 | ) | | 1,631 | Subtotal | | 37,403 | | (23,364 | ) | | 14,039 | Total property, plant and equipment | | 108,822 | | (62,680 | ) | | 46,142 |
| | | | | | | | | As of December 31, 2007(€ million) | | Cost | | Depreciation
and
impairment | | | Net | Upstream properties | | | | | | | | Proved properties | | 60,124 | | (38,735 | ) | | 21,389 | Unproved properties | | 48 | | (1 | ) | | 47 | Work in progress | | 7,010 | | — | | | 7,010 | Subtotal | | 67,182 | | (38,736 | ) | | 28,446 | Other property, plant and equipment | | | | | | | | Land | | 1,460 | | (417 | ) | | 1,043 | Machinery, plant and equipment (including transportation equipment) | | 20,575 | | (14,117 | ) | | 6,458 | Buildings | | 5,505 | | (3,430 | ) | | 2,075 | Work in progress | | 1,832 | | (4 | ) | | 1,828 | Other | | 6,291 | | (4,674 | ) | | 1,617 | Subtotal | | 35,663 | | (22,642 | ) | | 13,021 | Total property, plant and equipment | | 102,845 | | (61,378 | ) | | 41,467 |
| | | | | | | | | | | | | | | | | | | | Depreciation
| | | | | | | | | | | and
| | | | | | As of December 31, 2009 (M€) | | Cost | | | impairment | | | Net | | Upstream properties | | | | | | | | | | | | | | Proved properties | | | 71,082 | | | | (44,718 | ) | | | 26,364 | | | Unproved properties | | | 182 | | | | (1 | ) | | | 181 | | | Work in progress | | | 10,351 | | | | (51 | ) | | | 10,300 | | | | | | | | | | | | | | | | Subtotal | | | 81,615 | | | | (44,770 | ) | | | 36,845 | | | | | | | | | | | | | | | | Other property, plant and equipment | | | | | | | | | | | | | | Land | | | 1,458 | | | | (435 | ) | | | 1,023 | | | Machinery, plant and equipment (including transportation equipment) | | | 22,927 | | | | (15,900 | ) | | | 7,027 | | | Buildings | | | 6,142 | | | | (3,707 | ) | | | 2,435 | | | Work in progress | | | 2,774 | | | | (155 | ) | | | 2,619 | | | Other | | | 6,506 | | | | (4,865 | ) | | | 1,641 | | | | | | | | | | | | | | | | Subtotal | | | 39,807 | | | | (25,062 | ) | | | 14,745 | | | | | | | | | | | | | | | | Total property, plant and equipment | | | 121,422 | | | | (69,832 | ) | | | 51,590 | |
| | | | | | | | | | | | | | | | | | | | Depreciation
| | | | | | | | | | | and
| | | | | | As of December 31, 2008 (M€) | | Cost | | | impairment | | | Net | | Upstream properties | | | | | | | | | | | | | | Proved properties | | | 61,727 | | | | (39,315 | ) | | | 22,412 | | | Unproved properties | | | 106 | | | | (1 | ) | | | 105 | | | Work in progress | | | 9,586 | | | | — | | | | 9,586 | | | | | | | | | | | | | | | | Subtotal | | | 71,419 | | | | (39,316 | ) | | | 32,103 | | | | | | | | | | | | | | | | Other property, plant and equipment | | | | | | | | | | | | | | Land | | | 1,446 | | | | (429 | ) | | | 1,017 | | | Machinery, plant and equipment (including transportation equipment) | | | 21,734 | | | | (14,857 | ) | | | 6,877 | | | Buildings | | | 5,739 | | | | (3,441 | ) | | | 2,298 | | | Work in progress | | | 2,226 | | | | (10 | ) | | | 2,216 | | | Other | | | 6,258 | | | | (4,627 | ) | | | 1,631 | | | | | | | | | | | | | | | | Subtotal | | | 37,403 | | | | (23,364 | ) | | | 14,039 | | | | | | | | | | | | | | | | Total property, plant and equipment | | | 108,822 | | | | (62,680 | ) | | | 46,142 | | | | | | | | | | | | | | | |
Changes in net property, plant and equipment are analyzed in the following table: | | | | | | | | | | | | | | | | | | | | | | | | | | | | | | | | | Net amount
| | | | | | | | | Depreciation
| | | Currency
| | | | | | Net amount
| | | | | as of
| | | | | | | | | and
| | | translation
| | | | | | as of
| | | (M€) | | January 1, | | | Acquisitions | | | Disposals | | | impairment | | | adjustment | | | Other | | | December 31, | | 2010 | | | 51,590 | | | | 11,346 | | | | (1,269 | ) | | | (8,564 | ) | | | 2,974 | | | | (1,113 | ) | | | 54,964 | | | 2009 | | | 46,142 | | | | 11,212 | | | | (65 | ) | | | (6,765 | ) | | | 397 | | | | 669 | | | | 51,590 | | | 2008 | | | 41,467 | | | | 11,442 | | | | (102 | ) | | | (5,941 | ) | | | (1,151 | ) | | | 427 | | | | 46,142 | |
In 2010, the heading “Disposals” mainly includes the impact of sales of assets in the Upstream segment (sale of the interests in the Valhall and Hod fields in Norway and sale of the interest in Block 31 in Angola, see Note 3 to the Consolidated Financial Statements). In 2010, the heading “Depreciation and impairment” includes the impact of impairments of assets recognized for €1,416 million (see Note 4C to the Consolidated Financial Statements). F-37
| | | | | | | | | | | | | | | | | | | | (€ million) | | Net amount
as of
January 1, | | Acquisitions | | Disposals | | | Depreciation
and
impairment | | | Currency translation adjustment | | | Other | | | Net amount
as of
December 31, | 2009 | | 46,142 | | 11,212 | | (65 | ) | | (6,765 | ) | | 397 | | | 669 | | | 51,590 | 2008 | | 41,467 | | 11,442 | | (102 | ) | | (5,941 | ) | | (1,151 | ) | | 427 | | | 46,142 | 2007 | | 40,576 | | 10,241 | | (729 | ) | | (5,674 | ) | | (2,347 | ) | | (600 | ) | | 41,467 |
In 2010, the heading “Other” mainly corresponds to the change in the consolidation method of Samsung Total Petrochemicals (see Note 12 to the Consolidated Financial Statements) for €(541) million and the reclassification for €(537) million, including the currency translation adjustment, of property, plant and equipment related to Joslyn, Total E&P Cameroun, and resins businesses subject to a disposal project in accordance with IFRS 5 “Non-current assets held for sale and discontinued operations” (see Note 34 to the Consolidated Financial Statements), partially compensated by the acquisition of UTS for €217 million (see Note 3 to the Consolidated Financial Statements). In 2009, the heading “Other” mainly includesincluded changes in net property, plant and equipment related to asset retirement obligations and Chesapeake’s Barnett shale tangible assets for €113 €113 million (see Note 3 to the Consolidated Financial Statements). In 2008, the heading “Other” mainly included changes in net property, plant and equipment related to asset retirement obligations. In 2007, the heading “Disposals” mainly included the impact of conversion of the Sincor project and the disposal of the Group’s interest in the Milford Haven refinery. The heading “Other” mainly included the impact of conversion of the Sincor project and changes in net property, plant and equipment related to asset retirement obligations.
Property, plant and equipment presented above include the following amounts for facilities and equipment under finance leases that have been capitalized: | | | | | | | | | As of December 31, 2009(€ million) | | Cost | | Depreciation
and
impairment | | | Net | Machinery, plant and equipment | | 548 | | (343 | ) | | 205 | Buildings | | 60 | | (30 | ) | | 30 | Other | | — | | — | | | — | Total | | 608 | | (373 | ) | | 235 |
| | | | | | | | | As of December 31, 2008(€ million) | | Cost | | Depreciation
and
impairment | | | Net | Machinery, plant and equipment | | 558 | | (316 | ) | | 242 | Buildings | | 35 | | (28 | ) | | 7 | Other | | — | | — | | | — | Total | | 593 | | (344 | ) | | 249 |
| | | | | | | | | As of December 31, 2007(€ million) | | Cost | | Depreciation
and
impairment | | | Net | Machinery, plant and equipment | | 503 | | (265 | ) | | 238 | Buildings | | 35 | | (29 | ) | | 6 | Other | | — | | — | | | — | Total | | 538 | | (294 | ) | | 244 |
12) EQUITY AFFILIATES: INVESTMENTS AND LOANS
| | | | | | | | | | | | | | | | | Equity value(€ million) | | As of December 31, | | | | 2009 | | | 2008 | | | 2007 | | | 2009 | | 2008 | | 2007 | | | | | | | % owned | | | | | | equity value | NLNG | | 15.00 | % | | 15.00 | % | | 15.00 | % | | 1,136 | | 1,135 | | 1,062 | PetroCedeño — EM(a) | | 30.32 | % | | 30.32 | % | | 30.32 | % | | 874 | | 760 | | 534 | CEPSA (Upstream share) | | 48.83 | % | | 48.83 | % | | 48.83 | % | | 385 | | 403 | | 246 | Angola LNG Ltd.(a) | | 13.60 | % | | 13.60 | % | | 13.60 | % | | 490 | | 326 | | 155 | Qatargas | | 10.00 | % | | 10.00 | % | | 10.00 | % | | 83 | | 251 | | 172 | Société du Terminal Méthanier de Fos Cavaou | | 28.79 | % | | 30.30 | % | | 30.30 | % | | 124 | | 114 | | 92 | SCP Limited | | 10.00 | % | | 10.00 | % | | 10.00 | % | | 89 | | 96 | | 91 | Dolphin Energy Ltd (Del) Abu Dhabi | | 24.50 | % | | 24.50 | % | | 24.50 | % | | 118 | | 85 | | 37 | Qatar Liquefied Gas Company Limited II (Train B) | | 16.70 | % | | 16.70 | % | | 16.70 | % | | 143 | | 82 | | 86 | Moattama Gas Transportation Cy | | 31.24 | % | | 31.24 | % | | 31.24 | % | | 51 | | 65 | | 53 | Ocensa | | 15.20 | % | | 15.20 | % | | 15.20 | % | | 85 | | 60 | | 57 | Gasoducto Gasandes Argentina | | 56.50 | % | | 56.50 | % | | 56.50 | % | | 46 | | 58 | | 74 | Gaz transport & Technigaz(a) | | 30.00 | % | | 30.00 | % | | 30.00 | % | | 26 | | 53 | | 46 | Laffan Refinery | | 10.00 | % | | 10.00 | % | | 10.00 | % | | 60 | | 53 | | 39 | Shtokman Development AG(b) | | 25.00 | % | | 25.00 | % | | — | | | 162 | | 35 | | — | Other | | — | | | — | | | — | | | 388 | | 315 | | 277 | Total Upstream | | | | | | | | | | | 4,260 | | 3,891 | | 3,021 | CEPSA (Downstream share) | | 48.83 | % | | 48.83 | % | | 48.83 | % | | 1,927 | | 1,810 | | 1,932 | Saudi Aramco Total Refining & Petrochemicals(b) | | 37.50 | % | | 37.50 | % | | — | | | 60 | | 75 | | — | Wepec | | 22.41 | % | | 22.41 | % | | 22.41 | % | | — | | — | | 70 | Other | | | | | — | | | — | | | 123 | | 73 | | 103 | Total Downstream | | | | | | | | | | | 2,110 | | 1,958 | | 2,105 | CEPSA (Chemicals share) | | 48.83 | % | | 48.83 | % | | 48.83 | % | | 396 | | 424 | | 524 | Qatar Petrochemical Company Ltd | | 20.00 | % | | 20.00 | % | | 20.00 | % | | 205 | | 192 | | 150 | Other | | — | | | — | | | — | | | 51 | | 61 | | 54 | Total Chemicals | | | | | | | | | | | 652 | | 677 | | 728 | Sanofi-Aventis | | 7.39 | % | | 11.38 | % | | 13.06 | % | | 4,235 | | 6,137 | | 6,851 | Other | | — | | | — | | | — | | | — | | — | | — | Total Corporate | | | | | | | | | | | 4,235 | | 6,137 | | 6,851 | Total investments | | | | | | | | | | | 11,257 | | 12,663 | | 12,705 | Loans | | | | | | | | | | | 2,367 | | 2,005 | | 2,575 | Total investments and loans | | | | | | | | | | | 13,624 | | 14,668 | | 15,280 |
| | | | | | | | | | | | | | | | | | | | Depreciation
| | | | | | | | | | | and
| | | | | | As of December 31, 2010 (M€) | | Cost | | | impairment | | | Net | | | Machinery, plant and equipment | | | 480 | | | | (332 | ) | | | 148 | | | Buildings | | | 54 | | | | (24 | ) | | | 30 | | | Other | | | — | | | | — | | | | — | | | | | | | | | | | | | | | | Total | | | 534 | | | | (356 | ) | | | 178 | | | | | | | | | | | | | | | |
| | | | | | | | | | | | | | | | | | | | Depreciation
| | | | | | | | | | | and
| | | | | | As of December 31, 2009 (M€) | | Cost | | | impairment | | | Net | | | Machinery, plant and equipment | | | 548 | | | | (343 | ) | | | 205 | | | Buildings | | | 60 | | | | (30 | ) | | | 30 | | | Other | | | — | | | | — | | | | — | | | | | | | | | | | | | | | | Total | | | 608 | | | | (373 | ) | | | 235 | | | | | | | | | | | | | | | |
| | | | | | | | | | | | | | | | | | | | Depreciation
| | | | | | | | | | | and
| | | | | | As of December 31, 2008 (M€) | | Cost | | | impairment | | | Net | | | Machinery, plant and equipment | | | 558 | | | | (316 | ) | | | 242 | | | Buildings | | | 35 | | | | (28 | ) | | | 7 | | | Other | | | — | | | | — | | | | — | | | | | | | | | | | | | | | | Total | | | 593 | | | | (344 | ) | | | 249 | | | | | | | | | | | | | | | |
(a) | | Investment accounted for by the equity method as from 2007.12) | EQUITY AFFILIATES: INVESTMENTS AND LOANS |
As from January 1st, 2010, jointly-controlled entities are consolidated under the equity method, as provided for in the alternative method of IAS 31 “Interests in joint ventures” (see Note 1 “Accounting policies” paragraphs A and V to the Consolidated Financial Statements). Until December 31, 2009, these entities were consolidated using the proportionate method.
F-38
| | | | | | | | | | | | | | | | | | | | | | | | | | | Equity value (M€) | | As of December 31, | | | | | 2010 | | | 2009 | | | 2008 | | | 2010 | | | 2009 | | | 2008 | | | | | % owned | | | equity value | | | NLNG | | | 15.00 | % | | | 15.00 | % | | | 15.00 | % | | | 1,108 | | | | 1,136 | | | | 1,135 | | | PetroCedeño — EM | | | 30.32 | % | | | 30.32 | % | | | 30.32 | % | | | 1,136 | | | | 874 | | | | 760 | | | CEPSA (Upstream share) | | | 48.83 | % | | | 48.83 | % | | | 48.83 | % | | | 340 | | | | 385 | | | | 403 | | | Angola LNG Ltd. | | | 13.60 | % | | | 13.60 | % | | | 13.60 | % | | | 710 | | | | 490 | | | | 326 | | | Qatargas | | | 10.00 | % | | | 10.00 | % | | | 10.00 | % | | | 85 | | | | 83 | | | | 251 | | | Société du Terminal Méthanier de Fos Cavaou | | | 28.03 | % | | | 28.79 | % | | | 30.30 | % | | | 125 | | | | 124 | | | | 114 | | | Dolphin Energy Ltd (Del) Abu Dhabi | | | 24.50 | % | | | 24.50 | % | | | 24.50 | % | | | 172 | | | | 118 | | | | 85 | | | Qatar Liquefied Gas Company Limited II (Train B) | | | 16.70 | % | | | 16.70 | % | | | 16.70 | % | | | 184 | | | | 143 | | | | 82 | | Shtokman Development AG(a) | | | 25.00 | % | | | 25.00 | % | | | 25.00 | % | | | 214 | | | | 162 | | | | 35 | | AMYRIS(b) | | | 22.03 | % | | | — | | | | — | | | | 101 | | | | — | | | | — | | | Other | | | — | | | | — | | | | — | | | | 749 | | | | 745 | | | | 700 | | Total associates | | | | | | | | | | | | | | | 4,924 | | | | 4,260 | | | | 3,891 | | | Other | | | — | | | | — | | | | — | | | | 78 | | | | — | | | | — | | Total jointly-controlled entities | | | | | | | | | | | | | | | 78 | | | | — | | | | — | | | | | | | | | | | | | | | | | | | | | | | | | | | | Total Upstream | | | | | | | | | | | | | | | 5,002 | | | | 4,260 | | | | 3,891 | | | CEPSA (Downstream share) | | | 48.83 | % | | | 48.83 | % | | | 48.83 | % | | | 2,151 | | | | 1,927 | | | | 1,810 | | Saudi Aramco Total Refining & Petrochemicals (Downstream share)(a) | | | 37.50 | % | | | 37.50 | % | | | 37.50 | % | | | 47 | | | | 60 | | | | 75 | | | Wepec | | | 22.41 | % | | | 22.41 | % | | | 22.41 | % | | | — | | | | — | | | | — | | | Other | | | — | | | | — | | | | — | | | | 159 | | | | 123 | | | | 73 | | Total associates | | | | | | | | | | | | | | | 2,357 | | | | 2,110 | | | | 1,958 | | SARA(d) | | | 50.00 | % | | | — | | | | — | | | | 134 | | | | — | | | | — | | TotalErg(b) | | | 49.00 | % | | | — | | | | — | | | | 289 | | | | — | | | | — | | | Other | | | — | | | | — | | | | — | | | | 2 | | | | — | | | | — | | Total jointly-controlled entities | | | | | | | | | | | | | | | 425 | | | | — | | | | — | | | | | | | | | | | | | | | | | | | | | | | | | | | | Total Downstream | | | | | | | | | | | | | | | 2,782 | | | | 2,110 | | | | 1,958 | | | CEPSA (Chemicals share) | | | 48.83 | % | | | 48.83 | % | | | 48.83 | % | | | 411 | | | | 396 | | | | 424 | | | Qatar Petrochemical Company Ltd. | | | 20.00 | % | | | 20.00 | % | | | 20.00 | % | | | 221 | | | | 205 | | | | 192 | | Saudi Aramco Total Refining & Petrochemicals (Chemicals share)(a) | | | 37.50 | % | | | 37.50 | % | | | 37.50 | % | | | 4 | | | | 5 | | | | 6 | | | Other | | | — | | | | — | | | | — | | | | 68 | | | | 46 | | | | 55 | | Total associates | | | | | | | | | | | | | | | 704 | | | | 652 | | | | 677 | | Samsung Total Petrochemicals(d) | | | 50.00 | % | | | — | | | | — | | | | 645 | | | | — | | | | — | | Total jointly-controlled entities | | | | | | | | | | | | | | | 645 | | | | — | | | | — | | | | | | | | | | | | | | | | | | | | | | | | | | | | Total Chemicals | | | | | | | | | | | | | | | 1,349 | | | | 652 | | | | 677 | | Sanofi-Aventis(c) | | | — | | | | 7.39 | % | | | 11.38 | % | | | — | | | | 4,235 | | | | 6,137 | | Total associates | | | | | | | | | | | | | | | — | | | | 4,235 | | | | 6,137 | | Total jointly-controlled entities | | | | | | | | | | | | | | | — | | | | — | | | | — | | | | | | | | | | | | | | | | | | | | | | | | | | | | Total Corporate | | | | | | | | | | | | | | | — | | | | 4,235 | | | | 6,137 | | | | | | | | | | | | | | | | | | | | | | | | | | | | Total investments | | | | | | | | | | | | | | | 9,133 | | | | 11,257 | | | | 12,663 | | | | | | | | | | | | | | | | | | | | | | | | | | | | | Loans | | | | | | | | | | | | | | | 2,383 | | | | 2,367 | | | | 2,005 | | | | | | | | | | | | | | | | | | | | | | | | | | | | Total investments and loans | | | | | | | | | | | | | | | 11,516 | | | | 13,624 | | | | 14,668 | | | | | | | | | | | | | | | | | | | | | | | | | | | |
(b) | | | | (a) | | Investment accounted for by the equity method as from 2008. |
| | | | | | | | | | | | | | | | | | | | Equity in income (loss)(€ million) | | As of December 31, | | | | | 2009 | | | 2008 | | | 2007 | | | 2009 | | | 2008 | | | 2007 | | | | | | | | % owned | | | | | | equity in income (loss) | | NLNG | | 15.00 | % | | 15.00 | % | | 15.00 | % | | 227 | | | 554 | | | 477 | | PetroCedeño — EM(a) | | 30.32 | % | | 30.32 | % | | 30.32 | % | | 166 | | | 193 | | | — | | CEPSA (Upstream share) | | 48.83 | % | | 48.83 | % | | 48.83 | % | | 23 | | | 50 | | | 88 | | Angola LNG Ltd.(a) | | 13.60 | % | | 13.60 | % | | 13.60 | % | | 9 | | | 10 | | | 7 | | Qatargas | | 10.00 | % | | 10.00 | % | | 10.00 | % | | 114 | | | 126 | | | 74 | | Société du Terminal Méthanier de Fos Cavaou | | 28.79 | % | | 30.30 | % | | 30.30 | % | | — | | | (5 | ) | | (2 | ) | SCP Limited | | 10.00 | % | | 10.00 | % | | 10.00 | % | | 6 | | | 4 | | | 1 | | Dolphin Energy Ltd (Del) Abu Dhabi | | 24.50 | % | | 24.50 | % | | 24.50 | % | | 94 | | | 83 | | | 5 | | Qatar Liquefied Gas Company Limited II (Train B) | | 16.70 | % | | 16.70 | % | | 16.70 | % | | 8 | | | (11 | ) | | (5 | ) | Moattama Gas Transportation Cy | | 31.24 | % | | 31.24 | % | | 31.24 | % | | 75 | | | 81 | | | 67 | | Ocensa | | 15.20 | % | | 15.20 | % | | 15.20 | % | | 36 | | | — | | | — | | Gasoducto Gasandes Argentina | | 56.50 | % | | 56.50 | % | | 56.50 | % | | (6 | ) | | (10 | ) | | (22 | ) | Gaz transport & Technigaz(a) | | 30.00 | % | | 30.00 | % | | 30.00 | % | | 20 | | | 51 | | | 45 | | Laffan Refinery | | 10.00 | % | | 10.00 | % | | 10.00 | % | | (4 | ) | | 2 | | | — | | Shtokman Development AG(b) | | 25.00 | % | | 25.00 | % | | — | | | 4 | | | — | | | — | | Other | | — | | | — | | | — | | | 87 | | | 50 | | | 6 | | Total Upstream | | | | | | | | | | | 859 | | | 1,178 | | | 741 | | CEPSA (Downstream share) | | 48.83 | % | | 48.83 | % | | 48.83 | % | | 149 | | | 76 | | | 253 | | Saudi Aramco Total Refining & Petrochemicals(b) | | 37.50 | % | | 37.50 | % | | — | | | (12 | ) | | — | | | — | | Wepec | | 22.41 | % | | 22.41 | % | | 22.41 | % | | — | | | (110 | ) | | 14 | | Other | | | | | — | | | — | | | 81 | | | (13 | ) | | (1 | ) | Total Downstream | | | | | | | | | | | 218 | | | (47 | ) | | 266 | | CEPSA (Chemicals share) | | 48.83 | % | | 48.83 | % | | 48.83 | % | | 10 | | | 10 | | | 24 | | Qatar Petrochemical Company Ltd | | 20.00 | % | | 20.00 | % | | 20.00 | % | | 74 | | | 66 | | | 55 | | Other | | | | | — | | | — | | | (5 | ) | | (1 | ) | | 1 | | Total Chemicals | | | | | | | | | | | 79 | | | 75 | | | 80 | | Sanofi-Aventis | | 7.39 | % | | 11.38 | % | | 13.06 | % | | 486 | | | 515 | | | 688 | | Other | | | | | — | | | — | | | | | | — | | | — | | Total Corporate | | | | | | | | | | | 486 | | | 515 | | | 688 | | Total investments | | | | | | | | | | | 1,642 | | | 1,721 | | | 1,775 | |
(a)(b) | | Investment accounted for by the equity method as from 2007.2010. |
(b) | | | | (c) | | End of the accounting for by the equity method of Sanofi-Aventis as of July 1st, 2010 (see Note 3 to the Consolidated Financial Statements). |
| | | | (d) | | Change in the consolidation method as of January 1st, 2010. |
F-39
| | | | | | | | | | | | | | | | | | | | | | | | | | | Equity in income (loss) (M€) | | As of December 31, | | | For the year ended December 31, | | | | | 2010 | | | 2009 | | | 2008 | | | 2010 | | | 2009 | | | 2008 | | | | | % owned | | | equity in income (loss) | | | NLNG | | | 15.00 | % | | | 15.00 | % | | | 15.00 | % | | | 207 | | | | 227 | | | | 554 | | | PetroCedeño — EM | | | 30.32 | % | | | 30.32 | % | | | 30.32 | % | | | 195 | | | | 166 | | | | 193 | | | CEPSA (Upstream share) | | | 48.83 | % | | | 48.83 | % | | | 48.83 | % | | | 57 | | | | 23 | | | | 50 | | | Angola LNG Ltd. | | | 13.60 | % | | | 13.60 | % | | | 13.60 | % | | | 8 | | | | 9 | | | | 10 | | | Qatargas | | | 10.00 | % | | | 10.00 | % | | | 10.00 | % | | | 136 | | | | 114 | | | | 126 | | | Société du Terminal Méthanier de Fos Cavaou | | | 28.03 | % | | | 28.79 | % | | | 30.30 | % | | | — | | | | — | | | | (5 | ) | | Dolphin Energy Ltd (Del) Abu Dhabi | | | 24.50 | % | | | 24.50 | % | | | 24.50 | % | | | 121 | | | | 94 | | | | 83 | | | Qatar Liquefied Gas Company Limited II (Train B) | | | 16.70 | % | | | 16.70 | % | | | 16.70 | % | | | 288 | | | | 8 | | | | (11 | ) | Shtokman Development AG(a) | | | 25.00 | % | | | 25.00 | % | | | 25.00 | % | | | (5 | ) | | | 4 | | | | — | | AMYRIS(b) | | | 22.03 | % | | | — | | | | — | | | | (3 | ) | | | | | | | | | | Other | | | — | | | | — | | | | — | | | | 177 | | | | 214 | | | | 178 | | Total associates | | | | | | | | | | | | | | | 1,181 | | | | 859 | | | | 1,178 | | | Other | | | — | | | | — | | | | — | | | | 6 | | | | — | | | | — | | Total jointly-controlled entities | | | | | | | | | | | | | | | 6 | | | | — | | | | — | | | | | | | | | | | | | | | | | | | | | | | | | | | | Total Upstream | | | | | | | | | | | | | | | 1,187 | | | | 859 | | | | 1,178 | | | CEPSA (Downstream share) | | | 48.83 | % | | | 48.83 | % | | | 48.83 | % | | | 172 | | | | 149 | | | | 76 | | Saudi Aramco Total Refining & Petrochemicals (Downstream share)(a) | | | 37.50 | % | | | 37.50 | % | | | 37.50 | % | | | (19 | ) | | | (12 | ) | | | — | | | Wepec | | | 22.41 | % | | | 22.41 | % | | | 22.41 | % | | | 29 | | | | — | | | | (110 | ) | | Other | | | — | | | | — | | | | — | | | | 47 | | | | 81 | | | | (13 | ) | Total associates | | | | | | | | | | | | | | | 229 | | | | 218 | | | | (47 | ) | SARA(d) | | | 50.00 | % | | | — | | | | — | | | | 31 | | | | — | | | | — | | TotalErg(b) | | | 49.00 | % | | | — | | | | — | | | | (11 | ) | | | — | | | | — | | | Other | | | — | | | | — | | | | — | | | | 2 | | | | — | | | | — | | Total jointly-controlled entities | | | | | | | | | | | | | | | 22 | | | | — | | | | — | | | | | | | | | | | | | | | | | | | | | | | | | | | | Total Downstream | | | | | | | | | | | | | | | 251 | | | | 218 | | | | (47 | ) | | CEPSA (Chemicals share) | | | 48.83 | % | | | 48.83 | % | | | 48.83 | % | | | 78 | | | | 10 | | | | 10 | | | Qatar Petrochemical Company Ltd. | | | 20.00 | % | | | 20.00 | % | | | 20.00 | % | | | 84 | | | | 74 | | | | 66 | | Saudi Aramco Total Refining & Petrochemicals (Chemicals share)(a) | | | 37.50 | % | | | 37.50 | % | | | 37.50 | % | | | (1 | ) | | | (1 | ) | | | — | | | Other | | | — | | | | — | | | | — | | | | 41 | | | | (4 | ) | | | (1 | ) | Total associates | | | | | | | | | | | | | | | 202 | | | | 79 | | | | 75 | | Samsung Total Petrochemicals(d) | | | 50.00 | % | | | — | | | | — | | | | 104 | | | | — | | | | — | | Total jointly-controlled entities | | | | | | | | | | | | | | | 104 | | | | — | | | | — | | | | | | | | | | | | | | | | | | | | | | | | | | | | Total Chemicals | | | | | | | | | | | | | | | 306 | | | | 79 | | | | 75 | | Sanofi-Aventis(c) | | | — | | | | 7.39 | % | | | 11.38 | % | | | 209 | | | | 486 | | | | 515 | | Total associates | | | | | | | | | | | | | | | 209 | | | | 486 | | | | 515 | | Total jointly-controlled entities | | | | | | | | | | | | | | | — | | | | — | | | | — | | | | | | | | | | | | | | | | | | | | | | | | | | | | Total Corporate | | | | | | | | | | | | | | | 209 | | | | 486 | | | | 515 | | | | | | | | | | | | | | | | | | | | | | | | | | | | Total investments | | | | | | | | | | | | | | | 1,953 | | | | 1,642 | | | | 1,721 | | | | | | | | | | | | | | | | | | | | | | | | | | | |
| | | | (a) | | Investment accounted for by the equity method as from 2008. | | (b) | | Investment accounted for by the equity method as from 2010. | | (c) | | End of the accounting for by the equity method of Sanofi-Aventis as of July 1st, 2010 (see Note 3 to the Consolidated Financial Statements). | | (d) | | Change in the consolidation method as of January 1st, 2010. |
The market value of the Group’s share in CEPSA amountedamounts to €2,845 €2,389 million as of December 31, 20092010 for an equity value of €2,708 €2,902 million. The marketrecoverable amount of CEPSA determined by reference to the value of discounted future cash flows being greater than the Group’s share in Sanofi-Aventis amounted to€5,324 million as of December 31, 2009.equity value, no impairment loss has been accounted for. F-40
In Group share, the main financial items of the equity affiliates are as follows : | | | | | | As of December 31, (€ million) | | 2009 | | 2008 | Assets | | 22,681 | | 23,173 | Shareholders’ equity | | 11,257 | | 12,663 | Liabilities | | 11,424 | | 10,510 |
| | | | | | | For the year ended December 31, (€ million) | | 2009 | | | 2008 | | Revenues from sales | | 14,434 | | | 19,982 | | Pre-tax income | | 2,168 | | | 2,412 | | Income tax | | (526 | ) | | (691 | ) | Net income | | 1,642 | | | 1,721 | |
13) OTHER INVESTMENTS
| | | | | | | | As of December 31, 2009(€ million) | | Carrying
amount | | Unrealized gain (loss) | | | Balance sheet value | Areva(a) | | 69 | | 58 | | | 127 | Arkema | | 15 | | 47 | | | 62 | Chicago Mercantile Exchange Group(b) | | 1 | | 9 | | | 10 | Olympia Energy Fund — energy investment fund(c) | | 35 | | (2 | ) | | 33 | Other publicly traded equity securities | | — | | — | | | — | Total publicly traded equity securities(d) | | 120 | | 112 | | | 232 | BBPP | | 72 | | — | | | 72 | BTC Limited | | 144 | | — | | | 144 | Other equity securities | | 714 | | — | | | 714 | Total other equity securities(d) | | 930 | | — | | | 930 | Other investments | | 1,050 | | 112 | | | 1,162 | | | | | | | | | As of December 31, 2008(€ million) | | Carrying
amount | | Unrealized gain
(loss) | | | Balance
sheet value | Areva(a) | | 69 | | 59 | | | 128 | Arkema | | 16 | | 15 | | | 31 | Chicago Mercantile Exchange Group(b) | | 1 | | 5 | | | 6 | Olympia Energy Fund — energy investment fund(c) | | 36 | | (5 | ) | | 31 | Other publicly traded equity securities | | — | | — | | | — | Total publicly traded equity securities(d) | | 122 | | 74 | | | 196 | BBPP | | 75 | | — | | | 75 | BTC Limited | | 161 | | — | | | 161 | Other equity securities | | 733 | | — | | | 733 | Total other equity securities(d) | | 969 | | — | | | 969 | Other investments | | 1,091 | | 74 | | | 1,165 |
| | | | | | | As of December 31, 2007(€ million) | | Carrying
amount | | Unrealized gain (loss) | | Balance sheet value | Areva(a) | | 69 | | 216 | | 285 | Arkema | | 16 | | 97 | | 113 | Nymex Holdings Inc | | 1 | | 15 | | 16 | Other publicly traded equity securities | | — | | — | | — | Total publicly traded equity securities(d) | | 86 | | 328 | | 414 | BBPP | | 71 | | — | | 71 | BTC Limited | | 161 | | — | | 161 | Other equity securities | | 645 | | — | | 645 | Total other equity securities(d) | | 877 | | — | | 877 | Other investments | | 963 | | 328 | | 1,291 |
| | | | | | | | | | | | | | | | | | | | | | | | | | | | | 2010 | | | 2009 | | | 2008 | | | | | | | | Jointly-
| | | | | | Jointly-
| | | | | | Jointly-
| | | | | | | | controlled
| | | | | | controlled
| | | | | | controlled
| | | As of December 31, (M€) | | Associates | | | entities | | | Associates | | | entities | | | Associates | | | entities | | | Assets | | | 19,192 | | | | 2,770 | | | | 22,681 | | | | — | | | | 23,173 | | | | — | | | Shareholders’ equity | | | 7,985 | | | | 1,148 | | | | 11,257 | | | | — | | | | 12,663 | | | | — | | | Liabilities | | | 11,207 | | | | 1,622 | | | | 11,424 | | | | — | | | | 10,510 | | | | — | | | | | | | | | | | | | | | | | | | | | | | | | | | |
| | | | | | | | | | | | | | | | | | | | | | | | | | | | | 2010 | | | 2009 | | | 2008 | | | | | | | | Jointly-
| | | | | | Jointly-
| | | | | | Jointly-
| | | | | | | | controlled
| | | | | | controlled
| | | | | | controlled
| | | For the year ended December 31, (M€) | | Associates | | | entities | | | Associates | | | entities | | | Associates | | | entities | | | Revenues from sales | | | 16,529 | | | | 2,575 | | | | 14,434 | | | | — | | | | 19,982 | | | | — | | | Pre-tax income | | | 2,389 | | | | 166 | | | | 2,168 | | | | — | | | | 2,412 | | | | — | | | Income tax | | | (568 | ) | | | (34 | ) | | | (526 | ) | | | — | | | | (691 | ) | | | — | | | | | | | | | | | | | | | | | | | | | | | | | | | | Net income | | | 1,821 | | | | 132 | | | | 1,642 | | | | | | | | 1,721 | | | | | | | | | | | | | | | | | | | | | | | | | | | | | | | |
The investments detailed below are classified as “Financial assets available for sale” (see Note 1 paragraph M(ii) to the Consolidated Financial Statements). | | | | | | | | | | | | | | | | | Carrying
| | | Unrealized gain
| | | Balance
| | | As of December 31, 2010 (M€) | | amount | | | (loss) | | | sheet value | | Sanofi-Aventis(a) | | | 3,510 | | | | (56 | ) | | | 3,454 | | Areva(b) | | | 69 | | | | 63 | | | | 132 | | | Arkema | | | — | | | | — | | | | — | | Chicago Mercantile Exchange Group(c) | | | 1 | | | | 9 | | | | 10 | | Olympia Energy Fund — energy investment fund(d) | | | 37 | | | | (3 | ) | | | 34 | | | Other publicly traded equity securities | | | 2 | | | | (1 | ) | | | 1 | | | | | | | | | | | | | | | | Total publicly traded equity securities(e) | | | 3,619 | | | | 12 | | | | 3,631 | | | | | | | | | | | | | | | | | BBPP | | | 60 | | | | — | | | | 60 | | | BTC Limited | | | 141 | | | | — | | | | 141 | | | Other equity securities | | | 758 | | | | — | | | | 758 | | | | | | | | | | | | | | | | Total other equity securities(e) | | | 959 | | | | — | | | | 959 | | | | | | | | | | | | | | | | Other investments | | | 4,578 | | | | 12 | | | | 4,590 | | | | | | | | | | | | | | | |
F-41
| | | | | | | | | | | | | | | | | Carrying
| | Unrealized gain,
| | Balance
| | As of December 31, 2009 (M€) | | amount | | (loss) | | sheet value | Areva(b) | | | 69 | | | | 58 | | | | 127 | | | Arkema | | | 15 | | | | 47 | | | | 62 | | Chicago Mercantile Exchange Group(c) | | | 1 | | | | 9 | | | | 10 | | Olympia Energy Fund — energy investment fund(d) | | | 35 | | | | (2 | ) | | | 33 | | | Other publicly traded equity securities | | | — | | | | — | | | | — | | | | | | | | | | | | | | | | Total publicly traded equity securities(e) | | | 120 | | | | 112 | | | | 232 | | | | | | | | | | | | | | | | | BBPP | | | 72 | | | | — | | | | 72 | | | BTC Limited | | | 144 | | | | — | | | | 144 | | | Other equity securities | | | 714 | | | | — | | | | 714 | | | | | | | | | | | | | | | | Total other equity securities(e) | | | 930 | | | | — | | | | 930 | | | | | | | | | | | | | | | | Other investments | | | 1,050 | | | | 112 | | | | 1,162 | | | | | | | | | | | | | | | | | | | | | | | | | | | | | | | | | | | Carrying
| | Unrealized gain
| | Balance
| | As of December 31, 2008 (M€) | | amount | | (loss) | | sheet value | | | Areva(b) | | | 69 | | | | 59 | | | | 128 | | | Arkema | | | 16 | | | | 15 | | | | 31 | | Chicago Mercantile Exchange Group(c) | | | 1 | | | | 5 | | | | 6 | | Olympia Energy Fund — energy investment fund(d) | | | 36 | | | | (5 | ) | | | 31 | | | Other publicly traded equity securities | | | — | | | | — | | | | — | | | | | | | | | | | | | | | | Total publicly traded equity securities(e) | | | 122 | | | | 74 | | | | 196 | | | | | | | | | | | | | | | | | BBPP | | | 75 | | | | — | | | | 75 | | | BTC Limited | | | 161 | | | | — | | | | 161 | | | Other equity securities | | | 733 | | | | — | | | | 733 | | | | | | | | | | | | | | | | Total other equity securities(e) | | | 969 | | | | — | | | | 969 | | | | | | | | | | | | | | | | Other investments | | | 1,091 | | | | 74 | | | | 1,165 | | | | | | | | | | | | | | | |
| | | | (a) | | End of the accounting for by the equity method of Sanofi-Aventis as of July 1st, 2010 (see Note 3 to the Consolidated Financial Statements). |
| | | | (b) | | Unrealized gain based on the investment certificate. |
(b)(c) | | The Nymex Holdings Inc. securities have been traded during the acquisition process running from June 11 to August 22, 2008 through which Chicago Mercantile Exchange Group acquired all the Nymex Holdings Inc. securities. |
(c)(d) | | Securities acquired in 2008. |
(d)(e) | | Including cumulative impairments of€599 €597 million in 2009,€6082010, €599 million in 20082009 and€632 €608 million in 2007.2008. |
These investments are classified as “Financial assets available for sale” (see Note 1 paragraph M(ii) to the Consolidated Financial Statements).F-42
14) OTHER NON-CURRENT ASSETS
| | | | | | | | As of December 31, 2009(€ million) | | Gross
value | | Valuation
allowance | | | Net
value | Deferred income tax assets | | 1,164 | | — | | | 1,164 | Loans and advances(a) | | 1,871 | | (587 | ) | | 1,284 | Other | | 633 | | — | | | 633 | Total | | 3,668 | | (587 | ) | | 3,081 |
| | | | | | | | As of December 31, 2008(€ million) | | Gross
value | | Valuation
allowance | | | Net
value | Deferred income tax assets | | 1,010 | | — | | | 1,010 | Loans and advances(a) | | 1,932 | | (529 | ) | | 1,403 | Other | | 631 | | — | | | 631 | Total | | 3,573 | | (529 | ) | | 3,044 |
| | | | | | | | As of December 31, 2007(€ million) | | Gross
value | | Valuation
allowance | | | Net
value | Deferred income tax assets | | 797 | | — | | | 797 | Loans and advances(a) | | 1,378 | | (527 | ) | | 851 | Other | | 507 | | — | | | 507 | Total | | 2,682 | | (527 | ) | | 2,155 |
(a) | | | 14) | OTHER NON-CURRENT ASSETS |
| | | | | | | | | | | | | | | | | Gross
| | | Valuation
| | | Net
| | | As of December 31, 2010 (M€) | | value | | | allowance | | | value | | | Deferred income tax assets | | | 1,378 | | | | — | | | | 1,378 | | Loans and advances(a) | | | 2,060 | | | | (464 | ) | | | 1,596 | | | Other | | | 681 | | | | — | | | | 681 | | | | | | | | | | | | | | | | Total | | | 4,119 | | | | (464 | ) | | | 3,655 | | | | | | | | | | | | | | | |
| | | | | | | | | | | | | | | | | Gross
| | | Valuation
| | | Net
| | | As of December 31, 2009 (M€) | | value | | | allowance | | | value | | | Deferred income tax assets | | | 1,164 | | | | — | | | | 1,164 | | Loans and advances(a) | | | 1,871 | | | | (587 | ) | | | 1,284 | | | Other | | | 633 | | | | — | | | | 633 | | | | | | | | | | | | | | | | Total | | | 3,668 | | | | (587 | ) | | | 3,081 | | | | | | | | | | | | | | | |
| | | | | | | | | | | | | | | | | Gross
| | | Valuation
| | | Net
| | | As of December 31, 2008 (M€) | | value | | | allowance | | | value | | | Deferred income tax assets | | | 1,010 | | | | — | | | | 1,010 | | Loans and advances(a) | | | 1,932 | | | | (529 | ) | | | 1,403 | | | Other | | | 631 | | | | — | | | | 631 | | | | | | | | | | | | | | | | Total | | | 3,573 | | | | (529 | ) | | | 3,044 | | | | | | | | | | | | | | | |
| | | | (a) | | Excluding loans to equity affiliates. |
Changes in the valuation allowance on loans and advances are detailed as follows: | | | | | | | | | | | | | | | | | | | | | | | | | | | | | | | | | | Currency
| | | | | | | | Valuation
| | | | | | | | | translation
| | | Valuation
| | | | | allowance as of
| | | | | | | | | adjustment and
| | | allowance as of
| | | For the Year Ended December 31, (M€) | | January 1, | | | Increases | | | Decreases | | | other variations | | | December 31, | | 2010 | | | (587 | ) | | | (33 | ) | | | 220 | | | | (64 | ) | | | (464 | ) | | 2009 | | | (529 | ) | | | (19 | ) | | | 29 | | | | (68 | ) | | | (587 | ) | | 2008 | | | (527 | ) | | | (33 | ) | | | 52 | | | | (21 | ) | | | (529 | ) |
| | | | | | | | | | | | | | | | | Gross
| | | Valuation
| | | Net
| | | As of December 31, 2010 (M€) | | value | | | allowance | | | value | | | Crude oil and natural gas | | | 4,990 | | | | — | | | | 4,990 | | | Refined products | | | 7,794 | | | | (28 | ) | | | 7,766 | | | Chemicals products | | | 1,350 | | | | (99 | ) | | | 1,251 | | | Other inventories | | | 1,911 | | | | (318 | ) | | | 1,593 | | | | | | | | | | | | | | | | Total | | | 16,045 | | | | (445 | ) | | | 15,600 | | | | | | | | | | | | | | | |
F-43
| | | | | | | | | | | | | | | For the year ended December 31, (€ million) | | Valuation
allowance as of
January 1, | | | Increases | | | Decreases | | Currency
translation
adjustment and
other variations | | | Valuation
allowance as of
December 31, | | 2009 | | (529 | ) | | (19 | ) | | 29 | | (68 | ) | | (587 | ) | 2008 | | (527 | ) | | (33 | ) | | 52 | | (21 | ) | | (529 | ) | 2007 | | (488 | ) | | (13 | ) | | 6 | | (32 | ) | | (527 | ) |
15) INVENTORIES
| | | | | | | | | As of December 31, 2009(€ million) | | Gross value | | Valuation
allowance | | | Net value | Crude oil and natural gas | | 4,581 | | — | | | 4,581 | Refined products | | 6,647 | | (18 | ) | | 6,629 | Chemicals products | | 1,234 | | (113 | ) | | 1,121 | Other inventories | | 1,822 | | (286 | ) | | 1,536 | Total | | 14,284 | | (417 | ) | | 13,867 |
| | | | | | | | | As of December 31, 2008(€ million) | | Gross value | | Valuation
allowance | | | Net value | Crude oil and natural gas | | 2,772 | | (326 | ) | | 2,446 | Refined products | | 4,954 | | (416 | ) | | 4,538 | Chemicals products | | 1,419 | | (105 | ) | | 1,314 | Other inventories | | 1,591 | | (268 | ) | | 1,323 | Total | | 10,736 | | (1,115 | ) | | 9,621 |
| | | | | | | | | As of December 31, 2007(€ million) | | Gross value | | Valuation
allowance | | | Net value | Crude oil and natural gas | | 4,746 | | — | | | 4,746 | Refined products | | 6,874 | | (11 | ) | | 6,863 | Chemicals products | | 1,188 | | (91 | ) | | 1,097 | Other inventories | | 1,368 | | (223 | ) | | 1,145 | Total | | 14,176 | | (325 | ) | | 13,851 |
| | | | | | | | | | | | | | | | | Gross
| | | Valuation
| | | Net
| | | As of December 31, 2009 (M€) | | value | | | allowance | | | value | | | Crude oil and natural gas | | | 4,581 | | | | — | | | | 4,581 | | | Refined products | | | 6,647 | | | | (18 | ) | | | 6,629 | | | Chemicals products | | | 1,234 | | | | (113 | ) | | | 1,121 | | | Other inventories | | | 1,822 | | | | (286 | ) | | | 1,536 | | | | | | | | | | | | | | | | Total | | | 14,284 | | | | (417 | ) | | | 13,867 | | | | | | | | | | | | | | | |
| | | | | | | | | | | | | | | | | Gross
| | | Valuation
| | | Net
| | | As of December 31, 2008 (M€) | | value | | | allowance | | | value | | | Crude oil and natural gas | | | 2,772 | | | | (326 | ) | | | 2,446 | | | Refined products | | | 4,954 | | | | (416 | ) | | | 4,538 | | | Chemicals products | | | 1,419 | | | | (105 | ) | | | 1,314 | | | Other inventories | | | 1,591 | | | | (268 | ) | | | 1,323 | | | | | | | | | | | | | | | | Total | | | 10,736 | | | | (1,115 | ) | | | 9,621 | | | | | | | | | | | | | | | |
Changes in the valuation allowance on inventories are as follows: | | | | | | | | | | | | | | | | | | | | | | | | | | | Currency
| | | | | | | | | | | | | | translation
| | | Valuation
| | | | | Valuation
| | | | | | adjustment
| | | allowance
| | | | | allowance as of
| | | Increase
| | | and other
| | | as of
| | | For the year ended December 31, (M€) | | January 1, | | | (net) | | | variations | | | December 31, | | 2010 | | | (417 | ) | | | (39 | ) | | | 11 | | | | (445 | ) | | 2009 | | | (1,115 | ) | | | 700 | | | | (2 | ) | | | (417 | ) | | 2008 | | | (325 | ) | | | (740 | ) | | | (50 | ) | | | (1,115 | ) |
| | | 16) | ACCOUNTS RECEIVABLE AND OTHER CURRENT ASSETS |
| | | | | | | | | | | | | | | | | Gross
| | | Valuation
| | | Net
| | | As of December 31, 2010 (M€) | | value | | | allowance | | | value | | Accounts receivable | | | 18,635 | | | | (476 | ) | | | 18,159 | | | | | | | | | | | | | | | | | Recoverable taxes | | | 2,227 | | | | — | | | | 2,227 | | | Other operating receivables | | | 4,543 | | | | (136 | ) | | | 4,407 | | | Deferred income tax | | | 151 | | | | — | | | | 151 | | | Prepaid expenses | | | 657 | | | | — | | | | 657 | | | Other current assets | | | 41 | | | | — | | | | 41 | | | | | | | | | | | | | | | | Other current assets | | | 7,619 | | | | (136 | ) | | | 7,483 | | | | | | | | | | | | | | | |
| | | | | | | | | | | | | | | | | Gross
| | | Valuation
| | | Net
| | | As of December 31, 2009 (M€) | | value | | | allowance | | | value | | Accounts receivable | | | 16,187 | | | | (468 | ) | | | 15,719 | | | | | | | | | | | | | | | | | Recoverable taxes | | | 2,156 | | | | — | | | | 2,156 | | | Other operating receivables | | | 5,214 | | | | (69 | ) | | | 5,145 | | | Deferred income tax | | | 214 | | | | — | | | | 214 | | | Prepaid expenses | | | 638 | | | | — | | | | 638 | | | Other current assets | | | 45 | | | | — | | | | 45 | | | | | | | | | | | | | | | | Other current assets | | | 8,267 | | | | (69 | ) | | | 8,198 | | | | | | | | | | | | | | | |
F-44 | | | | | | | | | | | | | For the year ended December 31,(€ million) | | Valuation
allowance as of
January 1, | | | Increase
(net) | | | Currency
translation
adjustment
and other
variations | | | Valuation
allowance
as of
December 31, | | 2009 | | (1,115 | ) | | 700 | | | (2 | ) | | (417 | ) | 2008 | | (325 | ) | | (740 | ) | | (50 | ) | | (1,115 | ) | 2007 | | (440 | ) | | 124 | | | (9 | ) | | (325 | ) |
16) ACCOUNTS RECEIVABLE AND OTHER CURRENT ASSETS
| | | | | | | | | As of December 31, 2009(€ million) | | Gross value | | Valuation
allowance | | | Net value | Accounts receivable | | 16,187 | | (468 | ) | | 15,719 | Recoverable taxes | | 2,156 | | — | | | 2,156 | Other operating receivables | | 5,214 | | (69 | ) | | 5,145 | Deferred income tax | | 214 | | — | | | 214 | Prepaid expenses | | 638 | | — | | | 638 | Other current assets | | 45 | | — | | | 45 | Other current assets | | 8,267 | | (69 | ) | | 8,198 |
| | | | | | | | | As of December 31, 2008(€ million) | | Gross value | | Valuation
allowance | | | Net value | Accounts receivable | | 15,747 | | (460 | ) | | 15,287 | Recoverable taxes | | 2,510 | | — | | | 2,510 | Other operating receivables | | 6,227 | | (19 | ) | | 6,208 | Deferred income tax | | 206 | | — | | | 206 | Prepaid expenses | | 650 | | — | | | 650 | Other current assets | | 68 | | — | | | 68 | Other current assets | | 9,661 | | (19 | ) | | 9,642 |
| | | | | | | | | As of December 31, 2007(€ million) | | Gross value | | Valuation
allowance | | | Net value | Accounts receivable | | 19,611 | | (482 | ) | | 19,129 | Recoverable taxes | | 2,735 | | — | | | 2,735 | Other operating receivables | | 4,457 | | (27 | ) | | 4,430 | Deferred income tax | | 112 | | — | | | 112 | Prepaid expenses | | 687 | | — | | | 687 | Other current assets | | 42 | | — | | | 42 | Other current assets | | 8,033 | | (27 | ) | | 8,006 |
| | | | | | | | | | | | | | | | | Gross
| | | Valuation
| | | Net
| | | As of December 31, 2008 (M€) | | value | | | allowance | | | value | | Accounts receivable | | | 15,747 | | | | (460 | ) | | | 15,287 | | | | | | | | | | | | | | | | | Recoverable taxes | | | 2,510 | | | | — | | | | 2,510 | | | Other operating receivables | | | 6,227 | | | | (19 | ) | | | 6,208 | | | Deferred income tax | | | 206 | | | | — | | | | 206 | | | Prepaid expenses | | | 650 | | | | — | | | | 650 | | | Other current assets | | | 68 | | | | — | | | | 68 | | | | | | | | | | | | | | | | Other current assets | | | 9,661 | | | | (19 | ) | | | 9,642 | | | | | | | | | | | | | | | |
Changes in the valuation allowance on “Accounts receivable” and “Other current assets” are as follows: | | | | | | | | | | | | | | (€ million) | | Valuation allowance as of January 1, | | | Increase (net) | | | Currency translation adjustments and other variations | | | Valuation allowance as of December 31, | | Accounts receivable | | | | | | | | | | | | | 2009 | | (460 | ) | | (17 | ) | | 9 | | | (468 | ) | 2008 | | (482 | ) | | 9 | | | 13 | | | (460 | ) | 2007 | | (489 | ) | | (25 | ) | | 32 | | | (482 | ) | | | | | | Other current assets | | | | | | | | | | | | | 2009 | | (19 | ) | | (14 | ) | | (36 | ) | | (69 | ) | 2008 | | (27 | ) | | 7 | | | 1 | | | (19 | ) | 2007 | | (39 | ) | | (4 | ) | | 16 | | | (27 | ) |
| | | | | | | | | | | | | | | | | | | | | Valuation
| | | | | | Currency translation
| | | Valuation
| | | | | allowance as of
| | | | | | adjustments and
| | | allowance as of
| | | (M€) | | January 1, | | | Increase (net) | | | other variations | | | December 31, | | Accounts receivable | | | | | | | | | | | | | | | | | | | | | | | | | | | | | | | | | | | 2010 | | | (468 | ) | | | (31 | ) | | | 23 | | | | (476 | ) | | 2009 | | | (460 | ) | | | (17 | ) | | | 9 | | | | (468 | ) | | 2008 | | | (482 | ) | | | 9 | | | | 13 | | | | (460 | ) | Other current assets | | | | | | | | | | | | | | | | | | | | | | | | | | | | | | | | | | | 2010 | | | (69 | ) | | | (66 | ) | | | (1 | ) | | | (136 | ) | | 2009 | | | (19 | ) | | | (14 | ) | | | (36 | ) | | | (69 | ) | | 2008 | | | (27 | ) | | | 7 | | | | 1 | | | | (19 | ) |
As of December 31, 2010, the net portion of the overdue receivables included in “Accounts receivable” and “Other current assets” is €3,141 million, of which €1,885 million has expired for less than 90 days, €292 million has expired between 90 days and 6 months, €299 million has expired between 6 and 12 months and €665 million has expired for more than 12 months. As of December 31, 2009, the net portion of the overdue receivables included in “Accounts receivable” and “Other current assets” is €3,610 €3,610 million, of which €2,116 €2,116 million has expired for less than 90 days, €486 €486 million has expired between 90 days and 6 months, €246 €246 million has expired between 6 and 12 months and €762 €762 million has expired for more than 12 months. As of December 31, 2008, the net portion of the overdue receivables included in “Accounts receivable” and “Other current assets” was €3,744 €3,744 million, of which €2,420 €2,420 million had expired for less than 90 days, €729 €729 million had expired between 90 days and 6 months, €54 €54 million had expired between 6 and 12 months and €541 €541 million had expired for more than 12 months. 17) SHAREHOLDERS’ EQUITY
Number of Total Sharesshares The Company’s common shares, par value €2.50, €2.50, as of December 31, 20092010 are the only category of shares. Shares may be held in either bearer or registered form. Double voting rights are granted to holders of shares that are fully-paid and held in the name of the same shareholder for at least two years, with due consideration for the total portion of the share capital represented. Double voting rights are also assigned to restricted shares in the event of an increase in share capital by incorporation of reserves, profits or premiums based on shares already held that are entitled to double voting rights. Pursuant to the Company’s bylaws (Statuts)(Statuts), no shareholder may cast a vote at a shareholders’ meeting, either by himself or through an agent, representing more than 10% of the total voting rights for the Company’s shares. This limit applies to the aggregated amount of voting rights held directly, indirectly or through voting proxies. However, in the case of double voting rights, this limit may be extended to 20%. These restrictions no longer apply if any individual or entity, acting alone or in concert, acquires at least two-thirds of the total share capital of the Company, directly or indirectly, following a public tender offer for all of the Company’s shares. F-45
The authorized share capital amounts to 3,439,391,697 shares as of December 31, 2010 compared to 3,381,921,458 shares as of December 31, 2009 compared toand 3,413,204,025 as of December 31, 2008 and 4,042,585,605 as2008. Variation of December 31, 2007.the share capital | | | | | | As of January 1, 2007
| | | | 2,425,767,953 | | | As of January 1, 2008 | | | | | 2,395,532,097 | | | | | | | | | | Shares issued in connection with: | | Capital increase reserved for employees | | | 4,870,386 | | | | Exercise of TOTAL share subscription options | | 2,453,832 | 1,178,167 | | | | Exchange guarantee offered to the beneficiaries of
Elf Aquitaine share subscription options | | 315,312 | 227,424 | | Cancellation of shares(a)
| | | | (33,005,000 | ) | As of January 1, 2008
| | | | 2,395,532,097 | (30,000,000 | ) | | | | | | | | As of January 1, 2009 | | | | | 2,371,808,074 | | | | | | | | | | Shares issued in connection with: | | Capital increase reserved for employees | | 4,870,386 | | | | Exercise of TOTAL share subscription options | | 1,178,167 | 934,780 | | | | Exchange guarantee offered to the beneficiaries of
Elf Aquitaine share subscription options | | 227,424 | 480,030 | | Cancellation of shares(b)
| | | | (30,000,000 | ) | As of January 1, 2009
| | | | 2,371,808,074 | (24,800,000 | ) | | | | | | | | As of January 1, 2010 | | | | | 2,348,422,884 | | | | | | | | | | Shares issued in connection with: | | Exercise of TOTAL share subscription options | | 934,780 | 1,218,047 | | | | Exchange guarantee offered to the beneficiaries of Elf Aquitaine share subscription options | | 480,030 | | Cancellation of shares(c)
| | | | (24,800,000 | ) | As of December 31, 2009(d)
| | | | 2,348,422,884 | | | As of December 31, 2010(c) | | | | | 2,349,640,931 | | | | | | | | |
(a) | Decided by the Board of Directors on January 10, 2007. | |
(b)(a) | | Decided by the Board of Directors on July 31, 2008. |
(c)(b) | | Decided by the Board of Directors on July 30, 2009. |
(d)(c) | | Including 115,407,190112,487,679 treasury shares deducted from consolidated shareholders’ equity. |
The variation of both weighted-average number of shares and weighted-average number of diluted shares respectively used in the calculation of earnings per share and fully-diluted earnings per share is detailed as follows: | | | | | | | | | | | | | | | | | 2010 | | | 2009 | | | 2008 | | Number of shares as of January 1, | | | 2,348,422,884 | | | | 2,371,808,074 | | | | 2,395,532,097 | | | | | | | | | | | | | | | | Number of shares issued during the year (pro rated) | | | | | | | | | | | | | | Exercise of TOTAL share subscription options | | | 412,114 | | | | 221,393 | | | | 742,588 | | | Exercise of TOTAL share purchase options | | | 984,800 | | | | 93,827 | | | | 2,426,827 | | | Exchange guarantee offered to the beneficiaries of Elf Aquitaine share subscription options | | | — | | | | 393,623 | | | | 86,162 | | | TOTAL restricted shares | | | 416,420 | | | | 1,164,389 | | | | 1,112,393 | | Global free TOTAL share plan(a) | | | 15 | | | | — | | | | — | | | Capital increase reserved for employees | | | — | | | | — | | | | 3,246,924 | | | TOTAL shares held by TOTAL S.A. or by its subsidiaries and deducted from shareholders’ equity | | | (115,407,190 | ) | | | (143,082,095 | ) | | | (168,290,440 | ) | | | | | | | | | | | | | | | Weighted-average number of shares | | | 2,234,829,043 | | | | 2,230,599,211 | | | | 2,234,856,551 | | | | | | | | | | | | | | | | Dilutive effect | | | | | | | | | | | | | | TOTAL share subscription and purchase options | | | 1,758,006 | | | | 1,711,961 | | | | 6,784,200 | | | TOTAL restricted shares | | | 6,031,963 | | | | 4,920,599 | | | | 4,172,944 | | Global free TOTAL share plan(a) | | | 1,504,071 | | | | — | | | | — | | | Exchange guarantee offered to the beneficiaries of Elf Aquitaine share subscription options | | | — | | | | 60,428 | | | | 460,935 | | | Capital increase reserved for employees | | | 371,493 | | | | — | | | | 383,912 | | | | | | | | | | | | | | | | Weighted-average number of diluted shares | | | 2,244,494,576 | | | | 2,237,292,199 | | | | 2,246,658,542 | | | | | | | | | | | | | | | |
| | | | (a) | | The Board of Directors approved on May 21, 2010 the implementation and conditions of a global free share plan intended for the Group employees. |
F-46
| | | | | | | | | | | | | 2009 | | | 2008 | | | 2007 | | | Number of shares as of January 1, | | 2,371,808,074 | | | 2,395,532,097 | | | 2,425,767,953 | | Number of shares issued during the year (pro rated) | | | | | | | | | | Exercise of TOTAL share subscription options | | 221,393 | | | 742,588 | | | 1,020,190 | | Exercise of TOTAL share purchase options | | 93,827 | | | 2,426,827 | | | 4,141,186 | | Exchange guarantee offered to the beneficiaries of Elf Aquitaine share subscription options | | 393,623 | | | 86,162 | | | 163,074 | | TOTAL restricted shares | | 1,164,389 | | | 1,112,393 | | | 1,114,796 | | Capital increase reserved for employees | | — | | | 3,246,924 | | | — | | TOTAL shares held by TOTAL S.A. or by its subsidiaries and deducted from shareholders’ equity | | (143,082,095 | ) | | (168,290,440 | ) | | (176,912,968 | ) | Weighted-average number of shares | | 2,230,599,211 | | | 2,234,856,551 | | | 2,255,294,231 | | Dilutive effect | | | | | | | | | | TOTAL share subscription and purchase options | | 1,711,961 | | | 6,784,200 | | | 13,698,928 | | TOTAL restricted shares | | 4,920,599 | | | 4,172,944 | | | 4,387,761 | | Exchange guarantee offered to the beneficiaries of Elf Aquitaine share subscription options | | 60,428 | | | 460,935 | | | 655,955 | | Capital increase reserved for employees | | — | | | 383,912 | | | 348,109 | | Weighted-average number of diluted shares | | 2,237,292,199 | | | 2,246,658,542 | | | 2,274,384,984 | |
Capital increase reserved for Group employeesAt
Pursuant to the authorization granted by the shareholders’ meeting held on May 11, 2007, the Board of Directors, during its November 6, 2007 meeting, implemented a first capital increase reserved for employees within the limit of 12 million shares, at a price of €44.40 per share, with dividend rights as of January 1, 2007. The subscription period ran from March 10, 2008 to March 28, 2008. 4,870,386 shares were subscribed by employees pursuant to the capital increase. At the shareholders’ meeting held on May 21, 2010, the shareholders delegated to the Board of Directors the authority to increase the share capital of the Company in one or more transactions and within a maximum period of 26 months from the date of the meeting, by an amount not exceeding 1.5% of the share capital outstanding on the date of the meeting of the Board of Directors at which a decision to proceed with an issuance is made reserving subscriptions for such issuance to the Group employees participating in a company savings plan. It is being specified that the amount of any such capital increase reserved for Group employees is counted against the aggregate maximum nominal amount of share capital increases authorized by the shareholders’ meeting held on May 21, 2010 for issuing new ordinary shares or other securities granting immediate or future access to the Company’s share capital with preferential subscription rights (€2.5 billion in nominal value). Pursuant to this delegation of authorization, the Board of Directors, during its October 28, 2010 meeting, decided to proceed with a capital increase reserved for employees in 2011 within the limit of 12 million shares with dividend rights as of January 1, 2010 and delegated to the Chairman and CEO all powers to determine the opening and closing of the subscription period and the subscription price. Share cancellation Pursuant to the authorization granted by the shareholders’ meeting held on May 11, 2007 authorizing reduction of capital by cancellation of shares held by the Company within the limit of 10% of the outstanding capital every 24 months, the Board of Directors decided on July 30, 2009 to cancel 24,800,000 shares acquired in 2008 at an average price of €49.28 per share. Treasury shares (TOTAL shares held by TOTAL S.A.) As of December 31, 2010, TOTAL S.A. held 12,156,411 of its own shares, representing 0.52% of its share capital, detailed as follows: | | | • | 6,012,460 shares allocated to TOTAL restricted shares plans for Group employees; | | • | 6,143,951 shares intended to be allocated to new TOTAL share purchase option plans or to new restricted shares plans. |
These shares are deducted from the consolidated shareholders’ equity. As of December 31, 2009, TOTAL S.A. held 15,075,922 of its own shares, representing 0.64% of its share capital, detailed as follows: | | | • | 6,017,499 shares allocated to covering TOTAL share purchase option plans for Group employees and executive officers; | | • | 5,799,400 shares allocated to TOTAL restricted shares plans for Group employees; and | | • | 3,259,023 shares intended to be allocated to new TOTAL share purchase option plans or to new restricted shares plans. |
These shares were deducted from the consolidated shareholders’ equity. As of December 31, 2008, TOTAL S.A. held 42,750,827 of its own shares, representing 1.80% of its share capital, detailed as follows: | | | • | 12,627,522 shares allocated to covering TOTAL share purchase option plans for Group employees; | | • | 5,323,305 shares allocated to TOTAL restricted shares plans for Group employees; and | | • | 24,800,000 shares purchased for cancellation between January and October 2008 pursuant to the authorization granted by the shareholders’ meetings held on May 11, 2007 and May 16, 2008. The Board of Directors on July 30, 2009 decided to cancel these 24,800,000 shares acquired at an average price of €49.28 per share. |
These shares were deducted from the consolidated shareholders’ equity. TOTAL shares held by Group subsidiaries As of December 31, 2010, 2009 and 2008, TOTAL S.A. held indirectly through its subsidiaries 100,331,268 of its own shares, representing 4.27% of its share capital as of December 31, 2010, 4.27% of its share capital as of F-47
December 31, 2009 and 4.23% of its share capital as of December 31, 2008 detailed as follows: | | | • | 2,023,672 shares held by a consolidated subsidiary, Total Nucléaire, 100% indirectly controlled by TOTAL S.A.; and | | • | 98,307,596 shares held by subsidiaries of Elf Aquitaine (Financière Valorgest, Sogapar and Fingestval). |
These shares are deducted from the consolidated shareholders’ equity. Dividend TOTAL S.A. paid on June 1, 2010 the balance of the dividend of €1.14 per share for the 2009 fiscal year (the ex-dividend date was May 27, 2010). In addition, TOTAL S.A. paid on November 17, 2010 an interim dividend of €1.14 per share for the fiscal year 2010 (the ex-dividend date was November 12, 2010). A resolution will be submitted at the shareholders’ meeting on May 13, 2011 to pay a dividend of €2.28 per share for the 2010 fiscal year, i.e. a balance of €1.14 per share to be distributed after deducting the interim dividend of €1.14 already paid. Paid-in surplus In accordance with French law, the paid-in surplus corresponds to share premiums of the parent company which can be capitalized or used to offset losses if the legal reserve has reached its minimum required level. The amount of the paid-in surplus may also be distributed subject to taxation unless the unrestricted reserves of the parent company are distributed prior to this item. As of December 31, 2010, paid-in surplus amounted to €27,208 million (€27,171 million as of December 31, 2009 and €28,284 million as of December 31, 2008). Reserves Under French law, 5% of net income must be transferred to the legal reserve until the legal reserve reaches 10% of the nominal value of the share capital. This reserve cannot be distributed to the shareholders other than upon liquidation but can be used to offset losses. If wholly distributed, the unrestricted reserves of the parent company would be taxed for an approximate amount of €514 million as of December 31, 2010 (€514 million as of December 31, 2009). Other comprehensive income Detail of other comprehensive income showing items reclassified from equity to net income is presented in the table below: | | | | | | | | | | | | | | | | | | | | | | | | | | | For the year ended December 31, (M€) | | 2010 | | | 2009 | | | 2008 | | Currency translation adjustment | | | | | | | 2,231 | | | | | | | | (244 | ) | | | | | | | (722 | ) | | – Unrealized gain/(loss) of the period | | | 2,234 | | | | | | | | (243 | ) | | | | | | | (722 | ) | | | | | | – Less gain/(loss) included in net income | | | 3 | | | | | | | | 1 | | | | | | | | — | | | | | | | | | | | | | | | | | | | | | | | | | | | | | | | | | | | | | | | | | | | | | | | | | | | | | | | | | | Available for sale financial assets | | | | | | | (100 | ) | | | | | | | 38 | | | | | | | | (254 | ) | | – Unrealized gain/(loss) of the period | | | (50 | ) | | | | | | | 38 | | | | | | | | (254 | ) | | | | | | – Less gain/(loss) included in net income | | | 50 | | | | | | | | — | | | | | | | | — | | | | | | Cash flow hedge | | | | | | | (80 | ) | | | | | | | 128 | | | | | | | | — | | | – Unrealized gain/(loss) of the period | | | (195 | ) | | | | | | | 349 | | | | | | | | — | | | | | | | – Less gain/(loss) included in net income | | | (115 | ) | | | | | | | 221 | | | | | | | | — | | | | | | | | | | | | | | | | | | | | | | | | | | | | | | | | | | | | | | | | | | | | | | | | | | | | | | | | | | Share of other comprehensive income of equity affiliates, net amount | | | | | | | 302 | | | | | | | | 234 | | | | | | | | 173 | | | | | | | | | | | | | | | | | | | | | | | | | | | | | | | | | | | | | | | | | | | | | | | | | | | | | | Other | | | | | | | (7 | ) | | | | | | | (5 | ) | | | | | | | 1 | | | – Unrealized gain/(loss) of the period | | | (7 | ) | | | | | | | (5 | ) | | | | | | | 1 | | | | | | | – Less gain/(loss) included in net income | | | — | | | | | | | | — | | | | | | | | — | | | | | | Tax effect | | | | | | | 28 | | | | | | | | (38 | ) | | | | | | | 30 | | | | | | | | | | | | | | | | | | | | | | | | | | | | Total other comprehensive income, net amount | | | | | | | 2,374 | | | | | | | | 113 | | | | | | | | (772 | ) | | | | | | | | | | | | | | | | | | | | | | | | | | |
F-48
Tax effects relating to each component of other comprehensive income are as follows: | | | | | | | | | | | | | | | | | | | | | | | | | | | | | | | | | | | | | | | | | 2010 | | | 2009 | | | 2008 | | | | | Pre-tax
| | | Tax
| | | Net
| | | Pre-tax
| | | Tax
| | | Net
| | | Pre-tax
| | | Tax
| | | Net
| | | For the year ended December 31, (M€) | | amount | | | effect | | | amount | | | amount | | | effect | | | amount | | | amount | | | effect | | | amount | | | Currency translation adjustment | | | 2,231 | | | | — | | | | 2,231 | | | | (244 | ) | | | — | | | | (244 | ) | | | (722 | ) | | | — | | | | (722 | ) | | Available for sale financial assets | | | (100 | ) | | | 2 | | | | (98 | ) | | | 38 | | | | 4 | | | | 42 | | | | (254 | ) | | | 30 | | | | (224 | ) | | Cash flow hedge | | | (80 | ) | | | 26 | | | | (54 | ) | | | 128 | | | | (42 | ) | | | 86 | | | | — | | | | — | | | | — | | | Share of other comprehensive income of equity affiliates, net amount | | | 302 | | | | — | | | | 302 | | | | 234 | | | | — | | | | 234 | | | | 173 | | | | — | | | | 173 | | | Other | | | (7 | ) | | | — | | | | (7 | ) | | | (5 | ) | | | — | | | | (5 | ) | | | 1 | | | | — | | | | 1 | | | | | | | | | | | | | | | | | | | | | | | | | | | | | | | | | | | | | | | | Total other comprehensive income | | | 2,346 | | | | 28 | | | | 2,374 | | | | 151 | | | | (38 | ) | | | 113 | | | | (802 | ) | | | 30 | | | | (772 | ) | | | | | | | | | | | | | | | | | | | | | | | | | | | | | | | | | | | | | | |
| | | 18) | EMPLOYEE BENEFITS OBLIGATIONS |
Liabilities for employee benefits obligations consist of the following: | | | | | | | | | | | | | | | As of December 31, (M€) | | 2010 | | | 2009 | | | 2008 | | | Pension benefits liabilities | | | 1,268 | | | | 1,236 | | | | 1,187 | | | Other benefits liabilities | | | 605 | | | | 592 | | | | 608 | | | Restructuring reserves (early retirement plans) | | | 298 | | | | 212 | | | | 216 | | | | | | | | | | | | | | | | Total | | | 2,171 | | | | 2,040 | | | | 2,011 | | | | | | | | | | | | | | | |
The Group’s main defined benefit pension plans are located in France, in the United Kingdom, in the United States, in Belgium and in Germany. Their main characteristics are the following: | | | • | The benefits are usually based on the final salary and seniority; | | • | They are usually funded (pension fund or insurer); and | | • | They are closed to new employees who benefit from defined contribution pension plans. |
The pension benefits include also termination indemnities and early retirement benefits. The other benefits are the employer contribution to post-employment medical care.
F-49
The fair value of the defined benefit obligation and plan assets in the Consolidated Financial Statements is detailed as follows: | | | | | | | | | | | | | | | | | | | | | | | | | | | | | Pension benefits | | | Other benefits | | | As of December 31, (M€) | | 2010 | | | 2009 | | | 2008 | | | 2010 | | | 2009 | | | 2008 | | Change in benefit obligation | | | | | | | | | | | | | | | | | | | | | | | | | | Benefit obligation at beginning of year | | | 8,169 | | | | 7,405 | | | | 8,129 | | | | 547 | | | | 544 | | | | 583 | | | Service cost | | | 159 | | | | 134 | | | | 143 | | | | 11 | | | | 10 | | | | 14 | | | Interest cost | | | 441 | | | | 428 | | | | 416 | | | | 29 | | | | 30 | | | | 24 | | | Curtailments | | | (4 | ) | | | (5 | ) | | | (3 | ) | | | (3 | ) | | | (1 | ) | | | — | | | Settlements | | | (60 | ) | | | (3 | ) | | | (5 | ) | | | — | | | | — | | | | (4 | ) | | Special termination benefits | | | — | | | | — | | | | — | | | | 1 | | | | — | | | | — | | | Plan participants’ contributions | | | 11 | | | | 10 | | | | 12 | | | | — | | | | — | | | | — | | | Benefits paid | | | (471 | ) | | | (484 | ) | | | (463 | ) | | | (33 | ) | | | (33 | ) | | | (37 | ) | | Plan amendments | | | 28 | | | | 118 | | | | 12 | | | | 1 | | | | (2 | ) | | | (12 | ) | | Actuarial losses (gains) | | | 330 | | | | 446 | | | | (248 | ) | | | 57 | | | | — | | | | (27 | ) | | Foreign currency translation and other | | | 137 | | | | 120 | | | | (588 | ) | | | 13 | | | | (1 | ) | | | 3 | | | | | | | | | | | | | | | | | | | | | | | | | | | | Benefit obligation at year-end | | | 8,740 | | | | 8,169 | | | | 7,405 | | | | 623 | | | | 547 | | | | 544 | | Change in fair value of plan assets | | | | | | | | | | | | | | | | | | | | | | | | | | Fair value of plan assets at beginning of year | | | (6,286 | ) | | | (5,764 | ) | | | (6,604 | ) | | | — | | | | — | | | | — | | | Expected return on plan assets | | | (396 | ) | | | (343 | ) | | | (402 | ) | | | — | | | | — | | | | — | | | Actuarial losses (gains) | | | (163 | ) | | | (317 | ) | | | 1,099 | | | | — | | | | — | | | | — | | | Settlements | | | 56 | | | | 2 | | | | 2 | | | | — | | | | — | | | | — | | | Plan participants’ contributions | | | (11 | ) | | | (10 | ) | | | (12 | ) | | | — | | | | — | | | | — | | Employer contributions(a) | | | (269 | ) | | | (126 | ) | | | (855 | ) | | | — | | | | — | | | | — | | | Benefits paid | | | 394 | | | | 396 | | | | 375 | | | | — | | | | — | | | | — | | | Foreign currency translation and other | | | (134 | ) | | | (124 | ) | | | 633 | | | | — | | | | — | | | | — | | | | | | | | | | | | | | | | | | | | | | | | | | | | Fair value of plan assets at year-end | | | (6,809 | ) | | | (6,286 | ) | | | (5,764 | ) | | | — | | | | — | | | | — | | | | | | | | | | | | | | | | | | | | | | | | | | | | Unfunded status | | | 1,931 | | | | 1,883 | | | | 1,641 | | | | 623 | | | | 547 | | | | 544 | | | | | | | | | | | | | | | | | | | | | | | | | | | | | Unrecognized prior service cost | | | (105 | ) | | | (153 | ) | | | (48 | ) | | | 10 | | | | 15 | | | | 21 | | | Unrecognized actuarial (losses) gains | | | (1,170 | ) | | | (1,045 | ) | | | (953 | ) | | | (28 | ) | | | 30 | | | | 43 | | | Asset ceiling | | | 9 | | | | 9 | | | | 5 | | | | — | | | | — | | | | — | | | | | | | | | | | | | | | | | | | | | | | | | | | | Net recognized amount | | | 665 | | | | 694 | | | | 645 | | | | 605 | | | | 592 | | | | 608 | | | | | | | | | | | | | | | | | | | | | | | | | | | | | Pension benefits and other benefits liabilities | | | 1,268 | | | | 1,236 | | | | 1,187 | | | | 605 | | | | 592 | | | | 608 | | | Other non-current assets | | | (603 | ) | | | (542 | ) | | | (542 | ) | | | — | | | | — | | | | — | | | | | | | | | | | | | | | | | | | | | | | | | | | |
| | | | (a) | | In 2010, the Group covered certain employee pension benefit plans through insurance companies for an amount of €90 million (€757 million in 2008). |
As of December 31, 2010, the fair value of pension benefits and other pension benefits which are entirely or partially funded amounted to €7,727 million and the present value of the unfunded benefits amounted to €1,636 million (against €7,206 million and €1,510 million respectively as of December 31, 2009 and €6,515 million and €1,434 million respectively as of December 31, 2008). The experience actuarial (gains) losses related to the defined benefit obligation and the fair value of plan assets are as follows: | | | | | | | | | | | | | | | | | | | For the year ended December 31, (M€) | | 2010 | | | 2009 | | | 2008 | | | 2007 | | | Experience actuarial (gains) losses related to the defined benefit obligation | | | (54 | ) | | | (108 | ) | | | 12 | | | | 80 | | | Experience actuarial (gains) losses related to the fair value of plan assets | | | (163 | ) | | | (317 | ) | | | 1,099 | | | | 140 | | | | | | | | | | | | | | | | | | | |
F-50
| | | | | | | | | | | | | | | | | | | | | | | As of December 31, (M€) | | 2010 | | | 2009 | | | 2008 | | | 2007 | | | 2006 | | Pension benefits | | | | | | | | | | | | | | | | | | | | | | Benefit obligation | | | 8,740 | | | | 8,169 | | | | 7,405 | | | | 8,129 | | | | 8,742 | | | Fair value of plan assets | | | (6,809 | ) | | | (6,286 | ) | | | (5,764 | ) | | | (6,604 | ) | | | (6,401 | ) | | | | | | | | | | | | | | | | | | | | | | | Unfunded status | | | 1,931 | | | | 1,883 | | | | 1,641 | | | | 1,525 | | | | 2,341 | | | | | | | | | | | | | | | | | | | | | | | | Other benefits | | | | | | | | | | | | | | | | | | | | | | Benefits obligation | | | 623 | | | | 547 | | | | 544 | | | | 583 | | | | 648 | | | Fair value of plan assets | | | — | | | | — | | | | — | | | | — | | | | — | | | | | | | | | | | | | | | | | | | | | | | | Unfunded status | | | 623 | | | | 547 | | | | 544 | | | | 583 | | | | 648 | | | | | | | | | | | | | | | | | | | | | | | |
The Group expects to contribute €251 million to its pension plans in 2011. | | | | | | | | | | | Estimated future payments (M€) | | Pension benefits | | | Other benefits | | | 2011 | | | 487 | | | | 38 | | | 2012 | | | 478 | | | | 38 | | | 2013 | | | 477 | | | | 38 | | | 2014 | | | 477 | | | | 39 | | | 2015 | | | 497 | | | | 40 | | | 2016-2020 | | | 2,628 | | | | 203 | | | | | | | | | | | |
| | | | | | | | | | | | | | Asset allocation
| | Pension benefits | |
As of December 31, | | 2010 | | | 2009 | | | 2008 | | | Equity securities | | | 34 | % | | | 31 | % | | | 25 | % | | Debt securities | | | 60 | % | | | 62 | % | | | 56 | % | | Monetary | | | 3 | % | | | 3 | % | | | 16 | % | | Real estate | | | 3 | % | | | 4 | % | | | 3 | % | | | | | | | | | | | | | | |
The Group’s assumptions of expected returns on assets are built up by asset class and by country based on long-term bond yields and risk premiums. The discount rate retained corresponds to the rate of prime corporate bonds according to a benchmark per country of different market data on the closing date. | | | | | | | | | | | | | | | | | | | | | | | | | | Assumptions used to determine benefits obligations
| | Pension benefits | | | Other benefits | |
As of December 31, | | 2010 | | | 2009 | | | 2008 | | | 2010 | | | 2009 | | | 2008 | | | | | | | | | Discount rate (weighted average for all regions) | | | 5.01 | % | | | 5.41 | % | | | 5.93 | % | | | 5.00 | % | | | 5.60 | % | | | 6.00 | % | Of which Euro zone | | | 4.58 | % | | | 5.12 | % | | | 5.72 | % | | | 4.55 | % | | | 5.18 | % | | | 5.74 | % | Of which United States | | | 5.49 | % | | | 6.00 | % | | | 6.23 | % | | | 5.42 | % | | | 5.99 | % | | | 6.21 | % | Of which United Kingdom | | | 5.50 | % | | | 5.50 | % | | | 6.00 | % | | | — | | | | — | | | | 6.00 | % | | Average expected rate of salary increase | | | 4.55 | % | | | 4.50 | % | | | 4.56 | % | | | — | | | | — | | | | — | | | Expected rate of healthcare inflation | | | | | | | | | | | | | | | | | | | | | | | | | | — Initial rate | | | — | | | | — | | | | — | | | | 4.82 | % | | | 4.91 | % | | | 4.88 | % | | — Ultimate rate | | | — | | | | — | | | | — | | | | 3.75 | % | | | 3.79 | % | | | 3.64 | % | | | | | | | | | | | | | | | | | | | | | | | | | | |
F-51
| | | | | | | | | | | | | | | | | | | | | | | | | | Assumptions used to determine the net periodic benefit cost (income)
| | Pension benefits | | | Other benefits | | | For the year ended December 31, | | 2010 | | | 2009 | | | 2008 | | | 2010 | | | 2009 | | | 2008 | | | Discount rate (weighted average for all regions) | | | 5.41 | % | | | 5.93 | % | | | 5.50 | % | | | 5.60 | % | | | 6.00 | % | | | 5.50 | % | Of which Euro zone | | | 5.12 | % | | | 5.72 | % | | | 5.15 | % | | | 5.18 | % | | | 5.74 | % | | | 5.14 | % | Of which United States | | | 6.00 | % | | | 6.23 | % | | | 6.00 | % | | | 5.99 | % | | | 6.21 | % | | | 5.98 | % | Of which United Kingdom | | | 5.50 | % | | | 6.00 | % | | | 5.75 | % | | | — | | | | 6.00 | % | | | 5.75 | % | | Average expected rate of salary increase | | | 4.50 | % | | | 4.56 | % | | | 4.29 | % | | | — | | | | — | | | | — | | | Expected return on plan assets | | | 6.39 | % | | | 6.14 | % | | | 6.60 | % | | | — | | | | — | | | | — | | | Expected rate of healthcare inflation | | | | | | | | | | | | | | | | | | | | | | | | | | — Initial rate | | | — | | | | — | | | | — | | | | 4.91 | % | | | 4.88 | % | | | 5.16 | % | | — Ultimate rate | | | — | | | | — | | | | — | | | | 3.79 | % | | | 3.64 | % | | | 3.64 | % | | | | | | | | | | | | | | | | | | | | | | | | | | |
A 0.5% increase or decrease in discount rates – all other things being equal – would have the following approximate impact: | | | | | | | | | | | | | 0.5%
| | | 0.5%
| | | (M€) | | increase | | | decrease | | | Benefit obligation as of December 31, 2010 | | | (520 | ) | | | 574 | | | 2011 net periodic benefit cost (income) | | | (19 | ) | | | 52 | | | | | | | | | | | |
A 0.5% increase or decrease in expected return on plan assets rate – all other things being equal – would have an impact of €30 million on 2011 net periodic benefit cost (income). The components of the net periodic benefit cost (income) in 2010, 2009 and 2008 are: | | | | | | | | | | | | | | | | | | | | | | | | | | | | | Pension benefits | | | | | | | | | | | | | | | Other benefits | | | For the year ended December 31, (M€) | | 2010 | | | 2009 | | | 2008 | | | 2010 | | | 2009 | | | 2008 | | | Service cost | | | 159 | | | | 134 | | | | 143 | | | | 11 | | | | 10 | | | | 14 | | | Interest cost | | | 441 | | | | 428 | | | | 416 | | | | 29 | | | | 30 | | | | 24 | | | Expected return on plan assets | | | (396 | ) | | | (343 | ) | | | (402 | ) | | | — | | | | — | | | | — | | | Amortization of prior service cost | | | 74 | | | | 13 | | | | 34 | | | | (5 | ) | | | (7 | ) | | | (10 | ) | | Amortization of actuarial losses (gains) | | | 66 | | | | 50 | | | | 22 | | | | (4 | ) | | | (6 | ) | | | (2 | ) | | Asset ceiling | | | (3 | ) | | | 4 | | | | 1 | | | | — | | | | — | | | | — | | | Curtailments | | | (3 | ) | | | (4 | ) | | | (3 | ) | | | (3 | ) | | | (1 | ) | | | — | | | Settlements | | | 7 | | | | (1 | ) | | | (2 | ) | | | — | | | | — | | | | (3 | ) | | Special termination benefits | | | — | | | | — | | | | — | | | | 1 | | | | — | | | | — | | | | | | | | | | | | | | | | | | | | | | | | | | | | Net periodic benefit cost (income) | | | 345 | | | | 281 | | | | 209 | | | | 29 | | | | 26 | | | | 23 | | | | | | | | | | | | | | | | | | | | | | | | | | | |
A positive or negative change of one-percentage-point in the healthcare inflation rate would have the following approximate impact: | | | | | | | | | | | | | 1% point
| | | 1% point
| | | (M€) | | increase | | | decrease | | | Benefit obligation as of December 31, 2010 | | | 63 | | | | (52 | ) | | 2010 net periodic benefit cost (income) | | | 5 | | | | (4 | ) | | | | | | | | | | |
F-52
| | | 19) | PROVISIONS AND OTHER NON-CURRENT LIABILITIES |
| | | | | | | | | | | | | | | As of December 31, (M€) | | 2010 | | | 2009 | | | 2008 | | | Litigations and accrued penalty claims | | | 485 | | | | 423 | | | | 546 | | | Provisions for environmental contingencies | | | 644 | | | | 623 | | | | 558 | | | Asset retirement obligations | | | 5,917 | | | | 5,469 | | | | 4,500 | | | Other non-current provisions | | | 1,116 | | | | 1,331 | | | | 1,804 | | | Other non-current liabilities | | | 936 | | | | 1,535 | | | | 450 | | | | | | | | | | | | | | | | Total | | | 9,098 | | | | 9,381 | | | | 7,858 | | | | | | | | | | | | | | | |
In 2010, litigation reserves mainly include a provision covering risks concerning antitrust investigations related to Arkema amounting to €17 million as of December 31, 2010. Other risks and commitments that give rise to contingent liabilities are described in Note 32 to the Consolidated Financial Statements. In 2010, other non-current provisions mainly include: | | | • | The contingency reserve related to the Toulouse-AZF plant explosion (civil liability) for €31 million as of December 31, 2010; | | • | Provisions related to restructuring activities in the Downstream and Chemicals segments for €261 million as of December 31, 2010; and | | • | The contingency reserve related to the Buncefield depot explosion (civil liability) for €194 million as of December 31, 2010. |
In 2010, other non-current liabilities mainly include debts (whose maturity is more than one year) related to fixed assets acquisitions. In 2009, litigation reserves mainly include a provision covering risks concerning antitrust investigations related to Arkema amounting to €43 million as of December 31, 2009. Other risks and commitments that give rise to contingent liabilities are described in Note 32 to the Consolidated Financial Statements. In 2009, other non-current provisions mainly include: | | | • | The contingency reserve related to the Toulouse-AZF plant explosion (civil liability) for €40 million as of December 31, 2009; | | • | Provisions related to restructuring activities in the Downstream and Chemicals segments for €130 million as of December 31, 2009; and | | • | The contingency reserve related to the Buncefield depot explosion (civil liability) for €295 million as of December 31, 2009. |
In 2009, other non-current liabilities mainly include debts (whose maturity is more than one year) related to fixed assets acquisitions. This heading is mainly composed of a €818 million debt related to Chesapeake acquisition (see Note 3 to the Consolidated Financial Statements). In 2008, litigation reserves mainly included a provision covering risks concerning antitrust investigations related to Arkema amounting to €85 million as of December 31, 2008. Other risks and commitments that give rise to contingent liabilities are described in Note 32 to the Consolidated Financial Statements. In 2008, other non-current provisions mainly included the contingency reserve related to the Toulouse-AZF plant explosion (civil liability) for €256 million as of December 31, 2008. Changes in provisions and other non-current liabilities Changes in provisions and other non-current liabilities are as follows : | | | | | | | | | | | | | | | | | | | | | | | | | | | | | | | | | | | | | | Currency
| | | | | | | | | | | | | | | | | | | | translation
| | | | | | As of
| | | (M€) | | As of January 1, | | | Allowances | | | Reversals | | | adjustment | | | Other | | | December 31, | | 2010 | | | 9,381 | | | | 1,052 | | | | (971 | ) | | | 497 | | | | (861 | ) | | | 9,098 | | | 2009 | | | 7,858 | | | | 1,254 | | | | (1,413 | ) | | | 202 | | | | 1,480 | | | | 9,381 | | | 2008 | | | 6,843 | | | | 1,424 | | | | (864 | ) | | | (460 | ) | | | 915 | | | | 7,858 | | | | | | | | | | | | | | | | | | | | | | | | | | | |
F-53
Allowances In 2010, allowances of the period (€1,052 million) mainly include: | | | • | Asset retirement obligations for €338 million (accretion); | | • | Environmental contingencies for €88 million in the Downstream and Chemicals segments; | | • | The contingency reserve related to the Buncefield depot explosion (civil liability) for €79 million; and | | • | Provisions related to restructuring of activities for €226 million. |
In 2009, allowances of the period (€1,254 million) mainly included: | | | • | Asset retirement obligations for €283 million (accretion); | | • | Environmental contingencies for €147 million in the Downstream and Chemicals segments; | | • | The contingency reserve related to the Buncefield depot explosion (civil liability) for €223 million; and | | • | Provisions related to restructuring of activities for €121 million. |
In 2008, allowances of the period (€1,424 million) mainly included: | | | • | Asset retirement obligations for €229 million (accretion); | | • | The contingency reserve related to the Toulouse-AZF plant explosion (civil liability) for €140 million; | | • | Environmental contingencies for €89 million; | | • | An allowance of €48 million for litigation reserves in connection with antitrust investigations, as described in Note 32 to the Consolidated Financial Statements “Other risks and contingent liabilities”; and | | • | Provisions related to restructuring of activities for €27 million. |
Reversals In 2010, reversals of the period (€971 million) mainly relate to the following incurred expenses: | | | • | Provisions for asset retirement obligations for €214 million; | | • | €26 million for litigation reserves in connection with antitrust investigations; | | • | Environmental contingencies written back for €66 million; | | • | The contingency reserve related to the Toulouse-AZF plant explosion (civil liability), written back for €9 million; | | • | The contingency reserve related to the Buncefield depot explosion (civil liability), written back for €190 million; and | | • | Provisions for restructuring and social plans written back for €60 million. |
In 2009, reversals of the period (€1,413 million) were mainly related to the following incurred expenses: | | | • | Provisions for asset retirement obligations for €191 million; | | • | €52 million for litigation reserves in connection with antitrust investigations; | | • | Environmental contingencies written back for €86 million; | | • | The contingency reserve related to the Toulouse-AZF plant explosion (civil liability), written back for €216 million; | | • | The contingency reserve related to the Buncefield depot explosion (civil liability), written back for €375 million; and | | • | Provisions for restructuring and social plans written back for €28 million. |
In 2008, reversals of the period (€864 million) were mainly related to the following incurred expenses: | | | • | Provisions for asset retirement obligations for €280 million; | | • | €163 million for litigation reserves in connection with antitrust investigations; | | • | Environmental contingencies written back for €96 million; | | • | The contingency reserve related to the Toulouse-AZF plant explosion (civil liability), written back for €18 million; and | | • | Provisions for restructuring and social plans written back for €10 million. |
CHANGES IN THE ASSET RETIREMENT OBLIGATION Changes in the asset retirement obligation are as follows: | | | | | | | | | | | | | | | | | | | | | | | | | | | | | | | | | | | | | | | | | | | Revision
| | | | | | Spending on
| | | Currency
| | | | | | | | | | | As of
| | | | | | in
| | | New
| | | existing
| | | translation
| | | | | | As of
| | | (M€) | | January 1, | | | Accretion | | | estimates | | | obligations | | | obligations | | | adjustment | | | Other | | | December 31, | | 2010 | | | 5,469 | | | | 338 | | | | 79 | | | | 175 | | | | (214 | ) | | | 316 | | | | (246 | ) | | | 5,917 | | | 2009 | | | 4,500 | | | | 283 | | | | 447 | | | | 179 | | | | (191 | ) | | | 232 | | | | 19 | | | | 5,469 | | | 2008 | | | 4,206 | | | | 229 | | | | 563 | | | | 188 | | | | (280 | ) | | | (414 | ) | | | 8 | | | | 4,500 | | | | | | | | | | | | | | | | | | | | | | | | | | | | | | | | | | | |
F-54
| | | 20) | FINANCIAL DEBT AND RELATED FINANCIAL INSTRUMENTS |
| | | A) | NON-CURRENT FINANCIAL DEBT AND RELATED FINANCIAL INSTRUMENTS |
| | | | | | | | | | | | | | As of December 31, 2010 (M€)
| | | | | | | | | |
(Assets)/Liabilities | | Secured | | | Unsecured | | | Total | | | Non-current financial debt | | | 287 | | | | 20,496 | | | | 20,783 | | of which hedging instruments of non-current financial debt (liabilities) | | | — | | | | 178 | | | | 178 | | Hedging instruments of non-current financial debt (assets)(a) | | | — | | | | (1,870 | ) | | | (1,870 | ) | | | | | | | | | | | | | | | Non-current financial debt – net of hedging instruments | | | 287 | | | | 18,626 | | | | 18,913 | | | | | | | | | | | | | | | | | Bonds after fair value hedge | | | — | | | | 15,491 | | | | 15,491 | | | Fixed rate bonds and bonds after cash flow hedge | | | — | | | | 2,836 | | | | 2,836 | | | Bank and other, floating rate | | | 47 | | | | 189 | | | | 236 | | | Bank and other, fixed rate | | | 65 | | | | 110 | | | | 175 | | | Financial lease obligations | | | 175 | | | | — | | | | 175 | | | | | | | | | | | | | | | | Non-current financial debt – net of hedging instruments | | | 287 | | | | 18,626 | | | | 18,913 | | | | | | | | | | | | | | | |
| | | | (a) | | See the description of these hedging instruments in Notes 1 paragraph M (iii) “Long-term financing”, 28 and 29 to the Consolidated Financial Statements. |
| | | | | | | | | | | | | | As of December 31, 2009 (M€)
| | | | | | | | | |
(Assets)/Liabilities | | Secured | | | Unsecured | | | Total | | | Non-current financial debt | | | 312 | | | | 19,125 | | | | 19,437 | | of which hedging instruments of non-current financial debt (liabilities) | | | — | | | | 241 | | | | 241 | | Hedging instruments of non-current financial debt (assets)(a) | | | — | | | | (1,025 | ) | | | (1,025 | ) | | | | | | | | | | | | | | | Non-current financial debt – net of hedging instruments | | | 312 | | | | 18,100 | | | | 18,412 | | | | | | | | | | | | | | | | | Bonds after fair value hedge | | | — | | | | 15,884 | | | | 15,884 | | | Fixed rate bonds and bonds after cash flow hedge | | | — | | | | 1,700 | | | | 1,700 | | | Bank and other, floating rate | | | 60 | | | | 379 | | | | 439 | | | Bank and other, fixed rate | | | 50 | | | | 79 | | | | 129 | | | Financial lease obligations | | | 202 | | | | 58 | | | | 260 | | | | | | | | | | | | | | | | Non-current financial debt – net of hedging instruments | | | 312 | | | | 18,100 | | | | 18,412 | | | | | | | | | | | | | | | |
| | | | (a) | | See the description of these hedging instruments in Notes 1 paragraph M(iii) “Long-term financing”, 28 and 29 to the Consolidated Financial Statements. |
| | | | | | | | | | | | | | As of December 31, 2008 (M€)
| | | | | | | | | |
(Assets)/Liabilities | | Secured | | | Unsecured | | | Total | | | Non-current financial debt | | | 895 | | | | 15,296 | | | | 16,191 | | of which hedging instruments of non-current financial debt (liabilities) | | | — | | | | 440 | | | | 440 | | Hedging instruments of non-current financial debt (assets)(a) | | | — | | | | (892 | ) | | | (892 | ) | | | | | | | | | | | | | | | Non-current financial debt – net of hedging instruments | | | 895 | | | | 14,404 | | | | 15,299 | | | | | | | | | | | | | | | | | Bonds after fair value hedge | | | — | | | | 13,380 | | | | 13,380 | | | Fixed rate bonds and bonds after cash flow hedge | | | — | | | | 287 | | | | 287 | | | Bank and other, floating rate | | | 553 | | | | 665 | | | | 1,218 | | | Bank and other, fixed rate | | | 140 | | | | 6 | | | | 146 | | | Financial lease obligations | | | 202 | | | | 66 | | | | 268 | | | | | | | | | | | | | | | | Non-current financial debt – net of hedging instruments | | | 895 | | | | 14,404 | | | | 15,299 | | | | | | | | | | | | | | | |
| | | | (a) | | See the description of these hedging instruments in Notes 1 paragraph M(iii) “Long-term financing”, 28 and 29 to the Consolidated Financial Statements. |
F-55
Fair value of bonds, as of December 31, 2010, after taking into account currency and interest rates swaps, is detailed as follows: | | | | | | | | | | | | | | | | | | | | | | | | | | | | | | | | | Fair value after hedging as of | | | | | | | | | | | | | | Year of
| | December 31,
| | | December 31,
| | | December 31,
| | | | | | | | | Initial rate before hedging
| | | Bonds after fair value hedge (M€) | | issue | | 2010 | | | 2009 | | | 2008 | | | Currency | | | Maturity | | | instruments | | | | | | | | | | | | | | | | | | | | | | | | | | | | | | Parent company | | | | | | | | | | | | | | | | | | | | | | | | | | | | | | | | | | | | | | | | | | | | | | | | | | | | | | | Bond | | 1997 | | | — — | | | | — | | | | 124 | | | | FRF | | | | 2009 | | | | 6.200 | % | | | | | | | | | | | | | | | | | | | | | | | | | | | | | | Bond | | 1998 | | | — | | | | — | | | | 119 | | | | FRF | | | | 2009 | | | | 5.125 | % | | | | | | | | | | | | | | | | | | | | | | | | | | | | | | Bond | | 1998 | | | 125 | | | | 116 | | | | 121 | | | | FRF | | | | 2013 | | | | 5.000 | % | | | | | | | | | | | | | | | | | | | | | | | | | | | | | | Bond | | 2000 | | | — | | | | 61 | | | | 63 | | | | EUR | | | | 2010 | | | | 5.650 | % | | | | | | | | | | | | | | | | | | | | | | | | | | | | | | Current portion (less than one year) | | | | | — | | | | (61 | ) | | | (243 | ) | | | | | | | | | | | | | | | | | | | | | | | | | | | | | | | | | | | | | | | | | | | | | | | | | | | | | | | | | | | | | | | | | | | | | Total parent company | | | | | 125 | | | | 116 | | | | 184 | | | | | | | | | | | | | | | | | | | | | | | | | | | | | | | | | | | | | | | | | | | | | | | | | | | | | | | | | | | | | | | | | | | | | | Elf Aquitaine SA | | | | | | | | | | | | | | | | | | | | | | | | | | | | | | | | | | | | | | | | | | | | | | | | | | | | | | | | Bond | | 1999 | | | — | | | | — | | | | 1 003 | | | | EUR | | | | 2009 | | | | 4.500 | % | | | | | | | | | | | | | | | | | | | | | | | | | | | | | | Current portion (less than one year) | | | | | — | | | | — | | | | (1 003 | ) | | | | | | | | | | | | | | | | | | | | | | | | | | | | | | | | | | | | | | | | | | | | | | | | | | | | | | | | | | | | | | | | | | | | | Total Elf Aquitaine SA | | | | | — | | | | — | | | | — | | | | | | | | | | | | | | | | | | | | | | | | | | | | | | | | | | | | | | | | | | | | | | | | | | | | | | | | | | | | | | | | | | | | | | TOTAL CAPITAL(a) | | | | | | | | | | | | | | | | | | | | | | | | | | | | | | | | | | | | | | | | | | | | | | | | | | | | | | | | Bond | | 2002 | | | 15 | | | | 14 | | | | 14 | | | | USD | | | | 2012 | | | | 5.890 | % | | | | | | | | | | | | | | | | | | | | | | | | | | | | | | Bond | | 2003 | | | — | | | | — | | | | 52 | | | | AUD | | | | 2009 | | | | 6.250 | % | | | | | | | | | | | | | | | | | | | | | | | | | | | | | | Bond | | 2003 | | | — | | | | — | | | | 154 | | | | CHF | | | | 2009 | | | | 2.385 | % | | | | | | | | | | | | | | | | | | | | | | | | | | | | | | Bond | | 2003 | | | — | | | | 160 | | | | 166 | | | | CHF | | | | 2010 | | | | 2.385 | % | | | | | | | | | | | | | | | | | | | | | | | | | | | | | | Bond | | 2003 | | | 22 | | | | 21 | | | | 22 | | | | USD | | | | 2013 | | | | 4.500 | % | | | | | | | | | | | | | | | | | | | | | | | | | | | | | | Bond | | 2003-2004 | | | — | | | | — | | | | 395 | | | | USD | | | | 2009 | | | | 3.500 | % | | | | | | | | | | | | | | | | | | | | | | | | | | | | | | Bond | | 2004 | | | — | | | | — | | | | 57 | | | | AUD | | | | 2009 | | | | 6.000 | % | | | | | | | | | | | | | | | | | | | | | | | | | | | | | | Bond | | 2004 | | | — | | | | — | | | | 28 | | | | AUD | | | | 2009 | | | | 6.000 | % | | | | | | | | | | | | | | | | | | | | | | | | | | | | | | Bond | | 2004 | | | — | | | | 53 | | | | 55 | | | | CAD | | | | 2010 | | | | 4.000 | % | | | | | | | | | | | | | | | | | | | | | | | | | | | | | | Bond | | 2004 | | | — | | | | 113 | | | | 117 | | | | CHF | | | | 2010 | | | | 2.385 | % | | | | | | | | | | | | | | | | | | | | | | | | | | | | | | Bond | | 2004 | | | — | | | | 438 | | | | 454 | | | | EUR | | | | 2010 | | | | 3.750 | % | | | | | | | | | | | | | | | | | | | | | | | | | | | | | | Bond | | 2004 | | | — | | | | 322 | | | | 334 | | | | GBP | | | | 2010 | | | | 4.875 | % | | | | | | | | | | | | | | | | | | | | | | | | | | | | | | Bond | | 2004 | | | — | | | | 128 | | | | 132 | | | | GBP | | | | 2010 | | | | 4.875 | % | | | | | | | | | | | | | | | | | | | | | | | | | | | | | | Bond | | 2004 | | | — | | | | 185 | | | | 191 | | | | GBP | | | | 2010 | | | | 4.875 | % | | | | | | | | | | | | | | | | | | | | | | | | | | | | | | Bond | | 2004 | | | 57 | | | | 53 | | | | 55 | | | | AUD | | | | 2011 | | | | 5.750 | % | | | | | | | | | | | | | | | | | | | | | | | | | | | | | | Bond | | 2004 | | | 116 | | | | 107 | | | | 111 | | | | CAD | | | | 2011 | | | | 4.875 | % | | | | | | | | | | | | | | | | | | | | | | | | | | | | | | Bond | | 2004 | | | 235 | | | | 203 | | | | 216 | | | | USD | | | | 2011 | | | | 4.125 | % | | | | | | | | | | | | | | | | | | | | | | | | | | | | | | Bond | | 2004 | | | 75 | | | | 69 | | | | 72 | | | | USD | | | | 2011 | | | | 4.125 | % | | | | | | | | | | | | | | | | | | | | | | | | | | | | | | Bond | | 2004 | | | 125 | | | | 116 | | | | 120 | | | | CHF | | | | 2012 | | | | 2.375 | % | | | | | | | | | | | | | | | | | | | | | | | | | | | | | | Bond | | 2004 | | | 51 | | | | 47 | | | | 49 | | | | NZD | | | | 2014 | | | | 6.750 | % | | | | | | | | | | | | | | | | | | | | | | | | | | | | | | Bond | | 2005 | | | — | | | | — | | | | 36 | | | | USD | | | | 2009 | | | | 3.500 | % | | | | | | | | | | | | | | | | | | | | | | | | | | | | | | Bond | | 2005 | | | 57 | | | | 53 | | | | 55 | | | | AUD | | | | 2011 | | | | 5.750 | % | | | | | | | | | | | | | | | | | | | | | | | | | | | | | | Bond | | 2005 | | | 60 | | | | 56 | | | | 58 | | | | CAD | | | | 2011 | | | | 4.000 | % | | | | | | | | | | | | | | | | | | | | | | | | | | | | | | Bond | | 2005 | | | 120 | | | | 112 | | | | 116 | | | | CHF | | | | 2011 | | | | 1.625 | % | | | | | | | | | | | | | | | | | | | | | | | | | | | | | | Bond | | 2005 | | | 226 | | | | 226 | | | | 226 | | | | CHF | | | | 2011 | | | | 1.625 | % | | | | | | | | | | | | | | | | | | | | | | | | | | | | | | Bond | | 2005 | | | 139 | | | | 144 | | | | 144 | | | | USD | | | | 2011 | | | | 4.125 | % | | | | | | | | | | | | | | | | | | | | | | | | | | | | | | Bond | | 2005 | | | 63 | | | | 63 | | | | 63 | | | | AUD | | | | 2012 | | | | 5.750 | % | | | | | | | | | | | | | | | | | | | | | | | | | | | | | | Bond | | 2005 | | | 194 | | | | 180 | | | | 187 | | | | CHF | | | | 2012 | | | | 2.135 | % | | | | | | | | | | | | | | | | | | | | | | | | | | | | | | Bond | | 2005 | | | 65 | | | | 65 | | | | 65 | | | | CHF | | | | 2012 | | | | 2.135 | % | | | | | | | | | | | | | | | | | | | | | | | | | | | | | | Bond | | 2005 | | | 97 | | | | 97 | | | | 98 | | | | CHF | | | | 2012 | | | | 2.375 | % | | | | | | | | | | | | | | | | | | | | | | | | | | | | | | Bond | | 2005 | | | 391 | | | | 363 | | | | 376 | | | | EUR | | | | 2012 | | | | 3.250 | % | | | | | | | | | | | | | | | | | | | | | | | | | | | | | | Bond | | 2005 | | | 57 | | | | 57 | | | | 57 | | | | NZD | | | | 2012 | | | | 6.500 | % | | | | | | | | | | | | | | | | | | | | | | | | | | | | | | Bond | | 2006 | | | — | | | | 75 | | | | 75 | | | | GBP | | | | 2010 | | | | 4.875 | % | | | | | | | | | | | | | | | | | | | | | | | | | | | | | | Bond | | 2006 | | | — | | | | 50 | | | | 50 | | | | EUR | | | | 2010 | | | | 3.750 | % | | | | | | | | | | | | | | | | | | | | | | | | | | | | | | Bond | | 2006 | | | — | | | | 50 | | | | 50 | | | | EUR | | | | 2010 | | | | 3.750 | % | | | | | | | | | | | | | | | | | | | | | | | | | | | | | | Bond | | 2006 | | | — | | | | 100 | | | | 102 | | | | EUR | | | | 2010 | | | | 3.750 | % | | | | | | | | | | | | | | | | | | | | | | | | | | | | | | Bond | | 2006 | | | 42 | | | | 42 | | | | 42 | | | | EUR | | | | 2011 | | | | EURIBOR 3 months +0.040 | % | | | | | | | | | | | | | | | | | | | | | | | | | | | | | | Bond | | 2006 | | | 300 | | | | 300 | | | | 300 | | | | EUR | | | | 2011 | | | | 3.875 | % | | | | | | | | | | | | | | | | | | | | | | | | | | | | | | Bond | | 2006 | | | 150 | | | | 150 | | | | 150 | | | | EUR | | | | 2011 | | | | 3.875 | % | | | | | | | | | | | | | | | | | | | | | | | | | | | | | | Bond | | 2006 | | | 300 | | | | 300 | | | | 300 | | | | EUR | | | | 2011 | | | | 3.875 | % | | | | | | | | | | | | | | | | | | | | | | | | | | | | | | Bond | | 2006 | | | 120 | | | | 120 | | | | 120 | | | | USD | | | | 2011 | | | | 5.000 | % | | | | | | | | | | | | | | | | | | | | | | | | | | | | | | Bond | | 2006 | | | 300 | | | | 300 | | | | 300 | | | | EUR | | | | 2011 | | | | 3.875 | % | | | | | | | | | | | | | | | | | | | | | | | | | | | | | | Bond | | 2006 | | | 472 | | | | 472 | | | | 473 | | | | USD | | | | 2011 | | | | 5.000 | % |
F-56
| | | | | | | | | | | | | | | | | | | | | | | | | | | | | | | | | Fair value after hedging as of | | | | | | | | | | | | | | Year of
| | December 31,
| | | December 31,
| | | December 31,
| | | | | | | | | Initial rate before hedging
| | | Bonds after fair value hedge (M€) | | issue | | 2010 | | | 2009 | | | 2008 | | | Currency | | | Maturity | | | instruments | | | | | | | | | | | | | | | | | | | | | | | | | | | | | | | Bond | | 2006 | | | 62 | | | | 62 | | | | 62 | | | | AUD | | | | 2012 | | | | 5.625 | % | | | | | | | | | | | | | | | | | | | | | | | | | | | | | | Bond | | 2006 | | | 72 | | | | 72 | | | | 72 | | | | CAD | | | | 2012 | | | | 4.125 | % | | | | | | | | | | | | | | | | | | | | | | | | | | | | | | Bond | | 2006 | | | 100 | | | | 100 | | | | 100 | | | | EUR | | | | 2012 | | | | 3.250 | % | | | | | | | | | | | | | | | | | | | | | | | | | | | | | | Bond | | 2006 | | | 74 | | | | 74 | | | | 74 | | | | GBP | | | | 2012 | | | | 4.625 | % | | | | | | | | | | | | | | | | | | | | | | | | | | | | | | Bond | | 2006 | | | 100 | | | | 100 | | | | 100 | | | | EUR | | | | 2012 | | | | 3.250 | % | | | | | | | | | | | | | | | | | | | | | | | | | | | | | | Bond | | 2006 | | | 125 | | | | 125 | | | | 125 | | | | CHF | | | | 2013 | | | | 2.510 | % | | | | | | | | | | | | | | | | | | | | | | | | | | | | | | Bond | | 2006 | | | 127 | | | | 127 | | | | 127 | | | | CHF | | | | 2014 | | | | 2.635 | % | | | | | | | | | | | | | | | | | | | | | | | | | | | | | | Bond | | 2006 | | | 130 | | | | 130 | | | | 130 | | | | CHF | | | | 2016 | | | | 2.385 | % | | | | | | | | | | | | | | | | | | | | | | | | | | | | | | Bond | | 2006 | | | 65 | | | | 65 | | | | 65 | | | | CHF | | | | 2016 | | | | 2.385 | % | | | | | | | | | | | | | | | | | | | | | | | | | | | | | | Bond | | 2006 | | | 64 | | | | 64 | | | | 64 | | | | CHF | | | | 2016 | | | | 2.385 | % | | | | | | | | | | | | | | | | | | | | | | | | | | | | | | Bond | | 2006 | | | 63 | | | | 63 | | | | 64 | | | | CHF | | | | 2016 | | | | 2.385 | % | | | | | | | | | | | | | | | | | | | | | | | | | | | | | | Bond | | 2006 | | | 129 | | | | 129 | | | | 129 | | | | CHF | | | | 2018 | | | | 3.135 | % | | | | | | | | | | | | | | | | | | | | | | | | | | | | | | Bond | | 2007 | | | — | | | | 60 | | | | 60 | | | | CHF | | | | 2010 | | | | 2.385 | % | | | | | | | | | | | | | | | | | | | | | | | | | | | | | | Bond | | 2007 | | | — | | | | 74 | | | | 74 | | | | GBP | | | | 2010 | | | | 4.875 | % | | | | | | | | | | | | | | | | | | | | | | | | | | | | | | Bond | | 2007 | | | 77 | | | | 77 | | | | 77 | | | | USD | | | | 2011 | | | | 5.000 | % | | | | | | | | | | | | | | | | | | | | | | | | | | | | | | Bond | | 2007 | | | 370 | | | | 370 | | | | 370 | | | | USD | | | | 2012 | | | | 5.000 | % | | | | | | | | | | | | | | | | | | | | | | | | | | | | | | Bond | | 2007 | | | 222 | | | | 222 | | | | 222 | | | | USD | | | | 2012 | | | | 5.000 | % | | | | | | | | | | | | | | | | | | | | | | | | | | | | | | Bond | | 2007 | | | 61 | | | | 61 | | | | 61 | | | | AUD | | | | 2012 | | | | 6.500 | % | | | | | | | | | | | | | | | | | | | | | | | | | | | | | | Bond | | 2007 | | | 72 | | | | 72 | | | | 72 | | | | CAD | | | | 2012 | | | | 4.125 | % | | | | | | | | | | | | | | | | | | | | | | | | | | | | | | Bond | | 2007 | | | 71 | | | | 71 | | | | 71 | | | | GBP | | | | 2012 | | | | 4.625 | % | | | | | | | | | | | | | | | | | | | | | | | | | | | | | | Bond | | 2007 | | | 300 | | | | 300 | | | | 300 | | | | EUR | | | | 2013 | | | | 4.125 | % | | | | | | | | | | | | | | | | | | | | | | | | | | | | | | Bond | | 2007 | | | 73 | | | | 73 | | | | 74 | | | | GBP | | | | 2013 | | | | 5.500 | % | | | | | | | | | | | | | | | | | | | | | | | | | | | | | | Bond | | 2007 | | | 306 | | | | 306 | | | | 306 | | | | GBP | | | | 2013 | | | | 5.500 | % | | | | | | | | | | | | | | | | | | | | | | | | | | | | | | Bond | | 2007 | | | 72 | | | | 72 | | | | 73 | | | | GBP | | | | 2013 | | | | 5.500 | % | | | | | | | | | | | | | | | | | | | | | | | | | | | | | | Bond | | 2007 | | | 248 | | | | 248 | | | | 248 | | | | CHF | | | | 2014 | | | | 2.635 | % | | | | | | | | | | | | | | | | | | | | | | | | | | | | | | Bond | | 2007 | | | 31 | | | | 31 | | | | 31 | | | | JPY | | | | 2014 | | | | 1.505 | % | | | | | | | | | | | | | | | | | | | | | | | | | | | | | | Bond | | 2007 | | | 61 | | | | 61 | | | | 61 | | | | CHF | | | | 2014 | | | | 2.635 | % | | | | | | | | | | | | | | | | | | | | | | | | | | | | | | Bond | | 2007 | | | 49 | | | | 49 | | | | 49 | | | | JPY | | | | 2014 | | | | 1.723 | % | | | | | | | | | | | | | | | | | | | | | | | | | | | | | | Bond | | 2007 | | | 121 | | | | 121 | | | | 121 | | | | CHF | | | | 2015 | | | | 3.125 | % | | | | | | | | | | | | | | | | | | | | | | | | | | | | | | Bond | | 2007 | | | 300 | | | | 300 | | | | 300 | | | | EUR | | | | 2017 | | | | 4.700 | % | | | | | | | | | | | | | | | | | | | | | | | | | | | | | | Bond | | 2007 | | | 76 | | | | 76 | | | | 76 | | | | CHF | | | | 2018 | | | | 3.135 | % | | | | | | | | | | | | | | | | | | | | | | | | | | | | | | Bond | | 2007 | | | 60 | | | | 60 | | | | 60 | | | | CHF | | | | 2018 | | | | 3.135 | % | | | | | | | | | | | | | | | | | | | | | | | | | | | | | | Bond | | 2008 | | | — | | | | 63 | | | | 63 | | | | GBP | | | | 2010 | | | | 4.875 | % | | | | | | | | | | | | | | | | | | | | | | | | | | | | | | Bond | | 2008 | | | — | | | | 66 | | | | 66 | | | | GBP | | | | 2010 | | | | 4.875 | % | | | | | | | | | | | | | | | | | | | | | | | | | | | | | | Bond | | 2008 | | | 92 | | | | 92 | | | | 92 | | | | AUD | | | | 2011 | | | | 7.500 | % | | | | | | | | | | | | | | | | | | | | | | | | | | | | | | Bond | | 2008 | | | 100 | | | | 100 | | | | 100 | | | | EUR | | | | 2011 | | | | 3.875 | % | | | | | | | | | | | | | | | | | | | | | | | | | | | | | | Bond | | 2008 | | | 150 | | | | 150 | | | | 151 | | | | EUR | | | | 2011 | | | | 3.875 | % | | | | | | | | | | | | | | | | | | | | | | | | | | | | | | Bond | | 2008 | | | 50 | | | | 50 | | | | 50 | | | | EUR | | | | 2011 | | | | 3.875 | % | | | | | | | | | | | | | | | | | | | | | | | | | | | | | | Bond | | 2008 | | | 50 | | | | 50 | | | | 50 | | | | EUR | | | | 2011 | | | | 3.875 | % | | | | | | | | | | | | | | | | | | | | | | | | | | | | | | Bond | | 2008 | | | 60 | | | | 60 | | | | 60 | | | | JPY | | | | 2011 | | | | EURIBOR 6 months + 0.018 | % | | | | | | | | | | | | | | | | | | | | | | | | | | | | | | Bond | | 2008 | | | 102 | | | | 102 | | | | 102 | | | | USD | | | | 2011 | | | | 3.750 | % | | | | | | | | | | | | | | | | | | | | | | | | | | | | | | Bond | | 2008 | | | 62 | | | | 62 | | | | 62 | | | | CHF | | | | 2012 | | | | 2.135 | % | | | | | | | | | | | | | | | | | | | | | | | | | | | | | | Bond | | 2008 | | | 124 | | | | 124 | | | | 124 | | | | CHF | | | | 2012 | | | | 3.635 | % | | | | | | | | | | | | | | | | | | | | | | | | | | | | | | Bond | | 2008 | | | 46 | | | | 46 | | | | 46 | | | | CHF | | | | 2012 | | | | 2.385 | % | | | | | | | | | | | | | | | | | | | | | | | | | | | | | | Bond | | 2008 | | | 92 | | | | 92 | | | | 92 | | | | CHF | | | | 2012 | | | | 2.385 | % | | | | | | | | | | | | | | | | | | | | | | | | | | | | | | Bond | | 2008 | | | 64 | | | | 64 | | | | 64 | | | | CHF | | | | 2012 | | | | 2.385 | % | | | | | | | | | | | | | | | | | | | | | | | | | | | | | | Bond | | 2008 | | | 50 | | | | 50 | | | | 50 | | | | EUR | | | | 2012 | | | | 3.250 | % | | | | | | | | | | | | | | | | | | | | | | | | | | | | | | Bond | | 2008 | | | 63 | | | | 63 | | | | 63 | | | | GBP | | | | 2012 | | | | 4.625 | % | | | | | | | | | | | | | | | | | | | | | | | | | | | | | | Bond | | 2008 | | | 63 | | | | 63 | | | | 63 | | | | GBP | | | | 2012 | | | | 4.625 | % | | | | | | | | | | | | | | | | | | | | | | | | | | | | | | Bond | | 2008 | | | 63 | | | | 63 | | | | 64 | | | | GBP | | | | 2012 | | | | 4.625 | % | | | | | | | | | | | | | | | | | | | | | | | | | | | | | | Bond | | 2008 | | | 62 | | | | 62 | | | | 62 | | | | NOK | | | | 2012 | | | | 6.000 | % | | | | | | | | | | | | | | | | | | | | | | | | | | | | | | Bond | | 2008 | | | 69 | | | | 69 | | | | 69 | | | | USD | | | | 2012 | | | | 5.000 | % | | | | | | | | | | | | | | | | | | | | | | | | | | | | | | Bond | | 2008 | | | 60 | | | | 60 | | | | 60 | | | | AUD | | | | 2013 | | | | 7.500 | % | | | | | | | | | | | | | | | | | | | | | | | | | | | | | | Bond | | 2008 | | | 61 | | | | 61 | | | | 61 | | | | AUD | | | | 2013 | | | | 7.500 | % | | | | | | | | | | | | | | | | | | | | | | | | | | | | | | Bond | | 2008 | | | 127 | | | | 127 | | | | 128 | | | | CHF | | | | 2013 | | | | 3.135 | % | | | | | | | | | | | | | | | | | | | | | | | | | | | | | | Bond | | 2008 | | | 62 | | | | 62 | | | | 63 | | | | CHF | | | | 2013 | | | | 3.135 | % | | | | | | | | | | | | | | | | | | | | | | | | | | | | | | Bond | | 2008 | | | 200 | | | | 200 | | | | 200 | | | | EUR | | | | 2013 | | | | 4.125 | % | | | | | | | | | | | | | | | | | | | | | | | | | | | | | | Bond | | 2008 | | | 100 | | | | 100 | | | | 100 | | | | EUR | | | | 2013 | | | | 4.125 | % | | | | | | | | | | | | | | | | | | | | | | | | | | | | | | Bond | | 2008 | | | 1,000 | | | | 1,000 | | | | 1,002 | | | | EUR | | | | 2013 | | | | 4.750 | % | | | | | | | | | | | | | | | | | | | | | | | | | | | | | | Bond | | 2008 | | | 63 | | | | 63 | | | | 63 | | | | GBP | | | | 2013 | | | | 5.500 | % |
F-57
| | | | | | | | | | | | | | | | | | | | | | | | | | | | | | | | | Fair value after hedging as of | | | | | | | | | | | | | | Year of
| | December 31,
| | | December 31,
| | | December 31,
| | | | | | | | | Initial rate before hedging
| | | Bonds after fair value hedge (M€) | | issue | | 2010 | | | 2009 | | | 2008 | | | Currency | | | Maturity | | | instruments | | | | | | | | | | | | | | | | | | | | | | | | | | | | | | | Bond | | 2008 | | | 149 | | | | 149 | | | | 149 | | | | JPY | | | | 2013 | | | | EURIBOR 6 months + 0.008 | % | | | | | | | | | | | | | | | | | | | | | | | | | | | | | | Bond | | 2008 | | | 191 | | | | 191 | | | | 194 | | | | USD | | | | 2013 | | | | 4.000 | % | | | | | | | | | | | | | | | | | | | | | | | | | | | | | | Bond | | 2008 | | | 61 | | | | 61 | | | | 61 | | | | CHF | | | | 2015 | | | | 3.135 | % | | | | | | | | | | | | | | | | | | | | | | | | | | | | | | Bond | | 2008 | | | 62 | | | | 62 | | | | 62 | | | | CHF | | | | 2015 | | | | 3.135 | % | | | | | | | | | | | | | | | | | | | | | | | | | | | | | | Bond | | 2008 | | | 61 | | | | 61 | | | | 62 | | | | CHF | | | | 2015 | | | | 3.135 | % | | | | | | | | | | | | | | | | | | | | | | | | | | | | | | Bond | | 2008 | | | 62 | | | | 62 | | | | 62 | | | | CHF | | | | 2018 | | | | 3.135 | % | | | | | | | | | | | | | | | | | | | | | | | | | | | | | | Bond | | 2009 | | | 56 | | | | 56 | | | | — | | | | AUD | | | | 2013 | | | | 5.500 | % | | | | | | | | | | | | | | | | | | | | | | | | | | | | | | Bond | | 2009 | | | 54 | | | | 54 | | | | — | | | | AUD | | | | 2013 | | | | 5.500 | % | | | | | | | | | | | | | | | | | | | | | | | | | | | | | | Bond | | 2009 | | | 236 | | | | 236 | | | | — | | | | CHF | | | | 2013 | | | | 2.500 | % | | | | | | | | | | | | | | | | | | | | | | | | | | | | | | Bond | | 2009 | | | 77 | | | | 77 | | | | — | | | | USD | | | | 2013 | | | | 4.000 | % | | | | | | | | | | | | | | | | | | | | | | | | | | | | | | Bond | | 2009 | | | 131 | | | | 131 | | | | — | | | | CHF | | | | 2014 | | | | 2.625 | % | | | | | | | | | | | | | | | | | | | | | | | | | | | | | | Bond | | 2009 | | | 997 | | | | 998 | | | | — | | | | EUR | | | | 2014 | | | | 3.500 | % | | | | | | | | | | | | | | | | | | | | | | | | | | | | | | Bond | | 2009 | | | 150 | | | | 150 | | | | — | | | | EUR | | | | 2014 | | | | 3.500 | % | | | | | | | | | | | | | | | | | | | | | | | | | | | | | | Bond | | 2009 | | | 40 | | | | 40 | | | | — | | | | HKD | | | | 2014 | | | | 3.240 | % | | | | | | | | | | | | | | | | | | | | | | | | | | | | | | Bond | | 2009 | | | 103 | | | | 96 | | | | — | | | | AUD | | | | 2015 | | | | 6.000 | % | | | | | | | | | | | | | | | | | | | | | | | | | | | | | | Bond | | 2009 | | | 550 | | | | 550 | | | | — | | | | EUR | | | | 2015 | | | | 3.625 | % | | | | | | | | | | | | | | | | | | | | | | | | | | | | | | Bond | | 2009 | | | 684 | | | | 684 | | | | — | | | | USD | | | | 2015 | | | | 3.125 | % | | | | | | | | | | | | | | | | | | | | | | | | | | | | | | Bond | | 2009 | | | 224 | | | | 208 | | | | — | | | | USD | | | | 2015 | | | | 3.125 | % | | | | | | | | | | | | | | | | | | | | | | | | | | | | | | Bond | | 2009 | | | 99 | | | | 99 | | | | — | | | | CHF | | | | 2016 | | | | 2.385 | % | | | | | | | | | | | | | | | | | | | | | | | | | | | | | | Bond | | 2009 | | | 115 | | | | 115 | | | | — | | | | GBP | | | | 2017 | | | | 4.250 | % | | | | | | | | | | | | | | | | | | | | | | | | | | | | | | Bond | | 2009 | | | 225 | | | | 225 | | | | — | | | | GBP | | | | 2017 | | | | 4.250 | % | | | | | | | | | | | | | | | | | | | | | | | | | | | | | | Bond | | 2009 | | | 448 | | | | 448 | | | | — | | | | EUR | | | | 2019 | | | | 4.875 | % | | | | | | | | | | | | | | | | | | | | | | | | | | | | | | Bond | | 2009 | | | 69 | | | | 69 | | | | — | | | | HKD | | | | 2019 | | | | 4.180 | % | | | | | | | | | | | | | | | | | | | | | | | | | | | | | | Bond | | 2009 | | | 374 | | | | 347 | | | | — | | | | USD | | | | 2021 | | | | 4.250 | % | | | | | | | | | | | | | | | | | | | | | | | | | | | | | | Bond | | 2010 | | | 102 | | | | | | | | | | | | AUD | | | | 2014 | | | | 5.750 | % | | | | | | | | | | | | | | | | | | | | | | | | | | | | | | Bond | | 2010 | | | 108 | | | | | | | | | | | | CAD | | | | 2014 | | | | 2.500 | % | | | | | | | | | | | | | | | | | | | | | | | | | | | | | | Bond | | 2010 | | | 53 | | | | | | | | | | | | NZD | | | | 2014 | | | | 4.750 | % | | | | | | | | | | | | | | | | | | | | | | | | | | | | | | Bond | | 2010 | | | 187 | | | | | | | | | | | | USD | | | | 2015 | | | | 2.875 | % | | | | | | | | | | | | | | | | | | | | | | | | | | | | | | Bond | | 2010 | | | 935 | | | | | | | | | | | | USD | | | | 2015 | | | | 3.000 | % | | | | | | | | | | | | | | | | | | | | | | | | | | | | | | Bond | | 2010 | | | 748 | | | | | | | | | | | | USD | | | | 2016 | | | | 2.300 | % | | | | | | | | | | | | | | | | | | | | | | | | | | | | | | Bond | | 2010 | | | 68 | | | | | | | | | | | | AUD | | | | 2015 | | | | 6.000 | % | | | | | | | | | | | | | | | | | | | | | | | | | | | | | | Bond | | 2010 | | | 69 | | | | | | | | | | | | AUD | | | | 2015 | | | | 6.000 | % | | | | | | | | | | | | | | | | | | | | | | | | | | | | | | Bond | | 2010 | | | 64 | | | | | | | | | | | | AUD | | | | 2015 | | | | 6.000 | % | | | | | | | | | | | | | | | | | | | | | | | | | | | | | | Bond | | 2010 | | | 476 | | | | | | | | | | | | EUR | | | | 2022 | | | | 3.125 | % | | | | | | | | | | | | | | | | | | | | | | | | | | | | | | Current portion (less than one year) | | | | | (3,450 | ) | | | (1,937 | ) | | | (722 | ) | | | | | | | | | | | | | | | | | | | | | | | | | | | | | | | | | | | | | | | | | Total TOTAL CAPITAL | | | | | 15,143 | | | | 15,615 | | | | 13,093 | | | | | | | | | | | | | | | | | | | | | | | | | | | | | | | | | | | | | | | | | | | | | | | | | | | | | | | | | | | | | | | | | | | | | | | Other consolidated subsidiaries | | | | | 223 | | | | 153 | | | | 103 | | | | | | | | | | | | | | | | | | | | | | | | | | | | | | | | | | | | | | | | | | Total bonds after fair value hedge | | | | | 15,491 | | | | 15,884 | | | | 13,380 | | | | | | | | | | | | | | | | | | | Amount after hedging as of | | | | | | | | | | | | | | Year of
| | December 31,
| | | December 31,
| | | December 31,
| | | | | | | | | Initial rate before hedging
| | | Fixed rate bonds and bonds after cash flow hedge (M€) | | issue | | 2010 | | | 2009 | | | 2008 | | | Currency | | | Maturity | | | instruments | | | | | | | | | | | | | | | | | | | | | | | | | | | | | | TOTAL CAPITAL(a) | | | | | | | | | | | | | | | | | | | | | | | | | | | | | | | | | | | | | | | | | | | | | | | | | | | | | | | | Bond | | 2005 | | | 293 | | | | 292 | | | | 287 | | | | GBP | | | | 2012 | | | | 4.625 | % | | | | | | | | | | | | | | | | | | | | | | | | | | | | | | Bond | | 2009 | | | 691 | | | | 602 | | | | — | | | | EUR | | | | 2019 | | | | 4.875 | % | | | | | | | | | | | | | | | | | | | | | | | | | | | | | | Bond | | 2009 | | | 917 | | | | 806 | | | | — | | | | EUR | | | | 2024 | | | | 5.125 | % | | | | | | | | | | | | | | | | | | | | | | | | | | | | | | Bond | | 2010 | | | 935 | | | | | | | | | | | | USD | | | | 2020 | | | | 4.450 | % | | | | | | | | | | | | | | | | | | | | | | | | | | | | | Total fixed rate bonds and bonds after cash flow hedge | | | | | 2,836 | | | | 1,700 | | | | 287 | | | | | | | | | | | | | | | | | | | | | | | | | | | | | | | | | | | | | | | | | |
| | | | (a) | | TOTAL CAPITAL is a wholly-owned indirect subsidiary of TOTAL S.A. (with the exception of one share held by each member of its Board of Directors). It acts as a financing vehicle for the Group. Its debt securities are fully and unconditionally guaranteed by TOTAL S.A. as to payment of principal, premium, if any, interest and any other amounts due. |
F-58
Loan repayment schedule (excluding current portion) | | | | | | | | | | | | | | | | | | | | | | | | | | | of which hedging
| | | | | | | | | | | | | | | | instruments of
| | | Hedging instruments
| | | | | | | | | | | | | non-current
| | | of non-current
| | | Non-current financial
| | | | As of December 31, 2010
| | Non-current
| | | financial debt
| | | financial debt
| | | debt - net of hedging
| | | | | (M€) | | financial debt | | | (liabilities) | | | (assets) | | | instruments | | | % | | 2012 | | | 3,756 | | | | 34 | | | | (401 | ) | | | 3,355 | | | | 18% | | 2013 | | | 4,017 | | | | 76 | | | | (473 | ) | | | 3,544 | | | | 19% | | 2014 | | | 2,508 | | | | 1 | | | | (290 | ) | | | 2,218 | | | | 12% | | 2015 | | | 3,706 | | | | 2 | | | | (302 | ) | | | 3,404 | | | | 18% | | 2016 and beyond | | | 6,796 | | | | 65 | | | | (404 | ) | | | 6,392 | | | | 33% | | | | | | | | | | | | | | | | | | | | | | Total | | | 20,783 | | | | 178 | | | | (1,870 | ) | | | 18,913 | | | | 100% | | | | | | | | | | | | | | | | | | | | | |
| | | | | | | | | | | | | | | | | | | | | | | | | | | of which hedging
| | | | | | | | | | | | | | | | instruments of
| | | Hedging instruments
| | | | | | | | | | | | | non-current
| | | of non-current
| | | Non-current financial
| | | | As of December 31, 2009
| | Non-current
| | | financial debt
| | | financial debt
| | | debt - net of hedging
| | | | | (M€) | | financial debt | | | (liabilities) | | | (assets) | | | instruments | | | % | | 2011 | | | 3,857 | | | | 42 | | | | (199 | ) | | | 3,658 | | | | 20% | | 2012 | | | 3,468 | | | | 48 | | | | (191 | ) | | | 3,277 | | | | 18% | | 2013 | | | 3,781 | | | | 95 | | | | (236 | ) | | | 3,545 | | | | 19% | | 2014 | | | 2,199 | | | | 6 | | | | (90 | ) | | | 2,109 | | | | 11% | | 2015 and beyond | | | 6,132 | | | | 50 | | | | (309 | ) | | | 5,823 | | | | 32% | | | | | | | | | | | | | | | | | | | | | | Total | | | 19,437 | | | | 241 | | | | (1,025 | ) | | | 18,412 | | | | 100% | | | | | | | | | | | | | | | | | | | | | |
| | | | | | | | | | | | | | | | | | | | | | | | | | | of which hedging
| | | | | | | | | | | | | | | | instruments of
| | | Hedging instruments
| | | | | | | | | | | | | non-current
| | | of non-current
| | | Non-current financial
| | | | As of December 31, 2008
| | Non-current
| | | financial debt
| | | financial debt
| | | debt - net of hedging
| | | | | (M€) | | financial debt | | | (liabilities) | | | (assets) | | | instruments | | | % | | 2010 | | | 3,160 | | | | 170 | | | | (168 | ) | | | 2,992 | | | | 20% | | 2011 | | | 3,803 | | | | 24 | | | | (145 | ) | | | 3,658 | | | | 24% | | 2012 | | | 3,503 | | | | 115 | | | | (179 | ) | | | 3,324 | | | | 22% | | 2013 | | | 3,430 | | | | 127 | | | | (198 | ) | | | 3,232 | | | | 21% | | 2014 and beyond | | | 2,295 | | | | 4 | | | | (202 | ) | | | 2,093 | | | | 13% | | | | | | | | | | | | | | | | | | | | | | Total | | | 16,191 | | | | 440 | | | | (892 | ) | | | 15,299 | | | | 100% | | | | | | | | | | | | | | | | | | | | | |
Analysis by currency and interest rate These analyses take into account interest rate and foreign currency swaps to hedge non-current financial debt. | | | | | | | | | | | | | | | | | | | | | | | | | | | As of December 31, (M€) | | 2010 | | | % | | | 2009 | | | % | | | 2008 | | | % | | | U.S. Dollar | | | 7,248 | | | | 39% | | | | 3,962 | | | | 21% | | | | 3,990 | | | | 26% | | | Euro | | | 11,417 | | | | 60% | | | | 14,110 | | | | 77% | | | | 10,685 | | | | 70% | | | Other currencies | | | 248 | | | | 1% | | | | 340 | | | | 2% | | | | 624 | | | | 4% | | | | | | | | | | | | | | | | | | | | | | | | | | | | Total | | | 18,913 | | | | 100% | | | | 18,412 | | | | 100% | | | | 15,299 | | | | 100% | | | | | | | | | | | | | | | | | | | | | | | | | | | |
F-59
| | | | | | | | | | | | | | | | | | | | | | | | | | As of December 31,
| | | | | | | | | | | | | | | | | | | | (M€) | | 2010 | | | % | | | 2009 | | | % | | | 2008 | | | % | | | Fixed rate | | | 3,177 | | | | 17% | | | | 2,064 | | | | 11% | | | | 633 | | | | 4% | | | Floating rate | | | 15,736 | | | | 83% | | | | 16,348 | | | | 89% | | | | 14,666 | | | | 96% | | | | | | | | | | | | | | | | | | | | | | | | | | | | Total | | | 18,913 | | | | 100% | | | | 18,412 | | | | 100% | | | | 15,299 | | | | 100% | | | | | | | | | | | | | | | | | | | | | | | | | | | |
| | | B) | CURRENT FINANCIAL ASSETS AND LIABILITIES |
Current borrowings consist mainly of commercial papers or treasury bills or draws on bank loans. These instruments bear interest at rates that are close to market rates. | | | | | | | | | | | | | | As of December 31, (M€)
| | | | | | | | | | | (Assets) / Liabilities | | 2010 | | | 2009 | | | 2008 | | Current financial debt(a) | | | 5,867 | | | | 4,761 | | | | 5,586 | | | Current portion of non-current financial debt | | | 3,786 | | | | 2,233 | | | | 2,136 | | | | | | | | | | | | | | | | Current borrowings(note 28) | | | 9,653 | | | | 6,994 | | | | 7,722 | | | | | | | | | | | | | | | | | Current portion of hedging instruments of debt (liabilities) | | | 12 | | | | 97 | | | | 12 | | | Other current financial instruments (liabilities) | | | 147 | | | | 26 | | | | 146 | | | | | | | | | | | | | | | | Other current financial liabilities(note 28) | | | 159 | | | | 123 | | | | 158 | | | | | | | | | | | | | | | | | Current deposits beyond three months | | | (869 | ) | | | (55 | ) | | | (1 | ) | | Current portion of hedging instruments of debt (assets) | | | (292 | ) | | | (197 | ) | | | (100 | ) | | Other current financial instruments (assets) | | | (44 | ) | | | (59 | ) | | | (86 | ) | | | | | | | | | | | | | | | Current financial assets(note 28) | | | (1,205 | ) | | | (311 | ) | | | (187 | ) | | | | | | | | | | | | | | | Current borrowings and related financial assets and liabilities, net | | | 8,607 | | | | 6,806 | | | | 7,693 | | | | | | | | | | | | | | | |
| | | | (a) | | As of December 31, 2010, the current financial debt includes a commercial paper program in Total Capital Canada Ltd. Total Capital Canada Ltd. is a wholly-owned direct subsidiary of TOTAL S.A. It acts as a financing vehicle for the activities of the Group in Canada. Its debt securities are fully and unconditionally guaranteed by TOTAL S.A. as to payment of principal, premium, if any, interest and any other amounts due. |
| | | C) | NET-DEBT-TO-EQUITY RATIO |
For its internal and external communication needs, the Group calculates a debt ratio by dividing its net financial debt by equity. Shareholders’ equity as of December 31, 2010 is calculated after distribution of a dividend of €2.28 per share of which €1.14 per share was paid on November 17, 2010. F-60
The net-debt-to-equity ratio is calculated as follows: | | | | | | | | | | | | | | As of December 31, (M€)
| | | | | | | | | | | (Assets)/Liabilities | | 2010 | | | 2009 | | | 2008 | | | Current borrowings | | | 9,653 | | | | 6,994 | | | | 7,722 | | | Other current financial liabilities | | | 159 | | | | 123 | | | | 158 | | | Current financial assets | | | (1,205) | | | | (311) | | | | (187) | | | Non-current financial debt | | | 20,783 | | | | 19,437 | | | | 16,191 | | | Hedging instruments on non-current financial debt | | | (1,870) | | | | (1,025) | | | | (892) | | | Cash and cash equivalents | | | (14,489) | | | | (11,662) | | | | (12,321) | | | | | | | | | | | | | | | | Net financial debt | | | 13,031 | | | | 13,556 | | | | 10,671 | | | | | | | | | | | | | | | | | Shareholders’ equity-Group share | | | 60,414 | | | | 52,552 | | | | 48,992 | | | Estimated dividend payable | | | (2,553) | | | | (2,546) | | | | (2,540) | | | Minority interest | | | 857 | | | | 987 | | | | 958 | | | | | | | | | | | | | | | | Total shareholder’s equity | | | 58,718 | | | | 50,993 | | | | 47,410 | | | | | | | | | | | | | | | | Net-debt-to-equity ratio | | | 22.2% | | | | 26.6% | | | | 22.5% | | | | | | | | | | | | | | | |
| | | 21) | OTHER CREDITORS AND ACCRUED LIABILITIES |
| | | | | | | | | | | | | | | As of December 31, (M€) | | 2010 | | | 2009 | | | 2008 | | | Accruals and deferred income | | | 184 | | | | 223 | | | | 151 | | | Payable to States (including taxes and duties) | | | 7,235 | | | | 6,024 | | | | 6,256 | | | Payroll | | | 996 | | | | 955 | | | | 928 | | | Other operating liabilities | | | 3,574 | | | | 4,706 | | | | 4,297 | | | | | | | | | | | | | | | | Total | | | 11,989 | | | | 11,908 | | | | 11,632 | | | | | | | | | | | | | | | |
As of December 31, 2009, the heading “Other operating liabilities” mainly included €744 million related to Chesapeake acquisition (see Note 3 to the Consolidated Financial Statements). The Group leases real estate, retail stations, ships, and other equipments (see Note 11 to the Consolidated Financial Statements). The future minimum lease payments on operating and finance leases to which the Group is committed are shown as follows: | | | | | | | | | | | | | Operating
| | | Finance
| | | For the year ended December 31, 2010 (M€) | | leases | | | leases | | | 2011 | | | 582 | | | | 39 | | | 2012 | | | 422 | | | | 39 | | | 2013 | | | 335 | | | | 39 | | | 2014 | | | 274 | | | | 35 | | | 2015 | | | 230 | | | | 35 | | | 2016 and beyond | | | 1,105 | | | | 54 | | | | | | | | | | | | Total minimum payments | | | 2,948 | | | | 241 | | | Less financial expenses | | | — | | | | (43 | ) | | | | | | | | | | | Nominal value of contracts | | | — | | | | 198 | | | Less current portion of finance lease contracts | | | — | | | | (23 | ) | | | | | | | | | | | Outstanding liability of finance lease contracts | | | — | | | | 175 | | | | | | | | | | | |
F-61
| | | | | | | | | | | | | Operating
| | | Finance
| | | For the year ended December 31, 2009 (M€) | | leases | | | leases | | | 2010 | | | 523 | | | | 42 | | | 2011 | | | 377 | | | | 43 | | | 2012 | | | 299 | | | | 42 | | | 2013 | | | 243 | | | | 41 | | | 2014 | | | 203 | | | | 39 | | | 2015 and beyond | | | 894 | | | | 128 | | | | | | | | | | | | Total minimum payments | | | 2,539 | | | | 335 | | | Less financial expenses | | | — | | | | (53 | ) | | | | | | | | | | | Nominal value of contracts | | | — | | | | 282 | | | Less current portion of finance lease contracts | | | — | | | | (22 | ) | | | | | | | | | | | Outstanding liability of finance lease contracts | | | — | | | | 260 | | | | | | | | | | | |
| | | | | | | | | | | | | Operating
| | | Finance
| | | For the year ended December 31, 2008 (M€) | | leases | | | leases | | | 2009 | | | 429 | | | | 47 | | | 2010 | | | 306 | | | | 42 | | | 2011 | | | 243 | | | | 42 | | | 2012 | | | 208 | | | | 42 | | | 2013 | | | 166 | | | | 40 | | | 2014 and beyond | | | 675 | | | | 148 | | | | | | | | | | | | Total minimum payments | | | 2,027 | | | | 361 | | | Less financial expenses | | | — | | | | (70 | ) | | | | | | | | | | | Nominal value of contracts | | | — | | | | 291 | | | Less current portion of finance lease contracts | | | — | | | | (23 | ) | | | | | | | | | | | Outstanding liability of finance lease contracts | | | — | | | | 268 | | | | | | | | | | | |
Net rental expense incurred under operating leases for the year ended December 31, 2010 is €605 million (against €613 million in 2009 and €426 million in 2008). | | | 23) | COMMITMENTS AND CONTINGENCIES |
| | | | | | | | | | | | | | | | | | | | | Maturity and installments | | | | | | | | As of December 31, 2010 | | | | | Less than 1
| | | Between 1
| | | More than 5
| | (M€)
| | Total | | | year | | | and 5 years | | | years | | Non-current debt obligations net of hedging instruments(Note 20) | | | 18,738 | | | | — | | | | 12,392 | | | | 6,346 | | Current portion of non-current debt obligations net of hedging instruments(Note 20) | | | 3,483 | | | | 3,483 | | | | — | | | | — | | Finance lease obligations(Note 22) | | | 198 | | | | 23 | | | | 129 | | | | 46 | | Asset retirement obligations(Note 19) | | | 5,917 | | | | 177 | | | | 872 | | | | 4,868 | | | | | | | | | | | | | | | | | | | | Contractual obligations recorded in the balance sheet | | | 28,336 | | | | 3,683 | | | | 13,393 | | | | 11,260 | | Operating lease obligations(Note 22) | | | 2,948 | | | | 582 | | | | 1,261 | | | | 1,105 | | | Purchase obligations | | | 61,293 | | | | 6,347 | | | | 14,427 | | | | 40,519 | | | | | | | | | | | | | | | | | | | | Contractual obligations not recorded in the balance sheet | | | 64,241 | | | | 6,929 | | | | 15,688 | | | | 41,624 | | | | | | | | | | | | | | | | | | | | Total of contractual obligations | | | 92,577 | | | | 10,612 | | | | 29,081 | | | | 52,884 | | | | | | | | | | | | | | | | | | | | | Guarantees given for excise taxes | | | 1,753 | | | | 1,594 | | | | 71 | | | | 88 | | | Guarantees given against borrowings | | | 5,005 | | | | 1,333 | | | | 493 | | | | 3,179 | | | Indemnities related to sales of businesses | | | 37 | | | | — | | | | 31 | | | | 6 | | | Guarantees of current liabilities | | | 171 | | | | 147 | | | | 19 | | | | 5 | | | Guarantees to customers / suppliers | | | 3,020 | | | | 1,621 | | | | 96 | | | | 1,303 | | | Letters of credit | | | 1,250 | | | | 1,247 | | | | — | | | | 3 | | | Other operating commitments | | | 2,057 | | | | 467 | | | | 220 | | | | 1,370 | | | | | | | | | | | | | | | | | | | | Total of other commitments given | | | 13,293 | | | | 6,409 | | | | 930 | | | | 5,954 | | | | | | | | | | | | | | | | | | | | | Mortgages and liens received | | | 429 | | | | 2 | | | | 114 | | | | 313 | | | Other commitments received | | | 6,387 | | | | 3,878 | | | | 679 | | | | 1,830 | | | | | | | | | | | | | | | | | | | | Total of commitments received | | | 6,816 | | | | 3,880 | | | | 793 | | | | 2,143 | | | | | | | | | | | | | | | | | | | |
F-62
| | | | | | | | | | | | | | | | | | | | | Maturity and installments | | | | | | | | As of December 31, 2009 | | | | | Less than 1
| | | Between 1
| | | More than 5
| | (M€)
| | Total | | | year | | | and 5 years | | | years | | Non-current debt obligations net of hedging instruments(Note 20) | | | 18,152 | | | | — | | | | 12,443 | | | | 5,709 | | Current portion of non-current debt obligations net of hedging instruments(Note 20) | | | 2,111 | | | | 2,111 | | | | — | | | | — | | Finance lease obligations(Note 22) | | | 282 | | | | 22 | | | | 146 | | | | 114 | | Asset retirement obligations(Note 19) | | | 5,469 | | | | 235 | | | | 972 | | | | 4,262 | | | | | | | | | | | | | | | | | | | | Contractual obligations recorded in the balance sheet | | | 26,014 | | | | 2,368 | | | | 13,561 | | | | 10,085 | | Operating lease obligations(Note 22) | | | 2,539 | | | | 523 | | | | 1,122 | | | | 894 | | | Purchase obligations | | | 49,808 | | | | 4,542 | | | | 9,919 | | | | 35,347 | | | | | | | | | | | | | | | | | | | | Contractual obligations not recorded in the balance sheet | | | 52,347 | | | | 5,065 | | | | 11,041 | | | | 36,241 | | | | | | | | | | | | | | | | | | | | Total of contractual obligations | | | 78,361 | | | | 7,433 | | | | 24,602 | | | | 46,326 | | | | | | | | | | | | | | | | | | | | | Guarantees given for excise taxes | | | 1,765 | | | | 1,617 | | | | 69 | | | | 79 | | | Guarantees given against borrowings | | | 2,882 | | | | 1,383 | | | | 709 | | | | 790 | | | Indemnities related to sales of businesses | | | 36 | | | | — | | | | 1 | | | | 35 | | | Guarantees of current liabilities | | | 203 | | | | 160 | | | | 38 | | | | 5 | | | Guarantees to customers / suppliers | | | 2,770 | | | | 1,917 | | | | 70 | | | | 783 | | | Letters of credit | | | 1,499 | | | | 1,485 | | | | 2 | | | | 12 | | | Other operating commitments | | | 765 | | | | 582 | | | | 103 | | | | 80 | | | | | | | | | | | | | | | | | | | | Total of other commitments given | | | 9,920 | | | | 7,144 | | | | 992 | | | | 1,784 | | | | | | | | | | | | | | | | | | | | | Mortgages and liens received | | | 330 | | | | 5 | | | | 106 | | | | 219 | | | Other commitments received | | | 5,637 | | | | 3,187 | | | | 481 | | | | 1,969 | | | | | | | | | | | | | | | | | | | | Total of commitments received | | | 5,967 | | | | 3,192 | | | | 587 | | | | 2,188 | | | | | | | | | | | | | | | | | | | |
F-63
| | | | | | | | | | | | | | | | | | | | | Maturity and installments | | | | | | | | As of December 31, 2008 | | | | | Less than
| | | Between 1
| | | More than
| | (M€)
| | Total | | | 1 year | | | and 5 years | | | 5 years | | Non-current debt obligations net of hedging instruments(Note 20) | | | 15,031 | | | | — | | | | 13,064 | | | | 1,967 | | Current portion of non-current debt obligations net of hedging instruments(Note 20) | | | 2,025 | | | | 2,025 | | | | — | | | | — | | Finance lease obligations(Note 22) | | | 291 | | | | 23 | | | | 142 | | | | 126 | | Asset retirement obligations(Note 19) | | | 4,500 | | | | 154 | | | | 653 | | | | 3,693 | | | | | | | | | | | | | | | | | | | | Contractual obligations recorded in the balance sheet | | | 21,847 | | | | 2,202 | | | | 13,859 | | | | 5,786 | | Operating lease obligations(Note 22) | | | 2,027 | | | | 429 | | | | 923 | | | | 675 | | | Purchase obligations | | | 60,226 | | | | 4,420 | | | | 13,127 | | | | 42,679 | | | | | | | | | | | | | | | | | | | | Contractual obligations not recorded in the balance sheet | | | 62,253 | | | | 4,849 | | | | 14,050 | | | | 43,354 | | | | | | | | | | | | | | | | | | | | Total of contractual obligations | | | 84,100 | | | | 7,051 | | | | 27,909 | | | | 49,140 | | | | | | | | | | | | | | | | | | | | | Guarantees given for excise taxes | | | 1,720 | | | | 1,590 | | | | 58 | | | | 72 | | | Guarantees given against borrowings | | | 2,870 | | | | 1,119 | | | | 519 | | | | 1,232 | | | Indemnities related to sales of businesses | | | 39 | | | | 3 | | | | 1 | | | | 35 | | | Guarantees of current liabilities | | | 315 | | | | 119 | | | | 164 | | | | 32 | | | Guarantees to customers / suppliers | | | 2,866 | | | | 68 | | | | 148 | | | | 2,650 | | | Letters of credit | | | 1,080 | | | | 1,024 | | | | 17 | | | | 39 | | | Other operating commitments | | | 648 | | | | 246 | | | | 132 | | | | 270 | | | | | | | | | | | | | | | | | | | | Total of other commitments given | | | 9,538 | | | | 4,169 | | | | 1,039 | | | | 4,330 | | | | | | | | | | | | | | | | | | | | | Mortgages and liens received | | | 321 | | | | 72 | | | | 110 | | | | 139 | | | Other commitments received | | | 4,218 | | | | 2,440 | | | | 234 | | | | 1,544 | | | | | | | | | | | | | | | | | | | | Total of commitments received | | | 4,539 | | | | 2,512 | | | | 344 | | | | 1,683 | | | | | | | | | | | | | | | | | | | |
| | | A. | CONTRACTUAL OBLIGATIONS |
Debt obligations “Non-current debt obligations” are included in the items “Non-current financial debt” and “Hedging instruments of non-current financial debt” of the Consolidated Balance Sheet. It includes the non-current portion of swaps hedging bonds, and excludes non-current finance lease obligations of €175 million. The current portion of non-current debt is included in the items “Current borrowings”, “Current financial assets” and “Other current financial liabilities” of the Consolidated Balance Sheet. It includes the current portion of swaps hedging bonds, and excludes the current portion of finance lease obligations of €23 million. The information regarding contractual obligations linked to indebtedness is presented in Note 20 to the Consolidated Financial Statements. Lease contracts The information regarding operating and finance leases is presented in Note 22 to the Consolidated Financial Statements. Asset retirement obligations This item represents the discounted present value of Upstream asset retirement obligations, primarily asset removal costs at the completion date. The information regarding contractual obligations linked to asset retirement obligations is presented in Notes 1Q and 19 to the Consolidated Financial Statements. Purchase obligations Purchase obligations are obligations under contractual agreements to purchase goods or services, including capital projects. These obligations are enforceable and legally binding on the company and specify all significant terms, including the amount and the timing of the payments. These obligations mainly include: hydrocarbon unconditional purchase contracts (except where an active, highly-liquid market exists and when the hydrocarbons are expected to be re-sold shortly after purchase), reservation of transport capacities in pipelines, unconditional exploration works and development works in the Upstream segment, and contracts for capital investment projects in the Downstream segment. F-64
| | | B. | OTHER COMMITMENTS GIVEN |
Guarantees given for excise taxes They consist of guarantees given to other oil and gas companies in order to comply with French tax authorities’ requirements for oil and gas imports in France. A payment would be triggered by a failure of the guaranteed party with respect to the French tax authorities. The default of the guaranteed parties is however considered to be highly remote by the Group. Guarantees given against borrowings The Group guarantees bank debt and finance lease obligations of certain non-consolidated subsidiaries and equity affiliates. Maturity dates vary, and guarantees will terminate on paymentand/or cancellation of the obligation. A payment would be triggered by failure of the guaranteed party to fulfill its obligation covered by the guarantee, and no assets are held as collateral for these guarantees. As of December 31, 2010, the maturities of these guarantees are up to 2023. Guarantees given against borrowings include the guarantee given in 2008 by TOTAL S.A. in connection with the financing of the Yemen LNG project for an amount of €1,335 million. In turn, certain partners involved in this project have given commitments that could, in the case of Total S.A.’s guarantees being called for the maximum amount, reduce the Group’s exposure by up to €427 million, recorded under “Other commitments received”. In 2010, TOTAL S.A. provided guarantees in connection with the financing of the Jubail project (operated by SAUDI ARAMCO TOTAL Refining and Petrochemical Company (SATORP)) of up to €2,385 million, proportional to TOTAL’s share in the project (37.5%). In addition, TOTAL S.A. provided in 2010 a guarantee in favor of its partner in the Jubail project (Saudi Arabian Oil Company) with respect to Total Refining Saudi Arabia SAS’s obligations under the shareholders agreement with respect to SATORP. As of December 31, 2010, this guarantee is of up to €1,271 million and has been recorded under “Other operating commitments”. Indemnities related to sales of businesses In the ordinary course of business, the Group executes contracts involving standard indemnities in oil industry and indemnities specific to transactions such as sales of businesses. These indemnities might include claims against any of the following: environmental, tax and shareholder matters, intellectual property rights, governmental regulations and employment-related matters, dealer, supplier, and other commercial contractual relationships. Performance under these indemnities would generally be triggered by a breach of terms of the contract or by a third party claim. The Group regularly evaluates the probability of having to incur costs associated with these indemnities. The guarantees related to antitrust investigations granted as part of the agreement relating to the spin-off of Arkema are described in Note 32 to the Consolidated Financial Statements. Other guarantees given Non-consolidated subsidiaries The Group also guarantees the current liabilities of certain non-consolidated subsidiaries. Performance under these guarantees would be triggered by a financial default of the entity. Operating agreements As part of normal ongoing business operations and consistent with generally and accepted recognized industry practices, the Group enters into numerous agreements with other parties. These commitments are often entered into for commercial purposes, for regulatory purposes or for other operating agreements. The main transactions and balances with related parties (principally non-consolidated subsidiaries and equity affiliates) are detailed as follows: | | | | | | | | | | | | | |
Balance sheet
| | | | | | | | | | | As of December 31, (M€) | | 2010 | | | 2009 | | | 2008 | | | | | | | | | | | | | | | | Receivables | | | | | | | | | | | | | | Debtors and other debtors | | | 432 | | | | 293 | | | | 244 | | | Loans (excl. loans to equity affiliates) | | | 315 | | | | 438 | | | | 354 | | Payables | | | | | | | | | | | | | | Creditors and other creditors | | | 497 | | | | 386 | | | | 136 | | | Debts | | | 28 | | | | 42 | | | | 50 | | | | | | | | | | | | | | | |
| | | | | | | | | | | | | |
Statement of income
| | | | | | | | | | For the year ended December 31,
| | | | | | | | | | | (M€) | | 2010 | | | 2009 | | | 2008 | | | Sales | | | 3,194 | | | | 2,183 | | | | 3,082 | | | Purchases | | | 5,576 | | | | 2,958 | | | | 4,061 | | | Financial expense | | | 69 | | | | 1 | | | | — | | | Financial income | | | 74 | | | | 68 | | | | 114 | |
F-65
Compensation for the administration and management bodies The aggregate amount paid directly or indirectly by the French and foreign affiliates of the Company as compensation to the executive officers of TOTAL (the members of the Management Committee and the Treasurer) and to the members of the Board of Directors who are employees of the Group, is detailed as follows: | | | | | | | | | | | | | | | For the year ended December 31, | | | | | | | | | | | (M€) | | 2010 | | | 2009 | | | 2008 | | | Number of people | | | 26 | | | | 27 | | | | 30 | | | | | | | | | | | | | | | | | Direct or indirect compensation | | | 20.8 | | | | 19.4 | | | | 20.4 | | Pension expenses(a) | | | 12.2 | | | | 10.6 | | | | 11.9 | | | Other long-term benefits | | | — | | | | — | | | | — | | | Termination benefits | | | — | | | | — | | | | — | | Share-based payments expense (IFRS 2)(b) | | | 10.0 | | | | 11.2 | | | | 16.6 | | | | | | | | | | | | | | | |
| | | | (a) | | The benefits provided for executive officers and certain members of the Board of Directors, employees and former employees of the Group, include severance to be paid on retirement, supplementary pension schemes and insurance plans, which represent €113.8 million provisioned as of December 31, 2010 (against €96.6 million as of December 31, 2009 and €98.0 million as of December 31, 2008). | | | (b) | | Share-based payments expense computed for the executive officers and the members of the Board of Directors who are employees of the Group as described in Note 25 paragraph E to the Consolidated Financial Statements and based on the principles of IFRS 2 “Share-based payments” described in Note 1 paragraph E to the Consolidated Financial Statements. |
The compensation allocated to members of the Board of Directors for directors’ fees totaled €0.96 million in 2010 (€0.97 million in 2009 and €0.83 million in 2008).
F-66
A. TOTAL SHARE SUBSCRIPTION OPTION PLANS | | | | | | | | | | | | | | | | | | | | | | | | | | | | | | | | | | | | | | | | | | | | | | | | | | | | | | | | | | | | | | | | | | | | | | | | | | | Weighted
| | | | | | | | | | | | | | | | | | | | | | | | | | | | | | | | average
| | | | | 2003
| | | 2004
| | | 2005
| | | 2006
| | | 2007
| | | 2008
| | | 2009
| | | 2010
| | | | | | exercise
| | | | | Plan | | | Plan | | | Plan | | | Plan | | | Plan | | | Plan | | | Plan | | | Plan | | | Total | | | price | | | | | | | | | | | | | | | | | | | | | | | | | | | | | | | | | | | | | | | | | | | | | | | | | Date of the shareholders’ meeting | | | 05/17/2001 | | | | 05/14/2004 | | | | 05/14/2004 | | | | 05/14/2004 | | | | 05/11/2007 | | | | 05/11/2007 | | | | 05/11/2007 | | | | 05/21/2010 | | | | | | | | | | | | | | | | | | | | | | | | | | | | | | | | | | | | | | | | | | | | | | | | | | | | Grant Date(a) | | | 07/16/2003 | | | | 07/20/2004 | | | | 07/19/2005 | | | | 07/18/2006 | | | | 07/17/2007 | | | | 10/09/2008 | | | | 09/15/2009 | | | | 09/14/2010 | | | | | | | | | | | | | | | | | | | | | | | | | | | | | | | | | | | | | | | | | | | | | | | | | | | | Exercise price until May 23, 2006 included(b) | | | 33.30 | | | | 39.85 | | | | 49.73 | | | | — | | | | — | | | | — | | | | — | | | | — | | | | | | | | | | | | | | | | | | | | | | | | | | | | | | | | | | | | | | | | | | | | | | | | | | | | Exercise price since May 24, 2006(b) | | | 32.84 | | | | 39.30 | | | | 49.04 | | | | 50.60 | | | | 60.10 | | | | 42.90 | | | | 39.90 | | | | 38.20 | | | | | | | | | | | | | | | | | | | | | | | | | | | | | | | | | | | | | | | | | | | | | | | | | | | | Expiry date | | | 07/16/2011 | | | | 07/20/2012 | | | | 07/19/2013 | | | | 07/18/2014 | | | | 07/17/2015 | | | | 10/09/2016 | | | | 09/15/2017 | | | | 09/14/2018 | | | | | | | | | | | | | | | | | | | | | | | | | | | | | | | | | | | | | | | | | | | | | | | | | | | | | | | | Number of options(c) | | | | | | | | | | | | | | | | | | | | | | | | | | | | | | | | | | | | | | | | | | | | | | | | | | | | | | | | | | | | | | | | | | | | | | | | | | | | | | | | | | | Outstanding as of January 1, 2008 | | | 8,368,378 | | | | 13,197,236 | | | | 6,243,438 | | | | 5,711,060 | | | | 5,920,105 | | | | | | | | | | | | | | | | 39,440,217 | | | | 44.23 | | | | | | | | | | | | | | | | | | | | | | | | | | | | | | | | | | | | | | | | | | | | | Awarded | | | — | | | | — | | | | — | | | | — | | | | — | | | | 4,449,810 | | | | | | | | | | | | 4,449,810 | | | | 42.90 | | | | | | | | | | | | | | | | | | | | | | | | | | | | | | | | | | | | | | | | | | | | | Canceled | | | (25,184 | ) | | | (118,140 | ) | | | (34,032 | ) | | | (53,304 | ) | | | (34,660 | ) | | | (6,000 | ) | | | | | | | | | | | (271,320 | ) | | | 44.88 | | | | | | | | | | | | | | | | | | | | | | | | | | | | | | | | | | | | | | | | | | | | | Exercised | | | (841,846 | ) | | | (311,919 | ) | | | (17,702 | ) | | | (6,700 | ) | | | — | | | | — | | | | | | | | | | | | (1,178,167 | ) | | | 34.89 | | | | | | | | | | | | | | | | | | | | | | | | | | | | | | | | | | | | | | | | | | | | Outstanding as of January 1, 2009 | | | 7,501,348 | | | | 12,767,177 | | | | 6,191,704 | | | | 5,651,056 | | | | 5,885,445 | | | | 4,443,810 | | | | | | | | | | | | 42,440,540 | | | | 44.35 | | | | | | | | | | | | | | | | | | | | | | | | | | | | | | | | | | | | | | | | | | | | | Awarded | | | — | | | | — | | | | — | | | | — | | | | — | | | | — | | | | 4,387,620 | | | | | | | | 4,387,620 | | | | 39.90 | | | | | | | | | | | | | | | | | | | | | | | | | | | | | | | | | | | | | | | | | | | | | Canceled | | | (8,020 | ) | | | (18,387 | ) | | | (6,264 | ) | | | (5,370 | ) | | | (13,780 | ) | | | (2,180 | ) | | | (10,610 | ) | | | | | | | (64,611 | ) | | | 45.04 | | | | | | | | | | | | | | | | | | | | | | | | | | | | | | | | | | | | | | | | | | | | | Exercised | | | (681,699 | ) | | | (253,081 | ) | | | — | | | | — | | | | — | | | | — | | | | — | | | | | | | | (934,780 | ) | | | 34.59 | | | | | | | | | | | | | | | | | | | | | | | | | | | | | | | | | | | | | | | | | | | | Outstanding as of January 1, 2010 | | | 6,811,629 | | | | 12,495,709 | | | | 6,185,440 | | | | 5,645,686 | | | | 5,871,665 | | | | 4,441,630 | | | | 4,377,010 | | | | | | | | 45,828,769 | | | | 44.12 | | | | | | | | | | | | | | | | | | | | | | | | | | | | | | | | | | | | | | | | | | | | | Awarded | | | — | | | | — | | | | — | | | | — | | | | — | | | | — | | | | — | | | | 4,788,420 | | | | 4,788,420 | | | | 38.20 | | | | | | | | | | | | | | | | | | | | | | | | | | | | | | | | | | | | | | | | | | | | Canceled(d) | | | (1,420 | ) | | | (15,660 | ) | | | (6,584 | ) | | | (4,800 | ) | | | (5,220 | ) | | | (92,472 | ) | | | (4,040 | ) | | | (1,120 | ) | | | (131,316 | ) | | | 43.50 | | | | | | | | | | | | | | | | | | | | | | | | | | | | | | | | | | | | | | | | | | | | | Exercised | | | (1,075,765 | ) | | | (141,202 | ) | | | — | | | | — | | | | — | | | | — | | | | (1,080 | ) | | | — | | | | (1,218,047 | ) | | | 33.60 | | | | | | | | | | | | | | | | | | | | | | | | | | | | | | | | | | | | | | | | | | | | Outstanding as of December 31, 2010 | | | 5,734,444 | | | | 12,338,847 | | | | 6,178,856 | | | | 5,640,886 | | | | 5,866,445 | | | | 4,349,158 | | | | 4,371,890 | | | | 4,787,300 | | | | 49,267,826 | | | | 43.80 | | | | | |
| | | | (a) | | The grant date is the date of the Board meeting awarding the share subscription options, except for the grant of October 9, 2008, decided by the Board on September 9, 2008. | | (b) | | Exercise price in euro. The exercise prices of TOTAL subscription shares of the plans in force at that date were multiplied by 0.25 to take into account thefour-for-one stock split on May 18, 2006. Moreover, following the spin-off of Arkema, the exercise prices of TOTAL subscription shares of these plans were multiplied by an adjustment factor equal to 0.986147 effective as of May 24, 2006. | | (c) | | The number of options awarded, outstanding, canceled or exercised before May 23, 2006 included, was multiplied by four to take into account thefour-for-one stock split approved by the shareholders’ meeting on May 12, 2006. | | (d) | | Out of 92,472 options awarded under the 2008 Plan that were canceled, 88,532 options were canceled due to the performance condition. The acquisition rate applicable to the subscription options that were subject to the performance condition of the 2008 Plan was 60%. |
Options are exercisable, subject to a continued employment condition, after a2-year period from the date of the Board meeting awarding the options and expire eight years after this date. The underlying shares may not be transferred during four years from the date of grant. For the 2007, 2008, 2009 and 2010 Plans, the four-year transfer restriction period does not apply to employees of non-French subsidiaries as of the date of the grant, who may transfer the underlying shares after a two-year period from the date of the grant. The continued employment condition states that the termination of the employment contract will result in the employee losing the right to exercise the options. For the 2010 Plan, the Board of Directors decided that: | | | • | For each grantee of up to 3,000 options, other than the Chairman and Chief Executive Officer, the options will be finally granted to their beneficiary. | | • | For each grantee of more than 3,000 options and less or equal to 50,000 options (other than the Chairman and Chief Executive Officer): |
| | | | • | The first 3,000 options and two-thirds above the first 3,000 options will be finally granted to their beneficiary; | | • | The outstanding options, that is one-third of the options above the first 3,000 options, will be finally granted provided that the performance condition described below is fulfilled. |
F-67
| | | • | For each grantee of more than 50,000 options, other than the Chairman and Chief Executive Officer: |
| | | | • | The first 3,000 options, two-thirds of the options above the first 3,000 options and below the first 50,000 options, and one-third of the options above the first 50,000 options, will be finally granted to their beneficiary; | | • | The outstanding options, that is one-third of the options above the first 3,000 options and below the first 50,000 options and two-thirds of the options above the first 50,000 options, will be finally granted provided that the performance condition is fulfilled. |
The performance condition states that the number of options finally granted is based on the average of the Return On Equity (ROE) of the Group. The average ROE is calculated by the Group based on TOTAL’s consolidated balance sheet and statement of income for fiscal years 2010 and 2011. The acquisition rate: | | | • | is equal to zero if the average ROE is less than or equal to 7%; | | • | varies on straight-line basis between 0% and 100% if the average ROE is more than 7% and less than 18%; and | | • | is equal to 100% if the average ROE is more than or equal to 18%. |
In addition, as part of the 2010 plan, the Board of Directors decided that the number of share subscription options finally awarded to the Chairman and Chief Executive Officer will be subject to two performance conditions: | | | • | For 50% of the share subscription options granted, the performance condition states that the number of options finally granted is based on the average ROE of the Group. The average ROE is calculated by the Group based on TOTAL’s consolidated balance sheet and statement of income for fiscal years 2010 and 2011. The acquisition rate is equal to zero if the average ROE is less than or equal to 7%; varies on a straight-line basis between 0% and 100% if the average ROE is more than 7% and less than 18%; and is equal to 100% if the average ROE is more than or equal to 18%. | | • | For 50% of the share subscription options granted, the performance condition states that the number of options finally granted is based on the average of the Return On Average Capital Employed (ROACE) of the Group. The average ROACE is calculated by the Group based on TOTAL’s consolidated balance sheet and statement of income for fiscal years 2010 and 2011. The acquisition rate is equal to zero if the average ROACE is less than or equal to 6%; varies on a straight-line basis between 0% and 100% if the average ROACE is more than 6% and less than 15%; and is equal to 100% if the average ROACE is more than or equal to 15%. |
For the 2009 Plan, the Board of Directors decided that for each beneficiary, other than the Chief Executive Officer, of more than 25,000 options, one third of the options granted in excess of this number will be finally granted subject to a performance condition. This condition states that the final number of options finally granted is based on the average ROE of the Group as published by TOTAL. The average ROE is calculated based on the Group’s consolidated balance sheet and statement of income for fiscal years 2009 and 2010. The acquisition rate: | | | • | is equal to zero if the average ROE is less than or equal to 7%; | | • | varies on straight-line basis between 0% and 100% if the average ROE is more than 7% and less than 18%; and | | • | is equal to 100% if the average ROE is more than or equal to 18%. |
In addition, the Board of Directors decided that, for the Chief Executive Officer, the number of share subscription options finally granted will be subject to two performance conditions: | | | • | For 50% of the share subscription options granted, the performance condition states that the number of options finally granted is based on the average ROE of the Group as published by TOTAL. The average ROE is calculated based on the Group’s consolidated balance sheet and statement of income for fiscal years 2009 and 2010. The acquisition rate is equal to zero if the average ROE is less than or equal to 7%; varies on a straight-line basis between 0% and 100% if the average ROE is more than 7% and less than 18%; and is equal to 100% if the average ROE is more than or equal to 18%. | | • | For 50% of the share subscription options granted, the performance condition states that the number of options finally granted is based on the average ROACE of the Group as published by TOTAL. The average ROACE is calculated based on the Group’s consolidated balance sheet and statement of income for fiscal years 2009 and 2010. The acquisition rate is equal to zero if the average ROACE is less than or equal to 6%; varies on a straight-line basis between 0% and 100% if the average ROACE is more than 6% and less than 15%; and is equal to 100% if the average ROACE is more than or equal to 15%. |
F-68
For the 2008 Plan, the Board of Directors decided that for each beneficiary of more than 25,000 options, one third of the options in excess of this number will be finally granted subject to a performance condition. This condition states that the number of subscription options finally granted is based on the ROE of the Group. The ROE is calculated based on the consolidated accounts published by TOTAL for the fiscal year preceding the final grant. The acquisition rate: | | | • | is equal to zero if the ROE is less than or equal to 10%; | | • | varies on a straight-line basis between 0% and 80% if the ROE is more than 10% and less than 18%; | | • | varies on a straight-line basis between 80% and 100% if the ROE is more than or equal to 18% and less than 30%; and | | • | is equal to 100% if the ROE is more than or equal to 30%. |
Due to the application of the performance condition, the acquisition rate was 60% for the 2008 plan. As a consequence, 88,532 options were canceled. | | | B. | TOTAL SHARE PURCHASE OPTION PLANS |
| | | | | | | | | | | | | | | | | | | | | | | | | | | | | | | | | | | | | Weighted
| | | | | | | | | | | | | | | | | average
| | | | | 2000 Plan(a) | | | 2001 Plan(b) | | | 2002 Plan(c) | | | Total | | | exercise price | | Date of the shareholders’ meeting | | | 05/21/1997 | | | | 05/17/2001 | | | | 05/17/2001 | | | | | | | | | | Grant date(d) | | | 07/11/2000 | | | | 07/10/2001 | | | | 07/09/2002 | | | | | | | | | | Exercise price until May 23, 2006 included(e) | | | 40.68 | | | | 42.05 | | | | 39.58 | | | | | | | | | | Exercise price since May 24, 2006(e) | | | 40.11 | | | | 41.47 | | | | 39.03 | | | | | | | | | | Expiry date | | | 07/11/2008 | | | | 07/10/2009 | | | | 07/09/2010 | | | | | | | | | | | | | | | | | | | | | | | | | | | | | | | | Number of options(f) | | | | | | | | | | | | | | | | | | | | | Outstanding as of January 1, 2008 | | | 3,142,188 | | | | 5,150,258 | | | | 7,063,183 | | | | 15,355,629 | | | | 40.07 | | | Awarded | | | — | | | | — | | | | — | | | | — | | | | — | | | Canceled | | | (480,475 | ) | | | (3,652 | ) | | | (13,392 | ) | | | (497,519 | ) | | | 40.09 | | | Exercised | | | (2,661,713 | ) | | | (455,180 | ) | | | (598,934 | ) | | | (3,715,827 | ) | | | 40.10 | | Outstanding as of January 1, 2009 | | | — | | | | 4,691,426 | | | | 6,450,857 | | | | 11,142,283 | | | | 40.06 | | | Awarded | | | | | | | — | | | | — | | | | — | | | | — | | | Canceled | | | | | | | (4,650,446 | ) | | | (7,920 | ) | | | (4,658,366 | ) | | | 41.47 | | | Exercised | | | | | | | (40,980 | ) | | | (507,676 | ) | | | (548,656 | ) | | | 39.21 | | Outstanding as of January 1, 2010 | | | | | | | — | | | | 5,935,261 | | | | 5,935,261 | | | | 39.03 | | | Awarded | | | | | | | | | | | — | | | | — | | | | — | | Canceled(g) | | | | | | | | | | | (4,671,989 | ) | | | (4,671,989 | ) | | | 39.03 | | | Exercised | | | | | | | | | | | (1,263,272 | ) | | | (1,263,272 | ) | | | 39.03 | | Outstanding as of December 31, 2010 | | | | | | | | | | | — | | | | — | | | | — | | | | | | | | | | | | | | | | | | | | | | | |
| | | | (a) | | Options were exercisable, subject to a continued employment condition, after a4-year vesting period from the date of the Board meeting awarding the options and expired eight years after this date. The underlying shares may not be transferred during the5-year period from the date of the grant. This plan expired on July 11, 2008. | | (b) | | Options were exercisable, subject to a continued employment condition, after a 3.5-year vesting period from the date of the Board meeting awarding the options and expired eight years after this date. The underlying shares may not be transferred during the4-year period from the date of the grant. This plan expired on July 10, 2009. | | (c) | | Options were exercisable, subject to a continued employment condition, after a2-year vesting period from the date of the Board meeting awarding the options and expired eight years after this date. The underlying shares may not be transferred during the4-year period from the date of the grant. This plan expired on July 9, 2010. | | (d) | | The grant date is the date of the Board meeting awarding the options. | | (e) | | Exercise price in euro. The exercise prices of TOTAL share purchase options of the plans at that date were multiplied by 0.25 to take into account thefour-for-one stock split on May 18, 2006. Moreover, following the spin-off of Arkema, the exercise prices of TOTAL share purchase options of these plans were multiplied by an adjustment factor equal to 0.986147 effective as of May 24, 2006. | | (f) | | The number of options awarded, outstanding, canceled or exercised before May 23, 2006 included, was multiplied by four to take into account thefour-for-one stock split approved by the shareholders’ meeting on May 12, 2006. | | (g) | | Out of the 4,671,989 options canceled in 2010, 4,671,145 options that were not exercised expired due to the expiry of the 2002 purchase option Plan on July 9, 2010. |
F-69
C. EXCHANGE GUARANTEE GRANTED TO THE HOLDERS OF ELF AQUITAINE SHARE SUBSCRIPTION OPTIONS Pursuant to the public exchange offer for Elf Aquitaine shares which was made in 1999, the Group made a commitment to guarantee the holders of Elf Aquitaine share subscription options, at the end of the period referred to in Article 163 bis C of the French Tax Code (CGI), and until the end of the period for the exercise of the options, the possibility to exchange their future Elf Aquitaine shares for TOTAL shares, on the basis of the exchange ratio of the offer (nineteen TOTAL shares for thirteen Elf Aquitaine shares). In order to take into account the spin-off of S.D.A. (Société de Développement Arkema) by Elf Aquitaine, the spin-off of Arkema by TOTAL S.A. and thefour-for-one TOTAL stock split, the Board of Directors of TOTAL S.A., in accordance with the terms of the share exchange undertaking, approved on March 14, 2006 to adjust the exchange ratio described above (see pages 24 and 25 of the “Prospectus for the purpose of listing Arkema shares on Euronext Paris in connection with the allocation of Arkema shares to TOTAL S.A. shareholders”). Following the approval by Elf Aquitaine shareholders’ meeting on May 10, 2006 of the spin-off of S.D.A. by Elf Aquitaine, the approval by TOTAL S.A. shareholders’ meeting on May 12, 2006 of the spin-off of Arkema by TOTAL S.A. and thefour-for-one TOTAL stock split, the exchange ratio was adjusted to six TOTAL shares for one Elf Aquitaine share on May 22, 2006. This exchange guarantee expired on September 12, 2009, due to the expiry of the Elf Aquitaine share subscription option plan No. 2 of 1999. Subsequently, no Elf Aquitaine shares are covered by the exchange guarantee. D. TOTAL RESTRICTED SHARE GRANTS | | | | | | | | | | | | | | | | | | | | | | | | | | | | | | | | | 2005 Plan | | | 2006 Plan | | | 2007 Plan | | | 2008 Plan | | | 2009 Plan | | | 2010 Plan | | | Total | | Date of the shareholders’ meeting | | | 05/17/2005 | | | | 05/17/2005 | | | | 05/17/2005 | | | | 05/16/2008 | | | | 05/16/2008 | | | | 05/16/2008 | | | | | | Grant date(a) | | | 07/19/2005 | | | | 07/18/2006 | | | | 07/17/2007 | | | | 10/09/2008 | | | | 09/15/2009 | | | | 09/14/2010 | | | | | | | | | | | | | | | | | | | | | | | | | | | | | | | | | | | | Final grant date (end of the vesting period) | | | 07/20/2007 | | | | 07/19/2008 | | | | 07/18/2009 | | | | 10/10/2010 | | | | 09/16/2011 | | | | 09/15/2012 | | | | | | Transfer possible from | | | 07/20/2009 | | | | 07/19/2010 | | | | 07/18/2011 | | | | 10/10/2012 | | | | 09/16/2013 | | | | 09/15/2014 | | | | | | | | | | | | | | | | | | | | | | | | | | | | | | | | | | | | Number of restricted shares | | | | | | | | | | | | | | | | | | | | | | | | | | | | | Outstanding as of January 1, 2008 | | | — | | | | 2,263,956 | | | | 2,363,057 | | | | | | | | | | | | | | | | 4,627,013 | | | Awarded | | | — | | | | — | | | | — | | | | 2,791,968 | | | | | | | | | | | | 2,791,968 | | | Canceled | | | 2,840 | | | | (43,822 | ) | | | (29,504 | ) | | | (19,220 | ) | | | | | | | | | | | (89,706 | ) | Finally granted(b)(c) | | | (2,840 | ) | | | (2,220,134 | ) | | | (336 | ) | | | — | | | | | | | | | | | | (2,223,310 | ) | Outstanding as of January 1, 2009 | | | — | | | | — | | | | 2,333,217 | | | | 2,772,748 | | | | | | | | | | | | 5,105,965 | | | Awarded | | | — | | | | — | | | | — | | | | — | | | | 2,972,018 | | | | | | | | 2,972,018 | | | Canceled | | | 1,928 | | | | 2,922 | | | | (12,418 | ) | | | (9,672 | ) | | | (5,982 | ) | | | | | | | (23,222 | ) | Finally granted(b)(c) | | | (1,928 | ) | | | (2,922 | ) | | | (2,320,799 | ) | | | (600 | ) | | | — | | | | | | | | (2,326,249 | ) | Outstanding as of January 1, 2010 | | | — | | | | — | | | | — | | | | 2,762,476 | | | | 2,966,036 | | | | | | | | 5,728,512 | | | Awarded | | | — | | | | — | | | | — | | | | — | | | | — | | | | 3,010,011 | | | | 3,010,011 | | Canceled(d) | | | 1,024 | | | | 3,034 | | | | 552 | | | | (1,113,462 | ) | | | (9,796 | ) | | | (8,738 | ) | | | (1,127,386 | ) | Finally granted(b)(c) | | | (1,024 | ) | | | (3,034 | ) | | | (552 | ) | | | (1,649,014 | ) | | | (1,904 | ) | | | (636 | ) | | | (1,656,164 | ) | Outstanding as of December 31, 2010 | | | — | | | | — | | | | — | | | | — | | | | 2,954,336 | | | | 3,000,637 | | | | 5,954,973 | | | | | | | | | | | | | | | | | | | | | | | | | | | | | | | |
| | | | (a) | | The grant date is the date of the Board of Directors meeting that awarded the shares, except for the shares awarded by the Board of Directors at their meeting of September 9, 2008, and granted on October 9, 2008. | | (b) | | Restricted shares finally granted following the death of their beneficiaries (2007 Plan for fiscal year 2008, 2008 Plan for fiscal year 2009, 2009 Plan for fiscal year 2010). | | (c) | | Including restricted shares finally granted for which the entitlement right had been canceled erroneously. | | (d) | | Out of the 1,113,462 canceled rights to the grant share under the 2008 Plan, 1,094,914 entitlement rights were canceled due to the performance condition. The acquisition rate for the 2008 Plan was 60%. |
F-70
The restricted shares, which are bought back by the Company on the market, are finally granted to their beneficiaries after a2-year vesting period from the date of the grant. The final grant is subject to a continued employment condition and a performance condition. Moreover, the transfer of the restricted shares finally granted will not be permitted until the end of a2-year mandatory holding period from the date of the final grant. The continued employment condition states that the termination of the employment contract during the vesting period will also terminate the grantee’s right to a restricted share grant. For the 2010 Plan, the Board of Directors decided that, for each beneficiary of more than 100 shares, half of the shares in excess of this number will be finally granted subject to a performance condition. This condition is based on the average ROE calculated by the Group based on TOTAL’s consolidated balance sheet and statement of income for fiscal years 2010 and 2011. The acquisition rate: | | | • | is equal to zero if the average ROE is less than or equal to 7%; | | • | varies on a straight-line basis between 0% and 100% if the average ROE is greater than 7% and less than 18%; and | | • | is equal to 100% if the average ROE is greater than or equal to 18%. |
For the 2009 Plan, the Board of Directors decided that, for each beneficiary of more than 100 shares, half of the shares in excess of this number will be finally granted subject to a performance condition. This condition states that the number of shares finally granted is based on the average ROE as published by the Group and calculated based on the Group’s consolidated balance sheet and statement of income for fiscal years 2009 and 2010. The acquisition rate: | | | • | is equal to zero if the average ROE is less than or equal to 7%; | | • | varies on a straight-line basis between 0% and 100% if the average ROE is greater than 7% and less than 18%; and | | • | is equal to 100% if the average ROE is greater than or equal to 18%. |
For the 2008 Plan, the Board of Directors decided that, for each beneficiary, the shares will be finally granted subject to a performance condition. This performance condition states that the number of restricted shares finally granted is based on the ROE of the Group. The ROE is calculated based on the consolidated accounts published by TOTAL for the fiscal year preceding the final grant. This acquisition rate: | | | • | is equal to zero if the ROE is less than or equal to 10%; | | • | varies on a straight-line basis between 0% and 80% if the ROE is greater than 10% and less than 18%; | | • | varies on a straight-line basis between 80% and 100% if the ROE is greater than or equal to 18% and less than 30%; and | | • | is equal to 100% if the ROE is greater than or equal to 30%. |
Due to the application of the performance condition, the acquisition rate was 60% for the 2008 Plan. As a consequence, entitlement rights to 1,094,914 shares were canceled. | | | E. | GLOBAL FREE TOTAL SHARE PLAN |
The Board of Directors approved at its meeting on May 21, 2010 the implementation and conditions of a global free share plan intended for the Group employees, that is more than 100,000 employees in 124 countries. On June 30, 2010, entitlement rights to 25 free shares were granted to every employee. The final grant is subject to a continued employment condition during the plan’s vesting period. The shares are not subject to any performance condition. 1,508,850 shares were awarded to employees from countries with a 2+2 scheme(2-year vesting period followed by2-year of mandatory holding period) and 1,070,650 shares were awarded to employees in countries with a 4+0 scheme(4-year vesting period and no mandatory holding period), representing a total of 2,579,500 shares. Following the vesting period, the shares awarded will be new shares.
F-71
| | | | | | | | | | | | | | | | | 2010 Plan
| | | 2010 Plan
| | | | | | | | (2+2) | | | (4+0) | | | Total | | Date of the shareholders’ meeting | | | 05/16/2008 | | | | 05/16/2008 | | | | | | Grant date(a) | | | 06/30/2010 | | | | 06/30/2010 | | | | | | Final grant date (end of the vesting period) | | | 07/01/2012 | | | | 07/01/2014 | | | | | | Transfer possible from | | | 07/01/2014 | | | | 07/01/2014 | | | | | | | | | | | | | | | | | | | | Number of free shares | | | | | | | | | | | | | Outstanding as of January 1, 2008 | | | | | | | | | | | | | | Awarded | | | | | | | | | | | | | | Canceled | | | | | | | | | | | | | | Finally granted | | | | | | | | | | | | | Outstanding as of January 1, 2009 | | | | | | | | | | | | | | Awarded | | | | | | | | | | | | | | Canceled | | | | | | | | | | | | | | Finally granted | | | | | | | | | | | | | Outstanding as of January 1, 2010 | | | | | | | | | | | | | | Awarded | | | 1,508,850 | | | | 1,070,650 | | | | 2,579,500 | | | Canceled | | | (125 | ) | | | (75 | ) | | | (200 | ) | Finally granted(b) | | | (75 | ) | | | — | | | | (75 | ) | Outstanding as of December 31, 2010 | | | 1,508,650 | | | | 1,070,575 | | | | 2,579,225 | | | | | | | | | | | | | | | |
| | | | (a) | | The June 30, 2010, grant was decided by the Board of Directors on May 21, 2010. | | (b) | | Final grant following the death or disability of the beneficiary of the shares. |
| | | F. | SHARE-BASED PAYMENT EXPENSE |
Share-based payment expense before tax for the year 2010 amounts to €140 million and can be broken down as follows: | | | • | €31 million for TOTAL share subscription plans; and | | • | €109 million for TOTAL restricted shares plans. |
Share-based payment expense before tax for the year 2009 amounts to €106 million and can be broken down as follows: | | | • | €38 million for TOTAL share subscription plans; and | | • | €68 million for TOTAL restricted shares plans. |
Share-based payment expense before tax for the year 2008 amounted to €154 million and can be broken down as follows: | | | • | €61 million for TOTAL share subscription plans; | | • | €105 million for TOTAL restricted shares plans; and | | • | €(12) million for the adjustment to the expense booked in 2007 related to TOTAL capital increase reserved for employees (see Note 17 to the Consolidated Financial Statements). |
The fair value of the options granted in 2010, 2009 and 2008 has been measured according to the Black-Scholes method and based on the following assumptions: | | | | | | | | | | | | | | | For the year ended December 31, | | 2010 | | | 2009 | | | 2008 | | Risk free interest rate (%)(a) | | | 2.1 | | | | 2.9 | | | | 4.3 | | Expected dividends (%)(b) | | | 5.9 | | | | 4.8 | | | | 8.4 | | Expected volatility (%)(c) | | | 25.0 | | | | 31.0 | | | | 32.7 | | | Vesting period (years) | | | 2 | | | | 2 | | | | 2 | | | Exercise period (years) | | | 8 | | | | 8 | | | | 8 | | | Fair value of the granted options (€ per option) | | | 5.8 | | | | 8.4 | | | | 5.0 | | | | | | | | | | | | | | | |
| | | | (a) | | Zero coupon Euro swap rate at 6 years. |
| | | | (b) | | The expected dividends are based on the price of TOTAL share derivatives traded on the markets. | | (c) | | The expected volatility is based on the implied volatility of TOTAL share options and of share indices options traded on the markets. |
At the shareholders’ meeting held on May 21, 2010, the shareholders delegated to the Board of Directors the authority to increase the share capital of the Company in one or more transactions and within a maximum period of 26 months from the date of the meeting, by an amount not exceeding 1.5% of the share capital outstanding on the date of the meeting of the Board of Directors at which a decision to proceed with an issuance is made reserving subscriptions for such issuance to the Group employees participating in a company savings plan. It is being specified that the amount of any such capital increase reserved for Group employees was counted against the F-72
aggregate maximum nominal amount of share capital increases authorized by the shareholders’ meeting held on May 11, 200721, 2010 for issuing new ordinary shares or other securities granting immediate or future access to the Company’s share capital with preferential subscription rights (€4(€2.5 billion in nominal value). Pursuant to this delegation of authorization, the Board of Directors, during its November 6, 2007October 28, 2010 meeting, implemented a first capital increase reserved for employees within the limit of 12 million shares, par value€2.50, at a price of€44.40 per share, with dividend rights as of the January 1, 2007. The2010 and delegated all power to the Chairman and CEO to determine the opening and closing of subscription period ran from March 10, 2008, to March 28, 2008. 4,870,386 shares were subscribed byand the subscription price. | | | | | | | | | | | | | | | For the year ended December 31, (M€) | | 2010 | | | 2009 | | | 2008 | | Personnel expenses | | | | | | | | | | | | | | Wages and salaries (including social charges) | | | 6,246 | | | | 6,177 | | | | 6,014 | | Group employees | | | | | | | | | | | | | France | | | | | | | | | | | | | • Management | | | 10,852 | | | | 10,906 | | | | 10,688 | | • Other | | | 24,317 | | | | 25,501 | | | | 26,413 | | International | | | | | | | | | | | | | • Management | | | 15,146 | | | | 15,243 | | | | 14,709 | | • Other | | | 42,540 | | | | 44,737 | | | | 45,149 | | | | | | | | | | | | | | | | Total | | | 92,855 | | | | 96,387 | | | | 96,959 | | | | | | | | | | | | | | | |
The number of employees pursuant toincludes only employees of fully consolidated subsidiaries. The decrease in the capital increase. Share cancellation
Pursuant to the authorization granted by the shareholders’ meeting held on May 11, 2007 authorizing reductionnumber of capital by cancellation of shares held by the Company within the limit of 10% of the outstanding capital every 24 months, the Board of Directors decided on July 30, 2009 to cancel 24,800,000 shares acquired in 2008 at an average price of€49.28 per share.
Treasury shares (TOTAL Shares held by TOTAL S.A.)
As ofemployees between December 31, 2009 TOTAL S.A. held 15,075,922 of its own shares, representing 0.64% of its share capital, detailed as follows:
6,017,499 shares allocated to covering TOTAL share purchase option plans for Group employees and executive officers;
5,799,400 shares allocated to TOTAL restricted shares plans for Group employees; and
3,259,023 shares intended to be allocated to new TOTAL share purchase option plans or to new restricted shares plans.
These shares are deducted from the consolidated shareholders’ equity.
As of December 31, 2008, TOTAL S.A. held 42,750,827 of its own shares, representing 1.80% of its share capital, detailed as follows:
12,627,522 shares allocated to covering TOTAL share purchase option plans for Group employees;
5,323,305 shares allocated to TOTAL restricted shares plans for Group employees; and
24,800,000 shares purchased for cancellation between January and October 2008 pursuant to the authorization granted2010 is mainly explained by the shareholders’ meetings held on May 11, 2007 and May 16, 2008. The Board of Directors on July 30, 2009 decided to cancel these 24,800,000 shares acquired at an average price of€49.28 per share.
These shares were deducted from the consolidated shareholders’ equity.
As of December 31, 2007, TOTAL S.A. held 51,089,964 of its own shares, representing 2.13% of its share capital, detailed as follows:
16,343,349 shares allocated to covering TOTAL share purchase option plans for Group employees;
4,746,615 shares allocated to TOTAL restricted share plans for Group employees; and
30,000,000 shares purchased for cancellation between February and December 2007 pursuant to the authorization granted by the shareholders’ meetings held on May 12, 2006 and May 11, 2007. The Board of Directors on July 31, 2008 decided to cancel these 30,000,000 shares acquired at an average price of€54.69 per share.
These shares were deducted from the consolidated shareholders’ equity.
TOTAL Shares held by Group subsidiaries
As of December 31, 2009, 2008 and 2007, TOTAL S.A. held indirectly through its subsidiaries 100,331,268 of its own shares, representing 4.27% of its share capital as of December 31, 2009, 4.23% of its share capital as of December 31, 2008 and 4.19% of its share capital as of December 31, 2007 detailed as follows:
2,023,672 shares held by a consolidated subsidiary, Total Nucléaire, 100% indirectly controlled by TOTAL S.A.; and
98,307,596 shares held by subsidiaries of Elf Aquitaine (Financière Valorgest, Sogapar and Fingestval).
These shares are deducted from the consolidated shareholders’ equity.
Dividend
TOTAL S.A. paid on May 22, 2009 the balancesale of the dividend of€1.14 per share for the 2008 fiscal year (the ex-dividend date was May 19, 2009). In addition, TOTAL S.A. paid on November 18, 2009 an interim dividend of€1.14 per share for the fiscal year 2009 (the ex-dividend date was November 13, 2009).
A resolution will be submitted at the shareholders’ meeting on May 21, 2010 to pay a dividend of€2.28 per share for the 2009 fiscal year, i.e. a balance of€1.14 per share to be distributed after deducting the interim dividend of€1.14 already paid.
Paid-in surplus
In accordance with French law, the paid-in surplus corresponds to share premiums of the parent company which can be capitalized or used to offset losses if the legal reserve has reached its minimum required level. The amount of the paid-in surplus may also be distributed subject to taxation unless the unrestricted reserves of the parent company are distributed prior to this item.
As of December 31, 2009, paid-in surplus amounted to€27,171 million (€28,284 million as of December 31, 2008 and€29,598 million as of December 31, 2007).
Reserves
Under French law, 5% of net income must be transferred to the legal reserve until the legal reserve reaches 10% of the nominal value of the share capital. This reserve cannot be distributed to the shareholders other than upon liquidation but can be used to offset losses.
If wholly distributed, the unrestricted reserves of the parent company would be taxed for an approximate amount of€514 million as of December 31, 2009.
Other comprehensive income
Detail of other comprehensive income showing items reclassified from equity to net income is presented in the table below:
| | | | | | | | | | | | | | | | | | | | For the year ended December 31,(€ million) | | 2009 | | | 2008 | | | 2007 | | Currency translation adjustment | | | | | (244 | ) | | | | | (722 | ) | | | | | (2,703 | ) | – Unrealized gain/(loss) of the period | | (243 | ) | | | | | (722 | ) | | | | | (2,703 | ) | | | | – Less gain/(loss) included in net income | | 1 | | | | | | — | | | | | | — | | | | | | | | | | | | Available for sale financial assets | | | | | 38 | | | | | | (254 | ) | | | | | 111 | | – Unrealized gain/(loss) of the period | | 38 | | | | | | (254 | ) | | | | | 111 | | | | | – Less gain/(loss) included in net income | | — | | | | | | — | | | | | | — | | | | | | | | | | | | Cash flow hedge | | | | | 128 | | | | | | — | | | | | | — | | – Unrealized gain/(loss) of the period | | 349 | | | | | | — | | | | | | — | | | | | – Less gain/(loss) included in net income | | 221 | | | | | | — | | | | | | — | | | | | | | | | | | | Share of other comprehensive income of equity affiliates, net amount | | | | | 234 | | | | | | 173 | | | | | | (406 | ) | | | | | | | | Other | | | | | (5 | ) | | | | | 1 | | | | | | (3 | ) | – Unrealized gain/(loss) of the period | | (5 | ) | | | | | 1 | | | | | | (3 | ) | | | | – Less gain/(loss) included in net income | | — | | | | | | — | | | | | | — | | | | | | | | | | | | Tax effect | | | | | (38 | ) | | | | | 30 | | | | | | (6 | ) | Total other comprehensive income, net amount | | | | | 113 | | | | | | (772 | ) | | | | | (3,007 | ) |
Tax effects relating to each component of other comprehensive income are as follows:
| | | | | | | | | | | | | | | | | | | | | | | | | | | For the year ended December 31, (€ million) | | 2009 | | | 2008 | | | 2007 | | | | | Pre-tax
amount | | | Tax
effect | | | Net
amount | | | Pre-tax
amount | | | Tax
effect | | Net
amount | | | Pre-tax
amount | | | Tax
effect | | | Net
amount | | Currency translation adjustment | | (244 | ) | | | | | (244 | ) | | (722 | ) | | | | (722 | ) | | (2,703 | ) | | | | | (2,703 | ) | Available for sale financial assets | | 38 | | | 4 | | | 42 | | | (254 | ) | | 30 | | (224 | ) | | 111 | | | (6 | ) | | 105 | | Cash flow hedge | | 128 | | | (42 | ) | | 86 | | | — | | | | | — | | | — | | | | | | — | | Share of other comprehensive income of equity affiliates, net amount | | 234 | | | | | | 234 | | | 173 | | | | | 173 | | | (406 | ) | | | | | (406 | ) | Other | | (5 | ) | | | | | (5 | ) | | 1 | | | | | 1 | | | (3 | ) | | | | | (3 | ) | Total other comprehensive income | | 151 | | | (38 | ) | | 113 | | | (802 | ) | | 30 | | (772 | ) | | (3,001 | ) | | (6 | ) | | (3,007 | ) |
18) EMPLOYEE BENEFITS OBLIGATIONS
Liabilities for employee benefits obligations consist of the following:
| | | | | | | | As of December 31,(€ million) | | 2009 | | 2008 | | 2007 | Pension benefits liabilities | | 1,236 | | 1,187 | | 1,721 | Other benefits liabilities | | 592 | | 608 | | 611 | Restructuring reserves (early retirement plans) | | 212 | | 216 | | 195 | Total | | 2,040 | | 2,011 | | 2,527 |
The Group’s main defined benefit pension plans are located in France, in the United Kingdom, in the United States, in Belgium and in Germany. Their main characteristics are the following:
The benefits are usually based on the final salary and seniority;
They are usually funded (pension fund or insurer); and
They are closed to new employees who benefit from defined contribution pension plans.
The pension benefits include also termination indemnities and early retirement benefits.
The other benefits are the employer contribution to post-employment medical care.
The fair value of the defined benefit obligation and plan assets in the Consolidated Financial Statements is detailed as follows:
| | | | | | | | | | | | | | | | | | | | | | Pension benefits | | | Other benefits | | | As of December 31,(€ million) | | 2009 | | | 2008 | | | 2007 | | | 2009 | | | 2008 | | | 2007 | | | | | | | | | Change in benefit obligation | | | | | | | | | | | | | | | | | | | Benefit obligation at beginning of year | | 7,405 | | | 8,129 | | | 8,742 | | | 544 | | | 583 | | | 648 | | Service cost | | 134 | | | 143 | | | 160 | | | 10 | | | 14 | | | 12 | | Interest cost | | 428 | | | 416 | | | 396 | | | 30 | | | 24 | | | 28 | | Curtailments | | (5 | ) | | (3 | ) | | (9 | ) | | (1 | ) | | — | | | — | | Settlements | | (3 | ) | | (5 | ) | | (20 | ) | | — | | | (4 | ) | | — | | Special termination benefits | | — | | | — | | | — | | | — | | | — | | | — | | Plan participants’ contributions | | 10 | | | 12 | | | 10 | | | — | | | — | | | — | | Benefits paid | | (484 | ) | | (463 | ) | | (448 | ) | | (33 | ) | | (37 | ) | | (40 | ) | Plan amendments | | 118 | | | 12 | | | (70 | ) | | (2 | ) | | (12 | ) | | (2 | ) | Actuarial losses (gains) | | 446 | | | (248 | ) | | (384 | ) | | — | | | (27 | ) | | (38 | ) | Foreign currency translation and other | | 120 | | | (588 | ) | | (248 | ) | | (1 | ) | | 3 | | | (25 | ) | Benefit obligation at year-end | | 8,169 | | | 7,405 | | | 8,129 | | | 547 | | | 544 | | | 583 | | | | | | | | | Change in fair value of plan assets | | | | | | | | | | | | | | | | | | | Fair value of plan assets at beginning of year | | (5,764 | ) | | (6,604 | ) | | (6,401 | ) | | — | | | — | | | — | | Expected return on plan assets | | (343 | ) | | (402 | ) | | (387 | ) | | — | | | — | | | — | | Actuarial losses (gains) | | (317 | ) | | 1,099 | | | 140 | | | — | | | — | | | — | | Settlements | | 2 | | | 2 | | | 8 | | | — | | | — | | | — | | Plan participants’ contributions | | (10 | ) | | (12 | ) | | (10 | ) | | — | | | — | | | — | | Employer contributions(a) | | (126 | ) | | (855 | ) | | (556 | ) | | — | | | — | | | — | | Benefits paid | | 396 | | | 375 | | | 349 | | | — | | | — | | | — | | Foreign currency translation and other | | (124 | ) | | 633 | | | 253 | | | — | | | — | | | — | | Fair value of plan assets at year-end | | (6,286 | ) | | (5,764 | ) | | (6,604 | ) | | — | | | — | | | — | | | | | | | | | Unfunded status | | 1,883 | | | 1,641 | | | 1,525 | | | 547 | | | 544 | | | 583 | | Unrecognized prior service cost | | (153 | ) | | (48 | ) | | (49 | ) | | 15 | | | 21 | | | 18 | | Unrecognized actuarial (losses) gains | | (1,045 | ) | | (953 | ) | | (160 | ) | | 30 | | | 43 | | | 10 | | Asset ceiling | | 9 | | | 5 | | | 5 | | | — | | | — | | | — | | Net recognized amount | | 694 | | | 645 | | | 1,321 | | | 592 | | | 608 | | | 611 | | Pension benefits and other benefits liabilities | | 1,236 | | | 1,187 | | | 1,721 | | | 592 | | | 608 | | | 611 | | Other non-current assets | | (542 | ) | | (542 | ) | | (400 | ) | | — | | | — | | | — | |
(a) | In 2008, the Group covered certain employee pension benefit plans through insurance companies for an amount of€757 million. |
As of December 31, 2009, the fair value of pension benefits and other pension benefits which are entirely or partially funded amounted to€7,206 million and the present value of the unfunded benefits amounted to€1,510 million (against€6,515 million and€1,434 million respectively as of December 31, 2008 and€7,175 million and€1,537 million respectively as of December 31, 2007).
The experience actuarial gains (losses) related to the defined benefit obligation and the fair value of plan assets are as follows:
| | | | | | | | | | For the year ended December 31,(€ million) | | 2009 | | 2008 | | | 2007 | | Experience actuarial gains (losses) related to the defined benefit obligation | | 108 | | (12 | ) | | (80 | ) | Experience actuarial gains (losses) related to the fair value of plan assets | | 317 | | (1,099 | ) | | (140 | ) |
| | | | | | | | | | | | | | | | | As of December 31, (€ million) | | 2009 | | | 2008 | | | 2007 | | | 2006 | | | 2005 | | Pension benefits | | | | | | | | | | | | | | | | Benefit obligation | | 8,169 | | | 7,405 | | | 8,129 | | | 8,742 | | | 9,647 | | Fair value of plan assets | | (6,286 | ) | | (5,764 | ) | | (6,604 | ) | | (6,401 | ) | | (6,274 | ) | Unfunded status | | 1,883 | | | 1,641 | | | 1,525 | | | 2,341 | | | 3,373 | | Other benefits | | | | | | | | | | | | | | | | Benefits obligation | | 547 | | | 544 | | | 583 | | | 648 | | | 774 | | Fair value of plan assets | | — | | | — | | | — | | | — | | | — | | Unfunded status | | 547 | | | 544 | | | 583 | | | 648 | | | 774 | |
The Group expects to contribute€152 million to its pension plans in 2010.
| | | | | Estimated future payments (€ million) | | Pension benefits | | Other benefits | 2010 | | 489 | | 35 | 2011 | | 468 | | 36 | 2012 | | 481 | | 36 | 2013 | | 472 | | 36 | 2014 | | 474 | | 37 | 2015-2019 | | 2,508 | | 195 |
| | | | | | | | | | | Asset allocation | | Pension benefits | | | As of December 31, | | 2009 | | | 2008 | | | 2007 | | Equity securities | | 31 | % | | 25 | % | | 36 | % | Debt securities | | 62 | % | | 56 | % | | 56 | % | Monetary | | 3 | % | | 16 | % | | 4 | % | Real estate | | 4 | % | | 3 | % | | 4 | % |
The Group’s assumptions of expected returns on assets are built up by asset class and by country based on long-term bond yields and risk premiums.
The discount rate retained corresponds to the rate of prime corporate bonds according to a benchmark per country of different market data on the closing date.
| | | | | | | | | | | | | | | | | | | | | Assumptions used to determine benefits obligations | | Pension benefits | | | | | Other benefits | | As of December 31, | | 2009 | | | 2008 | | | 2007 | | | | | 2009 | | | 2008 | | | 2007 | Discount rate (weighted average for all regions) | | 5.41 | % | | 5.93 | % | | 5.50 | % | | | | 5.60 | % | | 6.00 | % | | 5.50% | Of which Euro zone | | 5.12 | % | | 5.72 | % | | 5.15 | % | | | | 5.18 | % | | 5.74 | % | | 5.14% | Of which United States | | 6.00 | % | | 6.23 | % | | 6.00 | % | | | | 5.99 | % | | 6.21 | % | | 5.98% | Of which United Kingdom | | 5.50 | % | | 6.00 | % | | 5.75 | % | | | | — | | | 6.00 | % | | 5.75% | Average expected rate of salary increase | | 4.50 | % | | 4.56 | % | | 4.29 | % | | | | — | | | — | | | — | Expected rate of healthcare inflation | | | | | | | | | | | | | | | | | | | | — initial rate | | — | | | — | | | — | | | | | 4.91 | % | | 4.88 | % | | 5.16% | — ultimate rate | | — | | | — | | | — | | | | | 3.79 | % | | 3.64 | % | | 3.64% | | | | | | | | | | | | | | | | | | | | | Assumptions used to determine the net periodic benefit cost
(income) | | Pension benefits | | | | | Other benefits | | For the year ended December 31, | | 2009 | | | 2008 | | | 2007 | | | | | 2009 | | | 2008 | | | 2007 | Discount rate (weighted average for all regions) | | 5.93 | % | | 5.50 | % | | 4.69 | % | | | | 6.00 | % | | 5.50 | % | | 4.89% | Of which Euro zone | | 5.72 | % | | 5.15 | % | | 4.23 | % | | | | 5.74 | % | | 5.14 | % | | 4.30% | Of which United States | | 6.23 | % | | 6.00 | % | | 5.50 | % | | | | 6.21 | % | | 5.98 | % | | 5.49% | Of which United Kingdom | | 6.00 | % | | 5.75 | % | | 5.00 | % | | | | 6.00 | % | | 5.75 | % | | 5.00% | Average expected rate of salary increase | | 4.56 | % | | 4.29 | % | | 4.14 | % | | | | — | | | — | | | — | Expected return on plan assets | | 6.14 | % | | 6.60 | % | | 6.26 | % | | | | — | | | — | | | — | Expected rate of healthcare inflation | | | | | | | | | | | | | | | | | | | | — initial rate | | — | | | — | | | — | | | | | 4.88 | % | | 5.16 | % | | 5.57% | — ultimate rate | | — | | | — | | | — | | | | | 3.64 | % | | 3.64 | % | | 3.65% |
A 0.5% increase or decrease in discount rates – all other things being equal – would have the following approximate impact:
| | | | | | | (€ million) | | 0.5%
increase | | | 0.5%
decrease | Benefit obligation as of December 31, 2009 | | (452 | ) | | 500 | 2010 net periodic benefit cost (income) | | (21 | ) | | 29 |
A 0.5% increase or decrease in expected return on plan assets rate – all other things being equal – would have an impact of€29 million on 2010 net periodic benefit cost (income).
The components of the net periodic benefit cost (income) in 2009, 2008 and 2007 are:
| | | | | | | | | | | | | | | | | | | | | | | | Pension benefits | | | | | Other benefits | | | For the year ended December 31,(€ million) | | 2009 | | | 2008 | | | 2007 | | | | | 2009 | | | 2008 | | | 2007 | | Service cost | | 134 | | | 143 | | | 160 | | | | | 10 | | | 14 | | | 12 | | Interest cost | | 428 | | | 416 | | | 396 | | | | | 30 | | | 24 | | | 28 | | Expected return on plan assets | | (343 | ) | | (402 | ) | | (387 | ) | | | | — | | | — | | | — | | Amortization of prior service cost | | 13 | | | 34 | | | 31 | | | | | (7 | ) | | (10 | ) | | (5 | ) | Amortization of actuarial losses (gains) | | 50 | | | 22 | | | 17 | | | | | (6 | ) | | (2 | ) | | (1 | ) | Asset ceiling | | 4 | | | 1 | | | — | | | | | — | | | — | | | — | | Curtailments | | (4 | ) | | (3 | ) | | (8 | ) | | | | (1 | ) | | — | | | — | | Settlements | | (1 | ) | | (2 | ) | | (12 | ) | | | | — | | | (3 | ) | | (1 | ) | Special termination benefits | | — | | | — | | | — | | | | | — | | | — | | | — | | Net periodic benefit cost (income) | | 281 | | | 209 | | | 197 | | | | | 26 | | | 23 | | | 33 | |
A positive or negative change of one-percentage-point in the healthcare inflation rate would have the following approximate impact:
| | | | | | | (€ million) | | 1% point
increase | | 1% point
decrease | | Benefit obligation as of December 31, 2009 | | 60 | | (47 | ) | 2009 net periodic benefit cost (income) | | 7 | | (3 | ) |
19) PROVISIONS AND OTHER NON-CURRENT LIABILITIES
| | | | | | | | As of December 31,(€ million) | | 2009 | | 2008 | | 2007 | Litigations and accrued penalty claims | | 423 | | 546 | | 601 | Provisions for environmental contingencies | | 623 | | 558 | | 552 | Asset retirement obligations | | 5,469 | | 4,500 | | 4,206 | Other non-current provisions | | 1,331 | | 1,804 | | 1,188 | Other non-current liabilities | | 1,535 | | 450 | | 296 | Total | | 9,381 | | 7,858 | | 6,843 |
In 2009, litigation reserves mainly include a provision covering risks concerning antitrust investigations related to Arkema amounting to€43 million as of December 31, 2009. Other risks and commitments that give rise to contingent liabilities are described in Note 32 to the Consolidated Financial Statements.
In 2009, other non current provisions mainly include:
The contingency reserve related to the Toulouse-AZF plant explosion (civil liability) for€40 million as of December 31, 2009;
Provisions related to restructuring activities in the Downstream and Chemicals segments for€130 million as of December 31, 2009; and
The contingency reserve related to the Buncefield depot explosion (civil liability) for€295 million as of December 31, 2009.
In 2009, other non current liabilities mainly include debts (whose maturity is more than one year) related to fixed assets acquisitions. This heading is mainly composed of a€818 million debt related to Chesapeake acquisitionconsumer specialty chemicals business Mapa Spontex (see Note 3 to the Consolidated Financial Statements).
In 2008, litigation reserves mainly included a provision covering risks concerning antitrust investigations related to Arkema amounting to€85 million as of December 31, 2008. Other risks and commitments that give rise to contingent liabilities are described in Note 32 to the Consolidated Financial Statements.
In 2008, other non current provisions mainly included the contingency reserve related to the Toulouse-AZF plant explosion (civil liability) for€256 million as of December 31, 2008.
In 2007, litigation reserves mainly included a provision covering risks concerning antitrust investigations related to Arkema amounting to€138 million as of December 31, 2007. Other risks and commitments that give rise to contingent liabilities are described in Note 32 to the Consolidated Financial Statements.
In 2007, other non-current provisions mainly included:
The contingency reserve related to the Toulouse-AZF plant explosion (civil liability) for€134 million as of December 31, 2007; and
Provisions related to restructuring activities in the Chemicals segment for€49 million as of December 31, 2007.
Changes in provisions and other non-current liabilities
| | | | | | | | | | | | | | | | (€ million) | | As of January 1, | | Allowances | | Reversals | | | Currency
translation
adjustment | | | Other | | As of December 31, | 2009 | | 7,858 | | 1,254 | | (1,413 | ) | | 202 | | | 1,480 | | 9,381 | 2008 | | 6,843 | | 1,424 | | (864 | ) | | (460 | ) | | 915 | | 7,858 | 2007 | | 6,467 | | 747 | | (927 | ) | | (303 | ) | | 859 | | 6,843 |
Allowances
In 2009, allowances of the period (€1,254 million) mainly include:
Asset retirement obligations for€283 million (accretion);
Environmental contingencies for€147 million in the Downstream and Chemicals segments;
The contingency reserve related to the Buncefield depot explosion (civil liability) for€223 million; and
Provisions related to restructuring of activities for€121 million.
In 2008, allowances of the period (€1,424 million) mainly included:
Asset retirement obligations for€229 million (accretion);
The contingency reserve related to the Toulouse-AZF plant explosion (civil liability) for€140 million;
Environmental contingencies for€89 million;
An allowance of€48 million for litigation reserves in connection with antitrust investigations, as described in Note 32 to the Consolidated Financial Statements “Other risks and contingent liabilities”; and
Provisions related to restructuring of activities for€27 million.
In 2007, allowances of the period (€747 million) mainly included:
Provisions for asset retirement obligations for€189 million (accretion);
An allowance of€100 million for litigation reserves in connection with antitrust investigations, as described in Note 32 to the Consolidated Financial Statements “Other risks and contingent liabilities”;
Environmental contingencies in the Chemicals segment for€23 million; and
Provisions related to restructuring of activities for€15 million.
Reversals
In 2009, reversals of the period (€1,413 million) mainly relate to the following incurred expenses:
Provisions for asset retirement obligations for€191 million;
€52 million for litigation reserves in connection with antitrust investigations;
Environmental contingencies written back for€86 million;
The contingency reserve related to the Toulouse-AZF plant explosion (civil liability), written back for€216 million;
The contingency reserve related to the Buncefield depot explosion (civil liability), written back for€375 million; and
Provisions for restructuring and social plans written back for€28 million.
In 2008, reversals of the period (€864 million) were mainly related to the following incurred expenses:
Provisions for asset retirement obligations for€280 million;
€163 million for litigation reserves in connection with antitrust investigations;
Environmental contingencies written back for€96 million;
The contingency reserve related to the Toulouse-AZF plant explosion (civil liability), written back for€18 million; and
Provisions for restructuring and social plans written back for€10 million.
In 2007, reversals of the period (€927 million) were mainly related to the following incurred expenses:
Provisions for asset retirement obligations for€209 million;
Environmental contingencies in the Chemicals segment written back for€52 million;
The contingency reserve related to the Toulouse-AZF plant explosion (civil liability), written back for€42 million; and
Provisions for restructuring and social plans written back for€37 million.
CHANGES IN THE ASSET RETIREMENT OBLIGATION
| | | | | | | | | | | | | | | | | | | | | (€ million) | | As of January 1, | | Accretion | | Revision
in
estimates | | New
obligations | | Spending
on existing
obligations | | | Currency
translation
adjustment | | | Other | | | As of December 31, | 2009 | | 4,500 | | 283 | | 447 | | 179 | | (191 | ) | | 232 | | | 19 | | | 5,469 | 2008 | | 4,206 | | 229 | | 563 | | 188 | | (280 | ) | | (414 | ) | | 8 | | | 4,500 | 2007 | | 3,893 | | 189 | | 203 | | 371 | | (209 | ) | | (206 | ) | | (35 | ) | | 4,206 |
20) FINANCIAL DEBT AND RELATED FINANCIAL INSTRUMENTS
A) NON-CURRENT FINANCIAL DEBT AND RELATED FINANCIAL INSTRUMENTS
| | | | | | | | | | As of December 31, 2009(€ million) | | | | | | | | | | (Assets)/Liabilities | | Secured | | Unsecured | | | Total | | | | | | Non-current financial debt | | 312 | | 19,125 | | | 19,437 | | of which hedging instruments of non-current financial debt (liabilities) | | — | | 241 | | | 241 | | Hedging instruments of non-current financial debt (assets)(a) | | — | | (1,025 | ) | | (1,025 | ) | Non-current financial debt – net of hedging instruments | | 312 | | 18,100 | | | 18,412 | | Bonds, net of hedging instruments | | — | | 17,584 | | | 17,584 | | Bank and other, floating rate | | 60 | | 379 | | | 439 | | Bank and other, fixed rate | | 50 | | 79 | | | 129 | | Financial lease obligations | | 202 | | 58 | | | 260 | | Non-current financial debt – net of hedging instruments | | 312 | | 18,100 | | | 18,412 | |
| | | | | | | | | | As of December 31, 2008(€ million) | | | | | | | | | | (Assets)/Liabilities | | Secured | | Unsecured | | | Total | | | | | | Non-current financial debt | | 895 | | 15,296 | | | 16,191 | | of which hedging instruments of non-current financial debt (liabilities) | | — | | 440 | | | 440 | | Hedging instruments of non-current financial debt (assets)(a) | | — | | (892 | ) | | (892 | ) | Non-current financial debt – net of hedging instruments | | 895 | | 14,404 | | | 15,299 | | Bonds, net of hedging instruments | | — | | 13,667 | | | 13,667 | | Bank and other, floating rate | | 553 | | 665 | | | 1,218 | | Bank and other, fixed rate | | 140 | | 6 | | | 146 | | Financial lease obligations | | 202 | | 66 | | | 268 | | Non-current financial debt – net of hedging instruments | | 895 | | 14,404 | | | 15,299 | |
| | | | | | | | | | As of December 31, 2007(€ million) | | | | | | | | | | (Assets)/Liabilities | | Secured | | Unsecured | | | Total | | | | | | Non-current financial debt | | 772 | | 14,104 | | | 14,876 | | of which hedging instruments of non-current financial debt (liabilities) | | — | | 369 | | | 369 | | Hedging instruments of non-current financial debt (assets)(a) | | — | | (460 | ) | | (460 | ) | Non-current financial debt – net of hedging instruments | | 772 | | 13,644 | | | 14,416 | | Bonds, net of hedging instruments | | — | | 11,650 | | | 11,650 | | Bank and other, floating rate | | 453 | | 1,781 | | | 2,234 | | Bank and other, fixed rate | | 2 | | 213 | | | 215 | | Financial lease obligations | | 317 | | — | | | 317 | | Non-current financial debt – net of hedging instruments | | 772 | | 13,644 | | | 14,416 | |
(a) | See the description of these hedging instruments in Notes 1 paragraph M(iii) “Long-term financing”, 28 and 29 to the Consolidated Financial Statements. |
Fair value of bonds, as of December 31, 2009, after taking into account currency and interest rates swaps, is detailed as follows:
| | | | | | | | | | | | | | | | | | | | | | | Fair value after hedging as of | | | | | | | | | (€ million) | | Year of
issue | | December 31,
2009 | | | December 31,
2008 | | | December 31,
2007 | | | Currency | | Maturity | | Initial rate before
hedging instruments | Parent company | | | | | | | | | | | | | | | | | | Bond | | 1996 | | — | | | — | | | 324 | | | FRF | | 2008 | | 6.750% | Bond | | 1997 | | — | | | 124 | | | 118 | | | FRF | | 2009 | | 6.200% | Bond | | 1998 | | — | | | — | | | 26 | | | FRF | | 2008 | | Pibor 3 months + 0.380% | Bond | | 1998 | | — | | | 119 | | | 113 | | | FRF | | 2009 | | 5.125% | Bond | | 1998 | | 116 | | | 121 | | | 114 | | | FRF | | 2013 | | 5.000% | Bond | | 2000 | | 61 | | | 63 | | | 60 | | | EUR | | 2010 | | 5.650% | Current portion (less than one year) | | | | (61 | ) | | (243 | ) | | (349 | ) | | | | | | | Total parent company | | | | 116 | | | 184 | | | 406 | | | | | | | | Elf Aquitaine SA | | | | | | | | | | | | | | | | | | Bond | | 1999 | | — | | | 1,003 | | | 998 | | | EUR | | 2009 | | 4.500% | Current portion (less than one year) | | | | — | | | (1,003 | ) | | — | | | | | | | | Total Elf Aquitaine SA | | | | — | | | — | | | 998 | | | | | | | | | TOTAL CAPITAL(a) | | | | | | | | | | | | | | | | | | Bond | | 2002 | | 14 | | | 14 | | | 14 | | | USD | | 2012 | | 5.890% | Bond | | 2003 | | — | | | — | | | 39 | | | AUD | | 2008 | | 5.000% | Bond | | 2003 | | — | | | — | | | 41 | | | AUD | | 2008 | | 5.000% | Bond | | 2003 | | — | | | — | | | 44 | | | CAD | | 2008 | | 4.250% | Bond | | 2003 | | — | | | — | | | 148 | | | CHF | | 2008 | | 2.010% | Bond | | 2003 | | — | | | — | | | 98 | | | CHF | | 2008 | | 2.010% | Bond | | 2003 | | — | | | — | | | 360 | | | EUR | | 2008 | | 3.500% | Bond | | 2003 | | — | | | — | | | 72 | | | EUR | | 2008 | | 3.500% | Bond | | 2003 | | — | | | — | | | 113 | | | EUR | | 2008 | | 3.500% | Bond | | 2003 | | — | | | — | | | 170 | | | USD | | 2008 | | 3.250% | Bond | | 2003 | | — | | | 52 | | | 49 | | | AUD | | 2009 | | 6.250% | Bond | | 2003 | | — | | | 154 | | | 145 | | | CHF | | 2009 | | 2.385% | Bond | | 2003 | | 160 | | | 166 | | | 157 | | | CHF | | 2010 | | 2.385% | Bond | | 2003 | | 21 | | | 22 | | | 20 | | | USD | | 2013 | | 4.500% | Bond | | 2003-2004 | | — | | | 395 | | | 373 | | | USD | | 2009 | | 3.500% | Bond | | 2004 | | — | | | — | | | 34 | | | USD | | 2008 | | 3.250% | Bond | | 2004 | | — | | | — | | | 34 | | | USD | | 2008 | | 3.250% | Bond | | 2004 | | — | | | — | | | 68 | | | USD | | 2008 | | 3.250% | Bond | | 2004 | | — | | | 57 | | | 54 | | | AUD | | 2009 | | 6.000% | Bond | | 2004 | | — | | | 28 | | | 26 | | | AUD | | 2009 | | 6.000% | Bond | | 2004 | | 53 | | | 55 | | | 52 | | | CAD | | 2010 | | 4.000% | Bond | | 2004 | | 113 | | | 117 | | | 110 | | | CHF | | 2010 | | 2.385% | Bond | | 2004 | | 438 | | | 454 | | | 429 | | | EUR | | 2010 | | 3.750% | Bond | | 2004 | | 322 | | | 334 | | | 316 | | | GBP | | 2010 | | 4.875% | Bond | | 2004 | | 128 | | | 132 | | | 125 | | | GBP | | 2010 | | 4.875% | Bond | | 2004 | | 185 | | | 191 | | | 181 | | | GBP | | 2010 | | 4.875% | Bond | | 2004 | | 53 | | | 55 | | | 52 | | | AUD | | 2011 | | 5.750% |
| | | | | | | | | | | | | | | | | | | | Fair value after hedging as of | | | | | | | | (€ million) | | Year of
issue | | December 31,
2009 | | December 31,
2008 | | December 31,
2007 | | Currency | | Maturity | | Initial rate before
hedging instruments | Bond | | 2004 | | 107 | | 111 | | 105 | | CAD | | 2011 | | 4.875% | Bond | | 2004 | | 203 | | 216 | | 204 | | USD | | 2011 | | 4.125% | Bond | | 2004 | | 69 | | 72 | | 68 | | USD | | 2011 | | 4.125% | Bond | | 2004 | | 116 | | 120 | | 114 | | CHF | | 2012 | | 2.375% | Bond | | 2004 | | 47 | | 49 | | 46 | | NZD | | 2014 | | 6.750% | Bond | | 2005 | | — | | 36 | | 34 | | USD | | 2009 | | 3.500% | Bond | | 2005 | | 53 | | 55 | | 52 | | AUD | | 2011 | | 5.750% | Bond | | 2005 | | 56 | | 58 | | 55 | | CAD | | 2011 | | 4.000% | Bond | | 2005 | | 112 | | 116 | | 109 | | CHF | | 2011 | | 1.625% | Bond | | 2005 | | 226 | | 226 | | 226 | | CHF | | 2011 | | 1.625% | Bond | | 2005 | | 144 | | 144 | | 136 | | USD | | 2011 | | 4.125% | Bond | | 2005 | | 63 | | 63 | | 63 | | AUD | | 2012 | | 5.750% | Bond | | 2005 | | 180 | | 187 | | 177 | | CHF | | 2012 | | 2.135% | Bond | | 2005 | | 65 | | 65 | | 65 | | CHF | | 2012 | | 2.135% | Bond | | 2005 | | 97 | | 98 | | 97 | | CHF | | 2012 | | 2.375% | Bond | | 2005 | | 363 | | 376 | | 356 | | EUR | | 2012 | | 3.250% | Bond | | 2005 | | 292 | | 287 | | 286 | | GBP | | 2012 | | 4.625% | Bond | | 2005 | | 57 | | 57 | | 57 | | NZD | | 2012 | | 6.500% | Bond | | 2006 | | 75 | | 75 | | 75 | | GBP | | 2010 | | 4.875% | Bond | | 2006 | | 50 | | 50 | | 50 | | EUR | | 2010 | | 3.750% | Bond | | 2006 | | 50 | | 50 | | 50 | | EUR | | 2010 | | 3.750% | Bond | | 2006 | | 100 | | 102 | | 100 | | EUR | | 2010 | | 3.750% | Bond | | 2006 | | 42 | | 42 | | 42 | | EUR | | 2011 | | EURIBOR 3 months +0.040% | Bond | | 2006 | | 300 | | 300 | | 300 | | EUR | | 2011 | | 3.875% | Bond | | 2006 | | 150 | | 150 | | 150 | | EUR | | 2011 | | 3.875% | Bond | | 2006 | | 300 | | 300 | | 300 | | EUR | | 2011 | | 3.875% | Bond | | 2006 | | 120 | | 120 | | 120 | | USD | | 2011 | | 5.000% | Bond | | 2006 | | 300 | | 300 | | 300 | | EUR | | 2011 | | 3.875% | Bond | | 2006 | | 472 | | 473 | | 474 | | USD | | 2011 | | 5.000% | Bond | | 2006 | | 62 | | 62 | | 62 | | AUD | | 2012 | | 5.625% | Bond | | 2006 | | 72 | | 72 | | 72 | | CAD | | 2012 | | 4.125% | Bond | | 2006 | | 100 | | 100 | | 100 | | EUR | | 2012 | | 3.250% | Bond | | 2006 | | 74 | | 74 | | 74 | | GBP | | 2012 | | 4.625% | Bond | | 2006 | | 100 | | 100 | | 100 | | EUR | | 2012 | | 3.250% | Bond | | 2006 | | 125 | | 125 | | 126 | | CHF | | 2013 | | 2.510% | Bond | | 2006 | | 127 | | 127 | | 127 | | CHF | | 2014 | | 2.635% | Bond | | 2006 | | 130 | | 130 | | 130 | | CHF | | 2016 | | 2.385% | Bond | | 2006 | | 65 | | 65 | | 65 | | CHF | | 2016 | | 2.385% | Bond | | 2006 | | 64 | | 64 | | 64 | | CHF | | 2016 | | 2.385% | Bond | | 2006 | | 63 | | 64 | | 64 | | CHF | | 2016 | | 2.385% | Bond | | 2006 | | 129 | | 129 | | 129 | | CHF | | 2018 | | 3.135% | Bond | | 2007 | | 60 | | 60 | | 60 | | CHF | | 2010 | | 2.385% | Bond | | 2007 | | 74 | | 74 | | 74 | | GBP | | 2010 | | 4.875% | Bond | | 2007 | | 77 | | 77 | | 77 | | USD | | 2011 | | 5.000% | Bond | | 2007 | | 370 | | 370 | | 371 | | USD | | 2012 | | 5.000% | Bond | | 2007 | | 222 | | 222 | | 222 | | USD | | 2012 | | 5.000% | Bond | | 2007 | | 61 | | 61 | | 61 | | AUD | | 2012 | | 6.500% | Bond | | 2007 | | 72 | | 72 | | 72 | | CAD | | 2012 | | 4.125% | Bond | | 2007 | | 71 | | 71 | | 71 | | GBP | | 2012 | | 4.625% | Bond | | 2007 | | 300 | | 300 | | 301 | | EUR | | 2013 | | 4.125% | Bond | | 2007 | | 73 | | 74 | | 73 | | GBP | | 2013 | | 5.500% |
| | | | | | | | | | | | | | | | | | | | Fair value after hedging as of | | | | | | | | (€ million) | | Year of
issue | | December 31,
2009 | | December 31,
2008 | | December 31,
2007 | | Currency | | Maturity | | Initial rate before
hedging instruments | Bond | | 2007 | | 306 | | 306 | | 305 | | GBP | | 2013 | | 5.500% | Bond | | 2007 | | 72 | | 73 | | 74 | | GBP | | 2013 | | 5.500% | Bond | | 2007 | | 248 | | 248 | | 248 | | CHF | | 2014 | | 2.635% | Bond | | 2007 | | 31 | | 31 | | 31 | | JPY | | 2014 | | 1.505% | Bond | | 2007 | | 61 | | 61 | | 61 | | CHF | | 2014 | | 2.635% | Bond | | 2007 | | 49 | | 49 | | 49 | | JPY | | 2014 | | 1.723% | Bond | | 2007 | | 121 | | 121 | | 122 | | CHF | | 2015 | | 3.125% | Bond | | 2007 | | 300 | | 300 | | 302 | | EUR | | 2017 | | 4.700% | Bond | | 2007 | | 76 | | 76 | | 76 | | CHF | | 2018 | | 3.135% | Bond | | 2007 | | 60 | | 60 | | 60 | | CHF | | 2018 | | 3.135% | Bond | | 2008 | | 63 | | 63 | | — | | GBP | | 2010 | | 4.875% | Bond | | 2008 | | 66 | | 66 | | — | | GBP | | 2010 | | 4.875% | Bond | | 2008 | | 92 | | 92 | | — | | AUD | | 2011 | | 7.500% | Bond | | 2008 | | 100 | | 100 | | — | | EUR | | 2011 | | 3.875% | Bond | | 2008 | | 150 | | 151 | | — | | EUR | | 2011 | | 3.875% | Bond | | 2008 | | 50 | | 50 | | — | | EUR | | 2011 | | 3.875% | Bond | | 2008 | | 50 | | 50 | | — | | EUR | | 2011 | | 3.875% | Bond | | 2008 | | 60 | | 60 | | — | | JPY | | 2011 | | EURIBOR 6 months + 0.018% | Bond | | 2008 | | 102 | | 102 | | — | | USD | | 2011 | | 3.750% | Bond | | 2008 | | 62 | | 62 | | — | | CHF | | 2012 | | 2.135% | Bond | | 2008 | | 124 | | 124 | | — | | CHF | | 2012 | | 3.635% | Bond | | 2008 | | 46 | | 46 | | — | | CHF | | 2012 | | 2.385% | Bond | | 2008 | | 92 | | 92 | | — | | CHF | | 2012 | | 2.385% | Bond | | 2008 | | 64 | | 64 | | — | | CHF | | 2012 | | 2.385% | Bond | | 2008 | | 50 | | 50 | | — | | EUR | | 2012 | | 3.250% | Bond | | 2008 | | 63 | | 63 | | — | | GBP | | 2012 | | 4.625% | Bond | | 2008 | | 63 | | 63 | | — | | GBP | | 2012 | | 4.625% | Bond | | 2008 | | 63 | | 64 | | — | | GBP | | 2012 | | 4.625% | Bond | | 2008 | | 62 | | 62 | | — | | NOK | | 2012 | | 6.000% | Bond | | 2008 | | 69 | | 69 | | — | | USD | | 2012 | | 5.000% | Bond | | 2008 | | 60 | | 60 | | — | | AUD | | 2013 | | 7.500% | Bond | | 2008 | | 61 | | 61 | | — | | AUD | | 2013 | | 7.500% | Bond | | 2008 | | 127 | | 128 | | — | | CHF | | 2013 | | 3.135% | Bond | | 2008 | | 62 | | 63 | | — | | CHF | | 2013 | | 3.135% | Bond | | 2008 | | 200 | | 200 | | — | | EUR | | 2013 | | 4.125% | Bond | | 2008 | | 100 | | 100 | | — | | EUR | | 2013 | | 4.125% | Bond | | 2008 | | 1,000 | | 1,002 | | — | | EUR | | 2013 | | 4.750% | Bond | | 2008 | | 63 | | 63 | | — | | GBP | | 2013 | | 5.500% | Bond | | 2008 | | 149 | | 149 | | — | | JPY | | 2013 | | EURIBOR 6 months + 0.008% | Bond | | 2008 | | 191 | | 194 | | — | | USD | | 2013 | | 4.000% | Bond | | 2008 | | 61 | | 61 | | — | | CHF | | 2015 | | 3.135% | Bond | | 2008 | | 62 | | 62 | | — | | CHF | | 2015 | | 3.135% | Bond | | 2008 | | 61 | | 62 | | — | | CHF | | 2015 | | 3.135% | Bond | | 2008 | | 62 | | 62 | | — | | CHF | | 2018 | | 3.135% | Bond | | 2009 | | 56 | | — | | — | | AUD | | 2013 | | 5.500% | Bond | | 2009 | | 54 | | — | | — | | AUD | | 2013 | | 5.500% | Bond | | 2009 | | 236 | | — | | — | | CHF | | 2013 | | 2.500% | Bond | | 2009 | | 77 | | — | | — | | USD | | 2013 | | 4.000% | Bond | | 2009 | | 131 | | — | | — | | CHF | | 2014 | | 2.625% | Bond | | 2009 | | 998 | | — | | — | | EUR | | 2014 | | 3.500% | Bond | | 2009 | | 150 | | — | | — | | EUR | | 2014 | | 3.500% |
| | | | | | | | | | | | | | | | | | | | | | | Fair value after hedging as of | | | | | | | | | (€ million) | | Year of
issue | | December 31,
2009 | | | December 31,
2008 | | | December 31,
2007 | | | Currency | | Maturity | | Initial rate before
hedging instruments | Bond | | 2009 | | 40 | | | — | | | — | | | HKD | | 2014 | | 3.240% | Bond | | 2009 | | 96 | | | — | | | — | | | AUD | | 2015 | | 6.000% | Bond | | 2009 | | 550 | | | — | | | — | | | EUR | | 2015 | | 3.625% | Bond | | 2009 | | 684 | | | — | | | — | | | USD | | 2015 | | 3.125% | Bond | | 2009 | | 208 | | | — | | | — | | | USD | | 2015 | | 3.125% | Bond | | 2009 | | 99 | | | — | | | — | | | CHF | | 2016 | | 2.385% | Bond | | 2009 | | 115 | | | — | | | — | | | GBP | | 2017 | | 4.250% | Bond | | 2009 | | 225 | | | — | | | — | | | GBP | | 2017 | | 4.250% | Bond | | 2009 | | 448 | | | — | | | — | | | EUR | | 2019 | | 4.875% | Bond | | 2009 | | 602 | | | — | | | — | | | EUR | | 2019 | | 4.875% | Bond | | 2009 | | 69 | | | — | | | — | | | HKD | | 2019 | | 4.180% | Bond | | 2009 | | 347 | | | — | | | — | | | USD | | 2021 | | 4.250% | Bond | | 2009 | | 806 | | | — | | | — | | | EUR | | 2024 | | 5.125% | Current portion (less than one year) | | | | (1,937 | ) | | (722 | ) | | (1,222 | ) | | | | | | | Total TOTAL CAPITAL(a) | | | | 17,315 | | | 13,380 | | | 10,136 | | | | | | | | | | | | | | | | | | | | | | | | | | Other consolidated subsidiaries | | | | 153 | | | 103 | | | 110 | | | | | | | | Total | | | | 17,584 | | | 13,667 | | | 11,650 | | | | | | | |
(a) | TOTAL CAPITAL is a wholly-owned indirect subsidiary of TOTAL S.A. (with the exception of one share held by each member of its Board of Directors). It acts as a financing vehicle for the Group. Its debt securities are fully and unconditionally guaranteed by TOTAL S.A. as to payment of principal, premium, if any, interest and any other amounts due. |
Loan repayment schedule (excluding current portion)
| | | | | | | | | | | | As of December 31, 2009 (€ million) | | Non-current
financial debt | | of which hedging
instruments of
non-current
financial debt
(liabilities) | | Hedging instruments
of non-current
financial debt (assets) | | | Non-current financial
debt - net of hedging
instruments | | % | 2011 | | 3,857 | | 42 | | (199 | ) | | 3,658 | | 20% | 2012 | | 3,468 | | 48 | | (191 | ) | | 3,277 | | 18% | 2013 | | 3,781 | | 95 | | (236 | ) | | 3,545 | | 19% | 2014 | | 2,199 | | 6 | | (90 | ) | | 2,109 | | 11% | 2015 and beyond | | 6,132 | | 50 | | (309 | ) | | 5,823 | | 32% | Total | | 19,437 | | 241 | | (1,025 | ) | | 18,412 | | 100% |
| | | | | | | | | | | | As of December 31, 2008 (€ million) | | Non-current
financial debt | | of which hedging
instruments of
non-current
financial debt
(liabilities) | | Hedging instruments
of non-current
financial debt (assets) | | | Non-current financial
debt - net of hedging
instruments | | % | 2010 | | 3,160 | | 170 | | (168 | ) | | 2,992 | | 20% | 2011 | | 3,803 | | 24 | | (145 | ) | | 3,658 | | 24% | 2012 | | 3,503 | | 115 | | (179 | ) | | 3,324 | | 22% | 2013 | | 3,430 | | 127 | | (198 | ) | | 3,232 | | 21% | 2014 and beyond | | 2,295 | | 4 | | (202 | ) | | 2,093 | | 13% | Total | | 16,191 | | 440 | | (892 | ) | | 15,299 | | 100% |
| | | | | | | | | | | | As of December 31, 2007 (€ million) | | Non-current
financial debt | | of which hedging
instruments of
non-current
financial debt
(liabilities) | | Hedging instruments
of non-current
financial debt (assets) | | | Non-current financial
debt - net of hedging
instruments | | % | 2009 | | 2,137 | | 6 | | (114 | ) | | 2,023 | | 14% | 2010 | | 2,767 | | 16 | | (207 | ) | | 2,560 | | 18% | 2011 | | 3,419 | | 123 | | (65 | ) | | 3,354 | | 23% | 2012 | | 3,517 | | 90 | | (30 | ) | | 3,487 | | 24% | 2013 and beyond | | 3,036 | | 134 | | (44 | ) | | 2,992 | | 21% | Total | | 14,876 | | 369 | | (460 | ) | | 14,416 | | 100% |
Analysis by currency and interest rate
These analyses take into account interest rate and foreign currency swaps to hedge non-current financial debt.
| | | | | | | | | | | | | | As of December 31,(€ million) | | 2009 | | % | | 2008 | | % | | 2007 | | % | U.S. Dollar | | 3,962 | | 21% | | 3,990 | | 26% | | 4,700 | | 33% | Euro | | 14,110 | | 77% | | 10,685 | | 70% | | 8,067 | | 56% | Other currencies | | 340 | | 2% | | 624 | | 4% | | 1,649 | | 11% | Total | | 18,412 | | 100% | | 15,299 | | 100% | | 14,416 | | 100% |
| | | | | | | | | | | | | | As of December 31,(€ million) | | 2009 | | % | | 2008 | | % | | 2007 | | % | Fixed rate | | 2,064 | | 11% | | 633 | | 4% | | 893 | | 6% | Floating rate | | 16,348 | | 89% | | 14,666 | | 96% | | 13,523 | | 94% | Total | | 18,412 | | 100% | | 15,299 | | 100% | | 14,416 | | 100% |
B) CURRENT FINANCIAL ASSETS AND LIABILITIES
Current borrowings consist mainly of commercial papers or treasury bills or draws on bank loans. These instruments bear interest at rates that are close to market rates.
| | | | | | | | | | | As of December 31,(€ million) | | | | | | | | | | | (Assets) / Liabilities | | 2009 | | | 2008 | | | 2007 | | Current financial debt | | 4,761 | | | 5,586 | | | 2,530 | | Current portion of non-current financial debt | | 2,233 | | | 2,136 | | | 2,083 | | Current borrowings | | 6,994 | | | 7,722 | | | 4,613 | | Current portion of hedging instruments of debt (liabilities) | | 97 | | | 12 | | | 1 | | Other current financial instruments (liabilities) | | 26 | | | 146 | | | 59 | | Other current financial liabilities(note 28) | | 123 | | | 158 | | | 60 | | Current deposits beyond three months | | (55 | ) | | (1 | ) | | (850 | ) | Current portion of hedging instruments of debt (assets) | | (197 | ) | | (100 | ) | | (388 | ) | Other current financial instruments (assets) | | (59 | ) | | (86 | ) | | (26 | ) | Current financial assets(note 28) | | (311 | ) | | (187 | ) | | (1,264 | ) | Current borrowings and related financial assets and liabilities, net | | 6,806 | | | 7,693 | | | 3,409 | |
C) NET-DEBT-TO-EQUITY RATIO
For its internal and external communication needs, the Group calculates a debt ratio by dividing its net financial debt by equity. Shareholders’ equity as of December 31, 2009 is calculated after distribution of a dividend of€2.28 per share of which€1.14 per share was paid on November 19, 2009.
The net-debt-to-equity ratio is calculated as follows:
| | | | | | | | | | | As of December 31,(€ million) | | | | | | | | | | | (Assets) / Liabilities | | 2009 | | | 2008 | | | 2007 | | Current borrowings | | 6,994 | | | 7,722 | | | 4,613 | | Other current financial liabilities | | 123 | | | 158 | | | 60 | | Current financial assets | | (311 | ) | | (187 | ) | | (1,264 | ) | Non-current financial debt | | 19,437 | | | 16,191 | | | 14,876 | | Hedging instruments on non-current financial debt | | (1,025 | ) | | (892 | ) | | (460 | ) | Cash and cash equivalents | | (11,662 | ) | | (12,321 | ) | | (5,988 | ) | Net financial debt | | 13,556 | | | 10,671 | | | 11,837 | | Shareholders’ equity - Group share | | 52,552 | | | 48,992 | | | 44,858 | | Estimated dividend payable | | (2,546 | ) | | (2,540 | ) | | (2,397 | ) | Minority interest | | 987 | | | 958 | | | 842 | | Total shareholder’s equity | | 50,993 | | | 47,410 | | | 43,303 | | Net-debt-to-equity ratio | | 26.6% | | | 22.5% | | | 27.3% | |
21) OTHER CREDITORS AND ACCRUED LIABILITIES
| | | | | | | | As of December 31,(€ million) | | 2009 | | 2008 | | 2007 | Accruals and deferred income | | 223 | | 151 | | 137 | Payable to States (including taxes and duties) | | 6,024 | | 6,256 | | 7,860 | Payroll | | 955 | | 928 | | 909 | Other operating liabilities | | 4,706 | | 4,297 | | 3,900 | Total | | 11,908 | | 11,632 | | 12,806 |
As of December 31, 2009, the heading “Other operating liabilities” mainly includes€744 million related to Chesapeake acquisition (see Note 3 to the Consolidated Financial Statements).
22) LEASE CONTRACTS
The Group leases real estate, retail stations, ships, and other equipments (see Note 11 to the Consolidated Financial Statements).
The future minimum lease payments on operating and finance leases to which the Group is committed are shown as follows:
| | | | | | For the year ended December 31,
2009(€ million) | | Operating
leases | | Finance
leases | | 2010 | | 523 | | 42 | | 2011 | | 377 | | 43 | | 2012 | | 299 | | 42 | | 2013 | | 243 | | 41 | | 2014 | | 203 | | 39 | | 2015 and beyond | | 894 | | 128 | | Total minimum payments | | 2,539 | | 335 | | Less financial expenses | | — | | (53 | ) | Nominal value of contracts | | — | | 282 | | Less current portion of finance lease contracts | | — | | (22 | ) | Outstanding liability of finance lease contracts | | — | | 260 | |
| | | | | | | | | For the year ended December 31,
2008(€ million) | | Operating
leases | | Finance
leases | | 2009 | | 429 | | 47 | | 2010 | | 306 | | 42 | | 2011 | | 243 | | 42 | | 2012 | | 208 | | 42 | | 2013 | | 166 | | 40 | | 2014 and beyond | | 675 | | 148 | | Total minimum payments | | 2,027 | | 361 | | Less financial expenses | | — | | (70 | ) | Nominal value of contracts | | — | | 291 | | Less current portion of finance lease contracts | | — | | (23 | ) | Outstanding liability of finance lease contracts | | — | | 268 | |
| | | | | | For the year ended December 31,
2007(€ million) | | Operating
leases | | Finance
leases | | 2008 | | 427 | | 50 | | 2009 | | 352 | | 47 | | 2010 | | 291 | | 46 | | 2011 | | 210 | | 46 | | 2012 | | 149 | | 47 | | 2013 and beyond | | 492 | | 154 | | Total minimum payments | | 1,921 | | 390 | | Less financial expenses | | — | | (47 | ) | Nominal value of contracts | | — | | 343 | | Less current portion of finance lease contracts | | — | | (26 | ) | Outstanding liability of finance lease contracts | | — | | 317 | |
Net rental expense incurred under operating leases for the year ended December 31, 2009 is€613 million (against€426 million in 2008 and€383 million in 2007).
23) COMMITMENTS AND CONTINGENCIES
| | | | | | | | | | | | Maturity and installments | | As of December 31, 2009(€ million) | | Total | | Less than
1 year | | Between
1 and 5 years | | More than
5 years | Non-current debt obligations net of hedging instruments(Note 20) | | 18,152 | | — | | 12,443 | | 5,709 | Current portion of non-current debt obligations net of hedging instruments(Note 20) | | 2,111 | | 2,111 | | — | | — | Finance lease obligations(Note 22) | | 282 | | 22 | | 146 | | 114 | Asset retirement obligations(Note 19) | | 5,469 | | 235 | | 972 | | 4,262 | Contractual obligations recorded in the balance sheet | | 26,014 | | 2,368 | | 13,561 | | 10,085 | Operating lease obligations(Note 22) | | 2,539 | | 523 | | 1,122 | | 894 | Purchase obligations | | 49,808 | | 4,542 | | 9,919 | | 35,347 | Contractual obligations not recorded in the balance sheet | | 52,347 | | 5,065 | | 11,041 | | 36,241 | Total of contractual obligations | | 78,361 | | 7,433 | | 24,602 | | 46,326 | Guarantees given for excise taxes | | 1,765 | | 1,617 | | 69 | | 79 | Guarantees given against borrowings | | 2,882 | | 1,383 | | 709 | | 790 | Indemnities related to sales of businesses | | 36 | | — | | 1 | | 35 | Guarantees of current liabilities | | 203 | | 160 | | 38 | | 5 | Guarantees to customers / suppliers | | 2,770 | | 1,917 | | 70 | | 783 | Letters of credit | | 1,499 | | 1,485 | | 2 | | 12 | Other operating commitments | | 765 | | 582 | | 103 | | 80 | Total of other commitments given | | 9,920 | | 7,144 | | 992 | | 1,784 | Mortgages and liens received | | 330 | | 5 | | 106 | | 219 | Other commitments received | | 5,637 | | 3,187 | | 481 | | 1,969 | Total of commitments received | | 5,967 | | 3,192 | | 587 | | 2,188 |
| | | | | | | | | | | | Maturity and installments | | As of December 31, 2008(€ million) | | Total | | Less than
1 year | | Between
1 and 5 years | | More than
5 years | Non-current debt obligations net of hedging instruments(Note 20) | | 15,031 | | — | | 13,064 | | 1,967 | Current portion of non-current debt obligations net of hedging instruments(Note 20) | | 2,025 | | 2,025 | | — | | — | Finance lease obligations(Note 22) | | 291 | | 23 | | 142 | | 126 | Asset retirement obligations(Note 19) | | 4,500 | | 154 | | 653 | | 3,693 | Contractual obligations recorded in the balance sheet | | 21,847 | | 2,202 | | 13,859 | | 5,786 | Operating lease obligations(Note 22) | | 2,027 | | 429 | | 923 | | 675 | Purchase obligations | | 60,226 | | 4,420 | | 13,127 | | 42,679 | Contractual obligations not recorded in the balance sheet | | 62,253 | | 4,849 | | 14,050 | | 43,354 | Total of contractual obligations | | 84,100 | | 7,051 | | 27,909 | | 49,140 | Guarantees given for excise taxes | | 1,720 | | 1,590 | | 58 | | 72 | Guarantees given against borrowings | | 2,870 | | 1,119 | | 519 | | 1,232 | Indemnities related to sales of businesses | | 39 | | 3 | | 1 | | 35 | Guarantees of current liabilities | | 315 | | 119 | | 164 | | 32 | Guarantees to customers / suppliers | | 2,866 | | 68 | | 148 | | 2,650 | Letters of credit | | 1,080 | | 1,024 | | 17 | | 39 | Other operating commitments | | 648 | | 246 | | 132 | | 270 | Total of other commitments given | | 9,538 | | 4,169 | | 1,039 | | 4,330 | Mortgages and liens received | | 321 | | 72 | | 110 | | 139 | Other commitments received | | 4,218 | | 2,440 | | 234 | | 1,544 | Total of commitments received | | 4,539 | | 2,512 | | 344 | | 1,683 |
| | | | | | | | | | | | Maturity and installments | | As of December 31, 2007(€ million) | | Total | | Less than
1 year | | Between
1 and 5 years | | More than
5 years | Non-current debt obligations net of hedging instruments(Note 20) | | 14,099 | | — | | 11,251 | | 2,848 | Current portion of non-current debt obligations net of hedging instruments(Note 20) | | 1,669 | | 1,669 | | — | | — | Finance lease obligations(Note 22) | | 343 | | 26 | | 173 | | 144 | Asset retirement obligations(Note 19) | | 4,206 | | 189 | | 503 | | 3,514 | Contractual obligations recorded in the balance sheet | | 20,317 | | 1,884 | | 11,927 | | 6,506 | Operating lease obligations(Note 22) | | 1,921 | | 427 | | 1,002 | | 492 | Purchase obligations | | 61,794 | | 3,210 | | 15,419 | | 43,165 | Contractual obligations not recorded in the balance sheet | | 63,715 | | 3,637 | | 16,421 | | 43,657 | Total of contractual obligations | | 84,032 | | 5,521 | | 28,348 | | 50,163 | Guarantees given for excise taxes | | 1,796 | | 590 | | 58 | | 1,148 | Guarantees given against borrowings | | 781 | | 9 | | 624 | | 148 | Indemnities related to sales of businesses | | 40 | | — | | 3 | | 37 | Guarantees of current liabilities | | 97 | | 16 | | 48 | | 33 | Guarantees to customers / suppliers | | 1,197 | | 23 | | 6 | | 1,168 | Letters of credit | | 1,677 | | 1,677 | | — | | — | Other operating commitments | | 1,280 | | 207 | | 151 | | 922 | Total of other commitments given | | 6,868 | | 2,522 | | 890 | | 3,456 | Mortgages and liens received | | 353 | | 7 | | 69 | | 277 | Other commitments received | | 3,887 | | 2,781 | | 377 | | 729 | Total of commitments received | | 4,240 | | 2,788 | | 446 | | 1,006 |
A. CONTRACTUAL OBLIGATIONS
Debt obligations
“Non-current debt obligations” are included in the items “Non-current financial debt” and “Hedging instruments of non-current financial debt” of the Consolidated Balance Sheet. It includes the non-current portion of swaps hedging bonds, and excludes non-current finance lease obligations of€260 million.
The current portion of non-current debt is included in the items “Current borrowings”, “Current financial assets” and “Other current financial liabilities” of the Consolidated Balance Sheet. It includes the current portion of swaps hedging bonds, and excludes the current portion of finance lease obligations of€22 million.
The information regarding contractual obligations linked to indebtedness is presented in Note 20 to the Consolidated Financial Statements.
Lease contracts
The information regarding operating and finance leases is presented in Note 22 to the Consolidated Financial Statements.
Asset retirement obligations
This item represents the discounted present value of Upstream asset retirement obligations, primarily asset removal costs at the completion date. The information regarding contractual obligations linked to asset retirement obligations is presented in Notes 1Q and 19 to the Consolidated Financial Statements.
Purchase obligations
Purchase obligations are obligations under contractual agreements to purchase goods or services, including capital projects. These obligations are enforceable and legally binding on the company and specify all significant terms, including the amount and the timing of the payments. These obligations mainly include: hydrocarbon unconditional purchase contracts (except where an active, highly-liquid market exists and when the hydrocarbons are expected to be re-sold shortly after purchase), reservation of transport capacities in pipelines, unconditional exploration works and development works in the Upstream segment, and contracts for capital investment projects in the Downstream segment.
B. OTHER COMMITMENTS GIVEN
Guarantees given for excise taxes
They consist of guarantees given to other oil and gas companies in order to comply with French tax authorities’ requirements for oil and gas imports in France. A payment would be triggered by a failure of the guaranteed party with respect to the French tax authorities. The default of the guaranteed parties is however considered to be highly remote by the Group.
Guarantees given against borrowings
The Group guarantees bank debt and finance lease obligations of certain non-consolidated subsidiaries and equity affiliates. Maturity dates vary, and guarantees will terminate on payment and/or cancellation of the obligation. A payment would be triggered by failure of the guaranteed party to fulfill its obligation covered by the guarantee, and no assets are held as collateral for these guarantees. As of December 31, 2009, the maturities of these guarantees are up to 2023.
Indemnities related to sales of businesses
In the ordinary course of business, the Group executes contracts involving standard indemnities in oil industry and indemnities specific to transactions such as sales of businesses. These indemnities might include claims against any of the following: environmental, tax and shareholder matters, intellectual property rights, governmental regulations and employment-related matters, dealer, supplier, and other commercial contractual relationships. Performance under these indemnities would generally be triggered by a breach of terms of the contract or by a third party claim. The Group regularly evaluates the probability of having to incur costs associated with these indemnities.
The guarantees related to antitrust investigations granted as part of the agreement relating to the spin-off of Arkema are described in Note 32 to the Consolidated Financial Statements.
Other guarantees given
Non-consolidated subsidiaries
The Group also guarantees the current liabilities of certain non-consolidated subsidiaries. Performance under these guarantees would be triggered by a financial default of the entity.
Operating agreements
As part of normal ongoing business operations and consistent with generally and accepted recognized industry practices, the Group enters into numerous agreements with other parties. These commitments are often entered into for commercial purposes, for regulatory purposes or for other operating agreements.
24) RELATED PARTIES
The main transactions and balances with related parties (principally non-consolidated subsidiaries and equity affiliates) are detailed as follows:
| | | | | | | Balance sheet As of December 31,(€ million) | | 2009 | | 2008 | | 2007 | Receivables | | | | | | | Debtors and other debtors | | 293 | | 244 | | 277 | Loans (excl. loans to equity affiliates) | | 438 | | 354 | | 378 | Payables | | | | | | | Creditors and other creditors | | 386 | | 136 | | 460 | Debts | | 42 | | 50 | | 28 | Statement of income For the year ended December 31, (€ million) | | 2009 | | 2008 | | 2007 | Sales | | 2,183 | | 3,082 | | 2,635 | Purchases | | 2,958 | | 4,061 | | 3,274 | Financial expense | | 1 | | — | | — | Financial income | | 68 | | 114 | | 29 |
Compensation for the administration and management bodies
The aggregate amount paid directly or indirectly by the French and foreign affiliates of the Company as compensation to the executive officers of TOTAL (the members of the Management Committee and the Treasury) and to the members of the Board of Directors who are employees of the Group, is detailed as follows:
| | | | | | | For the year ended December 31,
(€ million) | | 2009 | | 2008 | | 2007 | Number of people | | 27 | | 30 | | 30 | Direct or indirect compensation | | 19.4 | | 20.4 | | 19.9 | Share-based payments expense (IFRS 2)(a) | | 11.2 | | 16.6 | | 18.4 | Pension expenses(b) | | 10.6 | | 11.9 | | 12.2 |
(a) | Share-based payments expense computed for the executive officers and the members of the Board of Directors who are employees of the Group as described in Note 25 paragraph E to the Consolidated Financial Statements and based on the principles of IFRS 2 “Share-based payments” described in Note 1 paragraph E to the Consolidated Financial Statements. |
(b) | The benefits provided for executive officers and certain members of the Board of Directors, employees and former employees of the Group, include severance to be paid on retirement, supplementary pension schemes and insurance plans, which represent€96.6 million provisioned as of December 31, 2009, against€98.0 million as of December 31, 2008 and€102.9 million as of December 31, 2007. |
25) SHARE-BASED PAYMENTS
A. TOTAL SHARE SUBSCRIPTION OPTION PLANS
| | | | | | | | | | | | | | | | | | | | | | | | | | | | | | Plan 2003 | | | Plan 2004 | | | Plan 2005 | | | Plan 2006 | | | Plan 2007 | | | Plan 2008 | | | Plan 2009 | | | Total | | | Weighted
Average
Exercise
Price | Date of the shareholders’ meeting | | May 17,
2001 |
| | May 14,
2004 |
| | May 14,
2004 |
| | May 14,
2004 |
| | May 11,
2007 |
| | May 11,
2007 |
| | May 11,
2007 |
| | | | | | Date of the award(a) | | July 16,
2003 |
| | July 20,
2004 |
| | July 19,
2005 |
| | July 18,
2006 |
| | July 17,
2007 |
| | October 9,
2008 |
| | September 15,
2009 |
| | | | | | Exercise price until May 23, 2006 included(b) | | 33.30 | | | 39.85 | | | 49.73 | | | | | | | | | | | | | | | | | | | Exercise price since May 24, 2006(b) | | 32.84 | | | 39.30 | | | 49.04 | | | 50.60 | | | 60.10 | | | 42.90 | | | 39.90 | | | | | | | Expiry date | | July 16,
2011 |
| | July 20,
2012 |
| | July 19,
2013 |
| | July 18,
2014 |
| | July 17,
2015 |
| | October 9,
2016 |
| | September 15,
2017 |
| | | | | | Number of options(c) | | | | | | | | | | | | | | | | | | | | | | | | | | | Existing options as of January 1, 2007 | | 10,608,590 | | | 13,430,372 | | | 6,275,757 | | | 5,726,160 | | | — | | | — | | | — | | | 36,040,879 | | | 40.89 | Granted | | — | | | — | | | — | | | — | | | 5,937,230 | | | — | | | — | | | 5,937,230 | | | 60.10 | Cancelled | | (22,138 | ) | | (20,093 | ) | | (11,524 | ) | | (13,180 | ) | | (17,125 | ) | | — | | | — | | | (84,060 | ) | | 44.94 | Exercised | | (2,218,074 | ) | | (213,043 | ) | | (20,795 | ) | | (1,920 | ) | | — | | | — | | | — | | | (2,453,832 | ) | | 33.55 | Existing options as of January 1, 2008 | | 8,368,378 | | | 13,197,236 | | | 6,243,438 | | | 5,711,060 | | | 5,920,105 | | | — | | | — | | | 39,440,217 | | | 44.23 | Granted | | — | | | — | | | — | | | — | | | — | | | 4,449,810 | | | — | | | 4,449,810 | | | 42.90 | Cancelled | | (25,184 | ) | | (118,140 | ) | | (34,032 | ) | | (53,304 | ) | | (34,660 | ) | | (6,000 | ) | | — | | | (271,320 | ) | | 44.88 | Exercised | | (841,846 | ) | | (311,919 | ) | | (17,702 | ) | | (6,700 | ) | | — | | | — | | | — | | | (1,178,167 | ) | | 34.89 | Existing options as of January 1, 2009 | | 7,501,348 | | | 12,767,177 | | | 6,191,704 | | | 5,651,056 | | | 5,885,445 | | | 4,443,810 | | | — | | | 42,440,540 | | | 44.35 | Granted | | — | | | — | | | — | | | — | | | — | | | — | | | 4,387,620 | | | 4,387,620 | | | 39.90 | Cancelled | | (8,020 | ) | | (18,387 | ) | | (6,264 | ) | | (5,370 | ) | | (13,780 | ) | | (2,180 | ) | | (10,610 | ) | | (64,611 | ) | | 45.04 | Exercised | | (681,699 | ) | | (253,081 | ) | | — | | | — | | | — | | | — | | | — | | | (934,780 | ) | | 34.59 | Existing options as of December 31, 2009 | | 6,811,629 | | | 12,495,709 | | | 6,185,440 | | | 5,645,686 | | | 5,871,665 | | | 4,441,630 | | | 4,377,010 | | | 45,828,769 | | | 44.12 |
(a) | The grant date corresponds to the date of the Board of Directors meeting that awarded the options, except for the options awarded by the Board of Directors at their meeting of September 9, 2008, and granted on October 9, 2008. |
(b) | Exercise price in euro. The exercise prices of TOTAL subscription shares of the plans in force at that date were multiplied by 0.25 to take into account the four-for-one stock split on May 18, 2006. Moreover, following the spin-off of Arkema, the exercise prices of TOTAL subscription shares of these plans were multiplied by an adjustment factor equal to 0.986147 with effect as of May 24, 2006. |
(c) | The number of options awarded, outstanding, cancelled or exercised before May 23, 2006 included, was multiplied by four to reflect the four-for-one stock split approved by the shareholders’ meeting on May 12, 2006. |
The options, subject to a continued employment condition, are exercisable only after a 2-year period from the date of the Board meeting awarding the options and must be exercised within eight years from this date. Underlying shares may not be sold for four years from the date of grant. For the options of the 2007, 2008 and 2009 Plans, beneficiaries working for a non-French subsidiary as of the grant date are authorized to transfer the shares issued upon exercise of options starting after a 2-year period from the grant date.
The continued employment condition states that the termination of the employment contract will result in the employee losing the right to exercise the options.
For the 2009 Plan, the Board of Directors decided that for each beneficiary other than the CEO of more than 25,000 stock options, one third of the options in excess of this number finally awarded following the 2-year vesting period will be subject to a performance condition. This condition is based on the average of the Return On Equity (ROE) of the Group. The average ROE is calculated based on the consolidated accounts published by TOTAL for fiscal years 2009 and 2010. The acquisition rate:
is equal to zero if the average ROE is less than or equal to 7%;
varies on straight-line basis between 0% and 100% if the average ROE is greater than 7% and less than 18%; and
is equal to 100% if the average ROE is greater than or equal to 18%.
Furthermore, the Board of Directors decided that the number of options awarded to the CEO is subject to two performance conditions:
For 50% of the options granted, the performance condition states that the number of options finally granted is based on the average ROE of the Group. The average ROE is calculated based on the consolidated accounts published by TOTAL for
| | fiscal years 2009 and 2010. The acquisition rates equal to zero if the average ROE is less than or equal to 7%; varies on a straight-line basis between 0% and 100% if the average ROE is greater than 7% and less than 18%; and is equal to 100% if the average ROE is greater than or equal to 18%.
|
For the other 50% of the options granted, the performance condition states that the number of options finally granted is based on the average of the Return On Average Capital Employed (ROACE) of the Group. The average ROACE is calculated based on the consolidated accounts published by TOTAL for fiscal years 2009 and 2010. The acquisition rate is equal to zero if the average ROACE is less than or equal to 6%; varies on a straight-line basis between 0% and 100% if the average ROACE is greater than 6% and less than 15%; and is equal to 100% if the average ROACE is greater than or equal to 15%.
For the 2007 and 2008 Plans, the Board of Directors decided that for each beneficiary of more than 25,000 stock options, one third of the options in excess of this number finally awarded following the 2-year vesting period will be subject to a performance condition. This condition states that the number of subscription options finally granted is based on the ROE of the Group. The ROE is calculated based on the consolidated accounts published by TOTAL for the fiscal year preceding the final grant. The acquisition rate:
is equal to zero if the ROE is less than or equal to 10%;
varies on a straight-line basis between 0% and 80% if the ROE is greater than 10% and less than 18%;
varies on a straight-line basis between 80% and 100% if the ROE is greater than or equal to 18% and less than 30%; and
is equal to 100% if the ROE is greater than or equal to 30%.
For the 2007 Plan, the acquisition rate of the options, linked to the performance condition, amounted to 100%.
B. TOTAL SHARE PURCHASE OPTION PLANS
| | | | | | | | | | | | | | | | | | | | | 1999 Plan(a) | | | 2000 Plan(b) | | | 2001 Plan(c) | | | 2002 Plan(d) | | | Total | | | Weighted
Average
Exercise
Price | Date of the shareholders’ meeting | | May 21, 1997 | | | May 21, 1997 | | | May 17, 2001 | | | May 17, 2001 | | | | | | | Date of the award(e) | | June 15, 1999 | | | July 11, 2000 | | | July 10, 2001 | | | July 9, 2002 | | | | | | | Exercise price until May 23, 2006 included(f) | | 28.25 | | | 40.68 | | | 42.05 | | | 39.58 | | | | | | | Exercise price since May 24, 2006(f) | | 27.86 | | | 40.11 | | | 41.47 | | | 39.03 | | | | | | | Expiry date | | June 15, 2007 | | | July 11, 2008 | | | July 10, 2009 | | | July 9, 2010 | | | | | | | Number of options(g) | | | | | | | | | | | | | | | | | | Existing options as of January 1, 2007 | | 1,370,424 | | | 4,928,505 | | | 6,861,285 | | | 9,280,716 | | | 22,440,930 | | | 39.33 | Granted | | — | | | — | | | — | | | — | | | — | | | — | Cancelled | | (138,023 | ) | | (3,452 | ) | | (7,316 | ) | | (7,104 | ) | | (155,895 | ) | | 29.28 | Exercised | | (1,232,401 | ) | | (1,782,865 | ) | | (1,703,711 | ) | | (2,210,429 | ) | | (6,929,406 | ) | | 37.92 | Existing options as of January 1, 2008 | | — | | | 3,142,188 | | | 5,150,258 | | | 7,063,183 | | | 15,355,629 | | | 40.07 | Granted | | — | | | — | | | — | | | — | | | — | | | — | Cancelled | | — | | | (480,475 | ) | | (3,652 | ) | | (13,392 | ) | | (497,519 | ) | | 40.09 | Exercised | | — | | | (2,661,713 | ) | | (455,180 | ) | | (598,934 | ) | | (3,715,827 | ) | | 40.10 | Existing options as of January 1, 2009 | | — | | | — | | | 4,691,426 | | | 6,450,857 | | | 11,142,283 | | | 40.06 | Granted | | — | | | — | | | — | | | — | | | — | | | — | Cancelled | | — | | | — | | | (4,650,446 | ) | | (7,920 | ) | | (4,658,366 | ) | | 41.47 | Exercised | | — | | | — | | | (40,980 | ) | | (507,676 | ) | | (548,656 | ) | | 39.21 | Existing options as of December 31, 2009 | | — | | | — | | | — | | | 5,935,261 | | | 5,935,261 | | | 39.03 |
(a) | The options, subject to a continued employment condition, were exercisable only after a 5-year period from the date of the Board meeting awarding the options and had to be exercised within eight years from the grant date. This plan expired on June 15, 2007. |
(b) | The options, subject to a continued employment condition, were exercisable only after a 4-year period from the date of the Board meeting awarding the options and had to be exercised within eight years from the grant date. The shares arising from the exercise of options may not be sold for five years from the grant date. This plan expired on July 11, 2008. |
(c) | The options, subject to a continued employment condition, were exercisable only after a 3.5-year period from the date of the Board meeting awarding the options and had to be exercised within eight years from the grant date. The shares arising from the exercise of options may not be sold for four years from the grant date. This plan expired on July 10, 2009. |
(d) | The options, subject to a continued employment condition, are exercisable only after a 2-year period from the date of the Board meeting awarding the options and must be exercised within eight years from the grant date. Underlying shares may not be sold for four years from the grant date. |
(e) | The date of award is the date of the Board of Directors meeting that awarded the options. |
(f) | Exercise price in euro. The exercise prices of TOTAL share purchase options of the plans at that date were multiplied by 0.25 to take into account the four-for-one stock split on May 18, 2006. Moreover, following the spin-off of Arkema, the exercise prices of TOTAL share purchase options of these plans were multiplied by an adjustment factor equal to 0.986147 with effect as of May 24, 2006. |
(g) | The number of options awarded, outstanding, cancelled or exercised before May 23, 2006 included, was multiplied by four to reflect the four-for-one stock split approved by the shareholders’ meeting on May 12, 2006. |
C. EXCHANGE GUARANTEE GRANTED TO THE HOLDERS OF ELF AQUITAINE SHARE SUBSCRIPTION OPTIONS
Pursuant to the public exchange offer for Elf Aquitaine shares which was made in 1999, the Group made a commitment to guarantee the holders of Elf Aquitaine share subscription options, at the end of the period referred to in Article 163 bis C of the French Tax Code (CGI), and until the end of the period for the exercise of the options, the possibility to exchange their future Elf Aquitaine shares for TOTAL shares, on the basis of the exchange ratio of the offer (nineteen TOTAL shares for thirteen Elf Aquitaine shares).
In order to take into account the spin-off of S.D.A. (Société de Développement Arkema) by Elf Aquitaine, the spin-off of Arkema by TOTAL S.A. and the four-for-one TOTAL stock split, the Board of Directors of TOTAL S.A., in accordance with the terms of the share exchange undertaking, approved on March 14, 2006 to adjust the exchange ratio described above (see pages 24 and 25 of the “Prospectus for the purpose of listing Arkema shares on Euronext Paris in connection with the allocation of Arkema shares to TOTAL S.A. shareholders”). Following the approval by Elf Aquitaine shareholders’ meeting on May 10, 2006 of the spin-off of S.D.A. by Elf Aquitaine, the approval by TOTAL S.A. shareholders’ meeting on May 12, 2006 of the spin-off of Arkema by TOTAL S.A. and the four-for-one TOTAL stock split, the exchange ratio was adjusted to six TOTAL shares for one Elf Aquitaine share on May 22, 2006.
During 2009, 75,699 options were exercised and 80,005 Elf Aquitaine shares were exchanged based on the exchange ratio of six TOTAL shares for one Elf Aquitaine share as adjusted on May 22, 2006.
As of December 31, 2009, this exchange guarantee is not in effect and all Elf Aquitaine subscription plans have expired. Therefore, no Elf Aquitaine shares are covered by the exchange guarantee.
| | | | | | | | | | Elf Aquitaine subscription plan(a) | | 1999 Plan n°1 | | 1999 Plan n°2 | | Total | | Weighted-
average
exercise price(b) | Exercise price until May 23, 2006 included(b) | | 115.60 | | 171.60 | | | | | Exercise price since May 24, 2006(b) | | 114.76 | | 170.36 | | | | | Expiration date | | 03/30/2009 | | 09/12/2009 | | | | | Outstanding position as of January 1, 2009 | | 90,342 | | 6,044 | | 96,386 | | 118.25 | | Outstanding Elf Aquitaine shares covered by the exchange guarantee as of January 1, 2009 | | 5,295 | | — | | 5,295 | | | | Number of options exercised in 2009 | | 69,655 | | 6,044 | | 75,699 | | 119.20 | | Number of shares exchanged in 2009 | | 73,961 | | 6,044 | | 80,005 | | | | Outstanding position as of December 31, 2009 | | — | | — | | — | | | | Total of Elf Aquitaine shares, either outstanding or to be created, covered by the exchange guarantee for TOTAL shares as of December 31, 2009 | | — | | — | | | | | | TOTAL shares likely to be created within the scope of the application of the exchange guarantee as of December 31, 2009 | | — | | — | | | | |
(a) | Adjustments of the number of options approved by the Board of Directors of Elf Aquitaine on March 10, 2006 in application of articles 174-9, 174-12 and 174-13 of the decree No. 67-236 of March 23, 1967 in force on March 10, 2006 and during Elf Aquitaine shareholders’ meeting on May 10, 2006, as part of the spin-off of SDA. These adjustments have been made on May 22, 2006 with effect as of May 24, 2006. |
(b) | Exercise price in euro. To take into account the spin-off of S.D.A., the exercise prices of Elf Aquitaine share subscription options were multiplied by an adjustment factor equal to 0.992769 with effect on May 24, 2006. |
D. TOTAL RESTRICTED SHARE GRANTS
| | | | | | | | | | | | | | | | | | | | | | 2005 Plan(a) | | | 2006 Plan | | | 2007 Plan | | | 2008 Plan | | | 2009 Plan | | | Total | | Date of the shareholders’ meeting | | May 17, 2005 | | | May 17, 2005 | | | May 17, 2005 | | | May 16, 2008 | | | May 16, 2008 | | | | | Date of the award(b) | | July 19, 2005 | | | July 18, 2006 | | | July 17, 2007 | | | October 9,
2008 |
| | September 15,
2009 |
| | | | Date of the final award (end of the vesting period) | | July 20, 2007 | | | July 19, 2008 | | | July 18, 2009 | | | October 10,
2010 |
| | September 16,
2011 |
| | | | Transfer authorized as from | | July 20, 2009 | | | July 19, 2010 | | | July 18, 2011 | | | October 10,
2012 |
| | September 16,
2013 |
| | | | Number of restricted shares | | | | | | | | | | | | | | | | | | | Outstanding as of January 1, 2007 | | 2,267,096 | | | 2,272,296 | | | — | | | — | | | — | | | 4,539,392 | | Notified | | — | | | — | | | 2,366,365 | | | — | | | — | | | 2,366,365 | | Cancelled | | (38,088 | ) | | (6,212 | ) | | (2,020 | ) | | — | | | — | | | (46,320 | ) | Finally granted(c) | | (2,229,008 | ) | | (2,128 | ) | | (1,288 | ) | | — | | | — | | | (2,232,424 | ) | Outstanding as of January 1, 2008 | | — | | | 2,263,956 | | | 2,363,057 | | | — | | | — | | | 4,627,013 | | Notified | | — | | | — | | | — | | | 2,791,968 | | | — | | | 2,791,968 | | Cancelled(d) | | 2,840 | | | (43,822 | ) | | (29,504 | ) | | (19,220 | ) | | — | | | (89,706 | ) | Finally granted (c)(d) | | (2,840 | ) | | (2,220,134 | ) | | (336 | ) | | — | | | — | | | (2,223,310 | ) | Outstanding as of January 1, 2009 | | — | | | — | | | 2,333,217 | | | 2,772,748 | | | — | | | 5,105,965 | | Notified | | — | | | — | | | | | | — | | | 2,972,018 | | | 2,972,018 | | Cancelled | | 1,928 | | | 2,922 | | | (12,418 | ) | | (9,672 | ) | | (5,982 | ) | | (23,222 | ) | Finally granted(c)(d) | | (1,928 | ) | | (2,922 | ) | | (2,320,799 | ) | | (600 | ) | | — | | | (2,326,249 | ) | Outstanding as of December 31, 2009 | | — | | | — | | | — | | | 2,762,476 | | | 2,966,036 | | | 5,728,512 | |
(a) | The number of restricted shares was multiplied by four on May 18, 2006, to take into account the four-for-one stock split approved by the shareholders’ meeting. |
(b) | The grant date corresponds to the date of the Board of Directors meeting that awarded the options, except for the options awarded by the Board of Directors at their meeting of September 9, 2008, and granted on October 9, 2008. |
(c) | Restricted shares finally granted following the death of their beneficiaries (2005, 2006 and 2007 Plans for fiscal year 2007, 2007 Plan for fiscal year 2008, 2008 Plan for fiscal year 2009). |
(d) | For the 2005 Plan and 2006 Plan: final restricted share grants for which entitlement right had been cancelled erroneously. |
The grant of restricted shares, which are bought back by the Company on the market, becomes final after a 2-year vesting period (acquisition of the right to restricted shares). The final grant of these shares is subject to a continued employment condition and a performance condition. Moreover, the transfer of the restricted shares, that were definitely granted, will not be permitted between the date of final grant and the end of a two-year mandatory holding period.
The continued employment condition states that the termination of the employment contract during the vesting period will also terminate the grantee’s right to a restricted share grant.
For the 2009 Plan, the performance condition approved by the Board of Directors states that the half of the number of restricted shares finally granted above 100 shares is based on the average ROE of the Group. The average ROE is calculated based on the consolidated accounts published by TOTAL for fiscal years 2009 and 2010. The acquisition rate:
is equal to zero if the average ROE is less than or equal to 7%;
varies on a straight-line basis between 0% and 100% if the average ROE is greater than 7% and less than 18%; and
is equal to 100% if the average ROE is greater than or equal to 18%.
For the 2007 and 2008 Plans, the performance condition approved by the Board of Directors states that the number of restricted shares finally granted is based on the ROE of the Group. The ROE is calculated based on the consolidated accounts published by TOTAL for the fiscal year preceding the final grant. This acquisition rate:
is equal to zero if the ROE is less than or equal to 10%;
varies on a straight-line basis between 0% and 80% if the ROE is greater than 10% and less than 18%;
varies on a straight-line basis between 80% and 100% if the ROE is greater than or equal to 18% and less than 30%; and
is equal to 100% if the ROE is more than or equal to 30%.
For the 2005, 2006 and 2007 Plans, the acquisition rate of the granted shares, linked to the performance condition, amounted to 100%.
E. SHARE-BASED PAYMENT EXPENSE
Share-based payment expense before tax for the year 2009 amounts to€106 million and can be broken down as follows:
€38 million for TOTAL share subscription plans; and
€68 million for TOTAL restricted shares plans.
Share-based payment expense before tax for the year 2008 amounted to€154 million and can be broken down as follows:
€61 million for TOTAL share subscription plans;
€105 million for TOTAL restricted shares plans; and
€(12) million for the adjustment to the expense booked in 2007 related to TOTAL capital increase reserved for employees (see Note 17 to the Consolidated Financial Statements).
Share-based payment expense before tax for the year 2007 amounted to€196 million and can be broken down as follows:
€65 million for TOTAL share subscription plans;
€109 million for TOTAL restricted shares plans; and
€22 million for TOTAL capital increase reserved for employees (see Note 17 to the Consolidated Financial Statements).
The fair value of the options granted in 2009, 2008 and 2007 has been measured according to the Black- Scholes method and based on the following assumptions:
| | | | | | | | For the year ended December 31, | | 2009 | | 2008 | | 2007 | Risk free interest rate (%)(a) | | 2.9 | | 4.3 | | 4.9 | Expected dividends (%)(b) | | 4.8 | | 8.4 | | 3.9 | Expected volatility (%)(c) | | 31.0 | | 32.7 | | 25.3 | Vesting period (years) | | 2 | | 2 | | 2 | Exercise period (years) | | 8 | | 8 | | 8 | Fair value of the granted options (€ per option) | | 8.4 | | 5.0 | | 13.9 |
(a) | Zero coupon Euro swap rate at 6 years. |
(b) | The expected dividends are based on the price of TOTAL share derivatives traded on the markets. |
(c) | The expected volatility is based on the implied volatility of TOTAL share options and of share indices options traded on the markets. |
The cost of capital increases reserved for employees is reduced to take into account the nontransferability of the shares that could be subscribed by the employees over a period of five years. The valuation method of nontransferability of the shares is based on a strategy cost in two steps consisting, first, in a five years forward sale of the nontransferable shares, and second, in purchasing the same number of shares in cash with a loan financing reimbursable “in fine”. During the year 2007, the main assumptions used for the valuation of the cost of capital increase reserved for employees were the following:
| | | For the year ended December 31,27) | STATEMENT OF CASH FLOWS |
| 2007 | Date of the Board of Directors meeting that decided the issue
A) | | November 6, 2007 | Subscription price (€Cash flow from operating activities)
| | 44.4 | Share price at the date of the Board meeting (€)
| | 54.6 | Number of shares (in millions)(a)
| | 10.6 | Risk free interest rate (%)(b)
| | 4.1 | Employees loan financing rate (%)(c)
| | 7.5 | Non transferability cost (% of the share price at the date of the Board meeting)
| | 14.9 | Expense amount (€ per share)
| | 2.1 |
(a) | The estimated expense as of December 31, 2007 was based on a subscription of the capital increase reserved for employees for 10.6 million shares. The subscription was opened from March 10 to 28, 2008 included, leading to the creation of 4,870,386 TOTAL shares in 2008 (see Note 17 to the Consolidated Financial Statements). |
(b) | The risk-free interest rate is based on the French Treasury bonds rate for the appropriate maturity. |
(c) | The employees loan financing rate is based on a 5 year consumer’s credit rate. |
26) PAYROLL AND STAFF
| | | | | | | For the year ended
December 31, (€ million) | | 2009 | | 2008 | | 2007 | Personnel expenses(a) | | | | | | | Wages and salaries (including social charges) | | 6,177 | | 6,014 | | 6,058 | Group employees(a) | | | | | | | France | | | | | | | • Management | | 10,906 | | 10,688 | | 10,517 | • Other | | 25,501 | | 26,413 | | 26,779 | International | | | | | | | • Management | | 15,243 | | 14,709 | | 14,225 | • Other | | 44,737 | | 45,149 | | 44,921 | Total | | 96,387 | | 96,959 | | 96,442 |
(a) | Number of employees and personnel expenses of fully consolidated subsidiaries. |
27) STATEMENT OF CASH FLOWS
A) Cash flow from operating activities
The following table gives additional information on cash paid or received in the cash flow from operating activities: | | | | | | | | | | For the year ended
December 31, (€ million) | | 2009 | | | 2008 | | | 2007 | | Interests paid | | (678 | ) | | (958 | ) | | (1,680 | ) | Interests received | | 148 | | | 505 | | | 1,277 | | Income tax paid | | (6,202 | ) | | (10,631 | ) | | (9,687 | ) | Dividends received | | 1,456 | | | 1,590 | | | 1,109 | |
| | | | | | | | | | | | | | For the year ended December 31, (M€) | | 2010 | | | 2009 | | | 2008 | | | Interests paid | | | (470 | ) | | | (678 | ) | | | (958 | ) | | Interests received | | | 132 | | | | 148 | | | | 505 | | | Income tax paid | | | (6,990 | ) | | | (6,202 | ) | | | (10,631 | ) | | Dividends received | | | 1,722 | | | | 1,456 | | | | 1,590 | | | | | | | | | | | | | | | |
Changes in working capital are detailed as follows: | | | | | | | | | | For the year ended
December 31,(€ million) | | 2009 | | | 2008 | | | 2007 | | Inventories | | (4,217 | ) | | 4,020 | | | (2,706 | ) | Accounts receivable | | (344 | ) | | 3,222 | | | (2,963 | ) | Other current assets | | 1,505 | | | (982 | ) | | (1,341 | ) | Accounts payable | | 571 | | | (3,056 | ) | | 4,508 | | Other creditors and accrued liabilities | | (831 | ) | | (633 | ) | | 1,026 | | Net amount | | (3,316 | ) | | 2,571 | | | (1,476 | ) |
B) Cash flow used in financing activities
| | | | | | | | | | | | | | | For the year ended December 31, (M€) | | 2010 | | | 2009 | | | 2008 | | | Inventories | | | (1,896 | ) | | | (4,217 | ) | | | 4,020 | | | Accounts receivable | | | (2,712 | ) | | | (344 | ) | | | 3,222 | | | Other current assets | | | 911 | | | | 1,505 | | | | (982 | ) | | Accounts payable | | | 2,482 | | | | 571 | | | | (3,056 | ) | | Other creditors and accrued liabilities | | | 719 | | | | (831 | ) | | | (633 | ) | | | | | | | | | | | | | | | Net amount | | | (496 | ) | | | (3,316 | ) | | | 2,571 | | | | | | | | | | | | | | | |
| | | B) | Cash flow used in financing activities |
Changes in non-current financial debt are detailed in the following table under a net value due to the high number of multiple drawings: | | | | | | | | | | For the year ended
December 31, (€ million) | | 2009 | | | 2008 | | | 2007 | | Issuance of non-current debt | | 6,309 | | | 5,513 | | | 3,313 | | Repayment of non-current debt | | (787 | ) | | (2,504 | ) | | (93 | ) | Net amount | | 5,522 | | | 3,009 | | | 3,220 | |
C) Cash and cash equivalents
| | | | | | | | | | | | | | | For the year ended December 31, (M€) | | 2010 | | | 2009 | | | 2008 | | | Issuance of non-current debt | | | 3,995 | | | | 6,309 | | | | 5,513 | | | Repayment of non-current debt | | | (206 | ) | | | (787 | ) | | | (2,504 | ) | | | | | | | | | | | | | | | Net amount | | | 3,789 | | | | 5,522 | | | | 3,009 | | | | | | | | | | | | | | | |
| | | C) | Cash and cash equivalents |
Cash and cash equivalents are detailed as follows: | | | | | | | For the year ended
December 31, (€ million) | | 2009 | | 2008 | | 2007 | Cash | | 2,448 | | 1,836 | | 1,930 | Cash equivalents | | 9,214 | | 10,485 | | 4,058 | Total | | 11,662 | | 12,321 | | 5,988 |
| | | | | | | | | | | | | | | For the year ended December 31, (M€) | | 2010 | | | 2009 | | | 2008 | | | Cash | | | 4,679 | | | | 2,448 | | | | 1,836 | | | Cash equivalents | | | 9,810 | | | | 9,214 | | | | 10,485 | | | | | | | | | | | | | | | | Total | | | 14,489 | | | | 11,662 | | | | 12,321 | | | | | | | | | | | | | | | |
Cash equivalents are mainly composed of deposits less than three months deposited in government institutions or deposit banks selected in accordance with strict criteria.
F-73
28) FINANCIAL ASSETS AND LIABILITIES ANALYSIS PER INSTRUMENTS CLASS AND STRATEGY
| | | 28) | FINANCIAL ASSETS AND LIABILITIES ANALYSIS PER INSTRUMENTS CLASS AND STRATEGY |
The financial assets and liabilities disclosed on the face of the balance sheet are detailed as follows: | | | | | | | | | | | | | | | | | | | | | | | | | | | | | As of December 31, 2009 (€ million) Assets/(Liabilities) | | Financial instruments related to financing and trading activities | | | Other financial
instruments | | | Total | | | Fair value | | | | | Amortized
cost | | | Fair value | | | | | | | | | | | | | | | | | Available for sale(a) | | Held for
trading | | | Financial
debt(b) | | | Hedging of
financial debt | | | Cash flow
hedge | | Net investment hedge and other | | | | | | | | | | | Equity affiliates: loans | | 2,367 | | | | | | | | | | | | | | | | | | | | | | 2,367 | | | 2,367 | | Other investments | | | | | 1,162 | | | | | | | | | | | | | | | | | | | 1,162 | | | 1,162 | | Hedging instruments of non-current financial debt | | | | | | | | | | | | | 889 | | | 136 | | | | | | | | 1,025 | | | 1,025 | | Other non-current assets | | 1,284 | | | | | | | | | | | | | | | | | | | | | | 1,284 | | | 1,284 | | Accounts receivable, net | | | | | | | | | | | | | | | | | | | | | 15,719 | | | 15,719 | | | 15,719 | | Other operating receivables | | | | | | | 1,029 | | | | | | | | | | | | | | 4,116 | | | 5,145 | | | 5,145 | | Current financial assets | | 55 | | | | | 53 | | | | | | 197 | | | | | 6 | | | | | | 311 | | | 311 | | Cash and cash equivalents | | | | | | | | | | | | | | | | | | | | | 11,662 | | | 11,662 | | | 11,662 | | Total financial assets | | 3,706 | | | 1,162 | | 1,082 | | | — | | | 1,086 | | | 136 | | 6 | | | 31,497 | | | 38,675 | | | 38,675 | | Total non-financial assets | | | | | | | | | | | | | | | | | | | | | | | | 89,078 | | | | | Total assets | | | | | | | | | | | | | | | | | | | | | | | | 127,753 | | | | | | | | | | | | | | | | Non-current financial debt | | (389 | ) | | | | | | | (18,807 | ) | | (241 | ) | | | | | | | | | | (19,437 | ) | | (19,437 | ) | Accounts payable | | | | | | | | | | | | | | | | | | | | | (15,383 | ) | | (15,383 | ) | | (15,383 | ) | Other operating liabilities | | | | | | | (923 | ) | | | | | | | | | | | | | (3,783 | ) | | (4,706 | ) | | (4,706 | ) | Current borrowings | | (4,849 | ) | | | | | | | (2,145 | ) | | | | | | | | | | | | | (6,994 | ) | | (6,994 | ) | Other current financial liabilities | | | | | | | (25 | ) | | | | | (97 | ) | | | | (1 | ) | | | | | (123 | ) | | (123 | ) | Total financial liabilities | | (5,238 | ) | | | | (948 | ) | | (20,952 | ) | | (338 | ) | | — | | (1 | ) | | (19,166 | ) | | (46,643 | ) | | (46,643 | ) | Total non-financial liabilities | | | | | | | | | | | | | | | | | | | | | | | | (81,110 | ) | | | | Total liabilities | | | | | | | | | | | | | | | | | | | | | | | | (127,753 | ) | | | |
| | | | | | | | | | | | | | | | | | | | | | | | | | | | | | | | | | | | | | | | | | | | | | | | Other financial
| | | | | | Fair
| | | | | Financial instruments related to financing and trading activities | | | instruments | | | Total | | | value | | | | | | | | | | | As of December 31, 2010 | | Amortized
| | | Fair
| | | | | | | | | | | (M€)
| | cost | | | value | | | | | | | | | | | Assets /
| | | | | Available
| | | Held for
| | | | | | Hedging of
| | | Cash
| | | Net investment
| | | | | | | | | | | | (Liabilities) | | | | | for sale(a) | | | trading | | | Financial debt(b) | | | financial debt | | | flow hedge | | | hedge and other | | | | | | | | | | | | Equity affiliates: | | | | | | | | | | | | | | | | | | | | | | | | | | | | | | | | | | | | | | | | | | loans | | | 2,383 | | | | | | | | | | | | | | | | | | | | | | | | | | | | | | | | 2,383 | | | | 2,383 | | | Other investments | | | | | | | 4,590 | | | | | | | | | | | | | | | | | | | | | | | | | | | | 4,590 | | | | 4,590 | | | Hedging instruments of non-current financial debt | | | | | | | | | | | | | | | | | | | 1,814 | | | | 56 | | | | | | | | | | | | 1,870 | | | | 1,870 | | | Other non-current assets | | | 1,596 | | | | | | | | | | | | | | | | | | | | | | | | | | | | | | | | 1,596 | | | | 1,596 | | | Accounts receivable, net | | | | | | | | | | | | | | | | | | | | | | | | | | | | | | | 18,159 | | | | 18,159 | | | | 18,159 | | | Other operating receivables | | | | | | | | | | | 499 | | | | | | | | | | | | | | | | | | | | 3,908 | | | | 4,407 | | | | 4,407 | | | Current financial assets | | | 869 | | | | | | | | 38 | | | | | | | | 292 | | | | | | | | 6 | | | | | | | | 1,205 | | | | 1,205 | | | Cash and cash equivalents | | | | | | | | | | | | | | | | | | | | | | | | | | | | | | | 14,489 | | | | 14,489 | | | | 14,489 | | | | | | | | | | | | | | | | | | | | | | | | | | | | | | | | | | | | | | | | | | | | Total financial assets | | | 4,848 | | | | 4,590 | | | | 537 | | | | — | | | | 2,106 | | | | 56 | | | | 6 | | | | 36,556 | | | | 48,699 | | | | 48,699 | | | | | | | | | | | | | | | | | | | | | | | | | | | | | | | | | | | | | | | | | | | | Total non-financial assets | | | | | | | | | | | | | | | | | | | | | | | | | | | | | | | | | | | 95,019 | | | | | | | | | | | | | | | | | | | | | | | | | | | | | | | | | | | | | | | | | | | | | | | | Total assets | | | | | | | | | | | | | | | | | | | | | | | | | | | | | | | | | | | 143,718 | | | | | | | | | | | | | | | | | | | | | | | | | | | | | | | | | | | | | | | | | | | | | | | | | | | | | | | | | | | | | | | | | | | | | | | | | | | | | | | | | | | | | | | | | | | Non-current financial | | | (3,186 | ) | | | | | | | | | | | (17,419 | ) | | | (178 | ) | | | | | | | | | | | | | | | (20,783 | ) | | | (21,172 | ) | | debt | | | | | | | | | | | | | | | | | | | | | | | | | | | | | | | | | | | | | | | | | | Accounts payable | | | | | | | | | | | | | | | | | | | | | | | | | | | | | | | (18,450 | ) | | | (18,450 | ) | | | (18,450 | ) | | Other operating | | | | | | | | | | | (559 | ) | | | | | | | | | | | | | | | | | | | (3,015 | ) | | | (3,574 | ) | | | (3,574 | ) | | liabilities | | | | | | | | | | | | | | | | | | | | | | | | | | | | | | | | | | | | | | | | | | Current borrowings | | | (5,916 | ) | | | | | | | | | | | (3,737 | ) | | | | | | | | | | | | | | | | | | | (9,653 | ) | | | (9,653 | ) | | Other current financial liabilities | | | | | | | | | | | (147 | ) | | | | | | | (12 | ) | | | | | | | — | | | | | | | | (159 | ) | | | (159 | ) | | | | | | | | | | | | | | | | | | | | | | | | | | | | | | | | | | | | | | | | | | | Total financial liabilities | | | (9,102 | ) | | | | | | | (706 | ) | | | (21,156 | ) | | | (190 | ) | | | — | | | | — | | | | (21,465 | ) | | | (52,619 | ) | | | (53,008 | ) | | | | | | | | | | | | | | | | | | | | | | | | | | | | | | | | | | | | | | | | | | | Total non-financial liabilities | | | | | | | | | | | | | | | | | | | | | | | | | | | | | | | | | | | (91,099 | ) | | | | | | | | | | | | | | | | | | | | | | | | | | | | | | | | | | | | | | | | | | | | | | | Total liabilities | | | | | | | | | | | | | | | | | | | | | | | | | | | | | | | | | | | (143,718 | ) | | | | |
(a) | | | | (a) | | Financial assets available for sale are measured at their fair value except for unlisted securities (see Note 1 paragraph M(ii) and Note 13 to the Consolidated Financial Statements). |
| (b) | | The financial debt is adjusted to the hedged risks value (currency and interest rate) as part of hedge accounting (see Note 1 paragraph M(iii) to the Consolidated Financial Statements). |
F-74
| | | | | | | | | | | | | | | | | | | | | | | | | | | | As of December 31, 2008 (€ million) Assets/(Liabilities) | | Financial instruments related to financing and trading activities | | Other financial
instruments | | | Total | | | Fair value | | | | | Amortized
cost | | | Fair value | | | | | | | | | | | | | | | | Available for sale(a) | | Held for
trading | | | Financial
debt(b) | | | Hedging of
financial debt | | | Cash flow
hedge | | Net investment
hedge and other | | | | | | | | | | Equity affiliates: loans | | 2,005 | | | | | | | | | | | | | | | | | | | | | 2,005 | | | 2,005 | | Other investments | | | | | 1,165 | | | | | | | | | | | | | | | | | | 1,165 | | | 1,165 | | Hedging instruments of non-current financial debt | | | | | | | | | | | | | 892 | | | | | | | | | | 892 | | | 892 | | Other non-current assets | | 1,403 | | | | | | | | | | | | | | | | | | | | | 1,403 | | | 1,403 | | Accounts receivable, net | | | | | | | — | | | | | | | | | | | | | 15,287 | | | 15,287 | | | 15,287 | | Other operating receivables | | | | | | | 1,664 | | | | | | | | | | | | | 4,544 | | | 6,208 | | | 6,208 | | Current financial assets | | 1 | | | | | 86 | | | | | | 100 | | | | | — | | | | | 187 | | | 187 | | Cash and cash equivalents | | | | | | | | | | | | | | | | | | | | 12,321 | | | 12,321 | | | 12,321 | | Total financial assets | | 3,409 | | | 1,165 | | 1,750 | | | — | | | 992 | | | — | | — | | 32,152 | | | 39,468 | | | 39,468 | | Total non-financial assets | | | | | | | | | | | | | | | | | | | | | | | 78,842 | | | | | Total assets | | | | | | | | | | | | | | | | | | | | | | | 118,310 | | | | | | | | | | | | | | | | Non-current financial debt | | (414 | ) | | | | | | | (15,337 | ) | | (440 | ) | | | | | | | | | (16,191 | ) | | (16,191 | ) | Accounts payable | | | | | | | — | | | | | | | | | | | | | (14,815 | ) | | (14,815 | ) | | (14,815 | ) | Other operating liabilities | | | | | | | (1,033 | ) | | | | | | | | | | | | (3,264 | ) | | (4,297 | ) | | (4,297 | ) | Current borrowings | | (5,721 | ) | | | | | | | (2,001 | ) | | | | | | | | | | | | (7,722 | ) | | (7,722 | ) | Other current financial liabilities | | | | | | | (146 | ) | | | | | (12 | ) | | | | | | | | | (158 | ) | | (158 | ) | Total financial liabilities | | (6,135 | ) | | | | (1,179 | ) | | (17,338 | ) | | (452 | ) | | — | | — | | (18,079 | ) | | (43,183 | ) | | (43,183 | ) | Total non-financial liabilities | | | | | | | | | | | | | | | | | | | | | | | (75,127 | ) | | | | Total liabilities | | | | | | | | | | | | | | | | | | | | | | | (118,310 | ) | | | |
| | | | | | | | | | | | | | | | | | | | | | | | | | | | | | | | | | | | | | | | | | | | | | | | Other financial
| | | | | | Fair
| | | | | Financial instruments related to financing and trading activities | | | instruments | | | Total | | | value | | | | | | | | | | | As of December 31, 2009 | | Amortized
| | | Fair
| | | | | | | | | | | (M€)
| | cost | | | value | | | | | | | | | | | Assets /
| | | | | Available
| | | Held for
| | | | | | Hedging of
| | | Cash
| | | Net investment
| | | | | | | | | | | | (Liabilities) | | | | | for sale(a) | | | trading | | | Financial debt(b) | | | financial debt | | | flow hedge | | | hedge and other | | | | | | | | | | | | Equity affiliates: | | | | | | | | | | | | | | | | | | | | | | | | | | | | | | | | | | | | | | | | | | loans | | | 2,367 | | | | | | | | | | | | | | | | | | | | | | | | | | | | | | | | 2,367 | | | | 2,367 | | | Other investments | | | | | | | 1,162 | | | | | | | | | | | | | | | | | | | | | | | | | | | | 1,162 | | | | 1,162 | | | Hedging instruments of non-current financial debt | | | | | | | | | | | | | | | | | | | 889 | | | | 136 | | | | | | | | | | | | 1,025 | | | | 1,025 | | | Other non-current assets | | | 1,284 | | | | | | | | | | | | | | | | | | | | | | | | | | | | | | | | 1,284 | | | | 1,284 | | | Accounts receivable, net | | | | | | | | | | | | | | | | | | | | | | | | | | | | | | | 15,719 | | | | 15,719 | | | | 15,719 | | | Other operating receivables | | | | | | | | | | | 1,029 | | | | | | | | | | | | | | | | | | | | 4,116 | | | | 5,145 | | | | 5,145 | | | Current financial assets | | | 55 | | | | | | | | 53 | | | | | | | | 197 | | | | | | | | 6 | | | | | | | | 311 | | | | 311 | | | Cash and cash equivalents | | | | | | | | | | | | | | | | | | | | | | | | | | | | | | | 11,662 | | | | 11,662 | | | | 11,662 | | | | | | | | | | | | | | | | | | | | | | | | | | | | | | | | | | | | | | | | | | | | Total financial assets | | | 3,706 | | | | 1,162 | | | | 1,082 | | | | — | | | | 1,086 | | | | 136 | | | | 6 | | | | 31,497 | | | | 38,675 | | | | 38,675 | | | | | | | | | | | | | | | | | | | | | | | | | | | | | | | | | | | | | | | | | | | | Total non-financial assets | | | | | | | | | | | | | | | | | | | | | | | | | | | | | | | | | | | 89,078 | | | | | | | | | | | | | | | | | | | | | | | | | | | | | | | | | | | | | | | | | | | | | | | | Total assets | | | | | | | | | | | | | | | | | | | | | | | | | | | | | | | | | | | 127,753 | | | | | | | | | | | | | | | | | | | | | | | | | | | | | | | | | | | | | | | | | | | | | | | | | Non-current financial debt | | | (2,089 | ) | | | | | | | | | | | (17,107 | ) | | | (241 | ) | | | | | | | | | | | | | | | (19,437 | ) | | | (19,905 | ) | | Accounts payable | | | | | | | | | | | | | | | | | | | | | | | | | | | | | | | (15,383 | ) | | | (15,383 | ) | | | (15,383 | ) | | Other operating liabilities | | | | | | | | | | | (923 | ) | | | | | | | | | | | | | | | | | | | (3,783 | ) | | | (4,706 | ) | | | (4,706 | ) | | Current borrowings | | | (4,849 | ) | | | | | | | | | | | (2,145 | ) | | | | | | | | | | | | | | | | | | | (6,994 | ) | | | (6,994 | ) | | Other current financial liabilities | | | | | | | | | | | (25 | ) | | | | | | | (97 | ) | | | | | | | (1 | ) | | | | | | | (123 | ) | | | (123 | ) | | | | | | | | | | | | | | | | | | | | | | | | | | | | | | | | | | | | | | | | | | | Total financial liabilities | | | (6,938 | ) | | | | | | | (948 | ) | | | (19,252 | ) | | | (338 | ) | | | — | | | | (1 | ) | | | (19,166 | ) | | | (46,643 | ) | | | (47,111 | ) | | | | | | | | | | | | | | | | | | | | | | | | | | | | | | | | | | | | | | | | | | | Total non-financial liabilities | | | | | | | | | | | | | | | | | | | | | | | | | | | | | | | | | | | (81,110 | ) | | | | | | | | | | | | | | | | | | | | | | | | | | | | | | | | | | | | | | | | | | | | | | | Total liabilities | | | | | | | | | | | | | | | | | | | | | | | | | | | | | | | | | | | (127,753 | ) | | | | | | | | | | | | | | | | | | | | | | | | | | | | | | | | | | | | | | | | | | | | | | |
(a) | | | | (a) | | Financial assets available for sale are measured at their fair value except for unlisted securities (see Note 1 paragraph M(ii) and Note 13 to the Consolidated Financial Statements). |
| (b) | | The financial debt is adjusted to the hedged risks value (currency and interest rate) as part of hedge accounting (see Note 1 paragraph M(iii) to the Consolidated Financial Statements). |
F-75 | | | | | | | | | | | | | | | | | | | | | | | | | | | | As of December 31, 2007 (€ million) Assets / (Liabilities) | | Financial instruments related to financing and trading activities | | Other financial
instruments | | | Total | | | Fair value | | | | | Amortized
cost | | | Fair value | | | | | | | | | | | | | | | | Available for sale(a) | | Held for
trading | | | Financial
debt(b) | | | Hedging of
financial debt | | | Cash flow
hedge | | Net investment
hedge and other | | | | | | | | | | Equity affiliates: loans | | 2,575 | | | | | | | | | | | | | | | | | | | | | 2,575 | | | 2,575 | | Other investments | | | | | 1,291 | | | | | | | | | | | | | | | | | | 1,291 | | | 1,291 | | Hedging instruments of non-current financial debt | | | | | | | | | | | | | 460 | | | | | | | | | | 460 | | | 460 | | Other non-current assets | | 851 | | | | | | | | | | | | | | | | | | | | | 851 | | | 851 | | Accounts receivable, net | | | | | | | 464 | | | | | | | | | | | | | 18,665 | | | 19,129 | | | 19,129 | | Other operating receivables | | | | | | | 519 | | | | | | | | | | | | | 3,911 | | | 4,430 | | | 4,430 | | Current financial assets | | 850 | | | | | 12 | | | | | | 388 | | | | | 14 | | | | | 1,264 | | | 1,264 | | Cash and cash equivalents | | | | | | | | | | | | | | | | | | | | 5,988 | | | 5,988 | | | 5,988 | | Total financial assets | | 4,276 | | | 1,291 | | 995 | | | — | | | 848 | | | | | 14 | | 28,564 | | | 35,988 | | | 35,988 | | Total non-financial assets | | | | | | | | | | | | | | | | | | | | | | | 77,553 | | | | | Total assets | | | | | | | | | | | | | | | | | | | | | | | 113,541 | | | | | | | | | | | | | | | | Non-current financial debt | | (532 | ) | | | | | | | (13,975 | ) | | (369 | ) | | | | | | | | | (14,876 | ) | | (14,876 | ) | Accounts payable | | | | | | | (243 | ) | | | | | | | | | | | | (17,940 | ) | | (18,183 | ) | | (18,183 | ) | Other operating liabilities | | | | | | | (490 | ) | | | | | | | | | | | | (3,410 | ) | | (3,900 | ) | | (3,900 | ) | Current borrowings | | (2,655 | ) | | | | | | | (1,958 | ) | | | | | | | | | | | | (4,613 | ) | | (4,613 | ) | Other current financial liabilities | | | | | | | (59 | ) | | | | | (1 | ) | | | | | | | | | (60 | ) | | (60 | ) | Total financial liabilities | | (3,187 | ) | | | | (792 | ) | | (15,933 | ) | | (370 | ) | | | | | | (21,350 | ) | | (41,632 | ) | | (41,632 | ) | Total non-financial liabilities | | | | | | | | | | | | | | | | | | | | | | | (71,909 | ) | | | | Total liabilities | | | | | | | | | | | | | | | | | | | | | | | (113,541 | ) | | | |
| | | | | | | | | | | | | | | | | | | | | | | | | | | | | | | | | | | | | | | | | | | | | | | | Other financial
| | | | | | Fair
| | | | | Financial instruments related to financing and trading activities | | | instruments | | | Total | | | value | | | | | | | | | | | As of December 31, 2008 | | Amortized
| | | Fair
| | | | | | | | | | | (M€)
| | cost | | | value | | | | | | | | | | | Assets /
| | | | | Available
| | | Held for
| | | | | | Hedging of
| | | | | | Net investment
| | | | | | | | | | | | (Liabilities) | | | | | for sale(a) | | | trading | | | Financial debt(b) | | | financial debt | | | Cash flow hedge | | | hedge and other | | | | | | | | | | | | Equity affiliates: | | | | | | | | | | | | | | | | | | | | | | | | | | | | | | | | | | | | | | | | | | loans | | | 2,005 | | | | | | | | | | | | | | | | | | | | | | | | | | | | | | | | 2,005 | | | | 2,005 | | | Other investments | | | | | | | 1,165 | | | | | | | | | | | | | | | | | | | | | | | | | | | | 1,165 | | | | 1,165 | | | Hedging instruments of non-current financial debt | | | | | | | | | | | | | | | | | | | 892 | | | | | | | | | | | | | | | | 892 | | | | 892 | | | Other non-current assets | | | 1,403 | | | | | | | | | | | | | | | | | | | | | | | | | | | | | | | | 1,403 | | | | 1,403 | | | Accounts receivable, net | | | | | | | | | | | — | | | | | | | | | | | | | | | | | | | | 15,287 | | | | 15,287 | | | | 15,287 | | | Other operating receivables | | | | | | | | | | | 1,664 | | | | | | | | | | | | | | | | | | | | 4,544 | | | | 6,208 | | | | 6,208 | | | Current financial assets | | | 1 | | | | | | | | 86 | | | | | | | | 100 | | | | | | | | — | | | | | | | | 187 | | | | 187 | | | Cash and cash | | | | | | | | | | | | | | | | | | | | | | | | | | | | | | | 12,321 | | | | 12,321 | | | | 12,321 | | | equivalents | | | | | | | | | | | | | | | | | | | | | | | | | | | | | | | | | | | | | | | | | | | | | | | | | | | | | | | | | | | | | | | | | | | | | | | | | | | | | | | | | | | Total financial assets | | | 3,409 | | | | 1,165 | | | | 1,750 | | | | — | | | | 992 | | | | — | | | | — | | | | 32,152 | | | | 39,468 | | | | 39,468 | | | | | | | | | | | | | | | | | | | | | | | | | | | | | | | | | | | | | | | | | | | | Total non-financial assets | | | | | | | | | | | | | | | | | | | | | | | | | | | | | | | | | | | 78,842 | | | | | | | | | | | | | | | | | | | | | | | | | | | | | | | | | | | | | | | | | | | | | | | | Total assets | | | | | | | | | | | | | | | | | | | | | | | | | | | | | | | | | | | 118,310 | | | | | | | | | | | | | | | | | | | | | | | | | | | | | | | | | | | | | | | | | | | | | | | | | Non-current financial debt | | | (701 | ) | | | | | | | | | | | (15,050 | ) | | | (440 | ) | | | | | | | | | | | | | | | (16,191 | ) | | | (16,191 | ) | | Accounts payable | | | | | | | | | | | — | | | | | | | | | | | | | | | | | | | | (14,815 | ) | | | (14,815 | ) | | | (14,815 | ) | | Other operating liabilities | | | | | | | | | | | (1,033 | ) | | | | | | | | | | | | | | | | | | | (3,264 | ) | | | (4,297 | ) | | | (4,297 | ) | | Current borrowings | | | (5,721 | ) | | | | | | | | | | | (2,001 | ) | | | | | | | | | | | | | | | | | | | (7,722 | ) | | | (7,722 | ) | | Other current financial liabilities | | | | | | | | | | | (146 | ) | | | | | | | (12 | ) | | | | | | | | | | | | | | | (158 | ) | | | (158 | ) | | | | | | | | | | | | | | | | | | | | | | | | | | | | | | | | | | | | | | | | | | | Total financial liabilities | | | (6,422 | ) | | | | | | | (1,179 | ) | | | (17,051 | ) | | | (452 | ) | | | — | | | | — | | | | (18,079 | ) | | | (43,183 | ) | | | (43,183 | ) | | | | | | | | | | | | | | | | | | | | | | | | | | | | | | | | | | | | | | | | | | | Total non-financial liabilities | | | | | | | | | | | | | | | | | | | | | | | | | | | | | | | | | | | (75,127 | ) | | | | | | | | | | | | | | | | | | | | | | | | | | | | | | | | | | | | | | | | | | | | | | | Total liabilities | | | | | | | | | | | | | | | | | | | | | | | | | | | | | | | | | | | (118,310 | ) | | | | | | | | | | | | | | | | | | | | | | | | | | | | | | | | | | | | | | | | | | | | | | |
(a) | | | | (a) | | Financial assets available for sale are measured at their fair value except for unlisted securities (see Note 1 paragraph M(ii) and Note 13 to the Consolidated Financial Statements). |
(b) | | | | (b) | | The financial debt is adjusted to the hedged risks value (currency and interest rate) as part of hedge accounting (see Note 1 paragraph M(iii) to the Consolidated Financial Statements). |
F-76
29) FAIR VALUE OF FINANCIAL INSTRUMENTS (EXCLUDING COMMODITY CONTRACTS)
| | | 29) | FAIR VALUE OF FINANCIAL INSTRUMENTS (EXCLUDING COMMODITY CONTRACTS) |
| | | A) | IMPACT ON THE STATEMENT OF INCOME PER NATURE OF FINANCIAL INSTRUMENTS |
A) IMPACT ON THE STATEMENT OF INCOME PER NATURE OF FINANCIAL INSTRUMENTSOperating assets and liabilities The impact on the statement of income is detailed as follows: | | | | | | | | | | For the year ended December 31,
(€ million) | | 2009 | | | 2008 | | | 2007 | | Assets available for sale (investments): | | | | | | | | | | — dividend income on non-consolidated subsidiaries | | 210 | | | 238 | | | 218 | | — gains (losses) on disposal of assets | | 6 | | | 15 | | | 170 | | — other | | (18 | ) | | (15 | ) | | (63 | ) | Loans and receivables | | 41 | | | 100 | | | (2 | ) | Impact on net operating income | | 239 | | | 338 | | | 323 | |
| | | | | | | | | | | | | | | For the year ended December 31, | | | | | | | | | | | (M€) | | 2010 | | | 2009 | | | 2008 | | | Assets available for sale (investments): | | | | | | | | | | | | | | — Dividend income on non-consolidated subsidiaries | | | 255 | | | | 210 | | | | 238 | | | — Gains (losses) on disposal of assets | | | 60 | | | | 6 | | | | 15 | | | — Other | | | (17 | ) | | | (18 | ) | | | (15 | ) | | Loans and receivables | | | 90 | | | | 41 | | | | 100 | | | | | | | | | | | | | | | | Impact on net operating income | | | 388 | | | | 239 | | | | 338 | | | | | | | | | | | | | | | |
The impact in the statement of income mainly includes: Dividends and gains or losses on disposal of other investments classified as “Other investments”;
Financial gains and depreciation on loans related to equity affiliates, non-consolidated companies and on receivables reported in “Loans and receivables”.
| | | • | Dividends and gains or losses on disposal of other investments classified as “Other investments”; | | • | Financial gains and depreciation on loans related to equity affiliates, non-consolidated companies and on receivables reported in “Loans and receivables”. |
Assets and liabilities from financing activities The impact on the statement of income of financing assets and liabilities is detailed as follows: | | | | | | | | | | For the year ended December 31,
(€ million) | | 2009 | | | 2008 | | | 2007 | | Loans and receivables | | 158 | | | 547 | | | 1,135 | | Financing liabilities and associated hedging instruments | | (563 | ) | | (996 | ) | | (1,721 | ) | Fair value hedge (ineffective portion) | | 33 | | | (4 | ) | | (26 | ) | Assets and liabilities held for trading | | (26 | ) | | (74 | ) | | 73 | | Impact on the cost of net debt | | (398 | ) | | (527 | ) | | (539 | ) |
| | | | | | | | | | | | | | | For the year ended December 31, | | | | | | | | | | | (M€) | | 2010 | | | 2009 | | | 2008 | | | Loans and receivables | | | 133 | | | | 158 | | | | 547 | | | Financing liabilities and associated hedging instruments | | | (469 | ) | | | (563 | ) | | | (996 | ) | | Fair value hedge (ineffective portion) | | | 4 | | | | 33 | | | | (4 | ) | | Assets and liabilities held for trading | | | (2 | ) | | | (26 | ) | | | (74 | ) | | | | | | | | | | | | | | | Impact on the cost of net debt | | | (334 | ) | | | (398 | ) | | | (527 | ) | | | | | | | | | | | | | | |
The impact on the statement of income mainly includes: Financial income on cash, cash equivalents, and current financial assets (notably current deposits beyond three months) classified as “Loans and receivables”;
Financial expense of long term subsidiaries financing, associated hedging instruments (excluding ineffective portion of the hedge detailed below) and financial expense of short term financing classified as “Financing liabilities and associated hedging instruments”;
| | | • | Financial income on cash, cash equivalents, and current financial assets (notably current deposits beyond three months) classified as “Loans and receivables”; | | • | Financial expense of long term subsidiaries financing, associated hedging instruments (excluding ineffective portion of the hedge detailed below) and financial expense of short term financing classified as “Financing liabilities and associated hedging instruments”; | | • | Ineffective portion of bond hedging; and | | • | Financial income, financial expense and fair value of derivative instruments used for cash management purposes classified as “Assets and liabilities held for trading”. |
Ineffective portion of bond hedging; and
Financial income, financial expense and fair value of derivative instruments used for cash management purposes classified as “Assets and liabilities held for trading”.
Financial derivative instruments used for cash management purposes (interest rate and foreign exchange) are considered to be held for trading. Based on practical documentation issues, the Group did not elect to set up hedge accounting for such instruments. The impact on income of the derivatives is offset by the impact of loans and current liabilities they are related to. Therefore these transactions taken as a whole do not have a significant impact on the Consolidated Financial Statements. | | | B) | IMPACT OF THE HEDGING STRATEGIES |
B) IMPACT OF THE HEDGING STRATEGIESFair value hedge The impact on the statement of income of the bond hedging instruments which is recorded in the item “Financial interest on debt” in the Consolidated Statement of Income is detailed as follows: | | | | | | | | | | For the year ended December 31,
(€ million) | | 2009 | | | 2008 | | | 2007 | | Revaluation at market value of bonds | | (183 | ) | | (66 | ) | | 137 | | Swap hedging of bonds | | 216 | | | 62 | | | (163 | ) | Ineffective portion of the fair value hedge | | 33 | | | (4 | ) | | (26 | ) |
| | | | | | | | | | | | | | | For the year ended December 31, | | | | | | | | | | | (M€) | | 2010 | | | 2009 | | | 2008 | | | Revaluation at market value of | | | | | | | | | | | | | | bonds | | | (1,164 | ) | | | (183 | ) | | | (66 | ) | | Swap hedging of bonds | | | 1,168 | | | | 216 | | | | 62 | | | | | | | | | | | | | | | | Ineffective portion of the fair value hedge | | | 4 | | | | 33 | | | | (4 | ) | | | | | | | | | | | | | | |
The ineffective portion is not representative of the Group’s performance considering the Group’s objective to hold swaps to maturity. The current portion of the swaps valuation is not subject to active management.
F-77
These instruments are recorded directly in shareholders’ equity under “Currency translation adjustments”. The variations of the period are detailed in the table below: | | | | | | | | | | | | For the year ended December 31,(€ million) | | As of January 1, | | | Variations | | | Disposals | | As of December 31, | 2009 | | 124 | | | (99 | ) | | — | | 25 | 2008 | | 29 | | | 95 | | | — | | 124 | 2007 | | (188 | ) | | 217 | | | — | | 29 |
| | | | | | | | | | | | | | | | | | | For the year ended December 31, (M€) | | As of January 1, | | | Variations | | | Disposals | | | As of December 31, | | 2010 | | | 25 | | | | (268 | ) | | | — | | | | (243 | ) | | 2009 | | | 124 | | | | (99 | ) | | | — | | | | 25 | | | 2008 | | | 29 | | | | 95 | | | | — | | | | 124 | | | | | | | | | | | | | | | | | | | |
As of December 31, 2009,2010, the fair value of the open instruments amounts to €5 €6 million compared to €5 million in 2009 and zero in 2008 and€14 million in 2007.2008. The impact on the statement of income and on equity of the bond hedging instruments qualified as cash flow hedges is detailed as follows: | | | | | | | | For the year ended December 31,(€ million) | | 2009 | | 2008 | | 2007 | Profit (Loss) recorded in equity during the period | | 128 | | — | | — | Recycled amount from equity to the income statement during the period | | 221 | | — | | — |
| | | | | | | | | | | | | | | For The year ended December 31, (M€) | | 2010 | | | 2009 | | | 2008 | | | Profit (Loss) recorded in equity during the period | | | (80 | ) | | | 128 | | | | — | | | Recycled amount from equity to the income statement during the period | | | (115 | ) | | | 221 | | | | — | | | | | | | | | | | | | | | |
As of December 31, 2010 and 2009, the ineffective portion of these financial instruments is equal to zero.
F-78
C) MATURITY OF DERIVATIVE INSTRUMENTS
| | | C) | MATURITY OF DERIVATIVE INSTRUMENTS |
The maturity of the notional amounts of derivative instruments, excluding the commodity contracts, is detailed in the following table: | | | | | | | | | | | | | | | | | | | As of December 31, 2009(€ million) | | | | | Notional value(a) | | Assets/(Liabilities) | | Fair
value | | | Total | | 2010 | | 2011 | | 2012 | | 2013 | | 2014 | | 2015
and
after | Fair value hedge | | | | | | | | | | | | | | | | | | Swaps hedging fixed-rates bonds (liabilities) | | (241 | ) | | 4,615 | | | | | | | | | | | | | Swaps hedging fixed-rates bonds (assets) | | 889 | | | 11,076 | | | | | | | | | | | | | Total swaps hedging fixed-rates bonds (assets and liabilities) | | 648 | | | 15,691 | | — | | 3,345 | | 2,914 | | 3,450 | | 1,884 | | 4,098 | Swaps hedging fixed-rates bonds (current portion) (liabilities) | | (97 | ) | | 912 | | | | | | | | | | | | | Swaps hedging fixed-rates bonds (current portion) (assets) | | 197 | | | 1,084 | | | | | | | | | | | | | Total swaps hedging fixed-rates bonds (current portion) (assets and liabilities) | | 100 | | | 1,996 | | 1,996 | | | | | | | | | | | Cash flow hedge | | | | | | | | | | | | | | | | | | Swaps hedging fixed-rates bonds (liabilities) | | | | | | | | | | | | | | | | | | Swaps hedging fixed-rates bonds (assets) | | 136 | | | 1,837 | | | | | | 295 | | | | | | 1,542 | Total swaps hedging fixed-rates bonds (assets and liabilities) | | 136 | | | 1,837 | | | | | | 295 | | | | | | 1,542 | Swaps hedging fixed-rates bonds (current portion) (liabilities) | | | | | | | | | | | | | | | | | | Swaps hedging fixed-rates bonds (current portion) (assets) | | | | | | | | | | | | | | | | | | Total swaps hedging fixed-rates bonds (current portion) (assets and liabilities) | | | | | | | | | | | | | | | | | | Net investment hedge | | | | | | | | | | | | | | | | | | Currency swaps and forward exchange contracts (assets) | | 6 | | | 701 | | | | | | | | | | | | | Currency swaps and forward exchange contracts (liabilities) | | (1 | ) | | 224 | | | | | | | | | | | | | Total swaps hedging net investments | | 5 | | | 925 | | 925 | | | | | | | | | | | Held for trading | | | | | | | | | | | | | | | | | | Other interest rate swaps (assets) | | | | | 1,459 | | | | | | | | | | | | | Other interest rate swaps (liabilities) | | (1 | ) | | 10,865 | | | | | | | | | | | | | Total other interest rate swaps (assets and liabilities) | | (1 | ) | | 12,324 | | 12,208 | | 114 | | | | | | | | 2 | Currency swaps and forward exchange contracts (assets) | | 53 | | | 4,017 | | | | | | | | | | | | | Currency swaps and forward exchange contracts (liabilities) | | (24 | ) | | 3,456 | | | | | | | | | | | | | Total currency swaps and forward exchange contracts (assets and liabilities) | | 29 | | | 7,473 | | 7,224 | | | | 52 | | 50 | | 47 | | 100 |
| | | | | | | | | | | | | | | | | | | | | | | | | | | | | | | | | | | As of December 31, 2010 (M€) | | | | | Notional value(a) | | | | | | | | | | | | | | | | | | | | | | | | | | 2016
| | | | | Fair
| | | | | | | | | | | | | | | | | | | | | and
| | | ASSETS/(LIABILITIES) | | value | | | Total | | | 2011 | | | 2012 | | | 2013 | | | 2014 | | | 2015 | | | after | | Fair value hedge | | | | | | | | | | | | | | | | | | | | | | | | | | | | | | | | | | Swaps hedging fixed-rates bonds (liabilities) | | | (178 | ) | | | 2,244 | | | | | | | | | | | | | | | | | | | | | | | | | | | Swaps hedging fixed-rates bonds (assets) | | | 1,814 | | | | 13,939 | | | | | | | | | | | | | | | | | | | | | | | | | | | | | | | | | | | | | | | | | | | | | | | | | | | | | | | | | | | | Total swaps hedging fixed-rates bonds (assets and liabilities) | | | 1,636 | | | | 16,183 | | | | | | | | 2,967 | | | | 3,461 | | | | 2,421 | | | | 3,328 | | | | 4,006 | | | Swaps hedging fixed-rates bonds (current portion) (liabilities) | | | (12 | ) | | | 592 | | | | | | | | | | | | | | | | | | | | | | | | | | | Swaps hedging fixed-rates bonds (current portion) (assets) | | | 292 | | | | 2,815 | | | | | | | | | | | | | | | | | | | | | | | | | | | | | | | | | | | | | | | | | | | | | | | | | | | | | | | | | | | | Total swaps hedging fixed-rates bonds (current portion) (assets and liabilities) | | | 280 | | | | 3,407 | | | | 3,407 | | | | | | | | | | | | | | | | | | | | | | Cash flow hedge | | | | | | | | | | | | | | | | | | | | | | | | | | | | | | | | | | Swaps hedging fixed-rates bonds (liabilities) | | | — | | | | — | | | | | | | | | | | | | | | | | | | | | | | | | | | Swaps hedging fixed-rates bonds (assets) | | | 56 | | | | 1,957 | | | | | | | | | | | | | | | | | | | | | | | | | | | | | | | | | | | | | | | | | | | | | | | | | | | | | | | | | | | | Total swaps hedging fixed-rates bonds (assets and liabilities) | | | 56 | | | | 1,957 | | | | | | | | 295 | | | | | | | | | | | | | | | | 1,662 | | | Swaps hedging fixed-rates bonds (current portion) (liabilities) | | | | | | | | | | | | | | | | | | | | | | | | | | | | | | | | | | Swaps hedging fixed-rates bonds (current portion) (assets) | | | | | | | | | | | | | | | | | | | | | | | | | | | | | | | | | | | | | | | | | | | | | | | | | | | | | | | | | | | | | | | | | | | Total swaps hedging fixed-rates bonds (current portion) (assets and liabilities) | | | — | | | | — | | | | — | | | | | | | | | | | | | | | | | | | | | | Net investment hedge | | | | | | | | | | | | | | | | | | | | | | | | | | | | | | | | | | Currency swaps and forward exchange contracts (assets) | | | 6 | | | | 381 | | | | | | | | | | | | | | | | | | | | | | | | | | | Currency swaps and forward exchange contracts (liabilities) | | | — | �� | | | — | | | | | | | | | | | | | | | | | | | | | | | | | | | | | | | | | | | | | | | | | | | | | | | | | | | | | | | | | | | | Total swaps hedging net investments | | | 6 | | | | 381 | | | | 381 | | | | | | | | | | | | | | | | | | | | | | Held for trading | | | | | | | | | | | | | | | | | | | | | | | | | | | | | | | | | | Other interest rate swaps (assets) | | | 1 | | | | 6,463 | | | | | | | | | | | | | | | | | | | | | | | | | | | Other interest rate swaps (liabilities) | | | (3 | ) | | | 11,395 | | | | | | | | | | | | | | | | | | | | | | | | | | | | | | | | | | | | | | | | | | | | | | | | | | | | | | | | | | | | Total other interest rate swaps (assets and liabilities) | | | (2 | ) | | | 17,858 | | | | 17,667 | | | | 189 | | | | — | | | | — | | | | 2 | | | | — | | | Currency swaps and forward exchange contracts (assets) | | | 37 | | | | 1,532 | | | | | | | | | | | | | | | | | | | | | | | | | | | Currency swaps and forward exchange contracts (liabilities) | | | (144 | ) | | | 6,757 | | | | | | | | | | | | | | | | | | | | | | | | | | | | | | | | | | | | | | | | | | | | | | | | | | | | | | | | | | | | Total currency swaps and forward exchange contracts (assets and liabilities) | | | (107 | ) | | | 8,289 | | | | 8,102 | | | | — | | | | 25 | | | | 49 | | | | 31 | | | | 82 | | | | | | | | | | | | | | | | | | | | | | | | | | | | | | | | | | | |
(a) | | | | (a) | | These amounts set the levels of notional commitment and are not indicative of a contingent gain or loss. |
F-79
| | | | | | | | | | | | | | | | | | | As of December 31, 2008(€ million) | | | | | Notional value(a) | | ASSETS/(LIABILITIES) | | Fair
value | | | Total | | 2009 | | 2010 | | 2011 | | 2012 | | 2013 | | 2014
and
after | Fair value hedge | | | | | | | | | | | | | | | | | | Swaps hedging fixed-rates bonds (liabilities) | | (440 | ) | | 9,309 | | | | | | | | | | | | | Swaps hedging fixed-rates bonds (assets) | | 892 | | | 4,195 | | | | | | | | | | | | | Total swaps hedging fixed-rates bonds
(assets and liabilities) | | 452 | | | 13,504 | | | | 2,048 | | 3,373 | | 3,233 | | 3,032 | | 1,818 | Swaps hedging fixed-rates bonds
(current portion) (liabilities) | | (12 | ) | | 92 | | | | | | | | | | | | | Swaps hedging fixed-rates bonds
(current portion) (assets) | | 100 | | | 1,871 | | | | | | | | | | | | | Total swaps hedging fixed-rates bonds
(current portion) (assets and liabilities) | | 88 | | | 1,963 | | 1,963 | | | | | | | | | | | Net investment hedge | | | | | | | | | | | | | | | | | | Currency swaps and forward exchange contracts
(liabilities) | | — | | | 1,347 | | 1,347 | | | | | | | | | | | Held for trading | | | | | | | | | | | | | | | | | | Other interest rate swaps (assets) | | — | | | 2,853 | | | | | | | | | | | | | Other interest rate swaps (liabilities) | | (4 | ) | | 5,712 | | | | | | | | | | | | | Total other interest rate swaps (assets and liabilities) | | (4 | ) | | 8,565 | | 8,559 | | 4 | | | | | | | | 2 | Currency swaps and forward exchange contracts (assets) | | 86 | | | 5,458 | | | | | | | | | | | | | Currency swaps and forward exchange contracts
(liabilities) | | (142 | ) | | 2,167 | | | | | | | | | | | | | Total currency swaps and forward exchange contracts
(assets and liabilities) | | (56 | ) | | 7,625 | | 6,595 | | 483 | | 114 | | 67 | | 76 | | 290 |
| | | | | | | | | | | | | | | | | | | | | | | | | | | | | | | | | | | As of December 31, 2009 (M€) | | | | | Notional value(a) | | | | | | | | | | | | | | | | | | | | | | | | | | 2015
| | | | | Fair
| | | | | | | | | | | | | | | | | | | | | and
| | | ASSETS/(LIABILITIES) | | value | | | Total | | | 2010 | | | 2011 | | | 2012 | | | 2013 | | | 2014 | | | after | | Fair value hedge | | | | | | | | | | | | | | | | | | | | | | | | | | | | | | | | | | Swaps hedging fixed-rates bonds (liabilities) | | | (241 | ) | | | 4,615 | | | | | | | | | | | | | | | | | | | | | | | | | | | Swaps hedging fixed-rates bonds (assets) | | | 889 | | | | 11,076 | | | | | | | | | | | | | | | | | | | | | | | | | | | | | | | | | | | | | | | | | | | | | | | | | | | | | | | | | | | | Total swaps hedging fixed-rates bonds (assets and liabilities) | | | 648 | | | | 15,691 | | | | — | | | | 3,345 | | | | 2,914 | | | | 3,450 | | | | 1,884 | | | | 4,098 | | | Swaps hedging fixed-rates bonds (current portion) (liabilities) | | | (97 | ) | | | 912 | | | | | | | | | | | | | | | | | | | | | | | | | | | Swaps hedging fixed-rates bonds (current portion) (assets) | | | 197 | | | | 1,084 | | | | | | | | | | | | | | | | | | | | | | | | | | | | | | | | | | | | | | | | | | | | | | | | | | | | | | | | | | | | Total swaps hedging fixed-rates bonds (current portion) (assets and liabilities) | | | 100 | | | | 1,996 | | | | 1,996 | | | | | | | | | | | | | | | | | | | | | | Cash flow hedge | | | | | | | | | | | | | | | | | | | | | | | | | | | | | | | | | | Swaps hedging fixed-rates bonds (liabilities) Swaps hedging fixed-rates bonds (assets) | | | 136 | | | | 1,837 | | | | | | | | | | | | 295 | | | | | | | | | | | | 1,542 | | | | | | | | | | | | | | | | | | | | | | | | | | | | | | | | | | | | Total swaps hedging fixed-rates bonds (assets and liabilities) | | | 136 | | | | 1,837 | | | | | | | | | | | | 295 | | | | | | | | | | | | 1,542 | | | Swaps hedging fixed-rates bonds (current portion) (liabilities) Swaps hedging fixed-rates bonds (current portion) (assets) | | | | | | | | | | | | | | | | | | | | | | | | | | | | | | | | | | | | | | | | | | | | | | | | | | | | | | | | | | | | | | | | | | | Total swaps hedging fixed-rates bonds (current portion) (assets and liabilities) | | | | | | | | | | | | | | | | | | | | | | | | | | | | | | | | | Net investment hedge | | | | | | | | | | | | | | | | | | | | | | | | | | | | | | | | | | Currency swaps and forward exchange contracts (assets) | | | 6 | | | | 701 | | | | | | | | | | | | | | | | | | | | | | | | | | | Currency swaps and forward exchange contracts (liabilities) | | | (1 | ) | | | 224 | | | | | | | | | | | | | | | | | | | | | | | | | | | | | | | | | | | | | | | | | | | | | | | | | | | | | | | | | | | | Total swaps hedging net investments | | | 5 | | | | 925 | | | | 925 | | | | | | | | | | | | | | | | | | | | | | Held for trading | | | | | | | | | | | | | | | | | | | | | | | | | | | | | | | | | | Other interest rate swaps (assets) | | | | | | | 1,459 | | | | | | | | | | | | | | | | | | | | | | | | | | | Other interest rate swaps (liabilities) | | | (1 | ) | | | 10,865 | | | | | | | | | | | | | | | | | | | | | | | | | | | | | | | | | | | | | | | | | | | | | | | | | | | | | | | | | | | | Total other interest rate swaps (assets and liabilities) | | | (1 | ) | | | 12,324 | | | | 12,208 | | | | 114 | | | | | | | | | | | | | | | | 2 | | | Currency swaps and forward exchange contracts (assets) | | | 53 | | | | 4,017 | | | | | | | | | | | | | | | | | | | | | | | | | | | Currency swaps and forward exchange contracts (liabilities) | | | (24 | ) | | | 3,456 | | | | | | | | | | | | | | | | | | | | | | | | | | | | | | | | | | | | | | | | | | | | | | | | | | | | | | | | | | | | Total currency swaps and forward exchange contracts (assets and liabilities) | | | 29 | | | | 7,473 | | | | 7,224 | | | | | | | | 52 | | | | 50 | | | | 47 | | | | 100 | | | | | | | | | | | | | | | | | | | | | | | | | | | | | | | | | | | |
(a) | | | | (a) | | These amounts set the levels of notional commitment and are not indicative of a contingent gain or loss. |
F-80 | | | | | | | | | | | | | | | | | | | As of December 31, 2007(€ million) | | | | | Notional value(a) | | ASSETS/(LIABILITIES) | | Fair
value | | | Total | | 2008 | | 2009 | | 2010 | | 2011 | | 2012 | | 2013
and
after | Fair value hedge | | | | | | | | | | | | | | | | | | Swaps hedging fixed-rates bonds (liabilities) | | (369 | ) | | 7,506 | | | | | | | | | | | | | Swaps hedging fixed-rates bonds (assets) | | 460 | | | 3,982 | | | | | | | | | | | | | Total swaps hedging fixed-rates bonds
(assets and liabilities) | | 91 | | | 11,488 | | | | 1,910 | | 1,836 | | 2,725 | | 2,437 | | 2,580 | Swaps hedging fixed-rates bonds
(current portion) (liabilities) | | (1 | ) | | 306 | | | | | | | | | | | | | Swaps hedging fixed-rates bonds
(current portion) (assets) | | 388 | | | 1,265 | | | | | | | | | | | | | Total swaps hedging fixed-rates bonds
(current portion) (assets and liabilities) | | 387 | | | 1,571 | | 1,571 | | | | | | | | | | | Net investment hedge | | | | | | | | | | | | | | | | | | Currency swaps and forward exchange contracts (assets) | | 14 | | | 695 | | 695 | | | | | | | | | | | Held for trading | | | | | | | | | | | | | | | | | | Other interest rate swaps (assets) | | 1 | | | 8,249 | | | | | | | | | | | | | Other interest rate swaps (liabilities) | | — | | | 3,815 | | | | | | | | | | | | | Total other interest rate swaps (assets and liabilities) | | 1 | | | 12,064 | | 12,058 | | — | | 4 | | — | | — | | 2 | Currency swaps and forward exchange contracts (assets) | | 11 | | | 2,594 | | | | | | | | | | | | | Currency swaps and forward exchange contracts
(liabilities) | | (59 | ) | | 3,687 | | | | | | | | | | | | | Total currency swaps and forward exchange contracts
(assets and liabilities) | | (48 | ) | | 6,281 | | 6,207 | | 42 | | 2 | | 6 | | 8 | | 16 |
| | | | | | | | | | | | | | | | | | | | | | | | | | | | | | | | | | | As of December 31, 2008 (M€) | | | | | Notional value(a) | | | | | | | | | | | | | | | | | | | | | | | | | | 2014
| | | | | Fair
| | | | | | | | | | | | | | | | | | | | | and
| | | ASSETS/(LIABILITIES) | | value | | | Total | | | 2009 | | | 2010 | | | 2011 | | | 2012 | | | 2013 | | | after | | Fair value hedge | | | | | | | | | | | | | | | | | | | | | | | | | | | | | | | | | | Swaps hedging fixed-rates bonds (liabilities) | | | (440 | ) | | | 9,309 | | | | | | | | | | | | | | | | | | | | | | | | | | | Swaps hedging fixed-rates bonds (assets) | | | 892 | | | | 4,195 | | | | | | | | | | | | | | | | | | | | | | | | | | | | | | | | | | | | | | | | | | | | | | | | | | | | | | | | | | | | Total swaps hedging fixed-rates bonds (assets and liabilities) | | | 452 | | | | 13,504 | | | | — | | | | 2,048 | | | | 3,373 | | | | 3,233 | | | | 3,032 | | | | 1,818 | | | Swaps hedging fixed-rates bonds (current portion) (liabilities) | | | (12 | ) | | | 92 | | | | | | | | | | | | | | | | | | | | | | | | | | | Swaps hedging fixed-rates bonds (current portion) (assets) | | | 100 | | | | 1,871 | | | | | | | | | | | | | | | | | | | | | | | | | | | | | | | | | | | | | | | | | | | | | | | | | | | | | | | | | | | | Total swaps hedging fixed-rates bonds (current portion) (assets and liabilities) | | | 88 | | | | 1,963 | | | | 1,963 | | | | | | | | | | | | | | | | | | | | | | Net investment hedge | | | | | | | | | | | | | | | | | | | | | | | | | | | | | | | | | | | | | | | | | | | | | | | | | | | | | | | | | | | | | | | | | | | | Currency swaps and forward exchange contracts (liabilities) | | | — | | | | 1,347 | | | | 1,347 | | | | | | | | | | | | | | | | | | | | | | Held for trading | | | | | | | | | | | | | | | | | | | | | | | | | | | | | | | | | | Other interest rate swaps (assets) | | | — | | | | 2,853 | | | | | | | | | | | | | | | | | | | | | | | | | | | Other interest rate swaps (liabilities) | | | (4 | ) | | | 5,712 | | | | | | | | | | | | | | | | | | | | | | | | | | | | | | | | | | | | | | | | | | | | | | | | | | | | | | | | | | | | Total other interest rate swaps (assets and liabilities) | | | (4 | ) | | | 8,565 | | | | 8,559 | | | | 4 | | | | | | | | | | | | | | | | 2 | | | Currency swaps and forward exchange contracts (assets) | | | 86 | | | | 5,458 | | | | | | | | | | | | | | | | | | | | | | | | | | | Currency swaps and forward exchange contracts (liabilities) | | | (142 | ) | | | 2,167 | | | | | | | | | | | | | | | | | | | | | | | | | | | | | | | | | | | | | | | | | | | | | | | | | | | | | | | | | | | | Total currency swaps and forward exchange contracts (assets and liabilities) | | | (56 | ) | | | 7,625 | | | | 6,595 | | | | 483 | | | | 114 | | | | 67 | | | | 76 | | | | 290 | | | | | | | | | | | | | | | | | | | | | | | | | | | | | | | | | | | |
(a) | | | | (a) | | These amounts set the levels of notional commitment and are not indicative of a contingent gain or loss. |
D) FAIR VALUE HIERARCHY
The fair value hierarchy for financial instruments excluding commodity contracts is as follows: | | | | | | | | | | | | | | | | | | | | | Quoted prices in
| | | | | | | | | | | | | | active markets
| | | | | | Prices based on
| | | | | | | | for identical
| | | Prices based on
| | | non observable
| | | | | | | | assets
| | | observable data
| | | data
| | | | | | As of December 31, 2010 (M€) | | (level 1) | | | (level 2) | | | (level 3) | | | Total | | | Fair value hedge instruments | | | — | | | | 1,916 | | | | — | | | | 1,916 | | | Cash flow hedge instruments | | | — | | | | 56 | | | | — | | | | 56 | | | Net investment hedge instruments | | | — | | | | 6 | | | | — | | | | 6 | | | Assets and liabilities held for trading | | | — | | | | (109 | ) | | | — | | | | (109 | ) | | Assets available for sale | | | 3,631 | | | | — | | | | — | | | | 3,631 | | | | | | | | | | | | | | | | | | | | Total | | | 3,631 | | | | 1,869 | | | | — | | | | 5,500 | | | | | | | | | | | | | | | | | | | |
F-81
| | | | | | | | | | As of December 31, 2009(€ million) | | Quoted prices in
active markets
for identical
assets (level 1) | | Prices based on
observable data (level 2) | | Prices based on
non observable
data (level 3) | | Total | Fair value hedge instruments | | — | | 748 | | — | | 748 | Cash flow hedge instruments | | — | | 136 | | — | | 136 | Net investment hedge instruments | | — | | 5 | | — | | 5 | Assets and liabilities held for trading | | — | | 28 | | — | | 28 | Assets available for sale | | 232 | | — | | — | | 232 | Total | | 232 | | 917 | | — | | 1,149 |
| | | | | | | | | | | | | | | | | | | | | Quoted prices in
| | | | | | | | | | | | | | active markets
| | | | | | Prices based on
| | | | | | | | for identical
| | | Prices based on
| | | non observable
| | | | | | | | assets
| | | observable data
| | | data
| | | | | | As of December 31, 2009 (M€) | | (level 1) | | | (level 2) | | | (level 3) | | | Total | | | Fair value hedge instruments | | | — | | | | 748 | | | | — | | | | 748 | | | Cash flow hedge instruments | | | — | | | | 136 | | | | — | | | | 136 | | | Net investment hedge instruments | | | — | | | | 5 | | | | — | | | | 5 | | | Assets and liabilities held for trading | | | — | | | | 28 | | | | — | | | | 28 | | | Assets available for sale | | | 232 | | | | — | | | | — | | | | 232 | | | | | | | | | | | | | | | | | | | | Total | | | 232 | | | | 917 | | | | — | | | | 1,149 | | | | | | | | | | | | | | | | | | | |
The description of each fair value level is presented in Note 1 paragraph M(v) to the Consolidated Financial Statements. 30) FINANCIAL INSTRUMENTS RELATED TO COMMODITY CONTRACTS
| | | 30) | FINANCIAL INSTRUMENTS RELATED TO COMMODITY CONTRACTS |
Financial instruments related to oil, gas and power activities as well as related currency derivatives are recorded at fair value under “Other current assets” or “Other creditors and accrued liabilities” depending on whether they are assets or liabilities. | | | | | | | | As of December 31, 2009(€ million) | | | | | | | | Assets/(Liabilities) | | Carrying
amount | | | Fair
value(b) | | Crude oil, petroleum products and freight rates activities | | | | | | | Petroleum products and crude oil swaps | | (29 | ) | | (29 | ) | Freight rate swaps | | — | | | — | | Forwards(a) | | (9 | ) | | (9 | ) | Options | | 21 | | | 21 | | Futures | | (17 | ) | | (17 | ) | Options on futures | | 6 | | | 6 | | Total crude oil, petroleum products and freight rates | | (28 | ) | | (28 | ) | Gas & Power activities | | | | | | | Swaps | | 52 | | | 52 | | Forwards(a) | | 78 | | | 78 | | Options | | 4 | | | 4 | | Futures | | — | | | — | | Total Gas & Power | | 134 | | | 134 | | Total | | 106 | | | 106 | | Total of fair value non recognized in the balance sheet | | | | | — | |
| | | | | | | | | | | As of December 31, 2010 (M€) | | | | | | | | | | Carrying
| | | Fair
| | | Assets/(Liabilities) | | amount | | | value(b) | | Crude oil, petroleum products and freight rates activities | | | | | | | | | | Petroleum products and crude oil swaps | | | (2 | ) | | | (2 | ) | | Freight rate swaps | | | — | | | | — | | Forwards(a) | | | 5 | | | | 5 | | | Options | | | 51 | | | | 51 | | | Futures | | | (12 | ) | | | (12 | ) | | Options on futures | | | (4 | ) | | | (4 | ) | | | | | | | | | | | Total crude oil, petroleum products and freight rates | | | 38 | | | | 38 | | | | | | | | | | | | Gas & Power activities | | | | | | | | | | Swaps | | | (1 | ) | | | (1 | ) | Forwards(a) | | | (102 | ) | | | (102 | ) | | Options | | | 5 | | | | 5 | | | Futures | | | — | | | | — | | | | | | | | | | | | Total Gas & Power | | | (98 | ) | | | (98 | ) | | | | | | | | | | | Total | | | (60 | ) | | | (60 | ) | | | | | | | | | | | | Total of fair value non recognized in the balance sheet | | | | | | | — | | | | | | | | | | | |
(a) | | | | (a) | | Forwards: contracts resulting in physical delivery are accounted for as derivative commodity contracts and included in the amounts shown. |
| (b) | | From 2008, whenWhen the fair value of derivatives listed on an organized exchange market (futures, options on futures and swaps) is offset with the margin call received or paid on the face of the balance sheet, this fair value is set to zero. |
F-82 | | | | | | | | As of December 31, 2008(€ million) | | | | | | | | ASSETS/(LIABILITIES) | | Carrying
amount | | | Fair
value(b) | | Crude oil, petroleum products and freight rates activities | | | | | | | Petroleum products and crude oil swaps | | 141 | | | 141 | | Freight rate swaps | | 8 | | | 8 | | Forwards(a) | | (120 | ) | | (120 | ) | Options | | — | | | — | | Futures | | 17 | | | 17 | | Options on futures | | (7 | ) | | (7 | ) | Total crude oil, petroleum products and freight rates | | 39 | | | 39 | | Gas & Power activities | | | | | | | Swaps | | (48 | ) | | (48 | ) | Forwards(a) | | 659 | | | 659 | | Options | | — | | | — | | Futures | | (19 | ) | | (19 | ) | Total Gas & Power | | 592 | | | 592 | | Total | | 631 | | | 631 | | Total of fair value non recognized in the balance sheet | | | | | — | |
| | | | | | | | | | | As of December 31, 2009 (M€) | | | | | | | | | | Carrying
| | | Fair
| | | ASSETS/(LIABILITIES) | | amount | | | value(b) | | Crude oil, petroleum products and freight rates activities | | | | | | | | | | Petroleum products and crude oil swaps | | | (29 | ) | | | (29 | ) | | Freight rate swaps | | | — | | | | — | | Forwards(a) | | | (9 | ) | | | (9 | ) | | Options | | | 21 | | | | 21 | | | Futures | | | (17 | ) | | | (17 | ) | | Options on futures | | | 6 | | | | 6 | | | | | | | | | | | | Total crude oil, petroleum products and freight rates | | | (28 | ) | | | (28 | ) | | | | | | | | | | | Gas & Power activities | | | | | | | | | | Swaps | | | 52 | | | | 52 | | Forwards(a) | | | 78 | | | | 78 | | | Options | | | 4 | | | | 4 | | | Futures | | | — | | | | — | | | | | | | | | | | | Total Gas & Power | | | 134 | | | | 134 | | | | | | | | | | | | Total | | | 106 | | | | 106 | | | | | | | | | | | | | Total of fair value non recognized in the balance sheet | | | | | | | — | | | | | | | | | | | |
(a) | | | | (a) | | Forwards: contracts resulting in physical delivery are accounted for as derivative commodity contracts and included in the amounts shown. |
| (b) | | From 2008, whenWhen the fair value of derivatives listed on an organized exchange market (futures, options on futures and swaps) is offset with the margin call received or paid on the face of the balance sheet, this fair value is set to zero. |
| | | | | | | | As of December 31, 2007(€ million) | | | | | | | | ASSETS/(LIABILITIES) | | Carrying
amount | | | Fair
value(b) | | Crude oil, petroleum products and freight rates activities | | | | | | | Petroleum products and crude oil swaps | | (149 | ) | | (149 | ) | Freight rate swaps | | (3 | ) | | (3 | ) | Forwards(a) | | (4 | ) | | (4 | ) | Options | | 272 | | | 272 | | Futures | | (97 | ) | | (97 | ) | Options on futures | | (1 | ) | | (1 | ) | Total crude oil, petroleum products and freight rates | | 18 | | | 18 | | Gas & Power activities | | | | | | | Swaps | | 4 | | | 4 | | Forwards(a) | | 213 | | | 213 | | Options | | — | | | — | | Futures | | 15 | | | 15 | | Total Gas & Power | | 232 | | | 232 | | Total | | 250 | | | 250 | | Total of fair value non recognized in the balance sheet | | | | | — | |
| | | | | | | | | | | As of December 31, 2008 (M€) | | | | | | | | | | Carrying
| | | Fair
| | | ASSETS/(LIABILITIES) | | amount | | | value(b) | | Crude oil, petroleum products and freight rates activities | | | | | | | | | | Petroleum products and crude oil swaps | | | 141 | | | | 141 | | | Freight rate swaps | | | 8 | | | | 8 | | Forwards(a) | | | (120 | ) | | | (120 | ) | | Options | | | — | | | | — | | | Futures | | | 17 | | | | 17 | | | Options on futures | | | (7 | ) | | | (7 | ) | | | | | | | | | | | Total crude oil, petroleum products and freight rates | | | 39 | | | | 39 | | | | | | | | | | | | Gas & Power activities | | | | | | | | | | Swaps | | | (48 | ) | | | (48 | ) | Forwards(a) | | | 659 | | | | 659 | | | Options | | | — | | | | — | | | Futures | | | (19 | ) | | | (19 | ) | | | | | | | | | | | Total Gas & Power | | | 592 | | | | 592 | | | | | | | | | | | | Total | | | 631 | | | | 631 | | | | | | | | | | | | | Total of fair value non recognized in the balance sheet | | | | | | | — | | | | | | | | | | | |
(a) | | | | (a) | | Forwards: contracts resulting in physical delivery are accounted for as derivative commodity contracts and included in the amounts shown. |
| (b) | | From 2008, whenWhen the fair value of derivatives listed on an organized exchange market (futures, options on futures and swaps) is offset with the margin call received or paid on the face of the balance sheet, this fair value is set to zero. |
Most commitments on crude oil and refined products have a short term maturity (less than one year). The maturity of most Gas & Power energy derivatives is less than three years forward. F-83
The changes in fair value of financial instruments related to commodity contracts are detailed as follows: | | | | | | | | | | | | | | | | For the year ended December 31,(€ million) | | Fair value as
of January 1, | | | Impact on
income | | Settled
contracts | | | Other | | | Fair value as of
December 31, | | Crude oil, petroleum products and freight rates activities | | 2009 | | 39 | | | 1,713 | | (1,779 | ) | | (1 | ) | | (28 | ) | 2008 | | 18 | | | 1,734 | | (1,715 | ) | | 2 | | | 39 | | 2007 | | 102 | | | 1,381 | | (1,460 | ) | | (5 | ) | | 18 | | | | | | | | Gas & Power activities | | | | | | | | | | | | | | | 2009 | | 592 | | | 327 | | (824 | ) | | 39 | | | 134 | | 2008 | | 232 | | | 787 | | (310 | ) | | (117 | ) | | 592 | | 2007 | | (79 | ) | | 489 | | (163 | ) | | (15 | ) | | 232 | |
| | | | | | | | | | | | | | | | | | | | | | | | | Fair value as
| | | Impact on
| | | Settled
| | | | | | Fair value as
| | | For the year ended December 31, (M€) | | of January 1, | | | income | | | contracts | | | Other | | | of December 31, | | Crude oil, petroleum products and freight rates activities | 2010 | | | (28 | ) | | | 1,556 | | | | (1,488 | ) | | | (2 | ) | | | 38 | | | 2009 | | | 39 | | | | 1,713 | | | | (1,779 | ) | | | (1 | ) | | | (28 | ) | | 2008 | | | 18 | | | | 1,734 | | | | (1,715 | ) | | | 2 | | | | 39 | | | | | | | | | | | | | | | | | | | | | | | | | | | | | | | | | | | | | | | | | | | | | | Gas & Power activities | | | | | | | | | | | | | | | | | | | | | 2010 | | | 134 | | | | 410 | | | | (648 | ) | | | 6 | | | | (98 | ) | | 2009 | | | 592 | | | | 327 | | | | (824 | ) | | | 39 | | | | 134 | | | 2008 | | | 232 | | | | 787 | | | | (310 | ) | | | (117 | ) | | | 592 | | | | | | | | | | | | | | | | | | | | | | | |
The fair value hierarchy for financial instruments related to commodity contracts is as follows: | | | | | | | | | | | | | As of December 31, 2009(€ million) | | Quoted prices
in active
markets for
identical assets (level 1) | | | Prices based
on
observable
data (level 2) | | | Prices based
on non
observable
data (level 3) | | Total | | Crude oil, petroleum products and freight rates activities | | (45 | ) | | 17 | | | — | | (28 | ) | Gas & Power activities | | 140 | | | (6 | ) | | — | | 134 | | Total | | 95 | | | 11 | | | — | | 106 | |
| | | | | | | | | | | | | | | | | | | | | Quoted prices
| | | Prices based
| | | Prices based
| | | | | | | | in active
| | | on
| | | on non
| | | | | | | | markets for
| | | observable
| | | observable
| | | | | | | | identical assets
| | | data
| | | data
| | | | | | As of December 31, 2010 (M€) | | (level 1) | | | (level 2) | | | (level 3) | | | Total | | | Crude oil, petroleum products and freight rates activities | | | (10 | ) | | | 48 | | | | — | | | | 38 | | | Gas & Power activities | | | 50 | | | | (148 | ) | | | — | | | | (98 | ) | | | | | | | | | | | | | | | | | | | Total | | | 40 | | | | (100 | ) | | | — | | | | (60 | ) | | | | | | | | | | | | | | | | | | |
| | | | | | | | | | | | | | | | | | | | | Quoted prices
| | | Prices based
| | | Prices based
| | | | | | | | in active
| | | on
| | | on non
| | | | | | | | markets for
| | | observable
| | | observable
| | | | | | | | identical assets
| | | data
| | | data
| | | | | | As of December 31, 2009 (M€) | | (level 1) | | | (level 2) | | | (level 3) | | | Total | | | Crude oil, petroleum products and freight rates activities | | | (45 | ) | | | 17 | | | | — | | | | (28 | ) | | Gas & Power activities | | | 140 | | | | (6 | ) | | | — | | | | 134 | | | | | | | | | | | | | | | | | | | | Total | | | 95 | | | | 11 | | | | — | | | | 106 | | | | | | | | | | | | | | | | | | | |
The description of each fair value level is presented in Note 1 paragraph M(v) to the Consolidated Financial Statements. Oil and gas market related risks Due to the nature of its business, the Group has significant oil and gas trading activities as part of its day-to-day operations in order to optimize revenues from its oil and gas production and to obtain favorable pricing to supply its refineries. In its international oil trading business, the Group follows a policy of not selling its future production. However, in connection with this trading business, the Group, like most other oil companies, uses energy derivative instruments to adjust its exposure to price fluctuations of crude oil, refined products, natural gas, power and electricity.coal. The Group also uses freight rate derivative contracts in its shipping business to adjust its exposure to freight-rate fluctuations. To hedge against this risk, the Group uses various instruments such as futures, forwards, swaps and options on organizedorganised markets or over-the-counter markets. The list of the different derivatives held by the Group in these markets is detailed in Note 30 to the Consolidated Financial Statements. The Trading & Shipping division measures its market risk exposure, i.e. potential loss in fair values, on its crude oil, refined products and freight rates trading activities using a value-at-risk technique. This technique is based on an historical model and makes an assessment of the market risk arising from possible future changes in market values over a 24-hour period. The calculation of the range of potential changes in fair values takes into account a snapshot of the end-of-day exposures and the set of historical price movements for the last 400 business days for all instruments and maturities in the global trading activities. Options are systematically reevaluated using appropriate models. The potential movement in fair values corresponds to a 97.5%value-at-risk type confidence level. This means that
F-84
the Group’s portfolio result is likely to exceed the value-at-risk loss measure once over 40 business days if the portfolio exposures were left unchanged. Trading & Shipping: Shipping :value-at-risk with a 97.5% probability | | | | | | | | | As of December 31,
(€ million) | | High | | Low | | Average | | Year
end | 2009 | | 18.8 | | 5.8 | | 10.2 | | 7.6 | 2008 | | 13.5 | | 2.8 | | 6.9 | | 11.8 | 2007 | | 11.6 | | 3.3 | | 6.7 | | 5.4 |
| | | | | | | | | | | | | | | | | | | As of December 31, | | | | | | | | | | | Year
| | | (M€) | | High | | | Low | | | Average | | | end | | 2010 | | | 23.1 | | | | 3.4 | | | | 8.9 | | | | 3.8 | | | 2009 | | | 18.8 | | | | 5.8 | | | | 10.2 | | | | 7.6 | | | 2008 | | | 13.5 | | | | 2.8 | | | | 6.9 | | | | 11.8 | | | | | | | | | | | | | | | | | | | |
As part of its gas, power and powercoal trading activity, the Group also uses derivative instruments such as futures, forwards, swaps and options in both organizedorganised andover-the-counter markets. In general, the transactions are settled at maturity date through physical delivery. The Gas & Power division measures its market risk exposure,i.e.potential loss in fair values, on its trading business using avalue-at-risk technique. This technique is based on an historical model and makes an assessment of the market risk arising from possible future changes in market values over aone-day period. The calculation of the range of potential changes in fair values takes into account a snapshot of theend-of-day exposures and the set of historical price movements for the past two years for all instruments and maturities in the global trading business. Gas & Power trading: trading :value-at-risk with a 97.5% probability | | | | | | | | | As of December 31,
(€ million) | | High | | Low | | Average | | Year
end | 2009 | | 9.8 | | 1.9 | | 5.0 | | 4.8 | 2008 | | 16.3 | | 1.3 | | 5.0 | | 1.4 | 2007(a) | | 18.2 | | 3.2 | | 7.9 | | 4.3 |
(a) | Data takes into account historical price movements over one year. |
| | | | | | | | | | | | | | | | | | | As of December 31, | | | | | | | | | | | Year
| | | (M€) | | High | | | Low | | | Average | | | end | | 2010 | | | 13.9 | | | | 2.7 | | | | 6.8 | | | | 10.0 | | | 2009 | | | 9.8 | | | | 1.9 | | | | 5.0 | | | | 4.8 | | | 2008 | | | 16.3 | | | | 1.3 | | | | 5.0 | | | | 1.4 | | | | | | | | | | | | | | | | | | | |
The Group has implemented strict policies and procedures to manage and monitor these market risks. These are based on the splitting of supervisory functions from operational functions and on an integrated information system that enables real-time monitoring of trading activities. Limits on trading positions are approved by the Group’s Executive Committee and are monitored daily. To increase flexibility and encourage liquidity, hedging operations are performed with numerous independent operators, including other oil companies, major energy producers or consumers and financial institutions. The Group has established counterparty limits and monitors outstanding amounts with each counterparty on an ongoing basis. Financial markets related risks As part of its financing and cash management activities, the Group uses derivative instruments to manage its exposure to changes in interest rates and foreign exchange rates. These instruments are principally interest rate and currency swaps. The Group may also use, on a less frequent basis, futures caps, floors and options contracts. These operations and their accounting treatment are detailed in Notes 1 paragraph M, 20, 28 and 29 to the Consolidated Financial Statements. Risks relative to cash management operations and to interest rate and foreign exchange financial instruments are managed according to rules set by the Group’s senior management, which provide for regular pooling of available cash balances, open positions and management of the financial instruments by the Treasury Department. Excess cash of the Group is deposited mainly in government institutions or deposit banks through deposits, reverse repurchase agreements and purchase of commercial paper. Liquidity positions and the management of financial instruments are centralized by the Treasury Department, where they are managed by a team specialized in foreign exchange and interest rate market transactions. The Cash Monitoring-Management Unit within the Treasury Department monitors limits and positions per bank on a daily basis and reports results. This unit also prepares marked-to-market valuations and, when necessary, performs sensitivity analysis. The Group has established standards for market transactions under which bank counterparties must be approved in advance, based on an assessment of the counterparty’s financial soundness (multi-criteria analysis including a review of market prices and of the Credit Default Swap (CDS), its ratings with Standard & Poor’s and Moody’s, which must be of high quality, and its overall financial condition). An overall authorized credit limit is set for each bank and is allotted among the subsidiaries and the Group’s central treasury entities according to their needs. To reduce the market values risk on its commitments, in particular for swaps set as part of bonds issuance, the Treasury Department also developed a system of margin call that is gradually implemented with significant counterparties. The Group seeks to minimize the currency exposure of each entity to its functional currency (primarily the euro, the dollar, the pound sterling and the Norwegian krone).
F-85
For currency exposure generated by commercial activity, the hedging of revenues and costs in foreign currencies is typically performed using currency operations on the spot market and, in some cases, on the forward market. The Group rarely hedges future cash flows, although it may use options to do so. With respect to currency exposure linked to non-current assets booked in a currency other than the euro, the Group has a policy of reducing the related currency exposure by financing these assets in the same currency. Net short-term currency exposure is periodically monitored against limits set by the Group’s senior management. The non-current debt described in Note 20 to the Consolidated Financial Statements is generally raised by the corporate treasury entities either directly in dollars or euros, or in other currencies which are then exchanged for dollars or euros through swaps issues to appropriately match general corporate needs. The proceeds from these debt issuances are loaned to affiliates whose accounts are kept in dollars or in euros. Thus, the net sensitivity of these positions to currency exposure is not significant. The Group’s short-term currency swaps, the notional value of which appears in Note 29 to the Consolidated Financial Statements, are used to attempt to optimize the centralized cash management of the Group. Thus, the sensitivity to currency fluctuations which may be induced is likewise considered negligible. Short-term interest rate exposure and cash Cash balances, which are primarily composed of euros and dollars, are managed according to the guidelines established by the Group’s senior management (maintain an adequate level of liquidity, optimize revenue from investments considering existing interest rate yield curves, and minimize the cost of borrowing) over a less than twelve-month horizon and on the basis of a daily interest rate benchmark, primarily through short-term interest rate swaps and short-term currency swaps, without modifying currency exposure. Interest rate risk on non-current debt The Group’s policy consists of incurring non-current debt primarily at a floating rate, or, if the opportunity arises at the time of an issuance, at a fixed rate. Debt is incurred in dollars or in euros according to general corporate needs. Long-term interest rate and currency swaps may be used to hedge bonds at their issuance in order to create a variable or fixed rate synthetic debt. In order to partially modify the interest rate structure of the long-term debt, TOTAL may also enter into long-term interest rate swaps.
F-86
Sensitivity analysis on interest rate and foreign exchange risk The tables below present the potential impact of an increase or decrease of 10 basis points on the interest rate yield curves for each of the currencies on the fair value of the current financial instruments as of December 31, 2010, 2009 2008 and 2007. | | | | | | | | | | | | | | | | | | | | | | Change in fair value due to a
change in interest rate by | | | ASSETS/(LIABILITIES) | | Carrying
amount | | | Estimated
fair value | | | + 10 basis points | | | - 10 basis points | | As of December 31, 2009(€ million) | | | | | Bonds (non-current portion, before swaps) | | (18,368 | ) | | (18,368 | ) | | 75 | | | (75 | ) | Swaps hedging fixed-rates bonds (liabilities) | | (241 | ) | | (241 | ) | | | | | | | Swaps hedging fixed-rates bonds (assets) | | 1,025 | | | 1,025 | | | | | | | | Total swaps hedging fixed-rates bonds (assets and liabilities) | | 784 | | | 784 | | | (57 | ) | | 57 | | Current portion of non-current debt after swap
(excluding capital lease obligations) | | (2,111 | ) | | (2,111 | ) | | 3 | | | (3 | ) | Other interest rates swaps | | (1 | ) | | (1 | ) | | 1 | | | (1 | ) | Currency swaps and forward exchange contracts | | 34 | | | 34 | | | — | | | — | |
| | | | | | | | | | | | | | | | | | | | | | Change in fair value due to a
change in interest rate by | | | ASSETS/(LIABILITIES) | | Carrying
amount | | | Estimated
fair value | | | + 10 basis points | | | - 10 basis points | | As of December 31, 2008(€ million) | | | | | Bonds (non-current portion, before swaps) | | (14,119 | ) | | (14,119 | ) | | 47 | | | (43 | ) | Swaps hedging fixed-rates bonds (liabilities) | | (440 | ) | | (440 | ) | | | | | | | Swaps hedging fixed-rates bonds (assets) | | 892 | | | 892 | | | | | | | | Total swaps hedging fixed-rates bonds (assets and liabilities) | | 452 | | | 452 | | | (44 | ) | | 44 | | Current portion of non-current debt after swap
(excluding capital lease obligations) | | (2,025 | ) | | (2,025 | ) | | 3 | | | (3 | ) | Other interest rates swaps | | (4 | ) | | (4 | ) | | 1 | | | (1 | ) | Currency swaps and forward exchange contracts | | (56 | ) | | (56 | ) | | — | | | — | |
| | | | | | | | | | | | | | | | | | | | | | Change in fair value due to a
change in interest rate by | | | ASSETS/(LIABILITIES) | | Carrying
amount | | | Estimated
fair value | | | + 10 basis points | | | - 10 basis points | | As of December 31, 2007(€ million) | | | | | Bonds (non-current portion, before swaps) | | (11,741 | ) | | (11,741 | ) | | 37 | | | (37 | ) | Swaps hedging fixed-rates bonds (liabilities) | | (369 | ) | | (369 | ) | | | | | | | Swaps hedging fixed-rates bonds (assets) | | 460 | | | 460 | | | | | | | | Total swaps hedging fixed-rates bonds (assets and liabilities) | | 91 | | | 91 | | | (39 | ) | | 38 | | Current portion of non-current debt after swap
(excluding capital lease obligations) | | (1,669 | ) | | (1,669 | ) | | (1 | ) | | 1 | | Other interest rates swaps | | 1 | | | 1 | | | — | | | — | | Currency swaps and forward exchange contracts | | (34 | ) | | (34 | ) | | — | | | — | |
2008. | | | | | | | | | | | | | | | | | | ASSETS/(LIABILITIES)
| | | | | | | | Change in fair value due to a
| | | (M€) | | Carrying
| | | Estimated
| | | change in interest rate by | | | As of December 31, 2010 | | amount | | | fair value | | | + 10 basis points | | | - 10 basis points | | | Bonds (non-current portion, before swaps) | | | (20,019 | ) | | | (20,408 | ) | | | 86 | | | | (84 | ) | Swaps hedging fixed-rates bonds (liabilities) | | | (178 | ) | | | (178 | ) | | | | | | | | | Swaps hedging fixed-rates bonds (assets) | | | 1,870 | | | | 1,870 | | | | | | | | | | | Total swaps hedging fixed-rates bonds (assets and liabilities) | | | 1,692 | | | | 1,692 | | | | (59 | ) | | | 59 | | | Current portion of non-current debt after swap (excluding capital lease obligations) | | | 3,483 | | | | 3,483 | | | | 4 | | | | (4 | ) | | Other interest rates swaps | | | (2 | ) | | | (2 | ) | | | 3 | | | | (3 | ) | | Currency swaps and forward exchange contracts | | | (101 | ) | | | (101 | ) | | | — | | | | — | | | | | | | | | | | | | | | | | | | | As of December 31, 2009 | | | | | | | | | | | | | | | | | | | | | | | | | | | | | | | | | | | | Bonds (non-current portion, before swaps) | | | (18,368 | ) | | | (18,836 | ) | | | 75 | | | | (75 | ) | Swaps hedging fixed-rates bonds (liabilities) | | | (241 | ) | | | (241 | ) | | | | | | | | | Swaps hedging fixed-rates bonds (assets) | | | 1,025 | | | | 1,025 | | | | | | | | | | | Total swaps hedging fixed-rates bonds (assets and liabilities) | | | 784 | | | | 784 | | | | (57 | ) | | | 57 | | | Current portion of non-current debt after swap (excluding capital lease obligations) | | | (2,111 | ) | | | (2,111 | ) | | | 3 | | | | (3 | ) | | Other interest rates swaps | | | (1 | ) | | | (1 | ) | | | 1 | | | | (1 | ) | | Currency swaps and forward exchange contracts | | | 34 | | | | 34 | | | | — | | | | — | | | | | | | | | | | | | | | | | | | | As of December 31, 2008 | | | | | | | | | | | | | | | | | | | | | | | | | | | | | | | | | | | | Bonds (non-current portion, before swaps) | | | (14,119 | ) | | | (14,119 | ) | | | 47 | | | | (43 | ) | Swaps hedging fixed-rates bonds (liabilities) | | | (440 | ) | | | (440 | ) | | | | | | | | | Swaps hedging fixed-rates bonds (assets) | | | 892 | | | | 892 | | | | | | | | | | | Total swaps hedging fixed-rates bonds (assets and liabilities) | | | 452 | | | | 452 | | | | (44 | ) | | | 44 | | | Current portion of non-current debt after swap (excluding capital lease obligations) | | | (2,025 | ) | | | (2,025 | ) | | | 3 | | | | (3 | ) | | Other interest rates swaps | | | (4 | ) | | | (4 | ) | | | 1 | | | | (1 | ) | | Currency swaps and forward exchange contracts | | | (56 | ) | | | (56 | ) | | | — | | | | — | |
The impact of changes in interest rates on the cost of net debt before tax is as follows: | | | | | | | | | | | For the year ended December 31,(€ million) | | 2009 | | | 2008 | | | 2007 | | Cost of net debt | | (398 | ) | | (527 | ) | | (539 | ) | Interest rate translation of + 10 basis points | | (11 | ) | | (11 | ) | | (12 | ) | Interest rate translation of - 10 basis points | | 11 | | | 11 | | | 12 | | Interest rate translation of + 100 basis points | | (108 | ) | | (113 | ) | | (116 | ) | Interest rate translation of - 100 basis points | | 108 | | | 113 | | | 116 | |
| | | | | | | | | | | | | | | For The year ended December 31, (M€) | | 2010 | | | 2009 | | | 2008 | | | Cost of net debt | | | (334 | ) | | | (398 | ) | | | (527 | ) | | Interest rate translation of : | | | | | | | | | | | | | | + 10 basis points | | | (11 | ) | | | (11 | ) | | | (11 | ) | | - 10 basis points | | | 11 | | | | 11 | | | | 11 | | | + 100 basis points | | | (107 | ) | | | (108 | ) | | | (113 | ) | | - 100 basis points | | | 107 | | | | 108 | | | | 113 | | | | | | | | | | | | | | | |
As a result of the policy for the management of currency exposure previously described, the Group’s sensitivity to currency exposure is primarily influenced by the net equity of the subsidiaries whose functional currency is the dollar and, to a lesser extent, the pound sterling and the Norwegian krone.
F-87
This sensitivity is reflected in the historical evolution of the currency translation adjustment recorded in the statement of changes in shareholders’ equity which, in the course of the last three fiscal years, is essentially related to the fluctuation of dollar and pound sterling and is set forth in the table below: | | | | | | | | Euro / Dollar
exchange rates | | Euro / Pound sterling
exchange rates | As of December 31, 2009 | | 1.44 | | 0.89 | As of December 31, 2008 | | 1.39 | | 0.95 | As of December 31, 2007 | | 1.47 | | 0.73 |
| | | | | | | | | | | | | | | | As of December 31, 2009(€ million) | | Total | | | Euro | | Dollar | | | Pound
sterling | | | Other
currencies
and equity
affiliates | | Shareholders’ equity at historical exchange rate | | 57,621 | | | 27,717 | | 18,671 | | | 5,201 | | | 6,032 | | Currency translation adjustment before net investment hedge | | (5,074 | ) | | | | (3,027 | ) | | (1,465 | ) | | (582 | ) | Net investment hedge — open instruments | | 5 | | | | | 6 | | | (1 | ) | | | | Shareholders’ equity at exchange rate as of December 31, 2009 | | 52,552 | | | 27,717 | | 15,650 | | | 3,735 | | | 5,450 | | | | | | | | | | | | | | | | | | As of December 31, 2008(€ million) | | Total | | | Euro | | Dollar | | | Pound
sterling | | | Other
currencies
and equity
affiliates | | Shareholders’ equity at historical exchange rate | | 53,868 | | | 25,084 | | 15,429 | | | 5,587 | | | 7,768 | | Currency translation adjustment before net investment hedge | | (4,876 | ) | | — | | (2,191 | ) | | (1,769 | ) | | (916 | ) | Net investment hedge — open instruments | | — | | | — | | — | | | — | | | — | | Shareholders’ equity at exchange rate as of December 31, 2008 | | 48,992 | | | 25,084 | | 13,238 | | | 3,818 | | | 6,852 | | | | | | | | | | | | | | | | | | As of December 31, 2007(€ million) | | Total | | | Euro | | Dollar | | | Pound
sterling | | | Other
currencies
and equity
affiliates | | Shareholders’ equity at historical exchange rate | | 49,254 | | | 22,214 | | 12,954 | | | 5,477 | | | 8,609 | | Currency translation adjustment before net investment hedge | | (4,410 | ) | | — | | (3,501 | ) | | (289 | ) | | (620 | ) | Net investment hedge — open instruments | | 14 | | | — | | 14 | | | — | | | — | | Shareholders’ equity at exchange rate as of December 31, 2007 | | 44,858 | | | 22,214 | | 9,467 | | | 5,188 | | | 7,989 | |
| | | | | | | | | | | | | Euro / Dollar
| | Euro / Pound sterling
| | | | exchange rates | | exchange rates | As of December 31, 2010 | | | 1.34 | | | | 0.86 | | | As of December 31, 2009 | | | 1.44 | | | | 0.89 | | | As of December 31, 2008 | | | 1.39 | | | | 0.95 | | | | | | | | | | | |
| | | | | | | | | | | | | | | | | | | | | | | | | | | | | | | | | | | | | Other
| | | | | | | | | | | | | | | | | currencies
| | | | | | | | | | | | | | Pound
| | | and equity
| | | As of December 31, 2010 (M€) | | Total | | | Euro | | | Dollar | | | sterling | | | affiliates(a) | | | Shareholders’ equity at historical exchange rate | | | 62,909 | | | | 32,894 | | | | 22,242 | | | | 4,997 | | | | 2,776 | | | Currency translation adjustment before net investment hedge | | | (2,501 | ) | | | — | | | | (1,237 | ) | | | (1,274 | ) | | | 10 | | | Net investment hedge — open instruments | | | 6 | | | | — | | | | 6 | | | | — | | | | — | | | Shareholders’ equity at exchange rate as of December 31, 2010 | | | 60,414 | | | | 32,894 | | | | 21,011 | | | | 3,723 | | | | 2,786 | | | | | | | | | | | | | | | | | | | | | | | |
| | | | | | | | | | | | | | | | | | | | | | | | | | | | | | | | | | | | | Other
| | | | | | | | | | | | | | | | | currencies
| | | | | | | | | | | | | | Pound
| | | and equity
| | | As of December 31, 2009 (M€) | | Total | | | Euro | | | Dollar | | | sterling | | | affiliates | | | Shareholders’ equity at historical exchange rate | | | 57,621 | | | | 27,717 | | | | 18,671 | | | | 5,201 | | | | 6,032 | | | Currency translation adjustment before net investment hedge | | | (5,074 | ) | | | — | | | | (3,027 | ) | | | (1,465 | ) | | | (582 | ) | | Net investment hedge — open instruments | | | 5 | | | | — | | | | 6 | | | | (1 | ) | | | — | | | Shareholders’ equity at exchange rate as of December 31, 2009 | | | 52,552 | | | | 27,717 | | | | 15,650 | | | | 3,735 | | | | 5,450 | | | | | | | | | | | | | | | | | | | | | | | |
| | | | | | | | | | | | | | | | | | | | | | | | | | | | | | | | | | | | | Other
| | | | | | | | | | | | | | | | | currencies
| | | | | | | | | | | | | | Pound
| | | and equity
| | | As of December 31, 2008 (M€) | | Total | | | Euro | | | Dollar | | | sterling | | | affiliates | | | Shareholders’ equity at historical exchange rate | | | 53,868 | | | | 25,084 | | | | 15,429 | | | | 5,587 | | | | 7,768 | | | Currency translation adjustment before net investment hedge | | | (4,876 | ) | | | — | | | | (2,191 | ) | | | (1,769 | ) | | | (916 | ) | | Net investment hedge — open instruments | | | — | | | | — | | | | — | | | | — | | | | — | | | Shareholders’ equity at exchange rate as of December 31, 2008 | | | 48,992 | | | | 25,084 | | | | 13,238 | | | | 3,818 | | | | 6,852 | | | | | | | | | | | | | | | | | | | | | | | |
| | | | (a) | | The decrease in the heading “Other currencies and equity affiliates” is mainly explained by the change in the consolidation method of Sanofi-Aventis (see Note 3 to the Consolidated Financial Statements). The contribution to the shareholders’ equity of this investment is now reclassified into the heading for the Eurozone. |
As a result of this policy, the impact of currency exchange rate fluctuations on consolidated income, as illustrated in Note 7 to the Consolidated Financial Statements, has not been significant over the last three years despite the considerable fluctuation of the dollar (loss(nil result in 2010, loss of€32 €32 million in 2009, gain of€112 €112 million in 2008, gain of2008). €Stock market risk35 million in 2007).The Group holds interests in a number of publicly-traded companies (see Notes 12 and 13 to the Consolidated Financial Statements). The market value of these holdings fluctuates due to various factors, including stock market trends, valuations of the sectors in which the companies operate, and the economic and financial condition of each individual company. Liquidity risk TOTAL S.A. has confirmed lines of credit granted by international banks, which are calculated to allow it to manage its short-term liquidity needs as required. As of December 31, 2009,2010, these lines of credit amounted to $9,322$9,592 million, of which $9,289$9,581 million were was unused. The agreements for the lines of credit granted to TOTAL S.A. do not contain conditions related to the Company’s financial ratios, to its financial ratings from specialized agencies, or to the occurrence of events that could have a material adverse effect on its financial position. As of December 31, 2009,2010, the aggregate amount of the principal confirmed lines of credit
F-88
granted by international banks to Group companies, including TOTAL S.A., was $10,084$10,395 million, of which $10,051$10,383 million werewas unused. The lines of credit granted to Group companies other than TOTAL S.A. are not intended to finance the Group’s general needs; they are intended to finance either the general needs of the borrowing subsidiary or a specific project. The following tables show the maturity of the financial assets and liabilities of the Group as of December 31, 2010, 2009 2008 and 20072008 (see Note 20 to the Consolidated Financial Statements). | | | | | | | | | | | | | | | | | | | | | | | | | | | | | | As of December 31, 2010 (M€)
| | Less than
| | | | | | | | | | | | | | | More than
| | | | | | ASSETS/(LIABILITIES) | | one year | | | 1-2 years | | | 2-3 years | | | 3-4 years | | | 4-5 years | | | 5 years | | | Total | | | Non-current financial debt (notional value excluding interests) | | | | | | | (3,355 | ) | | | (3,544 | ) | | | (2,218 | ) | | | (3,404 | ) | | | (6,392 | ) | | | (18,913 | ) | | Current borrowings | | | (9,653 | ) | | | | | | | | | | | | | | | | | | | | | | | (9,653 | ) | | Other current financial liabilities | | | (159 | ) | | | | | | | | | | | | | | | | | | | | | | | (159 | ) | | Current financial assets | | | 1,205 | | | | | | | | | | | | | | | | | | | | | | | | 1,205 | | | Cash and cash equivalents | | | 14,489 | | | | | | | | | | | | | | | | | | | | | | | | 14,489 | | | | | | | | | | | | | | | | | | | | | | | | | | | | | | | | Net amount before financial expense | | | 5,882 | | | | (3,355 | ) | | | (3,544 | ) | | | (2,218 | ) | | | (3,404 | ) | | | (6,392 | ) | | | (13,031 | ) | | Financial expense on non-current financial debt | | | (843 | ) | | | (729 | ) | | | (605 | ) | | | (450 | ) | | | (358 | ) | | | (1,195 | ) | | | (4,180 | ) | | Interest differential on swaps | | | 461 | | | | 334 | | | | 153 | | | | 33 | | | | 2 | | | | (78 | ) | | | 905 | | | | | | | | | | | | | | | | | | | | | | | | | | | | | | | | Net amount | | | 5,500 | | | | (3,750 | ) | | | (3,996 | ) | | | (2,635 | ) | | | (3,760 | ) | | | (7,665 | ) | | | (16,306 | ) | | | | | | | | | | | | | | | | | | | | | | | | | | | | | | |
| | | | | | | | | | | | | | | | | | | | | | | | | | | | | | As of December 31, 2009 (M€)
| | Less than
| | | | | | | | | | | | | | | More than
| | | | | | ASSETS/(LIABILITIES) | | one year | | | 1-2 years | | | 2-3 years | | | 3-4 years | | | 4-5 years | | | 5 years | | | Total | | | Non-current financial debt (notional value excluding interests) | | | | | | | (3,658 | ) | | | (3,277 | ) | | | (3,545 | ) | | | (2,109 | ) | | | (5,823 | ) | | | (18,412 | ) | | Current borrowings | | | (6,994 | ) | | | | | | | | | | | | | | | | | | | | | | | (6,994 | ) | | Other current financial liabilities | | | (123 | ) | | | | | | | | | | | | | | | | | | | | | | | (123 | ) | | Current financial assets | | | 311 | | | | | | | | | | | | | | | | | | | | | | | | 311 | | | Cash and cash equivalents | | | 11,662 | | | | | | | | | | | | | | | | | | | | | | | | 11,662 | | | | | | | | | | | | | | | | | | | | | | | | | | | | | | | | Net amount before financial expense | | | 4,856 | | | | (3,658 | ) | | | (3,277 | ) | | | (3,545 | ) | | | (2,109 | ) | | | (5,823 | ) | | | (13,556 | ) | | Financial expense on non-current financial debt | | | (768 | ) | | | (697 | ) | | | (561 | ) | | | (448 | ) | | | (301 | ) | | | (1,112 | ) | | | (3,887 | ) | | Interest differential on swaps | | | 447 | | | | 233 | | | | 100 | | | | 25 | | | | (16 | ) | | | (55 | ) | | | 734 | | | | | | | | | | | | | | | | | | | | | | | | | | | | | | | | Net amount | | | 4,535 | | | | (4,122 | ) | | | (3,738 | ) | | | (3,968 | ) | | | (2,426 | ) | | | (6,990 | ) | | | (16,709 | ) | | | | | | | | | | | | | | | | | | | | | | | | | | | | | | |
| | | | | | | | | | | | | | | | | | | | | | | | | | | | | | As of December 31, 2008 (M€)
| | Less than
| | | | | | | | | | | | | | | More than
| | | | | | ASSETS/(LIABILITIES) | | one year | | | 1-2 years | | | 2-3 years | | | 3-4 years | | | 4-5 years | | | 5 years | | | Total | | | Non-current financial debt (notional value excluding interests) | | | | | | | (2,992 | ) | | | (3,658 | ) | | | (3,324 | ) | | | (3,232 | ) | | | (2,093 | ) | | | (15,299 | ) | | Current borrowings | | | (7,722 | ) | | | | | | | | | | | | | | | | | | | | | | | (7,722 | ) | | Other current financial liabilities | | | (158 | ) | | | | | | | | | | | | | | | | | | | | | | | (158 | ) | | Current financial assets | | | 187 | | | | | | | | | | | | | | | | | | | | | | | | 187 | | | Cash and cash equivalents | | | 12,321 | | | | | | | | | | | | | | | | | | | | | | | | 12,321 | | | | | | | | | | | | | | | | | | | | | | | | | | | | | | | | Net amount before financial expense | | | 4,628 | | | | (2,992 | ) | | | (3,658 | ) | | | (3,324 | ) | | | (3,232 | ) | | | (2,093 | ) | | | (10,671 | ) | | Financial expense on non-current financial debt | | | (554 | ) | | | (512 | ) | | | (431 | ) | | | (299 | ) | | | (189 | ) | | | (174 | ) | | | (2,159 | ) | | Interest differential on swaps | | | 118 | | | | 211 | | | | 100 | | | | 62 | | | | 37 | | | | (7 | ) | | | 521 | | | | | | | | | | | | | | | | | | | | | | | | | | | | | | | | Net amount | | | 4,192 | | | | (3,293 | ) | | | (3,989 | ) | | | (3,561 | ) | | | (3,384 | ) | | | (2,274 | ) | | | (12,309 | ) | | | | | | | | | | | | | | | | | | | | | | | | | | | | | | |
F-89
| | | | | | | | | | | | | ASSETS/(LIABILITIES) As of December 31, 2009(€ million) | | Less than
one year | | | Between 1 year
and 5 years | | | More than
5 years | | | Total | | Non-current financial debt (notional value excluding interests) | | | | | (12,589 | ) | | (5,823 | ) | | (18,412 | ) | Current borrowings | | (6,994 | ) | | | | | | | | (6,994 | ) | Other current financial liabilities | | (123 | ) | | | | | | | | (123 | ) | Current financial assets | | 311 | | | | | | | | | 311 | | Cash and cash equivalents | | 11,662 | | | | | | | | | 11,662 | | Net amount before financial expense | | 4,856 | | | (12,589 | ) | | (5,823 | ) | | (13,556 | ) | Financial expense on non-current financial debt | | (768 | ) | | (2,007 | ) | | (1,112 | ) | | (3,887 | ) | Interest differential on swaps | | 447 | | | 342 | | | (55 | ) | | 734 | | Net amount | | 4,535 | | | (14,254 | ) | | (6,990 | ) | | (16,709 | ) | | | | | | | | | | | | | | | | As of December 31, 2008(€ million) | | Less than
one year | | | Between 1 year
and 5 years | | | More than
5 years | | | Total | | Non-current financial debt (notional value excluding interests) | | | | | (13,206 | ) | | (2,093 | ) | | (15,299 | ) | Current borrowings | | (7,722 | ) | | | | | | | | (7,722 | ) | Other current financial liabilities | | (158 | ) | | | | | | | | (158 | ) | Current financial assets | | 187 | | | | | | | | | 187 | | Cash and cash equivalents | | 12,321 | | | | | | | | | 12,321 | | Net amount before financial expense | | 4,628 | | | (13,206 | ) | | (2,093 | ) | | (10,671 | ) | Financial expense on non-current financial debt | | (554 | ) | | (1,431 | ) | | (174 | ) | | (2,159 | ) | Interest differential on swaps | | 118 | | | 410 | | | (7 | ) | | 521 | | Net amount | | 4,192 | | | (14,227 | ) | | (2,274 | ) | | (12,309 | ) | | | | | | | | | | | | | | | | As of December 31, 2007(€ million) | | Less than
one year | | | Between 1 year
and 5 years | | | More than
5 years | | | Total | | Non-current financial debt (notional value excluding interests) | | | | | (11,424 | ) | | (2,992 | ) | | (14,416 | ) | Current borrowings | | (4,613 | ) | | | | | | | | (4,613 | ) | Other current financial liabilities | | (60 | ) | | | | | | | | (60 | ) | Current financial assets | | 1,264 | | | | | | | | | 1,264 | | Cash and cash equivalents | | 5,988 | | | | | | | | | 5,988 | | Net amount before financial expense | | 2,579 | | | (11,424 | ) | | (2,992 | ) | | (11,837 | ) | Financial expense on non-current financial debt | | (532 | ) | | (1,309 | ) | | (226 | ) | | (2,067 | ) | Interest differential on swaps | | (29 | ) | | (80 | ) | | (44 | ) | | (153 | ) | Net amount | | 2,018 | | | (12,813 | ) | | (3,262 | ) | | (14,057 | ) |
In addition, the Group guarantees bank debt and finance lease obligations of certain non-consolidated companies and equity affiliates. A payment would be triggered by failure of the guaranteed party to fulfill its obligation covered by the guarantee, and no assets are held as collateral for these guarantees. Maturity dates and amounts are set forth in Note 23 to the Consolidated Financial Statements (“Guarantees given against borrowings”). The Group also guarantees the current liabilities of certain non-consolidated companies. Performance under these guarantees would be triggered by a financial default of these entities. Maturity dates and amounts are set forth in Note 23 to the Consolidated Financial Statements (“Guarantees of current liabilities”). The following table sets forth financial assets and liabilities related to operating activities as of December 31, 2010, 2009 2008 and 20072008 (see Note 28 to the Consolidated Financial Statements). | | | | | | | | | | As of December 31
(€ million) | | | | | | | | | | | ASSETS/(LIABILITIES) | | 2009 | | | 2008 | | | 2007 | | Accounts payable | | (15,383 | ) | | (14,815 | ) | | (18,183 | ) | Other operating liabilities | | (4,706 | ) | | (4,297 | ) | | (3,900 | ) | including financial instruments related to commodity contracts | | (923 | ) | | (1,033 | ) | | (733 | ) | Accounts receivable, net | | 15,719 | | | 15,287 | | | 19,129 | | Other operating receivables | | 5,145 | | | 6,208 | | | 4,430 | | including financial instruments related to commodity contracts | | 1,029 | | | 1,664 | | | 983 | | Total | | 775 | | | 2,383 | | | 1,476 | |
| | | | | | | | | | | | | | As of December 31
| | | | | | | | | | (M€)
| | | | | | | | | | | ASSETS/(LIABILITIES) | | 2010 | | | 2009 | | | 2008 | | | Accounts payable | | | (18,450 | ) | | | (15,383 | ) | | | (14,815 | ) | | Other operating liabilities | | | (3,574 | ) | | | (4,706 | ) | | | (4,297 | ) | including financial instruments related to commodity contracts | | | (559 | ) | | | (923 | ) | | | (1,033 | ) | | Accounts receivable, net | | | 18,159 | | | | 15,719 | | | | 15,287 | | | Other operating receivables | | | 4,407 | | | | 5,145 | | | | 6,208 | | including financial instruments related to commodity contracts | | | 499 | | | | 1,029 | | | | 1,664 | | | | | | | | | | | | | | | | Total | | | 542 | | | | 775 | | | | 2,383 | | | | | | | | | | | | | | | |
These financial assets and liabilities mainly have a maturity date below one year. Credit risk Credit risk is defined as the risk of the counterparty to a contract failing to perform or pay the amounts due. The Group is exposed to credit risks in its operating and financing activities. The Group’s maximum exposure to credit risk is partially related to financial assets recorded on its balance sheet, including energy derivative instruments that have a positive market value. The following table presents the Group’s maximum credit risk exposure: | | | | | | | As of December 31,
(€ million) | | | | | | | | Assets/(Liabilities) | | 2009 | | 2008 | | 2007 | Loans to equity affiliates
(Note 12) | | 2,367 | | 2,005 | | 2,575 | Loans and advances
(Note 14) | | 1,284 | | 1,403 | | 851 | Hedging instruments of non-current financial debt(Note 20) | | 1,025 | | 892 | | 460 | Accounts receivable
(Note 16) | | 15,719 | | 15,287 | | 19,129 | Other operating receivables
(Note 16) | | 5,145 | | 6,208 | | 4,430 | Current financial assets
(Note 20) | | 311 | | 187 | | 1,264 | Cash and cash equivalents
(Note 27) | | 11,662 | | 12,321 | | 5,988 | Total | | 37,513 | | 38,303 | | 34,697 |
| | | | | | | | | | | | | | As of December 31
| | | | | | | | | | (M€)
| | | | | | | | | | | ASSETS/(LIABILITIES) | | 2010 | | | 2009 | | | 2008 | | Loans to equity affiliates(Note 12) | | | 2,383 | | | | 2,367 | | | | 2,005 | | Loans and advances(Note 14) | | | 1,596 | | | | 1,284 | | | | 1,403 | | Hedging instruments of non-current financial debt(Note 20) | | | 1,870 | | | | 1,025 | | | | 892 | | Accounts receivable(Note 16) | | | 18,159 | | | | 15,719 | | | | 15,287 | | | Other operating receivables (Note 16) | | | 4,407 | | | | 5,145 | | | | 6,208 | | Current financial assets(Note 20) | | | 1,205 | | | | 311 | | | | 187 | | Cash and cash equivalents(Note 27) | | | 14,489 | | | | 11,662 | | | | 12,321 | | | | | | | | | | | | | | | | Total | | | 44,109 | | | | 37,513 | | | | 38,303 | | | | | | | | | | | | | | | |
The valuation allowance on loans and advances and on accounts receivable and other operating receivables is detailed respectively in Notes 14 and 16 to the Consolidated Financial Statements. As part of its credit risk management related to operating and financing activities, the Group has developed margin call contracts with certain counterparties. As of December 31, 2009,2010, the net amount paid or received as part of these margin calls was €693 million. €1,560 million (against €693 million as of December 31, 2009). Credit risk is managed by the Group’s business segments as follows:
| | | | | - | Exploration & Production |
Risks arising under contracts with government authorities or other oil companies or under long-term supply contracts necessary for the development of projects are evaluated during the project approval process. The long-term aspect of these contracts and the high-quality of the other parties lead to a low level of credit risk. Risks related to commercial operations, other than those described above (which are, in practice, directly monitored by subsidiaries), are subject to procedures for establishing and reviewing credit. Customer receivables are subject to provisions on acase-by-case basis, based on prior history and management’s assessment of the facts and circumstances.
F-90
The Gas & Power division deals with counterparties in the energy, industrial and financial sectors throughout the world, primarily in Europe and North America.world. Financial institutions providing credit risk coverage are highly rated international bank and insurance groups. Potential counterparties are subject to credit assessment and approval before concluding transactions and are thereafter subject to regular review, including re-appraisal and approval of the limits previously granted. The creditworthiness of counterparties is assessed based on an analysis of quantitative and qualitative data regarding financial standing and business risks, together with the review of any relevant third party and market information, such as data published by rating agencies. On this basis, credit limits are defined for each potential counterparty and, where appropriate, transactions are subject to specific authorizations.authorisations. Credit exposure, which is essentially an economic exposure or an expected future physical exposure, is permanently monitored and subject to sensitivity measures. Credit risk is mitigated by the systematic use of industry standard contractual frameworks that permit netting, enable requiring added security in case of adverse change in the counterparty risk, and allow for termination of the contract upon occurrence of certain events of default. Internal procedures for the Refining & Marketing division include rules on credit risk that describe the basis of internal control in this domain, including the separation of authority between commercial and financial operations. Credit policies are defined at the local level, complemented by the implementation of procedures to monitor customer risk (credit committees at the subsidiary level, the creation of credit limits for corporate customers, portfolio guarantees, etc.). Each entity also implements monitoring of its outstanding receivables. Risks related to credit may be mitigated or limited by requiring security or guarantees. Bad debts are provisioned on a case-by-case basis at a rate determined by management based on an assessment of the facts and circumstances. Trading & Shipping deals with commercial counterparties and financial institutions located throughout the world. Counterparties to physical and derivative transactions are primarily entities involved in the oil and gas industry or in the trading of energy commodities, or financial institutions. Credit risk coverage is concluded with financial institutions, international banks and insurance groups selected in accordance with strict criteria. The Trading & Shipping division has a strict policy of internal delegation of authority governing establishment of country and counterparty credit limits and approval of specific transactions. Credit exposures contracted under these limits and approvals are monitored on a daily basis. Potential counterparties are subject to credit assessment and approval prior to any transaction being concluded and all active counterparties are subject to regular reviews, including re-appraisal and approval of granted limits. The creditworthiness of counterparties is assessed based on an analysis of quantitative and qualitative data regarding financial standing and business risks, together with the review of any relevant third party and market information, such as ratings published by Standard & Poor’s, Moody’s Investors Service and other agencies. Contractual arrangements are structured so as to maximize the risk mitigation benefits of netting between transactions wherever possible and additional protective terms providing for the provision of security in the event of financial deterioration and the termination of transactions on the occurrence of defined default events are used to the greatest permitted extent. Credit risks in excess of approved levels are secured by means of letters of credit and other guarantees, cash deposits and insurance arrangements. In respect of derivative transactions, risks are secured by margin call contracts wherever possible. Credit risk in the Chemicals segment is primarily related to commercial receivables. Each division implements procedures for managing and provisioning credit risk that differ based on the size of the subsidiary and the market in which it operates. The principal elements of these procedures are: | | | | • | Implementation of credit limits with different authorization procedures for possible credit overruns; | | • | Use of insurance policies or specific guarantees (letters of credit); | | • | Regular monitoring and assessment of overdue accounts (aging balance), including collection procedures; and |
F-91
implementation of credit limits with different authorization procedures for possible credit overruns;
use of insurance policies or specific guarantees (letters of credit);
regular monitoring and assessment of overdue accounts (aging balance), including collection procedures;
| | | | • | Provisioning of bad debts on acustomer-by-customer basis, according to payment delays and local payment practices (provisions may also be calculated based on statistics). |
| | | 32) | OTHER RISKS AND CONTINGENT LIABILITIES |
provisioning of bad debts on a customer-by-customer basis, according to payment delays and local payment practices.
32) OTHER RISKS AND CONTINGENT LIABILITIES
TOTAL is not currently aware of any exceptional event, litigation,dispute, risks or contingent liabilities that could have a material impact on the assets and liabilities, results, financial position or operations of the Group. ANTITRUST INVESTIGATIONS 1. Following investigations into certain commercial practices in
For the chemicals industry inyear ended 2010, the United States, some subsidiaries of the Arkema(1) group haveGroup has not been involved in criminal investigations, closed as of today, and civil liability lawsuits in the United States for violations of antitrust laws. TOTAL S.A. has been named in certain of these suits as the parent company.In Europe, the European Commission commenced investigations in 2000, 2003 and 2004 into alleged anti-competitive practices involving certain products sold by Arkema. In January 2005, under one of these investigations, the European Commission fined Arkema€13.5 million and jointly fined Arkema and Elf Aquitaine€45 million.pursuant to a Court ruling. The appeal from Arkema and Elf Aquitaine before the Court of First Instance of the European Union has been rejected on September 30, 2009. A recourse before the Court of Justice of the European Communities has been filed.
The Commission notified Arkema, TOTAL S.A. and Elf Aquitaine of complaints concerning two other product lines in January and August 2005, respectively. Arkema has cooperated with the authorities in these procedures and investigations. In May 2006, the European Commission fined Arkema€78.7 million and€219.1 million, as a result of, respectively, each of these two proceedings. Elf Aquitaine was held jointly and severally liable for, respectively,€65.1 million and€181.35 million of these fines while TOTAL S.A. was held jointly and severally liable, respectively, for€42 million and€140.4 million. TOTAL S.A., Arkema and Elf Aquitaine have appealed these decisions to the Court of First Instance of the European Union.
Arkema and Elf Aquitaine received a statement of objections from the European Commission in August 2007 concerning alleged anti-competitive practices related to another line of chemical products. As a result, in June 2008, Arkema and Elf Aquitaine have been jointly and severally fined in an amount of€22.7 million and individually in an amount of€20.43 million for Arkema and€15.89 million for Elf Aquitaine. The companies concerned appealed this decision to the relevant European court.
Arkema and Elf Aquitaine received a statement of objections from the European Commission in March 2009 concerning alleged anti-competitive practices related to another line of chemical products. The decision has been rendered by the Commission in November 2009. The companies have been jointly and severally fined in an amount of€11 million and individually in an amount of€9.92 million for Arkema and€7.71 million for Elf Aquitaine. The concerned companies will appeal this decision to the relevant European court.
No facts have been alleged that would implicate TOTAL S.A. or Elf Aquitaine in the practices questioned in these proceedings, and the fines received are based solely on their status as parent companies.
Arkema began implementing compliance procedures in 2001 that are designed to prevent its employees from violating antitrust provisions. However, it is not possible to exclude the possibility that the relevant authorities could commence additional proceedings involving Arkema, as well as TOTAL S.A. and Elf Aquitaine.
2. As part of the agreement relating to the spin-off of Arkema, TOTAL S.A. or certain other Group companies agreed to grant Arkema guarantees for certain risks related toprincipal antitrust proceedings arising from events prior toin which the spin-off.
These guarantees cover, for a period of ten years that began in 2006, 90% of amounts paid by Arkema related to (i) fines imposed by European authorities or European member-states for competition law violations, (ii) fines imposed by U.S. courts or antitrust authorities for federal antitrust violations or violations of the competition laws of U.S. states, (iii) damages awarded in civil proceedings related to the government proceedings mentioned above, and (iv) certain costs related to these proceedings.
Group is involved are described thereafter. The guarantee covering the risks related to anticompetition violations in Europe applies to amounts above a€Chemicals Segment176.5 million threshold.
(1) | Arkema is used in this section to designate those companies | | • | As part of the spin-off of Arkema(1) in 2006, TOTAL S.A. or certain other Group companies agreed to grant Arkema group whose ultimate parent company is Arkema S.A. Arkema became an independent company after being spun-offguarantees for potential monetary consequences related to antitrust proceedings arising from Total S.A. in May 2006.events prior to the spin-off. |
| | | | | These guarantees cover, for a period of ten years, 90% of amounts paid by Arkema related to (i) fines imposed by European authorities or European member-states for competition law violations, (ii) fines imposed by U.S. courts or antitrust authorities for federal antitrust violations or violations of the competition laws of U.S. states, (iii) damages awarded in civil proceedings related to the government proceedings mentioned above, and (iv) certain costs related to these proceedings. The guarantee related to anti-competition violations in Europe applies to amounts above a €176.5 million threshold. On the other hand, the agreements provide that Arkema will indemnify TOTAL S.A. or any Group company for 10% of any amount that TOTAL S.A. or any Group company are required to pay under any of the proceedings covered by these guarantees. |
If one or more individuals or legal entities, acting alone or together, directly or indirectly holds more than one-third of the voting rights of Arkema, or if Arkema transfers more than 50% of its assets (as calculated under the enterprise valuation method, as of the date of the transfer) to a third party or parties acting together, irrespective of the type or number of transfers, these guarantees will become void. On
| | | • | In the United States, investigations into certain commercial practices of some subsidiaries of the Arkema group have been closed since 2007; no charges have been brought against Arkema. Civil liability lawsuits, for which TOTAL S.A. has been named as the parent company, are about to be closed and are not expected to have a significant impact on the Group’s financial position. | | • | In Europe, since May 2006, the European Commission has fined companies of the Group in its configuration prior to the spin-off an overall amount of €385.47 million, of which Elf Aquitaineand/or TOTAL S.A. and their subsidiaries were held jointly liable for €280.17 million, Elf Aquitaine being personally fined €23.6 million for deterrence. These fines are entirely settled as of today. |
As a result(2) since the other hand,spin-off, the agreements provide that Arkema will indemnifyGroup has paid the overall amount of €188.07 million, corresponding to 90% of the fines overall amount once the threshold provided for by the guarantee is deducted. The European Commission imposed these fines following investigations between 2000 and 2004 into commercial practices involving eight products sold by Arkema. Five of these investigations resulted in prosecutions from the European Commission for which Elf Aquitaine has been named as the parent company, and two of these investigations named TOTAL S.A. or any Groupas the ultimate parent company for 10% of any amount that the Group. TOTAL S.A. or any Group companyand Elf Aquitaine are required to pay under anycontesting their liability based solely on their status as parent companies and appealed for cancellation and reformation of the rulings that are still pending before the relevant EU court of appeals or supreme court of appeals. Besides, a civil proceeding against Arkema and five groups of companies was initiated before a German regional court by a third party for an alleged damage pursuant to one of the above described legal proceedings. TOTAL S.A. was summoned to serve notice of the dispute before this court. At this point, the probability to have a favorable verdict and the financial impacts of this procedure are uncertain due to the number of legal difficulties it gave rise to, the (1) Arkema is used in this section to designate those companies of the Arkema group whose ultimate parent company is Arkema S.A. Arkema became an independent company after being spun-off from TOTAL S.A. in May 2006. (2) This amount does not take into account a case that led to Arkema, prior to Arkema’s spin-off from TOTAL, and Elf Aquitaine being fined jointly €45 million and Arkema being fined €13.5 million. This case is referred to in past Registration Documents.
F-92
lack of documented claim and the complex evaluation of the alleged damage. Arkema began implementing compliance procedures in 2001 that are designed to prevent its employees from violating antitrust provisions. However, it is not possible to exclude the possibility that the relevant authorities could commence additional proceedings covered by these guarantees.involving Arkema regarding events prior to the spin-off, as well as Elf Aquitaine3. The Group has recorded provisions amounting to€and/or43 TOTAL S.A. based on their status as parent company. Within the framework of the legal proceedings described above, a €17 million reserve is booked in itsthe Group’s consolidated financial statements as of December 31, 20092010. Downstream segment | | | • | Pursuant to a statement of objections received by Total Nederland N.V. and TOTAL S.A. (based on its status as parent company) from the European Commission, Total Nederland N.V. was fined in 2006 €20.25 million, which has been paid, and for which TOTAL S.A. was held jointly liable for €13.5 million. TOTAL S.A. appealed this decision before the relevant court and this appeal is still pending. |
In addition, pursuant to cover the risks mentioned above.4. Moreover, as a result of investigations started by the European Commission in October 2002 concerning certain Refining & Marketing subsidiaries of the Group, Total Nederland N.V. and TOTAL S.A. received a statement of objections in October 2004. These proceedings resulted, in September 2006, inreceived by Total Nederland N.V. being fined€20.25 million and in TOTAL S.A. as its parent company being held jointly responsible for€13.5 million of this amount, although no facts implicating TOTAL S.A. in the practices under investigation were alleged. TOTAL S.A. andRaffinage Marketing (formerly Total Nederland N.V. have appealed this decision to the Court of First Instance of the European Union.
In addition, in May 2007, Total FranceFrance) and TOTAL S.A. received a statement of objectionsfrom the European Commission regarding alleged antitrust practices concerning another product line of the Refining & Marketing division. These proceedings resulted, in October 2008, in Total France being fined€128.2 million and in TOTAL S.A., as its parent company, being held jointly responsible although no facts implicating TOTAL S.A. in the practices under investigation were alleged. TOTAL S.A. anddivision, Total Raffinage Marketing (the new corporate name of Total France) havewas fined €128.2 million in 2008, which has been paid, and for which TOTAL S.A. was held jointly liable based on its status as parent company. TOTAL S.A. also appealed this decision tobefore the Court of First Instance of the European Union.
Furthermore, in July 2009, the French antitrust Authority sent to TotalGazrelevant court and Total Raffinage Marketing a statement of objections regarding alleged antitrust practices concerning another product line of the Refining & Marketing division.
5. this appeal is still pending.
| | | • | Finally, TotalGaz and Total Raffinage Marketing received a statement of objections from the French Antitrust Authority (Autorité de la concurrence française) regarding alleged antitrust practices concerning another product line of the Refining & Marketing division. The case was dismissed by decision of the French antitrust authorities on December 17, 2010. |
Given the discretionary powers granted to the antitrust Authoritiesauthorities for determining fines relating to antitrust regulations, it is not currently possible to determine with certainty the ultimate outcome of these investigations and proceedings. TOTAL S.A. and Elf Aquitaine are contesting their liability and the method of determining these fines. Although it is not possible to predict the ultimate outcome of these proceedings, the Group believes that they will not have a material adverse effect on its financial conditionsituation or consolidated results. On December 11, 2005, several explosions, followed by a major fire, occurred at an oil storage depot at Buncefield, north of London. This depot iswas operated by Hertfordshire Oil Storage Limited (HOSL), a company in which the BritishTOTAL’s UK subsidiary of TOTAL holds 60% and another oil group holds 40%. The explosion caused injuries, most of which were minor injuries, to a number of people and caused property damage to the depot and the buildings and homes located nearby. The official Independent Investigation Board has indicated that the explosion was caused by the overflow of a tank at the depot. The Board’s final report was released on December 11, 2008. The civil procedure for claims, which had not yet been settled, took place between October and December 2008. The Court’s decision of March 20, 2009, declared the BritishTOTAL’s UK subsidiary of TOTAL responsibleliable for the accident and solely liable for indemnifying the victims. TOTAL’s BritishThe subsidiary has appealed thisthe decision. The appeal trial took place in January 2010 and2010. The Court of Appeals, by a decision ishanded down on March 4, 2010, confirmed the prior judgment. The Supreme Court of United Kingdom has partially authorized TOTAL’s UK subsidiary to contest the decision. The hearings before the Supreme Court are expected to be held during the first-half 2010.With respect to civil liability the provision recorded in the Group’s consolidated financial statements asfirst half of December 31, 2009 amounts to
€ 295 million after payments already completed.
2011. The Group carries insurance for damage to its interests in these facilities, business interruption and civil liability claims from third parties. The residual amount to be received from insurers amounts to€ 211 millionprovision for the civil liability that appears in the Group’s consolidated financial statements as of December 31, 2009.2010, stands at €194 million after taking into account the payments previously made. The Group believes that, based on the information currently available, on a reasonable estimate of its liability and on provisions recognized, this accident should not have a significant impact on the Group’s financial situation or consolidated results. On
In addition, on December 1, 2008, the Health and Safety Executive (HSE) and the Environment Agency (EA) issued a Notice of prosecution against five companies, including the BritishTOTAL’s UK subsidiary. By a judgment on July 16, 2010, TOTAL’s UK subsidiary of TOTAL. In November 2009, the British subsidiary of TOTAL, pleaded guilty to charges brought by the prosecution and intends to claim/raise,was fined £3.6 million. The decision takes into this framework,account a number of elements likely to mitigatethat have mitigated the impact of the charges brought against it.
F-93
Following the sinking in December 1999 of the Erika, a tanker that was transporting products belonging to one of the Group companies, the Tribunal de grande instanceof Paris convicted TOTAL S.A. of marine pollution pursuant to a judgment issued on January 16, 2008, finding that TOTAL S.A. was negligent in its vetting procedure for vessel selection.selection, and ordering TOTAL S.A. was fined€ 375,000.to pay a fine of €375,000. The court also ordered compensation to be paid to those affected by the victims of pollution from the Erika up to an aggregate amount of €192 €192 million, declaring TOTAL S.A. jointly and severally liable for such payments together with the Erika’s inspection and classification firm, the Erika’s owner and the Erika’s manager. TOTAL believes that the finding of negligence and the related conviction for marine pollution are without substance as a matter of fact and as a matter of law. TOTAL also considers that this verdict is contrary to the intended aim of enhancing maritime transport safety.
TOTAL has appealed the verdict of January 16, 2008. In the meantime, it has nevertheless proposed to pay third parties who so requestrequested definitive compensation as determined by the court. To date, forty-oneForty-one third parties have received compensation payments, representingbeen compensated for an aggregate amount of €171.5 €171.5 million. The appeal was heard end of 2009 by
By a decision dated March 30, 2010, the Court of Appeal in Paris. Theof Paris upheld the lower court verdict pursuant to which TOTAL S.A. was convicted of marine pollution and fined €375,000. TOTAL appealed this decision ofto the French Supreme Court (Cour de cassation). However, the Court is expected duringof Appeal ruled that TOTAL S.A. bears no civil liability according to the first-half 2010.applicable international conventions and consequently ruled that TOTAL S.A. be not convicted. TOTAL S.A. believes that, based on a reasonable estimate of its liability,the information currently available, the case willshould not have a materialsignificant impact on the Group’s financial situation or consolidated results. 33) OTHER INFORMATION
A) RESEARCH
BLUE RAPID AND DEVELOPMENT COSTSTHE RUSSIAN OLYMPIC COMMITTEE – RUSSIAN REGIONS AND INTERNEFT Blue Rapid, a Panamanian company, and the Russian Olympic Committee filed a claim for damages with the Paris Commercial Court against Elf Aquitaine concerning the withdrawal of one of its subsidiaries from an exploration and production project in Russia that was negotiated in the early 1990s. Elf Aquitaine believes this claim to be unfounded. On January 12, 2009, the Commercial Court of Paris rejected Blue Rapid’s claim and found that the Russian Olympic Committee did not have standing in the matter. This decision has been appealed. The hearings should be held during the first half of 2011. In connection with the same facts, and fifteen years after the termination of this exploration and production project, a Russian company and two regions of the Russian Federation have launched an arbitration procedure against a former subsidiary of Elf Aquitaine that was liquidated in 2005, claiming damages of an unspecified amount at this stage of the procedure. The Group considers this claim to be unfounded. The Group has reserved its rights to take any actionsand/or measures that would be appropriate to defend its interests. IRAN In 2003, the United States Securities and Exchange Commission (SEC) followed by the Department of Justice (DoJ) issued a formal order directing an investigation in connection with the pursuit of business in Iran, by certain oil companies including, among others, TOTAL. The inquiry concerns an agreement concluded by the Company with a consultant concerning a gas field in Iran and aims to verify whether certain payments made under this agreement would have benefited Iranian officials in violation of the Foreign Corrupt Practices Act (FCPA) and the Company’s accounting obligations. Investigations are still pending and the Company is cooperating with the SEC and the DoJ. In 2010, the Company opened talks with U.S. authorities, without any acknowledgement of facts, to consider anout-of-court settlement. Generally,out-of-court settlements with U.S. authorities include payment of fines and the obligation to improve internal compliance systems or other measures. In this same case, a judicial inquiry related to TOTAL was initiated in France in 2006. In 2007, the Company’s Chief Executive Officer was placed under formal investigation in relation to this inquiry, as the former President of the Middle East department of the Group’s Exploration & Production division. The Company has not been notified of any significant developments in the proceedings since the formal investigation was launched. At this point, the Company cannot determine when these investigations will terminate, and cannot predict their results, or the outcome of the talks that have been initiated, or the costs of a potentialout-of-court settlement. Resolving this case is not expected to have a significant impact on the Group’s financial situation or any impact on its future planned operations. | | | A) | RESEARCH AND DEVELOPMENT COSTS |
Research and development costs incurred by the Group in 20092010 amounted to€ €715 million (€650 million (€612in 2009
F-94
and €612 million in 2008 and€594 million in 2007)2008), corresponding to 0.5%0.4% of the sales. The staff dedicated in 20092010 to these research and development activities are estimated at 4,0164,087 people (4,285 in 2008 and 4,216 in 2007).B) TAXES PAID TO MIDDLE EAST OIL-PRODUCING COUNTRIES FOR THE PORTION WHICH TOTAL HELD HISTORICALLY AS CONCESSIONS
Taxes paid for the portion that TOTAL held historically as concessions (Abu Dhabi offshore and onshore, Dubai offshore, Oman and Abu Al Bu Khoosh) included in operating expenses amounted to€1,871 million(4,016 in 2009 (€3,301 millionand 4,285 in 2008 and€2,505 million in 2007)2008).
C) CARBON DIOXIDE EMISSION RIGHTS
| | | B) | CARBON DIOXIDE EMISSION RIGHTS |
The principles governing the accounting for emission rights are presented in Note 1 paragraph T to the Consolidated Financial Statements. As of December 31, 2009,2010, given the Group sites’ position for emission rights is balanced between delivered/acquired emission rights and emissions forgranted in the year 2009.34) POST-CLOSING EVENTS
A) DEVALUATION OF THE BOLIVAR
In January 2010,National Allocations Plans (NAPs), the President of Venezuela announced a devaluationposition of the Bolivar andGroup’s industrial facilities that are covered by the establishment of a dual exchange rate. SubsidiariesEuropean Union Emissions Trading System (EU ETS) is getting longer. This long position is expected to be confirmed at the end of the Group in this country operate mostly in the Upstream segment2008 — 2012 period.
| | | 34) | CHANGES IN PROGRESS IN THE GROUP STRUCTURE |
| | | | • | TOTAL finalized in November 2010 an agreement in principle with Perenco, an independent exploration and production French company, to sell its 75.8% equity in its upstream Cameroonian affiliate Total E&P Cameroun. This agreement is subject to the Cameroonian Authorities’ approval. |
As of December 31, 2010, assets and are dollar functional currency entities. In this context, the devaluationliabilities of the Bolivar should notaffiliate Total E&P Cameroun have any material effectbeen classified respectively as “Assets classified as held for sale” on the Group’s consolidated balance sheet, statementface of incomethe Consolidated Balance Sheet for €183 million and shareholders’ equity.B) CREATION OF TOTALERG
On January 27, 2010, TOTALas “Liabilities directly associated with the assets classified as held for sale” on the face of the Consolidated Balance Sheet for €137 million. The concerned assets and ERGliabilities mainly include tangible assets for €109 million and provisions and other non-current liabilities for €74 million.
| | | | • | In addition to the agreement signed during September 2010 (see Note 3 to the Consolidated Financial Statements), TOTAL signed in December 2010 an agreement to acquire an additional 7.5% interest in Australia’s GLNG project from Santos for an amount of $281 million. This will increase Total’s overall stake in the project to 27.5%. |
At the same time, South Korea’s Kogas has signed an agreement to createjoin the project with a joint venture15% stake. Once both transactions, which are subject to the approval of Australia’s Foreign Investment Review Board, have been finalized, interests in the Italian marketingproject will be: Santos (30%, operator), Petronas (27.5%), TOTAL (27.5%) and refining business. Kogas (15%). | | | | • | Total E&P Canada Ltd., a TOTAL subsidiary, and Suncor Energy Inc. (Suncor) have signed in December 2010 several agreements to form a strategic oil sands alliance encompassing the Suncor-operated Fort Hills mining project, the TOTAL-operated Joslyn mining project and the Suncor-operated Voyageur upgrader project. All three assets are located in the Athabasca region of the province of Alberta, in Canada. Under the alliance, the companies will pool their combined interests in these projects, with the respective operator holding 51% and the other partner 49%. |
The shareholder pact calls for joint governance as well as operating independence for the new entity. TOTALagreements comprise four significant and ERG will hold equity stakes of, respectively, 49% and 51%. Created through the merger of TOTAL Italia and ERG Petroli, the joint venture will be called “TotalErg” and will operate under both the TOTAL and ERG brands. TotalErg will become onerelated transactions: | | | | • | TOTAL is acquiring 19.2% of Suncor’s interest in the Fort Hills project. Taking into account the acquisition of UTS, finalized in September 2010, TOTAL will have an overall 39.2% interest in Fort Hills. Suncor, as operator, will hold 40.8%; | | | • | Suncor is acquiring 36.75% of TOTAL’s interest in the Joslyn project. TOTAL, as operator, will retain a 38.25% interest in the project; | | | • | TOTAL is also acquiring a 49% stake in the Suncor-operated Voyageur upgrader project; | | | • | As a result of the terms of these transactions and the related net balancing of the portfolio, in particular to contribute to the past costs of the Voyageur project, TOTAL will pay Suncor CAD 1,751 million, with a value date of January 1st, 2011. |
The implementation of the largest marketing operatorsagreements is subject to securing the necessary regulatory approvals from the Government of Canada and certain other approvals. As a result of the agreements, TOTAL will no longer proceed with the planned construction of an upgrader in Italy, with a retail marketEdmonton.
F-95
As of December 31, 2010, the share of nearly 13%assets and over 3,400 service stations.liabilities of the Joslyn mining project covered by the agreements has been classified respectively as “Assets classified as held for sale” on the face of the Consolidated Balance Sheet for €622 million and as “Liabilities directly associated with the assets classified as held for sale” on the face of the Consolidated Balance Sheet for €8 million. The joint venture will also be activeconcerned assets include mineral interests for €390 million and tangible assets for €232 million. | | | | • | TOTAL has announced in December 2010 a plan to sell its photocure and coatings resins businesses to Arkema for a €550 million enterprise value. The divestment is subject to the applicable legally required consultation and notification processes for employee representatives at TOTAL and Arkema and to the approval of the anti-trust authorities in the countries concerned. It could take place in the first half of 2011. |
As of December 31, 2010, assets and liabilities of the refiningphotocure and coatings resins businesses have been classified respectively as “Assets classified as held for sale” on the face of the Consolidated Balance Sheet for €465 million and as “Liabilities directly associated with the assets classified as held for sale” on the face of the Consolidated Balance Sheet for €52 million. The concerned assets mainly include a goodwill for €63 million, tangible assets for €196 million and inventories for €138 million. As of December 31, 2010, 687 entities are consolidated of which 596 are fully consolidated, and 91 are accounted for under the equity method (identified with the letter E). This simplified organizational chart shows the main consolidated entities. For each of them, the Group interest is mentioned between brackets. This chart of legal detentions is not exhaustive and does not reflect neither the operational structure nor the relative economic size of the Group entities and the business with a total capacity of around 8% of national demand. The transaction will be submitted to competition authorities for approval. Until then, TOTAL Italia and ERG Petroli will remain as separate, competing entities.segments.
F-96
35) CONSOLIDATION SCOPE
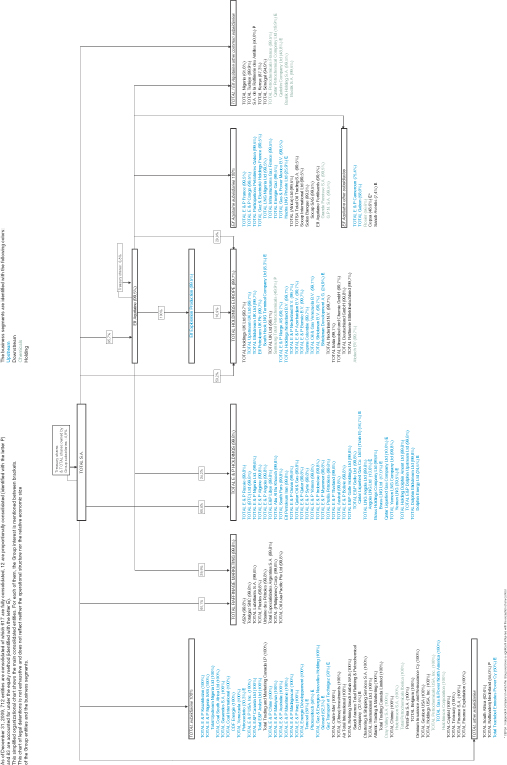
TOTAL SUPPLEMENTAL OIL AND GAS INFORMATION (Unaudited) As from 2009, the amendments to the Securities and Exchange Commission (SEC) Rule 4-10 of Regulation S-X set forth in the “Modernization of Oil and Gas Reporting” release (SEC Release n° 33-8995) and the Financial Accounting StandardsStandard Board (FASB) Accounting Standards Update regarding Extractive Activities –— Oil and Gas (ASC 932) change a number of reserves estimation and disclosure requirements. InAs a reminder, in terms of reserves estimation, the main changes are: the use of an average price instead of a single year-end price; the use of new reliable technologies to assess proved reserves; and the inclusion, under certain conditions, of non traditionalnon-traditional sources as oil and gas producing activities. The revised rules form the basis of the 2010 and 2009 year-end estimation of proved reservesreserves. The main impact of the application of the revised rules was related to, for 2009, the use of new reliable technologies and, their application resulted in an immaterial increase in TOTAL’s proved reserves. In particular, positive revisions were made possible in 2009 on a limited numberfor 2010, the booking of proved properties due to the integration of reliable technologies such as seismic and wireline pressure data in the proved reserves evaluation workflow. These revisions represent less than 2% of the Group’s proved reserves portfolio. Bitumen was included in 2008 and 2007 in the crudeon an oil reserves and is disclosed separately for 2009 pursuant to the SEC requirements, as amended.sands mining project. Preparation of reserves estimates The estimation of reserves is an ongoing process which is done within affiliates by experienced geoscientists, engineers and economists under the supervision of each affiliate’s General Management. Persons involved in reserves evaluation are trained to follow SEC-compliant internal guidelines and policies regarding criteria that must be met before reserves can be considered as proved. The technical validation process involvesrelies on a Reservoir Committee that is responsible for approving proved reserves changes above a certain threshold and technical evaluations of reserves associated with any investment decision that requires approval from the Exploration & Production Executive Committee. The Chairman of the Reservoir Committee and its members areis appointed by the President of Exploration & Production and its members represent expertise in reservoir engineering, production geology, production geophysics, drilling, and pre-development projects. An internal control process related to reserves estimation is well established within TOTAL and involves the following elements: A central Reserve Entity whose responsibility is: to consolidate, document and archive the Group’s reserves; to ensure coherency of evaluations worldwide; to maintain the Corporate Reserves Guidelines Standards in line with SEC guidelines and policies; to deliver training on reserves evaluation and classification; and to conduct periodically in-depth technical review of reserves for each affiliate.
| | | • | A central Reserve Entity whose responsibility is: to consolidate, document and archive the Group’s reserves; to ensure the coherence of evaluations worldwide; to maintain the Corporate Reserves Guidelines Standards in line with SEC guidelines and policies; to deliver training on reserves evaluation and classification; and to conduct periodically in-depth technical review of reserves for each affiliate. | | | • | An annual review of affiliates reserves is conducted by an internal group of specialists selected for their expertise in geosciences and engineering or their knowledge of the affiliate. All members of this group chaired by the Geoscience Reserve Manager and composed of at least three Reservoir Committee members are knowledgeable in the SEC guidelines for proved reserves evaluation. Their responsibility is to provide an independent review of reserves changes proposed by affiliates and ensure that reserves are estimated using appropriate standards and procedures. | | | • | At the end of the annual review carried out by the Geoscience Division, an SEC Reserves Committee chaired by the Exploration & Production Finance Senior Vice President and comprised of the Geoscience, Strategy and Legal Senior Vice Presidents, or their representatives, as well as the Chairman of the Reservoir Committee and the Geoscience Reserves Manager, approves the SEC reserve booking proposals as regards to criteria that are not dependent upon reservoir and geoscience techniques. The results of the annual review and the proposals for including revisions or additions of SEC Proved Reserves are presented to the Exploration & Production Executive Committee for approval before final validation by the Group Executive Management. |
An annual review of reserves conducted by an internal group of specialists selected for their expertise in geosciences and engineering or their knowledge of the affiliate. All members of this group chaired by the Geoscience Reserve Manager and composed of at least three Reservoir Committee members are knowledgeable in the SEC guidelines for proved reserves evaluation. Their responsibility is to provide an independent review of reserves changes proposed by affiliates and ensure that reserves are estimated using appropriate standards and procedures.
At the end of the annual review carried out by the Geoscience Division, a SEC Reserves Committee chaired by the Exploration & Production Finance Senior Vice President and comprised of the Geoscience, Strategy and Legal Senior Vice Presidents, or their representatives, as well as the Chairman of the Reservoir Committee and the Geoscience Reserves Manager, approves the SEC reserve booking proposals as regards to criteria that are not depending upon reservoir and geoscience techniques. The results of the annual review and the proposals for including revisions or additions of SEC Proved Reserves are presented to the Exploration & Production Executive Committee for approval before final validation by the Group Executive Management.
The reserves evaluation and control process is audited periodically by the GroupGroup’s internal auditors who verify the effectiveness of the reserves evaluation process and control procedures. The Geosciences Reserves Manager (GRM) is the technical person responsible for preparing the reserves estimates for the Group. The GRM supervises the Reserve Entity, chairs the annual review of reserves, and is a member of the Reservoir Committee and the SEC Reserves Committee. The GRM has a solid backgroundover twenty-five years of experience in the fields ofoil & gas industry. He previously held several management positions in the Group in reservoir engineering and geosciences, a strongand has more than ten years of experience in the field of reservereserves evaluation audit and control processesprocess. He holds an engineering degree fromÉcole Nationale Supérieure de Géologie, Nancy, France, and a good knowledgePh.D in economicsrock physics from Stanford University, California, USA. He is a member of the Society of
S-1
Petroleum Engineering Oil and finance.Gas Reserves Committee and the UNECE (United Nations Economic Commission for Europe) Expert Group on Resource Classification. Proved developed reserves At the end of 2010, proved developed reserves of oil and gas were 5,708 Mboe and represented 53% of proved reserves. At year-end 2009, proved developed reserves of oil and gas were 5,835 Mboe and represented 56% of proved reserves. At the end of 2008, proved developed reserves were 5,243 Mboe and represented 50% of proved reserves. Over the past three years, the level of proved developed reserves has remained above 5.2 Bboe and over 50% of proved reserves, illustrating TOTAL’s ability to consistently transfer proved undeveloped reserves into developed status. Proved undeveloped reserves As of December 31, 2009,2010, TOTAL’s combined proved undeveloped reserves of oil and gas were 4,6484,987 Mboe as compared to 5,2154,648 Mboe at the end of 2008.2009. The reductionnet increase of 339 Mboe of proved undeveloped reserves reflects primarilyis due to the progress made in convertingaddition of 291 Mboe of undeveloped reserves related to extensions and discoveries, the revision of +183 Mboe of previous estimates, a net increase of +416 Mboe due to acquisitions/divestitures and the conversion of −551 Mboe of proved undeveloped reserves into proved developed reserves in particular withreserves. In 2010, the successful production start up of large projects in Nigeria, Angola, United States, Qatar and Yemen. The reduction ofcapital expended to develop proved undeveloped reserves associated with(PUDs) was €6.7 billion, which represents 81% of 2010 development costs, and was related to projects located for the transfer into developed reserves has been partially offset bymost part in Kazakhstan, Angola, Norway, Nigeria, Indonesia, United Kingdom, Thailand and the addition of undeveloped reserves mainly in Canada and Argentina.
More thanUnited States.
Approximately 60% of the Group’s proved undeveloped reserves are associated with producing fields and are located for the most part in Canada, Nigeria, Yemen, UAE,the United Arab Emirates, Venezuela and Norway. These reserves are expected to be developed over time as part of initial field development plans or additional development phases. The timing to bring these proved reserves into production will depend upon several factors including reservoir performance, surface facilities or plant capacity constraints and contractual limitations on production level. The remaining proved undeveloped reserves correspond to undeveloped fields or assets for which a development has been sanctioned or is in progress. These proved undeveloped reserves are located primarily in Kazakhstan, Angola The Group’s portfolio of projects includes a few large scale and Nigeria. For some of the majorcomplex developments we anticipatefor which it anticipates that it may take more than five years from the time of recording proved reserves to the start of productionproduction. These specific projects represent approximately 30% of the Group’s proved undeveloped reserves and include the development of a giant field in Kazakhstan, deep offshore developments in Angola, Nigeria and the United Kingdom and development of oil sands in Canada. These projects are highly complex to develop due to a combination of factors that include, among others, the complexitynature of the reservoir rock and fluid properties, challenging operating environments and the size of the projects. Development costs In addition, some of these projects are generally designed and optimized for a given production capacity that controls the year 2009 werepace at which the field is developed and the wells are drilled. At production€start-up,8.1 billion. A large part only a portion of the investments was allocatedproved reserves are developed in order to majordeliver sufficient production potential to meet capacity constraints and contractual obligations. The remaining PUDs associated with the complete development plan will therefore remain undeveloped for more than five years following project approval and booking. Under these specific circumstances, the Group believes that it is justified to report as proved reserves the level of reserves used in connection with the approved project, despite the fact that some of these PUDs may remain undeveloped for more than five years. In addition, TOTAL has demonstrated in recent years the Group’s ability to successfully develop and bring into production similar large scale and complex projects, including the development of deep-offshore fields in Angola, Nigeria, Congo, HP/HT fields in the United Kingdom, heavy oil projects in Kazakhstan, Angola,Venezuela and LNG projects in Qatar, Yemen, Nigeria United States, Qatar and Yemen and contributed to convert proved undeveloped reserves into proved developed reserves.
Indonesia. Information shown in the following tables is presented in accordance with the FASB’s ASC 932 and the requirements of the SEC Regulation S-K (Items 1200 to 1208). The tables included provided below are presented by the following geographic areas: Europe, Africa, the Americas, Middle East and Asia (including CIS). Certain previously reported amounts for 2008 and 2007 have been reclassified to conform to the current year presentation.presentation adopted since 2009.
S-2
ESTIMATED PROVED RESERVES OF OIL, BITUMEN AND GAS RESERVES The following tables present, for oil, bitumen and gas reserves, an estimate of the Group’s oil, bitumen and gas quantities by geographic areas as of December 31, 2010, 2009 2008 and 2007.2008. Quantities shown concern proved developed and undeveloped reserves together with changes in quantities for 2010, 2009 2008 and 2007. 2008. The definitions used for proved, proved developed and proved undeveloped oil and gas reserves are in accordance with the revised Rule 4-10 of SEC Regulation S-X.All references in the following tables to reserves or production are to the Group’s entire share of such reserves or production. TOTAL’s worldwide proved reserves include the proved reserves of its consolidated subsidiaries as well as its proportionate share of the proved reserves of equity affiliates and of two companies accounted for by the cost method.
S-3
Changes in oil, bitumen and gas reserves | | | | | | | | | | | | | | | | | | | | | | | | | | | Proved developed and undeveloped reserves | | Consolidated subsidiaries | | | | | | | | | | | | | | Middle
| | | | | | | | | (in million barrels of oil equivalent) | | Europe | | | Africa | | | Americas | | | East | | | Asia | | | Total | | Balance as of December 31, 2007 | | | 1,900 | | | | 3,516 | | | | 737 | | | | 474 | | | | 1,224 | | | | 7,851 | | | | | | | | | | | | | | | | | | | | | | | | | | | | | Revisions of previous estimates | | | 41 | | | | 374 | | | | 50 | | | | 106 | | | | 144 | | | | 715 | | | Extensions, discoveries and other | | | 82 | | | | 110 | | | | — | | | | — | | | | 19 | | | | 211 | | | Acquisitions of reserves in place | | | 17 | | | | — | | | | — | | | | — | | | | — | | | | 17 | | | Sales of reserves in place | | | — | | | | (74 | ) | | | — | | | | — | | | | (46 | ) | | | (120 | ) | | Production for the year | | | (225 | ) | | | (280 | ) | | | (55 | ) | | | (50 | ) | | | (99 | ) | | | (709 | ) | | | | | | | | | | | | | | | | | | | | | | | | | | | Balance as of December 31, 2008 | | | 1,815 | | | | 3,646 | | | | 732 | | | | 530 | | | | 1,242 | | | | 7,965 | | | | | | | | | | | | | | | | | | | | | | | | | | | | | Revisions of previous estimates | | | 46 | | | | 76 | | | | 14 | | | | (7 | ) | | | 25 | | | | 154 | | | Extensions, discoveries and other | | | 18 | | | | 53 | | | | 284 | | | | 76 | | | | — | | | | 431 | | | Acquisitions of reserves in place | | | 12 | | | | — | | | | 130 | | | | — | | | | — | | | | 142 | | | Sales of reserves in place | | | (2 | ) | | | (43 | ) | | | (14 | ) | | | — | | | | — | | | | (59 | ) | | Production for the year | | | (224 | ) | | | (266 | ) | | | (56 | ) | | | (55 | ) | | | (101 | ) | | | (702 | ) | | | | | | | | | | | | | | | | | | | | | | | | | | | Balance as of December 31, 2009 | | | 1,665 | | | | 3,466 | | | | 1,090 | | | | 544 | | | | 1,166 | | | | 7,931 | | | | | | | | | | | | | | | | | | | | | | | | | | | | | Revisions of previous estimates | | | 92 | | | | 200 | | | | 82 | | | | (10 | ) | | | 1 | | | | 365 | | | Extensions, discoveries and other | | | 182 | | | | — | | | | 18 | | | | 96 | | | | 30 | | | | 326 | | | Acquisitions of reserves in place | | | 23 | | | | — | | | | 425 | | | | — | | | | 9 | | | | 457 | | | Sales of reserves in place | | | (45 | ) | | | (26 | ) | | | (5 | ) | | | — | | | | (8 | ) | | | (84 | ) | | Production for the year | | | (211 | ) | | | (269 | ) | | | (70 | ) | | | (56 | ) | | | (99 | ) | | | (705 | ) | | | | | | | | | | | | | | | | | | | | | | | | | | | Balance as of December 31, 2010 | | | 1,706 | | | | 3,371 | | | | 1,540 | | | | 574 | | | | 1,099 | | | | 8,290 | | | | | | | | | | | | | | | | | | | | | | | | | | | | Minority interest in proved developed and undeveloped reserves as of | | | | | | | | | | | | | | | | | | December 31, 2008 | | | 27 | | | | 100 | | | | — | | | | — | | | | — | | | | 127 | | | December 31, 2009 | | | 26 | | | | 98 | | | | — | | | | — | | | | — | | | | 124 | | December 31, 2010 | | | 26 | | | | 100 | | | | — | | | | — | | | | — | | | | 126 | |
| | | | | | | | | | | | | | | | | | | | | | | | | | | Proved developed and undeveloped reserves | | Equity & non-consolidated affiliates | | | | | | | | | | | | | | Middle
| | | | | | | | | (in million barrels of oil equivalent) | | Europe | | | Africa | | | Americas | | | East | | | Asia | | | Total | | Balance as of December 31, 2007 | | | — | | | | 69 | | | | 554 | | | | 1,975 | | | | — | | | | 2,598 | | | | | | | | | | | | | | | | | | | | | | | | | | | | | Revisions of previous estimates | | | — | | | | 22 | | | | — | | | | (2 | ) | | | — | | | | 20 | | | Extensions, discoveries and other | | | — | | | | 14 | | | | — | | | | 3 | | | | — | | | | 17 | | | Acquisitions of reserves in place | | | — | | | | — | | | | 6 | | | | — | | | | — | | | | 6 | | | Sales of reserves in place | | | — | | | | — | | | | — | | | | — | | | | — | | | | — | | | Production for the year | | | — | | | | (7 | ) | | | (33 | ) | | | (108 | ) | | | — | | | | (148 | ) | | | | | | | | | | | | | | | | | | | | | | | | | | | Balance as of December 31, 2008 | | | — | | | | 98 | | | | 527 | | | | 1,868 | | | | — | | | | 2,493 | | | | | | | | | | | | | | | | | | | | | | | | | | | | | Revisions of previous estimates | | | — | | | | 10 | | | | (7 | ) | | | 51 | | | | — | | | | 54 | | | Extensions, discoveries and other | | | — | | | | — | | | | — | | | | 136 | | | | — | | | | 136 | | | Acquisitions of reserves in place | | | — | | | | — | | | | — | | | | — | | | | — | | | | — | | | Sales of reserves in place | | | — | | | | — | | | | — | | | | — | | | | — | | | | — | | | Production for the year | | | — | | | | (8 | ) | | | (18 | ) | | | (105 | ) | | | — | | | | (131 | ) | | | | | | | | | | | | | | | | | | | | | | | | | | | Balance as of December 31, 2009 | | | — | | | | 100 | | | | 502 | | | | 1,950 | | | | — | | | | 2,552 | | | | | | | | | | | | | | | | | | | | | | | | | | | | | Revisions of previous estimates | | | — | | | | 14 | | | | 4 | | | | (2 | ) | | | — | | | | 16 | | | Extensions, discoveries and other | | | — | | | | — | | | | — | | | | — | | | | — | | | | — | | | Acquisitions of reserves in place | | | — | | | | — | | | | — | | | | — | | | | — | | | | — | | | Sales of reserves in place | | | — | | | | — | | | | — | | | | — | | | | — | | | | — | | | Production for the year | | | — | | | | (7 | ) | | | (20 | ) | | | (136 | ) | | | — | | | | (163 | ) | | | | | | | | | | | | | | | | | | | | | | | | | | | Balance as of December 31, 2010 | | | — | | | | 107 | | | | 486 | | | | 1,812 | | | | — | | | | 2,405 | | | | | | | | | | | | | | | | | | | | | | | | | | | |
S-4
| | | | | | | | | | | | | | | | | | | | Proved developed and undeveloped reserves | | Consolidated subsidiaries | | (in millions of barrels of oil equivalent) | | Europe | | | Africa | | | Americas | | | Middle
East | | | Asia | | | Total | | Balance as of December 31, 2006 | | 1,903 | | | 3,430 | | | 1,823 | | | 532 | | | 1,288 | | | 8,976 | | Revisions of previous estimates | | 196 | | | 280 | | | (531 | ) | | (23 | ) | | (16 | ) | | (94 | ) | Extensions, discoveries and other | | 50 | | | 93 | | | 2 | | | 1 | | | 51 | | | 197 | | Acquisitions of reserves in place | | — | | | — | | | — | | | — | | | — | | | — | | Sales of reserves in place | | (3 | ) | | (2 | ) | | (465 | ) | | — | | | — | | | (470 | ) | Production for the year | | (246 | ) | | (285 | ) | | (92 | ) | | (36 | ) | | (99 | ) | | (758 | ) | Balance as of December 31, 2007 | | 1,900 | | | 3,516 | | | 737 | | | 474 | | | 1,224 | | | 7,851 | | Revisions of previous estimates | | 41 | | | 374 | | | 50 | | | 106 | | | 144 | | | 715 | | Extensions, discoveries and other | | 82 | | | 110 | | | — | | | — | | | 19 | | | 211 | | Acquisitions of reserves in place | | 17 | | | — | | | — | | | — | | | — | | | 17 | | Sales of reserves in place | | — | | | (74 | ) | | — | | | — | | | (46 | ) | | (120 | ) | Production for the year | | (225 | ) | | (280 | ) | | (55 | ) | | (50 | ) | | (99 | ) | | (709 | ) | Balance as of December 31, 2008 | | 1,815 | | | 3,646 | | | 732 | | | 530 | | | 1,242 | | | 7,965 | | Revisions of previous estimates | | 46 | | | 76 | | | 14 | | | (7 | ) | | 25 | | | 154 | | Extensions, discoveries and other | | 18 | | | 53 | | | 284 | | | 76 | | | — | | | 431 | | Acquisitions of reserves in place | | 12 | | | — | | | 130 | | | — | | | — | | | 142 | | Sales of reserves in place | | (2 | ) | | (43 | ) | | (14 | ) | | — | | | — | | | (59 | ) | Production for the year | | (224 | ) | | (266 | ) | | (56 | ) | | (55 | ) | | (101 | ) | | (702 | ) | Balance as of December 31, 2009 | | 1,665 | | | 3,466 | | | 1,090 | | | 544 | | | 1,166 | | | 7,931 | | | | | Minority interest in proved developed and undeveloped reserves as of | | | | | | | | December 31, 2007 | | 30 | | | 135 | | | — | | | — | | | — | | | 165 | | December 31, 2008 | | 27 | | | 100 | | | — | | | — | | | — | | | 127 | | December 31, 2009 | | 26 | | | 98 | | | — | | | — | | | — | | | 124 | |
| | | | | | | | | | | | | | | | | | Proved developed and undeveloped reserves | | Equity & non–consolidated affiliates | | (in millions of barrels of oil equivalent) | | Europe | | Africa | | | Americas | | | Middle
East | | | Asia | | Total | | Balance as of December 31, 2006 | | — | | 60 | | | — | | | 2,084 | | | — | | 2,144 | | Revisions of previous estimates | | — | | (3 | ) | | 554 | | | (3 | ) | | — | | 548 | | Extensions, discoveries and other | | — | | 30 | | | — | | | — | | | — | | 30 | | Acquisitions of reserves in place | | — | | — | | | — | | | — | | | — | | — | | Sales of reserves in place | | — | | (9 | ) | | — | | | — | | | — | | (9 | ) | Production for the year | | — | | (9 | ) | | — | | | (106 | ) | | — | | (115 | ) | Balance as of December 31, 2007 | | — | | 69 | | | 554 | | | 1,975 | | | — | | 2,598 | | Revisions of previous estimates | | — | | 22 | | | — | | | (2 | ) | | — | | 20 | | Extensions, discoveries and other | | — | | 14 | | | — | | | 3 | | | — | | 17 | | Acquisitions of reserves in place | | — | | — | | | 6 | | | — | | | — | | 6 | | Sales of reserves in place | | — | | — | | | — | | | — | | | — | | — | | Production for the year | | — | | (7 | ) | | (33 | ) | | (108 | ) | | — | | (148 | ) | Balance as of December 31, 2008 | | — | | 98 | | | 527 | | | 1,868 | | | — | | 2,493 | | Revisions of previous estimates | | — | | 10 | | | (7 | ) | | 51 | | | — | | 54 | | Extensions, discoveries and other | | — | | — | | | — | | | 136 | | | — | | 136 | | Acquisitions of reserves in place | | — | | — | | | — | | | — | | | — | | — | | Sales of reserves in place | | — | | — | | | — | | | — | | | — | | — | | Production for the year | | — | | (8 | ) | | (18 | ) | | (105 | ) | | — | | (131 | ) | Balance as of December 31, 2009 | | — | | 100 | | | 502 | | | 1,950 | | | — | | 2,552 | |
| | | | | | | | | | | | | Proved developed and undeveloped reserves of
consolidated subsidiaries and equity & non-consolidated
affiliates (in millions of barrels of oil equivalent) | | Europe | | Africa | | Americas | | Middle East | | Asia | | Total | December 31, 2007 | Proved developed and undeveloped | | 1,900 | | 3,585 | | 1,291 | | 2,449 | | 1,224 | | 10,449 | Consolidated subsidiaries | | 1,900 | | 3,516 | | 737 | | 474 | | 1,224 | | 7,851 | Equity and non-consolidated affiliates | | — | | 69 | | 554 | | 1,975 | | — | | 2,598 | Proved developed | | 1,229 | | 1,917 | | 508 | | 1,242 | | 487 | | 5,383 | Consolidated subsidiaries | | 1,229 | | 1,884 | | 360 | | 452 | | 487 | | 4,412 | Equity and non-consolidated affiliates | | — | | 33 | | 148 | | 790 | | — | | 971 | Proved undeveloped | | 671 | | 1,668 | | 783 | | 1,207 | | 737 | | 5,066 | Consolidated subsidiaries | | 671 | | 1,632 | | 377 | | 22 | | 737 | | 3,439 | Equity and non-consolidated affiliates | | — | | 36 | | 406 | | 1,185 | | — | | 1,627 | December 31, 2008 | Proved developed and undeveloped | | 1,815 | | 3,744 | | 1,259 | | 2,398 | | 1,242 | | 10,458 | Consolidated subsidiaries | | 1,815 | | 3,646 | | 732 | | 530 | | 1,242 | | 7,965 | Equity and non-consolidated affiliates | | — | | 98 | | 527 | | 1,868 | | — | | 2,493 | Proved developed | | 1,252 | | 1,801 | | 515 | | 1,194 | | 481 | | 5,243 | Consolidated subsidiaries | | 1,252 | | 1,754 | | 381 | | 504 | | 481 | | 4,372 | Equity and non-consolidated affiliates | | — | | 47 | | 134 | | 690 | | — | | 871 | Proved undeveloped | | 563 | | 1,943 | | 744 | | 1,204 | | 761 | | 5,215 | Consolidated subsidiaries | | 563 | | 1,892 | | 351 | | 26 | | 761 | | 3,593 | Equity and non-consolidated affiliates | | — | | 51 | | 393 | | 1,178 | | — | | 1,622 | December 31, 2009 | Proved developed and undeveloped | | 1,665 | | 3,566 | | 1,592 | | 2,494 | | 1,166 | | 10,483 | Consolidated subsidiaries | | 1,665 | | 3,466 | | 1,090 | | 544 | | 1,166 | | 7,931 | Equity and non-consolidated affiliates | | — | | 100 | | 502 | | 1,950 | | — | | 2,552 | Proved developed | | 1,096 | | 1,775 | | 631 | | 1,918 | | 415 | | 5,835 | Consolidated subsidiaries | | 1,096 | | 1,745 | | 503 | | 482 | | 415 | | 4,241 | Equity and non-consolidated affiliates | | — | | 30 | | 128 | | 1,436 | | — | | 1,594 | Proved undeveloped | | 569 | | 1,791 | | 961 | | 576 | | 751 | | 4,648 | Consolidated subsidiaries | | 569 | | 1,721 | | 587 | | 62 | | 751 | | 3,690 | Equity and non-consolidated affiliates | | — | | 70 | | 374 | | 514 | | — | | 958 |
| | | | | | | | | | | | | | | | | | | | | | | | | | | | | Consolidated subsidiaries and equity & non-consolidated affiliates | | | | | | | | | | | | | | Middle
| | | | | | | | | (in million barrels of oil equivalent) | | Europe | | | Africa | | | Americas | | | East | | | Asia | | | Total | | As of December 31, 2008 | | | | | | | | | | | | | | | | | | | | | | | | | Proved developed and undeveloped reserves | | | 1,815 | | | | 3,744 | | | | 1,259 | | | | 2,398 | | | | 1,242 | | | | 10,458 | | | Consolidated subsidiaries | | | 1,815 | | | | 3,646 | | | | 732 | | | | 530 | | | | 1,242 | | | | 7,965 | | | Equity and non-consolidated affiliates | | | — | | | | 98 | | | | 527 | | | | 1,868 | | | | — | | | | 2,493 | | | | | | | | | | | | | | | | | | | | | | | | | | | | Proved developed reserves | | | 1,252 | | | | 1,801 | | | | 515 | | | | 1,194 | | | | 481 | | | | 5,243 | | | Consolidated subsidiaries | | | 1,252 | | | | 1,754 | | | | 381 | | | | 504 | | | | 481 | | | | 4,372 | | | Equity and non-consolidated affiliates | | | — | | | | 47 | | | | 134 | | | | 690 | | | | — | | | | 871 | | | | | | | | | | | | | | | | | | | | | | | | | | | | Proved undeveloped reserves | | | 563 | | | | 1,943 | | | | 744 | | | | 1,204 | | | | 761 | | | | 5,215 | | | Consolidated subsidiaries | | | 563 | | | | 1,892 | | | | 351 | | | | 26 | | | | 761 | | | | 3,593 | | | Equity and non-consolidated affiliates | | | — | | | | 51 | | | | 393 | | | | 1,178 | | | | — | | | | 1,622 | | | | | | | | | | | | | | | | | | | | | | | | | | | | As of December 31, 2009 | | | | | | | | | | | | | | | | | | | | | | | | | Proved developed and undeveloped reserves | | | 1,665 | | | | 3,566 | | | | 1,592 | | | | 2,494 | | | | 1,166 | | | | 10,483 | | | Consolidated subsidiaries | | | 1,665 | | | | 3,466 | | | | 1,090 | | | | 544 | | | | 1,166 | | | | 7,931 | | | Equity and non-consolidated affiliates | | | — | | | | 100 | | | | 502 | | | | 1,950 | | | | — | | | | 2,552 | | | | | | | | | | | | | | | | | | | | | | | | | | | | Proved developed reserves | | | 1,096 | | | | 1,775 | | | | 631 | | | | 1,918 | | | | 415 | | | | 5,835 | | | Consolidated subsidiaries | | | 1,096 | | | | 1,745 | | | | 503 | | | | 482 | | | | 415 | | | | 4,241 | | | Equity and non-consolidated affiliates | | | — | | | | 30 | | | | 128 | | | | 1,436 | | | | — | | | | 1,594 | | | | | | | | | | | | | | | | | | | | | | | | | | | | Proved undeveloped reserves | | | 569 | | | | 1,791 | | | | 961 | | | | 576 | | | | 751 | | | | 4,648 | | | Consolidated subsidiaries | | | 569 | | | | 1,721 | | | | 587 | | | | 62 | | | | 751 | | | | 3,690 | | | Equity and non-consolidated affiliates | | | — | | | | 70 | | | | 374 | | | | 514 | | | | — | | | | 958 | | | | | | | | | | | | | | | | | | | | | | | | | | | | As of December 31, 2010 | | | | | | | | | | | | | | | | | | | | | | | | | Proved developed and undeveloped reserves | | | 1,706 | | | | 3,478 | | | | 2,026 | | | | 2,386 | | | | 1,099 | | | | 10,695 | | | Consolidated subsidiaries | | | 1,706 | | | | 3,371 | | | | 1,540 | | | | 574 | | | | 1,099 | | | | 8,290 | | | Equity and non-consolidated affiliates | | | — | | | | 107 | | | | 486 | | | | 1,812 | | | | — | | | | 2,405 | | | | | | | | | | | | | | | | | | | | | | | | | | | | Proved developed reserves | | | 962 | | | | 1,692 | | | | 638 | | | | 2,055 | | | | 361 | | | | 5,708 | | | Consolidated subsidiaries | | | 962 | | | | 1,666 | | | | 505 | | | | 427 | | | | 361 | | | | 3,921 | | | Equity and non-consolidated affiliates | | | — | | | | 26 | | | | 133 | | | | 1,628 | | | | — | | | | 1,787 | | | | | | | | | | | | | | | | | | | | | | | | | | | | Proved undeveloped reserves | | | 744 | | | | 1,786 | | | | 1,388 | | | | 331 | | | | 738 | | | | 4,987 | | | Consolidated subsidiaries | | | 744 | | | | 1,705 | | | | 1,035 | | | | 147 | | | | 738 | | | | 4,369 | | | Equity and non-consolidated affiliates | | | — | | | | 81 | | | | 353 | | | | 184 | | | | — | | | | 618 | | | | | | | | | | | | | | | | | | | | | | | | | | | |
S-5
The oil reserves for the years prior to 2009 include crude oil, natural gas liquids (condensates, LPG) and bitumen reserves. Bitumen reserves as of December 31, 2007 and 2008 and only crude oil and natural gas liquidsfrom 2009 are shown separately. | | | | | | | | | | | | | | | | | | | | | | | | | | | Proved developed and undeveloped reserves | | Consolidated subsidiaries | | | | | | | | | | | | | | Middle
| | | | | | | | | (in million barrels) | | Europe | | | Africa | | | Americas | | | East | | | Asia | | | Total | | Balance as of December 31, 2007 | | | 880 | | | | 2,498 | | | | 285 | | | | 203 | | | | 530 | | | | 4,396 | | | | | | | | | | | | | | | | | | | | | | | | | | | | | Revisions of previous estimates | | | 15 | | | | 297 | | | | (17 | ) | | | 54 | | | | 64 | | | | 413 | | | Extensions, discoveries and other | | | 12 | | | | 107 | | | | — | | | | — | | | | 3 | | | | 122 | | | Acquisitions of reserves in place | | | 2 | | | | — | | | | — | | | | — | | | | — | | | | 2 | | | Sales of reserves in place | | | — | | | | (74 | ) | | | — | | | | — | | | | (43 | ) | | | (117 | ) | | Production for the year | | | (111 | ) | | | (231 | ) | | | (16 | ) | | | (32 | ) | | | (16 | ) | | | (406 | ) | | | | | | | | | | | | | | | | | | | | | | | | | | | Balance as of December 31, 2008 | | | 798 | | | | 2,597 | | | | 252 | | | | 225 | | | | 538 | | | | 4,410 | | | | | | | | | | | | | | | | | | | | | | | | | | | | | Revisions of previous estimates | | | 34 | | | | 92 | | | | (170 | ) | | | (4 | ) | | | 51 | | | | 3 | | | Extensions, discoveries and other | | | 8 | | | | 38 | | | | 22 | | | | 1 | | | | — | | | | 69 | | | Acquisitions of reserves in place | | | 1 | | | | — | | | | — | | | | — | | | | — | | | | 1 | | | Sales of reserves in place | | | — | | | | (44 | ) | | | (1 | ) | | | — | | | | — | | | | (45 | ) | | Production for the year | | | (108 | ) | | | (223 | ) | | | (15 | ) | | | (34 | ) | | | (17 | ) | | | (397 | ) | | | | | | | | | | | | | | | | | | | | | | | | | | | Balance as of December 31, 2009 | | | 733 | | | | 2,460 | | | | 88 | | | | 188 | | | | 572 | | | | 4,041 | | | | | | | | | | | | | | | | | | | | | | | | | | | | | Revisions of previous estimates | | | 46 | | | | 131 | | | | 7 | | | | (2 | ) | | | — | | | | 182 | | | Extensions, discoveries and other | | | 146 | | | | — | | | | 2 | | | | 82 | | | | 4 | | | | 234 | | | Acquisitions of reserves in place | | | 2 | | | | — | | | | — | | | | — | | | | — | | | | 2 | | | Sales of reserves in place | | | (37 | ) | | | (23 | ) | | | (2 | ) | | | — | | | | (7 | ) | | | (69 | ) | | Production for the year | | | (98 | ) | | | (218 | ) | | | (16 | ) | | | (29 | ) | | | (15 | ) | | | (376 | ) | | | | | | | | | | | | | | | | | | | | | | | | | | | Balance as of December 31, 2010 | | | 792 | | | | 2,350 | | | | 79 | | | | 239 | | | | 554 | | | | 4,014 | | | | | | | | | | | | | | | | | | | | | | | | | | | | Minority interest in proved developed and undeveloped reserves as of | | | | | | | | | | | | | | | | | | December 31, 2008 | | | 12 | | | | 89 | | | | — | | | | — | | | | — | | | | 101 | | | December 31, 2009 | | | 12 | | | | 88 | | | | — | | | | — | | | | — | | | | 100 | | | December 31, 2010 | | | 11 | | | | 89 | | | | — | | | | — | | | | — | | | | 100 | |
| | | | | | | | | | | | | | | | | | | | | | | | | | | Proved developed and undeveloped reserves | | Equity & non-consolidated affiliates | | | | | | | | | | | | | | Middle
| | | | | | | | | (in million barrels) | | Europe | | | Africa | | | Americas | | | East | | | Asia | | | Total | | Balance as of December 31, 2007 | | | — | | | | 43 | | | | 533 | | | | 806 | | | | — | | | | 1,382 | | | Revisions of previous estimates | | | — | | | | 22 | | | | 1 | | | | (2 | ) | | | — | | | | 21 | | | Extensions, discoveries and other | | | — | | | | — | | | | — | | | | 3 | | | | — | | | | 3 | | | Acquisitions of reserves in place | | | — | | | | — | | | | 6 | | | | — | | | | — | | | | 6 | | | Sales of reserves in place | | | — | | | | — | | | | — | | | | — | | | | — | | | | — | | | Production for the year | | | — | | | | (7 | ) | | | (32 | ) | | | (88 | ) | | | — | | | | (127 | ) | | | | | | | | | | | | | | | | | | | | | | | | | | | Balance as of December 31, 2008 | | | — | | | | 58 | | | | 508 | | | | 719 | | | | — | | | | 1,285 | | | | | | | | | | | | | | | | | | | | | | | | | | | | | Revisions of previous estimates | | | — | | | | (14 | ) | | | (5 | ) | | | (15 | ) | | | — | | | | (34 | ) | | Extensions, discoveries and other | | | — | | | | — | | | | — | | | | 136 | | | | — | | | | 136 | | | Acquisitions of reserves in place | | | — | | | | — | | | | — | | | | — | | | | — | | | | — | | | Sales of reserves in place | | | — | | | | — | | | | — | | | | — | | | | — | | | | — | | | Production for the year | | | — | | | | (7 | ) | | | (18 | ) | | | (79 | ) | | | — | | | | (104 | ) | | | | | | | | | | | | | | | | | | | | | | | | | | | Balance as of December 31, 2009 | | | — | | | | 37 | | | | 485 | | | | 761 | | | | — | | | | 1,283 | | | | | | | | | | | | | | | | | | | | | | | | | | | | | Revisions of previous estimates | | | — | | | | 4 | | | | 4 | | | | 3 | | | | — | | | | 11 | | | Extensions, discoveries and other | | | — | | | | — | | | | — | | | | — | | | | — | | | | — | | | Acquisitions of reserves in place | | | — | | | | — | | | | — | | | | — | | | | — | | | | — | | | Sales of reserves in place | | | — | | | | — | | | | — | | | | — | | | | — | | | | — | | | Production for the year | | | — | | | | (7 | ) | | | (19 | ) | | | (84 | ) | | | — | | | | (110 | ) | | | | | | | | | | | | | | | | | | | | | | | | | | | Balance as of December 31, 2010 | | | — | | | | 34 | | | | 470 | | | | 680 | | | | — | | | | 1,184 | | | | | | | | | | | | | | | | | | | | | | | | | | | |
S-6
| | | | | | | | | | | | | | | | | | | | | | | | | | | | | Consolidated subsidiaries and equity & non-consolidated affiliates | | | | | | | | | | | | | | Middle
| | | | | | | | | (in million barrels) | | Europe | | | Africa | | | Americas | | | East | | | Asia | | | Total | | As of December 31, 2008 | | | | | | | | | | | | | | | | | | | | | | | | | Proved developed and undeveloped reserves | | | 798 | | | | 2,655 | | | | 760 | | | | 944 | | | | 538 | | | | 5,695 | | | Consolidated subsidiaries | | | 798 | | | | 2,597 | | | | 252 | | | | 225 | | | | 538 | | | | 4,410 | | | Equity and non-consolidated affiliates | | | — | | | | 58 | | | | 508 | | | | 719 | | | | — | | | | 1,285 | | | | | | | | | | | | | | | | | | | | | | | | | | | | Proved developed reserves | | | 516 | | | | 1,357 | | | | 183 | | | | 681 | | | | 65 | | | | 2,802 | | | Consolidated subsidiaries | | | 516 | | | | 1,313 | | | | 56 | | | | 201 | | | | 65 | | | | 2,151 | | | Equity and non-consolidated affiliates | | | — | | | | 44 | | | | 127 | | | | 480 | | | | — | | | | 651 | | | | | | | | | | | | | | | | | | | | | | | | | | | | Proved undeveloped reserves | | | 282 | | | | 1,298 | | | | 577 | | | | 263 | | | | 473 | | | | 2,893 | | | Consolidated subsidiaries | | | 282 | | | | 1,284 | | | | 196 | | | | 24 | | | | 473 | | | | 2,259 | | | Equity and non-consolidated affiliates | | | — | | | | 14 | | | | 381 | | | | 239 | | | | — | | | | 634 | | | | | | | | | | | | | | | | | | | | | | | | | | | | As of December 31, 2009 | | | | | | | | | | | | | | | | | | | | | | | | | Proved developed and undeveloped reserves | | | 733 | | | | 2,497 | | | | 573 | | | | 949 | | | | 572 | | | | 5,324 | | | Consolidated subsidiaries | | | 733 | | | | 2,460 | | | | 88 | | | | 188 | | | | 572 | | | | 4,041 | | | Equity and non-consolidated affiliates | | | — | | | | 37 | | | | 485 | | | | 761 | | | | — | | | | 1,283 | | | | | | | | | | | | | | | | | | | | | | | | | | | | Proved developed reserves | | | 457 | | | | 1,331 | | | | 187 | | | | 728 | | | | 65 | | | | 2,768 | | | Consolidated subsidiaries | | | 457 | | | | 1,303 | | | | 66 | | | | 174 | | | | 65 | | | | 2,065 | | | Equity and non-consolidated affiliates | | | — | | | | 28 | | | | 121 | | | | 554 | | | | — | | | | 703 | | | | | | | | | | | | | | | | | | | | | | | | | | | | Proved undeveloped reserves | | | 276 | | | | 1,166 | | | | 386 | | | | 221 | | | | 507 | | | | 2,556 | | | Consolidated subsidiaries | | | 276 | | | | 1,157 | | | | 22 | | | | 14 | | | | 507 | | | | 1,976 | | | Equity and non-consolidated affiliates | | | — | | | | 9 | | | | 364 | | | | 207 | | | | — | | | | 580 | | | | | | | | | | | | | | | | | | | | | | | | | | | | As of December 31, 2010 | | | | | | | | | | | | | | | | | | | | | | | | | Proved developed and undeveloped reserves | | | 792 | | | | 2,384 | | | | 549 | | | | 919 | | | | 554 | | | | 5,198 | | | Consolidated subsidiaries | | | 792 | | | | 2,350 | | | | 79 | | | | 239 | | | | 554 | | | | 4,014 | | | Equity and non-consolidated affiliates | | | — | | | | 34 | | | | 470 | | | | 680 | | | | — | | | | 1,184 | | | | | | | | | | | | | | | | | | | | | | | | | | | | Proved developed reserves | | | 394 | | | | 1,250 | | | | 180 | | | | 662 | | | | 58 | | | | 2,544 | | | Consolidated subsidiaries | | | 394 | | | | 1,226 | | | | 53 | | | | 151 | | | | 58 | | | | 1,882 | | | Equity and non-consolidated affiliates | | | — | | | | 24 | | | | 127 | | | | 511 | | | | — | | | | 662 | | | | | | | | | | | | | | | | | | | | | | | | | | | | Proved undeveloped reserves | | | 398 | | | | 1,134 | | | | 369 | | | | 257 | | | | 496 | | | | 2,654 | | | Consolidated subsidiaries | | | 398 | | | | 1,124 | | | | 26 | | | | 88 | | | | 496 | | | | 2,132 | | | Equity and non-consolidated affiliates | | | — | | | | 10 | | | | 343 | | | | 169 | | | | — | | | | 522 | | | | | | | | | | | | | | | | | | | | | | | | | | | |
S-7
Changes in bitumen reserves as of December 31, 2009. Bitumen reserves as of December 31, 20092008 and before are shown separately. | | | | | | | | | | | | | | | | | | | | Proved developed and undeveloped reserves | | Consolidated subsidiaries | | (in millions of barrels) | | Europe | | | Africa | | | Americas | | | Middle
East | | | Asia | | | Total | | Balance as of December 31, 2006 | | 893 | | | 2,502 | | | 1,345 | | | 237 | | | 539 | | | 5,516 | | Revisions of previous estimates | | 108 | | | 149 | | | (549 | ) | | (5 | ) | | (1 | ) | | (298 | ) | Extensions, discoveries and other | | 4 | | | 90 | | | 2 | | | 1 | | | 6 | | | 103 | | Acquisitions of reserves in place | | — | | | — | | | — | | | — | | | — | | | — | | Sales of reserves in place | | (3 | ) | | (2 | ) | | (465 | ) | | — | | | — | | | (470 | ) | Production for the year | | (122 | ) | | (241 | ) | | (48 | ) | | (30 | ) | | (14 | ) | | (455 | ) | Balance as of December 31, 2007 | | 880 | | | 2,498 | | | 285 | | | 203 | | | 530 | | | 4,396 | | Revisions of previous estimates | | 15 | | | 297 | | | (17 | ) | | 54 | | | 64 | | | 413 | | Extensions, discoveries and other | | 12 | | | 107 | | | — | | | — | | | 3 | | | 122 | | Acquisitions of reserves in place | | 2 | | | — | | | — | | | — | | | — | | | 2 | | Sales of reserves in place | | — | | | (74 | ) | | — | | | — | | | (43 | ) | | (117 | ) | Production for the year | | (111 | ) | | (231 | ) | | (16 | ) | | (32 | ) | | (16 | ) | | (406 | ) | Balance as of December 31, 2008 | | 798 | | | 2,597 | | | 252 | | | 225 | | | 538 | | | 4,410 | | Revisions of previous estimates | | 34 | | | 92 | | | (170 | ) | | (4 | ) | | 51 | | | 3 | | Extensions, discoveries and other | | 8 | | | 38 | | | 22 | | | 1 | | | — | | | 69 | | Acquisitions of reserves in place | | 1 | | | — | | | — | | | — | | | — | | | 1 | | Sales of reserves in place | | — | | | (44 | ) | | (1 | ) | | — | | | — | | | (45 | ) | Production for the year | | (108 | ) | | (223 | ) | | (15 | ) | | (34 | ) | | (17 | ) | | (397 | ) | Balance as of December 31, 2009 | | 733 | | | 2,460 | | | 88 | | | 188 | | | 572 | | | 4,041 | | | | | Minority interest in proved developed and undeveloped reserves as of | | | | | | | | December 31, 2007 | | 15 | | | 116 | | | — | | | — | | | — | | | 131 | | December 31, 2008 | | 12 | | | 89 | | | — | | | — | | | — | | | 101 | | December 31, 2009 | | 12 | | | 88 | | | — | | | — | | | — | | | 100 | | | Proved developed and undeveloped reserves | | Equity & non—consolidated affiliates | | (in millions of barrels) | | Europe | | | Africa | | | Americas | | | Middle East | | | Asia | | | Total | | Balance as of December 31, 2006 | | — | | | 56 | | | — | | | 899 | | | — | | | 955 | | Revisions of previous estimates | | — | | | (3 | ) | | 533 | | | (5 | ) | | — | | | 525 | | Extensions, discoveries and other | | — | | | 7 | | | — | | | — | | | — | | | 7 | | Acquisitions of reserves in place | | — | | | — | | | — | | | — | | | — | | | — | | Sales of reserves in place | | — | | | (9 | ) | | — | | | — | | | — | | | (9 | ) | Production for the year | | — | | | (8 | ) | | — | | | (88 | ) | | — | | | (96 | ) | Balance as of December 31, 2007 | | — | | | 43 | | | 533 | | | 806 | | | — | | | 1,382 | | Revisions of previous estimates | | — | | | 22 | | | 1 | | | (2 | ) | | — | | | 21 | | Extensions, discoveries and other | | — | | | — | | | — | | | 3 | | | — | | | 3 | | Acquisitions of reserves in place | | — | | | — | | | 6 | | | — | | | — | | | 6 | | Sales of reserves in place | | — | | | — | | | — | | | — | | | — | | | — | | Production for the year | | — | | | (7 | ) | | (32 | ) | | (88 | ) | | — | | | (127 | ) | Balance as of December 31, 2008 | | — | | | 58 | | | 508 | | | 719 | | | — | | | 1,285 | | Revisions of previous estimates | | — | | | (14 | ) | | (5 | ) | | (15 | ) | | — | | | (34 | ) | Extensions, discoveries and other | | — | | | — | | | — | | | 136 | | | — | | | 136 | | Acquisitions of reserves in place | | — | | | — | | | — | | | — | | | — | | | — | | Sales of reserves in place | | — | | | — | | | — | | | — | | | — | | | — | | Production for the year | | — | | | (7 | ) | | (18 | ) | | (79 | ) | | — | | | (104 | ) | Balance as of December 31, 2009 | | — | | | 37 | | | 485 | | | 761 | | | — | | | 1,283 | |
| | | | | | | | | | | | | Proved developed and undeveloped reserves of consolidated
subsidiaries and equity & non-consolidated affiliates (in millions of barrels) | | Europe | | Africa | | Americas | | Middle
East | | Asia | | Total | December 31, 2007 | Proved developed and undeveloped | | 880 | | 2,541 | | 818 | | 1,009 | | 530 | | 5,778 | Consolidated subsidiaries | | 880 | | 2,498 | | 285 | | 203 | | 530 | | 4,396 | Equity and non-consolidated affiliates | | — | | 43 | | 533 | | 806 | | — | | 1,382 | Proved developed | | 560 | | 1,419 | | 213 | | 744 | | 59 | | 2,995 | Consolidated subsidiaries | | 560 | | 1,389 | | 70 | | 182 | | 59 | | 2,260 | Equity and non-consolidated affiliates | | — | | 30 | | 143 | | 562 | | — | | 735 | Proved undeveloped | | 320 | | 1,122 | | 605 | | 265 | | 471 | | 2,783 | Consolidated subsidiaries | | 320 | | 1,109 | | 215 | | 21 | | 471 | | 2,136 | Equity and non-consolidated affiliates | | — | | 13 | | 390 | | 244 | | — | | 647 | December 31, 2008 | | | | | | | | | | | | | Proved developed and undeveloped | | 798 | | 2,655 | | 760 | | 944 | | 538 | | 5,695 | Consolidated subsidiaries | | 798 | | 2,597 | | 252 | | 225 | | 538 | | 4,410 | Equity and non-consolidated affiliates | | — | | 58 | | 508 | | 719 | | — | | 1,285 | Proved developed | | 516 | | 1,357 | | 183 | | 681 | | 65 | | 2,802 | Consolidated subsidiaries | | 516 | | 1,313 | | 56 | | 201 | | 65 | | 2,151 | Equity and non-consolidated affiliates | | — | | 44 | | 127 | | 480 | | — | | 651 | Proved undeveloped | | 282 | | 1,298 | | 577 | | 263 | | 473 | | 2,893 | Consolidated subsidiaries | | 282 | | 1,284 | | 196 | | 24 | | 473 | | 2,259 | Equity and non-consolidated affiliates | | — | | 14 | | 381 | | 239 | | — | | 634 | December 31, 2009 | | | | | | | | | | | | | Proved developed and undeveloped | | 733 | | 2,497 | | 573 | | 949 | | 572 | | 5,324 | Consolidated subsidiaries | | 733 | | 2,460 | | 88 | | 188 | | 572 | | 4,041 | Equity and non-consolidated affiliates | | — | | 37 | | 485 | | 761 | | — | | 1,283 | Proved developed | | 457 | | 1,331 | | 187 | | 728 | | 65 | | 2,768 | Consolidated subsidiaries | | 457 | | 1,303 | | 66 | | 174 | | 65 | | 2,065 | Equity and non-consolidated affiliates | | — | | 28 | | 121 | | 554 | | — | | 703 | Proved undeveloped | | 276 | | 1,166 | | 386 | | 221 | | 507 | | 2,556 | Consolidated subsidiaries | | 276 | | 1,157 | | 22 | | 14 | | 507 | | 1,976 | Equity and non-consolidated affiliates | | — | | 9 | | 364 | | 207 | | — | | 580 |
Changesincluded in bitumenoil reserves
Bitumen reserves as of December 31, 2007 and 2008 are included presented in the table “Changes in oil reserves” above.
| | | | | | | | | | | | | | | | Proved developed and undeveloped reserves | | Consolidated subsidiaries | | (in millions of barrels) | | Europe | | Africa | | Americas | | | Middle
East | | Asia | | Total | | Balance as of December 31, 2008 | | — | | — | | — | | | — | | — | | — | | Revisions of previous estimates | | — | | — | | 176 | | | — | | — | | 176 | | Extensions, discoveries and other | | — | | — | | 192 | | | — | | — | | 192 | | Acquisitions of reserves in place | | — | | — | | — | | | — | | — | | — | | Sales of reserves in place | | — | | — | | — | | | — | | — | | — | | Production for the year | | — | | — | | (3 | ) | | — | | — | | (3 | ) | Balance as of December 31, 2009 | | — | | — | | 365 | | | — | | — | | 365 | | December 31, 2009 | | | | | | | | | | | | | | | Proved developed reserves | | — | | — | | 19 | | | — | | — | | 19 | | Proved undeveloped reserves | | — | | — | | 346 | | | — | | — | | 346 | |
. | | | | | | | | | | | | | | | | | | | | | | | | | | | Proved developed and undeveloped reserves | | Consolidated subsidiaries | | | | | | | | | | | | | | Middle
| | | | | | | | | (in million barrels) | | Europe | | | Africa | | | Americas | | | East | | | Asia | | | Total | | Balance as of December 31, 2008 | | | — | | | | — | | | | — | | | | — | | | | — | | | | — | | | | | | | | | | | | | | | | | | | | | | | | | | | | | Revisions of previous estimates | | | — | | | | — | | | | 176 | | | | — | | | | — | | | | 176 | | | Extensions, discoveries and other | | | — | | | | — | | | | 192 | | | | — | | | | — | | | | 192 | | | Acquisitions of reserves in place | | | — | | | | — | | | | — | | | | — | | | | — | | | | — | | | Sales of reserves in place | | | — | | | | — | | | | — | | | | — | | | | — | | | | — | | | Production for the year | | | — | | | | — | | | | (3 | ) | | | — | | | | — | | | | (3 | ) | | | | | | | | | | | | | | | | | | | | | | | | | | | Balance as of December 31, 2009 | | | — | | | | — | | | | 365 | | | | — | | | | — | | | | 365 | | | | | | | | | | | | | | | | | | | | | | | | | | | | | Revisions of previous estimates | | | — | | | | — | | | | 3 | | | | — | | | | — | | | | 3 | | | Extensions, discoveries and other | | | — | | | | — | | | | — | | | | — | | | | — | | | | — | | | Acquisitions of reserves in place | | | — | | | | — | | | | 425 | | | | — | | | | — | | | | 425 | | | Sales of reserves in place | | | — | | | | — | | | | — | | | | — | | | | — | | | | — | | | Production for the year | | | — | | | | — | | | | (4 | ) | | | — | | | | — | | | | (4 | ) | | | | | | | | | | | | | | | | | | | | | | | | | | | Balance as of December 31, 2010 | | | — | | | | — | | | | 789 | | | | — | | | | — | | | | 789 | | | | | | | | | | | | | | | | | | | | | | | | | | | | Proved developed reserves as of | | | | | | | | | | | | | | | | | | | | | | | | | | December 31, 2009 | | | — | | | | — | | | | 19 | | | | — | | | | — | | | | 19 | | | | | | | | | | | | | | | | | | | | | | | | | | | | December 31, 2010 | | | — | | | | — | | | | 18 | | | | — | | | | — | | | | 18 | | | | | | | | | | | | | | | | | | | | | | | | | | | | Proved undeveloped reserves as of | | | | | | | | | | | | | | | | | | | | | | | | | | December 31, 2009 | | | — | | | | — | | | | 346 | | | | — | | | | — | | | | 346 | | | | | | | | | | | | | | | | | | | | | | | | | | | | December 31, 2010 | | | — | | | | — | | | | 771 | | | | — | | | | — | | | | 771 | | | | | | | | | | | | | | | | | | | | | | | | | | | |
There are no bitumen reserves for equity and non-consolidated affiliates. There are no minority interests for bitumen reserves.
S-8
Changes in gas reserves | | | | | | | | | | | | | | | | | | | | | | | | | | | Proved developed and undeveloped reserves | | Consolidated subsidiaries | | | | | | | | | | | | | | Middle
| | | | | | | | | (in billion cubic feet) | | Europe | | | Africa | | | Americas | | | East | | | Asia | | | Total | | Balance as of December 31, 2007 | | | 5,531 | | | | 5,371 | | | | 2,564 | | | | 1,572 | | | | 4,045 | | | | 19,083 | | | | | | | | | | | | | | | | | | | | | | | | | | | | | Revisions of previous estimates | | | 145 | | | | 381 | | | | 366 | | | | 300 | | | | 458 | | | | 1,650 | | | Extensions, discoveries and other | | | 377 | | | | 17 | | | | — | | | | — | | | | 90 | | | | 484 | | | Acquisitions of reserves in place | | | 76 | | | | — | | | | — | | | | — | | | | — | | | | 76 | | | Sales of reserves in place | | | — | | | | — | | | | — | | | | — | | | | (15 | ) | | | (15 | ) | | Production for the year | | | (622 | ) | | | (240 | ) | | | (216 | ) | | | (103 | ) | | | (480 | ) | | | (1,661 | ) | | | | | | | | | | | | | | | | | | | | | | | | | | | Balance as of December 31, 2008 | | | 5,507 | | | | 5,529 | | | | 2,714 | | | | 1,769 | | | | 4,098 | | | | 19,617 | | | | | | | | | | | | | | | | | | | | | | | | | | | | | Revisions of previous estimates | | | 73 | | | | (127 | ) | | | 25 | | | | (18 | ) | | | (165 | ) | | | (212 | ) | | Extensions, discoveries and other | | | 55 | | | | 61 | | | | 382 | | | | 399 | | | | — | | | | 897 | | | Acquisitions of reserves in place | | | 58 | | | | — | | | | 752 | | | | — | | | | — | | | | 810 | | | Sales of reserves in place | | | (13 | ) | | | — | | | | (64 | ) | | | — | | | | — | | | | (77 | ) | | Production for the year | | | (633 | ) | | | (217 | ) | | | (212 | ) | | | (122 | ) | | | (467 | ) | | | (1,651 | ) | | | | | | | | | | | | | | | | | | | | | | | | | | | Balance as of December 31, 2009 | | | 5,047 | | | | 5,246 | | | | 3,597 | | | | 2,028 | | | | 3,466 | | | | 19,384 | | | | | | | | | | | | | | | | | | | | | | | | | | | | | Revisions of previous estimates | | | 271 | | | | 346 | | | | 415 | | | | (80 | ) | | | 15 | | | | 967 | | | Extensions, discoveries and other | | | 193 | | | | — | | | | 88 | | | | 70 | | | | 138 | | | | 489 | | | Acquisitions of reserves in place | | | 111 | | | | — | | | | — | | | | — | | | | 51 | | | | 162 | | | Sales of reserves in place | | | (43 | ) | | | (20 | ) | | | (16 | ) | | | — | | | | (4 | ) | | | (83 | ) | | Production for the year | | | (617 | ) | | | (258 | ) | | | (278 | ) | | | (151 | ) | | | (472 | ) | | | (1,776 | ) | | | | | | | | | | | | | | | | | | | | | | | | | | | Balance as of December 31, 2010 | | | 4,962 | | | | 5,314 | | | | 3,806 | | | | 1,867 | | | | 3,194 | | | | 19,143 | | | | | | | | | | | | | | | | | | | | | | | | | | | | Minority interest in proved developed and undeveloped reserves as of | | December 31, 2008 | | | 75 | | | | 64 | | | | — | | | | — | | | | — | | | | 139 | | | December 31, 2009 | | | 73 | | | | 60 | | | | — | | | | — | | | | — | | | | 133 | | | | | | | | | | | | | | | | | | | | | | | | | | | | December 31, 2010 | | | 83 | | | | 67 | | | | — | | | | — | | | | — | | | | 150 | | | | | | | | | | | | | | | | | | | | | | | | | | | |
S-9
| | | | | | | | | | | | | | | | | | | | Proved developed and undeveloped reserves | | Consolidated subsidiaries | | (in billions of cubic feet) | | Europe | | | Africa | | | Americas | | | Middle
East | | | Asia | | | Total | | Balance as of December 31, 2006 | | 5,452 | | | 4,787 | | | 2,711 | | | 1,769 | | | 4,347 | | | 19,066 | | Revisions of previous estimates | | 487 | | | 805 | | | 88 | | | (163 | ) | | (79 | ) | | 1,138 | | Extensions, discoveries and other | | 265 | | | 12 | | | 3 | | | — | | | 263 | | | 543 | | Acquisitions of reserves in place | | — | | | — | | | — | | | — | | | — | | | — | | Sales of reserves in place | | — | | | (1 | ) | | — | | | — | | | — | | | (1 | ) | Production for the year | | (673 | ) | | (232 | ) | | (238 | ) | | (34 | ) | | (486 | ) | | (1,663 | ) | Balance as of December 31, 2007 | | 5,531 | | | 5,371 | | | 2,564 | | | 1,572 | | | 4,045 | | | 19,083 | | Revisions of previous estimates | | 145 | | | 381 | | | 366 | | | 300 | | | 458 | | | 1,650 | | Extensions, discoveries and other | | 377 | | | 17 | | | — | | | — | | | 90 | | | 484 | | Acquisitions of reserves in place | | 76 | | | — | | | — | | | — | | | — | | | 76 | | Sales of reserves in place | | — | | | — | | | — | | | — | | | (15 | ) | | (15 | ) | Production for the year | | (622 | ) | | (240 | ) | | (216 | ) | | (103 | ) | | (480 | ) | | (1,661 | ) | Balance as of December 31, 2008 | | 5,507 | | | 5,529 | | | 2,714 | | | 1,769 | | | 4,098 | | | 19,617 | | Revisions of previous estimates | | 73 | | | (127 | ) | | 25 | | | (18 | ) | | (165 | ) | | (212 | ) | Extensions, discoveries and other | | 55 | | | 61 | | | 382 | | | 399 | | | — | | | 897 | | Acquisitions of reserves in place | | 58 | | | — | | | 752 | | | — | | | — | | | 810 | | Sales of reserves in place | | (13 | ) | | — | | | (64 | ) | | — | | | — | | | (77 | ) | Production for the year | | (633 | ) | | (217 | ) | | (212 | ) | | (122 | ) | | (467 | ) | | (1,651 | ) | Balance as of December 31, 2009 | | 5,047 | | | 5,246 | | | 3,597 | | | 2,028 | | | 3,466 | | | 19,384 | | | | | Minority interest in proved developed and undeveloped reserves as of | | | | | | | | December 31, 2007 | | 80 | | | 111 | | | — | | | — | | | — | | | 191 | | December 31, 2008 | | 75 | | | 64 | | | — | | | — | | | — | | | 139 | | December 31, 2009 | | 73 | | | 60 | | | — | | | — | | | — | | | 133 | | | Proved developed and undeveloped reserves | | Equity & non–consolidated affiliates | | (in billions of cubic feet) | | Europe | | | Africa | | | Americas | | | Middle
East | | | Asia | | | Total | | Balance as of December 31, 2006 | | — | | | 20 | | | — | | | 6,453 | | | — | | | 6,473 | | Revisions of previous estimates | | — | | | — | | | 125 | | | 30 | | | — | | | 155 | | Extensions, discoveries and other | | — | | | 126 | | | — | | | — | | | — | | | 126 | | Acquisitions of reserves in place | | — | | | — | | | — | | | — | | | — | | | — | | Sales of reserves in place | | — | | | (4 | ) | | — | | | — | | | — | | | (4 | ) | Production for the year | | — | | | (2 | ) | | — | | | (101 | ) | | — | | | (103 | ) | Balance as of December 31, 2007 | | — | | | 140 | | | 125 | | | 6,382 | | | — | | | 6,647 | | Revisions of previous estimates | | — | | | — | | | (13 | ) | | — | | | — | | | (13 | ) | Extensions, discoveries and other | | — | | | 76 | | | — | | | — | | | — | | | 76 | | Acquisitions of reserves in place | | — | | | — | | | — | | | — | | | — | | | — | | Sales of reserves in place | | — | | | — | | | — | | | — | | | — | | | — | | Production for the year | | — | | | (1 | ) | | (2 | ) | | (106 | ) | | — | | | (109 | ) | Balance as of December 31, 2008 | | — | | | 215 | | | 110 | | | 6,276 | | | — | | | 6,601 | | Revisions of previous estimates | | — | | | 127 | | | (13 | ) | | 363 | | | — | | | 477 | | Extensions, discoveries and other | | — | | | — | | | — | | | — | | | — | | | — | | Acquisitions of reserves in place | | — | | | — | | | — | | | — | | | — | | | — | | Sales of reserves in place | | — | | | — | | | — | | | — | | | — | | | — | | Production for the year | | — | | | (1 | ) | | (2 | ) | | (141 | ) | | — | | | (144 | ) | Balance as of December 31, 2009 | | — | | | 341 | | | 95 | | | 6,498 | | | — | | | 6,934 | |
| | | | | | | | | | | | | Proved developed and undeveloped reserves of consolidated
subsidiaries and equity & non-consolidated affiliates (in billions of cubic feet) | | Europe | | Africa | | Americas | | Middle
East | | Asia | | Total | December 31, 2007 | Proved developed and undeveloped | | 5,531 | | 5,511 | | 2,689 | | 7,954 | | 4,045 | | 25,730 | Consolidated subsidiaries | | 5,531 | | 5,371 | | 2,564 | | 1,572 | | 4,045 | | 19,083 | Equity and non-consolidated affiliates | | — | | 140 | | 125 | | 6,382 | | — | | 6,647 | Proved developed | | 3,602 | | 2,574 | | 1,647 | | 2,797 | | 2,487 | | 13,107 | Consolidated subsidiaries | | 3,602 | | 2,560 | | 1,619 | | 1,572 | | 2,487 | | 11,840 | Equity and non-consolidated affiliates | | — | | 14 | | 28 | | 1,225 | | — | | 1,267 | Proved undeveloped | | 1,929 | | 2,937 | | 1,042 | | 5,157 | | 1,558 | | 12,623 | Consolidated subsidiaries | | 1,929 | | 2,811 | | 945 | | — | | 1,558 | | 7,243 | Equity and non-consolidated affiliates | | — | | 126 | | 97 | | 5,157 | | — | | 5,380 | December 31, 2008 | Proved developed and undeveloped | | 5,507 | | 5,744 | | 2,824 | | 8,045 | | 4,098 | | 26,218 | Consolidated subsidiaries | | 5,507 | | 5,529 | | 2,714 | | 1,769 | | 4,098 | | 19,617 | Equity and non-consolidated affiliates | | — | | 215 | | 110 | | 6,276 | | — | | 6,601 | Proved developed | | 3,989 | | 2,292 | | 1,849 | | 2,893 | | 2,440 | | 13,463 | Consolidated subsidiaries | | 3,989 | | 2,280 | | 1,807 | | 1,766 | | 2,440 | | 12,282 | Equity and non-consolidated affiliates | | — | | 12 | | 42 | | 1,127 | | — | | 1,181 | Proved undeveloped | | 1,518 | | 3,452 | | 975 | | 5,152 | | 1,658 | | 12,755 | Consolidated subsidiaries | | 1,518 | | 3,249 | | 907 | | 3 | | 1,658 | | 7,335 | Equity and non-consolidated affiliates | | — | | 203 | | 68 | | 5,149 | | — | | 5,420 | December 31, 2009 | Proved developed and undeveloped | | 5,047 | | 5,587 | | 3,692 | | 8,526 | | 3,466 | | 26,318 | Consolidated subsidiaries | | 5,047 | | 5,246 | | 3,597 | | 2,028 | | 3,466 | | 19,384 | Equity and non-consolidated affiliates | | — | | 341 | | 95 | | 6,498 | | — | | 6,934 | Proved developed | | 3,463 | | 2,272 | | 2,388 | | 6,606 | | 2,059 | | 16,788 | Consolidated subsidiaries | | 3,463 | | 2,261 | | 2,343 | | 1,773 | | 2,059 | | 11,899 | Equity and non-consolidated affiliates | | — | | 11 | | 45 | | 4,833 | | — | | 4,889 | Proved undeveloped | | 1,584 | | 3,315 | | 1,304 | | 1,920 | | 1,407 | | 9,530 | Consolidated subsidiaries | | 1,584 | | 2,985 | | 1,254 | | 255 | | 1,407 | | 7,485 | Equity and non-consolidated affiliates | | — | | 330 | | 50 | | 1,665 | | — | | 2,045 |
| | | | | | | | | | | | | | | | | | | | | | | | | | | Proved developed and undeveloped reserves | | Equity & non-consolidated affiliates | | | | | | | | | | | | | | Middle
| | | | | | | | | (in billion cubic feet) | | Europe | | | Africa | | | Americas | | | East | | | Asia | | | Total | | Balance as of December 31, 2007 | | | — | | | | 140 | | | | 125 | | | | 6,382 | | | | — | | | | 6,647 | | | | | | | | | | | | | | | | | | | | | | | | | | | | | Revisions of previous estimates | | | — | | | | — | | | | (13 | ) | | | — | | | | — | | | | (13 | ) | | Extensions, discoveries and other | | | — | | | | 76 | | | | — | | | | — | | | | — | | | | 76 | | | Acquisitions of reserves in place | | | — | | | | — | | | | — | | | | — | | | | — | | | | — | | | Sales of reserves in place | | | — | | | | — | | | | — | | | | — | | | | — | | | | — | | | Production for the year | | | — | | | | (1 | ) | | | (2 | ) | | | (106 | ) | | | — | | | | (109 | ) | | | | | | | | | | | | | | | | | | | | | | | | | | | Balance as of December 31, 2008 | | | — | | | | 215 | | | | 110 | | | | 6,276 | | | | — | | | | 6,601 | | | | | | | | | | | | | | | | | | | | | | | | | | | | | Revisions of previous estimates | | | — | | | | 127 | | | | (13 | ) | | | 363 | | | | — | | | | 477 | | | Extensions, discoveries and other | | | — | | | | — | | | | — | | | | — | | | | — | | | | — | | | Acquisitions of reserves in place | | | — | | | | — | | | | — | | | | — | | | | — | | | | — | | | Sales of reserves in place | | | — | | | | — | | | | — | | | | — | | | | — | | | | — | | | Production for the year | | | — | | | | (1 | ) | | | (2 | ) | | | (141 | ) | | | — | | | | (144 | ) | | | | | | | | | | | | | | | | | | | | | | | | | | | Balance as of December 31, 2009 | | | — | | | | 341 | | | | 95 | | | | 6,498 | | | | — | | | | 6,934 | | | | | | | | | | | | | | | | | | | | | | | | | | | | | Revisions of previous estimates | | | — | | | | 50 | | | | (2 | ) | | | (52 | ) | | | — | | | | (4 | ) | | Extensions, discoveries and other | | | — | | | | — | | | | — | | | | — | | | | — | | | | — | | | Acquisitions of reserves in place | | | — | | | | — | | | | — | | | | — | | | | — | | | | — | | | Sales of reserves in place | | | — | | | | — | | | | — | | | | — | | | | — | | | | — | | | Production for the year | | | — | | | | (1 | ) | | | (2 | ) | | | (282 | ) | | | — | | | | (285 | ) | | | | | | | | | | | | | | | | | | | | | | | | | | | Balance as of December 31, 2010 | | | — | | | | 390 | | | | 91 | | | | 6,164 | | | | — | | | | 6,645 | | | | | | | | | | | | | | | | | | | | | | | | | | | |
S-10
| | | | | | | | | | | | | | | | | | | | | | | | | | | | | Consolidated subsidiaries and equity & non-consolidated affiliates | | | (in billion cubic feet) | | Europe | | | Africa | | | Americas | | | Middle East | | | Asia | | | Total | | As of December 31, 2008 | | | | | | | | | | | | | | | | | | | | | | | | | Proved developed and undeveloped reserves | | | 5,507 | | | | 5,744 | | | | 2,824 | | | | 8,045 | | | | 4,098 | | | | 26,218 | | | Consolidated subsidiaries | | | 5,507 | | | | 5,529 | | | | 2,714 | | | | 1,769 | | | | 4,098 | | | | 19,617 | | | Equity and non-consolidated affiliates | | | — | | | | 215 | | | | 110 | | | | 6,276 | | | | — | | | | 6,601 | | | | | | | | | | | | | | | | | | | | | | | | | | | | Proved developed reserves | | | 3,989 | | | | 2,292 | | | | 1,849 | | | | 2,893 | | | | 2,440 | | | | 13,463 | | | Consolidated subsidiaries | | | 3,989 | | | | 2,280 | | | | 1,807 | | | | 1,766 | | | | 2,440 | | | | 12,282 | | | Equity and non-consolidated affiliates | | | — | | | | 12 | | | | 42 | | | | 1,127 | | | | — | | | | 1,181 | | | | | | | | | | | | | | | | | | | | | | | | | | | | Proved undeveloped reserves | | | 1,518 | | | | 3,452 | | | | 975 | | | | 5,152 | | | | 1,658 | | | | 12,755 | | | Consolidated subsidiaries | | | 1,518 | | | | 3,249 | | | | 907 | | | | 3 | | | | 1,658 | | | | 7,335 | | | Equity and non-consolidated affiliates | | | — | | | | 203 | | | | 68 | | | | 5,149 | | | | — | | | | 5,420 | | | | | | | | | | | | | | | | | | | | | | | | | | | | As of December 31, 2009 | | | | | | | | | | | | | | | | | | | | | | | | | Proved developed and undeveloped reserves | | | 5,047 | | | | 5,587 | | | | 3,692 | | | | 8,526 | | | | 3,466 | | | | 26,318 | | | Consolidated subsidiaries | | | 5,047 | | | | 5,246 | | | | 3,597 | | | | 2,028 | | | | 3,466 | | | | 19,384 | | | Equity and non-consolidated affiliates | | | — | | | | 341 | | | | 95 | | | | 6,498 | | | | — | | | | 6,934 | | | | | | | | | | | | | | | | | | | | | | | | | | | | Proved developed reserves | | | 3,463 | | | | 2,272 | | | | 2,388 | | | | 6,606 | | | | 2,059 | | | | 16,788 | | | Consolidated subsidiaries | | | 3,463 | | | | 2,261 | | | | 2,343 | | | | 1,773 | | | | 2,059 | | | | 11,899 | | | Equity and non-consolidated affiliates | | | — | | | | 11 | | | | 45 | | | | 4,833 | | | | — | | | | 4,889 | | | | | | | | | | | | | | | | | | | | | | | | | | | | Proved undeveloped reserves | | | 1,584 | | | | 3,315 | | | | 1,304 | | | | 1,920 | | | | 1,407 | | | | 9,530 | | | Consolidated subsidiaries | | | 1,584 | | | | 2,985 | | | | 1,254 | | | | 255 | | | | 1,407 | | | | 7,485 | | | Equity and non-consolidated affiliates | | | — | | | | 330 | | | | 50 | | | | 1,665 | | | | — | | | | 2,045 | | | | | | | | | | | | | | | | | | | | | | | | | | | | As of December 31, 2010 | | | | | | | | | | | | | | | | | | | | | | | | | Proved developed and undeveloped reserves | | | 4,962 | | | | 5,704 | | | | 3,897 | | | | 8,031 | | | | 3,194 | | | | 25,788 | | | Consolidated subsidiaries | | | 4,962 | | | | 5,314 | | | | 3,806 | | | | 1,867 | | | | 3,194 | | | | 19,143 | | | Equity and non-consolidated affiliates | | | — | | | | 390 | | | | 91 | | | | 6,164 | | | | — | | | | 6,645 | | | | | | | | | | | | | | | | | | | | | | | | | | | | Proved developed reserves | | | 3,089 | | | | 2,240 | | | | 2,474 | | | | 7,649 | | | | 1,790 | | | | 17,242 | | | Consolidated subsidiaries | | | 3,089 | | | | 2,229 | | | | 2,439 | | | | 1,578 | | | | 1,790 | | | | 11,125 | | | Equity and non-consolidated affiliates | | | — | | | | 11 | | | | 35 | | | �� | 6,071 | | | | — | | | | 6,117 | | | | | | | | | | | | | | | | | | | | | | | | | | | | Proved undeveloped reserves | | | 1,873 | | | | 3,464 | | | | 1,423 | | | | 382 | | | | 1,404 | | | | 8,546 | | | Consolidated subsidiaries | | | 1,873 | | | | 3,085 | | | | 1,367 | | | | 289 | | | | 1,404 | | | | 8,018 | | | Equity and non-consolidated affiliates | | | — | | | | 379 | | | | 56 | | | | 93 | | | | — | | | | 528 | | | | | | | | | | | | | | | | | | | | | | | | | | | |
S-11
RESULTS OF OPERATIONS FOR OIL AND GAS PRODUCING ACTIVITIES The following tables do not include revenues and expenses related to oil and gas transportation activities and LNG liquefaction and transportation activities. | | | | | | | | | | | | | | | | | | | | | | | | | | | | | Consolidated subsidiaries | | | | | | | | | | | | | | Middle
| | | | | | | | | (in million euros) | | Europe | | | Africa | | | Americas | | | East | | | Asia | | | Total | | 2008 | | | | | | | | | | | | | | | | | | | | | | | | | | Non-Group sales | | | 4,521 | | | | 2,930 | | | | 707 | | | | 1,558 | | | | 2,819 | | | | 12,535 | | | Group sales | | | 6,310 | | | | 11,425 | | | | 360 | | | | 409 | | | | 626 | | | | 19,130 | | Total Revenues | | | 10,831 | | | | 14,355 | | | | 1,067 | | | | 1,967 | | | | 3,445 | | | | 31,665 | | | Production costs | | | (1,280 | ) | | | (1,055 | ) | | | (213 | ) | | | (249 | ) | | | (263 | ) | | | (3,060 | ) | | Exploration expenses | | | (185 | ) | | | (209 | ) | | | (130 | ) | | | (4 | ) | | | (236 | ) | | | (764 | ) | | Depreciation, depletion and amortization and valuation allowances | | | (1,266 | ) | | | (1,195 | ) | | | (318 | ) | | | (364 | ) | | | (471 | ) | | | (3,614 | ) | Other expenses(a) | | | (260 | ) | | | (1,214 | ) | | | (225 | ) | | | (357 | ) | | | (60 | ) | | | (2,116 | ) | Pre-tax income from producing activities | | | 7,840 | | | | 10,682 | | | | 181 | | | | 993 | | | | 2,415 | | | | 22,111 | | | Income tax | | | (5,376 | ) | | | (7,160 | ) | | | (109 | ) | | | (481 | ) | | | (1,212 | ) | | | (14,338 | ) | Results of oil and gas producing activities | | | 2,464 | | | | 3,522 | | | | 72 | | | | 512 | | | | 1,203 | | | | 7,773 | | | | | | | | | | | | | | | | | | | | | | | | | | | | 2009 | | | | | | | | | | | | | | | | | | | | | | | | | | Non-Group sales | | | 2,499 | | | | 1,994 | | | | 583 | | | | 859 | | | | 1,926 | | | | 7,861 | | | Group sales | | | 4,728 | | | | 7,423 | | | | 310 | | | | 556 | | | | 597 | | | | 13,614 | | Total Revenues | | | 7,227 | | | | 9,417 | | | | 893 | | | | 1,415 | | | | 2,523 | | | | 21,475 | | | Production costs | | | (1,155 | ) | | | (1,122 | ) | | | (193 | ) | | | (204 | ) | | | (243 | ) | | | (2,917 | ) | | Exploration expenses | | | (160 | ) | | | (265 | ) | | | (121 | ) | | | (81 | ) | | | (70 | ) | | | (697 | ) | | Depreciation, depletion and amortization and valuation allowances | | | (1,489 | ) | | | (1,471 | ) | | | (262 | ) | | | (314 | ) | | | (613 | ) | | | (4,149 | ) | Other expenses(a) | | | (261 | ) | | | (895 | ) | | | (181 | ) | | | (170 | ) | | | (56 | ) | | | (1,563 | ) | Pre-tax income from producing activities | | | 4,162 | | | | 5,664 | | | | 136 | | | | 646 | | | | 1,541 | | | | 12,149 | | | Income tax | | | (2,948 | ) | | | (3,427 | ) | | | (103 | ) | | | (309 | ) | | | (747 | ) | | | (7,534 | ) | Results of oil and gas producing activities | | | 1,214 | | | | 2,237 | | | | 33 | | | | 337 | | | | 794 | | | | 4,615 | | | | | | | | | | | | | | | | | | | | | | | | | | | | 2010 | | | | | | | | | | | | | | | | | | | | | | | | | | Non-Group sales | | | 2,839 | | | | 2,639 | | | | 628 | | | | 1,038 | | | | 2,540 | | | | 9,684 | | | Group sales | | | 5,599 | | | | 9,894 | | | | 540 | | | | 644 | | | | 683 | | | | 17,360 | | | | | | | | | | | | | | | | | | | | | | | | | | | | Total Revenues | | | 8,438 | | | | 12,533 | | | | 1,168 | | | | 1,682 | | | | 3,223 | | | | 27,044 | | | | | | | | | | | | | | | | | | | | | | | | | | | | | Production costs | | | (1,281 | ) | | | (1,187 | ) | | | (222 | ) | | | (259 | ) | | | (279 | ) | | | (3,228 | ) | | Exploration expenses | | | (266 | ) | | | (275 | ) | | | (216 | ) | | | (8 | ) | | | (99 | ) | | | (864 | ) | | Depreciation, depletion and amortization and valuation allowances | | | (1,404 | ) | | | (1,848 | ) | | | (368 | ) | | | (264 | ) | | | (830 | ) | | | (4,714 | ) | Other expenses(a) | | | (299 | ) | | | (1,014 | ) | | | (218 | ) | | | (241 | ) | | | (72 | ) | | | (1,844 | ) | | | | | | | | | | | | | | | | | | | | | | | | | | | Pre-tax income from producing activities | | | 5,188 | | | | 8,209 | | | | 144 | | | | 910 | | | | 1,943 | | | | 16,394 | | | | | | | | | | | | | | | | | | | | | | | | | | | | | Income tax | | | (3,237 | ) | | | (5,068 | ) | | | (83 | ) | | | (402 | ) | | | (950 | ) | | | (9,740 | ) | | | | | | | | | | | | | | | | | | | | | | | | | | | Results of oil and gas producing activities | | | 1,951 | | | | 3,141 | | | | 61 | | | | 508 | | | | 993 | | | | 6,654 | | | | | | | | | | | | | | | | | | | | | | | | | | | |
| | | | (a) | | Included production taxes and accretion expense as provided for by IAS 37 (€223 million in 2008, €271 million in 2009 and €326 million in 2010). |
S-12
| | | | | | | | | | | | | | | | | | | | | | | | | | Consolidated subsidiaries | | | (M€) | | | | Europe | | | Africa | | | Americas | | | Middle
East | | | Asia | | | Total | | Year ended December 31, 2007 | | | | | | | | | | | | | | | | | | | | | Revenues | | Non-Group sales | | 3,715 | | | 2,497 | | | 1,869 | | | 1,180 | | | 2,150 | | | 11,411 | | | | Group sales | | 5,484 | | | 9,724 | | | 417 | | | 321 | | | 558 | | | 16,504 | | Total Revenues | | 9,199 | | | 12,221 | | | 2,286 | | | 1,501 | | | 2,708 | | | 27,915 | | Production costs | | (1,102 | ) | | (906 | ) | | (248 | ) | | (192 | ) | | (240 | ) | | (2,688 | ) | Exploration expenses | | (113 | ) | | (480 | ) | | (145 | ) | | (9 | ) | | (129 | ) | | (876 | ) | Depreciation, depletion and amortization and valuation allowances | | (1,287 | ) | | (932 | ) | | (379 | ) | | (318 | ) | | (395 | ) | | (3,311 | ) | Other expenses(1) | | (244 | ) | | (1,238 | ) | | (544 | ) | | (273 | ) | | (50 | ) | | (2,349 | ) | Pre-tax income from producing activities | | 6,453 | | | 8,665 | | | 970 | | | 709 | | | 1,894 | | | 18,691 | | Income tax | | (4,180 | ) | | (5,772 | ) | | (576 | ) | | (421 | ) | | (934 | ) | | (11,883 | ) | Results of oil and gas producing activities | | 2,273 | | | 2,893 | | | 394 | | | 288 | | | 960 | | | 6,808 | | | | | | | | | | Year ended December 31, 2008 | | | | | | | | | | | | | | | | | | | | | Revenues | | Non-Group sales | | 4,521 | | | 2,930 | | | 707 | | | 1,558 | | | 2,819 | | | 12,535 | | | | Group sales | | 6,310 | | | 11,425 | | | 360 | | | 409 | | | 626 | | | 19,130 | | Total Revenues | | 10,831 | | | 14,355 | | | 1,067 | | | 1,967 | | | 3,445 | | | 31,665 | | Production costs | | (1,280 | ) | | (1,055 | ) | | (213 | ) | | (249 | ) | | (263 | ) | | (3,060 | ) | Exploration expenses | | (185 | ) | | (209 | ) | | (130 | ) | | (4 | ) | | (236 | ) | | (764 | ) | Depreciation, depletion and amortization and valuation allowances | | (1,266 | ) | | (1,195 | ) | | (318 | ) | | (364 | ) | | (471 | ) | | (3,614 | ) | Other expenses(1) | | (260 | ) | | (1,214 | ) | | (225 | ) | | (357 | ) | | (60 | ) | | (2,116 | ) | Pre-tax income from producing activities | | 7,840 | | | 10,682 | | | 181 | | | 993 | | | 2,415 | | | 22,111 | | Income tax | | (5,376 | ) | | (7,160 | ) | | (109 | ) | | (481 | ) | | (1,212 | ) | | (14,338 | ) | Results of oil and gas producing activities | | 2,464 | | | 3,522 | | | 72 | | | 512 | | | 1,203 | | | 7,773 | | | | | | | | | | Year ended December 31, 2009 | | | | | | | | | | | | | | | | | | | | | Revenues | | Non-Group sales | | 2,499 | | | 1,994 | | | 583 | | | 859 | | | 1,926 | | | 7,861 | | | | Group sales | | 4,728 | | | 7,423 | | | 310 | | | 556 | | | 597 | | | 13,614 | | Total Revenues | | 7,227 | | | 9,417 | | | 893 | | | 1,415 | | | 2,523 | | | 21,475 | | Production costs | | (1,155 | ) | | (1,122 | ) | | (193 | ) | | (204 | ) | | (243 | ) | | (2,917 | ) | Exploration expenses | | (160 | ) | | (265 | ) | | (121 | ) | | (81 | ) | | (70 | ) | | (697 | ) | Depreciation, depletion and amortization and valuation allowances | | (1,489 | ) | | (1,471 | ) | | (262 | ) | | (314 | ) | | (613 | ) | | (4,149 | ) | Other expenses(1) | | (261 | ) | | (895 | ) | | (181 | ) | | (170 | ) | | (56 | ) | | (1,563 | ) | Pre-tax income from producing activities | | 4,162 | | | 5,664 | | | 136 | | | 646 | | | 1,541 | | | 12,149 | | Income tax | | (2,948 | ) | | (3,427 | ) | | (103 | ) | | (309 | ) | | (747 | ) | | (7,534 | ) | Results of oil and gas producing activities | | 1,214 | | | 2,237 | | | 33 | | | 337 | | | 794 | | | 4,615 | | | | | | | Group’s share of equity affiliates’ results of oil and gas producing activities | | | | | | | | | | | | | | | | | | | | | Year ended December 31, 2007 | | — | | | 95 | | | — | | | 179 | | | — | | | 274 | | Year ended December 31, 2008 | | — | | | 49 | | | 245 | | | 287 | | | — | | | 581 | | (1) Including production taxes and IAS 37 accretion expense (€169 million in 2007,€223 million in 2008 and€271 million in 2009). | | | | | | | Equity affiliates | | | (M€) | | | | Europe | | | Africa | | | Americas | | | Middle
East | | | Asia | | | Total | | Year ended December 31, 2009 | | | | | | | | | | | | | | | | | | | | | Revenues | | Non-Group sales | | — | | | 203 | | | 528 | | | 231 | | | — | | | 962 | | | | Group sales | | — | | | — | | | — | | | 3,382 | | | — | | | 3,382 | | Total Revenues | | — | | | 203 | | | 528 | | | 3,613 | | | — | | | 4,344 | | Production costs | | — | | | (31 | ) | | (41 | ) | | (271 | ) | | — | | | (343 | ) | Exploration expenses | | — | | | — | | | (17 | ) | | — | | | — | | | (17 | ) | Depreciation, depletion and amortization and valuation allowances | | — | | | (42 | ) | | (73 | ) | | (247 | ) | | — | | | (362 | ) | Other expenses | | — | | | (9 | ) | | (205 | ) | | (2,800 | ) | | — | | | (3,014 | ) | Pre-tax income from producing activities | | — | | | 121 | | | 192 | | | 295 | | | — | | | 608 | | Income tax | | — | | | (93 | ) | | (74 | ) | | (101 | ) | | — | | | (268 | ) | Results of oil and gas producing activities | | — | | | 28 | | | 118 | | | 194 | | | — | | | 340 | |
| | | | | | | | | | | | | | | | | | | | | | | | | | | | | Equity affiliates | | | | | | | | | | | | | | Middle
| | | | | | | | | (in million euros) | | Europe | | | Africa | | | Americas | | | East | | | Asia | | | Total | | Group’s share of results of oil and gas producing activities | | | | | | | | | | | | | | | | | | | | | | | | | | 2008 | | | — | | | | 49 | | | | 245 | | | | 287 | | | | — | | | | 581 | | | | | | | | | | | | | | | | | | | | | | | | | | | | 2009 | | | | | | | | | | | | | | | | | | | | | | | | | | | | | | | | | | | | | | | | | | | | | | | | | | | | Non-Group sales | | | — | | | | 203 | | | | 528 | | | | 231 | | | | — | | | | 962 | | | Group sales | | | — | | | | — | | | | — | | | | 3,382 | | | | — | | | | 3,382 | | Total Revenues | | | — | | | | 203 | | | | 528 | | | | 3,613 | | | | — | | | | 4,344 | | | Production costs | | | — | | | | (31 | ) | | | (41 | ) | | | (271 | ) | | | — | | | | (343 | ) | | Exploration expenses | | | — | | | | — | | | | (17 | ) | | | — | | | | — | | | | (17 | ) | | Depreciation, depletion and amortization and valuation allowances | | | — | | | | (42 | ) | | | (73 | ) | | | (247 | ) | | | — | | | | (362 | ) | | Other expenses | | | — | | | | (9 | ) | | | (205 | ) | | | (2,800 | ) | | | — | | | | (3,014 | ) | Pre-tax income from producing activities | | | — | | | | 121 | | | | 192 | | | | 295 | | | | — | | | | 608 | | | Income tax | | | — | | | | (93 | ) | | | (74 | ) | | | (101 | ) | | | — | | | | (268 | ) | Results of oil and gas producing activities | | | — | | | | 28 | | | | 118 | | | | 194 | | | | — | | | | 340 | | | | | | | | | | | | | | | | | | | | | | | | | | | | 2010 | | | | | | | | | | | | | | | | | | | | | | | | | | | | | | | | | | | | | | | | | | | | | | | | | | | | Non-Group sales | | | — | | | | 148 | | | | 120 | | | | 596 | | | | — | | | | 864 | | | Group sales | | | — | | | | 3 | | | | 565 | | | | 4,646 | | | | — | | | | 5,214 | | | | | | | | | | | | | | | | | | | | | | | | | | | | Total Revenues | | | — | | | | 151 | | | | 685 | | | | 5,242 | | | | — | | | | 6,078 | | | | | | | | | | | | | | | | | | | | | | | | | | | | | Production costs | | | — | | | | (44 | ) | | | (53 | ) | | | (195 | ) | | | (1 | ) | | | (293 | ) | | Exploration expenses | | | — | | | | (7 | ) | | | (23 | ) | | | — | | | | — | | | | (30 | ) | | Depreciation, depletion and amortization and valuation allowances | | | — | | | | (44 | ) | | | (89 | ) | | | (259 | ) | | | — | | | | (392 | ) | | Other expenses | | | — | | | | — | | | | (268 | ) | | | (4,034 | ) | | | — | | | | (4,302 | ) | | | | | | | | | | | | | | | | | | | | | | | | | | | Pre-tax income from producing activities | | | — | | | | 56 | | | | 252 | | | | 754 | | | | (1 | ) | | | 1,061 | | | | | | | | | | | | | | | | | | | | | | | | | | | | | Income tax | | | — | | | | — | | | | (44 | ) | | | (142 | ) | | | — | | | | (186 | ) | | | | | | | | | | | | | | | | | | | | | | | | | | | Results of oil and gas producing activities | | | — | | | | 56 | | | | 208 | | | | 612 | | | | (1 | ) | | | 875 | | | | | | | | | | | | | | | | | | | | | | | | | | | |
S-13
COSTS INCURRED IN OIL AND GAS PROPERTY ACQUISITION, EXPLORATION AND DEVELOPMENT ACTIVITIES The following tables set forth the costs incurred in the Group’s oil and gas property acquisition, exploration and development activities, including both capitalized and expensed amounts. They do not include costs incurred related to oil and gas transportation and LNG liquefaction and transportation activities. | | | | | | | | | | | | | | | | Consolidated Subsidiaries | | (M€) | | Europe | | Africa | | Americas | | Middle
East | | Asia | | Total | Year ended December 31, 2007 | | | | | | | | | | | | | Proved property acquisition | | — | | 50 | | — | | 7 | | 4 | | 61 | Unproved property acquisition | | — | | 265 | | 9 | | 10 | | 18 | | 302 | Exploration costs | | 230 | | 586 | | 126 | | 9 | | 244 | | 1,195 | Development costs(1) | | 1,762 | | 2,853 | | 615 | | 320 | | 1,275 | | 6,825 | Total cost incurred | | 1,992 | | 3,754 | | 750 | | 346 | | 1,541 | | 8,383 | | | | | | | | Year ended December 31, 2008 | | | | | | | | | | | | | Proved property acquisition | | 269 | | 78 | | — | | 8 | | 18 | | 373 | Unproved property acquisition | | 24 | | 143 | | 22 | | 5 | | 3 | | 197 | Exploration costs | | 228 | | 493 | | 155 | | 11 | | 312 | | 1,199 | Development costs(1) | | 2,035 | | 3,121 | | 408 | | 281 | | 1,596 | | 7,441 | Total cost incurred | | 2,556 | | 3,835 | | 585 | | 305 | | 1,929 | | 9,210 | | | | | | | | Year ended December 31, 2009 | | | | | | | | | | | | | Proved property acquisition | | 71 | | 45 | | 1,551 | | 105 | | — | | 1,772 | Unproved property acquisition | | 26 | | 8 | | 403 | | — | | 21 | | 458 | Exploration costs | | 284 | | 475 | | 222 | | 87 | | 123 | | 1,191 | Development costs(1) | | 1,658 | | 3,288 | | 618 | | 250 | | 1,852 | | 7,666 | Total cost incurred | | 2,039 | | 3,816 | | 2,794 | | 442 | | 1,996 | | 11,087 | | | | Group’s share of equity affiliates’ costs of property acquisition, exploration and development | | | | | Year ended December 31, 2007 | | — | | 48 | | — | | 599 | | — | | 647 | Year ended December 31, 2008 | | — | | 360 | | 85 | | 527 | | — | | 972 | | | | Equity affiliates | | (M€) | | Europe | | Africa | | Americas | | Middle
East | | Asia | | Total | Year ended December 31, 2009 | | | | | | | | | | | | | Proved property acquisition | | — | | — | | — | | — | | — | | — | Unproved property acquisition | | — | | — | | — | | — | | — | | — | Exploration costs | | — | | — | | 22 | | 3 | | — | | 25 | Development costs(1) | | — | | 28 | | 93 | | 293 | | 23 | | 437 | Total cost incurred | | — | | 28 | | 115 | | 296 | | 23 | | 462 |
| | | | | | | | | | | | | | | | | | | | | | | | | | | | | Consolidated subsidiaries | | | | | | | | | | | | | | Middle
| | | | | | | | | (in million euros) | | Europe | | | Africa | | | Americas | | | East | | | Asia | | | Total | | 2008 | | | | | | | | | | | | | | | | | | | | | | | | | | Proved property acquisition | | | 269 | | | | 78 | | | | — | | | | 8 | | | | 18 | | | | 373 | | | Unproved property acquisition | | | 24 | | | | 143 | | | | 22 | | | | 5 | | | | 3 | | | | 197 | | | Exploration costs | | | 228 | | | | 493 | | | | 155 | | | | 11 | | | | 312 | | | | 1,199 | | Development costs(a) | | | 2,035 | | | | 3,121 | | | | 408 | | | | 281 | | | | 1,596 | | | | 7,441 | | Total cost incurred | | | 2,556 | | | | 3,835 | | | | 585 | | | | 305 | | | | 1,929 | | | | 9,210 | | 2009 | | | | | | | | | | | | | | | | | | | | | | | | | | Proved property acquisition | | | 71 | | | | 45 | | | | 1,551 | | | | 105 | | | | — | | | | 1,772 | | | Unproved property acquisition | | | 26 | | | | 8 | | | | 403 | | | | — | | | | 21 | | | | 458 | | | Exploration costs | | | 284 | | | | 475 | | | | 222 | | | | 87 | | | | 123 | | | | 1,191 | | Development costs(a) | | | 1,658 | | | | 3,288 | | | | 618 | | | | 250 | | | | 1,852 | | | | 7,666 | | Total cost incurred | | | 2,039 | | | | 3,816 | | | | 2,794 | | | | 442 | | | | 1,996 | | | | 11,087 | | 2010 | | | | | | | | | | | | | | | | | | | | | | | | | | Proved property acquisition | | | 162 | | | | 137 | | | | 26 | | | | 139 | | | | 21 | | | | 485 | | | Unproved property acquisition | | | 5 | | | | 124 | | | | 1,186 | | | | 8 | | | | 619 | | | | 1,942 | | | Exploration costs | | | 361 | | | | 407 | | | | 276 | | | | 17 | | | | 250 | | | | 1,311 | | Development costs(a) | | | 1,565 | | | | 3,105 | | | | 718 | | | | 247 | | | | 2,007 | | | | 7,642 | | | | | | | | | | | | | | | | | | | | | | | | | | | | Total cost incurred | | | 2,093 | | | | 3,773 | | | | 2,206 | | | | 411 | | | | 2,897 | | | | 11,380 | | | | | | | | | | | | | | | | | | | | | | | | | | | |
| | | | | | | | | | | | | | | | | | | | | | | | | | | Group’s share of costs of property acquisition, exploration and development | | Equity affiliates | | | | | | | | | | | | | | Middle
| | | | | | | | | (in million euros) | | Europe | | | Africa | | | Americas | | | East | | | Asia | | | Total | | 2008 | | | — | | | | 360 | | | | 85 | | | | 527 | | | | — | | | | 972 | | | | | | | | | | | | | | | | | | | | | | | | | | | | 2009 | | | | | | | | | | | | | | | | | | | | | | | | | | Proved property acquisition | | | — | | | | — | | | | — | | | | — | | | | — | | | | — | | | Unproved property acquisition | | | — | | | | — | | | | — | | | | — | | | | — | | | | — | | | Exploration costs | | | — | | | | — | | | | 22 | | | | 3 | | | | — | | | | 25 | | Development costs(a) | | | — | | | | 28 | | | | 93 | | | | 293 | | | | 23 | | | | 437 | | Total cost incurred | | | — | | | | 28 | | | | 115 | | | | 296 | | | | 23 | | | | 462 | | 2010 | | | | | | | | | | | | | | | | | | | | | | | | | | Proved property acquisition | | | — | | | | — | | | | — | | | | — | | | | — | | | | — | | | Unproved property acquisition | | | — | | | | — | | | | — | | | | — | | | | — | | | | — | | | Exploration costs | | | — | | | | 4 | | | | 30 | | | | 4 | | | | — | | | | 38 | | Development costs(a) | | | — | | | | 20 | | | | 99 | | | | 476 | | | | 73 | | | | 668 | | | | | | | | | | | | | | | | | | | | | | | | | | | | Total cost incurred | | | — | | | | 24 | | | | 129 | | | | 480 | | | | 73 | | | | 706 | | | | | | | | | | | | | | | | | | | | | | | | | | | |
(1) | | | | (a) | | Including asset retirement costs capitalized during the year and any gains or losses recognized upon settlement of asset retirement obligation during the year. |
S-14
CAPITALIZED COSTCOSTS RELATED TO OIL AND GAS PRODUCING ACTIVITIES The following tables do not include capitalized costcosts related to oil and gas transportation and LNG liquefaction and transportation activities. | | | | | | | | | | | | | | | | | | | | | | | | | | | | | Consolidated subsidiaries | | | | | | | | | | | | | | Middle
| | | | | | | | | (in million euros) | | Europe | | | Africa | | | Americas | | | East | | | Asia | | | Total | | As of December 31, 2008 | | | | | | | | | | | | | | | | | | | | | | | | | | Proved properties | | | 26,030 | | | | 25,136 | | | | 4,508 | | | | 4,824 | | | | 8,836 | | | | 69,334 | | | Unproved properties | | | 132 | | | | 1,145 | | | | 204 | | | | 25 | | | | 410 | | | | 1,916 | | Total capitalized costs | | | 26,162 | | | | 26,281 | | | | 4,712 | | | | 4,849 | | | | 9,246 | | | | 71,250 | | | Accumulated depreciation, depletion and amortization | | | (18,382 | ) | | | (12,339 | ) | | | (2,051 | ) | | | (3,420 | ) | | | (2,598 | ) | | | (38,790 | ) | Net capitalized costs | | | 7,780 | | | | 13,942 | | | | 2,661 | | | | 1,429 | | | | 6,648 | | | | 32,460 | | | | | | | | | | | | | | | | | | | | | | | | | | | | As of December 31, 2009 | | | | | | | | | | | | | | | | | | | | | | | | | | Proved properties | | | 30,613 | | | | 27,557 | | | | 7,123 | | | | 5,148 | | | | 10,102 | | | | 80,543 | | | Unproved properties | | | 337 | | | | 1,138 | | | | 839 | | | | 30 | | | | 555 | | | | 2,899 | | Total capitalized costs | | | 30,950 | | | | 28,695 | | | | 7,962 | | | | 5,178 | | | | 10,657 | | | | 83,442 | | | Accumulated depreciation, depletion and amortization | | | (21,870 | ) | | | (13,510 | ) | | | (2,214 | ) | | | (3,325 | ) | | | (3,085 | ) | | | (44,004 | ) | Net capitalized costs | | | 9,080 | | | | 15,185 | | | | 5,748 | | | | 1,853 | | | | 7,572 | | | | 39,438 | | | | | | | | | | | | | | | | | | | | | | | | | | | | As of December 31, 2010 | | | | | | | | | | | | | | | | | | | | | | | | | | Proved properties | | | 31,735 | | | | 32,494 | | | | 7,588 | | | | 5,715 | | | | 12,750 | | | | 90,282 | | | Unproved properties | | | 402 | | | | 1,458 | | | | 2,142 | | | | 49 | | | | 1,433 | | | | 5,484 | | Total capitalized costs | | | 32,137 | | | | 33,952 | | | | 9,730 | | | | 5,764 | | | | 14,183 | | | | 95,766 | | | Accumulated depreciation, depletion and amortization | | | (23,006 | ) | | | (16,716 | ) | | | (2,302 | ) | | | (3,849 | ) | | | (4,092 | ) | | | (49,965 | ) | | | | | | | | | | | | | | | | | | | | | | | | | | | Net capitalized costs | | | 9,131 | | | | 17,236 | | | | 7,428 | | | | 1,915 | | | | 10,091 | | | | 45,801 | | | | | | | | | | | | | | | | | | | | | | | | | | | |
| | | | | | | | | | | | | | | | | | | | | | | | | | | Group’s share of net capitalized costs | | Equity affiliates | | | | | | | | | | | | | | Middle
| | | | | | | | | (in million euros) | | Europe | | | Africa | | | Americas | | | East | | | Asia | | | Total | | | As of December 31, 2008 | | | — | | | | 403 | | | | 288 | | | | 638 | | | | — | | | | 1,329 | | | | | | | | | | | | | | | | | | | | | | | | | | | | As of December 31, 2009 | | | | | | | | | | | | | | | | | | | | | | | | | | Proved properties | | | — | | | | 610 | | | | 726 | | | | 2,404 | | | | — | | | | 3,740 | | | Unproved properties | | | — | | | | — | | | | 135 | | | | — | | | | 62 | | | | 197 | | Total capitalized costs | | | — | | | | 610 | | | | 861 | | | | 2,404 | | | | 62 | | | | 3,937 | | | Accumulated depreciation, depletion and amortization | | | — | | | | (387 | ) | | | (171 | ) | | | (1,723 | ) | | | — | | | | (2,281 | ) | Net capitalized costs | | | — | | | | 223 | | | | 690 | | | | 681 | | | | 62 | | | | 1,656 | | | | | | | | | | | | | | | | | | | | | | | | | | | | As of December 31, 2010 | | | | | | | | | | | | | | | | | | | | | | | | | | Proved properties | | | — | | | | 639 | | | | 887 | | | | 3,110 | | | | — | | | | 4,636 | | | Unproved properties | | | — | | | | 25 | | | | 168 | | | | — | | | | 138 | | | | 331 | | Total capitalized costs | | | — | | | | 664 | | | | 1,055 | | | | 3,110 | | | | 138 | | | | 4,967 | | | Accumulated depreciation, depletion and amortization | | | — | | | | (462 | ) | | | (307 | ) | | | (2,029 | ) | | | — | | | | (2,798 | ) | | | | | | | | | | | | | | | | | | | | | | | | | | | Net capitalized costs | | | — | | | | 202 | | | | 748 | | | | 1,081 | | | | 138 | | | | 2,169 | | | | | | | | | | | | | | | | | | | | | | | | | | | |
S-15
| | | | | | | | | | | | | | | | | | | | | | Consolidated Subsidiaries | | | (M€) | | Europe | | | Africa | | | Americas | | | Middle
East | | | Asia | | | Total | | As of December 31, 2007 | | | | | | | | | | | | | | | | | | | Proved properties | | 29,263 | | | 20,035 | | | 4,032 | | | 4,266 | | | 6,951 | | | 64,547 | | Unproved properties | | 215 | | | 993 | | | 153 | | | 12 | | | 395 | | | 1,768 | | Total capitalized costs | | 29,478 | | | 21,028 | | | 4,185 | | | 4,278 | | | 7,346 | | | 66,315 | | Accumulated depreciation, depletion and amortization | | (21,092 | ) | | (10,484 | ) | | (1,683 | ) | | (2,861 | ) | | (2,005 | ) | | (38,125 | ) | Net capitalized costs | | 8,386 | | | 10,544 | | | 2,502 | | | 1,417 | | | 5,341 | | | 28,190 | | As of December 31, 2008 | | | | | | | | | | | | | | | | | | | Proved properties | | 26,030 | | | 25,136 | | | 4,508 | | | 4,824 | | | 8,836 | | | 69,334 | | Unproved properties | | 132 | | | 1,145 | | | 204 | | | 25 | | | 410 | | | 1,916 | | Total capitalized costs | | 26,162 | | | 26,281 | | | 4,712 | | | 4,849 | | | 9,246 | | | 71,250 | | Accumulated depreciation, depletion and amortization | | (18,382 | ) | | (12,339 | ) | | (2,051 | ) | | (3,420 | ) | | (2,598 | ) | | (38,790 | ) | Net capitalized costs | | 7,780 | | | 13,942 | | | 2,661 | | | 1,429 | | | 6,648 | | | 32,460 | | As of December 31, 2009 | | | | | | | | | | | | | | | | | | | Proved properties | | 30,613 | | | 27,557 | | | 7,123 | | | 5,148 | | | 10,102 | | | 80,543 | | Unproved properties | | 337 | | | 1,138 | | | 839 | | | 30 | | | 555 | | | 2,899 | | Total capitalized costs | | 30,950 | | | 28,695 | | | 7,962 | | | 5,178 | | | 10,657 | | | 83,442 | | Accumulated depreciation, depletion and amortization | | (21,870 | ) | | (13,510 | ) | | (2,214 | ) | | (3,325 | ) | | (3,085 | ) | | (44,004 | ) | Net capitalized costs | | 9,080 | | | 15,185 | | | 5,748 | | | 1,853 | | | 7,572 | | | 39,438 | | | | | | | | | Group’s share of equity affiliates’ net capitalized costs(1) | | | | | | | | | | | | | | | | | | | As of December 31, 2007 | | — | | | 233 | | | — | | | 403 | | | — | | | 636 | | As of December 31, 2008 | | — | | | 403 | | | 288 | | | 638 | | | — | | | 1,329 | | | | | Equity affiliates | | | (M€) | | Europe | | | Africa | | | Americas | | | Middle
East | | | Asia | | | Total | | As of December 31, 2009 | | | | | | | | | | | | | | | | | | | Proved properties | | — | | | 610 | | | 726 | | | 2,404 | | | — | | | 3,740 | | Unproved properties | | — | | | — | | | 135 | | | — | | | 62 | | | 197 | | Total capitalized costs | | — | | | 610 | | | 861 | | | 2,404 | | | 62 | | | 3,937 | | Accumulated depreciation, depletion and amortization | | — | | | (387 | ) | | (171 | ) | | (1,723 | ) | | — | | | (2,281 | ) | Net capitalized costs | | — | | | 223 | | | 690 | | | 681 | | | 62 | | | 1,656 | |
(1) | Capitalized costs previously reported for equity affiliates have been restated to be consistent with the methods used for consolidated subsidiaries |
STANDARDIZED MEASURE OF
DISCOUNTED FUTURE NET CASH FLOWS (EXCLUDING TRANSPORTATION) The standardized measure of discounted future net cash flows relating to proved oil bitumen and gas reserve quantities was developed as follows: 1. | | | • | Estimates of proved reserves and the corresponding production profiles are based on existing technical and economic conditions; |
2. | | • | The estimated future cash flows are determined based on prices used in estimating the Group’s proved oil and gas reserves; |
3. | | • | The future cash flows incorporate estimated production costs (including production taxes), future development costs and asset retirement costs. All |
| cost estimates are based on year-end technical and economic conditions; |
4. | | • | Future income taxes are computed by applying the year-end statutory tax rate to future net cash flows after consideration of permanent differences and future income tax credits; and |
5. | | • | Future net cash flows are discounted at a standard discount rate of 10%.10 percent. |
These principles applied are those required by ASC 932 and do not reflect the expectations of real revenues from these reserves, nor their present value; hence, they do not constitute criteria for investment decisions. An estimate of the fair value of reserves should also take into account, among other things, the recovery of reserves not presently classified as proved, anticipated future changes in prices and costs and a discount factor more representative of the time value of money and the risks inherent in reserves estimates.
S-16
| | | | | | | | | | | | | | | | | | | | | | Consolidated Subsidiaries | | | (M€) | | Europe | | | Africa | | | Americas | | | Middle
East | | | Asia | | | Total | | As of December 31, 2007 | | | | | | | | | | | | | | | | | | | Future cash inflows | | 87,540 | | | 157,199 | | | 15,000 | | | 13,377 | | | 46,758 | | | 319,874 | | Future production costs | | (12,897 | ) | | (23,109 | ) | | (6,702 | ) | | (3,342 | ) | | (5,519 | ) | | (51,569 | ) | Future development costs | | (10,764 | ) | | (19,012 | ) | | (2,157 | ) | | (693 | ) | | (7,541 | ) | | (40,167 | ) | Future income taxes | | (43,851 | ) | | (75,557 | ) | | (1,475 | ) | | (3,460 | ) | | (11,436 | ) | | (135,779 | ) | Future net cash flows, after income taxes | | 20,028 | | | 39,521 | | | 4,666 | | | 5,882 | | | 22,262 | | | 92,359 | | Discount at 10% | | (8,070 | ) | | (17,474 | ) | | (2,087 | ) | | (2,673 | ) | | (13,591 | ) | | (43,895 | ) | Standardized measure of discounted future net cash flows | | 11,958 | | | 22,047 | | | 2,579 | | | 3,209 | | | 8,671 | | | 48,464 | | As of December 31, 2008 | | | | | | | | | | | | | | | | | | | Future cash inflows | | 42,749 | | | 67,761 | | | 7,963 | | | 7,047 | | | 19,745 | | | 145,265 | | Future production costs | | (8,593 | ) | | (15,372 | ) | | (4,040 | ) | | (1,942 | ) | | (5,224 | ) | | (35,171 | ) | Future development costs | | (10,423 | ) | | (21,594 | ) | | (1,863 | ) | | (733 | ) | | (7,497 | ) | | (42,110 | ) | Future income taxes | | (15,651 | ) | | (14,571 | ) | | (367 | ) | | (1,577 | ) | | (2,545 | ) | | (34,711 | ) | Future net cash flows, after income taxes | | 8,082 | | | 16,224 | | | 1,693 | | | 2,795 | | | 4,479 | | | 33,273 | | Discount at 10% | | (3,645 | ) | | (8,144 | ) | | (715 | ) | | (1,333 | ) | | (3,450 | ) | | (17,287 | ) | Standardized measure of discounted future net cash flows | | 4,437 | | | 8,080 | | | 978 | | | 1,462 | | | 1,029 | | | 15,986 | | As of December 31, 2009 | | | | | | | | | | | | | | | | | | | Future cash inflows | | 50,580 | | | 107,679 | | | 18,804 | | | 9,013 | | | 32,004 | | | 218,080 | | Future production costs | | (11,373 | ) | | (23,253 | ) | | (8,286 | ) | | (2,831 | ) | | (6,996 | ) | | (52,739 | ) | Future development costs | | (12,795 | ) | | (21,375 | ) | | (5,728 | ) | | (698 | ) | | (6,572 | ) | | (47,168 | ) | Future income taxes | | (17,126 | ) | | (36,286 | ) | | (1,293 | ) | | (2,041 | ) | | (5,325 | ) | | (62,071 | ) | Future net cash flows, after income taxes | | 9,286 | | | 26,765 | | | 3,497 | | | 3,443 | | | 13,111 | | | 56,102 | | Discount at 10% | | (3,939 | ) | | (13,882 | ) | | (2,696 | ) | | (1,558 | ) | | (8,225 | ) | | (30,300 | ) | Standardized measure of discounted future net cash flows | | 5,347 | | | 12,883 | | | 801 | | | 1,885 | | | 4,886 | | | 25,802 | | | | | | | | | | Minority interests in future net cash flows as of | | | | | | | | | | | | | | | | | | | December 31, 2007 | | 407 | | | 654 | | | — | | | — | | | — | | | 1,061 | | December 31, 2008 | | 217 | | | (50 | ) | | — | | | — | | | — | | | 167 | | December 31, 2009 | | 212 | | | 60 | | | — | | | — | | | — | | | 272 | | | | Group’s share of equity affiliates’ future net cash flows as of | | December 31, 2007 | | — | | | 526 | | | 2,998 | | | 6,554 | | | — | | | 10,078 | | December 31, 2008 | | — | | | 418 | | | 608 | | | 4,275 | | | — | | | 5,301 | | | | | Equity affiliates | | | (M€) | | Europe | | | Africa | | | Americas | | | Middle
East | | | Asia | | | Total | | As of December 31, 2009 | | | | | | | | | | | | | | | | | | | Future cash inflows | | — | | | 1,432 | | | 16,750 | | | 48,486 | | | — | | | 66,668 | | Future production costs | | — | | | (624 | ) | | (6,993 | ) | | (30,739 | ) | | — | | | (38,356 | ) | Future development costs | | — | | | (26 | ) | | (1,924 | ) | | (3,891 | ) | | — | | | (5,841 | ) | Future income taxes | | — | | | (245 | ) | | (3,650 | ) | | (1,843 | ) | | — | | | (5,738 | ) | Future net cash flows, after income taxes | | — | | | 537 | | | 4,183 | | | 12,013 | | | — | | | 16,733 | | Discount at 10% | | — | | | (239 | ) | | (2,816 | ) | | (6,383 | ) | | — | | | (9,438 | ) | Standardized measure of discounted future net cash flows | | — | | | 298 | | | 1,367 | | | 5,630 | | | — | | | 7,295 | |
| | | | | | | | | | | | | | | | | | | | | | | | | | | | | Consolidated subsidiaries | | | | | | | | | | | | | | Middle
| | | | | | | | | (in million euros) | | Europe | | | Africa | | | Americas | | | East | | | Asia | | | Total | | As of December 31, 2008 | | | | | | | | | | | | | | | | | | | | | | | | | | Future cash inflows | | | 42,749 | | | | 67,761 | | | | 7,963 | | | | 7,047 | | | | 19,745 | | | | 145,265 | | | Future production costs | | | (8,593 | ) | | | (15,372 | ) | | | (4,040 | ) | | | (1,942 | ) | | | (5,224 | ) | | | (35,171 | ) | | Future development costs | | | (10,423 | ) | | | (21,594 | ) | | | (1,863 | ) | | | (733 | ) | | | (7,497 | ) | | | (42,110 | ) | | Future income taxes | | | (15,651 | ) | | | (14,571 | ) | | | (367 | ) | | | (1,577 | ) | | | (2,545 | ) | | | (34,711 | ) | | | | | | | | | | | | | | | | | | | | | | | | | | | Future net cash flows, after income taxes | | | 8,082 | | | | 16,224 | | | | 1,693 | | | | 2,795 | | | | 4,479 | | | | 33,273 | | | Discount at 10% | | | (3,645 | ) | | | (8,144 | ) | | | (715 | ) | | | (1,333 | ) | | | (3,450 | ) | | | (17,287 | ) | | | | | | | | | | | | | | | | | | | | | | | | | | | Standardized measure of discounted future net cash flows | | | 4,437 | | | | 8,080 | | | | 978 | | | | 1,462 | | | | 1,029 | | | | 15,986 | | | | | | | | | | | | | | | | | | | | | | | | | | | | As of December 31, 2009 | | | | | | | | | | | | | | | | | | | | | | | | | | Future cash inflows | | | 50,580 | | | | 107,679 | | | | 18,804 | | | | 9,013 | | | | 32,004 | | | | 218,080 | | | Future production costs | | | (11,373 | ) | | | (23,253 | ) | | | (8,286 | ) | | | (2,831 | ) | | | (6,996 | ) | | | (52,739 | ) | | Future development costs | | | (12,795 | ) | | | (21,375 | ) | | | (5,728 | ) | | | (698 | ) | | | (6,572 | ) | | | (47,168 | ) | | Future income taxes | | | (17,126 | ) | | | (36,286 | ) | | | (1,293 | ) | | | (2,041 | ) | | | (5,325 | ) | | | (62,071 | ) | | | | | | | | | | | | | | | | | | | | | | | | | | | Future net cash flows, after income taxes | | | 9,286 | | | | 26,765 | | | | 3,497 | | | | 3,443 | | | | 13,111 | | | | 56,102 | | | Discount at 10% | | | (3,939 | ) | | | (13,882 | ) | | | (2,696 | ) | | | (1,558 | ) | | | (8,225 | ) | | | (30,300 | ) | | | | | | | | | | | | | | | | | | | | | | | | | | | Standardized measure of discounted future net cash flows | | | 5,347 | | | | 12,883 | | | | 801 | | | | 1,885 | | | | 4,886 | | | | 25,802 | | | | | | | | | | | | | | | | | | | | | | | | | | | | As of December 31, 2010 | | | | | | | | | | | | | | | | | | | | | | | | | | Future cash inflows | | | 65,644 | | | | 142,085 | | | | 42,378 | | | | 14,777 | | | | 41,075 | | | | 305,959 | | | Future production costs | | | (16,143 | ) | | | (29,479 | ) | | | (19,477 | ) | | | (4,110 | ) | | | (6,476 | ) | | | (75,685 | ) | | Future development costs | | | (18,744 | ) | | | (25,587 | ) | | | (8,317 | ) | | | (3,788 | ) | | | (8,334 | ) | | | (64,770 | ) | | Future income taxes | | | (20,571 | ) | | | (51,390 | ) | | | (3,217 | ) | | | (2,541 | ) | | | (7,281 | ) | | | (85,000 | ) | | | | | | | | | | | | | | | | | | | | | | | | | | | Future net cash flows, after income taxes | | | 10,186 | | | | 35,629 | | | | 11,367 | | | | 4,338 | | | | 18,984 | | | | 80,504 | | | Discount at 10% | | | (5,182 | ) | | | (16,722 | ) | | | (8,667 | ) | | | (2,106 | ) | | | (11,794 | ) | | | (44,471 | ) | | | | | | | | | | | | | | | | | | | | | | | | | | | Standardized measure of discounted future net cash flows | | | 5,004 | | | | 18,907 | | | | 2,700 | | | | 2,232 | | | | 7,190 | | | | 36,033 | | | | | | | | | | | | | | | | | | | | | | | | | | | | Minority interests in future net cash flows as of | | | | | | | | | | | | | | | | | | | | | | | | | December 31, 2008 | | | 217 | | | | (50 | ) | | | — | | | | — | | | | — | | | | 167 | | | December 31, 2009 | | | 212 | | | | 60 | | | | — | | | | — | | | | — | | | | 272 | | | | | | | | | | | | | | | | | | | | | | | | | | | | As of December 31, 2010 | | | 273 | | | | 344 | | | | — | | | | — | | | | — | | | | 617 | | | | | | | | | | | | | | | | | | | | | | | | | | | |
S-17
| | | | | | | | | | | | | | | | | | | | | | | | | | | | | Equity affiliates | | | | | | | | | | | | | | Middle
| | | | | | | | | (in million euros) | | Europe | | | Africa | | | Americas | | | East | | | Asia | | | Total | | Group’s share of future net cash flows | | | | | | | | | | | | | | | | | | | | | | | | | | As of December 31, 2008 | | | — | | | | 418 | | | | 608 | | | | 4,275 | | | | — | | | | 5,301 | | | | | | | | | | | | | | | | | | | | | | | | | | | | As of December 31, 2009 | | | | | | | | | | | | | | | | | | | | | | | | | | Future cash inflows | | | — | | | | 1,432 | | | | 16,750 | | | | 48,486 | | | | — | | | | 66,668 | | | Future production costs | | | — | | | | (624 | ) | | | (6,993 | ) | | | (30,739 | ) | | | — | | | | (38,356 | ) | | Future development costs | | | — | | | | (26 | ) | | | (1,924 | ) | | | (3,891 | ) | | | — | | | | (5,841 | ) | | Future income taxes | | | — | | | | (245 | ) | | | (3,650 | ) | | | (1,843 | ) | | | — | | | | (5,738 | ) | | | | | | | | | | | | | | | | | | | | | | | | | | | Future net cash flows, after income taxes | | | — | | | | 537 | | | | 4,183 | | | | 12,013 | | | | — | | | | 16,733 | | | Discount at 10% | | | — | | | | (239 | ) | | | (2,816 | ) | | | (6,383 | ) | | | — | | | | (9,438 | ) | | | | | | | | | | | | | | | | | | | | | | | | | | | Standardized measure of discounted future net cash flows | | | — | | | | 298 | | | | 1,367 | | | | 5,630 | | | | — | | | | 7,295 | | | | | | | | | | | | | | | | | | | | | | | | | | | | As of December 31, 2010 | | | | | | | | | | | | | | | | | | | | | | | | | | Future cash inflows | | | — | | | | 1,814 | | | | 22,293 | | | | 59,472 | | | | — | | | | 83,579 | | | Future production costs | | | — | | | | (765 | ) | | | (8,666 | ) | | | (40,085 | ) | | | — | | | | (49,516 | ) | | Future development costs | | | — | | | | (26 | ) | | | (2,020 | ) | | | (3,006 | ) | | | — | | | | (5,052 | ) | | Future income taxes | | | — | | | | (349 | ) | | | (5,503 | ) | | | (2,390 | ) | | | — | | | | (8,242 | ) | | | | | | | | | | | | | | | | | | | | | | | | | | | Future net cash flows, after income taxes | | | — | | | | 674 | | | | 6,104 | | | | 13,991 | | | | — | | | | 20,769 | | | Discount at 10% | | | — | | | | (203 | ) | | | (3,946 | ) | | | (7,386 | ) | | | — | | | | (11,535 | ) | | | | | | | | | | | | | | | | | | | | | | | | | | | Standardized measure of discounted future net cash flows | | | — | | | | 471 | | | | 2,158 | | | | 6,605 | | | | — | | | | 9,234 | | | | | | | | | | | | | | | | | | | | | | | | | | | |
S-18
CHANGES IN THE STANDARDIZED MEASURE OF DISCOUNTED FUTURE NET CASH FLOWS | | | | | | | | | | | (M€) | | 2009 | | | 2008 | | | 2007 | | Consolidated subsidiaries | | | | | | | | | | Beginning of year | | 15,986 | | | 48,464 | | | 35,048 | | Sales and transfers, net of production costs | | (17,266 | ) | | (26,109 | ) | | (19,095 | ) | Net change in sales and transfer prices and in production costs and other expenses | | 35,738 | | | (81,358 | ) | | 56,678 | | Extensions, discoveries and improved recovery | | (267 | ) | | 556 | | | 2,895 | | Changes in estimated future development costs | | (4,847 | ) | | (2,227 | ) | | (6,491 | ) | Previously estimated development costs incurred during the year | | 7,552 | | | 6,960 | | | 6,581 | | Revisions of previous quantity estimates | | 164 | | | 2,693 | | | (6,521 | ) | Accretion of discount | | 1,599 | | | 4,846 | | | 3,505 | | Net change in income taxes | | (12,455 | ) | | 63,611 | | | (22,585 | ) | Purchases of reserves in place | | 230 | | | 50 | | | — | | Sales of reserves in place | | (632 | ) | | (1,500 | ) | | (1,551 | ) | End of year | | 25,802 | | | 15,986 | | | 48,464 | | | | | | Equity affiliates | | | | | | | | | | Beginning of year | | 5,301 | | | | | | | | Sales and transfers, net of production costs | | (987 | ) | | | | | | | Net change in sales and transfer prices and in production costs and other expenses | | 2,789 | | | | | | | | Extensions, discoveries and improved recovery | | 407 | | | | | | | | Changes in estimated future development costs | | (88 | ) | | | | | | | Previously estimated development costs incurred during the year | | 854 | | | | | | | | Revisions of previous quantity estimates | | (790 | ) | | | | | | | Accretion of discount | | 530 | | | | | | | | Net change in income taxes | | (721 | ) | | | | | | | Purchases of reserves in place | | — | | | | | | | | Sales of reserves in place | | — | | | | | | | | End of year | | 7,295 | | | | | | | |
| | | | | | | | | | | | | | | (in million euros) | | 2010 | | | 2009 | | | 2008 | | Consolidated subsidiaries | | | | | | | | | | | | | Beginning of year | | | 25,802 | | | | 15,986 | | | | 48,464 | | | Sales and transfers, net of production costs | | | (22,297 | ) | | | (17,266 | ) | | | (26,109 | ) | | Net change in sales and transfer prices and in production costs and other expenses | | | 30,390 | | | | 35,738 | | | | (81,358 | ) | | Extensions, discoveries and improved recovery | | | 716 | | | | (267 | ) | | | 556 | | | Changes in estimated future development costs | | | (7,245 | ) | | | (4,847 | ) | | | (2,227 | ) | | Previously estimated development costs incurred during the year | | | 7,896 | | | | 7,552 | | | | 6,960 | | | Revisions of previous quantity estimates | | | 5,523 | | | | 164 | | | | 2,693 | | | Accretion of discount | | | 2,580 | | | | 1,599 | | | | 4,846 | | | Net change in income taxes | | | (6,773 | ) | | | (12,455 | ) | | | 63,611 | | | Purchases of reserves in place | | | 442 | | | | 230 | | | | 50 | | | Sales of reserves in place | | | (1,001 | ) | | | (632 | ) | | | (1,500 | ) | | | | | | | | | | | | | | | End of year | | | 36,033 | | | | 25,802 | | | | 15,986 | | | | | | | | | | | | | | | |
| | | | | | | | | | | (in million euros) | | 2010 | | | 2009 | | Equity affiliates | | | | | | | | | Beginning of year | | | 7,295 | | | | 5,301 | | | Sales and transfers, net of production costs | | | (1,583 | ) | | | (987 | ) | | Net change in sales and transfer prices and in production costs and other expenses | | | 2,366 | | | | 2,789 | | | Extensions, discoveries and improved recovery | | | — | | | | 407 | | | Changes in estimated future development costs | | | 195 | | | | (88 | ) | | Previously estimated development costs incurred during the year | | | 651 | | | | 854 | | | Revisions of previous quantity estimates | | | 308 | | | | (790 | ) | | Accretion of discount | | | 730 | | | | 530 | | | Net change in income taxes | | | (728 | ) | | | (721 | ) | | Purchases of reserves in place | | | — | | | | — | | | Sales of reserves in place | | | — | | | | — | | | | | | | | | | | | End of year | | | 9,234 | | | | 7,295 | | | | | | | | | | | |
Net gas production, production prices and production costs | | | | | | | | | | | | | | | | | | | | | | | | | | | | | Consolidated subsidiaries | | | | | | | | | | | | | | Middle
| | | | | | | | | | | Europe | | | Africa | | | Americas | | | East | | | Asia | | | Total | | 2009 | | | | | | | | | | | | | | | | | | | | | | | | | Natural gas production available for sale (Mcf/d)(a) | | | 1,643 | | | | 480 | | | | 545 | | | | 297 | | | | 1,224 | | | | 4,189 | | Production prices(b) | | | | | | | | | | | | | | | | | | | | | | | | | | Oil (€/b) | | | 40.76 | | | | 40.77 | | | | 36.22 | | | | 39.94 | | | | 37.66 | | | | 40.38 | | | Bitumen (€/b) | | | — | | | | — | | | | 23.17 | | | | — | | | | — | | | | 23.17 | | | Natural gas (€/kcf) | | | 4.81 | | | | 1.33 | | | | 1.56 | | | | 0.72 | | | | 4.47 | | | | 3.70 | | Production costs per unit of production (€/boe)(c)(d) | | | | | | | | | | | | | | | | | | | | | | | | | | Total liquids and natural gas | | | 5.30 | | | | 4.35 | | | | 3.59 | | | | 3.86 | | | | 2.52 | | | | 4.30 | | | Bitumen | | | — | | | | — | | | | 25.45 | | | | — | | | | — | | | | 25.45 | | | | | | | | | | | | | | | | | | | | | | | | | | | |
S-19
| | | | | | | | | | | | | | | | Consolidated subsidiaries | | | | Europe | | Africa | | Americas | | Middle
East | | Asia | | Total | Year ended December 31, 2009 | | | | | | | | | | | | | Natural gas production available for sale (Mcf/d)(1) | | 1,643 | | 480 | | 545 | | 297 | | 1,224 | | 4,189 | Production prices(2) | | | | | | | | | | | | | Oil (€/b) | | 40.76 | | 40.77 | | 36.22 | | 39.94 | | 37.66 | | 40.38 | Bitumen (€/b) | | — | | — | | 23.17 | | — | | — | | 23.17 | Natural gas (€/kcf) | | 4.81 | | 1.33 | | 1.56 | | 0.72 | | 4.47 | | 3.70 | | | | | | | | Production costs per unit of production (€/boe)(3) | | | | | | | | | | | | | Total liquids and natural gas | | 5.16 | | 4.22 | | 3.43 | | 3.69 | | 2.42 | | 4.16 | Bitumen | | — | | — | | 25.45 | | — | | — | | 25.45 |
| | | | | | | | | | | | | | | | | | | | | | | | | | | | | Equity affiliates | | | | | | | | | | | | | | Middle
| | | | | | | | | | | Europe | | | Africa | | | Americas | | | East | | | Asia | | | Total | | 2009 | | | | | | | | | | | | | | | | | | | | | | | | | Natural gas production available for sale (Mcf/d)(a) | | | — | | | | — | | | | — | | | | 268 | | | | — | | | | 268 | | Production prices(b) | | | | | | | | | | | | | | | | | | | | | | | | | | Oil (€/b) | | | — | | | | 42.98 | | | | 33.14 | | | | 43.98 | | | | — | | | | 42.18 | | | Bitumen (€/b) | | | — | | | | — | | | | — | | | | | | | | — | | | | — | | | Natural gas (€/kcf) | | | — | | | | — | | | | — | | | | 3.53 | | | | — | | | | 3.53 | | Production costs per unit of production (€/boe)(c) | | | | | | | | | | | | | | | | | | | | | | | | | | Total liquids and natural gas | | | — | | | | 4.21 | | | | 2.24 | | | | 2.81 | | | | — | | | | 2.81 | | | Bitumen | | | — | | | | — | | | | — | | | | — | | | | — | | | | — | | | | | | | | | | | | | | | | | | | | | | | | | | | |
| | | | | | | | | | | | | | | | | | | | | | | | | | | | | Consolidated subsidiaries | | | | | | | | | | | | | | Middle
| | | | | | | | | | | Europe | | | Africa | | | Americas | | | East | | | Asia | | | Total | | 2010 | | | | | | | | | | | | | | | | | | | | | | | | | Natural gas production available for sale (Mcf/d)(a) | | | 1,603 | | | | 608 | | | | 732 | | | | 375 | | | | 1,234 | | | | 4,552 | | Production prices(b) | | | | | | | | | | | | | | | | | | | | | | | | | | Oil (€/b) | | | 55.70 | | | | 56.18 | | | | 45.28 | | | | 55.83 | | | | 52.33 | | | | 55.39 | | | Bitumen (€/b) | | | — | | | | — | | | | 33.19 | | | | — | | | | — | | | | 33.19 | | | Natural gas (€/kcf) | | | 5.17 | | | | 1.55 | | | | 1.83 | | | | 0.63 | | | | 5.67 | | | | 3.94 | | Production costs per unit of production (€/boe)(c) | | | | | | | | | | | | | | | | | | | | | | | | | | Total liquids and natural gas | | | 6.23 | | | | 4.53 | | | | 3.29 | | | | 4.82 | | | | 2.93 | | | | 4.72 | | | Bitumen | | | — | | | | — | | | | 17.49 | | | | — | | | | — | | | | 17.49 | | | | | | | | | | | | | | | | | | | | | | | | | | | |
| | | | | | | | | | | | | | | | | | | | | | | | | | | | | Equity affiliates | | | | | | | | | | | | | | Middle
| | | | | | | | | | | Europe | | | Africa | | | Americas | | | East | | | Asia | | | Total | | 2010 | | | | | | | | | | | | | | | | | | | | | | | | | Natural gas production available for sale (Mcf/d)(a) | | | — | | | | — | | | | — | | | | 650 | | | | — | | | | 650 | | Production prices(b) | | | | | | | | | | | | | | | | | | | | | | | | | | Oil (€/b) | | | — | | | | 53.96 | | | | 43.81 | | | | 57.03 | | | | — | | | | 54.95 | | | Bitumen (€/b) | | | — | | | | — | | | | — | | | | — | | | | — | | | | — | | | Natural gas (€/kcf) | | | — | | | | — | | | | — | | | | 2.30 | | | | — | | | | 2.30 | | Production costs per unit of production (€/boe)(c) | | | | | | | | | | | | | | | | | | | | | | | | | | Total liquids and natural gas | | | — | | | | 6.31 | | | | 2.76 | | | | 1.54 | | | | — | | | | 1.91 | | | Bitumen | | | — | | | | — | | | | — | | | | — | | | | — | | | | — | | | | | | | | | | | | | | | | | | | | | | | | | | | |
(1) | | | | (a) | | The reported volumes are different from those shown in the reserves table due to gas consumed in operations. |
(2)(b) | | The volumes used for calculation of the average sales prices are the ones sold from the Group’s own production. |
(3)(c) | | The volumes of liquids used for this computation are shown in the proved reserves tables of this report. The reported volumes for natural gas are different from those shown in the reserves table due to gas consumed in operations. | | (d) | | Production costs previously reported for consolidated subsidiaries have been restated. |
S-20 S-16
|
|
|
|