UNITED STATES
SECURITIES AND EXCHANGE COMMISSION
Washington, D.C. 20549
FormFORM 20-F
| ¨ | Registration statement pursuant to Section 12(b) or 12(g) of the Securities Exchange Act of 1934 |
or
| x | Annual report pursuant to Section 13 or 15(d) of the Securities Exchange Act of 1934 |
For the Fiscal Year Ended December 31, 20092012
or
| ¨ | Transition report pursuant to Section 13 or 15(d) of the Securities Exchange Act of 1934 |
For the transition period from/to
or
| ¨ | Shell company report pursuant to Section 13 or 15(d) of the Securities Exchange Act of 1934 |
Date of event requiring this shell company report:
Commission file number 000–12033
TELEFONAKTIEBOLAGET LM ERICSSON
(Exact Name of Registrant as Specified in Its Charter)
LM ERICSSON TELEPHONE COMPANY
(Translation of Registrant’s Name Into English)
Kingdom of Sweden
(Jurisdiction of Incorporation or Organization)
SE-164 83 Stockholm, Sweden
(Address of Principal Executive Offices)
Roland Hagman, Vice President Group Function Financial Control
Telephone: +46 8 719 53 80, Facsimile: +46 8 719 42 22
SE-164 83 Stockholm, Sweden
(Name, Telephone, E-mail and/or Facsimile Number and Address of Company Contact Person)
Securities registered or to be registered pursuant to Section 12(b) of the Act:
| | |
Title of Each Class | | Name of Each Exchange on Which Registered |
| American Depositary Shares (each representing one B share) | | The NASDAQ Stock Market LLC |
B Shares*Shares * | | The NASDAQ Stock Market LLC |
| * | Not for trading, but only in connection with the registration of the American Depositary Shares representing such B Shares pursuant to the requirements of the Securities and Exchange Commission |
Securities registered pursuant to Section 12(g) of the Act:
None
Securities for which there is a reporting obligation pursuant to Section 15(d) of the Act:
None
Indicate the number of outstanding shares of each of the issuer’s classes of capital or common stock as of the close of the period covered by the Annual Report:
| | | | |
B shares (SEK 5.00 nominal value) | | 3,011,595,752 | 3,043,295,752 | |
A shares (SEK 5.00 nominal value) | | | 261,755,983 | |
C shares (SEK 1.00 nominal value) | | | 0 | |
Indicate by check mark if the registrant is a well-seasoned issuer, as defined in Rule 405 of the Securities Act. Yes x �� No ¨
If this report is an annual or transition report, indicate by check mark if the registrant is not required to file reports pursuant to Section 13 or 15(d) of the Securities Exchange Act of 1934. Yes ¨ No x
Indicate by check mark whether the registrant: (1) has filed all reports required to be filed by Section 13 or 15(d) of the Securities Exchange Act of 1934 during the preceding 12 months (or for such shorter period that the registrant was required to file such reports), and (2) has been subject to such filing requirements for the past 90 days. Yes x No ¨
Indicate by check mark whether the registrant has submitted electronically and posted on its corporate Web site, if any, every Interactive Data File required to be submitted and posted pursuant to Rule 405 of Regulation S-T (§232.405 of this chapter) during the preceding 12 months (or for such shorter period that the registrant was required to submit and post such files). Yes ¨ No ¨
Indicate by check mark whether the registrant is a large accelerated filer, an accelerated filer, or a non-accelerated filer. See definition of “accelerated filer” and “large accelerated filer” in Rule 12b-2 of the Exchange Act.
x Large accelerated filer ¨ Accelerated filer ¨ Non-accelerated filer
Indicate by check mark which basis of accounting the registrant has used to prepare the financial statements included in this filing:
US GAAP ¨ International Financial Reporting Standards as issued by the International Accounting Standards Board x Other ¨
IndicateIf “Other” has been checked in response to the previous question, indicate by check mark which financial statement item the registrant has elected to follow. Item 17 x¨ Item 18 ¨
IndicateIf this is an annual report, indicate by check mark whether the registrant is a shell company (as defined in Rule 12b-2 of the Exchange Act). Yes ¨ No x
ERICSSON ANNUAL REPORT ON FORM 20-F 20092012
CONTENTS
ERICSSON ANNUAL REPORT ON FORM 20-F 20092012
FORM 20-F 20092012 CROSS REFERENCE TABLE
OurThis document comprises the English version of our Swedish Annual Report for 2012 and our Annual Report on Form 20-F consists offor the Swedish Annual Report for 2009, with certain adjustmentsyear ended December 31, 2012. Reference is made to comply with U.S. requirements, together withthe Form 20-F 2012 cross reference table on pages i to viii hereof and the Supplemental Information beginning on page 137, which contains certain other information required by Form 20-F. Only (i) the information in this document that is referenced in the Form 20-F 2012 cross reference table, (ii) the Supplemental Information, and (iii) the Exhibits required to be filed pursuant to the Form 20-F shall be deemed to be filed with the Securities and Exchange Commission for any purpose, including incorporation by reference into the Registration Statement on Form F-3 filed on April 23, 2012 (File No. 333-180880) and any other documents filed by us pursuant to the Securities Act of 1933, as amended, which incorporates by reference the 2012 Form 20-F. Any information herein which is set forth undernot referenced in the heading Supplemental Information. Form 20-F 2012 cross reference table or filed as an exhibit thereto shall not be deemed to be so incorporated by reference.
This annual report includes financial measures that were not calculated or presented in accordance with IFRS, and we refer to these measures as non-IFRS financial measures. Reconciliations of these non-IFRS financial measures to the most directly comparable IFRS financial measures can be found on page 234 and pages 261-265 of this annual report.
The information included on the websites that appear in the Annual Report on Form 20-F is not incorporated by reference in the report.
The following cross reference table indicates where information required by Form 20-F may be found in this document.
| | | | | | | | | | |
Form 20-F Item Heading | | Location in this documentDocument | | Page
Number | |
PART I | | | | | | |
1 | | Identity of Directors, Senior Managementmanagement and Advisersadvisers | | Not applicable
N/A | | | | |
| | | |
2 | | Offer Statisticsstatistics and Expected Timetableexpected timetable | | Not applicable
N/A | | | | |
| | | |
3 | | Key Informationinformation | | | | |
| | A
| | Selected Financial Data | | Five-Year Summary
| | 10 |
| | B
| | Capitalization and Indebtedness
| | Not applicable
| | |
| | CA
| | Reason for the Offer and Use of ProceedsSelected financial data
| | Not applicable
Five-year summary | | | 29 | |
| | | | | | Reconciliations to IFRS | | | 261-265 | |
| | | | | | Financial terminology | | | 269-270 | |
| | | | | | Supplemental information | | | | |
| | | | | | DExchange rates
| | Risk Factors
| 232 | |
| | Risk FactorsB
| | 142Capitalization and indebtedness | | N/A | | | - | |
| | C | | Reason for the offer and use of proceeds | | N/A | | | - | |
| | D | | Risk factors | | Risk factors | | | 164-176 | |
| | | |
4 | | InformationInfo on the Company
| | | | | | |
| | A | | History and development of the Company | | Our Business | | | | |
| | | | | | This is Ericsson—2012 in review | | History and Development of the Company
| 3-4 | |
| | | | | | Board of Directors’ Report | | | | |
| | | | | | Business Drivers 2009in 2012 | | 13 | 32-34 | |
| | | | | | Cash flow—Capital Expenditures (capex)expenditures | | 24 | 48 | |
| | | | | | Notes to the Consolidated Financial Statementsfinancial statements | | | | |
| | | | | | Note C26 Business Combinationscombinations | | 119 | 143-146 | |
| | | | | | Note C32C33 Events Afterafter the Balance Sheet Datereporting period | | 140 |
| 161-162 | | | | | | Information on the Company
| | |
| | | | | | Company History and Development
| | 167 |
| | | | | | General Facts on the Company
| | 170 |
| | B
| | Business Overview
| | Board of Directors’ Report
| | |
| | | | | | Sustainability and Corporate Responsibility
| | 35 |
| | | | | | Notes to the Consolidated Financial Statements
| | |
| | | | | | Note C3 Segment Information
| | 70 |
| | | | | | Risk Factors
| | 142 |
| | | | | | Information on the Company
| | |
| | | | | | Company History and Development
| | 167 |
| | | | | | Market Environment
| | 171 |
| | | | | | Segment Overview
| | 173 |
| | | | | | Supplemental Information
| | |
| | | | | | Operating Results
| | 219 |
| | C
| | Organizational Structure
| | Information on the Company
| | |
| | | | | | General Facts on the Company
| | 170 |
| | | | | | Supplemental Information
| | |
| | | | | | Investments
| | 232 |
| | D
| | Property, Plants and Equipment
| | Information on the Company
| | |
| | | | | | Sourcing, Manufacturing and Supply and Availability of Materials
| | 175 |
i
ERICSSON ANNUAL REPORT ON FORM 20-F 20092012
| | | | | | | | | | |
Form 20-F Item Heading | | Location in this documentDocument | | Page
Number | |
| | | | | | Supplemental information | | | | |
| | | | | | General facts on the Company | | | 231 | |
| | | | | | Company history and development | | | 232 | |
| | B | | Business overview | | Our business | | | | |
| | | | | | This is Ericsson | | | 1-2 | |
| | | | | | Group overview | | | 5-6 | |
| | | | | | Our competitive assets | | | 13 | |
| | | | | | Strategy and customers | | | 15-17 | |
| | | | | | Our portfolio | | | 18-22 | |
| | | | | | Regional development | | | 23-24 | |
| | | | | | Board of Directors’ report | | | | |
| | | | | | Business in 2012 | | | 32-34 | |
| | | | | | Financial results of operations—Seasonality | | | 39-40 | |
| | | | | | Business results—Regions | | | 50 | |
| | | | | | Business results—Segments | | | 50-57 | |
| | | | | | Material contracts | | | 59 | |
| | | | | | Sourcing and supply | | | 60 | |
| | | | | | Sustainability and corporate responsibility | | | 60-64 | |
| | | | | | Notes to the Consolidated Financial Statementsconsolidated financial statements | | | | |
| | | | | | Note C11 Property, Plant and EquipmentC3—Segment information | | 84 | 95-101 | |
| | | | | | Note C27 Leasing
| | 124 |
| Risk factors | | | | | | Board of Directors’ Report
| | |
| | | | | | Capital Expenditures (capex)Market, technology and business risks
| | 24 |
| | | |
4A
164-172 | | Unresolved staff comments
| | Not applicable
| | |
| | | |
5
| | Operating and Financial Review and Prospects
| | | | |
| | A
| | Operating Results
| | Market Trends
| | 159 |
| | | | | | Regulatory, compliance and corporate governance risks | | | 172-175 | |
| | | | | | Corporate governance regulation and compliance | | | 180-181 | |
| | Board of Directors’ ReportC | | Organizational structure | | Supplemental information | | | | |
| | | | | | Business ResultsGeneral facts on the company
| | 25 | 231 | |
| | | | | | Supplemental InformationInvestments
| | | 260-261 | |
| | D | | Property, plants and equipment | | Our business | | | | |
| | | | | | Operating ResultsSustainability and corporate responsibility
| | 219 | 27-28 | |
| | | | | | Supplemental information | | | | |
| | | | | | Restructuring in 2008Primary manufacturing and 2009assembly facilities
| | 221 | 233 | |
| | | | | | Notes to the Consolidated Financial Statementsconsolidated financial statements | | | | |
| | | | | | Note C1 Significant Accounting PoliciesC11—Property, plant and equipment | | 49 | 109-110 | |
| | | | | | Note C2 Critical Accounting Estimates and JudgmentsC27—Leasing | | 66 | 147-148 | |
| | | | | | Note C20 Financial Risk Management and Financial Instruments
| | 108 |
| Board of Directors’ report | | | | | | Risk Factors
| | 142 |
| | | | | | Board of Directors’ Report
| | |
| | | | | | Risk ManagementCash Flow—Capital expenditures
| | 37 | 48 | |
| | B4A
| | Liquidity and Capital ResourcesUnresolved staff comments
| | Board of Directors’ Report
| | |
| — | | | | | | Financial Position
| | 20 |
| | | | | | Cash Flow
| | 23 |
| | | | | | Capital Expenditures
| | 24 |
| | | | | | Risk Management
| | 37 |
| | | | | | Notes to the Consolidated Financial Statements
| | |
| | | | | | Note C19 Interest-bearing Liabilities
| | 107 |
| | | | | | Note C20 Financial Risk Management and Financial Instruments
| | 108 |
| | | | | | Note C25 Statement of Cash Flows
| | 117 |
| | C | | Research and Development, Patents and Licenses, etc | | Five-Year Summary | | 10 |
| | | | | | Board of Directors’ Report
| | |
| | | | | | Financial Results of Operations
| | 17 |
| | | | | | Consolidated Balance Sheet
| | 46 |
| | | | | | Information on the Company
| | |
| | | | | | Technology and Services Leadership
| | 168 |
| | D | | Trend Information | | Board of Directors’ Report | | |
| | | | | | Business Results
| | 25 |
| | | | | | Market Trends
| | 159 |
| | E | | Off-Balance Sheet Arrangements | | Board of Directors’ Report | | |
| | | | | | Sony Ericsson Borrowings Guaranteed
| | 23 |
| | | | | | Off Balance Sheet Arrangements
| | 23 |
ii
ERICSSON ANNUAL REPORT ON FORM 20-F 20092012
| | | | | | | | | | |
Form 20-F Item Heading | | Location in this documentDocument | | Page
Number | |
5 | | Operating and financial review and prospects | | | | | | |
| | A | | Operating results | | Our business | | | | |
| | | | | | Group overview | | | 5-6 | |
| | | | | | Our performance | | | 25-26 | |
| | | | | | Regional development | | | 23-24 | |
| | | | | | Five-year summary | | | 29 | |
| | | | | | Board of Directors’ report | | | | |
| | | | | | Business in 2012 | | | 32-34 | |
| | | | | | Financial results of operation | | | 38-41 | |
| | | | | | Business results—Regions | | | 50 | |
| | | | | | Business results—Segments | | | 50-57 | |
| | | | | | Board of Directors’ report | | | | |
| | | | | | Risk management | | | 59 | |
| | | | | | Notes to the Consolidated Financial Statementsconsolidated financial statements | | | | |
| | | | | | Note C24 Contingent LiabilitiesC1—Significant accounting policies | | 117 | 75-91 | |
| | | | | | Note C20—Financial risk management and financial instruments—Foreign exchange risk | | | 134-136 | |
| | | | | | FRisk Factors | | Tabular Disclosure of Contractual Obligations | | Board of Directors’ Report | | |
| | | | | | Material ContractsMarket, technology and business risks
| | 33 | 164-172 | |
| | | | | | Supplemental information | | | | |
| | | | | | Operating results | | | 233-248 | |
| | B | | Liquidity and capital resources | | Board of Directors’ report | | | | |
| | | | | | Financial results of operations—Seasonality | | | 39-40 | |
| | | | | | Financial position | | | 42-46 | |
| | | | | | Cash flow | | | 47-49 | |
| | | | | | Risk Management | | | 59 | |
| | | | | | Notes to the Consolidated Financial Statementsconsolidated financial statements | | | | |
| | | | | | Note C33 Contractual ObligationsC19—Interest-bearing liabilities | | 141 | 131-132 | |
| | | |
6
| | Directors, Senior Management and Employees | | | | | | Note C20—Financial risk management and financial instruments | | | 133-140 | |
| | | | | | Note C25—Statement of cash flows | | | 142-143 | |
| | | | | | ASupplemental information | | Directors and Senior Management | | Corporate Governance Report 2009 | | |
| | | | | | Members of the Board of DirectorsOperating results
| | 203 | 234-248 | |
| | C | | R&D, Patents and licenses, etc. | | Five-year summary | | | 29 | |
| | | | | | Members of the Group Management Team
| | 209 |
| | BOur business | | Compensation | | Board of Directors’ Report
| | |
| | | | | | Corporate GovernanceThis is Ericsson
| | 33 | 1-2 | |
| | | | | | Corporate Governance Report 2009Our competitive assets-technology leadership
| | | 13 | |
| | | | | | Board of Directors’ report | | | | |
| | | | | | Board of DirectorsFair return on R&D investment
| | 195 | 33-34 | |
| | | | | | Company ManagementBusiness in 2012
| | 207 |
| 32-34 | | | | | | Notes to the Consolidated Financial Statements
| | |
| | | | | | Note C17 Post-Employment Benefits
| | 98 |
| | | | | | Note C29 Information Regarding Members of the Board of Directors, Management and Employees
| | 126 |
| | C
| | Board Practices | | Corporate Governance Report 2009 | | |
| | | | | | Board of Directors
| | 195 |
| | | | | | Members of the Board of Directors
| | 203 |
| | | | | | Members of the Group Management Team
| | 209 |
| | | | | | Notes to the Consolidated Financial Statements
| | |
| | | | | | Note C29 Information Regarding Members of the Board of Directors, Management and Employees
| | 126 |
| | D
| | Employees | | Five-Year Summary | | 10 |
| | | | | | Board of Directors’ Report
| | |
| | | | | | Financial Resultsresults of Operationsoperations—Operating expenses | | 17 |
| 40 | | | | | | Notes to the Consolidated Financial Statements
| | |
| | | | | | Note C29 Information Regarding Members of the Board of Directors, Management and Employees
| | 126 |
| | E
| | Share Ownership | | Share Information | | |
| | | | | | Shareholders
| | 155 |
| | | | | | Corporate Governance Report 2009 | | |
| | | | | | Members of the Board of Directors
| | 203 |
| | | | | | Members of the Group Management Team
| | 209 |
iii
ERICSSON ANNUAL REPORT ON FORM 20-F 20092012
| | | | | | | | | | |
Form 20-F Item Heading | | Location in this documentDocument | | Page
Number | |
| | | | | | Consolidated financial statements | | | | |
| | | | | | Consolidated income statement | | | 70 | |
| | D | | Trend information | | Our business | | | | |
| | | | | | Market trends | | | 10-12 | |
| | | | | | Strategy and customers | | | 15-17 | |
| | | | | | Board of Directors’ report | | | | |
| | | | | | Trends and drivers | | | 31-32 | |
| | | | | | Business results—Regions | | | 50 | |
| | | | | | Business results—Segments | | | 50-57 | |
| | E | | Off-balance sheet arrangements | | Board of Directors’ report | | | | |
| | | | | | Financial position—Off-balance sheet arrangements | | | 46 | |
| | | | | | Notes to the Consolidated Financial Statementsconsolidated financial statements | | | | |
| | | | | | Note C29 Information Regarding Members of the Board of Directors, Management and EmployeesC24—Contingent liabilities | | 126 |
| | | |
7
141-142 | | Major Shareholders and Related Party Transactions
| | | | |
| | A | | Major Shareholders | | Share Information
| | |
| | | | | | ShareholdersNote C32—Transfers of financial assets
| | 155 | 161 | |
| | BF | | Related Party TransactionsTabular disclosure of contractual obligations | | Notes to the Consolidated Financial Statementsconsolidated financial statements | | | | |
| | | | | | Note C30 Related Party TransactionsC31—Contractual obligations | | 137 |
| 161 | | C | | Interests of Experts and Counsel | | Not applicable
| | |
| | | |
86
| | Financial InformationDirectors, senior management and employees | | | | | | |
| | A | | Consolidated StatementsDirectors and Other Financial Informationsenior management
| | Consolidated Financial StatementsCorporate governance report 2012 | | 44 |
| | | | | Please see also Item 17 cross references
| | |
| | | | | | ReportMembers of Independent Registered Public Accounting Firmthe Board of Directors
| | | 196-201 | |
| | | | | | Members of the Executive Leadership Team | | | 206-211 | |
| | B | | Compensation | | Board of Directors’ report | | 43 | | |
| | | | | | Corporate governance—
Remuneration | | | 58 | |
| | | | | | Corporate Governance Report 2012 | | | | |
| | | | | | Remuneration to Board members | | | 195 | |
| | | | | | Remuneration report | | | 216-222 | |
| | | | | | Notes to the Consolidated Financial Statementsconsolidated financial statements | | | | |
| | | | | | Note C4 Net SalesC17—Post-employment benefits | | 75 |
| 121-129 | | | | | | Board of Directors’ Report | | |
| | | | | | LegalNote C28—Information regarding members of the Board of Directors, the Group management and Tax Proceedingsemployees
| | 32 |
| 149-158 | | | | | | Supplemental Information | | |
| | | | | | Dividends
| | 222 |
| | B | | Significant ChangesC | | Board of Directors’ Reportpractices | | |
| | | | | | Post-Closing Events
| | 42 |
| | | | | | Notes to the Consolidated Financial Statementsconsolidated financial statements | | | | |
| | | | | | Note C32 Events afterC28—Information regarding members of the Balance Sheet DateBoard of Directors, the Group management and employees | | 140 | 149-158 | |
9
| | The Offer and Listing | | | | |
| | ACorporate governance report 2012 | | Offer and Listing Details | | Share Information | | |
| | | | | | Offer and Listing DetailsBoard of Directors
| | 153 |
| 186-190 | | B | | Plan of Distribution | | Not applicable | | |
| | C | | Markets | | Share Information | | |
| | | | | | Stock Exchange Trading
| | 152 |
| | D | | Selling Shareholders | | Not applicable | | |
| | E | | Dilution | | Not applicable | | |
| | F | | ExpensesCommittees of the Issue | | Not applicable | | |
| | | |
10Board of Directors—Audit committee
| | Additional Information | 191-193 | | | | |
| | A | | Share Capital | | Not applicable | | |
| | B | | Memorandum and Articles of Association | | Supplemental Information | | |
| | | | | | Memorandum and Articles of Association
| | 222 |
| | C | | Material Contracts | | Board of Directors’ Report | | |
| | | | | | Material Contracts
| | 33 |
iv
ERICSSON ANNUAL REPORT ON FORM 20-F 20092012
| | | | | | | | | | |
Form 20-F Item Heading | | Location in this documentDocument | | Page
Number | |
| | | | | | Committees of the Board of Directors—Remuneration committee | | | 193-195 | |
| | D | | Employees | | Our business | | | | |
| | | | | | Our people | | | 14 | |
| | | | | | Five-year summary | | | 29 | |
| | | | | | Notes to the Consolidated Financial Statementsfinancial statements | | | | |
| | | | | | Note C33 Contractual ObligationsC28—Information Regarding Members of the Board of Directors, the Group Management and Employees | | 141 | 149-158 | |
| | E | | Share ownership | | Share Information | | | | |
| | | | | | Shareholders | | | 228-230 | |
| | | | | | Corporate governance report 2012 | | | | |
| | | | | | Shareholders | | | 182-183 | |
| | | | | | Members of the Board of Directors | | | 196-201 | |
| | | | | | Members of the Executive Leadership Team | | | 206-211 | |
| | | | | | Remuneration report | | | | |
| | | | | | Total remuneration | | | 219-222 | |
| | | | | | Notes to the consolidated financial statements | | | | |
| | | | | | Note C28—Information regarding members of the Board of Directors, the Group management and employees | | | 149-158 | |
| | | |
7 | | Major shareholders and related party transactions | | | | | | |
| | A | | Major shareholders | | Corporate governance report 2012 | | | | |
| | | | | | Shareholders | | | 182-183 | |
| | | | | | Share information | | | | |
| | | | | | Shareholders | | | 228-230 | |
| | B | | Related party transactions | | Notes to the consolidated financial statements | | | | |
| | | | | | Note C29—Related party transactions | | | 158-160 | |
| | C | | Interests of experts and counsel | | N/A | | | | |
| | |
8 | | Financial information | | | | |
| | A | | Consolidated statements and other financial information | | Board of Directors’ report | | | | |
| | | | | | Legal proceedings | | | 64-65 | |
| | | | | | Consolidated financial statements | | | 70-74 | |
| | | | | | Please see also Item 17 cross references | | | | |
| | | | | | Report of independent registered public accounting firm | | | 69 | |
| | | | | | Notes to the consolidated financial statements | | | 75-162 | |
v
ERICSSON ANNUAL REPORT ON FORM 20-F 2012
| | | | | | | | | | |
Form 20-F Item Heading | | Location in Document | | Page
Number | |
| | | | | | Supplemental information | | | | |
| | | | | | Memorandum and articles of association—Dividends | | | 249-250 | |
| | B | | Significant changes | | Board of Directors’ report | | | | |
| | | | | | Post-closing events | | | 67-68 | |
| | | | | | Notes to the consolidated financial Statements | | | | |
| | | | | | Note C33—Events after the reporting period | | | 161-162 | |
| | | |
9 | | The offer and listing | | | | | | |
| | A | | Offer and listing details | | Share Information | | | | |
| | | | | | Offer and listing details | | | 226-228 | |
| | B | | Plan of distribution | | N/A | | | | |
| | C | | Markets | | Share Information | | | | |
| | | | | | Stock exchange trading | | | 223-224 | |
| | D | | Selling shareholders | | N/A | | | | |
| | E | | Dilution | | N/A | | | | |
| | F | | Expenses of the issue | | N/A | | | | |
| | | |
10 | | Additional information | | | | | | |
| | A | | Share capital | | N/A | | | | |
| | B | | Articles of association | | Supplemental information | | | | |
| | | | | | Memorandum and articles of association | | | 248-252 | |
| | C | | Material contracts | | Board of Directors’ report | | | | |
| | | | | | Material contracts | | | 59 | |
| | | | | | Notes to the consolidated financial statements | | | | |
| | | | | | Note C31 Contractual obligations | | | 161 | |
| | D | | Exchange Controlscontrols | | Supplemental Informationinformation | | | | |
| | | | | | Exchange Controlscontrols | | 225 | 252 | |
| | E | | Taxation | | Supplemental Informationinformation | | | | |
| | | | | | Taxation | | 225 | 252-257 | |
| | F | | Dividends and Paying Agentspaying agents | | Not applicableN/A | | | | |
| | G | | Statement by Expertsexperts | | Not applicableN/A | | | | |
| | H | | Documents on Displaydisplay | | Information on the CompanySupplemental information | | | | |
| | | | | | General Factsfacts on the Company | | 170 | 232 | |
| | I | | Subsidiary Informationinformation | | Not applicable— | | | | |
| | | |
11 | | Quantitative and Qualitative Disclosures About Market Riskqualitative disclosures
about market risk | | | | | | |
| | A | | Quantitative Informationinformation about Market Riskmarket risk | | Board of Directors’ ReportNotes to the consolidated financial statements
| | | | |
| | | Note C20—Financial risk management and financial instruments | | | 133-140 | |
| | B | | Qualitative information about market risk | | Board of Directors’ Report | | | | |
| | | Risk Managementmanagement | | 209 | 59 | |
vi
ERICSSON ANNUAL REPORT ON FORM 20-F 2012
| | | | | | | | | | |
Form 20-F Item Heading | | Location in Document | | Page
Number | |
| | | | | | Notes to the Consolidated Financial Statementsconsolidated financial statements | | | | |
| | | | | | Note C20 C20—Financial Risk Managementrisk management and Financial Instrumentsfinancial instruments | | 108 | 133-140 | |
| | | | | | BCorporate governance report 2012 | | Qualitative Information about Market Risk
| | Board of Directors’ Report | | |
| | | | | | Risk Managementmanagement | | 209 |
| 203-206 | | | | | | Notes to the Consolidated Financial Statements
| | |
| | | | | | Note C20 Financial Risk Management and Financial Instruments
| | 108 |
| | C | | Interim Periodsperiods | | Not applicableN/A | | | | |
| | D | | Safe Harborharbor | | Not applicableN/A | | | | |
| | E | | Small Business Issuersbusiness issuers | | Not applicableN/A | | | | |
| | | |
12 | | Description of Securities Othersecurities other than Equity Securitiesequity securities | | Not applicable | | | | |
| | A | | Debt Securitiessecurities | | Not applicableN/A | | | | |
| | B | | Warrants and Rightsrights | | Not applicableN/A | | | | |
| | C | | Other Securitiessecurities | | Not applicableN/A | | | | |
| | D | | American Depositary Shares | | Supplemental Informationinformation | | | | |
| | | | | | Depositary Feesfees and Chargescharges | | 230 | 257 | |
| | |
PART II | | | | |
| | | |
13 | | Defaults, Dividend Arrearages and Delinquencies
| | Not applicable | | |
| | | |
1413
| | Material Modifications to the Rights of Security HoldersDefaults, Dividends, Arrearages and Use of ProceedsDelinquencies
| | Not applicableN/A | | | | |
| | | |
1514
| | Material modifications to the rights of security holders and use of proceeds | | N/A | | | | |
| | | |
15 | | Controls and Procedures | | | | | | |
| | A | | Disclosure Controlscontrols and Proceduresprocedures | | Corporate Governance Report 2009governance report 2012 | | | | |
| | | | | | Disclosure Controlscontrols and Proceduresprocedures | | 214 | 212-213 | |
| | B | | Management’s annual report on internal control over financial reporting | | Management’s Reportreport on Internal Control Over Financial Reportinginternal control over financial reporting | | 218 | 163 | |
| | C | | Attestation report of the registered public accounting firm | | Report of Independent Registered Public Accounting Firm | | | 69 | |
| | D | | Changes in internal control over financial reporting | | Management’s report on internal control over financial reporting | | | 163 | |
| | | |
16 | | Reserved | | | | | | |
| | | | |
| | A | | Audit Committee financial expert | | Corporate governance report 2012 | | | | |
| | | | Audit Committee—Members of the Audit committee | | | 192 | |
| | B | | Code of Ethics | | Corporate governance report 2012 | | | | |
| | | | | | Code of business ethics | | | 180-181 | |
| | | | | | Form 20-F 2012 cross reference table | | | | |
| | | | | | Part II—19—Exhibit 11 | | | viii | |
| | | | | | Board of Directors’ report | | | | |
| | | | | | Corporate governance—High ethical standards | | | 57 | |
| | C | | Principal accountant fees and services | | Supplemental information | | | | |
| | | | | | Audit committee pre-approval policies and procedures | | | 258 | |
| | | | | Notes to the consolidated financial statements | | | | |
| | | | | Note C30 Fees to auditors | | | 160 | |
v
vii
ERICSSON ANNUAL REPORT ON FORM 20-F 20092012
| | | | | | | | |
Form 20-F Item Heading | | Location in this document | | Page
Number |
| | C | | Attestation report of the registered public accounting firm | | Report of Independent Registered Public Accounting Firm | | 43 |
| | D | | Changes in internal control over financial reporting | | Corporate Governance Report 2009 | | |
| | | | | Disclosure Controls and Procedures | | 214 |
| | | |
| 16 | | Reserved | | | | |
| | A | | Audit Committee Financial Expert | | Corporate Governance Report 2009 | | |
| | | | | | The Audit Committee | | 199 |
| | B | | Code of Ethics | | Corporate Governance Report 2009 | | |
| | | | | | An Ethical Business | | 191 |
| | C | | Principal Accountant Fees and Services | | Notes to the Consolidated Financial Statements | | |
| | | | | | Note C31 Fees to Auditors | | 140 |
| | | | | | Corporate Governance Report 2009 | | |
| | | | | | Audit Committee Pre-Approval Policies and Procedures | | 200 |
| | D | | Exemptions from the Listing Standards for Audit Committees | | Corporate Governance Report 2009 | | |
| | | | | | Independence of the Directors | | 196 |
| | E | | Purchase of Equity Securities by the Issuer and Affiliated Purchasers | | Not applicable | | |
| | F | | Change in Registrant’s Certifying Accountant | | Not applicable | | |
| | G | | Corporate Governance | | Corporate Governance Report 2009 | | |
| | | | | | Independence of the Directors | | 196 |
| | | | | | Supplemental Information | | |
| | | | | | Independence Requirements | | 230 |
| | |
PART III | | | | |
| | | |
17 | | Financial Statements | | Consolidated Income Statement | | 44 |
| | | | | | Consolidated Statement of Comprehensive Income | | 45 |
| | | | | | Consolidated Balance Sheet | | 46 |
| | | | | | Consolidated Statement of Cash Flows | | 47 |
| | | | | | Consolidated Statement of Changes in Equity | | 48 |
| | | | | | Notes to the Consolidated Financial Statements | | 49 |
| | | | | | Report of Independent Registered Public Accounting Firm | | 43 |
| | | |
18 | | Financial Statements | | Not applicable | | |
| | | |
19 | | Exhibits | | | | |
| | Exhibit 1 | | Articles of Association | | |
| | Exhibit 2 | | Not applicable | | |
| | Exhibit 3 | | Not applicable | | |
| | Exhibit 4 | | Not applicable | | |
| | Exhibit 5 | | Not applicable | | |
| | Exhibit 6 | | Please see Notes to the Consolidated Financial Statements, Note C1 Significant Accounting Policies | | 49 |
vi
ERICSSON ANNUAL REPORT ON FORM 20-F 2009
| | | | | | | | | | |
Form 20-F Item Heading | | Location in this documentDocument | | Page
Number | |
| | D | | Exemptions from the listing standards for Audit Committees | | Corporate governance report 2012 | | | | |
| | | | | | Board of Directors—Independence | | | 187 | |
| | | | | | Supplemental information | | | | |
| | | | | | Corporate governance requirements | | | 257-258 | |
| | E | | Purchase of equity securities by the issuer and affiliated purchasers | | N/A | | | | |
| | F | | Change in registrant’s certifying accountant | | N/A | | | | |
| | G | | Corporate governance | | Corporate governance report 2012 | | | | |
| | | | | | Board of Directors—Independence | | | 187 | |
| | | | Supplemental information | | | | |
| | | | | | Corporate governance requirements | | | 257-258 | |
| | |
PART III | | | | | | |
| | | |
17 | | Financial statements | | | | | | |
| | | | | | Consolidated income statement and Statement of comprehensive income | | | 70-71 | |
| | | | | | Consolidated balance sheet | | | 72 | |
| | | | | | Consolidated statement of cash flows | | | 73 | |
| | | | | | Consolidated statement of changes in equity | | | 74 | |
| | | | | | Notes to the consolidated financial statements | | | 75-162 | |
| | | | | | Report of independent registered public accounting firm | | | 69 | |
| | | |
18 | | Financial statements | | N/A | | | | |
| | | | |
| 19 | | Exhibits | | | | | | | | |
| | | | Exhibit 1 | | Articles of Association (incorporated herein by reference to Exhibit 1 to the Annual Report on Form 20-F for the year ended December 31, 2011 filed by the registrant on April 4, 2012 (File No. 000-12033)) | | | | |
| | | | Exhibit 6 | | Please see Notes to the consolidated financial statements, Note C1 Significant accounting policies | | | 75-91 | |
| | | | Exhibit 7 | | For definitions of certain ratios used in this report, please see Financial Terminologyterminology | | 234 | 269-270 | |
| | | | Exhibit 8 | | Please see Supplemental Information, Information—Investments | | 232 | 260-261 | |
| | Exhibit 9
| | Not applicable
| | |
| | Exhibit 10
| | Not applicable
| | |
| | Exhibit 11 | | Our Code of Business Ethics and Conductbusiness ethics is included on our web site at
http://www.ericsson.com/ericsson/corporateresponsibility/employees/code_businessethics.shtmlcode-of-business-ethics | | | | |
| | | | Exhibit 12 | | 302 Certifications | | | | |
| | | | Exhibit 13 | | 906 Certifications | | |
| | Exhibit 14
| | Not applicable
| | |
| | | | Exhibit 15.1 | | Consent of Independent Registered Public Accounting Firmindependent registered public accounting firm | | |
| | Exhibit 15.2
| | Consolidated Financial Statements of Sony Ericsson Mobile Communications AB
| | |
| | Exhibit 15.3
| | Consent of Independent Registered Public Accounting Firm
| | |
Note: The Company’s holding in ST-Ericsson SA meets the requirements of Rule 3-09 under Regulation S-X for the provision of separate financial statements of ST-Ericsson SA, a non-listed Swiss company that has a December 31 fiscal year end.
viiThe Company intends to file the financial statements of ST-Ericsson SA as of and for the year ended December 31, 2012 as an amendment to this Annual Report on Form 20-F as soon as practicable after they become available.
viii
ERICSSON ANNUAL REPORT ON FORM 20-F 20092012
2009 MILESTONESTHIS IS ERICSSON
JANUARY-MARCHWe are a world-leading provider of communications networks, telecom services and support solutions.
Communication is changing the way we live and work. When one person connects, his or her world changes. With everything connected, our world changes. Ericsson plays a key role in this evolution, using innovation to empower people, business and society. We are enabling the networked society with efficient real-time solutions that allow us all to study, work and live our lives more freely, in sustainable societies.
Since the establishment of the Company in 1876, we are a leader in telecommunication and are now expanding our role into an ICT (Information and Communications Technology) solutions provider.
Our research and solutions development has made mobile communications and broadband possible. When you make a call or browse the internet on your handset, tablet or mobile PC, you will likely use one of our solutions.
Our offering comprises services, software and infrastructure, mainly for telecom operators.
Verizon Wireless chose Ericsson as one40% of two primary suppliers to build its LTE network infrastructure. Verizon Wireless will be the first operator to offer commercial LTE services in the United States. Later in the year, Metro-PCS chose Ericsson as the sole supplier of its LTE network buildout. Both operatorsworld’s mobile traffic runs through networks that are new Ericsson customers.supplied by us
China Unicom selected Ericsson to supply 3G networksWe provide solutions and services for 15 Chinese provinces and to upgrade its GSM networks to support 2G/3G interoperabilityall major telecom operators in 10 provinces.the world
The ST-Ericsson joint venture was launched as a leading supplier of semiconductors and platformsnetworks we manage for mobile devices to four of the top five handset manufacturers.operators serve about 950 million subscribers
With Ericsson as its partner for mobile learning, the BBC World Service Trust uses the creative power of media to reduce poverty and promote human rights in Bangladesh. The Financial Times reported thatWe have more than 300,000 people had already signed up to learn English over their mobile phones.33,000 granted patents, comprising one of the industry’s strongest patent portfolios.
APRIL-JUNEOUR SEGMENTS
In the first agreement of its kind in Africa, leading mobile operator Zain awarded Ericsson the management responsibility forToday, we are more than 4,000 sites across Nigeria, including110,000 people serving customers in more than 180 countries. To best reflect our business, we report four business segments:
Networks
Networks provides the infrastructure that is the basis for all mobile communication. We deliver superior-performance and cost-efficient networks to ensure the best user experience.
Global Services
With 60,000 services professionals globally, we deliver managed services, consulting and systems integration, customer support, network design and optimization and network rollout.
Support Solutions
Support Solutions is the new name for former segment Multimedia and it signposts a change of direction. The segment focuses on software for operations field operationssupport systems and business support systems.systems (OSS and BSS), TV and media management, and m-commerce.
Joint venture ST-Ericsson
In support of the initiative CaringST-Ericsson offers modems and ModAps (integrated modem and application processor platforms) for Climate of the UN Global Compact, Ericsson’s CEO Carl-Henric Svanberg addressed the UN Secretary General Ban-Ki Moon during the World Business Summit on Climate Change. The message was that a modernized telecommunications infrastructure can significantly contribute to the creation of a carbon-lean economy.handset and tablet manufacturers.
OUR REGIONS
The world’s largest upgrade of a live mobile network was accomplished at a record paceWe secure an efficient go-to-market setup through ten regions. We strive for Vodafone Essar in India. Ericsson replaced more than 10,500 of the operator’s GSM radio sites in just 13 months, reaching a peak rate of one site every minuteprofitable growth through solid regional competence and without disrupting service to more than 13 million subscribers.
JULY-SEPTEMBER
Ericsson’s first major services contract in North America is also the world’s largest, valued at USD 4.5–5 billion over seven years. Operator Sprint and its 50 million customers benefit from Ericsson’s leadership and best-in-class economies of scale in network services.
Ericsson signed framework agreements worth USD 1.7 billion for 2G/3G mobile communication equipment and related services for 2009 with two major Chinese telecom operators: China Mobile and China Unicom.
All three telecom operators in China selected Ericsson to provide fixed broadband access to millions of consumers in nine provinces.
Ericsson was selectedstrong customer relationships, backed by AT&T as one of two domain suppliers of wireline access products and services. This breakthrough win for Ericsson in North America significantly accelerates AT&T’s ability to bring new broadband services to the market.
OCTOBER-DECEMBER
With the acquisition of Nortel’s CDMA and LTE business, Ericsson became the largest supplier of infrastructure and services in North America, based on Ericsson reported sales and publicly reported sales and estimated sales for Ericsson’s main competitors.
ERICSSON ANNUAL REPORT ON FORM 20-F 20092012
ShipmentsIn our ten regions, we work together with our customers to develop innovative and scalable solutions that help operators grow their revenues and reduce their costs.
Once a successful case is proven, we can roll out the same practice all over the world, sharing common processes, methods and tools. This ensures quality and efficiency.
Solutions and services often go hand-in-hand as networks become more complex and often include products from several suppliers. Operators look for long-term services partnerships with companies such as Ericsson for support in every aspect of Ericsson’s mobile broadband modules almost reached 1.5 million units. Asus, the inventor of the netbook, started to use Ericsson’s embedded modulestheir business.
We serve our customers through regional competence organized into six engagement practices: Mobile Broadband; Communication Services; Fixed Broadband and Ericsson is now a supplier to 3 of the top 5 PC manufacturers.
Ericsson announced low-cost mobile broadband for the world’s three billion GSM subscribers through a software upgrade. The EDGE evolution upgrade lets people enjoy the benefits of 3G performance – a great opportunity in countries where the mobile phone is the most affordable way to access the internet.
Swedish TV network TV4 outsourced the operation of its nationwide playout services. Addressing the broadcasting industry substantially expands Ericsson’s opportunities—not only for managed services, but also for the multimedia product portfolio.
ERICSSON ANNUAL REPORT ON FORM 20-F 20092012
2012 IN REVIEW
JANUARY
Ericsson strengthens its focus on IPR licensing, to get a fair return on R&D investments in patents development.
Any company that provides wireless connectivity will likely need a license from us.
JANUARY
Ericsson signs a deal to connect the entire vessel fleet of the world’s largest shipping company, Maersk Line, using our capabilities to enable machine-to-machine communication.
FEBRUARY
Ericsson complements the heterogeneous network offering with telecom grade Wi-Fi through acquisition of Wi-Fi company BelAir Networks, enabling operators to further improve the mobile broadband user experience.
MARCH
Ericsson widens the scope of managed services to include such services for broadcasters by announcing the acquisition of the Broadcast Services Division of Technicolor.
APRIL
SOFTBANK MOBILE signs 4G/LTE contract with Ericsson in Japan. The network will cover three major cities in the country, together accounting for 70% of the data and voice traffic. Ericsson has deployed LTE networks on five continents.
MAY
Ericsson’s efficient AIR radio base station is selected by T-Mobile as the first operator in the USA to launch this technology, which enables improvement of existing coverage and quick launch of LTE in 2013. The contract also includes consulting and systems integration and rollout services.
JUNE
At a briefing for journalists in San Francisco, Ericsson’s President and CEO Hans Vestberg discusses how the rapid increases in subscribers and data usage impact the entire ICT industry. Network quality, user experience, billing and charging models and services offerings all need to be adapted.
JULY
MTN Nigeria boosts its ability to serve subscribers and their growing data needs by becoming the first African operator to deploy Ericsson’s scalable SSR 8020 platform for wireless IP core networks. This is one of 39 SSR contracts that Ericsson won in 2012.
AUGUST
Italian operator FASTWEB signs a seven-year IT managed services contract with Ericsson. It includes data center consolidation and transformation, as well as managed operations for its IT infrastructure. Ericsson extends the scope of managed services from telecoms to data centers.
ERICSSON ANNUAL REPORT ON FORM 20-F 2012
SEPTEMBER
Ericsson partners in the Social Good Summit 2012 in New York, discussing how mobile broadband can be used to help tackle global challenges such as poverty and climate change.
OCTOBER
Ericsson is selected to implement a new LTE network for Vivo, a subsidiary of Telefônica, helping meet user demand for connectivity and mobile broadband services in Brazil. Ericsson has an LTE market share of more than 50% in Latin America.
NOVEMBER
Ericsson holds its annual Investor Day, focusing on profitable growth and how the company is transforming into a leading ICT solutions provider in telecoms.
NOVEMBER
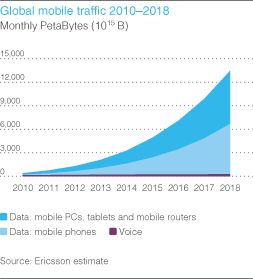
The new Ericsson Mobility Report is launched, stating that “Traffic in mobile networks continues to grow at an impressive rate worldwide, driven by uptake of smart devices and apps.” This is a recurrent report on network traffic and market trends, based on data traffic measurements in live networks globally and on internal forecasts.
DECEMBER
Ericsson announces that Volvo Car Group will use Ericsson’s Connected Vehicle Cloud to allow drivers, passengers and their cars to connect to services available in the cloud. Drivers and passengers can access applications for information, navigation and entertainment from a screen in the car.
ERICSSON ANNUAL REPORT ON FORM 20-F 2012
2009 SNAPSHOTGROUP OVERVIEW
THIS IS ERICSSON
Founded in 1876, Ericsson is a leading provider of communications networks, related services and multimedia solutions. Through our joint ventures ST-Ericsson and Sony Ericsson, we are also a major provider of handsets. Our experience building networks in more than 175 countries gives us unique customer and consumer insights, and our extensive portfolio of telecommunicationsfour business segments provide solutions and intellectual property (patents) offer a true business advantage. We are committed to working with our customers and partners to expand the borders ofservices which in combination create an industry-leading telecommunications for the benefit of people everywhere.
Our operations have been divided into segments that create competitive advantage and best meet the needs of our global customer base.portfolio.
| | | | | | |
Segment | | NETWORKS | | Technology leadership, a broad product portfolioGLOBAL SERVICES
| | SUPPORT SOLUTIONS |
| | | |
| | Headed by Johan Wibergh | | Headed by Magnus Mandersson | | Headed by Per Borgklint |
| | | |
| | We develop and scale enabledeliver superior-performance network infrastructure for 2G/GSM, 3G/WCDMA/HSPA & CDMA, and 4G/LTE with solutions for: • Radio access, based on multi-standard radio base station RBS 6000 • IP and transport; IP Edge routing based on SSR 8000 and transport solutions based on fiber and microwave • Core network; switching and IMS solutions based on the Ericsson Blade System platform. | | Globally, 60,000 service professionals deploy and operate networks, and integrate solutions to excelallow operators to monetize increasing data traffic and ensure high user experience in meetingnetworks. We use global processes, methods and tools to ensure quality and efficiency in the coverage, capacitynetworks. Global Services include: • Professional Services; consulting and systems integration, managed services, network evolution needs of fixeddesign and mobile operators. We provide products for all major standardsoptimization as well as all essential elements of a network on an end-to-end solutions basis.customer support SERVICES• Network Rollout.
| | Expertise in network design, rollout, integration, operationWe develop and customer support, combined with a global structure and robust local capabilities, enables us to understand and respond to the unique challenges of each customer. As a result we are able to capitalize on the trend for operators to outsource a broader range of activities.deliver software solutions for:
Innovative application platforms, service delivery• Operations and Business Support Systems (OSS and BSS); enabling management of networks and services, customer interaction and revenue management solutions, combined with leading content developer and application provider relationships, enable Ericsson to help customers create exciting and differentiating multimedia services.
The complementary strength of Sony Ericsson further enhances our consumer perspective for superior end-to-end offerings. Sony Ericsson offers exciting consumer experience through phones, accessories, content and applications.
ST-Ericsson represents the link between infrastructure and handsets in Ericsson’s offering. They provide a market-leading portfolio of wireless platforms and semiconductors.
ERICSSON ANNUAL REPORT ON FORM 20-F 2009
Performance
In a progressively more challenging environment during• M-Commerce; software solutions and hosted services to enable mobile financial services and global interoperability.
|
ERICSSON ANNUAL REPORT ON FORM 20-F 2012
ST-ERICSSON*
Headed by Didier Lamouche
A 50/50 joint venture with STMicroelectronics, ST-Ericsson offers modems and ModAps (integrated modem and application processor platforms) for leading handset and tablet manufacturers.
STMicroelectronics announced in October its intention to exit as a shareholder in ST-Ericsson. Ericsson is presently exploring various strategic options for the future of ST-Ericsson assets.
Ericsson continues to believe that the modem technology, which it originally contributed to the JV, has a strategic value for the wireless industry.
| * | The Ericsson share of ST Ericsson’s results is accounted for according to the year, Ericsson’s market shares were well maintained, adjusted operating margin1) was slightly improved, and cash conversion was well above target.Grow faster than the market
In the economic slowdown, the market for GSM/WCDMA network equipment and related services is estimated to have declined by more than 10%. Ericsson’s sales for comparable units were down 9%, adjusted for currency effects2). A decline in Networks in line with the market was partly offset by an increase in Professional Services, driven by strong growth in managed services. Reported Multimedia sales increased by 5% for comparable units. The Multimedia market is still too fragmented to make relevant overall market growth estimates.
Best-in-class operating margins
Operating margin, excluding JV results and restructuring, improved slightly to 12% (11%) despite lower volumes and remained the highest among major listed competitors. Multimedia showed the greatest improvement, up significantly from breakeven levels in 2008.
Cash conversion of more than 70%
Cash conversion was well above the target at 117% (92%), reflecting management’s ongoing focus on improving working capital efficiency as well as a lower level of turnkey projects.
KEY DEVELOPMENTSequity method.
|
ERICSSON ANNUAL REPORT ON FORM 20-F 2012
LETTER FROM THE CEO
2012 was a year of growth in Global Services and Support Solutions, but more challenging for Networks. We have extended our leadership in several key growth areas and taken important steps in executing our strategy.
Our mission is “Innovating to empower people, business and society.”
Two billion subscribers supported by Ericsson 24 hours a day, 7 days a week.
Ericsson provides managed services to network operators which together serve 370 million subscribers.
1) | Excluding restructuring charges and share in earnings of JVs. |
2) | The impact of foreign currency is calculated based on exchange rate changes in 2009 compared to 2008. Releases under hedge accounting in 2008 and 2009 have also been excluded. |
ERICSSON ANNUAL REPORT ON FORM 20-F 2009
North America set to become Ericsson’s largest and fastest growing market.
Ericsson’s presence in North America elevated—Chief Technology Officer relocated to Silicon Valley.
Ericsson is the only supplier selected to participate in all major 4G/LTE projects.
A new brand launched with the value proposition: “Innovating to Empower”.
Both joint ventures make progress on returning to report profits.
| | |
FINANCIAL RESULTS IN SHORT | | |
| |
NET SALES
| | NET CASH |
| |
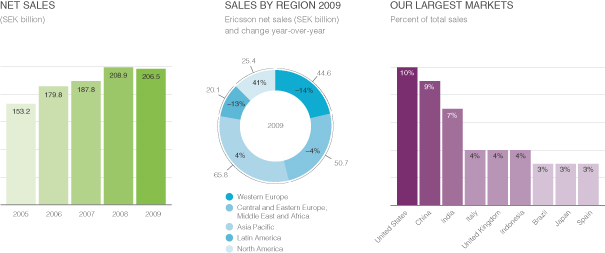
SEK 206.5 billion
| | SEK 36.1 billion (Dec. 31, 2009)
|
| |
OPERATING INCOME*
| | |
| |
SEK 24.6 billion
| | EARNINGS PER SHARE
|
| |
OPERATING MARGIN*
| | SEK 1.14 |
| |
12 percent
| | |
| | 
|
DEAR SHAREHOLDERS
We can look back at 2012 in which the strong growth of mobile data continued across the world and 4G/LTE launches started across all regions. Broadband is a transformative technology that is already improving quality of life, productivity and sustainability globally. During the year we have clearly seen how the world is moving towards our vision of a networked society, and over time, this will create new business opportunities for Ericsson and our customers.
Executing our strategy
The work to leverage our strength in the growth areas mobile broadband, managed services and operations and business support solutions (OSS and BSS) has continued with both selective acquisitions and divestments to enhance and streamline the portfolio.
Key acquisitions in the year that have contributed to strengthening our leadership include BelAir in the area of mobile broadband, ConceptWave and Telcordia in the area of OSS and BSS as well as Technicolor’s broadcast services division in the area of managed services.
In addition we completed the divestment of our share in Sony Ericsson and launched a new strategy for Support Solutions.
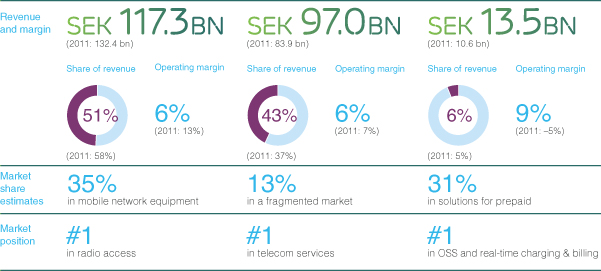
Our R&D and services investments form the foundation for the long-term strength of the company. Despite a challenging year for Networks, we remain almost the size of number two and three combined in the market when it comes to installed base of radio base stations and we have maintained a strong market share also in mobile network equipment. Global Services outperformed the market and solidified its leadership. In the fragmented telecom services market, Ericsson held a 13% market share for 2012, well ahead of its closest competitor.
ERICSSON ANNUAL REPORT ON FORM 20-F 2012
* | Excluding restructuring charges and share in earnings of JVs |
ERICSSON ANNUAL REPORT ON FORM 20-F 2009
LETTER FROM THE CEOOur joint venture ST-Ericsson had a tough year. Following the announcement of STMicroelectronics’ intention to exit as a shareholder, Ericsson will, together with STMicroelectronics, continue to explore various strategic options for ST-Ericsson assets. We continue to believe that the modem technology which we originally contributed to the JV has a strategic value to the wireless industry.
Performance in 2012
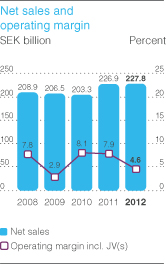
Sales in 2012 were flat compared to 2011, despite a challenging year for Networks.
Global Services contributed with both sales growth and stable operating profitability, and Support Solutions went from making losses in 2011 to achieving profitability.
Global Services and Support Solutions together represented close to 50% of Group sales, compared to 42% in 2011, highlighting the ongoing transformation into an ICT company combining services, software and hardware, into industry-leading solutions.
Profitability has been under pressure during the year due to operating losses in ST-Ericsson, the ongoing network modernization projects in Europe as well as the underlying business mix, with a higher share of coverage projects than capacity projects. Improving profitability has been a key priority throughout the year and we have taken actions globally to reduce costs and improve efficiency.
Throughout 2012 North America was our strongest region, driven by continued mobile broadband investments and a high demand for services. Our second largest region was North East Asia where sales grew in Japan, though not fully offsetting the lower sales of GSM in China and 3G in Korea.
Financial strength
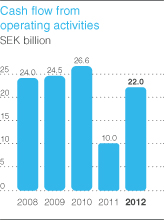
We continue to have high focus on capital efficiency. We ended the year with strong cash flow, full-year cash conversion well above target and maintained our strong net cash position.
Financial strength allows us to make selective acquisitions to capture opportunities to consolidate the market, gain market share and fill portfolio gaps when relevant, and provide a good return to shareholders. It is also a competitive advantage in our customer relationships.
The Board of Directors proposes a dividend for 2012 of SEK 2.75 (2.50) per share.
Sustainability and Corporate Responsibility
Ericsson is strongly committed to sustainability and corporate responsibility.
Focus remains on reducing our carbon footprint and in 2012 we exceeded our target. We see an increasing interest from customers in driving energy efficiency in their networks, and using broadband to shape the low-carbon economy of the future.
We continue to advocate the use of broadband to enable access to education, better health and livelihood through our partnerships and programs such as Connect To Learn and Ericsson Response.
Responsibility and high governance standards guide all Ericsson employees in all parts of the world. Our aim is to be the trusted partner to all of our stakeholders and as such we put strong focus on evolving our governance framework with further integration of sustainability and corporate responsibility principles.
ERICSSON ANNUAL REPORT ON FORM 20-F 2012
Our Code of Business Ethics was updated during the year to reflect our ongoing commitment to respect human rights and the new UN Guiding Principles on Business and Human Rights.
During 2012 we also signed the World Economic Forum’s Partnering Against Corruption Initiative, enhanced our anti-corruption program and broadened our whistle blower procedure.
Strong long-term drivers
We build our strength on the combination of our core assets: technology leadership, services leadership and global scale. We have strong and long-standing customer relationships and highly skilled and engaged employees. I have worked in this company for 24 years and the dedication and professionalism that Ericsson employees demonstrate never cease to impress me.
Our focus on profitable growth remains. While the macroeconomic and political uncertainty continues in certain regions, the industry fundamentals remain attractive. We have a strong portfolio, position and capabilities to continue to support our customers in a transforming ICT market and look forward to a year of leveraging our leadership position and continuing our journey into the networked society.
Hans Vestberg
LOOKING BACK
Dear fellow shareholders,
While the current economic environment affects all parts of society the longer-term fundamentals for our industry remain solid. Over the past decade the number of mobile subscriptions in the world has grown from some 700 million to over 4.5 billion. Mobile telephony is reaching a penetration beyond all expectations. Ten years ago it was all 2G; today 3G is the prevailing technology, mobile broadband is a reality and telecom is literally changing the world.
Ericsson has played a vital role in bringing the benefits of mobile broadband to the majority of the world’s population. What we do greatly improves people’s lives and society at large—in short, what we do shapes people’s lives and the world around us. One of my strongest memories is from the day we launched the network in Dertu, one of the Millennium Villages. Their chief, one of the camel drivers, came up to me and said, “Today our village is reborn”. People are now able to share ideas and information and accomplish things that were not possible before.
In the past ten years the telecom industry and Ericsson have transformed; from focus on voice to focus on internet, from hardware to software and from providing network equipment to providing solutions including services.
During the same period, many of our competitors have been forced to leave the arena and new ones have entered. We work harder than ever to outperform them and match our customers’ needs.
We have extended our leadership in mobile communications by building a highly successful services business which today accounts for almost 40 percent of our total Group sales. With less hardware, increased network complexity, and the move to all-IP, today is very much about making it work and supporting our customers in running and maintaining networks and realizing business models and rollout plans. During 2009 we captured additional strategic contracts in the services area and we now manage networks with 370 million subscribers.
The acquisition of Nortel’s CDMA business during 2009, on the heels of important breakthrough contract wins in North America, positioned Ericsson as the leading provider of telecoms technology and services in the United States and Canada. We have also firmly established ourselves in Silicon Valley where much of the internet development takes place.
We also gained strategic contracts for the radio standard LTE (Long-Term Evolution) which offers even greater network speeds and in December 2009 we passed another significant milestone with the worlds’ first commercial launch of an LTE network in Sweden.
“IN THE PAST TEN YEARS THE TELECOM INDUSTRY AND ERICSSON HAVE TRANSFORMED.”
The industry has changed and our ability to change with it, and indeed to lead the change, is perhaps our most important asset. New and compelling challenges lie ahead and as a company Ericsson must continue to drive the transformation of our industry.
My years as President and CEO of Ericsson have been the best of my professional career. Telecom is one of the most exciting industries to work in—so dynamic, challenging and competitive. I truly believe that telecom
ERICSSON ANNUAL REPORT ON FORM 20-F 2009
and the entire Information and Communication Technology (ICT) sector, particularly broadband networks, will form the backbone of the digital 21st century infrastructure, helping industries with the necessary reductions in their carbon footprint.
In closing, I will continue to follow and be involved in Ericsson’s development in my role as a Board member. I am proud and grateful to have had the opportunity to be at the helm of this great company and I will remember all the extraordinary people I have had the honor to work with, customers, partners and colleagues alike.
Carl-Henric Svanberg
Former President and CEO
ERICSSON ANNUAL REPORT ON FORM 20-F 2009
“IN THIS SEA OF CONNECTIVITY WE TAKE THE ROLE OF NAVIGATOR.”
LOOKING FORWARD
Dear shareholders,
2009 was a year of mixed trends and with varied operator investment behavior. Some markets were impacted by the financial climate while others continued to show growth.
Our Group sales for the full year, however, were flat and the operating margin increased slightly. Despite the challenging economic environment we maintained market shares, cash flow was good and our financial position remained strong. During the year we undertook significant cost reduction activities. These, in combination with large losses in our joint ventures, affected our earnings negatively. However, cost reductions will result in reduced cost base going forward and our joint ventures remain on track to return to profit.
It is now 2010 and we have a new decade ahead of us. A decade of new opportunities and new challenges. Telecoms is no longer about voice only. We do not just connect places and people. We also connect machines and devices. We connect the developing world to the developed world, rural areas to urban areas. Telecoms is the nervous system of the world.
In Ericsson we have a vision for this new decade—that there will be 50 billion connected devices. We will connect people with for example heart problems to remote monitoring systems so they can stay in the comfort of their homes, and we will connect our cars and trucks to smart road systems for safer driving and better fuel economy. Broadband networks will be the backbone of our smart cities, where houses will be connected so we can monitor and manage power consumption.
In this world the challenge will lie in dealing with the complexity of connecting all these devices. And we cannot fail. Patients must be able to rely on their health monitoring services. Transport companies must be sure that they can minimize gas consumption by smart routing and up-to-date traffic information.
In this sea of connectivity we take the role of navigator. We must support our customers and show them the way. This will require us to always put our customers first. Always have the best competence and drive innovation throughout the customer relationship.
Our business is about both technology and services. We have to be consultants; we have to be able to develop complex network management systems, we have to be able to integrate systems and solutions from many different suppliers and vendors. In addition, we should be able to deliver the best revenue management solutions and multimedia applications the consumers have ever seen. Everything must be based on IP software.
This new decade requires a lot from us. We will have to change our ways of working. Our success will be determined by our ability to see beyond technology, stay ahead of our customers and solve problems before they even arise.
In preparing ourselves to be successful in this new decade, we will need to continuously adjust to changing economic and competitive conditions while staying the course to our longer-term objectives. We will continue to proactively take actions to safeguard our financial position, leading technology and customer relationships. In order to drive shareholder value we focus on four financial targets; we want to grow the Company faster than the market, maintain best-in-class operating margins, have a healthy cash generation and grow earnings in the JVs.
ERICSSON ANNUAL REPORT ON FORM 20-F 2009
We have exciting developments ahead. The future will require us to be agile, brave and focused on performance in all we do.
I am proud and honored to lead Ericsson into a new decade where we will undoubtedly break new ground. Even more people and devices will share information across the world.
Hans Vestberg
President and CEO
ERICSSON ANNUAL REPORT ON FORM 20-F 20092012
MARKET TRENDS
Everything is going mobile. The uptake of mobile broadband, driven by increasing use of smartphones, tablets and apps is driving change for people, business and society.
Market trends 2012
USERS
Higher demand for data capacity due to:
Smartphone uptake acceleration
Increasing use of mobile broadband
Changing lifestyle with mobility and cloud-based services.
OPERATORS
Focus on:
Superior-performance broadband networks
Increasing efficiency through transformation and outsourcing
Creating new value streams from networks.
THE NETWORKED SOCIETY
In the networked society, connectivity will be the starting point for new ways of innovating, collaborating and socializing. It’s about creating freedom, empowerment and opportunity that will transform industries and society while helping find solutions to some of the greatest challenges facing our planet.
When one person connects, his or her world changes. With everything connected, our world changes. We believe ICT will be a fundamental driver of this transformation. For our customers the networked society will offer opportunities to expand their existing businesses, and to engage in new business areas, such as cloud services and industry-specific services.
Operators’ revenue growth and potential for efficiencies will steer their investments going forward. As a result, although the total addressable telecom market is growing at a modest pace, our portfolio momentum areas—mobile broadband, managed services as well as OSS and BSS—are set for higher growth.
Fundamentally, we believe the market is strong, fueled by higher smartphone penetration and growing mobile data usage. As a market leader, we understand the possibilities—and have the ability to drive rethinking, reinvention and innovation of our industry.
In 2012, mobile data traffic doubled. We expect it will continue to grow at a high rate in the coming years. The main driver is the change in user behavior, leading to increasing user expectations on network and application performance. Demand for greater mobile data capacity will also affect how operators choose to develop and operate networks and services.
CHANGING USER BEHAVIOR
The rapid increase in mobile data traffic will, in the coming years, be fuelled by three trends: increased smartphone uptake, the increasing use of mobile broadband, and the breakthrough of cloud-based services.
ERICSSON ANNUAL REPORT ON FORM 20-F 2012
Smartphone uptake is accelerating
While voice traffic is increasing at a steady rate, mobile data traffic is increasing exponentially. This increase is driven largely by smartphone use. Clearly phones are no longer simply for talking and texting—most of the time spent on a smartphone is dedicated to activities such as watching videos, playing games, shopping and engaging in social media.
Today 15–20% of the worldwide installed base of mobile phone subscriptions use smartphones—the number of smartphone subscriptions was 1.1 billion at the end of 2012 and we estimate that it will reach 3.3 billion by the end of 2018.
Mobile broadband use is increasing
People and businesses increasingly demand good network coverage, high-speed and high-quality broadband access at all times.
The number of mobile broadband subscriptions is increasing rapidly, from approximately 1.5 billion in 2012, to an estimated 6.5 billion in 2018. As the number of subscriptions increases, so does the data volume per subscription. By the end of 2018, we estimate that both mobile PCs and smartphones will generate four times as much data per device per month as today. Global mobile data traffic is estimated to grow twelve-fold between 2012 and 2018.
The largest contributor to increased data traffic is video, which is also watched on smartphones and tablets. Online video now constitutes on average 25–40% of traffic in mobile networks.
With the increasing use of ‘apps’, coverage is expected everywhere. But, when a user runs an app that requires higher performance (e.g. throughput) than needed for voice, the actual coverage area for the app will be smaller than that for voice.
In a network, every app has its own coverage area; a video application has a smaller coverage area than a music-streaming app which in turn has a smaller coverage area than voice.
Understanding of app coverage is therefore essential in order for operators to make the right investments in a network.
Cloud for availability everywhere
For many businesses and individuals, content is delivered as a cloud service—that is, as a service over the internet. Users see the benefits of accessing applications and data from any computer, phone or tablet anywhere, and at any time. Often they choose not to own the content but to stream it, gaining access to movies, TV, music and much more. Cloud-based services add to the demand for mobile capacity.
CHANGING OPERATOR NEEDS
The changes in how people, businesses and society at large operate, use the internet and interact will demand greater speed, capacity, quality of service and operational efficiency. To meet these demands, operators are upgrading their networks, revising how they can increase their operational efficiency and how they should best monetize the increased data traffic.
ERICSSON ANNUAL REPORT ON FORM 20-F 2012
Focus on superior-performance broadband networks
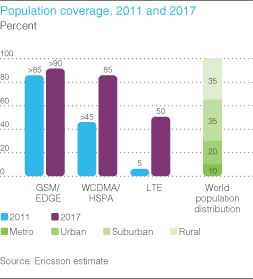
As user demand for coverage, speed and quality increases, superior-performance networks have become a key differentiator for operators. 3G/HSPA coverage is expected to increase from over 50% of the world’s population today, to 85% by the end of 2017. We anticipate that by 2017, half the world’s population will be covered by 4G/LTE networks. Operators come to Ericsson to expand network coverage and to upgrade networks for higher speed and capacity. To maintain superior performance there is also a continuous need for network tuning and optimization as traffic increases.
Focus on operational efficiency
To improve efficiency and reduce cost, operators increasingly choose to outsource the network and field operations, allowing them to focus on strategy, marketing and customer care. In a managed services project, Ericsson transforms the customer’s operations and implements our processes, methods and tools.
Monetizing data traffic
The demands created by mobile connectivity present new opportunities for operators. They are developing business models to monetize the increasing data use, with tiered pricing plans aligned to user needs, based for example on volume, time or speed. Increasingly, quality of service is becoming a differentiator for operators, as some focus on pure network development and others choose to be providers of premium services such as media, m-commerce and mobile finance.
Ericsson Operations Support Systems (OSS) enable the monitoring and optimization of the performance of operators’ increasingly complex networks and services, while our Business Support Systems (BSS) enable monetization of services and enhance their customer interaction capabilities.
ERICSSON ANNUAL REPORT ON FORM 20-F 2012
OUR COMPETITIVE ASSETS
The unique combination of core assets drives our performance throughout the business.
TECHNOLOGY LEADERSHIP
Combining superior performance and thought leadership
Innovation is an important element of our corporate culture and a foundation for our competitiveness. Our long-time pioneering in telecommunications technologies is reflected in one of the industry’s largest patent portfolios. Through research into new technologies and a strong contribution to the creation of open standards, we strive to be first-to-market with new solutions. Our networks are designed and optimized for superior end-user experience. They are built to accommodate future traffic increase and the increasing number of connected devices.
SERVICES LEADERSHIP
Meeting operator objectives of business efficiency & revenue growth
Service delivery is industrialized in four Global Services Centers and local resources in our ten regions, where we use the same processes, methods and tools. This ensures standardized services packages of high quality. Our services professionals have advanced multi-vendor and multi-technology competence. They create value for customers by improving network efficiency and user experience as well as by supporting them in business innovation and revenue growth.
GLOBAL SCALE
Combining global scale advantages with local presence
We have a geographically diversified business, with customers in more than 180 countries. We have established relationships with all major telecom operators in the world, supporting networks with over 2.5 billion subscriptions. Focus on global standards means that we can provide global products. Economies of scale in R&D and production ensure that the products are efficient and of high quality.
Ericsson’s core values
Our values are the foundation of our culture. They guide us in our daily work, in how we relate to each other and the world around us and in the way we do business.

ERICSSON ANNUAL REPORT ON FORM 20-F 2012
OUR PEOPLE
At the end of the day it is our people that make the real difference. Our people strategy centers on building the best talent in the industry.
Our people are at the heart of everything we do, and they made us the industry leader we are today.
But what brought us here will not keep us here. Our industry is changing, and we work every day to secure high performance in everything we do.
In order to maintain our technology and services leadership, and to leverage our global scale, we have developed a business-aligned people strategy.
Grounded on our core values—professionalism, respect and perseverance—our people strategy focuses on building the best talent in the industry. To achieve this we have four objectives:
Attract exceptional talent
We leverage a strategic and aligned approach to attracting the best talent at all levels in all the markets where we have employees.
Rigorous talent planning and development
Our objective is to have the right talent at the right time in the right place.
We have a rigorous process for identifying, calibrating and developing our talent. We have a comprehensive career and competence model that allows our employees to build career paths, and clearly understand how to keep developing capabilities for the continued success of the company.
Our approach emphasizes best-in-class learning solutions through our Ericsson Academy and on-the-job development through stretch assignments and internal mobility.
Leadership
We believe that strong leadership is a key factor in creating and maintaining a high performance work environment with a highly engaged workforce.
We expect our leaders to maintain an environment that fosters creativity, innovation and the constant flow of ideas. Our employees should have clear goals and receive continuous feedback and coaching. These are the drivers of high performance and employee engagement.
Diversity
We have a focused strategy aimed at ensuring that our employee base and our leadership teams are as diverse as the world in which we operate. We believe a diverse and inclusive workforce drives innovation and leads to high performing teams and superior business results.
ERICSSON ANNUAL REPORT ON FORM 20-F 2012
STRATEGY AND CUSTOMERS
We aim to become a leading information and communication technology (ICT) solutions provider by combining our core assets: technology leadership, services leadership and global scale.
VISION
The Company’s vision is to be the prime driver in an all-communicating world. Ericsson envisions a continued evolution, from having connected 6 billion people to connecting 50 billion ‘things’. The Company envisions that anything that can benefit from being connected will be connected, mainly via mobile broadband in the networked society that is beginning to come to life.
OUR STRATEGY
The Company’s strategy builds on a long-term vision and mission which is translated into a business strategy that should generate value for the Company’s key stakeholders; customers, employees and shareholders.
Four pillars form the foundation for our business strategy: Excel in Networks, Expand in Services, Extend in Support Solutions and Establish leading position in enablers of the networked society.
Excel in Networks
Networks’ strategic focus is on evolving networks from 2G to 3G to 4G with superior quality and performance. We secure a strong footprint in LTE and continue to assist operators in expanding their business by providing support for new business models and revenue streams.
We will expand our portfolio with heterogeneous networks in which Wi-Fi access will be part of our offering.
We will also utilize our large installed base of systems for mobile telephony to lead the transition to voice over LTE (VoLTE), where next-generation video and presence capabilities will be added to the traditional voice services.
We anticipate an array of “things” communicating, in addition to billions of people being connected. Mobile networks will thus increasingly carry more data and video, and we will evolve networks for the networked society through 4th-generation IP networks that are smart, scalable, simple and offer superior performance.
Expand in Global Services
In Global Services, we will leverage our momentum in sales and growth, and keep our focus on innovation, competence and cost control.
The focus area of innovation involves developing new business by capturing opportunities in new areas such as IT and broadcasting, as well as in new business models.
Competence is critical when expanding into an ICT market with a higher degree of complexity, with new competitors such as IT and professional services companies.
Cost control is supported by industrializing delivery, standardized services packaging and automated tools.
Our service delivery model enables us to provide services in the same way and with the same quality across the world. It also ensures that innovation and knowledge sharing are spread globally in an efficient way.
ERICSSON ANNUAL REPORT ON FORM 20-F 2012
Extend in Support Solutions
Segment Support Solutions focuses on building business in OSS and BSS, TV and Media management, as well as M-Commerce.
After the acquisitions of Telcordia and ConceptWave in 2012, we now have a full spectrum of OSS solutions from planning and engineering tools, through fulfillment and inventory tools and service assurance products. We now provide customers with the solutions to be best in class in plan-to-provision, lead-to-service and trouble-to-resolution.
We will continue to invest in our market-leading charging, billing and converged charging and billing solutions.
Our m-commerce business, focused on international remittance, builds on the strength in charging systems and our customers’ prepaid customer base.
Our TV and Media management offering comprises of compression, for both operators and media companies, and multiscreen TV & video, including IPTV, service enablement and service delivery platforms.
Establish leading position in enablers of a networked society
In the networked society anything that benefits from being connected will be connected. This development will be made possible through enablers such as solutions for machine-to-machine communications, modems from ST-Ericsson and IPRs.
We are shifting the focus from connected devices to enablers of a networked society. This is an area that will be developed over the coming years as we start investigating different opportunities both together with operator customers and with customers from other industries.
COMPANY TRANSFORMATION
We are going through a period of transformation and change – both in the industry and within the company. Two important areas of company-wide transformation are:
Go-to-market model
A new go-to-market model with ten regions and six global engagement practices was introduced in 2010, enabling us to expand engagements with customers into new areas, develop skills across our portfolio, and build momentum around global knowledge sharing.
This makes it possible for us to work even closer together with our customers, to understand their needs, while leveraging our global scale.
Lean and agile ways of working in R&D
One major undertaking to improve performance and efficiency in our R&D is to implement a lean and agile methodology. This is a way of working that includes shortened feedback loops, improved communication and rationalized processes.
Some product development projects have just begun the transition to lean and agile ways of working, while others are well advanced.
ERICSSON ANNUAL REPORT ON FORM 20-F 2012
OUR CUSTOMERS
Our business is defined by long-term relationships mainly with large telecom operators around the world. We serve approximately 400 customers. Globally, telecom operators represent the majority of net sales.
We also engage directly with customers in certain other industries such as utilities and media.
We have customers in more than 180 countries and have been present in many markets for more than 100 years. Our ten largest customers, of which half are multinational, account for 46% of net sales.
Our customers operate in a wide range of local economies and are at various technology stages. They have different business focuses depending on the maturity of their respective markets.
ERICSSON ANNUAL REPORT ON FORM 20-F 2012
OUR PORTFOLIO
We have the competence, the skills and the solutions our customers need to tackle the challenges of today and tomorrow. Here we feature our offering to telecom operators.
MOBILE BROADBAND
In summary
Evolving networks from 2G/GSM to 3G/WCDMA/HSPA and 4G/LTE
Helping operators meet demand for higher speed and capacity
Building heterogeneous networks where capacity demand is high, such as in cities.
Mobile broadband is playing an increasingly important role in our daily lives. It is changing the way we are entertained and educated, and helps us work, keep in touch, and share information and ideas, regardless of where we are. It has the power to lessen the divide between geographic regions and socioeconomic groups, and improve the quality of life in all parts of the world. Mobile data traffic almost doubled in 2012, driven particularly by video, new smartphone and tablet launches, and mobile PC users generating even more data traffic. Mobile data traffic is expected to grow at a high rate, presenting a significant opportunity for operators, both in mature and emerging markets. Operators need to enhance network quality by increasing coverage, speed and capacity, and by providing service differentiation to ensure they can monetize the ever-increasing consumer demands for mobile broadband, and the accompanying lifestyle expectations. We provide the network infrastructure, upgrades and LTE expansions and support solutions to meet these operators’ needs.
Network evolution
We were a key force behind the development of mobile technologies. Now our strategic focus is on evolving networks. With the evolution of the major mobile broadband technologies WCDMA/HSPA and LTE, true broadband performance and capacity is used to connect smartphones, PCs, tablets, sensors and machines to the internet and broadband services. With the high-speed, high-capacity mobile broadband possible through our WCDMA/HSPA and LTE offerings, operators can cost-effectively meet user demand for advanced internet services anywhere, anytime. We expect WCDMA/HSPA to be the predominant mobile broadband technology for many years to come. With the transition toward LTE, we take further steps towards greater capacity and higher throughput. LTE covers only 5–10% of global population today, but by 2017, we expect it will cover roughly half the people in the world. The ramp up of LTE is quicker than for earlier generations.
In addition, by 2017, densely populated urban areas, are expected to generate around 60% of total mobile traffic. To increase network capacity in these areas, we will build heterogeneous networks. Here, we complement powerful radio base stations with smaller radio base stations including Wi-Fi, which provide extra capacity in areas of high traffic loads, such as malls, transport hubs, hotels and offices.
Platform strength
Our network infrastructure is built on three main platforms:
The RBS 6000 multi-standard platform for radio base stations. The platform supports GSM/EDGE, WCDMA/HSPA, LTE and CDMA in a single unit. The RBS 6000 family ensures a smooth transition to new technology such as LTE. Upgrades and expansions involve mostly software and services, often delivered remotely. RBS 6000 now accounts for almost all of radio base station shipments.
The Ericsson Blade System platform for handling of network control functionality in fixed and mobile core networks.
ERICSSON ANNUAL REPORT ON FORM 20-F 2012
The SSR 8000 family of smart services routers for network gateways which provides two powerful differentiators for operators. It is a high-capacity router platform with multi-application capabilities, thus enabling better network performance; it also supports services across fixed and mobile networks.
All platforms offer cost-effective deployment and a future-secured evolution for capacity and functionality.
MANAGED SERVICES
In summary
Networks and business models becoming increasingly complex
Market pressures leading operators to enhance offerings while increasing efficiency
We build and manage networks, allowing operators to focus on strategy and customer attraction and retention.
Greater consumer expectations, and the upsurge in data traffic, demand greater network capacity and capability, which in turn lead to increased complexity, both in networks and their supporting business models. Maturing markets, intensified competition and stronger financial pressure lead to a need among telecom operators for greater service differentiation, enhanced offerings, and faster time to market, all at the same time as trying to reduce costs and increase efficiency.
This is where a managed services model comes into play. We take responsibility for activities telecom operators once handled in-house, from designing, planning and building a network, to managing its day-to-day operation. Operators can look to reduce costs and manage complexity through a partner such as Ericsson, who can take on a broader responsibility, and apply global best practices.
The world’s largest managed services provider
We handle complex issues such as convergence, quality and capacity management, while freeing up operator resources to focus on strategy, marketing and customer care. We can also help operators scale quickly and cost-effectively, and address new opportunities in cloud solutions and media offerings.
We manage networks with approximately 950 million subscribers in more than 100 countries.
The networks we manage are typically complex multi-vendor, multi-technology environments. More than 50% of the equipment we manage is non-Ericsson. Our four global service centers (GSCs) all house global network operation centers (GNOCs) for efficient remote network management.
Expanding the scope
We are expanding the managed services model to adjacent, growing industries such as TV/media and IT systems.
The television industry is clearly migrating towards the internet. Traditional broadcasting is being complemented or replaced by a multitude of communications technologies. Here we see the opportunity to extend the managed services model to be a true ICT service provider, covering the full broadcast chain.
ERICSSON ANNUAL REPORT ON FORM 20-F 2012
Operators also look for providers that can run and operate their entire IT systems and data centers. Consequently our managed services offering has expanded from network operations into IT Managed Services. This means Ericsson can run day-to-day operations IT systems and offer complete application life-cycle management, application development, and maintenance of both applications and infrastructure.
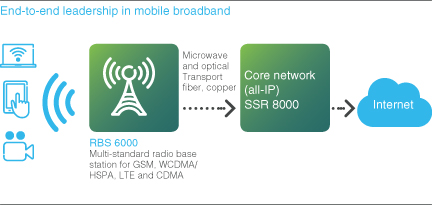
OPERATIONS AND BUSINESS SUPPORT SYSTEMS (OSS AND BSS)
In summary
We provide systems used for managing services, revenues and subscriber relationships
We help operators manage and monetize the increasing amount of data traffic
We help operators manage increasingly complex networks.
In the telecom industry, customers need change fast, driven by swiftly-evolving technology. Business models that once promised commercial success are being challenged. These are the reasons operations and business support systems (OSS and BSS) have become key areas of investment for operators.
OSS and BSS are the systems and services used for managing services, revenues and subscriber relationships. With the growth in mobile broadband, operators need to evolve their OSS and BSS solutions to monetize the increasing amount of data, and to manage increasing network complexity. Our solutions help operators optimize their services based on:
Customer experience, where understanding, acting and responding to changes in the way customers experience and use services helps meet their expectations
Business innovation, being able to adapt to and adopt different approaches
Business efficiency, consolidating systems and simplifying processes to manage the total cost of ownership.
Our OSS and BSS solutions have led change and created value through four generations of telecoms evolution. They are based on deep and broad experience in the business, and are now significantly strengthened by our acquisition of Telcordia. Solutions include:
Service differentiation—We provide the means for operators to improve customer loyalty and revenues as they are adopting new business models with tiered pricing plans for different speeds, data use or quality guarantees as well as personalized and improved customer experiences
Transformation—We support the transformation of operations through consulting, systems integration and software solutions, to help operators adapt to rapidly changing and competitive markets
ERICSSON ANNUAL REPORT ON FORM 20-F 2012
Assurance—We offer solutions for monitoring network performance, and for planning, building and optimizing networks, so operators can improve customer experience and secure revenue
Billing and revenue management—BSS solutions include those for revenue management and customer care. Our mobile money solution is pre-integrated with charging systems to help operators to lower churn, increase customer loyalty and reduce operating expenses.
This is OSS and BSS
Business Support Systems facilitate the relationship of the operator with their customers.
Operations Support Systems facilitate the operations of the operator’s network.
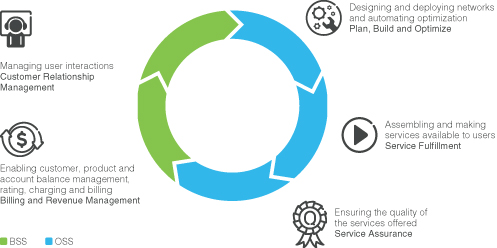
COMMUNICATION SERVICES
Operator-based services, based on industry standards, to ensure interoperability
IMS, HD voice and Voice over LTE (VoLTE) drive development.
Communication services are the services people use to interact with each other, such as voice and video calls as well as text and multimedia messaging. These operator-based services are provided globally and are based on industry standards, ensuring interoperability.
Users expect their communication services to provide a seamless, instantaneous experience across all devices and all subscriptions. This shift requires operators to provide new functionality and richer offerings.
Operators now exploit opportunities to enhance user experience while reducing costs for voice communication. Our IP Multimedia Subsystem (IMS) enables this. Services controlled by IMS include voice (including HD voice), messaging and video calls.
HD voice significantly improves quality of voice communication. It helps ensure that voice continues to provide revenue streams for operators of both fixed and mobile networks.
Voice over LTE (VoLTE) enables operators to offer voice services over all-IP LTE networks. It also brings with it new services such as HD video and richer multimedia services.
ERICSSON ANNUAL REPORT ON FORM 20-F 2012
FIXED BROADBAND AND CONVERGENCE
Our IP-based converged networks provide low-cost and high-performance services.
Strong growth in data traffic drives a need for higher capacity solutions, based on IP and Ethernet technologies. Operators compete by evolving their networks to provide fast internet speeds, reliable high-definition IPTV and video on demand. To reduce cost and enable service bundling, fixed traffic can be provided over a multiservice network converging telephony, internet and TV. Our 4th generation IP network portfolio supports IP-based services and applications at low cost and high performance.
TV AND MEDIA MANAGEMENT
A broad suite of standard-based products for digital TV, HDTV, video on demand, IPTV, mobile TV and content management.
TV is going digital and interactive. In the converging media landscape, broadcast and broadband are coming together. The worldwide digital TV market is growing rapidly.
With a broad suite of open standards-based products, we offer high-quality solutions for digital TV, HDTV, video on demand, IPTV, mobile TV and content management.
High-performance video means large amounts of traffic in the networks. This can be handled with our media distribution solution for video delivery over IP, combining a content distribution network with our TV portfolio.
Our IPTV network infrastructure offers a verified end-to-end solution from video head-end to broadband access, optimized for multi-stream HD-IPTV and on-demand video services. The solution also offers support for video to mobile handsets over HSPA and LTE networks.
Ericsson’s multiscreen TV solution combines the full features of IPTV, mobile TV and web TV with a common user interface. It fully integrates fixed line and wireless media for the first time.
Business consulting, systems integration and implementation ensure a smooth launch of new TV infrastructure and services.
ERICSSON ANNUAL REPORT ON FORM 20-F 2012
REGIONAL DEVELOPMENT
Ericsson is a truly global player, with customers in more than 180 countries. We have been present in many countries, such as China, Brazil and India, for more than 100 years.
LATIN AMERICA
Net sales: SEK 22.0 billion (+0%)
In 2012, all major operators chose their 4G/LTE suppliers resulting in an estimated market share for Ericsson of more than 50% in 4G/LTE.
NORTH AMERICA
Net sales: SEK 56.7 billion (+16%)
Development in North America has been strong across all segments, driven by operators’ demand for rollout of 4G networks as well as 3G capacity upgrades. A wide range of 4G devices are available to North American consumers and this fueled traffic growth and operators’ demand for network capacity. All Ericsson CDMA customers have transitioned to 4G/LTE.
NORTHERN EUROPE AND CENTRAL ASIA
Net sales: SEK 11.3 billion (–25%)
Lower operator investments during the year, primarily in Russia, impacted sales negatively.
WESTERN AND CENTRAL EUROPE
Net sales: SEK 17.5 billion (–8%)
Sales for Networks and Support Solutions declined due to cautious operator spending. Global Services sales increased slightly, driven by network modernization.
MEDITERRANEAN
Net sales: SEK 23.3 billion (–2%)
Sales for Networks and Support Solutions were negatively impacted by the macroeconomic environment in many countries, making operators more cautious with their investments. Global Services sales increased driven by network modernization projects.
MIDDLE EAST
Net sales: SEK 15.6 billion (+1%)
2012 was characterized by political unrest in some countries which made operators more cautious. Operators focused on network performance and efficiency which drove sales for Global Services.
SUB-SAHARAN AFRICA
Net sales: SEK 11.3 billion (+12%)
Sales increased in all segments mainly driven by rollout of 2G/GSM voice services. Mobile broadband penetration slowly increased with low-cost smartphone availability.
ERICSSON ANNUAL REPORT ON FORM 20-F 2012
INDIA
Net sales: SEK 6.5 billion (–34%)
India had a weak year, due to low activity levels with operator investments only in certain areas.
NORTH EAST ASIA
Net sales: SEK 36.2 billion (–5%)
Both Japan and South Korea are building country-wide 4G/ LTE networks. In Japan sales grew during 2012, while sales in Korea were negatively impacted by lower 3G revenues. China had focus on the coming 4G/LTE rollouts and GSM sales declined.
SOUTH EAST ASIA AND OCEANIA
Net sales: SEK 15.1 billion (+9%)
Sales growth was driven by 3G deployments in Indonesia, Thailand and the Philippines. Global Services developed well in Australia during the year.
OTHER
Net sales: SEK 12.3 billion (+15%)
Includes revenues generated across all regions, through licensing, sales of cables, broadcast services, power modules and other businesses.
ERICSSON ANNUAL REPORT ON FORM 20-F 2012
OUR PERFORMANCE
Our overall goal is to create shareholder value. We use a range of financial and non-financial targets to drive business performance.
| | | | | | |
| What we aim for | | GROWING SALES FASTER THAN THE MARKET | | BEST-IN-CLASS OPERATING MARGIN | | STRONG CASH CONVERSION |
| | | |
| Why we measure it | | Outperforming our market confirms the validity of our strategic direction. | | A clear focus on operating margins demonstrates our commitment to profitable growth. | | A strong cash position supports new business activity, enables appropriate acquisition opportunities and provides resilience to external economic volatility. |
Our performance | | 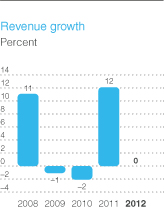
| | 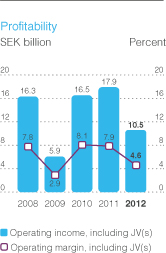 | | 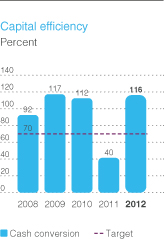
|
ERICSSON ANNUAL REPORT ON FORM 20-F 2012
| | | | | | |
| What we aim for | | GROWTH IN JV EARNINGS | | CUSTOMER SATISFACTION | | EMPLOYEE ENGAGEMENT |
| | | |
| Why we measure it | | The modem technology has a strategic value to the wireless industry. | | Customer satisfaction is a prerequisite for customer loyalty. We strive to ensure that our customers perceive us as a thought leader and their preferred business partner. | | Engaged employees are motivated to contribute to the success of Ericsson and are willing to go the extra mile to meet the organization’s goals. |
Our performance | | 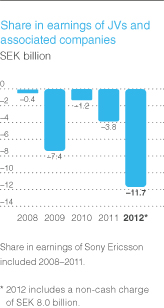 | | 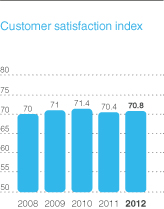 | | 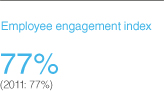
Our score is 8 percentage points higher than external benchmark average, as measured across over 250 companies. We started to measure the engagement index in 2011. |
ERICSSON ANNUAL REPORT ON FORM 20-F 2012
SUSTAINABILITY AND CORPORATE RESPONSIBILITY
Our approach to sustainability and corporate responsibility is integrated into our core business operations and in our relationship with stakeholders.
SUSTAINABILITY
Sustainability is about the “triple bottom line”:
Social equity; communication is a basic human need and should be available to everyone
Environmental performance; minimizing environmental impact and creating a low-carbon society
Economic prosperity; contributions to social and economic development.
We have implemented strong social, ethical and environmental standards. This commitment generates positive business impacts, which in turn benefit society.
Reducing environmental impact
The energy use of products in operation remains our most significant environmental impact. We also work to reduce our own environmental impact. Focus is on product energy efficiency and materials management as well as business travel, facilities and transport of our products. We have set a five-year target to reduce Ericsson carbon footprint intensity by 40% for products in operation and for our own operations and we have achieved it one year ahead of time.
We work proactively with our customers to encourage network and site energy optimization.
One aspect of our sustainability strategy is the role broadband can play in helping to offset global CO2 emissions.
70% of these are attributed to cities. We work on sustainable city solutions and are engaged in global climate policy.
Technology for Good
Our Technology for Good program is focused on applying Ericsson’s expertise, global presence and scale to find market-based solutions that empower people, business and society to help shape a more sustainable world. We have used our technology and competence to help achieve the Millennium Development Goals for more than a decade.
Through our volunteer program Ericsson Response™, we have played an active role in humanitarian disaster relief efforts.
CORPORATE RESPONSIBILITY
Corporate Responsibility is about managing risks to secure that Ericsson remains a trusted partner among our stakeholders.
Conducting business responsibly
We actively support the UN Global Compact, and endorse its principles regarding human and labor rights, anti-corruption and environmental protection.
ERICSSON ANNUAL REPORT ON FORM 20-F 2012
We have a Code of Business Ethics and a Code of Conduct which reflect responsible business practices. Promotion of these practices is reinforced by employee awareness training, workshops and monitoring.
Suppliers must comply with our Code of Conduct.
We continued to develop our anti-corruption program and broadened Ericsson’s whistleblower procedure.
ERICSSON ANNUAL REPORT ON FORM 20-F 2012
FIVE-YEAR SUMMARY
For definitions of the financial terms used, see Glossary, and Financial Terminology on page 234.and Exchange Rates.
Five-year summary
| SEK million | | 2009 | | Change | | 2008 | | 2007 | | 2006 | | 2005 | | | 2012 | | Change | | 2011 | | 2010 | | 2009 | | 2008 | |
| Income statement items | | | | | | | | | | | | | | | | | | | | | | | | | |
Net sales | | 206,477 | | | –1 | % | | 208,930 | | | 187,780 | | | 179,821 | | | 153,222 | | | | 227,779 | | | | 0 | % | | | 226,921 | | | | 203,348 | | | | 206,477 | | | | 208,930 | |
Operating income | | 5,918 | | | –64 | % | | 16,252 | | | 30,646 | | | 35,828 | | | 33,084 | | | | 10,458 | | | | –42 | % | | | 17,900 | | | | 16,455 | | | | 5,918 | | | | 16,252 | |
Financial net | | 325 | | | –67 | % | | 974 | | | 83 | | | 165 | | | 251 | | | | –276 | | | | — | | | | 221 | | | | –672 | | | | 325 | | | | 974 | |
Net income | | 4,127 | | | –65 | % | | 11,667 | | | 22,135 | | | 26,436 | | | 24,460 | | | | 5,938 | | | | –53 | % | | | 12,569 | | | | 11,235 | | | | 4,127 | | | | 11,667 | |
| Year-end position | | | | | | | | | | | | | | | |
Total assets | | 269,809 | | | –6 | % | | 285,684 | | | 245,117 | | | 214,940 | | | 209,336 | | | | 274,996 | | | | –2 | % | | | 280,349 | | | | 281,815 | | | | 269,809 | | | | 285,684 | |
Working capital | | 99,079 | | | –1 | % | | 99,951 | | | 86,327 | | | 82,926 | | | 86,184 | | |
Capital employed | | 181,680 | | | — | | | 182,439 | | | 168,456 | | | 142,447 | | | 133,332 | | |
Net cash | | 36,071 | | | 4 | % | | 34,651 | | | 24,312 | | | 40,728 | | | 50,645 | | |
Working capital as defined1) | | | | 100,619 | | | | –8 | % | | | 109,552 | | | | 105,488 | | | | 99,079 | | | | 99,951 | |
Capital employed as defined1) | | | | 176,653 | | | | –5 | % | | | 186,307 | | | | 182,640 | | | | 181,680 | | | | 182,439 | |
Gross cash as defined1) | | | | 76,708 | | | | –5 | % | | | 80,542 | | | | 87,150 | | | | 76,724 | | | | 75,005 | |
Net cash as defined1) | | | | 38,538 | | | | –2 | % | | | 39,505 | | | | 51,295 | | | | 36,071 | | | | 34,651 | |
Property, plant and equipment | | 9,606 | | | –4 | % | | 9,995 | | | 9,304 | | | 7,881 | | | 6,966 | | | | 11,493 | | | | 7 | % | | | 10,788 | | | | 9,434 | | | | 9,606 | | | | 9,995 | |
Stockholders’ equity | | 139,870 | | | –1 | % | | 140,823 | | | 134,112 | | | 120,113 | | | 101,622 | | | | 136,883 | | | | –4 | % | | | 143,105 | | | | 145,106 | | | | 139,870 | | | | 140,823 | |
Minority interests | | 1,157 | | | –8 | % | | 1,261 | | | 940 | | | 782 | | | 850 | | |
Non-controlling interest | | | | 1,600 | | | | –26 | % | | | 2,165 | | | | 1,679 | | | | 1,157 | | | | 1,261 | |
Interest-bearing liabilities and post-employment benefits | | 40,653 | | | — | | | 40,354 | | | 33,404 | | | 21,552 | | | 30,860 | | | | 38,170 | | | | –7 | % | | | 41,037 | | | | 35,855 | | | | 40,653 | | | | 40,354 | |
| Other information | | | |
Earnings, per share, basic, SEK | | 1.15 | | | –68 | % | | 3.54 | | | 6.87 | | | 8.27 | | | 7.67 | | |
Earnings, per share, diluted, SEK | | 1.14 | | | –68 | % | | 3.52 | | | 6.84 | | | 8.23 | | | 7.64 | | |
Per share indicators | | | | | | | | | | | | | | |
Earnings per share, basic, SEK | | | | 1.80 | | | | –53 | % | | | 3.80 | | | | 3.49 | | | | 1.15 | | | | 3.54 | |
Earnings per share, diluted, SEK | | | | 1.78 | | | | –53 | % | | | 3.77 | | | | 3.46 | | | | 1.14 | | | | 3.52 | |
Cash dividends per share, SEK | | 2.00 | 1) | | 8 | % | | 1.85 | | | 2.50 | | | 2.50 | | | 2.25 | | | | 2.75 | 2) | | | 10 | % | | | 2.50 | | | | 2.25 | | | | 2.00 | | | | 1.85 | |
Stockholders’ equity per share, SEK | | 43.79 | | | –1 | % | | 44.21 | | | 42.17 | | | 37.82 | | | 32.03 | | | | 42.51 | | | | –5 | % | | | 44.57 | | | | 45.34 | | | | 43.79 | | | | 44.21 | |
Number of shares outstanding (in millions) | | | | | | | | | | | | | | | | | | | | | | | | | |
—end of period, basic | | 3,194 | | | — | | | 3,185 | | | 3,180 | | | 3,176 | | | 3,173 | | |
—average, basic | | 3,190 | | | — | | | 3,183 | | | 3,178 | | | 3,174 | | | 3,169 | | |
—average, diluted | | 3,212 | | | — | | | 3,202 | | | 3,193 | | | 3,189 | | | 3,181 | | |
end of period, basic | | | | 3,220 | | | | — | | | | 3,211 | | | | 3,200 | | | | 3,194 | | | | 3,185 | |
average, basic | | | | 3,216 | | | | — | | | | 3,206 | | | | 3,197 | | | | 3,190 | | | | 3,183 | |
average, diluted | | | | 3,247 | | | | — | | | | 3,233 | | | | 3,226 | | | | 3,212 | | | | 3,202 | |
| Other information | | | | | | | | | | | | | | |
Additions to property, plant and equipment | | 4,006 | | | –3 | % | | 4,133 | | | 4,319 | | | 3,827 | | | 3,365 | | | | 5,429 | | | | 9 | % | | | 4,994 | | | | 3,686 | | | | 4,006 | | | | 4,133 | |
Depreciation and write-downs/impairments of property, plant and equipment | | 3,502 | | | 13 | % | | 3,105 | | | 2,914 | | | 3,038 | | | 2,438 | | | | 4,012 | | | | 13 | % | | | 3,546 | | | | 3,296 | | | | 3,502 | | | | 3,105 | |
Acquisitions/capitalization of intangible assets | | 11,413 | | | — | | | 1,287 | | | 29,838 | | | 18,319 | | | 2,250 | | | | 13,247 | | | | — | | | | 2,748 | | | | 7,246 | | | | 11,413 | | | | 1,287 | |
Amortization and write-downs/impairments of intangible assets | | 8,621 | | | 55 | % | | 5,568 | | | 5,459 | | | 4,479 | | | 3,364 | | | | 5,877 | | | | 7 | % | | | 5,490 | | | | 6,657 | | | | 8,621 | | | | 5,568 | |
Research and development expenses | | 33,055 | | | –2 | % | | 33,584 | | | 28,842 | | | 27,533 | | | 24,059 | | | | 32,833 | | | | 1 | % | | | 32,638 | | | | 31,558 | | | | 33,055 | | | | 33,584 | |
—as percentage of net sales | | 16.0 | % | | — | | | 16.1 | % | | 15.4 | % | | 15.3 | % | | 15.7 | % | |
as percentage of net sales | | | | 14.4 | % | | | — | | | | 14.4 | % | | | 15.5 | % | | | 16.0 | % | | | 16.1 | % |
| Ratios | | | | | | | | | | | | | | | |
Operating margin excluding joint ventures | | 6.5 | % | | — | | | 8.0 | % | | 12.5 | % | | 16.7 | % | | 20.1 | % | |
Operating margin excluding joint ventures and associated companies | | | | 9.7 | % | | | — | | | | 9.6 | % | | | 8.7 | % | | | 6.5 | % | | | 8.0 | % |
Operating margin | | 2.9 | % | | — | | | 7.8 | % | | 16.3 | % | | 19.9 | % | | 21.6 | % | | | 4.6 | % | | | — | | | | 7.9 | % | | | 8.1 | % | | | 2.9 | % | | | 7.8 | % |
EBITDA margin | | 8.7 | % | | — | | | 11.9 | % | | 20.8 | % | | 24.1 | % | | 25.4 | % | |
EBITA margin as defined1) | | | | 6.6 | % | | | — | | | | 9.9 | % | | | 11.0 | % | | | 6.7 | % | | | 9.4 | % |
Cash conversion | | 117 | % | | — | | | 92 | % | | 66 | % | | 57 | % | | 47 | % | | | 116 | % | | | — | | | | 40 | % | | | 112 | % | | | 117 | % | | | 92 | % |
Return on equity | | 2.6 | % | | — | | | 8.2 | % | | 17.2 | % | | 23.7 | % | | 26.7 | % | |
Return on capital employed | | 4.3 | % | | — | | | 11.3 | % | | 20.9 | % | | 27.4 | % | | 28.7 | % | |
Return on equity as defined1) | | | | 4.1 | % | | | — | | | | 8.5 | % | | | 7.8 | % | | | 2.6 | % | | | 8.2 | % |
Return on capital employed as defined1) | | | | 6.7 | % | | | — | | | | 11.3 | % | | | 9.6 | % | | | 4.3 | % | | | 11.3 | % |
Equity ratio | | 52.3 | % | | — | | | 49.7 | % | | 55.1 | % | | 56.2 | % | | 49.0 | % | | | 50.4 | % | | | — | | | | 51.8 | % | | | 52.1 | % | | | 52.3 | % | | | 49.7 | % |
Capital turnover | | 1.1 | | | — | | | 1.2 | | | 1.2 | | | 1.3 | | | 1.2 | | | | 1.3 | | | | — | | | | 1.2 | | | | 1.1 | | | | 1.1 | | | | 1.2 | |
Inventory turnover days | | 68 | | | — | | | 68 | | | 70 | | | 71 | | | 74 | | | | 73 | | | | — | | | | 78 | | | | 74 | | | | 68 | | | | 68 | |
Trade receivables turnover | | 2.9 | | | — | | | 3.1 | | | 3.4 | | | 3.9 | | | 4.1 | | | | 3.6 | | | | — | | | | 3.6 | | | | 3.2 | | | | 2.9 | | | | 3.1 | |
Payment readiness, SEK million | | 88,960 | | | 5 | % | | 84,917 | | | 64,678 | | | 67,454 | | | 78,647 | | | | 84,951 | | | | –2 | % | | | 86,570 | | | | 96,951 | | | | 88,960 | | | | 84,917 | |
—as percentage of net sales | | 43.1 | % | | — | | | 40.6 | % | | 34.4 | % | | 37.5 | % | | 51.3 | % | |
as percentage of net sales | | | | 37.3 | % | | | — | | | | 38.1 | % | | | 47.7 | % | | | 43.1 | % | | | 40.6 | % |
| Statistical data, year-end | | | | | | | | | | | | | | | |
Number of employees | | 82,493 | | | 5 | % | | 78,740 | | | 74,011 | | | 63,781 | | | 56,055 | | | | 110,255 | | | | 5 | % | | | 104,525 | | | | 90,261 | | | | 82,493 | | | | 78,740 | |
—of which in Sweden | | 18,217 | | | –10 | % | | 20,155 | | | 19,781 | | | 19,094 | | | 21,178 | | |
of which in Sweden | | | | 17,712 | | | | 1 | % | | | 17,500 | | | | 17,848 | | | | 18,217 | | | | 20,155 | |
Export sales from Sweden, SEK million | | 94,829 | | | –13 | % | | 109,254 | | | 102,486 | | | 98,694 | | | 93,879 | | | | 106,997 | | | | –8 | % | | | 116,507 | | | | 100,070 | | | | 94,829 | | | | 109,254 | |
| 1) | These financial measures as defined by us may constitute non-IFRS measures. For 2009,a reconciliation to the most directly comparable IFRS measures, see pages 262–266. |
| 2) | For 2012, as proposed by the Board of Directors. |
ERICSSON ANNUAL REPORT ON FORM 20-F 20092012
LETTER FROM THE CHAIRMAN
DEAR SHAREHOLDER,SHAREHOLDERS
As we head into 2010 and a new decade, we should considerIt is now almost two years since I assumed the phenomenal transformationrole as Chairman of the telecoms industry over the past decade, including the convergenceBoard of Ericsson, and looking back they have certainly been interesting years. The rapid pace of change of the telecom, IT and media industries. Through thisindustry and the explosive development in fixedtransformative power of the technology are two reasons why I find this role so interesting and mobile internet usage, mobile communications has had a remarkable growth, withinspiring.
A year of strategy execution
During 2012, the number of subscribers increasing from 700 million in 2000Company continued to more than 4.5 billion in 2009. Significant consolidation has occurred among operatorsstrengthen its core assets; technology and services leadership as well as equipment suppliers.global scale. A key event during the year was the completion of the divestment of Sony Ericsson. In addition, the Company has strengthened and streamlined its portfolio through a few strategic acquisitions and divestments.
I would likeBoard discussions
During the year, the Board has closely monitored the overall market conditions for Ericsson such as macroeconomic development, customers’ financial performance and strategy as well as the competitive landscape among ICT vendors. It is important for us to express my sincere thanks to Carl-Henric Svanbergunderstand how potential moves by competitors, both commercial and technological, might change the landscape and the relative strength of the company.
A main focus area for his outstanding helmsmanshipthe Board of Directors during his time with the Company. Ericsson’s key to success during these yearsyear has been Carl-Henric Svanberg’s willingness to seek opportunity through changeEricsson’s financial performance and proactively address challenges.working capital development. Commercial management and the balance between market share gains and profitable growth have been key topics.
The Board has also closely monitored the work during the year to find the best solution for ST-Ericsson assets given the strategic options at hand.
Strong financial position
One of the Board’s workkey areas of responsibility is to manage the Company’s financial position. The Company has a strong balance sheet and we believe it is appropriate to remain fairly conservative considering the continued macroeconomic uncertainty in 2009 had a significant focus on strategic matters. Ericsson’s strategy to leverage its leading position and technological prowessparts of the world. We will, as before, consider selective acquisitions but prefer to invest in future growth areas remains unchanged.
The key future opportunity forfurther strengthening the industry and Ericsson will be the increased traffic generated by mobile broadband, driven by internet and social media, and a shift from connecting places and people to connecting devices and applications. Systems integration skills and application enablers will play an increasingly important role in this market development. The Company intends to build a strong position in these areas to complement the current leadership in network technologies and operations.
Operator and consumer sensitivity to the macro-economy is an important factor closely monitored by the Board. During 2009, Ericsson was affected in the second half by the economic downturn as many operators reduced their network investments. This was largely offset by good sales in the first half and by increasing sales of services and multimedia solutions. The Board also addressed the Company’s restructuring program, the Nortel acquisition, and the expanded presence in Silicon Valley to support acceleration of the move to all-IP technology. Through key contract wins and the acquisition of parts of Nortel, Ericsson became the largest supplier of network technology and services in North America.leadership and its offering to the market.
Ericsson’s joint ventures Sony EricssonThe Company’s dividend policy takes into account last year’s earnings and ST-Ericsson were strongly affected by the market decline, and forceful actions have been taken to restore their profitability.
That said, I believe Ericsson remains well positioned in relation to its peers, with sustained revenues and margins and in certain areas increased market shares, a healthy balance sheet structure, as well as coming years’ business plans and expected economic development. Based on this, the Board proposes a dividend increase of 10%.
Importance of corporate governance
Good corporate governance is the basis for building a robust corporate culture. However, corporate governance is not only about efficient and reliable controls and procedures. It is also about adherence to strong principles of responsible business practice by all employees. Over time this strengthens the business, which in turn generates shareholder value. Ericsson has a strong cash position. This enables the Company to pursue emerging opportunities created by the market situation.
The debate around executive compensation has intensified. Benchmarking with global companies similar to Ericsson shows that we have a conservative but competitive compensation structure that rewards performanceportfolio for value creation at large, and effectively aligns employees’ longer-term interests with those of shareholders’.strong social, environmental and governance standards supporting risk management.
I am confident that these principles remain appropriate and reasonable.
Looking to the future, I welcome Hans Vestberg as our new CEO and wish him all the best in his new role. The Board and I are convinced that Hans has the qualities it takes to lead Ericsson, and we give him and his new team our full support.
Change and challenge seemproud to be the by-words for the world today. If embracing change and proactively addressing challenges brings rewards, then the coming years certainly look exciting for Ericsson.
I sincerely appreciate your support during the year.
Michael Treschow
Chairman of the Board of this Company with so many dedicated and competent people working hard every day, to stay the leader in this rapidly changing market.
Leif Johansson
Chairman of the Board of Directors
ERICSSON ANNUAL REPORT ON FORM 20-F 20092012
BOARD OF DIRECTORS’ REPORT 2009
This Board of Directors’ Report is basedTRENDS AND DRIVERS
Major industry trends in 2012 were operators focus on Ericsson’s consolidated financial statements, preparedhigh-performance mobile broadband networks and their focus on increasing the operational efficiency. Tiered pricing and new business models continued to be high on our customers’ agendas. In Europe, the network modernization projects continued the rapid implementation. In North America, Japan and Korea, major LTE rollouts took place.
Across the globe, operators continued to focus on increasing their operational efficiency and reducing their operating expenses. Their focus on operational efficiencies together with transformation activities in accordance with IFRS as issued by the IASB. The application of reasonable but subjective judgments, estimatesvoice, IP and assumptions to accounting policiesOSS and procedures affects the reported amounts of assetsBSS domains drove demand for consulting and liabilities and contingent assets and liabilities at the balance sheet datesystems integration as well as the reported amountsmanaged services.
When developing its internal plans, Ericsson looks at a number of revenuesparameters that have an impact on data traffic. These include:
Smartphone subscriptions, as a percentage of total subscriptions
Mobile broadband subscriptions, as a percentage of total mobile subscriptions
Average data traffic and expenses during the reporting period. These amounts could differ materially under different judgments, assumptionspeaks in traffic.
Mobile subscriptions and estimates. Please see Note C2—“Critical Accounting Estimates and Judgments” (p. 66).smartphones
Also non-IFRS measures are used to provide meaningful supplemental information to the IFRS results. Non-IFRS measures are designed to facilitate analysis by indicating Ericsson’s underlying performance, however, these measures should not be viewed in isolation or as substitutes to the IFRS measures. A reconciliation of non-IFRS measures with the IFRS results can be found on page 17.
This report includes forward-looking statements subject to risks and uncertainties. Actual developments could differ materially from those described or implied. Please see “Forward-Looking Statements” (p. 150) and “Risk Factors” (p. 142).
The external auditors review the quarterly interim reports, perform auditsToday, 15–20% of the Annual Report and report their findingsworldwide installed base of mobile phone subscriptions use smartphones. About 40% of all mobile phones sold during 2012 were smartphones, compared to the Board and its Audit Committee.
The terms “Ericsson”, “the Group”, and unless the context reasonably requires otherwise, also “the Company”, all refer to Telefonaktiebolaget LM Ericsson and its subsidiaries. Unless otherwise noted, numbers in parentheses refer to the previous year (i.e. 2008).
CONTENTSaround 30% for 2011. With less expensive smartphones being introduced, there is considerable room for further uptake.
Ericsson estimate
Mobile broadband subscriptions and population coverage
Mobile network coverage is constantly increasing. GSM/EDGE technology has the widest reach and covers more than 85% of the world population.
WCDMA/HSPA covers more than 50% of the world population. Further build out of WCDMA/HSPA coverage will be driven by factors such as demand for internet access and affordability of smartphones. By 2017, Ericsson estimates that 85% of the world’s population will have access to WCDMA/HSPA.
All WCDMA networks deployed by Ericsson have been upgraded to HSPA of various speeds.
Despite being in the early days, LTE networks can already provide downlink peak rates of around 100 Mbps. There are around 60 LTE networks in commercial operation. By 2017, Ericsson estimates that 50% of the world’s population will have LTE coverage.
Regions have different radio technology mixes dependent on maturity level. Less mature regions are dominated by 2G technologies while more mature regions are dominated by HSPA. LTE is growing strongly, particularly in North America, where LTE is forecasted to be the leading radio technology before 2018. The fast growth in LTE subscriptions is driven by strong competition and consumer demand, following CDMA operators’ decisions to migrate to LTE.
ERICSSON ANNUAL REPORT ON FORM 20-F 20092012
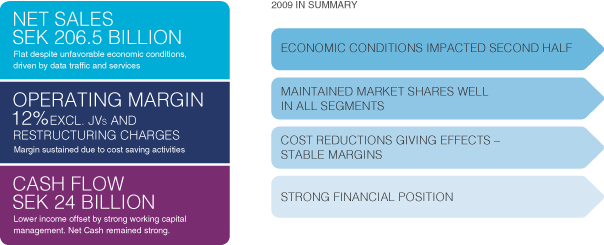
BUSINESS DRIVERS 2009Data traffic
Five major trends affected our markets and operations in 2009:
AcceleratedAccess to the internet from mobile devices continues to drive mobile traffic development. In 2012, mobile data growthtraffic continued the trend of doubling each year. Ericsson estimates that mobile data traffic will grow 12 times between 2012 and 2018. The increasing data traffic will drive the need for more capacity in mobile broadband networks.
Data traffic in developed marketsper subscriber is increasing dramatically, generating sales for additional network capacity.partly dependent on the screen size of the user’s device. Resolution is also a factor. On average, a mobile PC generates about seven times more data traffic than a smartphone.
| | | | | | | | |
Average mobile data traffic | |
| | 2012 | | | 2018
Forecast | |
Monthly data traffic per PC | | | 3 GB | | | | 11 GB | |
Monthly data traffic per tablet | | | 0.6 GB | | | | 2.7 GB | |
Monthly data traffic per smartphone | | | 0.45 GB | | | | 1.9 GB | |
Ericsson estimate
Network modernizationBUSINESS IN 2012
Strong year for services
With strong growth in Global Services and IPSupport Solutions in 2012, Ericsson took further steps in establishing itself as a leading ICT player. Networks sales declined 2012 following a strong 2011.
Many operators started migrationIn the coming years, Ericsson expects software sales to all-IP core networks.gradually increase as radio expansions and upgrades, IP and OSS and BSS materialize. This development will result in more recurring revenues from software and services business as well as less capital utilization.
Technology shift—2G/3G/4G
In 2009, Ericsson’s 3G sales surpassed 2G, however not yet offsetting the decline in GSM. The first commercial LTE (Long-Term Evolution) network was launched.
Impact from economic conditions
Demand for telecom infrastructure started to decline mid-2009, affecting sales in Networks—particularly in some developing markets, where the general economic downturn was exacerbated by weak currencies.
Operator focus on efficiency
Sales of services increased, not only managed services but also consulting and systems integration, driven by higher network complexity and operator focus on cost reductions.
North America
During 2009, Ericsson significantly strengthened its position in North America. A number of key contracts were won: LTE with Verizon and Metro PCS, the largest managed services contract ever with Sprint and a domain supplier agreement with AT&T for wireline access products. The Company also acquired Nortel’s CDMA and LTE businesses in North America.
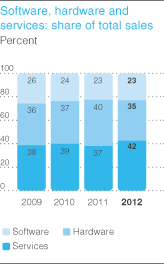
ERICSSON ANNUAL REPORT ON FORM 20-F 20092012
Tough timesHigh share of coverage projects
Ericsson’s gross margin and the amount of required capital employed vary with project type. When building network coverage, projects are often of a turnkey character. Generally there are more hardware and network rollout services in coverage projects, resulting in lower gross margin and a larger capital utilization.
During 2012, Ericsson was in a phase with a high share of coverage projects. Sales for 2012 showed a higher share of services and a lower share of hardware. This reflects the good momentum in services throughout the year, reduced CDMA infrastructure business and impact from network modernization projects in Europe.
Network modernization in Europe
The modernization of networks in Europe became an opportunity for the JVsCompany in mid-2010 when operators in Europe started to consider replacing old 2G and 3G equipment with multi-standard radio equipment.
Both Sony Ericsson that had lost out on market share in 3G compared to its strong 2G position, identified this as an opportunity to regain footprint. Competition for new footprint is always tough and ST-Ericsson were impacted by the decline in handset demand in 2009. Sony Ericsson’s situationa strategic decision was worsened by an aging product portfolio. Both JVs reported lossestaken to accept short-term profitability pressure to increase technology and initiated aggressive cost restructuring programs and are on track to return to report profits. New CEOs and chairmen of the Boards were appointed in both JVs.
ICTservices leadership. As a result, market share has increased and the climateCompany has further strengthened its leading market position in Europe. Average project duration for these modernization projects is 18–24 months and the first projects were completed in late 2012. The negative impact from network modernization projects in Europe will continue to gradually decline during 2013 as projects are finalized.
Acquisitions, partnerships and divestments
In 2009, climate change wasThe Company’s strategy is to focus on the agendaorganic growth and be selective with acquisitions. Acquisitions might be considered for governments. During the year, Carl-Henric Svanberg addressed the UN, promoting that a focused utilization of ICT solutions could reduce CO2 emissions by 15-20 percent. The ICT industry in itself contributes less than 2 percent to the emissions.
Telecomthree purposes: if there is a long-termcrucial opportunity to consolidate the Company’s market position, to fill portfolio gaps, or to enter new growth industry
The Company is convinced thatareas. In 2012, the factors driving industry growth are robust and should result in continued increased demand. The growth will be driven by the combined effects of the following:following activities were announced:
Subscriber growthCompletion of the acquisition of Telcordia
Completion of the divestment of the 50% stake in emerging markets, supported by cheaper handsets.Sony Ericsson Mobile Communication AB to Sony in February. The divestment was effective on January 1, 2012
Increased coverage and use.ownership in Ericsson-LG, now holding 75%
Ever faster mobile broadband communications, improving user efficiency and experiences.Acquisition of Canadian telecom-grade Wi-Fi company BelAir Networks
Data traffic driven by IP-based mobile broadband; in developed markets driven by the convenienceAcquisition of mobility, and in emerging markets by the lack of fixed broadband access.Technicolor’s broadcast services division
NewDivestment of EDA 1500 GPON portfolio to Calix, Inc.
Acquisition of Canadian ConcepStWave in the OSS and BSS domain
Divestment of the multimedia applications and communication between various new devices.brokering platform (IPX) to Gemalto.
Competition
Competition remained intense. After the consolidation in recent years, there are fewer vendors—all with comprehensive product portfolios. Ericsson has maintained or increased its market shares during the year.
OPERATIONAL GOALS AND RESULTSFair return on R&D investment
In the networked society, Ericsson aims toenvisions that anything that benefits from being connected will be the preferred business partner to its customers with an ultimate goal of sustainable long-term value creation. Faster than market sales growth, a best-in-class operating margin and a healthy cash conversion are key to the fulfillment of this goal.
As a market leader, Ericsson combines leading technology and services skills to develop superior solutions that deliver competitive advantage. Ericsson believes that highly satisfied customers and empowered and motivated employees are key to success. Several annual key performance indicators are used regarding shareholder value creation, customer satisfaction and employee engagement.
Shareholder value creation
Although margins in 2009 remained below historic levels, the Company strengthened its market position in strategically important areas, such as: LTE/4G technology and commercial contracts, market share in the US and managed services. This combined with a strong balance sheet, efficient and leaner processes after ambitious restructuring, and continued strong customer relations provided the means for value creation also in the macro-economic headwind. The share price increased during the year and a dividend was paid for a total shareholder return of 15 percent in 2009.
connected.ERICSSON ANNUAL REPORT ON FORM 20-F 20092012
In this scenario, Ericsson foresees new entrants to the connectivity markets, from device and equipment manufacturers as well as from other industries. Any company that provides wireless connectivity today is likely to require a license to Ericsson’s patents. The Company believes it is the strongest holder of essential patents in the wireless industry. Ericsson has more than 100 patent license agreements and is a net receiver of royalties. The Company’s product portfolio is well licensed, which is beneficial to its customers.
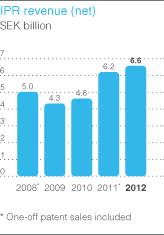
| * | Ericsson’s key network equipment market includes Radio, i.e. 2G, 3G, 4G RAN including CDMA, public WLAN access and OSS for mobile. IP and Transport includes IP Edge, packet core, microwave, opto metro and OSS for fixed. Core includes circuit-switched core, IMS, user data management and machine-to-machine. |
Cash generation
A tight focus is kept on the cash generation of the Company and its working capital. Working capital decreased by –8% mainly due to lower inventories at year-end. The balance sheet is strong and the cash position sufficiently large to ensure the financial flexibility to invest in future growth and to capture business opportunities. The earnings and balance sheet structure makes it possible for the Board of Directors to propose to increase the dividend. This proposal reflects earnings and balance sheet structure in 2012, as well as coming years’ business plans and expected economic development, according to Ericsson’s dividend policy.
Cost and efficiency
The Board of Directors has paid extra attention to commercial management and the balance of market share gains with profitable growth. In addition, the Company has also taken a number of initiatives to reduce cost and increase capital efficiency. Among these is the multi-year program to reduce cost by industrializing service delivery, implementing more lean and agile ways of working in software development as well as improving the order-to-cash process. The Company will also continue to optimize capital expenditures and debt management.
TARGETS AND PERFORMANCE
Ericsson’s overall goal is to create shareholder value. Management uses severalfour financial metrics to monitor performance:evaluate the Company’s long-term ambitions:
Faster than market salesSales growth
Ericsson’s sales for comparable units decreased by 9 percent, adjusted for currency and hedging effects. Due to the effects of the economic slowdown and to weaker demand for GSM equipment, the market for GSM/WCDMA equipment and related services is estimated to have declined by more than 10 percent in USD terms. Segment Networks’ sales for comparable units in constant currencies declined in line with the market. Based on external analyses and reported results by Ericsson and its main competitors, the Company believes its market shares were well maintained. A number of breakthrough contracts were signed which should enable the Company to grow faster than the market. Salesmarket
Best-in-class operating margin
Growth in Professional Services grewjoint ventures’ earnings
ERICSSON ANNUAL REPORT ON FORM 20-F 2012
The Board of Directors has translated these metrics into three performance criteria in the Executive Performance Stock Plan, included in the Company’s Long-Term Variable (LTV) remuneration program. These performance criteria have been approved by 8 percentthe Annual General Meeting.
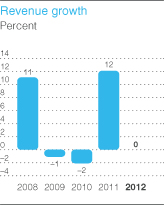


ERICSSON ANNUAL REPORT ON FORM 20-F 2012
Long-term ambitions
Grow faster than the market
Ericsson maintained its share of global installed base of radio base stations at close to 40%.
In 2012, Ericsson widened the definition* of the equipment market to also reflect the R&D investments during the past years. For the equipment market, which includes the key segment of Radio, IP and Transport as well as Core, preliminary market data indicates that the market share was 24%, down from 27% in local currencies. Sales2011. The decline is due to a lower market share in the mobile network equipment market, at 35%, down from 38% in 2011, negatively impacted by the technology shift in China where investments are moving from GSM to other technology areas where Ericsson has limited presence.
Ericsson’s global market share for comparable parts of Multimedia grew by 5 percent. The overall market growth for MultimediaLTE is difficult to assess,twice as big as the segmentlargest competitor, measured in shipments for the full year 2012. This makes Ericsson the world’s largest supplier of LTE. The LTE technology is very fragmented.still in an early build-out phase.
As expected, Ericsson’s sales of CDMA equipment decreased by –40% in 2012, following operators’ transition to LTE. All Ericsson CDMA customers are now Ericsson LTE customers.
In telecom services, internal market data indicates that the Company increased its market share to 13% and is larger than any of its competitors in this fragmented market. After the acquisition of Telcordia, consolidated as from January 2012, Ericsson has a leading position in OSS and BSS.
Best-in-class operating margin
The Company’s operating margin before share in JV earnings and gain from the sale of its share in Sony Ericsson was 6.4% (9.6%). Based on reported results for 2009,2012, the operating margin for the Group, excluding joint ventures and restructuring charges, was 12 (11) percent and remains the highest among the Company’s main competitors that aretraditional publicly listed.listed telecom competitors.
Growth in JV earnings
The Ericsson share in earnings of joint ventures and associated companies was SEK –11.7 (–3.8) billion. The Company took a non-cash charge of SEK 8.0 billion, related to its 50% stake of ST-Ericsson. The charge included write-down of investments of SEK 4.7 billion to reflect the current best estimate of Ericsson’s share of the fair market value of the JV. A provision of SEK 3.3 billion was also included, related to the available strategic options at hand for the future of the ST-Ericsson assets. Ericsson’s share of the JV Sony Ericsson was divested in early 2012 resulting in a gain of SEK 7.7 billion, reported as Other operating income. The Company did not consolidate Sony Ericsson in 2012.
Cash conversion of over 70 percent
The cash conversion rate for 2009 was 117 (92) percent, reflecting116% (40%), driven by reduced working capital. The Company reached its target of a strong focus oncash conversion rate above 70%. Cash conversion is defined as cash flow with a significant reduction infrom operating assets.activities divided by the sum of net income and adjustments to reconcile net income to cash.
Other performance indicators
Ericsson believes that satisfied customers and motivated employees are key to success.
Customer satisfaction and employee engagement
In the annualEvery year, an independent customer satisfaction survey approximately 9,700 employees from 380 operatorsis performed. In 2012 about 15,000 representatives of Ericsson customers, in different positions around the world, were polled to assess their satisfaction with Ericsson compared to its main peers. In 2009, Ericsson maintained a level of excellence.
An employee survey is also independently conducted every year. In 2009, 91 percent of employees participated in the survey. The Human Capital Index, which measures employee contribution in adding value for customers and meeting business goals, remained at a high level.
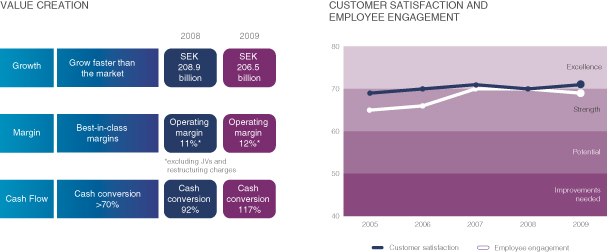
ERICSSON ANNUAL REPORT ON FORM 20-F 20092012
Ericsson, compared to its main competitors. Over the past five years, Ericsson has maintained a high level of excellence; a customer satisfaction index above 70. The goal is to further increase the customer satisfaction.
Employee engagement
In order to measure employee engagement, an annual survey is conducted by an independent company. In 2012, 94% (90%) of employees across the world responded to the survey.
The 2012 survey results show a continued strong employee engagement. The Employee Engagement index is 77%, which is unchanged from 2011 and 8%–points higher than the external benchmark average.
Executive Performance Stock Plan
The Company has a Long-Term Variable (LTV) remuneration program. It builds on a common platform, but consists of three separate plans; one targeting all employees, one targeting key contributors and one targeting senior management. The program is designed to encourage long-term value creation in alignment with shareholders’ interests.
The aim of the plan for senior managers is to attract, retain and motivate executives in a competitive market through performance-based share-related incentives and to encourage the build-up of significant equity stakes. The performance criteria for senior management, i.e. the Executive Performance Stock Plan, are revised yearly and approved by the Annual General Meeting. Performance criteria for the 2013 Executive Performance Stock Plan will be communicated in the notice to the Annual General Meeting.
The targets for the 2011 and 2012 Executive Performance Stock Plans are shown in the illustration below. The performance criteria are:
Up to one-third of the award will vest if the target for compound annual growth rate of consolidated net sales is achieved
Up to one-third of the award will vest if the target for compound annual growth rate of consolidated operating income, including earnings in joint ventures and restructuring, is achieved. For the 2011 plan, base year 2010 is excluding restructuring of SEK 6.8 billion.
Up to one-third of the award will vest if cash conversion is at or above 70% during each of the years and vesting one-ninth of the award for each year the target is achieved. The target was reached in 2012 but not reached in 2011.
ERICSSON ANNUAL REPORT ON FORM 20-F 2012
Before the number of performance shares to be matched are finally determined, the Board of Directors shall examine whether the performance matching is reasonable considering the Company’s financial results and position, conditions on the stock market and other circumstances, and if not, reduce the number of performance shares.
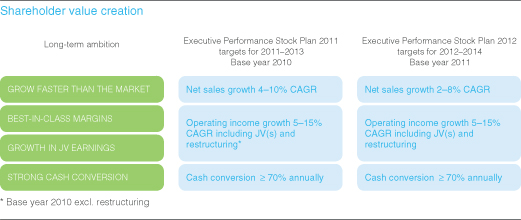
Working capital targets
Ericsson’s working capital targets are described on page 43. The targets remain for 2013.
FINANCIAL RESULTS OF OPERATIONS
ABBREVIATED INCOME STATEMENT
| | | | | | | | | | | | | | | | | | | | | | | | |
| | | IFRS | | | Restructuring charges | |
SEK billion | | 2012 | | | 2011 | | | 2010 | | | 2012 | | | 2011 | | | 2010 | |
Net sales | | | 227.8 | | | | 226.9 | | | | 203.3 | | | | | | | | | | | | | |
Cost of sales | | | –155.7 | | | | –147.2 | | | | –129.1 | | | | –2.2 | | | | –1.2 | | | | –3.4 | |
| | | | | | | | | | | | | | | | | | | | | | | | |
Gross income | | | 72.1 | | | | 79.7 | | | | 74.3 | | | | | | | | –1.2 | | | | –3.4 | |
Gross margin % | | | 31.6 | % | | | 35.1 | % | | | 36.5 | % | | | | | | | | | | | | |
| | | | | | | | | | | | | | | | | | | | | | | | |
Operating expenses | | | –58.9 | | | | –59.3 | | | | –58.6 | | | | –1.2 | | | | –2.0 | | | | –3.5 | |
Operating expenses as % of sales | | | 25.8 | % | | | 26.1 | % | | | 28.8 | % | | | | | | | | | | | | |
Other operating income and expenses | | | 9.0 | | | | 1.3 | | | | 2.0 | | | | — | | | | — | | | | — | |
| | | | | | | | | | | | | | | | | | | | | | | | |
Operating income before share in earnings of JVs and associated companies | | | 22.2 | | | | 21.7 | | | | 17.6 | | | | –3.4 | | | | –3.2 | | | | –6.8 | |
Operating margin % before share in earnings of JVs and associated companies | | | 9.7 | % | | | 9.6 | % | | | 8.7 | % | | | | | | | | | | | | |
| | | | | | | | | | | | | | | | | | | | | | | | |
Share in earnings of JVs and associated companies | | | –11.7 | | | | –3.8 | | | | –1.2 | | | | –0.3 | | | | –0.6 | | | | –0.5 | |
| | | | | | | | | | | | | | | | | | | | | | | | |
Operating income | | | 10.5 | | | | 17.9 | | | | 16.5 | | | | –3.8 | | | | –3.7 | | | | –7.3 | |
Operating margin % | | | 4.6 | % | | | 7.9 | % | | | 8.1 | % | | | | | | | | | | | | |
| | | | | | | | | | | | | | | | | | | | | | | | |
Financial income and expenses, net | | | –0.3 | | | | 0.2 | | | | –0.7 | | | | | | | | | | | | | |
Taxes | | | –4.2 | | | | –5.6 | | | | –4.5 | | | | | | | | | | | | | |
Net income | | | 5.9 | | | | 12.6 | | | | 11.2 | | | | | | | | | | | | | |
EPS diluted (SEK) | | | 1.78 | | | | 3.77 | | | | 3.46 | | | | | | | | | | | | | |
| | | | | | | | | | | | | | | | | | | | | | | | |
ERICSSON ANNUAL REPORT ON FORM 20-F 2012
VISION AND STRATEGYSales
Ericsson’s vision2012 was a year with strong growth in Global Services and Support Solutions while Networks had a more challenging year. Sales for comparable units, adjusted for foreign currency exchange rates and hedging, decreased –2%. The acquired Telcordia operation added sales of an all-communicating worldSEK 4.2 billion, split 50/50 between the segments Global Services and Support Solutions.
In 2012, the Company continued to execute its strategy to leverage its strengths in the growth areas of mobile broadband, managed services as well as OSS and BSS. Due to the current technology cycle in which mobile broadband is rapidly becomingbeing rolled out, the business mix in 2012 continued to include a realityhigher share of coverage business than capacity business. Ericsson was also to a large extent engaged in network modernization projects in Europe with its lower margins.
Sales of CDMA equipment declined –40% to SEK 8.4 (14.0) billion. The decline in CDMA was expected and planned for, following operators migration to LTE. The growth in Global Services is primarily related to continued good momentum in managed services and consulting and systems integration as the convergencewell as network rollout sales following a high share of the telecom, internetcoverage projects. The sales growth in Support Solutions is mainly driven by TV and media sectors gains momentum. Ericsson envisions continued evolution, from having connected some 1.5 billion placesmanagement, business support solutions (charging solutions) and the acquisition of Telcordia. The segments Global Services and Support Solutions together represented close to connecting50% of Group sales.
In 2012, five of our ten regions showed growth. The share of software sales was unchanged in 2012, at 23% (23%) of sales while the portion of hardware decreased to 35% (40%) and services increased to 42% (37%) of Group sales. Longer term, the software part is expected to increase following more than 5 billion peopleexpansions and 50 billion devices. The Company envisions that anything that can benefit from being connected will be connected, mainly via IP-based wireless communications.upgrades of networks.
Mobile broadband at the forefront
Following the unprecedented growth of mobile telephony isIPR (intellectual property rights) revenues showed a rapidly expanding range of mobility-based devices and applications. The accelerating penetration of smartphones and mobile broadband usage are early signs of this development. Extending network coverage and increasing data speeds, combined with devices that have large screens, intuitive user interfaces and multimedia capabilities, enhances the user experience and stimulates demand for mobile-broadband services. Once areas have ubiquitous coverage, machine-to-machine communication enables a large variety of existing services to be enhanced, such as media, governmental, utilities, industry automation, banking and transport.
Spurring socio-economic development
Ericsson’s mission is to empower people, business and society through innovation, industry leadership and a long- term commitment to the vision of an all-communicating world. In the course of making people’s lives easier and more productive, Ericsson is spurring socio-economicfavorable development and a better environment which brings the Company’s vision ever closeramounted to reality.SEK 6.6 (6.2) billion.
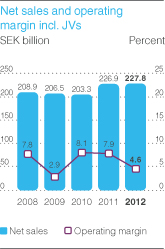
Leveraging the competitive dynamicsSeasonality
The Company’s strategy is driven byquarterly sales, income and cash flow from operations are seasonal in nature, generally lowest in the competitive dynamicsfirst quarter of the telecom marketyear and Ericsson’s position,highest in the combination of which gives rise to three strategic imperatives:
Economies of scale and scope are prerequisites for sustainable value creation. Industry standards govern product design and functionality, making it challenging for equipment suppliers to differentiate on product capabilities alone. Therefore, the Company strives to combine technology leadership with leadership in services.
The bargaining power of equipment suppliers depends primarily on their installed base. Operators not only look for the best products but also for long-term business partnerships that they can rely on to deliver end-to-end solutions for lower total cost of ownership, the ability to minimize time-to-market, strong professional services capabilities, and access to world-class subject matter experts.
Primary end-to-end suppliers with well-entrenched local presence, backed up by global resources andfourth quarter. This is mainly a proven track record, have a competitive advantage. The Company seeks to be a full systems solutions house with a broad but integrated product portfolio combined with superior technical competence, for example in systems integration.
Guiding principles
The guiding principles for attainmentresult of the Company’s strategic imperatives include:
customer intimacy; highly qualified employees working closely with the customer to create effective solutions
continuous process improvements and innovation
scale in delivery and technical solutions.
ERICSSON ANNUAL REPORT ON FORM 20-F 20092012
FINANCIAL RESULTS OF OPERATIONSMost recent five-year average seasonality
| | | | | | | | | | | | | | | | | | | |
SEK billion | | Non-IFRS
measures
2009 | | | Non-IFRS
measures
2008 | | | Percent
change | | | Restructuring
charges 2009 | | Restructuring
charges 2008 | | IFRS
2009 | | | IFRS
2008 | |
Net sales | | 206.5 | | | 208.9 | | | –1 | % | | | | | | 206.5 | | | 208.9 | |
Cost of sales | | –132.1 | | | –132.1 | | | 0 | % | | –4.2 | | –2.5 | | –136.3 | | | –134.6 | |
| | | | | | | | | | | | | | | | | | | |
Gross income | | 74.4 | | | 76.8 | | | –3 | % | | –4.2 | | –2.5 | | 70.2 | | | 74.3 | |
Gross margin % | | 36.0 | % | | 36.8 | % | | | | | | | | | 34.0 | % | | 35.5 | % |
| | | | | | | |
Operating expenses | | –52.9 | | | –56.4 | | | –6 | % | | –7.1 | | –4.2 | | –60.0 | | | –60.6 | |
Operating expenses as % of sales | | 25.6 | % | | 27.0 | % | | | | | | | | | 29.0 | % | | 29.0 | % |
| | | | | | | |
Other operating income and expenses | | 3.1 | | | 3.0 | | | 4 | % | | | | | | 3.1 | | | 3.0 | |
Operating income before share in earnings of JVs and associated companies | | 24.6 | | | 23.4 | | | 5 | % | | –11.3 | | –6.7 | | 13.3 | | | 16.7 | |
Operating margin % before share in earnings of JVs and associated companies | | 11.9 | % | | 11.2 | % | | | | | | | | | 6.5 | % | | 8.0 | % |
| | | | | | | | | | | | | | | | | | | |
Share in earnings of JVs and associated companies | | –6.1 | | | 0.4 | | | | | | –1.3 | | –0.9 | | –7.4 | | | –0.4 | |
| | | | | | | | | | | | | | | | | | | |
Operating income | | 18.5 | | | 23.9 | | | –22 | % | | –12.6 | | –7.6 | | 5.9 | | | 16.3 | |
| | | | | | | | | | | | | | | | | | | |
Operating margin % | | 9.0 | % | | 11.4 | % | | | | | | | | | 2.9 | % | | 7.8 | % |
| | | | | | | | | | | | | | | | | | | |
| | | | | | | |
Financial income and expense, net | | | | | | | | | | | | | | | 0.3 | | | 1.0 | |
Taxes | | | | | | | | | | | | | | | –2.1 | | | –5.6 | |
Net income | | | | | | | | | | | | | | | 4.1 | | | 11.7 | |
EPS diluted (SEK) | | | | | | | | | | | | | | | 1.14 | | | 3.52 | |
| | | | | | | | | | | | | | | | | | | |
| | | | | | | | | | | | | | | | |
| | | First
quarter | | | Second
quarter | | | Third
quarter | | | Fourth
quarter | |
Sequential change | | | –21 | % | | | 7 | % | | | –2 | % | | | 26 | % |
Share of annual sales | | | 23 | % | | | 24 | % | | | 24 | % | | | 30 | % |
Non-IFRS measures are usedGross margin
Gross margin declined to 31.6% (35.1%). The decrease is due to increased share of Global Services sales, higher proportion of coverage than capacity projects and network modernization projects in Europe. Close to 50% of the table above as supplemental informationgross margin decline is related to the IFRS results. Since there were significant restructuring costsincreased services share.
With current visibility, the underlying business mix, with a higher share of coverage projects than capacity projects, is expected to gradually shift towards more capacity projects during 2008 and 2009, but with relatively little benefit in 2008 and consequently significant impact on reported results and margins both years, non-IFRS measures excluding restructuring charges are presented to facilitate analysis by indicating Ericsson’s underlying performance. However, these measures should not be viewed in isolation or as substitutes to the IFRS measures. For more details on the restructuring activities and corresponding charges, please see Note C5—“Expenses by Nature”.
Sales sustained in weaker market
Increased sales in the first half of 2009 were offset in the second half byof 2013. The negative impact from the economic slowdown. Overall, salesnetwork modernization projects in Europe will continue to gradually decline during 2013.
Operating expenses
Total operating expenses declined marginally from last yearslightly. Excluding acquisitions and restructuring charges, Group operating expenses amounted to SEK 206.5 billion. Sales55.1 billion, down –4% from 2011.
To secure continued technology leadership, focus is on innovation and R&D. R&D expenses (see table below) increased slightly due to higher restructuring charges and acquisitions. Based on current portfolio and efficiencies in ways of working, R&D expenses for comparable units were stable year over year, i.e. excluding SEK 2.7 billion2013 are expected to decrease somewhat.
Selling and administrative expenses represented 11.4% of sales fromcompared to 11.8% in 2011.
Research and development
| | | | | | | | | | | | |
| | | 2012 | | | 2011 | | | 2010 | |
Expenses (SEK billion) | | | 32.8 | | | | 32.6 | | | | 31.6 | |
As percent of Net sales | | | 14.4 | % | | | 14.4 | % | | | 15.5 | % |
Employees within R&D as of December 311) | | | 24,100 | | | | 22,400 | | | | 20,800 | |
Patents1) | | | 33,000 | | | | 30,000 | | | | 27,000 | |
| 1) | The number of employees and patents are approximate. |
Operating margin before JVs
Operating margin before share in JV earnings was 9.7% (9.6%). Excluding the acquired Nortelgain related to the divestment of the share of Sony Ericsson, operating margin was 6.4%. The negative impact was due to the business mix having more coverage business than capacity business as well as network modernization projects in North AmericaEurope.
Share in the fourth quarterearnings of JVs
ST-Ericsson reported a loss in 2012. Ericsson’s share in ST-Ericsson’s income before tax, adjusted to IFRS, was SEK –3.7 (–2.7) billion. The reported loss of SEK –11.7 billion includes a write-down of investments of SEK 4.7 billion and a provision of SEK 5.2 billion in 2008 from the divested PBX and mobile platform operations. Adjusted also for effects of exchange rates and hedging, sales declined 9 percent. Lower sales in Networks were largely offset by higher sales in Professional Services and Multimedia. The economic downturn coupled with tighter credit supply impacted operator spending, in particular in certain emerging markets.
3.3 billion.ERICSSON ANNUAL REPORT ON FORM 20-F 20092012
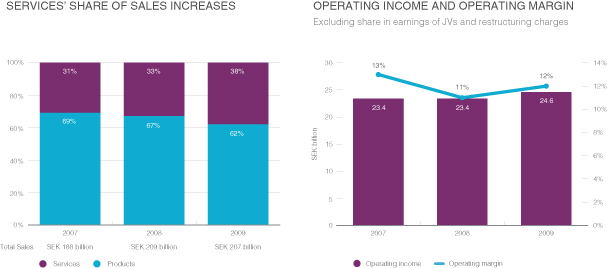
Other operating income and expenses includes a gain of SEK 7.7 billion related to the divestment of Sony Ericsson. It also includes a gain of SEK 0.2 billion from the divestment of the Multimedia brokering (IPX) operation.
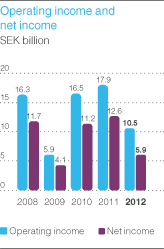
Financial net
The demand varied considerably between markets. Among our largest markets, the US, China, UKfinancial net decreased mainly due to negative currency exchange revaluation effects on financial investments and Turkey had good sales increases. Australia, India and Japan were stable, whereas sales in Brazil, Indonesia, Italy, Pakistan and Spain declined. Several important contracts were won in 2009: four LTE contracts, the appointment as fixed access domain supplier to AT&T and a services contract with Sprint in the US.liabilities.
Gross margin stable excluding restructuring chargesTaxes
Gross margin declined only slightly as effects of price pressure, increased share of services sales, and the initial transition costsThe tax rate for the Sprint contract were largely offset by cost cuttingyear was 42% (31%) of income after financial items. The high tax rate is due to product and restructuring efforts.
Operating expenses excluding restructuring charges were reduced
Operating expenses declined year-over-yearmarket mix as well as a result of restructuring activities andreduction in corporate tax rate for 2013, decided by the spin-off of mobile platforms.Swedish Parliament. The Company continues to focuslower corporate tax rate in Sweden reduced the deferred tax assets with approximately SEK 0.5 billion. Over time, the lower tax rate in Sweden will have a positive impact on innovations and R&D. however, spending as a percentage of sales was 13 percent compared to 15 percent in 2008taxes.
Net income
Net income decreased primarily due to cost reductionsthe negative impact from ST-Ericsson and efficiency gains.lower contribution from Networks.
Operating margin excludingEarnings per share, in earningsdiluted
Earnings per share decreased –53% to SEK 1.78 (3.77). Earnings per share, non-IFRS, decreased –42% to SEK 2.74 (4.72). The Board of JVs and restructuringDirectors proposes a dividend of SEK 2.75 (2.50). This represents an increase of 10% over 2011.
Restructuring charges increased slightly
Restructuring andcharges were SEK 3.4 (3.2) billion, excluding joint ventures. Restructuring charges mainly relate to continued execution of the service delivery strategy as well as other ongoing cost reduction measuresmeasures. Cash outlays that have loweredbeen provided for were SEK 1.2 (3.2) billion. At the breakeven point. The operating marginend of the year, cash outlays of SEK 1.2 (1.3) billion remain to be made. Ericsson’s share in Multimedia increased significantly, reflecting a more narrow business focus.
Share in earnings of JVs and associated companies declinedST-Ericsson’s restructuring charges was SEK 6.5 billion year-over-year
Both Sony Ericsson and ST-Ericsson were adversely affected by the lower handset sales during the economic downturn. Both companies have undertaken ambitious restructuring activities, and Sony Ericsson is improving its product portfolio focusing on mid- to high-end phones.
0.3 (0.1) billion.ERICSSON ANNUAL REPORT ON FORM 20-F 20092012
Under new management, both JVs are well on track to return to report profits.
Restructuring increased and will continue into 2010
In the beginning of the year, a program to reduce annual run rate of costs by SEK 10 billion was launched, following the 2008 program aiming at SEK 6–7 billion. In the third quarter, additional SEK 5–6 billion of savings were targeted with anticipated costs of the same magnitude. Full effects are expected to be achieved in the second half of 2010, assuming current level of operations. This year’s restructuring charges were SEK 11.3 (6.8) billion, relating to activities to reduce production costs, reduce product variants and platforms, increase the re-use of software, consolidate R&D activities, and improve administrative processes. This resulted in fewer platforms and solutions and was coupled with write-downs of capitalized development costs and acquired IPR assets for affected products.
Earnings per share (EPS) diluted down 68 percent
EPS diluted declined from SEK 3.52 last year to SEK 1.14 this year, largely driven by the losses in our JVs and the restructuring program.
Employees increased by net 3,750 in 2009
Headcount increased to 82,500 (78,750), largely as a result of new managed services contracts. About 2,500 employees from the acquired Nortel CDMA and LTE operations will be included from 2010. The additions were partly offset by reductions due to restructuring and the transfer of mobile platforms to ST-Ericsson. The competence and capabilities of the workforce is increasingly service and software oriented.
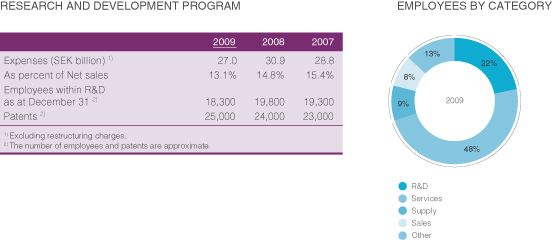
ERICSSON ANNUAL REPORT ON FORM 20-F 2009
FINANCIAL POSITION
CONSOLIDATED BALANCE SHEET (ABBREVIATED)
| | | | |
December 31, SEK billion | | 2009 | | 2008 |
ASSETS | | | | |
Non-current assets, total | | 87.4 | | 87.2 |
—of which intangible assets | | 48.2 | | 48.2 |
—of which property, plant and equipment | | 9.6 | | 10.0 |
—of which financial assets | | 15.3 | | 14.1 |
—of which deferred tax assets | | 14.3 | | 14.9 |
Current assets, total | | 182.4 | | 198.5 |
—of which inventory | | 22.7 | | 27.8 |
—of which trade receivables | | 66.4 | | 75.9 |
—of which other receivables/financing | | 16.6 | | 19.8 |
—of which short-term investments, cash and cash equivalents | | 76.7 | | 75.0 |
Total assets | | 269.8 | | 285.7 |
| | |
EQUITY AND LIABILITIES | | | | |
Equity | | 141.0 | | 142.1 |
Non-current liabilities | | 43.3 | | 39.5 |
—of which post-employment benefits | | 8.5 | | 9.9 |
—of which borrowings | | 30.0 | | 24.9 |
—of which other non-current liabilities | | 4.8 | | 4.7 |
Current liabilities | | 85.5 | | 104.1 |
—of which provisions | | 12.0 | | 14.0 |
—of which current borrowings | | 2.1 | | 5.5 |
—of which trade payables | | 18.9 | | 23.5 |
—of which other current liabilities | | 52.5 | | 61.0 |
Total equity and liabilities1) | | 269.8 | | 285.7 |
| | | | | | | | | | | | |
December 31, SEK billion | | 2012 | | | 2011 | | | 2010 | |
Assets | | | | | | | | | | | | |
Non-current assets, total | | | 81.7 | | | | 81.5 | | | | 83.4 | |
of which intangible assets | | | 49.4 | | | | 44.0 | | | | 46.8 | |
of which property, plant and equipment | | | 11.5 | | | | 10.8 | | | | 9.4 | |
of which financial assets | | | 8.5 | | | | 13.7 | | | | 14.5 | |
of which deferred tax assets | | | 12.3 | | | | 13.0 | | | | 12.7 | |
Current assets, total | | | 193.3 | | | | 198.8 | | | | 198.4 | |
of which inventory | | | 28.8 | | | | 33.1 | | | | 29.9 | |
of which trade receivables | | | 63.7 | | | | 64.5 | | | | 61.1 | |
of which other receivables/financing | | | 24.1 | | | | 20.7 | | | | 20.2 | |
of which short-term investments, cash and cash equivalents | | | 76.7 | | | | 80.5 | | | | 87.2 | |
Total assets | | | 275.0 | 1) | | | 280.3 | | | | 281.8 | |
| | | |
Equity and liabilities | | | | | | | | | | | | |
Equity | | | 138.5 | | | | 145.3 | | | | 146.8 | |
Non-current liabilities | | | 39.1 | | | | 38.1 | | | | 38.3 | |
of which post-employment benefits | | | 9.5 | | | | 10.0 | | | | 5.1 | |
of which borrowings | | | 23.9 | | | | 23.3 | | | | 27.0 | |
of which other non-current liabilities | | | 5.7 | | | | 4.8 | | | | 6.2 | |
Current liabilities | | | 97.4 | | | | 97.0 | | | | 96.8 | |
of which provisions | | | 8.4 | | | | 6.0 | | | | 9.4 | |
of which current borrowings | | | 4.8 | | | | 7.8 | | | | 3.8 | |
of which trade payables | | | 23.1 | | | | 25.3 | | | | 25.0 | |
of which other current liabilities | | | 61.1 | | | | 58.0 | | | | 58.6 | |
Total equity and liabilities1) | | | 275.0 | | | | 280.3 | | | | 281.8 | |
| 1) | Of which interest-bearing liabilities and post-employment benefits SEK 40.7 billion (SEK 40.4 billion in 2008).38.2 (41.0) billion. |
In 2009, despiteEricsson’s strategy is to maintain a strong balance sheet, including a sufficiently large cash position to ensure the strategic investmentsfinancial flexibility to invest in ST-Ericssonfuture growth and to capture business opportunities. This has been particularly important during the past years’ difficult macroeconomic and financial market situation. By maintaining a strong cash position, the Company gains competitive advantages and can maintain an active strategy for selective acquisitions.
The Company’s capital targets are to have an equity ratio above 40%, to generate a cash conversion rate above 70%, to have a positive net cash position and to achieve solid investment grade ratings.
An important focus area is the monitoring of working capital. Major efforts have been made during the year in order to reduce days sales outstanding and inventory turnover days as well as to increase payable days. The target for days sales outstanding was met, while the other two targets were not achieved. Efforts to further reduce working capital will continue in 2013 and the Nortel operations andworking capital targets are the same as previous years.
For 2011, the dividend was SEK 2.50 per share. The Board of Directors will propose to the Annual General Meeting 2013 a difficult macro-economic business environment, a healthy capital structure and equity ratio were maintained and the debt maturity profile was significantly improved.
Intangible assets flat with acquisitions offset by amortizations and write-downs
Added intangible assets from the Nortel acquisitiondividend of SEK 8.8 billion were offset by amortizations2.75 per share for 2012. This represents a total dividend of approximately SEK 9.1 (8.2) billion. The proposal reflects year 2012’s earnings and impairment losses. Impairment losses on acquired intangibles were SEK 4.3 (0) billion in 2009, attributablebalance sheet structure, as well as coming years’ business plans and economic development, according to restructuring.
Ericsson’s dividend policy.ERICSSON ANNUAL REPORT ON FORM 20-F 20092012
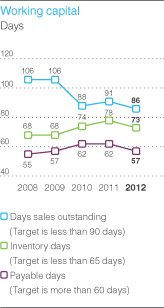
ERICSSON ANNUAL REPORT ON FORM 20-F 2012
Property, plant and equipment slightly downNon-current assets
The Company’s assets are largely related to test equipment for in-house manufacturing, R&D and services, including our network operations centers. A large share of manufacturing and IT operations are outsourced and most properties are leased.
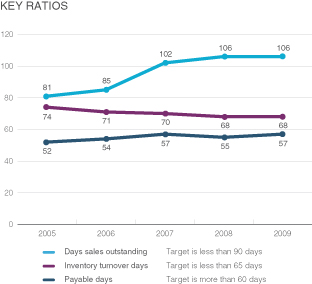
Financial assets up slightly
FinancialIntangible assets increased slightly, withto SEK 49.4 (44.0) billion due to acquisitions during the investment in ST-Ericsson partially offset by the reduced value of investments in JVs, attributable to their reported losses.
year. Customer financing, didcurrent and non-current, increased to SEK 5.3 (4.2) billion.
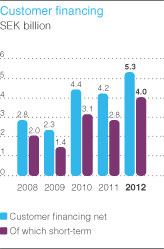
ERICSSON ANNUAL REPORT ON FORM 20-F 2012
Current assets
Inventory levels decreased at the end of the year. At year end, inventory was SEK 28.8 (33.1) billion. The target of inventory turnover days less than 65 days was not increase and deferred tax assets were slightly reduced with utilization of tax loss carryforwards.
Strong reductions in receivables and inventory
Considerable progress was made in the second half to achieve stable days sales outstanding (DSO) at 106 and inventory days at 68. However, targeted levels have not yet been reached and the improvement efforts will be continued.continue in 2013.
Cash remainedTrade receivables: Days sales outstanding reached 86 (91) days at year end due to strong at SEK 77 (75) billion
Due to a strong cash flow, a good level of cash and short-term investments was maintained. A strong liquidity is deemed important to keep flexibility for volatility in sales and cash flowsgood collections. The Company’s credit losses have historically been low and continued to be able to take advantage of opportunitiesso in the market.2012.
Equity down SEK 1.1 billion
Stockholders’ equityNet cash decreased by SEK 1.11.0 billion. The net incomeFor a more detailed discussion on changes in cash, see pages 47–50.
Equity
Equity decreased by SEK –6.8 billion primarily due to the non-cash charge of SEK 4.18.0 billion and a capital increase of SEK 0.7 billion, attributablerelated to the employee stock purchase plan, were more than offset by the dividend of SEK 6.3 billion. However, theST-Ericsson. The equity ratio was maintained at a healthy level of 52 (50) percent.
50.4% (51.8%). Return on equity 2.6 (8.2) percent
The decline in return on equity (ROE) was primarily a consequence of JV losses and the restructuring charges.
ERICSSON ANNUAL REPORT ON FORM 20-F 2009
decreased to 4.1% (8.5%) due to lower profitability. Return on capital employed 4.3 (11.3) percent(ROCE) was 6.7% (11.3%).
The return on capital employed (ROCE) declined to 4.3 percent. Excluding restructuring charges, ROCE would have been 11.2 (15.5) percent.
PensionNon-current liabilities down SEK 1.4 billion after employer contributions
Post-employment benefits related to defined benefit plans declined to SEK 8.5 (9.9)9.5 (10.0) billion. In 2012 there was a decrease in discount rates, which was offset as plan assets yielded higher than expected.
Non-current borrowings was almost unchanged at SEK 23.9 (23.3) billion. In 2012, Ericsson performed refinancing activities to extend its average debt maturity profile and to further diversify funding sources:
Issue of a USD-denominated 1 billion ten-year bond in 2009. A liability increaseorder to refinance debt maturing in 2012 to 2014
Repurchase of EUR 441 million related to the 2013 and 2014 EMTN bonds in order to reduce gross debt and optimize net interest
Repayment of two SEK-denominated bonds with a total of SEK 1.23.5 billion due to lower interest rates, was more than offset by higher valuesat maturity
Taken up a loan with the Nordic Investment Bank of plan assets of SEK 1.2EUR 0.15 billion (or the equivalent in USD). The loan is divided into two equal tranches with seven-year and employer contributions of SEK 2.1 billion to trust funds. The funded ratio (plan assets as percentage of defined benefit obligations) increased to 76 (68) percent.nine-year maturities respectively.
Provisions declined due to larger cash outlays
The total amount for provisions declined to SEK 12.4 (14.4) billion, largely attributable to SEK 4.7 billion of larger cash outlays than last year, of which SEK 2.5 billion related to restructuring.
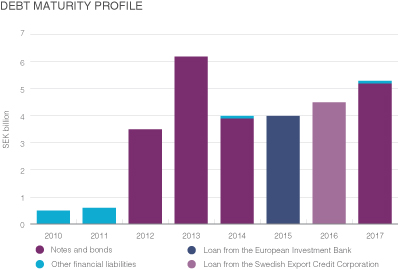
Trade payables declined by SEK 4.6 billion
The number of payable days improved some from 55 to 57 days, close toSigned loan agreement with the target of 60 days or more, despite the macroeconomic conditions, where some suppliers have had to be supported with shorter payment terms in a tight credit market.
Debt maturity profile improved
During the year, the Company increased borrowings by SEK 1.7 billion and considerably improved the maturity profile. Debt maturing in 2009 of USD 0.5 billion and in 2010European Investment Bank of EUR 0.5 billion were replaced(or the equivalent in USD) with a 7-yearan option for disbursement until April 2014. The loan of USD 0.6 billion and a 4-year loan of EUR 0.6 billion. In addition to borrowings, thewill mature seven years after disbursement
The Company also has unutilized committed credit facilities of USD 2.0 billion available, maturing in 2014.
ERICSSON ANNUAL REPORT ON FORM 20-F 20092012
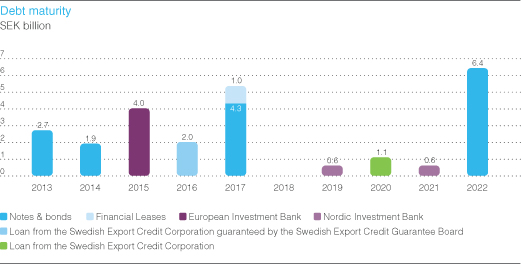
Credit RatingsCurrent liabilities
Credit ratingsProvisions increased to SEK 8.4 (6.0) billion. SEK 1.2 (1.3) billion were unchanged during 2009, remaining at “solid investment grade”: Moody’s at Baa1related to restructuring. The cash outlays of provisions were SEK 3.5 (6.0) billion. The higher amount of provisions is due to a provision of SEK 3.3 billion related to ST-Ericsson. Provisions will fluctuate over time, depending on business mix, market mix and Standard & Poor’s at BBB+.technology shifts.
Payable days decreased to 57 (62) days, reflecting the high level of network rollout where suppliers normally have shorter payment days. The target of payable days of more than 60 days was not met.
Sony Ericsson borrowings guaranteed
Ericsson and SONY have on a 50/50 basis guaranteed EUR 350 million of borrowings for general business purposes, as improved liquidity was needed following Sony Ericsson’s weak results and the restructuring program. The amount guaranteed is not deemed significant, considering Ericsson’s financial position.
Off-balance sheet arrangements
There are currently no material off-balance sheet arrangements that have, or would be reasonably likely to have, a current or anticipated effect on the Company’s financial condition, revenues, expenses, result of operations, liquidity, capital expenditures or capital resources.
CASH FLOW
ERICSSON ANNUAL REPORT ON FORM 20-F 2012
JANUARY–DECEMBER
| | | | | | |
SEK billion | | 2009 | | | 2008 | |
Net income | | 4.1 | | | 11.7 | |
Income reconciled to cash | | 21.0 | | | 26.0 | |
Changes in operating net assets | | 3.5 | | | –2.0 | |
Cash flow from operating activities | | 24.5 | | | 24.0 | |
Cash flow from investing activities | | –37.5 | | | –8.5 | |
—of which capital expenditures, sales of PP&E, product development | | –4.9 | | | –4.1 | |
—of which acquisitions/divestments, net | | –18.1 | | | 1.8 | |
—of which short-term investments for cash management purposes and other investing activities | | –14.5 | | | –6.2 | |
Cash flow before financing activities | | –13.0 | | | 15.5 | |
Cash flow from financing activities | | –1.7 | | | –7.2 | |
| | | | | | |
Cash conversion (Cash flow from operating activities divided by income reconciled to cash) | | 117 | % | | 92 | % |
| | | | | | |
Gross cash (Cash, cash equivalents and short-term investments) | | 76.7 | | | 75.0 | |
| | | | | | |
Net Cash (Gross cash less interest-bearing liabilities and post-employment benefits) | | 36.1 | | | 34.7 | |
| | | | | | |
CASH FLOW
Cash flow from operations stable at SEK 24.5 billion(abbreviated) January 1–December 31
A lower net income was offset by non-cash items, such as the losses in JVs, depreciation, amortization of intangibles, largely related to restructuring, and strong working capital reductions, resulting in a similar cash flow from operations as in 2008.
| | | | | | | | | | | | |
SEK billion | | 2012 | | | 2011 | | | 2010 | |
Net income | | | 5.9 | | | | 12.6 | | | | 11.2 | |
Income reconciled to cash | | | 19.0 | | | | 25.2 | | | | 23.7 | |
Changes in operating net assets | | | 3.0 | | | | –15.2 | | | | 2.9 | |
Cash flow from operating activities | | | 22.0 | | | | 10.0 | | | | 26.6 | |
Cash flow from investing activities | | | –4.9 | | | | 4.5 | | | | –12.5 | |
of which capital expenditures, sales of PP&E, product development | | | –6.5 | | | | –6.1 | | | | –5.2 | |
of which acquisitions/divestments, net | | | –2.1 | | | | –3.1 | | | | –2.8 | |
of which short-term investments for cash management purposes and other investing activities | | | 3.7 | | | | 13.8 | | | | –4.5 | |
Cash flow before financing activities | | | 17.1 | | | | 14.5 | | | | 14.0 | |
| | | | | | | | | | | | |
Cash flow from financing activities | | | –9.4 | | | | –6.5 | | | | –5.7 | |
| | | | | | | | | | | | |
Cash conversion (Cash flow from operating activities divided by income reconciled to cash) | | | 116 | % | | | 40 | % | | | 112 | % |
| | | | | | | | | | | | |
Gross cash (Cash, cash equivalents and short-term investments) | | | 76.7 | | | | 80.5 | 1) | | | 87.2 | |
| | | | | | | | | | | | |
Net cash (Gross cash less interest-bearing liabilities and post-employment benefits) | | | 38.5 | | | | 39.5 | | | | 51.3 | |
| | | | | | | | | | | | |
| 1) | Including loan to ST-Ericsson of SEK 2.8 billion. |
Cash out from investing activities SEK –37.5 billionconversion
Cash outlays for recurring investing activities increased slightly to SEK –4.9 billion.conversion was 116% (40%), above the target of 70%. Cash conversion in 2012 was positively impacted by lower working capital.
Acquisitions/divestments during the year were net SEK –18.1 billion, with the major items being the formation of the ST-Ericsson joint venture, the minority stake in LHS and Nortel’s CDMA and LTE businesses.
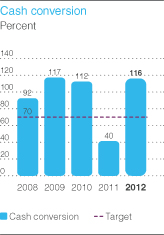
ERICSSON ANNUAL REPORT ON FORM 20-F 20092012
Cash outflowflow from operating activities
The operating cash flow was positively impacted by reduced working capital.
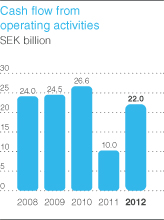
Cash flow from investing activities
Cash outlays for regular investing activities increased to SEK –6.5 (–6.1) billion. Acquisitions and divestments during the year were net SEK –2.1 (–3.1) billion, with the major item being the USD 1.15 billion acquisition of Telcordia and the divestment of Sony Ericsson.
Cash flow from short-term investments for cash management purposes and other investing activities was net SEK –14.53.7 (13.8) billion, largelymainly attributable to SEK –17.1 billion ofchanges between short-term investments driven by the strongand cash flow from operations.and cash equivalents.
Cash flow from financing activities SEK –1.7 billionCapital expenditures
Dividends paid of SEK –6.3 billion were partly offset by increased borrowings of SEK 4.3 billion and other financing activities of SEK 0.2 billion.
Strong cash conversion at 117 (92) percent
The cash conversion rate was 117 (92) percent, well above the target level of 70 percent. The percentage increase was largely attributable to the strong improvement in operating net assets and the lower income reconciled to cash.
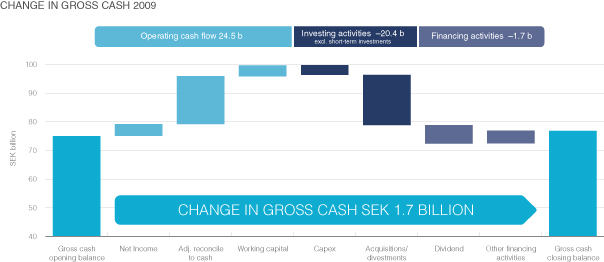
Restricted cash
Cash balances in certain countries with restrictions on transfers of funds to the Parent Company as cash dividends, loans or advances amounted to SEK 8.9 (8.2) billion.
Capital expenditures
Amounts for annualAnnual capital expenditures are normally around two percent2% of sales. This level corresponds to the needs for keeping and maintaining the current capacity level, including the continuous introduction of new technology and methods. The expendituresExpenditures are largely related to test equipment in R&D units and network operations centers and to production and test equipment inas well as manufacturing and repair operations.
The Board of Directors reviews the Company’s investment plans and proposals.
ERICSSON ANNUAL REPORT ON FORM 20-F 2009
CAPITAL EXPENDITURES 2005–2009
| | | | | | | | | | | | | | | |
SEK billion | | 2009 | | | 2008 | | | 2007 | | | 2006 | | | 2005 | |
Capital expenditures | | 4.0 | | | 4.1 | | | 4.3 | | | 3.8 | | | 3.4 | |
—of which in Sweden | | 1.3 | | | 1.6 | | | 1.3 | | | 1.0 | | | 1.0 | |
as percent of net sales | | 1.9 | % | | 2.0 | % | | 2.3 | % | | 2.2 | % | | 2.2 | % |
Capital expenditures in relation to sales are expected to remain at about two percent. The Company believes it has sufficient cash and cash generation capacity to fund expected capital expenditures as well as the acquisitions of the Nortel/GSM operations and Pride Spa and the contribution to the Swedish pension trust fund without external borrowings.borrowings in 2013.
We believe that the Company’s property, plant and equipment and the facilities that the Company now occupies are suitable for its present needs in most locations. As of December 31, 2009,2012, no material land, buildings, machinery or equipment were pledged as collateral for outstanding indebtedness.
BUSINESS RESULTS
Operator investments are increasing in mobile broadband, driven by a strong ramp up of data traffic. The broadband growth has not yet offset the decline in GSM sales, which in 2009 was accelerated due to the current economic climate. Operator investment patterns varied significantly between regions and countries. A number of developing markets became increasingly cautious, while others, including large markets such as China and the US, showed good growth. There was a continued strong demand for services targeting our customers’ operational efficiency.
Regional overview
SALES PER REGION AND SEGMENT 2009Capital expenditures 2008–2012
| | | | | | | | | | | | | | | |
| | | | | | | | | | | |
SEK billion | | Net-
works | | | Prof.
Services | | | Multi-
media | | | Total | | | Percent
change | |
Western Europe | | 23.8 | | | 18.3 | | | 2.4 | | | 44.6 | | | –14 | % |
CEMA1) | | 32.7 | | | 12.9 | | | 5.1 | | | 50.7 | | | –4 | % |
Asia Pacific | | 50.5 | | | 12.2 | | | 3.1 | | | 65.8 | | | 4 | % |
Latin America | | 13.0 | | | 5.9 | | | 1.1 | | | 20.1 | | | –13 | % |
North America | | 17.1 | | | 6.7 | | | 1.6 | | | 25.4 | | | 41 | % |
Total | | 137.1 | | | 56.1 | | | 13.3 | | | 206.5 | | | –1 | % |
| | | | | | | | | | | | | | | |
Share of total | | 66.4 | % | | 27.2 | % | | 6.4 | % | | 100 | % | | | |
Percent Change | | –3 | % | | 15 | % | | 5 | % | | –1 | % | | | |
| | | | | | | | | | | | | | | |
| | | | | | | | | | | | | | | | | | | | |
SEK billion | | 2012 | | | 2011 | | | 2010 | | | 2009 | | | 2008 | |
Capital expenditures | | | 5.4 | | | | 5.0 | | | | 3.7 | | | | 4.0 | | | | 4.1 | |
of which in Sweden | | | 1.3 | | | | 1.7 | | | | 1.4 | | | | 1.3 | | | | 1.6 | |
Share of annual sales | | | 2.4 | % | | | 2.2 | % | | | 1.8 | % | | | 1.9 | % | | | 2.0 | % |
ERICSSON ANNUAL REPORT ON FORM 20-F 2012
1) | Central and Eastern Europe, Middle East and Africa. |
Sales in Western Europe decreased by –6 (–2) percent for comparable unitswith growth of professional services and broadband more than offset by lower GSM sales. The growing demand for mobile broadband and professional services is expected to continue, as is the decline for GSM. The macro-economic development led to a weaker demand for replacement handsets but mobile phone usage appeared to be largely unaffected and mobile broadband traffic continued to show strong growth.
In CentralCash flow from financing activities
Cash flow from financing activities was SEK –9.4 (–6.5) billion, mainly impacted by dividend paid of SEK –8.6 (–7.5) billion. Other financing activities net amounted to SEK –0.8 (1.0) billion. However, substantial refinancing activities were performed during 2012 to extend the average debt maturity profile and Eastern Europe, Middle Eastto further diversify funding sources. For more information see section “Non-Current Liabilities”, on previous page.
Cash held in countries with exchange controls
The Company holds cash or cash equivalents in countries where exchange controls or legal restrictions apply. These restrictions normally refer to approval procedures prior to cross-border cash transfers. The amount of cash and Africa (CEMA), sales decreasedcash equivalents in such countries is SEK 10.6 (13.9) billion, of which SEK 9.2 (12.8) billion can be used for repayment of external and internal liabilities as well as other operating needs. Therefore, net cash and cash equivalents that are not readily available for use by –4 (+9) percent,the Group is SEK 1.4 (1.1) billion.
Gross cash and net cash despite continued network buildouts
The change in gross cash of SEK 3.8 billion is related to ST-Ericsson where loans of SEK 5.0 billion were converted into investments. The net income reconciled to cash was SEK 19.0 (25.2) billion. Net operating assets was SEK 3.0 (–15.2) billion and investing activities SEK –14.7 (–9.9) billion. Dividends to shareholders amounted to SEK –8.6 (–7.5) billion. This resulted in a numberdecrease in net cash of markets, as the region has been more affected than most by the macroeconomic development. Many countries within the CEMA region have low penetration levels and consumer demand remains robust even if some operators are currently unable or unwilling to invest at healthy levels. A similar situation is seen in other emerging markets such as Latin America and Asia Pacific.SEK 1.0 billion.
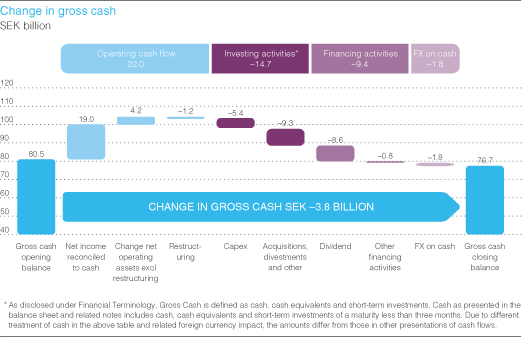
ERICSSON ANNUAL REPORT ON FORM 20-F 20092012
Asia Pacific remained Ericsson’s largestBUSINESS RESULTS—REGIONS
Sales per region withand segment 2012 and percent change from 2011
| | | | | | | | | | | | | | | | | | | | | | | | | | | | | | | | |
| | | Networks | | | Global Services | | | Support Solutions | | | | | | | |
SEK billion | | 2012 | | | Percent
change | | | 2012 | | | Percent
change | | | 2012 | | | Percent
change | | | Total
2012 | | | Percent
change | |
North America | | | 30.5 | | | | 6 | % | | | 23.5 | | | | 27 | % | | | 2.7 | | | | 103 | % | | | 56.8 | | | | 16 | % |
Latin America | | | 9.8 | | | | –15 | % | | | 10.6 | | | | 12 | % | | | 1.6 | | | | 65 | % | | | 22.0 | | | | 0 | % |
Northern Europe and Central Asia | | | 6.3 | | | | –35 | % | | | 4.5 | | | | –10 | % | | | 0.5 | | | | –6 | % | | | 11.3 | | | | –25 | % |
Western and Central Europe | | | 6.2 | | | | –21 | % | | | 10.6 | | | | 3 | % | | | 0.7 | | | | –27 | % | | | 17.5 | | | | –8 | % |
Mediterranean | | | 9.5 | | | | –11 | % | | | 13.0 | | | | 10 | % | | | 0.8 | | | | –42 | % | | | 23.3 | | | | –2 | % |
Middle East | | | 6.8 | | | | –9 | % | | | 7.3 | | | | 7 | % | | | 1.5 | | | | 24 | % | | | 15.6 | | | | 1 | % |
Sub-Saharan Africa | | | 6.4 | | | | 10 | % | | | 3.9 | | | | 14 | % | | | 1.0 | | | | 16 | % | | | 11.3 | | | | 12 | % |
India | | | 3.5 | | | | –42 | % | | | 2.5 | | | | –22 | % | | | 0.5 | | | | –14 | % | | | 6.5 | | | | –34 | % |
North East Asia | | | 22.4 | | | | –19 | % | | | 13.3 | | | | 34 | % | | | 0.5 | | | | 0 | % | | | 36.2 | | | | –5 | % |
South East Asia and Oceania | | | 8.0 | | | | 6 | % | | | 6.6 | | | | 18 | % | | | 0.5 | | | | –29 | % | | | 15.1 | | | | 9 | % |
Other1) | | | 7.9 | | | | –14 | % | | | 1.2 | | | | –844 | % | | | 3.1 | | | | 90 | % | | | 12.3 | | | | 15 | % |
| | | | | | | | | | | | | | | | | | | | | | | | | | | | | | | | |
Total | | | 117.3 | | | | –11 | % | | | 97.0 | | | | 16 | % | | | 13.5 | | | | 26 | % | | | 227.8 | | | | 0 | % |
Share of total | | | 51 | % | | | | | | | 43 | % | | | | | | | 6 | % | | | | | | | 100 | % | | | | |
| | | | | | | | | | | | | | | | | | | | | | | | | | | | | | | | |
| 1) | Region “Other” includes licensing revenues, sales of cables, broadcast services, power modules and other businesses. In the regional dimension, all of the Telcordia sales are reported in the Support Solutions segment except for North America where it is split 50/50 between Global Services and Support Solutions. The acquired Technicolor Broadcast Service Division is reported in region “Other”. Multimedia brokering (IPX) was previously reported in each region in segment Support Solutions. For the first three quarters 2012 it was part of region “Other”. Multimedia brokering (IPX) was divested end of Sept. 2012. |
BUSINESS RESULTS—SEGMENTS
Networks
Sales
Sales were SEK 117.3 (132.4) billion following a strong 2011. The decline is primarily related to lower sales increase of +4 (+16) percent,fuelled by continued good demand in China, Russia, India and India.South Korea. North America grew despite the –40% decline in CDMA equipment sales. The Company has a leading positionIP portfolio developed favorably, especially packet core products.
The decline in India, where subscribers are expected to ultimately exceed one billion from the current 496 million. Auctions for 3G licenses in India were postponed to 2010. Although Chinese suppliers have significantly increased their domestic market share, Ericsson maintains a strong market position in China. Political unrest and effectssales of the economic slowdown negatively affected sales growth in certain countries, such as Indonesia, Pakistan and Bangladesh.
Latin American sales decreased by –13 (+25) percent,reflecting lower demand across the region compared to strong growth over the last coupleCDMA equipment was expected. Sales of years. Demand for mobile broadband continues to develop well, but delays in licensing of new spectrum are causing operators to hold back investments in new technologies and applications.
North American sales increased by +41 (+34) percent, mainly driven by demand for mobile broadband and professional services. With a number of breakthrough contracts for LTE, fixed access and services and the acquisition of Nortel’s CDMA and LTE businesses, the Company is well positioned for continued growth and is now the largest supplier of technology and services to network operators in the region.
Market shares were well maintained and the Company retains its ambition to grow faster than the market.
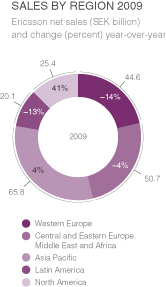
Networks
Overall operator demand for mobile GSM/WCDMA network equipment and related services is estimated to have declined by more than 10 percent in 2009. At the same time consumer demand continued to grow, the number of mobile subscriptions increased to a total of almost 4.6 billion and data traffic accelerated.
Network sales were down by –3 (+10) percentamounted to SEK 137.1 (142.0)8.4 (14.0) billion. Sales for comparable units declined by 5 percent, i.e. excluding SEK 2.7 billion of sales from acquired Nortel operations. Adjusted also for currency and hedge effects, sales declined in line with the market. Lower GSM sales, particularly in high-growth markets such as China, contributed to the decline. Sales in WCDMA continued to show good growth driven by demand for mobile broadband.
GSM shipments reached their all-time-high volume in 2008. This year, Ericsson’s WCDMA sales surpassed that of GSM for the first time. WCDMA growth did not offset the GSM decline.
ERICSSON ANNUAL REPORT ON FORM 20-F 20092012
Mobile broadband continuesIn CDMA, the priority has been to besupport customers’ migration to Ericsson’s LTE solution and excel in focuslife-cycle management. Ericsson is today a key supplier to all four major operators in North America.
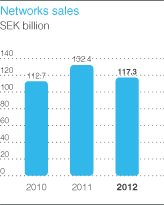
Profitability
Operating margin decreased due to lower sales as well as negative impact from a business mix with more and more networks are being upgraded. Smartphones, netbooks and notebooks drive data traffic and revenues for operators, resultingcoverage than capacity projects. In addition, modernization projects in demand for network expansions and upgrades.Europe impacted profitability negatively.
The
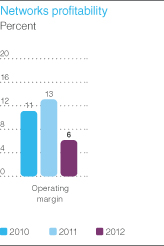
Business in 2012
In 2012, Ericsson maintained its share of global network coverage from WCDMA is still less than halfinstalled base of that of GSM. In China, the 3G licenses were awarded early 2009. Ericsson participated in China Unicom’s WCDMA rollout, the largest and fastest ever. Another achievement was the world’s largest live network upgrade in record time for Vodafone Essar in India, reaching a peak replacement rate of one radio base station every minute. Indiastations of close to 40%, which is expected to award 3G licenses in 2010.almost the size of number two and three combined.
For the next generation wireless technology, 4G/LTE, Ericsson won key contracts with Verizon, Metro PCS, NTT DoCoMomarket areas the Company addresses: Radio, IP and TeliaSonera. The industry support for LTE is very strong and this technology is expected to play an important role in many markets with suitable spectrum. Ericsson is leading the transformation and convergence of the core network with the largest installed base of all-IP networks based on Softswitch and IP Multimedia System (IMS) technology.
The LTE core network is all-IP. To meet the demand for this new all-IP core, Ericsson has introduced the industry’s most comprehensive Evolved Packet Core portfolio which will support LTE network introduction. The portfolio is built on Ericsson’s existing packet core products and new functionality will be introduced through software upgrades.
The increased data traffic driven by mobile broadband continues to create demand for transmission capacity for mobile backhaul. Ericsson offers a wide range of solutions to remove bottlenecks in the transport network. Successful mobile backhaul networks were completed in Turkey, Sweden, Canada and the US in 2009. Sales of optical and microwave transmission solutions to fixedTransport as well as mobile operators developedCore, preliminary market data indicates that the combined market share was 24%, down from 27% in line with the market.
In the fixed access area, the Company had break-in wins for fiber (GPON) connection2011. The decline is due to a lower market share in the Americasmobile network equipment market; from 38% in 2011 to 35% in 2012, negatively impacted by the technology shift in China, where investments are moving from GSM to other technology areas where Ericsson has limited presence.
Operators’ focus on improving network performance and in China.
Operators are evolving from legacy circuit-switched networks to all-IP, in both fixed and mobile networks, and this creates opportunities for Ericsson. A new Silicon Valley campuson service differentiation has been established with the intention of driving the convergence of IP and mobile networks and reaching out to new partners ina main driver for mobile broadband markets. The Company remains optimistic regarding growth opportunities for all-IP networks with IP routing, IMS and transmission.
Withinvestments throughout the acquisition of the Nortel assets for CDMA and LTE, the Company strengthened its ability to serve North America’s mobile operators. The acquisition significantly expands Ericsson’s footprint in this market, particularly as operators in this region are emerging as early adopters of LTE technology. The agreement also includes certain patents and patent licenses relating to CDMA and LTE. Going forward, R&D expenses are expected to be relatively low in CDMA compared with other technologies.
year.ERICSSON ANNUAL REPORT ON FORM 20-F 20092012
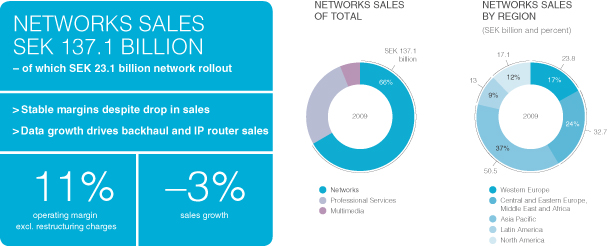
Professional Services
Professional Services sales continued to show good growth, increasing by 15 (14) percent to SEK 56.1 (49.0) billion. Growth measured in local currencies amounted to 8 (13) percent. However, sales were negatively affected byIn 2012, AIR, the reduced scope of a managed services agreementworld’s first commercially deployed antenna-integrated radio and somewhat lower sales of project-related services, reflecting the slowdown in network sales. Managed services was onepart of the main driversRBS 6000 family, met accelerating demand. AIR provides enhanced radio performance and ease of deployment.
After the initial large-scale LTE rollouts in the US, Korea and Japan, Ericsson is now starting to see other countries following. Late 2012, Latin America started LTE rollouts and after executing awarded contracts Ericsson will have a strong LTE footprint in Latin America, substantially higher than its 3G market share in the region.
Up until the end of 2011, Ericsson had won a total of 38 contracts for LTE on five continents.
At the sales increase, growing by 22 (17) percent to SEK 17.4 (14.3) billion, significantly outpacing the market.end of 2012, Ericsson had won more than 120 contracts for LTE on six continents. More than 60 percentLTE networks were in commercial use.
Ericsson’s global market share for LTE was twice as big as the largest competitor, measured in shipments for full year 2012
In 2012, Ericsson put the world’s first converged multi-standard radio base station for LTE FDD/TDD into commercial operation.
The demand for IMS is increasing as operators are preparing to launch Voice over LTE (VoLTE). Ericsson has a number of revenuescontracts for VoLTE.
The demand for circuit-switched core will continue to decline.
During the year, the Smart Services Router (SSR) gained good traction and 39 contracts were signed.
Competitors
In the Networks segment, Ericsson competes mainly with telecommunication equipment suppliers such as Alcatel-Lucent, Cisco, Huawei, Juniper, Nokia Siemens Networks, Samsung and ZTE. The Company also competes with local and regional manufacturers and providers of telecommunications equipment.
Global Services
Two subareas are reported in Global Services: Professional Services are now of a recurring nature.
As the professionaland Network Rollout. Professional Services includes Managed services, market develops, there are many opportunities for project business, but operators are also seeking longer-term partnerships for a competitive edge. Combined with an expanding managed services market, this should help sustain a healthy level of recurring business for Ericsson.
Ericsson is the clear leader in managed services and at year end 2009 Ericsson-managed network operations served over 370 (250) million users. Despite a higher proportion of managed services sales from new contracts with associated start-up costs, Professional Services’ operating margin remained in the mid-teens at 15 (16) percent. This is due to increased efficiency in the delivery organization.
Ericsson won several milestone contracts for managed services during the year. These include Sprint and Zain, the first full-scope managed services contracts in North America and Africa—not only firsts for Ericsson but also for the industry. The acquisition of Nortel’s CDMA and LTE businesses creates opportunities for synergies in the services operations in North America.
Customer Support as well as Consulting and systems integration also had encouraging developments during the year, particularly in revenue assurance and support systems transformation, exemplified by a multi-country contract for revenue assurance with Mobilkom Group of Austria and a service assurance contract with Wataniya in Algeria. Operational consulting is also an area of growth, exemplified by a contract with Claro in Guatemala (fixed and wireless).Systems Integration.
Common challenges faced by operators today are business growth, operational efficiency and network evolution towards IP. In a converging communications world, new complexity in business models must also be added to the challenges. Services expertise and experience, in combination with technology leadership and business understanding, enable the Company to take on a prime integrator role in complex deployment and transformation projects.Sales
Sales were SEK 97.0 (83.9) billion.
ERICSSON ANNUAL REPORT ON FORM 20-F 20092012
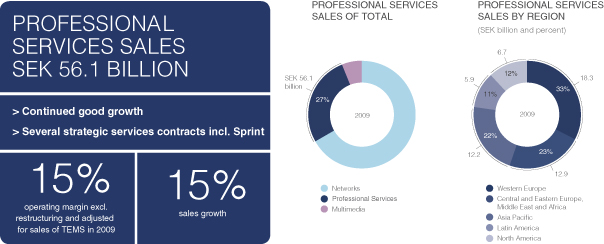
Multimedia
Multimedia sales increased 5 percent for comparable units with revenue management negatively affected during the second half of the year by lower network deployments. The segment continuesgrowth in Professional Services is mainly related to have attractive prospects for sales growthcontinued good momentum in Managed Services as well as in Consulting and Systems Integration. Operators continue to network operatorsfocus on increasing operational efficiency and service providers and the Company is well positioned to benefit from a market rebound.
Operating margin improved to 8 (0) percent while EBITDA margin doubled to 16 percent with stringent cost control and the operational benefits of a more concentrated business, i.e. excluding PBX systems and mobile platforms, focusing on TV solutions, business support systems and revenue management.
Solution area TV performed well during 2009 in what proved to be a challenging market environment. The Company strengthened its positionreducing operating expenses through transformation activities in the IPTV market with a number of winsvoice, IP and OSS and BSS domains which drive demand for its industry-leading IMS-enabled middleware, where full systems integration and solutions delivery is also provided. The product range in the Video on Demand and Content Management area was extended and a new generation of encoding platforms was introduced, redefining the achievable limits of compression performance. Industry recognition of market leadership was reinforced by three prestigious awards at IBC: Best IPTV solution, Best Content Management solution and Best Compression solution.
As operators modernize and transform their networks to all-IP, with more and more services added, the importance of business support systems increases. Ericsson’s business support systems enable management of subscribers, provisioning ofmanaged services and subscriptions, collectionconsulting and systems integration. More than 60% of usage data, chargingProfessional Services sales were recurrent.
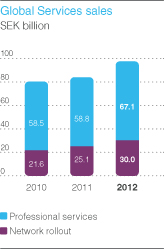
The increase in Network Rollout is related to major activities in North East Asia, North America and invoicingEurope reflecting the high coverage project activity.
Profitability
Global Services’ operating margin development was stable, despite the continued loss in Network Rollout, due to continued efficiency gains and higher sales in Professional Services. Professional Services has over the past years shown an operating margin of 11–14%. Network Rollout is a low-margin business due to its high level of third-party suppliers for services used and settlements with business partnerssuch as civil works. The losses in the service value chain. Business support systems presence was increased by leveraging the strong market position2012 are mainly a consequence of network modernization projects in Networks and Professional Services, especially systems integration, with a broad solutions portfolio in revenue management, provisioning and service delivery.
More than 800 million subscriptions have been activated through Ericsson’s provisioning and service delivery platforms and 1 billion subscribers are now charged and billed through Ericsson’s Revenue Management solutions. A Dynamic Discount Solution (DDS), the first telecom yield management system, was launched and deployed in a number of high-growth markets.
Ericsson advanced its leadership in mobile payment solutions and is first with a global solution to power application stores with mobile web payment capabilities. An Online Payment service was launched with great success through 60 operators in 15 markets. Ericsson was awarded the Best Transactions Provider Award—Mobile Entertainment 2009 and received a high ranking in the Forrester Messaging Wave Report.
Europe.ERICSSON ANNUAL REPORT ON FORM 20-F 20092012
There are opportunities for network operators and service providers to increase the value of their offerings toward consumers by taking advantageRestructuring charges from continuous transformation of the transformation to all-IP. Ericsson’s introductionservice delivery organization is a natural part of the two IP-based applications Rich Communication Suite and services business.
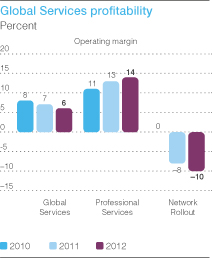
Business Communication Suite has attracted significant market interest. They enable Ericsson’s customersin 2012
Market demand for services continued to provide services regardless of handset model or operating system.grow in both subareas. Ericsson also reinforcedstrengthened its leading positioncapabilities to address new markets and customers in Location Basedareas such as IT Managed Services and Broadcast Services. The Company’s capability to deliver services remotely from the four global services centers expanded with the establishment of two new global network operation centers in Asia and Latin America.
The telecom services market is highly fragmented with a few global, but many local suppliers. In telecoms services, internal market data indicates that the Company reached a market share of 13% and is larger than any of its competitors in this fragmented market.
During 2012, 52 (70) managed services contracts were signed of which 19 (32) were expansions or extensions. In 2012, 24 (34) significant consulting and systems integration contracts were signed. At year end, there were approximately 950 (900) million subscribers in networks managed by Ericsson. Approximately 550 (500) million subscribers were in network operations contracts.
The number of new contracts. In addition, a Real Time Traffic Information service was launched in Europe and Asia.
The Company is making good progress in building a strong portfolio of applications enabling network operators and service providers to grow revenues and expand into new value chains beyond traditional telecom services. Ericsson continues to invest in new multimedia opportunities which may affect profitability on occasion. Most earlier investments are starting to pay off.
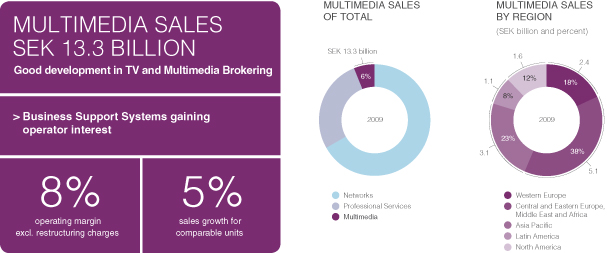
Joint Ventures
Sony Ericsson
The global handset market is believed to have declined by 10 percent in unit shipments, mainly due to weakening demand for mid- to high-end feature phones—an important segment for Sony Ericsson with its higher than average market share exposure. As a consequence, Sony Ericsson’s market share decreased from ~7 percent to less than 5 percent.
Units shipped declined by 41 percent to 57.1 (96.6) million while the average selling priceservices professionals also increased by 3 percent to EUR 119 (116). Sales decreased by 40 percent from EUR 11.2 billion to 6.8 billion. Gross margin declined significantly year-on-year but improved during the year as benefits of cost reductions and new products started to materialize.
Income before taxes, excluding restructuring charges, was a loss of EUR 878 million. The income gradually improved during the year from an improved gross margin56,000 end of 2011 to 60,000 end of 2012. The strategy to industrialize the service delivery continues and reducedthe capability of remote delivery has now reached a level of 23% in 2012 compared with 17% in 2011. This increases capacity and provides economies of scale.
Competitors
Competition in services includes the traditional telecommunication equipment suppliers. The Company also competes with companies such as Accenture, HP, IBM, Oracle, Tata Consultancy Services and Tech Mahindra. Among the competition is also a large number of smaller but specialized companies operating expenses. Ericsson’s share in Sony Ericsson’s income before taxes was SEK –5.7 billion.
on a local or regional basis.ERICSSON ANNUAL REPORT ON FORM 20-F 20092012
Support Solutions
Sales
Sales were SEK 13.5 (10.6) billion. Sales development was good in all four strategic focus areas, i.e. OSS, BSS, TV and Media Management and M-Commerce.
The acquired Telcordia operation added sales of SEK 2.1 billion, representing 50% of Telcordias total sales. The divested Multimedia brokering business (IPX) contributed with sales of SEK 1.2 billion for the first nine months of the year.
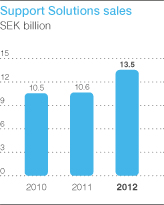
Profitability
Increased sales and execution on the new strategy, as well as portfolio streamlining and efficiency improvement, generated a higher operating margin. The divestment of IPX generated a capital gain of SEK 0.2 billion.
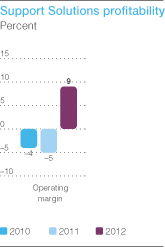
Business in 2012
The segment changed name in 2012 from Multimedia to Support Solutions following a change of strategy. Focus is now on OSS and BSS solutions, TV and Media management and M-Commerce.
Ericsson has a leading position in both OSS and BSS.
ERICSSON ANNUAL REPORT ON FORM 20-F 2012
In BSS, Ericsson has 280 charging and billing installations which at year end served two billion subscriptions. Ericsson’s market share in prepaid is 31%.
In the second halfmedia market, Ericsson is number one in broadcast video contribution, distribution and satellite direct-to-home. Customers include BSkyB, Chunghwa Telecom, Telekom A1, DirecTV, EBU and ESPN.
In M-Commerce, Ericsson is offering a mobile wallet platform and hosted services for interoperability between mobile and financial services. In 2012, the Company signed agreements for wallet payments with Western Union and MTN.
Competitors
The markets for BSS, OSS, TV and Media management and M-Commerce are fragmented with many local players. Competitors vary depending on the solution being offered. In the OSS and BSS market, they include many of the year, borrowing facilities of EUR 455 million were secured to improve liquidity. The parent companies guaranteed EUR 350 million of these facilities on a 50/50 basis without joint responsibility. EUR 255 million were utilized and EUR 200 million remain available as a backup facility. The net cash position was EUR 620 million at year end.
Programs initiated 2008 to lower annual operating expenses by EUR 880 million will continue, with full benefits expected in the second half of 2010. Restructuring charges are estimated to be well within the previously announced EUR 500 million.
Sir Howard Stringer, Chairman, CEO and President of SONY Corporation succeeded Carl-Henric Svanberg as Chairman of the Board and Bert Nordberg, Executive Vice President and Head of Ericsson Silicon Valley, succeeded Dick Komiyama as President and CEO.
ST-Ericsson
Proforma sales declined 25 percent from USD 3.6 billion to 2.7 billion. Sales grew progressively during the year, mainly due to good performance in Asia. The joint venture remains a key supplier to four of the five largest mobile phone manufacturers in the world.
Adjusted operating losses for the full year amounted to USD 440 million but results improved progressively during the year. The first quarter saw a proforma loss of USD 149 million. This was followed by losses of USD 165 million in the second quarter, USD 77 million in the third quarter and USD 50 million in the fourth quarter. The improvements reflect a tight control of product costs and operating expensestraditional telecommunication equipment suppliers as well as IT suppliers, such as Amdocs, Comverse and Oracle. Competition in the positive effects of cost reduction activities.TV business includes Harmonic and Harris. Competition in M-Commerce includes Comviva, Sybase, Infosys and Gemalto.
The JV ST-Ericsson
ST-Ericsson is reportinga 50/50 joint venture between STMicroelectronics and Ericsson, established in US-GAAP.2009. The Ericsson share of ST-Ericsson’s results is accounted for according to the equity method. ST-Ericsson’s main competitor is Qualcomm.
In December 2012, STMicroelectronics announced its intention to exit as a shareholder in ST-Ericsson. On the same day, Ericsson announced that it will continue to work together with STMicroelectronics to find a suitable strategic solution for ST-Ericsson. In December, Ericsson also stated that it will not acquire the full majority of ST-Ericsson and that the Company intends to write down investments and make a provision related to its 50% stake in ST-Ericsson.
This resulted in a non-cash charge of SEK 8.0 billion in 2012. The charge includes write-down of SEK 4.7 billion of investments to reflect the current best estimate of Ericsson’s share of the fair market value of the joint venture. The charge also includes a provision of SEK 3.3 billion related to the available strategic options at hand for the future of the ST-Ericsson assets. As of year-end 2012, there are no more investments related to ST-Ericsson on Ericsson’s balance sheet.
Ericsson continues to believe that the modem technology, which it originally contributed to the JV, has a strategic value to the wireless industry.
Business and financial performance in ST-Ericsson’s income before tax,2012
Early 2012, ST-Ericsson set a new strategic direction aiming at lowering its break-even point and introducing new technologies as well as developing competitive system solutions either directly or with partners.
During 2012, ST-Ericsson reached key maturity milestones with its advanced LTE modem. That is tested with customers and is anticipated to be commercialized in 2013. The NovaThor ModAp is the world’s fastest integrated LTE modem and application processor platform. The ModAp delivers industry-leading performance while improving battery life.
ST-Ericsson sales in 2012 decreased –18% to USD 1.4 (1.7) billion. The operating loss for the year, adjusted to IFRS,for restructuring charges, was SEK –1.8USD –0.8 (–0.7) billion. Adjustments for IFRS-complianceIFRS compliance mainly consist of capitalization of R&D expenses for hardware development.
The cost reduction programs are on schedule and target
ERICSSON ANNUAL REPORT ON FORM 20-F 2012
ST-Ericsson’s net financial position was USD 59537 (–798) million savings per year, of which USD 250 million were achieved by end of 2009. The full effectsat year-end, reflecting the cancellation of the cost-reduction activities are expectedparents’ loan facility. Ericsson’s share in ST-Ericsson’s income before taxes, adjusted to IFRS, was SEK –11.7 (–2.7) billion including the second halfnon-cash charge of 2010.SEK 8.0 billion.
A new product roadmap
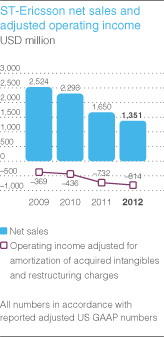
The JV Sony Ericsson
In February 2012, Ericsson announced the completion of the divestment of its 50% stake in Sony Ericsson Mobile Communications to Sony. The agreed cash consideration for market leadershipthe transaction was EUR 1.05 billion. The deal includes a broad IPR cross-licensing agreement. Sony Ericsson was consolidated until December 31, 2011, according to the equity method.
The divestment resulted in a gain of SEK 7.7 billion and a positive cash flow effect of SEK 9.1 billion.
CORPORATE GOVERNANCE
In accordance with the Annual Accounts Act ((SFS 1995:1554), Chapter 6, Sections 6 and 8) and the Swedish Corporate Governance Code (the “Code”), a separate Corporate Governance Report, including an Internal Control section, has been established by combiningprepared. It is attached to this Annual Report.
Continued compliance with the strengthsSwedish Corporate Governance Code
Ericsson applies the Code and is committed to complying with best-practice corporate governance standards on a global level wherever possible. In 2012, Ericsson did not report any deviations from the Code.
High ethical standards
Ericsson’s Code of parent companies STMicroelectronicsBusiness Ethics summarizes the Group’s basic policies and Ericsson. ST-Ericsson’s market position was further enhanced by securing leadership indirectives governing its relationships internally, with its stakeholders and with others. It also sets out how the fast growing TD-SCDMA technologyGroup works to achieve and maintain its high ethical standards. There have been no amendments or waivers to Ericsson’s Code of Business Ethics for the Chinese market and the announcementany Director, member of a close cooperation with Nokia to deliver platforms for new smartphones.
management or other employee.ERICSSON ANNUAL REPORT ON FORM 20-F 20092012
Wireless microelectronics industry veteran Gilles Delfassy succeeded Alain DutheilBoard of Directors 2012/2013
The Annual General Meeting held on May 3, 2012, re-elected Leif Johansson Chairman of the Board. Roxanne S. Austin, Sir Peter L. Bonfield, Börje Ekholm, Ulf J. Johansson, Sverker Martin-Löf, Nancy McKinstry, Anders Nyrén, Hans Vestberg, Michelangelo Volpi and Jacob Wallenberg were re-elected and Alexander Izosimov was elected new member of the Board. Pehr Claesson, Kristina Davidsson and Karin Åberg were appointed employee representatives by the unions, with Rickard Fredriksson, Karin Lennartsson and Roger Svensson as deputies.
Management
Hans Vestberg has been President and CEO after the successful integration of the JV operations. Hans Vestberg succeeded Carl-Henric Svanberg as ChairmanGroup since January 1, 2010. The President and CEO is supported by the Group management, consisting of the Board.Executive Leadership Team (ELT). During 2012, the ELT consisted of the President and CEO, the heads of Group functions, the heads of business units and two of the heads of Ericsson’s regions.
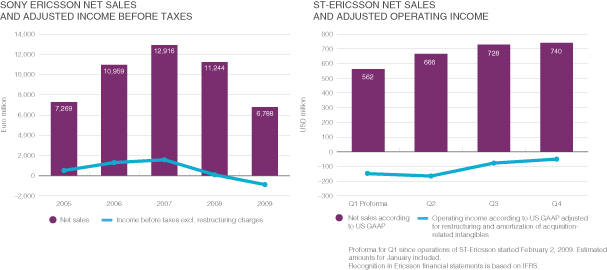
LEGAL AND TAX PROCEEDINGSRemuneration
InFees to the fallmembers of 2007,the Board of Directors and the remuneration to Group management, as well as the 2012 Guidelines for remuneration to Group Management, are reported in Notes to the consolidated financial statements—Note C28, “Information regarding members of the Board of Directors, the Group management and employees”.
As of December 31, 2012, there were no loans outstanding from and no guarantees issued to or assumed by Ericsson was named a defendant in three putative class action suits filedfor the benefit of any member of the Board of Directors or senior management.
The Board of Directors’ proposal for guidelines for remuneration to Group management
The Board of Directors proposes the following guidelines for remuneration to Group management, consisting of the Executive Leadership Team, for the period up to the Annual General Meeting (AGM) 2014. Compared to the guidelines resolved by the AGM 2012, these guidelines have been amended to enable consecutive time-limited arrangements according to the third item in the United States District Courtlist below. Information on estimated costs for variable remuneration has been removed from the guidelines and is instead appended to the AGM 2013 proposal.
Guidelines for remuneration to Group Management:
For Group Management consisting of the Executive Leadership Team, including the President and CEO, total remuneration consists of fixed salary, short- and long-term variable remuneration, pension and other benefits. The following guidelines apply for the Southern Districtremuneration to the Executive Leadership Team:
Variable remuneration is through cash and stock-based programs awarded against specific business targets derived from the long-term business plan approved by the Board of New York. The complaints alleged violations of US securities laws in connection with Ericsson’s October 2007 profit warning. In February 2008,Directors. Targets may include financial targets at either Group or unit level, operational targets, employee engagement targets and customer satisfaction targets
All benefits, including pension benefits, follow the court consolidated the three class actions into one. In June 2008, Ericsson filed a motion to dismiss the complaint. In December, the court granted the motion and dismissed the case. In early January 2009, the plaintiffs appealed the decision to dismiss the case. On October 8, 2009, the Second Circuit affirmed the district court and dismissed the case. Consequently, there are no pending legal actions that relate to Ericsson’s October 2007 profit warning.
In October 2005, Ericsson filed a complaint with the European Commission requesting that it investigate and stop US-based Qualcomm’s anti-competitive conductcompetitive practice in the licensinghome country taking total compensation into account. The retirement age is normally 60 to 65 years of essential patents for 3G mobile technology. In November 2009, the complaints were withdrawn and the investigation closed.age
Together with most of the mobile communications industry, Ericsson has been named a defendant in two class action lawsuits in the US, where plaintiffs allege that adverse health effects could be associated with mobile phone usage. The cases are currently pending in the federal court in Pennsylvania and the Superior Court of the District of Columbia. In September 2008, the federal court in Pennsylvania dismissed plaintiffs’ claims as preempted by federal law. Plaintiffs are appealing this decision to the Third Circuit Court of Appeals. The District of Columbia case is stayed pending the outcome of an appeal in a related case.
In April 2007, an Australian company, QPSX Developments Pty Ltd., filed a patent infringement lawsuit against Ericsson and other defendants in the US, alleging that Ericsson infringed a patent related to asynchronous transfer mode (ATM) technology. Currently, all of the asserted patent claims have been rejected as invalid by an examiner in the US Patent and Trademark Office in connection with a reexamination proceeding. QPSX is appealing that decision. On August 27, 2009, the court granted Ericsson’s motion to stay pending the outcome of the reexamination proceeding.
Swedish fiscal authorities have disallowed deductions for sales commission payments via external service companies to sales agents in certain countries. Most of the taxes have already been paid. The decision covering the fiscal year 1999 was appealed. In December 2006, the County Administrative Court in Stockholm rendered a
ERICSSON ANNUAL REPORT ON FORM 20-F 20092012
judgment
By way of exception, additional arrangements can be made when deemed necessary. An additional arrangement can be renewed but each such arrangement shall be limited in favortime and shall not exceed a period of 36 months and twice the fiscal authorities. remuneration that the individual concerned would have received had no additional arrangement been made
The Administrative Courtmutual notice period may be no more than six months. Upon termination of Appealemployment by the Company, severance pay amounting to a maximum of 18 months fixed salary is paid. Notice of termination given by the employee due to significant structural changes, or other events that in Stockholm affirmeda determining manner affect the County Administrative Court’s judgment. The judgment has been appealed tocontent of work or the Administrative Supreme Court.condition for the position, is equated with notice of termination served by the Company.
For more information on risks related to litigations, see chapter Risk Factors.
MATERIAL CONTRACTS
Material contractual obligations are outlined in Note C33C31, “Contractual obligations”.obligations.” These arewere entered into in the ordinary course of business and were primarily related to operating leases for office and production facilities, purchase contracts for outsourced manufacturing, R&D and IT operations, and the purchase of components for the Company’s own manufacturing.
Ericsson is party to certain agreements, which include provisions that may take effect or be altered or invalidated by a change in control of the Company as a result of a public takeover offer. However, none of the agreements currently in effect would entail any material consequence to Ericsson due to a change in control of the Company.
CORPORATE GOVERNANCERISK MANAGEMENT
In accordanceRisks are defined in both short-term and long-term perspective. They are categorized into industry and market risks, commercial risks, operational risks and compliance risks.
Ericsson’s risk management is based on the following principles, which apply universally across all business activities and risk types:
Risk management is an integrated part of the Ericsson Group Management System
Each operational unit is accountable for owning and managing its risks according to policies, directives and process tools. Decisions are made or escalated according to defined delegation of authority. Financial risks are coordinated through Group Function Finance
Risks are dealt with during the strategy process, annual planning and target setting, continuous monitoring through monthly and quarterly steering group meetings and during operational processes (customer projects, customer bid/contract, acquisition, investment and product development projects). They are subject to various controls such as decision tollgates and approvals.
At least twice a year, in connection with the Swedish Codeapproval of Corporate Governance (the Code), a separate Corporate Governance Report including an Internal Control section has been prepared. The Company is committed to complying with best-practice corporate governance standards on a global level wherever possible. This includes continued compliance with the corporate governance provisions expressedstrategy and targets, risks are reviewed by the Code.
An ethical business
Ericsson’s Code of Business Ethics summarizes the Group’s fundamental policies and directives governing its relationships internally, with its stakeholders and with others. It also sets out how the Group works to achieve and maintain its high standards. There have been no amendments or waivers to Ericsson’s Code of Business Ethics for any Director, member of management or other employee.
Board of Directors 2009/2010
The Annual General Meeting on April 22, 2009, re-elected Michael Treschow as Chairman of the Board and Roxanne S. Austin, Sir Peter L. Bonfield, Börje Ekholm, Ulf J. Johansson, Sverker Martin-Löf, Nancy McKinstry, Anders Nyrén, Carl-Henric Svanberg, and Marcus Wallenberg as Directors of the Board. Anna Guldstrand, Jan Hedlund and Karin Åberg were appointed as union representatives with Monica Bergström, Pehr Claesson and Kristina Davidsson as deputies.
Management
In 2009, Hans Vestberg was appointed new President and CEO, succeeding Carl-Henric Svanberg as of January 1, 2010. The President and CEO is supported by the Group Management Team which, in addition to the President and CEO, consists of heads of Group Functions and heads of business units.Directors.
A central security unit coordinates management system is implemented to ensureof certain risks, such as business interruption, information security and physical security. The Crisis Management Council deals with events of a serious nature.
For information on risks that could impact the business is well managedfulfillment of targets and able to fulfillform the objectives of major stakeholders within established risk limits. The system also monitors internal control and compliance with applicable laws, listing requirements and governance codes.
Remuneration
Fees tobasis for mitigating activities, see the membersother sections of the Board of DirectorsDirectors’ report, Notes C2, “Critical accounting estimates and judgments”, C14, “Trade receivables and customer finance”, C19, “Interest-bearing liabilities”, C20, “Financial risk management and financial instruments” and the remuneration of management as well as the 2009 guidelines for remuneration to senior management are reported in Notes to the Consolidated Financial Statements—Note C29, “Information Regarding Members of the Board of Directors, the Management and Employees”.
chapter Risk factors.ERICSSON ANNUAL REPORT ON FORM 20-F 20092012
AsSOURCING AND SUPPLY
Ericsson’s hardware largely consists of December 31, 2009, there were no loans outstandingelectronics. For manufacturing, the Company purchases customized and standardized components and services from several global providers as well as from local and no guarantees issued to or assumed by Ericsson for the benefitregional suppliers. Certain types of any member of the Board of Directors or senior management.
All relevant information regarding remuneration can be found in chapter Remuneration Report.
The Board of Directors’ proposal for guidelines for remuneration to senior managementcomponents, such as power modules and cables, are produced in-house.
The Boardproduction of Directors proposeselectronic modules and sub-assemblies is mostly outsourced to manufacturing services companies, of which the following guidelines for remunerationvast majority are in low-cost countries. Production of radio base stations is largely done in-house and other employment terms for the senior management for the period up to the 2011 Annual General Meeting. Compared to the guidelines resolved by the 2009 Annual General Meeting, these guidelines have been restructured and rephrased to better demonstrate the basic principles for remuneration within the Ericsson Group.
Details of how we deliver on our principles and policy, including information on previously decided long-term variable remuneration that has not yet become due for payment, can be found in the Remuneration Report and in Note C29, “Information regarding Members of the Board of Directors, the Management and Employees” in the Annual Report 2009.
2010 Remuneration Policy
Remuneration at Ericsson is based on the principles of performance, competitiveness and fairness. These principles and good practice in Sweden guide our policy to:
Attract and retain highly competent, performing and motivated people that have the ability, experience and skill to deliver on the Ericsson strategy.
Encourage behavior consistent with Ericsson’s culture and core values of professionalism, respect and perseverance.
Ensure fairness in reward by delivering total remuneration that is appropriate but not excessive.
Ensure a total compensation mix of fixed and variable remuneration and benefits that reflects the Company´s principles and is competitive where Ericsson competes for talent.
Encourage variable remuneration which, first, aligns employees with clear and relevant targets, second, reinforces performance and, third, enables flexible remuneration costs.
Ensure that all variable remuneration plans have maximum award and vesting limits.
Encourage employees to deliver sustained performance and build up a personal shareholding in Ericsson, aligning the interests of shareholders and employees.
Communicate clearly to both employees and shareholders how Ericsson translates remuneration principles and policy into practice.
Group Management
For senior management consisting of the Executive Leadership Team, including the President and CEO, in the following referred to as the “Group Management”, total remunerationon-demand. This consists of fixed salary, short-assembling and long-term variable remuneration, pensiontesting modules and other benefits. Furthermore, the following guidelines apply for Group Management:
Variable remuneration is through cashintegrating them into complete units. Final assembly and stock-based programs awarded against specific business targets derived from the long-term business plan approved by the Board of Directors. Targets may include financial targets at either corporate or unit level, operational targets, employee motivation targets and customer satisfaction targets.
ERICSSON ANNUAL REPORT ON FORM 20-F 2009
With the current composition of Group Management, the Company’s cost during 2010 for the variable remuneration of Group Management can, at a constant share price, amount to between 0 and 140 percent of the aggregate fixed salary cost, all excluding social security costs.
All benefits, including pension benefits, follow the competitive practice in the home country taking total compensation into account. The retirement age is normally 60 to 65 years of age.
By way of exception, additional arrangements can be made when deemed required. Such additional arrangement shall be limited in time and shall not exceed a period of 36 months and two times the remuneration that the individual concerned would have received had no additional arrangement been made.
The mutual notice period may be no more than six months. Upon termination of employment by the Company, severance pay amountingtesting are concentrated to a maximumfew sites. Ericsson has 16 manufacturing sites in Brazil, China, Estonia, India, Italy, Mexico and Sweden.
A number of 18 months fixed salary is paid. Noticesuppliers design and manufacture highly specialized and customized components. The Company generally attempts to negotiate global supply agreements with its primary suppliers. Ericsson’s suppliers are required to comply with the Code of termination given by the employee dueConduct.
Where possible, Ericsson relies on alternative supply sources and seeks to significant structural changes, or other events thatavoid single source supply situations. A need to switch to an alternative supplier may require allocation of additional resources. This process could take some time to complete.
Variations in market prices for raw materials generally have a determining manner affect the contentlimited effect on total cost of work or the condition for the position, is equated with notice of termination served by the Company.goods sold. For more information, see chapter Risk Factors.
SUSTAINABILITY AND CORPORATE RESPONSIBILITY
The Company has implemented strong social, environmental and ethical standards supporting value creation and risk management and value creation.management. This commitment generates positive business impacts, thatwhich in turn benefit society.
Ericsson’s approach to Sustainability and Corporate Responsibility (CR) is integrated into its core business operations and inthroughout its relationships with stakeholders.value chain. The Board of Directors considers these aspects in governance decision-making. Group level policies and directives ensure consistency across global operations.
Ericsson publishes an annual Sustainability and CRCorporate Responsibility Report, which provides additional information.
Minimizing risk
Responsible business practices
Since 2000, Ericsson supportshas actively supported the UN Global Compact, and endorses its ten principles regarding human and labor rights, anti-corruption and environmental protection. The Ericsson Group Management System (EGMS) includes policies and directives that cover responsible business practices, such as thea Code of Business Ethics and a Code of Conduct (CoC), anti-corruption and environmental management. Itamong other policies which reflect responsible business practices. Promotion of these practices is reinforced by employee awareness training, workshops and monitoring, including a global assessment programplan run by an external assurance providerprovider.
In 2012, Ericsson has continued to develop its anti-corruption program and expanded its whistleblower procedure.
Human rights
In 2012, the Company updated its Code of Business Ethics to reflect the ongoing commitment to respect human rights, and the UN Guiding Principles on Business and Human Rights. Ericsson has worked actively to
ERICSSON ANNUAL REPORT ON FORM 20-F 2012
strengthen its internal governance processes including the Sales Compliance Board, which also considers potential negative human rights impacts in which CR criteria represent approximately 20 percentits decisions. The Company joined the Shift Business Learning Program to support human rights risk analysis capabilities.
Ericsson is part of the total areas assessed.Burma (Myanmar) Human Rights and Business Framework, led by the Institute for Human Rights and Business and the Danish Human Rights Institute. Together with Deloitte, the Company launched a report, “The Potential Economic Impact of Mobile Communications in Myanmar,” which shows the importance of mobile communications from both GDP and job-creation perspectives.
Supply chain
Suppliers must comply with Ericsson’s CoC. Approximately 170 employees, covering all regions, are trained as supplier CoC and Environmental Requirements.auditors. The Company uses a risk-based approach to ensure that the high risk portfolio areas, and highest risk markets, are targeted first. For prioritized areas, Ericsson performs regular audits and works with suppliers to ensure measurable and continuous improvements. Priorities from a risk model include network roll- out, tower manufacturing and logistics. Findings are followed up to ensure that lasting improvements are made. One common findingTraining for suppliers is suppliers’ insufficient routines for ensuringavailable in 13 languages.
To effectively address the issue of conflict minerals, including compliance towith the CoC requirementsUS Dodd-Frank Act and the disclosure rule adopted by the U.S. Securities and Exchange Commission (SEC), Ericsson takes active measures in their supply chain.its sourcing and product management processes. Ericsson also participates in industry initiatives such as The Extractives Workgroup on conflict minerals, driven by the Global e-Sustainability Initiative (GeSI).
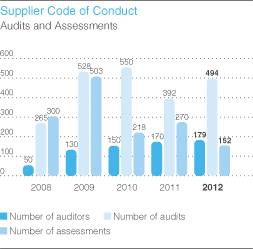
Design for EnvironmentReducing environmental impact
ControlsEnergy use of products in operation remains the Company’s most significant environmental impact. Ericsson works proactively with its customers to encourage network and site energy optimization, through innovative products, software, solutions and advisory services. Processes and controls are in place to ensure compliance with relevant product-related environmental, regulations, e.g. the EU regulation for Registration, Evaluation, Authorizationcustomer and restriction of Chemicals (REACH). Ericsson’s List of Banned and Restricted Substances was updated in 2009.regulatory requirements. The Company hasworks actively to date produced more than 10 million lead-free soldered printed board assembliesreduce its own environmental impact, with reliability equal to lead-soldered boards.
a focus on Design for Environment, which includes product energy efficiency and materials management.ERICSSON ANNUAL REPORT ON FORM 20-F 20092012
A five-year target which aims to reduce the Ericsson carbon footprint intensity by 40% was set in 2009 (with a 2008 baseline). The target comprises two focus areas: Ericsson’s own activities and the life-cycle impacts of products in operation. In 2012, Ericsson exceeded the annual 10% reduction target and, as a result, the target has been achieved in four years instead of five, with the following results:
A 22% reduction in direct emission intensity from own activities was achieved during 2012, including facilities energy use, product transportation and business travel. This was achieved by
| — | | reducing absolute emissions from business travel by 16% |
| — | | reducing absolute emissions from product transportation by 12% |
| — | | decreasing facility energy consumption by approximately 3%. while related emissions increased by 13% |
A 16% reduction in indirect emission intensity from life-cycle impacts of products in operation was achieved in 2012.
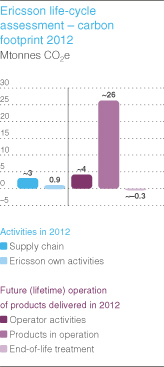
ERICSSON ANNUAL REPORT ON FORM 20-F 2012
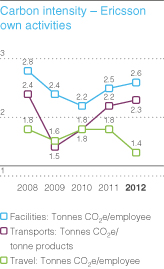
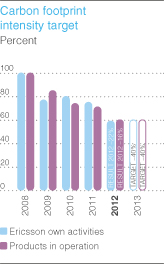
Take-backProduct take-back and recycling
Ericsson Ecology Management and Product Take-back is a global initiativeprogram to take responsibility offor products at the end of their life. Closelife and to 100 percenttreat them in an environmentally preferable way. The program also ensures that Ericsson fulfills its extended producer responsibility and is offered to all customers globally free of decommissioned equipmentcharge, not only in markets where it is recycled, exceeding the Waste from Electronic and Electrical Equipment Directive (WEEE) stipulation of 75 percent. During 2009 more than 5,300 tons were collected.mandatory.
ERICSSON ANNUAL REPORT ON FORM 20-F 2012
Radio waves and health
Ericsson employs rigid product testing and installation procedures with the goal of ensuring that radio wave exposure levels from Ericsson products and network solutions are below established safety limits. The Company provides public information on radio waves and health, and supports independent research to further increase knowledge in this area. Since 1996, Ericsson currently co-sponsors about 40 ongoing research projectshas cosponsored over 90 studies related to electromagnetic fields radio waves and health; over 90 studies have been supported since 1996.health. Independent expert groups and public health authorities, including the World Health Organization, have reviewed the total amount of research and have consistently concluded that the balance of evidence does not demonstrate any health effects associated with radio wave exposure from either mobile phones or radio base stations.
Creating valueEricsson has been cosponsoring the Swedish part of the international COSMOS study, which aims to carry out long-term health monitoring of more than 200,000 people to identify if there are any health issues linked to long-term mobile phone use. To assure scientific independence there is a firewall in place between the industrial sponsors and the researchers.
The environmental opportunityClimate change
Information and Communication Technology (ICT) represents about two percent2% of global CO2 emissions, but can potentially offset a significant portion16% of the remaining 98 percent98% from other sectors.industries, according to GeSI’s SMARTer2020 report. The report also shows that the abatement potential of ICT is over seven times its own emissions. Ericsson takes active measures to ensure that its own carbon footprint will beintensity is continuously reduced. A carbon footprint reduction target was set in 2008 to reduce emissions relative to products sold by 40 percent over five years, from in-house activities and the life-cycle impacts of products. In 2009, Ericsson exceeded the annual 10 percent reduction target by:
| • | | A 20 percent reduction in direct emissions from Ericsson activities, through reducing product weight, increasing the share of surface mode transports to 60 percent, and by reducing business travel by approximately 10 percent globally. This led to a 200,000 ton CO2 reduction.
|
| • | | A 15 percent reduction in indirect emissions from products in operation was achieved. Reducing the energy consumption of products sold will lead to a 3.5 million ton CO2 reduction over the product lifetime.
|
In addition, part of Ericsson’s sustainability strategy is toincludes focus on the role that broadband can play in helping to offset global CO2 emissions. In 2009,emissions, 70% of which are attributed to cities, according to UN-Habitat. Ericsson focusedworks on sustainable city solutions and partneredis engaged in global climate policy. Ericsson’s President and CEO Hans Vestberg leads the Climate Change Working Group of the Broadband Commission for Digital Development which launched the report “The Broadband Bridge: Linking ICT with WWF Sweden to assess the positive impact that ICT has in the creation ofclimate action for a low-carbon economies, co-publishing recommendations for policy makers.economy.”
SonyTechnology for Good
In 2011, Ericsson launched its Greenheart phone, with an in-phone manual, recycled plastics, energy efficient displaythe Technology for Good program, focused on applying the Company’s expertise, global presence and waterbased paints decreasing the overall CO2 emissions of the phone by 15 percent.
Meeting the Millennium Development Goals
scale to find market-based solutions that empower people, business and society to help shape a more sustainable world. Mobile connectivity fuels economic growth, which is particularly vital for the billions of people living at the base of the economic pyramid—the markets of the future.pyramid. Ericsson is committed to usinghas used its technology and competence to help achieve the UN Millennium Development Goals (MDGs), for more than a decade. Ericsson’s President and customer engagementCEO also joined the Leadership Council of the Sustainable Development Solutions Network, an initiative of the UN Secretary General, to contribute to the post-2015 development agenda and the Sustainable Development Goals. The Company engages in many Technology for Good projects globally, including Connect to Learn and Ericsson Response™.
Reporting according to GRI 3.0
Full key performance data is part of its strategyavailable on the Ericsson website and has achieved an A+ rating according to meet this aim.the Global Reporting Initiative (GRI). The performance data has been assured, and the application level has been checked by a third party.
In 2009, a monitoring and evaluation study, conducted in cooperation with Columbia University, revealed that access to mobile communicationsLEGAL PROCEEDINGS
On November 27, 2012, Ericsson filed two patent infringement lawsuits in the Millennium Villages has concretely contributed toUS District Court for the achievementEastern District of the MDGs. ItTexas against Samsung. Ericsson seeks damages and an injunction. Ericsson also showed that mobile applications are especially well suited for collecting information and monitoring critical areas such as health, education, security and small business development.
asked theERICSSON ANNUAL REPORT ON FORM 20-F 20092012
Court to adjudge that Samsung breached its commitment to license any standard-essential patents it owns on fair, reasonable, and non-discriminatory terms and to declare Samsung’s allegedly standard essential patents to be unenforceable.
On November 30, 2012, Ericsson Responsefiled a complaint with the US International Trade Commission, ITC, seeking an exclusion order blocking Samsung from importing certain products into the USA. The ITC instituted an investigation of Ericsson’s complaint on January 3, 2013.
On December 21, 2012, Samsung filed a complaint with the US International Trade Commission seeking an exclusion order blocking Ericsson Responsefrom importing certain products into the USA. The ITC instituted an investigation of Samsung’s complaint on January 25, 2013.
On October 1, 2012, Wi-LAN Inc. filed a complaint against Ericsson in the US District Court of Southern Florida alleging that Ericsson’s LTE products infringe three of Wi-LAN’s US patents. The parties are presently engaged in discovery. Ericsson was, on October 4, 2010, sued by Wi-LAN in another patent infringement law suit in the US District Court for the Eastern District of Texas. Wi-LAN alleged that Ericsson products, compliant with the 3GPP standard. Infringe three US patents assigned to Wi-LAN. A trial is scheduled for April 2013.
In February 2012, Airvana Networks Solutions Inc. sued Ericsson in the Supreme Court of the State of New York, alleging that Ericsson has violated key contract terms and misappropriated Airvana trade secrets and proprietary information. Airvana is seeking damages of USD 330 million and to enjoin Ericsson from developing, deploying or commercializing Ericsson products allegedly based on Airvana’s proprietary technology. In April 2012, the Court heard Airvana’s request for preliminary injunction. The motion for preliminary injunction remains under consideration by the Court. The parties are presently engaged in further discovery.
In 2011, TruePosition sued Ericsson, Qualcomm, Alcatel-Lucent, the European Telecommunications Standards Institute (ETSI) and the Third Generation Partnership Project (3GPP) in the US District Court for the Eastern District of Pennsylvania for purported federal antitrust violations. The complaint alleged that Ericsson , Qualcomm and Alcatel-Lucent illegally conspired to block the adoption of TruePosition’s proprietary technology into the new mobile positioning standards for LTE, while at the same time ensuring that their own technology was included into the new standards. In January 2012, the Court dismissed the complaint on a global employee volunteer initiative“without prejudice” basis. Following the dismissal, TruePosition filed an amended complaint in February 2012. The case is proceeding to rapidly roll out communication solutionsdiscovery.
In 2007, H3G S.p.A. (H3G) filed arbitral proceedings in Italy against Ericsson. H3G claims compensation from Ericsson for alleged breach of contract. H3G claims approximately EUR 475 million plus default interest. In addition to denying the claim in substance, Ericsson made a number of formal objections to the claim and provide telecomsfiled a motion for the case to be dismissed. Ericsson’s formal objections were however dismissed by the Arbitral Tribunal in a partial award rendered in February 2012. The Tribunal has appointed experts to assist disaster relief operations. Ericsson Response cooperates withrender an opinion on various substantive technical and financial issues. The final report was rendered in February 2013. The final arbitral award is expected to be rendered at the UN Office for the Coordinationend of Humanitarian Affairs, the UN World Food Programme and the International Federation of Red Cross and Red Crescent Societies (IFRC).2013.
In 2009, support was provided to relief workers in saving children in Southern Sudan and after heavy flooding in Panama. Continued support was givenaddition to the UN in establishing operations inproceedings discussed above, the Central African RepublicCompany is, and in the Democratic Republic of Congo.
In recognition of performance
The Millennium Villages Project received a Global Telecoms Business Innovation Award.
Ericsson China was named the “China Green Benchmark Company” for the second yearfuture may be, involved in a row. Ericsson was also recognized as the “Green Pioneer” at the 2009 “Korea-EU Industrial Cooperation Day”. In the UK Brand Emissions Leaders survey, Ericsson was named one of the brand leaders in reducing its carbon emissions.
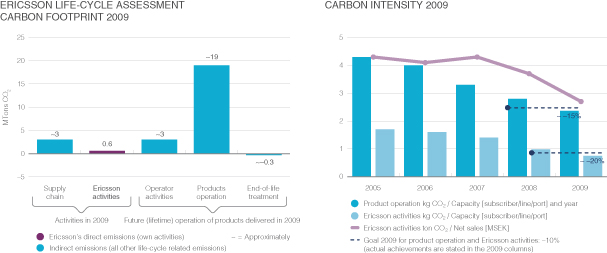
RISK MANAGEMENT
Ericsson’s Board of Directors is actively engaged in the Company’s risk management. Risks related to set long-term objectives are discussedvarious other lawsuits, claims and strategies formally approved by the Board as part of the annual strategy process. Risks related to annual targets for the Company are also reviewed by the Board and then monitored continuously during the year.
Operational risk management is integrated within the Ericsson Group Management System to ensure effectiveness, efficiency, business continuity and compliance with corporate governance, legal and other requirements. Certain transactional risks require specific Board approval, e.g. material acquisitions, management remuneration, borrowing or customer finance in excess of pre-defined limits.
For more information on risks related to Ericsson’s business, see chapter Risk Factors.
ERICSSON ANNUAL REPORT ON FORM 20-F 2009
Strategic and tactical risks
In the annual strategy and target setting process, objectives are set for the next five years, risks and opportunities are assessed and strategies are developed to achieve the objectives. To ensure that actions are taken to realize the strategies, focus areas are identified in target setting and planning for the coming year.
In 2009, the general economic downturn in 2008–2009 and the consequences for the business were assessed in relation to both strategy and target setting. For the setting of long-term objectives, important industry and market fundamentals were analyzed and risks and opportunities evaluated. Near-term, a continued focus on cost management and a strong liquidity were emphasized dueproceedings incidental to the increased difficultiesordinary course of forecasting customer demand.
Risks and opportunities were identified and analyzed in the following balanced scorecard perspectives:business.
Financial perspective
Top line growth: the decline caused by reduction in 2G spend has yet to be offset by growth in 3G and LTE driven by data traffic in mobile broadband networks. Ericsson will focus on converged solutions, IMS, multi-standard radios and services plus opportunities in transmission and evolved EDGE.
Margin improvement: addressed by platform consolidation, software reuse, reduced number of sites and rapid transformation of transferred managed services operations and integration of acquired Nortel units.
Cash flow: continued focus on working capital improvements. A strong cash position is deemed important for flexibility to execute on potential market opportunities.
JVs: continued cooperation with JVs and co-owners needed to make them profitable again as soon as possible.
Customer perspective
Convergence of the telecom, datacom and media industries results in new forms of competition and customers. Ericsson will focus on competitive offerings for mobile broadband, converged core solutions, network management systems and systems integration.
The competitive landscape is constantly changing, as consolidation continues among customers and vendors. Continued investments in R&D for premium, cost-effective and future-proof solutions are essential. Customer intimacy for network planning and migration is key for forging customer partnerships.
Ericsson’s installed base is an important asset for sales of upgrades, network convergence and systems integration. Now also Nortel’s US customer base is added, providing additional opportunities in CDMA and LTE.
Continuous follow-up of quality of delivered products and services to be maintained to ensure customer satisfaction.
ERICSSON ANNUAL REPORT ON FORM 20-F 2009

Market position perspective
Continued strong competition in the market is addressed through cost reductions and premium end-to-end solutions, based on continued leadership in R&D and services.
Market leadership is being safeguarded through rapid technological development and establishment of a key player position in network transformation—IP, mobile broadband, multimedia and consulting.
Backhaul demand is growing, driven by strong data traffic. Ericsson will seize this opportunity by harvesting its leading microwave position.
The Company will also leverage the broader product portfolio created through acquisitions, promote OneVoice and IMS for LTE networks, and continue its strong Design for Environment program to lower operators’ cost of ownership and drive a positive environmental impact.
The Company will capitalize on the dramatic improvement of its US footprint and its Silicon Valley presence.
The joint ventures will need to execute their restructuring programs and also address multiple operating systems and new market players, e.g. Google/Android. Sony Ericsson will focus its product portfolio more on high-end handsets.
Operations and people perspectives
Restructuring and other activities have been defined for margin protection, including industrialization of managed services.
Continued focus in R&D on shortened lead times for product/solution development.
Increased flexibility and responsiveness will be achieved through efforts to shorten lead times also for delivery of hardware and software.
The Company must ensure it has top competence in key technology areas and systems integration.
Empowerment and remuneration are important aspects to continue to be a competitive and attractive employer.
ERICSSON ANNUAL REPORT ON FORM 20-F 2009
Operational and financial risks
Operational risks are owned and managed by operational units. Risk management is embedded in various process controls, such as decision tollgates and approvals. Certain cross-process risks, such as information security/IT, corporate responsibility and business continuity as well as insurable risks are centrally coordinated. Financial risk management is governed by a Group policy and carried out by the Treasury and Customer Finance functions, both supervised by the Finance Committee of the Board of Directors. The policy governs risk exposures related to foreign exchange, liquidity/ financing, interest rates, credit risk and market price risk in equity instruments. For further information on financial risk management, see Notes to the Consolidated Financial Statements – Note C14, “Trade Receivables and Customer Finance”, Note C19, “Interest-Bearing Liabilities” and Note C20, “Financial Risk Management and Financial Instruments”.
Compliance risks
Ericsson has implemented Group policies and directives to ensure compliance with applicable laws and regulations, including a Code of Business Ethics. Risk management is integrated in the Company’s business processes. Policies and controls are implemented to ensure compliance with financial reporting standards and stock market regulations, e.g. the US Sarbanes-Oxley Act.
Monitoring and audits
Company management monitors the compliance with policies, directives and processes through internal self-assessment within all units. This is complemented by internal and external audits. External financial audits are performed by PricewaterhouseCoopers, and ISO/management system audits by Det Norske Veritas, DNV.
PARENT COMPANY
The Parent Company business consists mainly of corporate management, holding company functions and internal banking activities as well asactivities. It also handles customer credit management, performed on a commission basis by Ericsson Credit AB.
The Parent Company is the owner of a substantial part of Ericsson’s intellectual property rights. It manages the patent portfolio, including patent applications, licensing and cross-licensing of patents and defending of patents in litigations.
ERICSSON ANNUAL REPORT ON FORM 20-F 2012
The Parent Company has 6 (7)(6) branch offices. In total, the Group has 65 (62)71 (70) branch and representative offices.
Financial information
Net sales for the year amounted to SEK 0.3 (5.1) billion and incomeIncome after financial items was SEK 8.1 (19.4)–4.9 (4.4) billion.
Effective January 1, 2009, the right to all license revenues from third parties related to patent licenses was transferred to Ericsson AB, a wholly owned subsidiary, and consequently net sales in 2009 were insignificant compared to 2008. TEMS SWEDEN AB was sold during the year.
Exports accounted for 100 (70) percent of net sales. The Parent Company had no sales in 20092012 or 20082011 to subsidiaries, while 45 (46) percent34% (31%) of total purchases of goods and services were from such companies.
Major changes in the Parent Company’s financial position for the year include:included:
InvestmentsWrite-down of original investment in the joint venture ST-Ericsson of SEK 8.6 billion. This write-down does not have any impact on Group level. Another write-down was made including the short-term credit facility to ST-Ericsson of SEK 5.0 billion. and a provision of SEK 3.3 billion relating to the strategic options at hand for ST-Ericsson assets. The total write-downs and provision related to ST-Ericsson amount to SEK 17.0 billion.
DecreasedIncreased current and non-current receivables from subsidiaries of SEK 10.17.2 billion.
ERICSSON ANNUAL REPORT ON FORM 20-F 2009
DecreasedIncreased other current receivables of SEK 2.0 billion.1.7 billion
Increased cash, cash equivalents and short-term investments of SEK 3.2 billion.1.3 billion
Increased current and non-current liabilities to subsidiaries of SEK 5.0 billion.8.7 billion
Decreased other current liabilities of SEK 7.41.1 billion.
At year end,year-end, cash, cash equivalents and short-term investments amounted to SEK 62.4 (59.2)57.4 (56.1) billion.
Share information
As per December 31, 2012, the total number of shares in issue was 3,305,051,735, of which 261,755,983 were Class A shares, each carrying one vote, and 3,043,295,752 were Class B shares, each carrying one tenth of one vote. Both classes of shares have the same rights of participation in the net assets and earnings.
The Annual General Meeting (AGM) 2012 resolved to issue 31.7 million Class C shares for the Long-Term Variable Remuneration Program (LTV). In accordance with an authorization from the AGM, in the second quarter as decided by2012, the Board of Directors with authorization fromresolved to repurchase the Annual General Meeting, a stock issue and a subsequent repurchase was made for the share-based employee remuneration program. 27 million Class Cnew issued shares, which were issued and later repurchased as treasury stock. The shares weresubsequently converted into Class B shares. The quotient value of the repurchased shares was SEK 135.05.00, totaling SEK 158.5 million, representing less than 1one percent of capital stock, and the acquisition cost was approximately SEK 135.1158.7 million.
As per December 31, 2009, the total number of shares was 3,273,351,735, of which 261,755,983 Class A shares, each carrying one vote, and 3,011,595,752 Class B shares, each carrying one-tenth of one vote. The two largest shareholders at year endyear-end were Investor and Industrivärden holding 19.3321.37% and 13.62 percent14.96% respectively of the voting rights in the Parent Company.
In accordance with the conditions of the Long-Term Variable Remuneration Program (LTV) for Ericsson employees, 9,087,5649,748,408 treasury shares were sold or distributed to employees in 2009.2012. The quotient value of these shares was SEK 45.45.00, totaling SEK 48.7 million, representing less than 1 percent1% of capital stock, and compensation received for shares sold and distributed shares amounted to SEK 213.291.2 million.
The holding of treasury stock at December 31, 2009,2012 was 78,978,53384,798,095 Class B shares. The quotient value of these shares is SEK 394.95.00, totaling SEK 424.0 million, representing 2 percent2.6% of capital stock, and the related acquisition cost amounts to SEK 672.4655.3 million.
ERICSSON ANNUAL REPORT ON FORM 20-F 2012
Proposed disposition of earnings
The Board of Directors proposes that a dividend of SEK 2.00 (1.85 in 2008)2.75 (2.50) per share be paid to shareholders duly registered on the record date April 16, 2010,12, 2013, and that the Parent Company shall retain the remaining part of non-restricted equity.
The Class B treasury shares held by the Parent Company are not entitled to receive a dividend. Assuming that no treasury shares remain on the record date, the Board of Directors proposes that earnings be distributed as follows:
| | | | |
Amount to be paid to the shareholders | | | SEK 6,546,703,4709,088,892,271 | |
Amount to be retained by the Parent Company | | | SEK 35,406,164,93016,535,096,753 | |
| | | | |
Total non-restricted equity of the Parent Company | | | SEK 41,952,868,400 |
| 25,623,989,024 | |
As a basis for its dividend proposal, the Board of Directors has made an assessment in accordance with Chapter 18, Section 4 of the Swedish Companies Act of the Parent Company’s and the Group’s need for financial resources as well as the Parent Company’s and the Group’s liquidity, financial position in other respects and long-term ability to meet their commitments. The Group reports an equity ratio of 52 (50) percent50% (52%) and a net cash amount of SEK 36.1 (34.7) billion.38.5 (39.5) billion
The Board of Directors has also considered the Parent Company’s result and financial position and the Group’s position in general. In this respect, the Board of Directors has taken into account known commitments that may have an impact on the financial positions of the Parent Company and its subsidiaries.
ERICSSON ANNUAL REPORT ON FORM 20-F 2009
The proposed dividend does not limit the Group’s ability to make investments or raise funds, and it is ourthe Board of Directors’ assessment that the proposed dividend is well-balanced considering the nature, scope and risks of the business activities as well as the capital requirements for the Parent Company and the Group.Group in addition to coming years’ business plans and economic development.
POST-CLOSING EVENTS
In an auction on November 25, 2009, Ericsson acquired certain assets relating to Nortel’s GSM business in North America for a cash purchase price of USD 70 million. Closing is expected by March 31, 2010, subject to approval by US and Canadian bankruptcy courts and satisfying normal regulatory conditions.
On January 12, 2010,10, 2013, Ericsson entered into an agreement with Unwired Planet whereby Ericsson will transfer 2,185 issued patents and patent applications to Unwired Planet. Ericsson will also contribute 100 additional patent assets annually to Unwired Planet commencing in 2014 through 2018. Unwired Planet will compensate Ericsson with certain ongoing rights in future revenues generated from the enlarged patent portfolio. Unwired Planet will also grant Ericsson a license to its patent portfolio.
On January 21, 2013, Ericsson announced its intention to acquire Devoteam Telecom & Media operations in France. Devoteam has employees in Europe, Middle East and Africa. The acquisition is in line with Ericsson’s services strategy to broaden its IT capabilities.
In January, 2013, ST-Ericsson was granted a loan facility by their owners of USD 260 million. Ericsson’s share of this credit facility is USD 130 million.
On January 10, 2013 Adaptix Inc. filed two lawsuits against Ericsson, AT&T, AT&T Mobility and MetroPCS Communications in the US District Court for Eastern District of Texas alleging that certain Ericsson products infringe five US patents assigned to Adaptix. Adaptix seeks damages and an injunction.
On January 25 Adaptix filed a complaint with the US International Trade Commission (ITC) against Ericsson, AT&T, AT&T Mobility and MetroPCS Communications requesting that the commission open a patent
ERICSSON ANNUAL REPORT ON FORM 20-F 2012
infringement investigation of certain Ericsson products and further on January 29 Adaptix filed a complaint with the Tokyo District Court alleging certain Ericsson products infringe two Japanese patents assigned to Adaptix. Adaptix seeks damages and an injunction.
On March 18, 2013, Ericsson and STMicroelectronics announced an agreement on the way forward for the joint venture (JV) ST-Ericsson.
The main steps agreed upon to acquire Pride Spa, an Italian systems integration company with approximately 1,000 employees.
On January 18, 2010,split up the Company appointed Rima QureshiJV are the following: Ericsson will take on the design, development and Magnus Mandersson as heads of business unit CDMA and Global Services respectively. Both are memberssales of the Executive Leadership Team.
In January 2010, as perLTE multimode thin modem products, including 2G, 3G and 4G multimode; ST will take on the trust’s funding requirements, the Company made an employer contribution payment of SEK 730 million to the Swedish pension trust fund.
On February 8, 2010, the Company announced the appointment of Mats H. Olssonexisting ST-Ericsson products, other than LTE multimode thin modems, and Angel Ruiz as members of the Executive Leadership Teamrelated business as well as a reorganizationcertain assembly and test facilities; starting the close down of its 23 market units into ten regions.the remaining parts of ST-Ericsson.
On March 31, 2010, Ericsson announced that Marita Hellberg, Senior Vice President and HeadThe formal transfer of Group Function Human Resources and Organization will take over as Headthe relevant parts of Human ResourcesST-Ericsson to the parent companies is expected to be completed during the third quarter of Ericsson’s new region China and North East Asia from July 1st.2013, subject to regulatory approvals.
On April 1, 2010 Ericsson announced thatAfter the acquisition of substantially all the assets of Nortel’s GSM business had been completed, effective March 31. The closing follows the announcement on November 25, 2009,split up it is proposed that Ericsson had entered into an asset purchase agreement for the assets of Nortel’s GSM business in North America.
On April 21, 2010, the Company announced that it had entered into a share purchase agreement to acquire Nortel’s majority shareholding (50%+1 share) in LG-Nortel, the joint venture of LG Electronicswill assume approximately 1,800 employees and Nortel Networks. Purchase price is USD 242 million on a cash and debt free basis. The transaction is subject to customary regulatory approvals.contractors.
BOARD ASSURANCE
The Board of Directors and the President declare that the consolidated financial statements have been prepared in accordance with IFRS, as issuedadopted by the IASB,EU, and give a fair view of the Group’s financial position and results of operations. The financial statements of the Parent Company have been prepared in accordance with generally accepted accounting principles in Sweden and give a fair view of the Parent Company’s financial position and results of operations.
The Board of Directors’ Report for the Ericsson Group and the Parent Company provides a fair view of the development of the Group’s and the Parent Company’s operations, financial position and results of operations and describes material risks and uncertainties facing the Parent Company and the companies included in the Group.
ERICSSON ANNUAL REPORT ON FORM 20-F 20092012
REPORT OF INDEPENDENT REGISTERED PUBLIC ACCOUNTING FIRM
To the shareholdersShareholders of Telefonaktiebolaget LM Ericsson (publ)
In our opinion, the accompanying consolidated balance sheets and the related consolidated statements of income, comprehensive income, shareholders equity and cash flows present fairly, in all material respects, the financial position of Telefonaktiebolaget LM Ericsson and its subsidiaries at December 31, 20092012 and December 31, 2008,2011, and the results of their operations and their cash flows for each of the three years in the period ended December 31, 2009,2012, in conformity with International Financial Reporting Standards as issued by the International Accounting Standards Board and in conformity with International Financial Reporting Standards as adopted by the European Union. Also in our opinion, the Company maintained, in all material respects, effective internal control over financial reporting as of December 31, 2009,2012, based on criteria established in Internal Control—Integrated Framework issued by the Committee of Sponsoring Organizations of the Treadway Commission. The Company’s management is responsible for these financial statements, for maintaining effective internal control over financial reporting and for its assessment of the effectiveness of internal control over financial reporting, included in item 15(b) of the Annualwhich can be found herein, under ���Management’s Report on Form 20-F.Internal Control over Financial Reporting”. Our responsibility is to express opinions on these financial statements and on the Company’s internal control over financial reporting based on our integrated audits. We conducted our auditsaudit in accordance with the standards of the Public Company Accounting Oversight Board (United States). and International Standards on Auditing. Those standards require that we plan and perform the audits to obtain reasonable assurance about whether the financial statements are free of material misstatement and whether effective internal control over financial reporting was maintained in all material respects. Our audits of the financial statements included examining, on a test basis, evidence supporting the amounts and disclosures in the financial statements, assessing the accounting principles used and significant estimates made by management, and evaluating the overall financial statement presentation. Our audit of internal control over financial reporting included obtaining an understanding of internal control over financial reporting, assessing the risk that a material weakness exists, and testing and evaluating the design and operating effectiveness of internal control based on the assessed risk. Our audits also included performing such other procedures as we considered necessary in the circumstances. We believe that our audits provide a reasonable basis for our opinion.
A company’s internal control over financial reporting is a process designed to provide reasonable assurance regarding the reliability of financial reporting and the preparation of financial statements for external purposes in accordance with generally accepted accounting principles. A company’s internal control over financial reporting includes those policies and procedures that (i) pertain to the maintenance of records that, in reasonable detail, accurately and fairly reflect the transactions and dispositions of the assets of the company; (ii) provide reasonable assurance that transactions are recorded as necessary to permit preparation of financial statements in accordance with generally accepted accounting principles, and that receipts and expenditures of the company are being made only in accordance with authorizations of management and directors of the company; and (iii) provide reasonable assurance regarding prevention or timely detection of unauthorized acquisition, use, or disposition of the company’s assets that could have a material effect on the financial statements.
Because of its inherent limitations, internal control over financial reporting may not prevent or detect misstatements. Also, projections of any evaluation of effectiveness to future periods are subject to the risk that controls may become inadequate because of changes in conditions, or that the degree of compliance with the policies or procedures may deteriorate.
As described in Management’s Report on Internal Control Over Financial Reporting included in Item 15 (b), management has excluded Nortel from its assessment of internal control over financial reporting as of December 31, 2009 because it was acquired by the Company in a purchase business combination on November 13, 2009. We have also excluded Nortel from our audit of internal control over financial reporting.
The Nortel operation is part of the Network segment whose total assets and total revenues represent 0,6% and 1,3%, respectively, of the related consolidated financial statement amounts as of and for the year ended December 31, 2009.
Stockholm, April 21, 20108, 2013
PricewaterhouseCoopers AB
| | |
| By: | | /s/ PricewaterhouseCoopers |
| Name: | | PricewaterhouseCoopers AB |
ERICSSON ANNUAL REPORT ON FORM 20-F 20092012
CONSOLIDATED FINANCIAL STATEMENTS
CONSOLIDATED INCOME STATEMENT
| Years ended December 31, SEK million | | Notes | | 2009 | | 2008 | | 2007 | | |
January–December, SEK million | | | Notes | | | 2012 | | 2011 | | 2010 | |
Net sales | | C3, C4 | | 206,477 | | | 208,930 | | | 187,780 | | | | C3, C4 | | | | 227,779 | | | | 226,921 | | | | 203,348 | |
Cost of sales | | | | –136,278 | | | –134,661 | | | –114,059 | | | | | | –155,699 | | | | –147,200 | | | | –129,094 | |
| | | | | | | | | | | | | | | | | | | | | | |
Gross income | | | | 70,199 | | | 74,269 | | | 73,721 | | | | | | 72,080 | | | | 79,721 | | | | 74,254 | |
Gross margin % | | | | 34.0 | % | | 35.5 | % | | 39.3 | % | |
| Gross margin (%) | | | | | | 31.6 | % | | | 35.1 | % | | | 36.5 | % |
Research and development expenses | | | | –33,055 | | | –33,584 | | | –28,842 | | | | | | –32,833 | | | | –32,638 | | | | –31,558 | |
| Selling and administrative expenses | | | | –26,908 | | | –26,974 | | | –23,199 | | | | | | –26,023 | | | | –26,683 | | | | –27,072 | |
| | | | | | | | | | | | | | | | | | | | | | |
Operating expenses | | | | –59,963 | | | –60,558 | | | –52,041 | | | | | | –58,856 | | | | –59,321 | | | | –58,630 | |
| Other operating income and expenses | | C6 | | 3,082 | | | 2,977 | | | 1,734 | | | | C6 | | | | 8,965 | | | | 1,278 | | | | 2,003 | |
| | | | | | | | | | | | | | | | | | | | | | |
Operating income before shares in earnings of joint ventures and associated companies | | | | 13,318 | | | 16,688 | | | 23,414 | | | | | | 22,189 | | | | 21,678 | | | | 17,627 | |
Operating margin before shares in earnings of joint ventures and associated companies (%) | | | | 6.5 | % | | 8.0 | % | | 12.5 | % | | | | | 9.7 | % | | | 9.6 | % | | | 8.7 | % |
| Share in earnings of joint ventures and associated companies | | C12 | | –7,400 | | | –436 | | | 7,232 | | | | C3, C12 | | | | –11,731 | | | | –3,778 | | | | –1,172 | |
| | | | | | | | | | | | |
Operating income | | | | 5,918 | | | 16,252 | | | 30,646 | | | | | | 10,458 | | | | 17,900 | | | | 16,455 | |
Financial income | | C7 | | 1,874 | | | 3,458 | | | 1,778 | | | | C7 | | | | 1,708 | | | | 2,882 | | | | 1,047 | |
Financial expenses | | C7 | | –1,549 | | | –2,484 | | | –1,695 | | | | C7 | | | | –1,984 | | | | –2,661 | | | | –1,719 | |
| | | | | | | | | | | | | | | | | | | | | | |
Income after financial items | | | | 6,243 | | | 17,226 | | | 30,729 | | | | | | 10,182 | | | | 18,121 | | | | 15,783 | |
Taxes | | C8 | | –2,116 | | | –5,559 | | | –8,594 | | | | C8 | | | | –4,244 | | | | –5,552 | | | | –4,548 | |
| | | | | | | | | | | | | | | | | | | | | | |
Net income | | | | 4,127 | | | 11,667 | | | 22,135 | | | | | | 5,938 | | | | 12,569 | | | | 11,235 | |
| | | | | | | | | | | | | | | | | | | | | | |
Net income attributable to: | | | | | | | | | | | | | | | | |
Stockholders of the Parent Company | | | | 3,672 | | | 11,273 | | | 21,836 | | | | | | 5,775 | | | | 12,194 | | | | 11,146 | |
Minority interest | | | | 455 | | | 394 | | | 299 | | |
Non-controlling interest | | | | | | 163 | | | | 375 | | | | 89 | |
| Other information | | | | | | | | | | | | | | | | |
Average number of shares, basic (million)1) | | C9 | | 3,190 | | | 3,183 | | | 3,178 | | |
Earnings per share attributable to stockholders of the Parent Company, basic (SEK)1)2) | | C9 | | 1.15 | | | 3.54 | | | 6.87 | | |
Earnings per share attributable to stockholders of the Parent Company, diluted (SEK)1)2) | | C9 | | 1.14 | | | 3.52 | | | 6.84 | | |
Average number of shares, basic (million) | | | | C9 | | | | 3,216 | | | | 3,206 | | | | 3,197 | |
Earnings per share attributable to stockholders of the Parent Company, basic (SEK)1) | | | | C9 | | | | 1.80 | | | | 3.80 | | | | 3.49 | |
Earnings per share attributable to stockholders of the Parent Company, diluted (SEK)1) | | | | C9 | | | | 1.78 | | | | 3.77 | | | | 3.46 | |
| | | | | | | | | | | | | | | | | | | | | | |
| 1) | A reverse split 1:5 was made in June 2008. Comparative figures are restated accordingly. |
2) | Based on Net income attributable to stockholders of the Parent Company. |
ERICSSON ANNUAL REPORT ON FORM 20-F 20092012
CONSOLIDATED STATEMENT OF COMPREHENSIVE INCOME
| | | | | | | | |
Years ended December 31, SEK million | | Notes | | 2009 | | 2008 | | 2007 |
Net income | | | | 4,127 | | 11,667 | | 22,135 |
| | | | |
Other comprehensive income | | | | | | | | |
Actuarial gains and losses, and the effect of the asset ceiling, related to pensions | | C16 | | –605 | | –4,015 | | 1,208 |
Revaluation of other investments in shares and participations Fair value remeasurement | | C16 | | –2 | | –7 | | 2 |
Cash Flow hedges | | | | | | | | |
Gains/losses arising during the period | | C16 | | 672 | | –5,080 | | 584 |
Reclassification adjustments for gains/losses included in profit or loss | | C16 | | 3,850 | | 1,192 | | –1,390 |
Adjustments for amounts transferred to initial carrying amount of hedged items | | C16 | | –1,029 | | — | | — |
Changes in cumulative translation adjustments | | C16 | | –1,361 | | 8,528 | | –797 |
Tax on items relating to components of OCI | | C16 | | –1,040 | | 2,330 | | –73 |
| | | | | | | | |
Total other comprehensive income | | | | 485 | | 2,948 | | –466 |
| | | | | | | | |
Total comprehensive income | | | | 4,612 | | 14,615 | | 21,669 |
| | | | | | | | |
Total Comprehensive Income attributable to: | | | | | | | | |
Stockholders of the Parent Company | | | | 4,211 | | 13,988 | | 21,371 |
Minority interest | | | | 401 | | 627 | | 298 |
| | | | | | | | |
| | | | | | | | | | | | | | | | |
January–December, SEK million | | Notes | | | 2012 | | | 2011 | | | 2010 | |
Net income | | | | | | | 5,938 | | | | 12,569 | | | | 11,235 | |
| | | | |
Other comprehensive income | | | | | | | | | | | | | | | | |
Actuarial gains and losses, and the effect of the asset ceiling, related to pensions | | | C16 | | | | –451 | | | | –6,963 | | | | 3,892 | |
Revaluation of other investments in shares and participations | | | | | | | | | | | | | | | | |
Fair value remeasurement | | | C16 | | | | 6 | | | | — | | | | 7 | |
Cash Flow hedges | | | | | | | | | | | | | | | | |
Gains/losses arising during the period | | | C16 | | | | 1,668 | | | | 996 | | | | 966 | |
Reclassification adjustments for gains/losses included in profit or loss | | | C16 | | | | –568 | | | | –2,028 | | | | –238 | |
Adjustments for amounts transferred to initial carrying amount of hedged items | | | C16 | | | | 92 | | | | — | | | | –136 | |
Changes in cumulative translation adjustments | | | C16 | | | | –3,947 | | | | –964 | | | | –3,259 | |
Share of other comprehensive income of joint ventures and associated companies | | | C16 | | | | –486 | | | | –262 | | | | –434 | |
Tax on items relating to components of Other comprehensive income | | | C16 | | | | –422 | | | | 2,158 | | | | –1,120 | |
| | | | | | | | | | | | | | | | |
Total other comprehensive income | | | | | | | –4,108 | | | | –7,063 | | | | –322 | |
| | | | | | | | | | | | | | | | |
Total comprehensive income | | | | | | | 1,830 | | | | 5,506 | | | | 10,913 | |
| | | | | | | | | | | | | | | | |
Total Comprehensive Income attributable to: | | | | | | | | | | | | | | | | |
Stockholders of the Parent Company | | | | | | | 1,716 | | | | 5,081 | | | | 10,814 | |
Non-controlling interest | | | | | | | 114 | | | | 425 | | | | 99 | |
| | | | | | | | | | | | | | | | |
ERICSSON ANNUAL REPORT ON FORM 20-F 20092012
CONSOLIDATED BALANCE SHEET
| December 31, SEK million | | Notes | | 2009 | | 2008 | | Notes | | | 2012 | | | 2011 | |
ASSETS | | | | | | | |
Assets | | | | | | | |
Non-current assets | | | | | | | | | | | | |
Intangible assets | | C10 | | | | | | | C10 | | | | | |
Capitalized development expenses | | | | 2,079 | | 2,782 | | | | | 3,840 | | | | 3,523 | |
Goodwill | | | | 27,375 | | 24,877 | | | | | 30,404 | | | | 27,438 | |
Intellectual property rights, brands and other intangible assets | | | | 18,739 | | 20,587 | | | | | 15,202 | | | | 13,083 | |
| Property, plant and equipment | | C11, C26, C27 | | 9,606 | | 9,995 | | | C11, C26, C27 | | | | 11,493 | | | | 10,788 | |
Financial assets | | | | | | | | | | | | |
Equity in joint ventures and associated companies | | C12 | | 11,578 | | 7,988 | | | C12 | | | | 2,842 | | | | 5,965 | |
Other investments in shares and participations | | C12 | | 256 | | 309 | | | C12 | | | | 386 | | | | 2,199 | |
Customer finance, non-current | | C12 | | 830 | | 846 | | | C12 | | | | 1,290 | | | | 1,400 | |
Other financial assets, non-current | | C12 | | 2,577 | | 4,917 | | | C12 | | | | 3,964 | | | | 4,117 | |
Deferred tax assets | | C8 | | 14,327 | | 14,858 | | | C8 | | | | 12,321 | | | | 13,020 | |
| | | | | | | | | | | | | | |
| | | | 87,367 | | 87,159 | | | | | 81,742 | | | | 81,533 | |
Current assets | | | | | | | | | | | | |
Inventories | | C13 | | 22,718 | | 27,836 | | | C13 | | | | 28,802 | | | | 33,070 | |
| Trade receivables | | C14 | | 66,410 | | 75,891 | | | C14 | | | | 63,660 | | | | 64,522 | |
Customer finance, current | | C14 | | 1,444 | | 1,975 | | | C14 | | | | 4,019 | | | | 2,845 | |
Other current receivables | | C15 | | 15,146 | | 17,818 | | | C15 | | | | 20,065 | | | | 17,837 | |
| Short-term investments | | C20 | | 53,926 | | 37,192 | | | C20 | | | | 32,026 | | | | 41,866 | |
Cash and cash equivalents | | C25 | | 22,798 | | 37,813 | | | C25 | | | | 44,682 | | | | 38,676 | |
| | | | | | | | | | | | | | |
| | | | 182,442 | | 198,525 | | | | | 193,254 | | | | 198,816 | |
Total assets | | | | 269,809 | | 285,684 | | | | | 274,996 | | | | 280,349 | |
| | | | | | | | | | | | | | |
EQUITY AND LIABILITIES | | | | | | | |
Equity and liabilities | | | | | | | |
Equity | | | | | | | | | | | | |
Stockholders’ equity | | C16 | | 139,870 | | 140,823 | | | C16 | | | | 136,883 | | | | 143,105 | |
Minority interest in equity of subsidiaries | | C16 | | 1,157 | | 1,261 | |
Non-controlling interest in equity of subsidiaries | | | | C16 | | | | 1,600 | | | | 2,165 | |
| | | | | | | | | | | | | | |
| | | | 141,027 | | 142,084 | | | | | 138,483 | | | | 145,270 | |
Non-current liabilities | | | | | | | | | | | | |
Post-employment benefits | | C17 | | 8,533 | | 9,873 | | | C17 | | | | 9,503 | | | | 10,016 | |
Provisions, non-current | | C18 | | 461 | | 311 | | | C18 | | | | 211 | | | | 280 | |
Deferred tax liabilities | | C8 | | 2,270 | | 2,738 | | | C8 | | | | 3,120 | | | | 2,250 | |
Borrowings, non-current | | C19, C20 | | 29,996 | | 24,939 | | | C19, C20 | | | | 23,898 | | | | 23,256 | |
Other non-current liabilities | | | | 2,035 | | 1,622 | | | | | 2,377 | | | | 2,248 | |
| | | | | | | | | | | | | | |
| | | | 43,295 | | 39,483 | | | | | 39,109 | | | | 38,050 | |
Current liabilities | | | | | | | | | | | | |
Provisions, current | | C18 | | 11,970 | | 14,039 | | | C18 | | | | 8,427 | | | | 5,985 | |
Borrowings, current | | C19, C20 | | 2,124 | | 5,542 | | | C19, C20 | | | | 4,769 | | | | 7,765 | |
Trade payables | | C22 | | 18,864 | | 23,504 | | | C22 | | | | 23,100 | | | | 25,309 | |
Other current liabilities | | C21 | | 52,529 | | 61,032 | | | C21 | | | | 61,108 | | | | 57,970 | |
| | | | | | | | | | | | | | |
| | | | 85,487 | | 104,117 | | | | | 97,404 | | | | 97,029 | |
Total equity and liabilities1) | | | | 269,809 | | 285,684 | | | | | 274,996 | | | | 280,349 | |
| | | | | | | | | | | | | | |
| 1) | Of which interest-bearing liabilities and post-employment benefits SEK 40,653 million (SEK 40,354 million in 2008).38,170 (41,037) million. |
ERICSSON ANNUAL REPORT ON FORM 20-F 20092012
CONSOLIDATED STATEMENT OF CASH FLOWS
| January–December, SEK million | | Notes | | 2009 | | 2008 | | 2007 | | Notes | | | 2012 | | 2011 | | | 2010 | |
Operating activities | | | | | | | | | | | | | | | | |
Net income | | | | 4,127 | | 11,667 | | 22,135 | | | | | 5,938 | | | | 12,569 | | | | 11,235 | |
Adjustments to reconcile net income to cash | | C25 | | 16,856 | | 14,318 | | 7,172 | | | C25 | | | | 13,077 | | | | 12,613 | | | | 12,490 | |
| | | | | | | | | | | | | | | | | | | |
| | | | 20,983 | | 25,985 | | 29,307 | | | | | 19,015 | | | | 25,182 | | | | 23,725 | |
| Changes in operating net assets | | | | | | | | | | | | | | | | |
Inventories | | | | 5,207 | | –3,927 | | –445 | | | | | 2,752 | | | | –3,243 | | | | –7,917 | |
Customer finance, current and non-current | | | | 598 | | 549 | | 365 | | | | | –1,259 | | | | 74 | | | | –2,125 | |
Trade receivables | | | | 7,668 | | –11,434 | | –7,467 | | | | | –1,103 | | | | –1,700 | | | | 4,406 | |
Trade payables | | | | –3,522 | | 4,794 | | –1,558 | | | | | –1,311 | | | | –1,648 | | | | 5,964 | |
Provisions and post-employment benefits | | | | –2,950 | | 3,830 | | –4,401 | | | | | –1,920 | | | | –5,695 | | | | –2,739 | |
Other operating assets and liabilities, net | | | | –3,508 | | 4,203 | | 3,409 | | | | | 5,857 | | | | –2,988 | | | | 5,269 | |
| | | | | | | | | | | | | | | | | | | |
| | | | 3,493 | | –1,985 | | –10,097 | | | | | 3,016 | | | | –15,200 | | | | 2,858 | |
| Cash flow from operating activities | | | | 24,476 | | 24,000 | | 19,210 | | | | | 22,031 | | | | 9,982 | | | | 26,583 | |
| | | | | | | | | | | | | | | | | | | |
Investing activities | | | | | | | | | | | | | | | | |
Investments in property, plant and equipment | | C11 | | –4,006 | | –4,133 | | –4,319 | | | C11 | | | | –5,429 | | | | –4,994 | | | | –3,686 | |
Sales of property, plant and equipment | | | | 534 | | 1,373 | | 152 | | | | | 568 | | | | 386 | | | | 124 | |
Acquisitions of subsidiaries and other operations | | C25, C26 | | –19,321 | | –74 | | –26,292 | | | C25, C26 | | | | –11,529 | 1) | | | –3,181 | | | | –3,286 | |
Divestments of subsidiaries and other operations | | C25, C26 | | 1,239 | | 1,910 | | 84 | | | C25, C26 | | | | 9,452 | | | | 53 | | | | 454 | |
Product development | | C10 | | –1,443 | | –1,409 | | –1,053 | | | C10 | | | | –1,641 | | | | –1,515 | | | | –1,644 | |
Other investing activities | | | | 2,606 | | 944 | | 396 | | | | | 1,540 | | | | –900 | | | | –1,487 | |
Short-term investments | | | | –17,071 | | –7,155 | | 3,499 | | | | | 2,151 | | | | 14,692 | | | | –3,016 | |
| | | | | | | | | | | | | | | | | | | |
Cash flow from investing activities | | | | –37,462 | | –8,544 | | –27,533 | | | | | –4,888 | | | | 4,541 | | | | –12,541 | |
| | | | | | | | | | | | | | | | | | | |
Cash flow before financing activities | | | | –12,986 | | 15,456 | | –8,323 | | | | | 17,143 | | | | 14,523 | | | | 14,042 | |
| Financing activities | | | | | | | | | | | | | | | | |
Proceeds from issuance of borrowings | | | | 14,153 | | 5,245 | | 15,587 | | | | | 8,969 | | | | 2,076 | | | | 2,580 | |
Repayment of borrowings | | | | –9,804 | | –4,216 | | –1,291 | | | | | –9,670 | | | | –1,259 | | | | –1,449 | |
Sale of own stock and options exercised | | | | 69 | | 3 | | 94 | |
Proceeds from stock issue | | | | | | 159 | | | | — | | | | — | |
Sale/repurchase of own shares | | | | | | –93 | | | | 92 | | | | 51 | |
Dividends paid | | | | –6,318 | | –8,240 | | –8,132 | | | | | –8,632 | | | | –7,455 | | | | –6,677 | |
Other financing activities | | | | 199 | | – | | – | | | | | –118 | | | | 52 | | | | –175 | |
| | | | | | | | | | | | | | | | | | | |
Cash flow from financing activities | | | | –1,701 | | –7,208 | | 6,258 | | | | | –9,385 | | | | –6,494 | | | | –5,670 | |
| | | | | | | | | | | | | | | | | | | |
Effect of exchange rate changes on cash | | | | –328 | | 1,255 | | 406 | | | | | –1,752 | | | | –217 | | | | –306 | |
Net change in cash | | | | –15,015 | | 9,503 | | –1,659 | | | | | 6,006 | | | | 7,812 | | | | 8,066 | |
| | | | | | | | | | | | | | | | | | | |
Cash and cash equivalents, beginning of period | | | | 37,813 | | 28,310 | | 29,969 | | | | | 38,676 | | | | 30,864 | | | | 22,798 | |
| | | | | | | | | | | | | | | | | | | |
Cash and cash equivalents, end of period | | C25 | | 22,798 | | 37,813 | | 28,310 | | | C25 | | | | 44,682 | | | | 38,676 | | | | 30,864 | |
| | | | | | | | | | | | | | | | | | | |
| 1) | Includes payment of external loan of SEK -6.2 billion attributable to the acquisition of Telcordia. |
ERICSSON ANNUAL REPORT ON FORM 20-F 20092012
CONSOLIDATED STATEMENT OF CHANGES IN EQUITY
| | | | | | | | | | | | | | | | | | |
| | | Capital
stock | | Additional
paid in
capital | | Revaluation
of other
investments
in shares and
participations | | Cash
flow
hedges | | Cumulative
translation
adjustments | | Retained
earnings | | Stockholders’
equity | | Minority
interests | | Total
equity |
January 1, 2009 | | 16,232 | | 24,731 | | –1 | | –2,356 | | 2,124 | | 100,093 | | 140,823 | | 1,261 | | 142,084 |
| | | | | | | | | | | | | | | | | | |
Total comprehensive income | | — | | — | | –3 | | 2,434 | | –1,461 | | 3,241 | | 4,211 | | 401 | | 4,612 |
| | | | | | | | | |
Transactions with owners | | | | | | | | | | | | | | | | | | |
Stock issue | | 135 | | — | | — | | — | | — | | — | | 135 | | — | | 135 |
Sale of own shares | | — | | — | | — | | — | | — | | 75 | | 75 | | — | | 75 |
Repurchase of own shares | | — | | — | | — | | — | | — | | –135 | | –135 | | — | | –135 |
Stock Purchase and Stock Option Plans | | — | | — | | — | | — | | — | | 658 | | 658 | | — | | 658 |
Dividends paid | | — | | — | | — | | — | | — | | –5,897 | | –5,897 | | –421 | | –6,318 |
Business combinations | | — | | — | | — | | — | | — | | — | | — | | –84 | | –84 |
| | | | | | | | | | | | | | | | | | |
December 31, 2009 | | 16,367 | | 24,731 | | –4 | | 78 | | 663 | | 98,035 | | 139,870 | | 1,157 | | 141,027 |
| | | | | | | | | | | | | | | | | | |
| | | | | | | | | |
January 1, 2008 | | 16,132 | | 24,731 | | 5 | | 307 | | –6,345 | | 99,282 | | 134,112 | | 940 | | 135,052 |
| | | | | | | | | | | | | | | | | | |
Total comprehensive income | | — | | — | | –6 | | –2,663 | | 8,469 | | 8,188 | | 13,988 | | 627 | | 14,615 |
| | | | | | | | | |
Transactions with owners | | | | | | | | | | | | | | | | | | |
Stock issue | | 100 | | — | | — | | — | | — | | — | | 100 | | — | | 100 |
Sale of own shares | | — | | — | | — | | — | | — | | 88 | | 88 | | — | | 88 |
Repurchase of own shares | | — | | — | | — | | — | | — | | –100 | | –100 | | — | | –100 |
Stock Purchase and Stock Option Plans | | — | | — | | — | | — | | — | | 589 | | 589 | | — | | 589 |
Dividends paid | | — | | — | | — | | — | | — | | –7,954 | | –7,954 | | –286 | | –8,240 |
Business combinations | | — | | — | | — | | — | | — | | — | | — | | –20 | | –20 |
| | | | | | | | | | | | | | | | | | |
December 31, 2008 | | 16,232 | | 24,731 | | –1 | | –2,356 | | 2,124 | | 100,093 | | 140,823 | | 1,261 | | 142,084 |
| | | | | | | | | | | | | | | | | | |
| | | | | | | | | |
January 1, 2007 | | 16,132 | | 24,731 | | 3 | | 877 | | –5,569 | | 83,939 | | 120,113 | | 782 | | 120,895 |
| | | | | | | | | | | | | | | | | | |
Total comprehensive income | | — | | — | | 2 | | –570 | | –776 | | 22,715 | | 21,371 | | 298 | | 21,669 |
| | | | | | | | | |
Transactions with owners | | | | | | | | | | | | | | | | | | |
Sale of own shares | | — | | — | | — | | — | | — | | 62 | | 62 | | — | | 62 |
Stock Purchase and Stock Option Plans | | — | | — | | — | | — | | — | | 509 | | 509 | | — | | 509 |
Dividends paid | | — | | — | | — | | — | | — | | –7,943 | | –7,943 | | –189 | | –8,132 |
Business combinations | | — | | — | | — | | — | | — | | — | | — | | 49 | | 49 |
| | | | | | | | | | | | | | | | | | |
December 31, 2007 | | 16,132 | | 24,731 | | 5 | | 307 | | –6,345 | | 99,282 | | 134,112 | | 940 | | 135,052 |
| | | | | | | | | | | | | | | | | | |
| | | | | | | | | | | | | | | | | | | | | | | | | | | | |
| | | Notes | | | Capital
stock | | | Additional
paid in
capital | | | Retained
earnings | | | Stockholders’
equity | | | Non-controlling
interest (NCI) | | | Total
equity | |
January 1, 2012 | | | | | | | 16,367 | | | | 24,731 | | | | 102,007 | | | | 143,105 | | | | 2,165 | | | | 145,270 | |
Total comprehensive income | | | C16 | | | | — | | | | — | | | | 1,716 | | | | 1,716 | | | | 114 | | | | 1,830 | |
| | | | | | | |
Transactions with owners | | | | | | | | | | | | | | | | | | | | | | | | | | | | |
Stock issue | | | | | | | 159 | | | | — | | | | — | | | | 159 | | | | — | | | | 159 | |
Sale/Repurchase of own shares | | | | | | | — | | | | — | | | | –93 | | | | –93 | | | | — | | | | –93 | |
Stock Purchase Plans | | | | | | | — | | | | — | | | | 405 | | | | 405 | | | | — | | | | 405 | |
Dividends paid | | | | | | | — | | | | — | | | | –8,033 | | | | –8,033 | | | | –599 | | | | –8,632 | |
Transactions with non-controlling interest | | | | | | | — | | | | — | | | | –376 | | | | –376 | | | | –80 | | | | –456 | |
| | | | | | | | | | | | | | | | | | | | | | | | | | | | |
December 31, 2012 | | | | | | | 16,526 | | | | 24,731 | | | | 95,626 | | | | 136,883 | | | | 1,600 | | | | 138,483 | |
| | | | | | | | | | | | | | | | | | | | | | | | | | | | |
| | | | | | | |
January 1, 2011 | | | | | | | 16,367 | | | | 24,731 | | | | 104,008 | | | | 145,106 | | | | 1,679 | | | | 146,785 | |
| | | | | | | |
Total comprehensive income | | | C16 | | | | — | | | | — | | | | 5,081 | | | | 5,081 | | | | 425 | | | | 5,506 | |
| | | | | | | |
Transactions with owners | | | | | | | | | | | | | | | | | | | | | | | | | | | | |
Sale of own shares | | | | | | | — | | | | — | | | | 92 | | | | 92 | | | | — | | | | 92 | |
Stock Purchase Plans | | | | | | | — | | | | — | | | | 413 | | | | 413 | | | | — | | | | 413 | |
Dividends paid | | | | | | | — | | | | — | | | | –7,207 | | | | –7,207 | | | | –248 | | | | –7,455 | |
Transactions with non-controlling interest | | | | | | | — | | | | — | | | | –380 | | | | –380 | | | | 309 | | | | –71 | |
| | | | | | | | | | | | | | | | | | | | | | | | | | | | |
December 31, 2011 | | | | | | | 16,367 | | | | 24,731 | | | | 102,007 | | | | 143,105 | | | | 2,165 | | | | 145,270 | |
| | | | | | | | | | | | | | | | | | | | | | | | | | | | |
| | | | | | | |
January 1, 2010 | | | | | | | 16,367 | | | | 24,731 | | | | 98,772 | | | | 139,870 | | | | 1,157 | | | | 141,027 | |
| | | | | | | |
Total comprehensive income | | | C16 | | | | — | | | | — | | | | 10,814 | | | | 10,814 | | | | 99 | | | | 10,913 | |
| | | | | | | |
Transactions with owners | | | | | | | | | | | | | | | | | | | | | | | | | | | | |
Sale of own shares | | | | | | | — | | | | — | | | | 52 | | | | 52 | | | | — | | | | 52 | |
Stock Purchase Plans | | | | | | | — | | | | — | | | | 762 | | | | 762 | | | | — | | | | 762 | |
Dividends paid | | | | | | | — | | | | — | | | | –6,391 | | | | –6,391 | | | | –286 | | | | –6,677 | |
Transactions with non-controlling interest | | | | | | | — | | | | — | | | | — | | | | — | | | | 708 | | | | 708 | |
| | | | | | | | | | | | | | | | | | | | | | | | | | | | |
December 31, 2010 | | | | | | | 16,367 | | | | 24,731 | | | | 104,008 | | | | 145,106 | | | | 1,679 | | | | 146,785 | |
| | | | | | | | | �� | | | | | | | | | | | | | | | | | | | |
ERICSSON ANNUAL REPORT ON FORM 20-F 20082012
NOTES TO THE CONSOLIDATED FINANCIAL STATEMENTS
CONTENTS
C1 SIGNIFICANT ACCOUNTING POLICIES
Introduction
The consolidated financial statements comprise Telefonaktiebolaget LM Ericsson, the Parent Company, and its subsidiaries (“the Company”) and the Company’s interests in joint ventures and associated companies. The Parent Company is domiciled in Sweden at Torshamnsgatan 23, SE-164 83 Stockholm.
The consolidated financial statements for the year ended December 31, 2009,2012, have been prepared in accordance with International Financial Reporting Standards (IFRS) as endorsedissued by the EUIASB, without any early application, and RFR 1.21 “Additional rules for Group Accounting”, related interpretations issued by the Swedish Financial Reporting Board (Rådet för Finansiell Rapportering)finansiell rapportering), and the Swedish Annual Accounts Act. Further,There is no difference between IFRS effective as per December 31, 2012, and RFR 1 related interpretations issued by the Company’s financial statements are preparedSwedish Financial Reporting Board (Rådet för Finansiell Rapportering) or the Swedish Annual Accounts Act in accordanceconflict with IFRS, as issued by IASB.for all periods presented.
The financial statements were approved by the Board of Directors on February 26, 2010.March 5, 2013. The balance sheets and income statements are subject to approval by the annual meetingAnnual General Meeting of shareholders.
ERICSSON ANNUAL REPORT ON FORM 20-F 2009
NOTES TO THE CONSOLIDATED FINANCIAL STATEMENTS—(Continued)
New standards, amendments of standards and interpretations, effective as from January 1, 2009, changing presentation or disclosure:2012:
Amendment to IAS 1 (Revised), “Presentation12, income taxes: deferred tax: recovery of Financial Statements”. The revised standard requires all non-owner changes in equity to be shown in a performance statement. The Company therefore presents two statements, the Income Statement and a Statement of Comprehensive Income. Also, to improve the understanding of the Company’s financial performance, a new subtotal line has been added in the Income Statement, “Operating income before share in earnings of joint ventures and associated companies”. This is to distinguish between operating income from operations consolidated and from shares in earnings of joint ventures and associated companies accounted for using the equity method.
IFRS 7 “Financial instruments—Disclosures” (amendment). The amendment requires enhanced disclosures about fair value measurement and liquidity risk. In particular, the amendment requires disclosure of fair value measurements by level of a fair value measurement hierarchy. As the change in accounting policy only results in additional disclosure, there is no impact on earning per share.
IFRS 8 “Operating Segments”. This standard replaces IAS 14 “Segment Reporting” and requires a “management approach”, under which segment information is presented on the same basis as that used for internal reporting to the Chief Operating Decision Maker (CODM). In Ericsson, the Group Management Team is defined as the CODM function. The new standard has not resulted in any changes of the reportable segments, except for changes in the content of disclosures in note C3 Segment Information.
New standards, amendments of standards and interpretations, effective as from January 1, 2009, changing financial result and position and disclosures:
IFRS 2 (amendment), “Share-based payment” deals with vesting conditions and cancellations. It clarifies that vesting conditions are service conditions and performance conditions only. Other features of a share-based payment are not vesting conditions. These features would need to be included in the grant date fair value for transactions with employees and others providing similar services. In the period when an employee takes a refund of previously made contributions (and stops making further contributions) all remaining compensation expense is recognized. Non-vesting conditions would not impact the number of awards expected to vest or valuation thereof subsequent to grant date. The amendment has not had a material impact on the Company’s financial statements.
Revised IAS 23, “Borrowing Costs” and “Improvements to IFRSs”, (May 2008). In respect of borrowing costs relating to qualifyingunderlying assets for which the commencement date for capitalization is on or after January 1, 2009, the Company capitalizes borrowing costs directly attributable to the acquisition, design, construction or production of a qualifying asset as part of the cost of that asset. Previously the Company immediately recognized all borrowing costs as an expense. The change in IAS 23 has not had a material impact on the Company’s financial statements. Any capitalization of borrowing costs would normally relate to internally generated intangible assets (see note C10).
The following amendments and IFRIC:s have not had any material impact on the Company’s financial statements:
IAS 32 and IAS 1 (Amendments) “Puttable Financial Instruments” and “Obligations Arising on Liquidation”.
IAS 39 (Amendment) “Financial instruments: Recognition and Measurement—Eligible hedged Items.”
Amendments to IAS 39 Financial Instruments: Recognition and Measurement and IFRS 7, Financial Instruments: Disclosures.
ERICSSON ANNUAL REPORT ON FORM 20-F 2009
NOTES TO THE CONSOLIDATED FINANCIAL STATEMENTS—(Continued)
Amendments to IFRIC Interpretation 9 and IAS 39. Reassessmentinstruments Disclosures: Transfers of Embedded Derivatives.Financial Assets.
IFRIC 13 “Customer Loyalty Programmes” addressesNone of the accounting by companies that operate,new or otherwise participate in, customer loyalty programmes for their customers.
IFRIC 15 “Agreements for Constructionamended standards and interpretations have had any significant impact on the financial result or position as well as disclosure of Real Estate”. In note C4 Net Sales the Company discloses the split between revenue related to IAS 11 and IAS 18.Company.
IFRIC 16 “Hedges of a Net Investment in a Foreign Operation”.
IFRIC 18 “Transfers of Assets from Customers”.
Improvements to IFRSs, published in May 2008 and effective from January 1, 2009
Improvements to IFRSs, published in April 2009 and effective from January 1, 2010.
For information on “New standards and interpretations not yet adopted” please see page 65., refer to the end of this Note.
Changes in financial reporting structure
The joint venture ST-Ericsson was formed on February 3, 2009. By merging STMicroelectronics’ wireless business and Ericsson Mobile Platforms, a large company in the semiconductor industry was created. ST-Ericsson is reported as a separate operating segment, accounted for using the equity method.
Definition of Other comprehensive income (OCI)
OCI comprises items of income and expense (including reclassification adjustments) that are not recognized in the income statement as required or permitted by IFRS. See also comments under IAS 1 above.
Basis of presentation
The financial statements are presented in millions of Swedish Krona (SEK). They are prepared on a historical cost basis, except for certain financial assets and liabilities that are stated at fair value: derivative financial instruments, financial instruments held for trading, financial instruments classified as available-for-sale and plan assets related to defined benefit pension plans.
Basis of consolidation
The consolidated financial statements are prepared in accordance with the purchase method. Accordingly, consolidated stockholders’ equity includes equity in subsidiaries, joint ventures and associated companies earned only after their acquisition.
Subsidiaries are all companies in which Ericsson has an ownership interest, directly or indirectly, including effective potential voting rights, has the power to govern the financial and operating policies generally associated with ownership of more than one half of the voting rights or in which Ericsson by agreement has control. The financial statements of subsidiaries are included in the consolidated financial statements from the date that control commences until the date that control ceases.
Intra-group balances and any unrealized income and expense arising from intra-group transactions are fully eliminated in preparing the consolidated financial statements. Unrealized losses are eliminated in the same way as unrealized gains, but only to the extent that there is no evidence of impairment.
ERICSSON ANNUAL REPORT ON FORM 20-F 20092012
NOTES TO THE CONSOLIDATED FINANCIAL STATEMENTS—(Continued)
Business combinations
At the acquisition of a business, the cost of the acquisition, being the purchase price, is measured as the fair value of the assets given, and liabilities incurred or assumed at the date of exchange, plusincluding any cost related to contingent consideration. Transaction costs directly attributable to the acquisition.acquisition are expensed as incurred. The acquisition cost is allocated to acquired assets, liabilities and contingent liabilities based upon appraisals made, including assets and liabilities that were not recognized on the acquired entity’s balance sheet, for example intangible assets such as customer relations, brands, patents and patents.financial liabilities. Goodwill arises when the purchase price exceeds the fair value of recognizable acquired net assets. In acquisitions with non-controlling interest full or partial goodwill can be recognized. Final amounts must beare established within one year after the transaction date at the latest.
In case there is a put option for non-controlling interest in a subsidiary a corresponding financial liability is recognized.
MinorityNon-controlling interest
The Company treats transactions with minoritynon-controlling interests as transactions with external parties. Disposalsequity owners of minoritythe Company. For purchases from non-controlling interests, are recognized as gains and losses in the income statement. Purchases from minority interests result in goodwill if there is a difference between any consideration paid and the relevant share acquired of the carrying value of net assets of the subsidiary.subsidiary is recorded in equity. Gains or losses on disposals to non-controlling interests are also recorded in equity.
When the Company ceases to have control, any retained interest in the entity is remeasured to its fair value, with the change in carrying amount recognized in profit or loss. The fair value is the initial carrying amount for the purposes of subsequently accounting for the retained interest in an associate, joint venture or financial asset. In addition, any amounts previously recognized in other comprehensive income in respect of that entity are accounted for as if the Company had directly disposed of the related assets or liabilities. This may mean that amounts previously recognized in other comprehensive income are reclassified to profit or loss.
At acquisition, there is a choice on an acquisition-by-acquisition basis to measure the non-controlling interest in the acquiree either at fair value or at the non-controlling interest’s proportionate share of the acquiree’s net assets.
Joint ventures and associated companies
Investments inBoth joint ventures and associated companies i.e. where voting stock interest, including effective potential voting rights, is at least 20 percent but not more than 50 percent, or where a corresponding influence is obtained through agreement, are accounted for in accordance with the equity method. Under the equity method, the investment in an associate or joint venture is initially recognized at cost and the carrying amount is increased or decreased to recognize the investor’s share of the profit or loss of the investee after the date of acquisition. If the Company’s interest in an associated company or joint venture is nil the Company shall not, as prescribed by IFRS, recognize its part of any future losses. Provisions related to obligations for such an interest shall, however, be recognized in relation to such an interest.
JVs are ownership interests where a joint influence is obtained through agreement.
Investments in associated companies, i.e. when the Company has significant influence and the power to participate in the financial and operating policy decisions of the associated company, but is not control or joint control over those policies. Normally this is the case when voting stock interest, including effective potential voting rights, is at least 20% but not more than 50%.
Ericsson’s share of income before taxes is reported in item “Share in earnings of joint ventures and associated companies”, included in Operating Income. This is due to that these interests are held for operating
ERICSSON ANNUAL REPORT ON FORM 20-F 2012
rather than investing or financial purposes. Ericsson’s share of income taxes related to joint ventures and associated companies is reported under the line item Taxes in the income statement.
Unrealized gains on transactions between the Company and its associated companies and joint ventures are eliminated to the extent of the Company’s interest in these entities. Unrealized losses are also eliminated unless the transaction provides evidence of an impairment of the asset transferred.
Shares in earnings of joint ventures and associated companies included in consolidated equity which are undistributed are reported in Retained earnings in the balance sheet.
Impairment testing as well as recognition or reversal of impairment of investments in each joint venture is performed in the same manner as for intangible assets other than goodwill. The entire carrying amount of each investment, including goodwill, is tested as a single asset. See also description under “Intangible assets other than goodwill” below.
If the ownership interest in an associate is reduced but significant influence is retained, only a proportionate share of the amounts previously recognized in other comprehensive income are reclassified to profit or loss where appropriate.
In Note C2, “Critical Accounting Estimates and Judgments”, a further disclosure is presented in relation to (i) key sources of estimation uncertainty and (ii) the decision made in relation to accounting policies applied.
Foreign currency remeasurement and translation
Items included in the financial statements of each entity of the Company are measured using the currency of the primary economic environment in which the entity operates (‘the functional currency’). The consolidated financial statements are presented in Swedish Krona (SEK), which is the Parent Company’s functional and presentation currency.
ERICSSON ANNUAL REPORT ON FORM 20-F 2009
NOTES TO THE CONSOLIDATED FINANCIAL STATEMENTS—(Continued)
Transactions and balances
Foreign currency transactions are translated into the functional currency using the exchange rates prevailing at the dates of the transactions. Foreign exchange gains and losses resulting from the settlement of such transactions and from the translation at period-end exchange rates of monetary assets and liabilities denominated in foreign currencies are recognized in the income statement, unless deferred in OCIOther comprehensive income (OCI) under the hedge accounting practices as described below.
Changes in the fair value of monetary securities denominated in foreign currency classified as available-for-sale are analyzed between translation differences resulting from changes in the amortized cost of the security and other changes in the carrying amount of the security. Translation differences related to changes in the amortized cost are recognized in profit or loss, and other changes in the carrying amount are recognized in OCI.
Translation differences on non-monetary financial assets and liabilities are reported as part of the fair value gain or loss.
Group companies
The results and financial position of all the group entities that have a functional currency different from the presentation currency are translated into the presentation currency as follows:
assetsAssets and liabilities for each balance sheet presented are translated at the closing rate at the date of that balance sheet;sheet
ERICSSON ANNUAL REPORT ON FORM 20-F 2012
incomeIncome and expenses for each income statement are translated at average exchange rates; andrates
allAll resulting net exchange differences are recognized as a separate component of OCI.
On consolidation, exchange differences arising from the translation of the net investment in foreign operations, and of borrowings and other currency instruments designated as hedges of such investments, are accounted for in OCI. When a foreign operation is partially disposed of or sold, exchange differences that were recorded in OCI are recognized in the income statement as part of the gain or loss on sale.
Goodwill and fair value adjustments arising on the acquisition of a foreign entity are treated as assets and liabilities of the foreign entity and translated at the closing rate.
There is no significant impact due to a currency of a hyperinflationary economy.
Statement of cash flows
The statement of cash flow is prepared in accordance with the indirect method. Cash flows in foreign subsidiaries are translated at the average exchange rate during the period. Payments for subsidiaries acquired or divested are reported as cash flow from investing activities, net of cash and cash equivalents acquired or disposed of, respectively.
Cash and cash equivalents consist of cash, bank, and short-term investments that are highly liquid monetary financial instruments with a remaining maturity of three months or less at the date of acquisition.
ERICSSON ANNUAL REPORT ON FORM 20-F 2009Revenue recognition
NOTES TO THE CONSOLIDATED FINANCIAL STATEMENTS—(Continued)
Revenue recognitionBackground
The Company offers a comprehensive portfolio of telecommunication and data communication systems, multimedia solutions and professional services, covering a rangeand multimedia solutions. Products, both hardware and software as well as services are in general standardized. The impact of technologies.this is that any acceptance terms are normally only formal requirements. In Note C3, “Segment information”, the Company offer is disclosed more in detail as per operating segment.
The contracts are of four main types:
contracts for various types of services, for example multi-year managed services contracts.
license agreements for the use of the Company’s technology or intellectual property rights, not being a part of another product.
The majority of the Company’s products and services are generally sold under delivery-type or multi-year recurring services contracts. The delivery type contracts including multiple elements, such as base stations, base station controllers, mobile switching centers, routers, microwave transmission links, various software products and related installation and integration services. Such contract elements generallyoften have individual item prices in agreed price lists per customer.content from more than one segment.
Accounting treatment
Sales are based on fair values of consideration received and recorded net of value added taxes, goods returned and estimated trade discounts and rebates.discounts. Revenue is recognized when risks and rewards have been transferred to the customer, with reference to all significant contractual terms when thewhen:
The product or service has been delivered when the
The revenue amount is fixed or determinable
Customer has received and when collectionactivation has been made of separately sold software
Collection is reasonably assured. Specific
Estimation of contractual performance and acceptance criteria may impact the timing and amounts of revenue recognized.
recognized and may therefore defer revenue recognition until the performance criteria are met. The profitability of individual contracts is periodically assessed, and provisions for any estimated losses are made immediately when losses are probable.
ERICSSON ANNUAL REPORT ON FORM 20-F 2012
Allocation and/or timing criteria specific per type of contract are:
Delivery-type contracts. These contracts relate to delivery, installation, integration of products and providing of related services, normally under multiple elements contracts. Under multiple elements contracts the accounting is based on that the revenue recognition criteria are applied to the separately identifiable components of the contract. Revenue, including the impact of any discount or rebate, is allocated to each element based on relative fair values. Networks, Global Services and Support Solutions have contracts that relate to this type of contracts.
Contracts for services. Relate to multi-year service contracts such as support—and managed service contracts and other types of recurring services. Revenue is recognized when the services have been provided, generally pro rata over the contract period. Global Services has contracts that relate to this type of contracts.
Contracts generating license fees from third parties for the use of the Company’s intellectual property rights. License fees are normally measured as percentage on sales or currency amount per unit and recognized over the license period as the amount of the consideration becomes reasonably certain. Networks and Support Solutions have contracts that relate to this type of contracts.
For sales between consolidated companies, associated companies, joint ventures and segments, the Company applies arm’s length pricing.
DefinitionsIn Note C2, “Critical accounting estimates and judgments”, a further disclosure is presented in relation to (i) key sources of contract typesestimation uncertainty and related more specific revenue recognition criteria
Different revenue recognition methods, based on either IAS 18 “Revenue” or IAS 11 “Construction contracts”, are applied based on(ii) the solutions provideddecision made in relation to customers, the nature and sophistication of the technology involved and the contract conditions in each case.
The contract types that are accounted for in accordance with IAS 18 are:
Delivery-type contracts, i.e. contracts for delivery of a product or a combination of products to form a whole or a part of a network as well as delivery of stand-alone products. Medium-size and large delivery type contracts generally include multiple elements. Such elements are normally standardized types of equipment or software as well as services, such as network rollout.
Revenue is recognized when risks and rewards have been transferred to the customer, normally stipulated in the contractual terms of trade. For delivery-type contracts with multiple elements, revenue is allocated to each element based on relative fair values. If there are undelivered elements essential to the functionality of delivered elements, the Company defers recognition of revenue until all elements essential to the functionality have been delivered.
ERICSSON ANNUAL REPORT ON FORM 20-F 2009accounting policies applied.
NOTES TO THE CONSOLIDATED FINANCIAL STATEMENTS—(Continued)
Contracts for services include various types of services such as: training, consulting, engineering, installation, multi-year managed services and hosting. Revenue is generally recognized when the services have been provided. Revenue for managed service contracts and other services contracts covering longer periods is recognized pro rata over the contract period.
Contracts generating license fees from third parties for the use of the Company’s technology or intellectual property rights. Revenue is normally recognized based on sales of products sold to the customer/ licensee.
The contract type that is accounted for in accordance with IAS 11 is:
Construction-type contracts. In general, a construction-type contract is a contract where the Company supplies to a customer, a complete network, which to a large extent is based upon new technology or includes major components which are specifically designed for the customer. Revenues from construction-type contracts are recognized according to stage of completion, generally using the milestone output method.
Earnings per share
Basic earnings per share are calculated by dividing net income attributable to stockholders of the Parent Company by the weighted average number of shares outstanding (total number of shares less treasury stock) during the year.
Diluted earnings per share are calculated by dividing net income attributable to stockholders of the Parent Company, when appropriate adjusted by the sum of the weighted average number of ordinary shares outstanding and dilutive potential ordinary shares. Potential ordinary shares are treated as dilutive when, and only when, their conversion to ordinary shares would decrease earnings per share.
Stock options and rights to matching shares are considered dilutive when the actual fulfillment of any performance conditions as of the reporting date would give a right to ordinary shares. Furthermore, stock options are considered dilutive only when the exercise price is lower than the period’s average share price.
Financial assets
Financial assets are recognized when the Company becomes a party to the contractual provisions of the instrument. Regular purchases and sales of financial assets are recognized on the settlement date.
Financial assets are derecognized when the rights to receive cash flows from the investments have expired or have been transferred and the Company has transferred substantially all risks and rewards of ownership. Separate assets or liabilities are recognized if any rights and obligations are created or retained in the transfer.
The Company classifies its financial assets in the following categories: at fair value through profit or loss, loans and receivables, and available for sale. The classification depends on the purpose for which the financial assets were acquired. Management determines the classification of its financial assets at initial recognition.
ERICSSON ANNUAL REPORT ON FORM 20-F 2012
Financial assets are initially recognized at fair value plus transaction costs for all financial assets not carried at fair value through profit or loss. Financial assets carried at fair value through profit or loss are initially recognized at fair value, and transaction costs are expensed in the income statement.
ERICSSON ANNUAL REPORT ON FORM 20-F 2009
NOTES TO THE CONSOLIDATED FINANCIAL STATEMENTS—(Continued)
The fair values of quoted financial investments and derivatives are based on quoted market prices or rates. If official rates or market prices are not available, fair values are calculated by discounting the expected future cash flows at prevailing interest rates. Valuations of FXForeign exchange options and Interest Rate Guarantees (IRG) are made by using a Black-Scholes formula. Inputs to the valuations are market prices for implied volatility, foreign exchange and interest rates.
Financial assets at fair value through profit or loss
Financial assets at fair value through profit or loss are financial assets held for trading. A financial asset is classified in this category if acquired principally for the purpose of selling or repurchasing in the near term.
Derivatives are classified as held for trading, unless they are designated as hedges. Assets in this category are classified as current assets.
Gains or losses arising from changes in the fair values of the “financial assets at fair value through profit or loss”—category (excl-category (excluding derivatives) are presented in the income statement within Financial income in the period in which they arise. Derivatives are presented in the income statement either as cost of sales, other operating income, financial income or financial expense, depending on the intent with the transaction.
Loans and receivables
Receivables, including those that relate to customer financing, are subsequently measured at amortized cost using the effective interest rate method, less allowances for impairment charges. Trade receivables include amounts due from customers. The balance represents amounts billed to customer as well as amounts where risk and rewards have been transferred to the customer but the invoice has not yet been issued.
CollectibilityCollectability of the receivables is assessed for purposes of initial revenue recognition.
Available-for-sale financial assets
Available-for-sale financial assets are non-derivatives that are either designated in this category or not classified in any of the other categories. They are included in non-current assets unless management intends to dispose of the investment within 12 months of the balance sheet date.
Dividends on available-for-sale equity instruments are recognized in the income statement as part of financial income when the Company’s right to receive payments is established.
Changes in the fair value of monetary securities denominated in a foreign currency and classified as available-for-sale are analyzed between translation differences resulting from changes in amortized cost of the security and other changes in the carrying amount of the security. The translation differences on monetary securities are recognized in profit or loss; translation differences on non-monetary securities are recognized in OCI. Changes in the fair value of monetary and non-monetary securities classified as available-for-sale are recognized in OCI. When securities classified as available-for-sale are sold or impaired, the accumulated fair value adjustments previously recognized in OCI are included in the income statement.
ERICSSON ANNUAL REPORT ON FORM 20-F 2012
Impairment
At each balance sheet date, the Company assesses whether there is objective evidence that a financial asset or a group of financial assets is impaired. In the case of equity securities classified as available-for-sale, a
ERICSSON ANNUAL REPORT ON FORM 20-F 2009
NOTES TO THE CONSOLIDATED FINANCIAL STATEMENTS—(Continued)
significant or prolonged decline in the fair value of the security below its cost is considered as an indicatorevidence that the security is impaired. If any such evidence exists for available-for-sale financial assets, the cumulative loss – loss—measured as the difference between the acquisition cost and the current fair value, less any impairment loss on that financial asset previously recognized in profit or loss—is removed from OCI and recognized in the income statement. Impairment losses recognized in the income statement on equity instruments are not reversed through the income statement.
An assessment of impairment of receivables is performed when there is objective evidence that the Company will not be able to collect all amounts due according to the original terms of the receivable.
Significant financial difficulties of the debtor, probability that the debtor will enter bankruptcy or financial reorganization, and default or delinquency in payments are considered indicators that the trade receivable is impaired. The amount of the allowance is the difference between the asset’s carrying amount and the present value of estimated future cash flows, discounted at the original effective interest rate. The carrying amount of the asset is reduced through the use of an allowance account, and the amount of the loss is recognized in the income statement within selling expenses. When a trade receivable is finally established as uncollectible, it is written off against the allowance account for trade receivables. Subsequent recoveries of amounts previously written off are credited to selling expenses in the income statement.
Financial Liabilities
Financial liabilities are recognized when the Company becomes bound to the contractual obligations of the instrument.
Financial liabilities are derecognized when they are extinguished, i.e. when the obligation specified in the contract is discharged, cancelled or expires.
Borrowings
Borrowings are initially recognized at fair value, net of transaction costs incurred. Borrowings are subsequently stated at amortized cost; any difference between the proceeds (net of transaction costs) and the redemption value is recognized in the income statement over the period of the borrowings using the effective interest method.
Borrowings are classified as current liabilities unless the Company has an unconditional right to defer settlement of the liability for at least 12 months after the balance sheet date.
Trade payables
Trade payables are recognized initially at fair value and subsequently measured at amortized cost using the effective interest method.
Derivatives at fair value through profit or loss
Certain derivative instruments do not qualify for hedge accounting and are accounted for at fair value through profit or loss. Changes in the fair value of these derivative instruments that do not qualify for hedge accounting are recognized immediately in the income statement either as cost of sales, other operating income, financial income or financial expense, depending on the intent of the transaction.
ERICSSON ANNUAL REPORT ON FORM 20-F 20092012
NOTES TO THE CONSOLIDATED FINANCIAL STATEMENTS—(Continued)
Derivative financial instruments and hedging activities
Derivatives are initially recognized at fair value at trade date and subsequently re-measured at fair value. The method of recognizing the resulting gain or loss depends on whether the derivative is designated as a hedging instrument, and if so, the nature of the item being hedged. The Company designates certain derivatives as either:
| | a) | fairFair value hedge:a hedge of the fair value of recognized liabilities;liabilities |
| | b) | cashCash flow hedge: a hedge of a particular risk associated with a highly probable forecast transaction; or |
| | c) | netNet investment hedge:a hedge of a net investment in a foreign operation. |
At the inception of the hedge, the Company documents the relationship between hedging instruments and hedged items, as well as its risk management objectives and strategy for undertaking various hedging transactions. The Company also documents its assessment, both at hedge inception and on an ongoing basis, of whether the derivatives that are used in hedging transactions are highly effective in offsetting changes in fair values or cash flows of the hedged items.
The fair values of various derivative instruments used for hedging purposes are disclosed in Note C20, “Financial Risk Managementrisk management and Financial Instruments”financial instruments”. Movements in the hedging reserve in OCI are shown in Note C16, “Equity and OCI”other comprehensive income”.
The fair value of a hedging derivative is classified as a non-current asset or liability when the remaining maturity of the hedged item is more than 12 months, and as a current asset or liability when the remaining maturity of the hedged item is less than 12 months. Trading derivatives are classified as current assets or liabilities.
Fair value hedges
Changes in the fair value of derivatives that are designated and qualify as fair value hedges are recorded in the income statement, together with any changes in the fair value of the hedged asset or liability that are attributable to the hedged risk. The Company only applies fair value hedge accounting for hedging fixed interest risk on borrowings. Both gains and losses relating to the interest rate swaps hedging fixed rate borrowings and the changes in the fair value of the hedged fixed rate borrowings attributable to interest rate risk are recognized in the income statement within Financial expenses. If the hedge no longer meets the criteria for hedge accounting, the adjustment to the carrying amount of a hedged item for which the effective interest method is used is amortized to profit or lossthe income statement over the remaining period to maturity.
Cash flow hedges
The effective portion of changes in the fair value of derivatives that are designated and qualify as cash flow hedges is recognized in OCI. The gain or loss relating to an ineffective portion is recognized immediately in the income statement within financial income or expense.
Amounts deferred in OCI are recycled in the income statement in the periods when the hedged item affects profit or loss (for example, when the forecast sale that is hedged takes place), either in Net Sales or Cost of Sales. When the forecast transaction that is hedged results in the recognition of a non-financial asset (for example, inventory or fixed assets), the gains and losses previously deferred in OCI are transferred from OCI and included in the initial measurement of the cost of the asset. The deferred amounts are ultimately recognized in Cost of Sales in case of inventory or in Depreciation in case of fixed assets. When a hedging instrument expires or is
ERICSSON ANNUAL REPORT ON FORM 20-F 2009
NOTES TO THE CONSOLIDATED FINANCIAL STATEMENTS—(Continued)
sold, or when a hedge no longer meets the criteria for hedge accounting, any cumulative gain or loss which at that time remains in OCI is recognized in the income statement when the forecast transaction is ultimately recognized. When a forecast transaction is no longer expected to occur, the cumulative gain or loss that was reported in OCI is immediately transferred to the income statement within financial income or expense.
ERICSSON ANNUAL REPORT ON FORM 20-F 2012
Net investment hedges
Hedges of net investments in foreign operations are accounted for similarly to cash flow hedges. Any gain or loss on the hedging instrument relating to the effective portion of the hedge is recognized in OCI. A gain or loss relating to an ineffective portion is recognized immediately in the income statement within financial income or expense. Gains and losses deferred in OCI are included in the income statement when the foreign operation is partially disposed of or sold.
Financial guarantees
Financial guarantee contracts are initially recognized at fair value (i.e. usually the fee received). Subsequently, these contracts are measured at the higher of:
theThe amount determined as the best estimate of the net expenditure required to settle the obligation according to the guarantee contract and
theThe recognized contractual fee less cumulative amortization when amortized over the guarantee period, using the straight-line-method.
The best estimate of the net expenditure comprises future fees and cash flows from subrogation rights.
Inventories
Inventories are measured at the lower of cost or net realizable value on a first-in, first-out (FIFO) basis.
Risks of obsolescence have been measured by estimating market value based on future customer demand and changes in technology and customer acceptance of new products.
A significant part of Inventories is Contract work in Progress (CWIP). Recognition and de recognition of CWIP relates to the Company´s revenue recognition principles meaning that costs incurred under a customer contract are recognized as CWIP. When revenue is recognized CWIP is derecognized and is instead recognized as Cost of Sales.
In Note C2, “Critical accounting estimates and judgments”, a further disclosure is presented in relation to (i) key sources of estimation uncertainty and (ii) the decision made in relation to accounting policies applied.
Intangible assets
Intangible assets other than goodwill
Intangible assets other than goodwill comprise capitalized development expenses and acquired intangible assets, such as patents, customer relations, trademarks and software. At initial recognition, capitalized development expenses are stated at cost while acquired intangible assets related to business combinations are stated at fair value. Subsequent to initial recognition, both capitalized development expenses and acquired intangible assets are stated at initially recognized amounts less accumulated amortization and any impairment. Amortization and any impairment losses are included in Research and development expenses, mainly for capitalized development expenses and patents, in Selling and administrative expenses, mainly for customer relations and brands, and in Cost of sales.
Costs incurred for development of products to be sold, leased or otherwise marketed or intended for internal use are capitalized as from when technological and economical feasibility has been established until the product is available for sale or use. These capitalized expenses are mainly generated internally and include direct labor
ERICSSON ANNUAL REPORT ON FORM 20-F 2012
and directly attributable overhead. Amortization of capitalized development expenses begins when the product is available for general release. Amortization is made on a product or platform basis according to the straight-line
ERICSSON ANNUAL REPORT ON FORM 20-F 2009
NOTES TO THE CONSOLIDATED FINANCIAL STATEMENTS—(Continued)
method over periods not exceeding five years. Research and development expenses directly related to orders from customers are accounted for as a part of Cost of sales. Other research and development expenses are charged to income as incurred.
Amortization of acquired intangible assets, such as patents, customer relations, brands and software, is made according to the straight-line method over their estimated useful lives, not exceeding ten years. However, if the economic benefit related to an item of intangible assets is front-end loaded the amortization method reflects this. Thus, the amortization for such an item is amortized on a digressive curve basis and the asset value decreases with higher amounts in the beginning of the useful life compared to the end.
The Company has not recognized any intangible assets with indefinite useful life other than goodwill.
Impairment tests are performed whenever there is an indication of possible impairment. However, intangible assets not yet available for use are tested annually. An impairment loss is recognized if the carrying amount of an asset or its cash-generating unit exceeds its recoverable amount. The recoverable amount is the higher of the value in use and the fair value less costs to sell. In assessing value in use, the estimated future cash flows after tax are discounted to their present value using an after-tax discount rate that reflects current market assessments of the time value of money and the risks specific to the asset. Application of after tax amounts in calculation, both in relation to cash flows and discount rate is applied due to that available models for calculating discount rate include a tax component. The after tax discounting, applied by the Company is not materially different from a discounting based on before-tax future cash flows and before-tax discount rates, as required by IFRS.
Corporate assets have been allocated to cash-generating units in relation to each unit’s proportion of total net sales. The amount related to corporate assets is not significant. Impairment losses recognized in prior periods are assessed at each reporting date for any indications that the loss has decreased or no longer exists. An impairment loss is reversed if there has been a change in the estimates used to determine the recoverable amounts and if the recoverable amount is higher than the carrying value. An impairment loss is reversed only to the extent that the asset’s carrying amount after reversal does not exceed the carrying amount, net of amortization, which would have been reported if no impairment loss had been recognized.
In Note C2, “Critical accounting estimates and judgments”, a further disclosure is presented in relation to (i) key sources of estimation uncertainty and (ii) the decision made in relation to accounting policies applied.
Goodwill
As from the acquisition date, goodwill acquired in a business combination is allocated to each cash-generating unit (CGU) of the Company expected to benefit from the synergies of the combination. Ericsson’s fivefour operating segments have been identified as CGUs. Goodwill is assigned to three of them, Networks, ProfessionalGlobal Services and Multimedia.Support Solutions.
An annual impairment test for the CGUs to which goodwill has been allocated is performed in the fourth quarter, or when there is an indication of impairment. Impairment testing as well as recognition of impairment of goodwill is performed in the same manner as for intangible assets other than goodwill, see description under “Intangible assets other than goodwill” above. An impairment loss in respect of goodwill is not reversed.
Additional disclosure is required in relation to goodwill impairment testing, see Note C2, “Critical Accounting Estimatesaccounting estimates and Judgments”judgments”, below and in Note C10, “Intangible Assets”assets”.
ERICSSON ANNUAL REPORT ON FORM 20-F 2012
Property, plant and equipment
Property, plant and equipment consist of real estate, machinery and other technical assets, other equipment, tools and installation and construction in process and advance payment, they are stated at cost less accumulated depreciation and any impairment losses.
Depreciation is charged to income, generally on a straight-line basis, over the estimated useful life of each component of an item of property, plant and equipment, including buildings. Estimated useful lives are, in general, 25–50 years for buildings, 20 years for land improvements,real estate and 3–10 years for machinery and equipment, and up to 5 years for equipment on lease.equipment. Depreciation and any impairment charges are included in Cost of sales, Research and development or Selling and administrative expenses.
ERICSSON ANNUAL REPORT ON FORM 20-F 2009
NOTES TO THE CONSOLIDATED FINANCIAL STATEMENTS—(Continued)
The Company recognizes in the carrying amount of an item of property, plant and equipment the cost of replacing a component and derecognizes the residual value of the replaced component.
Impairment testing as well as recognition or reversal of impairment of property, plant and equipment is performed in the same manner as for intangible assets other than goodwill, see description under “Intangible assets other than goodwill” above.
Gains and losses on disposals are determined by comparing the proceeds less cost to sell with the carrying amount and are recognized within Other operating income and expenses in the income statement.
Leasing
Leasing when the Company is the lessee
Leases on terms in which the Company assumes substantially all the risks and rewards of ownership are classified as finance leases. Upon initial recognition, the leased asset is measured at an amount equal to the lower of its fair value and the present value of the minimum lease payments. Subsequent to initial recognition, the asset is accounted for in accordance with the accounting policy applicable to that type of asset, although the depreciation period must not exceed the lease term.
Other leases are operating leases, and the leased assets under such contracts are not recognized on the balance sheet. Costs under operating leases are recognized in the income statement on a straight-line basis over the term of the lease. Lease incentives received are recognized as an integral part of the total lease expense, over the term of the lease.
Leasing when the Company is the lessor
Leasing contracts with the Company as lessor are classified as finance leases when the majority of risks and rewards are transferred to the lessee, and otherwise as operating leases. Under a finance lease, a receivable is recognized at an amount equal to the net investment in the lease and revenue is recognized in accordance with the revenue recognition principles.
Under operating leases the equipment Is recorded as property, plant and equipment and revenue as well as depreciation is recognized on a straight-line basis over the lease term.
Income taxes
Income taxes in the consolidated financial statements include both current and deferred taxes. Income taxes are reported in the income statement unless the underlying item is reported directly in equity or OCI. For those items, the related income tax is also reported directly in equity or OCI. A current tax liability or asset is recognized for the estimated taxes payable or refundable for the current year or prior years.
ERICSSON ANNUAL REPORT ON FORM 20-F 2012
Deferred tax is recognized for temporary differences between the book values of assets and liabilities and their tax values and for tax loss carry forwards. A deferred tax asset is recognized only to the extent that it is probable that future taxable profits will be available against which the deductible temporary differences and tax loss carry forwards can be utilized. In the recognition of income taxes, the Company offsets current tax receivables against current tax liabilities and deferred tax assets against deferred tax liabilities in the balance sheet, when the Company has a legal right to offset these items and the intention to do so. Deferred tax is not recognized for the following temporary differences: goodwill not deductible for tax purposes, for the initial recognition of assets or liabilities that affect neither accounting nor taxable profit, and for differences related to investments in subsidiaries when It Isit is probable that the temporary difference will not reverse in the foreseeable future.
ERICSSON ANNUAL REPORT ON FORM 20-F 2009
NOTES TO THE CONSOLIDATED FINANCIAL STATEMENTS—(Continued)
Deferred tax is measured at the tax rate that is expected to be applied to the temporary differences when they reverse, based on the tax laws that have been enacted or substantively enacted by the reporting date. An adjustment of deferred tax asset/liability balances due to a change in the tax rate is recognized in the income statement, unless it relates to a temporary difference earlier recognized directly in equity or OCI, in which case the adjustment is also recognized in equity or OCI.
The measurement of deferred tax assets involves judgment regarding the deductibility of costs not yet subject to taxation and estimates regarding sufficient future taxable income to enable utilization of unused tax losses in different tax jurisdictions. All deferred tax assets are subject to annual review of probable utilization. The largest amounts of tax loss carry forwards relate to Sweden, with indefinite period of utilization.
In Note C2, “Critical accounting estimates and judgments”, a further disclosure is presented in relation to (i) key sources of estimation uncertainty and (ii) the decision made in relation to accounting policies applied.
Provisions and contingent liabilities
Provisions are made when there are legal or constructive obligations as a result of past events and when it is probable that an outflow of resources will be required to settle the obligations and the amounts can be reliably estimated. When the effect of the time value of money is material, discounting is made of estimated outflows. However, the actual outflows as a result of the obligations may differ from such estimates.
The provisions are mainly related to warranty commitments, restructuring, customer projects and other obligations, such as unresolved income tax and value added tax issues, claims or obligations as a result of patent infringement and other litigations, supplier claims and customer finance guarantees.
Product warranty commitments consider probabilities of all material quality issues based on historical performance for established products and expected performance for new products, estimates of repair cost per unit, and volumes sold still under warranty up to the reporting date.
A restructuring obligation is considered to have arisen when the Company has a detailed formal plan for the restructuring (approved by management), which has been communicated in such a way that a valid expectation has been raised among those affected.
Project related provisions include estimated losses on onerous contracts, contractual penalties and undertakings. For losses on customer contracts, a provision equal to the total estimated loss is recorded when a loss from a contract is anticipated and possible to estimate reliably. These contract loss estimates include any probable penalties to a customer under a loss contract.
ERICSSON ANNUAL REPORT ON FORM 20-F 2012
Other provisions include provisions for unresolved income tax issues, value added tax issues, litigations, supplier claims, customer finance and other provisions. The Company provides for estimated future settlements related to patent infringements based on the probable outcome of each infringement. The ultimateactual outcome or actual cost of settling an individual infringement may vary from the Company’s estimate.
The Company estimates the outcome of any potential patent infringement made known to the Company through assertion and through the Company’s own monitoring of patent-related cases in the relevant legal systems. To the extent that the Company makes the judgment that an identified potential infringement will more likely than not result in an outflow of resources, the Company records a provision based on the Company’s best estimate of the expenditure required to settle with the counterpart.
In the ordinary course of business, the Company is subject to proceedings, lawsuits and other unresolved claims, including proceedings under laws and government regulations and other matters. These matters are often
ERICSSON ANNUAL REPORT ON FORM 20-F 2009
NOTES TO THE CONSOLIDATED FINANCIAL STATEMENTS—(Continued)
resolved over a long period of time. The Company regularly assesses the likelihood of any adverse judgments in or outcomes of these matters, as well as potential ranges of possible losses. Provisions are recognized when it is probable that an obligation has arisen and the amount can be reasonably estimated based on a detailed analysis of each individual issue.
Certain present obligations are not recognized as provisions as it is not probable that an economic outflow will be required to settle the obligation or the amount of the obligation cannot be measured with sufficient reliability. Such obligations are reported as contingent liabilities. For further detailed information, see Note C24, “Contingent liabilities”.
In Note C2, “Critical accounting estimates and judgments”, a further disclosure is presented in relation to (i) key sources of estimation uncertainty and (ii) the decision made in relation to accounting policies applied.
Post-employment benefits
Pensions and other post-employment benefits are classified as either defined contribution plans or defined benefit plans. Under a defined contribution plan, the Company’s only obligation is to pay a fixed amount to a separate entity (a pension trust fund) with no obligation to pay further contributions if the fund does not hold sufficient assets to pay all employee benefits. The related actuarial and investment risks fall on the employee. The expenditures for defined contribution plans are recognized as expenses during the period when the employee provides service.
Under a defined benefit plan, it is the Company’s obligation to provide agreed benefits to current and former employees. The related actuarial and investment risks fall on the Company.
The present value of the defined benefit obligations for current and former employees is calculated using the Projected Unit Credit Method. The discount rate for each country is determined by reference to market yields on high-quality corporate bonds that have maturity dates approximating the terms of the Company’s obligations. In countries where there is no deep market in such bonds, the market yields on government bonds are used. The calculations are based upon actuarial assumptions, assessed on a quarterly basis, and are as a minimum prepared annually. Actuarial assumptions are the Company’s best estimate of the variables that determine the cost of providing the benefits. When using actuarial assumptions, it is possible that the actual results will differ from the estimated results or that the actuarial assumptions will change from one period to another. These differences are reported as actuarial gains and losses. They are for example caused by unexpectedly high or low rates of employee turnover, changed life expectancy, salary changes, changes in the discount rate and differences between actual and expected return on plan assets. Actuarial gains and losses are recognized in OCI in the period in which they occur. The Company’s net liability for each defined benefit plan consists of the present value of
ERICSSON ANNUAL REPORT ON FORM 20-F 2012
pension commitments less the fair value of plan assets and is recognized net on the balance sheet. When the result is a net benefit to the Company, the recognized asset is limited to the total of any cumulative past service cost and the present value of any future refunds from the plan or reductions in future contributions to the plan.
The net of return on plan assets and interest on pension liabilities is reported as financial income or expense, while the current service cost and any other items in the annual pension cost are reported as operating income or expense.
Payroll taxes related to actuarial gains and losses are included in determining actuarial gains and losses.
In Note C2, “Critical accounting estimates and judgments”, a further disclosure is presented in relation to (i) key sources of estimation uncertainty and (ii) the decision made in relation to accounting policies applied.
Share-based compensation to employees and the Board of Directors
Share-based compensation is related to remuneration to all employees, including key management personnel and the Board of Directors.
Under IFRS, a company shall recognize compensation costs for share-based compensation programs based on a measure of the value to the company of services received under the plans.
This value is based on the fair value of, for example free shares at grant date, measured as stock price as per each investment date. The value at grant date is charged to the income statement as any other remuneration over the service period. For example, value at grant date is 90. Given the normal service period of three years within Ericsson, 30 are charged per year during the service period.
ERICSSON ANNUAL REPORT ON FORM 20-F 2009The amount charged to the income statement is reversed in equity each time of the income statement charge.
NOTES TO THE CONSOLIDATED FINANCIAL STATEMENTS—(Continued)
The reason for this accounting principle of IFRS is that compensation cost is a cost with no direct cash flow impact. The purpose of share-based accounting according to IFRS (IFRS 2) is to present an impact of share-based programs, being part of the total remuneration, in the income statement.
Compensation to employees
Stock option plans
In accordance with IFRS 1 and IFRS 2, Ericsson has chosen not to apply IFRS 2 to equity instruments granted before November 7, 2002.
IFRS 2 is applied to the equity settled employee option program granted after November 7, 2002 (i.e. on program where the vesting period ended 2005). Ericsson recognizes compensation costs representing the fair value at grant date of the outstanding employee options. In the balance sheet, the corresponding amounts are accounted for as equity. The fair value of the options is calculated using an option-pricing model. The total costs are recognized during the vesting period, i.e. the period during which the employees had to fulfill vesting requirements. When the options are exercised, social security charges are to be paid in certain countries on the value of the employee benefit; generally based on the difference between the market price of the share and the strike price. Such social security charges are accrued during the vesting period.
Stock purchase plans
For stock purchase plans, compensation costs are recognized during the vesting period, based on the fair value of the Ericsson share at the employee’s investment date. The fair value is based upon the share price at investment date, adjusted for the fact that no dividends will be received on matching shares prior to matching and other features that are non-vesting conditions. The employee pays a price equal to the share price at investment date for the investment shares. The investment date is considered as the grant date. In the balance sheet, the corresponding amounts are accounted for as equity. Vesting conditions are non-market based and affect the number of shares that Ericsson will match. Other features of a share-based payment are not vestingnon-vesting conditions. These features would need to be included in the grant date fair value for transactions with employees and others providing similar services. In the period when an employee takes a refund of previously made contributions (and stops making further contributions) all remaining compensation expense is recognized. Non-vesting conditions would not impact the number of awards expected to vest or valuation thereof subsequent to grant date. When calculating the compensation costs for shares under performance-based matching programs, the Parent Company at each reporting date assesses the probability that the performance targets are met. Compensation expenses are based on estimates of the number of shares that will match at the end of the vesting period. When shares are matched, social security charges are to be paid in certain countries on the value of the employee
ERICSSON ANNUAL REPORT ON FORM 20-F 2012
benefit. The employee benefit is generally based on the market value of the shares at the matching date. During the vesting period, estimated amounts for such social security charges are expensed and accrued.
Compensation to the Board of Directors
During 2008, the Parent Company introduced a share-based compensation program as a part of the remuneration to the Board of Directors. The program gives non-employed Directors elected by the General Meeting of Shareholders a right to receive part of their remuneration as a future payment of an amount which corresponds to the market value of a share of class B in the Parent Company at the time of payment, as further disclosed in Note C29,C28, “Information Regarding Membersregarding members of the Board of Directors, the ManagementGroup management and Employees”employees”. The cost for cash settlements is measured and recognized based on the estimated costs for the program on a pro rata basis during the service period, being one year. The estimated costs are remeasured during and at the end of the service period.
Segment reporting
An operating segment is a component of a company whose operating results are regularly reviewed by the Company’s chief operating decision maker, (CODM), to make decisions about resources to be allocated to the segment and assess its performance. Within the Company, the Group Management Team is defined as the CODM function.
ERICSSON ANNUAL REPORT ON FORM 20-F 2009
NOTES TO THE CONSOLIDATED FINANCIAL STATEMENTS—(Continued)
The segment presentation, as per each segment is based on the Company’s accounting policies as disclosed in this note. The arm’s length principle is applied in transactions between the segments.
The Company’s segment disclosure about geographical areas is based on in which country transfer of risks and rewards occur.
Borrowing costs
The Company capitalizes borrowing costs in relation to qualifying assets, for the Company normally being internally generated intangible assets as capitalized development expenses. All other borrowing costs are expensed as incurred.
Government grants
Government grants are recognized when there is a reasonable assurance of compliance with conditions attached to the grants and that the grants will be received.
For the Company, government grants are linked to performance of research or development work or to capital expenditures that are subsidized as governmental stimulus to employment or investments in a certain country or region. Government grants linked to research and development are normally deducted in reporting the related expense, whereas grants related to assets are accounted for deducting the grant when establishing the acquisition cost of the asset.
New standards and interpretations not yet adopted
A number of issued new standards, amendments to standards and interpretations are not yet effective for the year ended December 31, 2009,2012 and have not been applied in preparing these consolidated financial statements:statements.
IAS 27 (revised), ‘ConsolidatedBelow is a list of standards/interpretations that have been issued, except for amendments related to IFRS 1, ‘First time adoption of International Financial Reporting Standards’ and separate financial statements’, (effective from July 1, 2009). The revised standard requiresare effective for the effects of all transactions with non-controlling interests to be recorded in OCI if there is no change in control and these transactions will no longer result in goodwill or gains or losses. The standard also specifies the accounting when control is lost. Any remaining interest in the entity is remeasured to fair value, and a gain or loss is recognized in profit or loss. The Company will apply IAS 27 (revised) prospectively to transactions with non-controlling interestsperiods starting as from January 1, 2010.
2013 (except IAS 32 and IFRS 3 (revised), ‘Business combinations’ (effective from July 1, 2009)9). The revised standard continues to apply the acquisition method to business combinations, with some significant changes. For example, all payments to purchase a business are to be recorded at fair value at the acquisition date, with contingent payments classified
These amendments effective as debt subsequently re-measured through the income statement. There is a choice on an acquisition-by-acquisition basis to measure the non-controlling interest in the acquiree either at fair value or at the non-controlling interest’s proportionate share of the acquiree’s net assets. All acquisition-related costs should be expensed as incurred. The Company will apply IFRS 3 (revised) prospectively from January 1, 2010. Acquisition-related costs incurred prior to the adoption of IFRS 3 (R) have been treated as a part of the purchase price, as required by IFRS 3. These costs amount to SEK 53 million as per December 31, 2009.
IFRS 2 (amendments), ‘Group cash-settled share-based payment transactions’ (effective from January 1, 2010). In addition to incorporating IFRIC 8, ‘Scope of IFRS 2’, and IFRIC 11, ‘IFRS 2—Group and
ERICSSON ANNUAL REPORT ON FORM 20-F 2009
NOTES TO THE CONSOLIDATED FINANCIAL STATEMENTS—(Continued)
| treasury share transactions’, the amendments expand on the guidance in IFRIC 11 to address the classification of group arrangements that were not covered by the interpretation. The new guidance is not expected to have a material impact on the Group’s financial statements. The EU has not yet endorsed.
|
Improvements to IFRSs, published in April 2009 and effective from January 1, 2010. None of these improvements2013, are expected to have a material impact on the Company’s financial statements. The EU has not yet endorsed.
Amendment to IAS 32 Classification of Rights Issues (published in October 2009 and effective for periods beginning after February 1, 2010). This amendment prescribes the accounting treatment of a contract that will or may be settled in the Company’s own equity instruments. The amendment is not expected to have a significant impact on the Company’s financial result or position.
Amendment to IAS 1, ‘Financial statement presentation’, regarding other comprehensive income
The main change resulting from these amendments is a requirement for entities to group items presented in ‘other comprehensive income’ (OCI) on the basis of whether they are potentially reclassifiable to profit or loss subsequently (reclassification adjustments). The amendments do not address which items are presented in OCI.
Amendment to IAS 19, ‘Employee benefits’
These amendments eliminate the corridor approach and calculate finance costs on a net funding basis. The Company implemented the immediate and full recognition of actuarial gains/losses in other comprehensive income in 2006, meaning that the corridor method has not been applied by the Company as from that date and therefore the transition to the revised IAS19 applicable starting January 1, 2013 will not have a significant effect on the present obligation. The main issue to address will be the
ERICSSON ANNUAL REPORT ON FORM 20-F 2012
implementation of the net interest cost/gain, which integrates the interest cost and expected return on assets to be based on a common discount rate. An analysis of fiscal year 2012 in relation to this amendment indicates an impact on pension costs for 2012 with an increase of approximately SEK 0.4 (–0.1) billion. The Company will also need to address the taxes to be incorporated into the defined benefit obligation. This amendment relates to the Swedish special payroll taxes to be reclassified from Other current liabilities to Post-employment benefits with an estimated amount of SEK 1.8 (1.8) billion as per December 31, 2012. The amendment also includes additional disclosure requirements on financial and demographic assumptions, sensitivity analysis, duration and multi-employer plans.
Amendment to IFRS 7, ‘Financial instruments: Disclosures’, on asset and liability offsetting
This amendment requires disclosure of gross amounts related to financial instruments for which off set has been made.
IFRS 10, ‘Consolidated financial statements’
The objective of IFRS 10 is to establish principles for the presentation and preparation of consolidated financial statements when an entity controls one or more other entities to present consolidated financial statements. It defines the principle of control, and establishes controls as the basis for consolidation. It sets out how to apply the principle of control to identify whether an investor controls an investee and therefore must consolidate the investee. An entity controls an investee if the entity has power over the investee, has the ability to use the power and is plannedexposed to variable returns. It also sets out the accounting requirements for the preparation of consolidated financial statements.
IFRS 11, ‘Joint arrangements’
IFRS 11 is a more realistic reflection of joint arrangements by focusing on the rights and obligations of the arrangement rather than its legal form. There are two types of joint arrangement: joint operations and joint ventures. Proportional consolidation of joint ventures is no longer allowed. The Company does not apply the proportionate consolidation method.
IFRS 12, ‘Disclosures of interests in other entities’
IFRS 12 includes the disclosure requirements for all forms of interests in other entities, including joint arrangements, associates, special purpose vehicles and other off balance sheet vehicles.
IFRS 13, ‘Fair value measurement’
IFRS 13 does not extend the use of fair value accounting but provide guidance on how it should be applied where its use is already required or permitted by other standards within IFRS.
IAS 27 (revised 2011), ‘Separate financial statements’
IAS 27 (revised 2011) includes the provisions on separate financial statements that are left after the control provisions of IAS 27 have been included in the new IFRS 10.
IAS 28 (revised 2011), ‘Associates and joint ventures’
IAS 28 (revised 2011) includes the requirements for joint ventures, as well as associates, to be appliedequity accounted following the issue of IFRS 11.
Below are standards that have been issued and are effective for the periods starting as from later than 1 January, 1, 2011.2013:
IFRIC 17,”DistributionsAmendment to IAS 32, ‘Financial instruments: Presentation’, on asset and liability offsetting
These amendments are related to the application guidance in IAS 32, ‘Financial instruments: Presentation’, and clarify some of Non-cash Assetsthe requirements for offsetting financial assets and financial liabilities on the balance sheet. This amendment is effective as from 1 January, 2014.
ERICSSON ANNUAL REPORT ON FORM 20-F 2012
IFRS 9, ‘Financial instruments’
IFRS 9 is the first standard issued as part of a wider project to Owners”.replace IAS 39. IFRS 9 retains but simplifies the mixed measurement model and establishes two primary measurement categories for financial assets: amortized cost and fair value. This interpretationamendment is not expected to have a material impact on the Company’s financial statements.be effective as from 1 January, 2015. The EU has not yet endorsed IFRS 9, ‘Financial instruments’.
Amendments to IFRIC 14, ‘Prepayment of a minimum funding requirement’ (effectiveThese amendments effective as from later than January 1, 2011). These new amendments2013, are not expected to have a materialsignificant impact on the group’sCompany’s financial statements. Theresult or position.
Effective date for IFRS 10, IFRS 11, IFRS 12, IAS 27 and IAS 28 is January 1, 2013. EU has not yet endorsed.
IFRIC19, ‘Extinguishing financial liabilities with equity instruments’ (effective for periods beginning after July 1, 2010). This new IFRIC is not expectedin its endorsement decision allowed listed companies in the EU to have a material impact on the group’s financial statements. The EU has not yet endorsed.
IAS 24 (revised) ‘Related party disclosures’ (effectiveadopt these standards as from January 1, 2011). This amendment only impact disclosures.2014. The EU has not yet endorsed.
Company will adopt IFRS 9 ‘Financial Instruments’ (effective10, IFRS 11, IFRS 12, IAS 27 and IAS 28 as from January 1, 2013). The objective of this IFRS is to establish principles for the financial reporting of financial assets that will present relevant and useful information to users of financial statements for their assessment of the amounts, timing and uncertainty of the entity’s future cash flows. The Company has not yet evaluated the impact of this new standard. The EU has not yet endorsed.2013.
C2 CRITICAL ACCOUNTING ESTIMATES AND JUDGMENTS
The preparation of financial statements and application of accounting standards often involve management’s judgment and the use of estimates and assumptions deemed to be reasonable at the time they are made. However, other results may be derived with different judgments or using different assumptions or estimates, and events may occur that could require a material adjustment to the carrying amount of the asset or liability affected. Following are the most important accounting policies subject to such judgments and the key sources of estimation uncertainty that the Company believes could have the most significant impact on the reported results and financial position.
The information in this note is grouped as per:
Key sources of estimation uncertainty.uncertainty
Judgments management has made in the process of applying the Company’s accounting policies.
ERICSSON ANNUAL REPORT ON FORM 20-F 2009
NOTES TO THE CONSOLIDATED FINANCIAL STATEMENTS—(Continued)
Revenue recognition
Key sources of estimation uncertainty
EstimatesExamples of estimates of total contract revenue and cost that are necessary in evaluationare the assessing of contractual performance and estimated total contract costs for assessing whether any loss provisions arecustomer possibility to be made or if customers will reach conditional purchase volumes triggering contractual discounts to be given.given to the customer, the impact on the Company revenue in relation to performance criteria and whether any loss provisions shall be made.
Judgments made in relation to accounting policies applied
Parts of the Company’s sales are generated from large and complex customer contracts. Managerial judgment is applied regarding, among other aspects, conformance with acceptance criteria and if transfer of risks and rewards to the buyer has taken place to determine if revenue and costs should be recognized in the current period, degree of completion and the customer credit standing to assess whether payment is likely or not to justify revenue recognition.
Trade and customer finance receivables
Key sources of estimation uncertainty
The Company monitors the financial stability of its customers and the environment in which they operate to make estimates regarding the likelihood that the individual receivables will be paid. Total allowances for estimated losses as of December 31, 2009,2012, were SEK 1.7 (1.8)1.1 (1.0) billion or 2.4 (2.2) percent1.5% (1.4%) of gross trade and customer finance receivables.
ERICSSON ANNUAL REPORT ON FORM 20-F 2012
Credit risks for outstanding customer finance credits are regularly assessed as well, and allowances are recorded for estimated losses.
Inventory valuation
Key sources of estimation uncertainty
Inventories are valued at the lower of cost and net realizable value. Estimates are required in relation to forecasted sales volumes and inventory balances. In situations where excess inventory balances are identified, estimates of net realizable values for the excess volumes are made. Inventory allowances for estimated losses as of December 31, 2009,2012, amounted to SEK 3.0 (3.5)3.5 (3.3) billion or 12 (11) percent11% (9%) of gross inventory.
Investments in joint ventures and associated companies
Key sources of estimation uncertainty
Impairment testing of total carrying value of each item of “Equity in joint ventures and associated companies” is performed after initial recognition, whenever there is an indication of impairment. Information regarding information used for impairment tests is provided by respective joint venture and associated company. Negative deviations in actual cash flows compared to estimated cash flows as well as new estimates that indicate lower future cash flows might result in recognition of impairment charges. An impairment in a JV or associated company may not always affect the Company in the same way depending on accounting standard used, initial recognition of assets and liabilities or other differences.
At December 31, 2009,2012, the amount of joint ventures and associated companies amounted to SEK 11.6 (8.0)2.8 (6.0) billion.
Deferred taxes
Key sources of estimation uncertainty
Deferred tax assets and liabilities, are recognized for temporary differences between the carrying amounts for financial reporting purposes of assets and liabilities and the amounts used for taxation purposes and for tax loss carry-forwards. Deferred tax is recognized net of valuation allowances. The valuation of temporary differences and tax loss carry-forwards, is based on management’s estimates of future taxable profits in different tax jurisdictions against which the temporary differences and loss carry-forwards may be utilized.
The largest amounts of tax loss carry-forwards are reported in Sweden, with an indefinite period of utilization (i.e. with no expiry date). The valuation of tax loss carry-forwards, deferred tax assets and the Company’s ability to utilize tax losses is based upon management’s estimates of future taxable income in different tax jurisdictions. For further detailed information, please refer to noteNote C8, “Taxes”.
At December 31, 2009,2012, the value of deferred tax assets amounted to SEK 14.3 (14.9)12.3 (13.0) billion. The deferred tax assets related to loss carryforwardscarry-forwards are reported as non-current assets.
ERICSSON ANNUAL REPORT ON FORM 20-F 2009
NOTES TO THE CONSOLIDATED FINANCIAL STATEMENTS—(Continued)
Accounting for income-, value added- and other taxes
Key sources of estimation uncertainty
Accounting for these items is based upon evaluation of income-, value added- and other tax rules in all jurisdictions where we perform activities. The total complexity of rules related to taxes and the accounting for these require management’s involvement in judgments regarding classification of transactions and in estimates of probable outcomes of claimed deductions and/or disputes.
Capitalized development expenses
ERICSSON ANNUAL REPORT ON FORM 20-F 2012
Key sources of estimation uncertainty
Impairment testing is performed after initial recognition whenever there is an indication of impairment. Intangible assets not yet available for use are tested annually. The impairment testing amounts are based on estimates of future cash flows for the respective products.
At December 31, 2009, the capitalized development expenses amounted to SEK 2.1 (2.8) billion. An impairment charge of SEK 0.2 (0.5) billion was recognized as a part of the restructuring program. Under this program decisions where taken to phase out certain products. The impairment charge relates to balances for these products.
Judgments made in relation to accounting policies applied
Development costs that meet IFRS’ intangible asset recognition criteria for products that will be sold, leased or otherwise marketed as well as those intended for internal use are capitalized. The starting point for capitalization is based upon management’s judgment that technological and economical feasibility is confirmed, usually when a product development project has reached a defined milestone according to the Company’s established project management model. Capitalization ceases and amortization of capitalized development costs begins when the product is available for general release.
The definition of amortization periods and the evaluation of impairment indicators also require management’s judgment.
Acquired intellectual property rights and other intangible assets, including goodwill
Key sources of estimation uncertainty
At initial recognition, future cash flows are estimated, to ensure that the initial carrying values do not exceed the expected discounted cash flows for the items of this type of assets. After initial recognition, impairment testing is performed whenever there is an indication of impairment, except for goodwill for which impairment testing is performed at least once per year. Negative deviations in actual cash flows compared to estimated cash flows as well as new estimates that indicate lower future cash flows might result in recognition of impairment charges. One source of uncertainty related to future cash flows is long-term movements in exchange rates.
The market capitalization of the Company as per year-end 2009 well exceeded the value of the Company’s net assets.
For further discussion on goodwill, see Note C1, “Significant Accounting Policies”accounting policies” and Note C10, “Intangible Assets”assets”. Estimates related to acquired intangible assets are based on similar assumptions and risks in assumptions as for goodwill.
ERICSSON ANNUAL REPORT ON FORM 20-F 2009
NOTES TO THE CONSOLIDATED FINANCIAL STATEMENTS—(Continued)
At December 31, 2009,2012, the amount of acquired intellectual property rights and other intangible assets amounted to SEK 46.1 (45.5)45.6 (40.5) billion, including goodwill of SEK 274 (24.9)30.4 (27.4) billion. An impairment chargeThe Company recognized goodwill in ST-Ericsson of SEK 4.30.0 (1.3) billion, was recognized as a part of the restructuring program. Under this program decisions where taken to phase out certain products. The impairment charge relates to balances for these products.disclosed in Note C12, “Financial assets, non-current”.
Judgments made in relation to accounting policies applied
At initial recognition and subsequent remeasurement, management judgments are made, both for key assumptions and regarding impairment indicators. In the purchase price allocation made for each acquisition, the purchase price shall be assigned to the identifiable assets, liabilities and contingent liabilities based on fair values for these assets. Any remaining excess value is reported as goodwill. This allocation requires management judgment as well as the definition of cash generating units for impairment testing purposes. Other judgments might result in significantly different results and financial position in the future.
Provisions
Warranty provisions
Key sources of estimation uncertainty
Provisions for product warranties are based on current volumes of products sold still under warranty and on historic quality rates for mature products as well as estimates and assumptions on future quality rates for new products and estimates of costs to remedy the various qualitative issues that might occur. Total provisions for product warranties as of December 31, 2009,2012, amounted to SEK 2.51.6 (1.9) billion.
Provisions other than warranty provisions
Key sources of estimation uncertainty
Provisions, other than warranty provisions, mainly comprise amounts related to contractual obligations and penalties to customers and estimated losses on customer contracts, restructuring, risks associated with patent and other litigations, supplier or subcontractor claims and/or disputes, as well as provisions for unresolved income tax and value added tax issues. The estimates related to the amounts of provisions for penalties, claims or losses receive special attention from the management. At December 31, 2009,2012, provisions other than warranty commitments amounted to SEK 9.9 (12.4)7.0 (4.4) billion. For further detailed information, see Note C18, “Provisions”.
ERICSSON ANNUAL REPORT ON FORM 20-F 2012
Judgments made in relation to accounting policies applied
Whether a present obligation is probable or not requires judgment. The nature and type of risks for these provisions differ and management’s judgment is applied regarding the nature and extent of obligations in deciding if an outflow of resources is probable or not.
Contingent liabilities
Key sources of estimation uncertainty
As disclosed under ‘Provisions other than warranty provisions’ there are uncertainties in the estimated amounts. The same type of uncertainty exists for contingent liabilities.
Judgments made in relation to accounting policies
As disclosed under Note C1, “Significant accounting policies” a potential obligation that is not probable to result in an economic outflow is classified as a contingent liability, with no impact on the Company’s financial statements. Should, however, an obligation in a later period be deemed to be probable, then a provision shall be recognized, impacting the financial statements.
Pension and other post-employment benefits
Key sources of estimation uncertainty
Accounting for the costs of defined benefit pension plans and other applicable post-employment benefits is based on actuarial valuations, relying on key estimates for discount rates, expected return on plan assets, future salary increases, employee turnover rates and mortality tables. The discount rate assumptions are based on rates for high-quality fixed-income investments with durations as close as possible to the Company’s pension plans.
ERICSSON ANNUAL REPORT ON FORM 20-F 2009
NOTES TO THE CONSOLIDATED FINANCIAL STATEMENTS—(Continued)
Expected returns on plan assets consider long-term historical returns, allocation of assets and estimates of future long-term investment returns. At December 31, 2009,2012, defined benefit obligations for pensions and other post-employment benefits amounted to SEK 30.7 (28.0)52.0 (36.4) billion and fair value of plan assets to SEK 23.2 (19.0)44.6 (28.0) billion. For more information on estimates and assumptions, see Note C17, “Post-Employment Benefits”“Post-employment benefits”.
Financial instruments, hedge accounting and foreign exchange risks
Key sources of estimation uncertainty
Foreign exchange risk in highly probable sales and purchases in future periods are hedged using foreign exchange derivative instruments designated as cash-flow hedges. Forecasts are based on estimations of future transactions, atransactions. A forecast is therefore per definition uncertain to some degree.
Judgments made in relation to accounting policies applied
Establishing highly probable sales and purchases volumes involvesinvolve gathering and evaluating sales and purchases estimates for future periods as well as analyzing actual outcome versus estimates on a regular basis in order to fulfill effectiveness testing requirements for hedge accounting. Changes in estimates of sales and purchases might result in that hedge accounting is discontinued.
For further information regarding risks in financial instruments, see Note C20, “Financial Risk Managementrisk management and Financial Instruments”financial instruments”.
ERICSSON ANNUAL REPORT ON FORM 20-F 2012
C3 SEGMENT INFORMATION
Operating segments
OperatingWhen determining Ericsson’s operating segments, consideration has been given to which markets and what type of customers the products and services aim to attract as well as the distribution channels they are sold through. Commonality regarding technology, research and development has also been taken into account. To best reflect the business focus and to facilitate comparability with peers, four operating segments are reported:
The Company has the following five operating segments:
Ericsson’s share in Sony Ericsson was divested in February 2012, with effective date on January 1.
Networksdelivers products and solutions for mobile access, IP and fixed broadband access, coretransport networks and transmission as well as related network rollout services.core networks. The offering includes:
Radio access solutions that interconnect with devices such as mobile phones, notebookstablets and PCs, supporting differentPCs. The RBS 6000 supports all major standardized mobile technologies such as GSM and WCDMA on the same platform.
Fixed access solutions; increaseIP and transport solutions based on the customers’ ability to modernize fixed networks to enable new IP-based services with higher bandwidth.
Ericsson’s core network solutions include industry leading softswitches, IP infrastructure for EDGE- and core routing, IP Multimedia Subsystem (IMS) and media gateways.
Transmission/backhaul; micro-waveSSR 8000 family of products as well as transmission/backhaul including microwave (MINI-LINK) and optical transmission solutions for mobile and fixed networks.networks
Related network rollout services.Switching and IMS solutions, based on Ericsson Blade Server platform, for core networks
Network management tools;Operations Support Systems (OSS), supporting operator activities foroperators’ management of existing networks as well as forand introduction of new network architectures, technologies and services.
GSM and WCDMA share a common core network, preserving investments. IMS is a platform that enables converged services to be transparently provided independent of the type of access used.
ProfessionalGlobal Servicesdelivers managed services, product-related services and consulting and systems integration consulting, education and general customer support services. The offering includes:
Managed services comprise network operations (the management ofServices; Solutions for designing, building, operating and managing the day-to-day operations of customer networks) andthe customer’s network or solution, maintenance, network sharing solutions as well as shared solutions such as hosting of service layer platforms and applications. Ericsson also offers broadcast services and managed services of IT environments.
Product-related services: Services to expand, upgrade, restructure or migrate networks, network-rollout services, customer support and network optimization services.
Consulting and Systems Integration: Technology and operational consulting, integration of multi-vendor equipment, design and integration of new solutions and transforming programs. Industry-specific solutions for vertical industries are also included.
Support Solutions (name changed from Multimedia during 2012) provides enablers and applications for operators. The offering includes:
Operations Support Systems: plan, build and optimize, service fulfillment and service assurance.
Business Support Systems: revenue management (prepaid, post-paid, convergent charging and billing), mediation and customer care solutions.
TV solutions: a suite of open, standards-based solutions and products for the creation, management and delivery of evolved TV experiences on any device over any network. Includes a multi-screen TV platform with consumer experience creation, video content management, on-demand video delivery, advanced video compression and video-optimized delivery network infrastructure.
ERICSSON ANNUAL REPORT ON FORM 20-F 20092012
NOTES TO THE CONSOLIDATED FINANCIAL STATEMENTS—(Continued)
Systems integration; Ericsson integrates equipment from multiple suppliersM-Commerce solutions for money transfer; payment transactions and handles technology change programs as well as designservices between mobile subscribers and integration of new solutions.
Consulting; experts in business and technology strategy provide support (decision making, planning and execution) to customers in improving and growing their business.
Education; tailored programs to ensure operator personnel have the right skills and competence to manage their increasingly complex systems.
Customer support services; staff world-wide provide around-the-clock support and advice to ensure network uptime and performance.operators or other service providers.
MultimediaST-Ericsson provides enablers, the joint venture, offers modems and applications enabling operatorsModAps (integrated modem and application processor platforms) for device manufacturers.
ST-Ericsson’s results are reported according to deliverthe equity method under “Share in earnings of joint ventures and associated companies” in the income statement.
On December 10, 2012, STMicroelectronics announced its intention to exit as a rich user experience seamlessly on any device, any time and anywhere.shareholder in ST-Ericsson. On December 20, 2012, the Company announced that it would take a non-cash charge in the fourth quarter of 2012 related to its 50% stake in ST-Ericsson. The offering includes:
TV solutions; end-to-end solutions for operators, service providers, advertisers and content providers.
Customer and business applications; multimedia solutions forcharge includes write-down of investments to reflect the consumer and enterprise markets.
Multimedia brokering solutions which facilitate payment and distributioncurrent best estimate of content.
Service delivery and provisioning platforms enabling operators and service providers to create, sell and manage multimedia offerings and multi-play offerings.
Sony Ericsson, consistingthe Company’s share of the fair market value of the joint venture and a provision related to the strategic options at hand for ST-Ericsson assets. In total, the Company has made write-downs of SEK –4.7 billion of ST-Ericsson investments and taken a provision of SEK –3.3 billion. In addition, the Company’s share in ST-Ericsson’s operating loss amounted to SEK –3.7 (–0.8) billion. For more information, see Note C12, “Financial assets, non-current” and Note C18 “Provisions”.
As of December 31, 2012 there are no remaining investments related to ST-Ericsson on the Company’s balance sheet. Costs and cash related to implementation of strategic options at hand will be booked against provisions.
Sony Ericsson Mobile Communications. Sony Ericsson delivers innovative and feature-rich, was up until 2012, a joint venture delivering mobile phones and accessories. In February 2012, Ericsson completed the divestment of its 50% stake in Sony Ericsson to Sony. Sony Ericsson has not been consolidated by the Company during 2012. The sale resulted in a gain of SEK 7.7 billion.
ST-Ericsson,Unallocated consisting of the joint venture ST-Ericsson. ST-Ericsson is an industry leader in design, development, and creation of cutting-edge mobile platforms and wireless semiconductors. ST-Ericsson was formed on February 2, 2009, by merging ST-NXP Wireless and Ericsson Mobile Platforms.
Unallocated
Some revenues, costs, assets and liabilities are not identified as part of any operating segment and are therefore not allocated. Examples of such items are costs for corporate staff, IT costs and general marketing costs.
Geographical areasRegions
The Regions are the Company’s primary sales channel. The Company operates world-wideworldwide and reports its operations divided in five geographical areas: (1) into eleven regions. Region China and North East Asia has changed name to North East Asia.
Northern Europe & Central Asia
Western Europe, (2)and Central and Eastern Europe
North East Asia Pacific, (4) North America and (5) Latin America.
South East Asia & Oceania
ERICSSON ANNUAL REPORT ON FORM 20-F 20092012
NOTES TO THE CONSOLIDATED FINANCIAL STATEMENTS—(Continued)
Region “Other” includes licensing revenues, sales of cables, broadcast services, power modules and other businesses.
The acquired Technicolor Broadcast Service Division is reported in region “Other”. Multimedia brokering (IPX) was previously reported in each region in segment Support Solutions. For the first three quarters 2012 it was part of region “Other”. Multimedia brokering (IPX) was divested at the end of the third quarter 2012.
Major customers
The Company does not have any customer for which revenues from transactions have exceeded 10 percent10% of the Company’s total revenues for the years 2009, 20082012, 2011 or 2007.2010.
We derive most of the sales from large, multi-year agreements with a limited number of significant customers. Out of a customer base of approximately 400, mainly network operators, the 10 largest customers account for 46% (44%) of net sales. The largest customer accounted for approximately 7% (7%) of sales in 2012. For more information, see Risk Factors, “Market, Technology and Business Risks”.
OPERATING SEGMENTSMarketing channels
Marketing in a business-to-business environment is expanding, from being primarily through personal meetings, to on-line forums, expert blogs and social media. Ericsson performs marketing through:
Customer engagement with a consultative approach
Selective focus on events and experience centers for customer experience and interaction
Continuous dialogue with customers and target audiences through social and other digital media (including virtual events)
Activation of the open social and digital media landscape to strengthen message reach and impact
Execution of solutions-driven programs, aligned globally and regionally.
ERICSSON ANNUAL REPORT ON FORM 20-F 2012
Operating segments
| 2009 | | Networks | | Professional
Services | | Multi-
media | | Sony
Ericsson | | ST-
Ericsson | | Total
Segments | | Unallo-
cated | | Elimi-
nations3) | | Group | | |
| | | | |
2012 | | | Networks | | Global
Services | | Support
Solutions | | Sony
Ericsson | | ST-
Ericsson | | Total
Segments | | Unallocated | | Eliminations1) | | Group | |
Segment sales | | 136,312 | | | 56,065 | | | 12,996 | | | 71,984 | | | 13,535 | | | 290,892 | | | — | | –85,519 | | 205,373 | | | | 117,185 | | | | 97,009 | | | | 13,445 | | | | — | | | | 8,457 | | | | 236,096 | | | | — | | | | –8,457 | | | | 227,639 | |
Inter–segment sales | | 770 | | | 58 | | | 276 | | | 164 | | | 5,731 | | | 6,999 | | | — | | –5,895 | | 1,104 | | |
Inter-segment sales | | | | 100 | | | | 34 | | | | 6 | | | | — | | | | 634 | | | | 774 | | | | — | | | | –634 | | | | 140 | |
| | | | | | | | | | | | | | | | | | | | | | | | | | | | | | | | | | | | | | | | | | | | | | | | | | | | |
Net sales | | 137,082 | | | 56,123 | | | 13,272 | | | 72,148 | | | 19,266 | | | 297,891 | | | — | | –91,414 | | 206,477 | | | | 117,285 | | | | 97,043 | | | | 13,451 | | | | — | | | | 9,091 | | | | 236,870 | | | | — | | | | –9,091 | | | | 227,779 | |
| | | | | | | | | | | | | | | | | | | | | | | | | | | | | | | | | | | | | | | | | | | | | | | | | | | | |
Operating income | | 6,879 | 2) | | 6,990 | 1) | | 655 | | | –10,820 | | | –2,615 | | | 1,089 | | | –855 | | 5,684 | | 5,918 | | | | 7,057 | | | | 6,226 | | | | 1,150 | | | | 8,026 | 2) | | | –15,447 | 3) | | | 7,012 | | | | –267 | | | | 3,713 | | | | 10,458 | |
| | | | | | | | | | | | | | | | | | | | | | | | | | | | | | | | | | | | | | | | | | | | | | | | | | | | |
Operating margin (%) | | 5 | % | | 12 | % | | 5 | % | | –15 | % | | –14 | % | | 0 | % | | — | | — | | 3 | % | | | 6 | % | | | 6 | % | | | 9 | % | | | | | –170 | % | | | 3 | % | | | | | | | 5 | % |
Financial income | | | | | | | | | | | | | | | | | | 1,874 | | | | | | | | | | | | | | | | | | | | 1,708 | |
Financial expenses | | | | | | | | | | | | | | | | | | –1,549 | | | | | | | | | | | | | | | | | | | | –1,984 | |
| | | | | | | | | | | | | | | | | | | | | | | | | | | | | | | | | | | | | | |
Income after financial items | | | | | | | | | | | | | | | | | | 6,243 | | | | | | | | | | | | | | | | | | | | 10,182 | |
| | | | | | | | | | | | | | | | | | | | | | | | | | | | | | | | | | | | | | |
Taxes | | | | | | | | | | | | | | | | | | –2,116 | | | | | | | | | | | | | | | | | | | | –4,244 | |
| | | | | | | | | | | | | | | | | | | | | | | | | | | | | | | | | | | | | | |
Net income | | | | | | | | | | | | | | | | | | 4,127 | | | | | | | | | | | | | | | | | | | | 5,938 | |
| | | | | | | | | | | | | | | | | | | | | | | | | | | | | | | | | | | | | | |
Other segment items | | | | | | | | | | | | | | | | | | | | | | | | | | | | | | | | | | | | |
Share in earnings of joint ventures and associated companies | | 37 | | | 33 | | | –1 | | | –5,693 | | | –1,762 | | | –7,386 | | | –14 | | — | | –7,400 | | | | –59 | | | | 45 | | | | –20 | | | | — | | | | –11,734 | 3) | | | –11,768 | | | | 37 | | | | — | | | | –11,731 | |
Amortization | | –2,673 | | | –574 | | | –910 | | | –165 | | | –828 | | | –5,150 | | | — | | 941 | | –4,209 | | | | –3,832 | | | | –853 | | | | –809 | | | | — | | | | –322 | | | | –5,816 | | | | — | | | | 322 | | | | –5,494 | |
Depreciation | | –2,768 | | | –627 | | | –155 | | | –1,124 | | | –997 | | | –5,671 | | | — | | 2,121 | | –3,550 | | | | –3,035 | | | | –727 | | | | –290 | | | | — | | | | –741 | | | | –4,793 | | | | — | | | | 741 | | | | –4,052 | |
Impairment losses | | –4,333 | 2) | | — | | | –80 | | | — | | | –46 | | | –4,459 | | | — | | 46 | | –4,413 | | | | –385 | | | | –9 | | | | –1 | | | | — | | | | — | 4) | | | –395 | | | | — | | | | — | | | | –395 | |
Reversals of impairment losses | | 38 | | | 9 | | | 2 | | | — | | | — | | | 49 | | | — | | — | | 49 | | | | 39 | | | | 9 | | | | 4 | | | | — | | | | — | | | | 52 | | | | — | | | | — | | | | 52 | |
Write-down of investment | | | | | | — | | | | — | | | | — | | | | –4,684 | | | | –4,684 | | | | — | | | | — | | | | –4,684 | |
Restructuring expenses | | –8,748 | 2) | | –2,044 | | | –385 | | | –1,754 | | | –890 | | | –13,821 | | | –82 | | 1,322 | | –12,581 | | | | –1,253 | | | | –1,930 | | | | –246 | | | | — | | | | –624 | | | | –4,053 | | | | –18 | | | | 624 | | | | –3,447 | |
Gains/losses from divestments | | 10 | | | 777 | 1) | | 41 | | | — | | | 47 | | | 875 | | | –32 | | — | | 843 | | | | –59 | | | | 1 | | | | 216 | | | | 8,026 | 2) | | | — | | | | 8,184 | | | | 152 | | | | — | | | | 8,336 | |
| | | | | | | | | | | | | | | | | | | | | | | | | | |
Total assets | | 116,226 | | | 33,515 | | | 17,650 | | | 33,586 | | | 22,187 | | | 223,164 | | | 92,101 | | –45,456 | | 269,809 | | |
| | | | | | | | | | | | | | | | | | | | | | | | | | |
Revenue from the acquired Telcordia business operation is reported 50/50 between segments Global Services and Support Solutions.
| 1) | In Q2 2009, the TEMS business was divested, resulting in a capital gain of SEK 0.8 billion. |
2) | Including impairment losses related to restructuring activities of SEK 4.3 billion. |
3) | Sony Ericsson andAll segment sales are presented, but as ST-Ericsson sales are accounted for in accordance with the equity method. The difference between what is reported tomethod, their sales are eliminated in the CODMEliminations column. |
| 2) | Includes a gain from the divestment of Sony Ericsson of SEK 7.7 billion. |
| 3) | Includes a write-down of SEK –4.7 billion of ST-Ericsson investment, a provision of SEK –3.3 billion and externally is eliminated.the Company’s share in ST-Ericsson’s operating loss of SEK –3.7 billion. |
| 4) | Impairment losses included in Write-down of investment. |
ERICSSON ANNUAL REPORT ON FORM 20-F 20092012
NOTES TO THE CONSOLIDATED FINANCIAL STATEMENTS—(Continued)
GEOGRAPHICAL AREASOperating segments
| | | | |
2009 | | Net sales | | Non-current
assets1) |
Western Europe | | 44,579 | | 56,118 |
—of which Sweden | | 4,096 | | 43,574 |
Central and Eastern Europe, Middle East and Africa | | 50,725 | | 1,202 |
Asia Pacific | | 65,770 | | 1,630 |
—of which China | | 18,455 | | 903 |
—of which India | | 15,252 | | 225 |
North America | | 25,350 | | 8,359 |
—of which United States | | 21,538 | | 8,100 |
Latin America | | 20,053 | | 2,066 |
| | | | |
Total | | 206,477 | | 69,375 |
—of which EU | | 49,313 | | 49,158 |
| | | | |
| | | | | | | | | | | | | | | | | | | | | | | | | | | | | | | | | | | | |
| | |
2011 | | Networks | | | Global
Services | | | Support
Solutions | | | Sony
Ericsson | | | ST-
Ericsson | | | Total
Segments | | | Unallocated | | | Eliminations1) | | | Group | |
Segment sales | | | 131,596 | | | | 83,854 | | | | 10,629 | | | | 46,866 | | | | 9,232 | | | | 282,177 | | | | — | | | | –56,098 | | | | 226,079 | |
Inter-segment sales | | | 799 | | | | 30 | | | | 13 | | | | 126 | | | | 1,461 | | | | 2,429 | | | | — | | | | –1,587 | | | | 842 | |
| | | | | | | | | | | | | | | | | | | | | | | | | | | | | | | | | | | | |
Net sales | | | 132,395 | | | | 83,884 | | | | 10,642 | | | | 46,992 | | | | 10,693 | | | | 284,606 | | | | — | | | | –57,685 | | | | 226,921 | |
| | | | | | | | | | | | | | | | | | | | | | | | | | | | | | | | | | | | |
Operating income | | | 17,295 | | | | 5,544 | | | | –504 | | | | –1,854 | | | | –5,461 | | | | 15,020 | | | | –501 | | | | 3,381 | | | | 17,900 | |
| | | | | | | | | | | | | | | | | | | | | | | | | | | | | | | | | | | | |
Operating margin (%) | | | 13 | % | | | 7 | % | | | –5 | % | | | –4 | % | | | –51 | % | | | 5 | % | | | | | | | | | | | 8 | % |
Financial income | | | | | | | | | | | | | | | | | | | | | | | | | | | | | | | | | | | 2,882 | |
Financial expenses | | | | | | | | | | | | | | | | | | | | | | | | | | | | | | | | | | | –2,661 | |
| | | | | | | | | | | | | | | | | | | | | | | | | | | | | | | | | | | | |
Income after financial items | | | | | | | | | | | | | | | | | | | | | | | | | | | | | | | | | | | 18,121 | |
| | | | | | | | | | | | | | | | | | | | | | | | | | | | | | | | | | | | |
Taxes | | | | | | | | | | | | | | | | | | | | | | | | | | | | | | | | | | | –5,552 | |
| | | | | | | | | | | | | | | | | | | | | | | | | | | | | | | | | | | | |
Net income | | | | | | | | | | | | | | | | | | | | | | | | | | | | | | | | | | | 12,569 | |
| | | | | | | | | | | | | | | | | | | | | | | | | | | | | | | | | | | | |
Other segment items | | | | | | | | | | | | | | | | | | | | | | | | | | | | | | | | | | | | |
Share in earnings of joint ventures and associated companies | | | 87 | | | | 28 | | | | 4 | | | | –1,199 | | | | –2,730 | | | | –3,810 | | | | 32 | | | | — | | | | –3,778 | |
Amortization | | | –4,192 | | | | –481 | | | | –792 | | | | –1 | | | | –867 | | | | –6,333 | | | | — | | | | 868 | | | | –5,465 | |
Depreciation | | | –2,783 | | | | –532 | | | | –184 | | | | –647 | | | | –823 | | | | –4,969 | | | | — | | | | 1,470 | | | | –3,499 | |
Impairment losses | | | –50 | | | | –23 | | | | –12 | | | | — | | | | –283 | | | | –368 | | | | — | | | | 283 | | | | –85 | |
Reversals of impairment losses | | | 12 | | | | — | | | | 1 | | | | — | | | | — | | | | 13 | | | | — | | | | — | | | | 13 | |
Restructuring expenses | | | –1,600 | | | | –1,363 | | | | –143 | | | | –838 | | | | –280 | | | | –4,224 | | | | –78 | | | | 1,118 | | | | –3,184 | |
Gains/losses from divestments | | | –6 | | | | — | | | | — | | | | — | | | | — | | | | –6 | | | | 164 | | | | — | | | | 158 | |
| 1) | All segment sales are presented, but as Sony Ericsson and ST-Ericsson sales are accounted for in accordance with the equity method, their sales are eliminated in the Eliminations column. |
ERICSSON ANNUAL REPORT ON FORM 20-F 2012
Operating segments
| | | | | | | | | | | | | | | | | | | | | | | | | | | | | | | | | | | | |
2010 | | Networks | | | Global
Services | | | Support
Solutions | | | Sony
Ericsson | | | ST-
Ericsson | | | Total
Segments | | | Unallocated | | | Eliminations1) | | | Group | |
Segment sales | | | 111,459 | | | | 80,117 | | | | 10,504 | | | | 60,118 | | | | 13,116 | | | | 275,314 | | | | — | | | | –73,234 | | | | 202,080 | |
Inter-segment sales | | | 1,249 | | | | 6 | | | | 13 | | | | 60 | | | | 3,403 | | | | 4,731 | | | | — | | | | –3,463 | | | | 1,268 | |
| | | | | | | | | | | | | | | | | | | | | | | | | | | | | | | | | | | | |
Net sales | | | 112,708 | | | | 80,123 | | | | 10,517 | | | | 60,178 | | | | 16,519 | | | | 280,045 | | | | — | | | | –76,697 | | | | 203,348 | |
| | | | | | | | | | | | | | | | | | | | | | | | | | | | | | | | | | | | |
Operating income | | | 12,481 | | | | 6,513 | | | | –643 | | | | 1,523 | | | | –3,527 | | | | 16,347 | | | | –805 | | | | 913 | | | | 16,455 | |
| | | | | | | | | | | | | | | | | | | | | | | | | | | | | | | | | | | | |
Operating margin (%) | | | 11 | % | | | 8 | % | | | –6 | % | | | 3 | % | | | –21 | % | | | 6 | % | | | — | | | | — | | | | 8 | % |
Financial income | | | | | | | | | | | | | | | | | | | | | | | | | | | | | | | | | | | 1,047 | |
Financial expenses | | | | | | | | | | | | | | | | | | | | | | | | | | | | | | | | | | | –1,719 | |
| | | | | | | | | | | | | | | | | | | | | | | | | | | | | | | | | | | | |
Income after financial items | | | | | | | | | | | | | | | | | | | | | | | | | | | | | | | | | | | 15,783 | |
| | | | | | | | | | | | | | | | | | | | | | | | | | | | | | | | | | | | |
Taxes | | | | | | | | | | | | | | | | | | | | | | | | | | | | | | | | | | | –4,548 | |
| | | | | | | | | | | | | | | | | | | | | | | | | | | | | | | | | | | | |
Net income | | | | | | | | | | | | | | | | | | | | | | | | | | | | | | | | | | | 11,235 | |
| | | | | | | | | | | | | | | | | | | | | | | | | | | | | | | | | | | | |
Other segment items | | | | | | | | | | | | | | | | | | | | | | | | | | | | | | | | | | | | |
Share in earnings of joint ventures and associated companies | | | –64 | | | | –17 | | | | –2 | | | | 664 | | | | –1,763 | | | | –1,182 | | | | 10 | | | | — | | | | –1,172 | |
Amortization | | | –4,554 | | | | –303 | | | | –806 | | | | –25 | | | | –930 | | | | –6,618 | | | | — | | | | 955 | | | | –5,663 | |
Depreciation | | | –2,600 | | | | –555 | | | | –144 | | | | –731 | | | | –1,022 | | | | –5,052 | | | | — | | | | 1,753 | | | | –3,299 | |
Impairment losses | | | –675 | | | | –276 | | | | –52 | | | | — | | | | –61 | | | | –1,064 | | | | — | | | | 61 | | | | –1,003 | |
Reversals of impairment losses | | | 9 | | | | 2 | | | | 1 | | | | — | | | | — | | | | 12 | | | | — | | | | — | | | | 12 | |
Restructuring expenses | | | –3,915 | | | | –2,675 | | | | –207 | | | | –402 | | | | –536 | | | | –7,735 | | | | –17 | | | | 938 | | | | –6,814 | |
Gains/losses from divestments | | | 154 | | | | 53 | | | | 92 | | | | — | | | | — | | | | 299 | | | | 59 | | | | — | | | | 358 | |
| 1) | All segment sales are presented, but as Sony Ericsson and ST-Ericsson sales are accounted for in accordance with the equity method, their sales are eliminated in the Eliminations column. |
ERICSSON ANNUAL REPORT ON FORM 20-F 2012
Regions
| | | | | | | | | | | | | | | | | | | | | | | | |
| | |
| | | Net sales | | | Non-current assets3) | |
| | | 2012 | | | 2011 | | | 2010 | | | 2012 | | | 2011 | | | 2010 | |
North America | | | 56,749 | | | | 48,785 | | | | 49,473 | | | | 15,058 | | | | 6,296 | | | | 7,251 | |
Of which the United States | | | 56,698 | | | | 46,519 | | | | 46,104 | | | | 6,101 | | | | 6,020 | | | | 6,977 | |
Latin America | | | 22,006 | | | | 21,982 | | | | 17,882 | | | | 2,084 | | | | 2,268 | | | | 1,998 | |
Northern Europe & Central Asia1)2) | | | 11,345 | | | | 15,225 | | | | 12,171 | | | | 38,335 | | | | 41,008 | | | | 42,112 | |
Western & Central Europe2) | | | 17,478 | | | | 19,030 | | | | 19,868 | | | | 2,922 | | | | 5,097 | | | | 8,629 | |
Mediterranean | | | 23,299 | | | | 23,807 | | | | 22,628 | | | | 1,099 | | | | 1,395 | | | | 1,523 | |
Middle East | | | 15,556 | | | | 15,461 | | | | 15,099 | | | | 32 | | | | 42 | | | | 84 | |
Sub-Saharan Africa | | | 11,349 | | | | 10,163 | | | | 9,194 | | | | 119 | | | | 79 | | | | 51 | |
India | | | 6,460 | | | | 9,762 | | | | 8,626 | | | | 460 | | | | 355 | | | | 262 | |
North East Asia | | | 36,196 | | | | 38,209 | | | | 25,965 | | | | 3,371 | | | | 3,939 | | | | 3,795 | |
Of which China | | | 12,637 | | | | 17,546 | | | | 14,633 | | | | 1,399 | | | | 1,496 | | | | 1,013 | |
South East Asia & Oceania | | | 15,068 | | | | 13,870 | | | | 14,902 | | | | 301 | | | | 318 | | | | 351 | |
Other1)2) | | | 12,273 | | | | 10,627 | | | | 7,540 | | | | — | | | | — | | | | — | |
| | | | | | | | | | | | | | | | | | | | | | | | |
Total | | | 227,779 | | | | 226,921 | | | | 203,348 | | | | 63,781 | | | | 60,797 | | | | 66,056 | |
| | | | | | | | | | | | | | | | | | | | | | | | |
1) Of which Sweden | | | 5,033 | | | | 3,882 | | | | 4,237 | | | | 37,718 | | | | 40,415 | | | | 41,683 | |
2) Of which EU | | | 44,230 | | | | 43,960 | | | | 43,707 | | | | 41,546 | | | | 44,786 | | | | 46,563 | |
| 3) | Total non-current assets excluding financial instruments, deferred tax assets, and post-employementpost-employment benefit assets. |
For employee information, see Note C29,C28, “Information Regarding Membersregarding members of the Board of Directors, the ManagementGroup management and Employees”employees”.
OPERATING SEGMENTSC4 NET SALES
Net sales
| | | | | | | | | | | | | | | | | | | | | | |
2008 | | Networks | | | Professional
Services | | | Multi-
media1) | | | Sony
Ericsson | | | Total
Segments | | | Unallo-
cated | | Elimi-
nations2) | | Group | |
Segment sales | | 142,031 | | | 48,940 | | | 12,614 | | | 108,492 | | | 312,077 | | | — | | –108,492 | | 203,585 | |
Inter-segment sales | | 19 | | | 38 | | | 5,288 | | | 261 | | | 5,606 | | | — | | –261 | | 5,345 | |
| | | | | | | | | | | | | | | | | | | | | | |
Net sales | | 142,050 | | | 48,978 | | | 17,902 | | | 108,753 | | | 317,683 | | | — | | –108,753 | | 208,930 | |
| | | | | | | | | | | | | | | | | | | | | | |
Operating income | | 11,145 | | | 6,346 | | | –118 | | | –1,094 | | | 16,279 | | | –618 | | 591 | | 16,252 | |
| | | | | | | | | | | | | | | | | | | | | | |
Operating margin (%) | | 8 | % | | 13 | % | | –1 | % | | 0 | % | | 5 | % | | — | | — | | 8 | % |
Financial income | | | | | | | | | | | | | | | | | | | | | 3,458 | |
Financial expenses | | | | | | | | | | | | | | | | | | | | | –2,484 | |
| | | | | | | | | | | | | | | | | | | | | | |
Income after financial items | | | | | | | | | | | | | | | | | | | | | 17,226 | |
| | | | | | | | | | | | | | | | | | | | | | |
Taxes | | | | | | | | | | | | | | | | | | | | | –5,559 | |
| | | | | | | | | | | | | | | | | | | | | | |
Net income | | | | | | | | | | | | | | | | | | | | | 11,667 | |
| | | | | | | | | | | | | | | | | | | | | | |
Other segment items | | | | | | | | | | | | | | | | | | | | | | |
Share in earnings of joint ventures and associated companies | | –25 | | | 91 | | | 1 | | | -503 | | | –436 | | | — | | — | | –436 | |
Amortization | | –3,210 | | | –368 | | | –1,429 | | | –53 | | | –5,060 | | | 1 | | 53 | | –5,006 | |
Depreciation | | –2,347 | | | –532 | | | –228 | | | –1,138 | | | –4,245 | | | –1 | | 1,138 | | –3,108 | |
Impairment losses | | –547 | | | — | | | –19 | | | — | | | –566 | | | — | | — | | –566 | |
Reversals of impairment losses | | 6 | | | 1 | | | — | | | — | | | 7 | | | — | | — | | 7 | |
Restructuring expenses | | –5,131 | | | –1,272 | | | –337 | | | –1,692 | | | –8,432 | | | –20 | | 846 | | –7,606 | |
Gains/losses from divestments | | 9 | | | –16 | | | 992 | | | — | | | 985 | | | 113 | | — | | 1,098 | |
| | | | | | | | | | | | | | | | | | | | | | |
Total assets | | 131,127 | 3) | | 32,099 | 3) | | 20,891 | | | 48,837 | | | 232,954 | | | 94,873 | | –42,143 | | 285,684 | |
| | | | | | | | | | | | | | | | | | | | | | |
1) | Multimedia figures include the Mobile Platforms business which from 2009 is part of ST-Ericsson. |
2) | Sony Ericsson is accounted for in accordance with the equity method. The difference between what is reported to the CODM and externally is eliminated. |
3) | Amounts for 2007 and 2008 have been restated to be consistent with asset allocation method applied as from 2009. |
| | | | | | | | | | | | |
| | | 2012 | | | 2011 | | | 2010 | |
Sales of products and network rollout services | | | 154,068 | | | | 161,882 | | | | 140,222 | |
Of which: | | | | | | | | | | | | |
Delivery-type contracts | | | 154,068 | | | | 161,882 | | | | 140,156 | |
Construction-type contracts | | | — | | | | — | | | | 66 | |
Professional Services sales | | | 67,092 | | | | 58,834 | | | | 58,529 | |
License revenues | | | 6,619 | | | | 6,205 | | | | 4,597 | |
| | | | | | | | | | | | |
Net sales | | | 227,779 | | | | 226,921 | | | | 203,348 | |
Export sales from Sweden | | | 106,997 | | | | 116,507 | | | | 100,070 | |
| | | | | | | | | | | | |
ERICSSON ANNUAL REPORT ON FORM 20-F 20092012
NOTES TO THE CONSOLIDATED FINANCIAL STATEMENTS—(Continued)
GEOGRAPHICAL AREAS
| | | | |
2008 | | Net sales | | Non-current
assets1) |
Western Europe | | 51,570 | | 53,019 |
—of which Sweden | | 8,876 | | 46,458 |
Central and Eastern Europe, Middle East and Africa | | 53,080 | | 1,178 |
Asia Pacific | | 63,307 | | 1,436 |
—of which China | | 15,068 | | 688 |
—of which India | | 15,176 | | 156 |
North America | | 17,925 | | 8,917 |
—of which United States | | 14,132 | | 8,829 |
Latin America | | 23,048 | | 1,676 |
| | | | |
Total | | 208,930 | | 66,226 |
—of which EU | | 57,601 | | 52,945 |
| | | | |
1) | Total non-current assets excluding financial instruments, deferred tax assets, and post-employement benefit assets. |
For employee information, see Note C29, “Information Regarding Members of the Board of Directors, the Management and Employees”.
OPERATING SEGMENTS
| | | | | | | | | | | | | | | | | | | | | | |
2007 | | Networks | | | Professional
Services | | | Multi-
media1,2) | | | Sony
Ericsson | | | Total
Segments | | | Unallo-
cated | | Elimi-
nations3) | | Group | |
Segment sales | | 128,985 | | | 42,892 | | | 11,997 | | | 119,068 | | | 302,942 | | | — | | –119,068 | | 183,874 | |
Inter-segment sales | | 32 | | | 10 | | | 3,908 | | | 333 | | | 4,283 | | | — | | –377 | | 3,906 | |
| | | | | | | | | | | | | | | | | | | | | | |
Net sales | | 129,017 | | | 42,902 | | | 15,905 | | | 119,401 | | | 307,225 | | | — | | –119,445 | | 187,780 | |
| | | | | | | | | | | | | | | | | | | | | | |
Operating income | | 17,398 | | | 6,394 | | | –135 | | | 14,270 | | | 37,927 | | | –119 | | –7,162 | | 30,646 | |
| | | | | | | | | | | | | | | | | | | | | | |
Operating margin (%) | | 13 | % | | 15 | % | | –1 | % | | 12 | % | | 12 | % | | — | | — | | 16 | % |
Financial income | | | | | | | | | | | | | | | | | | | | | 1,778 | |
Financial expenses | | | | | | | | | | | | | | | | | | | | | –1,695 | |
| | | | | | | | | | | | | | | | | | | | | | |
Income after financial items | | | | | | | | | | | | | | | | | | | | | 30,729 | |
| | | | | | | | | | | | | | | | | | | | | | |
Taxes | | | | | | | | | | | | | | | | | | | | | –8,594 | |
| | | | | | | | | | | | | | | | | | | | | | |
Net income | | | | | | | | | | | | | | | | | | | | | 22,135 | |
| | | | | | | | | | | | | | | | | | | | | | |
Other segment items | | | | | | | | | | | | | | | | | | | | | | |
Share in earnings of joint ventures and associated companies | | 61 | | | 66 | | | –3 | | | 7,108 | | | 7232 | | | — | | — | | 7,232 | |
Amortization | | –4,630 | | | –237 | | | –566 | | | — | | | –5,433 | | | — | | — | | –5,433 | |
Depreciation | | –2,601 | | | –367 | | | –152 | | | –1,052 | | | –4,172 | | | –1 | | 1,052 | | –3,121 | |
Impairment losses | | –105 | | | –1 | | | — | | | — | | | –106 | | | — | | — | | –106 | |
Reversals of impairment losses | | 297 | | | — | | | — | | | — | | | 297 | | | — | | — | | 297 | |
Gains/losses from divestments | | — | | | — | | | — | | | — | | | — | | | 280 | | — | | 280 | |
| | | | | | | | | | | | | | | | | | | | | | |
Total assets | | 117,863 | 4) | | 28,078 | 4) | | 18,945 | | | 50,832 | | | 215,718 | | | 70,682 | | –41,283 | | 245,117 | |
| | | | | | | | | | | | | | | | | | | | | | |
1) | Multimedia figures include the Enterprise PBX business which was divested in 2008. |
2) | Multimedia figures include the Mobile Platforms business which from 2009 is part of ST-Ericsson |
3) | Sony Ericsson is accounted for in accordance with the equity method. The difference between what is reported to the CODM and externally is eliminated. |
4) | Amounts for 2007 and 2008 have been restated to be consistent with asset allocation method applied as from 2009. |
ERICSSON ANNUAL REPORT ON FORM 20-F 2009
NOTES TO THE CONSOLIDATED FINANCIAL STATEMENTS—(Continued)
GEOGRAPHICAL AREAS
| | | | |
2007 | | Net sales | | Non-current
assets1) |
Western Europe | | 52,685 | | 57,537 |
—of which Sweden | | 8,395 | | 49,283 |
Central and Eastern Europe, Middle East and Africa | | 48,661 | | 1,158 |
Asia Pacific | | 54,629 | | 1,313 |
—of which China | | 13,598 | | 618 |
—of which India | | 10,517 | | 124 |
North America | | 13,422 | | 8,794 |
—of which United States | | 10,529 | | 8,668 |
Latin America | | 18,383 | | 1,846 |
| | | | |
Total | | 187,780 | | 70,648 |
—of which EU | | 58,978 | | 57,148 |
| | | | |
1) | Total non-current assets excluding financial instruments, deferred tax assets, and post-employement benefit assets. |
For employee information, see Note C29, “Information Regarding Members of the Board of Directors, the Management and Employees”.
C4 NET SALES
| | | | | | |
| | | 2009 | | 2008 | | 2007 |
Sales of products and network rollout services | | 145,873 | | 150,846 | | 138,011 |
Of which: | | | | | | |
—Delivery-type contracts | | 144,908 | | 148,358 | | 130,890 |
—Construction-type contracts | | 965 | | 2,488 | | 7,121 |
Professional Services sales | | 56,123 | | 48,978 | | 42,892 |
License revenues1) | | 4,481 | | 9,106 | | 6,877 |
| | | | | | |
Net sales | | 206,477 | | 208,930 | | 187,780 |
Export sales from Sweden | | 94,829 | | 109,254 | | 102,486 |
| | | | | | |
1) | The ST-Ericsson joint venture was formed in February 2009, figures for 2007 and 2008 include licenses revenues from Mobile Platforms. |
ERICSSON ANNUAL REPORT ON FORM 20-F 2009
NOTES TO THE CONSOLIDATED FINANCIAL STATEMENTS—(Continued)
C5 EXPENSES BY NATURE
Expenses by nature
| | | | 2009 | | 2008 | | 2007 | | 2012 | | | 2011 | | | 2010 | |
Goods and services | | 124,627 | | 138,298 | | 113,195 | | | 137,769 | | | | 142,221 | | | | 130,725 | |
Employee remuneration | | | | 64,100 | | | | 58,905 | | | | 57,183 | |
Amortization and depreciation | | 7,759 | | 8,114 | | 8,554 | | | 9,546 | | | | 8,964 | | | | 8,962 | |
Impairments and obsolescence allowances, net of reversals | | 5,637 | | 2,680 | | 1,435 | | | 1,999 | | | | 1,363 | | | | 966 | |
Employee remunerations | | 54,877 | | 51,297 | | 44,771 | |
Interest expenses | | 1,549 | | 2,484 | | 1,695 | |
Financial expenses | | | | 1,984 | | | | 2,661 | | | | 1,719 | |
Taxes | | 2,116 | | 5,559 | | 8,594 | | | 4,244 | | | | 5,552 | | | | 4,548 | |
Expenses incurred | | | | 219,642 | | | | 219,666 | | | | 204,103 | |
| | | | | | | | | | | | | | | |
Expenses incurred | | 196,565 | | 208,432 | | 178,244 | |
Less: | | | | | | | |
Inventory changes1) | | –4,784 | | 3,761 | | 802 | | | –2,782 | | | | 3,417 | | | | 8,465 | |
Additions to Capitalized development | | 1,443 | | 1,409 | | 1,053 | | | 1,641 | | | | 1,515 | | | | 1,647 | |
| | | | | | | | | | | | | | | |
Expenses charged to the Income Statement | | 199,906 | | 203,262 | | 176,389 | | | 220,783 | | | | 214,734 | | | | 193,991 | |
| | | | | | | | | | | | | | | |
| 1) | The inventory changes are based on changes of gross inventory values prior to obsolescence allowances. |
The increase in impairments and obsolescence allowances, net of reversals, is mainly due to restructuring-related impairments of intangible assets, somewhat offset by decreased obsolescence allowances for inventories as well as decreased impairments of trade receivables and capitalized development expenses.
TheTotal restructuring charges relate to activities to reduce production cost, reduce product variants and platforms, increase the re-use of software, consolidate R&D activities, and improve administrative processes. In the product portfolio reviews, opportunities to reduce the number of platforms and solutionsin 2012 were identified, resulting in write-downs of capitalized development costs and acquired IPR assets for the affected products.SEK 3.4 (3.2) b.
For 2009, restructuring charges amounted to SEK 11.3 billion. Restructuring charges are included in the expenses presented above.
Restructuring charges by function
| | | | 2009 | | 2008 | | 2007 | | 2012 | | | 2011 | | | 2010 | |
Cost of sales | | 4,180 | | 2,540 | | — | | | 2,225 | | | | 1,231 | | | | 3,354 | |
R&D expenses | | 6,045 | | 2,648 | | — | | | 852 | | | | 561 | | | | 1,682 | |
Selling and administrative expenses | | 1,034 | | 1,572 | | — | | | 370 | | | | 1,392 | | | | 1,778 | |
| | | | | | | | | | | | | | | |
Total restructuring charges | | 11,259 | | 6,760 | | — | | | 3,447 | | | | 3,184 | | | | 6,814 | |
| | | | | | | | | | | | | | | |
C6 OTHER OPERATING INCOME AND EXPENSES
Other operating income and expenses
| | | | | | | | | | | | |
| | | 2012 | | | 2011 | | | 2010 | |
Gains on sales of intangible assets and PP&E | | | 12 | | | | 65 | | | | 301 | |
Losses on sales of intangible assets and PP&E | | | –261 | | | | –64 | | | | –422 | |
Gains on sales of investments and operations | | | 8,462 | 1) | | | 210 | | | | 577 | |
Losses on sales of investments and operations | | | –126 | | | | –52 | | | | –219 | |
| | | | | | | | | | | | |
Capital gains/losses, net | | | 8,087 | | | | 159 | | | | 237 | |
| | | | | | | | | | | | |
Other operating revenues | | | 878 | | | | 1,119 | | | | 1,766 | |
| | | | | | | | | | | | |
Total other operating income and expenses | | | 8,965 | | | | 1,278 | | | | 2,003 | |
| | | | | | | | | | | | |
| 1) | Includes a gain from the divestment of Sony Ericsson of SEK 7.7 billion. |
ERICSSON ANNUAL REPORT ON FORM 20-F 20092012
NOTES TO THE CONSOLIDATED FINANCIAL STATEMENTS—(Continued)
C6 OTHER OPERATING INCOME AND EXPENSES
| | | | | | |
| | | 2009 | | 2008 | | 2007 |
Gains on sales of intangible assets and PP&E | | 193 | | 302 | | 78 |
Losses on sales of intangible assets and PP&E | | –126 | | –190 | | –104 |
Gains on sales of investments and operations | | 962 | | 1,236 | | 296 |
Losses on sales of investments and operations | | –119 | | –138 | | –16 |
| | | | | | |
Capital gains/losses, net | | 910 | | 1,210 | | 254 |
| | | | | | |
Other operating revenues | | 2,172 | | 1,767 | | 1,480 |
| | | | | | |
Total other operating income and expenses | | 3,082 | | 2,977 | | 1,734 |
| | | | | | |
C7 FINANCIAL INCOME AND EXPENSES
Financial income and expenses
| | | | 2009 | | 2008 | | 2007 | | 2012 | | | 2011 | | | 2010 | |
| | | Financial
income | | Financial
expenses | | Financial
income | | Financial
expenses | | Financial
income | | Financial
expenses | | Financial
income | | | Financial
expenses | | | Financial
income | | | Financial
expenses | | | Financial
income | | | Financial
expenses | |
Contractual interest on financial assets | | 1,287 | | | | 2,938 | | | | 2,293 | | | | | 1,685 | | | | — | | | | 1,940 | | | | — | | | | 811 | | | | — | |
Of which on financial assets at fair value through profit or loss | | 814 | | | | 2,282 | | | | 1,094 | | | | | 1,308 | | | | — | | | | 1,381 | | | | — | | | | 304 | | | | — | |
Contractual interest on financial liabilities | | | | –1,616 | | | | –2,023 | | | | –1,543 | | | — | | | | –1,734 | | | | — | | | | –1,706 | | | | — | | | | –1,315 | |
Of which on financial liabilities at fair value through profit or loss | | | | — | | | | — | | | | — | |
Net gain/loss on: | | | | | | | | | | | | | | | | | | | | | | | | |
Instruments at fair value through profit or loss1) | | 635 | | 155 | | 322 | | 280 | | –181 | | –60 | | | 142 | | | | 54 | | | | 1,062 | | | | –591 | | | | 295 | | | | –206 | |
Of which included in fair value hedge relationships | | | | 155 | | — | | –32 | | — | | –7 | | | — | | | | –129 | | | | — | | | | –175 | | | | — | | | | 151 | |
Available for sale | | — | | — | | — | | — | | — | | — | |
Loans and receivables | | –53 | | | | 191 | | — | | –342 | | — | | | –127 | | | | — | | | | –132 | | | | — | | | | –68 | | | | — | |
Liabilities at amortized cost | | | | –2 | | — | | –656 | | — | | 11 | | | — | | | | –133 | | | | — | | | | –105 | | | | — | | | | –4 | |
Other financial income and expenses | | 5 | | –86 | | 7 | | –85 | | 8 | | –103 | | | 8 | | | | –171 | | | | 12 | | | | –259 | | | | 9 | | | | –194 | |
| | | | | | | | | | | | | | | | | | | | | | | | | | | | | | |
Total | | 1,874 | | –1,549 | | 3,458 | | –2,484 | | 1,778 | | –1,695 | | | 1,708 | | | | –1,984 | | | | 2,882 | | | | –2,661 | | | | 1,047 | | | | –1,719 | |
| | | | | | | | | | | | | | | | | | | | | | | | | | | | | | |
| 1) | Excluding net gain from operating assets and liabilities, SEK 2,2471,299 million (net lossgain of SEK 4,23451 million in 2008, net loss of2011, SEK 7621,528 million in 2007)2010), reported as Cost of Sales.sales. |
ERICSSON ANNUAL REPORT ON FORM 20-F 2009
NOTES TO THE CONSOLIDATED FINANCIAL STATEMENTS—(Continued)
C8 TAXES
The Company’s tax expense for the year2012 was SEK 2,116 (5,559)–4,244 (–5,552) million or 33.9 (32.3) percent41.7% (30.6%) of the income after financial items, mainly due to a loweritems. The tax rate from the loss making joint venture companies.may vary between years depending on business and geographical mix. The effective tax rate excluding joint ventures and associated companies as well as the gain due to the divestment of Sony Ericsson was 25.7 percent.30.5% (26.4%). The corporate tax in Sweden was reduced from 26.3% to 22.0% from January 1, 2013. This resulted in a reduction of deferred tax assets and an increase of tax expense of SEK –0.5 billion.
Income taxes recognized in the income statement
The following items are included in taxes:
| | | | 2009 | | 2008 | | 2007 | | 2012 | | | 2011 | | | 2010 | |
Current income taxes for the year | | –4,605 | | –5,574 | | –4,115 | | | –5,795 | | | | –4,642 | | | | –4,635 | |
Current income taxes related to previous years | | 441 | | 167 | | –294 | |
Deferred tax income/expense (–) | | 661 | | –297 | | –2,227 | |
Current income taxes related to prior years | | | | –241 | | | | 283 | | | | –35 | |
Deferred tax income/expense (+/–) | | | | 1,697 | | | | –1,433 | | | | 307 | |
| | | | | | | | | | | | | | | |
Sub total | | –3,503 | | –5,704 | | –6,636 | | | –4,339 | | | | –5,792 | | | | –4,363 | |
Share of taxes in joint ventures and associated companies | | 1,387 | | 145 | | –1,958 | | | 95 | | | | 240 | | | | –185 | |
| | | | | | | | | | | | | | | |
Taxes | | –2,116 | | –5,559 | | –8,594 | |
Tax expense | | | | –4,244 | | | | –5,552 | | | | –4,548 | |
| | | | | | | | | | | | | | | |
ERICSSON ANNUAL REPORT ON FORM 20-F 2012
A reconciliation between actualreported tax expense for the year and the theoretical tax expense that would arise when applying statutory tax rate in Sweden, 26.3 percent,26.3%, on the consolidated income before taxes, is shown in the table below.
RECONCILIATION OF SWEDISH INCOME TAX TO THE ACTUAL INCOME TAXReconciliation of Swedish income tax rate with effective tax rate
| | | | | | |
| | | 2009 | | 2008 | | 2007 |
Tax rate in Sweden (26.3 %) | | –1,643 | | –4,823 | | –8,604 |
Effect of foreign tax rates | | –812 | | 22 | | 62 |
Of which joint ventures and associated companies | | –550 | | 1 | | 63 |
Current income taxes related to previous years | | 441 | | 167 | | –294 |
Recognition/remeasurement of tax losses related to previous years | | 8 | | –169 | | –204 |
Recognition/remeasurement of deductible temporary differences related to previous years | | 267 | | 62 | | 472 |
Tax effect of non-deductible expenses | | –1,155 | | –986 | | –810 |
Tax effect of non-taxable income | | 630 | | 327 | | 853 |
Tax effect of changes in tax rates | | 148 | | –159 | | –69 |
| | | | | | |
Taxes | | –2,116 | | –5,559 | | –8,594 |
| | | | | | |
ERICSSON ANNUAL REPORT ON FORM 20-F 2009
| | | | | | | | | | | | |
| | | 2012 | | | 2011 | | | 2010 | |
Expected tax expense at Swedish tax rate 26.3% | | | –2,678 | | | | –4,767 | | | | –4,150 | |
Effect of foreign tax rates | | | –581 | | | | –1,126 | | | | –405 | |
Of which joint ventures and associated companies | | | –778 | | | | –754 | | | | –467 | |
Current income taxes related to prior years | | | –241 | | | | 283 | | | | –35 | |
Remeasurement of tax loss carry-forwards | | | 134 | | | | 224 | | | | –257 | |
Remeasurement of deductible temporary differences | | | 468 | | | | 81 | | | | 172 | |
Tax effect of non-deductible expenses | | | –3,430 | | | | –768 | | | | –830 | |
Tax effect of non-taxable income | | | 2,573 | | | | 521 | | | | 880 | |
Tax effect of changes in tax rates | | | –489 | | | | — | | | | 77 | |
| | | | | | | | | | | | |
Tax expense | | | –4,244 | | | | –5,552 | | | | –4,548 | |
| | | | | | | | | | | | |
Effective tax rate | | | 41.7 | % | | | 30.6 | % | | | 28.8 | % |
NOTES TO THE CONSOLIDATED FINANCIAL STATEMENTS—(Continued)
Deferred tax balances
Deferred tax assets and liabilities are derived from the balance sheet items as shown in the table below.
Tax effects of temporary differences and tax loss carryforwards are attributable as shown in the table below:
TAX EFFECTS OF TEMPORARY DIFFERENCES AND TAX LOSS CARRYFORWARDScarry-forwards
| | | | | | | | | | | | | | |
| | | 2009 | | 2008 |
| | | Deferred tax
assets | | Deferred tax
liabilities | | | Net balance | | Deferred tax
assets | | Deferred tax
liabilities | | | Net balance |
Intangible assets and property, plant and equipment | | 359 | | 2,264 | | | | | 313 | | 4,081 | | | |
Current assets | | 2,481 | | 53 | | | | | 2,056 | | 80 | | | |
Post-employment benefits | | 852 | | 472 | | | | | 1,054 | | 138 | | | |
Provisions | | 2,240 | | — | | | | | 2,473 | | — | | | |
Equity | | 1,901 | | — | | | | | 2,941 | | — | | | |
Other | | 4,343 | | 1,291 | 1) | | | | 3,743 | | 897 | 1) | | |
Loss carryforwards | | 3,961 | | — | | | | | 4,736 | | — | | | |
| | | | | | | | | | | | | | |
Deferred tax assets/liabilities | | 16,137 | | 4,080 | | | | | 17,316 | | 5,196 | | | |
Netting of assets/liabilities | | –1,810 | | –1,810 | | | | | –2,458 | | –2,458 | | | |
| | | | | | | | | | | | | | |
Net deferred tax balances | | 14,327 | | 2,270 | | | 12,057 | | 14,858 | | 2,738 | | | 12,120 |
| | | | | | | | | | | | | | |
1) | Referring mainly to R&D credits and intellectual property rights. |
| | | | | | | | | | | | | | | | | | | | | | | | |
| | | 2012 | | | 2011 | |
| | | Deferred
tax assets | | | Deferred
tax liabilities | | | Net balance | | | Deferred
tax assets | | | Deferred
tax liabilities | | | Net balance | |
Intangible assets and property, plant and equipment | | | 941 | | | | 4,579 | | | | | | | | 968 | | | | 2,941 | | | | | |
Current assets | | | 2,388 | | | | 293 | | | | | | | | 3,193 | | | | 100 | | | | | |
Post-employment benefits | | | 2,600 | | | | 614 | | | | | | | | 2,233 | | | | 618 | | | | | |
Provisions | | | 1,512 | | | | 48 | | | | | | | | 1,441 | | | | 23 | | | | | |
Other | | | 3,487 | | | | 432 | | | | | | | | 3,423 | | | | 64 | | | | | |
Loss carry-forwards | | | 4,239 | | | | — | | | | | | | | 3,258 | | | | — | | | | | |
| | | | | | | | | | | | | | | | | | | | | | | | |
Deferred tax assets/liabilities | | | 15,167 | | | | 5,966 | | | | 9,201 | | | | 14,516 | | | | 3,746 | | | | 10,770 | |
Netting of assets/liabilities | | | –2,846 | | | | –2,846 | | | | | | | | –1,496 | | | | –1,496 | | | | | |
| | | | | | | | | | | | | | | | | | | | | | | | |
Deferred tax balances, net | | | 12,321 | | | | 3,120 | | | | 9,201 | | | | 13,020 | | | | 2,250 | | | | 10,770 | |
| | | | | | | | | | | | | | | | | | | | | | | | |
CHANGES IN DEFERRED TAXESChanges in deferred taxes, net
| | | | 2009 | | 2008 | | 2012 | | | 2011 | |
Opening balance, net | | 12,120 | | 8,891 | | | 10,770 | | | | 10,166 | |
Recognized in income statement | | 661 | | –296 | |
Recognized in OCI | | –1,040 | | 2,330 | |
Recognized in net income | | | | 1,697 | | | | –1,433 | |
Recognized in Other comprehensive income | | | | –422 | | | | 2,158 | |
Acquisitions/disposals of subsidiaries | | 186 | | 861 | | | –2,309 | | | | 53 | |
Translation differences | | 130 | | 334 | |
Currency translation differences | | | | –535 | | | | –174 | |
| | | | | | | | | | |
Closing balance, net | | 12,057 | | 12,120 | | | 9,201 | | | | 10,770 | |
| | | | | | | | | | |
ERICSSON ANNUAL REPORT ON FORM 20-F 2012
Tax effects reported directly in Other Comprehensive Incomecomprehensive income amount to SEK –1,040 (2,330)–422 (2,158) million, of which actuarial gains and losses related to pensions SEK 173 (931)–57 (1,809) million, cash flow hedges SEK –1,059 (1,225)–363 (350) million and changesdeferred tax on gains/losses on hedges on investments in cumulative translations adjustmentsforeign entities SEK –154 (174)–2 (–1) million.
Deferred tax assets are only recognized in countries where the Company expects to be able to generate corresponding taxable income in the future to benefit from tax reductions.
Significant tax loss carryforwardscarry-forwards are related to countries with long or indefinite periods of utilization, mainly Sweden and the US.Germany. Of the total SEK 4,239 million recognized deferred tax assets forrelated to tax loss carryforwards,carry-forwards, SEK 3,9612,840 million SEK 2,420 million relaterelates to Sweden with indefinite timeperiods of utilization. Due to the Company’s strong current financial position and taxable income during 2009,2012, Ericsson has been able to utilize part of its tax loss carryforwardscarry-forwards during the year. The assessment is that Ericsson will be able to generate sufficient income in the coming years to also utilize the remaining parts.
part of the recognized amounts.ERICSSON ANNUAL REPORT ON FORM 20-F 2009
NOTES TO THE CONSOLIDATED FINANCIAL STATEMENTS—(Continued)
Investments in subsidiaries
Due to losses in certain subsidiary companies, the book value of certain investments in those subsidiaries are less than the tax value of these investments. Since deferredDeferred tax assets have been reportedfor ST-Ericsson are not included, as they are recognized in accordance with respect also to losses in these companies, and due to the uncertainty as to which deductions can be realized in the future, no additional deferred tax assets are reported.equity method.
Tax loss carryforwardscarry-forwards
Deferred tax assets regarding tax loss carryforwardscarry-forwards are reported to the extent that realization of the related tax benefit through future taxable profits is probable also when considering the period during which these can be utilized, as described below. Tax loss carryforwards for Sony Ericsson and ST-Ericsson are not included, as they are accounted for in accordance with the equity method.
AtAs of December 31, 2009,2012, the availablerecognized tax loss carryforwardscarry-forwards amounted to SEK 14,493 (16,327)17,081 (12,657) million. The tax effectvalue of these tax loss carryforwards arecarry-forwards is reported as an asset.
The final years in which thesethe recognized loss carryforwardscarry-forwards can be utilized are shown in the following table:table.
| | | | |
Year of expiration | | Tax loss
carryforwards | | Tax
effect |
2010 | | 28 | | 7 |
2011 | | 41 | | 8 |
2012 | | 101 | | 20 |
2013 | | 256 | | 55 |
2014 | | 379 | | 96 |
2015 or later | | 13,688 | | 3,775 |
| | | | |
Total | | 14,493 | | 3,961 |
| | | | |
C9 EARNINGS PER SHARETax loss carry-forwards year of expiration
| | | | | | |
| | | 2009 | | 2008 | | 20071) |
| Basic | | | | | | |
Net income attributable to stockholders of the Parent Company (SEK million) | | 3,672 | | 11,273 | | 21,836 |
Average number of shares outstanding, basic (millions) | | 3,190 | | 3,183 | | 3,178 |
| | | | | | |
Earnings per share, basic (SEK) | | 1.15 | | 3.54 | | 6.87 |
| | | |
| Diluted | | | | | | |
Net income attributable to stockholders of the Parent Company (SEK million) | | 3,672 | | 11,273 | | 21,836 |
Average number of shares outstanding, basic (millions) | | 3,190 | | 3,183 | | 3,178 |
Dilutive effect for stock option plans | | — | | 1 | | 2 |
Dilutive effect for stock purchase plans | | 22 | | 18 | | 13 |
Average number of shares outstanding, diluted (millions) | | 3,212 | | 3,202 | | 3,193 |
Earnings per share, diluted (SEK) | | 1.14 | | 3.52 | | 6.84 |
| | | | | | |
| | | | | | | | |
Year of expiration | | Tax loss
carry-forwards | | | Tax
value | |
2013 | | | 19 | | | | 5 | |
2014 | | | 8 | | | | 2 | |
2015 | | | 43 | | | | 13 | |
2016 | | | 54 | | | | 16 | |
2017 | | | 327 | | | | 78 | |
2018 or later | | | 16,630 | | | | 4,125 | |
| | | | | | | | |
Total | | | 17,081 | | | | 4,239 | |
| | | | | | | | |
Tax loss carry-forwards of ST-Ericsson are not included as they are recognized in accordance with the equity method.
1) | A reverse split 1:5 was made in June 2008. Comparative figures are restated accordingly. |
In addition to the table above there are loss carry-forwards of SEK 4,737 million at a tax value of SEK 1,432 million that have not been recognized due to judgments of the possibility to be used against future taxable profits in the respective jurisdictions. The majority of these loss carry-forwards have an expiration date in excess of five years.
ERICSSON ANNUAL REPORT ON FORM 20-F 20092012
NOTES TO THE CONSOLIDATED FINANCIAL STATEMENTS—(Continued)
C9 EARNINGS PER SHARE
C10 INTANGIBLE ASSETSEarnings per share 2010–2012
| | | | | | | | | | | | | | | | |
| | | Capitalized development expenses | | Goodwill | | Intellectual property rights (IPR),
trade-marks and other
intangible assets |
2009 | | To be
marketed | | For internal use | | Total | | | Trademarks
and similar
rights | | Patents
and
acquired
R&D | | Total |
| | | Acquired
costs | | Internal
costs | | | | | |
Accumulated acquisition costs | | | | | | | | | | | | | | | | |
Opening balance | | 5,518 | | 1,821 | | 1,217 | | 8,556 | | 24,877 | | 9,429 | | 20,450 | | 29,879 |
Acquisitions/capitalization | | 1,045 | | 239 | | 159 | | 1,443 | | — | | 602 | | 2 | | 604 |
Balances regarding divested/acquired businesses1) | | — | | — | | — | | — | | 3,534 | | 811 | | 5,021 | | 5,832 |
Sales/disposals | | — | | — | | — | | — | | –21 | | –142 | | — | | –142 |
Contribution to joint ventures | | –1,342 | | — | | — | | –1,342 | | — | | — | | — | | — |
Translation difference | | — | | — | | — | | — | | –1,015 | | –76 | | –575 | | –651 |
| | | | | | | | | | | | | | | | |
Closing balance | | 5,221 | | 2,060 | | 1,376 | | 8,657 | | 27,375 | | 10,624 | | 24,898 | | 35,522 |
| | | | | | | | | | | | | | | | |
Accumulated amortization | | | | | | | | | | | | | | | | |
Opening balance | | –1,570 | | –1,562 | | –1,042 | | –4,174 | | — | | –2,425 | | –6,853 | | –9,278 |
Amortization | | –534 | | –68 | | –45 | | –647 | | — | | –360 | | –3,202 | | –3,562 |
Sales/disposals | | — | | — | | — | | — | | — | | 131 | | — | | 131 |
Translation difference | | — | | — | | — | | — | | — | | 15 | | 180 | | 195 |
| | | | | | | | | | | | | | | | |
Closing balance | | –2,104 | | –1,630 | | –1,087 | | –4,821 | | — | | –2,639 | | –9,875 | | –12,514 |
| | | | | | | | | | | | | | | | |
Accumulated impairment losses | | | | | | | | | | | | | | | | |
Opening balance | | –1,508 | | –55 | | –37 | | –1,600 | | — | | — | | –14 | | –14 |
Impairment losses2) | | –157 | | — | | — | | –157 | | — | | — | | –4,255 | | –4,255 |
| | | | | | | | | | | | | | | | |
Closing balance | | –1,665 | | –55 | | –37 | | –1,757 | | — | | — | | –4,269 | | –4,269 |
| | | | | | | | | | | | | | | | |
Net carrying value | | 1,452 | | 375 | | 252 | | 2,079 | | 27,375 | | 7,985 | | 10,754 | | 18,739 |
| | | | | | | | | | | | | | | | |
| | | | | | | | | | | | |
| | | 2012 | | | 2011 | | | 2010 | |
Basic | | | | | | | | | | | | |
Net income attributable to stockholders of the Parent Company (SEK million) | | | 5,775 | | | | 12,194 | | | | 11,146 | |
Average number of shares outstanding, basic (millions) | | | 3,216 | | | | 3,206 | | | | 3,197 | |
Earnings per share, basic (SEK) | | | 1.80 | | | | 3.80 | | | | 3.49 | |
| | | | | | | | | | | | |
| | | |
Diluted | | | | | | | | | | | | |
Net income attributable to stockholders of the Parent Company (SEK million) | | | 5,775 | | | | 12,194 | | | | 11,146 | |
Average number of shares outstanding, basic (millions) | | | 3,216 | | | | 3,206 | | | | 3,197 | |
Dilutive effect for stock purchase plans | | | 31 | | | | 27 | | | | 29 | |
Average number of shares outstanding, diluted (millions) | | | 3,247 | | | | 3,233 | | | | 3,226 | |
Earnings per share, diluted (SEK) | | | 1.78 | | | | 3.77 | | | | 3.46 | |
| | | | | | | | | | | | |
C10 INTANGIBLE ASSETS
Intangible assets 2012
| | | | | | | | | | | | | | | | | | | | | | | | | | | | | | | | |
| | | Capitalized development expenses | | | Goodwill | | | Intellectual property rights (IPR),
trademarks and other
intangible assets | |
| | | To be
marketed | | | For internal use | | | Total | | | Total | | | Trademarks,
customer
relationships
and similar
rights | | | Patents
and
acquired
R&D | | | Total | |
| | | | Acquired
costs | | | Internal
costs | | | | | | |
Cost | | | | | | | | | | | | | | | | | | | | | | | | | | | | | | | | |
Opening balance | | | 8,125 | | | | 2,213 | | | | 1,478 | | | | 11,816 | | | | 27,455 | | | | 14,188 | | | | 25,689 | | | | 39,877 | |
Acquisitions/capitalization | | | 1,641 | | | | — | | | | — | | | | 1,641 | | | | — | | | | 538 | | | | 103 | | | | 641 | |
Balances regarding acquired businesses1) | | | — | | | | — | | | | — | | | | — | | | | 4,293 | | | | 4,517 | | | | 2,155 | | | | 6,672 | |
Sales/disposals | | | — | | | | — | | | | — | | | | — | | | | –20 | | | | –158 | | | | –137 | | | | –295 | |
Reclassification | | | — | | | | — | | | | — | | | | — | | | | 94 | | | | — | | | | –94 | | | | –94 | |
Translation difference | | | — | | | | — | | | | — | | | | — | | | | –1,400 | | | | –490 | | | | –300 | | | | –790 | |
| | | | | | | | | | | | | | | | | | | | | | | | | | | | | | | | |
Closing balance | | | 9,766 | | | | 2,213 | | | | 1,478 | | | | 13,457 | | | | 30,422 | | | | 18,595 | | | | 27,416 | | | | 46,011 | |
| | | | | | | | | | | | | | | | | | | | | | | | | | | | | | | | |
Accumulated amortization | | | | | | | | | | | | | | | | | | | | | | | | | | | | | | | | |
Opening balance | | | –3,187 | | | | –1,975 | | | | –1,318 | | | | –6,480 | | | | 1 | | | | –5,502 | | | | –16,078 | | | | –21,580 | |
Amortization | | | –840 | | | | –131 | | | | –87 | | | | –1,058 | | | | — | | | | –2,023 | | | | –2,413 | | | | –4,436 | |
Sales/disposals | | | — | | | | — | | | | — | | | | — | | | | –1 | | | | 46 | | | | 124 | | | | 170 | |
Translation difference | | | — | | | | — | | | | — | | | | — | | | | — | | | | 202 | | | | 166 | | | | 368 | |
| | | | | | | | | | | | | | | | | | | | | | | | | | | | | | | | |
Closing balance | | | –4,027 | | | | –2,106 | | | | –1,405 | | | | –7,538 | | | | — | | | | –7,277 | | | | –18,201 | | | | –25,478 | |
| | | | | | | | | | | | | | | | | | | | | | | | | | | | | | | | |
Accumulated impairment losses | | | | | | | | | | | | | | | | | | | | | | | | | | | | | | | | |
Opening balance | | | –1,721 | | | | –55 | | | | –37 | | | | –1,813 | | | | –18 | | | | — | | | | –5,214 | | | | –5,214 | |
Impairment losses | | | –266 | | | | — | | | | — | | | | –266 | | | | — | | | | — | | | | –117 | | | | –117 | |
| | | | | | | | | | | | | | | | | | | | | | | | | | | | | | | | |
Closing balance | | | –1,987 | | | | –55 | | | | –37 | | | | –2,079 | | | | –18 | | | | — | | | | –5,331 | | | | –5,331 | |
| | | | | | | | | | | | | | | | | | | | | | | | | | | | | | | | |
Net carrying value | | | 3,752 | | | | 52 | | | | 36 | | | | 3,840 | | | | 30,404 | | | | 11,318 | | | | 3,884 | | | | 15,202 | |
| | | | | | | | | | | | | | | | | | | | | | | | | | | | | | | | |
| 1) | During 2009, EricssonFor more information on acquired Nortel SEK 8.7 billion.businesses, see Note C26, “Business combinations”. |
2) | The write-down (impairment charge) of SEK 4.255 billion is a consequence of the restructuring program decision to phase out certain products. |
ERICSSON ANNUAL REPORT ON FORM 20-F 2012
Intangible assets 2011
| | | | | | | | | | | | | | | | | | | | | | | | | | | | | | | | |
| | | Capitalized development expenses | | | Goodwill | | | Intellectual property rights (IPR),
trademarks and other intangible
assets | |
| | | To be
marketed | | | For internal use | | | Total | | | Total | | | Trademarks,
customer
relationships
and similar
rights | | | Patents
and
acquired
R&D | | | Total | |
| | | | Acquired
costs | | | Internal
costs | | | | | | |
Cost | | | | | | | | | | | | | | | | | | | | | | | | | | | | | | | | |
Opening balance | | | 6,610 | | | | 2,213 | | | | 1,478 | | | | 10,301 | | | | 27,151 | | | | 13,582 | | | | 25,330 | | | | 38,912 | |
Acquisitions/capitalization | | | 1,515 | | | | — | | | | — | | | | 1,515 | | | | — | | | | 237 | | | | 354 | | | | 591 | |
Balances regarding acquired businesses | | | — | | | | — | | | | — | | | | — | | | | 260 | | | | 382 | | | | — | | | | 382 | |
Sales/disposals | | | — | | | | — | | | | — | | | | — | | | | –2 | | | | –20 | | | | –20 | | | | –40 | |
Translation difference | | | — | | | | — | | | | — | | | | — | | | | 46 | | | | 7 | | | | 25 | | | | 32 | |
| | | | | | | | | | | | | | | | | | | | | | | | | | | | | | | | |
Closing balance | | | 8,125 | | | | 2,213 | | | | 1,478 | | | | 11,816 | | | | 27,455 | | | | 14,188 | | | | 25,689 | | | | 39,877 | |
| | | | | | | | | | | | | | | | | | | | | | | | | | | | | | | | |
Accumulated amortization | | | | | | | | | | | | | | | | | | | | | | | | | | | | | | | | |
Opening balance | | | –2,526 | | | | –1,775 | | | | –1,184 | | | | –5,485 | | | | — | | | | –3,937 | | | | –13,103 | | | | –17,040 | |
Amortization | | | –661 | | | | –200 | | | | –134 | | | | –995 | | | | — | | | | –1,538 | | | | –2,932 | | | | –4,470 | |
Sales/disposals | | | — | | | | — | | | | — | | | | — | | | | 1 | | | | 15 | | | | 13 | | | | 28 | |
Translation difference | | | — | | | | — | | | | — | | | | — | | | | — | | | | –42 | | | | –56 | | | | –98 | |
| | | | | | | | | | | | | | | | | | | | | | | | | | | | | | | | |
Closing balance | | | –3,187 | | | | –1,975 | | | | –1,318 | | | | –6,480 | | | | 1 | | | | –5,502 | | | | –16,078 | | | | –21,580 | |
| | | | | | | | | | | | | | | | | | | | | | | | | | | | | | | | |
Accumulated impairment losses | | | | | | | | | | | | | | | | | | | | | | | | | | | | | | | | |
Opening balance | | | –1,714 | | | | –55 | | | | –37 | | | | –1,806 | | | | — | | | | — | | | | –5,214 | | | | –5,214 | |
Impairment losses | | | –7 | | | | — | | | | — | | | | –7 | | | | –18 | | | | — | | | | — | | | | — | |
| | | | | | | | | | | | | | | | | | | | | | | | | | | | | | | | |
Closing balance | | | –1,721 | | | | –55 | | | | –37 | | | | –1,813 | | | | –18 | | | | — | | | | –5,214 | | | | –5,214 | |
| | | | | | | | | | | | | | | | | | | | | | | | | | | | | | | | |
Net carrying value | | | 3,217 | | | | 183 | | | | 123 | | | | 3,523 | | | | 27,438 | | | | 8,686 | | | | 4,397 | | | | 13,083 | |
| | | | | | | | | | | | | | | | | | | | | | | | | | | | | | | | |
The goodwill is allocated to the operating segments Networks SEK 16.5 (15.3)16.2 (16.7) billion, ProfessionalGlobal Services SEK 3.7 (2.8)4.2 (4.1) billion and MultimediaSupport Solutions SEK 7.2 (6.8)10.0 (6.6) billion.
The recoverable amounts for cash-generating units are established as the present value of expected future cash flows. Estimation of future cash flows includes assumptions mainly for the following key financial parameters:
developmentDevelopment of operating income (based on operating margin or cost of goods sold and operating expenses relative to sales),
developmentDevelopment of working capital and capital expenditure requirements.
ERICSSON ANNUAL REPORT ON FORM 20-F 2009
NOTES TO THE CONSOLIDATED FINANCIAL STATEMENTS—(Continued)
The assumptions regarding revenueindustry specific market drivers and market growth are approved by group management and each operating segment’s management,management. These assumptions are based on industry sources andas input to the projections made within the Company for the development 2010–20142012–2017 for key industry parameters:
theThe number of global mobile subscriptions is estimated to grow from 4.5around 6.3 billion by the end of 20092012 to approximately 7.1 billion.around 9 billion by the end of 2017. Of these, some hundred millions will have mobile PC connections, while more than 2around 5-6 billion will have abe mobile broadband connection.
Mobile PC includes USB dongles and embedded modules for CDMA2000 EV-DO, HSPA, LTE, Mobile WiMax and TDSCDMA and can also be used for fixed applications.
Mobile Broadband includes CDMA2000 EV-DO, HSPA, LTE, Mobile WiMax and TDSCDMA. It includes handsets, USB dongles and embedded modules. Thesubscriptions. Around three-quarters of a billion of these mobile broadband subscriptions will use mobile PC/tablets/mobile routers, but the vast majority is handsets.will still use mobile phones to access the internet.
ERICSSON ANNUAL REPORT ON FORM 20-F 2012
Fixed broadband subscriptions willare estimated to grow from slightly above 400 million to almostaround 600 million by the end of 2012 to around 750 million in the same time perspective.2017. Fixed broadband includes Fiber, Cable and xDSL.
Mobile data traffic volume is estimated to increase more than 10around 9 times 2012–2017, while the fixed Internet traffic and fixed IPTV traffic is estimated to increase around 7–84 times 2012–2017, however from a much larger base.
The growth in network equipment is mainly driven by a shift in investments from voice to data. The end user requirements for “app-coverage” drives deployment of heterogeneous networks and small cells.
The demand for multimediasupport solutions is driven by the opportunities for new types of service offerings enabled by IP technology and high-speed broadband. There is strong IPTV subscriber growth, rapid growth in digital viewing and on-demand services. The development and build out of Mobile Broadband networks and increasing number of mobile broadband subscriptions drives growth in service introduction and traffic. This puts high demand on plan to provision, implementation and systems integration services as well as real time payment systems. The Business Support Systems’ growth is driven by introduction of new services, new business models and price plans.
The demand for professional services is also driven by an increasing business and technology complexity. Therefore, operators review their business models and look for vendor partners that can take on a broader responsibility, including outsourcing of network operations.
The assumptions are also based upon information gathered in the Company’s long-term strategy process, including assessments of new technology, the Company’s competitive position and new types of business and customers, driven by the continued integration of telecom, data and media industries.
The impairment testing is based on specific estimates for the first five years and with a reduction of nominal annual growth rate to an average GDP growth of 3 (3) percent3% (3%) per year thereafter. The impairment tests for goodwill did not result in any impairment.
A number of sensitivity tests have been made, for example applying lower levels of revenue and operating income. Also when applying these estimates no goodwill impairment is indicated.
As per year end 2009, the market capitalization of the Company well exceeded the value of the Company’s net assets.
An after-tax discount rate of 12 (12) percent8% (8%) has been applied for all cash generating units been applied for the discounting of projected after-tax cash flows. The assumptions for 2011 are disclosed in Note C10, “Intangible assets” in the Annual Report of 2011.
The Company’s discounting is based on after-tax future cash flows and after-tax discount rates. This discounting is not materially different from a discounting based on before-tax future cash flows and before-tax discount rates, as required by IFRS.
In Note C1, “Significant Accounting Policies”accounting policies”, and Note C2, “Critical Accounting Estimatesaccounting estimates and Judgments”judgments”, further disclosures are given regarding goodwill impairment testing.
ERICSSON ANNUAL REPORT ON FORM 20-F 20092012
NOTES TO THE CONSOLIDATED FINANCIAL STATEMENTS—(Continued)
| | | | | | | | | | | | | | | | | | |
| | | Capitalized development expenses | | Goodwil | | Intellectual property rights (IPR),
trade-marks and other
intangible assets |
2008 | | To be
marketed | | | For internal use | | Total | | | Trademarks
and similar
rights | | | Patents
and
acquired
R&D | | Total |
| | | Acquired
costs | | Internal
costs | | | | | |
Accumulated acquisition costs | | | | | | | | | | | | | | | | | | |
Opening balance | | 12,478 | | | 1,640 | | 1,096 | | 15,214 | | 22,826 | | 10,372 | | | 19,758 | | 30,130 |
Acquisitions/capitalization | | 1,107 | | | 181 | | 121 | | 1,409 | | — | | 20 | | | — | | 20 |
Balances regarding divested/acquired businesses | | — | | | — | | — | | — | | 30 | | –172 | | | — | | –172 |
Sales/disposals | | –8,067 | | | — | | — | | –8,067 | | –60 | | –1,212 | 1) | | –31 | | –1,243 |
Reclassification2) | | — | | | — | | — | | — | | –912 | | –209 | | | — | | –209 |
Translation difference | | — | | | — | | — | | — | | 2,993 | | 630 | | | 723 | | 1,353 |
| | | | | | | | | | | | | | | | | | |
Closing balance | | 5,518 | | | 1,821 | | 1,217 | | 8,556 | | 24,877 | | 9,429 | | | 20,450 | | 29,879 |
| | | | | | | | | | | | | | | | | | |
Accumulated amortization | | | | | | | | | | | | | | | | | | |
Opening balance | | –7,911 | | | –1,562 | | –1,042 | | –10,515 | | — | | –2,072 | | | –4,086 | | –6,158 |
Amortization | | –1,726 | | | — | | — | | –1,726 | | — | | –674 | | | –2,606 | | –3,280 |
Sales/disposals | | 8,067 | | | — | | — | | 8,067 | | — | | 496 | | | 8 | | 504 |
Translation difference | | — | | | — | | — | | — | | — | | –175 | | | –169 | | –344 |
| | | | | | | | | | | | | | | | | | |
Closing balance | | –1,570 | | | –1,562 | | –1,042 | | –4,174 | | — | | –2,425 | | | –6,853 | | –9,278 |
| | | | | | | | | | | | | | | | | | |
Accumulated impairment losses | | | | | | | | | | | | | | | | | | |
Opening balance | | –974 | | | –38 | | –26 | | –1,038 | | — | | — | | | –14 | | –14 |
Impairment losses | | –534 | 3) | | –17 | | –11 | | –562 | | — | | — | | | — | | — |
| | | | | | | | | | | | | | | | | | |
Closing balance | | –1,508 | | | –55 | | –37 | | –1,600 | | — | | — | | | –14 | | –14 |
| | | | | | | | | | | | | | | | | | |
Net carrying value | | 2,440 | | | 204 | | 138 | | 2,782 | | 24,877 | | 7,004 | | | 13,583 | | 20,587 |
| | | | | | | | | | | | | | | | | | |
1) | Divestment of data centers in the UK. |
2) | Reclassification of deferred tax assets, goodwill and intangible assets due to finalized purchase price allocation. For more information, see Note C26, “Business Combinations”. |
3) | Part of the restructuring program. |
ERICSSON ANNUAL REPORT ON FORM 20-F 2009
NOTES TO THE CONSOLIDATED FINANCIAL STATEMENTS—(Continued)
C11 PROPERTY, PLANT AND EQUIPMENT
Property, plant and equipment 2012
| 2009 | | Real estate | | Machinery and
other technical
assets | | Other equipment,
tools and
installations | | Construction
in process
and advance
payments | | Total | |
Accumulated acquisition costs | | | | | | | | | | | |
| | | | Real
estate | | | Machinery and
other technical
assets | | | Other equipment,
tools and
installations | | | Construction in
progress and
advance payments | | | Total | |
Cost | | | | | | | | | | | |
Opening balance | | 4,054 | | 6,131 | | 18,058 | | 795 | | 29,038 | | | 4,641 | | | | 5,235 | | | | 20,663 | | | | 1,302 | | | | 31,841 | |
Additions | | 362 | | 657 | | 1,699 | | 1,288 | | 4,006 | | | 640 | | | | 370 | | | | 2,521 | | | | 1,898 | | | | 5,429 | |
Balances regarding divested/acquired businesses | | — | | –183 | | –95 | | –1 | | –279 | | | 2 | | | | 46 | | | | 432 | | | | — | | | | 480 | |
Sales/disposals | | –282 | | –1,241 | | –2,184 | | –148 | | –3,855 | | | –476 | | | | –373 | | | | –1,296 | | | | –242 | | | | –2,387 | |
Reclassifications | | 240 | | 151 | | 947 | | –1,338 | | — | | | 381 | | | | –380 | | | | 1,458 | | | | –1,459 | | | | — | |
Translation difference | | –157 | | –217 | | –338 | | –18 | | –730 | | | –203 | | | | –152 | | | | –745 | | | | –48 | | | | –1,148 | |
| | | | | | | | | | | | | | | | | | | | | | | | | |
Closing balance | | 4,217 | | 5,298 | | 18,087 | | 578 | | 28,180 | | | 4,985 | | | | 4,746 | | | | 23,033 | | | | 1,451 | | | | 34,215 | |
| | | | | | | | | | | | | | | | | | | | | | | | | |
Accumulated depreciation | | | | | | | | | | | | | | | | | | | | |
Opening balance | | –1,545 | | –4,211 | | –12,967 | | — | | –18,723 | | | –2,165 | | | | –3,485 | | | | –15,094 | | | | — | | | | –20,744 | |
Depreciation | | –303 | | –735 | | –2,512 | | — | | –3,550 | | | –354 | | | | –428 | | | | –3,270 | | | | — | | | | –4,052 | |
Balances regarding divested businesses | | — | | 112 | | 191 | | — | | 303 | | | — | | | | — | | | | 3 | | | | — | | | | 3 | |
Sales/disposals | | 174 | | 1,188 | | 1,873 | | — | | 3,235 | | | 68 | | | | 347 | | | | 1,228 | | | | — | | | | 1,643 | |
Reclassifications | | –75 | | –51 | | 126 | | — | | — | | | 7 | | | | –13 | | | | 6 | | | | — | | | | — | |
Translation difference | | 57 | | 140 | | 231 | | — | | 428 | | | 89 | | | | 90 | | | | 504 | | | | — | | | | 683 | |
| | | | | | | | | | | | | | | | | | | | | | | | | |
Closing balance | | –1,692 | | –3,557 | | –13,058 | | — | | –18,307 | | | –2,355 | | | | –3,489 | | | | –16,623 | | | | — | | | | –22,467 | |
| | | | | | | | | | | | | | | | | | | | | | | | | |
Accumulated impairment losses | | | | | | | | | | | | | | | | | | | | |
Opening balance | | –47 | | –125 | | –148 | | — | | –320 | | | –43 | | | | –148 | | | | –118 | | | | — | | | | –309 | |
Impairment losses | | — | | — | | –1 | | — | | –1 | | | –4 | | | | –8 | | | | — | | | | — | | | | –12 | |
Reversals of impairment losses | | — | | 33 | | 16 | | — | | 49 | | | — | | | | 22 | | | | 30 | | | | — | | | | 52 | |
Sales/disposals | | — | | — | | — | | — | | — | | | — | | | | 6 | | | | — | | | | — | | | | 6 | |
Translation difference | | 2 | | 1 | | 2 | | — | | 5 | | | 2 | | | | 4 | | | | 2 | | | | — | | | | 8 | |
| | | | | | | | | | | | | | | | | | | | | | | | | |
Closing balance | | –45 | | –91 | | –131 | | — | | –267 | | | –45 | | | | –124 | | | | –86 | | | | — | | | | –255 | |
| | | | | | | | | | | | | | | | | | | | | | | | | |
Net carrying value | | 2,480 | | 1,650 | | 4,898 | | 578 | | 9,606 | | | 2,585 | | | | 1,133 | | | | 6,324 | | | | 1,451 | | | | 11,493 | |
| | | | | | | | | | | | | | | | | | | | | | | | | |
Contractual commitments for the acquisition of property, plant and equipment as per December 31, 2009,2012, amounted to SEK 236 (229)184 (226) million.
ERICSSON ANNUAL REPORT ON FORM 20-F 2009
NOTES TO THE CONSOLIDATED FINANCIAL STATEMENTS—(Continued)
The reversal of impairment losses have been reported under Cost of sales.
ERICSSON ANNUAL REPORT ON FORM 20-F 2012
| | | | | | | | | | |
2008 | | Real estate | | Machinery and
other technical
assets | | Other equipment,
tools and
installations | | Construction
in process
and advance
payments | | Total |
Accumulated acquisition costs | | | | | | | | | | |
Opening balance | | 4,611 | | 5,697 | | 16,672 | | 675 | | 27,655 |
Additions | | 210 | | 805 | | 1,729 | | 1,389 | | 4,133 |
Balances regarding divested/acquired businesses | | — | | –5 | | –21 | | — | | –26 |
Sales/disposals | | –1,208 | | –775 | | –2,835 | | –33 | | –4,851 |
Reclassifications | | 21 | | –50 | | 1,284 | | –1,255 | | — |
Translation difference | | 420 | | 459 | | 1,229 | | 19 | | 2,127 |
| | | | | | | | | | |
Closing balance | | 4,054 | | 6,131 | | 18,058 | | 795 | | 29,038 |
| | | | | | | | | | |
Accumulated depreciation | | | | | | | | | | |
Opening balance | | –1,470 | | –4,013 | | –12,485 | | — | | –17,968 |
Depreciation | | –241 | | –865 | | –2,002 | | — | | –3,108 |
Balances regarding divested businesses | | — | | 5 | | 18 | | — | | 23 |
Sales/disposals | | 308 | | 875 | | 2,407 | | — | | 3,590 |
Reclassifications | | –1 | | 55 | | –54 | | — | | — |
Translation difference | | –141 | | –268 | | –851 | | — | | –1,260 |
| | | | | | | | | | |
Closing balance | | –1,545 | | –4,211 | | –12,967 | | — | | –18,723 |
| | | | | | | | | | |
Accumulated impairment losses | | | | | | | | | | |
Opening balance | | –117 | | –118 | | –148 | | — | | –383 |
Impairment losses | | — | | –4 | | — | | — | | –4 |
Reversals of impairment losses | | — | | — | | 7 | | — | | 7 |
Sales/disposals | | 78 | | — | | — | | — | | 78 |
Translation difference | | –8 | | –3 | | –7 | | — | | –18 |
| | | | | | | | | | |
Closing balance | | –47 | | –125 | | –148 | | — | | –320 |
| | | | | | | | | | |
Net carrying value | | 2,462 | | 1,795 | | 4,943 | | 795 | | 9,995 |
| | | | | | | | | | |
Contractual commitments for the acquisition of property,
Property, plant and equipment as per December 31, 2008, amounted to SEK 229 (176) million.2011
The reversal of impairment losses have been reported under Cost of sales.
| | | | | | | | | | | | | | | | | | | | |
| | | Real estate | | | Machinery and
other technical
assets | | | Other equipment,
tools and
installations | | | Construction in
progress and
advance payments | | | Total | |
Cost | | | | | | | | | | | | | | | | | | | | |
Opening balance | | | 4,238 | | | | 5,004 | | | | 18,576 | | | | 814 | | | | 28,632 | |
Additions | | | 265 | | | | 400 | | | | 1,910 | | | | 2,419 | | | | 4,994 | |
Balances regarding divested/acquired businesses | | | 146 | | | | 37 | | | | 75 | | | | — | | | | 258 | |
Sales/disposals | | | –147 | | | | –354 | | | | –952 | | | | –524 | | | | –1,977 | |
Reclassifications | | | 142 | | | | 169 | | | | 1,116 | | | | –1,427 | | | | — | |
Translation difference | | | –3 | | | | –21 | | | | –62 | | | | 20 | | | | –66 | |
| | | | | | | | | | | | | | | | | | | | |
Closing balance | | | 4,641 | | | | 5,235 | | | | 20,663 | | | | 1,302 | | | | 31,841 | |
| | | | | | | | | | | | | | | | | | | | |
Accumulated depreciation | | | | | | | | | | | | | | | | | | | | |
Opening balance | | | –1,869 | | | | –3,377 | | | | –13,695 | | | | — | | | | –18,941 | |
Depreciation | | | –415 | | | | –571 | | | | –2,513 | | | | — | | | | –3,499 | |
Balances regarding divested businesses | | | — | | | | — | | | | 1 | | | | — | | | | 1 | |
Sales/disposals | | | 74 | | | | 435 | | | | 1,085 | | | | — | | | | 1,594 | |
Reclassifications | | | 36 | | | | –4 | | | | –32 | | | | — | | | | — | |
Translation difference | | | 9 | | | | 32 | | | | 60 | | | | — | | | | 101 | |
| | | | | | | | | | | | | | | | | | | | |
Closing balance | | | –2,165 | | | | –3,485 | | | | –15,094 | | | | — | | | | –20,744 | |
| | | | | | | | | | | | | | | | | | | | |
Accumulated impairment losses | | | | | | | | | | | | | | | | | | | | |
Opening balance | | | –43 | | | | –95 | | | | –119 | | | | — | | | | –257 | |
Impairment losses | | | — | | | | –48 | | | | –12 | | | | — | | | | –60 | |
Reversals of impairment losses | | | — | | | | — | | | | 13 | | | | — | | | | 13 | |
Sales/disposals | | | — | | | | — | | | | 1 | | | | — | | | | 1 | |
Translation difference | | | — | | | | –5 | | | | –1 | | | | — | | | | –6 | |
| | | | | | | | | | | | | | | | | | | | |
Closing balance | | | –43 | | | | –148 | | | | –118 | | | | — | | | | –309 | |
| | | | | | | | | | | | | | | | | | | | |
Net carrying value | | | 2,433 | | | | 1,602 | | | | 5,451 | | | | 1,302 | | | | 10,788 | |
| | | | | | | | | | | | | | | | | | | | |
C12 FINANCIAL ASSETS, NON-CURRENT
Equity in joint ventures and associated companies
| | | | | | | | | | | | | | | | | | | | | | | | |
| | | Joint ventures | | | Associated companies | | | Total | | | Total | |
| | | 2012 | | | 2011 | | | 2012 | | | 2011 | | | 2012 | | | 2011 | |
Opening balance | | | 4,663 | | | | 8,648 | | | | 1,302 | | | | 1,155 | | | | 5,965 | | | | 9,803 | |
Share in earnings | | | –8,399 | | | | –3,929 | | | | 3 | | | | 151 | | | | –8,396 | | | | –3,778 | |
Contributions to joint ventures and associated companies | | | 5,029 | | | | — | | | | — | | | | 109 | | | | 5,029 | | | | 109 | |
Taxes | | | 106 | | | | 241 | | | | –11 | | | | –1 | | | | 95 | | | | 240 | |
Translation difference | | | –111 | | | | –126 | | | | 42 | | | | 66 | | | | –69 | | | | –60 | |
Change in hedge reserve | | | 65 | | | | 4 | | | | — | | | | — | | | | 65 | | | | 4 | |
Pensions | | | — | | | | –175 | | | | — | | | | — | | | | — | | | | –175 | |
Dividends | | | — | | | | — | | | | –133 | | | | –177 | | | | –133 | | | | –177 | |
Divestments | | | –1,353 | | | | — | | | | — | | | | — | | | | –1,353 | | | | — | |
Reclassification | | | — | | | | — | | | | 1,639 | 2) | | | –1 | | | | 1,639 | | | | –1 | |
| | | | | | | | | | | | | | | | | | | | | | | | |
Closing balance | | | — | | | | 4,663 | 1) | | | 2,842 | 3) | | | 1,302 | 3) | | | 2,842 | | | | 5,965 | |
| | | | | | | | | | | | | | | | | | | | | | | | |
ERICSSON ANNUAL REPORT ON FORM 20-F 20092012
NOTES TO THE CONSOLIDATED FINANCIAL STATEMENTS—(Continued)
C12 FINANCIAL ASSETS, NON-CURRENT
EQUITY IN JOINT VENTURES AND ASSOCIATED COMPANIES
| | | | | | | | | | | | | | |
| | | Joint ventures | | Associated companies | | Total |
| | | 2009 | | | 2008 | | 2009 | | | 2008 | | 2009 | | 2008 |
Opening balance | | 6,694 | | | 9,549 | | 1,294 | | | 1,354 | | 7,988 | | 10,903 |
Share in earnings | | –7,455 | | | –503 | | 55 | | | 67 | | –7,400 | | –436 |
Taxes | | 1,388 | | | 151 | | –1 | | | –6 | | 1,387 | | 145 |
Translation difference | | –277 | | | 1,084 | | –17 | | | 130 | | –294 | | 1,214 |
Change in hedge reserve | | 6 | | | 36 | | — | | | — | | 6 | | 36 |
Pensions | | 21 | | | 4 | | — | | | — | | 21 | | 4 |
Dividends | | — | | | –3,627 | | –70 | | | –236 | | –70 | | –3,863 |
Contributions to joint ventures and associated companies | | 9,941 | 1) | | — | | 2 | | | 46 | | 9,943 | | 46 |
Reclassification | | –1 | | | — | | –2 | | | –1 | | –3 | | –1 |
Disposals | | — | | | — | | — | | | –60 | | — | | –60 |
| | | | | | | | | | | | | | |
Closing balance | | 10,317 | 2) | | 6,694 | | 1,261 | 3) | | 1,294 | | 11,578 | | 7,988 |
| | | | | | | | | | | | | | |
| 1) | Including contribution of SEK 5.0 billion paid to STMicroelectronics. |
2) | Including goodwill for ST-Ericsson of SEK 1,341 million1.3 billion. |
| 2) | Reclassification from Other investments in shares and participations. |
| 3) | Goodwill, net, amounts to SEK 16 million (SEK 16 million in 2008).12.2 (13.5) million. |
ERICSSON’S SHARE OF ASSETS, LIABILITIES AND INCOME IN JOINT VENTURE SONY ERICSSON MOBILE COMMUNICATIONS
| | | | | | |
| | | 2009 | | 2008 | | 2007 |
Non-current assets | | 4,003 | | 3,228 | | 2,701 |
Current assets | | 12,790 | | 21,190 | | 22,714 |
Non-current liabilities | | 130 | | 157 | | 121 |
Current liabilities | | 14,675 | | 17,593 | | 15,745 |
Net assets | | 1,988 | | 6,668 | | 9,549 |
| | | | | | |
Net sales | | 36,074 | | 54,377 | | 59,700 |
Income after financial items | | –5,540 | | –400 | | 7,276 |
Income taxes | | 1,252 | | 151 | | –1,957 |
| | | | | | |
Net income | | –4,288 | | –249 | | 5,319 |
| | | | | | |
Net income attributable to: | | | | | | |
Stockholders of the Parent Company | | –4,441 | | –353 | | 5,151 |
Minority interest | | 153 | | 104 | | 168 |
Assets pledged as collateral | | 182 | | — | | — |
Contingent liabilities | | 17 | | 20 | | 12 |
ERICSSON ANNUAL REPORT ON FORM 20-F 2009
NOTES TO THE CONSOLIDATED FINANCIAL STATEMENTS—(Continued)
ERICSSON’S SHARE OF ASSETS, LIABILITIES AND INCOME IN ASSOCIATED COMPANY ERICSSON NIKOLA TESLA D.D.Ericsson’s share of assets, liabilities and income in associated company Ericsson Nikola Tesla d.d.1)
| | | | 2009 | | 2008 | | 2007 | | 2012 | | | 2011 | | | 2010 | |
Non-current assets | | 311 | | 394 | | 363 | | | 84 | | | | 113 | | | | 92 | |
Current assets | | 754 | | 695 | | 728 | | | 588 | | | | 574 | | | | 749 | |
Non-current liabilities | | 3 | | 6 | | 1 | | | — | | | | 1 | | | | 2 | |
Current liabilities | | 240 | | 253 | | 263 | | | 262 | | | | 197 | | | | 209 | |
| | | | | | | | | | | | | | | |
Net assets | | 822 | | 830 | | 827 | | | 410 | | | | 489 | | | | 630 | |
| | | | | | | | | | | | | | | |
Net sales | | 994 | | 1,182 | | 1,100 | | | 1,085 | | | | 693 | | | | 784 | |
Income after financial items | | 90 | | 139 | | 124 | | | 80 | | | | 13 | | | | 17 | |
Income taxes | | 1 | | –5 | | –1 | | | –8 | | | | 3 | | | | –1 | |
| | | | | | | | | | | | | | | |
Net income | | 91 | | 134 | | 123 | | | 72 | | | | 16 | | | | 16 | |
| | | | | | | | | | | | | | | |
Net income attributable to: | | | | | | | |
Stockholders of the Parent Company | | 91 | | 134 | | 123 | |
Minority interest | | — | | — | | — | |
Assets pledged as collateral | | 5 | | 5 | | 5 | | | 4 | | | | 4 | | | | 4 | |
Contingent liabilities | | 151 | | 172 | | 64 | | | 17 | | | | 80 | | | | 43 | |
| 1) | Ericsson’sThe Company’s share is 49.07 percent.49.07%. |
All three companies apply IFRS, as issued by the IASB,Ericsson’s Share of assets, liabilities and income in the reporting to Ericsson.
associated company Rockstar ConsortiumERICSSON’S SHARE OF ASSETS, LIABILITIES AND INCOME IN JOINT VENTURE ST-ERICSSON1)
| | | | |
| | | 20092012 | |
Non-currentTotal assets
| | | 7,2381,561 | |
Current assets
| | 3,856 |
Non-currentTotal liabilities
| | | 1296 |
Current liabilities
| | 2,691 |
| | | | |
Net assets | | | 8,2741,555 | |
| | | | |
Net sales | | | 9,633— | |
Income after financial items | | | –1,76280 | |
Income taxes | | | 136— | |
| | | | |
Net income | | | –1,62680 | |
| | |
Net income attributable to:
| | |
Stockholders of the Parent Company
| | –1,626 |
Minority interest
| | — |
Assets pledged as collateral | | | — | |
Contingent liabilities | | | 6— | |
ST-Ericsson:
| 1) | The Company’s share is 21.26%. |
All companies apply IFRS in the reporting to the Company as issued by IASB.
On February 2, 2009,December 10, 2012, STMicroelectronics announced its intention to exit the 50/50 joint venture consistingST-Ericsson. On December 20, 2012 the Company announced its decision not to acquire the full majority. This, together with other factors such as no change in governance rights, no change in funding responsibilities etc, means that the Company continues to not be in control of ST-NXP wireless business and Ericsson Mobile Platforms was established.
ST-Ericsson.ERICSSON ANNUAL REPORT ON FORM 20-F 20092012
Due to the status of ST-Ericsson, the Company has made a non-cash charge related to its 50% stake in ST-Ericsson. For further information, see Note C3, “Segment information” and Note C18, “Provisions”. The charge includes a write-down of investments of SEK –4.7 billion. The Company’s share in ST-Ericsson’s operating loss amounted to SEK –3.7 (–0.8) billion.
NOTES TO THE CONSOLIDATED FINANCIAL STATEMENTS—(Continued)Ericsson’s share of assets, liabilities and income in joint venture ST-Ericsson
| | | | | | | | | | | | |
| | | 2012 | | | 2011 | | | 2010 | |
Non-current assets | | | 1,097 | | | | 6,855 | | | | 6,673 | |
Current assets | | | 1,006 | | | | 1,514 | | | | 2,249 | |
Non-current liabilities | | | 370 | | | | 397 | | | | 214 | |
Current liabilities | | | 1,339 | | | | 4,695 | | | | 2,519 | |
| | | | | | | | | | | | |
Net assets | | | 394 | | | | 3,277 | | | | 6,189 | |
| | | | | | | | | | | | |
Net sales | | | 4,545 | | | | 5,346 | | | | 8,260 | |
Income after financial items | | | –2,503 | | | | –2,730 | | | | –1,762 | |
Income taxes | | | –400 | | | | 156 | | | | 50 | |
| | | | | | | | | | | | |
Net income | | | –2,903 | | | | –2,574 | | | | –1,712 | |
| | | | | | | | | | | | |
Assets pledged as collateral | | | — | | | | 3 | | | | 3 | |
Contingent liabilities | | | — | | | | — | | | | — | |
ST-Ericsson is an industry leaderThe table above consists of amounts considered by the Company when applying the equity method in design, development,relation to ST-Ericsson.
Ericsson’s Share of assets, liabilities and the creation of new generations of mobile platforms and wireless semiconductors. ST-Ericsson is a key supplier to four of the industry’s top five handset manufacturers, who together represent about 80 percent of global handset shipments, as well as to other leading companiesincome in the industry.
Ericsson contributed with net cash and net assets, of which SEK 5.0 billion was paid to STMicroelectronics.
The joint venture is headquartered in Geneva, Switzerland, and employs approximately 8,000 persons.
OTHER FINANCIAL ASSETS, NON-CURRENTSony Ericsson Mobile Communications AB
| | | | | | | | | | | | | | | | | |
| | | Other investments
in shares and
participations | | | Customer finance,
non-current | | Derivatives,
non-current | | Other financial
assets, non-current |
| | | 2009 | | 2008 | | | 2009 | | 2008 | | 2009 | | 2008 | | 2009 | | 2008 |
Accumulated acquisition costs | | | | | | | | | | | | | | | | | |
Opening balance | | 1,783 | | 2,019 | | | 1,082 | | 1,221 | | 2,814 | | 96 | | 3,557 | | 4,092 |
Additions | | 1 | | 4 | | | 408 | | 623 | | — | | — | | 389 | | 292 |
Business combinations | | — | | — | | | — | | — | | — | | — | | — | | — |
Disposals/repayments/deductions | | –36 | | –462 | 2) | | –258 | | –761 | | — | | — | | –244 | | –713 |
Change in value in funded pension plans1) | | — | | — | | | — | | — | | — | | — | | –521 | | –307 |
Reclassifications | | –1 | | — | | | — | | — | | — | | — | | — | | — |
Revaluation | | — | | — | | | — | | — | | –1,971 | | 2,718 | | — | | — |
Translation difference | | –87 | | 222 | | | — | | –1 | | — | | — | | 16 | | 193 |
| | | | | | | | | | | | | | | | | |
Closing balance | | 1,660 | | 1,783 | 2) | | 1,232 | | 1,082 | | 843 | | 2,814 | | 3,197 | | 3,557 |
| | | | | | | | | | | | | | | | | |
Accumulated impairment losses/allowances | | | | | | | | | | | | | | | | | |
Opening balance | | –1,474 | | –1,281 | | | –236 | | –209 | | — | | — | | –1,454 | | –1,270 |
Impairment losses/allowance | | –3 | | — | | | –222 | | –48 | | — | | — | | –74 | | –14 |
Business combinations | | — | | — | | | — | | — | | — | | — | | — | | — |
Disposals/repayments/deductions | | — | | –7 | | | 56 | | 21 | | — | | — | | — | | — |
Translation difference | | 73 | | –186 | | | — | | — | | — | | — | | 65 | | –170 |
| | | | | | | | | | | | | | | | | |
Closing balance | | –1,404 | | –1,474 | | | –402 | | –236 | | — | | — | | –1,463 | | –1,454 |
| | | | | | | | | | | | | | | | | |
Net carrying value | | 256 | | 309 | | | 830 | | 846 | | 843 | | 2,814 | | 1,734 | | 2,103 |
| | | | | | | | | | | | | | | | | |
| | | | | | | | | | | | |
| | | 2012 | | | 2011 | | | 2010 | |
Non-current assets | | | — | | | | 5,040 | | | | 3,622 | |
Current assets | | | — | | | | 8,745 | | | | 9,904 | |
Non-current liabilities | | | — | | | | 285 | | | | 592 | |
Current liabilities | | | — | | | | 12,172 | | | | 10,533 | |
| | | | | | | | | | | | |
Net assets | | | — | | | | 1,328 | | | | 2,401 | |
| | | | | | | | | | | | |
Net sales | | | — | | | | 23,496 | | | | 30,089 | |
Income after financial items | | | — | | | | –1,095 | | | | 705 | |
Income taxes | | | — | | | | 85 | | | | –231 | |
| | | | | | | | | | | | |
Net income | | | — | | | | –1,010 | | | | 474 | |
| | | | | | | | | | | | |
Assets pledged as collateral | | | — | | | | 1 | | | | — | |
Contingent liabilities | | | — | | | | 37 | | | | 16 | |
The Company has divested its 50% stake in Sony Ericsson Mobile Communications to Sony. The divestment was effective on January 1, 2012.
ERICSSON ANNUAL REPORT ON FORM 20-F 2012
Other financial assets, non-current
| | | | | | | | | | | | | | | | | | | | | | | | | | | | | | | | |
| | | Other investments
in shares and
participations | | | Customer finance,
non-current | | | Derivatives,
non-current | | | Other
financial assets,
non-current | |
| | | 2012 | | | 2011 | | | 2012 | | | 2011 | | | 2012 | | | 2011 | | | 2012 | | | 2011 | |
Cost | | | | | | | | | | | | | | | | | | | | | | | | | | | | | | | | |
Opening balance | | | 3,576 | | | | 1,607 | | | | 1,661 | | | | 1,474 | | | | 816 | | | | — | | | | 4,633 | | | | 4,382 | |
Additions | | | 45 | | | | 1,930 | | | | 5,249 | | | | 1,875 | | | | — | | | | — | | | | 313 | | | | 422 | |
Disposals/repayments/deductions | | | –63 | | | | –68 | | | | –5,331 | | | | –1,699 | | | | — | | | | — | | | | –136 | | | | –97 | |
Change in value in funded pension plans1) | | | — | | | | — | | | | — | | | | — | | | | — | | | | — | | | | 776 | | | | 42 | |
Reclassifications | | | –1,639 | 2) | | | — | | | | — | | | | — | | | | — | | | | — | | | | –1,018 | 3) | | | — | |
Revaluation | | | — | | | | — | | | | — | | | | — | | | | 9 | | | | 816 | | | | — | | | | — | |
Translation difference | | | –161 | | | | 107 | | | | –41 | | | | 11 | | | | — | | | | — | | | | –154 | | | | –116 | |
| | | | | | | | | | | | | | | | | | | | | | | | | | | | | | | | |
Closing balance | | | 1,758 | | | | 3,576 | | | | 1,538 | | | | 1,661 | | | | 825 | | | | 816 | | | | 4,414 | | | | 4,633 | |
| | | | | | | | | | | | | | | | | | | | | | | | | | | | | | | | |
Accumulated impairment losses/allowances | | | | | | | | | | | | | | | | | | | | | | | | | | | | | | | | |
Opening balance | | | –1,377 | | | | –1,388 | | | | –261 | | | | –193 | | | | — | | | | — | | | | –1,332 | | | | –1,303 | |
Impairment losses/allowance | | | –51 | | | | –54 | | | | –26 | | | | –91 | | | | — | | | | — | | | | –14 | | | | –47 | |
Disposals/repayments/deductions | | | — | | | | 63 | | | | 35 | | | | 19 | | | | — | | | | — | | | | — | | | | — | |
Reclassifications | | | — | | | | — | | | | — | | | | — | | | | — | | | | — | | | | 26 | 3) | | | — | |
Translation difference | | | 56 | | | | 2 | | | | 4 | | | | 4 | | | | — | | | | — | | | | 45 | | | | 18 | |
| | | | | | | | | | | | | | | | | | | | | | | | | | | | | | | | |
Closing balance | | | –1,372 | | | | –1,377 | | | | –248 | | | | –261 | | | | — | | | | — | | | | –1,275 | | | | –1,332 | |
| | | | | | | | | | | | | | | | | | | | | | | | | | | | | | | | |
Net carrying value | | | 386 | | | | 2,199 | | | | 1,290 | | | | 1,400 | | | | 825 | | | | 816 | | | | 3,139 | | | | 3,301 | |
| | | | | | | | | | | | | | | | | | | | | | | | | | | | | | | | |
| 1) | This amount includes asset ceiling. For further information, see Note C17, “Post-employment benefits”. |
| 2) | In 2008, the divestment of sharesReclassification to Equity in Symbian, with a cash flow effect of SEK 1,256 million, is included in divestments of subsidiaries and other operations.associated companies. |
| 3) | Reclassification to Short-term investments. |
C13 INVENTORIES
Inventories
| | | | |
| | | 2009 | | 2008 |
Raw materials, components, consumables and manufacturing work in progress | | 6,190 | | 7,413 |
Finished products and goods for resale | | 6,621 | | 7,616 |
Contract work in progress | | 9,907 | | 12,807 |
| | | | |
Inventories, net | | 22,718 | | 27,836 |
| | | | |
ERICSSON ANNUAL REPORT ON FORM 20-F 2009
NOTES TO THE CONSOLIDATED FINANCIAL STATEMENTS—(Continued)
| | | | | | | | |
| | | 2012 | | | 2011 | |
Raw materials, components, consumables and manufacturing work in progress | | | 7,351 | | | | 8,772 | |
Finished products and goods for resale | | | 10,981 | | | | 13,525 | |
Contract work in progress | | | 10,470 | | | | 10,773 | |
| | | | | | | | |
Inventories, net | | | 28,802 | | | | 33,070 | |
| | | | | | | | |
Contract work in progress includes amounts related to delivery-type contracts service contracts and construction-typeservice contracts with ongoing work in progress.
Reported amounts are net of obsolescence allowances of SEK 2,961 (3,493)3,473 (3,343) million.
ERICSSON ANNUAL REPORT ON FORM 20-F 2012
MOVEMENTS IN OBSOLESCENCE ALLOWANCESMovements in obsolescence allowances
| | | | 2009 | | 2008 | | 2007 | | 2012 | | | 2011 | | | 2010 | |
Opening balance | | 3,493 | | 2,752 | | 2,578 | | | 3,343 | | | | 3,090 | | | | 2,961 | |
Additions, net | | 562 | | 1,553 | | 1,276 | | | 1,403 | | | | 918 | | | | 250 | |
Utilization | | –1,297 | | –1,039 | | –1,114 | | | –1,140 | | | | –683 | | | | –165 | |
Translation difference | | 2 | | 250 | | 17 | | | –133 | | | | 18 | | | | –46 | |
Balances regarding acquired/divested businesses | | 201 | | –23 | | –5 | | | — | | | | — | | | | 90 | |
| | | | | | | | | | | | | | | |
Closing balance | | 2,961 | | 3,493 | | 2,752 | | | 3,473 | | | | 3,343 | | | | 3,090 | |
| | | | | | | | | | | | | | | |
The amount of inventories recognized as expense and included in Cost of sales was SEK 52,255 (58,155)56,842 (60,544) million.
C14 TRADE RECEIVABLES AND CUSTOMER FINANCE
Trade receivables and customer finance
| | | | 2009 | | 2008 | | 2012 | | | 2011 | |
Trade receivables excluding associated companies and joint ventures | | 67,133 | | 76,827 | | | 64,015 | | | | 64,740 | |
Allowances for impairment | | –924 | | –1,471 | | | –655 | | | | –567 | |
| | | | | | | | | | |
Trade receivables, net | | 66,209 | | 75,356 | | | 63,360 | | | | 64,173 | |
Trade receivables related to associated companies and joint ventures | | 201 | | 535 | | | 300 | | | | 349 | |
| | | | | | | | | | |
Trade receivables, total | | 66,410 | | 75,891 | | | 63,660 | | | | 64,522 | |
| | | | | | | | | | |
Customer finance | | 3,046 | | 3,147 | |
Customer finance credits | | | | 5,731 | | | | 4,671 | |
Allowances for impairment | | –772 | | –326 | | | –422 | | | | –426 | |
| | | | | | | | | | |
Customer finance, net | | 2,274 | | 2,821 | |
of which short term | | 1,444 | | 1,975 | |
Customer finance credits, net | | | | 5,309 | | | | 4,245 | |
| | | | | | | |
Of which current | | | | 4,019 | | | | 2,845 | |
Credit commitments for customer finance | | 3,027 | | 3,811 | | | 5,933 | | | | 8,569 | |
| | | | | | | | | | |
Days Sales Outstandingsales outstanding (DSO) were 106 (106)86 (91) in December 2009.2012.
MOVEMENTS IN ALLOWANCES FOR IMPAIRMENTMovements in allowances for impairment
| | | | | | | | | | | | |
| | | Trade receivables | | Customer finance |
| | | 2009 | | 2008 | | 2007 | | 2009 | | 2008 | | 2007 |
Opening balance | | 1,471 | | 1,351 | | 1,372 | | 326 | | 275 | | 418 |
Additions | | 388 | | 651 | | 564 | | 595 | | 90 | | 49 |
Utilization | | –583 | | –492 | | –554 | | –67 | | –3 | | –43 |
Reversal of excess amounts | | –312 | | –81 | | –137 | | –37 | | –74 | | –141 |
Reclassification | | 10 | | –69 | | 56 | | — | | — | | — |
Translation difference | | –43 | | 115 | | 50 | | –45 | | 38 | | –8 |
Balances regarding acquired/divested business | | –7 | | –4 | | — | | — | | — | | — |
| | | | | | | | | | | | |
Closing balance | | 924 | | 1,471 | | 1,351 | | 772 | | 326 | | 275 |
| | | | | | | | | | | | |
| | | | | | | | | | | | | | | | | | | | | | | | |
| | | Trade receivables | | | Customer finance | |
| | | 2012 | | | 2011 | | | 2010 | | | 2012 | | | 2011 | | | 2010 | |
Opening balance | | | 567 | | | | 766 | | | | 924 | | | | 426 | | | | 321 | | | | 772 | |
Additions | | | 229 | | | | 198 | | | | 282 | | | | 101 | | | | 162 | | | | 25 | |
Utilized | | | –116 | | | | –266 | | | | –285 | | | | –9 | | | | –31 | | | | –87 | |
Reversal of excess amounts | | | –30 | | | | –43 | | | | –169 | | | | –112 | | | | –27 | | | | –359 | |
Reclassification | | | 21 | | | | –69 | | | | 33 | | | | — | | | | — | | | | — | |
Translation difference | | | –16 | | | | –19 | | | | –19 | | | | 16 | | | | 1 | | | | –30 | |
| | | | | | | | | | | | | | | | | | | | | | | | |
Closing balance | | | 655 | | | | 567 | | | | 766 | | | | 422 | | | | 426 | | | | 321 | |
| | | | | | | | | | | | | | | | | | | | | | | | |
ERICSSON ANNUAL REPORT ON FORM 20-F 20092012
NOTES TO THE CONSOLIDATED FINANCIAL STATEMENTS—(Continued)
AGING ANALYSIS AS PER DECEMBERAging analysis as per December 31 2009
| | | | | | | | | | | | | | |
| | | Amount | | of which
neither
impaired
nor
past due | | of which
impaired,
not
past due | | of which
past due in the
following time intervals | | of which
past due and impaired in
the following time intervals |
| | | | | less than
90 days | | 90 days
or more | | less than
90 days | | 90 days
or more |
Trade receivables excluding associated companies and joint ventures | | 67,133 | | 58,727 | | 43 | | 2,962 | | 2,081 | | 774 | | 2,546 |
Allowances for impairment of receivables | | –924 | | — | | –8 | | — | | — | | –180 | | –736 |
Customer finance | | 3,046 | | 1,292 | | 1,314 | | 9 | | 1 | | 145 | | 285 |
Allowances for impairment of customer finance | | –772 | | — | | –342 | | — | | — | | –145 | | –285 |
|
AGING ANALYSIS AS PER DECEMBER 31, 2008
|
| | | | | | | | | | | | | | |
| | | Amount | | of which
neither
impaired
nor
past due | | of which
impaired,
not
past due | | of which
past due in the
following time intervals | | of which
past due and impaired in
the following time intervals |
| | | | | less than
90 days | | 90 days
or more | | less than
90 days | | 90 days
or more |
Trade receivables excluding associated companies and joint ventures | | 76,827 | | 67,482 | | 157 | | 4,003 | | 2,711 | | 844 | | 1,630 |
Allowances for impairment of receivables | | –1,471 | | — | | –121 | | — | | — | | –362 | | –988 |
Customer finance | | 3,147 | | 2,530 | | 347 | | 5 | | 27 | | 47 | | 191 |
Allowances for impairment of customer finance | | –326 | | — | | –97 | | — | | — | | –38 | | –191 |
| | | | | | | | | | | | | | | | | | | | | | | | | | | | |
| | | Total | | | Of which
neither impaired
nor past due | | | Of which
impaired,
not past due | | | Of which past
due in
the following time
intervals: | | | Of which past due and
impaired in the following
time intervals: | |
| | | | | | less than
90 days | | | 90 days
or more | | | less than
90 days | | | 90 days or
more | |
2012 | | | | | | | | | | | | | | | | | | | | | | | | | | | | |
Trade receivables excluding associated companies and joint ventures | | | 64,015 | | | | 57,526 | | | | 25 | | | | 2,459 | | | | 1,431 | | | | 779 | | | | 1,795 | |
Allowances for impairment | | | –655 | | | | — | | | | –15 | | | | — | | | | — | | | | –70 | | | | –570 | |
Customer finance credits | | | 5,731 | | | | 4,549 | | | | 845 | | | | 21 | | | | 15 | | | | 70 | | | | 231 | |
Allowances for impairment | | | –422 | | | | — | | | | –146 | | | | — | | | | — | | | | –45 | | | | –231 | |
| | | | | | | |
2011 | | | | | | | | | | | | | | | | | | | | | | | | | | | | |
Trade receivables excluding associated companies and joint ventures | | | 64,740 | | | | 56,480 | | | | 184 | | | | 4,126 | | | | 1,072 | | | | 850 | | | | 2,028 | |
Allowances for impairment | | | –567 | | | | — | | | | –16 | | | | — | | | | — | | | | –50 | | | | –501 | |
Customer finance credits | | | 4,671 | | | | 3,369 | | | | 763 | | | | 238 | | | | 45 | | | | 41 | | | | 215 | |
Allowances for impairment | | | –426 | | | | — | | | | –176 | | | | — | | | | — | | | | –35 | | | | –215 | |
Credit risk
Credit risk is divided into three categories: credit risk in trade receivables, customer finance risk and financial credit risk, (seesee Note C20, Financial Risk Management“Financial risk management and Financial Instruments)financial instruments”.
Credit risk in trade receivables
Credit risk in trade receivables is governed by a policy applicable for all legal entities in Ericsson.the Company. The purpose of the policy is to:
Avoid credit losses through establishing internal standard credit approval routines in all Ericssonthe Company’s legal entities.entities
Ensure monitoring and risk mitigation of defaulting accounts, i.e. events of non-payment and/or delayed payments from customers.customers
Ensure efficient credit management within the Company and thereby improve Days Sales Outstandingsales outstanding and Cash Flow.flow
Ensure payment terms are commercially justifiable.justifiable
Define escalation path and approval process for payment terms and customer credit limits.
ERICSSON ANNUAL REPORT ON FORM 20-F 2009
NOTES TO THE CONSOLIDATED FINANCIAL STATEMENTS—(Continued)
The credit worthiness of all customers is regularly assessed and a credit limit is set. Through credit management system functionality, credit checks are performed every time a sales order or an invoice is generated in the source system. This is based on the credit risk set on the customer. Credit blocks appear if the credit limit set on customer is exceeded or if past due receivables are higher than permitted levels. Release of a credit block requires authorization.
Letters of credits are used as a method for securing payments from customers operating in emerging markets, in particular in markets with unstable political and/or economic environment. By having banks confirming the letters of credit, the political and commercial credit risk exposures to Ericssonthe Company are mitigated.
ERICSSON ANNUAL REPORT ON FORM 20-F 2012
Trade receivables amounted to SEK 67,133 (76,827)64,015 (64,740) million as of December 31, 2009.2012. Provisions for expected losses are regularly assessed and amounted to SEK 924 (1,471)655 (567) million as of December 31, 2009. Ericsson’s2012. The Company’s nominal credit losses have, however, historically been low. The amounts of trade receivables closely follow the distribution of Ericsson’sthe Company’s sales and do not include any major concentrations of credit risk by customer or by geography. The five largest customers represent 26 percentrepresented 27% (30%) of the total trade receivables.receivables in 2012.
Customer finance credit risk
All major commitments to finance customers are made only after the approval by the Finance Committee of the Board of Directors according to the established credit approval process.
Prior to the approval of new facilities reported as customer finance, an internal credit risk assessment is conducted in order to assess the credit rating of each transaction (for political and commercial risk). The credit risk analysis is made by using an assessment tool, where the political risk rating is identical to the rating used by all Export Credit Agenciescredit agencies within the OECD. The commercial risk is assessed by analyzing a large number of parameters, which may affect the level of the future commercial credit risk exposure. The output from the assessment tool for the credit rating also include an internal pricing of the risk. This is expressed as a risk margin per annum over funding cost. The reference pricing for political and commercial risk, on which the tool is based, is reviewed using information from Export Credit Agenciescredit agencies and prevailing pricing in the bank loan market for structured financed deals. The objective is that the internally set risk margin shall reflect the assessed risk and that the pricing is as close as possible to the current market pricing. A reassessment of the credit rating for each customer finance facility is made on a regular basis.
Risk provisions related to customer finance risk exposures are only made upon events which occur after the financing arrangement has become effective and which are expected to have a significant adverse impact on the borrower’s ability and/or willingness to service the outstanding debt. These events can be political (normally outside the control of the borrower) or commercial, e.g. a borrower’s deteriorated creditworthiness.
As of December 31, 2009, Ericsson’s2012, the Company’s total outstanding exposure related to customer finance was SEK 3,046 (3,147)5,731 (4,671) million. As of December 31, 2009, Ericsson2012, the Company also had unutilized customer finance commitments of SEK 3,027 (3,811) million. During 2009 Ericsson transferred certain customer finance assets to third parties, and continues to recognize a part of such assets corresponding to the extent of its continuing involvement. The total carrying amount of the original assets transferred is SEK 560 million, the amount of the assets that Ericsson continues to recognize is SEK 28 million, and the carrying amount of the associated liabilities is SEK 285,933 (8,569) million. Customer finance is arranged for infrastructure projects in different geographic markets and for a large number of customers. As of December 31, 2009,2012, there were a total of 68 (69)78 (80) customer finance arrangements originated by or guaranteed by Ericsson.the Company. The five largest facilities represented 43 (44) percent57% (41%) of the total credit exposure.exposure in 2012.
Total outstanding customer finance exposure per region as of December 31
| | | | | | | | |
Percent | | 2012 | | | 2011 | |
North America | | | 26 | | | | 1 | |
Latin America | | | 4 | | | | 4 | |
Northern Europe & Central Asia | | | 8 | | | | 8 | |
Western & Central Europe | | | 1 | | | | 1 | |
Mediterranean | | | 9 | | | | 11 | |
Middle East | | | 17 | | | | 24 | |
Sub-Saharan Africa | | | 19 | | | | 29 | |
India | | | 9 | | | | 14 | |
North East Asia | | | 7 | | | | 7 | |
South East Asia and Oceania | | | — | | | | 1 | |
Other | | | — | | | | — | |
| | | | | | | | |
Total | | | 100 | | | | 100 | |
| | | | | | | | |
ERICSSON ANNUAL REPORT ON FORM 20-F 20092012
NOTES TO THE CONSOLIDATED FINANCIAL STATEMENTS—(Continued)
Of Ericsson’s total outstanding customer finance exposure as of December 31, 2009, 57 (58) percent was related to Central and Eastern Europe, Middle East and Africa, 15 (22) percent to America, 14 (18) percent to Western Europe, and 14 (2) percent to Asia Pacific.
The effect of risk provisions and reversals for customer finance affecting the income statement amounted to a net negative impact of SEK 480 (16)33 million in 2009.2012 compared to a negative impact of SEK 114 million in 2011. Credit losses incurred wereamounted to SEK 67 (3) million.16 (62) million in 2012.
Security arrangements for customer finance facilities normally include pledges of equipment, pledges of certain assets belonging to the borrower and pledges of shares in the operating company. Restructuring efforts for cases of troubled debt may lead to temporary holdings of equity interests. If available, third-party risk coverage is as a rule arranged. “Third-party risk coverage” means that a financial payment guarantee covering the credit risk has been issued by a bank, an export credit agency or other financial institution. A credit risk transfer under a sub participation arrangement with a bank can also be arranged. In this case the entire credit risk and the funding is taken care of by the bank for the part that they cover. A credit risk cover from a third party may also be issued by an insurance company. During 2009, Ericsson has2012, the Company did not takentake possession of any collateral it holds as security or called on any other credit enhancement.
Information about guarantees related to customer finance is included in note C24.Note C24, “Contingent liabilities”, and information about leasing is included in Note C27, “Leasing”.
The table below summarizes Ericsson’sthe Company’s outstanding customer finance as of December 31, 20092012 and 2008.2011.
OUTSTANDING CUSTOMER FINANCEOutstanding customer finance
| | | | 2009 | | 2008 | | 2012 | | | 2011 | |
Total customer finance | | 3,046 | | 3,147 | | | 5,731 | | | | 4,671 | |
Accrued interest | | 57 | | 81 | | | 96 | | | | 68 | |
Less third-party risk coverage | | –382 | | –162 | | | –187 | | | | –480 | |
| | | | | | | | | | |
Ericsson’s risk exposure | | 2,721 | | 3,066 | | | 5,640 | | | | 4,259 | |
| | | | | | | | | | |
Transfers of financial assets
In previous years, the Company disclosed information in this note about assets transferred where the Company continues to recognize a part of such assets. As required by IFRS, as from fiscal year 2012 this information is disclosed in a separate note, see Note C32, “Transfers of financial assets”.
C15 OTHER CURRENT RECEIVABLES
Other current receivables
| | | | 2009 | | 2008 | | 2012 | | | 2011 | |
Prepaid expenses | | 2,403 | | 3,134 | | | 2,623 | | | | 2,056 | |
Accrued revenues | | 1,538 | | 1,885 | | | 2,305 | | | | 2,486 | |
Advance payments to suppliers | | 776 | | 1,278 | | | 1,060 | | | | 1,697 | |
Derivatives with a positive value1) | | 1,760 | | 2,796 | | | 3,068 | | | | 2,003 | |
Taxes | | 4,830 | | 4,130 | | | 7,727 | | | | 5,633 | |
Other | | 3,839 | | 4,595 | | | 3,282 | | | | 3,962 | |
| | | | | | | | | | |
Total | | 15,146 | | 17,818 | | | 20,065 | | | | 17,837 | |
| | | | | | | | | | |
| 1) | Also seeSee also Note C20, “Financial Risk Managementrisk management and Financial Instruments”financial instruments”. |
ERICSSON ANNUAL REPORT ON FORM 20-F 20092012
NOTES TO THE CONSOLIDATED FINANCIAL STATEMENTS—(Continued)
C16 EQUITY AND OTHER COMPREHENSIVE INCOME
Capital stock 20092012
Capital stock at December 31, 2009,2012, consisted of the following:
Capital stock
| | | | |
Parent Company | | Number of shares | | Capital
stock |
Class A shares | | 261,755,983 | | 1,309 |
Class B shares | | 3,011,595,752 | | 15,058 |
| | | | |
Total | | 3,273,351,735 | | 16,367 |
| | | | |
| | | | | | | | |
Parent Company | | Number of shares | | | Capital stock
(SEK million) | |
Class A shares | | | 261,755,983 | | | | 1,309 | |
Class B shares | | | 3,043,295,752 | | | | 15,217 | |
| | | | | | | | |
Total | | | 3,305,051,735 | | | | 16,526 | |
| | | | | | | | |
The capital stock of the Parent Company is divided into two classes: Class A shares (quota value SEK 5.00) and Class B shares (quota value SEK 5.00). Both classes have the same rights of participation in the net assets and earnings. Class A shares, however, are entitled to one vote per share while Class B shares are entitled to one tenth of one vote per share.
At December 31, 2009,2012, the total number of treasury shares was 78,978,533 (61,066,09784,798,095 (62,846,503 in 20082011 and 46,398,3091)73,088,516 in 2007)2010) Class B shares. Ericsson repurchased 27,000,00031.7 million shares in 2009,2012 in relation to the Stock Purchase Plans and the Stock Option Plans.Long-Term Variable Remuneration Program.
RECONCILIATION OF NUMBER OF SHARESReconciliation of number of shares
| | | | |
| | | Number of shares | | Capital
stock |
Number of shares Jan 1, 2009 | | 3,246,351,735 | | 16,232 |
Number of shares Dec 31, 2009 | | 3,273,351,735 | | 16,367 |
| | | | | | | | |
| | | Number of shares | | | Capital stock
(SEK million) | |
Number of shares Jan 1, 2012 | | | 3,273,351,735 | | | | 16,367 | |
Number of shares Dec 31, 2012 | | | 3,305,051,735 | | | | 16,526 | |
For further information about number of shares, see chapter Share information.Information.
Dividend proposal
The Board of Directors will propose to the Annual General Meeting 20102013 a dividend of SEK 2.002.75 per share.share (SEK 2.50 in 2012 and SEK 2.25 in 2011).
Additional paid in capital
Relates to payments made by owners and includes share premiums paid.
Retained earnings
Retained earnings, including net income for the year, comprise the earned profits of the Parent Company and its share of net income in subsidiaries, joint ventures and associated companies. Retained earnings also include:
Remeasurements related to post-employment benefits
Actuarial gains and losses resulting from experience-based events and changes in actuarial assumptions, fluctuations of the effect of the asset ceiling, and adjustments related to the Swedish special payroll taxes.
Revaluation of other investments in shares and participations
The fair value reserve comprises the cumulative net change in the fair value of available-for-sale financial assets until the investments are derecognized or impaired.assets.
ERICSSON ANNUAL REPORT ON FORM 20-F 2012
Cash flow hedges
The cash flow hedge reserve comprises the effective portion of the cumulative net change in the fair value of cash-flow-hedging instruments related to hedged transactions that have not yet occurred.
1) | A reverse split 1:5 was made in June 2008. Comparative figures are restated accordingly. |
ERICSSON ANNUAL REPORT ON FORM 20-F 2009
NOTES TO THE CONSOLIDATED FINANCIAL STATEMENTS—(Continued)
Cumulative translation adjustments
The cumulative translation adjustments comprises all foreign currency differences arising from the translation of the financial statements of foreign operations and changes regarding revaluation of goodwillexcess value in local currency as well as from the translation of liabilities that hedge the Company’s net investment in foreign subsidiaries.
Retained earningsEquity and Other comprehensive income 2012
Retained earnings, including net income for the year, comprise the earned profits of the Parent Company and its share of net income in subsidiaries, joint ventures and associated companies. Actuarial gains and losses related to pensions are included in retained earnings.
| | | | | | | | | | | | | | | | | | | | | | | | |
2012 | | Capital
stock | | | Additional
paid in
capital | | | Retained
earnings | | | Stock-
holders’
equity | | | Non-
controlling
interest
(NCI) | | | Total
equity | |
January 1, 2012 | | | 16,367 | | | | 24,731 | | | | 102,007 | | | | 143,105 | | | | 2,165 | | | | 145,270 | |
Net income | | | | | | | | | | | | | | | | | | | | | | | | |
Group | | | — | | | | — | | | | 17,411 | | | | 17,411 | | | | 163 | | | | 17,574 | |
Joint ventures and associated companies | | | — | | | | — | | | | –11,636 | | | | –11,636 | | | | — | | | | –11,636 | |
| | | | | | | | | | | | | | | | | | | | | | | | |
Other comprehensive income | | | | | | | | | | | | | | | | | | | | | | | | |
Remeasurements related to post-employment benefits | | | | | | | | | | | | | | | | | | | | | | | | |
Group | | | — | | | | — | | | | –451 | | | | –451 | | | | — | | | | –451 | |
Joint ventures and associated companies | | | — | | | | — | | | | 50 | | | | 50 | | | | — | | | | 50 | |
Revaluation of other investments in shares and participations | | | | | | | | | | | | | | | | | | | | | | | | |
Group | | | — | | | | — | | | | 6 | | | | 6 | | | | — | | | | 6 | |
Cash flow hedges | | | | | | | | | | | | | | | | | | | | | | | | |
Gains/losses arising during the year | | | | | | | | | | | | | | | | | | | | | | | | |
Group | | | — | | | | — | | | | 1,668 | | | | 1,668 | | | | — | | | | 1,668 | |
Joint ventures and associated companies | | | — | | | | — | | | | –25 | | | | –25 | | | | — | | | | –25 | |
Reclassification adjustments for gains/losses included in profit or loss | | | — | | | | — | | | | –568 | 1) | | | –568 | | | | — | | | | –568 | |
Adjustments for amounts transferred to initial carrying amount of hedged items | | | — | | | | — | | | | 92 | | | | 92 | | | | — | | | | 92 | |
Changes in cumulative translation adjustments | | | | | | | | | | | | | | | | | | | | | | | | |
Group | | | — | | | | — | | | | –3,898 | 2) | | | –3,898 | | | | –49 | | | | –3,947 | |
Joint ventures and associated companies | | | — | | | | — | | | | –511 | | | | –511 | | | | — | | | | –511 | |
Tax on items relating to components of OCI3) | | | — | | | | — | | | | –422 | | | | –422 | | | | — | | | | –422 | |
| | | | | | | | | | | | | | | | | | | | | | | | |
Total other comprehensive income | | | — | | | | — | | | | –4,059 | | | | –4,059 | | | | –49 | | | | –4,108 | |
| | | | | | | | | | | | | | | | | | | | | | | | |
Total comprehensive income | | | — | | | | — | | | | 1,716 | | | | 1,716 | | | | 114 | | | | 1,830 | |
| | | | | | | | | | | | | | | | | | | | | | | | |
Transactions with owners | | | | | | | | | | | | | | | | | | | | | | | | |
Stock issue | | | 159 | | | | — | | | | — | | | | 159 | | | | — | | | | 159 | |
Sale/Repurchase of own shares | | | — | | | | — | | | | –93 | | | | –93 | | | | — | | | | –93 | |
Stock Purchase Plans | | | | | | | | | | | | | | | | | | | | | | | | |
Group | | | — | | | | — | | | | 405 | | | | 405 | | | | — | | | | 405 | |
Joint ventures and associated companies | | | — | | | | — | | | | — | | | | – | | | | — | | | | — | |
Dividends paid | | | — | | | | — | | | | –8,033 | | | | –8,033 | 4) | | | –599 | | | | –8,632 | |
Transactions with non-controlling interest | | | — | | | | — | | | | –376 | | | | –376 | | | | –80 | | | | –456 | |
| | | | | | | | | | | | | | | | | | | | | | | | |
December 31, 2012 | | | 16,526 | | | | 24,731 | | | | 95,626 | | | | 136,883 | | | | 1,600 | | | | 138,483 | |
| | | | | | | | | | | | | | | | | | | | | | | | |
ERICSSON ANNUAL REPORT ON FORM 20-F 20092012
NOTES TO THE CONSOLIDATED FINANCIAL STATEMENTS—(Continued)
| | | | | | | | | | | | | | | | | | | | |
2009 | | Capital
stock | | Additional
paid in
capital | | Revaluation
of other
investments
in shares and
participations | | Cash flow
hedges | | | Cumulative
translation
adjustments | | | Retained
earnings | | Stock-
holders’
equity | | Minority
interests | | Total
equity |
January 1, 2009 | | 16,232 | | 24,731 | | –1 | | –2,356 | | | 2,124 | | | 100,093 | | 140,823 | | 1,261 | | 142,084 |
| | | | | | | | | | | | | | | | | | | | |
Net income | | | | | | | | | | | | | | | | | | | | |
Group | | — | | — | | — | | — | | | — | | | 9,685 | | 9,685 | | 455 | | 10,140 |
Joint ventures and associated companies | | — | | — | | — | | — | | | — | | | –6,013 | | –6,013 | | — | | –6,013 |
| | | | | | | | | | | | | | | | | | | | |
Other comprehensive income | | | | | | | | | | | | | | | | | | | | |
Actuarial gains and losses, and the effect of the asset ceiling, related to pensions | | | | | | | | | | | | | | | | | | | | |
Group | | — | | — | | — | | — | | | — | | | –633 | | –633 | | — | | –633 |
Joint ventures and associated companies | | — | | — | | — | | — | | | — | | | 28 | | 28 | | — | | 28 |
Revaluation of other investments in shares and participations | | | | | | | | | | | | | | | | | | | | |
Fair value remeasurement | | | | | | | | | | | | | | | | | | | | |
Group | | — | | — | | –2 | | — | | | — | | | — | | –2 | | — | | –2 |
Joint ventures and associated companies | | — | | — | | — | | — | | | — | | | — | | — | | — | | — |
Cash flow hedges | | | | | | | | | | | | | | | | | | | | |
Gains/losses arising during the year | | | | | | | | | | | | | | | | | | | | |
Group | | — | | — | | — | | 665 | | | — | | | — | | 665 | | — | | 665 |
Joint ventures and associated companies | | — | | — | | — | | 7 | | | — | | | — | | 7 | | — | | 7 |
Reclassification adjustments for gains/losses included in profit or loss | | — | | — | | — | | 3,850 | 1) | | — | | | — | | 3,850 | | — | | 3,850 |
Adjustments for amounts transferred to initial carrying amount of hedged items | | — | | — | | — | | –1,029 | | | — | | | — | | –1,029 | | — | | –1,029 |
Changes in cumulative translation adjustments | | | | | | | | | | | | | | | | | | | | |
Group | | — | | — | | — | | — | | | –1,013 | 2) | | — | | –1,013 | | –54 | | –1,067 |
Joint ventures and associated companies | | — | | — | | — | | — | | | –294 | | | — | | –294 | | — | | –294 |
Tax on items relating to components of OCI3) | | — | | — | | –1 | | –1,059 | | | –154 | 4) | | 174 | | –1,040 | | — | | –1,040 |
| | | | | | | | | | | | | | | | | | | | |
Total other comprehensive income | | — | | — | | –3 | | 2,434 | | | –1,461 | | | –431 | | 539 | | –54 | | 485 |
| | | | | | | | | | | | | | | | | | | | |
Total comprehensive income | | — | | — | | –3 | | 2,434 | | | –1,461 | | | 3,241 | | 4,211 | | 401 | | 4,612 |
| | | | | | | | | | | | | | | | | | | | |
Transactions with owners | | | | | | | | | | | | | | | | | | | | |
Stock issue | | 135 | | — | | — | | — | | | — | | | — | | 135 | | — | | 135 |
Sale of own shares | | — | | — | | — | | — | | | — | �� | | 75 | | 75 | | — | | 75 |
Repurchase of own shares | | — | | — | | — | | — | | | — | | | –135 | | –135 | | — | | –135 |
Stock Purchase and Stock Option Plans | | | | | | | | | | | | | | | | | | | | |
Group | | — | | — | | — | | — | | | — | | | 658 | | 658 | | — | | 658 |
Joint ventures and associated companies | | — | | — | | — | | — | | | — | | | — | | — | | — | | — |
Dividends paid | | — | | — | | — | | — | | | — | | | –5,897 | | –5,897 | | –421 | | –6,318 |
Business combinations | | — | | — | | — | | — | | | — | | | — | | — | | –84 | | –84 |
| | | | | | | | | | | | | | | | | | | | |
December 31, 2009 | | 16,367 | | 24,731 | | –4 | | 78 | | | 663 | | | 98,035 | | 139,870 | | 1,157 | | 141,027 |
| | | | | | | | | | | | | | | | | | | | |
| 1) | SEK 3,720–172 million is recognized in Net Sales, SEK 698–232 million is recognized in Cost of Sales, and SEK –56867 million is recognized in R&D.&D expenses and SEK –231 million is recognized in Other operating income and expenses. |
| 2) | Changes in cumulative translation adjustments include changes regarding revaluation of goodwill in local currency of SEK -1,015–1,400 million (SEK 2,99346 million in 2008,2011, SEK –914–1,480 million in 2007)2010), gain/loss from hedging activities of foreign entities, SEK 5860 million (SEK –660 in 2008, SEK –529 million in 2007)2011, SEK 385 in 2010), and SEK 10 million (SEK 13 million in 2008, SEK –70 million in 2007) of realized gain/losses net from sold/liquidated companies.companies SEK –461 million (SEK 192 million in 2011, SEK 140 million in 2010). |
| 3) | For further disclosures, see noteNote C8, “Taxes”. |
| 4) | Deferred tax on gains/losses on hedges on investmentsDividends paid per share amounted to SEK 2.50 (SEK 2.25 in foreign entities.2011 and SEK 2.00 in 2010). |
Equity and Other comprehensive income 2011
| | | | | | | | | | | | | | | | | | | | | | | | |
2011 | | Capital
stock | | | Additional
paid in
capital | | | Retained
earnings | | | Stock-
holders’
equity | | | Non-
controlling
interest
(NCI) | | | Total
equity | |
January 1, 2011 | | | 16,367 | | | | 24,731 | | | | 104,008 | | | | 145,106 | | | | 1,679 | | | | 146,785 | |
Net income | | | | | | | | | | | | | | | | | | | | | | | | |
Group | | | — | | | | — | | | | 15,727 | | | | 15,727 | | | | 375 | | | | 16,102 | |
Joint ventures and associated companies | | | — | | | | — | | | | –3,533 | | | | –3,533 | | | | — | | | | –3,533 | |
| | | | | | | | | | | | | | | | | | | | | | | | |
Other comprehensive income | | | | | | | | | | | | | | | | | | | | | | | | |
Remeasurements related to post-employment benefits | | | | | | | | | | | | | | | | | | | | | | | | |
Group | | | — | | | | — | | | | –6,963 | | | | –6,963 | | | | — | | | | –6,963 | |
Joint ventures and associated companies | | | — | | | | — | | | | –212 | | | | –212 | | | | — | | | | –212 | |
Cash flow hedges | | | | | | | | | | | | | | | | | | | | | | | | |
Gains/losses arising during the year | | | | | | | | | | | | | | | | | | | | | | | | |
Group | | | — | | | | — | | | | 996 | | | | 996 | | | | — | | | | 996 | |
Joint ventures and associated companies | | | — | | | | — | | | | 11 | | | | 11 | | | | — | | | | 11 | |
Reclassification adjustments for gains/losses included in profit or loss | | | — | | | | — | | | | –2,028 | | | | –2,028 | | | | — | | | | –2,028 | |
Changes in cumulative translation adjustments | | | | | | | | | | | | | | | | | | | | | | | | |
Group | | | — | | | | — | | | | –1,014 | | | | –1,014 | | | | 50 | | | | –964 | |
Joint ventures and associated companies | | | — | | | | — | | | | –61 | | | | –61 | | | | — | | | | –61 | |
Tax on items relating to components of OCI3) | | | — | | | | — | | | | 2,158 | | | | 2,158 | | | | — | | | | 2,158 | |
| | | | | | | | | | | | | | | | | | | | | | | | |
Total other comprehensive income | | | — | | | | — | | | | –7,113 | | | | –7,113 | | | | 50 | | | | –7,063 | |
| | | | | | | | | | | | | | | | | | | | | | | | |
Total comprehensive income | | | — | | | | — | | | | 5,081 | | | | 5,081 | | | | 425 | | | | 5,506 | |
| | | | | | | | | | | | | | | | | | | | | | | | |
Transactions with owners | | | | | | | | | | | | | | | | | | | | | | | | |
Sale of own shares | | | — | | | | — | | | | 92 | | | | 92 | | | | — | | | | 92 | |
Stock Purchase Plans | | | | | | | | | | | | | | | | | | | | | | | | |
Group | | | — | | | | — | | | | 413 | | | | 413 | | | | — | | | | 413 | |
Joint ventures and associated companies | | | — | | | | — | | | | — | | | | — | | | | — | | | | — | |
Dividends paid | | | — | | | | — | | | | –7,207 | | | | –7,207 | | | | –248 | | | | –7,455 | |
Transactions with non-controlling interest | | | — | �� | | | — | | | | –380 | | | | –380 | | | | 309 | | | | –71 | |
| | | | | | | | | | | | | | | | | | | | | | | | |
December 31, 2011 | | | 16,367 | | | | 24,731 | | | | 102,007 | | | | 143,105 | | | | 2,165 | | | | 145,270 | |
| | | | | | | | | | | | | | | | | | | | | | | | |
ERICSSON ANNUAL REPORT ON FORM 20-F 20092012
NOTES TO THE CONSOLIDATED FINANCIAL STATEMENTS—(Continued)
| | | | | | | | | | | | | | | | | | |
2008 | | Capital
stock | | Additional
paid in
capital | | Revaluation
of other
investments
in shares and
participations | | Cash flow
hedges | | Cumulative
translation
adjustments | | Retained
earnings | | Stock-
holders’
equity | | Minority
interests | | Total
equity |
| | | | | | | | | |
January 1, 2008 | | 16,132 | | 24,731 | | 5 | | 307 | | –6,345 | | 99,282 | | 134,112 | | 940 | | 135,052 |
| | | | | | | | | | | | | | | | | | |
Net income | | | | | | | | | | | | | | | | | | |
Group | | — | | — | | — | | — | | — | | 11,564 | | 11,564 | | 394 | | 11,958 |
Joint ventures and associated companies | | — | | — | | — | | — | | — | | –291 | | –291 | | — | | –291 |
| | | | | | | | | | | | | | | | | | |
Other comprehensive income | | | | | | | | | | | | | | | | | | |
Actuarial gains and losses related to pensions | | | | | | | | | | | | | | | | | | |
Group | | — | | — | | — | | — | | — | | –4,019 | | –4,019 | | — | | –4,019 |
Joint ventures and associated companies | | — | | — | | — | | — | | — | | 4 | | 4 | | | | 4 |
Revaluation of other investments in shares and participations | | | | | | | | | | | | | | | | | | |
Fair value remeasurement | | | | | | | | | | | | | | | | | | |
Group | | — | | — | | –6 | | — | | — | | — | | –6 | | — | | –6 |
Joint ventures and associated companies | | — | | — | �� | –1 | | — | | — | | — | | –1 | | — | | –1 |
Cash flow hedges | | | | | | | | | | | | | | | | | | |
Gains/losses arising during the year | | | | | | | | | | | | | | | | | | |
Group | | — | | — | | — | | –5,116 | | — | | — | | –5,116 | | — | | –5,116 |
Joint ventures and associated companies | | — | | — | | — | | 36 | | — | | — | | 36 | | — | | 36 |
Reclassification adjustments for gains/losses included in profit or loss | | — | | — | | — | | 1,192 | | — | | — | | 1,192 | | — | | 1,192 |
Adjustments for amounts transferred to initial carrying amount of hedged items | | — | | — | | — | | — | | — | | — | | — | | — | | — |
Changes in cumulative translation adjustments | | | | | | | | | | | | | | | | | | |
Group | | — | | — | | — | | — | | 7,081 | | — | | 7,081 | | 233 | | 7,314 |
Joint ventures and associated companies | | — | | — | | — | | — | | 1,214 | | — | | 1,214 | | — | | 1,214 |
Tax on items relating to components of OCI | | — | | — | | 1 | | 1,225 | | 174 | | 930 | | 2,330 | | — | | 2,330 |
| | | | | | | | | | | | | | | | | | |
Total other comprehensive income | | — | | — | | –6 | | –2,663 | | 8,469 | | –3,085 | | 2,715 | | 233 | | 2,948 |
| | | | | | | | | | | | | | | | | | |
Total comprehensive income | | — | | — | | –6 | | –2,663 | | 8,469 | | 8,188 | | 13,988 | | 627 | | 14,615 |
| | | | | | | | | | | | | | | | | | |
Transactions with owners | | | | | | | | | | | | | | | | | | |
Stock issue | | 100 | | — | | — | | — | | — | | — | | 100 | | — | | 100 |
Sale of own shares | | — | | — | | — | | — | | — | | 88 | | 88 | | — | | 88 |
Repurchase of own shares | | — | | — | | — | | — | | — | | –100 | | –100 | | — | | –100 |
Stock Purchase and Stock Option Plans | | | | | | | | | | | | | | | | | | |
Group | | — | | — | | — | | — | | — | | 589 | | 589 | | — | | 589 |
Joint ventures and associated companies | | — | | — | | — | | — | | — | | — | | — | | — | | — |
Dividends paid | | — | | — | | — | | — | | — | | –7,954 | | –7,954 | | –286 | | –8,240 |
Business combinations | | — | | — | | — | | — | | — | | — | | — | | –20 | | –20 |
| | | | | | | | | | | | | | | | | | |
December 31, 2008 | | 16,232 | | 24,731 | | –1 | | –2,356 | | 2,124 | | 100,093 | | 140,823 | | 1,261 | | 142,084 |
| | | | | | | | | | | | | | | | | | |
ERICSSON ANNUAL REPORT ON FORM 20-F 2009
NOTES TO THE CONSOLIDATED FINANCIAL STATEMENTS—(Continued)
| | | | | | | | | | | | | | | | | | |
2007 | | Capital
stock | | Additional
paid in
capital | | Revaluation
of other
investments
in shares and
participations | | Cash flow
hedges | | Cumulative
translation
adjustments | | Retained
earnings | | Stock-
holders’
equity | | Minority
interests | | Total
equity |
January 1, 2007 | | 16,132 | | 24,731 | | 3 | | 877 | | –5,569 | | 83,939 | | 120,113 | | 782 | | 120,895 |
| | | | | | | | | | | | | | | | | | |
Net income | | | | | | | | | | | | | | | | | | |
Group | | — | | — | | — | | — | | — | | 16,562 | | 16,562 | | 299 | | 16,861 |
Joint ventures and associated companies | | — | | — | | — | | — | | — | | 5,274 | | 5,274 | | — | | 5,274 |
| | | | | | | | | | | | | | | | | | |
Other comprehensive income | | | | | | | | | | | | | | | | | | |
Actuarial gains and losses related to pensions | | | | | | | | | | | | | | | | | | |
Group | | — | | — | | — | | — | | — | | 1,210 | | 1,210 | | — | | 1,210 |
Joint ventures and associated companies | | | | | | | | | | | | –2 | | –2 | | | | –2 |
Revaluation of other investments in shares and participations | | | | | | | | | | | | | | | | | | |
Fair value remeasurement | | — | | — | | 2 | | — | | — | | — | | 2 | | — | | 2 |
Group | | — | | — | | — | | — | | — | | — | | — | | — | | — |
Joint ventures and associated companies | | — | | — | | — | | — | | — | | — | | — | | — | | — |
Cash flow hedges | | | | | | | | | | | | | | | | | | |
Gains/losses arising during the year | | | | | | | | | | | | | | | | | | |
Group | | — | | — | | — | | 580 | | — | | — | | 580 | | — | | 580 |
Joint ventures and associated companies | | — | | — | | — | | 4 | | — | | — | | 4 | | — | | 4 |
Reclassification adjustments for gains/losses included in profit or loss | | — | | — | | — | | –1,390 | | — | | — | | –1,390 | | — | | –1,390 |
Adjustments for amounts transferred to initial carrying amount of hedged items | | — | | — | | — | | — | | — | | — | | — | | — | | — |
Changes in cumulative translation adjustments | | | | | | | | | | | | | | | | | | |
Group | | — | | — | | — | | — | | –1,155 | | — | | –1,155 | | –1 | | –1,156 |
Joint ventures and associated companies | | — | | — | | — | | — | | 359 | | — | | 359 | | — | | 359 |
Tax on items relating to components of OCI | | — | | — | | — | | 236 | | 20 | | –329 | | –73 | | — | | –73 |
| | | | | | | | | | | | | | | | | | |
Total other comprehensive income | | — | | — | | 2 | | –570 | | –776 | | 879 | | –465 | | –1 | | –466 |
| | | | | | | | | | | | | | | | | | |
Total comprehensive income | | — | | — | | 2 | | –570 | | –776 | | 22,715 | | 21,371 | | 298 | | 21,669 |
| | | | | | | | | | | | | | | | | | |
Transactions with owners | | | | | | | | | | | | | | | | | | |
Sale of own shares | | — | | — | | — | | — | | — | | 62 | | 62 | | — | | 62 |
Stock Purchase and Stock Option Plans | | | | | | | | | | | | | | | | | | |
Group | | — | | — | | — | | — | | — | | 528 | | 528 | | — | | 528 |
Joint ventures and associated companies | | — | | — | | — | | — | | — | | –19 | | –19 | | — | | –19 |
Dividends paid | | — | | — | | — | | — | | — | | –7,943 | | –7,943 | | –189 | | –8,132 |
Business combinations | | — | | — | | — | | — | | — | | — | | — | | 49 | | 49 |
| | | | | | | | | | | | | | | | | | |
December 31, 2007 | | 16,132 | | 24,731 | | 5 | | 307 | | –6,345 | | 99,282 | | 134,112 | | 940 | | 135,052 |
| | | | | | | | | | | | | | | | | | |
ERICSSON ANNUAL REPORT ON FORM 20-F 2009
NOTES TO THE CONSOLIDATED FINANCIAL STATEMENTS—(Continued)
Equity and Other comprehensive income 2010
| | | | | | | | | | | | | | | | | | | | | | | | |
2010 | | Capital
stock | | | Additional
paid in
capital | | | Retained
earnings | | | Stock-
holders’
equity | | | Non-
controlling
interest
(NCI) | | | Total
equity | |
January 1, 2010 | | | 16,367 | | | | 24,731 | | | | 98,772 | | | | 139,870 | | | | 1,157 | | | | 141,027 | |
Net income | | | | | | | | | | | | | | | | | | | | | | | | |
Group | | | — | | | | — | | | | 12,503 | | | | 12,503 | | | | 89 | | | | 12,592 | |
Joint ventures and associated companies | | | — | | | | — | | | | –1,357 | | | | –1,357 | | | | — | | | | –1,357 | |
| | | | | | | | | | | | | | | | | | | | | | | | |
Other comprehensive income | | | | | | | | | | | | | | | | | | | | | | | | |
Remeasurements related to post-employment benefits | | | | | | | | | | | | | | | | | | | | | | | | |
Group | | | — | | | | — | | | | 3,892 | | | | 3,892 | | | | — | | | | 3,892 | |
Joint ventures and associated companies | | | — | | | | — | | | | –27 | | | | –27 | | | | — | | | | –27 | |
Revaluation of other investments in shares and participations | | | | | | | | | | | | | | | | | | | | | | | | |
Fair value remeasurement | | | | | | | | | | | | | | | | | | | | | | | | |
Group | | | — | | | | — | | | | 7 | | | | 7 | | | | — | | | | 7 | |
Joint ventures and associated companies | | | — | | | | — | | | | — | | | | — | | | | — | | | | — | |
Cash flow hedges | | | | | | | | | | | | | | | | | | | | | | | | |
Gains/losses arising during the year | | | | | | | | | | | | | | | | | | | | | | | | |
Group | | | — | | | | — | | | | 966 | | | | 966 | | | | — | | | | 966 | |
Joint ventures and associated companies | | | — | | | | — | | | | 31 | | | | 31 | | | | — | | | | 31 | |
Reclassification adjustments for gains/losses included in profit or loss | | | — | | | | — | | | | –238 | | | | –238 | | | | — | | | | –238 | |
Adjustments for amounts transferred to initial carrying amount of hedged items | | | — | | | | — | | | | –136 | | | | –136 | | | | — | | | | –136 | |
Changes in cumulative translation adjustments | | | | | | | | | | | | | | | | | | | | | | | | |
Group | | | — | | | | — | | | | –3,269 | | | | –3,269 | | | | 10 | | | | –3,259 | |
Joint ventures and associated companies | | | — | | | | — | | | | –438 | | | | –438 | | | | — | | | | –438 | |
Tax on items relating to components of OCI | | | — | | | | — | | | | –1,120 | | | | –1,120 | | | | — | | | | –1,120 | |
| | | | | | | | | | | | | | | | | | | | | | | | |
Total other comprehensive income | | | — | | | | — | | | | –332 | | | | –332 | | | | 10 | | | | –322 | |
| | | | | | | | | | | | | | | | | | | | | | | | |
Total comprehensive income | | | — | | | | — | | | | 10,814 | | | | 10,814 | | | | 99 | | | | 10,913 | |
| | | | | | | | | | | | | | | | | | | | | | | | |
Transactions with owners | | | | | | | | | | | | | | | | | | | | | | | | |
Sale of own shares | | | — | | | | — | | | | 52 | | | | 52 | | | | — | | | | 52 | |
Stock Purchase Plans | | | | | | | | | | | | | | | | | | | | | | | | |
Group | | | — | | | | — | | | | 762 | | | | 762 | | | | — | | | | 762 | |
Joint ventures and associated companies | | | — | | | | — | | | | — | | | | — | | | | — | | | | — | |
Dividends paid | | | — | | | | — | | | | –6,391 | | | | –6,391 | | | | –286 | | | | –6,677 | |
Transactions with non-controlling interest | | | — | | | | — | | | | — | | | | — | | | | 708 | | | | 708 | |
| | | | | | | | | | | | | | | | | | | | | | | | |
December 31, 2010 | | | 16,367 | | | | 24,731 | | | | 104,008 | | | | 145,106 | | | | 1,679 | | | | 146,785 | |
| | | | | | | | | | | | | | | | | | | | | | | | |
C17 POST-EMPLOYMENT BENEFITS
Ericsson sponsors a number of post-employment benefit plans throughout the Company, which are in line with market practice in each country. The year 20092012 was characterisedcharacterized by the overall decrease in discount rates and a positive returndevelopment of plan assets and significant employer contributions.assets. Consequently, the Company experienced a decrease in the net pension liability. The acquisition of Telcordia resulted in an overfunded provision for post-employment benefits.
This note is divided into the following sections:
ERICSSON ANNUAL REPORT ON FORM 20-F 2012
| 1. | Amount Recognized in the Consolidated Balance Sheet |
| 2. | Total Pension Expenses Recognized in the Income Statement |
| 3. | Change in the Defined Benefit Obligation, DBO |
| 4. | Change in the Plan Assets |
| 5. | Actuarial Gains and Losses Reported Directly in OCI |
| 7. | Summary Information on Pension Plans per Geographical Zone |
Section One: Amount Recognizedrecognized in the Consolidated Balance Sheetbalance sheet
Amount recognized in the Consolidated balance sheet
| | | | Sweden | | UK | | Euro zone | | US | | Other | | Total | | Sweden | | | EU | | | US | | | Other | | | Total | |
2009 | | | | | | | | | | | | | |
2012 | | | | | | | | | | | |
Defined benefit obligation (DBO)1) | | 16,150 | | 5,688 | | 3,840 | | 2,781 | | 2,258 | | 30,717 | | | 21,432 | | | | 10,935 | | | | 16,472 | | | | 3,119 | | | | 51,958 | |
Fair value of plan assets2) | | 10,927 | | 5,336 | | 2,406 | | 1,974 | | 2,563 | | 23,206 | | | 15,375 | | | | 10,275 | | | | 16,263 | | | | 2,729 | | | | 44,642 | |
| | | | | | | | | | | | | | | | | | | | | | | | | | | |
Deficit/Surplus (+/-) | | 5,223 | | 352 | | 1,434 | | 807 | | –305 | | 7,511 | |
Deficit/Surplus (+/–) | | | | 6,057 | | | | 660 | | | | 209 | | | | 390 | | | | 7,316 | |
Unrecognized past service costs | | — | | — | | –14 | | — | | –79 | | –93 | | | — | | | | –3 | | | | — | | | | –25 | | | | –28 | |
| | | | | | | | | | | | | | | | | | | | | | | | | | | |
Closing balance | | 5,223 | | 352 | | 1,420 | | 807 | | –384 | | 7,418 | | | 6,057 | | | | 657 | | | | 209 | | | | 365 | | | | 7,288 | |
| | | | | | | | | | | | | | | | | | | | | | | | | | | |
Plans with net surplus3) | | — | | 190 | | 29 | | — | | 896 | | 1,115 | |
Plans with net surplus excluding asset ceiling3) | | | | — | | | | 1,028 | | | | 738 | | | | 449 | | | | 2,215 | |
| | | | | | | | | | | | | | | | | | | | | | | | | | | |
Provision for post-employment benefits4) | | 5,223 | | 542 | | 1,449 | | 807 | | 512 | | 8,533 | | | 6,057 | | | | 1,685 | | | | 947 | | | | 814 | | | | 9,503 | |
| | | | | | | | | | | | | | | | | | | | | | | | | | | |
2008 | | | | | | | | | | | | | |
2011 | | | | | | | | | | | |
Defined benefit obligation (DBO)1) | | 14,866 | | 4,867 | | 3,557 | | 2,789 | | 1,931 | | 28,010 | | | 20,643 | | | | 9,994 | | | | 3,133 | | | | 2,605 | | | | 36,375 | |
Fair value of plan assets2) | | 8,181 | | 4,407 | | 2,330 | | 2,289 | | 1,830 | | 19,037 | | | 13,490 | | | | 9,415 | | | | 2,337 | | | | 2,777 | | | | 28,019 | |
| | | | | | | | | | | | | | | | | | | | | | | | | | | |
Deficit/Surplus (+/-) | | 6,685 | | 460 | | 1,227 | | 500 | | 101 | | 8,973 | |
Deficit/Surplus (+/–) | | | | 7,153 | | | | 579 | | | | 796 | | | | –172 | | | | 8,356 | |
Unrecognized past service costs | | — | | — | | 1 | | — | | –75 | | –74 | | | — | | | | — | | | | — | | | | –47 | | | | –47 | |
| | | | | | | | | | | | | | | | | | | | | | | | | | | |
Closing balance | | 6,685 | | 460 | | 1,228 | | 500 | | 26 | | 8,899 | | | 7,153 | | | | 579 | | | | 796 | | | | –219 | | | | 8,309 | |
| | | | | | | | | | | | | | | | | | | | | | | | | | | |
Plans with net surplus3) | | — | | 35 | | 304 | | 171 | | 464 | | 974 | |
Plans with net surplus excluding asset ceiling3) | | | | — | | | | 953 | | | | — | | | | 754 | | | | 1,707 | |
| | | | | | | | | | | | | | | | | | | | | | | | | | | |
Provision for post-employment benefits4) | | 6,685 | | 495 | | 1,532 | | 671 | | 490 | | 9,873 | | | 7,153 | | | | 1,532 | | | | 796 | | | | 535 | | | | 10,016 | |
| | | | | | | | | | | | | | | | | | | | | | | | | | | |
| 1) | For details on DBO, please refer to section three“Change in the defined benefit obligation, DBO” of this note. |
| 2) | For details on plan assets, please refer to section four“Change in the plan assets” of this note. |
| 3) | Plans with a net surplus, i.e. where plan assets exceed DBO, are reported as Other financial assets, non-current, (please see Note C12, “Financial Assets”)assets”. None of the Company’s plans with net surplus are affected by restrictions on asset recognition.Asset ceiling amounted to SEK 217 (483) million. |
| 4) | Plans with net liabilities are reported in the Balance Sheetbalance sheet as Post-employment benefits, non-current. |
ERICSSON ANNUAL REPORT ON FORM 20-F 20092012
NOTES TO THE CONSOLIDATED FINANCIAL STATEMENTS—(Continued)
Section Two: Total Pension Expenses Recognizedpension expenses recognized in the Income Statementincome statement
The expenses for post-employment benefits within Ericsson are distributed between defined contribution plans and defined benefit plans, with a trend toward defined contribution plans.
Pension costs for defined contribution plans and defined benefit plans
| | | | | | | | | | | | | |
| | | Sweden | | UK | | Euro zone | | US | | Other | | Total | |
2009 | | | | | | | | | | | | | |
Pension cost for defined contribution plans | | 1,686 | | 73 | | 385 | | 124 | | 185 | | 2,453 | |
Pension cost for defined benefit plans1) | | 674 | | 66 | | 202 | | 49 | | 144 | | 1,135 | |
| | | | | | | | | | | | | |
Total | | 2,360 | | 139 | | 587 | | 173 | | 329 | | 3,588 | |
| | | | | | | | | | | | | |
Total pension cost expressed as a percentage of wages and salaries | | | | | | | | | | | | 8.7 | % |
| | | | | | | | | | | | | |
2008 | | | | | | | | | | | | | |
Pension cost for defined contribution plans | | 1,607 | | 40 | | 345 | | 114 | | 72 | | 2,178 | |
Pension cost for defined benefit plans1) | | 625 | | 156 | | 179 | | 35 | | 33 | | 1,028 | |
| | | | | | | | | | | | | |
Total | | 2,232 | | 196 | | 524 | | 149 | | 105 | | 3,206 | |
| | | | | | | | | | | | | |
Total pension cost expressed as a percentage of wages and salaries | | | | | | | | | | | | 8.3 | % |
| | | | | | | | | | | | | |
2007 | | | | | | | | | | | | | |
Pension cost for defined contribution plans | | 1,166 | | 265 | | 370 | | 105 | | 148 | | 2,054 | |
Pension cost for defined benefit plans1) | | 471 | | 279 | | 128 | | 42 | | 100 | | 1,020 | |
| | | | | | | | | | | | | |
Total | | 1,637 | | 544 | | 498 | | 147 | | 248 | | 3,074 | |
| | | | | | | | | | | | | |
Total pension cost expressed as a percentage of wages and salaries | | | | | | | | | | | | 9.0 | % |
| | | | | | | | | | | | | |
| | | | | | | | | | | | | | | | | | | | |
| | | Sweden | | | EU | | | US | | | Other | | | Total | |
2012 | | | | | | | | | | | | | | | | | | | | |
Pension cost for defined contribution plans | | | 977 | | | | 520 | | | | 404 | | | | 181 | | | | 2,082 | |
Pension cost for defined benefit plans1) | | | 936 | | | | 56 | | | | –454 | | | | 142 | | | | 680 | |
| | | | | | | | | | | | | | | | | | | | |
Total | | | 1,913 | | | | 576 | | | | –50 | | | | 323 | | | | 2,762 | |
| | | | | | | | | | | | | | | | | | | | |
Total pension cost expressed as a percentage of wages and salaries | | | | | | | | | | | | | | | | | | | 5.7 | % |
| | | | | | | | | | | | | | | | | | | | |
2011 | | | | | | | | | | | | | | | | | | | | |
Pension cost for defined contribution plans | | | 2,039 | | | | 458 | | | | 360 | | | | 185 | | | | 3,042 | |
Pension cost for defined benefit plans1) | | | 621 | | | | 38 | | | | 42 | | | | 146 | | | | 847 | |
| | | | | | | | | | | | | | | | | | | | |
Total | | | 2,660 | | | | 496 | | | | 402 | | | | 331 | | | | 3,889 | |
| | | | | | | | | | | | | | | | | | | | |
Total pension cost expressed as a percentage of wages and salaries | | | | | | | | | | | | | | | | | | | 8.9 | % |
| | | | | | | | | | | | | | | | | | | | |
2010 | | | | | | | | | | | | | | | | | | | | |
Pension cost for defined contribution plans | | | 1,037 | | | | 528 | | | | 244 | | | | 192 | | | | 2,001 | |
Pension cost for defined benefit plans1) | | | 762 | | | | 312 | | | | 30 | | | | –14 | | | | 1,090 | |
| | | | | | | | | | | | | | | | | | | | |
Total | | | 1,799 | | | | 840 | | | | 274 | | | | 178 | | | | 3,091 | |
| | | | | | | | | | | | | | | | | | | | |
Total pension cost expressed as a percentage of wages and salaries | | | | | | | | | | | | | | | | | | | 7.1 | % |
| | | | | | | | | | | | | | | | | | | | |
| 1) | See cost details in table below. |
ERICSSON ANNUAL REPORT ON FORM 20-F 20092012
NOTES TO THE CONSOLIDATED FINANCIAL STATEMENTS—(Continued)
COST DETAILS FORD DEFINED BENEFIT PLANS RECOGNIZED IN THE INCOME STATEMENTCost details for defined benefit plans recognized in the income statement
| | | | Sweden | | UK | | Euro zone | | US | | Other | | Total | | Sweden | | | EU | | | US | | | Other | | | Total | |
2009 | | | | | | | | | | | | | |
2012 | | | | | | | | | | | |
Current service cost | | 594 | | 205 | | 138 | | 35 | | 131 | | 1,103 | | | 777 | | | | 169 | | | | 140 | | | | 194 | | | | 1,280 | |
Interest cost | | 590 | | 284 | | 194 | | 171 | | 155 | | 1,394 | | | 717 | | | | 475 | | | | 752 | | | | 176 | | | | 2,120 | |
Expected return on plan assets | | –366 | | –270 | | –125 | | –156 | | –208 | | –1,125 | | | –579 | | | | –483 | | | | –1,060 | | | | –235 | | | | –2,357 | |
Past service cost | | — | | — | | 5 | | — | | 25 | | 30 | | | — | | | | 13 | | | | –1 | | | | 8 | | | | 20 | |
Curtailments and settlements | | –144 | | –153 | | –10 | | –1 | | 41 | | –267 | |
Curtailments, settlements and other | | | | 21 | | | | –118 | | | | ��285 | | | | –1 | | | | –383 | |
| | | | | | | | | | | | | | | | | | | | | | | | | | | |
Total | | 674 | | 66 | | 202 | | 49 | | 144 | | 1,135 | | | 936 | | | | 56 | | | | –454 | | | | 142 | | | | 680 | |
| | | | | | | | | | | | | | | | | | | | | | | | | | | |
2008 | | | | | | | | | | | | | |
2011 | | | | | | | | | | | |
Current service cost | | 539 | | 186 | | 141 | | 29 | | 122 | | 1,017 | | | 547 | | | | 227 | | | | 26 | | | | 157 | | | | 957 | |
Interest cost | | 549 | | 299 | | 160 | | 142 | | 133 | | 1,283 | | | 714 | | | | 461 | | | | 151 | | | | 169 | | | | 1,495 | |
Expected return on plan assets | | –431 | | –310 | | –143 | | –137 | | –201 | | –1,222 | | | –558 | | | | –474 | | | | –135 | | | | –243 | | | | –1,410 | |
Past service cost | | — | | — | | 11 | | — | | 8 | | 19 | | | 6 | | | | 10 | | | | — | | | | 9 | | | | 25 | |
Curtailments and settlements | | –32 | | –19 | | 10 | | 1 | | –29 | | –69 | |
Curtailments, settlements and other | | | | –88 | | | | –186 | | | | — | | | | 54 | | | | –220 | |
| | | | | | | | | | | | | | | | | | | | | | | | | | | |
Total | | 625 | | 156 | | 179 | | 35 | | 33 | | 1,028 | | | 621 | | | | 38 | | | | 42 | | | | 146 | | | | 847 | |
| | | | | | | | | | | | | | | | | | | | | | | | | | | |
2007 | | | | | | | | | | | | | |
2010 | | | | | | | | | | | |
Current service cost | | 473 | | 257 | | 186 | | 33 | | 140 | | 1,089 | | | 631 | | | | 290 | | | | 32 | | | | 140 | | | | 1,093 | |
Interest cost | | 435 | | 307 | | 135 | | 139 | | 109 | | 1,125 | | | 643 | | | | 496 | | | | 159 | | | | 172 | | | | 1,470 | |
Expected return on plan assets | | –412 | | –285 | | –125 | | –135 | | –163 | | –1,120 | | | –511 | | | | –463 | | | | –130 | | | | –253 | | | | –1,357 | |
Past service cost | | — | | — | | — | | 3 | | 8 | | 11 | | | — | | | | 33 | | | | — | | | | 9 | | | | 42 | |
Curtailments and settlements | | –25 | | — | | –68 | | 2 | | 6 | | –85 | |
Curtailments, settlements and other | | | | –1 | | | | –44 | | | | –31 | | | | –82 | | | | –158 | |
| | | | | | | | | | | | | | | | | | | | | | | | | | | |
Total | | 471 | | 279 | | 128 | | 42 | | 100 | | 1,020 | | | 762 | | | | 312 | | | | 30 | | | | –14 | | | | 1,090 | |
| | | | | | | | | | | | | | | | | | | | | | | | | | | |
Sections three to sixERICSSON ANNUAL REPORT ON FORM 20-F 2012
The following sections focus on the defined benefit plansplans.
Section Three: Change in the Defined Benefit Obligation DBO(DBO)
The DBO is the gross pension liability.
| | | | | | | | | | | | |
| | | Sweden | | UK | | Euro zone | | US | | Other | | Total |
2009 | | | | | | | | | | | | |
Opening balance | | 14,866 | | 4,867 | | 3,557 | | 2,789 | | 1,931 | | 28,010 |
Current service cost | | 594 | | 205 | | 138 | | 35 | | 131 | | 1,103 |
Interest cost | | 590 | | 284 | | 194 | | 171 | | 155 | | 1,394 |
Employee contributions | | — | | 14 | | 4 | | — | | 12 | | 30 |
Pension payments | | –107 | | –108 | | –90 | | –172 | | –142 | | –619 |
Actuarial gain/loss (-/+) | | 351 | | 543 | | 204 | | 143 | | –120 | | 1,121 |
Settlements | | — | | — | | — | | — | | –1 | | –1 |
Curtailments | | –144 | | –153 | | –14 | | — | | — | | –311 |
Business combinations | | — | | — | | — | | — | | –13 | | –13 |
Other | | — | | –13 | | 74 | | 26 | | 40 | | 127 |
Translation difference | | — | | 49 | | –227 | | –211 | | 265 | | –124 |
| | | | | | | | | | | | |
Closing balance | | 16,150 | | 5,688 | | 3,840 | | 2,781 | | 2,258 | | 30,717 |
| | | | | | | | | | | | |
Of which medical benefit schemes | | — | | — | | — | | 631 | | — | | 631 |
| | | | | | | | | | | | |
ERICSSON ANNUAL REPORT ON FORM 20-F 2009
NOTES TO THE CONSOLIDATED FINANCIAL STATEMENTS—(Continued)Change in the defined benefit obligation
| | | | Sweden | | UK | | Euro zone | | US | | Other | | Total | | Sweden | | | EU | | | US | | | Other | | | Total | |
| 2008 | | | | | | | | | | | | | |
2012 | | | | | | | | | | | |
Opening balance | | 12,512 | | 5,606 | | 3,079 | | 2,238 | | 1,791 | | 25,226 | | | 20,643 | | | | 9,994 | | | | 3,133 | | | | 2,605 | | | | 36,375 | |
Current service cost | | 539 | | 186 | | 141 | | 29 | | 122 | | 1,017 | | | 777 | | | | 169 | | | | 140 | | | | 194 | | | | 1,280 | |
Interest cost | | 549 | | 299 | | 160 | | 142 | | 133 | | 1,283 | | | 717 | | | | 475 | | | | 752 | | | | 176 | | | | 2,120 | |
Employee contributions | | — | | 43 | | 4 | | — | | 12 | | 59 | | | — | | | | 15 | | | | — | | | | 7 | | | | 22 | |
Pension payments | | –74 | | –87 | | –133 | | –144 | | –86 | | –524 | | | –282 | | | | –195 | | | | –871 | | | | –130 | | | | –1,478 | |
Actuarial gain/loss (-/+) | | 1,372 | | –436 | | –185 | | 38 | | 25 | | 814 | |
Actuarial gain/loss (–/+) | | | | –436 | | | | 634 | | | | 1,875 | | | | 394 | | | | 2,467 | |
Settlements | | — | | — | | — | | — | | –16 | | –16 | | | –22 | | | | 129 | | | | –55 | | | | –2 | | | | 50 | |
Curtailments | | –32 | | –19 | | 10 | | 1 | | –13 | | –53 | | | — | | | | –31 | | | | — | | | | — | | | | –31 | |
Business combinations1) | | — | | — | | –14 | | — | | — | | –14 | | | — | | | | 13 | | | | 12,565 | | | | — | | | | 12,578 | |
Other | | — | | –7 | | 7 | | 19 | | –7 | | 12 | | | 35 | | | | –3 | | | | –263 | | | | 159 | | | | –72 | |
Translation difference | | — | | –718 | | 488 | | 466 | | –30 | | 206 | | | — | | | | –265 | | | | –804 | | | | –284 | | | | –1,353 | |
| | | | | | | | | | | | | | | | | | | | | | | | | | | |
Closing balance | | 14,866 | | 4,867 | | 3,557 | | 2,789 | | 1,931 | | 28,010 | | | 21,432 | | | | 10,935 | | | | 16,472 | | | | 3,119 | | | | 51,958 | |
| | | | | | | | | | | | | | | | | | | | | | | | | | | |
Of which medical benefit schemes | | — | | — | | — | | 639 | | — | | 639 | | | — | | | | — | | | | 423 | | | | — | | | | 423 | |
| | | | | | | | | | | | | | | | | | | | | | | | | | | |
2011 | | | | | | | | | | | |
Opening balance | | | | 14,980 | | | | 8,600 | | | | 2,693 | | | | 2,437 | | | | 28,710 | |
Current service cost | | | | 547 | | | | 227 | | | | 26 | | | | 157 | | | | 957 | |
Interest cost | | | | 714 | | | | 461 | | | | 151 | | | | 169 | | | | 1,495 | |
Employee contributions | | | | — | | | | 15 | | | | — | | | | 1 | | | | 16 | |
Pension payments | | | | –220 | | | | –228 | | | | –149 | | | | –144 | | | | –741 | |
Actuarial gain/loss (–/+) | | | | 4,705 | | | | 1,030 | | | | 329 | | | | 120 | | | | 6,184 | |
Settlements | | | | — | | | | — | | | | — | | | | — | | | | — | |
Curtailments | | | | –88 | | | | –183 | | | | — | | | | — | | | | –271 | |
Business combinations | | | | — | | | | 2 | | | | — | | | | — | | | | 2 | |
Other | | | | 5 | | | | 1 | | | | 22 | | | | 15 | | | | 43 | |
Translation difference | | | | — | | | | 69 | | | | 61 | | | | –150 | | | | –20 | |
| | | | | | | | | | | | | | | | |
Closing balance | | | | 20,643 | | | | 9,994 | | | | 3,133 | | | | 2,605 | | | | 36,375 | |
| | | | | | | | | | | | | | | | |
Of which medical benefit schemes | | | | — | | | | — | | | | 658 | | | | — | | | | 658 | |
| | | | | | | | | | | | | | | | |
| 1) | Business combinations in 20082012 are related to the divestureacquisition of the Enterprise Business.Telcordia. |
ERICSSON ANNUAL REPORT ON FORM 20-F 2012
Funded Status
The funded ratio, defined as total plan assets in relation to the total defined benefit obligation (DBO),DBO, was 75.5 percent85.9% in 2009,2012, compared to 68.0 percent77.0% in 2008.2011.
The following table summarizes the value of the DBO per geographical area based on whether there are plan assets wholly or partially funding each pension plan.
| | | | | | | | | | | | |
| | | Sweden | | UK | | Euro zone | | US | | Other | | Total |
| | | | | | |
2009 | | | | | | | | | | | | |
DBO, closing balance | | 16,150 | | 5,688 | | 3,840 | | 2,781 | | 2,258 | | 30,717 |
Of which partially or fully funded | | 15,660 | | 5,688 | | 2,659 | | 2,119 | | 1,813 | | 27,939 |
Of which unfunded | | 490 | | — | | 1,181 | | 662 | | 445 | | 2,778 |
2008 | | | | | | | | | | | | |
DBO, closing balance | | 14,866 | | 4,867 | | 3,557 | | 2,789 | | 1,931 | | 28,010 |
Of which partially or fully funded | | 14,375 | | 4,867 | | 2,355 | | 2,118 | | 1,522 | | 25,237 |
Of which unfunded | | 491 | | — | | 1,202 | | 671 | | 409 | | 2,773 |
ERICSSON ANNUAL REPORT ON FORM 20-F 2009
NOTES TO THE CONSOLIDATED FINANCIAL STATEMENTS—(Continued)Value of the defined benefit obligation
| | | | | | | | | | | | | | | | | | | | |
| | | Sweden | | | EU | | | US | | | Other | | | Total | |
2012 | | | | | | | | | | | | | | | | | | | | |
DBO, closing balance | | | 21,432 | | | | 10,935 | | | | 16,472 | | | | 3,119 | | | | 51,958 | |
Of which partially or fully funded | | | 20,916 | | | | 9,623 | | | | 15,895 | | | | 2,441 | | | | 48,875 | |
Of which unfunded | | | 516 | | | | 1,312 | | | | 577 | | | | 678 | | | | 3,083 | |
2011 | | | | | | | | | | | | | | | | | | | | |
DBO, closing balance | | | 20,643 | | | | 9,994 | | | | 3,133 | | | | 2,605 | | | | 36,375 | |
Of which partially or fully funded | | | 20,118 | | | | 8,847 | | | | 2,447 | | | | 2,118 | | | | 33,530 | |
Of which unfunded | | | 525 | | | | 1,147 | | | | 686 | | | | 487 | | | | 2,845 | |
Section Four: Change in the Plan Assetsplan assets
A majority of pension plans have assets managed by local Pension Trust funds, whose sole purpose is to secure the future pension payments to the employees.
Change in the plan assets
| | | | | | | | | | | | |
| | | Sweden | | UK | | Euro zone | | US | | Other | | Total |
2009 | | | | | | | | | | | | |
| | | | | | |
Opening balance | | 8,181 | | 4,407 | | 2,330 | | 2,289 | | 1,830 | | 19,037 |
Expected return on plan assets | | 366 | | 270 | | 125 | | 156 | | 208 | | 1,125 |
Actuarial gain/loss (+/-) | | 1,076 | | 342 | | –136 | | –253 | | 162 | | 1,191 |
Employer contributions | | 1,305 | | 387 | | 213 | | 49 | | 122 | | 2,076 |
Employee contributions | | — | | 14 | | 4 | | — | | 12 | | 30 |
Pension payments | | — | | –122 | | –75 | | –115 | | –125 | | –437 |
Settlements | | — | | — | | — | | — | | — | | — |
Business combinations | | — | | — | | –1 | | — | | –11 | | –12 |
Other | | –1 | | — | | 90 | | — | | –2 | | 87 |
Translation difference | | — | | 38 | | –144 | | –152 | | 367 | | 109 |
| | | | | | | | | | | | |
Closing balance | | 10,927 | | 5,336 | | 2,406 | | 1,974 | | 2,563 | | 23,206 |
| | | | | | | | | | | | |
2008 | | | | | | | | | | | | |
Opening balance | | 9,463 | | 4,854 | | 2,104 | | 1,779 | | 2,036 | | 20,236 |
Expected return on plan assets | | 431 | | 310 | | 143 | | 137 | | 201 | | 1,222 |
Actuarial gain/loss (+/-) | | –1,713 | | –595 | | –343 | | 19 | | –320 | | –2,952 |
Employer contributions | | — | | 527 | | 132 | | 61 | | 85 | | 805 |
Employee contributions | | — | | 43 | | 4 | | — | | 12 | | 59 |
Pension payments | | — | | –95 | | –30 | | –88 | | –73 | | –286 |
Settlements | | — | | — | | — | | — | | –16 | | –16 |
Business combinations1) | | — | | — | | –2 | | — | | — | | –2 |
Other | | — | | — | | — | | — | | –5 | | –5 |
Translation difference | | — | | –637 | | 322 | | 381 | | –90 | | –24 |
| | | | | | | | | | | | |
Closing balance | | 8,181 | | 4,407 | | 2,330 | | 2,289 | | 1,830 | | 19,037 |
| | | | | | | | | | | | |
| | | | | | | | | | | | | | | | | | | | |
| | | Sweden | | | EU | | | US | | | Other | | | Total | |
2012 | | | | | | | | | | | | | | | | | | | | |
Opening balance | | | 13,490 | | | | 9,415 | | | | 2,337 | | | | 2,777 | | | | 28,019 | |
Expected return on plan assets | | | 579 | | | | 483 | | | | 1,060 | | | | 235 | | | | 2,357 | |
Actuarial gain/loss (+/–) | | | 377 | | | | 219 | | | | 994 | | | | 44 | | | | 1,634 | |
Employer contributions | | | 1,183 | | | | 332 | | | | 115 | | | | 121 | | | | 1,751 | |
Employee contributions | | | — | | | | 15 | | | | — | | | | 7 | | | | 22 | |
Pension payments | | | –247 | | | | –153 | | | | –817 | | | | –94 | | | | –1,311 | |
Settlements | | | –17 | | | | 220 | | | | –47 | | | | — | | | | 156 | |
Business combinations1) | | | — | | | | — | | | | 13,417 | | | | — | | | | 13,417 | |
Other | | | 10 | | | | –23 | | | | –7 | | | | –22 | | | | –42 | |
Translation difference | | | — | | | | –233 | | | | –789 | | | | –339 | | | | –1,361 | |
| | | | | | | | | | | | | | | | | | | | |
Closing balance | | | 15,375 | | | | 10,275 | | | | 16,263 | | | | 2,729 | | | | 44,642 | |
| | | | | | | | | | | | | | | | | | | | |
2011 | | | | | | | | | | | | | | | | | | | | |
Opening balance | | | 12,389 | | | | 8,205 | | | | 2,048 | | | | 2,793 | | | | 25,435 | |
Expected return on plan assets | | | 558 | | | | 474 | | | | 135 | | | | 243 | | | | 1,410 | |
Actuarial gain/loss (+/–) | | | –358 | | | | 437 | | | | 155 | | | | –84 | | | | 150 | |
Employer contributions | | | 1,086 | | | | 397 | | | | 54 | | | | 125 | | | | 1,662 | |
Employee contributions | | | — | | | | 15 | | | | — | | | | 1 | | | | 16 | |
Pension payments | | | –185 | | | | –187 | | | | –98 | | | | –102 | | | | –572 | |
Other | | | — | | | | –15 | | | | — | | | | –4 | | | | –19 | |
Translation difference | | | — | | | | 89 | | | | 43 | | | | –195 | | | | –63 | |
| | | | | | | | | | | | | | | | | | | | |
Closing balance | | | 13,490 | | | | 9,415 | | | | 2,337 | | | | 2,777 | | | | 28,019 | |
| | | | | | | | | | | | | | | | | | | | |
| 1) | Business combinations in 20082012 are related to the divestureacquisition of the Enterprise Business.Telcordia. |
ERICSSON ANNUAL REPORT ON FORM 20-F 2012
Refunds from or reductions in future contributions to plan assets are recognized if they are available and firmly decided.
ACTUAL RETURN ON PLAN ASSETSActual return on plan assets
| | | | | | | | | | | | |
| | | Sweden | | UK | | Euro zone | | US | | Other | | Total |
2009 | | 1,441 | | 612 | | –10 | | –97 | | 370 | | 2,316 |
2008 | | –1,283 | | –284 | | –200 | | 156 | | –119 | | –1,730 |
ERICSSON ANNUAL REPORT ON FORM 20-F 2009
| | | | | | | | | | | | | | | | | | | | |
| | | Sweden | | | EU | | | US | | | Other | | | Total | |
2012 | | | 956 | | | | 702 | | | | 2,054 | | | | 279 | | | | 3,991 | |
2011 | | | 200 | | | | 911 | | | | 289 | | | | 160 | | | | 1,560 | |
NOTES TO THE CONSOLIDATED FINANCIAL STATEMENTS—(Continued)Asset Allocation
ASSET ALLOCATION
| | | | Sweden | | UK | | Euro zone | | US | | Other | | Total | | Sweden | | | EU | | | US | | | Other | | | Total | |
2009 | | | | | | | | | | | | | |
2012 | | | | | | | | | | | |
Equities | | 3,824 | | 1,825 | | 1,094 | | 1,069 | | 394 | | 8,063 | | | 4,867 | | | | 3,168 | | | | 5,103 | | | | 319 | | | | 13,457 | |
Interest-bearing securities | | 7,103 | | 2,801 | | 1,051 | | 741 | | 1,747 | | 13,586 | | | 9,665 | | | | 5,900 | | | | 10,042 | | | | 1,727 | | | | 27,334 | |
Other | | — | | 710 | | 261 | | 164 | | 422 | | 1,557 | | | 843 | | | | 1,207 | | | | 1,118 | | | | 683 | | | | 3,851 | |
| | | | | | | | | | | | | | | | | | | | | | | | | | | |
Total | | 10,927 | | 5,336 | | 2,406 | | 1,974 | | 2,563 | | 23,206 | | | 15,375 | | | | 10,275 | | | | 16,263 | | | | 2,729 | | | | 44,642 | |
| | | | | | | | | | | | | | | | |
Of which Ericsson securities | | — | | — | | — | | — | | — | | — | | | — | | | | — | | | | — | | | | — | | | | — | |
| | | | | | | | | | | | | | | | | | | | | | | | | | | |
2008 | | | | | | | | | | | | | |
2011 | | | | | | | | | | | |
Equities | | 2,577 | | 1,674 | | 900 | | 831 | | 306 | | 6,288 | | | 4,503 | | | | 3,014 | | | | 1,062 | | | | 356 | | | | 8,935 | |
Interest-bearing securities | | 5,604 | | 2,161 | | 1,291 | | 1,256 | | 1,258 | | 11,570 | | | 8,239 | | | | 5,265 | | | | 1,210 | | | | 1,846 | | | | 16,560 | |
Other | | — | | 572 | | 139 | | 202 | | 266 | | 1,179 | | | 748 | | | | 1,136 | | | | 65 | | | | 575 | | | | 2,524 | |
| | | | | | | | | | | | | | | | | | | | | | | | | | | |
Total | | 8,181 | | 4,407 | | 2,330 | | 2,289 | | 1,830 | | 19,037 | | | 13,490 | | | | 9,415 | | | | 2,337 | | | | 2,777 | | | | 28,019 | |
| | | | | | | | | | | | | | | | |
Of which Ericsson securities | | — | | — | | — | | — | | — | | — | | | — | | | | — | | | | — | | | | — | | | | — | |
| | | | | | | | | | | | | | | | | | | | | | | | | | | |
Equity instruments amount to 35 percent30% (32%) of the total assets, interest bearing instruments amount to 59 percent61% (59%) of the total assets, and other instruments amount to 6 percent9% (9%) of the total assets.
The contributions to the defined benefit plans for the upcoming year will be based on the development of the financial markets as well as on the growth of the pension liability, and how these developments affect the target funding ratio of the Company.
Section Five: Actuarial Gainsgains and Losses Reported Directlylosses reported directly in OCIOther comprehensive income
| | | | |
| | | 2009 | | 2008 |
Cumulative gain/loss (-/+) at beginning of year | | 5,402 | | 1,806 |
Recognized gain/loss (-/+) during the year | | –70 | | 3,765 |
Other1) | | – | | –7 |
Translation difference | | –6 | | –162 |
| | | | |
Cumulative gain/loss (-/+) at end of year | | 5,326 | | 5,402 |
| | | | |
1) | The gain in 2008 is related to terminated pension plans. |
Since January 1, 2006, Ericssonthe Company applies immediate recognition of actuarial gains and losses directly in OCI, as disclosed in the statement of OCI.Other comprehensive income. Actuarial gains and losses may arise from either a change in actuarial assumptions or in deviations between estimated and actual outcome.
MULTI- YEAR SUMMARYMulti-year summary
| | | | | | | | | | |
| | | 2009 | | 2008 | | 2007 | | 2006 | | 2005 |
Plan assets | | 23,206 | | 19,037 | | 20,236 | | 18,395 | | 16,784 |
DBO | | 30,717 | | 28,010 | | 25,226 | | 24,612 | | 22,314 |
| | | | | | | | | | |
Deficit/Surplus (-/+) | | –7,511 | | –8,973 | | –4,990 | | –6,217 | | –5,530 |
Actuarial gains and losses (-/+) | | | | | | | | | | |
Experience-based adjustments of pension obligations | | 310 | | 57 | | –76 | | 232 | | –415 |
Experience-based adjustments of plan assets | | –1,191 | | 2,952 | | 59 | | –358 | | –706 |
| | | | | | | | | | | | | | | | | | | | |
| | | 2012 | | | 2011 | | | 2010 | | | 2009 | | | 2008 | |
Plan assets | | | 44,642 | | | | 28,019 | | | | 25,435 | | | | 23,206 | | | | 19,037 | |
DBO | | | 51,958 | | | | 36,375 | | | | 28,710 | | | | 30,717 | | | | 28,010 | |
| | | | | | | | | | | | | | | | | | | | |
Deficit/Surplus (–/+) | | | –7,316 | | | | –8,356 | | | | –3,275 | | | | –7,511 | | | | –8,973 | |
Actuarial gains and losses (–/+) | | | | | | | | | | | | | | | | | | | | |
Experience-based adjustments of pension obligations | | | –362 | | | | –463 | | | | 177 | | | | 310 | | | | 57 | |
Experience-based adjustments of plan assets | | | –1,634 | | | | –150 | | | | –653 | | | | –1,191 | | | | 2,952 | |
ERICSSON ANNUAL REPORT ON FORM 20-F 20092012
NOTES TO THE CONSOLIDATED FINANCIAL STATEMENTS—(Continued)
Section Six: Actuarial Assumptionsgains and losses reported directly in Other comprehensive income
| | | | | | | | | | | | | | | |
| | | Sweden | | | UK | | | Euro zone1) | | | US1) | | | Other1) | |
2009 | | | | | | | | | | | | | | | |
Discount rate | | 4.00 | % | | 5.60 | % | | 5.26 | % | | 5.89 | % | | 8.91 | % |
Expected return on plan assets for the year | | 4.55 | % | | 6.00 | % | | 6.31 | % | | 7.00 | % | | 9.34 | % |
Future salary increases | | 3.25 | % | | 4.90 | % | | 2.92 | % | | 4.50 | % | | 6.77 | % |
Inflation | | 2.00 | % | | 3.60 | % | | 2.17 | % | | 2.50 | % | | 3.80 | % |
Health care cost inflation, current year | | n/a | | | n/a | | | n/a | | | 9.00 | % | | n/a | |
Life expectancy after age 65 in years, males | | 21 | | | 21 | | | 22 | | | 18 | | | 18 | |
Life expectancy after age 65 in years, females | | 24 | | | 24 | | | 25 | | | 20 | | | 22 | |
2008 | | | | | | | | | | | | | | | |
Discount rate | | 4.00 | % | | 5.50 | % | | 5.86 | % | | 6.25 | % | | 8.53 | % |
Expected return on plan assets for the year | | 4.55 | % | | 6.40 | % | | 6.51 | % | | 7.50 | % | | 10.05 | % |
Future salary increases | | 3.25 | % | | 4.30 | % | | 3.00 | % | | 4.50 | % | | 6.81 | % |
Inflation | | 2.00 | % | | 3.00 | % | | 2.25 | % | | 2.50 | % | | 4.23 | % |
Health care cost inflation, current year | | n/a | | | n/a | | | n/a | | | 9.00 | % | | n/a | |
Life expectancy after age 65 in years, males | | 21 | | | 21 | | | 22 | | | 18 | | | 18 | |
Life expectancy after age 65 in years, females | | 24 | | | 24 | | | 25 | | | 20 | | | 22 | |
| | | | | | | | |
| | | 2012 | | | 2011 | |
Cumulative gain/loss (–/+) at beginning of year | | | 7,911 | | | | 1,849 | |
Recognized gain/loss (–/+) during the year | | | 833 | | | | 6,034 | |
Translation difference | | | –48 | | | | 28 | |
| | | | | | | | |
Cumulative gain/loss (–/+) at end of year | | | 8,696 | | | | 7,911 | |
| | | | | | | | |
Total remeasurements in Other comprehensive income related to post-employment benefits
| | | | | | | | |
| | | 2012 | | | 2011 | |
Actuarial gains and losses (+/–) | | | –833 | | | | –6,034 | |
The effect of asset ceiling | | | 266 | | | | 208 | |
Swedish special payroll taxes | | | 116 | | | | –1,137 | |
Total | | | –451 | | | | –6,963 | |
| | | | | | | | |
Actuarial gains and losses for joint ventures and associated companies | | | 50 | | | | –212 | |
| | | | | | | | |
Actuarial assumptions
Financial and demographic actuarial assumptions
| | | | | | | | | | | | | | | | |
| | | Sweden | | | EU1) | | | US1) | | | Other1) | |
2012 | | | | | | | | | | | | | | | | |
Discount rate | | | 3.50 | % | | | 4.55 | % | | | 4.00 | % | | | 7.24 | % |
Expected return on plan assets for the year | | | 4.33 | % | | | 5.11 | % | | | 7.00 | % | | | 9.06 | % |
Future salary increases | | | 3.25 | % | | | 3.63 | % | | | 4.50 | % | | | 5.57 | % |
Inflation | | | 2.00 | % | | | 2.20 | % | | | 2.50 | % | | | 1.35 | % |
Health care cost inflation, current year | | | n/a | | | | n/a | | | | 9.00 | % | | | n/a | |
Life expectancy after age 65 in years, males | | | 22 | | | | 22 | | | | 19 | | | | 19 | |
Life expectancy after age 65 in years, females | | | 24 | | | | 24 | | | | 21 | | | | 22 | |
2011 | | | | | | | | | | | | | | | | |
Discount rate | | | 3.50 | % | | | 4.90 | % | | | 5.23 | % | | | 8.18 | % |
Expected return on plan assets for the year | | | 4.55 | % | | | 5.73 | % | | | 7.00 | % | | | 9.27 | % |
Future salary increases | | | 3.25 | % | | | 3.71 | % | | | 4.50 | % | | | 6.07 | % |
Inflation | | | 2.00 | % | | | 2.74 | % | | | 2.50 | % | | | 3.43 | % |
Health care cost inflation, current year | | | n/a | | | | n/a | | | | 9.00 | % | | | n/a | |
Life expectancy after age 65 in years, males | | | 22 | | | | 22 | | | | 19 | | | | 19 | |
Life expectancy after age 65 in years, females | | | 24 | | | | 24 | | | | 21 | | | | 22 | |
| 1) | Weighted average for disclosure purposes only. Land specific assumptions were used for each actuarial calculation. |
Actuarial assumptions are assessed on a quarterly basis.
The discount rate for each country is determined by reference to market yields on high-quality corporate bonds. In countries where there is no deep market in such bonds, the market yields on government bonds are used.
The overall expected long-term return on plan assets is a weighted average of each asset category’s expected rate of return. The expected return on interest-bearing investments is set in line with each country’s market yield. Expected return on equities is derived from each country’s risk free rate with the addition of a risk premium.
ERICSSON ANNUAL REPORT ON FORM 20-F 2012
Salary increases are partially affected by fluctuations in inflation rate.
The net periodic pension cost and the present value of the DBO for current and former employees are calculated using the Projected Unit Credit (PUC) actuarial cost method, where the objective is to spread the cost of each employee’s benefits over the period that the employee works for the Company.
Sensitivity Analysisanalysis for Medical Benefit Schemesmedical benefit schemes
The effect (in SEK million) of aA one percentage pointpercent change in the assumed trend rate of medical cost would have the following effect:
| | | | |
| | | 1 percent
increase | | 1 percent
decrease |
Net periodic post-employment medical cost | | 4 | | –3 |
Accumulated post-employment benefit obligation for medical costs | | 59 | | –50 |
ERICSSON ANNUAL REPORT ON FORM 20-F 2009effect (in SEK million):
NOTES TO THE CONSOLIDATED FINANCIAL STATEMENTS—(Continued)Sensitivity analysis for medical benefit schemes
| | | | | | | | |
| | | 1%
increase | | | 1%
decrease | |
Net periodic post-employment medical cost | | | 3 | | | | –3 | |
Accumulated post-employment benefit obligation for medical costs | | | 32 | | | | –28 | |
Section Seven: Summary Information on Pension Plans per Geographical Zoneissues affecting the net pension liability for the year
Applicable to all countries: In 2009, the positive returnSweden
The defined benefit obligation has been calculated using a discount rate based on yields of plan assets resulted in an actuarial gain and an increase in the total valuecovered bonds, which is higher than a discount rate based on yields of the plan assets.government bonds. The actuarial gain on plan assets is the difference between the expected return on planSwedish covered bonds are considered high-quality bonds, mainly AAA-rated, as they are secured with assets, and the actual return on plan assets. Changes in discount rate resulted in an overall actuarial lossmarket for covered bonds is considered deep and an increase in the defined benefit obligation. The net actuarial gain amounted to SEK 70 million.
Sweden:
In 2009, the Swedish discount rate is unchanged compared to 2008. The actuarial loss was purely due to experience-based adjustments on pension obligations and plan assets. Sweden was positively affected by the positive performance of the plan assets and the employer contribution to the Swedish Trust fund.liquid, thereby meeting IAS19 requirements.
As before, Ericsson has secured the disability-disability and survivors’ pension part of the ITP Plan through an insurance solution with the insurance company Alecta. Although this part of the plan is classified as a multi-employer defined benefit plan, it hasis not been possible for Ericsson to get sufficient information to apply defined benefit accounting, and therefore, it has been accounted for as a defined contribution plan.
Alecta has a collective funding ratio which is a buffer for its insurance commitments to protect against fluctuations in investment return and insurance risks. Alecta’s target ratio is 140 percent140% and reflects the fair value of Alecta’s plan assets as a percentage of plan commitments, then measured in accordance with Alecta’s actuarial assumptions, which are different from those in IAS 19. Alecta’s collective funding ratio was 129% (113%) as of December 31, 2012.
UK:
The increaseContingent liabilities include the Company’s mutual responsibility as a credit insured company of PRI Pensionsgaranti in the discount rate was more than offset by the riseSweden. This mutual responsibility can only be imposed in inflationcase PRI Pensionsgaranti has consumed all of their assets, and future salary increases, which resulted in an overall actuarial loss. The restructuringit amounts to a maximum of 2% of the UK operations resultedcompany’s pension liability in a curtailment of approximately SEK 150 million.
Euro zone:
Germany, Italy and Ireland are the countries with the most significant defined benefit pension plans within the Euro zone.
The discount rate for the Euro zone decreased, resulting in an increase in the defined benefit obligation and an actuarial loss.
US:
The discount rate decreased resulting in an increase in the defined benefit obligation and an actuarial loss.
Other:
Brazil is the country included in Other with the most significant defined benefit pension plan.
Sweden.ERICSSON ANNUAL REPORT ON FORM 20-F 20092012
NOTES TO THE CONSOLIDATED FINANCIAL STATEMENTS—(Continued)
C18 PROVISIONS
Provisions
| | | | Warranty
commitments | | Restructuring | | Project
related | | Other | | Total | | Warranty | | | Restructuring | | | Project related | | | Other | | | Total | |
2009 | | | | | | | | | | | |
2012 | | | | | | | | | | | |
Opening balance | | 1,931 | | 3,830 | | 3,794 | | 4,795 | | 14,350 | | | 1,888 | | | | 1,327 | | | | 718 | | | | 2,332 | | | | 6,265 | |
Additions | | 2,141 | | 4,920 | | 1,952 | | 2,129 | | 11,142 | | | 1,088 | | | | 1,234 | | | | 278 | | | | 4,411 | | | | 7,011 | |
Reversal of excess amounts | | –171 | | –210 | | –451 | | –915 | | –1,747 | | | –157 | | | | –150 | | | | –234 | | | | –532 | | | | –1,073 | |
Negative effect on Income Statement | | | | | | | | | | 9,395 | | | | | | | | | | | 5,938 | |
Utilization/Cash out | | –1,427 | | –4,248 | | –3,459 | | –1,595 | | –10,729 | |
Cash out/utilization | | | | –1,188 | | | | –1,170 | | | | –376 | | | | –741 | | | | –3,475 | |
Balances regarding divested/acquired businesses | | 96 | | — | | — | | 16 | | 112 | | | 48 | | | | – | | | | 10 | | | | 82 | | | | 140 | |
Reclassification | | 19 | | 146 | | –128 | | –595 | | –558 | | | 1 | | | | 11 | | | | 4 | | | | –38 | | | | –22 | |
Translation differences | | –56 | | –139 | | –14 | | 70 | | –139 | | | –85 | | | | –34 | | | | –22 | | | | –67 | | | | –208 | |
| | | | | | | | | | | | | | | | | | | | | | | | | |
Closing balance | | 2,533 | | 4,299 | | 1,694 | | 3,905 | | 12,431 | | | 1,595 | | | | 1,218 | | | | 378 | | | | 5,447 | | | | 8,638 | |
| | | | | | | | | | | | | | | | | | | | | | | | | |
2008 | | | | | | | | | | | |
2011 | | | | | | | | | | | |
Opening balance | | 1,814 | | 1,051 | | 2,619 | | 4,242 | | 9,726 | | | 2,469 | | | | 3,230 | | | | 1,105 | | | | 2,940 | | | | 9,744 | |
Additions | | 1,568 | | 4,328 | | 3,960 | | 2,105 | | 11,961 | | | 1,433 | | | | 1,806 | | | | 563 | | | | 1,005 | | | | 4,807 | |
Reversal of excess amounts | | –392 | | –131 | | –799 | | –493 | | –1,815 | | | –440 | | | | –407 | | | | –164 | | | | –908 | | | | –1,919 | |
Negative effect on Income Statement | | | | | | | | | | 10,146 | | | | | | | | | | | 2,888 | |
Utilization/Cash out | | –1,150 | | –1,756 | | –2,164 | | –970 | | –6,040 | |
Cash out/utilization | | | | –1,527 | | | | –3,223 | | | | –662 | | | | –575 | | | | –5,987 | |
Balances regarding divested/acquired businesses | | –30 | | –2 | | –51 | | –15 | | –98 | | | 21 | | | | – | | | | – | | | | 2 | | | | 23 | |
Reclassification | | 1 | | 71 | | 45 | | –173 | | –56 | | | – | | | | –48 | | | | –111 | | | | –87 | | | | –246 | |
Translation differences | | 120 | | 269 | | 184 | | 99 | | 672 | | | –68 | | | | –31 | | | | –13 | | | | –45 | | | | –157 | |
| | | | | | | | | | | | | | | | | | | | | | | | | |
Closing balance | | 1,931 | | 3,830 | | 3,794 | | 4,795 | | 14,350 | | | 1,888 | | | | 1,327 | | | | 718 | | | | 2,332 | | | | 6,265 | |
| | | | | | | | | | | | | | | | | | | | | | | | | |
Provisions will fluctuate over time depending on business mix, market mix and technology shifts. Risk assessment in the ongoing business is performed monthly to identify the need for new additions and reversals. Management uses its best judgment to estimate provisions based on this assessment. In certain circumstances, provisions are no longer required due to more favorable outcomes than anticipated, which affect the provisions balance as a reversal. In other cases the outcome can be negative, and if so, a charge is recorded in the income statement.
For 2009,2012, new or additional provisions amounting to SEK 11.17.0 billion were made, and SEK 1.71.1 billion were reversed. The actual utilizationcash outlays for 2009 was2012 were SEK 10.73.5 billion compared with the estimated SEK 93.5 billion. The main part of the total cash out for 2012 is warranty provisions of SEK 1.2 billion and restructuring provisions of SEK 1.2 billion. The expected utilizationtotal cash outlays in 20102013 is approximately SEK 87 billion.
Of the total provisions, SEK 461 (311)211 (280) million are classified as non-current. For more information, see Note C1, “Significant Accounting Policies”accounting policies” and Note C2, “Critical Accounting Estimatesaccounting estimates and Judgments”judgments”.
Warranty commitmentsprovisions
Warranty provisions are based on historic quality rates for established products as well as estimates regarding quality rates for new products and costs to remedy the various types of faults predicted. The actual utilization for 2009 was SEK 1.4 billion and in line with the expected SEK 1 billion. Provisions amounting to SEK 2.11.1 billion were made and due to more favorable outcomes in certain cases reversals of SEK 0.2 billion were made. The utilizationactual cash outlays for 2012 were SEK 1.2 billion and in line with the expected SEK 1 billion. The cash outlays of warranty provisions during year 2010 is2013 are estimated to approximately SEK 21 billion.
ERICSSON ANNUAL REPORT ON FORM 20-F 20092012
NOTES TO THE CONSOLIDATED FINANCIAL STATEMENTS—(Continued)
Restructuring provisions
In January, 2009, cost reduction activities were initiated. In the third quarter 2009, it was reported that the program was ahead of plan and that additional opportunities for efficiency improvements had evolved. This would lead to further restructuring charges during the last three quarters of the program. As part of this cost reduction plan,2012 SEK 4.91.2 billion in provision were made.made and SEK 0.1 billion were reversed due to a more favorable outcome than expected. The actual utilization wascash outlays were SEK 4.21.2 billion wherefor the full year and in line with the expected SEK 2.61 billion. SEK 0.6 billion waswere related to restructuring programs initiated before 2009.2011. The utilizationcash outlays for 2010 is2013 are estimated to approximately SEK 31 billion.
Project related provisions
Project provisions relate to estimated losses on onerous contracts, including probable contractual penalties. The utilization of project related provisions were SEK 3.5 billion and in line with the estimated SEK 3 billion. Provisions amounting to SEK 2.00.3 billion were made and SEK 0.50.2 billion were reversed due to a more favorable outcome than expected. The utilizationcash outlays of project related provisions were SEK 0.4 billion and in line with the estimated SEK 0.5 billion. The cash outlays for 2010 is2013 are estimated to be approximately SEK 10.4 billion.
Other provisions
Other provisions include provisions for tax issues, litigations, supplier claims, and other. During 2012, new provisions amounting to SEK 4.4 billion were made, of which 3.3 billion was related to ST-Ericsson, for further information, see Note C3, “Segment information”. SEK 0.5 billion were reversed during 2012 due to a more favorable outcome. The utilization wascash outlays were SEK 1.60.7 billion in 20092012 compared to the estimate of SEK 21 billion. During 2009, new provisions amountingFor 2013, the cash outlays are estimated to SEK 2.1 billion were made and SEK 0.9 billion were reversed during the year due to a more favorable outcome. For 2010, the estimated utilization is approximately SEK 25 billion.
C19 INTEREST-BEARING LIABILITIES
As of December 31, 2009, Ericsson’s2012, the Company’s outstanding interest-bearing liabilities were SEK 32.1 (30.5)28.7 (31.0) billion.
INTEREST-BEARING LIABILITIESInterest-bearing liabilities
| | | | 2009 | | 2008 | | 2012 | | | 2011 | |
Borrowings, current | | | | | | | | |
Current part of non-current borrowings1) | | 684 | | 3,903 | | | 3,018 | | | | 4,314 | |
Other current borrowings | | 1,440 | | 1,639 | | | 1,751 | | | | 3,451 | |
| | | | | | | | | | |
Total current borrowings | | 2,124 | | 5,542 | | | 4,769 | | | | 7,765 | |
| | | | | | | | | | |
Borrowings, non-current | | | | | | | | |
Notes and bond loans | | 23,801 | | 18,879 | | | 16,519 | | | | 17,197 | |
Other borrowings, non-current | | 6,195 | | 6,060 | | | 7,379 | | | | 6,059 | |
| | | | | |
Total non-current interest-bearing liabilities | | 29,996 | | 24,939 | | | 23,898 | | | | 23,256 | |
| | | | | | | | | | |
Total interest-bearing liabilities | | 32,120 | | 30,481 | | | 28,667 | | | | 31,021 | |
| | | | | | | | | | |
| 1) | Including notes and bond loans of SEK 0 (3,794)2,671 (3,461) million. |
All outstanding notes and bond loans are issued by the Parent Company under its Euro Medium-Term Note (EMTN) program or under its SEC Registered program. Bonds issued at a fixed interest rate are normally swapped to a floating interest rate using interest rate swaps resultingleaving a maximum of 50% of outstanding loans at fixed interest rates. It resulted in a weighted average interest rate of 2.88 percent at December 31, 2009.4.69% (4.21%). These bonds are revalued based on changes in benchmark interest rates according to the fair value hedge methodology stipulated in IAS 39.
ERICSSON ANNUAL REPORT ON FORM 20-F 20092012
NOTES TO THE CONSOLIDATED FINANCIAL STATEMENTS—(Continued)
OnIn May 20, 2009,2012 the USDCompany placed a US dollar denominated 1 billion 10-year bond issuedwith a fixed coupon rate of 4.125%. The offer was made pursuant to the Company’s shelf registration statement filed with the SEC in 1999April 2012, and a prospectus supplement thereto. This was the Company´s debut issue on the US bond market.
In June 2012 the Company repurchased notes with a nominal value of 483EUR 286.79 million maturedfrom the EUR 600 million 5% Notes due 2013 and notes with a nominal value of EUR 154.52 million from the EUR 375 million Floating Rate Notes due 2014 pursuant to a tender offer process.
In July 2012 the Company signed a loan of EUR 150 million with the Nordic Investment Bank (NIB). The loan is divided into two equal tranches with respective seven- and nine-year maturity and was repaid.
On June 22, 2009, a new EUR fixed rate bond was issued under the EMTN program. The nominal amount of the issue was 600 million EUR and the maturity date 24 June 2013.
On June 23, 2009, Ericsson signed a seven year floating rate loan of USD 625 million with Svensk Exportkredit. This loan is issued under the EMTN program.
On November 30, 2009, Ericsson called the EUR bond issueddisbursed in 2003 of EUR 471 million with maturity date 28 November 2010 at par.
In 2008 Ericsson signed a seven year loan of SEK 4.0 billion with the European Investment Bank.December 2012. The loan supports Ericsson’sthe Company’s R&D activities to develop the next generation ofradio and IP technology supporting Mobile Broadband build-out globally.
In October 2012 the Company signed a loan agreement with the European Investment Bank (EIB). The loan amount is EUR 500 million (or the equivalent in USD), and the Company has an option for disbursement until April 2014. This loan facility currently remains undrawn. The loan will mature seven years after disbursement. The loan supports the Company’s R&D activities to further develop the next generation radio and IP technology that supports mobile broadband technology at sites in Kista, Gothenburgbuild-out globally.
Notes, bonds and Linköping in Sweden.
NOTES AND BOND LOANSbilateral loans
| | | | | | | | | | | | | | | |
Issued-maturing | | Nominal
amount | | Coupon | | | Currency | | Book value
(SEK m.) | | | Maturity date
(yy-mm-dd) | | | Unrealized hedge
gain/loss (incl. in
book value) |
2004-2012 | | 450 | | 1.275 | % | | SEK | | 450 | | | 12-12-07 | 2) | | |
2007-2012 | | 1,000 | | 5.100 | % | | SEK | | 1,058 | 1) | | 12-06-29 | | | –59 |
2007-2012 | | 2,000 | | 0.730 | % | | SEK | | 2,000 | | | 12-06-29 | 3) | | |
2007-2014 | | 375 | | 1.006 | % | | EUR | | 3,863 | | | 14-06-27 | 4) | | |
2007-2017 | | 500 | | 5.380 | % | | EUR | | 5,714 | 1) | | 17-06-27 | | | –591 |
2009-2013 | | 600 | | 5.000 | % | | EUR | | 6,229 | 1) | | 13-06-24 | | | –81 |
2009-2016 | | 625 | | 3.29875 | % | | USD | | 4,487 | | | 16-06-23 | 5) | | |
| | | | | | | | | | | | | | | |
Total | | | | | | | | | 23,801 | | | | | | –731 |
| | | | | | | | | | | | | | | |
| | | | | | | | | | | | | | | | | | | | | | | | |
Issued–maturing | | Nominal
amount | | | Coupon | | | Currency | | | Book value
(SEK m.) | | | Maturity date | | | Unrealized hedge
gain/loss (included in
book value) | |
Notes and bond loans | | | | | | | | | | | | | | | | | | | | | | | | |
2007-2014 | | | 220 | | | | 0.484 | % | | | EUR | | | | 1,891 | | | | Jun 27, 2014 | 1) | | | | |
2007-2017 | | | 500 | | | | 5.375 | % | | | EUR | | | | 5,117 | 2) | | | Jun 27, 2017 | | | | –799 | |
2009-2013 | | | 313 | | | | 5.000 | % | | | EUR | | | | 2,671 | 2) | | | Jun 24, 2013 | | | | –30 | |
2009-20163) | | | 300 | | | | | | | | USD | | | | 1,952 | | | | Jun 23, 2016 | | | | | |
2010-20204) | | | 170 | | | | | | | | USD | | | | 1,106 | | | | Dec 23, 2020 | | | | | |
2012-2022 | | | 1,000 | | | | 4.125 | % | | | USD | | | | 6,453 | | | | May 15, 2022 | | | | | |
| | | | | | | | | | | | | | | | | | | | | | | | |
Total notes and bond loans | | | | | | | | | | | | | | | 19,190 | | | | | | | | –829 | |
| | | | | | | | | | | | | | | | | | | | | | | | |
Bilateral loans | | | | | | | | | | | | | | | | | | | | | | | | |
2008-20155) | | | 4,000 | | | | | | | | SEK | | | | 4,000 | | | | Jul 15, 2015 | | | | | |
2012-20196) | | | 98 | | | | | | | | USD | | | | 636 | | | | Sep 30, 2019 | | | | | |
2012-20217) | | | 98 | | | | | | | | USD | | | | 637 | | | | Sep 30, 2021 | | | | | |
| | | | | | | | | | | | | | | | | | | | | | | | |
Total bilateral loans | | | | | | | | | | | | | | | 5,273 | | | | | | | | | |
| | | | | | | | | | | | | | | | | | | | | | | | |
| 1) | Next contractual repricing date March 27, 2013 (quarterly). |
| 2) | Interest rate swaps are designated as fair value hedges. |
2) | Next contractual repricing date 2010-06-03 (semi annual). |
| 3) | Next contractual repricing date 2010-03-25 (quarterly)Private Placement, Swedish Export Credits Guarantee Board (EKN) / Swedish Export Credit Corporation (SEK). |
| 4) | Next contractual repricing date 2010-03-25 (quarterly)Private Placement, Swedish Export Credit Corporation (SEK). |
| 5) | Next contractual repricing date 2010-03-19 (quarterly).European Investment Bank (EIB), R&D project financing. |
| 6) | Nordic Investment Bank (NIB), R&D project financing. |
| 7) | Nordic Investment Bank (NIB), R&D project financing. |
ERICSSON ANNUAL REPORT ON FORM 20-F 2012
C20 FINANCIAL RISK MANAGEMENT AND FINANCIAL INSTRUMENTS
Ericsson’sThe Company’s financial risk management is governed by a policy approved by the Board of Directors. The Finance Committee of the Board of Directors is responsible for overseeing the capital structure and financial management of the Company and approving certain matters (such as acquisitions, investments, customer finance commitments, guarantees and borrowing) and is continuously monitoring the exposure to financial risks.
EricssonThe Company defines its managed capital as the total Company equity. For Ericsson,the Company, a robust financial position with a strong equity ratio, investment grade rating, low leverage and ample liquidity is deemed important. This provides the financial flexibility and independence to operate and manage variations in working capital needs as well as to capitalize on business opportunities.
ERICSSON ANNUAL REPORT ON FORM 20-F 2009
NOTES TO THE CONSOLIDATED FINANCIAL STATEMENTS—(Continued)
The Company’s overall capital structure should support the financial targets: to grow faster than the market, deliver best-in-class margins and generate a healthy cash flow. The capital structure is managed by balancing equity, debt financing and liquidity in such a way that wethe Company secure funding of our operations at a reasonable cost of capital. Regular borrowings are complemented with committed credit facilities to give additional flexibility to manage unforeseen funding needs. WeThe Company strive to finance our growth, normal capital expenditures and dividends to shareholders by generating sufficient positive cash flows from operating activities.
OurThe Company’s capital objectives are:
anAn equity ratio above 40 percent.40%
aA cash conversion rate above 70 percent.70%
toTo maintain a positive net cash position.position
toTo maintain a solid investment grade rating by Moody’s and Standard & Poor’s.
CAPITAL OBJECTIVES RELATED INFORMATIONCapital objectives related information, SEK billion
| | | | |
| | | 2009 | | 2008 |
Capital (SEK billion) | | 141 | | 142 |
Equity ratio (percent) | | 52 | | 50 |
Cash conversion rate (percent) | | 117 | | 92 |
Positive net cash (SEK billion) | | 36.1 | | 34.7 |
| | |
Credit rating | | | | |
Moody’s | | Baa1 | | Baa1 |
Standard & Poor’s | | BBB+ | | BBB+ |
| | | | | | | | |
| | | 2012 | | | 2011 | |
Capital | | | 138 | | | | 145 | |
Equity ratio | | | 50 | % | | | 52 | % |
Cash conversion rate | | | 116 | % | | | 40 | % |
Positive net cash | | | 38.5 | | | | 39.5 | |
EricssonThe Company has a treasury function with the principal role to ensure that appropriate financing is in place through loans and committed credit facilities, to actively manage the Company��sCompany’s liquidity as well as financial assets and liabilities, and to manage and control financial risk exposures in a manner consistent with underlying business risks and financial policies. Hedging activities, cash management and insurance management are largely centralized to the treasury function in Stockholm.
EricssonThe Company also has a customer finance function with the main objective to find suitable third-party financing solutions for customers and to minimize recourse to Ericsson.the Company. To the extent customer loans are not provided directly by banks, the Parent Company provides or guarantees vendor credits. The customer finance function monitors the exposure from outstanding vendor credits and credit commitments.
Ericsson The Company classifies financial risks as:
foreignForeign exchange risk.risk
interestInterest rate risk.risk
ERICSSON ANNUAL REPORT ON FORM 20-F 2012
credit risk.Liquidity and refinancing risk
liquidity and refinancing risk.
marketMarket price risk in own and other equity instruments.
ERICSSON ANNUAL REPORT ON FORM 20-F 2009
NOTES TO THE CONSOLIDATED FINANCIAL STATEMENTS—(Continued)
The Board of Directors has established risk limits for defined exposures to foreign exchange and interest rate risks as well as to political risks in certain countries.
For further information about accounting policies, please see Note C1, “Significant Accounting Policies”accounting policies”.
Foreign exchange risk
EricssonThe Company is a global company with sales mainly outside Sweden. Revenues and costs are to a large extent in currencies other than SEK and therefore the financial results of the Company are impacted by currency fluctuations.
EricssonThe Company reports the financial accounts in SEK and movements in exchange rates between currencies will affect:
specificSpecific line items such as Net sales and Operating income.income
theThe comparability of our results between periods.periods
theThe carrying value of assets and liabilities.liabilities
reportedReported cash flows.
Net sales and Operating Incomeincome are affected by changes in foreign exchange rates from two different kinds of exposures, translation exposure and transaction exposure. In the Operating Incomeincome we are primarily exposed to transaction exposure which is partially addressed by hedging.
ERICSSON ANNUAL REPORT ON FORM 20-F 2012
CURRENCY EXPOSURECurrency exposure, SEK billion
| | | | Net Sales | | Net Cost | | |
| | | Exposure | | Of which
Translation
Exposure | | Exposure | | Of which
Translation
Exposure | | |
Exposure currency | | | Translation
exposure | | | Transaction
exposure | | | Net
exposure | | | Net
exposure,
percent
of total | |
Net sales | | | | | | | | | |
SEK | | | | 43.2 | | | | –40.5 | | | | 2.7 | | | | 1 | % |
USD | | 42 | % | | 13 | % | | 21 | % | | 13 | % | | | 57.2 | | | | 38.9 | | | | 96.1 | | | | 42 | % |
EUR | | 22 | % | | 16 | % | | 25 | % | | 19 | % | | | 29.7 | | | | 11.4 | | | | 41.1 | | | | 18 | % |
CNY | | 8 | % | | 8 | % | | 5 | % | | 7 | % | | | 12.1 | | | | –0.2 | | | | 11.9 | | | | 5 | % |
JPY | | | | 17.5 | | | | 0.5 | | | | 18.0 | | | | 8 | % |
INR | | 5 | % | | 7 | % | | 3 | % | | 7 | % | | | 6.1 | | | | 0.0 | | | | 6.1 | | | | 3 | % |
BRL | | | | 7.0 | | | | –0.3 | | | | 6.7 | | | | 3 | % |
GBP | | | | 6.3 | | | | –1.3 | | | | 5.0 | | | | 2 | % |
Other | | | | 48.5 | | | | –8.5 | | | | 40.0 | | | | 18 | % |
| | | | | | | | | | | | | |
Pre-hedge total | | | | | | | | 227.6 | | | | 100 | % |
Hedge | | | | | | | | 0.2 | | | |
| | | | | | | | | | |
Total Net sales | | | | | | | | 227.8 | | | |
| | | | | | | | | | |
Net cost | | | | | | | | | |
SEK | | | | –43.4 | | | | –29.9 | | | | –73.3 | | | | 33 | % |
USD | | | | –57.9 | | | | –12.6 | | | | –70.5 | | | | 32 | % |
EUR | | | | –27.4 | | | | –4.7 | | | | –32.1 | | | | 15 | % |
CNY | | | | –11.5 | | | | 0.7 | | | | –10.8 | | | | 5 | % |
JPY | | 3 | % | | 3 | % | | 2 | % | | 3 | % | | | –16.1 | | | | 11.5 | | | | –4.6 | | | | 2 | % |
INR | | | | –5.1 | | | | 2.4 | | | | –2.7 | | | | 1 | % |
BRL | | 3 | % | | 3 | % | | 3 | % | | 4 | % | | | –6.5 | | | | 0.7 | | | | –5.8 | | | | 3 | % |
GBP | | | | –5.9 | | | | 0.3 | | | | –5.6 | | | | 3 | % |
Other | | | | –43.9 | | | | 31.6 | | | | –12.3 | | | | 6 | % |
| | | | | | | | | | | | | |
Pre-hedge total | | | | | | | | –217.7 | | | | 100 | % |
Hedge | | | | | | | | 0.4 | | | |
| | | | | | | | | | |
Total Net cost | | | | | | | | –217.3 | | | |
| | | | | | | | | | |
Operating income | | | | | | | | 10.5 | | | |
| | | | | | | | | | |
Translation exposure
Translation exposure relates to Sales and Cost of sales in foreign entities when translated into SEK upon consolidation. These exposures can not be addressed by hedging, but as the Income Statement is translated using average rate (average rate gives a good approximation), the impact of volatility in foreign currency rates is reduced.
Transaction exposure
Transaction exposure relates to Sales and Cost of sales in non-reporting currencies in individual group companies. Foreign exchange risk is as far as possible concentrated to Swedish group companies, primarily Ericsson AB. Sales to foreign subsidiaries are normally denominated in the functional currency of the receiving
ERICSSON ANNUAL REPORT ON FORM 20-F 2009
NOTES TO THE CONSOLIDATED FINANCIAL STATEMENTS—(Continued)
entity,customers and export sales from Sweden to external customers are normally denominated in USD or other foreign currency. In order to limit the exposure toward exchange rate fluctuations on future revenues or expenditures,and costs, committed and forecasted future sales and purchases in major currencies are hedged for the coming 6–12 months.with 7% of 12-month forecast monthly. This corresponds to approximately 5–6 months of an average forecast.
ERICSSON ANNUAL REPORT ON FORM 20-F 2012
According to Company policy, transaction exposure in subsidiaries’ balance sheets (i.e. trade receivables and payables and customer finance receivables) should be fully hedged, except for non-tradable currencies. Group Treasury has a mandate to leave selected transaction exposures in local companies’ balance sheets unhedged up to an aggregate Value at Risk (VaR) of SEK 20 million, given a confidence level of 99 percent and a 1-day horizon.
Foreign exchange exposures in balance sheet items are hedged through offsetting balances or derivatives.
As of December 31, 2009,2012, outstanding foreign exchange derivatives hedging transaction exposures had a positive net market value of SEK 0.3 (negative 2.9)1.1 (–0.5) billion. The market value is partly deferred in the hedge reserve in OCIother comprehensive income to offset the gains/losses on hedged future sales in foreign currency.
Cash flow hedges
The purpose of hedging future cash flowsforecasted revenues and costs is to reduce volatility in the income statement. Hedging is done by selling or buying foreign currencies against the functional currency of the hedging entity using FXforeign exchange forwards.
Hedging is done based on a rolling 12-month exposure forecast. EricssonThe Company uses a layered hedging approach, where the closest quarters are hedged to a higher degree than later quarters. Each consecutive quarter is hereby hedged on several occasions and is covered by an aggregate of hedging contracts initiated at various points in time, which supports the objective of reducing volatility in the income statement from changes in foreign exchange rates.
Translation exposure in net assets
EricssonThe Company has many subsidiaries operating outside Sweden with other functional currencies than SEK. The results and net assets of such companies are exposed to exchange rate fluctuations, which affect the consolidated income statement and balance sheet when translated to SEK. Translation risk related to forecasted results from foreign operations can not be hedged, but net assets can be addressed by hedging.
Translation exposure in foreign subsidiaries is hedged according to the following policy established by the Board of Directors:
Translation risk related to net assets in foreign subsidiaries is hedged up to 20 percent20% in selected companies. The translation differences reported in OCIOther comprehensive income during 20092012 were negative, SEK 1.4–3.9 (–1.0) billion, including hedging gaingain/loss of SEK 0.60.0 (0.0) billion.
Interest rate risk
EricssonThe Company is exposed to interest rate risk through market value fluctuations in certain balance sheet items and through changes in interest revenues and expenses. The net cash position was SEK 36.1 (34.7)38.5 (39.5) billion at the end of 2009,2012, consisting of cash, cash equivalents and short-term investments of SEK 76.7 (75.0)(80.5) billion and interest-bearing liabilities and post-employment benefits of SEK 40.7 (40.4)38.2 (41.0) billion.
ERICSSON ANNUAL REPORT ON FORM 20-F 2009
NOTES TO THE CONSOLIDATED FINANCIAL STATEMENTS—(Continued)
EricssonThe Company manages the interest rate risk by (i) matching fixed and floating interest rates in interest-bearing balance sheet items and (ii) avoiding significant fixed interest rate exposure in Ericsson’sthe Company’s net cash position. The policy is that interest-bearing assets shall have an average interest duration between 10 and 14 months, and interest-bearing liabilities an average interest duration shorter than 6 months, taking derivative instruments into consideration. Interest-bearing liabilities do not have a duration target as the duration of the fixed rate portion will be determined by markets conditions when liabilities are issued, Group Treasury has a mandate to deviate from the asset management benchmark given by the Board and take FXforeign exchange positions up to an aggregateaggregated risk of VaR SEK 30 m.45 million given a confidence level of 99 percent99% and a 1-day horizon.
As of December 31, 2009, 88 (87) percent of Ericsson’s interest-bearing liabilities and 61 (100) percent of Ericsson’s interest-bearing assets had floating interest rates, i.e. interest periods of less than 12 months.
ERICSSON ANNUAL REPORT ON FORM 20-F 2012
Interest duration, SEK billion
| | | | | | | | | | | | | | | | | | | | | | | | |
| | | < 3M | | | <1Y | | | 1-3Y | | | 3-5Y | | | >5Y | | | Total | |
Interest Bearing Trading | | | 4.7 | | | | –5.4 | | | | 1.0 | | | | 0.0 | | | | –0.3 | | | | 0 | |
Interest Bearing Assets | | | 58.2 | | | | 2.6 | | | | 11.5 | | | | 3.6 | | | | 0.8 | | | | 76.7 | |
Interest Bearing Liabilities | | | –11.7 | | | | –5.1 | | | | 0.0 | | | | –4.2 | | | | –7.7 | | | | –28.7 | |
When managing the interest rate exposure, Ericssonthe Company uses derivative instruments, such as interest rate swaps. Derivative instruments used for converting fixed rate debt into floating rate debt are designated as fair value hedges.
Fair value hedges
The purpose of fair value hedges is to hedge the variability in the fair value of fixed-rate debt (issued bonds) from changes in the relevant benchmark yield curve for its entire term by converting fixed interest payments to a floating rate (e.g. STIBOR or LIBOR) by using interest rate swaps (IRS). The credit risk/spread is not hedged.
The fixed leg of the IRS is matched against the cash flows of the hedged bond. Hereby the fixed-rate bond/debt is converted into a floating-rate debt in accordance with the policy.
OUTSTANDING DERIVATIVESOutstanding derivatives1)
| | | | 2009 | | 2008 | | 2012 | | | 2011 | |
Fair value | | Asset | | Liability | | Asset | | Liability | | Asset | | Liability | | | Asset | | Liability | |
Currency derivatives | | | | | | | | | | | | | | | | |
Maturity within 3 months | | 580 | | | 500 | | 2,671 | | | 2,489 | | | 976 | | | | 60 | | | | 557 | | | | 881 | |
Maturity between 3 and 12 months | | 910 | | | 423 | | 1,639 | | | 4,022 | | | 611 | | | | 10 | | | | 364 | | | | 393 | |
Maturity 1 to 3 years | | 90 | | | 44 | | 40 | | | 589 | | | 4 | | | | — | | | | — | | | | — | |
Maturity 3 to 5 years | | 84 | | | — | | — | | | — | |
Maturity more than 5 years | | 3 | | | — | | — | | | — | |
Total currency derivatives | | 1,666 | 1) | | 967 | | 4,350 | 1) | | 7,100 | |
of which designated in cash flow hedge relations | | 96 | | | — | | — | | | 3,503 | |
of which designated in net investment hedge relations | | — | | | 62 | | 8 | | | 179 | |
| | | | | | | | | | | | | |
Total | | | | 1,591 | | | | 70 | | | | 921 | | | | 1,274 | |
Of which designated in cash flow hedge relations | | | | 816 | | | | 6 | | | | 333 | | | | 638 | |
Of which designated in net investment hedge relations | | | | — | | | | — | | | | — | | | | — | |
| | | | | | | | | | | | | | | | |
Interest rate derivatives | | | | | | | | | | | | | | | | |
Maturity within 3 months | | — | | | — | | — | | | — | | | — | | | | — | | | | — | | | | 5 | |
Maturity between 3 and 12 months | | 28 | | | 40 | | 315 | | | 121 | | | 487 | | | | 285 | | | | 324 | | | | 367 | |
Maturity 1 to 3 years | | 49 | | | 151 | | 129 | | | 25 | | | 565 | | | | 681 | | | | 380 | | | | 618 | |
Maturity 3 to 5 years | | 175 | | | 40 | | 105 | | | — | | | 1,212 | | | | 739 | | | | 416 | | | | 815 | |
Maturity more than 5 years | | 685 | | | 58 | | 711 | | | 53 | | | 38 | | | | — | | | | 778 | | | | 161 | |
Total interest rate derivatives | | 937 | 1) | | 289 | | 1,260 | 1) | | 199 | |
of which designated in fair value hedge relations | | 845 | | | — | | 1,152 | | | — | |
| | | | | | | | | | | | | |
Total | | | | 2,302 | 2) | | | 1,705 | | | | 1,898 | 2) | | | 1,966 | |
Of which designated in fair value hedge relations | | | | 969 | | | | — | | | | 1,002 | | | | — | |
| | | | | | | | | | | | | |
| 1) | Some of the derivatives hedging non-current liabilities are recognized in the balance sheet as non-current derivatives due to hedge accounting. |
| 2) | Of which 843 (2,814)SEK 825 (816) million is reported as non-current assets. |
ERICSSON ANNUAL REPORT ON FORM 20-F 2009
NOTES TO THE CONSOLIDATED FINANCIAL STATEMENTS—(Continued)Sensitivity analysis
Sensitivity analysis
EricssonThe Company uses the VaR methodology to measure foreign exchange and interest rate risks in portfolios managed by Treasury. This statistical method expresses the maximum potential loss that can arise with a certain
ERICSSON ANNUAL REPORT ON FORM 20-F 2012
degree of probability during a certain period of time. For the VaR measurement, Ericssonthe Company has chosen a probability level of 99 percent99% and a 1-day time horizon. The daily VaR measurement uses market volatilities and correlations based on historical daily data (one year).
The average VaR calculated for 20092012 was SEK 9.8 (20.6) million for the interest rate mandate SEK 14.3 (20.5) million and for the transaction exposure mandate SEK 13.9 (14.4) million.combined mandates. No VaR-limits were exceeded during 2009.2012.
Financial credit risk
Financial instruments carry an element of risk in that counterparts may be unable to fulfill their payment obligations. This exposure arises in the investments in cash, cash equivalents, short-term Investmentsinvestments and from derivative positions with positive unrealized results against banks and other counterparties.
EricssonThe Company mitigates these risks by investing cash primarily in well-rated securities such as treasury bills, government bonds, commercial papers, and mortgage covered bonds with short-term ratings of at least A-1/P-1 and long-term ratings of AAA. Separate credit limits are assigned to each counterpart in order to minimize risk concentration. We have had no sub-prime exposure in our investments. All derivative transactions are covered by ISDA netting agreements to reduce the credit risk. No credit losses were incurred during 2009,2012, SEK 0.0 (0.0) billion, neither on external investments nor on derivative positions.
At December 31, 2009,2012, the credit risk in financial cash instruments was equal to the instruments’ carrying value. Credit exposure in derivative instruments was SEK 2.6 (5.6)3.9 (2.8) billion.
Liquidity risk
Liquidity risk is that Ericssonthe Company is unable to meet its short-term payment obligations due to insufficient or illiquid cash reserves.
Ericsson maintainsThe Company minimizes the liquidity risk by maintaining a sufficient liquiditynet cash position. This is managed through centralized cash management, investments in highly liquid interest-bearing securities, and by having sufficient committed credit lines in place to meet potential funding needs. For information about contractual obligations, please see Note C33,C31, “Contractual obligations”. The current cash position is deemed to satisfy all short-term liquidity requirements.
During 2009,2012, cash and bank and short-term investments increaseddecreased by SEK 1.73.8 billion to SEK 76.7 billion. The increase was mainly due to positive operating
Cash, cash flow.
CASH, CASH EQUIVALENTS AND SHORT-TERM INVESTMENTSequivalents and short-term investments
| | | | | | | | | | |
| | | Remaining time to maturity |
(SEK billion) | | < 3
months | | < 1
year | | 1–5
years | | >5
years | | Total |
2009 | | 31.8 | | 2.6 | | 34.4 | | 7.9 | | 76.7 |
2008 | | 43.5 | | 23.7 | | 5.9 | | 1.9 | | 75.0 |
ERICSSON ANNUAL REPORT ON FORM 20-F 2009
NOTES TO THE CONSOLIDATED FINANCIAL STATEMENTS—(Continued)
| | | | | | | | | | | | | | | | | | | | |
| | | Remaining time to maturity | |
SEK billion | | < 3
months | | | < 1
year | | | 1–5
years | | | >5
years | | | Total | |
Bank Deposits | | | 40.6 | | | | 0.2 | | | | — | | | | — | | | | 40.8 | |
Type of issuer/counterpart | | | | | | | | | | | | | | | | | | | | |
Governments | | | 3.4 | | | | 4.5 | | | | 10.8 | | | | 0.8 | | | | 19.5 | |
Corporations | | | 3.1 | | | | — | | | | — | | | | — | | | | 3.1 | |
Mortgage institutes | | | — | | | | 0.1 | | | | 13.2 | | | | — | | | | 13.3 | |
2012 | | | 47.1 | | | | 4.8 | | | | 24.0 | | | | 0.8 | | | | 76.7 | |
2011 | | | 44.7 | | | | 4.0 | | | | 29.8 | | | | 2.0 | | | | 80.5 | |
The instruments are either classified as held for trading or as assets available for sale with maturity less than one year and are therefore short-term investments. Cash, Cash Equivalentsequivalents and short-term investments are mainly held in SEK unless off-set by EUR-funding.
ERICSSON ANNUAL REPORT ON FORM 20-F 2012
Refinancing risk
Refinancing risk is the risk that Ericssonthe Company is unable to refinance outstanding debt at reasonable terms and conditions, or at all, at a given point in time.
REPAYMENT SCHEDULE OF LONG-TERM BORR OWINGSRepayment schedule of non-current borrowings1)
| Nominal amount (SEK billion) | | Current
maturities
of long-
term debt | | Notes and
bonds
(non-current) | | Liabilities
to financial
institutions
(non-current) | | Total | | Current
maturities
of long-
term debt | | | Notes and
bonds
(non-current) | | | Liabilities
to financial
institutions
(non-current) | | | Total | |
2010 | | 0.5 | | — | | — | | 0.5 | |
2011 | | — | | — | | 0.6 | | 0.6 | |
2012 | | — | | 3.5 | | — | | 3.5 | |
2013 | | — | | 6.2 | | — | | 6.2 | | | 3.0 | | | | — | | | | — | | | | 3.0 | |
2014 | | — | | 3.9 | | 0.1 | | 4.0 | | | — | | | | 1.9 | | | | — | | | | 1.9 | |
2015 | | — | | — | | 4.0 | | 4.0 | | | — | | | | — | | | | 5.1 | | | | 5.1 | |
2016 | | — | | 4.5 | | — | | 4.5 | | | — | | | | 2.0 | | | | — | | | | 2.0 | |
2017 | | — | | 5.2 | | 0.1 | | 5.3 | | | — | | | | 4.3 | | | | — | | | | 4.3 | |
2018 | | — | | — | | — | | — | | | — | | | | — | | | | — | | | | — | |
2019 | | | | — | | | | — | | | | 0.6 | | | | 0.6 | |
2020 | | | | — | | | | 1.1 | | | | — | | | | 1.1 | |
2021 | | | | — | | | | — | | | | 0.6 | | | | 0.6 | |
2022 | | | | — | | | | 6.4 | | | | — | | | | 6.4 | |
| | | | | | | | | | | | | | | | | | | | |
Total | | 0.5 | | 23.3 | | 4.8 | | 28.6 | | | 3.0 | | | | 15.7 | | | | 6.3 | | | | 25.0 | |
| | | | | | | | | | | | | | | | | | | | |
| 1) | Excluding finance leases reported in Note C27, “Leasing”. |
Debt financing is mainly carried out through borrowing in the Swedish and international debt capital markets.
Bank financing is used for certain subsidiary funding and to obtain committed credit facilities.
FUNDING PROGRAMSFunding programs1)
| | | | | | |
| | | Amount | | Utilized | | Unutilized |
Euro Medium-Term Note program (USD m.) | | 5,000 | | 3,158 | | 1,842 |
Euro Commercial Paper program (USD m.) | | 1,500 | | — | | 1,500 |
Swedish Commercial Paper program (SEK m.) | | 5,000 | | — | | 5,000 |
Long-term Committed Credit facility (USD m.) | | 2,000 | | — | | 2,000 |
European Investment Bank (SEK m.) | | 4,000 | | 4,000 | | — |
Indian Commercial Paper program (INR m.) | | 5,000 | | 4,000 | | 1,000 |
At year-end, Ericsson’s credit ratings remained at Baa1 (Baa1) by Moody’s and BBB+ (BBB+) by Standard & Poor’s, both considered to be “Solid Investment Grade”.
ERICSSON ANNUAL REPORT ON FORM 20-F 2009
NOTES TO THE CONSOLIDATED FINANCIAL STATEMENTS—(Continued)
| | | | | | | | | | | | |
| | | Amount | | | Utilized | | | Unutilized | |
Euro Medium-Term Note program (USD million) | | | 5,000 | | | | 1,833 | | | | 3,167 | |
SEC Registered program (USD Million) | | | — | 2) | | | 1,000 | | | | — | |
Long-term Committed Credit facility (USD million) | | | 2,000 | | | | — | | | | 2,000 | |
Indian Commercial Paper program (INR million) | | | 5,000 | | | | 3,750 | | | | 1,250 | |
EIB Committed Credit Facility (EUR million) | | | 500 | | | | — | | | | 500 | |
| 1) | There are no financial covenants related to these programs. |
| 2) | Program amount indeterminate. |
Financial instruments carried at other than fair value
The fair value of the majority of the Company’s financial instruments, recognized at fair value, are determined based on quoted market prices or rates. In the following tables, carrying amounts and fair values of financial instruments that are carried in the financial statements at other than fair values are presented. Assets valued at fair value through profit or loss showed a net gain of SEK 2.12.7 billion. For further information about valuation principles, please see Note C1, “Significant accounting policies”.
ERICSSON ANNUAL REPORT ON FORM 20-F 2012
FINANCIAL INSTRUMENTS CARRIED AT OTHER THAN FAIR VALUEFinancial instruments carried at other than fair value1)
| | | | Carrying amount | | Fair value | | Book value | | | Fair value | |
SEK billion | | 2009 | | 2008 | | 2009 | | 2008 | | 2012 | | | 2011 | | | 2012 | | | 2011 | |
Current maturities of non-current borrowings | | 0.7 | | 3.9 | | 0.7 | | 4.0 | |
Current part of non-current borrowings | | | | 3.0 | | | | 4.3 | | | | 3.0 | | | | 4.3 | |
Notes and bonds | | 23.8 | | 18.9 | | 22.8 | | 15.9 | | | 16.5 | | | | 17.2 | | | | 17.0 | | | | 17.1 | |
Other borrowings non-current | | 4.8 | | 4.6 | | 4.0 | | 3.7 | | | 7.4 | | | | 4.9 | | | | 7.6 | | | | 4.9 | |
| | | | | | | | | | | | | | | | | | | | |
Total | | 29.3 | | 27.4 | | 27.5 | | 23.6 | | | 26.9 | | | | 26.4 | | | | 27.6 | | | | 26.3 | |
| | | | | | | | | | | | | | | | | | | | |
| 1) | Excluding finance leases reported in Note C27, “Leasing”. |
Financial instruments excluded from the tables, such as trade receivables and payables, are carried at amortized cost which is deemed to be equal to fair value. When a market price is not readily available and there is insignificant interest rate exposure affecting the value, the carrying value is considered to represent a reasonable estimate of fair value.
Market price risk in own shares and other listed equity investments
Risk related to our own share price
EricssonThe Company is exposed to the development of its own share price through stock option and stock purchase plans for employees and synthetic share-based compensations to the Board of Directors.
Stock purchase plans for employees
The obligation to deliver shares or pay compensation amounts, under these plansthe stock purchase plan is covered by holding Ericsson Class B shares as treasury stock and warrants for issuance of new Ericsson Class B shares or provisions. An increasestock. A change in the share price will result in a change in social security charges, which represents a risk to boththe income and cash flow.statement. The cash flow exposure is fully hedged through the holding of Ericsson Class B shares as treasury stock to be sold to generate funds to cover also social security payments,payments.
Synthetic share-based compensations to the Board of Directors
For these plans, the Company is exposed to risks in relation to own share price, both in relation to compensation expenses and throughsocial security charges. The obligation to pay compensation amounts under the purchasesynthetic share-based compensations to the Board of call options on Ericsson Class B shares. Directors is covered by a liability in the balance sheet.
For further information about the stock optionpurchase plan and stock purchase plans, please see note C29, “Information Regarding Members ofthe synthetic share-based compensations to the Board of Directors, please see note C28, “Information regarding members of the Managementboard of directors, the Group management and Employees”employees”.
Financial instruments, book value
| | | | | | | | | | | | | | | | | | | | | | | | | | | | | | | | | | | | | | | | | | | | |
SEK billion | | Customer
finance | | | Trade
receivables | | | Short-
term
invest-
ments | | | Cash
equiva-
lents | | | Borrowings | | | Trade
payables | | | Other
financial
assets | | | Other
current
receiv-
ables | | | Other
current
liabilities | | | 2012 | | | 2011 | |
Note | | | C14 | | | | C14 | | | | | | | | | | | | C19 | | | | C22 | | | | C12 | | | | C15 | | | | C21 | | | | | | | | | |
Assets at fair value through profit or loss | | | — | | | | — | | | | 32.0 | | | | 12.2 | | | | — | | | | — | | | | 0.8 | | | | 3.1 | | | | –1.8 | | | | 46.3 | | | | 43.4 | |
Loans and receivables | | | 5.3 | | | | 63.7 | | | | — | | | | 2.1 | | | | — | | | | — | | | | 3.2 | | | | — | | | | — | | | | 74.3 | | | | 79.2 | |
Financial liabilities at amortized cost | | | — | | | | — | | | | — | | | | — | | | | –28.7 | | | | –23.1 | | | | — | | | | — | | | | — | | | | –51.8 | | | | –56.3 | |
| | | | | | | | | | | | | | | | | | | | | | | | | | | | | | | | | | | | | | | | | | | | |
Total | | | 5.3 | | | | 63.7 | | | | 32.0 | | | | 14.3 | | | | –28.7 | | | | –23.1 | | | | 4.0 | | | | 3.1 | | | | –1.8 | | | | 68.8 | | | | 66.3 | |
| | | | | | | | | | | | | | | | | | | | | | | | | | | | | | | | | | | | | | | | | | | | |
ERICSSON ANNUAL REPORT ON FORM 20-F 20092012
NOTES TO THE CONSOLIDATED FINANCIAL STATEMENTS—(Continued)
FINANCIAL INSTRUMENTS, CARRYING AMOUNTS
| | | | | | | | | | | | | | | | | | | | | | |
SEK billion | | Customer
finance
C14 | | Trade
receivables
C14 | | Short-term
investments | | Cash
equivalents | | Borrowings
C19 | | Trade
payables
C22 | | Other
financial
assets
C12 | | Other
current
receivables
C15 | | Other
current
liabilities
C21 | | 2009 | | 2008 |
Assets at fair value through profit or loss | | | | | | 53.9 | | 1.6 | | | | | | | | 1.8 | | –1.3 | | 56.0 | | 41.6 |
Loans and receivables | | 2.3 | | 66.4 | | | | 2.8 | | | | | | 2.2 | | | | | | 73.7 | | 87.4 |
Available for sale assets | | | | | | | | | | | | | | | | | | | | — | | 0.3 |
Financial liabilities at amortized cost | | | | | | | | | | –32.1 | | –18.9 | | | | | | | | –51.0 | | –54.0 |
| | | | | | | | | | | | | | | | | | | | | | |
Total | | 2.3 | | 66.4 | | 53.9 | | 4.4 | | –32.1 | | –18.9 | | 2.2 | | 1.8 | | –1.3 | | 78.7 | | 75.3 |
| | | | | | | | | | | | | | | | | | | | | | |
C21 OTHER CURRENT LIABILITIES
Other current liabilities
| | | | 2009 | | 2008 | | 2012 | | | 2011 | |
Income tax liabilities | | 1,890 | | 2,213 | | | 3,878 | | | | 2,691 | |
Advances from customers | | 4,903 | | 4,412 | | | 4,754 | | | | 3,942 | |
Liabilities to associated companies and joint ventures | | 152 | | 93 | | | — | | | | 119 | |
Accrued interest | | 378 | | 421 | | | 259 | | | | 351 | |
Accrued expenses, of which | | 29,957 | | 24,289 | | | 32,353 | | | | 32,652 | |
employee related | | 10,137 | | 10,369 | |
other1) | | 19,820 | | 13,920 | |
Employee related | | | | 11,166 | | | | 11,314 | |
Supplier related | | | | 11,440 | | | | 11,621 | |
Other1) | | | | 9,747 | | | | 9,717 | |
Deferred revenues | | 8,267 | | 9,204 | | | 11,658 | | | | 8,722 | |
Derivatives with a negative value2) | | 1,255 | | 7,299 | | | 1,775 | | | | 3,240 | |
Other3) | | 5,727 | | 13,101 | | | 6,431 | | | | 6,253 | |
| | | | | | | | | | |
Total | | 52,529 | | 61,032 | | | 61,108 | | | | 57,970 | |
| | | | | | | | | | |
| 1) | Major balance relates to accrued expenses for customer projects. |
| 2) | See Note C20, “Financial Risk Managementrisk management and Financial Instruments”financial instruments”. |
| 3) | Includes items such as VAT and withholding tax payables, social security payables and other payroll deductions, and liabilities for goods received where invoice is not yet received. |
C22 TRADE PAYABLES
Trade payables
| | | | | | | | |
| | | 2012 | | | 2011 | |
Payables to associated companies and joint ventures | | | 81 | | | | 102 | |
Other | | | 23,019 | | | | 25,207 | |
| | | | | | | | |
Total | | | 23,100 | | | | 25,309 | |
| | | | | | | | |
C23 ASSETS PLEDGED AS COLLATERAL
Assets pledged as collateral
| | | | | | | | |
| | | 2012 | | | 2011 | |
Chattel mortgages | | | 185 | | | | 185 | |
Bank deposits | | | 335 | | | | 267 | |
| | | | | | | | |
Total | | | 520 | | | | 452 | |
| | | | | | | | |
C24 CONTINGENT LIABILITIES
Contingent liabilities
| | | | | | | | |
| | | 2012 | | | 2011 | |
Contingent liabilities | | | 613 | | | | 609 | |
| | | | | | | | |
Total | | | 613 | | | | 609 | |
| | | | | | | | |
ERICSSON ANNUAL REPORT ON FORM 20-F 20092012
NOTES TO THE CONSOLIDATED FINANCIAL STATEMENTS—(Continued)
C22 TRADE PAYABLES
| | | | |
| | | 2009 | | 2008 |
Payables to associated companies and joint ventures | | 1,186 | | 83 |
Other | | 17,678 | | 23,421 |
| | | | |
Total | | 18,864 | | 23,504 |
| | | | |
C23 ASSETS PLEDGED AS COLLATERAL
| | | | |
| | | 2009 | | 2008 |
Chattel mortgages | | 167 | | 149 |
Bank deposits | | 383 | | 267 |
| | | | |
Total | | 550 | | 416 |
| | | | |
C24 CONTINGENT LIABILITIES
| | | | |
| | | 2009 | | 2008 |
Contingent liabilities | | 1,245 | | 1,080 |
| | | | |
Total | | 1,245 | | 1,080 |
| | | | |
Contingent liabilities assumed by Ericsson include guarantees of loans to other companies of SEK 76 (72)24 (25) million. Ericsson has SEK 542 (568)59 (111) million issued to guarantee the performance of a third party.
All ongoing legal and tax proceedings have been evaluated, their potential economic outflows and probability estimated and necessary provisions made. In Note C2, “Critical Accounting Estimates and Judgments”, a further disclosure is presented in relation to (i) key sources of estimation uncertainty and (ii) the decision made in relation to accounting policies applied.
Financial guarantees for third party amounted to SEK 52286 (449) million as of December 31, 2009.2012. Maturity date for major part of the issued guarantees occurs in 20182021 at latest.
In addition to the above, Ericsson has issued guarantees for a long-term loan granted to Sony Ericsson Mobile Communications AB (SEMC) with a maximum amount of SEK 3,606 million. The parent companies of Ericsson and Sony Corporation have issued guarantees for this loan on a 50/50 basis, without joint responsibility. Ericsson’s part thus amounted to SEK 1,803 million. As of December 31, 2009, Ericsson’s part of the principal amount outstanding amounted to SEK 779 million inclusive of accrued interest SEK 6 million. Maturity date for the maximum amount of the issued guarantees occurs in 2011 (SEK 1,030 million) and 2010 (SEK 773 million). See also Note C30, “Related Party Transactions”.
C25 STATEMENT OF CASH FLOWS
Interest paid in 20092012 was SEK 7721,650 million (SEK 1,6891,422 million in 2008,2011, SEK 1,513977 million in 2007)2010) and interest received was SEK 1,9001,883 million (SEK 2,3752,632 million in 2008,2011, SEK 1,8641,083 million in 2007)2010). Taxes paid, including withholding tax, were SEK 4,4275,750 million (SEK 4,2744,393 million in 2008,2011, SEK 5,1164,808 million in 2007)2010).
Cash and cash equivalents includes cash of SEK 18,37230,358 (29,471) million (SEK 28,939 million in 2008) and temporary investments of SEK 4,426 million (SEK 8,874 million in 2008).14,324 (9,205) million. For more information regarding the disposition of cash and cash equivalents and unutilized credit commitments, see Note C20, “Financial Risk Managementrisk management and Financial Instruments”financial instruments”.
The Company holds cash or cash equivalents in countries where exchange controls or legal restrictions apply. These restrictions normally refer to approval procedures prior to cross-border cash transfers. The amount of cash and cash equivalents in such countries amounts to SEK 10.6 (13.9) billion. Of this amount, SEK 9.2 (12.8) billion can be used for repayment of external and internal liabilities as well as other operating needs. Therefore, net cash and cash equivalents that are not readily available for use by the Group is SEK 1.4 (1.1) billion.
Adjustments to reconcile net income to cash
| | | | | | | | | | | | |
| | | 2012 | | | 2011 | | | 2010 | |
Property, plant and equipment | | | | | | | | | | | | |
Depreciation | | | 4,052 | | | | 3,499 | | | | 3,299 | |
Impairment losses/reversals of impairments | | | –40 | | | | 47 | | | | –3 | |
Total | | | 4,012 | | | | 3,546 | | | | 3,296 | |
| | | | | | | | | | | | |
Intangible assets | | | | | | | | | | | | |
Amortization | | | | | | | | | | | | |
Capitalized development expenses | | | 1,058 | | | | 995 | | | | 664 | |
Intellectual Property Rights, brands and other intangible assets | | | 4,436 | | | | 4,470 | | | | 4,999 | |
| | | | | | | | | | | | |
Total amortization | | | 5,494 | | | | 5,465 | | | | 5,663 | |
Impairments | | | | | | | | | | | | |
Capitalized development expenses | | | 266 | | | | 7 | | | | 49 | |
Intellectual Property Rights, brands and other intangible assets | | | 117 | | | | 18 | | | | 945 | |
| | | | | | | | | | | | |
Total | | | 5,877 | | | | 5,490 | | | | 6,657 | |
| | | | | | | | | | | | |
Total depreciation, amortization and impairment losses on property, plant and equipment and intangible assets | | | 9,889 | | | | 9,036 | | | | 9,953 | |
| | | | | | | | | | | | |
Taxes | | | –1,140 | | | | 1,994 | | | | 351 | |
Dividends from joint ventures/ associated companies1) | | | 133 | | | | 177 | | | | 119 | |
Undistributed earnings in joint ventures/associated companies1) | | | 11,636 | | | | 3,533 | | | | 1,357 | |
Gains/losses on sales of investments and operations, intangible assets and PP&E, net2) | | | –8,087 | | | | –159 | | | | –237 | |
Other non-cash items3) | | | 646 | | | | –1,968 | | | | 947 | |
| | | | | | | | | | | | |
Total adjustments to reconcile net income to cash | | | 13,077 | | | | 12,613 | | | | 12,490 | |
| | | | | | | | | | | | |
ERICSSON ANNUAL REPORT ON FORM 20-F 20092012
NOTES TO THE CONSOLIDATED FINANCIAL STATEMENTS—(Continued)
Cash restricted due to currency regulations or other legal restrictions in certain countries amounted to SEK 8,907 million (SEK 8,197 million in 2008, SEK 5,797 million in 2007).
ADJUSTMENTS TO RECONCILE NET INCOME TO CASH
| | | | | | |
| | | 2009 | | 2008 | | 2007 |
Property, plant and equipment | | | | | | |
Depreciation | | 3,550 | | 3,108 | | 3,121 |
Impairment losses/reversals of impairments | | –48 | | –3 | | –207 |
| | | | | | |
Total | | 3,502 | | 3,105 | | 2,914 |
| | | | | | |
Intangible assets | | | | | | |
Amortization | | | | | | |
Capitalized development expenses | | 647 | | 1,726 | | 2,371 |
Intellectual Property Rights, brands and other intangible assets | | 3,562 | | 3,280 | | 3,062 |
| | | | | | |
Total amortization | | 4,209 | | 5,006 | | 5,433 |
Impairments | | | | | | |
Capitalized development expenses | | 157 | | 562 | | 16 |
Intellectual Property Rights, brands and other intangible assets | | 4,255 | | – | | – |
| | | | | | |
Total | | 8,621 | | 5,568 | | 5,449 |
| | | | | | |
Total depreciation, amortization and impairment losses on property, plant and equipment and intangible assets | | 12,123 | | 8,673 | | 8,363 |
| | | | | | |
Taxes | | –1,011 | | 1,032 | | 1,119 |
Dividends from joint ventures/associated companies1) | | 70 | | 3,863 | | 4,223 |
Undistributed earnings in joint ventures/associated companies1) | | 6,013 | | 291 | | –5,636 |
Gains/losses on sales of investments and operations, intangible assets and | | | | | | |
PP&E, net2) | | –910 | | –1,210 | | –254 |
Other non-cash items2) 3) | | 571 | | 1,669 | | –643 |
| | | | | | |
Total adjustments to reconcile net income to cash | | 16,856 | | 14,318 | | 7,172 |
| | | | | | |
| 1) | See also noteNote C12, “Financial Assets, Non-Current”assets, non-current”. |
| 2) | See also noteNote C26, “Business Combinations”combinations”. |
| 3) | Refers mainly to unrealized foreign exchange, gains/losses on financial instruments. |
ACQUISITIONS/DIVESTMENTS OF SUBSIDIARIES AND OTHER OPERATIONSAcquisitions/divestments of subsidiaries and other operations
| 2009 | | Acquisitions | | Divestments | |
| | | | Acquisitions | | | Divestments | |
2012 | | | | | |
Cash flow from business combinations1) | | –9,633 | | 1,239 | | | –11,575 | | | | 9,502 | |
Capital contribution to joint venture | | –9,688 | | – | |
Acquisitions/divestments of other investments | | | | 46 | | | | –50 | |
| | | | | | | | | | |
Total | | –19,321 | | 1,239 | | | –11,529 | | | | 9,452 | |
| | | | | | | | | | |
2011 | | | | | |
Cash flow from business combinations1) | | | | –1,232 | | | | –28 | |
Acquisitions/divestments of other investments | | | | –1,949 | | | | 81 | |
| | | | | | | |
Total | | | | –3,181 | | | | 53 | |
| | | | | | | |
2010 | | | | | |
Cash flow from business combinations1) | | | | –3,286 | | | | 454 | |
| | | | | | | |
Total | | | | –3,286 | | | | 454 | |
| | | | | | | |
| 1) | See also noteNote C26, “Business Combinations”combinations”. |
C26 BUSINESS COMBINATIONS
Acquisitions and divestments
Acquisitions
Acquisitions 2010–2012
| | | | | | | | | | | | |
| | | 2012 | | | 2011 | | | 2010 | |
Cash | | | 12,564 | 1) | | | 1,162 | | | | 3,789 | |
| | | | | | | | | | | | |
Total consideration | | | 12,564 | | | | 1,162 | | | | 3,789 | |
| | | | | | | | | | | | |
Acquisition-related costs2) | | | 150 | | | | 77 | | | | 67 | |
Net asset acquired | | | | | | | | | | | | |
Cash and cash equivalents | | | 1,139 | | | | 7 | | | | 570 | |
Property, plant and equipment | | | 480 | | | | 259 | | | | 205 | |
Intangible assets | | | 6,672 | | | | 382 | | | | 3,825 | |
Investments in joint ventures and associated companies | | | — | | | | 120 | | | | 138 | |
Other assets | | | 2,105 | | | | 140 | | | | 2,506 | |
Provisions, including post-employment benefits | | | 714 | | | | –23 | | | | –390 | |
Other liabilities | | | –3,214 | | | | –37 | | | | –3,573 | |
| | | | | | | | | | | | |
Total identifiable net assets | | | 7,896 | | | | 848 | | | | 3,281 | |
Non-controlling interest | | | 375 | | | | 54 | | | | –748 | |
Goodwill | | | 4,293 | | | | 260 | | | | 1,256 | |
| | | | | | | | | | | | |
| | | 12,564 | | | | 1,162 | | | | 3,789 | |
| | | | | | | | | | | | |
ERICSSON ANNUAL REPORT ON FORM 20-F 20092012
NOTES TO THE CONSOLIDATED FINANCIAL STATEMENTS—(Continued)
C26 BUSINESS COMBINATIONS
Acquisitions and divestments
Acquisitions
| | | | | | |
| | | 2009 | | 2008 | | 2007 |
Intangible assets | | 5,832 | | –209 | | 11,627 |
Property, plant and equipment | | 297 | | — | | 325 |
Goodwill | | 3,534 | | –882 | | 16,917 |
Other assets | | 1,235 | | 887 | | 4,266 |
Provisions, including post-employment benefits | | — | | — | | –127 |
Other liabilities | | –1,270 | | 278 | | –6,227 |
Purchase of minority holdings | | — | | — | | 45 |
Cash and cash equivalents | | 5 | | — | | 2,387 |
| | | | | | |
Total purchase price | | 9,633 | | 74 | | 29,213 |
| | | | | | |
Less: | | | | | | |
Cash and cash equivalents | | — | | — | | 2,387 |
Consideration payable | | — | | — | | 534 |
| | | | | | |
Cash flow effect | | 9,633 | | 74 | | 26,292 |
| | | | | | |
| 1) | The cash transaction includes payment of external loan of SEK 6.2 billion and investment in subsidiary of SEK 2.5 billion. |
| 2) | Acquisition-related costs are included in Selling and administrative expenses in the consolidated income statement. |
In 2009,2012, Ericsson made acquisitions with a negative cash flow effect amounting to SEK 9,633 million (SEK 74 million in 2008), primarily:11,575 (1,232) million. The acquisitions consist primarily of:
Nortel:BelAir: On April 2, 2012, the Company acquired 100% of the shares in BelAir Networks, a North American telecom-grade Wi-Fi company. The acquisition gives the Company a telecom-grade Wi-Fi portfolio, technological expertise, IPR, and established customer contracts and relationships. The purchase price was USD 250 million on a cash and debt-free basis.
ConceptWave: On September 25, 2012, the Company announced the acquisition of 100% of the shares in the Canadian company ConceptWave in an all-cash transaction. The acquisition complements the Company’s portfolio in OSS/BSS with order management and product catalog solutions. The purchase price was CAD 55 million on a cash and debt-free basis. Balances to facilitate the Purchase price allocation are preliminary.
Ericsson-LG: On March 22, 2012, the Company announced it had acquired additional shares in Ericsson-LG, thereby increasing the ownership from 50% plus one share to 75%. The company is fully consolidated by the Company, since the original acquisition in July 2010.
Technicolor:On July 25,3, 2012, the Company announced the closing of the acquisition of the broadcast services division of Technicolor. The acquisition brings broadcast customers and playout operations in France, UK and in the Netherlands. The purchase price amounted to EUR 20 million including a potential earn-out valued at EUR 2 million, based on 2015 revenues of the Broadcast services activity. Balances to facilitate the Purchase price allocation are preliminary.
Telcordia: On June 14, 2011, the Company announced that it had entered into an asset purchase agreement to acquire the parts100% of the Carrier networks divisionshares of Nortel relating to CDMATelcordia, a leader in the development of software and LTE technology.services for OSS/BSS. The purchase is structured as an asset acquisition deal atwas completed on January 12, 2012, with a cash purchase price of USD 1.181.15 billion in an all-cash transaction, on a cash and debt freedebt-free basis. The acquisition strengthens Ericsson’s ability to serve North America’s leading wireless operators in the evolution to LTE. Nortel employs approximately 2,500 persons. Net sales for the acquired NortelTelcordia business amounted to approximately SEK 2,711 million4.2 billion for the period November 13–January 12 – December 31, 2009.2012. The acquired NortelTelcordia business had a positive impact on the result. The main reasons for that partGoodwill represented 57% of the acquisition costs are recognized as goodwill, representing 30 percent of total assets acquired, are that future synergies are estimated and alsoacquired. The goodwill is mainly attributable to the value of the compentence acquired assembled work force.and future synergy effects. None of the goodwill is expected to be deductible for tax purposes. Transaction costs for the acquisition amounted to SEK 9657 million.
ERICSSON ANNUAL REPORT ON FORM 20-F 20092012
NOTES TO THE CONSOLIDATED FINANCIAL STATEMENTS—(Continued)
NORTEL BUSINESSTelcordia
| | | | | | |
Net assets acquired | | Book
value | | Fair value
adjustments | | Fair
value |
| | | |
Intangible assets | | | | | | |
Intellectual property rights | | — | | 4,979 | | 4,979 |
Customer relationships | | — | | 811 | | 811 |
Goodwill | | — | | 2,957 | | 2,957 |
Other assets and liabilities | | | | | | |
Inventory | | 187 | | — | | 187 |
Property, plant and equipment | | 261 | | — | | 261 |
Other assets | | 392 | | — | | 392 |
Other liabilities | | –1,242 | | — | | –1,242 |
| | | | | | |
Total purchase price | | | | | | 8,345 |
| | | | | | |
Less: | | | | | | |
Cash and cash equivalents | | — | | — | | — |
| | | | | | |
Cash flow effect | | | | | | 8,345 |
| | | | | | |
| | | | |
| | 2012 | |
Cash | | | 8,725 | 1) |
| | | | |
Total consideration | | | 8,725 | |
| | | | |
Acquisition-related costs2) | | | 57 | |
Net asset acquired | | | | |
Cash and cash equivalents | | | 886 | |
Property, plant and equipment | | | 305 | |
Intangible assets | | | 5,543 | |
Other assets3) | | | 1,713 | |
Provisions, including post-employment benefits | | | 714 | |
Other liabilities | | | –3,586 | |
| | | | |
Total identifiable net assets | | | 5,575 | |
Goodwill | | | 3,150 | |
| | | | |
| | | 8,725 | |
| | | | |
The determination of purchase
| 1) | The cash transaction includes payment of external loan of SEK 6.2 billion and investment in subsidiary of SEK 2.5 billion. |
| 2) | Acquisition-related costs are included in Selling and administrative expenses in the consolidated income statement. |
| 3) | Other assets include trade receivables with a fair value of SEK 1.4 billion. |
In order to finalize a Purchase price allocation all relevant information needs to be in place. Examples of such information are final consideration and fair valuesfinal opening balances, they may remain preliminary for a period of assets acquired and liabilities assumed is based on preliminary appraisal; therefore, these values may be subjecttime due to adjustments.
Bizitek:On May 28, the Company announced that it has acquired all shares in Bizitek, a Turkish systems integrator of business support systems. With this acquisition Ericsson will strengthen itsfor example working capital adjustments, tax items or decisions from local R&D force as well as its leadership in the field of systems integration. The acquisition gives Ericsson an additional competence to provide end-to-end solutions in business support systems for charging, provisioning, billing and customer relations management. The purchase price was TTL 5,840 million. All 116 employees were transferred to Ericsson.authorities.
Elcoteq:On June 17, the Company announced the purchase of Elcoteq’s manufacturing operations in Tallinn, Estonia, to secure manufacturing capacity. Elcoteq SE is a leading electronics manufacturing Services Company in the communications technology field. The purchase price was EUR 30 million, mainly relating to inventory and some minor assets. The agreement includes transfer of about 1,200 employees.
LHS:On July 3, the Company announced that it has acquired additional shares in LHS, thereby increasing its ownership in the German company to 99.83 percent. In addition goodwill increased by SEK 560 million.
ERICSSON ANNUAL REPORT ON FORM 20-F 2009
NOTES TO THE CONSOLIDATED FINANCIAL STATEMENTS—(Continued)
OTHER
| | | | | | |
Net assets acquired | | Book
value | | Fair value
adjustments | | Fair
value |
Intangible assets | | | | | | |
Customer relationships | | — | | 42 | | 42 |
Goodwill | | — | | 577 | | 577 |
Other assets and liabilities | | | | | | |
Inventory | | 298 | | — | | 298 |
Property, plant and equipment | | 36 | | — | | 36 |
Other assets | | 358 | | — | | 358 |
Cash and cash equivalents | | 5 | | — | | 5 |
Other liabilities | | –28 | | — | | –28 |
| | | | | | |
Total purchase price | | | | | | 1,288 |
| | | | | | |
Less: | | | | | | |
Cash and cash equivalents | | | | | | — |
| | | | | | |
Cash flow effect | | | | | | 1,288 |
| | | | | | |
The determination of purchase price allocation and fair values of assets acquired and liabilities assumed is based on preliminary appraisal; therefore, these values may be subject to minor adjustments.
In 2008 the preliminary purchase price allocations made in 2007 related to acquired businesses were finalized with the following effects:
Redback: An increase in deferred tax assets of SEK 593 million, goodwill decreased correspondingly.
Tandberg:Decreased intangible assets by SEK 209 million, increased goodwill by SEK 71 million and increased deferred tax assets by SEK 138 million.
Entrisphere:An increase in deferred tax assets of SEK 130 million, goodwill decrease correspondingly. In addition goodwill decreased by SEK 260 million, regarding Entrisphere, since the additional consideration never was materialized.
Divestments
| | | | | | |
Net assets disposed of | | 2009 | | 2008 | | 2007 |
Property, plant and equipment | | 5 | | 3 | | 13 |
Other assets | | 586 | | 1,005 | | 498 |
Provisions, including post-employment benefits | | — | | — | | –19 |
Other liabilities | | –38 | | –456 | | –234 |
| | | | | | |
| | 553 | | 552 | | 258 |
Net gains from divestments | | 780 | | 296 | | 280 |
| | | | | | |
Less: | | | | | | |
Cash and cash equivalents | | 94 | | 194 | | 454 |
| | | | | | |
Cash flow effect | | 1,239 | | 654 | | 84 |
| | | | | | |
ERICSSON ANNUAL REPORT ON FORM 20-F 2009
NOTES TO THE CONSOLIDATED FINANCIAL STATEMENTS—(Continued)Divestments 2010–2012
| | | | | | | | | | | | |
| | | 2012 | | | 2011 | | | 2010 | |
Cash | | | 9,502 | | | | –28 | | | | 454 | |
Net assets disposed of | | | | | | | | | | | | |
Property, plant and equipment | | | — | | | | 1 | | | | 21 | |
Investments in joint ventures and associated companies | | | 1,353 | | | | 10 | | | | — | |
Other assets | | | 296 | | | | 38 | | | | 372 | |
Other liabilities | | | –483 | | | | –224 | | | | –183 | |
| | | | | | | | | | | | |
| | | 1,166 | | | | –175 | | | | 210 | |
Net gains from divestments | | | 8,336 | | | | 158 | | | | 357 | |
Less Cash and cash equivalents | | | — | | | | –11 | | | | –113 | |
| | | | | | | | | | | | |
Cash flow effect | | | 9,502 | | | | –28 | | | | 454 | |
| | | | | | | | | | | | |
In 2009,2012, the Company made divestments with a cash flow effect amounting to SEK 1,239 million (SEK 654 million in 2008), primarily:9,502 (–28) million.
TEMS:IPX:On March 23, 2009,September 30, 2012, the Company announced an agreementdivested its Multimedia brokering platform (IPX) to divest its TEMS branded products business, consistingFrench listed company Gemalto, with the exception of tools for air interface monitoring and radio network planning, to Ascom.the operations in the US. The purchase price was CHF 190 million, excluding net of assets and liabilities. The agreement involves transfer of approximately 300 employees. Salessale resulted in 2009 amounted to approximately SEK 256 million.
TEMS BUSINESS
| | |
Net assets disposed of
| | 2009 |
Property, plant and equipment
| | 5 |
Other assets
| | 276 |
Other liabilities
| | –38 |
| | |
| | 243 |
Net gains from divestments
| | 777 |
| | |
Less:
| | |
Cash and cash equivalents
| | 94 |
| | |
Cash flow effect
| | 926 |
| | |
Divestments in 2008 refer mainly to Enterprise PBX solutions business with a gain amounting to SEK 151237 million and a Cashpositive cash flow effect of SEK 637260 million.
Sony Ericsson: On February 16, 2012, the Company announced the completion of the divestment of its 50% stake in Sony Ericsson Mobile Communications, with a carrying value of 1.4 billion. The agreed
ERICSSON ANNUAL REPORT ON FORM 20-F 20092012
NOTES TO THE CONSOLIDATED FINANCIAL STATEMENTS—(Continued)
| cash consideration for the transaction was EUR 1.05 billion. The sale resulted in a gain amounting to SEK 7.7 billion and a positive cash flow effect of SEK 9.1 billion. For further information on the divestment of Sony Ericsson, see note C3, “Segment information”. |
ACQUISITIONS 2007–2009Acquisitions 2010–2012
| | | | |
Company | | Description | | DateTransaction
date
|
ConceptWave | | A Canadian OSS/BSS company. The purchase price was CAD 55 million. | | Sep, 2012 |
| | |
Technicolor | | A technology company in the media and entertainment sector. The purchase price was EUR 20 million. | | Jul, 2012 |
| | |
BelAir | | A telecom-grade Wi-Fi company based in Canada. The purchase price was USD 250 million. | | Apr, 2012 |
| | |
Ericsson-LG | | Increase of ownership from 50% plus one share, to 75%. | | Mar, 2012 |
| | |
Telcordia | | A US company developing software and services for OSS/BSS. The purchase price was USD 1.15 billion. | | Jan, 2012 |
| | |
GDNT | | An asset purchase agreement of certain assets. Enhances the Company’s existing R&D, manufacturing and services capabilities in the China region. The purchase price was RMB 357 million. | | May, 2011 |
| | |
Nortel Multiservice Switch business (MSS) | | An asset purchase agreement to acquire certain assets of Nortel’s MSS. The purchase price was USD 53 million. | | Mar, 2011 |
| | |
Optimi | | A US-Spanish telecommunications vendor providing products and services within the networks optimization and management sector. The purchase price was USD 99 million. | | Dec, 2010 |
| | |
inCode | | An asset purchase agreement of certain assets. A professional services firm providing strategic business and consulting services. The purchase price was USD 12 million. | | Sep, 2010 |
| | |
LG-Nortel | | Nortel’s majority shareholding (50% + 1 share) in LG-Nortel. The purchase price was USD 234 million. | | Jun, 2010 |
| | |
Nortel GSM | | An asset purchase agreement of the Carrier networks division of Nortel relating to CDMA and LTE technology.GSM business. The purchase price was USD 79 million. | | Nov 13, 2009Mar, 2010 |
| | |
ElcoteqPride
| | Estonian electronics manufacturing service company with around 1,200 employees. | | June 17, 2009 |
| | |
Bizitek
| | Turkish systems integrator of business support systems with around 116 employees. | | May 28, 2009 |
| | |
Mobeon
| | Swedish company. Acquisition of shares. | | Mar 31, 2008 |
| | |
HyC
| | Spanish company with around 110 employees that specializes in designAn Italian consulting and systems integration of IPTV networks. | | Dec 30, 2007 |
| | |
LHS
| | German provider of post-paid billing and customer care systems for wireless, wireline, and IP telecom markets. Purchasecompany. The purchase price SEK 2.7 billion. | | Oct 1, 2007 |
| | |
Drutt
| | Swedish company, with around 85 employees, that develops Mobile Service Delivery Platform which enables mobile operators to mobilize and charge for any content to any device, over any delivery channel. | | June 28, 2007 |
| | |
Tandberg Television
| | Norwegian global supplier of products for digital TV solutions, including IPTV, HDTV, video on demand, advertising on demand and interactive TV applications. Purchase price SEK 9.8 billion. | | May 1, 2007 |
| | |
Mobeon
| | Swedish business, with around 130 employees that develops IP messaging software technology. | | Mar 15, 2007 |
| | |
Entrisphere
| | US-based company, with around 140 employees, that develops gigabit passive optical network (GPON) technology for fixed broadband access, i.e. FTTx. | | Feb 12, 2007 |
| | |
Redback Networks
| | US supplier of multi-service routing platform for broadband services such as VoIP, IPTV and Video On-Demand. Purchase price SEK 14.8 billion.was EUR 66 million. | | Jan, 23, 20072010 |
DIVESTMENTS 2007–2009Divestments 2010–2012
| | | | |
Company | | Description | | DateTransaction
date
|
TEMSIPX
| | Tools for air interface monitoring and radio network planning. CashSale of IPX to Gemalto, with a positive cash flow effect of SEK 0.9 billion.260 million. | | Mar 23, 2009Sep, 2012 |
| | |
EnterpriseEDA 1500 GPON
| | PBX solutions business. CashCapital asset sale of EDA 1500 GPON portfolio with a positive cash flow effect of SEK 0.680 million. | | Aug, 2012 |
| | |
Sony Ericsson | | Sale of the Company’s share in Sony Ericsson (50%) to Sony, with a positive cash flow effect of SEK 9.1 billion. | | May 1, 2008Feb, 2012 |
| | |
EFI | | Sale of Ericsson Federal Inc. (EFI), with a positive cash flow effect of SEK 360 million. | | Dec, 2010 |
ERICSSON ANNUAL REPORT ON FORM 20-F 20092012
NOTES TO THE CONSOLIDATED FINANCIAL STATEMENTS—(Continued)
C27 LEASING
Leasing with the Company as lessee
Assets under finance leases, recorded as property, plant and equipment, consist of:
FINANCE LEASESFinance leases
| | | | 2009 | | 2008 | | 2012 | | | 2011 | |
Acquisition costs | | | | | |
Cost | | | | | |
Real estate | | 1,942 | | 2,059 | | | 1,538 | | | | 1,856 | |
Machinery | | 4 | | 4 | | | 3 | | | | 3 | |
| | | | | | | | | | |
| | 1,946 | | 2,063 | | | 1,541 | | | | 1,859 | |
| | | | | | | | | | |
Accumulated depreciation | | | | | | | | |
Real estate | | –662 | | –763 | | | –601 | | | | –725 | |
Machinery | | –4 | | –4 | | | –3 | | | | –3 | |
| | | | | | | | | | |
| | –666 | | –767 | | | –604 | | | | –728 | |
| | | | | | | | | | |
Accumulated impairment losses | | | | | | | | |
Real estate | | –49 | | –10 | | | –35 | | | | –42 | |
| | | | | | | –35 | | | | –42 | |
| | | | | | | |
Net carrying value | | 1,231 | | 1,286 | | | 902 | | | | 1,089 | |
| | | | | | | | | | |
As of December 31, 2009,2012, future minimum lease payment obligations for leases were distributed as follows:
Future minimum lease payment obligations for leases
| | | | |
| | | Finance
leases | | Operating
leases |
| | |
2010 | | 177 | | 3,185 |
2011 | | 168 | | 2,611 |
2012 | | 166 | | 2,102 |
2013 | | 164 | | 1,270 |
2014 | | 209 | | 935 |
2015 and later | | 1186 | | 2,371 |
| | | | |
Total | | 2,070 | | 12,474 |
| | | | |
Future finance charges1) | | –676 | | n/a |
| | | | |
Present value of finance lease liabilities | | 1,394 | | 12,474 |
| | | | |
| | | | | | | | |
| | | Finance
leases | | | Operating
leases | |
2013 | | | 150 | | | | 2,847 | |
2014 | | | 229 | | | | 1,794 | |
2015 | | | 127 | | | | 1,388 | |
2016 | | | 85 | | | | 1,105 | |
2017 | | | 76 | | | | 777 | |
2018 and later | | | 795 | | | | 2,472 | |
| | | | | | | | |
Total | | | 1,462 | | | | 10,383 | |
| | | | | | | | |
Future finance charges1) | | | –398 | | | | n/a | |
| | | | | | | | |
Present value of finance lease liabilities | | | 1,064 | | | | 10,383 | |
| | | | | | | | |
| 1) | Average effective interest rate on lease payables is 5.63 percent.5.69%. |
Expenses in 20092012 for leasing of assets were SEK 3,839 (4,708)3,172 (3,362) million, of which variable expenses were SEK 0 (1)20 (7) million. The leasing contracts vary in length from 1 to 20 years.
The Company’s lease agreements normally do not include any contingent rents. In the few cases they occur, they relate to charges for heating linked to the oil price index. Most of the leases of real estate contain terms of renewal, giving the companyCompany the right to prolong the agreement in question for a predefined period of time. All of the finance leases of facilities contain purchase options. Only a very limited number of the
ERICSSON ANNUAL REPORT ON FORM 20-F 2012
Company’s lease agreements contain restrictions on stockholders’ equity or other means of finance. The major agreement contains a restriction stating that the Parent Company must maintain a stockholders���stockholders’ equity of at least SEK 25 billion.
ERICSSON ANNUAL REPORT ON FORM 20-F 2009
NOTES TO THE CONSOLIDATED FINANCIAL STATEMENTS—(Continued)
Leases with the Company as lessor
Leasing income mainly relates to subleasing of real estate.estate as well as equipment provided to customers under leasing arrangements. These leasing contracts vary in length from 1 to 11 years.
At December 31, 2009,2012, future minimum payment receivables were distributed as follows:
Future minimum payment receivables
| | | | |
| | | Finance
leases | | Operating
leases |
| | |
2010 | | — | | 112 |
2011 | | — | | 51 |
2012 | | — | | 17 |
2013 | | — | | 14 |
2014 | | — | | 14 |
2015 and later | | — | | 54 |
| | | | |
Total | | — | | 262 |
| | | | |
Unearned financial income | | — | | n/a |
Uncollectible lease payments | | — | | n/a |
| | | | |
Net investments in financial leases | | — | | n/a |
| | | | |
| | | | | | | | |
| | | Finance
leases | | | Operating
leases | |
2013 | | | 6 | | | | 154 | |
2014 | | | 6 | | | | 143 | |
2015 | | | 6 | | | | 96 | |
2016 | | | 6 | | | | 23 | |
2017 | | | 6 | | | | 18 | |
2018 and later | | | — | | | | 52 | |
| | | | | | | | |
Total | | | 30 | | | | 486 | |
| | | | | | | | |
Unearned financial income | | | n/a | | | | n/a | |
Uncollectible lease payments | | | n/a | | | | n/a | |
| | | | | | | | |
Net investments in financial leases | | | n/a | | | | n/a | |
| | | | | | | | |
Leasing income in 20092012 was SEK 181 (205)236 (76) million.
C28 TAX ASSESSMENT VALUES IN SWEDEN
| | | | |
| | | 2009 | | 2008 |
Land and land improvements | | 58 | | 58 |
Buildings | | 265 | | 265 |
| | | | |
Total | | 323 | | 323 |
| | | | |
ERICSSON ANNUAL REPORT ON FORM 20-F 20092012
NOTES TO THE CONSOLIDATED FINANCIAL STATEMENTS—(Continued)
C29C28 INFORMATION REGARDING MEMBERS OF THE BOARD OF DIRECTORS, THE GROUP MANAGEMENT AND EMPLOYEES
CONTENTS
Remuneration to the Board of Directors
REMUNERATION TO MEMBERS OF THE BOARD OF DIRECTORSRemuneration to members of the Board of Directors
| | | | Board
fees | | Number
of synthetic
shares/
portion of
Board fee | | Value at
grant date
of synthetic
shares
allocated 2009
A | | Number of
previously
allocated
synthetic
shares | | Net change
in value
of allocated
synthetic
shares1)
B | | Committee
fees | | Total fees
paid in
cash2)
C | | Total
recognized
costs 2009
(A+B+C) | |
SEK | | | Board fees | | Number
of synthetic
shares/
portion of
Board fee | | Value at
grant date of
synthetic
shares
allocated in 2012
A | | Number of
previously
allocated
synthetic
shares
outstanding | | Net change
in value
of allocated
synthetic
shares1)
B | | Committee
fees | | Total fees
paid in
cash2)
C | | Total
remuneration
2012
(A+B+C) | |
Board member | | | | | | | | | | | | | | | | | | | | | | | | | | | | | | | | |
Michael Treschow | | 3,750,000 | | 40,747/75 | % | | 2,812,500 | | 38,323.80 | | +227,763 | | 250,000 | | 1,187,500 | | 4,227,763 | |
Marcus Wallenberg | | 750,000 | | 2,716/25 | % | | 187,500 | | 2,554.80 | | +15,153 | | 125,000 | | 687,500 | | 890,153 | |
Sverker Martin–Löf | | 750,000 | | 0/0 | % | | — | | — | | — | | — | | 750,000 | | 750,000 | |
Leif Johansson | | | | 3,750,000 | | | | 0/0 | % | | | — | | | | — | | | | — | | | | 400,000 | | | | 4,150,000 | 3) | | | 4,150,000 | |
Sverker Martin-Löf | | | | 875,000 | | | | 0/0 | % | | | — | | | | — | | | | — | | | | 250,000 | | | | 1,125,000 | | | | 1,125,000 | |
Jacob Wallenberg | | | | 875,000 | | | | 6,984/50 | % | | | 437,499 | | | | 2,262.00 | | | | 10,826 | | | | 175,000 | | | | 612,500 | | | | 1,060,825 | |
Roxanne S. Austin | | 750,000 | | 8,149/75 | % | | 562,500 | | 7,664.60 | | +45,524 | | 250,000 | | 437,500 | | 1,045,524 | | | 875,000 | | | | 6,984/50 | % | | | 437,499 | | | | 29,172.60 | | | | 31,648 | | | | 250,000 | | | | 687,500 | | | | 1,156,647 | |
Sir Peter L. Bonfield | | 750,000 | | 2,716/25 | % | | 187,500 | | 2,554.80 | | +15,153 | | 250,000 | | 812,500 | | 1,015,153 | | | 875,000 | | | | 3,492/25 | % | | | 218,749 | | | | 9,722.80 | | | | 13,411 | | | | 250,000 | | | | 906,250 | | | | 1,138,410 | |
Börje Ekholm | | 750,000 | | 8,149/75 | % | | 562,500 | | 7,664.60 | | +45,524 | | 125,000 | | 312,500 | | 920,524 | | | 875,000 | | | | 10,476/75 | % | | | 656,248 | | | | 29,172.60 | | | | 40,228 | | | | 175,000 | | | | 393,750 | | | | 1,090,226 | |
Alexander Izosimov | | | | 875,000 | | | | 3,492/25 | % | | | 218,749 | | | | — | | | | 8,580 | | | | — | | | | 656,250 | | | | 883,579 | |
Ulf J. Johansson | | 750,000 | | 8,149/75 | % | | 562,500 | | 7,664.60 | | +45,524 | | 350,000 | | 537,500 | | 1,145,524 | | | 875,000 | | | | 0/0 | % | | | — | | | | 22,384.60 | | | | 33,495 | | | | 350,000 | | | | 1,225,000 | 4) | | | 1,258,495 | |
Nancy McKinstry | | 750,000 | | 5,433/50 | % | | 375,000 | | 7,664.60 | | +53,904 | | 125,000 | | 500,000 | | 928,904 | | | 875,000 | | | | 0/0 | % | | | — | | | | 22,002.60 | | | | 18,092 | | | | 175,000 | | | | 1,050,000 | | | | 1,068,092 | |
Anders Nyrén | | 750,000 | | 0/0 | % | | — | | — | | — | | 125,000 | | 875,000 | | 875,000 | | | 875,000 | | | | 0/0 | % | | | — | | | | — | | | | — | | | | 175,000 | | | | 1,050,000 | | | | 1,050,000 | |
Carl-Henric Svanberg | | — | | — | | | — | | — | | — | | — | | — | | — | |
Hans Vestberg | | | | — | | | | — | | | | — | | | | — | | | | — | | | | — | | | | — | | | | — | |
Michelangelo Volpi | | | | 875,000 | | | | 0/0 | % | | | — | | | | 4,380.00 | | | | –2,409 | | | | — | | | | 875,000 | | | | 872,591 | |
Employee Representatives | | | | | | | | | | | | | | | | | | | | | | | | | | | | | | | | |
Jan Hedlund | | 18,000 | | — | | | | | — | | — | | — | | 18,000 | | 18,000 | |
Anna Guldstrand | | 21,000 | | — | | | | | — | | — | | — | | 21,000 | | 21,000 | |
Pehr Claesson | | | | 18,000 | | | | — | | | | — | | | | — | | | | — | | | | — | | | | 18,000 | | | | 18,000 | |
Kristina Davidsson | | | | 18,000 | | | | — | | | | — | | | | — | | | | — | | | | — | | | | 18,000 | | | | 18,000 | |
Jan Hedlund5) | | | | 6,000 | | | | — | | | | — | | | | — | | | | — | | | | — | | | | 6,000 | | | | 6,000 | |
Karin Åberg | | 19,500 | | — | | | | | — | | — | | — | | 19,500 | | 19,500 | | | 18,000 | | | | — | | | | — | | | | — | | | | — | | | | — | | | | 18,000 | | | | 18,000 | |
Monica Bergström | | 19,500 | | — | | | | | — | | — | | — | | 19,500 | | 19,500 | |
Kristina Davidsson | | 21,000 | | — | | | | | — | | — | | — | | 21,000 | | 21,000 | |
Pehr Claesson | | 21,000 | | — | | | | | — | | — | | — | | 21,000 | | 21,000 | |
Rickard Fredriksson6) | | | | 10,500 | | | | — | | | | — | | | | — | | | | — | | | | — | | | | 10,500 | | | | 10,500 | |
Karin Lennartsson | | | | 18,000 | | | | — | | | | — | | | | — | | | | — | | | | — | | | | 18,000 | | | | 18,000 | |
Roger Svensson | | | | 18,000 | | | | — | | | | — | | | | — | | | | — | | | | — | | | | 18,000 | | | | 18,000 | |
| | | | | | | | | | | | | | | | | | | | | | | | | | | | | | | | | | | | | | | | | |
Total | | 9,870,000 | | 76,059 | | | 5,250,000 | | 74,091.80 | | +448,545 | | 1,600,000 | | 6,220,000 | | 11,918,545 | | | 12,606,500 | | | | 31,428 | | | | 1,968,744 | | | | 119,097.20 | | | | 153,871 | | | | 2,200,000 | | | | 12,837,750 | | | | 14,960,365 | 7) |
| | | | | | | | | | | | | | | | | | | | | | | | | | | | | | | | | | | | | | | | | |
Total | | | | 12,606,500 | | | | 31,428 | | | | 1,968,744 | | | | 128,002.20 | 8) | | | 138,792 | 8) | | | 2,200,000 | | | | 20,706,150 | 9) | | | 22,813,687 | 7)9) |
| | | | | | | | | | | | | | | | | | | | | | | | | |
| 1) | The difference in value as of December 31, 20092012, compared to December 31, 2008 (with respect to2011 (for synthetic shares allocated 2008)2008, 2009, 2010 and 2011), and compared to grant date 2009 (with respect to2012 (for synthetic shares allocated 2009)in 2012). The value of synthetic shares allocated in 2008, 2009, 2010 and 2011 includes respectively SEK 1.85, SEK 2.00, SEK 2.25 and SEK 2.50 per share in compensation for dividends resolved by the Annual General Meeting 2009.Meetings 2009, 2010, 2011 and 2012. |
| 2) | Committee fee and cash portion of the Board fee. |
| 3) | In addition, an amount corresponding to statutory social charges in respect of the part of the fee that has been invoiced through a company was paid, amounting to SEK 1,303,930. |
| 4) | In addition, an amount corresponding to statutory social charges in respect of the part of the fee that has been invoiced through a company was paid, amounting to SEK 122,520. |
| 5) | Resigned as employee representative as of May 3, 2012. |
| 6) | Appointed deputy employee representative as of May 3, 2012. |
| 7) | Excluding social security charges in the amount of SEK 3,950,998. |
ERICSSON ANNUAL REPORT ON FORM 20-F 20092012
NOTES TO THE CONSOLIDATED FINANCIAL STATEMENTS—(Continued)
| 8) | Including synthetic shares previously allocated to the former Director Carl-Henric Svanberg. |
| 9) | Including advance payments to the former Directors Michael Treschow and Marcus Wallenberg under the synthetic share programs. Michael Treschow: SEK 7,376,686 for 111,926.80 synthetic shares (in addition, an amount corresponding to statutory social charges in respect of the part of the fee that has been invoiced through a company was paid, amounting to SEK 753,159) and Marcus Wallenberg: SEK 491,714 for 7,460.80 synthetic shares. |
Comments to the table
The Chairman of the Board was entitled to a Board fee of SEK 3,750,000. The Chairman also received3,750,000 and a fee of SEK 125,000200,000 for each Board committeeCommittee on which he served.served as Chairman.
The other Directors appointedelected by the Annual General Meeting were entitled to a fee of SEK 750,000875,000 each. In addition, each non-employed Director serving on a Board committee received a fee of SEK 125,000 for each committee. However, the Chairman of the Audit Committee receivedwas entitled to a fee of SEK 350,000 and the other non-employed members of the Audit Committee receivedwere entitled to a fee of SEK 250,000 each. The Chairmen of the Finance and Remuneration Committees were entitled to a fee of SEK 200,000 each and the other non-employed members of the Finance and the Remuneration Committees were entitled to a fee of SEK 175,000 each.
Members of the Board, who are not employees of the Company, have not received any remuneration other than the fees and synthetic shares as above. None of the directorsDirectors have entered into a service contract with the Parent Company or any of its subsidiaries, providing for termination benefits.
Members and Deputy Membersdeputy members of the Board who are Ericsson employees received no remuneration or benefits other than their entitlements as employees. However,employees and a fee to the employee representatives and their deputies of SEK 1,500 per attended Board meeting was paid to each employee representative onmeeting.
Board members invoicing the amount of the Board and their deputies.Committee fee through a company may add to the invoice an amount corresponding to social charges. The social charges thus included in the invoiced amount are not higher than the general payroll tax that would otherwise have been paid by the Company. The entire amount, i.e. the cash portion of the Board fee and the Committee fee, including social charges, constitutes the invoiced Board fee.
The Annual General Meeting 20092012 resolved that non-employed Directors may choose to receive the Board fee (i.e. exclusive of committee fee) as follows: i) 25 percent25% of the Board fee in cash and 75 percent75% in the form of synthetic shares, with a value corresponding to 75 percent75% of the Board fee at the time of allocation, ii) 50 percent50% in cash and 50 percent50% in the form of synthetic shares, or iii) 75 percent75% in cash and 25 percent25% in the form of synthetic shares. Directors may also choose not to participate in the synthetic share program and receive 100 percent100% of the Board fee in cash. Committee fees are always paid in cash.
The number of synthetic shares is based on a volume-weighed average of the market price of Ericsson Class B shares on the NASDAQ OMX Stockholm exchange during the five trading days immediately following the publication of Ericsson’s interim report for the first quarter of 2009:Annual General Meeting 2012: SEK 69.0222.62.643. The number of synthetic shares is rounded down to the nearest whole number of shares.
The synthetic shares are vested during the Directors’ term of office and the right to receive payment with regard to the allocated synthetic shares occurs after the publication of the Company’s year-end financial statement during the fifth year following the Annual General Meeting which resolved on the synthetic share program, i.e. in 2014.2017.
The amount payable shall be determined based on the volume-weighed average price for shares of Class B during the five trading days immediately following the publication of the year-end financial statement.
ERICSSON ANNUAL REPORT ON FORM 20-F 2012
Synthetic shares were allocated to members of the Board for the first time in 2008, on equal terms and conditions as resolved 2009.in 2009, 2010, 2011 and 2012. Payment based on synthetic shares may thus, under the main rule, occur for the first time in 2013 with respect to the synthetic shares allocated in 2008. The value of all outstanding synthetic shares fluctuates in line with the market value of Ericsson’s Class B share and may differ from year to year compared to the original value on their respective grant dates. The change in value of the outstanding synthetic shares is established each year and affects the total recognized costs that year. As per December 31, 20092012, the total number of synthetic shares under the programs is 150,150.80159,430.20, and the total accounted debt is SEK 10,039,515.11,113,237 (including synthetic shares previously allocated to the former Director Carl-Henric Svanberg). In accordance with the terms and conditions for the synthetic shares, the time for payment to the former Director Carl-Henric Svanberg has been advanced, to occur after the publication of the year-end financial statement 2013. In February 2012, advance payment was made to the former Directors Michael Treschow and Marcus Wallenberg with respect to their synthetic shares, all in accordance with the terms and conditions for the synthetic shares.
Remuneration to the Group Management
RemunerationThe Company’s costs for remuneration to the Group Managementmanagement are the costs recognized in the Income Statement during the fiscal year. These costs are disclosed under “Remuneration costs” below.
Costs recognized during a fiscal year in the Income Statement are not fully paid by the Company at the end of the fiscal year. The unpaid amounts that the Company has in relation to the Group management are disclosed under “Outstanding balances”.
Remuneration costs
The total remuneration to the President and CEO and to other members of the Group Managementmanagement, consisting of the Executive Leadership Team (ELT) includes fixed salary, short-term and long-term variable remuneration, pension and other benefits. These remuneration elements are based on the guidelines for remuneration and other employment conditions for senior managementthe ELT as approved at AGM 2009,by the Annual General Meeting held in 2012, see the approved guidelines in “2009 Remuneration Policysection “Guidelines for remuneration to Group Management”Management 2012”.
ERICSSON ANNUAL REPORT ON FORM 20-F 2009
NOTES TO THE CONSOLIDATED FINANCIAL STATEMENTS—(Continued)Remuneration costs for the President and CEO and other members of Executive Leadership Team (ELT)
The Remuneration Policy and how it is implemented at Ericsson is outlined in “Remuneration Report”.
| | | | | | | | | | | | | | | | | | | | | | | | |
SEK | | The President
and CEO 2012 | | | The President
and CEO 2011 | | | Other members
of ELT 2012 | | | Other members
of ELT 2011 | | | Total 2012 | | | Total 2011 | |
Salary | | | 12,573,233 | | | | 11,739,341 | | | | 76,973,215 | | | | 76,031,733 | | | | 89,546,448 | | | | 87,771,074 | |
Costs for annual variable remuneration earned 2012 to be paid 2013 | | | 3,972,247 | | | | 2,771,134 | | | | 21,877,700 | | | | 18,460,645 | | | | 25,849,947 | | | | 21,231,779 | |
Long-term variable remuneration provision | | | 6,439,873 | | | | 5,636,050 | | | | 6,472,215 | | | | 8,916,556 | | | | 12,912,088 | | | | 14,552,606 | |
Pension costs | | | 6,491,713 | | | | 5,960,566 | | | | 22,865,674 | | | | 22,154,413 | | | | 29,357,387 | | | | 28,114,979 | |
Other benefits | | | 123,612 | | | | 78,594 | | | | 4,431,160 | | | | 4,944,762 | | | | 4,554,772 | | | | 5,023,356 | |
Social charges and taxes | | | 9,114,641 | | | | 7,800,766 | | | | 22,877,888 | | | | 23,529,200 | | | | 31,992,529 | | | | 31,329,966 | |
| | | | | | | | | | | | | | | | | | | | | | | | |
Total | | | 38,715,319 | | | | 33,986,451 | | | | 155,497,852 | | | | 154,037,309 | | | | 194,213,171 | | | | 188,023,760 | |
| | | | | | | | | | | | | | | | | | | | | | | | |
REMUNERATION COSTS INCURRED DURING 2009 FOR THE PRESIDENT AND CEO AND OTHER MEMBERS OF GROUP MANAGEMENT
| | | | | | |
SEK | | The
President | | Other Members
of Group
Management | | Total |
Salary | | 15,981,000 | | 45,672,309 | | 61,653,309 |
Provisions for annual variable remuneration earned 2009 to be paid 2010 | | 6,226,920 | | 15,137,637 | | 21,364,557 |
Long-term variable remuneration provision | | 1,261,476 | | 1,910,875 | | 3,172,351 |
Pension costs | | 18,917,620 | | 28,656,277 | | 47,573,897 |
Other benefits | | 59,664 | | 2,363,773 | | 2,423,437 |
| | | | | | |
Total | | 42,446,680 | | 93,740,871 | | 136,187,551 |
| | | | | | |
Comments to the table
During 2009,2012 there were three Executive Vice Presidents, who have been appointed by the Board of Directors,Directors. None of whom one has have left his position during the year. No one of these executivesthem has acted as deputy to the President and CEO during the year. AllThe Executive Vice Presidents are included in the group “Other members of Group Management”ELT”.
ERICSSON ANNUAL REPORT ON FORM 20-F 2012
The group “Other members of Group Management”ELT” comprises the following persons: Hans Vestberg,Per Borgklint, Bina Chaurasia, Hĺkan Eriksson (up to January 31), Ulf Ewaldsson (from February 1), Jan Frykhammar, Johan Wibergh, Carl Olof Blomqvist, Cesare Avenia (from November 9, 2009), Håkan Eriksson, Douglas L. Gilstrap, (from September 7, 2009), Marita Hellberg,Nina Macpherson, Magnus Mandersson, (from November 13, 2009), Torbjörn Possne, Henry Sténson,Helena Norrman, Mats H. Olsson, Rima Qureshi, Angel Ruiz, Johan Wibergh and Jan Wäreby. Bert Nordberg left the Group Management Team as of September 1, 2009. Joakim Westh left the Group Management Team as of January 1, 2009, but is included up to June 30, 2009, as he was fulfilling his six-month notice period.
The salary stated in the table includes vacation salary paid during 2009.
During 2010,for the President and CEO has received SEK 6,804,000and other members of the ELT includes vacation pay paid during 2012 as well as other contracted compensation which were paid during 2012 or provisioned for outstanding vacation at the time of his resignation, i.e. earned but not used vacation days during his employment at Ericsson.2012.
“Long-term variable remuneration provisions”provision” refers to the compensation costs during 20092012 for all outstanding share basedshare-based plans.
For a description of compensation cost, including accounting treatment, see Note C1, “Significant Accounting Policies, Share based employee compensation”.accounting policies”, section Share-based compensation to employees and the Board of Directors.
For the President and CEO and other members of Group Managementthe ELT employed in Sweden before 2011 a supplementary plan is applied in addition to the occupational pension plan for salaried staff on the Swedish labor market (ITP) with pension from 60 years. These pension plans are not conditional upon future employment at Ericsson. For
Outstanding balances
The Company has recognized the President and CEO, the contribution during 2009 for old age pensionfollowing liabilities relating to unpaid remunerations in the supplementary pension plan was SEK 7,489,825 and the fee in the ITP plan SEK 1,427,795. The pension cost for the President and CEO includes a pension supplement of SEK 10,000,000 paid to his existing pension insurance. Changes of commitments made to the President and CEO and other members of Group Management for benefit based temporary disability and survivor’s pension until retirement age are also included in the pension costs.
ERICSSON ANNUAL REPORT ON FORM 20-F 2009
NOTES TO THE CONSOLIDATED FINANCIAL STATEMENTS—(Continued)Balance Sheet:
Ericsson’s commitments for benefit based pensions peras of December 31, 2009,2012 under IAS 19 amounted to SEK 3,025,5275,971,282 for the President and CEO which refers to theincludes ITP plan.plan and temporary disability and survivor’s pension. For other members of Group ManagementELT the Company’s commitments amounted to SEK 47,969,44827,103,244 of which SEK 36,890,05121,429,454 refers to the ITP plan and the remaining SEK 11,079,3975,673,790 to temporary disability and survivor’s pensions until retirement age.pensions.
For previous Presidents and CEOs, the Company has made provisions for defined benefit pension plans in connection with their active service periods within the Company.
Deferred salary, earned 2012 or earlier, to be paid 12 months after period end or later, amounts to SEK 7,899,000.
OUTSTANDING MATCHING RIGHTSMaximum outstanding matching rights
| | | | |
As per December 31, 2009 Number of Class B shares | | The
President | | Other Members
of Group
Management |
Stock Purchase Plans 2006, 2007, 2008 and 2009 and Executive Performance Stock Plans 2007, 2008 and 2009 | | 410,123 | | 553,688 |
| | | | | | | | |
As per December 31, 2012 Number of Class B shares | | The President
and CEO | | | Other members
of the ELT | |
Stock Purchase Plans 2009, 2010, 2011 and 2012 and Executive Performance Stock Plans 2009, 2010, 2011 and 2012 | | | 503,382 | | | | 661,456 | |
Comments to the tablestable
For the definition of matching rights, see the description in section “Long-term variable remuneration”.
The number of matching rights is based on expected performance matching under Executive Performance Stock Plans 2007, 2008 andresult of 70,3% is included for 2009 (there is no payout under the 2006 Executive Performance Stock Plan).plan.
Cash conversion target for 2012 was reached, but not reached in 2011.
During 2009,2012, the President and CEO received 9,18310,108 matching shares and other members of Group Management 10,857the ELT 54,803 matching shares.
Remuneration Policy for Group Management
ERICSSON ANNUAL REPORT ON FORM 20-F 2012
The following guidelines
Guidelines for remuneration and other employment terms forto Group Management were approved by2012
For Group Management consisting of the Annual General Meeting 2009.
2009 Remuneration Policy for Group Management
This policy covers the remuneration and other terms of employment for the Group ManagementExecutive Leadership Team, including the President and CEO, in the following referred to as the “Group Management”.
Remuneration of Group Management in Ericsson is based on the principles of performance, competitiveness and fairness. Different remuneration elements are designed to reflect these principles. Therefore a mix of several remuneration elements is applied in order to reflect the remuneration principles in a balanced way.
The Group Management’s total remuneration consists of fixed salary, variable components in the form of annual short-term variable remunerationshort and long-term variable remuneration, pension and other benefits. Together these elements constitute an integralFurthermore, the following guidelines apply for the remuneration package. Ifto the size of any of the elements should be increased or decreased, at least one other element has to be decreased or increased if the competitive position of the total package should remain unchanged.
ERICSSON ANNUAL REPORT ON FORM 20-F 2009
NOTES TO THE CONSOLIDATED FINANCIAL STATEMENTS—(Continued)Executive Leadership Team:
1. Relative importance of fixed and variable components of the remuneration of Group Management and the linkage between performance and remuneration
Ericsson takes account of global remuneration practices together with the practice of the home country of each member of Group Management.
Fixed salary is set to be competitive. Its absolute level is determined by the size and complexity of the job and the year-to-year performance of the individual jobholder.
Performance is specifically reflected in the variable remuneration—both in an annual variable component and in a long-term variable part. Although this may vary over time to take account of pay trends, currently the target level of the short-term variable remuneration for Group Management is 30 to 40 percent of the fixed salary. The long-term variableVariable remuneration is set to achieve a target of around 30 percent of the fixed salary. In both cases the variable pay is measuredthrough cash and stock-based programs awarded against the achievement of specific business objectives, reflectingtargets derived from the judgment oflong-term business plan approved by the Board of Directors as to the right balance between fixedDirectors. Targets may include financial targets at either corporate or unit level, operational targets, employee motivation targets and variable pay and the market practice for remuneration of executives. All variable remuneration plans have maximum award and vesting limits.customer satisfaction targets.
With the current composition of Group Management,the Executive Leadership Team, the Company’s cost during 20092012 for the short-term variable and the long-term variable remuneration of Group Managementto the Executive Leadership Team can, at a constant share price, amount to between 0 and 125 percent150% of the aggregate fixed salary cost, all excluding social security costs.
2. The principal terms of variable remuneration
The annual variable remuneration is through a cash-based program with specific business targets derived from the annual business plan approved by the Board of Directors. The exact nature of the targets will vary depending on the specific job but may include financial targets at either corporate level or at a specific business unit level, operational targets, employee motivation targets and customer satisfaction targets.
Share based long-term variable remuneration plans are submitted each year for approval by the shareholders in General Meeting. The payout is determined by three specific variables, the individual’s own investment in shares, a long-term financial target at corporate level and the share price development.
3. Pension
PensionAll benefits, including pension benefits, follow the competitive practice in the home country. For Group Management in Sweden, the Company applies a defined contribution scheme for old age pension in addition to the basic pension plans on the Swedish labor market.
country taking total compensation into account. The retirement age is normally 60 to 65 years of age but can vary in individual cases.age.
4. Other benefits
The basic principle is that other benefits, such as company car and medical schemes, shall be competitive in the local market.
5. Additional remuneration arrangements
By way of exception, additional arrangements can be made when deemed required in order to attract or retain key competences or skills, or to encourage individuals to move to new locations or positions.required. Such additional arrangement shall be limited in time and shall not exceed a period of 36 months and two times the remuneration that the individual concerned would have received had no additional arrangement been made.
ERICSSON ANNUAL REPORT ON FORM 20-F 2009
NOTES TO THE CONSOLIDATED FINANCIAL STATEMENTS—(Continued)
6. Notice of termination and severance pay
For Group Management in Sweden theThe mutual notice period ismay be no more than six months. Upon termination of employment by the Company, severance pay amounting to a maximum of 18 monthsmonths’ fixed salary is paid. Notice of termination given by the employee due to significant structural changes, or other events that in a determining manner affect the content of work or the condition for the position, is equated with notice of termination served by the Company.
Long-Term Variable Remunerationremuneration
The Stock Purchase Plan
The Stock Purchase Plan is designed to offer an incentive for all employees to participate in the Company where practicable, which is consistent with industry practice and with our ways of working. For the 20092012 plan, employees are able to save up to 7.5 percent (CEO 9 percent)7.5% of gross fixed salary (President and CEO can save up to 10% of gross fixed salary and short-term variable remuneration) for purchase of Class B contribution shares at market price on the NASDAQ OMX Stockholm or ADSsAmerican Depositary Shares (ADSs) at NASDAQ New York (contribution shares) during a twelve-month period (contribution period). If the contribution shares are retained by the employee for three years after the investment and the employment with the Ericsson Group continues during that time, the employee’s shares will be matched with a corresponding number of Class B shares or ADSs free of consideration. Employees in 94100 countries participate in the plans.
The table below shows the contribution periods and participation details for ongoing plans.plans as of December 31, 2012.
Stock purchase plans
| | | | | | | |
Plan | | Contribution period | | Number of
participants
at launch | | Take-up
rate–percent
of all
employees | |
Stock Purchase plan 2006 | | August 2006–July 2007 | | 17,000 | | 29 | % |
Stock Purchase plan 2007 | | August 2007–July 2008 | | 19,000 | | 26 | % |
Stock Purchase plan 2008 | | August 2008–July 2009 | | 19,000 | | 25 | % |
Stock Purchase plan 2009 | | August 2009–July 2010 | | 18,000 | | 25 | % |
| | | | | | | | | | | | |
Plan | | Contribution period | | | Number of
participants
at launch | | | Take-up
rate–percent of
eligible employees | |
Stock Purchase plan 2009 | | | August 2009–July 2010 | | | | 18,000 | | | | 25 | % |
Stock Purchase plan 2010 | | | August 2010–July 2011 | | | | 22,000 | | | | 27 | % |
Stock Purchase plan 2011 | | | August 2011–July 2012 | | | | 24,000 | | | | 30 | % |
Stock Purchase plan 2012 | | | August 2012–July 2013 | | | | 27,000 | | | | 28 | % |
ERICSSON ANNUAL REPORT ON FORM 20-F 2012
Participants save each month, beginning with August payroll, towards quarterly investments. These investments (in November, February, May and August) are matched on the third anniversary of each such investment, subject to continued employment, and hence the matching spans over two financial years and two tax years.
The Key Contributor Retention Plan
The Key Contributor Retention Plan is part of Ericsson’s talent management strategy and is designed to give recognition for performance, critical skills and potential as well as to encourage retention of key employees. Under the program, up to 10 percent10% of employees (2009: 6,702(2012 plan: up to 8,000 employees) are selected through a nomination process that identifies individuals according to performance, critical skills and potential. Participants selected obtain one extra matching share in addition to the ordinary one matching share for each contribution share purchased under the Stock Purchase Plan during a twelve-month program period.
The Executive Performance Stock Plan
The Executive Performance Stock Plan is designed to focus the management on driving earnings and provide competitive remuneration. Senior executives, including Group Management, are selected to obtain up to four or six extra shares (performance matching shares) in addition to the ordinary one matching share for each
ERICSSON ANNUAL REPORT ON FORM 20-F 2009
NOTES TO THE CONSOLIDATED FINANCIAL STATEMENTS—(Continued)
contribution share purchased under the Stock Purchase Plan. Up to 0.5 percent of employees (2009: 218 executives) are offered to participate in the plan. As from the 2006 program, the CEO has been allowed to invest up to 9 percent of fixed salary in contribution shares and may obtain up to eight performance matching shares in addition to the Stock Purchase Plan matching share for each contribution share. The performance matching is subject to the fulfillment of a performance target of average annual Earnings Per Share (EPS) growth. The table below shows all Executive Performance Stock Plans to date.
EXECUTIVE PERFORMANCE STOCK PLANS
| | | | | | | | | | |
Plan
| | Base year
EPS1) | | Target average
annual EPS
growth range2) | | Matching
share
vesting
range3) | | Maximum
opportunity
as percentage
of fixed salary4) | | Percentage
vesting |
| | | | |
| | | | |
| | | | |
Performance Stock Plan 20045)
| | 3.45 | | 5% to 25% | | 0 to 4
0 to 6 | | 30%
45% | | 100%
100% |
Performance Stock Plan 20056)
| | 6.68 | | 3% to 15% | | 0 to 4
0 to 6 | | 30%
45% | | 0%
0% |
Performance Stock Plan 2006
| | 7.58 | | 3% to 15% | | 0 to 4
0 to 6
0 to 8 | | 30%
45%
72% | | 0%
0%
0% |
Performance Stock Plan 2007
| | 8.83 | | 5% to 15% | | 0.67 to 4
1 to 6
1.33 to 8 | | 30%
45%
72% | | |
Performance Stock Plan 2008
| | 4.43 | | 5% to 15% | | 0.67 to 4
1 to 6
1.33 to 8 | | 30%
45%
72% | | |
Performance Stock Plan 2009
| | 2.90 | | 5% to 15% | | 0.67 to 4
1 to 6
1.33 to 8 | | 30%
45%
72% | | |
| | | | | | | | | | | | | | | | |
| | | Executive Performance Stock Plan | |
| | | 20121) | | | 2011 | | | 2010 | | | 2009 | |
Base year EPS2) | | | | | | | | | | | 1.14 | | | | 2.90 | |
Target average annual EPS growth range3) | | | | | | | | | | | 5% to 15% | | | | 5% to 15% | |
Matching share vesting range4) | | | 0.67 to 4 | | | | 0.67 to 4 | | | | 0.67 to 4 | | | | 0.67 to 4 | |
| | | 1 to 6 | | | | 1 to 6 | | | | 1 to 6 | | | | 1 to 6 | |
| | | 1.5 to 9 | | | | 1.5 to 9 | | | | 1.5 to 9 | | | | 1.33 to 8 | |
Maximum opportunity as percentage of fixed salary5) | | | 30 | % | | | 30 | % | | | 30 | % | | | 30 | % |
| | | 45 | % | | | 45 | % | | | 45 | % | | | 45 | % |
| | | 162 | % | | | 162 | % | | | 162 | % | | | 72 | % |
| 1) | Targets for Executive Performance Stock Plan 2012 are described in the next table. |
| 2) | Sum of four quarters up to June 30 of plan year.year 2009. For 2010 plan the sum of 4 quarters up to December 31, 2010. |
2)3) | EPS range found from three-year average EPS of the twelve quarters to the end of the performance period and corresponding growth targets. |
3)4) | Corresponding to EPS range (no Performance Share Plan matching below this range). Matching shares per contribution share invested in addition to Stock Purchase Plan matching according to program of up to 4, 6 or 89 matching shares. |
4)5) | At full investment, full vesting and constant share price. Excludes Stock Purchase Plan matching. |
5) | The 2004 plan vested in full. |
6) | No vesting and therefore no Performance Share Plan matching for 2005 and 2006 plans |
Stock option plans
Originally, for the Stock Option Plan 2002, 10.8 million options were granted to 12,800 key employees. Of the originally issued employee options, there remained, as of December 31, 2009, no employee options outstanding whatsoever, since the plan expired on November 11, 2009. Each employee option did entitle the holder to purchase one Class B share for SEK 39.00.
ERICSSON ANNUAL REPORT ON FORM 20-F 20092012
NOTES TO THE CONSOLIDATED FINANCIAL STATEMENTS—(Continued)
STOCK OPTION PLANSExecutive Performance Stock Plan targets
| | | | | | | | | | |
Ongoing plans 2009 | | Grant/expiry date | | Exercise
price1)
(SEK) | | Vesting period
from grant date | | Number of
participants
at grant | | Number of
participants
end of 2009 |
| | | | | |
| | | | | |
Stock Option Plan 20022) | | 11 Nov 2002/11 Nov 2009 | | 39.00 | | 1/3 after 1 year,
1/3 after 2 years,
1/3 after 3 years | | 12,800 | | — |
| | | | | | | | | | | | | | | | |
| | | Base year
value
SEK billion | | | Year 1 | | | Year 2 | | | Year 3 | |
| 2012 | | | | | | | | | | | | | | | | |
Growth (Net Sales Growth) | | | 227.8 | | |
| Compound annual
growth rate of 2–8% |
|
Margin (Operating Income Growth) | | | 17.9 | | |
| Compound annual
growth of 5–15% |
|
Cash Flow (Cash Conversion) | | | — | | | ³ | 70 | % | | ³ | 70 | % | | ³ | 70 | % |
| 2011 | | | | | | | | | | | | | | | | |
Growth (Net Sales Growth) | | | 203.3 | | |
| Compound annual
growth rate of 4–10% |
|
Margin (Operating Income Growth)1) | | | 23.7 | | |
| Compound annual
growth of 5–15% |
|
Cash Flow (Cash Conversion) | | | — | | | ³ | 70 | % | | ³ | 70 | % | | ³ | 70 | % |
| 1) | Market price at grant date—re-pricing is only permitted under limited circumstances, principally relating to changes in the capital structure of Ericsson.Consolidated operating margin excluding restructuring for 2010. |
The Executive Performance Stock Plan
The Executive Performance Stock Plan is designed to focus management on driving earnings and provide competitive remuneration. Senior executives, including ELT, are selected to obtain up to four or six extra shares (performance matching shares) in addition to the ordinary one matching share for each contribution share purchased under the Stock Purchase Plan. Up to 0.5% of employees (2012 plan: up to 400 executives) are offered to participate in the plan. The President and CEO can save up to 10% of gross fixed salary and short-term variable remuneration, and may obtain up to nine performance matching shares in addition to the Stock Purchase Plan matching share for each contribution share. The performance matching for the 2009 and 2010 plans is subject to the fulfillment of a performance target of average annual Earnings per Share (EPS) growth.
The performance targets changed from Earnings Per Share (EPS) targets to targets linked to the business strategy as from 2011.
The tables above show all Executive Performance Stock Plans as per December 31, 2012.
Shares for all plans
| | | | | | | | | | | | | | | | | | | | | | | | | | | | |
| | | | | | Stock Purchase Plan, Key Contributor
Retention Plan and Executive
Performance Stock Plans | | | | | | | | | | |
Plan (million shares) | | | | | 2012 | | | 2011 | | | 2010 | | | 2009 | | | 2008 | | | Total | |
Originally designated1) | | | A | | | | 26.2 | | | | 19.4 | | | | 19.4 | | | | 22.4 | | | | 16.5 | | | | 103.9 | |
Outstanding beginning of 2012 | | | B | | | | — | | | | 3.4 | | | | 10.6 | | | | 9.1 | | | | 6.1 | | | | 29.2 | |
Awarded during 2012 | | | C | | | | 4.4 | | | | 10.8 | | | | — | | | | — | | | | — | | | | 15.2 | |
Exercised/matched during 2012 | | | D | | | | — | | | | 0.3 | | | | 0.5 | | | | 2.3 | | | | 6.0 | | | | 9.1 | |
Forfeited/expired during 2012 | | | E | | | | — | | | | 0.4 | | | | 0.9 | | | | 0.8 | | | | 0.1 | | | | 2.2 | |
Outstanding end of 20122) | | | F=B+C–D–E | | | | 4.4 | | | | 13.5 | | | | 9.2 | | | | 6.0 | | | | — | | | | 33.1 | |
Compensation costs charged during 2012 (SEK million) | | | G | | | | 6 | 3) | | | 132 | 3) | | | 148 | 3) | | | 91 | 3) | | | 28 | 3) | | | 405 | 4) |
ERICSSON ANNUAL REPORT ON FORM 20-F 2012
| 1) | Adjusted for rights offering and reverse split when applicable. |
| 2) | For stock options exercised duringPresuming maximum performance matching under the Executive Performance Stock Plans. The 2008 plan has lapsed. The 2009 plan partially vested to an extent of 70,3%. |
| 3) | Fair value is calculated as the weighted average share price wason the investment date, reduced by the net present value of the dividend expectations during the three-year vesting period. Net present value calculations are based on data from external party. Fair value is also adjusted for participants failing to keep hold of their contribution shares during the vesting period. For shares under the Executive Performance Stock Plans, the Company presumes maximum performance matching for all ongoing plans when calculating the compensation cost. The 2008 plan has lapsed. The 2009 plan partially vested to an extent of 70,3%. Fair value of the Class B share at each investment date during 2012 was: February 15 SEK 72.18.56.26, May 15 SEK 53.93, August 15 SEK 55.85 and November 15 SEK 49.99. |
| 4) | Total compensation costs charged during 2011: SEK 413 million, 2010: SEK 757 million. |
Shares for all plans
All plans are funded with treasury stock and are equity settled. Treasury stock for all plans has been issued in directed cash issues of Class C shares at the quotient value and purchased under a public offering at the subscription price plus a premium corresponding to the subscribers’ financing costs, and then converted to Class B shares.
For all plans, additional shares have been allocated for financing of social security expenses. Treasury stock is sold on the NASDAQ OMX Stockholm to cover social security payments when arising due to exercise of options or matching of shares. During 2009, 1,044,5352012, 1,038,200 shares were sold at an average price of SEK 70.04.63.17. Sale of shares is recognized directly in equity.
If, as of December 31, 2009,2012, all shares allocated for future matching under the Stock Purchase Plan were transferred, and shares designated to cover social security payments were disposed of as a result of the exercise and the matching, approximately 5461 million Class B shares would be transferred, corresponding to 1.7 percent1.9% of the total number of shares outstanding, 3,194 million.3,220 million not including treasury stock. As of December 31, 2009, 792012, 85 million Class B shares were held as treasury stock.
The table belowabove shows how shares (representing options and matching rights but excluding shares for social security costs)expenses) are being used for all outstanding plans. From leftup to rightdown the table includes (A) the number of shares originally approved by the Annual General Meeting, adjusted for rights offering and reverse split where applicable; (B) how manythe number of the originally designated shares that were outstanding at the beginning of 2009;2012; (C) how manythe number of shares awards that were granted over during 2009;2012; (D) the number of shares exercised or matched during 2009;2012; (E) the number of shares forfeited by participants or expired under the plan rules during 2009;2012; and (F) the balance left as outstanding at the end of 2009,2012, having added new grantsawards to the shares outstanding at the beginning of the year and deducted the shares related to awards exercised, matched, forfeited and expired.
The final column (G) shows the compensation costs charged to the accounts during 20092012 for each plan, calculated as fair value in SEK.
For a description of compensation cost, including accounting treatment, see Note C1, “Significant Accounting Policies,accounting policies”, section Share-based employee compensation”.
compensation to employees and the Board of Directors.ERICSSON ANNUAL REPORT ON FORM 20-F 20092012
NOTES TO THE CONSOLIDATED FINANCIAL STATEMENTS—(Continued)
SHARES FOR ALL PLANSEmployee numbers, wages and salaries
Employee numbers
Average number of employees
| | | | | | | | | | | | | | | | |
Plan (million shares) | | Originally
designated1)
A | | Outstanding
beginning
of 2009
B | | Awarded
during 2009
C | | Exercised/
matched
during 2009
D | | Forfeited/
expired
during 2009
E | | Outstanding
end of 2009
F=B+C-D-E | | | Compensation
costs charged
during 2009
(MSEK)
G | |
2002 Stock Option Plan | | 10.8 | | 3.8 | | — | | 3.4 | | 0.4 | | — | 2) | | — | |
2005 Stock Purchase Plan, Key Contributor and Executive Performance Stock Plans | | 6.3 | | 3.2 | | — | | 2.7 | | 0.5 | | — | | | 25 | 4) |
2006 Stock Purchase Plan, Key Contributor and Executive Performance Stock Plans | | 6.4 | | 4.6 | | — | | 1.2 | | 0.1 | | 3.3 | | | 126 | 4) |
2007 Stock Purchase Plan, Key Contributor and Executive Performance Stock Plans | | 9.7 | | 9.4 | | — | | 0.5 | | 0.3 | | 8.6 | 3) | | 189 | 4) |
2008 Stock Purchase Plan, Key Contributor and Executive Performance Stock Plans | | 16.5 | | 3.7 | | 8.3 | | 0.4 | | 0.3 | | 11.3 | 3) | | 183 | 4) |
2009 Stock Purchase Plan, Key Contributor and Executive Performance Stock Plans | | 22.4 | | — | | 2.5 | | — | | — | | 2.5 | 3) | | 6 | 4) |
| | | | | | | | | | | | | | | | |
Total | | 72.1 | | 24.7 | | 10.8 | | 8.2 | | 1.6 | | 25.7 | | | 529 | 5) |
| | | | | | | | | | | | | | | | |
| | | | | | | | | | | | | | | | | | | | | | | | |
| | | 2012 | | | 2011 | |
| | | Women | | | Men | | | Total | | | Women | | | Men | | | Total | |
North America | | | 3,479 | | | | 12,607 | | | | 16,086 | | | | 2,876 | | | | 12,106 | | | | 14,982 | |
Latin America | | | 2,137 | | | | 9,230 | | | | 11,367 | | | | 1,913 | | | | 7,837 | | | | 9,750 | |
Northern Europe & Central Asia1)2) | | | 5,746 | | | | 15,351 | | | | 21,097 | | | | 5,656 | | | | 14,927 | | | | 20,583 | |
Western & Central Europe2) | | | 1,790 | | | | 9,463 | | | | 11,253 | | | | 1,663 | | | | 8,968 | | | | 10,631 | |
Mediterranean2) | | | 2,966 | | | | 10,064 | | | | 13,030 | | | | 2,743 | | | | 9,077 | | | | 11,820 | |
Middle East | | | 617 | | | | 4,603 | | | | 5,220 | | | | 634 | | | | 4,343 | | | | 4,977 | |
Sub-Saharan Africa | | | 548 | | | | 1,672 | | | | 2,220 | | | | 661 | | | | 1,290 | | | | 1,951 | |
India | | | 2,137 | | | | 11,924 | | | | 14,061 | | | | 1,613 | | | | 9,912 | | | | 11,525 | |
North East Asia | | | 4,191 | | | | 9,584 | | | | 13,775 | | | | 3,480 | | | | 8,839 | | | | 12,319 | |
South East Asia & Oceania | | | 1,175 | | | | 3,474 | | | | 4,649 | | | | 1,155 | | | | 3,437 | | | | 4,592 | |
| | | | | | | | | | | | | | | | | | | | | | | | |
Total | | | 24,786 | | | | 87,972 | | | | 112,758 | | | | 22,394 | | | | 80,736 | | | | 103,130 | |
| | | | | | | | | | | | | | | | | | | | | | | | |
1) Of which Sweden | | | 4,232 | | | | 13,337 | | | | 17,569 | | | | 4,188 | | | | 12,881 | | | | 17,069 | |
2) Of which EU | | | 9,911 | | | | 33,581 | | | | 43,492 | | | | 9,575 | | | | 31,667 | | | | 41,242 | |
Number of employees by region at year-end
1) | Adjusted for rights offering and reverse split when applicable. |
2) | All outstanding options in the 2002 Stock Option Plan expired during 2009 and no options therefore remain exercisable. |
3) | Presuming maximum performance matching under the Executive Performance Stock Plans. The 2005 and 2006 plans have lapsed. |
4) | Fair value is calculated as the share price on the investment date, reduced by the net present value of the dividend expectations during the three-year vesting period. Net present value calculations are based on data from external party. Fair value is also adjusted for participants failing to keep hold of their contribution shares during the vesting period. For shares under the Executive Performance Stock Plans, the Company assesses the probability of meeting the performance targets when calculating the compensation cost. Fair value of the Class B share at each investment date during 2009 was: February 15 SEK 68.11, May 15 SEK 60.00, August 15 SEK 60.88 and November 15 SEK 65.83. |
5) | Total compensation costs charged during 2008: SEK 572 million, 2007: SEK 496 million. |
| | | | | | | | |
| | | 2012 | | | 2011 | |
North America | | | 15,501 | | | | 14,801 | |
Latin America | | | 11,219 | | | | 11,191 | |
Northern Europe & Central Asia1)2) | | | 21,211 | | | | 20,987 | |
Western & Central Europe2) | | | 11,257 | | | | 10,806 | |
Mediterranean2) | | | 12,205 | | | | 11,645 | |
Middle East | | | 3,992 | | | | 4,336 | |
Sub-Saharan Africa | | | 2,014 | | | | 2,283 | |
India | | | 14,303 | | | | 11,535 | |
North East Asia | | | 14,157 | | | | 12,567 | |
South East Asia & Oceania | | | 4,396 | | | | 4,374 | |
Total | | | 110,255 | | | | 104,525 | |
| | | | | | | | |
1)Of which Sweden | | | 17,712 | | | | 17,500 | |
2)Of which EU | | | 42,872 | | | | 41,596 | |
| | | | | | | | |
Employees by gender and age at year-end 2012
| | | | | | | | | | | | |
| | | Women | | | Men | | | Percent
of total | |
Under 25 years old | | | 2,517 | | | | 6,018 | | | | 8 | % |
25–35 years old | | | 8,530 | | | | 31,054 | | | | 36 | % |
36–45 years old | | | 7,818 | | | | 28,954 | | | | 33 | % |
46–55 years old | | | 3,984 | | | | 15,692 | | | | 18 | % |
Over 55 years old | | | 1,233 | | | | 4,455 | | | | 5 | % |
Percent of total | | | 22 | % | | | 78 | % | | | 100 | % |
ERICSSON ANNUAL REPORT ON FORM 20-F 20092012
NOTES TO THE CONSOLIDATED FINANCIAL STATEMENTS—(Continued)
Employee numbers, wages and salariesmovements
Employee numbers
AVERAGE NUMBER OF EMPLOYEES
| | | | | | | | | | | | |
| | | 2009 | | 2008 |
| | | Men | | Women | | Total | | Men | | Women | | Total |
Western Europe1) | | 30,676 | | 9,493 | | 40,169 | | 32,289 | | 9,167 | | 41,456 |
Central and Eastern Europe, Middle East and Africa | | 8,168 | | 1,831 | | 9,999 | | 7,028 | | 1,723 | | 8,751 |
Asia Pacific | | 13,513 | | 3,825 | | 17,338 | | 12,111 | | 3,343 | | 15,454 |
Latin America | | 5,876 | | 1,254 | | 7,130 | | 6,151 | | 1,335 | | 7,486 |
North America | | 9,366 | | 2,358 | | 11,724 | | 4,556 | | 1,286 | | 5,842 |
| | | | | | | | | | | | |
Total2) | | 67,599 | | 18,761 | | 86,360 | | 62,135 | | 16,854 | | 78,989 |
| | | | | | | | | | | | |
| | | | | | | | | | | | |
1) Of which Sweden | | 13,930 | | 4,591 | | 18,521 | | 14,685 | | 4,990 | | 19,675 |
2) Of which EU | | 32,970 | | 10,055 | | 43,025 | | 34,100 | | 9,633 | | 43,733 |
NUMBER OF EMPLOYEES AT YEAR END
| | | | |
Employees by region | | 2009 | | 2008 |
Western Europe1) | | 38,305 | | 41,618 |
Central and Eastern Europe, Middle East and Africa | | 10,145 | | 7,976 |
Asia Pacific | | 16,766 | | 15,165 |
Latin America | | 6,055 | | 8,247 |
North America | | 11,222 | | 5,734 |
| | | | |
Total2) | | 82,493 | | 78,740 |
| | | �� | |
| | | | |
1) Of which Sweden | | 18,217 | | 20,155 |
2) Of which EU | | 41,396 | | 43,093 |
| | |
Employees per segment | | | | |
Networks | | 49,874 | | 45,823 |
Professional Services | | 24,570 | | 23,244 |
Multimedia | | 8,049 | | 9,673 |
| | | | |
Total | | 82,493 | | 78,740 |
| | | | |
ERICSSON ANNUAL REPORT ON FORM 20-F 2009
NOTES TO THE CONSOLIDATED FINANCIAL STATEMENTS—(Continued)
EMPLOYEES BY GENDER AND AGE AT YEAR END 2009
| | | | | | | | | |
| | | Female | | | Male | | | Percent
of total | |
Under 25 years old | | 1,228 | | | 3,321 | | | 5 | % |
26–35 years old | | 6,778 | | | 23,022 | | | 36 | % |
36–45 years old | | 6,918 | | | 23,749 | | | 37 | % |
46–55 years old | | 2,908 | | | 10,768 | | | 17 | % |
Over 55 years old | | 784 | | | 3,017 | | | 5 | % |
| | | | | | | | | |
Percent of total | | 23 | % | | 77 | % | | 100 | % |
| | | | | | | | | |
NUMBER OF EMPLOYEES RELATED TO COST OF SALES AND OPERATING EXPENSES
| | | | | | |
| | | 2009 | | 2008 | | 2007 |
Cost of sales | | 41,521 | | 35,717 | | 33,904 |
Operating expenses | | 40,972 | | 43,023 | | 40,107 |
| | | | | | |
Total | | 82,493 | | 78,740 | | 74,011 |
| | | | | | |
EMPLOYEE MOVEMENTS
| | | | 2009 | | 2008 | | | | 2012 | | | 2011 | |
Head count at year-end | | 82,493 | | 78,740 | | | | | 110,255 | | | | 104,525 | |
Employees who have left the Company | | 9,147 | | 3,415 | | | | | 12,280 | | | | 10,571 | |
Employees who have joined the Company | | 12,900 | | 8,144 | | | | | 18,010 | | | | 24,835 | |
Temporary employees | | 693 | | 1,124 | | | | | 766 | | | | 901 | |
Employee wages and salaries
WAGES AND SALARIES AND SOCIAL SECURITY EXPENSESWages and salaries and social security expenses
| | | | 2009 | | 2008 | |
(SEK million) | | | 2012 | | | 2011 | |
Wages and salaries | | 41,247 | | 38,607 | | | 48,428 | | | | 43,707 | |
Social security expenses | | 13,630 | | 12,690 | | | 15,672 | | | | 15,198 | |
Of which pension costs | | 3,588 | | 3,206 | | | 2,762 | | | | 3,888 | |
Amounts related to the President and CEO and the Group ManagementExecutive Leadership Team are included.
ERICSSON ANNUAL REPORT ON FORM 20-F 2009
NOTES TO THE CONSOLIDATED FINANCIAL STATEMENTS—(Continued)Remuneration to Board members and Presidents in subsidiaries
| | | | | | | | |
(SEK million) | | 2012 | | | 2011 | |
Salary and other remuneration | | | 243 | | | | 223 | |
Of which annual variable remuneration | | | 33 | | | | 22 | |
Pension costs | | | 27 | | | | 20 | |
WAGES AND SALARIES PER REGIONBoard members, Presidents and Group management by gender at year end
| | | | |
| | | 2009 | | 2008 |
Western Europe1) | | 23,039 | | 24,138 |
Central and Eastern Europe, Middle East and Africa | | 4,323 | | 3,354 |
Asia Pacific | | 5,346 | | 4,594 |
Latin America | | 2,181 | | 1,879 |
North America2) | | 6,358 | | 4,642 |
| | | | |
Total3) | | 41,247 | | 38,607 |
| | | | |
| | | | |
1) Of which Sweden | | 10,324 | | 11,825 |
2) Of which United States | | 4,928 | | 3,296 |
3) Of which EU | | 23,734 | | 24,699 |
Remuneration in foreign currency has been translated to SEK at average exchange rates for the year.
| | | | | | | | | | | | | | | | |
| | | 2012 | | | 2011 | |
| | | Women | | | Men | | | Women | | | Men | |
Parent Company | | | | | | | | | | | | | | | | |
Board members and President | | | 27 | % | | | 73 | % | | | 20 | % | | | 80 | % |
Group Management | | | 29 | % | | | 71 | % | | | 29 | % | | | 71 | % |
Subsidiaries | | | | | | | | | | | | | | | | |
Board members and Presidents | | | 12 | % | | | 88 | % | | | 11 | % | | | 89 | % |
REMUNERATION TO BOARD MEMBERS AND PRESIDENTS IN SUBSIDIARIES
| | | | |
| | | 2009 | | 2008 |
Salary and other remuneration | | 315 | | 316 |
Of which annual variable remuneration | | 42 | | 41 |
Pension costs | | 34 | | 36 |
BOARD MEMBERS, PRESIDENTS AND GROUP MANAGEMENT BY GENDER AT YEAR END
| | | | | | | | | | | | |
| | | 2009 | | | 2008 | |
| | | Females | | | Males | | | Females | | | Males | |
Parent Company | | | | | | | | | | | | |
Board members and President | | 38 | % | | 62 | % | | 38 | % | | 62 | % |
Group Management | | 8 | % | | 92 | % | | 9 | % | | 91 | % |
| | | | |
Subsidiaries | | | | | | | | | | | | |
Board members and Presidents | | 10 | % | | 90 | % | | 12 | % | | 88 | % |
C30C29 RELATED PARTY TRANSACTIONS
During 2009,2012, various related party transactions were executed pursuant to contracts based on terms customary in the industry and negotiated on an arm’s length basis. For information regarding equity and Ericsson’s share of assets, liabilities and income in joint ventures and associated companies, see Note C12, “Financial Assets, Non-Current”assets, non-current”. For information regarding transactions with senior management, see Note C28, “Information regarding members of the Board of Directors, the Group management and employees”.
Sony Ericsson Mobile Communications AB (SEMC)
In October 2001, SEMC was established as a joint venture between Sony Corporation and Ericsson, and a substantial portion of Ericsson’s handset operations was sold to SEMC. The joint venture is headquartered in London, United Kingdom. As part of the formation of the joint venture, contracts were entered into between Ericsson and SEMC.
ERICSSON ANNUAL REPORT ON FORM 20-F 2009
NOTES TO THE CONSOLIDATED FINANCIAL STATEMENTS—(Continued)
Major transactions are as follows:
License revenues.ST-EricssonBoth owners of SEMC, Sony Corporation and Ericsson, receive license revenues for SEMC’s usage of trademarks and intellectual property rights. The decline in license revenues during 2009 is a consequence of the formation of ST-Ericsson.
Purchases.Ericsson purchases mobile phones from SEMC to support contracts with a number of customers for mobile systems which also include limited quantities of phones.
Dividends.Both owners of SEMC receive dividends, when so decided by the board of directors. During 2009 Ericsson received no dividends from SEMC.
| | | | | | |
| | | 2009 | | 2008 | | 2007 |
Related party transactions | | | | | | |
License revenues | | 1,746 | | 5,856 | | 5,743 |
Purchases | | 164 | | 261 | | 333 |
Ericsson’s share of dividends | | — | | 3,627 | | 3,949 |
| | | | | | |
Related party balances | | | | | | |
Receivables | | 369 | | 1,002 | | 932 |
Liabilities | | 14 | | 176 | | 204 |
SEMC has been granted a long-term loan with a maximum amount of SEK 3,606 million. The parent companies of Ericsson and Sony Corporation have issued guarantees for this loan on a 50/50 basis, without joint responsibility. Ericsson’s part thus amounted to SEK 1,803 million. As of December 31, 2009, Ericsson’s part of the principal amount outstanding amounted to SEK 779 million inclusive of accrued interest SEK 6 million. Maturity date for the maximum amount of the issued guarantees occurs in 2011 (SEK 1,030 million) and 2010 (SEK 773 million).
ST-Ericsson
ST-Ericsson, the joint venture between Ericsson and STMicroelectronics, was formed on February 2, 2009, by merging Ericsson Mobile Platforms with ST-NXP Wireless. The joint venture is equally owned by Ericsson and STMicroelectronics. ST-Ericsson is an industry leader in design, development and the creation of cutting-edge mobile platforms and wireless semiconductors. ST-Ericsson is a key supplier to four of the industry’s top five handset manufacturers, who together represent about 80 percent of global handset shipments, as well as to other leading companies in the industry. The joint venture is headquartered in Geneva, Switzerland, and employs approximately 8,000 persons.For further information, see Note C3, “Segment information”.
ERICSSON ANNUAL REPORT ON FORM 20-F 2012
Major transactions are as follows:
Sales.Sales: Ericsson provides ST-Ericsson with services in the areas of R&D, HR, IT and facilities.
Purchases.MajorPurchases: A major part of Ericsson’s purchases from ST-Ericsson consists of chipsets and R&D services.
Dividends.Dividends: Both owners of ST-Ericsson receive dividends, when so decided by the boardBoard of directors. During 2009Directors. Ericsson received no dividends from ST-Ericsson.ST-Ericsson during 2012.
| | |
| | 2009 |
Related party transactions
| | |
Sales
| | 740 |
Purchases
| | 624 |
Ericsson’s share of dividends
| | — |
| | |
Related party balances
| | |
Receivables
| | 244 |
Liabilities
| | 365 |
ERICSSON ANNUAL REPORT ON FORM 20-F 2009
NOTES TO THE CONSOLIDATED FINANCIAL STATEMENTS—(Continued)ST-Ericsson
| | | | | | | | | | | | |
| | | 2012 | | | 2011 | | | 2010 | |
Related party transactions | | | | | | | | | | | | |
Sales | | | 138 | | | | 182 | | | | 403 | |
Purchases | | | 634 | | | | 781 | | | | 629 | |
| | | | | | | | | | | | |
Related party balances | | | | | | | | | | | | |
Receivables | | | 127 | | | | 51 | | | | 53 | |
Liabilities | | | — | | | | 24 | | | | 48 | |
Ericsson does not have any contingent liabilities, assets pledged as collateral or guarantees towardtowards ST-Ericsson.
Ericsson Nikola Tesla d.d.
Ericsson Nikola Tesla d.d. is a joint stock company for design, sales and service of telecommunication systems and equipment, and an associated member of the Ericsson Group. Ericsson Nikola Tesla d.d. is located in Zagreb, Croatia. Ericsson holds 49.07 percent49.07% of the shares.
Major transactions are as follows:
Sales.Sales:Ericsson sells telecommunication equipment to Ericsson Nikola Tesla d.d.
License revenues.revenues:Ericsson receives license revenues for Ericsson Nikola Tesla d.d.’s usage of trademarks.
Purchases.Purchases:Ericsson purchases development resources from Ericsson Nikola Tesla d.d.
Dividends.Dividends:Ericsson received dividends from Ericsson Nikola Tesla d.d. during 2009.2012.
Ericsson Nikola Tesla D.D.
| | | | | | |
| | | 2009 | | 2008 | | 2007 |
Related party transactions | | | | | | |
Sales | | 654 | | 1,020 | | 1,010 |
License revenues | | 7 | | 9 | | 9 |
Purchases | | 569 | | 547 | | 506 |
Ericsson’s share of dividends | | 66 | | 227 | | 267 |
| | | | | | |
Related party balances | | | | | | |
Receivables | | 93 | | 85 | | 103 |
Liabilities | | 70 | | 58 | | 55 |
| | | | | | | | | | | | |
| | | 2012 | | | 2011 | | | 2010 | |
Related party transactions | | | | | | | | | | | | |
Sales | | | 1,161 | | | | 465 | | | | 563 | |
License revenues | | | 8 | | | | 4 | | | | 2 | |
Purchases | | | 607 | | | | 595 | | | | 566 | |
Ericsson’s share of dividends | | | 133 | | | | 154 | | | | 104 | |
| | | | | | | | | | | | |
Related party balances | | | | | | | | | | | | |
Receivables | | | 189 | | | | 59 | | | | 120 | |
Liabilities | | | 81 | | | | 76 | | | | 75 | |
ERICSSON ANNUAL REPORT ON FORM 20-F 2012
Ericsson does not have any contingent liabilities, assets pledged as collateral or guarantees towardtowards Ericsson Nikola Tesla d.d.
ERICSSON ANNUAL REPORT ON FORM 20-F 2009
NOTES TO THE CONSOLIDATED FINANCIAL STATEMENTS—(Continued)Sony Ericsson Mobile Communications AB
The company has divested its 50% stake in Sony Ericsson Mobile Communications to Sony. The divestment was effective on January 1, 2012.
C31 FEES TO AUDITORSSony Ericsson Mobile Communications AB
| | | | | | |
| | | Price-
waterhouse-
Coopers | | Others | | Total |
2009 | | | | | | |
Audit fees | | 98 | | 3 | | 101 |
Audit related fees | | 10 | | — | | 10 |
Tax services fees | | 16 | | 2 | | 18 |
Other fees | | 1 | | 2 | | 3 |
| | | | | | |
Total | | 125 | | 7 | | 132 |
| | | | | | |
2008 | | | | | | |
Audit fees | | 97 | | 4 | | 101 |
Audit related fees | | 7 | | — | | 7 |
Tax services fees | | 14 | | 2 | | 16 |
Other fees | | 1 | | 5 | | 6 |
| | | | | | |
Total | | 119 | | 11 | | 130 |
| | | | | | |
2007 | | | | | | |
Audit fees | | 102 | | 7 | | 109 |
Audit related fees | | 4 | | — | | 4 |
Tax services fees | | 13 | | 12 | | 25 |
Other fees | | — | | 6 | | 6 |
| | | | | | |
Total | | 119 | | 25 | | 144 |
| | | | | | |
| | | | | | | | | | | | |
| | | 2012 | | | 2011 | | | 2010 | |
Related party transactions | | | | | | | | | | | | |
License revenues | | | — | | | | 855 | | | | 1,255 | |
Purchases | | | — | | | | 126 | | | | 61 | |
| | | | | | | | | | | | |
Related party balances | | | | | | | | | | | | |
Receivables | | | — | | | | 27 | | | | 258 | |
Liabilities | | | — | | | | 2 | | | | 8 | |
All services provided by the auditors were pre-approved priorC30 FEES TO AUDITORS
Fees to the engagement.auditors
| | | | | | | | | | | | |
| | | PwC | | | Others | | | Total | |
2012 | | | | | | | | | | | | |
Audit fees | | | 82 | | | | 5 | | | | 87 | |
Audit related fees | | | 15 | | | | — | | | | 15 | |
Tax services fees | | | 16 | | | | 3 | | | | 19 | |
Other fees | | | 10 | | | | 10 | | | | 20 | |
| | | | | | | | | | | | |
Total | | | 123 | | | | 18 | | | | 141 | |
| | | | | | | | | | | | |
2011 | | | | | | | | | | | | |
Audit fees | | | 77 | | | | 9 | | | | 86 | |
Audit related fees | | | 10 | | | | — | | | | 10 | |
Tax services fees | | | 20 | | | | 3 | | | | 23 | |
Other fees | | | 16 | | | | — | | | | 16 | |
| | | | | | | | | | | | |
Total | | | 123 | | | | 12 | | | | 135 | |
| | | | | | | | | | | | |
2010 | | | | | | | | | | | | |
Audit fees | | | 79 | | | | 5 | | | | 84 | |
Audit related fees | | | 17 | | | | 1 | | | | 18 | |
Tax services fees | | | 16 | | | | 2 | | | | 18 | |
Other fees | | | 7 | | | | 2 | | | | 9 | |
| | | | | | | | | | | | |
Total | | | 119 | | | | 10 | | | | 129 | |
| | | | | | | | | | | | |
During the period 2007–2009,2010–2012, in addition to audit services, PricewaterhouseCoopersPwC provided certain audit related services, tax and taxother services to the Company. The audit related services include consultation on financial accounting,quarterly reviews, ISO audits, SSAE16 reviews and services related to acquisitionsin connection with issuing of certificates and assessments of internal control.opinions. The tax services include general expatriate services and corporate tax compliance work. Other services include consultation on financial accounting, services related to acquisitions, operational effectiveness and assessments of internal control.
Audit fees to other auditors largely consist of local statutory audits for minor companies.
C32 EVENTS AFTER THE BALANCE SHEET DATE
In a November 25 auction, 2009, Ericsson acquired certain assets relating to Nortel’s GSM business in North America for a cash purchase price of USD 70 million. Closing is expected by March 31, 2010, subject to approval by US and Canadian bankruptcy courts and satisfying normal regulatory conditions.
On January 12, 2010, Ericsson announced agreement to acquire Pride Spa, an Italian systems integration company with approximately 1,000 employees.
In January 2010, the Company made an employer contribution payment of SEK 730 million to the Swedish pension trust fund due to funding requirements.
On March 31, 2010, Ericsson announced that Marita Hellberg, Senior Vice President and Head of Group Function Human Resources and Organization will take over as Head of Human Resources of Ericsson’s new region China and North East Asia from July 1st.
ERICSSON ANNUAL REPORT ON FORM 20-F 20092012
NOTES TO THE CONSOLIDATED FINANCIAL STATEMENTS—(Continued)C31 CONTRACTUAL OBLIGATIONS
Contractual obligations 2012
On April 1, 2010 Ericsson announced that the acquisition of substantially all the assets of Nortel’s GSM business had been completed, effective March 31. The closing follows the announcement on November 25, 2009, that Ericsson had entered into an asset purchase agreement for the assets of Nortel’s GSM business in North America.
On April 21, 2010, the Company announced that it had entered into a share purchase agreement to acquire Nortel’s majority shareholding (50%+1 share) in LG-Nortel, the joint venture of LG Electronics and Nortel Networks. Purchase price is USD 242 million on a cash and debt free basis. The transaction is subject to customary regulatory approvals.
C33 CONTRACTUAL OBLIGATIONS
CONTRACTUAL OBLIGATIONS 2009
| | | | Payment due by period | | Total | | Payment due by period | | | | |
(SEK billion) | | <1 year | | 1–3 years | | 3–5 years | | >5 years | | 2009 | |
SEK billion | | | <1
year | | | 1–3
years | | | 3–5
years | | | >5
years | | | Total | |
Long-term debt1)2) | | 1.2 | | 4.2 | | 10.8 | | 14.2 | | 30.4 | | | 3.3 | | | | 7.0 | | | | 7.1 | | | | 9.0 | | | | 26.4 | |
Finance lease obligations3) | | 0.2 | | 0.3 | | 0.4 | | 1.2 | | 2.1 | | | 0.2 | | | | 0.3 | | | | 0.2 | | | | 0.8 | | | | 1.5 | |
Operating leases3) | | 3.2 | | 4.7 | | 2.2 | | 2.4 | | 12.5 | | | 2.8 | | | | 3.2 | | | | 1.9 | | | | 2.5 | | | | 10.4 | |
Other non-current liabilities | | — | | 0.3 | | 0.1 | | 1.6 | | 2.0 | | | 0.1 | | | | 0.3 | | | | 0.1 | | | | 1.9 | | | | 2.4 | |
Purchase obligations4) | | 7.1 | | — | | — | | — | | 7.1 | | | 5.7 | | | | — | | | | — | | | | — | | | | 5.7 | |
Trade Payables | | 18.9 | | — | | — | | — | | 18.9 | |
Commitments for customer financing5) | | 3.0 | | — | | — | | — | | 3.0 | |
| | | | | | | | | | | |
Trade payables | | | | 23.1 | | | | — | | | | — | | | | — | | | | 23.1 | |
Commitments for customer finance5) | | | | 5.9 | | | | — | | | | — | | | | — | | | | 5.9 | |
Total | | 33.6 | | 9.5 | | 13.5 | | 19.4 | | 76.0 | | | 41.1 | | | | 10.8 | | | | 9.3 | | | | 14.2 | | | | 75.4 | |
| | | | | | | | | | | | | | | | | | | | | | | | | |
| 1) | Including interest payments. |
| 2) | See also Note C20, “Financial Risk Managementrisk management and Financial Instruments”financial instruments”. |
| 3) | See also Note C27, “Leasing”. |
| 4) | The amounts of purchase obligations are gross, before deduction of any related provisions. |
| 5) | See also Note C14, “Trade Receivablesreceivables and Customer Financing”customer finance”. |
For information about financial guarantees, see Note C24, “Contingent Liabilities”liabilities”.
Except for those transactions described in this report, Ericssonthe Company has not been a party to any material contracts over the past three years other than those entered into during the ordinary course of business.
C32 TRANSFERS OF FINANCIAL ASSETS
Transfers where the Company has not derecognized the assets in their entirety
As per December 31, 2012 there existed certain customer financing assets that the Company had transferred to third parties where the Company did not derecognize the assets in their entirety. The total carrying amount of the original assets transferred was SEK 471 (194) million, the amount of the assets that the Company continues to recognize was SEK 28 (10) million, and the carrying amount of the associated liabilities was SEK 0 (0) million. More information is disclosed about Customer Finance in Note C14 “Trade receivables and customer finance”.
Transfers where the Company has continuing involvement
The Company has during 2012 derecognized financial assets where the Company had continuing involvement. A repurchase of these assets would amount to SEK 225 (596) million. No assets or liabilities were recognized in relation to the continuing involvement.
C33 EVENTS AFTER THE REPORTING PERIOD
On January 10, 2013, Ericsson entered into an agreement with Unwired Planet whereby Ericsson will transfer 2,185 issued patents and patent applications to Unwired Planet. Ericsson will also contribute 100 additional patent assets annually to Unwired Planet commencing in 2014 through 2018. Unwired Planet will compensate Ericsson with certain ongoing rights in future revenues generated from the enlarged patent portfolio. Unwired Planet will also grant Ericsson a license to its patent portfolio.
ERICSSON ANNUAL REPORT ON FORM 20-F 20092012
On January 21, 2013, Ericsson announced its intention to acquire Devoteam Telecom & Media operations in France. Devoteam has employees in Europe, Middle East and Africa. The acquisition is in line with Ericsson’s services strategy to broaden its IT capabilities.
In January 2013, ST-Ericsson was granted a loan facility by their owners of USD 260 million. Ericsson’s share of this credit facility is USD 130 million.
On January 10, 2013, Adaptix Inc. filed two lawsuits against Ericsson, AT&T, AT&T Mobility and MetroPCS Communications in the US District Court for Eastern District of Texas alleging that certain Ericsson products infringe five US patents assigned to Adaptix. Adaptix seeks damages and an injunction.
On January 25, 2013, Adaptix filed a complaint with the US International Trade Commission (ITC) against Ericsson, AT&T, AT&T Mobility and MetroPCS Communications requesting that the commission open a patent infringement investigation of certain Ericsson products and further on January 29, 2013, Adaptix filed a complaint with the Tokyo District Court alleging certain Ericsson products infringe two Japanese patents assigned to Adaptix. Adaptix seeks damages and an injunction.
On March 18, 2013, Ericsson and STMicroelectronics announced an agreement on the way forward for the joint venture (JV) ST-Ericsson.
The main steps agreed upon to split up the JV are the following: Ericsson will take on the design, development and sales of the LTE multimode thin modem products, including 2G, 3G and 4G multimode; ST will take on the existing ST-Ericsson products, other than LTE multimode thin modems, and related business as well as certain assembly and test facilities; starting the close down of the remaining parts of ST-Ericsson.
The formal transfer of the relevant parts of ST-Ericsson to the parent companies is expected to be completed during the third quarter of 2013, subject to regulatory approvals.
After the split up it is proposed that Ericsson will assume approximately 1,800 employees and contractors.
ERICSSON ANNUAL REPORT ON FORM 20-F 2012
MANAGEMENT’S REPORT ON INTERNAL CONTROL OVER FINANCIAL REPORTING
Ericsson’s management is responsible for establishing and maintaining adequate internal control over financial reporting for the Company. Ericsson’s internal control system related to financial reporting is designed to provide reasonable assurance regarding the reliability of financial reporting and the preparation of financial statements for external purposes in accordance with International Financial Reporting Standards (IFRS) and includes those policies and procedures that:
pertain to the maintenance of records that, in reasonable detail, accurately and fairly reflect the transactions and dispositions of the assets of the Company;
provide reasonable assurance that transactions are recorded as necessary to permit preparation of financial statements in accordance with International Financial Reporting Standards (IFRS), and that receipts and expenditures of the Company are being made only in accordance with authorizations of management and directors of the Company; and
provide reasonable assurance regarding prevention or timely detection of unauthorized acquisition, use or disposition of the Company’s assets that could have a material effect on the financial statements.
Although the purpose of internal control systems is to ensure adequate risk management all internal control systems, no matter how well designed, have inherent limitations which may result in that misstatements are not prevented or detected. Therefore, even systems determined to be effective can provide only reasonable assurance with respect to the reliability of financial statement preparation and presentation.
Controls and procedures
Ericsson’s management assessed the effectiveness of Ericsson’s internal control over financial reporting as of December 31, 2012. In making this assessment, management used the criteria set forth in “Internal Control—Integrated Framework”, issued by the Committee of Sponsoring Organizations of the Treadway Commission.
Based on this assessment, management has concluded that, as of December 31, 2012, Ericsson’s internal control over financial reporting was effective at a reasonable assurance level.
Attestation report of registered public accounting firm
The effectiveness of the Company’s internal control over financial reporting as of December 31, 2012, has been audited by PricewaterhouseCoopers AB, an independent registered public accounting firm. PricewaterhouseCoopers AB has issued an attestation report on Ericsson’s internal control over financial reporting, which appears on page 69.
Changes in internal control over financial reporting
During the period covered by the Annual Report 2012, there were no changes to the internal control over financial reporting that have materially affected, or are likely to materially affect, the internal control over financial reporting.
ERICSSON ANNUAL REPORT ON FORM 20-F 2012
RISK FACTORS
You should carefully consider all the information in this Annual Report and in particular the risks and uncertainties outlined below. Based on the information currently known to us, we believe that the following information identifies the most significant risk factors affecting our business. Any of the factors described below, or any other risk factors discussed elsewhere in this report, could have a material negative effect on our business, operational and after-tax results, financial position, cash flow, liquidity, credit rating, brand and/or our share price. Additional risks and uncertainties not presently known to us or that we currently believe to be immaterial may also materially adversely affect our business. Furthermore, our operational results may have a greater variability than in the past and we may have difficulties in accurately predicting future developments. See also “Forward-Looking Statements”.
CONTENTSMARKET, TECHNOLOGY AND BUSINESS RISKS
Market, TechnologyChallenging global economic conditions may adversely impact the demand and Business Riskspricing for our products and services as well as limit our ability to grow.
Demand is difficult to predict
Challenging global economic conditions could have adverse, wide-ranging effects on demand for our products and for the products of our customers. Adverse global economic conditions could cause network operators and other customers to postpone investments or initiate other cost-cutting initiatives to improve their financial position. This could result in significantly reduced expenditures for network infrastructure and services, in which case our operating results would suffer. We have established flexibility to cost-effectively accommodate fluctuations in demand. However, ifIf demand for our products and services were to fall in the future, we maycould experience material adverse effects on our revenues, cash flow, capital employed and value of our assets and we may evencould incur operating losses. IfFurthermore, if demand is significantly weaker or more volatile than expected, this may have a material adverse impact on our credit rating, borrowing opportunities and costs as well as on the trading price of our shares.shares could be adversely impacted. When deemed necessary, we undertake specific restructuring or cost saving initiatives, however, there are no guarantees that such initiatives arewill be sufficient, successful or executed in time to deliver necessaryany improvements in our earnings.
The extent of the current adverse conditions in the financial markets andShould global economic downturn may exacerbate someconditions fail to improve, or worsen, other business risks we face could intensify and could also negatively impact the business prospects of the risk factors we are exposed to. Most of ouroperators and other customers. Some operators and other customers, are financially stable and have networks with good utilization. However, some operators, in particular in markets with weak currencies, may incur borrowing difficulties and lowerslower traffic than expected,development, which may negatively affect their investment plans. plans and cause them to purchase less of our products and services.
The potential adverse effects of thean economic downturn include:
Reduced demand for products and services, resulting in increased price competition or deferrals of purchases, with lower revenues not being possible to compensate withfully compensated through reduced costs.costs
Risks of excess and obsolete inventories and excess manufacturing capacity and risk
Risk of financial difficulties or failures among our suppliers.suppliers
Increased demand for customer finance, difficulties in collection of accounts receivable and increased risk of counterpart failures.counterparty failures
Risk of impairment losses related to our intangible assets as a result of lower forecasted sales of certain products.products
Increased difficulties in forecasting sales and financial results as well as increased volatility in our reported results.results
ERICSSON ANNUAL REPORT ON FORM 20-F 2012
DeclineA decline in the value of the assets in the Company’sour pension plans.plans and/or increased pension liabilities due to discount rate changes
ERICSSON ANNUAL REPORT ON FORM 20-F 2009
End user demand could also be adversely affected by reduced consumer spending on technology, changed operator pricing, security breaches and trust issues.
Short-term volatilityThe telecommunications industry fluctuates and is affected by many factors, including the economic environment, decisions by operators and other customers regarding their deployment of technology and their timing of purchases.
The telecommunications industry has an impactexperienced downturns in the past in which operators substantially reduced their capital spending on new equipment. While we expect the network service provider equipment market and telecommunications services market to grow in the coming years, the uncertainty surrounding the global economic recovery may materially harm actual market conditions. Moreover, market conditions are subject to substantial fluctuation, and could vary geographically and across technologies. Even if global conditions improve, conditions in the specific industry segments in which we participate may be weaker than in other segments. In that case, the results of our operations may be adversely affected.
If capital expenditures by operators and other customers is weaker than we anticipate, our revenues and profitability may be adversely affected. The level of demand by operators and other customers who buy our products and services can change quickly and can vary over short periods of time, including from month to month. Due to the uncertainty and variations in the telecommunications industry, accurately forecasting revenues, results, and cash flow remains difficult.
Sales volumes and gross margin levels are affected by the variation and short order time of our products and services.
Our sales to network operators and other customers represent a mix of equipment, software and services, which normally generate different gross margins. ThirdWe sell our own products as well as third party products, which normally have lower margins than our own products. As a consequence, our reported gross margin in a specific period will be affected by the overall mix of products and services as well as the relative content of third party products. NetworkFurther, network expansions and upgrades have much shorter lead times for delivery than initial network buildouts. Such ordersbuild outs. Orders for such network expansions and upgrades are normally placed with short notice by customers, i.e.often with less than a month,month’s notice, and consequently variations in demand are difficult to forecast. As a result, changes in our product and service mix and the short order time for certain of our products may affect our ability to accurately forecast sales and margins or detect in advance whether actual results will deviate from market consensus. Short-term variation could have a material adverse effect on our business, operating results and financial condition.
Convergence brings opportunityWe may not be able to properly respond to market trends in the industries in which we operate, including the ongoing convergence of the telecom, data and riskmedia industries, which may harm our market position relative to our competitors.
We are affected by market conditions and trends within the telecom industry,industries in which we operate, including the convergence of the telecom, data and media industries. The convergenceConvergence is largely driven by technological development related to IP-based communications. This change increases our addressable market, changeshas changed the competitive landscape and affects our objective setting, risk assessment and strategies. Competitors new to our business may enter this new business context and negatively impact our market share in selected areas. If we fail to understand the market development, or fail to acquire the necessary competence orcompetences to develop and market products, services and solutions that are competitive in this changing market, our futurebusiness, operating results and financial condition will suffer.
ERICSSON ANNUAL REPORT ON FORM 20-F 2012
We depend onOur business depends upon the continued growth of mobile communications and the successacceptance of new services. If growth slows or new services do not succeed, operators’ investment in networks may slow or stop, harming our business.
MostA substantial portion of our business depends on the continued growth inof mobile communications in terms of both the number of subscriptions and usage per subscriber, which in turn requiresdrives the continued deployment and evolutionexpansion of our network systems by our customers. If operators are not successful in their attemptsfail to increase the number of subscribers and/or stimulate increased usage, our business and operational results could be materially adversely affected. Also, if operators fail to monetize new services, fail to introduce new business models or experience a decline in operator revenues or profitability, their willingness to further invest in their network systems may decrease which will reduce their demand for our products and services and have an adverse effect on our business, operational results and financial condition.
Fixed and mobile networks converge and new technologies, such as IP and broadband, enable operators to deliver a range of new types of services in both fixed and mobile networks. We are dependent upon the market acceptance of such services e.g. music, internet and navigation in the handset, and on the outcome of regulatory and standardization activities in this field, such as spectrum allocation. If delays in standardization, regulation, or market acceptance occur, this could adversely affect our business, operational results and operational results.financial condition.
We operate in a highly competitive industryface intense competition from our existing competitors as well as new entrants, including IT companies entering the telecommunications market, and this could materially adversely affect our results.
The markets in which we operate in are highly competitive in terms of price, functionality, and service quality, as well as in thecustomization, timing of development, and the introduction of new products and services.
We face intense competition from significant competitors many of which are very large, with substantial technological and financial resources and established relationships with operators. Further, certain competitors, Chinese companies in particular, have become relatively stronger in recent years. We may also encounter increased competition from new market entrants, alternative technologies or due to evolving industry standards. In particular, we may face competition from large IT companies entering the telecommunications market who benefit from economies of scale from being active in several industries. We cannot assure that we will be able to compete successfully with these companies. Our competitors may implement new technologies before we do, offer more attractively priced or enhanced products, services or solutions, or they may offer other incentives that we do not provide. Some of our competitors may also have greater resources in certain business segments or geographic markets than we do. We may also encounterIncreased competition could result in reduced profit margins, loss of market share, increased competition from new market entrants,research and development costs as well as increased sales and marketing expenses. Traffic development on cellular networks could be affected if more traffic is off-loaded to Wi-Fi networks. Further, alternative technologies or evolving industry standards. The rapid technological change alsoservices provided over-the-top have profound effects on operator voice/ SMS revenues with possible reduced capital expenses consequences.
Additionally, we operate in markets characterized by rapidly changing technology. This results in shorter life-cycles for products, increasing the risk in all product investments.
Continuouscontinuous price erosion isand increased price competition for our products and services. If our counter measures, including enhanced products and business models or cost reductions cannot be achieved or do not occur in a symptom of this rapid technological change and we must counteract this by introducing new products to the market and by continuously enhancing the functionality while reducing the cost of new and existing products. Ourtimely manner, there could be adverse impacts on our business, operating results, depend largely on our ability to compete in thisfinancial condition and market environment.
ERICSSON ANNUAL REPORT ON FORM 20-F 2009
share.
Vendor consolidation may lead to a new competitive landscapestronger competitors who are able to benefit from integration, scale and greater resources.
Industry convergence and consolidation among equipment and services suppliers could potentially result in stronger competitors that are competing as end-to-end suppliers as well as competitors more specialized in particular areas. Consolidation may also result in competitors with greater resources than we have or in reduction of our current scale advantages. This could have a materialmaterially adverse effect on our business, operating results, financial condition and financial condition.market share.
ERICSSON ANNUAL REPORT ON FORM 20-F 2012
OperatorA significant portion of our revenue is currently generated from a limited number of key customers, and operator consolidation may increase our dependence on a limited number of customerskey customers.
We derive most of our business from large, multi-year frame agreements with a limited number of significant customers. Many of these agreements are opened up on a yearly basis to re-negotiate the price for our products and services and do not contain committed purchase volumes. Although no single customer currently represents more than 5 percent7% of our sales ain 2012, our ten largest customers accounted for 46% of our sales in 2012. A loss of or a reduced role with a key customer could have a significant adverse impact on sales, profit and market share for an extended period.
In recent years, network operators have undergone significant consolidation, resulting in a largefewer number of operators with activities in several countries. This trend is expected to continue, and also intra-country consolidation is likely to accelerate as a result of competitive pressure.
A market with fewer and larger operators will increase our reliance on key customers and may negatively impact our bargaining position and profit margins. Moreover, if the combined companies operate in the same geographic market, networks may be shared and less network equipment and associated services willmay be required. Another possible consequence of customer consolidationNetwork investments could be a delay in network investments pending negotiations of e.g. merger/delayed by the consolidation process, which may include, among others, actions relating to merger or acquisition agreements, securing necessary regulatory approvals, or integration of their businesses. Recently, networkNetwork operators have started to share parts of their network infrastructure through cooperation agreements rather than legal consolidations, which may adversely affect demand for network equipment. Accordingly, operator consolidation may have a material adverse effect on our business, operating results and financial condition.
Certain long-term frame agreements with customers still include commitments to future price reductions, requiring us to constantly manage and control our cost base.
Long-term frame agreements can expose us to risk
Long-term agreementswith our customers are typically awarded on a competitive bidding basis. In some cases, such agreements also include commitmentsa commitment to future price reductions. In order to maintain theour gross margin with such price reductions, we continuously strive to reduce the costs of our products. We reduce costsproducts through design improvements, negotiation of better purchase prices from our suppliers, allocation of more production to low-cost countries and increased productivity in our own production. However, there can be no assurance that our actions to reduce costs will be sufficient or quick enough to maintain our gross margin in such contracts.contracts, which may have a material adverse effect on our operating results.
Transforming into a more service-based companyGrowth of our managed services business is difficult to predict, and requires taking significant contractual risks.
Operators are increasingly outsourcingoutsource parts of their operations as a way to reduce cost and focus on new services. This has opened up a marketTo address this opportunity, we offer operators various services in which we have addressed.manage their networks. The growth rate in the managed services market is difficult to forecast and each new contract carries a risk that transformation and integration of the operations iswill not be as fast or smooth as planned. EarlyAdditionally, early contract margins are generally lowerlow and the mix of new/new and old contracts may negatively affect reported results negatively in a given period. Contracts for such services normally cover several years and revenues are of agenerate recurring nature.revenues. However, sometimes contract scopes arecontracts have been, and may in the future be, terminated or reduced within scope, which has negative impactimpacts on sales and earnings. Ericsson isWhile we believe we have a strong position in the market leader in managed services butmarket, competition in this area is increasing, which may have adverse effects on our future growth and profitability.
SuccessWe depend upon the development of R&Dnew products and enhancements to our existing products, and the success of our substantial research and development investments is uncertainuncertain.
To be a playerRapid technological and market changes in our industry requires largerequire us to make significant investments in technology and creates exposure to rapid technological and market changes.innovation. We spend significant amounts and resourcesinvest significantly in innovation work for new
ERICSSON ANNUAL REPORT ON FORM 20-F 2009
technology, products and solutions. In order for us to be successful, those technologies, products and solutions must be accepted by relevant standardization bodies and
ERICSSON ANNUAL REPORT ON FORM 20-F 2012
by the industry as a whole. There can be no assurance that our research and development efforts will be technically or commercially successful. If we invest in the development of technologies, products and solutions that do not function as expected, are not adopted by the industry, are not ready in time, or are not successful in the marketplace our sales and earnings may materially suffer. Additionally, it is common for research and development projects to encounter delays due to unforeseen problems. Delays in production may increase the cost of research and development efforts and put us at a disadvantage against our competition.
AcquisitionsWe engage in acquisitions and divestments which may be disruptive and require us to incur significant expenses.
In addition to in-house innovation efforts, we make strategic acquisitions in order to obtain various benefits e.g. to reducesuch as reduced time-to-market, to gain access to technology and/orand competence, to increase ourincreased scale or to broaden our product portfolio or expand our customer base. Future acquisitions could result in the incurrence of contingent liabilities and an increase in amortization expenses related to goodwill and other intangible assets, which could have a material adverse effect upon our business, financial condition and results of operations. Risks we could face with respect to acquisitions include:
Difficulties in the integration of the operations, technologies, products and personnel of the acquired company
Risks of entering markets in which we have no or limited
Potential loss of employees
Diversion of management’s attention away from other business concerns
Expenses of any undisclosed or potential legal liabilities of the acquired company.
From time to time we also divest parts of our operationsbusiness to optimize our product portfolio or operations. There are no guaranteesAny decision to dispose of or otherwise exit businesses may result in the recording of special charges, such as workforce reduction costs and industry and technology-related write-offs. We cannot assure that suchwe will be successful in consummating future acquisitions or divestments are successful or that we will succeed in integrating the acquired entities to gain the expected benefits within the time frame we expecton favourable terms or at all. The risks associated with such acquisitions and divestments could have a material adverse effect upon our business, financial condition and results of operations.
JointWe are a party to joint ventures and partnerships which may not be successful and expose us to future costs.
If ourWe are partners in joint ventures and partnerships. Our partnering arrangements may fail to perform as expected (whether throughfor various reasons, including an incorrect assessment of our needs, our inability to take action without the approval of our partners or the capabilities or financial stability of our strategic partners), ourpartners. Our ability to work with these partners or develop new products and solutions may bebecome constrained, and this maywhich could harm our competitive position in the market.
Additionally, our share of any losses from or commitments to contribute additional capital to such partnerships may adversely affect our results of operations or financial position.
The Board of Directors’ report includes further information regarding our joint venture ST Ericsson.
AWe rely on a limited number of suppliers of components, production capacity and R&D and IT services, which exposes us to supply disruptions and cost increases.
Our ability to deliver according to market demands and contractual commitments depends significantly on obtaining a timely and adequate supply of materials, components, and production capacity and other vital services on
ERICSSON ANNUAL REPORT ON FORM 20-F 2012
competitive terms. Although we strive to avoid single-source supplier solutions, this is not always possible. Accordingly, there is a risk that we will be unable to obtain key supplies we need to produce our products and provide our services on commercially reasonable terms, or at all. Failure by any of our suppliers could interrupt our product or services supply or operations and significantly limit our sales or increase our costs. To find an alternative supplier or re-design products to replace components may take significant time.time which could cause significant delays or interruptions in the delivery of our products and services. We have from time to time experienced interruptions of supply and we may experience such interruptions in the future.
Furthermore, our procurement of supplies requires us to predict future customer demands. If we fail to anticipate customer demand properly, an over/under-supplyover or under supply of components and production capacity could occur. In many cases, some of our competitors utilize the same contract manufacturers and if they have purchased capacity ahead of us we could be blocked from acquiring the needed products. This factor could limit our ability to supply our customers or could increase our costs. At the same time, we commit to certain capacity levels or component quantities, which, if unused, will result in charges for unused capacity or scrapping costs. We are also exposed to financial counterpart risks to suppliers where we pay in advance. We conduct regular supplier audits and evaluations to mitigate the risks mentioned as well as brand risks related to the suppliers’ compliance with e.g. labor and environmental regulations.advance for supplies.
Product or service quality issues could lead to reduced revenue, gross margins and declining sales to existing customers.
Sales contracts normally include warranty undertakings for faulty products and often alsoinclude provisions regarding penalties and/or termination rights in the event of a failure to deliver ordered products or services on time or with required quality. Although we undertake a number of quality assurance measures to reduce such risks, product quality or service performance issues may negatively affect our reputation, results negatively.and financial position. If significant warranty obligations arise due to reliability or quality issues, our operating results and financial position could be negatively impacted by costs associated with fixing software or hardware defects, high service and warranty expenses, high inventory obsolescence expense, delays in collecting accounts receivable or declining sales to existing customers.
Significant foreign exchange exposures
With the majorityDue to having a significant portion of our cost basecosts in SEK and a very large share of salesrevenues in other currencies, and significant operations outside Sweden, our business is exposed to foreign exchange exposuresfluctuations that could negatively impact our revenue and results of operation.
We incur a significant portion of our expenses in SEK. As a result of our international operations, we generate, and expect to continue to generate, a significant portion of our revenue in currencies other than SEK. To the extent we are significant. Currencyunable to match revenue received in foreign currencies with costs paid in the same currency, exchange rate fluctuations affectcould have a negative impact on our consolidated income statement, balance sheet and cash flows when foreign currencies are exchanged or translated to SEK, which increases volatility in reported results.
ERICSSON ANNUAL REPORT ON FORM 20-F 2009
As market prices are predominantly established in USD or EUR, and withwe presently have a net revenue exposure in foreign currencies which means that a stronger SEK exchange rate would generally have a negative effect on our reported results. Our attempts to reduce the effects of exchange rate fluctuations through a variety of hedging activities may not be sufficient or successful, resulting in an adverse impact on our results.
IntellectualOur ability to benefit from intellectual property rights (IPR) which are critical to our business may be limited by changes in regulation limiting patents, inability to prevent infringement, the loss of licenses from third parties and IP infringement claims brought against us by competitors.
Although we have a large number of patents, there can be no assurance that they will not be challenged, invalidated, or circumvented, or that any rights granted in relation to our patents will in fact provide us with competitive advantages to us.advantages.
ERICSSON ANNUAL REPORT ON FORM 20-F 2012
In 2005, the European Union considered placing restrictions onrestricting the patentability of software. Although the European Union ultimately rejected this proposal, we cannot guarantee that they will not revisit this issue in the future. We rely on many software patents, and any limitations on the patentability of software may materially affect our business.
We utilize a combination of trade secrets, confidentiality policies, non-disclosurenondisclosure and other contractual arrangements in addition to relying on patent, copyright and trademark laws to protect our intellectual property rights. However, these measures may not be adequate to prevent or deter infringement or other misappropriation. Moreover, we may not be able to detect unauthorized use or take appropriate and timely steps to establish and enforce our proprietary rights. In fact, existing laws of some countries in which we conduct business offer only limited protection of intellectual property rights, if at all.
Our solutions may also require us to license technologies from third parties. It may be necessary in the future to seek or renew licenses and there can be no assurance that they would be available on acceptable terms, or at all. Moreover, the inclusion in our products of software or other intellectual property licensed from third parties on a non-exclusive basis could limit our ability to protect proprietary rights in our products.
Many key aspects of telecommunications and data network technology are governed by industry-wide standards usable by all market participants. As the number of market entrants and the complexity of technology increases, the possibility of functional overlap and inadvertent infringement of intellectual property rights also increases. Third parties have asserted, and may assert in the future, claims, directly against us or indirectly against our customers, alleging infringement of their intellectual property rights. Defending such claims may be expensive, time-consuming and divert the efforts of our management and/or technical personnel. As a result of litigation, we could be required to pay damages and other compensation directly or indemnifyingto indemnify our customers for such damages and other compensation, develop non-infringing products/technology or enter into royalty or licensing agreements. However, we cannot be certain that such licenses will be available to us on commercially reasonable terms or at all.all, and such judgments could have a materially adverse effect on our business.
LitigationsWe are involved in lawsuits and investigations which, if determined against us, could require us to pay substantial damages, fines and/or penalties.
In the normal course of our business we are involved in legal proceedings. These lawsuits include such matters as commercial disputes, claims regarding intellectual property, antitrust, tax and labour disputes. Litigation can be expensive, lengthy and disruptive to normal business operations. Moreover, the results of complex legal proceedings are difficult to predict. An unfavorableunfavourable resolution of a particular lawsuit could have a material adverse effect on our business, reputation, operating results, or financial condition.
As a publicly listed company, Ericsson may be exposed to lawsuits in which plaintiffs allege that the Company or its officers have failed to comply with securities laws, stock market regulationregulations or other laws, regulations or requirements. Whether or not there is merit to such claims, the time and costs incurred to defend the Company and its officers and the potential settlement or compensation to the plaintiffs maycould have significant impact on our reported results and reputation. For additional information regarding certain of the lawsuits in which we are involved, see “Legal and Tax Proceedings”proceedings” in the Board of Directors’ Report.
ERICSSON ANNUAL REPORT ON FORM 20-F 2009
Business interruptionOur operations are complex and several critical operations are centralized in a single location. Any disruption of our operations, whether due to natural or man made events, may be highly damaging to the operation of our business.
Our business operations rely on complex IT operations and communications networks, which are vulnerable to damage or disturbance from a variety of sources. Having outsourced a significant portion of our IT operations, we depend partly on security and reliability measures of external companies. Regardless of protection measures, essentially all ITour systems and communications networks are susceptible to disruption from equipmentdue to failure, vandalism, computer
ERICSSON ANNUAL REPORT ON FORM 20-F 2012
viruses, security breaches, natural disasters, power outages and other events. We also have a concentration of operations on certain sites, e.g. forincluding R&D, production, R&D, network operation centers,centres, and logistic centers,centres and shared services centers,centres, where business interruptions could cause material damage and costs. AlthoughThe delivery of goods from suppliers, and to customers, could also be hampered for the reasons stated above. We cannot provide any assurance that interruptions to our systems and communications will not have an adverse effect on our operations and financial conditions.
Cyber security incidents affecting our business may have a material adverse effect on our business operations, financial condition and brand.
Ericsson’s business operations involve areas that are particularly vulnerable to cyber security incidents such as data breaches, intrusions, espionage, knowhow and data privacy infringements, leakage and general malfeasance. Examples of these areas include, amongst others, research and development, managed services, usage of cloud solutions, software development, lawful interception and product engineering. Any cyber security incident including unintended use, involving our operations, product development, services, our third party providers or installed product base, could cause severe harm to Ericsson and could have a material adverse effect on our business operations, financial condition and brand.
Ericsson relies heavily on third parties to whom we have assessedoutsourced significant aspects of our IT infrastructure, product development and engineering services. While we have taken precautions relating to the selection, integration and ongoing management of these risks, implemented controls, performed business continuity planning and selected reputable companies for outsourced services, we cannot be surethird parties, any event or attack that interruptions withis caused as a result of vulnerabilities in their operations or products supplied to us, could have a material adverse effects will not occur.effect upon Ericsson, our business operations, financial condition and brand, potentially slowing operations, leaking valuable intellectual property or damaging our products which have been installed in our customers’ networks.
AttractWe must continue to attract and retain highly qualified employees to remain competitive.
We believe that our future success largely depends on our continued ability to hire, develop, motivate and retain engineers and other qualified personnel needed to develop successful new products, support our existing product range and provide services to our customers.
Competition for skilled personnel and highly qualified managers in the telecommunications industry remains intense. We are continuously developing our corporate culture, remuneration, promotion and benefitbenefits policies as well as other measures aimed at empowering our employees and reducing employee turnover. However, there are no guarantees that we will be successful in attracting and retaining employees with appropriate skills in the future.future, and failure in retention and recruiting could have a material adverse effect on our business.
AccessIf our customers’ financial conditions decline, we will be exposed to increased credit and commercial risks.
After completing sales to customers, we may encounter difficulty collecting accounts receivables and could be exposed to risks associated with uncollectable accounts receivable. We regularly assess the credit worthiness of our customers and based on that we determine a credit limit for each one of them. Challenging economic conditions have impacted some of our customers’ ability to pay their accounts receivables. Although our credit losses have historically been low and we have policies and procedures for managing customer finance credit risk we may be unable to avoid future losses on our trade receivables. We have also experienced demands for customer financing, and in adverse financial markets or more competitive environments, those demands may increase. Upon the financial failure of a customer, we may experience losses on credit extended and loans made to such customer, losses relating to our commercial risk exposure, and the loss of the customer’s on-going business. If customers fail to meet their obligations to us, we may experience reduced cash flows and losses in excess of reserves, which could materially adversely impact our results of operations and financial position.
ERICSSON ANNUAL REPORT ON FORM 20-F 2012
We rely on various capital sources for short-term and long-term capital for the funding of our business. Should such capital become unavailable or available in insufficient amounts or unreasonable terms, our business may materially suffer.
If we do not generate sufficient amounts of capital to support our operations, service our debt and continue our research and development and customer finance programs, or if we cannot raise sufficient amounts of capital at the required times and on the terms, required by us, our business is likely to be adversely affected. Access to short-term funding may decrease or become more expensive as a result of our operational and financial condition, and market conditions, including financial conditions in the Euro-zone, or due to deterioration in our credit rating. We cannot assureThere can be no assurance that additional sources of funds that we from time to time may need, will be available or available on reasonable terms. If we cannot access capital on commercially viable terms, our business could materially suffer.
Regulatory, Compliance and Corporate Governance RisksImpairment of goodwill may negatively impact financial condition.
An impairment of goodwill or other intangible assets could adversely affect our financial condition or results of operations. We have a significant amount of goodwill and intangible assets, for example patents, customer relations, trademarks and software. Goodwill is the only intangible asset the company has recognized to have indefinite useful life.
Other intangible assets are mainly amortized on a straight-line basis over their estimated useful lives, but no more than ten years, and are reviewed for impairment whenever events such as product discontinuances, product dispositions or other changes in circumstances indicate that the carrying amount may not be wholly recoverable. Those not yet in use are tested for impairment annually.
Historically, we have recognized impairment charges related to intangible assets mainly due to restructuring. Additional impairment charges may be incurred in the future that could be significant due to various reasons, including restructuring actions or adverse market conditions that are either specific to us or the broader telecommunications industry or more general in nature and that could have an adverse effect on our results of operations or financial condition.
Negative deviations in actual cash flows compared to estimated cash flows as well as new estimates that indicate lower future cash flows might result in recognition of impairment charges. Estimates require management judgment as well as the definition of cash generating units for impairment testing purposes. Other judgments might result in significantly different results and financial position in the future.
Regulatory environmentREGULATORY, COMPLIANCE AND CORPORATE GOVERNANCE RISKS
Our business may suffer as a result of changes in laws or regulations which could subject us to liability, increase costs, or reduce product demand.
Telecommunications is an industry which is subject to particular regulation and regulatory changesregulations. Changes to these regulations may adversely affect both our customers’ and our own operations. For example, regulations imposing more stringent, time-consuming or costly planning and zoning requirements or building approvals for radio base stations and other network infrastructure could adversely affect the timing and costs of network construction or expansion, and ultimately the commercial launch and success of these networks. Similarly, tariff and roaming regulations or rules on network neutrality could also affect operators’ ability or willingness to invest in network infrastructure, which in turn could affect the sales of our systems and services. AlsoAdditionally, delay in radio frequency spectrum allocation, and allocation between different types of usage may affect operator spending adversely or force us to develop new products to be able to compete.
LicenseFurther, we develop many of our products and services based on existing regulations and technical standards. Changes to existing regulations and technical standards, or the implementation of new regulations and
ERICSSON ANNUAL REPORT ON FORM 20-F 2012
technical standards relating to products and services not previously regulated, could adversely affect our development efforts by increasing compliance costs and causing delay. Demand for those products and services could also decline. Regulatory changes in license fees, environmental, health and safety, privacy and other regulatory changes, in general or particular to our industry,areas may increase costs and restrict our operations foror the operations of network operators and service providers or us.providers. Also indirect impacts of such changes and regulatory changes in other fields, such as pricing regulations, could affecthave an adverse impact on our business adversely even though the specific regulations may not apply directly to our products or us.
ERICSSON ANNUAL REPORT ON FORM 20-F 2009
Ericsson may fail or be unable to comply with laws or regulations and could experience adverse rulings in enforcement or other proceedings, which could have a material adverse impact on our business operations, financial condition and brand.
Country-specific political, economic and regulatory risksOur substantial international operations are subject to uncertainties which could affect our operating results.
We conduct business throughout the world and are subject to the effects of general global economic conditions as well as conditions unique to a specific countrycountries or region.regions. We conduct businesshave customers in more than 170180 countries, with a significant proportion of our sales to emerging markets in the Asia Pacific region, Latin America, Eastern Europe, the Middle East and Africa. We expect that sales to such emerging markets will represent an increasing portion of total sales, as developing nations and regions around the world increase their investments in telecommunications. We already have
Our extensive operations in many of these countries, which involve certainare subject to numerous additional risks, including volatility in gross domestic product, civil disturbances, economic and political instability, the imposition of exchange controls, economies which are subject to significant fluctuations, nationalization of private assets or other governmental actions affecting the flow of goods and currency, and difficulty of enforcing agreements and collecting receivables through local legal systems. Further, in certain markets in which we operate, there is a risk of protectionist governmental measures implemented to assist domestic market participants at the expense of foreign competitors. The implementation of such measures could adversely affect sales or our ability to purchase critical components.
We must always comply with relevant export control regulations and sanctions or other trade embargoes in force, not only at the time of sale but also at the time of delivery. The political situation in parts of the world, particularly in the Middle East, has led to an increase of sanctions imposed by the global community. A universal element of these sanctions is the financial restrictions with respect to individuals and/or legal entities, but sanctions can also restrict certain exports and ultimately lead to a complete trade embargo towards a country. In particular, the sanctions towards Iran have been strengthened significantly during 2012, both by the EU and the impositionU.S. Even though the EU has imposed a ban on deliveries on many items, especially so called dual use items, an exemption for certain standard telecom equipment is still maintained.
There is a risk in many of exchange controls.
Changesthese countries of unexpected changes in regulatory requirements, tariffs and other trade barriers, price or exchange controls, or other governmental policies in the countries where we do businesswhich could limit our operations and make the repatriation of profits difficult. In addition, the uncertainty of the legal environment in some regions could limitdecrease our ability to enforce our rights. In addition we must comply with theprofitability. Further export control regulations, sanctions or other forms of thetrade restrictions imposed on countries in which we are active may result in a reduction of commitment in those countries. The need to terminate activities as a result of further trade restrictions may also expose us to customer claims and any trade embargoes in force at the time of sale and/or delivery.other actions. Although we seek to comply with all such regulations, there can be no assurance that we are, or will be in the future, compliant with all relevant regulations and such violations, even unintentional violations, could have material adverse effects on our business, operational results and brand.
There has been a growing concern reported by media and others, that certain countries may use features of their telecommunications systems violating the human rights. This may adversely affect the telecommunications business and may have a negative impact on our brand.
ERICSSON ANNUAL REPORT ON FORM 20-F 2012
As a result of the credit crisis in Europe, concerns persist regarding the debt burden of certain Eurozone countries and their ability to meet future financial obligations, the overall stability of the euro and the suitability of the euro as a single currency given the diverse economic and political circumstances in individual member states. These and other concerns could in worst case lead to the re-introduction of individual currencies in one or more member states, or, in more extreme circumstances, the possible dissolution of the euro entirely. These potential developments, or market perceptions concerning these and related issues, could adversely affect our operations and have a material adverse effect on our business, operating results and financial condition.
ComplianceWe may fail to comply with high standards of corporate governance
Ericsson applies mandatoryour corporate governance statutesstandards which could negatively affect our financial condition, business, results of operations and rules, such as the Swedish Code of Corporate Governanceour brand.
We are subject to corporate governance laws and isregulations and are also committed to several corporate responsibility and environmental initiatives. In some of the countries where we operate corruption risks are high. In addition, there is higher focus on anticorruption, with changed legislation in many countries. To ensure that our operations are executed in accordance with theseapplicable requirements, our management system includes a robust corporate culture and a Code of Business Ethics, a Sustainability Policy, as well as other policies and directives to govern our processes and operations. We regularly perform communicationOur commitment to apply the UN Guiding principles for business and training in these areas, andhuman rights to our operation cannot prevent unintended or unlawful use of our technology by non democratic regimes. While we attempt to monitor and audit internal compliance with the policies and directives as well as our suppliers’ adherence to our Supplier Code of Conduct. There is however no guaranteeConduct and strive for continuous improvements, we cannot provide any assurances that violations will not occur which could have material adverse effects on our brand, reputationoperations, business results and business.brand.
ComplianceFailure to comply with a environmental, health and safety regulations in many jurisdictions may expose us to significant penalties and other sanctions.
We are subject to certain environmental, health and safety laws and regulations that affect our operations, facilities and products in each of the jurisdictions in which we operate. WeWhile we believe that we are in compliance with all material laws and regulations related to the environment, health, and safety, we can provide no assurance that we have been, are, or will in the future be compliant with these regulations. However,If we have failed or fail to comply with these regulations, we could be subject to significant penalties and other sanctions that could have a material adverse effect on our business, operating results and financial condition. Additionally, there is a risk that we may have to incur expenditures to cover environmental and health liabilities to maintain compliance with current or future laws and regulations or to undertake any necessary remediation. It is difficult to reasonably estimate the future impact of environmental matters, such as climate change and weather events, including potential liabilities. This is due to several factors, particularly the length of time often involved in resolving such matters. Adverse future events, regulations, or judgments could have a material effect on our business, operating results and financial condition.
Potential health risks related to electromagnetic fields may subject us to various product liability claims and result in regulatory changes.
The mobile telecommunications industry is subject to claims that mobile handsets and other devices that generate electromagnetic fields expose users to health risks. At present, a substantial number of scientific studies conducted by various independent research bodies have indicated that electromagnetic fields, at levels within the limits prescribed by public health authority safety standards and recommendations, cause no adverse effects to human health. However, any perceived risk or new scientific findings of adverse health effects offrom mobile communication devices and equipment could adversely affect us through a reduction in sales or through liability claims. Although Ericsson’s products are designed to comply with all current safety standards and
ERICSSON ANNUAL REPORT ON FORM 20-F 2012
recommendations regarding applicable electromagnetic fields, we cannot guarantee that we or the jointly owned Sony Ericsson Mobile Communications or ST-Ericsson will not become the subject of product liability claims or be held liable for such claims or be required to comply with future regulatory changes that may have an adverse effect on our business.
ERICSSON ANNUAL REPORT ON FORM 20-F 2009
business, operating results and financial condition.
RisksNew regulations related to “conflict minerals” may cause us to incur additional expenses, and may make our supply chain more complex.
On August 22, 2012, the US Securities and Exchange Commission (the “SEC”), adopted a new rule requiring disclosures beginning in 2014 of specified minerals (“conflict minerals”) that are necessary to the functionality or production of products manufactured or contracted to be manufactured by companies registered with the SEC, whether or not these products or its components are manufactured by third parties. While we believe that we will be able to fulfill these requirements without materially affecting our costs or access to materials, we can provide no assurance that there will not be material costs associated with owning Ericsson sharescomplying with the disclosure requirements.
While we work and strive to be able to sufficiently verify the origins of these minerals, our supply chain is complex, and we may not be able to sufficiently verify the origins of the relevant minerals used in our products through the due diligence procedures that we implement, which may harm our reputation. In addition, we may encounter challenges if customers require that all of the components of our products be certified as conflict-free. These new disclosure requirements may negatively affect our brand, financial condition, business and results of operations.
RISKS ASSOCIATED WITH OWNING ERICSSON SHARES
Our share price has been and may continue to be volatile, especially as technology companies, securities and markets as a whole remain volatile.
Our share price has been volatile partly due to various factors, including our operating performance as well as the high volatility in the securities markets generally and forvolatility in telecommunications and technology companiescompanies’ securities in particular. TheOur share price is also likely to be affected by the developmentfuture developments in our market, our reported financial results and the expectations of financial analysts, as well as statements and market speculation regarding our future prospects.prospects or the timing or content of any profit warningpublic communications, including reports of operating results, by us or our competitors.
Factors other than our financial results that may affect our share price include, but are not limited to:
A weakening of our brand name or other circumstances with adverse effects on our reputation.reputation
Announcements by our customers, competitors or us regarding capital spending plans of network operators.our customers
Financial difficulties for our customers.customers
Awards of large supply or service contracts.contracts
Speculation in the press or investment community about the business level or growth in the telecommunications market for mobile communications.
Technical problems, in particular those relating to the introduction and viability of new network systems, like LTE/4G.including lte/4g and new platforms such as the rbs 6000 (multi-standard radio base station) platform
Actual or expected results of ongoing or potential litigation.litigation
ERICSSON ANNUAL REPORT ON FORM 20-F 2012
Announcements concerning bankruptcy or investigations into the accounting procedures of ourselves or other telecommunications companies even if we are not involved.
Our ability to forecast and communicate our future results in a manner consistent with investor expectations.
Currency fluctuations may adversely affect share value or value of dividendsdividends.
Because our shares are quoted in SEK on NASDAQ OMX Stockholm (our primary stock exchange), but in USD on NASDAQ New York (ADSs), fluctuations in exchange rates between SEK and USD may affect the value of yourour shareholders’ investment. In addition, because we pay cash dividends in SEK, fluctuations in exchange rates may affect the value of distributions if arrangements with your bank, broker or depositary call for distributions to you in currencieswhen converted into other than SEK.currencies. An increasing part of the trade in our shares is carried out on alternative exchanges or markets, which may lead to less accurate share price information on NASDAQ OMX Stockholm or NASDAQ.
NASDAQ New York.ERICSSON ANNUAL REPORT ON FORM 20-F 20092012
FORWARD-LOOKING STATEMENTS
This Annual Report includes forward-looking statements, including statements reflecting management’s current views relating to the growth of the market, future market conditions, future events and expected operational and financial performance. The words “believe”, “expect”, “foresee”, “anticipate”, “assume”, “intend”, “may”, “could”, “plan”, “estimate”, “forecast”, “will”, “should”, “could”“predict”, “aim”, “ambition”, “target”, “might” or, in each case, their negative, and similar words are intended to help identify forward-looking statements.
Forward-looking statements may be found throughout this document, but in particular in the chapterschapter “Board of Directors’ Report” and “Information on the Company”, and include statements regarding:
ourOur goals, strategies and operational or financial performance expectations;expectations
developmentDevelopment of corporate governance standards, stock market regulations and related legislation;legislation
the growthThe future characteristics of the markets in which we operate;operate
ourProjections and other characterizations of future events
Our liquidity, capital resources, capital expenditures, our credit ratings and the development in the capital markets, affecting our industry or us;us
theThe expected demand for our existing as well as new products and services;services
theThe expected operational or financial performance of our joint ventures and other strategic cooperation activities;activities
theThe time until acquired entities will be accretive to income;income
technologyTechnology and industry trends including regulatory and standardization environment, competition and our customer structure;structure
ourOur plans for new products and services including research and development expenditures.
Although we believe that the expectations reflected in these and other forward-looking statements are reasonable, we cannot assure you that these expectations will materialize. Because forward-looking statements are based on assumptions, judgments and estimates, and are subject to risks and uncertainties, actual results could differ materially from those described or implied herein.
Important factors that could affect whether and to what extent any of our forward-looking statements materialize include, but are not limited to:
ourOur ability to respond to changes in the telecommunications market and other general market conditions in a cost effective and timely manner;manner
developmentsDevelopments in the political, economic or regulatory environment affecting the markets in which we operate, including trade embargoes, changes in tax rates, changes in patent protection regulations, allegations of health risks from electromagnetic fields, cost of radio licenses for our customers, allocation of radio frequencies for different purposes and results of standardization activities;activities
theThe effectiveness of our strategies and their execution, including partnerships, acquisitions and divestments;divestments
financialFinancial risks, including changes in foreign exchange rates or interest rates, lack of liquidity or access to financing, our credit ratings, changes in tax liabilities, credit risks in relation to counterparties, customer defaults under significant customer finance arrangements and risks of confiscation of assets in foreign countries;countries
ERICSSON ANNUAL REPORT ON FORM 20-F 2012
The financial strength of our customer base
theThe impact of the consolidation in the industry, and the resulting (i) reduction in the number of customers, and adverse consequences of a loss of, or significant decline in, our business with a major customer; (ii) increased strength of a competitor or the establishment of new competitors;competitors
theThe impact of changes in product demand, technology adoption, price erosion, competition from existing or new competitors or new technologies or alliances between vendors of different types of technology and the risk that our products and services may not sell at the rates or levels we anticipate;anticipate
ERICSSON ANNUAL REPORT ON FORM 20-F 2009
theThe product mix and margins of our sales;sales
theThe volatility of market demand and difficulties to forecast such demand;demand
ourOur ability to develop commercially viable products, systems and services, to acquire licenses of necessary technology, to protect our intellectual property rights through patents and trademarks and to license them to others and defend them against infringement, and the results of patent litigation;litigation
supplyOur ability to manage cyber security incidents
Supply constraints, including component or production capacity shortages, suppliers’ abilities to cost effectively deliver quality products on time and in sufficient volumes, and risks related to concentration of proprietary or outsourced production in a single facility or sole source situations with a single vendor;vendor
ourOur ability to successfully manage operators’ networks to their satisfaction with satisfactory margins;margins
ourOur ability to maintain a strong brand and good reputation and to be acknowledged for good corporate governance;governance
ourOur ability to recruit and retain qualified management and other key employees.employees
Our ability to trace conflict minerals in our complex supply chain.
Certain of these risks and uncertainties are described further in “Risk Factors”factors”. We undertake no obligation to publicly update or revise any forward-looking statements included in this Annual Report, whether as a result of new information, future events or otherwise, except as required by applicable law or stock exchange regulation.
ERICSSON ANNUAL REPORT ON FORM 20-F 2012
CORPORATE GOVERNANCE REPORT 2012
Corporate governance describes how rights and responsibilities are distributed among corporate bodies according to applicable laws, rules and processes. Corporate governance also defines the decision-making systems and structure through which owners directly or indirectly control a company.
Good corporate governance forms the basis for building a robust corporate culture throughout a global organization. Efficient and reliable controls and procedures are important, but it is also crucial that ethical business practices are highly valued and followed by all people in the organization—starting at the top.
As Chairman of the Board, it is my responsibility to ensure that the Board’s work is efficient and that applicable principles and processes in the Board’s work procedure are complied with. The Board of Directors’ main tasks include supporting Group management and exercising critical review of their work. To be able to fulfill these tasks successfully, it is also my responsibility as Chairman to enable an open and meaningful dialogue between the Board and Group management. Relevant and timely information from Group management is very important as it forms the best possible basis for the Board’s discussions and resolutions. The Board’s work is constantly evaluated and improved to allow the Board to fulfill its duties successfully.
I believe that Ericsson’s continuous focus on corporate governance matters, ethical business and open and meaningful dialogue within the organization promote sustainable business. I believe that this, in turn, generates value for Ericsson’s shareholders.
Leif Johansson
Chairman of the Board of Directors
This Corporate Governance Report is rendered as a separate report added to the Annual Report in accordance with the Annual Accounts Act ((SFS 1995:1554) Chapter 6, Sections 6 and 8) and the Swedish Corporate Governance Code. The report has been reviewed by Ericsson’s auditor in accordance with the Annual Accounts Act.
ERICSSON ANNUAL REPORT ON FORM 20-F 20092012
REGULATION AND COMPLIANCE
External rules
As a Swedish public limited liability company with securities quoted on NASDAQ OMX Stockholm as well as on NASDAQ New York, Ericsson is subject to a variety of rules that affect its governance. Major external rules include:
The Swedish Companies Act
The Rule Book for issuers of NASDAQ OMX Stockholm
The Swedish Corporate Governance Code (the “Code”)
NASDAQ Stock Market Rules, including applicable NASDAQ New York corporate governance requirements (subject to certain exemptions principally reflecting mandatory Swedish legal requirements)
Applicable requirements of the US Securities and Exchange Commission (the “SEC”).
Internal rules
In addition, to ensure compliance with legal and regulatory requirements and the high ethical standards that we set for ourselves, Ericsson has adopted internal rules that include:
A Code of Business Ethics
Group Steering Documents, including Group policies and directives, instructions and business processes for approval, control and risk management
A Code of Conduct, to be applied in the product development, production, supply and support of Ericsson products and services worldwide.
The work procedure for the Board of Directors also includes internal corporate governance rules.
Compliance with the Swedish Corporate Governance Code
The Code has been applied by Ericsson since 2005. Ericsson is committed to complying with best-practice corporate governance on a global level wherever possible. This includes continued compliance with the Code. Ericsson has not deviated from any of the rules of the Code. The Code can be found on the website of the Swedish Corporate Governance Board which administrates the Code: www.corporategovernanceboard.se.
Compliance with applicable stock exchange rules
There has been no infringement of applicable stock exchange rules and no breach of good practice on the securities market reported by the stock exchange’s disciplinary committee or the Swedish Securities Council.
Code of Business Ethics
Ericsson’s Code of Business Ethics sets out how the Group works to achieve and maintain high ethical standards. It summarizes the Group’s basic policies and directives and underpins the importance of ethical conduct in all business activities.
The Code of Business Ethics has been translated into 30 languages. This ensures that it is accessible to all employees. During recruitment, employees acknowledge that they are aware of the principles of the Code of
ERICSSON ANNUAL REPORT ON FORM 20-F 2012
Business Ethics. This procedure is repeated at regular intervals throughout the term of employment. Through this process, Ericsson strives to raise awareness and to ensure that the business is run with integrity so that Ericsson can maintain credibility with customers, partners, employees, shareholders and other stakeholders. During 2012, the Code of Business Ethics was reviewed and updated and acknowledged by employees throughout the global organization. In addition, Ericsson’s whistleblower procedure was extended to a greater scope.
All employees have an individual responsibility to ensure that business practices adhere to the Code of Business Ethics.

GOVERNANCE STRUCTURE
Shareholders may exercise their decision-making rights in the Company at General Meetings of shareholders.
A Nomination Committee is appointed by the major shareholders in accordance with the Instruction for the Nomination Committee adopted by the Annual General Meeting of shareholders. The tasks of the Nomination Committee include the proposal of an external auditor and the proposal of Board members for election by the Annual General Meeting of shareholders.
In addition to the Directors elected by shareholders, the Board of Directors consists of employee representatives appointed by the unions. The Board of Directors is ultimately responsible for the organization of Ericsson and the management of its operations.
The President and CEO, appointed by the Board of Directors, is responsible for handling the day-to-day management of Ericsson in accordance with instructions from the Board. The President and CEO is supported by the Executive Leadership Team (ELT).
The external auditor of Ericsson is elected by the General Meeting of shareholders.
SUSTAINABILITY, CORPORATE RESPONSIBILITY AND CORPORATE GOVERNANCE
Sustainability and Corporate Responsibility (CR) are important parts of Ericsson’s corporate governance framework. For Ericsson, sustainability is about long-term social equity, economic prosperity and environmental performance. CR is about maintaining the necessary controls to minimize risks, while creating positive business impacts for Ericsson’s stakeholders and brand, by linking products, services and solutions to an overall business goal of sustainable growth, ensuring that Ericsson is a trusted partner to its stakeholders. Ericsson’s Sustainability and CR strategy is integrated in the Group’s yearly strategy process and implemented in the business units and the regions. The strategy process is further described on pages 204 and 205. CR risks are also included in Ericsson’s risk management framework.
ERICSSON ANNUAL REPORT ON FORM 20-F 2012
During 2012, Ericsson’s continued focus on sustainability and CR matters was reflected through a number of corporate governance activities within the organization:
Effective October 2012, Ericsson’s Head of Sustainability and Corporate Responsibility reports directly to the President and CEO. This repositioning of the Sustainability and CR unit within the organization was made to better integrate the sustainability and CR work with the company’s business operations, decision-making, culture and ways of working and to help build sustainable value creation for Ericsson.
Ericsson’s Code of Business Ethics was reviewed and updated and now includes a commitment to the new UN Guiding Principles on Business and Human Rights. Also, Ericsson’s whistleblower procedure was extended to a wider scope in terms of incidents covered by the procedure and with respect to who can report violations. The updated Code was confirmed by employees throughout the global organization.
The Sales Compliance Board was further strengthened and formalized to assess and manage human rights and CR risks.
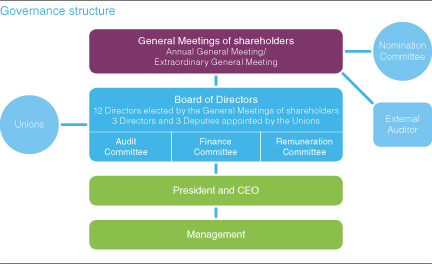
SHAREHOLDERS
Ownership structure
As of December 31, 2012, Telefonaktiebolaget LM Ericsson (the “Parent Company”) had 551,719 shareholders (according to the share register kept by Euroclear Sweden AB). Swedish institutions hold approximately 58% of the votes. The largest shareholders are Investor AB, holding 21.37% of the votes, and AB Industrivärden, holding 19.81% of the votes (together with Svenska Handelsbankens Pensionsstiftelse and Pensionskassan SHB Försäkringsförening).
A significant number of the shares held by foreign investors are nominee-registered, i.e. held off-record by banks, brokers and/or nominees. This means that the actual shareholder is not displayed in the share register or included in the shareholding statistics.
ERICSSON ANNUAL REPORT ON FORM 20-F 2012
More information on Ericsson’s shareholders can be found in the chapter “Share Information” in the Annual Report.
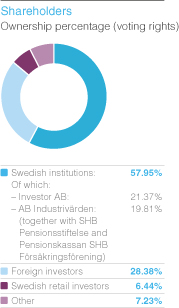
CONTACT THE BOARD OF DIRECTORS
Telefonaktiebolaget LM Ericsson
The Board of Directors Secretariat
SE-164 83 Stockholm
Sweden
boardsecretariat@ericsson.com
Shares and voting rights
The share capital of the Parent Company consists of two classes of listed shares: A and B shares. Each Class A share carries one vote and each Class B share carries one tenth of one vote. Class A and B shares entitle the holder to the same proportion of assets and earnings and carry equal rights to dividends.
The Parent Company may also issue Class C shares in order to create treasury stock to finance and hedge long-term variable remuneration programs resolved by the General Meeting of shareholders. Class C shares are converted into Class B shares before they are used for long-term variable remuneration programs.
The members of the Board of Directors and the Executive Leadership Team have the same voting rights on shares as other shareholders.
GENERAL MEETINGS OF SHAREHOLDERS
Decision-making at General Meetings
The decision-making rights of Ericsson’s shareholders are exercised at General Meetings of shareholders. Most resolutions at General Meetings are passed by a simple majority. However, the Swedish Companies Act requires qualified majorities in certain cases, for example in case of:
Amendment of the Articles of Association
ERICSSON ANNUAL REPORT ON FORM 20-F 2012
Resolution to transfer own shares to employees participating in long-term variable remuneration programs.
The Annual General Meeting of shareholders
The Annual General Meeting of shareholders (AGM) is held in Stockholm. The date and venue for the meeting is announced on the Ericsson website no later than at the time of release of the third-quarter interim financial report.
Shareholders who cannot participate in person may be represented by proxy. Only shareholders registered in the share register have voting rights. Nominee-registered shareholders who wish to vote may request to be entered into the share register by the record date for the AGM.
The AGM is held in Swedish and is simultaneously interpreted into English. All documentation provided by the Company is available in both Swedish and English.
The AGM gives shareholders the opportunity to raise questions relating to the operations of the Group. Ericsson always strives to ensure that the members of the Board of Directors and the Executive Leadership Team are present to answer such questions. Shareholders and other interested parties may also correspond in writing with the Company at any time.
The external auditor is always present at the AGM.
Ericsson’s Annual General Meeting 2012
Including shareholders represented by proxy, 3,224 shareholders were represented at the AGM held on May 3, 2012, representing approximately 70% of the votes.
The meeting was also attended by members of the Board of Directors, members of the Executive Leadership Team (ELT) and the external auditor.
Decisions of the AGM 2012 included:
Payment of a dividend of SEK 2.50 per share
Re-election of Leif Johansson as Chairman of the Board of Directors
Re-election of members of the Board of Directors: Roxanne S. Austin, Sir Peter L. Bonfield, Börje Ekholm, Ulf J. Johansson, Sverker Martin-Löf, Nancy McKinstry, Anders Nyrén, Hans Vestberg, Michelangelo Volpi and Jacob Wallenberg
Election of Alexander Izosimov as a new member of the Board of Directors
Board of Directors’ fees:
Chairman: SEK 3,750,000 (unchanged)
Other non-employed Board members: SEK 875,000 each (previously SEK 825,000)
Chairman of the Audit Committee: SEK 350,000 (unchanged)
Other non-employed members of the Audit Committee: SEK 250,000 each (unchanged)
Chairmen of the Finance and Remuneration Committees: SEK 200,000 each (unchanged)
Other non-employed members of the Finance and Remuneration Committees: SEK 175,000 each (unchanged)
ERICSSON ANNUAL REPORT ON FORM 20-F 2012
Approval for part of the Directors’ fees to be paid in the form of synthetic shares
Approval of Guidelines for remuneration to Group Management
Implementation of a Long-Term Variable Remuneration Program 2012, including a share issue of and authorization to the Board to buy back 31,700,000 shares for the program
Approval of the Instruction for the Nomination Committee, including among other things, a procedure on how to appoint the members of the Nomination Committee, to apply until the General Meeting of shareholders resolves otherwise.
The minutes of the AGM 2012 are available at Ericsson’s website.
ANNUAL GENERAL MEETING 2013
Ericsson’s AGM 2013 will take place on April 9, 2013 at Kistamässan in Kista, Stockholm. Shareholders who wish to have a matter addressed at the AGM should submit their written request to the Board in due time before the AGM. Further information is available on Ericsson’s website.
CONTACT THE NOMINATION COMMITTEE
Telefonaktiebolaget LM Ericsson
The Nomination Committee
c/o General Counsel’s Office
SE-164 83 Stockholm
Sweden
nomination.committee@ericsson.com
NOMINATION COMMITTEE
A Nomination Committee was elected by the AGM for the first time in 2001. Since then, each AGM has appointed a Nomination Committee, or resolved on the procedure for appointing the Nomination Committee.
The AGM 2012 resolved on an Instruction for the Nomination Committee, including the tasks of the Nomination Committee and the procedure for appointing the members of the Nomination Committee. The Instruction for the Nomination Committee shall apply until the General Meeting of shareholders resolves otherwise. Under the instruction, the Nomination Committee shall consist of:
Representatives of the four largest shareholders by voting power by the end of the month in which the AGM was held
The Chairman of the Board of Directors.
As described in the Instruction for the Nomination Committee, the Committee may include additional members following a request by a shareholder. The request must be justified by changes in the shareholder’s ownership of shares and be received by the Nomination Committee no later than December 31. No fees are paid to the members of the Nomination Committee.
Members of the Nomination Committee
In addition to the Chairman of the Board of Directors, Leif Johansson, the current Nomination Committee consists of four representatives appointed by the four shareholders with the largest voting power as of May 31, 2012:
Petra Hedengran (Investor AB), Chairman of the Nomination Committee
ERICSSON ANNUAL REPORT ON FORM 20-F 2012
Carl-Olof By (AB Industrivärden, Svenska Handelsbankens Pensionsstiftelse)
Johan Held (AFA Försäkring)
Marianne Nilsson (Swedbank Robur Fonder).
The tasks of the Nomination Committee
Over the years, the tasks of the Nomination Committee have evolved to comply with the requirements of the Code. The main task of the Committee remains to propose Board members for election by the AGM. In doing this, the Committee must not only orientate itself on the Company’s strategy and future challenges to be able to assess the competence and experience that is required by the Board; it must also consider all applicable rules on independence of the Board of Directors and its committees.
In addition, the Committee prepares remuneration proposals, for resolution by the AGM, to non-employed Directors elected by the AGM and to the auditor.
The assignment of the Nomination Committee further includes proposing auditors, whereby candidates are selected in cooperation with the Audit Committee of the Board. The Committee also proposes a candidate for election of the Chairman at the AGM.
Work of the Nomination Committee for the AGM 2013
The Nomination Committee started its work by going through a checklist of all its duties according to the Code and the Instruction for the Nomination Committee, resolved by the AGM. The Committee also set a time plan for its work ahead. A thorough understanding of Ericsson’s business is paramount to the role of the members of the Committee. Therefore, the President and CEO was invited to, together with the Chairman of the Board, present their views on the Company’s position and strategy.
The Committee was thoroughly informed of the results of the evaluation of the Board’s work and procedures, including the performance of the Chairman of the Board. On this basis, the Committee was able to assess the competence and experience required by Board members. When proposing Board members, the Nomination Committee considered a number of things, including necessary experience and competence as well as the value of diversity and renewal and the improvement of gender balance.
The Committee also acquainted itself with the assessments made by the Company and the Audit Committee on the quality and efficiency of external auditor work, and received recommendations on external auditor and audit fees. As of March 5, 2013 the Nomination Committee has held six meetings.
PROPOSALS TO THE NOMINATION COMMITTEE
Shareholders may submit proposals to the Nomination Committee at any time, but should do so in due time before the AGM to ensure that the proposals can be considered by the Committee. Further information is available on Ericsson’s website.
BOARD OF DIRECTORS
The Board of Directors is ultimately responsible for the organization of Ericsson and the management of Ericsson’s operations. The Board of Directors develops guidelines and instructions for day-to-day operations, managed by the President and CEO. The President and CEO ensures that the Board is updated regularly on events of importance to the Group. This includes updates on business development, results, financial position and the liquidity of the Group.
ERICSSON ANNUAL REPORT ON FORM 20-F 2012
According to the Articles of Association, the Board of Directors shall consist of no less than five and no more than 12 directors, with no more than six deputies. In addition, under Swedish law, trade unions have the right to appoint three directors and their deputies to the Board.
Directors serve from the close of one AGM to the close of the next, but can serve any number of consecutive terms.
The President and CEO may be elected director of the Board, but, under the Swedish Companies Act, the President of a public company may not be elected Chairman of the Board.
Conflicts of interest
Ericsson maintains rules and regulations regarding conflicts of interest. Directors are disqualified from participating in any decision regarding agreements between themselves and Ericsson. The same applies to agreements between Ericsson and any third party or legal entity in which the Board member has an interest.
The Audit Committee has implemented a procedure on related-party transactions and a pre-approval process for non-audit services carried out by the external auditor.
Composition of the Board of Directors
The Board of Directors consists of 12 Directors, including the Chairman of the Board, elected by the shareholders at the AGM 2012 for the period until the close of the AGM 2013. It also consists of three employee representatives, each with a deputy, appointed by the trade unions for the same period of time. The President and CEO, Hans Vestberg, is the only Board member who was also a member of Ericsson’s management during 2012.
Work procedure
Pursuant to the Swedish Companies Act, the Board of Directors has adopted a work procedure that outlines rules for the distribution of tasks between the Board and its Committees as well as between the Board, its Committees and the President and CEO. This complements the regulations in the Swedish Companies Act and in the Articles of Association of the Company. The work procedure is reviewed, evaluated and adopted by the Board as required and at least once a year.
Independence
The Board of Directors and its Committees are subject to a variety of independence rules under applicable Swedish law, the Code and applicable US securities laws, SEC rules and the NASDAQ Stock Market Rules. However, Ericsson can rely on exemptions from certain US requirements.
The composition of the Board of Directors meets all applicable independence criteria. The Nomination Committee concluded before the AGM 2012 that, for purposes of the Code, at least seven of the nominated Directors were independent of Ericsson, its senior management and its major shareholders. These were Roxanne S. Austin, Sir Peter L. Bonfield, Alexander Izosimov, Leif Johansson, Ulf J. Johansson, Nancy McKinstry and Michelangelo Volpi.
Structure of the work of the Board of Directors
The work of the Board follows a yearly cycle. This enables the Board to appropriately address each of its duties and to keep strategy, risk assessment and value creation high on the agenda.
ERICSSON ANNUAL REPORT ON FORM 20-F 2012
The yearly cycle starts with the statutory Board meeting which is held in connection with the AGM. At this meeting, members of each of the three Board Committees are appointed and the Board resolves on signatory power.
First interim report meeting
At the next ordinary meeting (depending on the date of the AGM), the Board handles the interim financial report for the first quarter of the year.
Various strategic issues are addressed at most of the Board meetings. In accordance with the annual cycle for the strategy process, a main strategy Board meeting is also held, which is in essence dedicated to short- and long-term strategies of the Group. Following the Board’s input on and approval of the overall strategy, the strategy is cascaded throughout the entire organization, starting at the Global Leadership Summit with Ericsson’s top 250 leaders.
Second interim report meeting
At the second interim report meeting, the Board handles the interim financial report for the second quarter of the year.
Follow-up strategy and risk management meeting
Following the summer, a meeting is held to address particular strategy matters in further detail and to finally confirm the Group strategy. The meeting also addresses the overall risk management of the Group.
Third interim report meeting
A Board meeting is held to handle the interim financial report for the third quarter of the year. At this meeting, the results of the Board evaluation are presented to and discussed by the Board.
Budget and financial outlook meeting
A meeting is held for the Board to address the budget and financial outlook as well as further analysis of internal and external risks.
Fourth-quarter and full-year financial results meeting
Following the end of the calendar year, the Board holds a meeting which focuses on the financial results of the entire year and handles the fourth-quarter financial report.
The Annual Report meeting closes the yearly cycle of work of the Board of Directors. At this meeting the Board approves the Annual Report.
As the Board is responsible for financial oversight, financial information is presented and evaluated at each Board meeting. Furthermore, each Board meeting generally includes reports on Committee work by the Chairman of each Committee. In addition, minutes from Committee meetings are distributed to all Directors prior to the Board meeting.
ERICSSON ANNUAL REPORT ON FORM 20-F 2012
At every Board meeting, the President and CEO reports on business and market developments as well as on the financial performance of the Company. Strategic issues and risks are also addressed at most Board meetings. The Board is regularly informed of developments in legal and regulatory matters of importance.
The Board’s annual work cycle
The annual cycle applied to the Board’s work allows the Board to appropriately address its duties during the year. It also facilitates for the organization to align its global processes to allow appropriate Board involvement. This is particularly relevant for the Group’s strategy process and risk management.
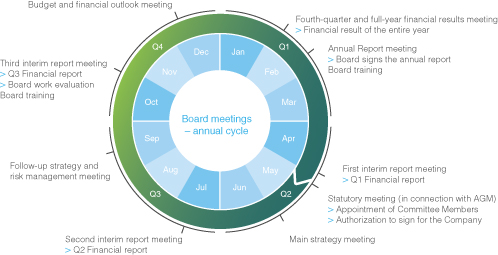
Auditor involvement
The Board meets with Ericsson’s external auditor in closed sessions at least once a year to receive and consider the auditor’s observations. The auditor reports to management on the accounting and financial reporting practices of the Group.
The Audit Committee also meets with the auditor to receive and consider observations on the interim reports and the Annual Report. The auditor has been instructed to report on whether the accounts, the management of funds and the general financial position of the Group are under control in all material respects.
In addition, the Board reviews and assesses the process for financial reporting, as described later in “Internal control over financial reporting 2012”. Combined with internal controls, the Board’s and the auditor’s review of interim and annual reports are deemed to give reasonable assurance on the quality of financial reporting.
Training of the Board of Directors
All new Directors receive comprehensive training tailored to their individual needs. Introductory training typically includes meetings with the heads of the business units and Group functions, as well as training arranged by NASDAQ OMX Stockholm on listing issues and insider rules. In addition, full-day training sessions are held twice a year for all Directors. These sessions enhance the Directors’ knowledge of specific operations and issues as appropriate to ensure that the Board has knowledge and understanding of the forefront of technical development and of the business activities of the Group.
As a rule, the Board receives Sustainability and Corporate Responsibility training at least once a year.
ERICSSON ANNUAL REPORT ON FORM 20-F 2012
Key focus areas in Board training in 2012 were:
Technology leadership, including market development, competitor overview, Ericsson Research long-term view and ways of working.
Ericsson’s strategic forecast, including purpose, process, roles and methodology forecast.
Work of the Board of Directors in 2012
In 2012, 12 Board meetings were held. For attendance at Board meetings, see the table on page 195. Among the matters addressed by the Board this year (apart from regular matters in the annual Board work cycle) were:
A number of acquisitions, including BelAir Networks, Technicolor’s broadcast services division, ConceptWave and increased ownership in Ericsson-LG.
Entry to the US bond market through issuing a ten-year US bond.
Loan agreements with the European Investment Bank (EIB) and the Nordic Investment Bank (NIB).
Strong focus on risk management, strategy and the competitive market development, as well as on sustainability and corporate responsibility matters.
A number of divestments, including the divestment of the Multimedia brokering platform (IPX) and EDA 1500 GPON assets.
Continued focus on the effects of general financial uncertainty on the market, including the effects of political unrest in the Middle East and Africa and financial uncertainty in Europe.
Continuous work relating to strategic plans for the joint venture ST-Ericsson.
Board work evaluation
A key objective of the Board evaluation is to ensure that the Board is functioning well. This includes gaining an understanding of the issues that the Board thinks warrant greater focus, as well as determining areas where additional competence is needed within the Board. The evaluation also serves as guidance for the work of the Nomination Committee.
Each year, the Chairman of the Board initiates and leads the evaluation of the Board and Committee work and procedures. Evaluation tools include detailed questionnaires and discussions.
In 2012, all the Directors responded to written questionnaires, covering the Director’s individual performance, Board work in general, Committee work and the Chairman’s performance. The Chairman was not involved in the development or compilation of the questionnaire which related to his performance, nor was he present when his performance was evaluated. The evaluations were thoroughly discussed and an action plan was developed in order to further improve the work of the Board.
COMMITTEES OF THE BOARD OF DIRECTORS
The Board of Directors has established three Committees: the Audit Committee, the Finance Committee and the Remuneration Committee. Members of each Committee are appointed for one year amongst the Board members.
The task of the Committees is mainly to prepare matters for final resolution by the Board. However, the Board has authorized each Committee to determine certain issues in limited areas. It may also on occasion provide extended authorization for the Committees to determine specific matters.
ERICSSON ANNUAL REPORT ON FORM 20-F 2012
If deemed appropriate, the Board of Directors and each Committee have the right to engage external expertise, either in general or with respect to specific matters.
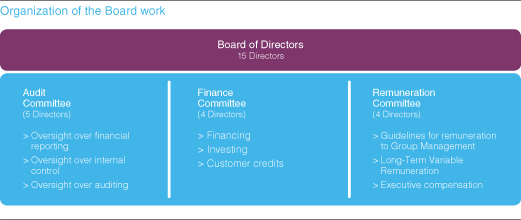
Prior to the Board meetings, each Committee submits to the Board minutes from Committee meetings. The Chairman of the Committee also reports on the Committee work at each Board meeting.
Audit Committee
On behalf of the Board, the Audit Committee monitors the following:
The scope and correctness of the financial statements
Compliance with legal and regulatory requirements
Internal control over financial reporting
The effectiveness and appropriateness of the Group’s anti-corruption program.
The Audit Committee also reviews the annual and interim financial reports and oversees the external audit process, including audit fees. This involves:
Reviewing, with management and the external auditor, the financial statements (including their conformity with generally accepted accounting principles)
Reviewing, with management, the reasonableness of significant estimates and judgments made in preparing the financial statements, as well as the quality of the disclosures in the financial statements
Reviewing matters arising from reviews and audits performed.
The Audit Committee itself does not perform audit work. Ericsson has an internal audit function which reports directly to the Audit Committee.
The Committee is also involved in the preparatory work of proposing auditor for election by the AGM. It also monitors Group transactions and the ongoing performance and independence of the auditor with the aim to avoid conflicts of interest.
ERICSSON ANNUAL REPORT ON FORM 20-F 2012
In order to ensure the auditor’s independence, the Audit Committee has established pre-approval policies and procedures for non-audit related services to be performed by the external auditor. Pre-approval authority may not be delegated to management. The Audit Committee also oversees:
The process for reviewing transactions with related parties
The whistleblower procedure for the reporting of alleged violations of the Code of Business Ethics that (i) are conducted by Group or local management, and (ii) relate to corruption, questionable accounting or auditing matters or otherwise seriously affect vital interests of the Group or personal health and safety. The whistleblower procedure was updated and extended during 2012 in connection with the review and update of the Code of Business Ethics.
Violations reported through the whistleblower procedure are investigated by Ericsson’s internal audit function together with the relevant Group function. Information regarding any incident is reported to the Audit Committee. Reports include measures taken, details of the responsible Group function and the status of any investigation.
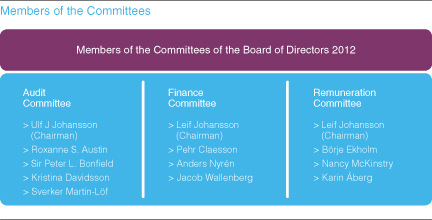
Members of the Audit Committee
The Audit Committee consists of five Board members appointed by the Board. In 2012, the Audit Committee comprised Ulf J. Johansson (Chairman of the Committee), Roxanne S. Austin, Sir Peter L. Bonfield, Kristina Davidsson and Sverker Martin-Löf.
The composition of the Audit Committee meets all applicable independence requirements. The Board of Directors has determined that each of Ulf J. Johansson, Roxanne S. Austin, Sir Peter L. Bonfield and Sverker Martin-Löf is an audit committee financial expert, as defined under the SEC rules. Each of them is independent under applicable US securities laws, SEC rules and NASDAQ Stock Market Rules and each of them is financially literate and familiar with the accounting practices of an international company, such as Ericsson.
Former authorized public accountant Peter Markborn was previously appointed as an external expert advisor to assist and advise the Audit Committee. He left this assignment during 2012.
Work of the Audit Committee in 2012
The Audit Committee held six meetings in 2012. Directors’ attendance is reflected in the table on page 195. During the year, the Audit Committee reviewed the scope and results of external financial audits and the independence of the external auditor. It also monitored the external audit fees and approved non-audit services performed by the external auditor in accordance with the Committee’s pre-approval policies and procedures.
ERICSSON ANNUAL REPORT ON FORM 20-F 2012
The Committee approved the annual audit plan for the internal audit function and reviewed its reports. Prior to publishing it, the Committee also reviewed and discussed each interim report with the external auditor.
The Committee monitored the continued compliance with the Sarbanes-Oxley Act as well as the internal control and risk management process. It also reviewed certain related-party transactions in accordance with its established process.
The Committee reviewed and evaluated the effectiveness and appropriateness of the Group’s anti-corruption program.
Finance Committee
The Finance Committee is primarily responsible for:
Handling matters related to acquisitions and divestments
Handling capital contributions to companies inside and outside the Ericsson Group
Raising loans, issuing guarantees and similar undertakings, and approving financial support to customers and suppliers
Continuously monitoring the Group’s financial risk exposure.
The Finance Committee is authorized to determine matters such as:
Direct or indirect financing
Granting of securities and guarantees
Certain investments, divestments and financial commitments.
Members of the Finance Committee
The Finance Committee consists of four Board members appointed by the Board. In 2012, the Finance Committee comprised: Leif Johansson (Chairman of the Committee), Pehr Claesson, Anders Nyrén and Jacob Wallenberg.
Work of the Finance Committee in 2012
The Finance Committee held seven meetings in 2012. Directors’ attendance is reflected in the table on page 195. During the year, the Finance Committee approved numerous customer finance credit arrangements and reviewed a number of potential mergers and acquisitions and real estate investments from a financial perspective. As a result of the uncertainty on the financial markets and the macroeconomic development, the Finance Committee has focused particularly on discussing and securing an adequate capital structure, cash flow and cash-generating ability. It has also continuously monitored Ericsson’s financial position and credit exposure.
Remuneration Committee
The Remuneration Committee’s main responsibility is to prepare for resolution by the Board of Directors matters regarding salary and other remuneration, including pension benefits of the President and CEO, the Executive Vice Presidents and other officers who report directly to the President and CEO. Responsibilities include:
Reviewing and preparing for resolution by the Board, proposals on salary and other remuneration, including retirement compensation, for the President and CEO
ERICSSON ANNUAL REPORT ON FORM 20-F 2012
Reviewing and preparing for resolution by the Board, proposals to the AGM on guidelines for remuneration to the ELT
Approving proposals on salary and other remuneration, including retirement compensation, for the Executive Vice Presidents and other CEO direct reports
Reviewing and preparing for resolution by the Board, proposals to the AGM on LTV and similar equity arrangements.
Consideration is given to trends in remuneration, legislative changes, disclosure rules and the general global environment surrounding executive remuneration. The Committee reviews salary survey data before approving any salary adjustment for CEO direct reports. In addition, the Committee prepares salary adjustments for the President and CEO for resolution by the Board.
Members of the Remuneration Committee
The Remuneration Committee consists of four Board members appointed by the Board. In 2012, the Remuneration Committee comprised: Leif Johansson (Chairman of the Committee), Börje Ekholm, Nancy McKinstry and Karin Åberg.
Piia Pilv has been appointed by the Remuneration Committee as an independent expert advisor to assist the Committee, particularly regarding international trends and developments.
Work of the Remuneration Committee in 2012
The Remuneration Committee held six meetings in 2012. Directors’ attendance is reflected in the table on page 195.
The Committee reviewed and prepared a proposal for the LTV 2012 for resolution by the Board. This was approved by the AGM 2012. The Committee further resolved on salaries and Short-Term Variable remuneration (STV) for 2012 for CEO direct reports. It prepared remuneration to the President and CEO, for resolution by the Board. The Committee also prepared guidelines for remuneration to the ELT, which were subsequently referred by the Board to the AGM for approval.
Towards the end of the year, the Committee concluded its analysis of the current LTV structure and executive remuneration. The resulting proposals on LTV and guidelines for remuneration to the ELT will be referred to the AGM 2013 for resolution.
For further information on fixed and variable remuneration, please see Notes to the consolidated financial statements—Note C28 “Information regarding members of the Board of Directors, the Group management and employees” and the “Remuneration Report” included in the Annual Report.
ERICSSON ANNUAL REPORT ON FORM 20-F 2012
Directors’ attendance and fees 2012
| | | | | | | | | | | | | | | | | | | | | | | | |
| | | Fees resolved by the
AGM 2012 | | | Number of Board/Committee
meetings attended | |
Board member | | Board
fees1) | | | Committee
fees | | | Board | | | Audit
Committee | | | Finance
Committee | | | Remuneration
Committee | |
Leif Johansson | | | 3,750,000 | | | | 400,000 | | | | 12 | | | | | | | | 7 | | | | 6 | |
Sverker Martin-Löf | | | 875,000 | | | | 250,000 | | | | 12 | | | | 6 | | | | | | | | | |
Jacob Wallenberg | | | 875,000 | | | | 175,000 | | | | 12 | | | | | | | | 5 | | | | | |
Roxanne S. Austin | | | 875,000 | | | | 250,000 | | | | 11 | | | | 6 | | | | | | | | | |
Sir Peter L. Bonfield | | | 875,000 | | | | 250,000 | | | | 12 | | | | 6 | | | | | | | | | |
Börje Ekholm | | | 875,000 | | | | 175,000 | | | | 12 | | | | | | | | | | | | 6 | |
Alexander Izosimov2) | | | 875,000 | | | | | | | | 8 | | | | | | | | | | | | | |
Ulf J. Johansson | | | 875,000 | | | | 350,000 | | | | 12 | | | | 6 | | | | | | | | | |
Nancy McKinstry | | | 875,000 | | | | 175,000 | | | | 11 | | | | | | | | | | | | 6 | |
Anders Nyrén | | | 875,000 | | | | 175,000 | | | | 12 | | | | | | | | 7 | | | | | |
Carl-Henric Svanberg3) | | | — | | | | | | | | 4 | | | | | | | | | | | | | |
Hans Vestberg | | | — | | | | | | | | 12 | | | | | | | | | | | | | |
Michelangelo Volpi | | | 875,000 | | | | | | | | 10 | | | | | | | | | | | | | |
Pehr Claesson | | | 18,000 | 7) | | | | | | | 12 | | | | | | | | 7 | | | | | |
Jan Hedlund4) | | | 6,000 | 7) | | | | | | | 4 | | | | 3 | | | | | | | | | |
Karin Åberg | | | 18,000 | 7) | | | | | | | 12 | | | | | | | | | | | | 6 | |
Kristina Davidsson5) | | | 18,000 | 7) | | | | | | | 12 | | | | 3 | | | | | | | | | |
Rickard Fredriksson6) | | | 10,500 | 7) | | | | | | | 7 | | | | | | | | | | | | | |
Karin Lennartsson | | | 18,000 | 7) | | | | | | | 12 | | | | | | | | | | | | | |
Roger Svensson | | | 18,000 | 7) | | | | | | | 12 | | | | | | | | | | | | | |
| | | | | | | | | | | | | | | | | | | | | | | | |
Total number of meetings | | | | | | | | | | | 12 | | | | 6 | | | | 7 | | | | 6 | |
| | | | | | | | | | | | | | | | | | | | | | | | |
| 1) | Non-employed Directors can choose to receive part of their Board fee (exclusive of Committee fees) in the form of synthetic shares. |
| 2) | Elected Board member as of May 3, 2012. |
| 3) | Resigned as Board member as of May 3, 2012. |
| 4) | Resigned as employee representative and from the Audit Committee as of May 3, 2012. |
| 5) | Member of the Audit Committee since May 3, 2012. |
| 6) | Appointed deputy employee representative as of May 3, 2012. |
| 7) | Employee representative Board members and their deputies are not entitled to a Board fee but compensation in the amount of SEK 1,500 per attended Board meeting. |
REMUNERATION TO BOARD MEMBERS
Remuneration to Board members not employed by the Company is proposed by the Nomination Committee for resolution by the AGM.
The AGM 2012 approved the Nomination Committee’s proposal for fees to the non-employed Board members for Board and Committee work. For information on Board of Directors’ fees 2012, please refer to Notes to the consolidated financial statements—Note C28 “Information regarding members of the Board of Directors, the Group management and employees” in the Annual Report. The AGM 2012 also approved the Nomination Committee’s proposal that Board members may be paid part of their Board fee in the form of synthetic shares.
A synthetic share gives the right to receive a future cash payment of an amount which corresponds to the market value of a Class B share in Ericsson at the time of payment. The director’s right to receive payment with regard to allocated synthetic shares occurs, as a main rule, after the publication of the Company’s year-end
ERICSSON ANNUAL REPORT ON FORM 20-F 2012
financial statement during the fifth year following the General Meeting which resolved on the allocation of the synthetic shares. The purpose of paying part of the Board of Directors’ fee in the form of synthetic shares is to further align the Directors’ interest with shareholder interest. For more information on the terms and conditions of the synthetic shares, please refer to the notice convening the AGM 2012 and to the minutes from the AGM 2012, which are available at Ericsson’s website.
MEMBERS OF THE BOARD OF DIRECTORS
Board members elected by the AGM 2012
Leif Johansson(first elected 2011)
Chairman of the Board of Directors, Chairman of the Remuneration Committee and of the Finance Committee
Born 1951. Master of Science in Engineering, Chalmers University of Technology, Gothenburg, Sweden.
Board Chairman: Astra Zeneca PLC, European Round Table of Industrialists and the International Advisory Board of the Nobel Foundation.
Board Member: Svenska Cellulosa Aktiebolaget SCA and Ecolean AB.
Holdings in Ericsson1): 17,933 Class B shares. Principal work experience and other information: President of the Royal Swedish Academy of Engineering Sciences. President and CEO of AB Volvo 1997-2011. Executive Vice President of AB Electrolux 1988-1991, President 1991-1994 and President and CEO of AB Electrolux 1994-1997. Holds honorary Doctorates at Blekinge Institute of Technology, the University of Gothenburg and Chalmers University of Technology. Awarded the Large Gold Medal of the Royal Swedish Academy of Engineering Sciences in 2011.
Sverker Martin-Löf(first elected 1993)
Deputy Chairman of the Board of Directors, Member of the Audit Committee
Born 1943. Doctor of Technology and Master of Engineering, KTH Royal Institute of Technology, Stockholm, Sweden.
Board Chairman: Svenska Cellulosa Aktiebolaget SCA, SSAB and AB Industrivärden.
Board Member: Skanska AB and Svenska Handelsbanken AB.
Holdings in Ericsson1): 10,400 Class B shares.
Principal work experience and other information: President and CEO of Svenska Cellulosa Aktiebolaget SCA 1990–2002, where he was employed 1977–1983 and 1986–2002. Previous positions at Sunds Defibrator and Mo och Domsjö AB.
Jacob Wallenberg(first elected 2011)
Deputy Chairman of the Board of Directors, Member of the Finance Committee
Born 1956. Bachelor of Science in Economics and Master of Business Administration, Wharton School, University of Pennsylvania, USA. Officer of the Reserve, Swedish Navy.
Board Chairman:Investor AB.
Deputy Board Chairman: SAS AB and SEB Skandinaviska Enskilda Banken AB (SEB).
| 1) | The number of shares reflects ownership as of December 31, 2012 and includes holdings by related natural and legal persons, as well as holdings of any ADS, if applicable. |
ERICSSON ANNUAL REPORT ON FORM 20-F 2012
Board member:ABB Ltd, The Coca-Cola Company, The Knut and Alice Wallenberg Foundation and Stockholm School of Economics.
Holdings in Ericsson1): 2,413 Class B shares.
Principal work experience and other information: Chairman of the Board of Investor AB since 2005. Extensive experience in banking and finance, including experience from the commercial banks JP Morgan, New York and SEB. Appointed President and CEO of SEB in 1997 and appointed Chairman of SEB’s Board of Directors in 1998. Executive Vice President and CFO of Investor AB 1990-1993. Honorary Chairman of IBLAC (Mayor of Shanghai’s International Business Leaders Advisory Council) and member of The European Round Table of Industrialists.
Roxanne S. Austin(first elected 2008)
Member of the Audit Committee
Born 1961. Bachelor of Business Administration in Accounting, University of Texas, San Antonio, USA.
Board Member: Abbott Laboratories, Teledyne Technologies Inc. and Target Corporation.
Holdings in Ericsson1): 3,000 Class B shares.
Principal work experience and other information: President of Austin Investment Advisors since 2004. President and CEO of Move Networks Inc. 2009–2010. President and COO of DirecTV 2001–2003. Corporate Senior Vice President and CFO of Hughes Electronics Corporation 1997–2000, which she joined in 1993. Previously a partner at Deloitte & Touche. Member of the California State Society of Certified Public Accountants and the American Institute of Certified Public Accountants.
Sir Peter L. Bonfield(first elected 2002)
Member of the Audit Committee
Born 1944. Honors degree in Engineering, Loughborough University, Leicestershire, UK.
Board Chairman: NXP Semiconductors N.V.
Board Member: Mentor Graphics Inc., Sony Corporation and Taiwan Semiconductor Manufacturing Company, Ltd.
Holdings in Ericsson1): 4,400 Class B shares.
Principal work experience and other information: CEO and Chairman of the Executive Committee of British Telecommunications plc 1996–2002. Chairman and CEO of ICL plc 1985–1996. Positions with STC plc and Texas Instruments Inc. Member of the Advisory Boards of New Venture Partners LLP, the Longreach Group and Apax Partners LLP. Board Mentor of CMi. Senior Advisor, Rothschild, London.
Chair of Council and Senior Pro-Chancellor, Loughborough University, UK. Fellow of the Royal Academy of Engineering.
Börje Ekholm(first elected 2006)
Member of the Remuneration Committee
Born 1963. Master of Science in Electrical Engineering, KTH Royal Institute of Technology, Stockholm, Sweden. Master of Business Administration, INSEAD, France.
| 1) | The number of shares reflects ownership as of December 31, 2012 and includes holdings by related natural and legal persons, as well as holdings of any ADS, if applicable. |
ERICSSON ANNUAL REPORT ON FORM 20-F 2012
Board Chairman: KTH Royal Institute of Technology, Stockholm and Nasdaq OMX Group Inc.
Board Member: Investor AB, AB Chalmersinvest, EQT Partners AB and Husqvarna AB.
Holdings in Ericsson1): 30,760 Class B shares.
Principal work experience and other information: President and CEO of Investor AB since 2005. Formerly Head of Investor Growth Capital Inc. and New Investments. Previous positions at Novare Kapital AB and McKinsey & Co Inc.
Alexander Izosimov(first elected 2012)
Born 1964. Master of Business Administration, INSEAD, France and Master of Science in Production Management Systems and Computer Science, Moscow Aviation Institute, Russian Federation.
Board Member: East Capital AB, Modern Times Group MTG AB, EVRAZ Group S.A., Dynasty Foundation, Transcom WorldWide SA and International Chamber of Commerce (ICC).
Holdings in Ericsson1): 1,600 Class B shares.
Principal work experience and other information: CEO and President of VimpelCom 2003-2011. Previous positions with Mars Inc., including Member of the Global Executive Board and Regional President for CIS, Central Europe and Nordics. Earlier positions with McKinsey & Co as consultant in the Stockholm and London offices. Served as GSMA Board member 2005-2008 and Chairman of GSMA 2008-2010.
Ulf J. Johansson(first elected 2005)
Chairman of the Audit Committee
Born 1945. Doctor of Technology and Master of Science in Electrical Engineering, KTH Royal Institute of Technology, Stockholm, Sweden.
Board Chairman: Acando AB, Eurostep Group AB, Novo A/S, Novo Nordisk Foundation and Trimble Navigation Ltd.
Board Member: European Institute of Innovation and Technology.
Holdings in Ericsson1): 6,435 Class B shares.
Principal work experience and other information: Founder of Europolitan Vodafone AB, where he was the Chairman of the Board 1990–2005. Previous positions at Spectra-Physics AB as President and CEO and at Ericsson Radio Systems AB. Member of the Royal Academy of Engineering Sciences.
Nancy McKinstry(first elected 2004)
Member of the Remuneration Committee
Born 1959. Master of Business Administration in Finance and Marketing, Columbia University, USA. Bachelor of Arts in Economics, University of Rhode Island, USA.
Board Chairman: CEO and Chairman of the Executive Board of Wolters Kluwer n.v.
Board Member: Abbott Laboratories and Sanoma Corporation.
| 1) | The number of shares reflects ownership as of December 31, 2012 and includes holdings by related natural and legal persons, as well as holdings of any ADS, if applicable. |
ERICSSON ANNUAL REPORT ON FORM 20-F 2012
Holdings in Ericsson1): 4,000 Class B shares.
Principal work experience and other information: CEO and Chairman of the Executive Board of Wolters Kluwer n.v. President and CEO of CCH Legal Information Services 1996–1999. Previous positions at Booz, Allen & Hamilton and New England Telephone Company. Member of the Advisory Board of the University of Rhode Island, the Advisory Council of the Amsterdam Institute of Finance, the Board of Overseers of Columbia Business School and the Advisory Board of the Harrington School of Communication and Media.
Anders Nyrén(first elected 2006)
Member of the Finance Committee
Born 1954. Graduate of Stockholm School of Economics, Sweden, Master of Business Administration from Anderson School of Management, UCLA, USA.
Board Chairman: Sandvik AB.
Deputy Board Chairman: Svenska Handelsbanken AB.
Board Member: Svenska Cellulosa Aktiebolaget SCA, AB Industrivärden, SSAB, AB Volvo, Ernströmgruppen and Stockholm School of Economics.
Holdings in Ericsson1): 6,686 Class B shares.
Principal work experience and other information: President and CEO of Industrivärden since 2001. CFO and Executive Vice President of Skanska AB 1997–2001. Director Capital Markets of Nordbanken 1996–1997. CFO and EVP of Securum AB 1992–1996. Managing Director of OM International AB 1987–1992. Earlier positions at STC Scandinavian Trading Co AB and AB Wilhelm Becker.
Hans Vestberg(first elected 2010)
Born 1965. Bachelor of Business Administration and Economics, University of Uppsala, Sweden.
Board Chairman: ST-Ericsson and Svenska Handbollförbundet.
Board Member: Thernlunds AB.
Holdings in Ericsson1): 149,382 Class B shares.
Principal work experience and other information: President and CEO of Telefonaktiebolaget LM Ericsson since January 1, 2010. Previously, First Executive Vice President, CFO and Head of Group Function Finance and Executive Vice President and Head of Business Unit Global Services. Various positions in the Group since 1988, including Vice President and Head of Market Unit Mexico and Head of Finance and Control in USA, Brazil and Chile. International advisor to the Governor of Guangdong, China and co-chairman of the Russian-Swedish Business Council. Founding member of the Broadband Commission for Digital Development, and heading the Commission’s climate change working group. Member of the European Cloud Partnership Steering Board and the Leadership Council of the United Nations Sustainable Development Solutions Network.
| 1) | The number of shares reflects ownership as of December 31, 2012 and includes holdings by related natural and legal persons, as well as holdings of any ADS, if applicable. |
ERICSSON ANNUAL REPORT ON FORM 20-F 2012
Michelangelo Volpi(first elected 2010)
Born 1966. Bachelor of Science in Mechanical Engineering and Masters in Manufacturing Systems Engineering from Stanford University, USA. MBA from the Stanford Graduate School of Business, USA.
Board Member: EXOR S.p.A.
Holdings in Ericsson1): None.
Principal work experience and other information: Partner at Index Ventures since July 2009. Previously CEO of Joost Inc. Various positions in Cisco from 1994-2007, including Senior Vice President and General Manager of the Routing and Service Provider Technology Group and Chief Strategy Officer. Has also worked for Hewlett Packard in the optoelectronics division.
Board members and deputies appointed by the unions
Pehr Claesson(first appointed 2008)
Employee representative, Member of the Finance Committee
Born 1966. Appointed by the union The Swedish Association of Graduate Engineers.
Holdings in Ericsson1): 999 Class B shares. Employed since 1997. Working with marketing and communication for Consulting and Systems Integration within Business Unit Global Services.
Kristina Davidsson(first appointed 2006)
Employee representative, Member of the Audit Committee
Born 1955. Appointed by the union IF Metall.
Holdings in Ericsson1): 1,629 Class B shares. Employed since 1995. Previously working as repairer within Business Unit Networks and currently working full time as union representative.
Karin Åberg(first appointed 2007)
Employee representative, Member of the Remuneration Committee
Born 1959. Appointed by the union Unionen.
Holdings in Ericsson1): 2,751 Class B shares. Employed since 1995. Working as a Service Engineer within the IT organization.
Rickard Fredriksson(first appointed 2012)
Deputy employee representative
Born 1969. Appointed by the union IF Metall.
Holdings in Ericsson1): 799 Class B shares.
Employed since 2000. Previously working as machine operator within Business Unit Networks and currently working full time as union representative.
| 1) | The number of shares reflects ownership as of December 31, 2012 and includes holdings by related natural and legal persons, as well as holdings of any ADS, if applicable. |
ERICSSON ANNUAL REPORT ON FORM 20-F 2012
Karin Lennartsson(first appointed 2010)
Deputy employee representative
Born 1957. Appointed by the union Unionen.
Holdings in Ericsson1): 493 Class B shares.
Employed since 1976. Working as Process Expert within Group Function Finance—Process Management.
Roger Svensson(first appointed 2011)
Deputy employee representative
Born 1971. Appointed by the union The Swedish Association of Graduate Engineers.
Holdings in Ericsson1): 7,710 Class B shares.
Employed since 1999. Working as Senior Specialist Test Strategy Power Amplifier within Business Unit Networks.
Hans Vestberg was the only Director who held an operational management position at Ericsson in 2012. No Director has been elected pursuant to an arrangement or understanding with any major shareholder, customer, supplier or other person.
At the Annual General Meeting 2012, Alexander Izosimov was elected new member of the Board of Directors, replacing Carl-Henric Svanberg. Jan Hedlund resigned as employee representative of the Board of Directors as of the date of the Annual General Meeting 2012 and Kristina Davidsson (previously deputy employee representative) was appointed employee representative as of the same date. Rickard Fredriksson was appointed new deputy employee representative as of the date of the Annual General Meeting 2012.
MANAGEMENT
The President/CEO and the Executive Leadership Team
The Board of Directors appoints the President and CEO and the Executive Vice Presidents. The President and CEO is responsible for the management of day-to-day operations and is supported by the Executive Leadership Team (the “ELT”). During 2012, the ELT consisted of the President and CEO, the heads of Group functions, the heads of business units and the heads of two of Ericsson’s regions. The role of the ELT is to:
Establish a strong corporate culture, a long-term vision and Group strategies and policies, all based on objectives stated by the Board
Determine targets for operational units, allocate resources and monitor unit performance
Secure operational excellence and realize global synergies through efficient organization of the Group.
Remuneration to the Executive Leadership Team
Guidelines for remuneration to the ELT were approved by the AGM 2012. For further information on fixed and variable remuneration, see the Remuneration report and Notes to the consolidated financial statements—Note C28, “Information regarding members of the Board of Directors, the Group management and employees” in the Annual Report.
| 1) | The number of shares reflects ownership as of December 31, 2012 and includes holdings by related natural and legal persons, as well as holdings of any ADS, if applicable. |
ERICSSON ANNUAL REPORT ON FORM 20-F 2012
The Ericsson Group Management System
Ericsson has a global management system, the Ericsson Group Management System (EGMS) to drive corporate culture and to ensure that the business is managed:
To fulfill the objectives of Ericsson’s major stakeholders (customers, shareholders, employees)
Within established risk limits and with reliable internal control
In compliance with relevant applicable laws, listing requirements, governance codes and corporate social responsibilities.
The EGMS is founded on ISO 9001 (International Standard for Quality management system) but is designed as a dynamic governance system, enabling Ericsson to adapt the system to evolving demands and expectations, including new legislation as well as customers’ and other stakeholders’ requirements. The management system is an important foundation and is continuously evaluated and improved.
Certificates are evidence from an independent body verifying that the operations fulfill defined requirements. As the EGMS is a global system, group-wide certificates can be issued by a third party certification body proving that the system is efficient throughout the whole organization. Ericsson is currently globally certified to ISO 9001 (Quality), ISO 14001 (Environment) and OHSAS 18001 (Health & Safety). Selected Ericsson units are also certified to additional standards, for example ISO 27001 (Information Security) and TL 9000 (telecom-specific standard).
The EGMS comprises three elements:
Ericsson business processes
Organization and resources.
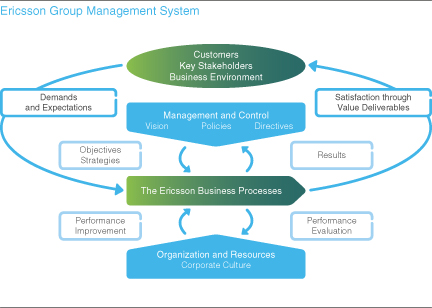
ERICSSON ANNUAL REPORT ON FORM 20-F 2012
Management and control
Ericsson’s strategy and target setting processes consider the demands and expectations of customers as well as other key stakeholders. The process facilitates the alignment of objectives and their measurement in activities at all levels of the organization.
Ericsson uses balanced scorecards as tools for translating strategic objectives into a set of performance indicators for its operational units. Based on annual strategy work, these scorecards are updated with targets for each unit for the next year and are communicated throughout the organization.
Group-wide policies and directives govern how the organization works and are core elements in managing and controlling Ericsson. The Group Policies and Directives include a Code of Business Ethics, a Code of Conduct and accounting and reporting directives to fulfill external reporting requirements and the Sarbanes-Oxley Act.
The Group Steering Documents Committee works to ensure that the policies and directives cover relevant issues; that they are aligned and consistent with Group strategies, values and structures; and that they are not in conflict with legal and regulatory requirements. In addition, the Group Steering Documents Committee works to ensure that the said strategies, values and structures are implemented by the responsible function.
Ericsson business processes
As a market leader, Ericsson utilizes the competitive advantages that are gained through global scale and has implemented common processes and IT tools across all operational units worldwide. Customer requirements are identified, clarified and formalized in Ericsson Business Processes where requirements transform from theory to reality. Through management and continuous improvement of processes and IT tools, Ericsson attempts to reduce costs with efficient and effective process flows and with standardized internal controls and performance indicators.
Organization and resources
Ericsson is operated in two dimensions: one operational structure and one legal structure.
The operational structure aligns accountability and authority regardless of country borders and supports the process flow with cross-country operations. During 2012 there were four business units and ten regions. Group functions coordinate Ericsson’s strategies, operations and resource allocation and define the necessary directives, processes and organization for the effective governance of the Group.
The legal structure is the basis for legal requirements and responsibility as well as for tax and statutory reporting purposes. There are more than 200 legal entities within the Ericsson Group with representation (via legal entities, branch and representative offices) in more than 140 countries.
Risk management
Ericsson’s risk management is integrated with the business and its operational processes, and is a part of the EGMS to ensure accountability, effectiveness, efficiency, business continuity and compliance with corporate governance, legal and other requirements. The Board of Directors is also actively engaged in the Company’s risk management. Risks related to set long-term objectives are discussed and strategies are formally approved by the Board as part of the annual strategy process. Risks related to annual targets for the Company are also reviewed by the Board and then monitored continuously during the year. Certain transactional risks require specific Board approval, e.g. acquisitions, management remuneration, borrowing or customer finance in excess of pre-defined limits.
ERICSSON ANNUAL REPORT ON FORM 20-F 2012
Strategic and tactical risks
Strategic risks constitute the highest risk to the Company if not managed properly as they could have a long-term impact. Ericsson therefore reviews its long-term objectives, main strategies and business scope on an annual basis and continuously works on its tactics to reach these objectives and to mitigate any risks identified.
In the annual strategy and target setting process, objectives are set for the next three to five years. Risks and opportunities are assessed and strategies are developed to achieve the objectives. The strategy process in the Company is well established and involves regions, business units and Group functions. The strategy is finally summarized and discussed in a yearly Global Leadership Summit with approximately 250 leaders from all parts of the business. By involving all parts of the business in the process, potential risks are identified early and mitigating actions can be incorporated in the strategy and in the annual target process following the finalization of the strategy.
Technology development, industry and market fundamentals and the development of the economy are key components in the evaluation of risks related to Ericsson’s long-term objectives.
The outcome from the strategy process forms the basis for the annual target process, which involves regions, business units and Group functions. Risks and opportunities linked to the targets are identified as part of this process together with actions to mitigate the identified risks. Follow-up of targets, risks and mitigating actions are reported and discussed continuously in business unit and region steering groups and are reviewed by the Board of Directors.
Ericsson continuously strives to improve its risk management and believes that it is important that the entire global organization takes part in the risk management and strategy work. Therefore, risk management was given a stronger focus in 2012. During the year, an enhanced risk management framework was implemented and aligned with the Strategy and Target setting process. Risks were identified and analyzed in four categories: industry & market risks, commercial risks, operational risks and compliance risks. For more information on risks related to Ericsson’s business, see the chapter “Risk factors” in the Annual Report.
Strategic, target setting and risk management cycle
The annual strategic, target setting and risk management cycle is part of Ericsson’s strategy process, which is well established within the Group and involves regions, business units and Group functions.
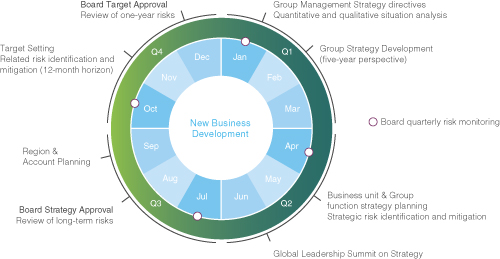
ERICSSON ANNUAL REPORT ON FORM 20-F 2012
Operational and financial risks
Operational risks are owned and managed by operational units. Risk management is embedded in various process controls, such as decision tollgates and approvals. Certain cross-process risks are centrally coordinated, such as information security, IT security, corporate responsibility and business continuity and insurable risks. Financial risk management is governed by a Group policy and carried out by the Treasury and Customer Finance functions, both supervised by the Finance Committee. The policy governs risk exposures related to foreign exchange, liquidity/financing, interest rates, credit risk and market price risk in equity instruments. For further information on financial risk management, see Notes to the consolidated financial statements—Note C14, “Trade receivables and customer finance”, Note C19, “Interest-bearing liabilities” and Note C20, “Financial risk management and financial instruments” in the Annual Report.
Compliance risks
Ericsson has implemented Group policies and directives in order to comply with applicable laws and regulations, including a Code of Business Ethics and a Code of Conduct. Risk management is integrated in the Company’s business processes. Policies and controls are implemented to comply with financial reporting standards and stock market regulations, such as the US Sarbanes-Oxley Act.
Compliance officer
Ericsson has a Chief Compliance Officer (CCO) whose responsibilities include providing support for compliance with laws, regulations, internal policies and directives, coordinating the different strands of expertise within Ericsson. Attention from senior-management level on compliance matters is crucial, as is ensuring that this is addressed from a cross-functional perspective. Initially, the CCO’s primary focus has been to further develop Ericsson’s Anti-corruption Compliance Program. This is reviewed and evaluated by the Audit Committee at least annually.
Monitoring and audits
Company management monitors compliance with policies, directives and processes through internal self-assessment within all units. This is complemented by internal and external audits. External financial audits are performed by PricewaterhouseCoopers, and ISO/ management system audits by Intertek. Internal audits are performed by the company’s internal audit function which reports to the Audit Committee. Audits of suppliers are also conducted in order to secure compliance with Ericsson’s Code of Conduct, which is mandatory for suppliers to the Ericsson Group.
Risk mitigation
Significant ongoing activities in order to mitigate risks include:
Establishing flexibility to cost-effectively accommodate to fluctuations in customer demand
Conducting regular Supplier Code of Conduct audits
Continuous assessment and management of CR risks
Conducting business continuity management in an efficient way
Conducting corporate governance training as needed
Continuous monitoring of information systems to guard against data breaches
Reviewing top risks and mitigating actions at various internal governance meetings.
ERICSSON ANNUAL REPORT ON FORM 20-F 2012
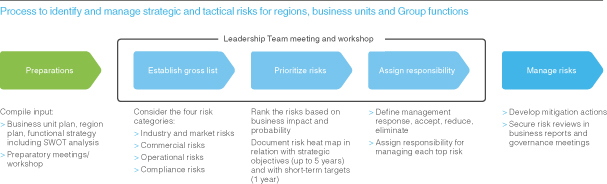
Example of risk heat map document
Risk heat maps are generated by business units, regions and Group functions in four risk categories:

MEMBERS OF THE EXECUTIVE LEADERSHIP TEAM
Hans Vestberg
President and CEO (since 2010)
Born 1965.
Bachelor of Business Administration and Economics, University of Uppsala, Sweden.
Board Chairman: ST-Ericsson and Svenska Handbollförbundet.
ERICSSON ANNUAL REPORT ON FORM 20-F 2012
Board member: Telefonaktiebolaget LM Ericsson and Thernlunds AB.
Holdings in Ericsson1): 149,382 Class B shares.
Background: Previously First Executive Vice President, CFO and Head of Group Function Finance and Executive Vice President and Head of Business Unit Global Services. Various positions in the Group since 1988, including Vice President and Head of Market Unit Mexico and Head of Finance and Control in USA, Brazil and Chile. International advisor to the Governor of Guangdong, China and co-chairman of the Russian-Swedish Business Council. Founding member of the Broadband Commission for Digital Development, and heading the Commission’s broadband and climate change working group. Member of the European Cloud Partnership Steering Board and the Leadership Council of the United Nations Sustainable Development Solutions Network.
Jan Frykhammar
Executive Vice President and Chief Financial Officer and Head of Group Function Finance (since 2009)
Born 1965.
Bachelor of Business Administration and Economics, University of Uppsala, Sweden.
Board member: ST-Ericsson and the Swedish International Chamber of Commerce.
Holdings in Ericsson1): 14,844 Class B shares.
Background: Previously Senior Vice President and Head of Business Unit Global Services. Various positions within Ericsson including Sales and Business Control in Business Unit Global Services, CFO in North America and Vice President, Finance and Commercial within the Global Customer Account Vodafone.
Magnus Mandersson
Executive Vice President (since 2011) and Head of Business Unit Global Services (since 2010)
Born 1959.
Bachelor of Business Administration, University of Lund, Sweden.
Board member: None.
Holdings in Ericsson1): 22,602 Class B shares.
Background: Previously Head of Business Unit CDMA, Market Unit Northern Europe, Global Customer Account Deutsche Telekom AG and Product Area Managed Services. Has also been President and CEO of SEC/ Tele2 Europe and COO of Millicom International Cellular S.A.
Johan Wibergh
Executive Vice President (since 2010) and Head of Business Unit Networks (since 2008)
Born 1963.
Master of Computer Science, Linköping Institute of Technology, Sweden.
| 1) | The number of shares reflects ownership as of December 31, 2012 and includes holdings by related natural and legal persons, as well as holdings of any ADS, if applicable. |
ERICSSON ANNUAL REPORT ON FORM 20-F 2012
Board member: ST-Ericsson, Confederation of Swedish Enterprise, KTH Royal Institute of Technology and Teknikföretagen.
Holdings in Ericsson1): 40,448 Class B shares.
Background: President of Ericsson Brazil, President of Market Unit Nordic and Baltics and Vice President and Head of Sales at Business Unit Global Services.
Per Borgklint
Senior Vice President and Head of Business Unit Support Solutions (since 2011)
Born 1972.
Master of Science in Business Administration, Jönköping International Business School, Sweden.
Board member:None.
Holdings in Ericsson1): None.
Background: Previously CEO of Net1 (Ice.net), Canal Plus Nordic and Versatel. Has also held several leading positions at Tele2.
Bina Chaurasia
Senior Vice President, Chief Human Resources Officer and Head of Group Function Human Resources and Organization (since 2010)
Born 1962.
Master of Science in Management and Human Resources, Ohio State University, USA, and Master of Arts in Philosophy, University of Wisconsin, USA.
Holdings in Ericsson1): 19,144 Class B shares.
Background: Joined Ericsson from Hewlett Packard, where she was Vice President of Global Talent Management. Has held senior HR leadership roles at Gap, Sun Microsystems and PepsiCo/Yum.
Ulf Ewaldsson
Senior Vice President, Chief Technology Officer and Head of Group Function Technology(since February 1, 2012)
Born 1965.
Master of Science in Engineering and Business Management, Linköping Institute of Technology, Sweden.
Board member: None.
| 1) | The number of shares reflects ownership as of December 31, 2012 and includes holdings by related natural and legal persons, as well as holdings of any ADS, if applicable. |
ERICSSON ANNUAL REPORT ON FORM 20-F 2012
Holdings in Ericsson1): 14,985 Class B shares. Background: Previously Head of Product Area Radio within Business Unit Networks. Has held various managerial positions within Ericsson since 1990.
Douglas L. Gilstrap
Senior Vice President and Head of Group Function Strategy(since 2009)
Born 1963.
Bachelor of Science in Accounting, University of Richmond, USA, and Master of Business Administration, Emory University, Atlanta, USA. Executive program at INSEAD, France.
Board member: Telecom Management Forum (TMF). Deputy board member: ST-Ericsson.
Holdings in Ericsson1): 8,643 Class B shares. Background: Has held various global managerial positions within the telecommunications sector for more than 15 years.
Nina Macpherson
Senior Vice President, General Counsel, Head of Group Function Legal Affairs and secretary to the Board of Directors(since 2011)
Born 1958.
Master of Laws, LL M, University of Stockholm, Sweden.
Board member: The Association for Swedish Listed Companies.
Holdings in Ericsson1): 7,857 Class B shares.
Background: Previously Vice President and Deputy Head of Group Function Legal Affairs at Ericsson. Previous positions also include private practice and in-house attorney. Member of the Swedish Securities Council.
Helena Norrman
Senior Vice President and Head of Group Function Communications(since 2011)
Born 1970.
Master of International Business Administration, Linköping University, Sweden.
Board member: None.
Holdings in Ericsson1): 8,312 Class B shares.
Background: Previously Vice President, Communications Operations at Group Function Communications at Ericsson. Has held various positions within Ericsson’s global communications organization since 1998. Previous positions as communications consultant.
Mats H. Olsson
Head of Region North East Asia(since 2010)
Born 1954.
| 1) | The number of shares reflects ownership as of December 31, 2012 and includes holdings by related natural and legal persons, as well as holdings of any ADS, if applicable. |
ERICSSON ANNUAL REPORT ON FORM 20-F 2012
Master of Business Administration, Stockholm School of Economics, Sweden.
Board member: None.
Holdings in Ericsson1): 61,252 Class B shares.
Background: International economic advisor to a number of Chinese provincial and municipal governments. Previously Head of Market Unit Greater China. Appointed President of Ericsson Greater China in 2004, with overall responsibility for mainland China, Hong Kong, Macao and Taiwan. Also assumed overall responsibility for Japan and South Korea in 2010. Has held various executive positions across Asia-Pacific over the last 25 years.
Rima Qureshi
Senior Vice President and Head of Business Unit CDMA Mobile Systems(since 2010)
Born 1965.
Bachelor of Information Systems and Master of Business Administration, McGill University, Montreal, Canada.
Board member: MasterCard Incorporated.
Holdings in Ericsson1): 4,932 Class B shares.
Background: Also serves as Head of Ericsson Response. Previously Vice President of Strategic Improvement Program and Vice President Product Area Customer Support. Has held various positions within Ericsson since 1993.
Angel Ruiz
Head of Region North America(since 2010)
Born 1956.
Bachelor of Electrical Engineering, University of Central Florida, USA, and Master of Management Science and Information Systems, Johns Hopkins University, USA.
Board member: CTIA.
Holdings in Ericsson1): 38,546 Class B shares. Background: Joined Ericsson in 1990 and has held a variety of technical, sales and managerial positions within the Company, including heading up the global account teams for Cingular/SBC/BellSouth (now AT&T). Was appointed President of Ericsson North America in 2001.
Jan Wäreby
Senior Vice President and Head of Sales and Marketing(since 2011)
Born 1956.
Master of Science, Chalmers University, Gothenburg, Sweden.
Board member: ST-Ericsson.
| 1) | The number of shares reflects ownership as of December 31, 2012 and includes holdings by related natural and legal persons, as well as holdings of any ADS, if applicable. |
ERICSSON ANNUAL REPORT ON FORM 20-F 2012
Holdings in Ericsson1): 66,495 Class B shares. Background: Senior Vice President and Head of Business Unit Multimedia and Executive Vice President and Head of Sales and Marketing for Sony Ericsson Mobile Communications.
Up until January 31, 2012, Håkan Eriksson, former Senior Vice President, Chief Technology Officer and Head of Group Function Technology & Portfolio Management, was a member of the Executive Leadership Team.
AUDITOR
According to the Articles of Association, the Parent Company shall have no less than one and no more than three registered public accounting firms as external independent auditor. Pursuant to the Swedish Companies Act, the mandate period of an auditor shall be one year, unless the Articles of Association provide for a longer mandate period up to four years. The auditor reports to the shareholders at General Meetings.
The duties of the auditor include the following:
Updating the Board of Directors regarding the planning, scope and content of the annual audit
Examining the interim and year-end financial statements to assess accuracy and completeness of the accounts and adherence to accounting standards and policies
Advising the Board of Directors of non-audit services performed, the consideration paid and other issues that determine the auditor’s independence.
For further information on the contacts between the Board and the auditor, please see “Work of the Board of Directors” earlier in this Corporate Governance Report.
All Ericsson’s quarterly financial reports are reviewed by the auditor.
Current auditor
PricewaterhouseCoopers AB was elected auditor at the AGM 2012 for a period of one year, i.e. until the close of the AGM 2013.
PricewaterhouseCoopers AB has appointed Peter Nyllinge, Authorized Public Accountant, to serve as auditor in charge.
Fees to the auditor
Ericsson paid the fees (including expenses) for audit-related and other services listed in the table in Notes to the consolidated financial statements—Note C30, “Fees to auditors” in the Annual Report.
INTERNAL CONTROL OVER FINANCIAL REPORTING 2012
This section has been prepared in accordance with the Annual Accounts Act and the Swedish Corporate Governance Code and is limited to internal control over financial reporting.
Since Ericsson is listed in the United States, the requirements outlined in the Sarbanes-Oxley Act (SOX) apply. These regulate the establishment and maintenance of internal controls over financial reporting as well as management’s assessment of the effectiveness of the controls.
In order to support high quality reporting and to meet the requirement of SOX, the Company has implemented detailed documented controls and testing and reporting procedures based on the internationally established COSO framework for internal control. The COSO framework is issued by the Committee of Sponsoring Organizations of the Treadway Commission (COSO).
ERICSSON ANNUAL REPORT ON FORM 20-F 2012
Management’s internal control report according to SOX is included in this Annual Report on Form 20-F and filed with the SEC in the United States.
During 2012, the Company has included operations of acquired entities as well as continued to improve the design and execution of its financial reporting controls.
Disclosure policies
Ericsson’s financial disclosure policies aim to ensure transparent, relevant and consistent communication with equity and debt investors on a fair and equal basis. This will support a fair market value for Ericsson securities. Ericsson wants current and potential investors to have a good understanding of how the Company works, including operational performance, prospects and potential risks.
To achieve these objectives, financial reporting and disclosure must be:
Transparent—enhancing understanding of the economic drivers and operational performance of the business, building trust and credibility
Consistent—comparable in scope and level of detail to facilitate comparison between reporting periods
Simple—to support understanding of business operations and performance and to avoid misinterpretations
Relevant—with focus on what is relevant to Ericsson’s stakeholders or required by regulation or listing agreements, to avoid information overload
Timely—with regular scheduled disclosures as well as ad-hoc information, such as press releases on important events, performed in a timely manner
Fair and equal—where all material information is published via press releases to ensure that the whole investor community receives the information at the same time
Complete, free from material errors and a reflection of best practice—disclosure is compliant with applicable financial reporting standards and listing requirements and in line with industry norms.
Ericsson’s website comprises comprehensive information on the Group, including:
An archive of annual and interim reports
On-demand access to recent news
Copies of presentations given by senior management at industry conferences.
Disclosure controls and procedures
Ericsson has controls and procedures in place to allow for timely information disclosure under applicable laws and regulations, including the US Securities Exchange Act of 1934, and under agreements with NASDAQ OMX Stockholm and NASDAQ New York. These procedures also require that such information is provided to management, including the CEO and CFO, so timely decisions can be made regarding required disclosure.
The Disclosure Committee comprises members with various expertise. It assists managers in fulfilling their responsibility regarding disclosures made to the shareholders and the investment community. One of the main tasks of the committee is to monitor the integrity and effectiveness of the disclosure controls and procedures.
Ericsson has investments in certain entities that the Company does not control or manage. With respect to such entities, disclosure controls and procedures are substantially more limited than those maintained with respect to subsidiaries.
ERICSSON ANNUAL REPORT ON FORM 20-F 2012
During the year, Ericsson’s President and CEO and the CFO evaluated the disclosure controls and procedures and concluded that they were effective at a reasonable assurance level as at December 31, 2012.
Internal control over financial reporting
Ericsson has integrated risk management and internal control into its business processes. As defined in the COSO framework, internal control is an aggregation of components such as a control environment, risk assessment, control activities, information and communication and monitoring.
During the period covered by the Annual Report 2012, there were no changes to the internal control over financial reporting that have materially affected, or are likely to materially affect, the internal control over financial reporting.
Control environment
The Company’s internal control structure is based on the division of tasks between the Board of Directors and its Committees and the President and CEO. The Company has implemented a management system that is based on:
Steering documents, such as policies, directives and a Code of Business Ethics
A strong corporate culture
The Company’s organization and mode of operations, with well-defined roles and responsibilities and delegations of authority
Several well-defined Group-wide processes for planning, operations and support.
The most essential parts of the control environment relative to financial reporting are included in steering documents and processes for accounting and financial reporting. These steering documents are updated regularly to include, among other things:
Financial reporting standards and listing requirements, such as IFRS and SOX.
The processes include specific controls to be performed to ensure high quality financial reports. The management of each reporting legal entity, region and business unit is supported by a financial controller function with execution of controls related to transactions and reporting. The financial controller functions are organized in a number of Company Control Hubs, each supporting a number of legal entities within a geographical area. A financial controller function is also established on Group level, reporting to the CFO.
Risk assessment
Risks of material misstatements in financial reporting may exist in relation to recognition and measurement of assets, liabilities, revenue and cost or insufficient disclosure. Other risks related to financial reporting include fraud, loss or embezzlement of assets and undue favorable treatment of counterparties at the expense of the Company.
Policies and directives regarding accounting and financial reporting cover areas of particular significance to support correct, complete and timely accounting, reporting and disclosure.
Identified types of risks are mitigated through well-defined business processes with integrated risk management activities, segregation of duties and appropriate delegation of authority. This requires specific approval of material transactions and ensures adequate asset management.
ERICSSON ANNUAL REPORT ON FORM 20-F 2012
Control activities
The Company’s business processes include financial controls regarding the approval and accounting of business transactions. The financial closing and reporting process has controls regarding recognition, measurement and disclosure. These include the application of critical accounting policies and estimates, in individual subsidiaries as well as in the consolidated accounts.
Regular analyses of the financial results for each subsidiary, region and business unit cover the significant elements of assets, liabilities, revenues, costs and cash flow. Together with further analysis of the consolidated financial statements performed at Group level, these procedures are designed to produce financial reports without material errors.
For external financial reporting purposes, the Disclosure Committee performs additional control procedures to review whether the disclosure requirements are fulfilled.
The Company has implemented controls to ensure that financial reports are prepared in accordance with its internal accounting and reporting policies and IFRS as well as with relevant listing regulations. It maintains detailed documentation on internal controls related to accounting and financial reporting. It also keeps records on the monitoring of the execution and results of such controls. This allows the President and CEO and the CFO to assess the effectiveness of the controls in a way that is compliant with SOX.
Entity-wide controls, focusing on the control environment and compliance with financial reporting policies and directives, are implemented in all subsidiaries. Detailed process controls and documentation of controls performed are also implemented in almost all subsidiaries, covering the items with significant materiality and risk.
In order to secure compliance, governance and risk management in the areas of legal entity accounting and taxation, as well as securing funding and equity levels, the Company operates through a Company Control hub structure, covering subsidiaries in each respective geographical area.
Based on a common IT platform, a common chart of account and common master data, the hubs and shared services centers perform accounting and financial reporting services for most subsidiaries.
Information and communication
The Company’s information and communication channels support complete, correct and timely financial reporting by making all relevant internal process instructions and policies accessible to all the employees concerned. Regular updates and briefing documents regarding changes in accounting policies, reporting and disclosure requirements are also supplied.
Subsidiaries and operating units prepare regular financial and management reports for internal steering groups and Company management. These include analysis and comments on financial performance and risks. The Board of Directors receives financial reports monthly. Ericsson has established a whistleblower procedure for the reporting of alleged violations that (i) are conducted by Group or local management, and (ii) relate to corruption, questionable accounting or auditing matters or otherwise seriously affect vital interests of the Group or personal health and safety.
Monitoring
The Company’s process for financial reporting is reviewed annually by the management. This forms a basis for evaluating the internal management system and internal steering documents to ensure that they cover all
ERICSSON ANNUAL REPORT ON FORM 20-F 2012
significant areas related to financial reporting. The shared service center and company control hub management continuously monitors accounting quality through a set of performance indicators. Compliance with policies and directives is monitored through annual self-assessments and representation letters from heads and company controllers in all subsidiaries as well as in business units and regions.
The Company’s financial performance is also reviewed at each Board meeting. The Committees of the Board fulfill important monitoring functions regarding remuneration, borrowing, investments, customer finance, cash management, financial reporting and internal control. The Audit Committee and the Board of Directors review all interim and annual financial reports before they are released to the market. The Company’s internal audit function reports directly to the Audit Committee. The Audit Committee also receives regular reports from the external auditor. The Audit Committee follows up on any actions taken to improve or modify controls.
BOARD OF DIRECTORS
Stockholm, March 5, 2013
Telefonaktiebolaget LM Ericsson (publ)
Org. no. 556016–0680
ERICSSON ANNUAL REPORT ON FORM 20-F 2012
REMUNERATION REPORT
INTRODUCTION
This report outlines how the remuneration policy is implemented throughout Ericsson in line with corporate governance best practice, with specific references to Group management. The work of the Remuneration Committee in 2012 and the remuneration policy are explained, at the beginning of the report, followed by descriptions of plans and approaches.
More details of the remuneration of Group management and Board members’ fees can be found in the Notes to the Consolidated financial statements—Note C28, “Information regarding members of the Board of Directors, the Group management and employees”.
THE REMUNERATION COMMITTEE
The Remuneration Committee advises the Board of Directors on an ongoing basis on the remuneration to the Executive Leadership Team (ELT). This includes fixed salaries, pensions, other benefits and short-term and long-term variable remuneration, all in the context of pay and employment conditions throughout Ericsson. The Remuneration Committee reviews and prepares for resolution by the Board:
Proposals on salary and other remuneration, including retirement compensation, for the President and CEO
Proposals on targets for the short-term variable remuneration for the President and CEO
Proposals to the Annual General Meeting on guidelines for remuneration to the ELT
Proposals to the Annual General Meeting on long-term variable remuneration and similar equity arrangements
The responsibility for the Remuneration Committee is also to:
Approve proposals on salary and other remuneration, including retirement compensation, for the Executive Vice Presidents and other ELT.
Approve proposals on targets for the short-term variable remuneration for the Executive Vice Presidents and other ELT.
Approve pay out of the short-term variable renumeration for the ELT, based on achievements and performance.
The Remuneration Committee’s work is the foundation for the governance of Ericsson’s remuneration processes together with Ericsson’s internal systems and audit controls. The Committee is chaired by Leif Johansson and its other members are Börje Ekholm, Nancy McKinstry, and Karin Åberg. All the members are non-executive directors, independent (except for the employee representative) as required by the Swedish Corporate Governance Code and have relevant knowledge and experience of remuneration matters.
The Company’s General Counsel acts as secretary to the Committee. The Chief Executive Officer, the Senior Vice President, Head of Human Resources and Organization and the Vice President, Head of Total Rewards attend the Remuneration Committee meetings by invitation and assist the Committee in its considerations, except when issues relating to their own remuneration are being discussed.
The Remuneration Committee has appointed an independent expert advisor, Piia Pilv, to assist and advise the Committee. The independent advisor provided no other services to the Company during 2012. The
ERICSSON ANNUAL REPORT ON FORM 20-F 2012
Remuneration Committee is also provided with national and international pay data collected from external survey providers and can call on other independent expertise, should it so require. The Chairman continues to ensure that contact is maintained, as necessary and appropriate, with principal shareholders regarding remuneration.
The purpose and function of the Remuneration Committee and its responsibilities can be found on the Ericsson website. These responsibilities, together with the Guidelines for remuneration to Group Management (ELT) and the Long-Term Variable remuneration plan, are reviewed and evaluated annually in light of matters such as changes to corporate governance best practice or changes to accounting, legislation, political opinion or business practices among peers. This helps to ensure that the policy continues to provide Ericsson with a competitive remuneration strategy.
The Guidelines for remuneration to Group Management are, in accordance with Swedish law, brought to shareholders annually for approval.
The Remuneration Committee met six times during the year 2012.
The winter meetings focused on following up on results from the 2011 variable remuneration programs and preparing proposals to shareholders for the 2012 Annual General Meeting (AGM). During the spring the committee determined remuneration to a new member of the ELT and revised the remuneration to others. In the fall, the committee reviewed the Guidelines for remuneration to Group Management and decided to continue the Long-Term Variable remuneration plans without any material changes and the Short-Term Variable remuneration plans with an increased weighting on capital and margins for 2013. The committee based its considerations on the business needs, analyses and reviews of the global market trends and feedback from shareholders and institutions. Supported by the independent advisor, the Committee also reviewed the competitiveness of the ELT remuneration in the global market. The Remuneration Committee is of the opinion that the Long-Term Variable remuneration plans fulfill the defined objectives to promote “One Ericsson” and to align the interests of employees with those of shareholders. The number of participants as of December 1, 2012 was 27,000 employees, compared to 24,000 employees as of December 1, 2011. The evaluation also confirms that the Key Contributor Retention Plan meets the purpose of retaining our key employees. The voluntary attrition rate among Key Contributors is about two-thirds compared to the attrition rate in the total number of employees.
REMUNERATION POLICY
Remuneration at Ericsson is based on the principles of performance, competitiveness and fairness. The remuneration policy, together with the mix of remuneration elements, is designed to reflect these principles by creating a balanced remuneration package. The Guidelines for remuneration to Group Management 2012 approved by AGM can be found in note C28. The auditor’s report regarding whether we have complied with the guidelines for compensation to the ELT during 2012 is posted on the Ericsson website.
ERICSSON ANNUAL REPORT ON FORM 20-F 2012
Summaries of 2012 short- and long-term variable remuneration
| | | | | | | | |
What we call it | | What is it? | | What is the objective? | | Who participates? | | How is it earned? |
Short-term: Remuneration delivered over 12 months or less |
| | | | |
| Fixed salary | | Fixed remuneration paid at set times | | Attract and retain employees, delivering part of annual remuneration in a predictable format | | All employees | | Market appropriate
levels set according
to position and
evaluated according
to individual
performance |
| | | | |
| Short-Term Variable remuneration (STV) | | A variable plan that is measured and paid over a single year | | Align employees with clear and relevant targets, providing an earnings opportunity in return for performance, and flexible cost | | Enrolled employees, including Executive Leadership Team. Approx. 73,900 in 2012 | | Achievements
against set targets.
Reward can increase
to up to twice the
target level and
decrease to zero,
depending on
performance |
| | | | |
| Local and Sales Incentive Plans | | Tailored versions of the STV | | As for STV, tailored for local or business requirements, such as sales | | Employees in sales. Approx. 2,300 in 2012 | | Similar to STV. All
plans have maximum
award and vesting
limits |
|
Long-term: Remuneration delivered over 3 years or more |
| | | | |
| Stock Purchase Plan (SPP) | | All-employee stock-based plan | | Reinforce a “One Ericsson” mentality and align employees’ interests with those of shareholders | | All employees are eligible | | Buy one share and it
will be matched by
one share after
3 years if still
employed |
| | | | |
| Key Contributor Retention Plan (KC) | | Share-based plan for selected individuals | | Recognize, retain and motivate key contributors for performance, critical skills and potential | | Up to 10% of employees | | If selected, get one
more matching share
in addition to the
SPP one |
| | | | |
| Executive Performance Stock Plan (EPSP) | | Share-based plan for senior executives | | Remuneration for long-term commitment and value creation | | Senior executives, including Executive Leadership Team | | Get up to 4, 6 or, for
CEO, 9 further
matching shares to
the SPP one for
long-term
performance |
REMUNERATION 2012
To enhance the understanding of how Ericsson translates remuneration principles and policy into practice, an internal remuneration website was launched in January 2011. The site contains e-learning and training programs targeted at line managers. It supports more informed decisions and better communication to the wider employee population. The next step in this development is the planned implementation of an Integrated HR IT tool. The first phase was launched to all managers in Ericsson in November 2012 and include performance management, talent planning, variable pay and annual salary review.
ERICSSON ANNUAL REPORT ON FORM 20-F 2012
TOTAL REMUNERATION
When considering the remuneration of an individual, it is the total remuneration that matters. First, the total annual cash compensation is defined, consisting of the target level of short-term variable remuneration plus fixed salary. Thereafter, target long-term variable remuneration may be added to get to the total target remuneration and, finally, pension and other benefits may be added to arrive at the total remuneration.
For the ELT, remuneration consists of fixed salary, short-term and long-term variable remuneration, pension and other benefits. If the size of any one of these elements is increased or decreased when setting the remuneration, at least one other element has to change if the competitive position is to remain unchanged.
The remuneration costs for the CEO and the ELT are reported in Note C28.
Fixed salary
When setting fixed salaries, the Remuneration Committee considers the impact on total remuneration, including pension and associated costs. The absolute levels are determined by the size and complexity of the position and the year-to-year performance of the individual. Together with other elements of remuneration, ELT salaries are subject to an annual review by the Remuneration Committee, which considers external pay data to ensure that levels of pay remain competitive and appropriate to the remuneration policy.
Variable remuneration
Ericsson strongly believes that, where possible, variable compensation should be encouraged as an integral part of total remuneration. First and foremost, this aligns employees with clear and relevant targets, but it also enables more flexible payroll costs and emphasizes the link between performance and pay. All variable remuneration plans have maximum award and vesting limits. Short-term variable remuneration is to a greater extent dependent on the specific unit or function, while long-term variable remuneration is dependent on the achievements of the Ericsson Group.
Short-term variable remuneration
Annual variable remuneration is delivered through cash-based programs. Specific business targets are derived from the annual business plan approved by the Board of Directors and, in turn, defined by the Company’s long-term strategy. Ericsson strives to grow faster than the market with best-in-class margins and strong cash conversion and therefore the starting point is to have three core targets:
For the ELT, targets are thus predominantly financial at either Group level (for Heads of Group functions) or at the individual unit level (for Heads of regions or business units) and may also include operational targets like customer satisfaction and employee engagement.
ERICSSON ANNUAL REPORT ON FORM 20-F 2012
The chart below illustrates how payouts to the ELT have varied with performance over the past five years.
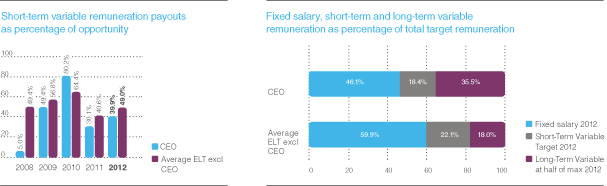
Short-term variable remuneration structure
| | | | | | | | | | | | | | | | | | | | | | | | |
| | | Short-term variable remuneration
as percentage of fixed salary | | | Percentage of short-term variable
remuneration maximal opportunity | |
| | | Target
level | | | Maximum
level | | | Actual paid
for 2012 | | | Group financial
targets | | | Unit/functional
financial targets | | | Non-financial
targets | |
CEO 2012 | | | 40 | % | | | 80 | % | | | 32 | % | | | 90 | % | | | 0 | % | | | 10 | % |
CEO 2013 | | | 40 | % | | | 80 | % | | | — | | | | 100 | % | | | 0 | % | | | 0 | % |
Average ELT 20121) | | | 36 | % | | | 72 | % | | | 37 | % | | | 49 | % | | | 27 | % | | | 24 | % |
Average ELT 20131) | | | 38 | % | | | 76 | % | | | — | | | | 50 | % | | | 24 | % | | | 26 | % |
| 1) | Excludes CEO—differences in target and maximum levels from year to year are due to changes in the composition of the ELT. |
The Board of Directors and the Remuneration Committee decide on all Ericsson Group targets, which are cascaded to unit-related targets throughout the Company, always subject to a two-level management approval process. The Remuneration Committee monitors the appropriateness and fairness of Group target levels throughout the performance year and has the authority to revise them should they cease to be relevant or stretching or to enhance shareholder value.
During 2012, approximately 76,200 employees participated in short-term variable remuneration plans.
Long-term variable remuneration
Share-based long-term variable remuneration plans are submitted each year for approval by shareholders at the AGM. All long-term variable remuneration plans are designed to form part of a well-balanced total remuneration package and to span over a minimum of three years. As these are variable plans, outcomes are unknown and rewards depend on long-term personal investment, corporate performance and resulting share price performance. During 2012, share-based remuneration was made up of three different but linked plans: the all-employee Stock Purchase Plan, the Key Contributor Retention Plan and the Executive Performance Stock Plan.
The Stock Purchase Plan
The all-employee Stock Purchase Plan is designed to offer, where practicable, an incentive for all employees to participate. This reinforces “One Ericsson” aligned with shareholder interests. Employees can save up to 7.5% of gross fixed salary (the President and CEO can save up to 10% of gross fixed salary and short-term variable remuneration) for purchase of Class B shares at market price on NASDAQ OMX Stockholm or ADSs on
ERICSSON ANNUAL REPORT ON FORM 20-F 2012
NASDAQ New York (contribution shares) over a twelve-month period. If the contribution shares are retained by the employee for three years after the investment and employment with the Ericsson Group continues during that time, the employee’s shares will be matched with a corresponding number of Class B shares or ADSs, as applicable. The plan was introduced in 2002 and employees in 71 countries participated during its first year. In December 2012, the number of participants was over 27,000, or approximately 28% of eligible employees in 100 countries.
Participants save each month, beginning with the August payroll, towards quarterly investments. These investments (in November, February, May and August) are matched on the third anniversary of each such investment and hence the matching spans over two financial years and two tax years.
The Key Contributor Retention Plan
The Key Contributor Retention Plan is part of Ericsson’s talent management strategy. It is designed to recognize individuals for performance, critical skills and potential as well as to encourage retention of key employees.
Under the program, operating units around the world can nominate up to 10% of employees worldwide. Each unit nominates individuals that have been identified according to performance, critical skills and potential. The nominations are calibrated in management teams locally and are reviewed by both local and corporate Human Resources to ensure that there is a minimum of bias and a strong belief in the system.
Participants selected obtain one extra matching share in addition to the one matching share for each contribution share purchased under the Stock Purchase Plan during a twelve-month investment period. The plan was introduced in 2004.
The Executive Performance Stock Plan
The Executive Performance Stock Plan was first introduced in 2004. The plan is designed to focus management on driving long-term financial performance and to provide market competitive remuneration. Senior executives, including the ELT, are selected to obtain up to four or six extra shares (performance matching shares). This is in addition to the one matching share for each contribution share purchased under the all-employee Stock Purchase Plan. Performance matching is subject to the fulfillment of performance targets. Since 2010, the President and CEO may obtain up to nine performance matching shares in addition to the Stock Purchase Plan matching share for each contribution share.
In the 2004 to 2010 plans, the performance targets were Earnings Per Share (EPS) targets.
To support the long-term strategy and value creation of the Company, new targets were defined for the 2011 plan. At the AGM 2012, the following targets for the 2012 Executive Performance Stock Plan were resolved on proposal by the Board:
Up to one-third of the award shall vest provided the compound annual growth rate (CAGR) of consolidated net sales between year 0 (2011 financial year) and year 3 (2014 financial year) is between 2% and 8%.
Up to one-third of the award shall vest provided the compound annual growth rate (CAGR) of consolidated operating income between year 0 (2011 financial year) and year 3 (2014 financial year) is between 5% and 15%.
Up to one-third of the award will be based on the cash conversion during each of the years during the performance period, calculated as cash flow from operating activities divided by net income reconciled to cash. One-ninth of the total award will vest for any year, i.e. financial years 2012, 2013 and 2014, if cash conversion is at or above 70%.
ERICSSON ANNUAL REPORT ON FORM 20-F 2012
Before the number of performance shares to be matched are finally determined, the Board of Directors shall examine whether the performance matching is reasonable considering the Company’s financial results and position, conditions on the stock market and other circumstances, and if not, as determined by the Board of Directors, reduce the number of performance shares to be matched to the lower number of shares deemed appropriate by the Board of Directors. When undertaking its evaluation of performance outcomes the Board of Directors will consider, in particular, the impact of larger acquisitions, divestitures, the creation of joint ventures and any other significant capital event on the three targets on a case by case basis.
Benefits and terms of employment
Pension benefits follow the competitive practice in the employee’s home country and may contain various supplementary plans, in addition to any national system for social security. Where possible, pension plans are operated on a defined contribution basis. Under these plans, Ericsson pays contributions into a plan but does not guarantee the ultimate benefit, unless local regulations or legislation prescribe that defined benefit plans that do give such guarantees have to be offered.
For the President and CEO and other members of the ELT employed in Sweden before 2011, a supplementary pension plan is applied in addition to the occupational pension plan for salaried staff on the Swedish labor market (ITP). The pension age for these ELT members is normally 60 years.
The ELT members employed in Sweden from 2011 are normally covered by the defined contribution plan under the ITP1 scheme, with a pensionable age of 65 years.
For members of the ELT who are not employed in Sweden, local market competitive pension arrangements apply.
Other benefits, such as company car and medical insurance, are also set to be competitive in the local market. The ELT members may not receive loans from the Company.
The ELT members locally employed in Sweden have a mutual notice period of up to six months. Upon termination of employment by the Company, severance pay can amount to up to 18 months’ fixed salary. For other ELT members, different notice period and severance pay agreements apply; however, no agreement exceeds the notice period of six months or the severance pay period of 18 months.
ERICSSON ANNUAL REPORT ON FORM 20-F 2012
SHARE INFORMATION
STOCK EXCHANGE TRADINGSony Ericsson
| Sale of the Company’s share in Sony Ericsson (50%) to Sony, with a positive cash flow effect of SEK 9.1 billion. | | Feb, 2012 | | | |
EFI | | Sale of Ericsson Federal Inc. (EFI), with a positive cash flow effect of SEK 360 million. | | Dec, 2010 |
ERICSSON ANNUAL REPORT ON FORM 20-F 2012
C27 LEASING
Leasing with the Company as lessee
Assets under finance leases, recorded as property, plant and equipment, consist of:
Finance leases
| | | | | | | | |
| | | 2012 | | | 2011 | |
Cost | | | | | | | | |
Real estate | | | 1,538 | | | | 1,856 | |
Machinery | | | 3 | | | | 3 | |
| | | | | | | | |
| | | 1,541 | | | | 1,859 | |
| | | | | | | | |
Accumulated depreciation | | | | | | | | |
Real estate | | | –601 | | | | –725 | |
Machinery | | | –3 | | | | –3 | |
| | | | | | | | |
| | | –604 | | | | –728 | |
| | | | | | | | |
Accumulated impairment losses | | | | | | | | |
Real estate | | | –35 | | | | –42 | |
| | | –35 | | | | –42 | |
| | | | | | | | |
Net carrying value | | | 902 | | | | 1,089 | |
| | | | | | | | |
As of December 31, 2012, future minimum lease payment obligations for leases were distributed as follows:
Future minimum lease payment obligations for leases
| | | | | | | | |
| | | Finance
leases | | | Operating
leases | |
2013 | | | 150 | | | | 2,847 | |
2014 | | | 229 | | | | 1,794 | |
2015 | | | 127 | | | | 1,388 | |
2016 | | | 85 | | | | 1,105 | |
2017 | | | 76 | | | | 777 | |
2018 and later | | | 795 | | | | 2,472 | |
| | | | | | | | |
Total | | | 1,462 | | | | 10,383 | |
| | | | | | | | |
Future finance charges1) | | | –398 | | | | n/a | |
| | | | | | | | |
Present value of finance lease liabilities | | | 1,064 | | | | 10,383 | |
| | | | | | | | |
| 1) | Average effective interest rate on lease payables is 5.69%. |
Expenses in 2012 for leasing of assets were SEK 3,172 (3,362) million, of which variable expenses were SEK 20 (7) million. The leasing contracts vary in length from 1 to 20 years.
The Company’s lease agreements normally do not include any contingent rents. In the few cases they occur, they relate to charges for heating linked to the oil price index. Most of the leases of real estate contain terms of renewal, giving the Company the right to prolong the agreement in question for a predefined period of time. All of the finance leases of facilities contain purchase options. Only a very limited number of the
ERICSSON ANNUAL REPORT ON FORM 20-F 2012
Company’s lease agreements contain restrictions on stockholders’ equity or other means of finance. The major agreement contains a restriction stating that the Parent Company must maintain a stockholders’ equity of at least SEK 25 billion.
Leases with the Company as lessor
Leasing income relates to subleasing of real estate as well as equipment provided to customers under leasing arrangements. These leasing contracts vary in length from 1 to 11 years.
At December 31, 2012, future minimum payment receivables were distributed as follows:
Future minimum payment receivables
| | | | | | | | |
| | | Finance
leases | | | Operating
leases | |
2013 | | | 6 | | | | 154 | |
2014 | | | 6 | | | | 143 | |
2015 | | | 6 | | | | 96 | |
2016 | | | 6 | | | | 23 | |
2017 | | | 6 | | | | 18 | |
2018 and later | | | — | | | | 52 | |
| | | | | | | | |
Total | | | 30 | | | | 486 | |
| | | | | | | | |
Unearned financial income | | | n/a | | | | n/a | |
Uncollectible lease payments | | | n/a | | | | n/a | |
| | | | | | | | |
Net investments in financial leases | | | n/a | | | | n/a | |
| | | | | | | | |
Leasing income in 2012 was SEK 236 (76) million.
ERICSSON ANNUAL REPORT ON FORM 20-F 2012
C28 INFORMATION REGARDING MEMBERS OF THE BOARD OF DIRECTORS, THE GROUP MANAGEMENT AND EMPLOYEES
Remuneration to the Board of Directors
Remuneration to members of the Board of Directors
| | | | | | | | | | | | | | | | | | | | | | | | | | | | | | | | |
SEK | | Board fees | | | Number
of synthetic
shares/
portion of
Board fee | | | Value at
grant date of
synthetic
shares
allocated in 2012
A | | | Number of
previously
allocated
synthetic
shares
outstanding | | | Net change
in value
of allocated
synthetic
shares1)
B | | | Committee
fees | | | Total fees
paid in
cash2)
C | | | Total
remuneration
2012
(A+B+C) | |
Board member | | | | | | | | | | | | | | | | | | | | | | | | | | | | | | | | |
Leif Johansson | | | 3,750,000 | | | | 0/0 | % | | | — | | | | — | | | | — | | | | 400,000 | | | | 4,150,000 | 3) | | | 4,150,000 | |
Sverker Martin-Löf | | | 875,000 | | | | 0/0 | % | | | — | | | | — | | | | — | | | | 250,000 | | | | 1,125,000 | | | | 1,125,000 | |
Jacob Wallenberg | | | 875,000 | | | | 6,984/50 | % | | | 437,499 | | | | 2,262.00 | | | | 10,826 | | | | 175,000 | | | | 612,500 | | | | 1,060,825 | |
Roxanne S. Austin | | | 875,000 | | | | 6,984/50 | % | | | 437,499 | | | | 29,172.60 | | | | 31,648 | | | | 250,000 | | | | 687,500 | | | | 1,156,647 | |
Sir Peter L. Bonfield | | | 875,000 | | | | 3,492/25 | % | | | 218,749 | | | | 9,722.80 | | | | 13,411 | | | | 250,000 | | | | 906,250 | | | | 1,138,410 | |
Börje Ekholm | | | 875,000 | | | | 10,476/75 | % | | | 656,248 | | | | 29,172.60 | | | | 40,228 | | | | 175,000 | | | | 393,750 | | | | 1,090,226 | |
Alexander Izosimov | | | 875,000 | | | | 3,492/25 | % | | | 218,749 | | | | — | | | | 8,580 | | | | — | | | | 656,250 | | | | 883,579 | |
Ulf J. Johansson | | | 875,000 | | | | 0/0 | % | | | — | | | | 22,384.60 | | | | 33,495 | | | | 350,000 | | | | 1,225,000 | 4) | | | 1,258,495 | |
Nancy McKinstry | | | 875,000 | | | | 0/0 | % | | | — | | | | 22,002.60 | | | | 18,092 | | | | 175,000 | | | | 1,050,000 | | | | 1,068,092 | |
Anders Nyrén | | | 875,000 | | | | 0/0 | % | | | — | | | | — | | | | — | | | | 175,000 | | | | 1,050,000 | | | | 1,050,000 | |
Hans Vestberg | | | — | | | | — | | | | — | | | | — | | | | — | | | | — | | | | — | | | | — | |
Michelangelo Volpi | | | 875,000 | | | | 0/0 | % | | | — | | | | 4,380.00 | | | | –2,409 | | | | — | | | | 875,000 | | | | 872,591 | |
Employee Representatives | | | | | | | | | | | | | | | | | | | | | | | | | | | | | | | | |
Pehr Claesson | | | 18,000 | | | | — | | | | — | | | | — | | | | — | | | | — | | | | 18,000 | | | | 18,000 | |
Kristina Davidsson | | | 18,000 | | | | — | | | | — | | | | — | | | | — | | | | — | | | | 18,000 | | | | 18,000 | |
Jan Hedlund5) | | | 6,000 | | | | — | | | | — | | | | — | | | | — | | | | — | | | | 6,000 | | | | 6,000 | |
Karin Åberg | | | 18,000 | | | | — | | | | — | | | | — | | | | — | | | | — | | | | 18,000 | | | | 18,000 | |
Rickard Fredriksson6) | | | 10,500 | | | | — | | | | — | | | | — | | | | — | | | | — | | | | 10,500 | | | | 10,500 | |
Karin Lennartsson | | | 18,000 | | | | — | | | | — | | | | — | | | | — | | | | — | | | | 18,000 | | | | 18,000 | |
Roger Svensson | | | 18,000 | | | | — | | | | — | | | | — | | | | — | | | | — | | | | 18,000 | | | | 18,000 | |
| | | | | | | | | | | | | | | | | | | | | | | | | | | | | | | | |
Total | | | 12,606,500 | | | | 31,428 | | | | 1,968,744 | | | | 119,097.20 | | | | 153,871 | | | | 2,200,000 | | | | 12,837,750 | | | | 14,960,365 | 7) |
| | | | | | | | | | | | | | | | | | | | | | | | | | | | | | | | |
Total | | | 12,606,500 | | | | 31,428 | | | | 1,968,744 | | | | 128,002.20 | 8) | | | 138,792 | 8) | | | 2,200,000 | | | | 20,706,150 | 9) | | | 22,813,687 | 7)9) |
| | | | | | | | | | | | | | | | | | | | | | | | | | | | | | | | |
| 1) | The Ericsson Class Adifference in value as of December 31, 2012, compared to December 31, 2011 (for synthetic shares allocated 2008, 2009, 2010 and Class B2011), and compared to grant date 2012 (for synthetic shares allocated in 2012). The value of synthetic shares allocated in 2008, 2009, 2010 and 2011 includes respectively SEK 1.85, SEK 2.00, SEK 2.25 and SEK 2.50 per share in compensation for dividends resolved by the Annual General Meetings 2009, 2010, 2011 and 2012. |
| 2) | Committee fee and cash portion of the Board fee. |
| 3) | In addition, an amount corresponding to statutory social charges in respect of the part of the fee that has been invoiced through a company was paid, amounting to SEK 1,303,930. |
| 4) | In addition, an amount corresponding to statutory social charges in respect of the part of the fee that has been invoiced through a company was paid, amounting to SEK 122,520. |
| 5) | Resigned as employee representative as of May 3, 2012. |
| 6) | Appointed deputy employee representative as of May 3, 2012. |
| 7) | Excluding social security charges in the amount of SEK 3,950,998. |
ERICSSON ANNUAL REPORT ON FORM 20-F 2012
| 8) | Including synthetic shares previously allocated to the former Director Carl-Henric Svanberg. |
| 9) | Including advance payments to the former Directors Michael Treschow and Marcus Wallenberg under the synthetic share programs. Michael Treschow: SEK 7,376,686 for 111,926.80 synthetic shares (in addition, an amount corresponding to statutory social charges in respect of the part of the fee that has been invoiced through a company was paid, amounting to SEK 753,159) and Marcus Wallenberg: SEK 491,714 for 7,460.80 synthetic shares. |
Comments to the table
The Chairman of the Board was entitled to a Board fee of SEK 3,750,000 and a fee of SEK 200,000 for each Board Committee on which he served as Chairman.
The other Directors elected by the Annual General Meeting were entitled to a fee of SEK 875,000 each. In addition, the Chairman of the Audit Committee was entitled to a fee of SEK 350,000 and the other non-employed members of the Audit Committee were entitled to a fee of SEK 250,000 each. The Chairmen of the Finance and Remuneration Committees were entitled to a fee of SEK 200,000 each and the other non-employed members of the Finance and the Remuneration Committees were entitled to a fee of SEK 175,000 each.
Members of the Board, who are not employees of the Company, have not received any remuneration other than the fees and synthetic shares as above. None of the Directors have entered into a service contract with the Parent Company or any of its subsidiaries, providing for termination benefits.
Members and deputy members of the Board who are Ericsson employees received no remuneration or benefits other than their entitlements as employees and a fee to the employee representatives and their deputies of SEK 1,500 per attended Board meeting.
Board members invoicing the amount of the Board and Committee fee through a company may add to the invoice an amount corresponding to social charges. The social charges thus included in the invoiced amount are not higher than the general payroll tax that would otherwise have been paid by the Company. The entire amount, i.e. the cash portion of the Board fee and the Committee fee, including social charges, constitutes the invoiced Board fee.
The Annual General Meeting 2012 resolved that non-employed Directors may choose to receive the Board fee (i.e. exclusive of committee fee) as follows: i) 25% of the Board fee in cash and 75% in the form of synthetic shares, with a value corresponding to 75% of the Board fee at the time of allocation, ii) 50% in cash and 50% in the form of synthetic shares, or iii) 75% in cash and 25% in the form of synthetic shares. Directors may also choose not to participate in the synthetic share program and receive 100% of the Board fee in cash. Committee fees are always paid in cash.
The number of synthetic shares is based on a volume-weighed average of the market price of Ericsson Class B shares on the NASDAQ OMX Stockholm exchange during the five trading days immediately following the Annual General Meeting 2012: SEK 62.643. The number of synthetic shares is rounded down to the nearest whole number of shares.
The synthetic shares are vested during the Directors’ term of office and the right to receive payment with regard to the allocated synthetic shares occurs after the publication of the Company’s year-end financial statement during the fifth year following the Annual General Meeting which resolved on the synthetic share program, i.e. in 2017.
The amount payable shall be determined based on the volume-weighed average price for shares of Class B during the five trading days immediately following the publication of the year-end financial statement.
ERICSSON ANNUAL REPORT ON FORM 20-F 2012
Synthetic shares were allocated to members of the Board for the first time in 2008, on equal terms and conditions as resolved in 2009, 2010, 2011 and 2012. Payment based on synthetic shares may thus, under the main rule, occur for the first time in 2013 with respect to the synthetic shares allocated in 2008. The value of all outstanding synthetic shares fluctuates in line with the market value of Ericsson’s Class B share and may differ from year to year compared to the original value on their respective grant dates. The change in value of the outstanding synthetic shares is established each year and affects the total recognized costs that year. As per December 31, 2012, the total number of synthetic shares under the programs is 159,430.20, and the total accounted debt is SEK 11,113,237 (including synthetic shares previously allocated to the former Director Carl-Henric Svanberg). In accordance with the terms and conditions for the synthetic shares, the time for payment to the former Director Carl-Henric Svanberg has been advanced, to occur after the publication of the year-end financial statement 2013. In February 2012, advance payment was made to the former Directors Michael Treschow and Marcus Wallenberg with respect to their synthetic shares, all in accordance with the terms and conditions for the synthetic shares.
Remuneration to the Group Management
The Company’s costs for remuneration to the Group management are the costs recognized in the Income Statement during the fiscal year. These costs are disclosed under “Remuneration costs” below.
Costs recognized during a fiscal year in the Income Statement are not fully paid by the Company at the end of the fiscal year. The unpaid amounts that the Company has in relation to the Group management are disclosed under “Outstanding balances”.
Remuneration costs
The total remuneration to the President and CEO and to other members of the Group management, consisting of the Executive Leadership Team (ELT) includes fixed salary, short-term and long-term variable remuneration, pension and other benefits. These remuneration elements are based on the guidelines for remuneration and other employment conditions for the ELT as approved by the Annual General Meeting held in 2012, see the approved guidelines in section “Guidelines for remuneration to Group Management 2012”.
Remuneration costs for the President and CEO and other members of Executive Leadership Team (ELT)
| | | | | | | | | | | | | | | | | | | | | | | | |
SEK | | The President
and CEO 2012 | | | The President
and CEO 2011 | | | Other members
of ELT 2012 | | | Other members
of ELT 2011 | | | Total 2012 | | | Total 2011 | |
Salary | | | 12,573,233 | | | | 11,739,341 | | | | 76,973,215 | | | | 76,031,733 | | | | 89,546,448 | | | | 87,771,074 | |
Costs for annual variable remuneration earned 2012 to be paid 2013 | | | 3,972,247 | | | | 2,771,134 | | | | 21,877,700 | | | | 18,460,645 | | | | 25,849,947 | | | | 21,231,779 | |
Long-term variable remuneration provision | | | 6,439,873 | | | | 5,636,050 | | | | 6,472,215 | | | | 8,916,556 | | | | 12,912,088 | | | | 14,552,606 | |
Pension costs | | | 6,491,713 | | | | 5,960,566 | | | | 22,865,674 | | | | 22,154,413 | | | | 29,357,387 | | | | 28,114,979 | |
Other benefits | | | 123,612 | | | | 78,594 | | | | 4,431,160 | | | | 4,944,762 | | | | 4,554,772 | | | | 5,023,356 | |
Social charges and taxes | | | 9,114,641 | | | | 7,800,766 | | | | 22,877,888 | | | | 23,529,200 | | | | 31,992,529 | | | | 31,329,966 | |
| | | | | | | | | | | | | | | | | | | | | | | | |
Total | | | 38,715,319 | | | | 33,986,451 | | | | 155,497,852 | | | | 154,037,309 | | | | 194,213,171 | | | | 188,023,760 | |
| | | | | | | | | | | | | | | | | | | | | | | | |
Comments to the table
During 2012 there were three Executive Vice Presidents, who have been appointed by the Board of Directors. None of them has acted as deputy to the President and CEO during the year. The Executive Vice Presidents are included in the group “Other members of ELT”.
ERICSSON ANNUAL REPORT ON FORM 20-F 2012
The group “Other members of ELT” comprises the following persons: Per Borgklint, Bina Chaurasia, Hĺkan Eriksson (up to January 31), Ulf Ewaldsson (from February 1), Jan Frykhammar, Douglas L. Gilstrap, Nina Macpherson, Magnus Mandersson, Helena Norrman, Mats H. Olsson, Rima Qureshi, Angel Ruiz, Johan Wibergh and Jan Wäreby.
The salary stated in the table for the President and CEO and other members of the ELT includes vacation pay paid during 2012 as well as other contracted compensation which were paid during 2012 or provisioned for 2012.
“Long-term variable remuneration provision” refers to the compensation costs during 2012 for all outstanding share-based plans.
For a description of compensation cost, including accounting treatment, see Note C1, “Significant accounting policies”, section Share-based compensation to employees and the Board of Directors.
For the President and CEO and other members of the ELT employed in Sweden before 2011 a supplementary plan is applied in addition to the occupational pension plan for salaried staff on the Swedish labor market (ITP) with pension from 60 years. These pension plans are not conditional upon future employment at Ericsson.
Outstanding balances
The Company has recognized the following liabilities relating to unpaid remunerations in the Balance Sheet:
Ericsson’s commitments for benefit based pensions as of December 31, 2012 under IAS 19 amounted to SEK 5,971,282 for the President and CEO which includes ITP plan and temporary disability and survivor’s pension. For other members of ELT the Company’s commitments amounted to SEK 27,103,244 of which SEK 21,429,454 refers to the ITP plan and the remaining SEK 5,673,790 to temporary disability and survivor’s pensions.
For previous Presidents and CEOs, the Company has made provisions for defined benefit pension plans in connection with their active service periods within the Company.
Deferred salary, earned 2012 or earlier, to be paid 12 months after period end or later, amounts to SEK 7,899,000.
Maximum outstanding matching rights
| | | | | | | | |
As per December 31, 2012 Number of Class B shares | | The President
and CEO | | | Other members
of the ELT | |
Stock Purchase Plans 2009, 2010, 2011 and 2012 and Executive Performance Stock Plans 2009, 2010, 2011 and 2012 | | | 503,382 | | | | 661,456 | |
Comments to the table
For the definition of matching rights, see the description in section “Long-term variable remuneration”.
The performance matching result of 70,3% is included for 2009 plan.
Cash conversion target for 2012 was reached, but not reached in 2011.
During 2012, the President and CEO received 10,108 matching shares and other members of the ELT 54,803 matching shares.
ERICSSON ANNUAL REPORT ON FORM 20-F 2012
Guidelines for remuneration to Group Management 2012
For Group Management consisting of the Executive Leadership Team, including the President and CEO, total remuneration consists of fixed salary, short and long-term variable remuneration, pension and other benefits. Furthermore, the following guidelines apply for the remuneration to the Executive Leadership Team:
Variable remuneration is through cash and stock-based programs awarded against specific business targets derived from the long-term business plan approved by the Board of Directors. Targets may include financial targets at either corporate or unit level, operational targets, employee motivation targets and customer satisfaction targets.
With the current composition of the Executive Leadership Team, the Company’s cost during 2012 for variable remuneration to the Executive Leadership Team can, at a constant share price, amount to between 0 and 150% of the aggregate fixed salary cost, all excluding social security costs.
All benefits, including pension benefits, follow the competitive practice in the home country taking total compensation into account. The retirement age is normally 60 to 65 years of age.
By way of exception, additional arrangements can be made when deemed required. Such additional arrangement shall be limited in time and shall not exceed a period of 36 months and two times the remuneration that the individual concerned would have received had no additional arrangement been made.
The mutual notice period may be no more than six months. Upon termination of employment by the Company, severance pay amounting to a maximum of 18 months’ fixed salary is paid. Notice of termination given by the employee due to significant structural changes, or other events that in a determining manner affect the content of work or the condition for the position, is equated with notice of termination served by the Company.
Long-Term Variable remuneration
The Stock Purchase Plan
The Stock Purchase Plan is designed to offer an incentive for all employees to participate in the Company where practicable, which is consistent with industry practice and with our ways of working. For the 2012 plan, employees are able to save up to 7.5% of gross fixed salary (President and CEO can save up to 10% of gross fixed salary and short-term variable remuneration) for purchase of Class B contribution shares at market price on the NASDAQ OMX Stockholm or American Depositary Shares (ADSs) at NASDAQ New York (contribution shares) during a twelve-month period (contribution period). If the contribution shares are retained by the employee for three years after the investment and the employment with the Ericsson Group continues during that time, the employee’s shares will be matched with a corresponding number of Class B shares or ADSs free of consideration. Employees in 100 countries participate in the plans.
The table below shows the contribution periods and participation details for ongoing plans as of December 31, 2012.
Stock purchase plans
| | | | | | | | | | | | |
Plan | | Contribution period | | | Number of
participants
at launch | | | Take-up
rate–percent of
eligible employees | |
Stock Purchase plan 2009 | | | August 2009–July 2010 | | | | 18,000 | | | | 25 | % |
Stock Purchase plan 2010 | | | August 2010–July 2011 | | | | 22,000 | | | | 27 | % |
Stock Purchase plan 2011 | | | August 2011–July 2012 | | | | 24,000 | | | | 30 | % |
Stock Purchase plan 2012 | | | August 2012–July 2013 | | | | 27,000 | | | | 28 | % |
ERICSSON ANNUAL REPORT ON FORM 20-F 2012
Participants save each month, beginning with August payroll, towards quarterly investments. These investments (in November, February, May and August) are matched on the third anniversary of each such investment, subject to continued employment, and hence the matching spans over two financial years and two tax years.
The Key Contributor Retention Plan
The Key Contributor Retention Plan is part of Ericsson’s talent management strategy and is designed to give recognition for performance, critical skills and potential as well as to encourage retention of key employees. Under the program, up to 10% of employees (2012 plan: up to 8,000 employees) are selected through a nomination process that identifies individuals according to performance, critical skills and potential. Participants selected obtain one extra matching share in addition to the ordinary one matching share for each contribution share purchased under the Stock Purchase Plan during a twelve-month program period.
Executive Performance Stock Plans
| | | | | | | | | | | | | | | | |
| | | Executive Performance Stock Plan | |
| | | 20121) | | | 2011 | | | 2010 | | | 2009 | |
Base year EPS2) | | | | | | | | | | | 1.14 | | | | 2.90 | |
Target average annual EPS growth range3) | | | | | | | | | | | 5% to 15% | | | | 5% to 15% | |
Matching share vesting range4) | | | 0.67 to 4 | | | | 0.67 to 4 | | | | 0.67 to 4 | | | | 0.67 to 4 | |
| | | 1 to 6 | | | | 1 to 6 | | | | 1 to 6 | | | | 1 to 6 | |
| | | 1.5 to 9 | | | | 1.5 to 9 | | | | 1.5 to 9 | | | | 1.33 to 8 | |
Maximum opportunity as percentage of fixed salary5) | | | 30 | % | | | 30 | % | | | 30 | % | | | 30 | % |
| | | 45 | % | | | 45 | % | | | 45 | % | | | 45 | % |
| | | 162 | % | | | 162 | % | | | 162 | % | | | 72 | % |
| 1) | Targets for Executive Performance Stock Plan 2012 are listeddescribed in the next table. |
| 2) | Sum of four quarters up to June 30 of plan year 2009. For 2010 plan the sum of 4 quarters up to December 31, 2010. |
| 3) | EPS range found from three-year average EPS of the twelve quarters to the end of the performance period and corresponding growth targets. |
| 4) | Corresponding to EPS range (no Performance Share Plan matching below this range). Matching shares per contribution share invested in addition to Stock Purchase Plan matching according to program of up to 4, 6 or 9 matching shares. |
| 5) | At full investment, full vesting and constant share price. Excludes Stock Purchase Plan matching. |
ERICSSON ANNUAL REPORT ON FORM 20-F 2012
Executive Performance Stock Plan targets
| | | | | | | | | | | | | | | | |
| | | Base year
value
SEK billion | | | Year 1 | | | Year 2 | | | Year 3 | |
| 2012 | | | | | | | | | | | | | | | | |
Growth (Net Sales Growth) | | | 227.8 | | |
| Compound annual
growth rate of 2–8% |
|
Margin (Operating Income Growth) | | | 17.9 | | |
| Compound annual
growth of 5–15% |
|
Cash Flow (Cash Conversion) | | | — | | | ³ | 70 | % | | ³ | 70 | % | | ³ | 70 | % |
| 2011 | | | | | | | | | | | | | | | | |
Growth (Net Sales Growth) | | | 203.3 | | |
| Compound annual
growth rate of 4–10% |
|
Margin (Operating Income Growth)1) | | | 23.7 | | |
| Compound annual
growth of 5–15% |
|
Cash Flow (Cash Conversion) | | | — | | | ³ | 70 | % | | ³ | 70 | % | | ³ | 70 | % |
| 1) | Consolidated operating margin excluding restructuring for 2010. |
The Executive Performance Stock Plan
The Executive Performance Stock Plan is designed to focus management on driving earnings and provide competitive remuneration. Senior executives, including ELT, are selected to obtain up to four or six extra shares (performance matching shares) in addition to the ordinary one matching share for each contribution share purchased under the Stock Purchase Plan. Up to 0.5% of employees (2012 plan: up to 400 executives) are offered to participate in the plan. The President and CEO can save up to 10% of gross fixed salary and short-term variable remuneration, and may obtain up to nine performance matching shares in addition to the Stock Purchase Plan matching share for each contribution share. The performance matching for the 2009 and 2010 plans is subject to the fulfillment of a performance target of average annual Earnings per Share (EPS) growth.
The performance targets changed from Earnings Per Share (EPS) targets to targets linked to the business strategy as from 2011.
The tables above show all Executive Performance Stock Plans as per December 31, 2012.
Shares for all plans
| | | | | | | | | | | | | | | | | | | | | | | | | | | | |
| | | | | | Stock Purchase Plan, Key Contributor
Retention Plan and Executive
Performance Stock Plans | | | | | | | | | | |
Plan (million shares) | | | | | 2012 | | | 2011 | | | 2010 | | | 2009 | | | 2008 | | | Total | |
Originally designated1) | | | A | | | | 26.2 | | | | 19.4 | | | | 19.4 | | | | 22.4 | | | | 16.5 | | | | 103.9 | |
Outstanding beginning of 2012 | | | B | | | | — | | | | 3.4 | | | | 10.6 | | | | 9.1 | | | | 6.1 | | | | 29.2 | |
Awarded during 2012 | | | C | | | | 4.4 | | | | 10.8 | | | | — | | | | — | | | | — | | | | 15.2 | |
Exercised/matched during 2012 | | | D | | | | — | | | | 0.3 | | | | 0.5 | | | | 2.3 | | | | 6.0 | | | | 9.1 | |
Forfeited/expired during 2012 | | | E | | | | — | | | | 0.4 | | | | 0.9 | | | | 0.8 | | | | 0.1 | | | | 2.2 | |
Outstanding end of 20122) | | | F=B+C–D–E | | | | 4.4 | | | | 13.5 | | | | 9.2 | | | | 6.0 | | | | — | | | | 33.1 | |
Compensation costs charged during 2012 (SEK million) | | | G | | | | 6 | 3) | | | 132 | 3) | | | 148 | 3) | | | 91 | 3) | | | 28 | 3) | | | 405 | 4) |
ERICSSON ANNUAL REPORT ON FORM 20-F 2012
| 1) | Adjusted for rights offering and reverse split when applicable. |
| 2) | Presuming maximum performance matching under the Executive Performance Stock Plans. The 2008 plan has lapsed. The 2009 plan partially vested to an extent of 70,3%. |
| 3) | Fair value is calculated as the share price on NASDAQ OMX Stockholm. In the United States,investment date, reduced by the net present value of the dividend expectations during the three-year vesting period. Net present value calculations are based on data from external party. Fair value is also adjusted for participants failing to keep hold of their contribution shares during the vesting period. For shares under the Executive Performance Stock Plans, the Company presumes maximum performance matching for all ongoing plans when calculating the compensation cost. The 2008 plan has lapsed. The 2009 plan partially vested to an extent of 70,3%. Fair value of the Class B share at each investment date during 2012 was: February 15 SEK 56.26, May 15 SEK 53.93, August 15 SEK 55.85 and November 15 SEK 49.99. |
| 4) | Total compensation costs charged during 2011: SEK 413 million, 2010: SEK 757 million. |
Shares for all plans
All plans are funded with treasury stock and are equity settled. Treasury stock for all plans has been issued in directed cash issues of Class C shares at the quotient value and purchased under a public offering at the subscription price plus a premium corresponding to the subscribers’ financing costs, and then converted to Class B shares.
For all plans, additional shares have been allocated for financing of social security expenses. Treasury stock is sold on the NASDAQ OMX Stockholm to cover social security payments when arising due to matching of shares. During 2012, 1,038,200 shares were sold at an average price of SEK 63.17. Sale of shares is recognized directly in equity.
If, as of December 31, 2012, all shares allocated for future matching under the Stock Purchase Plan were transferred, and shares designated to cover social security payments were disposed of as a result of the exercise and the matching, approximately 61 million Class B shares would be transferred, corresponding to 1.9% of the total number of shares outstanding, 3,220 million not including treasury stock. As of December 31, 2012, 85 million Class B shares were held as treasury stock.
The table above shows how shares (representing matching rights but excluding shares for social security expenses) are being used for all outstanding plans. From up to down the table includes (A) the number of shares originally approved by the Annual General Meeting, adjusted for reverse split where applicable; (B) the number of originally designated shares that were outstanding at the beginning of 2012; (C) the number of shares awards that were granted during 2012; (D) the number of shares matched during 2012; (E) the number of shares forfeited by participants or expired under the plan rules during 2012; and (F) the balance left as outstanding at the end of 2012, having added new awards to the shares outstanding at the beginning of the year and deducted the shares related to awards matched, forfeited and expired.
The final column (G) shows the compensation costs charged to the accounts during 2012 for each plan, calculated as fair value in SEK.
For a description of compensation cost, including accounting treatment, see Note C1, “Significant accounting policies”, section Share-based compensation to employees and the Board of Directors.
ERICSSON ANNUAL REPORT ON FORM 20-F 2012
Employee numbers, wages and salaries
Employee numbers
Average number of employees
| | | | | | | | | | | | | | | | | | | | | | | | |
| | | 2012 | | | 2011 | |
| | | Women | | | Men | | | Total | | | Women | | | Men | | | Total | |
North America | | | 3,479 | | | | 12,607 | | | | 16,086 | | | | 2,876 | | | | 12,106 | | | | 14,982 | |
Latin America | | | 2,137 | | | | 9,230 | | | | 11,367 | | | | 1,913 | | | | 7,837 | | | | 9,750 | |
Northern Europe & Central Asia1)2) | | | 5,746 | | | | 15,351 | | | | 21,097 | | | | 5,656 | | | | 14,927 | | | | 20,583 | |
Western & Central Europe2) | | | 1,790 | | | | 9,463 | | | | 11,253 | | | | 1,663 | | | | 8,968 | | | | 10,631 | |
Mediterranean2) | | | 2,966 | | | | 10,064 | | | | 13,030 | | | | 2,743 | | | | 9,077 | | | | 11,820 | |
Middle East | | | 617 | | | | 4,603 | | | | 5,220 | | | | 634 | | | | 4,343 | | | | 4,977 | |
Sub-Saharan Africa | | | 548 | | | | 1,672 | | | | 2,220 | | | | 661 | | | | 1,290 | | | | 1,951 | |
India | | | 2,137 | | | | 11,924 | | | | 14,061 | | | | 1,613 | | | | 9,912 | | | | 11,525 | |
North East Asia | | | 4,191 | | | | 9,584 | | | | 13,775 | | | | 3,480 | | | | 8,839 | | | | 12,319 | |
South East Asia & Oceania | | | 1,175 | | | | 3,474 | | | | 4,649 | | | | 1,155 | | | | 3,437 | | | | 4,592 | |
| | | | | | | | | | | | | | | | | | | | | | | | |
Total | | | 24,786 | | | | 87,972 | | | | 112,758 | | | | 22,394 | | | | 80,736 | | | | 103,130 | |
| | | | | | | | | | | | | | | | | | | | | | | | |
1) Of which Sweden | | | 4,232 | | | | 13,337 | | | | 17,569 | | | | 4,188 | | | | 12,881 | | | | 17,069 | |
2) Of which EU | | | 9,911 | | | | 33,581 | | | | 43,492 | | | | 9,575 | | | | 31,667 | | | | 41,242 | |
Number of employees by region at year-end
| | | | | | | | |
| | | 2012 | | | 2011 | |
North America | | | 15,501 | | | | 14,801 | |
Latin America | | | 11,219 | | | | 11,191 | |
Northern Europe & Central Asia1)2) | | | 21,211 | | | | 20,987 | |
Western & Central Europe2) | | | 11,257 | | | | 10,806 | |
Mediterranean2) | | | 12,205 | | | | 11,645 | |
Middle East | | | 3,992 | | | | 4,336 | |
Sub-Saharan Africa | | | 2,014 | | | | 2,283 | |
India | | | 14,303 | | | | 11,535 | |
North East Asia | | | 14,157 | | | | 12,567 | |
South East Asia & Oceania | | | 4,396 | | | | 4,374 | |
Total | | | 110,255 | | | | 104,525 | |
| | | | | | | | |
1)Of which Sweden | | | 17,712 | | | | 17,500 | |
2)Of which EU | | | 42,872 | | | | 41,596 | |
| | | | | | | | |
Employees by gender and age at year-end 2012
| | | | | | | | | | | | |
| | | Women | | | Men | | | Percent
of total | |
Under 25 years old | | | 2,517 | | | | 6,018 | | | | 8 | % |
25–35 years old | | | 8,530 | | | | 31,054 | | | | 36 | % |
36–45 years old | | | 7,818 | | | | 28,954 | | | | 33 | % |
46–55 years old | | | 3,984 | | | | 15,692 | | | | 18 | % |
Over 55 years old | | | 1,233 | | | | 4,455 | | | | 5 | % |
Percent of total | | | 22 | % | | | 78 | % | | | 100 | % |
ERICSSON ANNUAL REPORT ON FORM 20-F 2012
Employee movements
| | | | | | | | | | |
| | | | | 2012 | | | 2011 | |
Head count at year-end | | | | | 110,255 | | | | 104,525 | |
Employees who have left the Company | | | | | 12,280 | | | | 10,571 | |
Employees who have joined the Company | | | | | 18,010 | | | | 24,835 | |
Temporary employees | | | | | 766 | | | | 901 | |
Employee wages and salaries
Wages and salaries and social security expenses
| | | | | | | | |
(SEK million) | | 2012 | | | 2011 | |
Wages and salaries | | | 48,428 | | | | 43,707 | |
Social security expenses | | | 15,672 | | | | 15,198 | |
Of which pension costs | | | 2,762 | | | | 3,888 | |
Amounts related to the President and CEO and the Executive Leadership Team are included.
Remuneration to Board members and Presidents in subsidiaries
| | | | | | | | |
(SEK million) | | 2012 | | | 2011 | |
Salary and other remuneration | | | 243 | | | | 223 | |
Of which annual variable remuneration | | | 33 | | | | 22 | |
Pension costs | | | 27 | | | | 20 | |
Board members, Presidents and Group management by gender at year end
| | | | | | | | | | | | | | | | |
| | | 2012 | | | 2011 | |
| | | Women | | | Men | | | Women | | | Men | |
Parent Company | | | | | | | | | | | | | | | | |
Board members and President | | | 27 | % | | | 73 | % | | | 20 | % | | | 80 | % |
Group Management | | | 29 | % | | | 71 | % | | | 29 | % | | | 71 | % |
Subsidiaries | | | | | | | | | | | | | | | | |
Board members and Presidents | | | 12 | % | | | 88 | % | | | 11 | % | | | 89 | % |
C29 RELATED PARTY TRANSACTIONS
During 2012, various related party transactions were executed pursuant to contracts based on terms customary in the industry and negotiated on an arm’s length basis. For information regarding equity and Ericsson’s share of assets, liabilities and income in joint ventures and associated companies, see Note C12, “Financial assets, non-current”. For information regarding transactions with senior management, see Note C28, “Information regarding members of the Board of Directors, the Group management and employees”.
ST-Ericsson
ST-Ericsson, the joint venture between Ericsson and STMicroelectronics, was formed on February 2, 2009, by merging Ericsson Mobile Platforms with ST-NXP Wireless. The joint venture is equally owned by Ericsson and STMicroelectronics. For further information, see Note C3, “Segment information”.
ERICSSON ANNUAL REPORT ON FORM 20-F 2012
Major transactions are as follows:
Sales: Ericsson provides ST-Ericsson with services in the areas of R&D, HR, IT and facilities.
Purchases: A major part of Ericsson’s purchases from ST-Ericsson consists of chipsets and R&D services.
Dividends: Both owners of ST-Ericsson receive dividends, when so decided by the Board of Directors. Ericsson received no dividends from ST-Ericsson during 2012.
ST-Ericsson
| | | | | | | | | | | | |
| | | 2012 | | | 2011 | | | 2010 | |
Related party transactions | | | | | | | | | | | | |
Sales | | | 138 | | | | 182 | | | | 403 | |
Purchases | | | 634 | | | | 781 | | | | 629 | |
| | | | | | | | | | | | |
Related party balances | | | | | | | | | | | | |
Receivables | | | 127 | | | | 51 | | | | 53 | |
Liabilities | | | — | | | | 24 | | | | 48 | |
Ericsson does not have any contingent liabilities, assets pledged as collateral or guarantees towards ST-Ericsson.
Ericsson Nikola Tesla d.d.
Ericsson Nikola Tesla d.d. is a company for design, sales and service of telecommunication systems and equipment, and an associated member of the Ericsson Group. Ericsson Nikola Tesla d.d. is located in Zagreb, Croatia. Ericsson holds 49.07% of the shares.
Major transactions are as follows:
Sales: Ericsson sells telecommunication equipment to Ericsson Nikola Tesla d.d.
License revenues: Ericsson receives license revenues for Ericsson Nikola Tesla d.d.’s usage of trademarks.
Purchases: Ericsson purchases development resources from Ericsson Nikola Tesla d.d.
Dividends: Ericsson received dividends from Ericsson Nikola Tesla d.d. during 2012.
Ericsson Nikola Tesla D.D.
| | | | | | | | | | | | |
| | | 2012 | | | 2011 | | | 2010 | |
Related party transactions | | | | | | | | | | | | |
Sales | | | 1,161 | | | | 465 | | | | 563 | |
License revenues | | | 8 | | | | 4 | | | | 2 | |
Purchases | | | 607 | | | | 595 | | | | 566 | |
Ericsson’s share of dividends | | | 133 | | | | 154 | | | | 104 | |
| | | | | | | | | | | | |
Related party balances | | | | | | | | | | | | |
Receivables | | | 189 | | | | 59 | | | | 120 | |
Liabilities | | | 81 | | | | 76 | | | | 75 | |
ERICSSON ANNUAL REPORT ON FORM 20-F 2012
Ericsson does not have any contingent liabilities, assets pledged as collateral or guarantees towards Ericsson Nikola Tesla d.d.
Sony Ericsson Mobile Communications AB
The company has divested its 50% stake in Sony Ericsson Mobile Communications to Sony. The divestment was effective on January 1, 2012.
Sony Ericsson Mobile Communications AB
| | | | | | | | | | | | |
| | | 2012 | | | 2011 | | | 2010 | |
Related party transactions | | | | | | | | | | | | |
License revenues | | | — | | | | 855 | | | | 1,255 | |
Purchases | | | — | | | | 126 | | | | 61 | |
| | | | | | | | | | | | |
Related party balances | | | | | | | | | | | | |
Receivables | | | — | | | | 27 | | | | 258 | |
Liabilities | | | — | | | | 2 | | | | 8 | |
C30 FEES TO AUDITORS
Fees to auditors
| | | | | | | | | | | | |
| | | PwC | | | Others | | | Total | |
2012 | | | | | | | | | | | | |
Audit fees | | | 82 | | | | 5 | | | | 87 | |
Audit related fees | | | 15 | | | | — | | | | 15 | |
Tax services fees | | | 16 | | | | 3 | | | | 19 | |
Other fees | | | 10 | | | | 10 | | | | 20 | |
| | | | | | | | | | | | |
Total | | | 123 | | | | 18 | | | | 141 | |
| | | | | | | | | | | | |
2011 | | | | | | | | | | | | |
Audit fees | | | 77 | | | | 9 | | | | 86 | |
Audit related fees | | | 10 | | | | — | | | | 10 | |
Tax services fees | | | 20 | | | | 3 | | | | 23 | |
Other fees | | | 16 | | | | — | | | | 16 | |
| | | | | | | | | | | | |
Total | | | 123 | | | | 12 | | | | 135 | |
| | | | | | | | | | | | |
2010 | | | | | | | | | | | | |
Audit fees | | | 79 | | | | 5 | | | | 84 | |
Audit related fees | | | 17 | | | | 1 | | | | 18 | |
Tax services fees | | | 16 | | | | 2 | | | | 18 | |
Other fees | | | 7 | | | | 2 | | | | 9 | |
| | | | | | | | | | | | |
Total | | | 119 | | | | 10 | | | | 129 | |
| | | | | | | | | | | | |
During the period 2010–2012, in addition to audit services, PwC provided certain audit related services, tax and other services to the Company. The audit related services include quarterly reviews, ISO audits, SSAE16 reviews and services in connection with issuing of certificates and opinions. The tax services include general expatriate services and corporate tax compliance work. Other services include consultation on financial accounting, services related to acquisitions, operational effectiveness and assessments of internal control.
Audit fees to other auditors largely consist of local statutory audits for minor companies.
ERICSSON ANNUAL REPORT ON FORM 20-F 2012
C31 CONTRACTUAL OBLIGATIONS
Contractual obligations 2012
| | | | | | | | | | | | | | | | | | | | |
| | | Payment due by period | | | | |
SEK billion | | <1
year | | | 1–3
years | | | 3–5
years | | | >5
years | | | Total | |
Long-term debt1)2) | | | 3.3 | | | | 7.0 | | | | 7.1 | | | | 9.0 | | | | 26.4 | |
Finance lease obligations3) | | | 0.2 | | | | 0.3 | | | | 0.2 | | | | 0.8 | | | | 1.5 | |
Operating leases3) | | | 2.8 | | | | 3.2 | | | | 1.9 | | | | 2.5 | | | | 10.4 | |
Other non-current liabilities | | | 0.1 | | | | 0.3 | | | | 0.1 | | | | 1.9 | | | | 2.4 | |
Purchase obligations4) | | | 5.7 | | | | — | | | | — | | | | — | | | | 5.7 | |
Trade payables | | | 23.1 | | | | — | | | | — | | | | — | | | | 23.1 | |
Commitments for customer finance5) | | | 5.9 | | | | — | | | | — | | | | — | | | | 5.9 | |
Total | | | 41.1 | | | | 10.8 | | | | 9.3 | | | | 14.2 | | | | 75.4 | |
| | | | | | | | | | | | | | | | | | | | |
| 1) | Including interest payments. |
| 2) | See Note C20, “Financial risk management and financial instruments”. |
| 3) | See Note C27, “Leasing”. |
| 4) | The amounts of purchase obligations are gross, before deduction of any related provisions. |
| 5) | See also Note C14, “Trade receivables and customer finance”. |
For information about financial guarantees, see Note C24, “Contingent liabilities”.
Except for those transactions described in this report, the Company has not been a party to any material contracts over the past three years other than those entered into during the ordinary course of business.
C32 TRANSFERS OF FINANCIAL ASSETS
Transfers where the Company has not derecognized the assets in their entirety
As per December 31, 2012 there existed certain customer financing assets that the Company had transferred to third parties where the Company did not derecognize the assets in their entirety. The total carrying amount of the original assets transferred was SEK 471 (194) million, the amount of the assets that the Company continues to recognize was SEK 28 (10) million, and the carrying amount of the associated liabilities was SEK 0 (0) million. More information is disclosed about Customer Finance in Note C14 “Trade receivables and customer finance”.
Transfers where the Company has continuing involvement
The Company has during 2012 derecognized financial assets where the Company had continuing involvement. A repurchase of these assets would amount to SEK 225 (596) million. No assets or liabilities were recognized in relation to the continuing involvement.
C33 EVENTS AFTER THE REPORTING PERIOD
On January 10, 2013, Ericsson entered into an agreement with Unwired Planet whereby Ericsson will transfer 2,185 issued patents and patent applications to Unwired Planet. Ericsson will also contribute 100 additional patent assets annually to Unwired Planet commencing in 2014 through 2018. Unwired Planet will compensate Ericsson with certain ongoing rights in future revenues generated from the enlarged patent portfolio. Unwired Planet will also grant Ericsson a license to its patent portfolio.
ERICSSON ANNUAL REPORT ON FORM 20-F 2012
On January 21, 2013, Ericsson announced its intention to acquire Devoteam Telecom & Media operations in France. Devoteam has employees in Europe, Middle East and Africa. The acquisition is in line with Ericsson’s services strategy to broaden its IT capabilities.
In January 2013, ST-Ericsson was granted a loan facility by their owners of USD 260 million. Ericsson’s share of this credit facility is USD 130 million.
On January 10, 2013, Adaptix Inc. filed two lawsuits against Ericsson, AT&T, AT&T Mobility and MetroPCS Communications in the US District Court for Eastern District of Texas alleging that certain Ericsson products infringe five US patents assigned to Adaptix. Adaptix seeks damages and an injunction.
On January 25, 2013, Adaptix filed a complaint with the US International Trade Commission (ITC) against Ericsson, AT&T, AT&T Mobility and MetroPCS Communications requesting that the commission open a patent infringement investigation of certain Ericsson products and further on January 29, 2013, Adaptix filed a complaint with the Tokyo District Court alleging certain Ericsson products infringe two Japanese patents assigned to Adaptix. Adaptix seeks damages and an injunction.
On March 18, 2013, Ericsson and STMicroelectronics announced an agreement on the way forward for the joint venture (JV) ST-Ericsson.
The main steps agreed upon to split up the JV are the following: Ericsson will take on the design, development and sales of the LTE multimode thin modem products, including 2G, 3G and 4G multimode; ST will take on the existing ST-Ericsson products, other than LTE multimode thin modems, and related business as well as certain assembly and test facilities; starting the close down of the remaining parts of ST-Ericsson.
The formal transfer of the relevant parts of ST-Ericsson to the parent companies is expected to be completed during the third quarter of 2013, subject to regulatory approvals.
After the split up it is proposed that Ericsson will assume approximately 1,800 employees and contractors.
ERICSSON ANNUAL REPORT ON FORM 20-F 2012
MANAGEMENT’S REPORT ON INTERNAL CONTROL OVER FINANCIAL REPORTING
Ericsson’s management is responsible for establishing and maintaining adequate internal control over financial reporting for the Company. Ericsson’s internal control system related to financial reporting is designed to provide reasonable assurance regarding the reliability of financial reporting and the preparation of financial statements for external purposes in accordance with International Financial Reporting Standards (IFRS) and includes those policies and procedures that:
pertain to the maintenance of records that, in reasonable detail, accurately and fairly reflect the transactions and dispositions of the assets of the Company;
provide reasonable assurance that transactions are recorded as necessary to permit preparation of financial statements in accordance with International Financial Reporting Standards (IFRS), and that receipts and expenditures of the Company are being made only in accordance with authorizations of management and directors of the Company; and
provide reasonable assurance regarding prevention or timely detection of unauthorized acquisition, use or disposition of the Company’s assets that could have a material effect on the financial statements.
Although the purpose of internal control systems is to ensure adequate risk management all internal control systems, no matter how well designed, have inherent limitations which may result in that misstatements are not prevented or detected. Therefore, even systems determined to be effective can provide only reasonable assurance with respect to the reliability of financial statement preparation and presentation.
Controls and procedures
Ericsson’s management assessed the effectiveness of Ericsson’s internal control over financial reporting as of December 31, 2012. In making this assessment, management used the criteria set forth in “Internal Control—Integrated Framework”, issued by the Committee of Sponsoring Organizations of the Treadway Commission.
Based on this assessment, management has concluded that, as of December 31, 2012, Ericsson’s internal control over financial reporting was effective at a reasonable assurance level.
Attestation report of registered public accounting firm
The effectiveness of the Company’s internal control over financial reporting as of December 31, 2012, has been audited by PricewaterhouseCoopers AB, an independent registered public accounting firm. PricewaterhouseCoopers AB has issued an attestation report on Ericsson’s internal control over financial reporting, which appears on page 69.
Changes in internal control over financial reporting
During the period covered by the Annual Report 2012, there were no changes to the internal control over financial reporting that have materially affected, or are likely to materially affect, the internal control over financial reporting.
ERICSSON ANNUAL REPORT ON FORM 20-F 2012
RISK FACTORS
You should carefully consider all the information in this Annual Report and in particular the risks and uncertainties outlined below. Based on the information currently known to us, we believe that the following information identifies the most significant risk factors affecting our business. Any of the factors described below, or any other risk factors discussed elsewhere in this report, could have a material negative effect on our business, operational and after-tax results, financial position, cash flow, liquidity, credit rating, brand and/or our share price. Additional risks and uncertainties not presently known to us or that we currently believe to be immaterial may also materially adversely affect our business. Furthermore, our operational results may have a greater variability than in the past and we may have difficulties in accurately predicting future developments. See also “Forward-Looking Statements”.
MARKET, TECHNOLOGY AND BUSINESS RISKS
Challenging global economic conditions may adversely impact the demand and pricing for our products and services as well as limit our ability to grow.
Challenging global economic conditions could have adverse, wide-ranging effects on demand for our products and for the products of our customers. Adverse global economic conditions could cause operators and other customers to postpone investments or initiate other cost-cutting initiatives to improve their financial position. This could result in significantly reduced expenditures for network infrastructure and services, in which case our operating results would suffer. If demand for our products and services were to fall in the future, we could experience material adverse effects on our revenues, cash flow, capital employed and value of our assets and we could incur operating losses. Furthermore, if demand is significantly weaker or more volatile than expected, our credit rating, borrowing opportunities and costs as well as the trading price of our shares could be adversely impacted. When deemed necessary, we undertake specific restructuring or cost saving initiatives, however, there are no guarantees that such initiatives will be sufficient, successful or executed in time to deliver any improvements in our earnings.
Should global economic conditions fail to improve, or worsen, other business risks we face could intensify and could also negatively impact the business prospects of operators and other customers. Some operators and other customers, in particular in markets with weak currencies, may incur borrowing difficulties and slower traffic development, which may negatively affect their investment plans and cause them to purchase less of our products and services.
The potential adverse effects of an economic downturn include:
Reduced demand for products and services, resulting in increased price competition or deferrals of purchases, with lower revenues not fully compensated through reduced costs
Risks of excess and obsolete inventories and excess manufacturing capacity
Risk of financial difficulties or failures among our suppliers
Increased demand for customer finance, difficulties in collection of accounts receivable and increased risk of counterparty failures
Risk of impairment losses related to our intangible assets as a result of lower forecasted sales of certain products
Increased difficulties in forecasting sales and financial results as well as increased volatility in our reported results
ERICSSON ANNUAL REPORT ON FORM 20-F 2012
A decline in the value of the assets in our pension plans and/or increased pension liabilities due to discount rate changes
End user demand could also be adversely affected by reduced consumer spending on technology, changed operator pricing, security breaches and trust issues.
The telecommunications industry fluctuates and is affected by many factors, including the economic environment, decisions by operators and other customers regarding their deployment of technology and their timing of purchases.
The telecommunications industry has experienced downturns in the past in which operators substantially reduced their capital spending on new equipment. While we expect the network service provider equipment market and telecommunications services market to grow in the coming years, the uncertainty surrounding the global economic recovery may materially harm actual market conditions. Moreover, market conditions are subject to substantial fluctuation, and could vary geographically and across technologies. Even if global conditions improve, conditions in the specific industry segments in which we participate may be weaker than in other segments. In that case, the results of our operations may be adversely affected.
If capital expenditures by operators and other customers is weaker than we anticipate, our revenues and profitability may be adversely affected. The level of demand by operators and other customers who buy our products and services can change quickly and can vary over short periods of time, including from month to month. Due to the uncertainty and variations in the telecommunications industry, accurately forecasting revenues, results, and cash flow remains difficult.
Sales volumes and gross margin levels are affected by the variation and short order time of our products and services.
Our sales to operators and other customers represent a mix of equipment, software and services, which normally generate different gross margins. We sell our own products as well as third party products, which normally have lower margins than our own products. As a consequence, our reported gross margin in a specific period will be affected by the overall mix of products and services as well as the relative content of third party products. Further, network expansions and upgrades have much shorter lead times for delivery than initial network build outs. Orders for such network expansions and upgrades are normally placed with short notice by customers, often with less than a month’s notice, and consequently variations in demand are difficult to forecast. As a result, changes in our product and service mix and the short order time for certain of our products may affect our ability to accurately forecast sales and margins or detect in advance whether actual results will deviate from market consensus. Short-term variation could have a material adverse effect on our business, operating results and financial condition.
We may not be able to properly respond to market trends in the industries in which we operate, including the ongoing convergence of the telecom, data and media industries, which may harm our market position relative to our competitors.
We are affected by market conditions and trends within the industries in which we operate, including the convergence of the telecom, data and media industries. Convergence is largely driven by technological development related to IP-based communications. This has changed the competitive landscape and affects our objective setting, risk assessment and strategies. Competitors new to our business may enter this new business context and negatively impact our market share in selected areas. If we fail to understand the market development, or fail to acquire the necessary competences to develop and market products, services and solutions that are competitive in this changing market, our business, operating results and financial condition will suffer.
ERICSSON ANNUAL REPORT ON FORM 20-F 2012
Our business depends upon the continued growth of mobile communications and the acceptance of new services. If growth slows or new services do not succeed, operators’ investment in networks may slow or stop, harming our business.
A substantial portion of our business depends on the continued growth of mobile communications in terms of both the number of subscriptions and usage per subscriber, which in turn drives the continued deployment and expansion of network systems by our customers. If operators fail to increase the number of subscribers and/or stimulate increased usage, our business and operational results could be materially adversely affected. Also, if operators fail to monetize new services, fail to introduce new business models or experience a decline in operator revenues or profitability, their willingness to further invest in their network systems may decrease which will reduce their demand for our products and services and have an adverse effect on our business, operational results and financial condition.
Fixed and mobile networks converge and new technologies, such as IP and broadband, enable operators to deliver a range of new types of services in both fixed and mobile networks. We are dependent upon market acceptance of such services and the outcome of regulatory and standardization activities in this field, such as spectrum allocation. If delays in standardization, regulation, or market acceptance occur, this could adversely affect our business, operational results and financial condition.
We face intense competition from our existing competitors as well as new entrants, including IT companies entering the telecommunications market, and this could materially adversely affect our results.
The markets in which we operate are highly competitive in terms of price, functionality, service quality, customization, timing of development, and the introduction of new products and services. We face intense competition from significant competitors many of which are very large, with substantial technological and financial resources and established relationships with operators. Further, certain competitors, Chinese companies in particular, have become relatively stronger in recent years. We may also encounter increased competition from new market entrants, alternative technologies or due to evolving industry standards. In particular, we may face competition from large IT companies entering the telecommunications market who benefit from economies of scale from being active in several industries. We cannot assure that we will be able to compete successfully with these companies. Our competitors may implement new technologies before we do, offer more attractively priced or enhanced products, services or solutions, or they may offer other incentives that we do not provide. Some of our competitors may also have greater resources in certain business segments or geographic markets than we do. Increased competition could result in reduced profit margins, loss of market share, increased research and development costs as well as increased sales and marketing expenses. Traffic development on cellular networks could be affected if more traffic is off-loaded to Wi-Fi networks. Further, alternative services provided over-the-top have profound effects on operator voice/ SMS revenues with possible reduced capital expenses consequences.
Additionally, we operate in markets characterized by rapidly changing technology. This results in continuous price erosion and increased price competition for our products and services. If our counter measures, including enhanced products and business models or cost reductions cannot be achieved or do not occur in a timely manner, there could be adverse impacts on our business, operating results, financial condition and market share.
Vendor consolidation may lead to stronger competitors who are able to benefit from integration, scale and greater resources.
Industry convergence and consolidation among equipment and services suppliers could potentially result in stronger competitors that are competing as end-to-end suppliers as well as competitors more specialized in particular areas. Consolidation may also result in competitors with greater resources than we have or in reduction of our current scale advantages. This could have a materially adverse effect on our business, operating results, financial condition and market share.
ERICSSON ANNUAL REPORT ON FORM 20-F 2012
A significant portion of our revenue is currently generated from a limited number of key customers, and operator consolidation may increase our dependence on key customers.
We derive most of our business from large, multi-year frame agreements with a limited number of significant customers. Many of these agreements are opened up on a yearly basis to re-negotiate the price for our products and services and do not contain committed purchase volumes. Although no single customer represents more than 7% of our sales in 2012, our ten largest customers accounted for 46% of our sales in 2012. A loss of or a reduced role with a key customer could have a significant adverse impact on sales, profit and market share for an extended period.
In recent years, network operators have undergone significant consolidation, resulting in a fewer number of operators with activities in several countries. This trend is expected to continue, and intra-country consolidation is likely to accelerate as a result of competitive pressure. A market with fewer and larger operators will increase our reliance on key customers and may negatively impact our bargaining position and profit margins. Moreover, if the combined companies operate in the same geographic market, networks may be shared and less network equipment and associated services may be required. Network investments could be delayed by the consolidation process, which may include, among others, actions relating to merger or acquisition agreements, securing necessary regulatory approvals, or integration of their businesses. Network operators have started to share parts of their network infrastructure through cooperation agreements rather than legal consolidations, which may adversely affect demand for network equipment. Accordingly, operator consolidation may have a material adverse effect on our business, operating results and financial condition.
Certain long-term frame agreements with customers still include commitments to future price reductions, requiring us to constantly manage and control our cost base.
Long-term frame agreements with our customers are typically awarded on a competitive bidding basis. In some cases, such agreements also include a commitment to future price reductions. In order to maintain our gross margin with such price reductions, we continuously strive to reduce the costs of our products through design improvements, negotiation of better purchase prices from our suppliers, allocation of more production to low-cost countries and increased productivity in our own production. However, there can be no assurance that our actions to reduce costs will be sufficient or quick enough to maintain our gross margin in such contracts, which may have a material adverse effect on our operating results.
Growth of our managed services business is difficult to predict, and requires taking significant contractual risks.
Operators increasingly outsource parts of their operations to reduce cost and focus on new services. To address this opportunity, we offer operators various services in which we manage their networks. The growth rate in the managed services market is difficult to forecast and each new contract carries a risk that transformation and integration of the operations will not be as fast or smooth as planned. Additionally, early contract margins are generally low and the mix of new and old contracts may negatively affect reported results in a given period. Contracts for such services normally cover several years and generate recurring revenues. However, contracts have been, and may in the future be, terminated or reduced in scope, which has negative impacts on sales and earnings. While we believe we have a strong position in the managed services market, competition in this area is increasing, which may have adverse effects on our future growth and profitability.
We depend upon the development of new products and enhancements to our existing products, and the success of our substantial research and development investments is uncertain.
Rapid technological and market changes in our industry require us to make significant investments in technological innovation. We invest significantly in new technology, products and solutions. In order for us to be successful, those technologies, products and solutions must be accepted by relevant standardization bodies and
ERICSSON ANNUAL REPORT ON FORM 20-F 2012
by the industry as a whole. There can be no assurance that our research and development efforts will be technically or commercially successful. If we invest in the development of technologies, products and solutions that do not function as expected, are not adopted by the industry, are not ready in time, or are not successful in the marketplace our sales and earnings may materially suffer. Additionally, it is common for research and development projects to encounter delays due to unforeseen problems. Delays in production may increase the cost of research and development efforts and put us at a disadvantage against our competition.
We engage in acquisitions and divestments which may be disruptive and require us to incur significant expenses.
In addition to in-house innovation efforts, we make strategic acquisitions in order to obtain various benefits such as reduced time-to-market, access to technology and competence, increased scale or to broaden our product portfolio or customer base. Future acquisitions could result in the incurrence of contingent liabilities and an increase in amortization expenses related to goodwill and other intangible assets, which could have a material adverse effect upon our business, financial condition and results of operations. Risks we could face with respect to acquisitions include:
Difficulties in the integration of the operations, technologies, products and personnel of the acquired company
Risks of entering markets in which we have no or limited
Potential loss of employees
Diversion of management’s attention away from other business concerns
Expenses of any undisclosed or potential legal liabilities of the acquired company.
From time to time we also divest parts of our business to optimize our product portfolio or operations. Any decision to dispose of or otherwise exit businesses may result in the recording of special charges, such as workforce reduction costs and industry and technology-related write-offs. We cannot assure that we will be successful in consummating future acquisitions or divestments on favourable terms or at all. The risks associated with such acquisitions and divestments could have a material adverse effect upon our business, financial condition and results of operations.
We are a party to joint ventures and partnerships which may not be successful and expose us to future costs.
We are partners in joint ventures and partnerships. Our partnering arrangements may fail to perform as expected for various reasons, including an incorrect assessment of our needs, our inability to take action without the approval of our partners or the capabilities or financial stability of our strategic partners. Our ability to work with these partners or develop new products and solutions may become constrained, which could harm our competitive position in the market.
Additionally, our share of any losses from or commitments to contribute additional capital to such partnerships may adversely affect our results of operations or financial position.
The Board of Directors’ report includes further information regarding our joint venture ST Ericsson.
We rely on a limited number of suppliers of components, production capacity and R&D and IT services, which exposes us to supply disruptions and cost increases.
Our ability to deliver according to market demands and contractual commitments depends significantly on obtaining a timely and adequate supply of materials, components, production capacity and other vital services on
ERICSSON ANNUAL REPORT ON FORM 20-F 2012
competitive terms. Although we strive to avoid single-source supplier solutions, this is not always possible. Accordingly, there is a risk that we will be unable to obtain key supplies we need to produce our products and provide our services on commercially reasonable terms, or at all. Failure by any of our suppliers could interrupt our product or services supply or operations and significantly limit sales or increase our costs. To find an alternative supplier or re-design products to replace components may take significant time which could cause significant delays or interruptions in the delivery of our products and services. We have from time to time experienced interruptions of supply and we may experience such interruptions in the future.
Furthermore, our procurement of supplies requires us to predict future customer demands. If we fail to anticipate customer demand properly, an over or under supply of components and production capacity could occur. In many cases, some of our competitors utilize the same contract manufacturers and if they have purchased capacity ahead of us we could be blocked from acquiring the needed products. This factor could limit our ability to supply our customers or could increase costs. At the same time, we commit to certain capacity levels or component quantities, which, if unused, will result in charges for unused capacity or scrapping costs. We are also exposed to financial counterpart risks to suppliers where we pay in advance for supplies.
Product or service quality issues could lead to reduced revenue, gross margins and declining sales to existing customers.
Sales contracts normally include warranty undertakings for faulty products and often include provisions regarding penalties and/or termination rights in the event of a failure to deliver ordered products or services on time or with required quality. Although we undertake a number of quality assurance measures to reduce such risks, product quality or service performance issues may negatively affect our reputation, results and financial position. If significant warranty obligations arise due to reliability or quality issues, our operating results and financial position could be negatively impacted by costs associated with fixing software or hardware defects, high service and warranty expenses, high inventory obsolescence expense, delays in collecting accounts receivable or declining sales to existing customers.
Due to having a significant portion of our costs in SEK and revenues in other currencies, our business is exposed to foreign exchange fluctuations that could negatively impact our revenue and results of operation.
We incur a significant portion of our expenses in SEK. As a result of our international operations, we generate, and expect to continue to generate, a significant portion of our revenue in currencies other than SEK. To the extent we are unable to match revenue received in foreign currencies with costs paid in the same currency, exchange rate fluctuations could have a negative impact on our consolidated income statement, balance sheet and cash flows when foreign currencies are exchanged or translated to SEK, which increases volatility in reported results.
As market prices are predominantly established in USD or EUR, we presently have a net revenue exposure in foreign currencies which means that a stronger SEK exchange rate would generally have a negative effect on our reported results. Our attempts to reduce the effects of exchange rate fluctuations through a variety of hedging activities may not be sufficient or successful, resulting in an adverse impact on our results.
Our ability to benefit from intellectual property rights (IPR) which are critical to our business may be limited by changes in regulation limiting patents, inability to prevent infringement, the loss of licenses from third parties and IP infringement claims brought against us by competitors.
Although we have a large number of patents, there can be no assurance that they will not be challenged, invalidated, or circumvented, or that any rights granted in relation to our patents will in fact provide us with competitive advantages.
ERICSSON ANNUAL REPORT ON FORM 20-F 2012
In 2005, the European Union considered restricting the patentability of software. Although the European Union ultimately rejected this proposal, we cannot guarantee that they will not revisit this issue in the future. We rely on many software patents, and limitations on the patentability of software may materially affect our business.
We utilize a combination of trade secrets, confidentiality policies, nondisclosure and other contractual arrangements in addition to relying on patent, copyright and trademark laws to protect our intellectual property rights. However, these measures may not be adequate to prevent or deter infringement or other misappropriation. Moreover, we may not be able to detect unauthorized use or take appropriate and timely steps to establish and enforce our proprietary rights. In fact, existing laws of some countries in which we conduct business offer only limited protection of intellectual property rights, if at all.
Our solutions may also require us to license technologies from third parties. It may be necessary in the future to seek or renew licenses and there can be no assurance that they would be available on acceptable terms, or at all. Moreover, the inclusion in our products of software or other intellectual property licensed from third parties on a non-exclusive basis could limit our ability to protect proprietary rights in our products.
Many key aspects of telecommunications and data network technology are governed by industry-wide standards usable by all market participants. As the number of market entrants and the complexity of technology increases, the possibility of functional overlap and inadvertent infringement of intellectual property rights also increases. Third parties have asserted, and may assert in the future, claims, directly against us or against our customers, alleging infringement of their intellectual property rights. Defending such claims may be expensive, time-consuming and divert the efforts of our management and/or technical personnel. As a result of litigation, we could be required to pay damages and other compensation directly or to indemnify our customers for such damages and other compensation, develop non-infringing products/technology or enter into royalty or licensing agreements. However, we cannot be certain that such licenses will be available to us on commercially reasonable terms or at all, and such judgments could have a materially adverse effect on our business.
We are involved in lawsuits and investigations which, if determined against us, could require us to pay substantial damages, fines and/or penalties.
In the normal course of our business we are involved in legal proceedings. These lawsuits include such matters as commercial disputes, claims regarding intellectual property, antitrust, tax and labour disputes. Litigation can be expensive, lengthy and disruptive to normal business operations. Moreover, the results of complex legal proceedings are difficult to predict. An unfavourable resolution of a particular lawsuit could have a material adverse effect on our business, reputation, operating results, or financial condition.
As a publicly listed company, Ericsson may be exposed to lawsuits in which plaintiffs allege that the Company or its officers have failed to comply with securities laws, stock market regulations or other laws, regulations or requirements. Whether or not there is merit to such claims, the time and costs incurred to defend the Company and its officers and the potential settlement or compensation to the plaintiffs could have significant impact on our reported results and reputation. For additional information regarding certain of the lawsuits in which we are involved, see “Legal proceedings” in the Board of Directors’ Report.
Our operations are complex and several critical operations are centralized in a single location. Any disruption of our operations, whether due to natural or man made events, may be highly damaging to the operation of our business.
Our business operations rely on complex operations and communications networks, which are vulnerable to damage or disturbance from a variety of sources. Having outsourced a significant portion of our IT operations, we depend partly on security and reliability measures of external companies. Regardless of protection measures, our systems and communications networks are susceptible to disruption due to failure, vandalism, computer
ERICSSON ANNUAL REPORT ON FORM 20-F 2012
viruses, security breaches, natural disasters, power outages and other events. We also have a concentration of operations on certain sites, including R&D, production, network operation centres, and logistic centres and shared services centres, where business interruptions could cause material damage and costs. The delivery of goods from suppliers, and to customers, could also be hampered for the reasons stated above. We cannot provide any assurance that interruptions to our systems and communications will not have an adverse effect on our operations and financial conditions.
Cyber security incidents affecting our business may have a material adverse effect on our business operations, financial condition and brand.
Ericsson’s business operations involve areas that are particularly vulnerable to cyber security incidents such as data breaches, intrusions, espionage, knowhow and data privacy infringements, leakage and general malfeasance. Examples of these areas include, amongst others, research and development, managed services, usage of cloud solutions, software development, lawful interception and product engineering. Any cyber security incident including unintended use, involving our operations, product development, services, our third party providers or installed product base, could cause severe harm to Ericsson and could have a material adverse effect on our business operations, financial condition and brand.
Ericsson relies heavily on third parties to whom we have outsourced significant aspects of our IT infrastructure, product development and engineering services. While we have taken precautions relating to the selection, integration and ongoing management of these third parties, any event or attack that is caused as a result of vulnerabilities in their operations or products supplied to us, could have a material adverse effect upon Ericsson, our business operations, financial condition and brand, potentially slowing operations, leaking valuable intellectual property or damaging our products which have been installed in our customers’ networks.
We must continue to attract and retain highly qualified employees to remain competitive.
We believe that our future success largely depends on our continued ability to hire, develop, motivate and retain engineers and other qualified personnel needed to develop successful new products, support our existing product range and provide services to our customers.
Competition for skilled personnel and highly qualified managers in the telecommunications industry remains intense. We are continuously developing our corporate culture, remuneration, promotion and benefits policies as well as other measures aimed at empowering our employees and reducing employee turnover. However, there are no guarantees that we will be successful in attracting and retaining employees with appropriate skills in the future, and failure in retention and recruiting could have a material adverse effect on our business.
If our customers’ financial conditions decline, we will be exposed to increased credit and commercial risks.
After completing sales to customers, we may encounter difficulty collecting accounts receivables and could be exposed to risks associated with uncollectable accounts receivable. We regularly assess the credit worthiness of our customers and based on that we determine a credit limit for each one of them. Challenging economic conditions have impacted some of our customers’ ability to pay their accounts receivables. Although our credit losses have historically been low and we have policies and procedures for managing customer finance credit risk we may be unable to avoid future losses on our trade receivables. We have also experienced demands for customer financing, and in adverse financial markets or more competitive environments, those demands may increase. Upon the financial failure of a customer, we may experience losses on credit extended and loans made to such customer, losses relating to our commercial risk exposure, and the loss of the customer’s on-going business. If customers fail to meet their obligations to us, we may experience reduced cash flows and losses in excess of reserves, which could materially adversely impact our results of operations and financial position.
ERICSSON ANNUAL REPORT ON FORM 20-F 2012
We rely on various capital sources for short-term and long-term capital for the funding of our business. Should such capital become unavailable or available in insufficient amounts or unreasonable terms, our business may materially suffer.
If we do not generate sufficient amounts of capital to support our operations, service our debt and continue our research and development and customer finance programs, or if we cannot raise sufficient amounts of capital at the required times and terms, our business is likely to be adversely affected. Access to funding may decrease or become more expensive as a result of our operational and financial condition, market conditions, including financial conditions in the Euro-zone, or due to deterioration in our credit rating. There can be no assurance that additional sources of funds that we from time to time may need, will be available or available on reasonable terms. If we cannot access capital on commercially viable terms, our business could materially suffer.
Impairment of goodwill may negatively impact financial condition.
An impairment of goodwill or other intangible assets could adversely affect our financial condition or results of operations. We have a significant amount of goodwill and intangible assets, for example patents, customer relations, trademarks and software. Goodwill is the only intangible asset the company has recognized to have indefinite useful life.
Other intangible assets are mainly amortized on a straight-line basis over their estimated useful lives, but no more than ten years, and are reviewed for impairment whenever events such as product discontinuances, product dispositions or other changes in circumstances indicate that the carrying amount may not be wholly recoverable. Those not yet in use are tested for impairment annually.
Historically, we have recognized impairment charges related to intangible assets mainly due to restructuring. Additional impairment charges may be incurred in the future that could be significant due to various reasons, including restructuring actions or adverse market conditions that are either specific to us or the broader telecommunications industry or more general in nature and that could have an adverse effect on our results of operations or financial condition.
Negative deviations in actual cash flows compared to estimated cash flows as well as new estimates that indicate lower future cash flows might result in recognition of impairment charges. Estimates require management judgment as well as the definition of cash generating units for impairment testing purposes. Other judgments might result in significantly different results and financial position in the future.
REGULATORY, COMPLIANCE AND CORPORATE GOVERNANCE RISKS
Our business may suffer as a result of changes in laws or regulations which could subject us to liability, increase costs, or reduce product demand.
Telecommunications is an industry which is subject to regulations. Changes to these regulations may adversely affect both our customers’ and our own operations. For example, regulations imposing more stringent, time-consuming or costly planning and zoning requirements or building approvals for radio base stations and other network infrastructure could adversely affect the timing and costs of network construction or expansion, and ultimately the commercial launch and success of these networks. Similarly, tariff and roaming regulations or rules on network neutrality could also affect operators’ ability or willingness to invest in network infrastructure, which in turn could affect the sales of our systems and services. Additionally, delay in radio frequency spectrum allocation, and allocation between different types of usage may affect operator spending adversely or force us to develop new products to be able to compete.
Further, we develop many of our products and services based on existing regulations and technical standards. Changes to existing regulations and technical standards, or the implementation of new regulations and
ERICSSON ANNUAL REPORT ON FORM 20-F 2012
technical standards relating to products and services not previously regulated, could adversely affect our development efforts by increasing compliance costs and causing delay. Demand for those products and services could also decline. Regulatory changes in license fees, environmental, health and safety, privacy and other regulatory areas may increase costs and restrict our operations or the operations of network operators and service providers. Also indirect impacts of such changes and regulatory changes in other fields, such as pricing regulations, could have an adverse impact on our business even though the specific regulations may not apply directly to our products or us.
Ericsson may fail or be unable to comply with laws or regulations and could experience adverse rulings in enforcement or other proceedings, which could have a material adverse impact on our business operations, financial condition and brand.
Our substantial international operations are subject to uncertainties which could affect our operating results.
We conduct business throughout the world and are subject to the effects of general global economic conditions as well as conditions unique to specific countries or regions. We have customers in more than 180 countries, with a significant proportion of our sales to emerging markets in the Asia Pacific region, Latin America, Eastern Europe, the Middle East and Africa.
Our extensive operations are subject to numerous additional risks, including civil disturbances, economic and political instability, the imposition of exchange controls, economies which are subject to significant fluctuations, nationalization of private assets or other governmental actions affecting the flow of goods and currency, and difficulty of enforcing agreements and collecting receivables through local legal systems. Further, in certain markets in which we operate, there is a risk of protectionist governmental measures implemented to assist domestic market participants at the expense of foreign competitors. The implementation of such measures could adversely affect sales or our ability to purchase critical components.
We must always comply with relevant export control regulations and sanctions or other trade embargoes in force, not only at the time of sale but also at the time of delivery. The political situation in parts of the world, particularly in the Middle East, has led to an increase of sanctions imposed by the global community. A universal element of these sanctions is the financial restrictions with respect to individuals and/or legal entities, but sanctions can also restrict certain exports and ultimately lead to a complete trade embargo towards a country. In particular, the sanctions towards Iran have been strengthened significantly during 2012, both by the EU and the U.S. Even though the EU has imposed a ban on deliveries on many items, especially so called dual use items, an exemption for certain standard telecom equipment is still maintained.
There is a risk in many of these countries of unexpected changes in regulatory requirements, tariffs and other trade barriers, price or exchange controls, or other governmental policies which could limit our operations and decrease our profitability. Further export control regulations, sanctions or other forms of trade restrictions imposed on countries in which we are active may result in a reduction of commitment in those countries. The need to terminate activities as a result of further trade restrictions may also expose us to customer claims and other actions. Although we seek to comply with all such regulations, there can be no assurance that we are, or will be in the future, compliant with all relevant regulations and such violations, even unintentional violations, could have material adverse effects on our business, operational results and brand.
There has been a growing concern reported by media and others, that certain countries may use features of their telecommunications systems violating the human rights. This may adversely affect the telecommunications business and may have a negative impact on our brand.
ERICSSON ANNUAL REPORT ON FORM 20-F 2012
As a result of the credit crisis in Europe, concerns persist regarding the debt burden of certain Eurozone countries and their ability to meet future financial obligations, the overall stability of the euro and the suitability of the euro as a single currency given the diverse economic and political circumstances in individual member states. These and other concerns could in worst case lead to the re-introduction of individual currencies in one or more member states, or, in more extreme circumstances, the possible dissolution of the euro entirely. These potential developments, or market perceptions concerning these and related issues, could adversely affect our operations and have a material adverse effect on our business, operating results and financial condition.
We may fail to comply with our corporate governance standards which could negatively affect our financial condition, business, results of operations and our brand.
We are subject to corporate governance laws and regulations and are also committed to several corporate responsibility and environmental initiatives. In some of the countries where we operate corruption risks are high. In addition, there is higher focus on anticorruption, with changed legislation in many countries. To ensure that our operations are executed in accordance with applicable requirements, our management system includes a Code of Business Ethics, a Sustainability Policy, as well as other policies and directives to govern our processes and operations. Our commitment to apply the UN Guiding principles for business and human rights to our operation cannot prevent unintended or unlawful use of our technology by non democratic regimes. While we attempt to monitor and audit internal compliance with the policies and directives as well as our suppliers’ adherence to our Code of Conduct and strive for continuous improvements, we cannot provide any assurances that violations will not occur which could have material adverse effects on our operations, business results and brand.
Failure to comply with environmental, health and safety regulations in many jurisdictions may expose us to significant penalties and other sanctions.
We are subject to certain environmental, health and safety laws and regulations that affect our operations, facilities and products in each of the jurisdictions in which we operate. While we believe that we are in compliance with all material laws and regulations related to the environment, health, and safety, we can provide no assurance that we have been, are, or will in the future be compliant with these regulations. If we have failed or fail to comply with these regulations, we could be subject to significant penalties and other sanctions that could have a material adverse effect on our business, operating results and financial condition. Additionally, there is a risk that we may have to incur expenditures to cover environmental and health liabilities to maintain compliance with current or future laws and regulations or to undertake any necessary remediation. It is difficult to reasonably estimate the future impact of environmental matters, such as climate change and weather events, including potential liabilities. This is due to several factors, particularly the length of time often involved in resolving such matters. Adverse future events, regulations, or judgments could have a material effect on our business, operating results and financial condition.
Potential health risks related to electromagnetic fields may subject us to various product liability claims and result in regulatory changes.
The mobile telecommunications industry is subject to claims that mobile handsets and other devices that generate electromagnetic fields expose users to health risks. At present, a substantial number of scientific studies conducted by various independent research bodies have indicated that electromagnetic fields, at levels within the limits prescribed by public health authority safety standards and recommendations, cause no adverse effects to human health. However, any perceived risk or new scientific findings of adverse health effects from mobile communication devices and equipment could adversely affect us through a reduction in sales or through liability claims. Although Ericsson’s products are designed to comply with all current safety standards and
ERICSSON ANNUAL REPORT ON FORM 20-F 2012
recommendations regarding applicable electromagnetic fields, we cannot guarantee that we or the jointly owned ST-Ericsson will not become the subject of product liability claims or be held liable for such claims or be required to comply with future regulatory changes that may have an adverse effect on our business, operating results and financial condition.
New regulations related to “conflict minerals” may cause us to incur additional expenses, and may make our supply chain more complex.
On August 22, 2012, the US Securities and Exchange Commission (the “SEC”), adopted a new rule requiring disclosures beginning in 2014 of specified minerals (“conflict minerals”) that are necessary to the functionality or production of products manufactured or contracted to be manufactured by companies registered with the SEC, whether or not these products or its components are manufactured by third parties. While we believe that we will be able to fulfill these requirements without materially affecting our costs or access to materials, we can provide no assurance that there will not be material costs associated with complying with the disclosure requirements.
While we work and strive to be able to sufficiently verify the origins of these minerals, our supply chain is complex, and we may not be able to sufficiently verify the origins of the relevant minerals used in our products through the due diligence procedures that we implement, which may harm our reputation. In addition, we may encounter challenges if customers require that all of the components of our products be certified as conflict-free. These new disclosure requirements may negatively affect our brand, financial condition, business and results of operations.
RISKS ASSOCIATED WITH OWNING ERICSSON SHARES
Our share price has been and may continue to be volatile, especially as technology companies, securities and markets as a whole remain volatile.
Our share price has been volatile due to various factors, including our operating performance as well as the high volatility in the securities markets generally and volatility in telecommunications and technology companies’ securities in particular. Our share price is also likely to be affected by future developments in our market, our reported financial results and the expectations of financial analysts, as well as statements and market speculation regarding our future prospects or the timing or content of any public communications, including reports of operating results, by us or our competitors.
Factors other than our financial results that may affect our share price include, but are not limited to:
A weakening of our brand name or other circumstances with adverse effects on our reputation
Announcements by our customers, competitors or us regarding capital spending plans of our customers
Financial difficulties for our customers
Awards of large supply or service contracts
Speculation in the press or investment community about the business level or growth in the telecommunications market
Technical problems, in particular those relating to the introduction and viability of new network systems, including lte/4g and new platforms such as the rbs 6000 (multi-standard radio base station) platform
Actual or expected results of ongoing or potential litigation
ERICSSON ANNUAL REPORT ON FORM 20-F 2012
Announcements concerning bankruptcy or investigations into the accounting procedures of ourselves or other telecommunications companies
Our ability to forecast and communicate our future results in a manner consistent with investor expectations.
Currency fluctuations may adversely affect share value or value of dividends.
Because our shares are quoted in SEK on NASDAQ OMX Stockholm (our primary stock exchange), but in USD on NASDAQ New York (ADSs), fluctuations in exchange rates between SEK and USD may affect the value of our shareholders’ investment. In addition, because we pay cash dividends in SEK, fluctuations in exchange rates may affect the value of distributions when converted into other currencies. An increasing part of the trade in our shares is carried out on alternative exchanges or markets, which may lead to less accurate share price information on NASDAQ OMX Stockholm or NASDAQ New York.
ERICSSON ANNUAL REPORT ON FORM 20-F 2012
FORWARD-LOOKING STATEMENTS
This Annual Report includes forward-looking statements, including statements reflecting management’s current views relating to the growth of the market, future market conditions, future events and expected operational and financial performance. The words “believe”, “expect”, “foresee”, “anticipate”, “assume”, “intend”, “may”, “could”, “plan”, “estimate”, “forecast”, “will”, “should”, “predict”, “aim”, “ambition”, “target”, “might” or, in each case, their negative, and similar words are intended to help identify forward-looking statements.
Forward-looking statements may be found throughout this document, but in particular in the chapter “Board of Directors’ Report” and include statements regarding:
Our goals, strategies and operational or financial performance expectations
Development of corporate governance standards, stock market regulations and related legislation
The future characteristics of the markets in which we operate
Projections and other characterizations of future events
Our liquidity, capital resources, capital expenditures, our credit ratings and the development in the capital markets, affecting our industry or us
The expected demand for our existing as well as new products and services
The expected operational or financial performance of our joint ventures and other strategic cooperation activities
The time until acquired entities will be accretive to income
Technology and industry trends including regulatory and standardization environment, competition and our customer structure
Our plans for new products and services including research and development expenditures.
Although we believe that the expectations reflected in these and other forward-looking statements are reasonable, we cannot assure you that these expectations will materialize. Because forward-looking statements are based on assumptions, judgments and estimates, and are subject to risks and uncertainties, actual results could differ materially from those described or implied herein.
Important factors that could affect whether and to what extent any of our forward-looking statements materialize include, but are not limited to:
Our ability to respond to changes in the telecommunications market and other general market conditions in a cost effective and timely manner
Developments in the political, economic or regulatory environment affecting the markets in which we operate, including trade embargoes, changes in tax rates, changes in patent protection regulations, allegations of health risks from electromagnetic fields, cost of radio licenses for our customers, allocation of radio frequencies for different purposes and results of standardization activities
The effectiveness of our strategies and their execution, including partnerships, acquisitions and divestments
Financial risks, including changes in foreign exchange rates or interest rates, lack of liquidity or access to financing, our credit ratings, changes in tax liabilities, credit risks in relation to counterparties, customer defaults under significant customer finance arrangements and risks of confiscation of assets in foreign countries
ERICSSON ANNUAL REPORT ON FORM 20-F 2012
The financial strength of our customer base
The impact of the consolidation in the industry, and the resulting (i) reduction in the number of customers, and adverse consequences of a loss of, or significant decline in, our business with a major customer; (ii) increased strength of a competitor or the establishment of new competitors
The impact of changes in product demand, technology adoption, price erosion, competition from existing or new competitors or new technologies or alliances between vendors of different types of technology and the risk that our products and services may not sell at the rates or levels we anticipate
The product mix and margins of our sales
The volatility of market demand and difficulties to forecast such demand
Our ability to develop commercially viable products, systems and services, to acquire licenses of necessary technology, to protect our intellectual property rights through patents and trademarks and to license them to others and defend them against infringement, and the results of patent litigation
Our ability to manage cyber security incidents
Supply constraints, including component or production capacity shortages, suppliers’ abilities to cost effectively deliver quality products on time and in sufficient volumes, and risks related to concentration of proprietary or outsourced production in a single facility or sole source situations with a single vendor
Our ability to successfully manage operators’ networks to their satisfaction with satisfactory margins
Our ability to maintain a strong brand and good reputation and to be acknowledged for good corporate governance
Our ability to recruit and retain qualified management and other key employees
Our ability to trace conflict minerals in our complex supply chain.
Certain of these risks and uncertainties are described further in “Risk factors”. We undertake no obligation to publicly update or revise any forward-looking statements included in this Annual Report, whether as a result of new information, future events or otherwise, except as required by applicable law or stock exchange regulation.
ERICSSON ANNUAL REPORT ON FORM 20-F 2012
CORPORATE GOVERNANCE REPORT 2012
Corporate governance describes how rights and responsibilities are distributed among corporate bodies according to applicable laws, rules and processes. Corporate governance also defines the decision-making systems and structure through which owners directly or indirectly control a company.
Good corporate governance forms the basis for building a robust corporate culture throughout a global organization. Efficient and reliable controls and procedures are important, but it is also crucial that ethical business practices are highly valued and followed by all people in the organization—starting at the top.
As Chairman of the Board, it is my responsibility to ensure that the Board’s work is efficient and that applicable principles and processes in the Board’s work procedure are complied with. The Board of Directors’ main tasks include supporting Group management and exercising critical review of their work. To be able to fulfill these tasks successfully, it is also my responsibility as Chairman to enable an open and meaningful dialogue between the Board and Group management. Relevant and timely information from Group management is very important as it forms the best possible basis for the Board’s discussions and resolutions. The Board’s work is constantly evaluated and improved to allow the Board to fulfill its duties successfully.
I believe that Ericsson’s continuous focus on corporate governance matters, ethical business and open and meaningful dialogue within the organization promote sustainable business. I believe that this, in turn, generates value for Ericsson’s shareholders.
Leif Johansson
Chairman of the Board of Directors
This Corporate Governance Report is rendered as a separate report added to the Annual Report in accordance with the Annual Accounts Act ((SFS 1995:1554) Chapter 6, Sections 6 and 8) and the Swedish Corporate Governance Code. The report has been reviewed by Ericsson’s auditor in accordance with the Annual Accounts Act.
ERICSSON ANNUAL REPORT ON FORM 20-F 2012
REGULATION AND COMPLIANCE
External rules
As a Swedish public limited liability company with securities quoted on NASDAQ OMX Stockholm as well as on NASDAQ New York, Ericsson is subject to a variety of rules that affect its governance. Major external rules include:
The Swedish Companies Act
The Rule Book for issuers of NASDAQ OMX Stockholm
The Swedish Corporate Governance Code (the “Code”)
NASDAQ Stock Market Rules, including applicable NASDAQ New York corporate governance requirements (subject to certain exemptions principally reflecting mandatory Swedish legal requirements)
Applicable requirements of the US Securities and Exchange Commission (the “SEC”).
Internal rules
In addition, to ensure compliance with legal and regulatory requirements and the high ethical standards that we set for ourselves, Ericsson has adopted internal rules that include:
A Code of Business Ethics
Group Steering Documents, including Group policies and directives, instructions and business processes for approval, control and risk management
A Code of Conduct, to be applied in the product development, production, supply and support of Ericsson products and services worldwide.
The work procedure for the Board of Directors also includes internal corporate governance rules.
Compliance with the Swedish Corporate Governance Code
The Code has been applied by Ericsson since 2005. Ericsson is committed to complying with best-practice corporate governance on a global level wherever possible. This includes continued compliance with the Code. Ericsson has not deviated from any of the rules of the Code. The Code can be found on the website of the Swedish Corporate Governance Board which administrates the Code: www.corporategovernanceboard.se.
Compliance with applicable stock exchange rules
There has been no infringement of applicable stock exchange rules and no breach of good practice on the securities market reported by the stock exchange’s disciplinary committee or the Swedish Securities Council.
Code of Business Ethics
Ericsson’s Code of Business Ethics sets out how the Group works to achieve and maintain high ethical standards. It summarizes the Group’s basic policies and directives and underpins the importance of ethical conduct in all business activities.
The Code of Business Ethics has been translated into 30 languages. This ensures that it is accessible to all employees. During recruitment, employees acknowledge that they are aware of the principles of the Code of
ERICSSON ANNUAL REPORT ON FORM 20-F 2012
Business Ethics. This procedure is repeated at regular intervals throughout the term of employment. Through this process, Ericsson strives to raise awareness and to ensure that the business is run with integrity so that Ericsson can maintain credibility with customers, partners, employees, shareholders and other stakeholders. During 2012, the Code of Business Ethics was reviewed and updated and acknowledged by employees throughout the global organization. In addition, Ericsson’s whistleblower procedure was extended to a greater scope.
All employees have an individual responsibility to ensure that business practices adhere to the Code of Business Ethics.
GOVERNANCE STRUCTURE
Shareholders may exercise their decision-making rights in the Company at General Meetings of shareholders.
A Nomination Committee is appointed by the major shareholders in accordance with the Instruction for the Nomination Committee adopted by the Annual General Meeting of shareholders. The tasks of the Nomination Committee include the proposal of an external auditor and the proposal of Board members for election by the Annual General Meeting of shareholders.
In addition to the Directors elected by shareholders, the Board of Directors consists of employee representatives appointed by the unions. The Board of Directors is ultimately responsible for the organization of Ericsson and the management of its operations.
The President and CEO, appointed by the Board of Directors, is responsible for handling the day-to-day management of Ericsson in accordance with instructions from the Board. The President and CEO is supported by the Executive Leadership Team (ELT).
The external auditor of Ericsson is elected by the General Meeting of shareholders.
SUSTAINABILITY, CORPORATE RESPONSIBILITY AND CORPORATE GOVERNANCE
Sustainability and Corporate Responsibility (CR) are important parts of Ericsson’s corporate governance framework. For Ericsson, sustainability is about long-term social equity, economic prosperity and environmental performance. CR is about maintaining the necessary controls to minimize risks, while creating positive business impacts for Ericsson’s stakeholders and brand, by linking products, services and solutions to an overall business goal of sustainable growth, ensuring that Ericsson is a trusted partner to its stakeholders. Ericsson’s Sustainability and CR strategy is integrated in the Group’s yearly strategy process and implemented in the business units and the regions. The strategy process is further described on pages 204 and 205. CR risks are also included in Ericsson’s risk management framework.
ERICSSON ANNUAL REPORT ON FORM 20-F 2012
During 2012, Ericsson’s continued focus on sustainability and CR matters was reflected through a number of corporate governance activities within the organization:
Effective October 2012, Ericsson’s Head of Sustainability and Corporate Responsibility reports directly to the President and CEO. This repositioning of the Sustainability and CR unit within the organization was made to better integrate the sustainability and CR work with the company’s business operations, decision-making, culture and ways of working and to help build sustainable value creation for Ericsson.
Ericsson’s Code of Business Ethics was reviewed and updated and now includes a commitment to the new UN Guiding Principles on Business and Human Rights. Also, Ericsson’s whistleblower procedure was extended to a wider scope in terms of incidents covered by the procedure and with respect to who can report violations. The updated Code was confirmed by employees throughout the global organization.
The Sales Compliance Board was further strengthened and formalized to assess and manage human rights and CR risks.
SHAREHOLDERS
Ownership structure
As of December 31, 2012, Telefonaktiebolaget LM Ericsson (the “Parent Company”) had 551,719 shareholders (according to the share register kept by Euroclear Sweden AB). Swedish institutions hold approximately 58% of the votes. The largest shareholders are Investor AB, holding 21.37% of the votes, and AB Industrivärden, holding 19.81% of the votes (together with Svenska Handelsbankens Pensionsstiftelse and Pensionskassan SHB Försäkringsförening).
A significant number of the shares held by foreign investors are nominee-registered, i.e. held off-record by banks, brokers and/or nominees. This means that the actual shareholder is not displayed in the share register or included in the shareholding statistics.
ERICSSON ANNUAL REPORT ON FORM 20-F 2012
More information on Ericsson’s shareholders can be found in the chapter “Share Information” in the Annual Report.
CONTACT THE BOARD OF DIRECTORS
Telefonaktiebolaget LM Ericsson
The Board of Directors Secretariat
SE-164 83 Stockholm
Sweden
boardsecretariat@ericsson.com
Shares and voting rights
The share capital of the Parent Company consists of two classes of listed shares: A and B shares. Each Class A share carries one vote and each Class B share carries one tenth of one vote. Class A and B shares entitle the holder to the same proportion of assets and earnings and carry equal rights to dividends.
The Parent Company may also issue Class C shares in order to create treasury stock to finance and hedge long-term variable remuneration programs resolved by the General Meeting of shareholders. Class C shares are converted into Class B shares before they are used for long-term variable remuneration programs.
The members of the Board of Directors and the Executive Leadership Team have the same voting rights on shares as other shareholders.
GENERAL MEETINGS OF SHAREHOLDERS
Decision-making at General Meetings
The decision-making rights of Ericsson’s shareholders are exercised at General Meetings of shareholders. Most resolutions at General Meetings are passed by a simple majority. However, the Swedish Companies Act requires qualified majorities in certain cases, for example in case of:
Amendment of the Articles of Association
ERICSSON ANNUAL REPORT ON FORM 20-F 2012
Resolution to transfer own shares to employees participating in long-term variable remuneration programs.
The Annual General Meeting of shareholders
The Annual General Meeting of shareholders (AGM) is held in Stockholm. The date and venue for the meeting is announced on the Ericsson website no later than at the time of release of the third-quarter interim financial report.
Shareholders who cannot participate in person may be represented by proxy. Only shareholders registered in the share register have voting rights. Nominee-registered shareholders who wish to vote may request to be entered into the share register by the record date for the AGM.
The AGM is held in Swedish and is simultaneously interpreted into English. All documentation provided by the Company is available in both Swedish and English.
The AGM gives shareholders the opportunity to raise questions relating to the operations of the Group. Ericsson always strives to ensure that the members of the Board of Directors and the Executive Leadership Team are present to answer such questions. Shareholders and other interested parties may also correspond in writing with the Company at any time.
The external auditor is always present at the AGM.
Ericsson’s Annual General Meeting 2012
Including shareholders represented by proxy, 3,224 shareholders were represented at the AGM held on May 3, 2012, representing approximately 70% of the votes.
The meeting was also attended by members of the Board of Directors, members of the Executive Leadership Team (ELT) and the external auditor.
Decisions of the AGM 2012 included:
Payment of a dividend of SEK 2.50 per share
Re-election of Leif Johansson as Chairman of the Board of Directors
Re-election of members of the Board of Directors: Roxanne S. Austin, Sir Peter L. Bonfield, Börje Ekholm, Ulf J. Johansson, Sverker Martin-Löf, Nancy McKinstry, Anders Nyrén, Hans Vestberg, Michelangelo Volpi and Jacob Wallenberg
Election of Alexander Izosimov as a new member of the Board of Directors
Board of Directors’ fees:
Chairman: SEK 3,750,000 (unchanged)
Other non-employed Board members: SEK 875,000 each (previously SEK 825,000)
Chairman of the Audit Committee: SEK 350,000 (unchanged)
Other non-employed members of the Audit Committee: SEK 250,000 each (unchanged)
Chairmen of the Finance and Remuneration Committees: SEK 200,000 each (unchanged)
Other non-employed members of the Finance and Remuneration Committees: SEK 175,000 each (unchanged)
ERICSSON ANNUAL REPORT ON FORM 20-F 2012
Approval for part of the Directors’ fees to be paid in the form of synthetic shares
Approval of Guidelines for remuneration to Group Management
Implementation of a Long-Term Variable Remuneration Program 2012, including a share issue of and authorization to the Board to buy back 31,700,000 shares for the program
Approval of the Instruction for the Nomination Committee, including among other things, a procedure on how to appoint the members of the Nomination Committee, to apply until the General Meeting of shareholders resolves otherwise.
The minutes of the AGM 2012 are available at Ericsson’s website.
ANNUAL GENERAL MEETING 2013
Ericsson’s AGM 2013 will take place on April 9, 2013 at Kistamässan in Kista, Stockholm. Shareholders who wish to have a matter addressed at the AGM should submit their written request to the Board in due time before the AGM. Further information is available on Ericsson’s website.
CONTACT THE NOMINATION COMMITTEE
Telefonaktiebolaget LM Ericsson
The Nomination Committee
c/o General Counsel’s Office
SE-164 83 Stockholm
Sweden
nomination.committee@ericsson.com
NOMINATION COMMITTEE
A Nomination Committee was elected by the AGM for the first time in 2001. Since then, each AGM has appointed a Nomination Committee, or resolved on the procedure for appointing the Nomination Committee.
The AGM 2012 resolved on an Instruction for the Nomination Committee, including the tasks of the Nomination Committee and the procedure for appointing the members of the Nomination Committee. The Instruction for the Nomination Committee shall apply until the General Meeting of shareholders resolves otherwise. Under the instruction, the Nomination Committee shall consist of:
Representatives of the four largest shareholders by voting power by the end of the month in which the AGM was held
The Chairman of the Board of Directors.
As described in the Instruction for the Nomination Committee, the Committee may include additional members following a request by a shareholder. The request must be justified by changes in the shareholder’s ownership of shares and be received by the Nomination Committee no later than December 31. No fees are paid to the members of the Nomination Committee.
Members of the Nomination Committee
In addition to the Chairman of the Board of Directors, Leif Johansson, the current Nomination Committee consists of four representatives appointed by the four shareholders with the largest voting power as of May 31, 2012:
Petra Hedengran (Investor AB), Chairman of the Nomination Committee
ERICSSON ANNUAL REPORT ON FORM 20-F 2012
Carl-Olof By (AB Industrivärden, Svenska Handelsbankens Pensionsstiftelse)
Johan Held (AFA Försäkring)
Marianne Nilsson (Swedbank Robur Fonder).
The tasks of the Nomination Committee
Over the years, the tasks of the Nomination Committee have evolved to comply with the requirements of the Code. The main task of the Committee remains to propose Board members for election by the AGM. In doing this, the Committee must not only orientate itself on the Company’s strategy and future challenges to be able to assess the competence and experience that is required by the Board; it must also consider all applicable rules on independence of the Board of Directors and its committees.
In addition, the Committee prepares remuneration proposals, for resolution by the AGM, to non-employed Directors elected by the AGM and to the auditor.
The assignment of the Nomination Committee further includes proposing auditors, whereby candidates are selected in cooperation with the Audit Committee of the Board. The Committee also proposes a candidate for election of the Chairman at the AGM.
Work of the Nomination Committee for the AGM 2013
The Nomination Committee started its work by going through a checklist of all its duties according to the Code and the Instruction for the Nomination Committee, resolved by the AGM. The Committee also set a time plan for its work ahead. A thorough understanding of Ericsson’s business is paramount to the role of the members of the Committee. Therefore, the President and CEO was invited to, together with the Chairman of the Board, present their views on the Company’s position and strategy.
The Committee was thoroughly informed of the results of the evaluation of the Board’s work and procedures, including the performance of the Chairman of the Board. On this basis, the Committee was able to assess the competence and experience required by Board members. When proposing Board members, the Nomination Committee considered a number of things, including necessary experience and competence as well as the value of diversity and renewal and the improvement of gender balance.
The Committee also acquainted itself with the assessments made by the Company and the Audit Committee on the quality and efficiency of external auditor work, and received recommendations on external auditor and audit fees. As of March 5, 2013 the Nomination Committee has held six meetings.
PROPOSALS TO THE NOMINATION COMMITTEE
Shareholders may submit proposals to the Nomination Committee at any time, but should do so in due time before the AGM to ensure that the proposals can be considered by the Committee. Further information is available on Ericsson’s website.
BOARD OF DIRECTORS
The Board of Directors is ultimately responsible for the organization of Ericsson and the management of Ericsson’s operations. The Board of Directors develops guidelines and instructions for day-to-day operations, managed by the President and CEO. The President and CEO ensures that the Board is updated regularly on events of importance to the Group. This includes updates on business development, results, financial position and the liquidity of the Group.
ERICSSON ANNUAL REPORT ON FORM 20-F 2012
According to the Articles of Association, the Board of Directors shall consist of no less than five and no more than 12 directors, with no more than six deputies. In addition, under Swedish law, trade unions have the right to appoint three directors and their deputies to the Board.
Directors serve from the close of one AGM to the close of the next, but can serve any number of consecutive terms.
The President and CEO may be elected director of the Board, but, under the Swedish Companies Act, the President of a public company may not be elected Chairman of the Board.
Conflicts of interest
Ericsson maintains rules and regulations regarding conflicts of interest. Directors are disqualified from participating in any decision regarding agreements between themselves and Ericsson. The same applies to agreements between Ericsson and any third party or legal entity in which the Board member has an interest.
The Audit Committee has implemented a procedure on related-party transactions and a pre-approval process for non-audit services carried out by the external auditor.
Composition of the Board of Directors
The Board of Directors consists of 12 Directors, including the Chairman of the Board, elected by the shareholders at the AGM 2012 for the period until the close of the AGM 2013. It also consists of three employee representatives, each with a deputy, appointed by the trade unions for the same period of time. The President and CEO, Hans Vestberg, is the only Board member who was also a member of Ericsson’s management during 2012.
Work procedure
Pursuant to the Swedish Companies Act, the Board of Directors has adopted a work procedure that outlines rules for the distribution of tasks between the Board and its Committees as well as between the Board, its Committees and the President and CEO. This complements the regulations in the Swedish Companies Act and in the Articles of Association of the Company. The work procedure is reviewed, evaluated and adopted by the Board as required and at least once a year.
Independence
The Board of Directors and its Committees are subject to a variety of independence rules under applicable Swedish law, the Code and applicable US securities laws, SEC rules and the NASDAQ Stock Market Rules. However, Ericsson can rely on exemptions from certain US requirements.
The composition of the Board of Directors meets all applicable independence criteria. The Nomination Committee concluded before the AGM 2012 that, for purposes of the Code, at least seven of the nominated Directors were independent of Ericsson, its senior management and its major shareholders. These were Roxanne S. Austin, Sir Peter L. Bonfield, Alexander Izosimov, Leif Johansson, Ulf J. Johansson, Nancy McKinstry and Michelangelo Volpi.
Structure of the work of the Board of Directors
The work of the Board follows a yearly cycle. This enables the Board to appropriately address each of its duties and to keep strategy, risk assessment and value creation high on the agenda.
ERICSSON ANNUAL REPORT ON FORM 20-F 2012
The yearly cycle starts with the statutory Board meeting which is held in connection with the AGM. At this meeting, members of each of the three Board Committees are appointed and the Board resolves on signatory power.
First interim report meeting
At the next ordinary meeting (depending on the date of the AGM), the Board handles the interim financial report for the first quarter of the year.
Various strategic issues are addressed at most of the Board meetings. In accordance with the annual cycle for the strategy process, a main strategy Board meeting is also held, which is in essence dedicated to short- and long-term strategies of the Group. Following the Board’s input on and approval of the overall strategy, the strategy is cascaded throughout the entire organization, starting at the Global Leadership Summit with Ericsson’s top 250 leaders.
Second interim report meeting
At the second interim report meeting, the Board handles the interim financial report for the second quarter of the year.
Follow-up strategy and risk management meeting
Following the summer, a meeting is held to address particular strategy matters in further detail and to finally confirm the Group strategy. The meeting also addresses the overall risk management of the Group.
Third interim report meeting
A Board meeting is held to handle the interim financial report for the third quarter of the year. At this meeting, the results of the Board evaluation are presented to and discussed by the Board.
Budget and financial outlook meeting
A meeting is held for the Board to address the budget and financial outlook as well as further analysis of internal and external risks.
Fourth-quarter and full-year financial results meeting
Following the end of the calendar year, the Board holds a meeting which focuses on the financial results of the entire year and handles the fourth-quarter financial report.
The Annual Report meeting closes the yearly cycle of work of the Board of Directors. At this meeting the Board approves the Annual Report.
As the Board is responsible for financial oversight, financial information is presented and evaluated at each Board meeting. Furthermore, each Board meeting generally includes reports on Committee work by the Chairman of each Committee. In addition, minutes from Committee meetings are distributed to all Directors prior to the Board meeting.
ERICSSON ANNUAL REPORT ON FORM 20-F 2012
At every Board meeting, the President and CEO reports on business and market developments as well as on the financial performance of the Company. Strategic issues and risks are also addressed at most Board meetings. The Board is regularly informed of developments in legal and regulatory matters of importance.
The Board’s annual work cycle
The annual cycle applied to the Board’s work allows the Board to appropriately address its duties during the year. It also facilitates for the organization to align its global processes to allow appropriate Board involvement. This is particularly relevant for the Group’s strategy process and risk management.
Auditor involvement
The Board meets with Ericsson’s external auditor in closed sessions at least once a year to receive and consider the auditor’s observations. The auditor reports to management on the accounting and financial reporting practices of the Group.
The Audit Committee also meets with the auditor to receive and consider observations on the interim reports and the Annual Report. The auditor has been instructed to report on whether the accounts, the management of funds and the general financial position of the Group are under control in all material respects.
In addition, the Board reviews and assesses the process for financial reporting, as described later in “Internal control over financial reporting 2012”. Combined with internal controls, the Board’s and the auditor’s review of interim and annual reports are deemed to give reasonable assurance on the quality of financial reporting.
Training of the Board of Directors
All new Directors receive comprehensive training tailored to their individual needs. Introductory training typically includes meetings with the heads of the business units and Group functions, as well as training arranged by NASDAQ OMX Stockholm on listing issues and insider rules. In addition, full-day training sessions are held twice a year for all Directors. These sessions enhance the Directors’ knowledge of specific operations and issues as appropriate to ensure that the Board has knowledge and understanding of the forefront of technical development and of the business activities of the Group.
As a rule, the Board receives Sustainability and Corporate Responsibility training at least once a year.
ERICSSON ANNUAL REPORT ON FORM 20-F 2012
Key focus areas in Board training in 2012 were:
Technology leadership, including market development, competitor overview, Ericsson Research long-term view and ways of working.
Ericsson’s strategic forecast, including purpose, process, roles and methodology forecast.
Work of the Board of Directors in 2012
In 2012, 12 Board meetings were held. For attendance at Board meetings, see the table on page 195. Among the matters addressed by the Board this year (apart from regular matters in the annual Board work cycle) were:
A number of acquisitions, including BelAir Networks, Technicolor’s broadcast services division, ConceptWave and increased ownership in Ericsson-LG.
Entry to the US bond market through issuing a ten-year US bond.
Loan agreements with the European Investment Bank (EIB) and the Nordic Investment Bank (NIB).
Strong focus on risk management, strategy and the competitive market development, as well as on sustainability and corporate responsibility matters.
A number of divestments, including the divestment of the Multimedia brokering platform (IPX) and EDA 1500 GPON assets.
Continued focus on the effects of general financial uncertainty on the market, including the effects of political unrest in the Middle East and Africa and financial uncertainty in Europe.
Continuous work relating to strategic plans for the joint venture ST-Ericsson.
Board work evaluation
A key objective of the Board evaluation is to ensure that the Board is functioning well. This includes gaining an understanding of the issues that the Board thinks warrant greater focus, as well as determining areas where additional competence is needed within the Board. The evaluation also serves as guidance for the work of the Nomination Committee.
Each year, the Chairman of the Board initiates and leads the evaluation of the Board and Committee work and procedures. Evaluation tools include detailed questionnaires and discussions.
In 2012, all the Directors responded to written questionnaires, covering the Director’s individual performance, Board work in general, Committee work and the Chairman’s performance. The Chairman was not involved in the development or compilation of the questionnaire which related to his performance, nor was he present when his performance was evaluated. The evaluations were thoroughly discussed and an action plan was developed in order to further improve the work of the Board.
COMMITTEES OF THE BOARD OF DIRECTORS
The Board of Directors has established three Committees: the Audit Committee, the Finance Committee and the Remuneration Committee. Members of each Committee are appointed for one year amongst the Board members.
The task of the Committees is mainly to prepare matters for final resolution by the Board. However, the Board has authorized each Committee to determine certain issues in limited areas. It may also on occasion provide extended authorization for the Committees to determine specific matters.
ERICSSON ANNUAL REPORT ON FORM 20-F 2012
If deemed appropriate, the Board of Directors and each Committee have the right to engage external expertise, either in general or with respect to specific matters.
Prior to the Board meetings, each Committee submits to the Board minutes from Committee meetings. The Chairman of the Committee also reports on the Committee work at each Board meeting.
Audit Committee
On behalf of the Board, the Audit Committee monitors the following:
The scope and correctness of the financial statements
Compliance with legal and regulatory requirements
Internal control over financial reporting
The effectiveness and appropriateness of the Group’s anti-corruption program.
The Audit Committee also reviews the annual and interim financial reports and oversees the external audit process, including audit fees. This involves:
Reviewing, with management and the external auditor, the financial statements (including their conformity with generally accepted accounting principles)
Reviewing, with management, the reasonableness of significant estimates and judgments made in preparing the financial statements, as well as the quality of the disclosures in the financial statements
Reviewing matters arising from reviews and audits performed.
The Audit Committee itself does not perform audit work. Ericsson has an internal audit function which reports directly to the Audit Committee.
The Committee is also involved in the preparatory work of proposing auditor for election by the AGM. It also monitors Group transactions and the ongoing performance and independence of the auditor with the aim to avoid conflicts of interest.
ERICSSON ANNUAL REPORT ON FORM 20-F 2012
In order to ensure the auditor’s independence, the Audit Committee has established pre-approval policies and procedures for non-audit related services to be performed by the external auditor. Pre-approval authority may not be delegated to management. The Audit Committee also oversees:
The process for reviewing transactions with related parties
The whistleblower procedure for the reporting of alleged violations of the Code of Business Ethics that (i) are conducted by Group or local management, and (ii) relate to corruption, questionable accounting or auditing matters or otherwise seriously affect vital interests of the Group or personal health and safety. The whistleblower procedure was updated and extended during 2012 in connection with the review and update of the Code of Business Ethics.
Violations reported through the whistleblower procedure are investigated by Ericsson’s internal audit function together with the relevant Group function. Information regarding any incident is reported to the Audit Committee. Reports include measures taken, details of the responsible Group function and the status of any investigation.
Members of the Audit Committee
The Audit Committee consists of five Board members appointed by the Board. In 2012, the Audit Committee comprised Ulf J. Johansson (Chairman of the Committee), Roxanne S. Austin, Sir Peter L. Bonfield, Kristina Davidsson and Sverker Martin-Löf.
The composition of the Audit Committee meets all applicable independence requirements. The Board of Directors has determined that each of Ulf J. Johansson, Roxanne S. Austin, Sir Peter L. Bonfield and Sverker Martin-Löf is an audit committee financial expert, as defined under the SEC rules. Each of them is independent under applicable US securities laws, SEC rules and NASDAQ Stock Market Rules and each of them is financially literate and familiar with the accounting practices of an international company, such as Ericsson.
Former authorized public accountant Peter Markborn was previously appointed as an external expert advisor to assist and advise the Audit Committee. He left this assignment during 2012.
Work of the Audit Committee in 2012
The Audit Committee held six meetings in 2012. Directors’ attendance is reflected in the table on page 195. During the year, the Audit Committee reviewed the scope and results of external financial audits and the independence of the external auditor. It also monitored the external audit fees and approved non-audit services performed by the external auditor in accordance with the Committee’s pre-approval policies and procedures.
ERICSSON ANNUAL REPORT ON FORM 20-F 2012
The Committee approved the annual audit plan for the internal audit function and reviewed its reports. Prior to publishing it, the Committee also reviewed and discussed each interim report with the external auditor.
The Committee monitored the continued compliance with the Sarbanes-Oxley Act as well as the internal control and risk management process. It also reviewed certain related-party transactions in accordance with its established process.
The Committee reviewed and evaluated the effectiveness and appropriateness of the Group’s anti-corruption program.
Finance Committee
The Finance Committee is primarily responsible for:
Handling matters related to acquisitions and divestments
Handling capital contributions to companies inside and outside the Ericsson Group
Raising loans, issuing guarantees and similar undertakings, and approving financial support to customers and suppliers
Continuously monitoring the Group’s financial risk exposure.
The Finance Committee is authorized to determine matters such as:
Direct or indirect financing
Granting of securities and guarantees
Certain investments, divestments and financial commitments.
Members of the Finance Committee
The Finance Committee consists of four Board members appointed by the Board. In 2012, the Finance Committee comprised: Leif Johansson (Chairman of the Committee), Pehr Claesson, Anders Nyrén and Jacob Wallenberg.
Work of the Finance Committee in 2012
The Finance Committee held seven meetings in 2012. Directors’ attendance is reflected in the table on page 195. During the year, the Finance Committee approved numerous customer finance credit arrangements and reviewed a number of potential mergers and acquisitions and real estate investments from a financial perspective. As a result of the uncertainty on the financial markets and the macroeconomic development, the Finance Committee has focused particularly on discussing and securing an adequate capital structure, cash flow and cash-generating ability. It has also continuously monitored Ericsson’s financial position and credit exposure.
Remuneration Committee
The Remuneration Committee’s main responsibility is to prepare for resolution by the Board of Directors matters regarding salary and other remuneration, including pension benefits of the President and CEO, the Executive Vice Presidents and other officers who report directly to the President and CEO. Responsibilities include:
Reviewing and preparing for resolution by the Board, proposals on salary and other remuneration, including retirement compensation, for the President and CEO
ERICSSON ANNUAL REPORT ON FORM 20-F 2012
Reviewing and preparing for resolution by the Board, proposals to the AGM on guidelines for remuneration to the ELT
Approving proposals on salary and other remuneration, including retirement compensation, for the Executive Vice Presidents and other CEO direct reports
Reviewing and preparing for resolution by the Board, proposals to the AGM on LTV and similar equity arrangements.
Consideration is given to trends in remuneration, legislative changes, disclosure rules and the general global environment surrounding executive remuneration. The Committee reviews salary survey data before approving any salary adjustment for CEO direct reports. In addition, the Committee prepares salary adjustments for the President and CEO for resolution by the Board.
Members of the Remuneration Committee
The Remuneration Committee consists of four Board members appointed by the Board. In 2012, the Remuneration Committee comprised: Leif Johansson (Chairman of the Committee), Börje Ekholm, Nancy McKinstry and Karin Åberg.
Piia Pilv has been appointed by the Remuneration Committee as an independent expert advisor to assist the Committee, particularly regarding international trends and developments.
Work of the Remuneration Committee in 2012
The Remuneration Committee held six meetings in 2012. Directors’ attendance is reflected in the table on page 195.
The Committee reviewed and prepared a proposal for the LTV 2012 for resolution by the Board. This was approved by the AGM 2012. The Committee further resolved on salaries and Short-Term Variable remuneration (STV) for 2012 for CEO direct reports. It prepared remuneration to the President and CEO, for resolution by the Board. The Committee also prepared guidelines for remuneration to the ELT, which were subsequently referred by the Board to the AGM for approval.
Towards the end of the year, the Committee concluded its analysis of the current LTV structure and executive remuneration. The resulting proposals on LTV and guidelines for remuneration to the ELT will be referred to the AGM 2013 for resolution.
For further information on fixed and variable remuneration, please see Notes to the consolidated financial statements—Note C28 “Information regarding members of the Board of Directors, the Group management and employees” and the “Remuneration Report” included in the Annual Report.
ERICSSON ANNUAL REPORT ON FORM 20-F 2012
Directors’ attendance and fees 2012
| | | | | | | | | | | | | | | | | | | | | | | | |
| | | Fees resolved by the
AGM 2012 | | | Number of Board/Committee
meetings attended | |
Board member | | Board
fees1) | | | Committee
fees | | | Board | | | Audit
Committee | | | Finance
Committee | | | Remuneration
Committee | |
Leif Johansson | | | 3,750,000 | | | | 400,000 | | | | 12 | | | | | | | | 7 | | | | 6 | |
Sverker Martin-Löf | | | 875,000 | | | | 250,000 | | | | 12 | | | | 6 | | | | | | | | | |
Jacob Wallenberg | | | 875,000 | | | | 175,000 | | | | 12 | | | | | | | | 5 | | | | | |
Roxanne S. Austin | | | 875,000 | | | | 250,000 | | | | 11 | | | | 6 | | | | | | | | | |
Sir Peter L. Bonfield | | | 875,000 | | | | 250,000 | | | | 12 | | | | 6 | | | | | | | | | |
Börje Ekholm | | | 875,000 | | | | 175,000 | | | | 12 | | | | | | | | | | | | 6 | |
Alexander Izosimov2) | | | 875,000 | | | | | | | | 8 | | | | | | | | | | | | | |
Ulf J. Johansson | | | 875,000 | | | | 350,000 | | | | 12 | | | | 6 | | | | | | | | | |
Nancy McKinstry | | | 875,000 | | | | 175,000 | | | | 11 | | | | | | | | | | | | 6 | |
Anders Nyrén | | | 875,000 | | | | 175,000 | | | | 12 | | | | | | | | 7 | | | | | |
Carl-Henric Svanberg3) | | | — | | | | | | | | 4 | | | | | | | | | | | | | |
Hans Vestberg | | | — | | | | | | | | 12 | | | | | | | | | | | | | |
Michelangelo Volpi | | | 875,000 | | | | | | | | 10 | | | | | | | | | | | | | |
Pehr Claesson | | | 18,000 | 7) | | | | | | | 12 | | | | | | | | 7 | | | | | |
Jan Hedlund4) | | | 6,000 | 7) | | | | | | | 4 | | | | 3 | | | | | | | | | |
Karin Åberg | | | 18,000 | 7) | | | | | | | 12 | | | | | | | | | | | | 6 | |
Kristina Davidsson5) | | | 18,000 | 7) | | | | | | | 12 | | | | 3 | | | | | | | | | |
Rickard Fredriksson6) | | | 10,500 | 7) | | | | | | | 7 | | | | | | | | | | | | | |
Karin Lennartsson | | | 18,000 | 7) | | | | | | | 12 | | | | | | | | | | | | | |
Roger Svensson | | | 18,000 | 7) | | | | | | | 12 | | | | | | | | | | | | | |
| | | | | | | | | | | | | | | | | | | | | | | | |
Total number of meetings | | | | | | | | | | | 12 | | | | 6 | | | | 7 | | | | 6 | |
| | | | | | | | | | | | | | | | | | | | | | | | |
| 1) | Non-employed Directors can choose to receive part of their Board fee (exclusive of Committee fees) in the form of American Depositary Shares (ADS) evidenced by American Depositary Receipts (ADR) undersynthetic shares. |
| 2) | Elected Board member as of May 3, 2012. |
| 3) | Resigned as Board member as of May 3, 2012. |
| 4) | Resigned as employee representative and from the symbol ERIC. Each ADS represents one Class B share.In 2009, approximately 7 (20) billion shares were traded on NASDAQ OMX StockholmAudit Committee as of May 3, 2012.
|
| 5) | Member of the Audit Committee since May 3, 2012. |
| 6) | Appointed deputy employee representative as of May 3, 2012. |
| 7) | Employee representative Board members and NASDAQ, of which about 74 (84) percent were on NASDAQ OMX Stockholm and about 26 (16) percent were on NASDAQ. Trading volume in Ericsson shares decreased by approximately 71 percent on NASDAQ OMX Stockholm and increased by approximately 7 percent on NASDAQ as comparedtheir deputies are not entitled to 2008. (Note: Ericsson had a reversed split of shares of 1:5 for the B-share on June 2, 2008 and a 10:1 to 1:1 changeBoard fee but compensation in the ADS ratio from June 10, 2008 which affects the comparative figures above.)SHARE PRICE TREND
In 2009, Ericsson’s total market value increased by about 13 (–22) percent to approximatelyamount of SEK 215 billion (SEK 191 billion in 2008)1,500 per attended Board meeting.
|
REMUNERATION TO BOARD MEMBERS
Remuneration to Board members not employed by the Company is proposed by the Nomination Committee for resolution by the AGM.
The AGM 2012 approved the Nomination Committee’s proposal for fees to the non-employed Board members for Board and Committee work. For information on Board of Directors’ fees 2012, please refer to Notes to the consolidated financial statements—Note C28 “Information regarding members of the Board of Directors, the Group management and employees” in the Annual Report. The AGM 2012 also approved the Nomination Committee’s proposal that Board members may be paid part of their Board fee in the form of synthetic shares.
A synthetic share gives the right to receive a future cash payment of an amount which corresponds to the market value of a Class B share in Ericsson at the time of payment. The director’s right to receive payment with regard to allocated synthetic shares occurs, as a main rule, after the publication of the Company’s year-end
ERICSSON ANNUAL REPORT ON FORM 20-F 2012
financial statement during the fifth year following the General Meeting which resolved on the allocation of the synthetic shares. The purpose of paying part of the Board of Directors’ fee in the form of synthetic shares is to further align the Directors’ interest with shareholder interest. For more information on the terms and conditions of the synthetic shares, please refer to the notice convening the AGM 2012 and to the minutes from the AGM 2012, which are available at Ericsson’s website.
MEMBERS OF THE BOARD OF DIRECTORS
Board members elected by the AGM 2012
Leif Johansson(first elected 2011)
Chairman of the Board of Directors, Chairman of the Remuneration Committee and of the Finance Committee
Born 1951. Master of Science in Engineering, Chalmers University of Technology, Gothenburg, Sweden.
Board Chairman: Astra Zeneca PLC, European Round Table of Industrialists and the International Advisory Board of the Nobel Foundation.
Board Member: Svenska Cellulosa Aktiebolaget SCA and Ecolean AB.
Holdings in Ericsson1): 17,933 Class B shares. Principal work experience and other information: President of the Royal Swedish Academy of Engineering Sciences. President and CEO of AB Volvo 1997-2011. Executive Vice President of AB Electrolux 1988-1991, President 1991-1994 and President and CEO of AB Electrolux 1994-1997. Holds honorary Doctorates at Blekinge Institute of Technology, the University of Gothenburg and Chalmers University of Technology. Awarded the Large Gold Medal of the Royal Swedish Academy of Engineering Sciences in 2011.
Sverker Martin-Löf(first elected 1993)
Deputy Chairman of the Board of Directors, Member of the Audit Committee
Born 1943. Doctor of Technology and Master of Engineering, KTH Royal Institute of Technology, Stockholm, Sweden.
Board Chairman: Svenska Cellulosa Aktiebolaget SCA, SSAB and AB Industrivärden.
Board Member: Skanska AB and Svenska Handelsbanken AB.
Holdings in Ericsson1): 10,400 Class B shares.
Principal work experience and other information: President and CEO of Svenska Cellulosa Aktiebolaget SCA 1990–2002, where he was employed 1977–1983 and 1986–2002. Previous positions at Sunds Defibrator and Mo och Domsjö AB.
Jacob Wallenberg(first elected 2011)
Deputy Chairman of the Board of Directors, Member of the Finance Committee
Born 1956. Bachelor of Science in Economics and Master of Business Administration, Wharton School, University of Pennsylvania, USA. Officer of the Reserve, Swedish Navy.
Board Chairman:Investor AB.
Deputy Board Chairman: SAS AB and SEB Skandinaviska Enskilda Banken AB (SEB). The OMXSP Index on NASDAQ OMX Stockholm increased by 47 percent, the NASDAQ telecom index (CUTL) increased by approximately 48 percent and the NASDAQ composite index (CCMP) increased by approximately 44 percent.
SHARE DATA
| | | | | | | | | | |
| | | 2009 | | 2008 | | 2007 | | 2006 | | 2005 |
Earnings per share, diluted (SEK) | | 1.14 | | 3.52 | | 6.84 | | 8.23 | | 7.64 |
Operating income per share (SEK)2) | | 5.80 | | 7.50 | | 9.64 | | 11.29 | | 10.44 |
Cash flow from operating activities per share (SEK) | | 7.67 | | 7.54 | | 6.04 | | 5.82 | | 5.26 |
Stockholders’ equity per share, basic, end of period (SEK) | | 43.79 | | 44.21 | | 42.17 | | 37.82 | | 32.03 |
P/E ratio | | 57 | | 17 | | 11 | | 17 | | 18 |
Total shareholder return % | | 15 | | –20 | | –43 | | 3 | | 31 |
Dividend per share (SEK)1)2) | | 2.00 | | 1.85 | | 2.50 | | 2.50 | | 2.25 |
1) | 2005, 2006 and 2007 restated for reverse split 1:5 in 2008. |
2) | For 2009 and 2008 excluding restructuring charges. |
3) | For 2009 as proposed by the Board of Directors. |
All share based performance indicators except Earnings per share and Stockholders’ equity per share are calculated based on average
| 1) | The number of shares outstanding, basic. Comparison periods has been restated for consistency.SHARE PRICES ON NASDAQ OMX STOCKHOLM
| | | | | | | | | | | (SEK) | | 2009 | | 2008 | | 2007 | | 2006 | | 2005 | Class A at last day of trading1) | | 65.00 | | 59.30 | | 76.80 | | 138.00 | | 137.50 | Class A high for year (April 17, 2009)1) | | 78.80 | | 83.60 | | 148.50 | | 154.50 | | 143.50 | Class A low for year (January 20, 2009)1) | | 55.40 | | 40.60 | | 73.00 | | 104.50 | | 99.00 | Class B at last day of trading1) | | 65.90 | | 58.80 | | 75.90 | | 138.25 | | 136.50 | Class B high for year (April 17, 2009)1) | | 79.60 | | 83.70 | | 149.50 | | 155.00 | | 145.00 | Class B low for year (January 20, 2009)1) | | 55.50 | | 40.60 | | 72.65 | | 104.50 | | 97.00 |
1) | 2005, 2006 and 2007 restated for reverse split 1:5 in 2008. |
ERICSSON ANNUAL REPORT ON FORM 20-F 2009
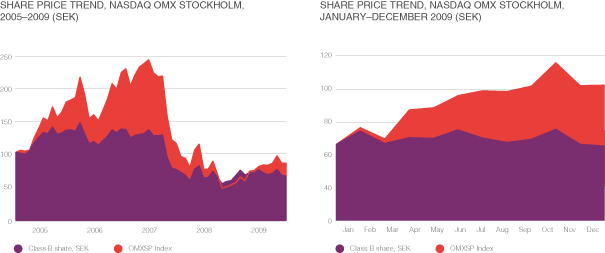
OFFER AND LISTING DETAILS
Principal trading market—NASDAQ OMX Stockholm—share prices
The table to the right states the high and low sales prices for our Class A and Class B shares as reported by NASDAQ OMX Stockholm for the last five years. The equity securities listed on the NASDAQ OMX Stockholm Official Price List of Shares currently comprise the shares of 258 companies. Trading on the exchange generally continues until 5:30 p.m. (CET) each business day. In addition to official trading on the exchange, there is also trading off the exchange during official trading hours and also after 5:30 p.m. (CET). Trading on the exchange tends to involve a higher percentage of retail clients, while trading off the exchange often involves larger Swedish institutions, banks arbitraging between the Swedish market and foreign markets, and foreign buyers and sellers purchasing shares from or selling shares to Swedish institutions.
NASDAQ OMX Stockholm publishes a daily Official Price List of Shares which includes the volume of recorded transactions in each listed stock, together with the prices of the highest and lowest recorded trades of the day. The Official Price List of Shares reflects price and volume information for trades completed by the members.
Host market NASDAQ—ADS prices
The table to the right states the high and low sales prices quoted for our ADSs on NASDAQ for the last five years. The NASDAQ quotations represent prices between dealers, not including retail mark-ups, markdowns or commissions, and do not necessarily represent actual transactions.
ERICSSON ANNUAL REPORT ON FORM 20-F 2009
MARKET PRICES ON NASDAQ OMX STOCKHOLM AND NASDAQ
| | | | | | | | | | | | | | | | NASDAQ OMX Stockholm | | NASDAQ | | | | SEK per Class A share | | SEK per Class B share | | USD per ADS1) | Period | | High | | Low | | High | | Low | | High | | Low | | Annual high and low | | | | | | | | | | | | | 20052) | | 143.50 | | 99.00 | | 145.00 | | 97.00 | | 18.60 | | 13.89 | 20062) | | 154.50 | | 104.50 | | 155.00 | | 104.50 | | 20.57 | | 14.44 | 20072) | | 148.50 | | 73.00 | | 149.50 | | 72.65 | | 21.71 | | 11.12 | 2008 | | 83.60 | | 40.60 | | 83.70 | | 40.60 | | 14.00 | | 5.49 | 2009 | | 78.80 | | 55.40 | �� | 79.60 | | 55.50 | | 10.92 | | 6.60 | | Quarterly high and low | | | | | | | | | | | | | 2008 | | | | | | | | | | | | | First Quarter | | 79.50 | | 51.10 | | 78.90 | | 50.25 | | 12.28 | | 8.52 | Second Quarter | | 83.60 | | 58.70 | | 83.70 | | 57.50 | | 14.00 | | 9.76 | Third Quarter | | 75.80 | | 61.60 | | 75.80 | | 61.20 | | 12.65 | | 9.03 | Fourth Quarter | | 66.60 | | 40.60 | | 65.90 | | 40.60 | | 9.15 | | 5.49 | 2009 | | | | | | | | | | | | | First Quarter | | 78.00 | | 55.40 | | 78.70 | | 55.50 | | 9.65 | | 6.60 | Second Quarter | | 78.80 | | 64.10 | | 79.60 | | 64.00 | | 9.92 | | 8.10 | Third Quarter | | 78.60 | | 65.80 | | 79.50 | | 66.10 | | 10.84 | | 9.10 | Fourth Quarter | | 76.25 | | 64.70 | | 76.95 | | 65.25 | | 10.92 | | 8.94 | Monthly high and low | | | | | | | | | | | | | August 2009 | | 70.60 | | 65.80 | | 71.20 | | 66.10 | | 10.04 | | 9.10 | September 2009 | | 74.30 | | 67.10 | | 74.70 | | 67.50 | | 10.84 | | 9.29 | October 2009 | | 76.25 | | 67.00 | | 76.95 | | 67.30 | | 10.92 | | 9.73 | November 2009 | | 75.40 | | 65.65 | | 76.00 | | 66.30 | | 10.74 | | 9.56 | December 2009 | | 68.35 | | 64.70 | | 68.90 | | 65.25 | | 9.96 | | 8.94 | January 2010 | | 72.20 | | 65.20 | | 73.30 | | 65.90 | | 10.31 | | 9.46 | February 2010 | | 73.50 | | 69.20 | | 74.65 | | 70.15 | | 10.28 | | 9.84 | March 2010 | | 78.70 | | 69.90 | | 80.00 | | 70.95 | | 11.33 | | 9.84 |
1) | One ADS = 1 Class B share. |
2) | 2005, 2006 and 2007 restated for reverse split 1:5 in 2008. |
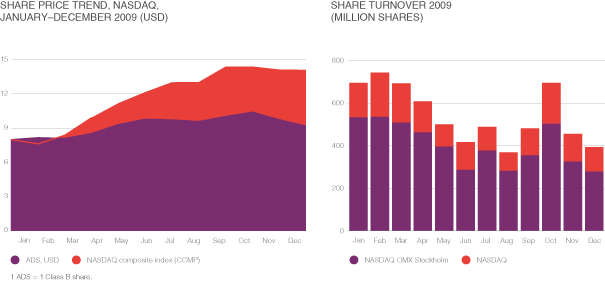
ERICSSON ANNUAL REPORT ON FORM 20-F 2009
CHANGES IN NUMBER OF SHARES AND CAPITAL STOCK 2005–2009
| | | | | | | | | | | | Number of shares | | Share capital | | 2005 | | December 31 (no changes) | | 16,132,258,678 | | 16,132,258,678 | | 2006 | | December 31 (no changes) | | 16,132,258,678 | | 16,132,258,678 | | 2007 | | December 31 (no changes) | | 16,132,258,678 | | 16,132,258,678 | | 2008 | | June 2, reverse split 1:5 | | 3,226,451,735 | | 16,132,258,678 | | 2008 | | July 23, new issue. (Class C shares, later converted to Class B) | | 19,900,000 | | 99,500,000 | | 2008 | | December 31 | | 3,246,351,735 | | 16,231,758,678 | | 2009 | | June 8, new issue (Class C-shares, later converted to Class B) | | 27,000,000 | | 135,000,000 | | 2009 | | December 31 | | 3,273,351,735 | | 16,366,758,678 |
SHARE CAPITAL
In the second quarter, as decided by the Board of Directors with authorization from the Annual General Meeting, a stock issue and a subsequent repurchase was made for the share-based employee remuneration program. 27 million Class C shares were issued and later repurchased as treasury stock. The shares were converted into Class B shares. The quotient value of the repurchased shares was SEK 135.0 million, representing less than 1 percent of capital stock, and the acquisition cost was SEK 135.1 million.
As of December 31, 2009, the Parent Company’s share capital was SEK 16,366,758,678 (16,231,758,678) represented by 3,273,351,735 (3,246,351,735) shares. The quotient value of each share is SEK 5.00 (SEK 5.00). As of December 31, 2009, the shares were divided into 261,755,983 (261,755,983) Class A shares, each carrying one vote, and 3,011,595,752 (2,984,595,752) Class B shares, each carrying one-tenth of one vote. As of December 31, 2009, Ericsson held 78 978 533 Class B shares as treasury shares.
TEN LARGEST COUNTRIES, OWNERSHIP
| | | | | | | | | | As of December 31, | | Percent of capital | | 2009 | | | 2008 | | Sweden | | 47.9 | % | | 47.2 | % | United States | | 24.2 | % | | 25.0 | % | United Kingdom | | 7.9 | % | | 8.9 | % | Norway | | 1.9 | % | | 1.3 | % | Canada | | 1.2 | % | | 1.1 | % | Japan | | 1.2 | % | | 1.3 | % | Switzerland | | 1.1 | % | | 1.7 | % | France | | 1.1 | % | | 1.1 | % | Netherlands | | 0.8 | % | | 0.8 | % | Denmark | | 0.8 | % | | 0.8 | % | Other countries | | 11.9 | % | | 10.8 | % |
Source: | Capital Precision, December 31, 2009. |
The information from Capital Precision is based on the shareholders’ domicile or in case of funds, areas of operation.
SHAREHOLDERS
As of December 31, 2009, the Parent Company had 690,726 shareholders registered at Euroclear Sweden AB (the Central Securities Depository—CSD), of which 1,421 holders had a US address. According to
ERICSSON ANNUAL REPORT ON FORM 20-F 2009
information provided by Citibank, there were 242,229,433 ADSs outstandingownership as of December 31, 2009,2012 and 5,068 registered holdersincludes holdings by related natural and legal persons, as well as holdings of such ADSs. A significant number of the ADSs are held of record by banks, brokers and/ or nominees for the accounts of their customers. As of year end 2009, banks, brokers and/or nominees held ADSs on behalf of 240,915 accounts.
According to information known at year-end 2009, almost 77 percent of our Class A and Class B shares were owned by institutions, Swedish and international.
Our major shareholders do not have different voting rights than other shareholders holding the same classes of shares.
As far as we know, the Company is not directly or indirectly owned or controlled by another corporation, by any foreign government or by any other natural or legal person(s) separately or jointly.
TOP EXECUTIVES AND DIRECTORS, OWNERSHIPADS, if applicable.
|
ERICSSON ANNUAL REPORT ON FORM 20-F 2012
Board member:ABB Ltd, The Coca-Cola Company, The Knut and Alice Wallenberg Foundation and Stockholm School of Economics.
Holdings in Ericsson1): 2,413 Class B shares.
Principal work experience and other information: Chairman of the Board of Investor AB since 2005. Extensive experience in banking and finance, including experience from the commercial banks JP Morgan, New York and SEB. Appointed President and CEO of SEB in 1997 and appointed Chairman of SEB’s Board of Directors in 1998. Executive Vice President and CFO of Investor AB 1990-1993. Honorary Chairman of IBLAC (Mayor of Shanghai’s International Business Leaders Advisory Council) and member of The European Round Table of Industrialists.
Roxanne S. Austin(first elected 2008)
Member of the Audit Committee
Born 1961. Bachelor of Business Administration in Accounting, University of Texas, San Antonio, USA.
Board Member: Abbott Laboratories, Teledyne Technologies Inc. and Target Corporation.
Holdings in Ericsson1): 3,000 Class B shares.
Principal work experience and other information: President of Austin Investment Advisors since 2004. President and CEO of Move Networks Inc. 2009–2010. President and COO of DirecTV 2001–2003. Corporate Senior Vice President and CFO of Hughes Electronics Corporation 1997–2000, which she joined in 1993. Previously a partner at Deloitte & Touche. Member of the California State Society of Certified Public Accountants and the American Institute of Certified Public Accountants.
Sir Peter L. Bonfield(first elected 2002)
Member of the Audit Committee
Born 1944. Honors degree in Engineering, Loughborough University, Leicestershire, UK.
Board Chairman: NXP Semiconductors N.V.
Board Member: Mentor Graphics Inc., Sony Corporation and Taiwan Semiconductor Manufacturing Company, Ltd.
Holdings in Ericsson1): 4,400 Class B shares.
Principal work experience and other information: CEO and Chairman of the Executive Committee of British Telecommunications plc 1996–2002. Chairman and CEO of ICL plc 1985–1996. Positions with STC plc and Texas Instruments Inc. Member of the Advisory Boards of New Venture Partners LLP, the Longreach Group and Apax Partners LLP. Board Mentor of CMi. Senior Advisor, Rothschild, London.
Chair of Council and Senior Pro-Chancellor, Loughborough University, UK. Fellow of the Royal Academy of Engineering.
Börje Ekholm(first elected 2006)
Member of the Remuneration Committee
Born 1963. Master of Science in Electrical Engineering, KTH Royal Institute of Technology, Stockholm, Sweden. Master of Business Administration, INSEAD, France.
| | | | | | |
| | | Number of
Class A
shares | | Number of
Class B
shares | | Voting
rights,
percent |
Top executives and directors as a group (28 persons) | | 2,416 | | 3,844,472 | | 0.07 |
For individual holdings, see “Corporate Governance Report”.
| 1) | The table shows the total number of shares in the Parent Company owned by top executives and directors as a groupreflects ownership as of December 31, 2009.ERICSSON ANNUAL REPORT ON FORM 20-F 20092012 and includes holdings by related natural and legal persons, as well as holdings of any ADS, if applicable.
|
ERICSSON ANNUAL REPORT ON FORM 20-F 2012
Board Chairman: KTH Royal Institute of Technology, Stockholm and Nasdaq OMX Group Inc.
Board Member: Investor AB, AB Chalmersinvest, EQT Partners AB and Husqvarna AB.
Holdings in Ericsson1): 30,760 Class B shares.
Principal work experience and other information: President and CEO of Investor AB since 2005. Formerly Head of Investor Growth Capital Inc. and New Investments. Previous positions at Novare Kapital AB and McKinsey & Co Inc.
Alexander Izosimov(first elected 2012)
Born 1964. Master of Business Administration, INSEAD, France and Master of Science in Production Management Systems and Computer Science, Moscow Aviation Institute, Russian Federation.
Board Member: East Capital AB, Modern Times Group MTG AB, EVRAZ Group S.A., Dynasty Foundation, Transcom WorldWide SA and International Chamber of Commerce (ICC).
Holdings in Ericsson1): 1,600 Class B shares.
Principal work experience and other information: CEO and President of VimpelCom 2003-2011. Previous positions with Mars Inc., including Member of the Global Executive Board and Regional President for CIS, Central Europe and Nordics. Earlier positions with McKinsey & Co as consultant in the Stockholm and London offices. Served as GSMA Board member 2005-2008 and Chairman of GSMA 2008-2010.
Ulf J. Johansson(first elected 2005)
Chairman of the Audit Committee
Born 1945. Doctor of Technology and Master of Science in Electrical Engineering, KTH Royal Institute of Technology, Stockholm, Sweden.
Board Chairman: Acando AB, Eurostep Group AB, Novo A/S, Novo Nordisk Foundation and Trimble Navigation Ltd.
Board Member: European Institute of Innovation and Technology.
Holdings in Ericsson1): 6,435 Class B shares.
Principal work experience and other information: Founder of Europolitan Vodafone AB, where he was the Chairman of the Board 1990–2005. Previous positions at Spectra-Physics AB as President and CEO and at Ericsson Radio Systems AB. Member of the Royal Academy of Engineering Sciences.
Nancy McKinstry(first elected 2004)
Member of the Remuneration Committee
Born 1959. Master of Business Administration in Finance and Marketing, Columbia University, USA. Bachelor of Arts in Economics, University of Rhode Island, USA.
Board Chairman: CEO and Chairman of the Executive Board of Wolters Kluwer n.v.
Board Member: Abbott Laboratories and Sanoma Corporation.
| 1) | The following table shows share information,number of shares reflects ownership as of December 31, 2009, with respect to our 15 largest shareholders, ranked2012 and includes holdings by voting rights,related natural and legal persons, as well as percentageholdings of voting rightsany ADS, if applicable. |
ERICSSON ANNUAL REPORT ON FORM 20-F 2012
Holdings in Ericsson1): 4,000 Class B shares.
Principal work experience and other information: CEO and Chairman of the Executive Board of Wolters Kluwer n.v. President and CEO of CCH Legal Information Services 1996–1999. Previous positions at Booz, Allen & Hamilton and New England Telephone Company. Member of the Advisory Board of the University of Rhode Island, the Advisory Council of the Amsterdam Institute of Finance, the Board of Overseers of Columbia Business School and the Advisory Board of the Harrington School of Communication and Media.
Anders Nyrén(first elected 2006)
Member of the Finance Committee
Born 1954. Graduate of Stockholm School of Economics, Sweden, Master of Business Administration from Anderson School of Management, UCLA, USA.
Board Chairman: Sandvik AB.
Deputy Board Chairman: Svenska Handelsbanken AB.
Board Member: Svenska Cellulosa Aktiebolaget SCA, AB Industrivärden, SSAB, AB Volvo, Ernströmgruppen and Stockholm School of Economics.
Holdings in Ericsson1): 6,686 Class B shares.
Principal work experience and other information: President and CEO of Industrivärden since 2001. CFO and Executive Vice President of Skanska AB 1997–2001. Director Capital Markets of Nordbanken 1996–1997. CFO and EVP of Securum AB 1992–1996. Managing Director of OM International AB 1987–1992. Earlier positions at STC Scandinavian Trading Co AB and AB Wilhelm Becker.
Hans Vestberg(first elected 2010)
Born 1965. Bachelor of Business Administration and Economics, University of Uppsala, Sweden.
Board Chairman: ST-Ericsson and Svenska Handbollförbundet.
Board Member: Thernlunds AB.
Holdings in Ericsson1): 149,382 Class B shares.
Principal work experience and other information: President and CEO of Telefonaktiebolaget LM Ericsson since January 1, 2010. Previously, First Executive Vice President, CFO and Head of Group Function Finance and Executive Vice President and Head of Business Unit Global Services. Various positions in the Group since 1988, including Vice President and Head of Market Unit Mexico and Head of Finance and Control in USA, Brazil and Chile. International advisor to the Governor of Guangdong, China and co-chairman of the Russian-Swedish Business Council. Founding member of the Broadband Commission for Digital Development, and heading the Commission’s climate change working group. Member of the European Cloud Partnership Steering Board and the Leadership Council of the United Nations Sustainable Development Solutions Network.
| 1) | The number of shares reflects ownership as of December 31, 2009, 20082012 and 2007.LARGEST SHAREHOLDERS, DECEMBER 31, 2009 AND PERCENTAGE OF VOTING RIGHTS, DECEMBER 31, 2009, 2008 AND 2007
| | | | | | | | | | | | | | | Identity of person or group1) | | Number
of Class A
shares | | Percentage
of total
Class A
shares | | Number
of Class B
shares | | Percentage
of total
Class B
shares | | 2009
Voting rights
percent | | 2008
Voting rights
percent | | 2007
Voting rights
percent | Investor AB | | 102,664,038 | | 39.22 | | 61,414,664 | | 2.04 | | 19.33 | | 19.42 | | 19.49 | AB Industrivärden | | 76,680,600 | | 29.29 | | 0 | | 0.00 | | 13.62 | | 13.28 | | 13.36 | Handelsbankens Pensionsstiftelse | | 19,800,000 | | 7.56 | | 0 | | 0.00 | | 3.52 | | 3.00 | | 3.01 | Swedbank Robur Fonder AB | | 1,510,466 | | 0.58 | | 157,785,431 | | 5.24 | | 3.07 | | 2.44 | | 1.67 | Skandia Liv AB | | 15,270,077 | | 5.83 | | 17,079,591 | | 0.57 | | 3.02 | | 2.89 | | 2.75 | Pensionskassan SHB Försäkringsföreningen | | 12,672,000 | | 4.84 | | 0 | | 0.00 | | 2.25 | | 2.26 | | 2.27 | BlackRock Advisors, Inc. | | 0 | | 0.00 | | 101,632,540 | | 3.38 | | 1.81 | | 0.00 | | 0.06 | Brandes Investment Partners LP | | 0 | | 0.00 | | 55,603,761 | | 2.54 | | 1.36 | | 2.08 | | 1.73 | AMF Pensionsforsakring AB | | 800,000 | | 0.31 | | 65,104,680 | | 2.16 | | 1.30 | | 1.55 | | 0.89 | OppenheimerFunds, Inc. | | 0 | | 0.00 | | 72,541,045 | | 2.41 | | 1.29 | | 1.31 | | 1.57 | Dodge & Cox, Inc. | | 0 | | 0.00 | | 29,149,700 | | 1.96 | | 1.05 | | 0.98 | | 0.00 | Gamla Livförsäkringsbolaget SEB Trygg Liv | | 4,675,919 | | 1.79 | | 8,475,600 | | 0.28 | | 0.98 | | 1.04 | | 1.04 | Handelsbanken Fonder AB | | 2,335 | | 0.00 | | 52,894,889 | | 1.76 | | 0.94 | | 1.02 | | 1.08 | Norges Bank Investment Management | | 0 | | 0.00 | | 50,368,857 | | 1.67 | | 0.89 | | 0.46 | | 0.35 | SEB Investment Management AB | | 480,909 | | 0.18 | | 45,030,567 | | 1.50 | | 0.89 | | 0.98 | | 0.78 | Others | | 27,199,639 | | 10.40 | | 2,294,514,427 | | 74.49 | | 44.68 | | 47.29 | | 49.95 | | | | | | | | | | | | | | | | Total | | 261,755,983 | | 100.00 | | 3,011,595,752 | | 100.00 | | 100.00 | | 100.00 | | 100.00 | | | | | | | | | | | | | | | |
1) | Sources: Capital Precision, December 2009 and 2008. Euroclear Sweden AB, December 31, 2007. |
ERICSSON ANNUAL REPORT ON FORM 20-F 2009
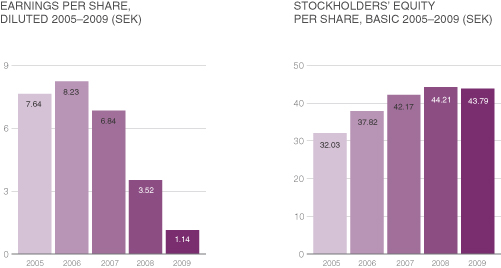
ERICSSON ANNUAL REPORT ON FORM 20-F 2009
MARKET TRENDS
Telecommunications plays a central role in the daily life of practically every person on earth. It is fundamental to the global economyincludes holdings by related natural and increasingly important to the environment. Over the last decade, mobile became a ubiquitous communications service, enabling people from all regions and walks of life to connect at an unprecedented level.
With the widespread adoption of mobile communications for voice and text messaging, the impetus to add more voice subscribers has started to diminish. Growth will continue with more than two billion new mobile voice subscriptions expected over the coming years but these will mainly come from low-usage customers in developing areas or users with multiple subscriptions. This dilutes average revenue per subscription but the underlying growth in minutes of use per user is stronger than the subscription dilution. Thus the total voice traffic continues to grow.
Mobile broadband is fast becoming the main growth driver for operators and equipment suppliers globally. Consumer behavior is changing with the introduction of mobile broadband prompting innovation in a number of areas and driving the need for ever greater bandwidth and data speeds. The industry focus is shifting from connecting places and people to connecting devices and applications.
There are many devices whose utility is enabled by mobile broadband, including mobile phones, personal computers and a growing number of electronic devices and software applications. Wireless connectivity will make broadband mobile and affordable to the majority of people. Particularly in the case of machine-to-machine communications, it will also enable applications for a variety of industries and uses (e.g. smart grids, transportation, financial services and healthcare.) This is far beyond the capability and scope of today’s networks.
We envision 50 billion network connections over the next decade, compared with some 5 billion currently. The underlying network technologies must be enhanced to accommodate such a vast number of connections. We expect Ericsson to benefit from this as network operators and service providers:
Accelerate the transition from legacy technologies to IP- based technologies.
Respond to rising demands for services that aid economic, societal and environmental development.
Invest in mobile and fixed broadband access, multi-service edge routing, IP multimedia subsystems (IMS) based services and Metro optical and/or radio transport.
Prioritize suppliers that combine technology with services for lower total cost, faster time-to-market and reduced project risks.
Outsource more of their network-related activities and operations for increased flexibility and focus more on the consumer experience.
These are all areas where the Company is well positioned and continues to invest heavily. Ericsson is now focused exclusively on serving network operators and service providers while device manufacturers and consumers are addressed via two joint venture companies, i.e. ST-Ericsson and Sony Ericsson.
ERICSSON ANNUAL REPORT ON FORM 20-F 2009
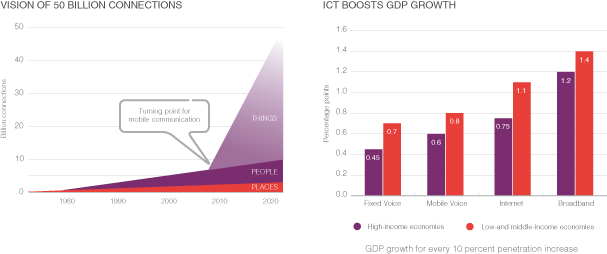
ICT, especially mobile, positively affects GDP levelslegal persons, as well as the environment
Even though the benefitsholdings of a connected society are difficult to precisely quantify, telecommunications has become as essential to any nation’s infrastructure as water, transportation or electricity. As already well demonstrated by telephony, there is clear evidence that the ubiquitous availability of affordable ICT services has a positive effect on any country’s economy. The ICT industry generates approximately 2 percent of global CO2emissions. However, ICT could potentially reduce the other 98 percent by 15 percent or more.ADS, if applicable.
|
ERICSSON ANNUAL REPORT ON FORM 20-F 2012
Michelangelo Volpi(first elected 2010)
Born 1966. Bachelor of Science in Mechanical Engineering and Masters in Manufacturing Systems Engineering from Stanford University, USA. MBA from the Stanford Graduate School of Business, USA.
Board Member: EXOR S.p.A.
Holdings in Ericsson1): None.
Principal work experience and other information: Partner at Index Ventures since July 2009. Previously CEO of Joost Inc. Various positions in Cisco from 1994-2007, including Senior Vice President and General Manager of the Routing and Service Provider Technology Group and Chief Strategy Officer. Has also worked for Hewlett Packard in the optoelectronics division.
Board members and deputies appointed by the unions
Pehr Claesson(first appointed 2008)
Employee representative, Member of the Finance Committee
Born 1966. Appointed by the union The Swedish Association of Graduate Engineers.
Holdings in Ericsson1): 999 Class B shares. Employed since 1997. Working with marketing and communication for Consulting and Systems Integration within Business Unit Global Services.
Kristina Davidsson(first appointed 2006)
Employee representative, Member of the Audit Committee
Born 1955. Appointed by the union IF Metall.
Holdings in Ericsson1): 1,629 Class B shares. Employed since 1995. Previously working as repairer within Business Unit Networks and currently working full time as union representative.
Karin Åberg(first appointed 2007)
Employee representative, Member of the Remuneration Committee
Born 1959. Appointed by the union Unionen.
Holdings in Ericsson1): 2,751 Class B shares. Employed since 1995. Working as a Service Engineer within the IT organization.
Rickard Fredriksson(first appointed 2012)
Deputy employee representative
Born 1969. Appointed by the union IF Metall.
Holdings in Ericsson1): 799 Class B shares.
Employed since 2000. Previously working as machine operator within Business Unit Networks and currently working full time as union representative.
A higher GDP level obviously enables more broadband adoption but studies of the relationship between broadband penetration and economic development indicate that broadband plays an even more fundamental role than telephony in accelerating the economic and social development of a country. Mobile broadband networks, along with suitable devices and appropriate applications, can accelerate broadband penetration by avoiding the relatively more expensive and time-consuming deployments of fixed networks.
Mobile communications market
Mobile communication is the service of choice for consumers across the world and we believe there is considerable potential for further growth with the introduction of mobile broadband. During 2010, Ericsson expects mobile subscriptions to grow to more than 5.2 billion, mainly driven by voice in developing markets and broadband in more developed markets.
Although at a slower pace than in previous years, mobile communications continued to grow in 2009 with over 600 (670) million new subscriptions added.
| 1) | The number of mobile phones shipped was approximately 1,100 (1,190) million, mainly due to less subscriber additionsshares reflects ownership as of December 31, 2012 and longer replacement intervals. Based on vendor reportsincludes holdings by related natural and Ericsson estimates, the mobile systems market is estimated to have declined by more than 10 percent due to the economic slowdown and weaker demand for GSM. However, we believe investments in mobile communications are below optimal levels—suggesting the possibilitylegal persons, as well as holdings of increased spending once the economy recovers.any ADS, if applicable. |
ERICSSON ANNUAL REPORT ON FORM 20-F 2012
At the end of 2009, the 4.6 (4.0) billion mobile subscriptions worldwide represented a global subscription penetration of 64 (59) percent (the actual number of mobile users is probably some 20-25 percent less due to inactive and multiple subscriptions). The High Speed Packet Access (HSPA) version of 3G/WCDMA is now deployed in 303 (247) commercial networks across 130 (110) countries. Ericsson supplies 144 (115) of these networks, serving the majority of mobile broadband subscribers.
ERICSSON ANNUAL REPORT ON FORM 20-F 2009
Karin Lennartsson(first appointed 2010)
Deputy employee representative
Born 1957. Appointed by the union Unionen.
Holdings in Ericsson1): 493 Class B shares.
Employed since 1976. Working as Process Expert within Group Function Finance—Process Management.
Roger Svensson(first appointed 2011)
Deputy employee representative
Born 1971. Appointed by the union The Swedish Association of Graduate Engineers.
Holdings in Ericsson1): 7,710 Class B shares.
Employed since 1999. Working as Senior Specialist Test Strategy Power Amplifier within Business Unit Networks.
Hans Vestberg was the only Director who held an operational management position at Ericsson in 2012. No Director has been elected pursuant to an arrangement or understanding with any major shareholder, customer, supplier or other person.
At the Annual General Meeting 2012, Alexander Izosimov was elected new member of the Board of Directors, replacing Carl-Henric Svanberg. Jan Hedlund resigned as employee representative of the Board of Directors as of the date of the Annual General Meeting 2012 and Kristina Davidsson (previously deputy employee representative) was appointed employee representative as of the same date. Rickard Fredriksson was appointed new deputy employee representative as of the date of the Annual General Meeting 2012.
MANAGEMENT
The President/CEO and the Executive Leadership Team
The Board of Directors appoints the President and CEO and the Executive Vice Presidents. The President and CEO is responsible for the management of day-to-day operations and is supported by the Executive Leadership Team (the “ELT”). During 2012, the ELT consisted of the President and CEO, the heads of Group functions, the heads of business units and the heads of two of Ericsson’s regions. The role of the ELT is to:
Establish a strong corporate culture, a long-term vision and Group strategies and policies, all based on objectives stated by the Board
Determine targets for operational units, allocate resources and monitor unit performance
Secure operational excellence and realize global synergies through efficient organization of the Group.
Remuneration to the Executive Leadership Team
Guidelines for remuneration to the ELT were approved by the AGM 2012. For further information on fixed and variable remuneration, see the Remuneration report and Notes to the consolidated financial statements—Note C28, “Information regarding members of the Board of Directors, the Group management and employees” in the Annual Report.
| 1) | The number of subscribers coveredshares reflects ownership as of December 31, 2012 and includes holdings by commercial 3G/ WCDMA networks remainsrelated natural and legal persons, as well below half thatas holdings of 2G/GSM. Subscribers to mobile broadband services worldwide reached 360 (180) million by the end of 2009. The vast majority of the 360 million are handheld devices and the figure is set to soar with the mass consumer adoption of mobile internet devices such as smartphones and netbooks. This additional demand presents a significant opportunity for network infrastructure and systems integration, areas in which Ericsson has a market-leading position.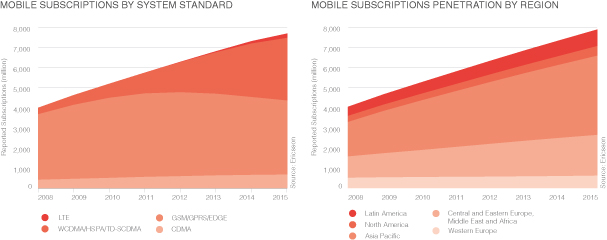
Fixed and mobile broadband main market driversany ADS, if applicable.
|
ERICSSON ANNUAL REPORT ON FORM 20-F 2012
The Ericsson Group Management System
Ericsson has a global management system, the Ericsson Group Management System (EGMS) to drive corporate culture and to ensure that the business is managed:
To fulfill the objectives of Ericsson’s major stakeholders (customers, shareholders, employees)
Within established risk limits and with reliable internal control
In compliance with relevant applicable laws, listing requirements, governance codes and corporate social responsibilities.
The EGMS is founded on ISO 9001 (International Standard for Quality management system) but is designed as a dynamic governance system, enabling Ericsson to adapt the system to evolving demands and expectations, including new legislation as well as customers’ and other stakeholders’ requirements. The management system is an important foundation and is continuously evaluated and improved.
Certificates are evidence from an independent body verifying that the operations fulfill defined requirements. As the EGMS is a global system, group-wide certificates can be issued by a third party certification body proving that the system is efficient throughout the whole organization. Ericsson is currently globally certified to ISO 9001 (Quality), ISO 14001 (Environment) and OHSAS 18001 (Health & Safety). Selected Ericsson units are also certified to additional standards, for example ISO 27001 (Information Security) and TL 9000 (telecom-specific standard).
The EGMS comprises three elements:
Ericsson business processes
Organization and resources.
ERICSSON ANNUAL REPORT ON FORM 20-F 2012
Management and control
Ericsson’s strategy and target setting processes consider the demands and expectations of customers as well as other key stakeholders. The process facilitates the alignment of objectives and their measurement in activities at all levels of the organization.
Ericsson uses balanced scorecards as tools for translating strategic objectives into a set of performance indicators for its operational units. Based on annual strategy work, these scorecards are updated with targets for each unit for the next year and are communicated throughout the organization.
Group-wide policies and directives govern how the organization works and are core elements in managing and controlling Ericsson. The Group Policies and Directives include a Code of Business Ethics, a Code of Conduct and accounting and reporting directives to fulfill external reporting requirements and the Sarbanes-Oxley Act.
The Group Steering Documents Committee works to ensure that the policies and directives cover relevant issues; that they are aligned and consistent with Group strategies, values and structures; and that they are not in conflict with legal and regulatory requirements. In addition, the Group Steering Documents Committee works to ensure that the said strategies, values and structures are implemented by the responsible function.
Ericsson business processes
As a market leader, Ericsson utilizes the competitive advantages that are gained through global scale and has implemented common processes and IT tools across all operational units worldwide. Customer requirements are identified, clarified and formalized in Ericsson Business Processes where requirements transform from theory to reality. Through management and continuous improvement of processes and IT tools, Ericsson attempts to reduce costs with efficient and effective process flows and with standardized internal controls and performance indicators.
Organization and resources
Ericsson is operated in two dimensions: one operational structure and one legal structure.
The operational structure aligns accountability and authority regardless of country borders and supports the process flow with cross-country operations. During 2012 there were four business units and ten regions. Group functions coordinate Ericsson’s strategies, operations and resource allocation and define the necessary directives, processes and organization for the effective governance of the Group.
The legal structure is the basis for legal requirements and responsibility as well as for tax and statutory reporting purposes. There are more than 200 legal entities within the Ericsson Group with representation (via legal entities, branch and representative offices) in more than 140 countries.
Risk management
Ericsson’s risk management is integrated with the business and its operational processes, and is a part of the EGMS to ensure accountability, effectiveness, efficiency, business continuity and compliance with corporate governance, legal and other requirements. The Board of Directors is also actively engaged in the Company’s risk management. Risks related to set long-term objectives are discussed and strategies are formally approved by the Board as part of the annual strategy process. Risks related to annual targets for the Company are also reviewed by the Board and then monitored continuously during the year. Certain transactional risks require specific Board approval, e.g. acquisitions, management remuneration, borrowing or customer finance in excess of pre-defined limits.
ERICSSON ANNUAL REPORT ON FORM 20-F 2012
Strategic and tactical risks
Strategic risks constitute the highest risk to the Company if not managed properly as they could have a long-term impact. Ericsson therefore reviews its long-term objectives, main strategies and business scope on an annual basis and continuously works on its tactics to reach these objectives and to mitigate any risks identified.
In the annual strategy and target setting process, objectives are set for the next three to five years. Risks and opportunities are assessed and strategies are developed to achieve the objectives. The strategy process in the Company is well established and involves regions, business units and Group functions. The strategy is finally summarized and discussed in a yearly Global Leadership Summit with approximately 250 leaders from all parts of the business. By involving all parts of the business in the process, potential risks are identified early and mitigating actions can be incorporated in the strategy and in the annual target process following the finalization of the strategy.
Technology development, industry and market fundamentals and the development of the economy are key components in the evaluation of risks related to Ericsson’s long-term objectives.
The outcome from the strategy process forms the basis for the annual target process, which involves regions, business units and Group functions. Risks and opportunities linked to the targets are identified as part of this process together with actions to mitigate the identified risks. Follow-up of targets, risks and mitigating actions are reported and discussed continuously in business unit and region steering groups and are reviewed by the Board of Directors.
Ericsson continuously strives to improve its risk management and believes that it is important that the entire global organization takes part in the risk management and strategy work. Therefore, risk management was given a stronger focus in 2012. During the year, an enhanced risk management framework was implemented and aligned with the Strategy and Target setting process. Risks were identified and analyzed in four categories: industry & market risks, commercial risks, operational risks and compliance risks. For more information on risks related to Ericsson’s business, see the chapter “Risk factors” in the Annual Report.
Strategic, target setting and risk management cycle
The annual strategic, target setting and risk management cycle is part of Ericsson’s strategy process, which is well established within the Group and involves regions, business units and Group functions.
ERICSSON ANNUAL REPORT ON FORM 20-F 2012
Operational and financial risks
Operational risks are owned and managed by operational units. Risk management is embedded in various process controls, such as decision tollgates and approvals. Certain cross-process risks are centrally coordinated, such as information security, IT security, corporate responsibility and business continuity and insurable risks. Financial risk management is governed by a Group policy and carried out by the Treasury and Customer Finance functions, both supervised by the Finance Committee. The policy governs risk exposures related to foreign exchange, liquidity/financing, interest rates, credit risk and market price risk in equity instruments. For further information on financial risk management, see Notes to the consolidated financial statements—Note C14, “Trade receivables and customer finance”, Note C19, “Interest-bearing liabilities” and Note C20, “Financial risk management and financial instruments” in the Annual Report.
Compliance risks
Ericsson has implemented Group policies and directives in order to comply with applicable laws and regulations, including a Code of Business Ethics and a Code of Conduct. Risk management is integrated in the Company’s business processes. Policies and controls are implemented to comply with financial reporting standards and stock market regulations, such as the US Sarbanes-Oxley Act.
Compliance officer
Ericsson has a Chief Compliance Officer (CCO) whose responsibilities include providing support for compliance with laws, regulations, internal policies and directives, coordinating the different strands of expertise within Ericsson. Attention from senior-management level on compliance matters is crucial, as is ensuring that this is addressed from a cross-functional perspective. Initially, the CCO’s primary focus has been to further develop Ericsson’s Anti-corruption Compliance Program. This is reviewed and evaluated by the Audit Committee at least annually.
Monitoring and audits
Company management monitors compliance with policies, directives and processes through internal self-assessment within all units. This is complemented by internal and external audits. External financial audits are performed by PricewaterhouseCoopers, and ISO/ management system audits by Intertek. Internal audits are performed by the company’s internal audit function which reports to the Audit Committee. Audits of suppliers are also conducted in order to secure compliance with Ericsson’s Code of Conduct, which is mandatory for suppliers to the Ericsson Group.
Risk mitigation
Significant ongoing activities in order to mitigate risks include:
Establishing flexibility to cost-effectively accommodate to fluctuations in customer demand
Conducting regular Supplier Code of Conduct audits
Continuous assessment and management of CR risks
Conducting business continuity management in an efficient way
Conducting corporate governance training as needed
Continuous monitoring of information systems to guard against data breaches
Reviewing top risks and mitigating actions at various internal governance meetings.
ERICSSON ANNUAL REPORT ON FORM 20-F 2012
Example of risk heat map document
Risk heat maps are generated by business units, regions and Group functions in four risk categories:
MEMBERS OF THE EXECUTIVE LEADERSHIP TEAM
Hans Vestberg
President and CEO (since 2010)
Born 1965.
Bachelor of Business Administration and Economics, University of Uppsala, Sweden.
Board Chairman: ST-Ericsson and Svenska Handbollförbundet.
ERICSSON ANNUAL REPORT ON FORM 20-F 2012
Board member: Telefonaktiebolaget LM Ericsson and Thernlunds AB.
Holdings in Ericsson1): 149,382 Class B shares.
Background: Previously First Executive Vice President, CFO and Head of Group Function Finance and Executive Vice President and Head of Business Unit Global Services. Various positions in the Group since 1988, including Vice President and Head of Market Unit Mexico and Head of Finance and Control in USA, Brazil and Chile. International advisor to the Governor of Guangdong, China and co-chairman of the Russian-Swedish Business Council. Founding member of the Broadband Commission for Digital Development, and heading the Commission’s broadband and climate change working group. Member of the European Cloud Partnership Steering Board and the Leadership Council of the United Nations Sustainable Development Solutions Network.
Jan Frykhammar
Executive Vice President and Chief Financial Officer and Head of Group Function Finance (since 2009)
Born 1965.
Bachelor of Business Administration and Economics, University of Uppsala, Sweden.
Board member: ST-Ericsson and the Swedish International Chamber of Commerce.
Holdings in Ericsson1): 14,844 Class B shares.
Background: Previously Senior Vice President and Head of Business Unit Global Services. Various positions within Ericsson including Sales and Business Control in Business Unit Global Services, CFO in North America and Vice President, Finance and Commercial within the Global Customer Account Vodafone.
Magnus Mandersson
Executive Vice President (since 2011) and Head of Business Unit Global Services (since 2010)
Born 1959.
Bachelor of Business Administration, University of Lund, Sweden.
Board member: None.
Holdings in Ericsson1): 22,602 Class B shares.
Background: Previously Head of Business Unit CDMA, Market Unit Northern Europe, Global Customer Account Deutsche Telekom AG and Product Area Managed Services. Has also been President and CEO of SEC/ Tele2 Europe and COO of Millicom International Cellular S.A.
Johan Wibergh
Executive Vice President (since 2010) and Head of Business Unit Networks (since 2008)
Born 1963.
Master of Computer Science, Linköping Institute of Technology, Sweden.
| 1) | The number of fixedshares reflects ownership as of December 31, 2012 and mobile broadband subscriptions is expected to increase five times between 2009includes holdings by related natural and 2015 to approximately 4 billion, of which the vast majority will be subscriptions for mobile broadband. Broadband internet access revenues for fixed operators (including cable operators) are expected to grow from around 25 to around 30 percent of total revenues in the next five years. Similarly, data’s share of mobile operators’ revenue, which is currently some 25 percent, is expected to account for a progressively larger portion of global mobile revenues over the next five years.These projections assume the cost for mobile data services aligns with subscriber expectations, i.e. data must be priced lower than voice when comparing the amount of bandwidth consumed. Hence, operators may implement cost-efficient solutions for delivering more network capacity with revenues based on service value rather than the amount of capacity. This motivates a next-generation network that offers fixed and mobile convergence and leverages IP technology for a lower cost, higher performance broadband service.
However, operators’ willingness to invest in modernizing their networks can be inhibited by governmental regulations on how they can monetize their investments. For example, open access policies seek to facilitate the entrance into broadband markets for new competitors by requiring existing operators to lease access to their networks at regulated wholesale rates. The basic idea is that the more competitive consumer broadband markets are, the better the service offering, i.e. at lower prices, to more consumers. The alternative approach is to avoid forcing operators to lease network assets to competitors as it can undermine the incentive to invest.
The major challenge is identifying regulatory policies and practices that promote ubiquitous availability without undermining competition by mandating how an operator can monetize usage and capacity consumption.
ERICSSON ANNUAL REPORT ON FORM 20-F 2009
Mobile broadband creates bottlenecks in parts of the network
The deployment of access nodes that connect devices at ever faster speeds increases subscriber uptake which can quickly create bottlenecks in other parts of the network especially on the backhaul part of the transport network.
Backhaul capacity needs to be provided more dynamically and efficiently than is possible with traditional backhaul solutions. Support of multiple services is required to ensure continuity for existing serviceslegal persons, as well as allowing new services. Operators want holdings of any ADS, if applicable.
|
ERICSSON ANNUAL REPORT ON FORM 20-F 2012
Board member: ST-Ericsson, Confederation of Swedish Enterprise, KTH Royal Institute of Technology and Teknikföretagen.
Holdings in Ericsson1): 40,448 Class B shares.
Background: President of Ericsson Brazil, President of Market Unit Nordic and Baltics and Vice President and Head of Sales at Business Unit Global Services.
Per Borgklint
Senior Vice President and Head of Business Unit Support Solutions (since 2011)
Born 1972.
Master of Science in Business Administration, Jönköping International Business School, Sweden.
Board member:None.
Holdings in Ericsson1): None.
Background: Previously CEO of Net1 (Ice.net), Canal Plus Nordic and Versatel. Has also held several leading positions at Tele2.
Bina Chaurasia
Senior Vice President, Chief Human Resources Officer and Head of Group Function Human Resources and Organization (since 2010)
Born 1962.
Master of Science in Management and Human Resources, Ohio State University, USA, and Master of Arts in Philosophy, University of Wisconsin, USA.
Holdings in Ericsson1): 19,144 Class B shares.
Background: Joined Ericsson from Hewlett Packard, where she was Vice President of Global Talent Management. Has held senior HR leadership roles at Gap, Sun Microsystems and PepsiCo/Yum.
Ulf Ewaldsson
Senior Vice President, Chief Technology Officer and Head of Group Function Technology(since February 1, 2012)
Born 1965.
Master of Science in Engineering and Business Management, Linköping Institute of Technology, Sweden.
Board member: None.
| 1) | The number of shares reflects ownership as of December 31, 2012 and includes holdings by related natural and legal persons, as well as holdings of any ADS, if applicable. |
ERICSSON ANNUAL REPORT ON FORM 20-F 2012
Holdings in Ericsson1): 14,985 Class B shares. Background: Previously Head of Product Area Radio within Business Unit Networks. Has held various managerial positions within Ericsson since 1990.
Douglas L. Gilstrap
Senior Vice President and Head of Group Function Strategy(since 2009)
Born 1963.
Bachelor of Science in Accounting, University of Richmond, USA, and Master of Business Administration, Emory University, Atlanta, USA. Executive program at INSEAD, France.
Board member: Telecom Management Forum (TMF). Deputy board member: ST-Ericsson.
Holdings in Ericsson1): 8,643 Class B shares. Background: Has held various global managerial positions within the telecommunications sector for more than 15 years.
Nina Macpherson
Senior Vice President, General Counsel, Head of Group Function Legal Affairs and secretary to the Board of Directors(since 2011)
Born 1958.
Master of Laws, LL M, University of Stockholm, Sweden.
Board member: The Association for Swedish Listed Companies.
Holdings in Ericsson1): 7,857 Class B shares.
Background: Previously Vice President and Deputy Head of Group Function Legal Affairs at Ericsson. Previous positions also include private practice and in-house attorney. Member of the Swedish Securities Council.
Helena Norrman
Senior Vice President and Head of Group Function Communications(since 2011)
Born 1970.
Master of International Business Administration, Linköping University, Sweden.
Board member: None.
Holdings in Ericsson1): 8,312 Class B shares.
Background: Previously Vice President, Communications Operations at Group Function Communications at Ericsson. Has held various positions within Ericsson’s global communications organization since 1998. Previous positions as communications consultant.
Mats H. Olsson
Head of Region North East Asia(since 2010)
Born 1954.
| 1) | The number of shares reflects ownership as of December 31, 2012 and includes holdings by related natural and legal persons, as well as holdings of any ADS, if applicable. |
ERICSSON ANNUAL REPORT ON FORM 20-F 2012
Master of Business Administration, Stockholm School of Economics, Sweden.
Board member: None.
Holdings in Ericsson1): 61,252 Class B shares.
Background: International economic advisor to a number of Chinese provincial and municipal governments. Previously Head of Market Unit Greater China. Appointed President of Ericsson Greater China in 2004, with overall responsibility for mainland China, Hong Kong, Macao and Taiwan. Also assumed overall responsibility for Japan and South Korea in 2010. Has held various executive positions across Asia-Pacific over the last 25 years.
Rima Qureshi
Senior Vice President and Head of Business Unit CDMA Mobile Systems(since 2010)
Born 1965.
Bachelor of Information Systems and Master of Business Administration, McGill University, Montreal, Canada.
Board member: MasterCard Incorporated.
Holdings in Ericsson1): 4,932 Class B shares.
Background: Also serves as Head of Ericsson Response. Previously Vice President of Strategic Improvement Program and Vice President Product Area Customer Support. Has held various positions within Ericsson since 1993.
Angel Ruiz
Head of Region North America(since 2010)
Born 1956.
Bachelor of Electrical Engineering, University of Central Florida, USA, and Master of Management Science and Information Systems, Johns Hopkins University, USA.
Board member: CTIA.
Holdings in Ericsson1): 38,546 Class B shares. Background: Joined Ericsson in 1990 and has held a variety of technical, sales and managerial positions within the Company, including heading up the global account teams for Cingular/SBC/BellSouth (now AT&T). Was appointed President of Ericsson North America in 2001.
Jan Wäreby
Senior Vice President and Head of Sales and Marketing(since 2011)
Born 1956.
Master of Science, Chalmers University, Gothenburg, Sweden.
Board member: ST-Ericsson.
| 1) | The number of shares reflects ownership as of December 31, 2012 and includes holdings by related natural and legal persons, as well as holdings of any ADS, if applicable. |
ERICSSON ANNUAL REPORT ON FORM 20-F 2012
Holdings in Ericsson1): 66,495 Class B shares. Background: Senior Vice President and Head of Business Unit Multimedia and Executive Vice President and Head of Sales and Marketing for Sony Ericsson Mobile Communications.
Up until January 31, 2012, Håkan Eriksson, former Senior Vice President, Chief Technology Officer and Head of Group Function Technology & Portfolio Management, was a member of the Executive Leadership Team.
AUDITOR
According to the Articles of Association, the Parent Company shall have no less than one and no more than three registered public accounting firms as external independent auditor. Pursuant to the Swedish Companies Act, the mandate period of an auditor shall be one year, unless the Articles of Association provide for a longer mandate period up to four years. The auditor reports to the shareholders at General Meetings.
The duties of the auditor include the following:
Updating the Board of Directors regarding the planning, scope and content of the annual audit
Examining the interim and year-end financial statements to assess accuracy and completeness of the accounts and adherence to accounting standards and policies
Advising the Board of Directors of non-audit services performed, the consideration paid and other issues that determine the auditor’s independence.
For further information on the contacts between the Board and the auditor, please see “Work of the Board of Directors” earlier in this Corporate Governance Report.
All Ericsson’s quarterly financial reports are reviewed by the auditor.
Current auditor
PricewaterhouseCoopers AB was elected auditor at the AGM 2012 for a period of one year, i.e. until the close of the AGM 2013.
PricewaterhouseCoopers AB has appointed Peter Nyllinge, Authorized Public Accountant, to serve as auditor in charge.
Fees to the auditor
Ericsson paid the fees (including expenses) for audit-related and other services listed in the table in Notes to the consolidated financial statements—Note C30, “Fees to auditors” in the Annual Report.
INTERNAL CONTROL OVER FINANCIAL REPORTING 2012
This section has been prepared in accordance with the Annual Accounts Act and the Swedish Corporate Governance Code and is limited to internal control over financial reporting.
Since Ericsson is listed in the United States, the requirements outlined in the Sarbanes-Oxley Act (SOX) apply. These regulate the establishment and maintenance of internal controls over financial reporting as well as management’s assessment of the effectiveness of the controls.
In order to support high quality reporting and to meet the requirement of SOX, the Company has implemented detailed documented controls and testing and reporting procedures based on the internationally established COSO framework for internal control. The COSO framework is issued by the Committee of Sponsoring Organizations of the Treadway Commission (COSO).
ERICSSON ANNUAL REPORT ON FORM 20-F 2012
Management’s internal control report according to SOX is included in this Annual Report on Form 20-F and filed with the SEC in the United States.
During 2012, the Company has included operations of acquired entities as well as continued to improve the design and execution of its financial reporting controls.
Disclosure policies
Ericsson’s financial disclosure policies aim to ensure transparent, relevant and consistent communication with equity and debt investors on a fair and equal basis. This will support a fair market value for Ericsson securities. Ericsson wants current and potential investors to have a good understanding of how the Company works, including operational performance, prospects and potential risks.
To achieve these objectives, financial reporting and disclosure must be:
Transparent—enhancing understanding of the economic drivers and operational performance of the business, building trust and credibility
Consistent—comparable in scope and level of detail to facilitate comparison between reporting periods
Simple—to support understanding of business operations and performance and to avoid misinterpretations
Relevant—with focus on what is relevant to Ericsson’s stakeholders or required by regulation or listing agreements, to avoid information overload
Timely—with regular scheduled disclosures as well as ad-hoc information, such as press releases on important events, performed in a timely manner
Fair and equal—where all material information is published via press releases to ensure that the whole investor community receives the information at the same time
Complete, free from material errors and a reflection of best practice—disclosure is compliant with applicable financial reporting standards and listing requirements and in line with industry norms.
Ericsson’s website comprises comprehensive information on the Group, including:
An archive of annual and interim reports
On-demand access to recent news
Copies of presentations given by senior management at industry conferences.
Disclosure controls and procedures
Ericsson has controls and procedures in place to allow for timely information disclosure under applicable laws and regulations, including the US Securities Exchange Act of 1934, and under agreements with NASDAQ OMX Stockholm and NASDAQ New York. These procedures also require that such information is provided to management, including the CEO and CFO, so timely decisions can be made regarding required disclosure.
The Disclosure Committee comprises members with various expertise. It assists managers in fulfilling their responsibility regarding disclosures made to the shareholders and the investment community. One of the main tasks of the committee is to monitor the integrity and effectiveness of the disclosure controls and procedures.
Ericsson has investments in certain entities that the Company does not control or manage. With respect to such entities, disclosure controls and procedures are substantially more limited than those maintained with respect to subsidiaries.
ERICSSON ANNUAL REPORT ON FORM 20-F 2012
During the year, Ericsson’s President and CEO and the CFO evaluated the disclosure controls and procedures and concluded that they were effective at a reasonable assurance level as at December 31, 2012.
Internal control over financial reporting
Ericsson has integrated risk management and internal control into its business processes. As defined in the COSO framework, internal control is an aggregation of components such as a control environment, risk assessment, control activities, information and communication and monitoring.
During the period covered by the Annual Report 2012, there were no changes to the internal control over financial reporting that have materially affected, or are likely to materially affect, the internal control over financial reporting.
Control environment
The Company’s internal control structure is based on the division of tasks between the Board of Directors and its Committees and the President and CEO. The Company has implemented a management system that is based on:
Steering documents, such as policies, directives and a Code of Business Ethics
A strong corporate culture
The Company’s organization and mode of operations, with well-defined roles and responsibilities and delegations of authority
Several well-defined Group-wide processes for planning, operations and support.
The most essential parts of the control environment relative to financial reporting are included in steering documents and processes for accounting and financial reporting. These steering documents are updated regularly to include, among other things:
Financial reporting standards and listing requirements, such as IFRS and SOX.
The processes include specific controls to be performed to ensure high quality financial reports. The management of each reporting legal entity, region and business unit is supported by a financial controller function with execution of controls related to transactions and reporting. The financial controller functions are organized in a number of Company Control Hubs, each supporting a number of legal entities within a geographical area. A financial controller function is also established on Group level, reporting to the CFO.
Risk assessment
Risks of material misstatements in financial reporting may exist in relation to recognition and measurement of assets, liabilities, revenue and cost or insufficient disclosure. Other risks related to financial reporting include fraud, loss or embezzlement of assets and undue favorable treatment of counterparties at the expense of the Company.
Policies and directives regarding accounting and financial reporting cover areas of particular significance to support correct, complete and timely accounting, reporting and disclosure.
Identified types of risks are mitigated through well-defined business processes with integrated risk management activities, segregation of duties and appropriate delegation of authority. This requires specific approval of material transactions and ensures adequate asset management.
ERICSSON ANNUAL REPORT ON FORM 20-F 2012
Control activities
The Company’s business processes include financial controls regarding the approval and accounting of business transactions. The financial closing and reporting process has controls regarding recognition, measurement and disclosure. These include the application of critical accounting policies and estimates, in individual subsidiaries as well as in the consolidated accounts.
Regular analyses of the financial results for each subsidiary, region and business unit cover the significant elements of assets, liabilities, revenues, costs and cash flow. Together with further analysis of the consolidated financial statements performed at Group level, these procedures are designed to produce financial reports without material errors.
For external financial reporting purposes, the Disclosure Committee performs additional control procedures to review whether the disclosure requirements are fulfilled.
The Company has implemented controls to ensure that financial reports are prepared in accordance with its internal accounting and reporting policies and IFRS as well as with relevant listing regulations. It maintains detailed documentation on internal controls related to accounting and financial reporting. It also keeps records on the monitoring of the execution and results of such controls. This allows the President and CEO and the CFO to assess the effectiveness of the controls in a way that is compliant with SOX.
Entity-wide controls, focusing on the control environment and compliance with financial reporting policies and directives, are implemented in all subsidiaries. Detailed process controls and documentation of controls performed are also implemented in almost all subsidiaries, covering the items with significant materiality and risk.
In order to secure compliance, governance and risk management in the areas of legal entity accounting and taxation, as well as securing funding and equity levels, the Company operates through a Company Control hub structure, covering subsidiaries in each respective geographical area.
Based on a common IT platform, a common chart of account and common master data, the hubs and shared services centers perform accounting and financial reporting services for most subsidiaries.
Information and communication
The Company’s information and communication channels support complete, correct and timely financial reporting by making all relevant internal process instructions and policies accessible to all the employees concerned. Regular updates and briefing documents regarding changes in accounting policies, reporting and disclosure requirements are also supplied.
Subsidiaries and operating units prepare regular financial and management reports for internal steering groups and Company management. These include analysis and comments on financial performance and risks. The Board of Directors receives financial reports monthly. Ericsson has established a whistleblower procedure for the reporting of alleged violations that (i) are conducted by Group or local management, and (ii) relate to corruption, questionable accounting or auditing matters or otherwise seriously affect vital interests of the Group or personal health and safety.
Monitoring
The Company’s process for financial reporting is reviewed annually by the management. This forms a basis for evaluating the internal management system and internal steering documents to ensure that they cover all
ERICSSON ANNUAL REPORT ON FORM 20-F 2012
significant areas related to financial reporting. The shared service center and company control hub management continuously monitors accounting quality through a set of performance indicators. Compliance with policies and directives is monitored through annual self-assessments and representation letters from heads and company controllers in all subsidiaries as well as in business units and regions.
The Company’s financial performance is also reviewed at each Board meeting. The Committees of the Board fulfill important monitoring functions regarding remuneration, borrowing, investments, customer finance, cash management, financial reporting and internal control. The Audit Committee and the Board of Directors review all interim and annual financial reports before they are released to the market. The Company’s internal audit function reports directly to the Audit Committee. The Audit Committee also receives regular reports from the external auditor. The Audit Committee follows up on any actions taken to improve or modify controls.
BOARD OF DIRECTORS
Stockholm, March 5, 2013
Telefonaktiebolaget LM Ericsson (publ)
Org. no. 556016–0680
ERICSSON ANNUAL REPORT ON FORM 20-F 2012
REMUNERATION REPORT
INTRODUCTION
This report outlines how the remuneration policy is implemented throughout Ericsson in line with corporate governance best practice, with specific references to Group management. The work of the Remuneration Committee in 2012 and the remuneration policy are explained, at the beginning of the report, followed by descriptions of plans and approaches.
More details of the remuneration of Group management and Board members’ fees can be found in the Notes to the Consolidated financial statements—Note C28, “Information regarding members of the Board of Directors, the Group management and employees”.
THE REMUNERATION COMMITTEE
The Remuneration Committee advises the Board of Directors on an ongoing basis on the remuneration to the Executive Leadership Team (ELT). This includes fixed salaries, pensions, other benefits and short-term and long-term variable remuneration, all in the context of pay and employment conditions throughout Ericsson. The Remuneration Committee reviews and prepares for resolution by the Board:
Proposals on salary and other remuneration, including retirement compensation, for the President and CEO
Proposals on targets for the short-term variable remuneration for the President and CEO
Proposals to the Annual General Meeting on guidelines for remuneration to the ELT
Proposals to the Annual General Meeting on long-term variable remuneration and similar equity arrangements
The responsibility for the Remuneration Committee is also to:
Approve proposals on salary and other remuneration, including retirement compensation, for the Executive Vice Presidents and other ELT.
Approve proposals on targets for the short-term variable remuneration for the Executive Vice Presidents and other ELT.
Approve pay out of the short-term variable renumeration for the ELT, based on achievements and performance.
The Remuneration Committee’s work is the foundation for the governance of Ericsson’s remuneration processes together with Ericsson’s internal systems and audit controls. The Committee is chaired by Leif Johansson and its other members are Börje Ekholm, Nancy McKinstry, and Karin Åberg. All the members are non-executive directors, independent (except for the employee representative) as required by the Swedish Corporate Governance Code and have relevant knowledge and experience of remuneration matters.
The Company’s General Counsel acts as secretary to the Committee. The Chief Executive Officer, the Senior Vice President, Head of Human Resources and Organization and the Vice President, Head of Total Rewards attend the Remuneration Committee meetings by invitation and assist the Committee in its considerations, except when issues relating to their own remuneration are being discussed.
The Remuneration Committee has appointed an independent expert advisor, Piia Pilv, to assist and advise the Committee. The independent advisor provided no other services to the Company during 2012. The
ERICSSON ANNUAL REPORT ON FORM 20-F 2012
Remuneration Committee is also provided with national and international pay data collected from external survey providers and can call on other independent expertise, should it so require. The Chairman continues to ensure that contact is maintained, as necessary and appropriate, with principal shareholders regarding remuneration.
The purpose and function of the Remuneration Committee and its responsibilities can be found on the Ericsson website. These responsibilities, together with the Guidelines for remuneration to Group Management (ELT) and the Long-Term Variable remuneration plan, are reviewed and evaluated annually in light of matters such as changes to corporate governance best practice or changes to accounting, legislation, political opinion or business practices among peers. This helps to ensure that the policy continues to provide Ericsson with a competitive remuneration strategy.
The Guidelines for remuneration to Group Management are, in accordance with Swedish law, brought to shareholders annually for approval.
The Remuneration Committee met six times during the year 2012.
The winter meetings focused on following up on results from the 2011 variable remuneration programs and preparing proposals to shareholders for the 2012 Annual General Meeting (AGM). During the spring the committee determined remuneration to a new member of the ELT and revised the remuneration to others. In the fall, the committee reviewed the Guidelines for remuneration to Group Management and decided to continue the Long-Term Variable remuneration plans without any material changes and the Short-Term Variable remuneration plans with an increased weighting on capital and margins for 2013. The committee based its considerations on the business needs, analyses and reviews of the global market trends and feedback from shareholders and institutions. Supported by the independent advisor, the Committee also reviewed the competitiveness of the ELT remuneration in the global market. The Remuneration Committee is of the opinion that the Long-Term Variable remuneration plans fulfill the defined objectives to promote “One Ericsson” and to align the interests of employees with those of shareholders. The number of participants as of December 1, 2012 was 27,000 employees, compared to 24,000 employees as of December 1, 2011. The evaluation also confirms that the Key Contributor Retention Plan meets the purpose of retaining our key employees. The voluntary attrition rate among Key Contributors is about two-thirds compared to the attrition rate in the total number of employees.
REMUNERATION POLICY
Remuneration at Ericsson is based on the principles of performance, competitiveness and fairness. The remuneration policy, together with the mix of remuneration elements, is designed to reflect these principles by creating a balanced remuneration package. The Guidelines for remuneration to Group Management 2012 approved by AGM can be found in note C28. The auditor’s report regarding whether we have complied with the guidelines for compensation to the ELT during 2012 is posted on the Ericsson website.
ERICSSON ANNUAL REPORT ON FORM 20-F 2012
Summaries of 2012 short- and long-term variable remuneration
| | | | | | | | |
What we call it | | What is it? | | What is the objective? | | Who participates? | | How is it earned? |
Short-term: Remuneration delivered over 12 months or less |
| | | | |
| Fixed salary | | Fixed remuneration paid at set times | | Attract and retain employees, delivering part of annual remuneration in a predictable format | | All employees | | Market appropriate
levels set according
to maximize investmentsposition and
evaluated according
to individual
performance |
| | | | |
| Short-Term Variable remuneration (STV) | | A variable plan that is measured and paid over a single year | | Align employees with clear and relevant targets, providing an earnings opportunity in existing infrastructure while leveragingreturn for performance, and flexible cost | | Enrolled employees, including Executive Leadership Team. Approx. 73,900 in 2012 | | Achievements
against set targets.
Reward can increase
to up to twice the capabilities of new technologies.Roughly two-thirds of backhaul globally is provided via microwave radio with the notable exception
target level and
decrease to zero,
depending on
performance
|
| | | | |
| Local and Sales Incentive Plans | | Tailored versions of the USSTV | | As for STV, tailored for local or business requirements, such as sales | | Employees in sales. Approx. 2,300 in 2012 | | Similar to STV. All
plans have maximum
award and China where fiber isvesting
limits |
|
Long-term: Remuneration delivered over 3 years or more |
| | | | |
| Stock Purchase Plan (SPP) | | All-employee stock-based plan | | Reinforce a “One Ericsson” mentality and align employees’ interests with those of shareholders | | All employees are eligible | | Buy one share and it
will be matched by
one share after
3 years if still
employed |
| | | | |
| Key Contributor Retention Plan (KC) | | Share-based plan for selected individuals | | Recognize, retain and motivate key contributors for performance, critical skills and potential | | Up to 10% of employees | | If selected, get one
more matching share
in addition to the preferred method. The dynamic nature of multi-service broadband access requires
SPP one |
| | | | |
| Executive Performance Stock Plan (EPSP) | | Share-based plan for senior executives | | Remuneration for long-term commitment and value creation | | Senior executives, including Executive Leadership Team | | Get up to 4, 6 or, for
CEO, 9 further
matching shares to
the SPP one for
long-term
performance |
REMUNERATION 2012
To enhance the understanding of how Ericsson translates remuneration principles and policy into practice, an internal remuneration website was launched in January 2011. The site contains e-learning and training programs targeted at line managers. It supports more informed decisions and better communication to the wider employee population. The next step in this development is the planned implementation of an Integrated HR IT tool. The first phase was launched to all managers in Ericsson in November 2012 and include performance management, talent planning, variable pay and annual salary review.
ERICSSON ANNUAL REPORT ON FORM 20-F 2012
TOTAL REMUNERATION
When considering the remuneration of an individual, it is the total remuneration that matters. First, the total annual cash compensation is defined, consisting of the target level of short-term variable remuneration plus fixed salary. Thereafter, target long-term variable remuneration may be added to get to the total target remuneration and, finally, pension and other benefits may be added to arrive at the total remuneration.
For the ELT, remuneration consists of fixed salary, short-term and long-term variable remuneration, pension and other benefits. If the size of any one of these elements is increased or decreased when setting the remuneration, at least one other element has to change if the competitive position is to remain unchanged.
The remuneration costs for the CEO and the ELT are reported in Note C28.
Fixed salary
When setting fixed salaries, the Remuneration Committee considers the impact on total remuneration, including pension and associated costs. The absolute levels are determined by the size and complexity of the position and the year-to-year performance of the individual. Together with other elements of remuneration, ELT salaries are subject to an annual review by the Remuneration Committee, which considers external pay data to ensure that levels of pay remain competitive and appropriate to the remuneration policy.
Variable remuneration
Ericsson strongly believes that, where possible, variable compensation should be encouraged as an integral part of total remuneration. First and foremost, this aligns employees with clear and relevant targets, but it also enables more flexible payroll costs and emphasizes the link between performance and pay. All variable remuneration plans have maximum award and vesting limits. Short-term variable remuneration is to a greater extent dependent on the specific unit or function, while long-term variable remuneration is dependent on the achievements of the Ericsson Group.
Short-term variable remuneration
Annual variable remuneration is delivered through cash-based programs. Specific business targets are derived from the annual business plan approved by the Board of Directors and, in turn, defined by the Company’s long-term strategy. Ericsson strives to grow faster than the market with best-in-class margins and strong cash conversion and therefore the starting point is to have three core targets:
For the ELT, targets are thus predominantly financial at either Group level (for Heads of Group functions) or at the individual unit level (for Heads of regions or business units) and may also include operational targets like customer satisfaction and employee engagement.
ERICSSON ANNUAL REPORT ON FORM 20-F 2012
The chart below illustrates how payouts to the ELT have varied with performance over the past five years.
Short-term variable remuneration structure
| | | | | | | | | | | | | | | | | | | | | | | | |
| | | Short-term variable remuneration
as percentage of fixed salary | | | Percentage of short-term variable
remuneration maximal opportunity | |
| | | Target
level | | | Maximum
level | | | Actual paid
for 2012 | | | Group financial
targets | | | Unit/functional
financial targets | | | Non-financial
targets | |
CEO 2012 | | | 40 | % | | | 80 | % | | | 32 | % | | | 90 | % | | | 0 | % | | | 10 | % |
CEO 2013 | | | 40 | % | | | 80 | % | | | — | | | | 100 | % | | | 0 | % | | | 0 | % |
Average ELT 20121) | | | 36 | % | | | 72 | % | | | 37 | % | | | 49 | % | | | 27 | % | | | 24 | % |
Average ELT 20131) | | | 38 | % | | | 76 | % | | | — | | | | 50 | % | | | 24 | % | | | 26 | % |
| 1) | Excludes CEO—differences in target and maximum levels from year to year are due to changes in the network technology used—a change from TDM/STM/ATM structures to IP/Ethernet. Ericsson already has a market-leading position in microwave radio systems and with the acquisitions of Marconi and Redback, the Company is well positioned with optical transmission systems and IP/Ethernet products.Convergence and network transformation in focus
Placing greater emphasis on smarter networks and bundled service offerings, operators are starting the conversion to all-IP broadband networks. An increase in broadband access, routing and transmission deployments, combined with next-generation service delivery and revenue management systems, means operators will be able to offer a broader range of services to key customer segments. Each segment (business, consumer and wholesale) requires a different and varying mix of fixed, mobile and converged services.
Ericsson has developed a network architecture that meets consumer desires and operator requirements for converged services, covering the device ecosystems, fixed and mobile broadband access, transport, control, applications, revenue management, services and operations management. All the components have been integrated for a high performance and scalable end-to-end solution.
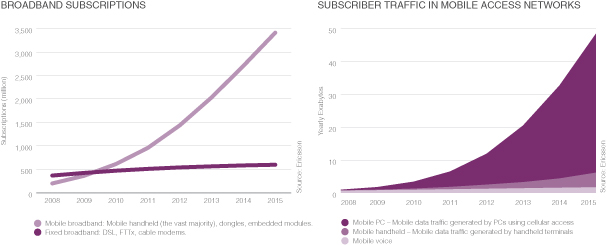
ERICSSON ANNUAL REPORT ON FORM 20-F 2009
Ericsson’s full-service broadband solution has been built from in-house development, e.g. mobile broadband and IMS, and is complemented by the acquisitions of IP-routing products (Redback), optical transport (Marconi), deep fiber access systems (Entrisphere) and IPTV (Tandberg). The Company has also developed a comprehensive network transformation service that leverages professional services such as consulting and systems integration.
The internet is changing TV
The visioncomposition of the television industry is a simple one: to let you watch whatever, whenever and wherever you want and to help you discover other interesting programs and share your favorites and comments with other people. We believe that the best way to achieve this is to use internet technology enhanced with telecom-gradeELT.
|
The Board of Directors and the Remuneration Committee decide on all Ericsson Group targets, which are cascaded to unit-related targets throughout the Company, always subject to a two-level management approval process. The Remuneration Committee monitors the appropriateness and fairness of Group target levels throughout the performance year and has the authority to revise them should they cease to be relevant or stretching or to enhance shareholder value.
During 2012, approximately 76,200 employees participated in short-term variable remuneration plans.
Long-term variable remuneration
Share-based long-term variable remuneration plans are submitted each year for approval by shareholders at the AGM. All long-term variable remuneration plans are designed to form part of a well-balanced total remuneration package and to span over a minimum of three years. As these are variable plans, outcomes are unknown and rewards depend on long-term personal investment, corporate performance and resulting share price performance. During 2012, share-based remuneration was made up of three different but linked plans: the all-employee Stock Purchase Plan, the Key Contributor Retention Plan and the Executive Performance Stock Plan.
The Stock Purchase Plan
The all-employee Stock Purchase Plan is designed to offer, where practicable, an incentive for all employees to participate. This reinforces “One Ericsson” aligned with shareholder interests. Employees can save up to 7.5% of gross fixed salary (the President and CEO can save up to 10% of gross fixed salary and short-term variable remuneration) for purchase of Class B shares at market price on NASDAQ OMX Stockholm or ADSs on
ERICSSON ANNUAL REPORT ON FORM 20-F 2012
Consumers are already using the internet to find new ways of accessing TV, with interactive on-demand capabilities now a basic expectation. Despite this trend, we do not expect operators to become marginalized as bit pipe providers. Efficient bit pipes will be needed, but to differentiate their services, operators will need to continue to leverage their network capabilities. This is where IMS comes into play to provide the reliability and combination of services required for a portfolio of applications which differentiates from the competition.
Today some 1.2 billion (850 million) households have television services, of which only 25 (20) million are currently served by IPTV. This number is expected to grow to above 130 million by end of 2015. In the same time period, DSL-based broadband access is forecasted to grow from some 300 million to 400 million households and cable-TV-based broadband access is estimated to grow from 90 million to more than 100 million households. FTTx-based broadband access is estimated to increase from 35 million to some 100 million households. Building on the acquisitions of Tandberg Television and Entrisphere, the Company continues to invest in a leading position in IPTV and FTTx broadband access.
Mobility is changing the internet
Today, less than 40 percent of mobile subscribers are also internet users. However, the increasing use of high-speed applications in the fixed environment is stimulating a parallel expectation on the mobile side. When people become accustomed to using bandwidth-intensive applications at home or in the office, they tend to want them everywhere they go.
Multimedia-capable mobile internet devices and affordable mobile broadband access are driving a change in usage. Users will be able to create and discover content of personal interest and instantaneously share ideas and information with friends and colleagues. We see mobile internet devices helping to accelerate consumer demand for wireless internet access. This will have the greatest impact on emerging markets, where household PC penetration is only about 10 percent compared with well over 60 percent in developed markets. This is particularly significant as there are more than three times as many households in emerging markets as there are in more developed markets.
The Company has established a product unit to provide mobile broadband connectivity for notebook PCs and other mobile internet devices. Three of the world’s largest notebook manufacturers are already using Ericsson embedded modules. In addition, Intel, among others, has signed an agreement to use Ericsson’s mobile broadband technology.
ERICSSON ANNUAL REPORT ON FORM 20-F 2009
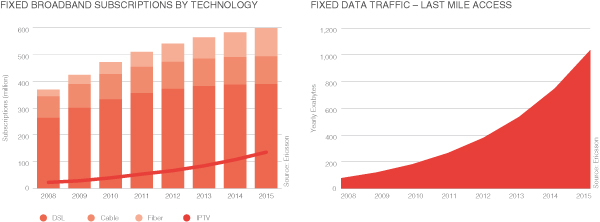
Operator consolidation and network sharing
Operator consolidation continues in all regions globally. In the Americas, consolidation has substantially reduced the number of operators. In Europe, mergers continue along with other collaborations such as network sharing and outsourcing of network operations. In other regions, operator consolidation has led to the emergence of rapidly growing pan-regional operators, particularly in the CEMA markets (Central and Eastern Europe, Middle East and Africa). Western European-based operators continue to invest in operators in developing markets such as Brazil and India. There have also been attempts to combine certain Indian operators with African operators but with little progress so far.
Despite the trend for operator consolidation, the number of mobile operators has actually increased in many regions over the past few years, with the notable exception of the Americas. The introduction of mobile number portability in many markets has simplified service substitution, leading to fierce competition and declining market share for the top two players in each market. Consequently, mobile operator margins are under pressure from the more intense competition which requires lower costs to compensate.
Network sharing offers potentially significant capex and opex savings to operators. However, the overall impact of network sharing should ultimately be neutral for mobile equipment vendors. To a certain extent, short-term disruption of capital expenditure plans or re-negotiation of contracts with the network sharing companies may be offset by faster coverage buildout, an earlier entry into expansion phases and increased sales of professional services, particularly network integration and managed operations. Over the longer term, the majority of savings come from shared plant and property rather than equipment as the equipment has to be dimensioned for the total traffic load of the combined networks.
Ericsson is well positioned to benefit from operator consolidation with a suite of solutions for network sharing and a well proven capability for outsourcing network operations, consulting and systems integration as well as a strong presence with consolidating companies.
Opportunities in Professional Services
Outsourcing of network operations is another form of consolidation. Operators are able to tap into the global scale and efficiency offered by a company like Ericsson via managed services. Ericsson is well positioned to benefit from this trend for operator consolidation with a suite of professional services and a well proven capability for outsourcing network operations.
ERICSSON ANNUAL REPORT ON FORM 20-F 2009
Demand for professional services (i.e., managed services, consulting, systems integration, network optimization and modernization) is growing rapidly. The demand for professional services is increasing, driven by operators’ desire to optimize capex investments, take out unnecessary costs and deliver a competitive end-user experience.
The potential market for managed services is larger than the market for network equipment and related deployment services. A mature operator is estimated to typically spend some 5–6 percent of revenues on network equipment and 10–12 percent on operating its network.
More than two-thirds of network operational expenses today are believed to be handled in-house by operators but network operations are increasingly being outsourced as operators realize the competitive advantages and potential cost savings. Therefore, the available market for managed services is expected to continue to show good growth prospects.
Over time, as networks evolve, grow and become more versatile, their complexity increases and so does the number of operations and business support systems. This creates many opportunities to help operators streamline both networks and operations. One aspect of streamlining is reducing the number of support systems needed for the network. The other aspect of streamlining comes from outsourcing operations. Operators may also ask for advice and best-practice to create efficiency in their own operations. An indicator of this streamlining or efficiency trend is the increasing demand for consulting and systems integration services like revenue assurance, operations and business support systems transformation and service assurance.
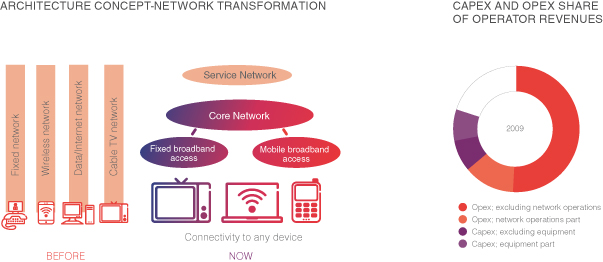
Replacement rates affect mobile handset sales
With subscriber additions slowing, mobile phone replacements have increasingly become the key market driver, now accounting for roughly two-thirds of shipments and an even higher proportion of sales.
Mobile phone replacement tends to go in tandem with contract renewal. In mature markets, this is often operator driven via subsidies that lower or eliminate the upfront cost of buying a new phone in exchange for multi-year subscription commitments. Many operators are now pushing SIM card only plans to reduce phone subsidies for lower value subscriptions and prioritizing subsidies for smartphones and mobile internet devices that carry much higher value subscriptions. This is slowing the demand for replacement phones, especially in the low- to mid-end price range, as consumers postpone upgrading their mobile phones.
ERICSSON ANNUAL REPORT ON FORM 20-F 2009
In emerging markets, operators often subsidize multi SIM card plans rather than handsets. This has stimulated the market for ultra low priced phones rather than curtailing subscription growth or mobile phone usage. With inflationary and other economic pressures rising in these markets, consumers are buying more refurbished or unlicensed phones. Manufacturers of illicit phones enjoy cost advantages because they do not pay for licenses, test their products for safety or provide warranties or offer sales support. Some countries, such as India, are especially concerned about personal safety and national security of unlicensed phones, but enforcement is far less strict in most other emerging markets.
Sony Ericsson has refined its product portfolio and value proposition to target an increased share of the replacement market.
Effects of the macro-economic slowdown
While not a trend, the economic recession affected Ericsson’s business development for networks, but with improving operational efficiency, a market leading position, scale and a solid balance sheet, the Company is in a good position to meet continued tough market conditions.
The macro-economic developments are externally driven and beyond the control or the influence of the Company. But the Company does control the cost structure and is adjusting to a more challenging market environment including the effects of a global recession.
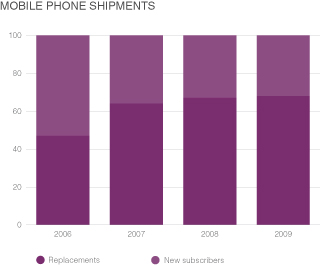
ERICSSON ANNUAL REPORT ON FORM 20-F 2009
INFORMATION ON THE COMPANY
CONTENTS
COMPANY HISTORY AND DEVELOPMENT
Innovating to empower people, business and society
Our origins date back to 1876 when Alexander Graham Bell filed a patent application in the United States for the telephone. The same year, Lars Magnus Ericsson opened a small workshop in Stockholm to repair telegraph instruments and sell his own telephone equipment.
Today, Ericsson is a leading provider of communications equipment, professional services and multimedia solutions. Our customers are operators of mobile and fixed networks worldwide. Over 1,000 networks in more than 175 countries utilize our equipment. More than 40 percent of all mobile traffic goes through Ericsson equipment.
We invest heavily in R&D and promote standardization and open systems. We have a long history of innovation and pioneering future telecommunications technologies. We have one of the industry’s most comprehensive intellectual property portfolios with approximately 25,000 patents.
Ericsson’s vision is “to be the prime driver in an all-communicating world”—a world in which any person can use voice, text, images and video to share ideas and access information whenever and wherever they want. Within a few years, we foresee communications extending beyond places and people to devices. Then everything that benefits from being connected will be. We strongly believe that affordable and generally available telecommunications are a prerequisite for social and economic development, and that the ICT industry is a key enabler for a sustainable and prosperous society and for bridging the digital divide.
Our strategy to realize our vision and reach our goals is to:
Excel with a leading portfolio in mobile and converged networks.
Expand in services by enabling world-class operations and network evolution.
Extend in multimedia, with leading applications and business support solutions.
Successful execution of the strategy is built on (1) close customer relations; (2) technology and services leadership and (3) operational excellence in all we do.
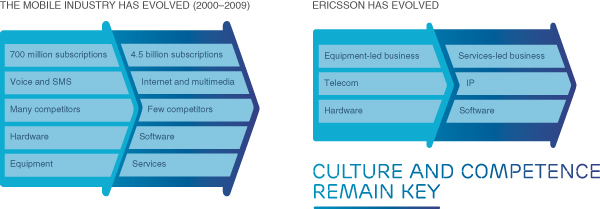
ERICSSON ANNUAL REPORT ON FORM 20-F 2009
Close customer relations
The foundation for our business is our strong, long-term customer relationships. We have been present in most of our markets for more than 100 years. We work closely with the operators to understand their business, their objectives and technology needs.
We are a major supplier to most of the world’s leading mobile operators and many leading wireline operators. We believe that our ability to offer superior end-to-end solutions and services makes us well positioned to assist operators with their network development and operations. With our significant scale advantage, custom-tailored end-to-end solutions and local presence, we are able to serve as a true partner—providing fast time-to-market and competitive total cost of ownership—helping our customers reach their business objectives.
Ericsson has 82,500 employees across the world, close to our customers. Local operations have strong technical, commercial and administrative support from specialist functions in R&D, supply, network operations centra and Group functions.
Technology and services leadership
Innovation is an important element of our corporate culture. It is key to our competitiveness and future success. We have a long tradition of developing innovative communication technologies. By early involvement in creating new standards we are often first to market with new solutions—a distinct competitive advantage.
We are a market leader in GSM, WCDMA/HSPA, LTE, packet core networks, microwave transmission, revenue management applications and managed services. We are growing in the area of wireline access, metro Ethernet solutions and optical transport, and we are a provider of multimedia solutions and brokering services for both wireless and wireline operators and TV broadcasters. We have recently acquired Nortel’s CDMA and LTE operations in North America.
Within our ambitious R&D program, we have approximately 18,300 (19,800) employees in 17 (17) countries worldwide and in 2009 we invested SEK 27 billion (excluding SEK 6 billion restructuring charges) or 13 percent of sales. Most of this is invested in product development, of which the greater part is in network infrastructure. We have continued to invest in strategically important areas of broadband access, converged core networks, IP technology and multimedia. Our ability to generate world-class innovations is enhanced through cooperation with a variety of partners, including customers, universities and research institutes.
Through many years of development of new technologies we have built up a considerable portfolio of intellectual property rights (IPR)
NASDAQ New York (contribution shares) over a twelve-month period. If the contribution shares are retained by the employee for three years after the investment and employment with the Ericsson Group continues during that time, the employee’s shares will be matched with a corresponding number of Class B shares or ADSs, as applicable. The plan was introduced in 2002 and employees in 71 countries participated during its first year. In December 2012, the number of participants was over 27,000, or approximately 28% of eligible employees in 100 countries.
Participants save each month, beginning with the August payroll, towards quarterly investments. These investments (in November, February, May and August) are matched on the third anniversary of each such investment and hence the matching spans over two financial years and two tax years.
The Key Contributor Retention Plan
The Key Contributor Retention Plan is part of Ericsson’s talent management strategy. It is designed to recognize individuals for performance, critical skills and potential as well as to encourage retention of key employees.
Under the program, operating units around the world can nominate up to 10% of employees worldwide. Each unit nominates individuals that have been identified according to performance, critical skills and potential. The nominations are calibrated in management teams locally and are reviewed by both local and corporate Human Resources to ensure that there is a minimum of bias and a strong belief in the system.
Participants selected obtain one extra matching share in addition to the one matching share for each contribution share purchased under the Stock Purchase Plan during a twelve-month investment period. The plan was introduced in 2004.
The Executive Performance Stock Plan
The Executive Performance Stock Plan was first introduced in 2004. The plan is designed to focus management on driving long-term financial performance and to provide market competitive remuneration. Senior executives, including the ELT, are selected to obtain up to four or six extra shares (performance matching shares). This is in addition to the one matching share for each contribution share purchased under the all-employee Stock Purchase Plan. Performance matching is subject to the fulfillment of performance targets. Since 2010, the President and CEO may obtain up to nine performance matching shares in addition to the Stock Purchase Plan matching share for each contribution share.
In the 2004 to 2010 plans, the performance targets were Earnings Per Share (EPS) targets.
To support the long-term strategy and value creation of the Company, new targets were defined for the 2011 plan. At the AGM 2012, the following targets for the 2012 Executive Performance Stock Plan were resolved on proposal by the Board:
Up to one-third of the award shall vest provided the compound annual growth rate (CAGR) of consolidated net sales between year 0 (2011 financial year) and year 3 (2014 financial year) is between 2% and 8%. As of December 31, 2009, we held approximately 25,000 (24,000) patents worldwide, including patents essential to the standards GSM, GPRS, EDGE, WCDMA, HSPA, MBMS, TD-SCDMA, cdma2000, WiMAX and LTE. We also hold essential patents for many other areas, e.g. IMS, Voice-over-IP, ATM, Messaging, WAP, Bluetooth, SDH/SONET, WDM and Carrier Ethernet.
Our intellectual property rights are valuable business assets. We license these rights to many other companies (infrastructure equipment suppliers, embedded module suppliers, handset suppliers and mobile application developers) in return for royalty payments and/or access to their intellectual property rights. We believe that we have access to all essential patents that are material to our business in part or in whole.
For more information, please see also Risk Factors, “Market, Technology and Business Risks”.
ERICSSON ANNUAL REPORT ON FORM 20-F 2009
Operational excellence in all we do
Ericsson is focused mainly on infrastructure solutions and services for telecom operators. This focus enables us to have a functional organization and leverage our scale to gain competitive advantage. The Group is organized in some 200 legal entities, aligned to a common functional structure, using standardized processes.
Group functions coordinate the Company’s strategies, operations and resource allocation and establish the necessary directives, processes and organization for the effective governance of the Group. They also manage support units, such as Ericsson Research, IT and shared service centers.
The main operational functions/processes are:
Business units:
product/service and solution development
sourcing, manufacturing and supply of products
sales of spare parts and repair.
Market units:
Operational excellence is an important competitive advantage. and we focus on three areas:
Speed—to reduce time to market and working capital and to increase flexibility and responsiveness.
Scale—to leverage our market-leading position, enabling us to afford developing best-in-class solutions.
Skills—to work according to standardized processes with highly educated employees and partners.
We continuously focus on improving processes, support systems and our ways of working. Our mission, to empower people, business and society, requires strong change capabilities and efficient and effective processes, delivering innovative, high-quality solutions with low cost of ownership.
The Company culture of innovation and competitiveness and continuous competence development of our employees are key enablers for success. Ericsson Academy is one of our vehicles to achieve this—a new, innovative forum for learning and sharing of ideas and knowledge, open to our employees and available to our customers during 2010. We believe this will sharpen our employees’ skills, enhance performance for our customers, and give us a competitive edge in the new business and technology landscape.
To further increase flexibility and efficiency and reduce cost, we have several partnerships with strong players in outsourced manufacturing, IT services and certain areas of R&D and services. Examples are: Flextronics, HP, IBM and Tieto.
ERICSSON ANNUAL REPORT ON FORM 20-F 2009
GENERAL FACTS ON THE COMPANY
Legal name of the Parent Company:
Telefonaktiebolaget LM Ericsson (publ)
Organization number:
556016-0680
Legal form of the Parent Company:
A Swedish limited liability company, organized under the Swedish Companies Act. The terms “Ericsson”, “the Company”, “the Group”, “us”, “we”, and “our” all refer to Telefonaktiebolaget LM Ericsson and its subsidiaries.
Country of incorporation:
Sweden.
Date of incorporation:
The Parent Company was incorporated on August 18, 1918, as a result of a merger between AB LM Ericsson & Co. and Stockholms Allmänna Telefon AB.
Domicile:
Our registered office is Telefonaktiebolaget LM Ericsson, SE–164 83 Stockholm, Sweden. Our headquarters are located at Torshamnsgatan 23, Kista, Sweden.
Telephone number:
+46 10 719 0000
Website:
www.ericsson.com
Agent in the US:
Ericsson Inc., Vice President Legal Affairs, 6300 Legacy Drive, Plano, Texas 75024. Telephone number: +1 972 583 0000.
Shares:
Ericsson’s Class A and Class B shares are traded on NASDAQ OMX Stockholm. In the US, our American Depository Shares (ADS), each representing one underlying Class B share, are traded on NASDAQ.
Parent Company operations:
The business of the Parent Company, Telefonaktiebolaget LM Ericsson, consists mainly of corporate management, holding company functions and internal banking activities. Parent Company operations also include customer credit management activities performed by Ericsson Credit AB on a commission basis.
ERICSSON ANNUAL REPORT ON FORM 20-F 2009
Subsidiaries and associated companies:
For a listing of our significant subsidiaries, please see Notes to the Parent Company Financial Statements—Note P9, “Investments”. In addition to our joint ventures Sony Ericsson and ST-Ericsson, we are engaged in a number of other minor joint ventures, cooperative arrangements and venture capital initiatives. For more information regarding risks associated with joint ventures, strategic alliances and third-party agreements please see Risk Factors, “Market, Technology and Business Risks”.
Documents on display:
We file annual reports and other information (normally in Swedish only) for certain domestic legal entities with Bolagsverket (Swedish Companies Registration Office) pursuant to Swedish rules and regulations.
You may order any of these reports from their website www.bolagsverket.se. If you access these reports, please be aware that the information included may not be indicative of our published consolidated results in all aspects. Other than information related to the Parent Company, only consolidated numbers for the Group totals are included in our reports.Filing in the US:Annual reports and other information are filed with the Securities and Exchange Commission (SEC) in the United States, pursuant to the rules and regulations that apply to foreign private issuers. Electronic access to these documents may be obtained from the SEC’s website, www.sec.gov/edgar/searchedgar/webusers.htm, where they are stored in the EDGAR database.
MARKET ENVIRONMENT
Ericsson has evolved with the changes in the industry:
from equipment driven, to services driven, with close to 40 percent of sales and almost 50 percent of employees now related to services
from hardware to software, with more and more of the functionality in our solutions being software-based
from narrow-band voice to all-IP broadband, with strong focus on converged networks and services capabilities.
Customers
We supply equipment, integrated solutions, multimedia applications and services to almost all major operators globally. We derive most of our sales from large, multi-year agreements with a limited number of significant customers. Out of a customer base of more than 425 network operators, the 10 largest customers account for 42 (42) percent of our net sales and the 20 largest customers account for 57 (61) percent of our net sales. Our largest customer accounted for approximately 5 (6) percent of sales in 2009. For more information, see Risk Factors, “Market, Technology and Business Risks”
Our customers have different needs and demands when interacting with us:
Strategy and business model development in an increasingly complex environment.
Network expansion and evolution in response to subscriber and traffic growth and new technology.
Support, training and spare parts.
Efficient operations to keep operating expenses competitive.
Our own market units are our primary sales channel. They perform most of the sales where the customer is a fixed or mobile telecommunications operator.
ERICSSON ANNUAL REPORT ON FORM 20-F 2009
For certain products or solutions we also use other channels:
TV solutions are sold through other equipment vendors as resellers as well as directly by business unit Multimedia to cable-TV operators.
Mobile broadband modules are sold directly by business unit Networks to PC/netbook manufacturers.
For newly acquired entities, certain market channels normally prevail during a transition period, e.g. LHS has maintained its market channels for billing solutions until it is fully owned and integrated.
A central IPR unit is managing sales of licenses to equipment vendors or others who wish to use our patented technology.
Our two joint ventures are the channels to the handset and mobile platform/chipset markets.
Our sales to network operators is normally based on multi-year frame agreements after an initial tender with a system and supplier selection.
During the frame agreement, equipment, software, services and spare parts are called off according to price lists. On a highly selective basis we occasionally provide customer financing. The vast majority of customer financing is provided by third parties, often guaranteed by Swedish export credit agencies. Various types of services, such as training or consulting, are often ordered separately as needed. Managed services contracts are normally also multi-year contracts and negotiated separately as they require extensive scoping and planning for transfer of employees and operations.
We have implemented a strict trade compliance program throughout the Company in order to comply with foreign and domestic laws and regulations, trade embargoes and sanctions in force. Our business activities should not be construed as supporting a particular political agenda or regime in any way.
Seasonality
Our quarterly sales, income and cash flow from operations are seasonal in nature and generally lowest in the first quarter of the year and highest in the fourth quarter. This is mainly a result of the seasonal purchase patterns of network operators. The table below illustrates the average seasonal effect on sales for the five-year period 2005 through 2009.
MOST RECENT 5-YEAR AVERAGE SEASONALITY
| | | | | | | | | | | | |
| | | First
quarter | | | Second
quarter | | | Third
quarter | | | Fourth
quarter | |
Sequential Change | | –20 | % | | 13 | % | | –6 | % | | 29 | % |
Share of annual sales | | 22 | % | | 25 | % | | 23 | % | | 30 | % |
Competitors
In the Networks segment, we compete mainly with large and well-established communication equipment suppliers. Our most significant competitors include Alcatel/Lucent, Huawei, Nokia/Siemens, Cisco, ZTE and Juniper. We also compete with numerous local and regional manufacturers and providers of communication equipment and services.
We believe the most important competitive factors in this industry include; existing customer relationships, superior network performance and subscriber experience, technological innovation, product design and cost, and the ability to scale/ upgrade/migrate existing network investments, and the systems integration capability.
ERICSSON ANNUAL REPORT ON FORM 20-F 2009
Competition in the Professional Services segment includes not only many of the suppliers mentioned above, but also large companies from other industry sectors, such as Accenture, HP/ EDS, IBM, and several India-based off-shore companies, e.g. Tata Consultancy Services and Tech Mahindra, as well as a large number of smaller but specialized companies operating on a local or regional basis.
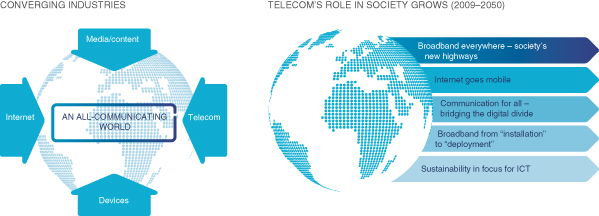
As this segment grows, we expect to see additional competitors emerge, possibly as a result of network sharing or of network operators attempting to expand their business.
In the Multimedia segment we face significant competition. As the market is rather fragmented, our competitors vary widely depending on the product or service being offered. Competitors include many of the traditional communication equipment and IT suppliers as well as companies from other industries, such as Acision, Amdocs, Comverse, Harmonic, Oracle and Thomson.
Within the handset market, Sony Ericsson’s primary competitors include Nokia, Motorola, Samsung, LG, NEC and Sharp, as well as companies like Apple, HTC and RIM for smartphones. We believe that our joint venture with SONY Corporation creates a distinctive competitive advantage by combining our telecom expertise with their media, content and consumer equipment know-how.
We also compete in the mobile platform/wireless chipset market through our joint venture ST-Ericsson. Here, the largest competitor is Qualcomm. This market is growing in complexity as several new software platforms for handsets and other devices are being launched, e.g. Google’s Android, Microsoft’s Windows and Samsung’s Bada.
For more information on competitive risks, see Risk Factors, “Market, Technology and Business Risks”.
SEGMENT OVERVIEW
Operating segments
Ericsson is a vendor of solutions and services to telecom operators of fixed and mobile networks. We also provide TV solutions and managed services for television broadcast companies and mobile access modules to netbook manufacturers. Through two joint ventures we address the mobile handset and mobile platform/wireless chipset markets.
ERICSSON ANNUAL REPORT ON FORM 20-F 2009
When determining our operating segments, we have looked at which markets and what type of customers our products and services aim to attract as well as what distribution channels they are sold through. We have also considered commonality regarding technology, research and development. To best reflect our business focus and to facilitate comparability with peers, we report five operating segments:
Up to one-third of the award shall vest provided the compound annual growth rate (CAGR) of consolidated operating income between year 0 (2011 financial year) and year 3 (2014 financial year) is between 5% and 15%.
Up to one-third of the award will be based on the cash conversion during each of the years during the performance period, calculated as cash flow from operating activities divided by net income reconciled to cash. One-ninth of the total award will vest for any year, i.e. financial years 2012, 2013 and 2014, if cash conversion is at or above 70%.
ERICSSON ANNUAL REPORT ON FORM 20-F 2012
Before the number of performance shares to be matched are finally determined, the Board of Directors shall examine whether the performance matching is reasonable considering the Company’s financial results and position, conditions on the stock market and other circumstances, and if not, as determined by the Board of Directors, reduce the number of performance shares to be matched to the lower number of shares deemed appropriate by the Board of Directors. When undertaking its evaluation of performance outcomes the Board of Directors will consider, in particular, the impact of larger acquisitions, divestitures, the creation of joint ventures and any other significant capital event on the three targets on a case by case basis.
Benefits and terms of employment
Pension benefits follow the competitive practice in the employee’s home country and may contain various supplementary plans, in addition to any national system for social security. Where possible, pension plans are operated on a defined contribution basis. Under these plans, Ericsson pays contributions into a plan but does not guarantee the ultimate benefit, unless local regulations or legislation prescribe that defined benefit plans that do give such guarantees have to be offered.
For the President and CEO and other members of the ELT employed in Sweden before 2011, a supplementary pension plan is applied in addition to the occupational pension plan for salaried staff on the Swedish labor market (ITP). The pension age for these ELT members is normally 60 years.
The ELT members employed in Sweden from 2011 are normally covered by the defined contribution plan under the ITP1 scheme, with a pensionable age of 65 years.
For members of the ELT who are not employed in Sweden, local market competitive pension arrangements apply.
Other benefits, such as company car and medical insurance, are also set to be competitive in the local market. The ELT members may not receive loans from the Company.
The ELT members locally employed in Sweden have a mutual notice period of up to six months. Upon termination of employment by the Company, severance pay can amount to up to 18 months’ fixed salary. For other ELT members, different notice period and severance pay agreements apply; however, no agreement exceeds the notice period of six months or the severance pay period of 18 months.
ERICSSON ANNUAL REPORT ON FORM 20-F 2012
SHARE INFORMATION
Sony Ericsson
Segment Networks
Networks includes products/solutions for:
wireless and wireline access
In 2009, we acquired Nortel’s CDMA and LTE operations. Services, other than network rollout, are reported under Professional Services. In 2009, segment Networks accounted for 66 percent of total sales.

Wireless and wireline access
Ericsson provides market-leading wireless access solutions to network operators for reliable, efficient and cost-effective mobile telephony networks. Ericsson also has a strong product portfolio for wireline access. Our
ERICSSON ANNUAL REPORT ON FORM 20-F 2009
leadership in GSM, WCDMA/ HSPA and LTE technologies and now also CDMA enables us to offer tailored solutions regardless
| Sale of the existing network standard used, delivering superior performance and consumer experience.We provide wireline access solutions, for both fiber and copper, such as GPON and DSL. In 2009, AT&T appointed Ericsson as a domain vendor for wireline access solutions.
IP core network (switching, routing and control)
Our core network solutions include industry-leading softswitches, IP infrastructure for edge and core routing (Ericsson SmartEdge), IP-based Multimedia Subsystem (IMS) and gateways. GSM and WCDMA/HSPACompany’s share a common core network. Therefore operators’ previous investments are preserved as they migrate from voice-centric to multimedia networks. Our switching products have industry-leading scalability and capacity.
Transmission/backhaul
Our MINI-LINK microwave system is one of the world’s most widely deployed mobile backhaul solutions. Transport networks (e.g. MINI-LINK, metro optical networks) are essential elements of our end-to-end solutions.
Network management
Ericsson offers a portfolio of network management tools, supporting vital operator activities for management of existing networks as well as for introduction of new network architectures, technologies and services, such as: configuration, performance monitoring, security management, inventory management and software upgrades. The tools are applicable for fixed and mobile access, transport and core. They are often capable of managing also multi-vendor networks.
Network rollout services
Fast rollout of large networks involves a heavy ramp-up of resources. Ericsson’s Global Services organization uses a mix of local, in-house capabilities, authorized service providers and central specialist resources. We manage our capabilities in a way that has proven to be highly successful, resulting in successful projects and satisfied customers.
Sourcing, manufacturing and supply and availability of materials
Our hardware products largely consist of electronics, such as circuit boards, radio frequency (RF) modules, antennas etc. For manufacturing of products we purchase customized and standardized equipment, components and services from several global providers as well as from numerous local and regional suppliers. We produce certain types of components in-house, such as power modules and cables.
The production of electronic modules and sub-assemblies is mostly outsourced to manufacturing services companies (EMS), of which the vast majority is in low-cost countries. Node production, i.e. assembly, integration and testing of modules into complete radio base stations, mobile switching centers etc., is largely done in-house and on-demand.
Where possible, we rely on alternative supply sources for the purchased elements of our products. This avoids sole source situations and secures sufficient supply at competitive prices. When selecting a new supplier, we try to ensure that our technical standards and other requirements are met, including our supplier code of conduct. Assuming there will only be a moderate increase in near-term market demand, we do not foresee any
ERICSSON ANNUAL REPORT ON FORM 20-F 2009
supply constraints to meet our expected production requirements during 2010. Variations in market prices for copper, aluminum, steel, precious metals, plastics and other raw materials generally have a limited effect on our total cost of goods sold. For more information related to sourcing, see Risk Factors, “Market, Technology and Business Risks”.
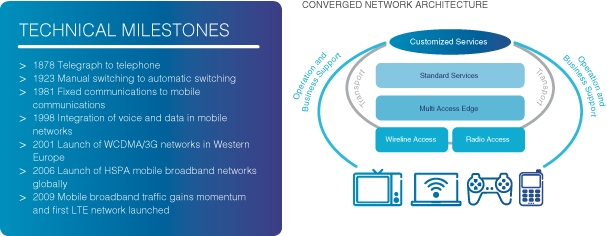
We continuously adjust our production capacity to meet expected demand. At year-end 2009, our overall capacity utilization was close to 100 percent. The table “Primary manufacturing and assembly facilities” summarizes where we have major sites as well as the total floor space at year-end. In Sweden, the majority of the floor space within our production facilities is used for node assembly and verification.
Segment Professional Services
Ericsson’s professional services capabilities include expertise in managed services, systems integration, consulting, education and customer support services.
Segment Professional Services accounted for 27 percent of total sales in 2009, up from 23 percent in 2008.
Managed services
We are the industry leader in managed services, managing networks with more than 370 million subscribers. We offer the most comprehensive managed services capabilities within the telecom industry:
Network design and planning.
Network operations; including networks without any Ericsson equipment installed, such as Sprint’s fixed and mobile CDMA/IDEN networks in the US.
Field operations and maintenance of sites.
Shared solutions; e.g. managed backhaul or hosting of platforms like pre-paid or real time billing/charging.
ERICSSON ANNUAL REPORT ON FORM 20-F 2009
Systems integration
Operators can minimize risk by engaging Ericsson to:
integrate equipment from multiple suppliers
manage technology change programs
design and integrate new solutions.
More and more operators who introduce multimedia services or face challenging technology transformations ask us to serve as prime integrator, ensuring successful deployment of the total solution.
Consulting
With expertise in business, strategy and technology, our consultants support customers in decision-making, planning and execution in order to improve and grow their business. Our Industry Programs package the expertise into end-to-end solutions in the key areas of multimedia, 3G rollout, broadband, value creation and revenue assurance.
Education
We provide our customers with tailored education programs to ensure their employees have the skills and competences necessary for managing today’s and tomorrow’s complex technologies.
Customer support
Having experienced professionals available around-the-clock to provide customer support is a crucial part of our service offering. We support operators across the world with over one billion customers in total.
PRIMARY MANUFACTURING AND ASSEMBLY FACILITIES
| | | | | | | | | | | | | | | | 2009 | | 2008 | | 2007 | | | | Sites | | Thousands
of sq meters | | Sites | | Thousands
of sq meters | | Sites | | Thousands
of sq meters | Sweden | | 8 | | 224.7 | | 8 | | 226.0 | | 8 | | 244.3 | China | | 4 | | 46.4 | | 4 | | 38.5 | | 4 | | 33.9 | Estonia | | 1 | | 26.6 | | — | | — | | — | | — | Italy | | 2 | | 20.1 | | 2 | | 20.1 | | 2 | | 20.1 | Brazil | | 1 | | 23.3 | | 1 | | 18.0 | | 1 | | 25.9 | India | | 1 | | 13.6 | | 1 | | 9.0 | | 1 | | 6.4 | USA | | — | | — | | 1 | | 5.0 | | 1 | | 5.0 | Other | | — | | — | | 1 | | 0.3 | | 1 | | 0.3 | | | | | | | | | | | | | | Total | | 17 | | 354.7 | | 18 | | 316.9 | | 18 | | 335.9 | | | | | | | | | | | | | |
ERICSSON ANNUAL REPORT ON FORM 20-F 2009
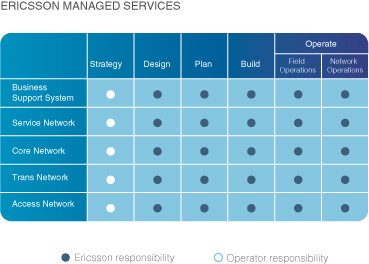
Segment Multimedia
Sales in segment Multimedia were 6 percent of total sales excluding mobile platforms and PBX business.
Consumer and Business Applications
We provide our operator customers with multimedia solutions for the consumer and business markets. For the consumer segment, we offer Rich Communication Suite (RCS), mobile TV solutions, messaging, a social media portal, and location-based services. In the business communication segment, we provide converged, fixed-mobile, business communication solutions for enterprise needs. Ericsson Business Communication Suite (BCS) is a network operator application for business users.
Multimedia Brokering
Ericsson Multimedia Brokering offers a range of payment, messaging and location-based services solutions: e.g. IPX Payment, IPX Messaging and IPX Subscriber Information services. We offer multimedia brokering solutions, to help network operators monetize their network assets by facilitating payment and distribution of content through interconnection of network operators with content and media companies, information and search services, consumer brands and a variety of enterprises.
Service delivery and provisioning
Our service delivery platforms and provisioning solutions enable operators and service providers to create, sell, and manage multimedia services and multi-play offerings. By combining products, solutions, systems integration and business consulting into one offering, we create a multimedia marketplace for each customer’s specific needs.
Revenue management
We provide revenue management solutions, enabling new business models, utilizing our unique combined competence in prepaid and postpaid. Our convergent charging and billing offering helps operators reduce cost and increase revenues by creating one unified solution to manage all their customers and services.
ERICSSON ANNUAL REPORT ON FORM 20-F 2009
TV
We have an industry-leading IMS-enabled middleware in the IPTV market, and also offer a full system integration and solutions delivery role. We have strengthened our compression market leadership through the launch of the next-generation encoding platforms. In the Video on Demand and Content Management area, we extended our product range.
Segment Sony Ericsson
Sony Ericsson delivers innovative and feature-rich mobile phones, and accessories, which allow us(50%) to provide end-to-end solutions to our customers. The joint venture, formed in October 2001, combines the mobile communications expertiseSony, with a positive cash flow effect of SEK 9.1 billion. | | Feb, 2012 | | | |
EFI | | Sale of Ericsson Federal Inc. (EFI), with the consumer electronic devices and content expertisea positive cash flow effect of SONY Corporation. It forms an essential part of our end-to-end capability for mobile multimedia services.SEK 360 million. | | Dec, 2010 Sony Ericsson’s results are reported according to the equity method under “Share in earnings of joint ventures and associated companies” in the income statement.
|
ERICSSON ANNUAL REPORT ON FORM 20-F 2012
Please also see Notes to the Consolidated Financial Statements—Note C3, “Segment Information”.
Segment ST-Ericsson
Ericsson and STMicroelectronics formed ST-Ericsson as a 50/50 joint venture in February 2009. The combined company has one of the industry’s strongest product offerings in semiconductors and platforms for mobile devices for GSM/ EDGE, WCDMA/HSPA and TD-SCDMA as well as LTE. ST-Ericsson is a leading supplier to the top handset vendors, and its products and technologies enable more than half of all handsets in use today.
ST-Ericsson’s results are reported according to the equity method under “Share in earnings of joint ventures and associated companies” in the income statement.
Please see also Notes to the Consolidated Financial Statements—Note C3, “Segment Information”.
Geographical areas
Sales are reported in five geographical areas; Western Europe, CEMA (Central and Eastern Europe, Middle East and Africa), Asia Pacific, Latin America and North America. The areas have different characteristics in terms of penetration of fixed and mobile telephony, network traffic, sophistication of services, average country GDP and other economic factors. The distribution of sales between the areas mitigates volatility, as a decrease in one area is often offset by an increase in another. No individual country accounts for more than 10 percent of sales. However, due to our improved market position there, the US is expected to account for between 10 and 15 percent of sales next year.
SALES PERRE GIONAN D SEGMENT 2009
| | | | | | | | |
SEK billion | | Networks | | Professional
Services | | Multi-
media | | Total |
Western Europe | | 23.8 | | 18.3 | | 2.4 | | 44.6 |
CEMA1) | | 32.7 | | 12.9 | | 5.1 | | 50.7 |
Asia Pacific | | 50.5 | | 12.2 | | 3.1 | | 65.8 |
Latin America | | 13.0 | | 5.9 | | 1.1 | | 20.0 |
North America | | 17.1 | | 6.7 | | 1.6 | | 25.4 |
| | | | | | | | |
Total | | 137.1 | | 56.1 | | 13.3 | | 206.5 |
| | | | | | | | |
1) | Central and Eastern Europe, Middle East and Africa. |
ERICSSON ANNUAL REPORT ON FORM 20-F 2009
REMUNERATION REPORT
CONTENTSC27 LEASING
Leasing with the Company as lessee
Assets under finance leases, recorded as property, plant and equipment, consist of:
Finance leases
| | | | | | | | |
| | | 2012 | | | 2011 | |
Cost | | | | | | | | |
Real estate | | | 1,538 | | | | 1,856 | |
Machinery | | | 3 | | | | 3 | |
| | | | | | | | |
| | | 1,541 | | | | 1,859 | |
| | | | | | | | |
Accumulated depreciation | | | | | | | | |
Real estate | | | –601 | | | | –725 | |
Machinery | | | –3 | | | | –3 | |
| | | | | | | | |
| | | –604 | | | | –728 | |
| | | | | | | | |
Accumulated impairment losses | | | | | | | | |
Real estate | | | –35 | | | | –42 | |
| | | –35 | | | | –42 | |
| | | | | | | | |
Net carrying value | | | 902 | | | | 1,089 | |
| | | | | | | | |
As of December 31, 2012, future minimum lease payment obligations for leases were distributed as follows:
Future minimum lease payment obligations for leases
| | | | | | | | |
| | | Finance
leases | | | Operating
leases | |
2013 | | | 150 | | | | 2,847 | |
2014 | | | 229 | | | | 1,794 | |
2015 | | | 127 | | | | 1,388 | |
2016 | | | 85 | | | | 1,105 | |
2017 | | | 76 | | | | 777 | |
2018 and later | | | 795 | | | | 2,472 | |
| | | | | | | | |
Total | | | 1,462 | | | | 10,383 | |
| | | | | | | | |
Future finance charges1) | | | –398 | | | | n/a | |
| | | | | | | | |
Present value of finance lease liabilities | | | 1,064 | | | | 10,383 | |
| | | | | | | | |
Expenses in 2012 for leasing of assets were SEK 3,172 (3,362) million, of which variable expenses were SEK 20 (7) million. The leasing contracts vary in length from 1 to 20 years.
The Company’s lease agreements normally do not include any contingent rents. In the few cases they occur, they relate to charges for heating linked to the oil price index. Most of the leases of real estate contain terms of renewal, giving the Company the right to prolong the agreement in question for a predefined period of time. All of the finance leases of facilities contain purchase options. Only a very limited number of the
ERICSSON ANNUAL REPORT ON FORM 20-F 2012
Company’s lease agreements contain restrictions on stockholders’ equity or other means of finance. The major agreement contains a restriction stating that the Parent Company must maintain a stockholders’ equity of at least SEK 25 billion.
Leases with the Company as lessor
Leasing income relates to subleasing of real estate as well as equipment provided to customers under leasing arrangements. These leasing contracts vary in length from 1 to 11 years.
At December 31, 2012, future minimum payment receivables were distributed as follows:
Future minimum payment receivables
| | | | | | | | |
| | | Finance
leases | | | Operating
leases | |
2013 | | | 6 | | | | 154 | |
2014 | | | 6 | | | | 143 | |
2015 | | | 6 | | | | 96 | |
2016 | | | 6 | | | | 23 | |
2017 | | | 6 | | | | 18 | |
2018 and later | | | — | | | | 52 | |
| | | | | | | | |
Total | | | 30 | | | | 486 | |
| | | | | | | | |
Unearned financial income | | | n/a | | | | n/a | |
Uncollectible lease payments | | | n/a | | | | n/a | |
| | | | | | | | |
Net investments in financial leases | | | n/a | | | | n/a | |
| | | | | | | | |
Leasing income in 2012 was SEK 236 (76) million.
ERICSSON ANNUAL REPORT ON FORM 20-F 2012
C28 INFORMATION REGARDING MEMBERS OF THE BOARD OF DIRECTORS, THE GROUP MANAGEMENT AND EMPLOYEES
Remuneration to the Board of Directors
Remuneration to members of the Board of Directors
| | | | | | | | | | | | | | | | | | | | | | | | | | | | | | | | |
SEK | | Board fees | | | Number
of synthetic
shares/
portion of
Board fee | | | Value at
grant date of
synthetic
shares
allocated in 2012
A | | | Number of
previously
allocated
synthetic
shares
outstanding | | | Net change
in value
of allocated
synthetic
shares1)
B | | | Committee
fees | | | Total fees
paid in
cash2)
C | | | Total
remuneration
2012
(A+B+C) | |
Board member | | | | | | | | | | | | | | | | | | | | | | | | | | | | | | | | |
Leif Johansson | | | 3,750,000 | | | | 0/0 | % | | | — | | | | — | | | | — | | | | 400,000 | | | | 4,150,000 | 3) | | | 4,150,000 | |
Sverker Martin-Löf | | | 875,000 | | | | 0/0 | % | | | — | | | | — | | | | — | | | | 250,000 | | | | 1,125,000 | | | | 1,125,000 | |
Jacob Wallenberg | | | 875,000 | | | | 6,984/50 | % | | | 437,499 | | | | 2,262.00 | | | | 10,826 | | | | 175,000 | | | | 612,500 | | | | 1,060,825 | |
Roxanne S. Austin | | | 875,000 | | | | 6,984/50 | % | | | 437,499 | | | | 29,172.60 | | | | 31,648 | | | | 250,000 | | | | 687,500 | | | | 1,156,647 | |
Sir Peter L. Bonfield | | | 875,000 | | | | 3,492/25 | % | | | 218,749 | | | | 9,722.80 | | | | 13,411 | | | | 250,000 | | | | 906,250 | | | | 1,138,410 | |
Börje Ekholm | | | 875,000 | | | | 10,476/75 | % | | | 656,248 | | | | 29,172.60 | | | | 40,228 | | | | 175,000 | | | | 393,750 | | | | 1,090,226 | |
Alexander Izosimov | | | 875,000 | | | | 3,492/25 | % | | | 218,749 | | | | — | | | | 8,580 | | | | — | | | | 656,250 | | | | 883,579 | |
Ulf J. Johansson | | | 875,000 | | | | 0/0 | % | | | — | | | | 22,384.60 | | | | 33,495 | | | | 350,000 | | | | 1,225,000 | 4) | | | 1,258,495 | |
Nancy McKinstry | | | 875,000 | | | | 0/0 | % | | | — | | | | 22,002.60 | | | | 18,092 | | | | 175,000 | | | | 1,050,000 | | | | 1,068,092 | |
Anders Nyrén | | | 875,000 | | | | 0/0 | % | | | — | | | | — | | | | — | | | | 175,000 | | | | 1,050,000 | | | | 1,050,000 | |
Hans Vestberg | | | — | | | | — | | | | — | | | | — | | | | — | | | | — | | | | — | | | | — | |
Michelangelo Volpi | | | 875,000 | | | | 0/0 | % | | | — | | | | 4,380.00 | | | | –2,409 | | | | — | | | | 875,000 | | | | 872,591 | |
Employee Representatives | | | | | | | | | | | | | | | | | | | | | | | | | | | | | | | | |
Pehr Claesson | | | 18,000 | | | | — | | | | — | | | | — | | | | — | | | | — | | | | 18,000 | | | | 18,000 | |
Kristina Davidsson | | | 18,000 | | | | — | | | | — | | | | — | | | | — | | | | — | | | | 18,000 | | | | 18,000 | |
Jan Hedlund5) | | | 6,000 | | | | — | | | | — | | | | — | | | | — | | | | — | | | | 6,000 | | | | 6,000 | |
Karin Åberg | | | 18,000 | | | | — | | | | — | | | | — | | | | — | | | | — | | | | 18,000 | | | | 18,000 | |
Rickard Fredriksson6) | | | 10,500 | | | | — | | | | — | | | | — | | | | — | | | | — | | | | 10,500 | | | | 10,500 | |
Karin Lennartsson | | | 18,000 | | | | — | | | | — | | | | — | | | | — | | | | — | | | | 18,000 | | | | 18,000 | |
Roger Svensson | | | 18,000 | | | | — | | | | — | | | | — | | | | — | | | | — | | | | 18,000 | | | | 18,000 | |
| | | | | | | | | | | | | | | | | | | | | | | | | | | | | | | | |
Total | | | 12,606,500 | | | | 31,428 | | | | 1,968,744 | | | | 119,097.20 | | | | 153,871 | | | | 2,200,000 | | | | 12,837,750 | | | | 14,960,365 | 7) |
| | | | | | | | | | | | | | | | | | | | | | | | | | | | | | | | |
Total | | | 12,606,500 | | | | 31,428 | | | | 1,968,744 | | | | 128,002.20 | 8) | | | 138,792 | 8) | | | 2,200,000 | | | | 20,706,150 | 9) | | | 22,813,687 | 7)9) |
| | | | | | | | | | | | | | | | | | | | | | | | | | | | | | | | |
The Remuneration Committee advises the Boarddifference in value as of Directors on an ongoing basis on the remunerationDecember 31, 2012, compared to December 31, 2011 (for synthetic shares allocated 2008, 2009, 2010 and 2011), and compared to grant date 2012 (for synthetic shares allocated in 2012). The value of Group Management. Thissynthetic shares allocated in 2008, 2009, 2010 and 2011 includes fixed salaries, pensions, other benefitsrespectively SEK 1.85, SEK 2.00, SEK 2.25 and short-term and long-term variable remuneration, allSEK 2.50 per share in the context of pay and employment conditions throughout Ericsson. The Remuneration Committee also approves variable remuneration outcomes, prepares remuneration related proposalscompensation for Board and shareholder approval and develops and monitors the remuneration policy, strategies and general guidelines for employee remuneration.
Remuneration 2009
During 2009, as the financial crisis hit the world with its full force, there was an increased public focus on compensation and benefits matters. In its work the Remuneration Committee has followed the debate closely. The Committee met seven times during the year. The winter meetings were primarily dedicated to reviewing and implementing a zero salary increase for senior management, the vesting of variable compensation awards and proposals to shareholders atdividends resolved by the Annual General Meeting (AGM). InMeetings 2009, the policy for senior management remuneration2010, 2011 and the Long-Term Variable share-based plans were brought to the AGM with no major changes proposed. During the summer the 2012.
| 2) | Committee reviewed short-term targets to ensure that they remained appropriatefee and challenging. In the fall it began the cycle again with a review of the remuneration strategy, the variable compensation plans and levels of fixed compensation. As is illustrated below, the Committee has also considered market trends, existing and potential remuneration risks, target setting, its working arrangements and investor consultations.Activities during the second half of 2009 resulted in an updated remuneration policy being brought to the AGM which better demonstrates the basic remuneration principles within Ericsson.
This chapter outlines how the remuneration policy is implemented throughout Ericsson in line with corporate governance best practice, with specific references to senior management. To begin with, the work of the Remuneration Committee and our remuneration policy are explained, followed by descriptions of plans and approaches. More details of the remuneration of senior management and Board members’ fees can be found in the Notes to the Consolidated Financial Statements—Note C29, “Information regarding Memberscash portion of the Board fee.
|
| 3) | In addition, an amount corresponding to statutory social charges in respect of Directors, the Management and Employees” (“Note C29”). Senior management comprisespart of the Group Management Team, includingfee that has been invoiced through a company was paid, amounting to SEK 1,303,930. |
| 4) | In addition, an amount corresponding to statutory social charges in respect of the CEO, and will hereafter be referredpart of the fee that has been invoiced through a company was paid, amounting to SEK 122,520. |
| 5) | Resigned as “Group Management”.employee representative as of May 3, 2012. |
| 6) | Appointed deputy employee representative as of May 3, 2012. |
| 7) | Excluding social security charges in the amount of SEK 3,950,998. |
ERICSSON ANNUAL REPORT ON FORM 20-F 2012
ERICSSON ANNUAL REPORT ON FORM 20-F 2009
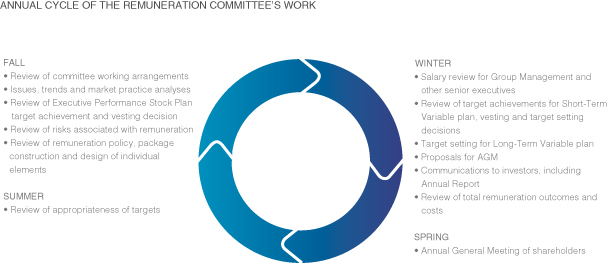
SUMMARIES OF 2009 SHORT- AND LONG-TERM VARIABLE REMUNERATION
| | | | | | | | |
What we call it
| | What is it?
| | What is the objective?
| | Who participates?
| | How is it earned?
|
Short-term: Remuneration delivered over 12 months or less
|
| | | | |
Fixed salary | | Fixed remuneration paid at set times | | Attract and retain employees, delivering part of annual remuneration in a predictable format | | All employees | | Market appropriate levels set according to position and evaluated according to individual performance |
| | | | |
Short-Term Variable compensation (STV) | | A variable plan that is measured and paid over a single year | | Align employees with clear and relevant targets, providing an earnings opportunity in return for variable cost and performance | | Managers, including Group Management | | Achievements against set targets. Reward can increase to up to twice the target level and decrease to zero, depending on performance |
| | | | |
Local and Sales Incentive Plans | | Tailored versions of the STV | | As for STV, tailored for local or business requirements, such as sales | | Most employees | | Similar to STV. All plans have maximum award and vesting limits |
|
Long-term: Remuneration delivered over 3 years or more
|
| | | | |
Stock Purchase Plan (SPP) | | All-employee stock- based plan | | Reinforce a “One Ericsson” and align employees’ interests with those of shareholders | | All employees are eligible | | Buy one share and it will be matched by one share after 3 years if still employed |
| | | | |
Key Contributor Retention Plan (KC) | | Share-based plan for selected individuals | | Recognize, retain and motivate key contributors for performance, critical skills and potential | | Up to 10 percent of employees | | If selected, get one more matching share in addition to the SPP one |
| | | | |
Executive Performance Stock Plan (EPSP) | | Share-based plan for senior executives | | Remuneration for long-term commitment and earnings performance | | Senior executives, including Group Management | | Get up to 4, 6 or, for CEO, 8 further matching shares to the SPP one for EPS growth performance| 8) | Including synthetic shares previously allocated to the former Director Carl-Henric Svanberg. |
ERICSSON ANNUAL REPORT ON FORM 20-F 2009
The Remuneration Committee
The Remuneration Committee’s work is
| 9) | Including advance payments to the foundation for the governance of our remuneration processes together with our internal systems and audit controls. The Committee is chaired byformer Directors Michael Treschow and its other members are Nancy McKinstry, Börje Ekholm and Karin Åberg. Karin Åberg replaced Monica Bergström afterMarcus Wallenberg under the 2009 Annual General Meeting. All the members are non-executive directors, independent (exceptsynthetic share programs. Michael Treschow: SEK 7,376,686 for the employee representative) as required by the Swedish Code of Corporate Governance and have relevant knowledge and experience of remuneration matters.The Company’s General Counsel acts as secretary111,926.80 synthetic shares (in addition, an amount corresponding to the Committee. The Chief Executive Officer, the Senior Vice President Human Resources & Organization and the Vice President Compensation & Benefits attend the Remuneration Committee meetings by invitation and assist the Committeestatutory social charges in its considerations, except when issues relating to their own remuneration are being discussed.
The Remuneration Committee has appointed an independent expert advisor, Gerrit Aronson, to assist and advise the Committee. Gerrit Aronson provided no other services to the Company during 2009. The Remuneration Committee is also provided with national and international pay data collected from external survey providers and can call on other independent expertise, should it so require. The Chairman continues to ensure that contact is maintained, as necessary and appropriate, with principal shareholders on the subject of remuneration.
The purpose and functionrespect of the Remuneration Committee will continue going forward and its terms of reference can be found on the Ericsson website (www.ericsson.com). These terms of reference, together with the remuneration policy, are reviewed annually in light of matters such as changes to corporate governance best practice or changes to accounting, legislation, political opinion or business practices among peers. This helps to ensure that the policy continues to provide Ericsson with a competitive remuneration strategy. The policy for senior management remuneration is, in accordance with Swedish law, brought to shareholders annually for approval.
Remuneration policy
Remuneration at Ericsson is based on the principles of performance, competitiveness and fairness. Our remuneration policy together with the mix of remuneration elements are designed to reflect these remuneration principles by creating a balanced remuneration package. The policy for 2009 can be found in Note C29. The proposed resolution for the 2010 AGM can be found in the Board of Directors’ Report and, together with resolutions relating to the long-term variable remuneration plans, in the Notice of Annual General Meeting on our website. The auditors’ opinion on how we have followed our policy during 2009 is also posted on the website.
SHORT-TERM VARIABLE REMUNERATION STRUCTURE
| | | | | | | | | | | | | | | | | | | | | | Short-Term Variable
remuneration as percentage
of Fixed Salary | | | Percentage of Short-Term Variable
remuneration opportunity | | | | | Target
level | | | Maximum
level | | | Actual paid
for 2009 | | | Group Financial
Targets | | | Unit/Functional
Financial Targets | | | Non-Financial
Targets | | CEO 2009 | | 40 | % | | 80 | % | | 39.5 | % | | 90 | % | | 0 | % | | 10 | % | CEO 2010 | | 40 | % | | 80 | % | | — | | | 90 | % | | 0 | % | | 10 | % | Average Group Management 20091) | | 31 | % | | 62 | % | | 39.0 | % | | 62 | % | | 23 | % | | 15 | % | Average Group Management 20101) | | 34 | % | | 68 | % | | — | | | 73 | % | | 16 | % | | 11 | % |
1) | Excludes CEO—differences in target and maximum levels from year to year are due to changes in the composition of Group Management |
ERICSSON ANNUAL REPORT ON FORM 20-F 2009
Key elements of remuneration
For Group Management, total remuneration consists of fixed salary, short-term and long-term variable remuneration, pension and other benefits. If the size of any one of these elements is increased or decreased, at least one other element has to change where the competitive position should remain unchanged.
Fixed salary
Fixed salaries are set to be competitive within an individual’s home market. When setting fixed salaries the Remuneration Committee considers the impact on total remuneration, including pension and associated costs. The absolute levels are determined by the size and complexitypart of the positionfee that has been invoiced through a company was paid, amounting to SEK 753,159) and the year-to-year performance of the individual. Together with other elements of remuneration, Group Management salaries are subject to an annual review by the Remuneration Committee, which considers external pay data to ensure that levels of pay remain competitive and appropriate to the remuneration policy.
For 2009 it was decided that it was strategically appropriate not to increase fixed salariesMarcus Wallenberg: SEK 491,714 for Group Management and other senior executives.
Variable remuneration7,460.80 synthetic shares.
|
Comments to the table The Chairman of the Board was entitled to a Board fee of SEK 3,750,000 and a fee of SEK 200,000 for each Board Committee on which he served as Chairman. The other Directors elected by the Annual General Meeting were entitled to a fee of SEK 875,000 each. In addition, the Chairman of the Audit Committee was entitled to a fee of SEK 350,000 and the other non-employed members of the Audit Committee were entitled to a fee of SEK 250,000 each. The Chairmen of the Finance and Remuneration Committees were entitled to a fee of SEK 200,000 each and the other non-employed members of the Finance and the Remuneration Committees were entitled to a fee of SEK 175,000 each. Members of the Board, who are not employees of the Company, have not received any remuneration other than the fees and synthetic shares as above. None of the Directors have entered into a service contract with the Parent Company or any of its subsidiaries, providing for termination benefits. Members and deputy members of the Board who are Ericsson employees received no remuneration or benefits other than their entitlements as employees and a fee to the employee representatives and their deputies of SEK 1,500 per attended Board meeting. Board members invoicing the amount of the Board and Committee fee through a company may add to the invoice an amount corresponding to social charges. The social charges thus included in the invoiced amount are not higher than the general payroll tax that would otherwise have been paid by the Company. The entire amount, i.e. the cash portion of the Board fee and the Committee fee, including social charges, constitutes the invoiced Board fee. The Annual General Meeting 2012 resolved that non-employed Directors may choose to receive the Board fee (i.e. exclusive of committee fee) as follows: i) 25% of the Board fee in cash and 75% in the form of synthetic shares, with a value corresponding to 75% of the Board fee at the time of allocation, ii) 50% in cash and 50% in the form of synthetic shares, or iii) 75% in cash and 25% in the form of synthetic shares. Directors may also choose not to participate in the synthetic share program and receive 100% of the Board fee in cash. Committee fees are always paid in cash. The number of synthetic shares is based on a volume-weighed average of the market price of Ericsson Class B shares on the NASDAQ OMX Stockholm exchange during the five trading days immediately following the Annual General Meeting 2012: SEK 62.643. The number of synthetic shares is rounded down to the nearest whole number of shares. The synthetic shares are vested during the Directors’ term of office and the right to receive payment with regard to the allocated synthetic shares occurs after the publication of the Company’s year-end financial statement during the fifth year following the Annual General Meeting which resolved on the synthetic share program, i.e. in 2017. The amount payable shall be determined based on the volume-weighed average price for shares of Class B during the five trading days immediately following the publication of the year-end financial statement. ERICSSON ANNUAL REPORT ON FORM 20-F 2012 Synthetic shares were allocated to members of the Board for the first time in 2008, on equal terms and conditions as resolved in 2009, 2010, 2011 and 2012. Payment based on synthetic shares may thus, under the main rule, occur for the first time in 2013 with respect to the synthetic shares allocated in 2008. The value of all outstanding synthetic shares fluctuates in line with the market value of Ericsson’s Class B share and may differ from year to year compared to the original value on their respective grant dates. The change in value of the outstanding synthetic shares is established each year and affects the total recognized costs that year. As per December 31, 2012, the total number of synthetic shares under the programs is 159,430.20, and the total accounted debt is SEK 11,113,237 (including synthetic shares previously allocated to the former Director Carl-Henric Svanberg). In accordance with the terms and conditions for the synthetic shares, the time for payment to the former Director Carl-Henric Svanberg has been advanced, to occur after the publication of the year-end financial statement 2013. In February 2012, advance payment was made to the former Directors Michael Treschow and Marcus Wallenberg with respect to their synthetic shares, all in accordance with the terms and conditions for the synthetic shares. Remuneration to the Group Management The Company’s costs for remuneration to the Group management are the costs recognized in the Income Statement during the fiscal year. These costs are disclosed under “Remuneration costs” below. Costs recognized during a fiscal year in the Income Statement are not fully paid by the Company at the end of the fiscal year. The unpaid amounts that the Company has in relation to the Group management are disclosed under “Outstanding balances”. Remuneration costs The total remuneration to the President and CEO and to other members of the Group management, consisting of the Executive Leadership Team (ELT) includes fixed salary, short-term and long-term variable remuneration, pension and other benefits. These remuneration elements are based on the guidelines for remuneration and other employment conditions for the ELT as approved by the Annual General Meeting held in 2012, see the approved guidelines in section “Guidelines for remuneration to Group Management 2012”. Remuneration costs for the President and CEO and other members of Executive Leadership Team (ELT) | | | | | | | | | | | | | | | | | | | | | | | | | SEK | | The President
and CEO 2012 | | | The President
and CEO 2011 | | | Other members
of ELT 2012 | | | Other members
of ELT 2011 | | | Total 2012 | | | Total 2011 | | Salary | | | 12,573,233 | | | | 11,739,341 | | | | 76,973,215 | | | | 76,031,733 | | | | 89,546,448 | | | | 87,771,074 | | Costs for annual variable remuneration earned 2012 to be paid 2013 | | | 3,972,247 | | | | 2,771,134 | | | | 21,877,700 | | | | 18,460,645 | | | | 25,849,947 | | | | 21,231,779 | | Long-term variable remuneration provision | | | 6,439,873 | | | | 5,636,050 | | | | 6,472,215 | | | | 8,916,556 | | | | 12,912,088 | | | | 14,552,606 | | Pension costs | | | 6,491,713 | | | | 5,960,566 | | | | 22,865,674 | | | | 22,154,413 | | | | 29,357,387 | | | | 28,114,979 | | Other benefits | | | 123,612 | | | | 78,594 | | | | 4,431,160 | | | | 4,944,762 | | | | 4,554,772 | | | | 5,023,356 | | Social charges and taxes | | | 9,114,641 | | | | 7,800,766 | | | | 22,877,888 | | | | 23,529,200 | | | | 31,992,529 | | | | 31,329,966 | | | | | | | | | | | | | | | | | | | | | | | | | | | Total | | | 38,715,319 | | | | 33,986,451 | | | | 155,497,852 | | | | 154,037,309 | | | | 194,213,171 | | | | 188,023,760 | | | | | | | | | | | | | | | | | | | | | | | | | | |
Comments to the table During 2012 there were three Executive Vice Presidents, who have been appointed by the Board of Directors. None of them has acted as deputy to the President and CEO during the year. The Executive Vice Presidents are included in the group “Other members of ELT”. ERICSSON ANNUAL REPORT ON FORM 20-F 2012 The group “Other members of ELT” comprises the following persons: Per Borgklint, Bina Chaurasia, Hĺkan Eriksson (up to January 31), Ulf Ewaldsson (from February 1), Jan Frykhammar, Douglas L. Gilstrap, Nina Macpherson, Magnus Mandersson, Helena Norrman, Mats H. Olsson, Rima Qureshi, Angel Ruiz, Johan Wibergh and Jan Wäreby. The salary stated in the table for the President and CEO and other members of the ELT includes vacation pay paid during 2012 as well as other contracted compensation which were paid during 2012 or provisioned for 2012. “Long-term variable remuneration provision” refers to the compensation costs during 2012 for all outstanding share-based plans. For a description of compensation cost, including accounting treatment, see Note C1, “Significant accounting policies”, section Share-based compensation to employees and the Board of Directors. For the President and CEO and other members of the ELT employed in Sweden before 2011 a supplementary plan is applied in addition to the occupational pension plan for salaried staff on the Swedish labor market (ITP) with pension from 60 years. These pension plans are not conditional upon future employment at Ericsson. Outstanding balances The Company has recognized the following liabilities relating to unpaid remunerations in the Balance Sheet: Ericsson’s commitments for benefit based pensions as of December 31, 2012 under IAS 19 amounted to SEK 5,971,282 for the President and CEO which includes ITP plan and temporary disability and survivor’s pension. For other members of ELT the Company’s commitments amounted to SEK 27,103,244 of which SEK 21,429,454 refers to the ITP plan and the remaining SEK 5,673,790 to temporary disability and survivor’s pensions. For previous Presidents and CEOs, the Company has made provisions for defined benefit pension plans in connection with their active service periods within the Company. Deferred salary, earned 2012 or earlier, to be paid 12 months after period end or later, amounts to SEK 7,899,000. Maximum outstanding matching rights | | | | | | | | | As per December 31, 2012 Number of Class B shares | | The President
and CEO | | | Other members
of the ELT | | Stock Purchase Plans 2009, 2010, 2011 and 2012 and Executive Performance Stock Plans 2009, 2010, 2011 and 2012 | | | 503,382 | | | | 661,456 | |
Comments to the table For the definition of matching rights, see the description in section “Long-term variable remuneration”. The performance matching result of 70,3% is included for 2009 plan. Cash conversion target for 2012 was reached, but not reached in 2011. During 2012, the President and CEO received 10,108 matching shares and other members of the ELT 54,803 matching shares. ERICSSON ANNUAL REPORT ON FORM 20-F 2012 Guidelines for remuneration to Group Management 2012 For Group Management consisting of the Executive Leadership Team, including the President and CEO, total remuneration consists of fixed salary, short and long-term variable remuneration, pension and other benefits. Furthermore, the following guidelines apply for the remuneration to the Executive Leadership Team: Variable remuneration is through cash and stock-based programs awarded against specific business targets derived from the long-term business plan approved by the Board of Directors. Targets may include financial targets at either corporate or unit level, operational targets, employee motivation targets and customer satisfaction targets. With the current composition of the Executive Leadership Team, the Company’s cost during 2012 for variable remuneration to the Executive Leadership Team can, at a constant share price, amount to between 0 and 150% of the aggregate fixed salary cost, all excluding social security costs. All benefits, including pension benefits, follow the competitive practice in the home country taking total compensation into account. The retirement age is normally 60 to 65 years of age. By way of exception, additional arrangements can be made when deemed required. Such additional arrangement shall be limited in time and shall not exceed a period of 36 months and two times the remuneration that the individual concerned would have received had no additional arrangement been made. The mutual notice period may be no more than six months. Upon termination of employment by the Company, severance pay amounting to a maximum of 18 months’ fixed salary is paid. Notice of termination given by the employee due to significant structural changes, or other events that in a determining manner affect the content of work or the condition for the position, is equated with notice of termination served by the Company. Long-Term Variable remuneration At Ericsson we strongly believe that, where possible, we should encourage variable compensation. First and foremost this aligns employees with clear and relevant targets but it also enables more flexible payroll costs and emphasizes the link between performance and pay. All variable remuneration plans have maximum award and vesting limits.
Short-Term Variable remuneration
The annual variable remuneration is delivered through cash-based programs. Specific business targets are derived from the annual business plan approved by the Board of Directors and, in turn, defined by the Company’s long-term strategy. Ericsson strives to grow faster than the market with best-in-class margins and strong cash conversion and therefore the starting point is to have these as three core targets:
For Group Management, targets are thus predominantly financial targets at either Group level or at the individual unit level and may also include operational targets like customer satisfaction and employee motivation. Targets are cascaded to all managers and will vary depending on the specific position.
ERICSSON ANNUAL REPORT ON FORM 20-F 2009
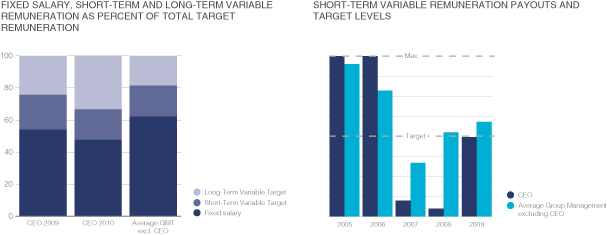
All variable remuneration targets have to be objective and measurable and typically refer to a result that is achieved on a collective basis. Each target is, in accordance with our strict governance instructions, defined in a “target specification” and measured over the calendar year. The target setting process is fully integrated with the strategy work and target levels are tested against plans and forecasts up until they are finalized around the turn of the year. The Board of Directors and the Remuneration Committee decide on all Ericsson Group targets, which are cascaded to unit-related targets throughout the Company, always subject to a two levels of management approval process. The Remuneration Committee monitors the appropriateness and fairness of Group target levels throughout the performance year and has the authority to revise them should they cease to be relevant, stretching and/or enhance shareholder value.
During 2009, approximately 65,000 employees participated in short-term variable plans. Of these 6,000 were in the global Short-Term Variable remuneration plan (“STV”) for management, including Group Management, and 4,000 were in the global Sales Incentive Plan. Local plans vary in design according to local competitive practice.
The chart above illustrates how payouts to Group Management have varied with performance over the past five years.
Long-Term Variable remuneration
Share-based long-term variable remuneration plans are submitted each year for approval by shareholders at the Annual General Meeting. All long-term variable remuneration plans are designed to form part of a well-balanced total remuneration and span over a minimum of three years. As these are variable plans, outcomes are unknown and rewards depend on long-term personal investment, corporate performance and resulting share price performance. During 2009, share-based remuneration was made up of three different but linked plans: The all-employee Stock Purchase Plan, the Key Contributor Retention Plan and the Executive Performance Stock Plan.
The Stock Purchase Plan The Stock Purchase Plan is designed to offer an incentive for all employees to participate in the Company where practicable, which is consistent with industry practice and with our ways of working. For the 2012 plan, employees are able to save up to 7.5% of gross fixed salary (President and CEO can save up to 10% of gross fixed salary and short-term variable remuneration) for purchase of Class B contribution shares at market price on the NASDAQ OMX Stockholm or American Depositary Shares (ADSs) at NASDAQ New York (contribution shares) during a twelve-month period (contribution period). If the contribution shares are retained by the employee for three years after the investment and the employment with the Ericsson Group continues during that time, the employee’s shares will be matched with a corresponding number of Class B shares or ADSs free of consideration. Employees in 100 countries participate in the plans. The table below shows the contribution periods and participation details for ongoing plans as of December 31, 2012. Stock purchase plans | | | | | | | | | | | | | Plan | | Contribution period | | | Number of
participants
at launch | | | Take-up
rate–percent of
eligible employees | | Stock Purchase plan 2009 | | | August 2009–July 2010 | | | | 18,000 | | | | 25 | % | Stock Purchase plan 2010 | | | August 2010–July 2011 | | | | 22,000 | | | | 27 | % | Stock Purchase plan 2011 | | | August 2011–July 2012 | | | | 24,000 | | | | 30 | % | Stock Purchase plan 2012 | | | August 2012–July 2013 | | | | 27,000 | | | | 28 | % |
ERICSSON ANNUAL REPORT ON FORM 20-F 2012 Participants save each month, beginning with August payroll, towards quarterly investments. These investments (in November, February, May and August) are matched on the third anniversary of each such investment, subject to continued employment, and hence the matching spans over two financial years and two tax years. The Key Contributor Retention Plan The Key Contributor Retention Plan is part of Ericsson’s talent management strategy and is designed to give recognition for performance, critical skills and potential as well as to encourage retention of key employees. Under the program, up to 10% of employees (2012 plan: up to 8,000 employees) are selected through a nomination process that identifies individuals according to performance, critical skills and potential. Participants selected obtain one extra matching share in addition to the ordinary one matching share for each contribution share purchased under the Stock Purchase Plan during a twelve-month program period. Executive Performance Stock Plans | | | | | | | | | | | | | | | | | | | | Executive Performance Stock Plan | | | | | 20121) | | | 2011 | | | 2010 | | | 2009 | | Base year EPS2) | | | | | | | | | | | 1.14 | | | | 2.90 | | Target average annual EPS growth range3) | | | | | | | | | | | 5% to 15% | | | | 5% to 15% | | Matching share vesting range4) | | | 0.67 to 4 | | | | 0.67 to 4 | | | | 0.67 to 4 | | | | 0.67 to 4 | | | | | 1 to 6 | | | | 1 to 6 | | | | 1 to 6 | | | | 1 to 6 | | | | | 1.5 to 9 | | | | 1.5 to 9 | | | | 1.5 to 9 | | | | 1.33 to 8 | | Maximum opportunity as percentage of fixed salary5) | | | 30 | % | | | 30 | % | | | 30 | % | | | 30 | % | | | | 45 | % | | | 45 | % | | | 45 | % | | | 45 | % | | | | 162 | % | | | 162 | % | | | 162 | % | | | 72 | % |
| 1) | Targets for Executive Performance Stock Plan 2012 are described in the next table. |
| 2) | Sum of four quarters up to June 30 of plan year 2009. For 2010 plan the sum of 4 quarters up to December 31, 2010. |
| 3) | EPS range found from three-year average EPS of the twelve quarters to the end of the performance period and corresponding growth targets. |
| 4) | Corresponding to EPS range (no Performance Share Plan matching below this range). Matching shares per contribution share invested in addition to Stock Purchase Plan matching according to program of up to 4, 6 or 9 matching shares. |
| 5) | At full investment, full vesting and constant share price. Excludes Stock Purchase Plan matching. |
ERICSSON ANNUAL REPORT ON FORM 20-F 2012 Executive Performance Stock Plan targets | | | | | | | | | | | | | | | | | | | | Base year
value
SEK billion | | | Year 1 | | | Year 2 | | | Year 3 | | | 2012 | | | | | | | | | | | | | | | | | Growth (Net Sales Growth) | | | 227.8 | | |
| Compound annual
growth rate of 2–8% |
| Margin (Operating Income Growth) | | | 17.9 | | |
| Compound annual
growth of 5–15% |
| Cash Flow (Cash Conversion) | | | — | | | ³ | 70 | % | | ³ | 70 | % | | ³ | 70 | % | | 2011 | | | | | | | | | | | | | | | | | Growth (Net Sales Growth) | | | 203.3 | | |
| Compound annual
growth rate of 4–10% |
| Margin (Operating Income Growth)1) | | | 23.7 | | |
| Compound annual
growth of 5–15% |
| Cash Flow (Cash Conversion) | | | — | | | ³ | 70 | % | | ³ | 70 | % | | ³ | 70 | % |
| 1) | Consolidated operating margin excluding restructuring for 2010. |
The Executive Performance Stock Plan The Executive Performance Stock Plan is designed to focus management on driving earnings and provide competitive remuneration. Senior executives, including ELT, are selected to obtain up to four or six extra shares (performance matching shares) in addition to the ordinary one matching share for each contribution share purchased under the Stock Purchase Plan. Up to 0.5% of employees (2012 plan: up to 400 executives) are offered to participate in the plan. The President and CEO can save up to 10% of gross fixed salary and short-term variable remuneration, and may obtain up to nine performance matching shares in addition to the Stock Purchase Plan matching share for each contribution share. The performance matching for the 2009 and 2010 plans is subject to the fulfillment of a performance target of average annual Earnings per Share (EPS) growth. The performance targets changed from Earnings Per Share (EPS) targets to targets linked to the business strategy as from 2011. The tables above show all Executive Performance Stock Plans as per December 31, 2012. Shares for all plans | | | | | | | | | | | | | | | | | | | | | | | | | | | | | | | | | | | Stock Purchase Plan, Key Contributor
Retention Plan and Executive
Performance Stock Plans | | | | | | | | | | | Plan (million shares) | | | | | 2012 | | | 2011 | | | 2010 | | | 2009 | | | 2008 | | | Total | | Originally designated1) | | | A | | | | 26.2 | | | | 19.4 | | | | 19.4 | | | | 22.4 | | | | 16.5 | | | | 103.9 | | Outstanding beginning of 2012 | | | B | | | | — | | | | 3.4 | | | | 10.6 | | | | 9.1 | | | | 6.1 | | | | 29.2 | | Awarded during 2012 | | | C | | | | 4.4 | | | | 10.8 | | | | — | | | | — | | | | — | | | | 15.2 | | Exercised/matched during 2012 | | | D | | | | — | | | | 0.3 | | | | 0.5 | | | | 2.3 | | | | 6.0 | | | | 9.1 | | Forfeited/expired during 2012 | | | E | | | | — | | | | 0.4 | | | | 0.9 | | | | 0.8 | | | | 0.1 | | | | 2.2 | | Outstanding end of 20122) | | | F=B+C–D–E | | | | 4.4 | | | | 13.5 | | | | 9.2 | | | | 6.0 | | | | — | | | | 33.1 | | Compensation costs charged during 2012 (SEK million) | | | G | | | | 6 | 3) | | | 132 | 3) | | | 148 | 3) | | | 91 | 3) | | | 28 | 3) | | | 405 | 4) |
ERICSSON ANNUAL REPORT ON FORM 20-F 2012 | 1) | Adjusted for rights offering and reverse split when applicable. |
| 2) | Presuming maximum performance matching under the Executive Performance Stock Plans. The 2008 plan has lapsed. The 2009 plan partially vested to an extent of 70,3%. |
| 3) | Fair value is calculated as the share price on the investment date, reduced by the net present value of the dividend expectations during the three-year vesting period. Net present value calculations are based on data from external party. Fair value is also adjusted for participants failing to keep hold of their contribution shares during the vesting period. For shares under the Executive Performance Stock Plans, the Company presumes maximum performance matching for all ongoing plans when calculating the compensation cost. The 2008 plan has lapsed. The 2009 plan partially vested to an extent of 70,3%. Fair value of the Class B share at each investment date during 2012 was: February 15 SEK 56.26, May 15 SEK 53.93, August 15 SEK 55.85 and November 15 SEK 49.99. |
| 4) | Total compensation costs charged during 2011: SEK 413 million, 2010: SEK 757 million. |
Shares for all plans All plans are funded with treasury stock and are equity settled. Treasury stock for all plans has been issued in directed cash issues of Class C shares at the quotient value and purchased under a public offering at the subscription price plus a premium corresponding to the subscribers’ financing costs, and then converted to Class B shares. For all plans, additional shares have been allocated for financing of social security expenses. Treasury stock is sold on the NASDAQ OMX Stockholm to cover social security payments when arising due to matching of shares. During 2012, 1,038,200 shares were sold at an average price of SEK 63.17. Sale of shares is recognized directly in equity. If, as of December 31, 2012, all shares allocated for future matching under the Stock Purchase Plan were transferred, and shares designated to cover social security payments were disposed of as a result of the exercise and the matching, approximately 61 million Class B shares would be transferred, corresponding to 1.9% of the total number of shares outstanding, 3,220 million not including treasury stock. As of December 31, 2012, 85 million Class B shares were held as treasury stock. The table above shows how shares (representing matching rights but excluding shares for social security expenses) are being used for all outstanding plans. From up to down the table includes (A) the number of shares originally approved by the Annual General Meeting, adjusted for reverse split where applicable; (B) the number of originally designated shares that were outstanding at the beginning of 2012; (C) the number of shares awards that were granted during 2012; (D) the number of shares matched during 2012; (E) the number of shares forfeited by participants or expired under the plan rules during 2012; and (F) the balance left as outstanding at the end of 2012, having added new awards to the shares outstanding at the beginning of the year and deducted the shares related to awards matched, forfeited and expired. The final column (G) shows the compensation costs charged to the accounts during 2012 for each plan, calculated as fair value in SEK. For a description of compensation cost, including accounting treatment, see Note C1, “Significant accounting policies”, section Share-based compensation to employees and the Board of Directors. ERICSSON ANNUAL REPORT ON FORM 20-F 2012 Employee numbers, wages and salaries Employee numbers Average number of employees | | | | | | | | | | | | | | | | | | | | | | | | | | | | 2012 | | | 2011 | | | | | Women | | | Men | | | Total | | | Women | | | Men | | | Total | | North America | | | 3,479 | | | | 12,607 | | | | 16,086 | | | | 2,876 | | | | 12,106 | | | | 14,982 | | Latin America | | | 2,137 | | | | 9,230 | | | | 11,367 | | | | 1,913 | | | | 7,837 | | | | 9,750 | | Northern Europe & Central Asia1)2) | | | 5,746 | | | | 15,351 | | | | 21,097 | | | | 5,656 | | | | 14,927 | | | | 20,583 | | Western & Central Europe2) | | | 1,790 | | | | 9,463 | | | | 11,253 | | | | 1,663 | | | | 8,968 | | | | 10,631 | | Mediterranean2) | | | 2,966 | | | | 10,064 | | | | 13,030 | | | | 2,743 | | | | 9,077 | | | | 11,820 | | Middle East | | | 617 | | | | 4,603 | | | | 5,220 | | | | 634 | | | | 4,343 | | | | 4,977 | | Sub-Saharan Africa | | | 548 | | | | 1,672 | | | | 2,220 | | | | 661 | | | | 1,290 | | | | 1,951 | | India | | | 2,137 | | | | 11,924 | | | | 14,061 | | | | 1,613 | | | | 9,912 | | | | 11,525 | | North East Asia | | | 4,191 | | | | 9,584 | | | | 13,775 | | | | 3,480 | | | | 8,839 | | | | 12,319 | | South East Asia & Oceania | | | 1,175 | | | | 3,474 | | | | 4,649 | | | | 1,155 | | | | 3,437 | | | | 4,592 | | | | | | | | | | | | | | | | | | | | | | | | | | | Total | | | 24,786 | | | | 87,972 | | | | 112,758 | | | | 22,394 | | | | 80,736 | | | | 103,130 | | | | | | | | | | | | | | | | | | | | | | | | | | | 1) Of which Sweden | | | 4,232 | | | | 13,337 | | | | 17,569 | | | | 4,188 | | | | 12,881 | | | | 17,069 | | 2) Of which EU | | | 9,911 | | | | 33,581 | | | | 43,492 | | | | 9,575 | | | | 31,667 | | | | 41,242 | |
Number of employees by region at year-end | | | | | | | | | | | | 2012 | | | 2011 | | North America | | | 15,501 | | | | 14,801 | | Latin America | | | 11,219 | | | | 11,191 | | Northern Europe & Central Asia1)2) | | | 21,211 | | | | 20,987 | | Western & Central Europe2) | | | 11,257 | | | | 10,806 | | Mediterranean2) | | | 12,205 | | | | 11,645 | | Middle East | | | 3,992 | | | | 4,336 | | Sub-Saharan Africa | | | 2,014 | | | | 2,283 | | India | | | 14,303 | | | | 11,535 | | North East Asia | | | 14,157 | | | | 12,567 | | South East Asia & Oceania | | | 4,396 | | | | 4,374 | | Total | | | 110,255 | | | | 104,525 | | | | | | | | | | | 1)Of which Sweden | | | 17,712 | | | | 17,500 | | 2)Of which EU | | | 42,872 | | | | 41,596 | | | | | | | | | | |
Employees by gender and age at year-end 2012 | | | | | | | | | | | | | | | | Women | | | Men | | | Percent
of total | | Under 25 years old | | | 2,517 | | | | 6,018 | | | | 8 | % | 25–35 years old | | | 8,530 | | | | 31,054 | | | | 36 | % | 36–45 years old | | | 7,818 | | | | 28,954 | | | | 33 | % | 46–55 years old | | | 3,984 | | | | 15,692 | | | | 18 | % | Over 55 years old | | | 1,233 | | | | 4,455 | | | | 5 | % | Percent of total | | | 22 | % | | | 78 | % | | | 100 | % |
ERICSSON ANNUAL REPORT ON FORM 20-F 2012 Employee movements | | | | | | | | | | | | | | | | 2012 | | | 2011 | | Head count at year-end | | | | | 110,255 | | | | 104,525 | | Employees who have left the Company | | | | | 12,280 | | | | 10,571 | | Employees who have joined the Company | | | | | 18,010 | | | | 24,835 | | Temporary employees | | | | | 766 | | | | 901 | |
Employee wages and salaries Wages and salaries and social security expenses | | | | | | | | | (SEK million) | | 2012 | | | 2011 | | Wages and salaries | | | 48,428 | | | | 43,707 | | Social security expenses | | | 15,672 | | | | 15,198 | | Of which pension costs | | | 2,762 | | | | 3,888 | |
Amounts related to the President and CEO and the Executive Leadership Team are included. Remuneration to Board members and Presidents in subsidiaries | | | | | | | | | (SEK million) | | 2012 | | | 2011 | | Salary and other remuneration | | | 243 | | | | 223 | | Of which annual variable remuneration | | | 33 | | | | 22 | | Pension costs | | | 27 | | | | 20 | |
Board members, Presidents and Group management by gender at year end | | | | | | | | | | | | | | | | | | | | 2012 | | | 2011 | | | | | Women | | | Men | | | Women | | | Men | | Parent Company | | | | | | | | | | | | | | | | | Board members and President | | | 27 | % | | | 73 | % | | | 20 | % | | | 80 | % | Group Management | | | 29 | % | | | 71 | % | | | 29 | % | | | 71 | % | Subsidiaries | | | | | | | | | | | | | | | | | Board members and Presidents | | | 12 | % | | | 88 | % | | | 11 | % | | | 89 | % |
C29 RELATED PARTY TRANSACTIONS During 2012, various related party transactions were executed pursuant to contracts based on terms customary in the industry and negotiated on an arm’s length basis. For information regarding equity and Ericsson’s share of assets, liabilities and income in joint ventures and associated companies, see Note C12, “Financial assets, non-current”. For information regarding transactions with senior management, see Note C28, “Information regarding members of the Board of Directors, the Group management and employees”. ST-Ericsson ST-Ericsson, the joint venture between Ericsson and STMicroelectronics, was formed on February 2, 2009, by merging Ericsson Mobile Platforms with ST-NXP Wireless. The joint venture is equally owned by Ericsson and STMicroelectronics. For further information, see Note C3, “Segment information”. ERICSSON ANNUAL REPORT ON FORM 20-F 2012 Major transactions are as follows: Sales: Ericsson provides ST-Ericsson with services in the areas of R&D, HR, IT and facilities. Purchases: A major part of Ericsson’s purchases from ST-Ericsson consists of chipsets and R&D services. Dividends: Both owners of ST-Ericsson receive dividends, when so decided by the Board of Directors. Ericsson received no dividends from ST-Ericsson during 2012. ST-Ericsson | | | | | | | | | | | | | | | | 2012 | | | 2011 | | | 2010 | | Related party transactions | | | | | | | | | | | | | Sales | | | 138 | | | | 182 | | | | 403 | | Purchases | | | 634 | | | | 781 | | | | 629 | | | | | | | | | | | | | | | Related party balances | | | | | | | | | | | | | Receivables | | | 127 | | | | 51 | | | | 53 | | Liabilities | | | — | | | | 24 | | | | 48 | |
Ericsson does not have any contingent liabilities, assets pledged as collateral or guarantees towards ST-Ericsson. Ericsson Nikola Tesla d.d. Ericsson Nikola Tesla d.d. is a company for design, sales and service of telecommunication systems and equipment, and an associated member of the Ericsson Group. Ericsson Nikola Tesla d.d. is located in Zagreb, Croatia. Ericsson holds 49.07% of the shares. Major transactions are as follows: Sales: Ericsson sells telecommunication equipment to Ericsson Nikola Tesla d.d. License revenues: Ericsson receives license revenues for Ericsson Nikola Tesla d.d.’s usage of trademarks. Purchases: Ericsson purchases development resources from Ericsson Nikola Tesla d.d. Dividends: Ericsson received dividends from Ericsson Nikola Tesla d.d. during 2012. Ericsson Nikola Tesla D.D. | | | | | | | | | | | | | | | | 2012 | | | 2011 | | | 2010 | | Related party transactions | | | | | | | | | | | | | Sales | | | 1,161 | | | | 465 | | | | 563 | | License revenues | | | 8 | | | | 4 | | | | 2 | | Purchases | | | 607 | | | | 595 | | | | 566 | | Ericsson’s share of dividends | | | 133 | | | | 154 | | | | 104 | | | | | | | | | | | | | | | Related party balances | | | | | | | | | | | | | Receivables | | | 189 | | | | 59 | | | | 120 | | Liabilities | | | 81 | | | | 76 | | | | 75 | |
ERICSSON ANNUAL REPORT ON FORM 20-F 2012 Ericsson does not have any contingent liabilities, assets pledged as collateral or guarantees towards Ericsson Nikola Tesla d.d. Sony Ericsson Mobile Communications AB The company has divested its 50% stake in Sony Ericsson Mobile Communications to Sony. The divestment was effective on January 1, 2012. Sony Ericsson Mobile Communications AB | | | | | | | | | | | | | | | | 2012 | | | 2011 | | | 2010 | | Related party transactions | | | | | | | | | | | | | License revenues | | | — | | | | 855 | | | | 1,255 | | Purchases | | | — | | | | 126 | | | | 61 | | | | | | | | | | | | | | | Related party balances | | | | | | | | | | | | | Receivables | | | — | | | | 27 | | | | 258 | | Liabilities | | | — | | | | 2 | | | | 8 | |
C30 FEES TO AUDITORS Fees to auditors | | | | | | | | | | | | | | | | PwC | | | Others | | | Total | | 2012 | | | | | | | | | | | | | Audit fees | | | 82 | | | | 5 | | | | 87 | | Audit related fees | | | 15 | | | | — | | | | 15 | | Tax services fees | | | 16 | | | | 3 | | | | 19 | | Other fees | | | 10 | | | | 10 | | | | 20 | | | | | | | | | | | | | | | Total | | | 123 | | | | 18 | | | | 141 | | | | | | | | | | | | | | | 2011 | | | | | | | | | | | | | Audit fees | | | 77 | | | | 9 | | | | 86 | | Audit related fees | | | 10 | | | | — | | | | 10 | | Tax services fees | | | 20 | | | | 3 | | | | 23 | | Other fees | | | 16 | | | | — | | | | 16 | | | | | | | | | | | | | | | Total | | | 123 | | | | 12 | | | | 135 | | | | | | | | | | | | | | | 2010 | | | | | | | | | | | | | Audit fees | | | 79 | | | | 5 | | | | 84 | | Audit related fees | | | 17 | | | | 1 | | | | 18 | | Tax services fees | | | 16 | | | | 2 | | | | 18 | | Other fees | | | 7 | | | | 2 | | | | 9 | | | | | | | | | | | | | | | Total | | | 119 | | | | 10 | | | | 129 | | | | | | | | | | | | | | |
During the period 2010–2012, in addition to audit services, PwC provided certain audit related services, tax and other services to the Company. The audit related services include quarterly reviews, ISO audits, SSAE16 reviews and services in connection with issuing of certificates and opinions. The tax services include general expatriate services and corporate tax compliance work. Other services include consultation on financial accounting, services related to acquisitions, operational effectiveness and assessments of internal control. Audit fees to other auditors largely consist of local statutory audits for minor companies. ERICSSON ANNUAL REPORT ON FORM 20-F 2012 C31 CONTRACTUAL OBLIGATIONS Contractual obligations 2012 | | | | | | | | | | | | | | | | | | | | | | | | Payment due by period | | | | | SEK billion | | <1
year | | | 1–3
years | | | 3–5
years | | | >5
years | | | Total | | Long-term debt1)2) | | | 3.3 | | | | 7.0 | | | | 7.1 | | | | 9.0 | | | | 26.4 | | Finance lease obligations3) | | | 0.2 | | | | 0.3 | | | | 0.2 | | | | 0.8 | | | | 1.5 | | Operating leases3) | | | 2.8 | | | | 3.2 | | | | 1.9 | | | | 2.5 | | | | 10.4 | | Other non-current liabilities | | | 0.1 | | | | 0.3 | | | | 0.1 | | | | 1.9 | | | | 2.4 | | Purchase obligations4) | | | 5.7 | | | | — | | | | — | | | | — | | | | 5.7 | | Trade payables | | | 23.1 | | | | — | | | | — | | | | — | | | | 23.1 | | Commitments for customer finance5) | | | 5.9 | | | | — | | | | — | | | | — | | | | 5.9 | | Total | | | 41.1 | | | | 10.8 | | | | 9.3 | | | | 14.2 | | | | 75.4 | | | | | | | | | | | | | | | | | | | | | | |
| 1) | Including interest payments. |
| 2) | See Note C20, “Financial risk management and financial instruments”. |
| 3) | See Note C27, “Leasing”. |
| 4) | The amounts of purchase obligations are gross, before deduction of any related provisions. |
| 5) | See also Note C14, “Trade receivables and customer finance”. |
For information about financial guarantees, see Note C24, “Contingent liabilities”. Except for those transactions described in this report, the Company has not been a party to any material contracts over the past three years other than those entered into during the ordinary course of business. C32 TRANSFERS OF FINANCIAL ASSETS Transfers where the Company has not derecognized the assets in their entirety As per December 31, 2012 there existed certain customer financing assets that the Company had transferred to third parties where the Company did not derecognize the assets in their entirety. The total carrying amount of the original assets transferred was SEK 471 (194) million, the amount of the assets that the Company continues to recognize was SEK 28 (10) million, and the carrying amount of the associated liabilities was SEK 0 (0) million. More information is disclosed about Customer Finance in Note C14 “Trade receivables and customer finance”. Transfers where the Company has continuing involvement The Company has during 2012 derecognized financial assets where the Company had continuing involvement. A repurchase of these assets would amount to SEK 225 (596) million. No assets or liabilities were recognized in relation to the continuing involvement. C33 EVENTS AFTER THE REPORTING PERIOD On January 10, 2013, Ericsson entered into an agreement with Unwired Planet whereby Ericsson will transfer 2,185 issued patents and patent applications to Unwired Planet. Ericsson will also contribute 100 additional patent assets annually to Unwired Planet commencing in 2014 through 2018. Unwired Planet will compensate Ericsson with certain ongoing rights in future revenues generated from the enlarged patent portfolio. Unwired Planet will also grant Ericsson a license to its patent portfolio. ERICSSON ANNUAL REPORT ON FORM 20-F 2012 On January 21, 2013, Ericsson announced its intention to acquire Devoteam Telecom & Media operations in France. Devoteam has employees in Europe, Middle East and Africa. The acquisition is in line with Ericsson’s services strategy to broaden its IT capabilities. In January 2013, ST-Ericsson was granted a loan facility by their owners of USD 260 million. Ericsson’s share of this credit facility is USD 130 million. On January 10, 2013, Adaptix Inc. filed two lawsuits against Ericsson, AT&T, AT&T Mobility and MetroPCS Communications in the US District Court for Eastern District of Texas alleging that certain Ericsson products infringe five US patents assigned to Adaptix. Adaptix seeks damages and an injunction. On January 25, 2013, Adaptix filed a complaint with the US International Trade Commission (ITC) against Ericsson, AT&T, AT&T Mobility and MetroPCS Communications requesting that the commission open a patent infringement investigation of certain Ericsson products and further on January 29, 2013, Adaptix filed a complaint with the Tokyo District Court alleging certain Ericsson products infringe two Japanese patents assigned to Adaptix. Adaptix seeks damages and an injunction. On March 18, 2013, Ericsson and STMicroelectronics announced an agreement on the way forward for the joint venture (JV) ST-Ericsson. The main steps agreed upon to split up the JV are the following: Ericsson will take on the design, development and sales of the LTE multimode thin modem products, including 2G, 3G and 4G multimode; ST will take on the existing ST-Ericsson products, other than LTE multimode thin modems, and related business as well as certain assembly and test facilities; starting the close down of the remaining parts of ST-Ericsson. The formal transfer of the relevant parts of ST-Ericsson to the parent companies is expected to be completed during the third quarter of 2013, subject to regulatory approvals. After the split up it is proposed that Ericsson will assume approximately 1,800 employees and contractors. ERICSSON ANNUAL REPORT ON FORM 20-F 2012 MANAGEMENT’S REPORT ON INTERNAL CONTROL OVER FINANCIAL REPORTING Ericsson’s management is responsible for establishing and maintaining adequate internal control over financial reporting for the Company. Ericsson’s internal control system related to financial reporting is designed to provide reasonable assurance regarding the reliability of financial reporting and the preparation of financial statements for external purposes in accordance with International Financial Reporting Standards (IFRS) and includes those policies and procedures that: pertain to the maintenance of records that, in reasonable detail, accurately and fairly reflect the transactions and dispositions of the assets of the Company; provide reasonable assurance that transactions are recorded as necessary to permit preparation of financial statements in accordance with International Financial Reporting Standards (IFRS), and that receipts and expenditures of the Company are being made only in accordance with authorizations of management and directors of the Company; and provide reasonable assurance regarding prevention or timely detection of unauthorized acquisition, use or disposition of the Company’s assets that could have a material effect on the financial statements. Although the purpose of internal control systems is to ensure adequate risk management all internal control systems, no matter how well designed, have inherent limitations which may result in that misstatements are not prevented or detected. Therefore, even systems determined to be effective can provide only reasonable assurance with respect to the reliability of financial statement preparation and presentation. Controls and procedures Ericsson’s management assessed the effectiveness of Ericsson’s internal control over financial reporting as of December 31, 2012. In making this assessment, management used the criteria set forth in “Internal Control—Integrated Framework”, issued by the Committee of Sponsoring Organizations of the Treadway Commission. Based on this assessment, management has concluded that, as of December 31, 2012, Ericsson’s internal control over financial reporting was effective at a reasonable assurance level. Attestation report of registered public accounting firm The effectiveness of the Company’s internal control over financial reporting as of December 31, 2012, has been audited by PricewaterhouseCoopers AB, an independent registered public accounting firm. PricewaterhouseCoopers AB has issued an attestation report on Ericsson’s internal control over financial reporting, which appears on page 69. Changes in internal control over financial reporting During the period covered by the Annual Report 2012, there were no changes to the internal control over financial reporting that have materially affected, or are likely to materially affect, the internal control over financial reporting. ERICSSON ANNUAL REPORT ON FORM 20-F 2012 RISK FACTORS You should carefully consider all the information in this Annual Report and in particular the risks and uncertainties outlined below. Based on the information currently known to us, we believe that the following information identifies the most significant risk factors affecting our business. Any of the factors described below, or any other risk factors discussed elsewhere in this report, could have a material negative effect on our business, operational and after-tax results, financial position, cash flow, liquidity, credit rating, brand and/or our share price. Additional risks and uncertainties not presently known to us or that we currently believe to be immaterial may also materially adversely affect our business. Furthermore, our operational results may have a greater variability than in the past and we may have difficulties in accurately predicting future developments. See also “Forward-Looking Statements”. MARKET, TECHNOLOGY AND BUSINESS RISKS Challenging global economic conditions may adversely impact the demand and pricing for our products and services as well as limit our ability to grow. Challenging global economic conditions could have adverse, wide-ranging effects on demand for our products and for the products of our customers. Adverse global economic conditions could cause operators and other customers to postpone investments or initiate other cost-cutting initiatives to improve their financial position. This could result in significantly reduced expenditures for network infrastructure and services, in which case our operating results would suffer. If demand for our products and services were to fall in the future, we could experience material adverse effects on our revenues, cash flow, capital employed and value of our assets and we could incur operating losses. Furthermore, if demand is significantly weaker or more volatile than expected, our credit rating, borrowing opportunities and costs as well as the trading price of our shares could be adversely impacted. When deemed necessary, we undertake specific restructuring or cost saving initiatives, however, there are no guarantees that such initiatives will be sufficient, successful or executed in time to deliver any improvements in our earnings. Should global economic conditions fail to improve, or worsen, other business risks we face could intensify and could also negatively impact the business prospects of operators and other customers. Some operators and other customers, in particular in markets with weak currencies, may incur borrowing difficulties and slower traffic development, which may negatively affect their investment plans and cause them to purchase less of our products and services. The potential adverse effects of an economic downturn include: Reduced demand for products and services, resulting in increased price competition or deferrals of purchases, with lower revenues not fully compensated through reduced costs Risks of excess and obsolete inventories and excess manufacturing capacity Risk of financial difficulties or failures among our suppliers Increased demand for customer finance, difficulties in collection of accounts receivable and increased risk of counterparty failures Risk of impairment losses related to our intangible assets as a result of lower forecasted sales of certain products Increased difficulties in forecasting sales and financial results as well as increased volatility in our reported results ERICSSON ANNUAL REPORT ON FORM 20-F 2012 A decline in the value of the assets in our pension plans and/or increased pension liabilities due to discount rate changes End user demand could also be adversely affected by reduced consumer spending on technology, changed operator pricing, security breaches and trust issues. The telecommunications industry fluctuates and is affected by many factors, including the economic environment, decisions by operators and other customers regarding their deployment of technology and their timing of purchases. The telecommunications industry has experienced downturns in the past in which operators substantially reduced their capital spending on new equipment. While we expect the network service provider equipment market and telecommunications services market to grow in the coming years, the uncertainty surrounding the global economic recovery may materially harm actual market conditions. Moreover, market conditions are subject to substantial fluctuation, and could vary geographically and across technologies. Even if global conditions improve, conditions in the specific industry segments in which we participate may be weaker than in other segments. In that case, the results of our operations may be adversely affected. If capital expenditures by operators and other customers is weaker than we anticipate, our revenues and profitability may be adversely affected. The level of demand by operators and other customers who buy our products and services can change quickly and can vary over short periods of time, including from month to month. Due to the uncertainty and variations in the telecommunications industry, accurately forecasting revenues, results, and cash flow remains difficult. Sales volumes and gross margin levels are affected by the variation and short order time of our products and services. Our sales to operators and other customers represent a mix of equipment, software and services, which normally generate different gross margins. We sell our own products as well as third party products, which normally have lower margins than our own products. As a consequence, our reported gross margin in a specific period will be affected by the overall mix of products and services as well as the relative content of third party products. Further, network expansions and upgrades have much shorter lead times for delivery than initial network build outs. Orders for such network expansions and upgrades are normally placed with short notice by customers, often with less than a month’s notice, and consequently variations in demand are difficult to forecast. As a result, changes in our product and service mix and the short order time for certain of our products may affect our ability to accurately forecast sales and margins or detect in advance whether actual results will deviate from market consensus. Short-term variation could have a material adverse effect on our business, operating results and financial condition. We may not be able to properly respond to market trends in the industries in which we operate, including the ongoing convergence of the telecom, data and media industries, which may harm our market position relative to our competitors. We are affected by market conditions and trends within the industries in which we operate, including the convergence of the telecom, data and media industries. Convergence is largely driven by technological development related to IP-based communications. This has changed the competitive landscape and affects our objective setting, risk assessment and strategies. Competitors new to our business may enter this new business context and negatively impact our market share in selected areas. If we fail to understand the market development, or fail to acquire the necessary competences to develop and market products, services and solutions that are competitive in this changing market, our business, operating results and financial condition will suffer. ERICSSON ANNUAL REPORT ON FORM 20-F 2012 Our business depends upon the continued growth of mobile communications and the acceptance of new services. If growth slows or new services do not succeed, operators’ investment in networks may slow or stop, harming our business. A substantial portion of our business depends on the continued growth of mobile communications in terms of both the number of subscriptions and usage per subscriber, which in turn drives the continued deployment and expansion of network systems by our customers. If operators fail to increase the number of subscribers and/or stimulate increased usage, our business and operational results could be materially adversely affected. Also, if operators fail to monetize new services, fail to introduce new business models or experience a decline in operator revenues or profitability, their willingness to further invest in their network systems may decrease which will reduce their demand for our products and services and have an adverse effect on our business, operational results and financial condition. Fixed and mobile networks converge and new technologies, such as IP and broadband, enable operators to deliver a range of new types of services in both fixed and mobile networks. We are dependent upon market acceptance of such services and the outcome of regulatory and standardization activities in this field, such as spectrum allocation. If delays in standardization, regulation, or market acceptance occur, this could adversely affect our business, operational results and financial condition. We face intense competition from our existing competitors as well as new entrants, including IT companies entering the telecommunications market, and this could materially adversely affect our results. The markets in which we operate are highly competitive in terms of price, functionality, service quality, customization, timing of development, and the introduction of new products and services. We face intense competition from significant competitors many of which are very large, with substantial technological and financial resources and established relationships with operators. Further, certain competitors, Chinese companies in particular, have become relatively stronger in recent years. We may also encounter increased competition from new market entrants, alternative technologies or due to evolving industry standards. In particular, we may face competition from large IT companies entering the telecommunications market who benefit from economies of scale from being active in several industries. We cannot assure that we will be able to compete successfully with these companies. Our competitors may implement new technologies before we do, offer more attractively priced or enhanced products, services or solutions, or they may offer other incentives that we do not provide. Some of our competitors may also have greater resources in certain business segments or geographic markets than we do. Increased competition could result in reduced profit margins, loss of market share, increased research and development costs as well as increased sales and marketing expenses. Traffic development on cellular networks could be affected if more traffic is off-loaded to Wi-Fi networks. Further, alternative services provided over-the-top have profound effects on operator voice/ SMS revenues with possible reduced capital expenses consequences. Additionally, we operate in markets characterized by rapidly changing technology. This results in continuous price erosion and increased price competition for our products and services. If our counter measures, including enhanced products and business models or cost reductions cannot be achieved or do not occur in a timely manner, there could be adverse impacts on our business, operating results, financial condition and market share. Vendor consolidation may lead to stronger competitors who are able to benefit from integration, scale and greater resources. Industry convergence and consolidation among equipment and services suppliers could potentially result in stronger competitors that are competing as end-to-end suppliers as well as competitors more specialized in particular areas. Consolidation may also result in competitors with greater resources than we have or in reduction of our current scale advantages. This could have a materially adverse effect on our business, operating results, financial condition and market share. ERICSSON ANNUAL REPORT ON FORM 20-F 2012 A significant portion of our revenue is currently generated from a limited number of key customers, and operator consolidation may increase our dependence on key customers. We derive most of our business from large, multi-year frame agreements with a limited number of significant customers. Many of these agreements are opened up on a yearly basis to re-negotiate the price for our products and services and do not contain committed purchase volumes. Although no single customer represents more than 7% of our sales in 2012, our ten largest customers accounted for 46% of our sales in 2012. A loss of or a reduced role with a key customer could have a significant adverse impact on sales, profit and market share for an extended period. In recent years, network operators have undergone significant consolidation, resulting in a fewer number of operators with activities in several countries. This trend is expected to continue, and intra-country consolidation is likely to accelerate as a result of competitive pressure. A market with fewer and larger operators will increase our reliance on key customers and may negatively impact our bargaining position and profit margins. Moreover, if the combined companies operate in the same geographic market, networks may be shared and less network equipment and associated services may be required. Network investments could be delayed by the consolidation process, which may include, among others, actions relating to merger or acquisition agreements, securing necessary regulatory approvals, or integration of their businesses. Network operators have started to share parts of their network infrastructure through cooperation agreements rather than legal consolidations, which may adversely affect demand for network equipment. Accordingly, operator consolidation may have a material adverse effect on our business, operating results and financial condition. Certain long-term frame agreements with customers still include commitments to future price reductions, requiring us to constantly manage and control our cost base. Long-term frame agreements with our customers are typically awarded on a competitive bidding basis. In some cases, such agreements also include a commitment to future price reductions. In order to maintain our gross margin with such price reductions, we continuously strive to reduce the costs of our products through design improvements, negotiation of better purchase prices from our suppliers, allocation of more production to low-cost countries and increased productivity in our own production. However, there can be no assurance that our actions to reduce costs will be sufficient or quick enough to maintain our gross margin in such contracts, which may have a material adverse effect on our operating results. Growth of our managed services business is difficult to predict, and requires taking significant contractual risks. Operators increasingly outsource parts of their operations to reduce cost and focus on new services. To address this opportunity, we offer operators various services in which we manage their networks. The growth rate in the managed services market is difficult to forecast and each new contract carries a risk that transformation and integration of the operations will not be as fast or smooth as planned. Additionally, early contract margins are generally low and the mix of new and old contracts may negatively affect reported results in a given period. Contracts for such services normally cover several years and generate recurring revenues. However, contracts have been, and may in the future be, terminated or reduced in scope, which has negative impacts on sales and earnings. While we believe we have a strong position in the managed services market, competition in this area is increasing, which may have adverse effects on our future growth and profitability. We depend upon the development of new products and enhancements to our existing products, and the success of our substantial research and development investments is uncertain. Rapid technological and market changes in our industry require us to make significant investments in technological innovation. We invest significantly in new technology, products and solutions. In order for us to be successful, those technologies, products and solutions must be accepted by relevant standardization bodies and ERICSSON ANNUAL REPORT ON FORM 20-F 2012 by the industry as a whole. There can be no assurance that our research and development efforts will be technically or commercially successful. If we invest in the development of technologies, products and solutions that do not function as expected, are not adopted by the industry, are not ready in time, or are not successful in the marketplace our sales and earnings may materially suffer. Additionally, it is common for research and development projects to encounter delays due to unforeseen problems. Delays in production may increase the cost of research and development efforts and put us at a disadvantage against our competition. We engage in acquisitions and divestments which may be disruptive and require us to incur significant expenses. In addition to in-house innovation efforts, we make strategic acquisitions in order to obtain various benefits such as reduced time-to-market, access to technology and competence, increased scale or to broaden our product portfolio or customer base. Future acquisitions could result in the incurrence of contingent liabilities and an increase in amortization expenses related to goodwill and other intangible assets, which could have a material adverse effect upon our business, financial condition and results of operations. Risks we could face with respect to acquisitions include: Difficulties in the integration of the operations, technologies, products and personnel of the acquired company Risks of entering markets in which we have no or limited Potential loss of employees Diversion of management’s attention away from other business concerns Expenses of any undisclosed or potential legal liabilities of the acquired company. From time to time we also divest parts of our business to optimize our product portfolio or operations. Any decision to dispose of or otherwise exit businesses may result in the recording of special charges, such as workforce reduction costs and industry and technology-related write-offs. We cannot assure that we will be successful in consummating future acquisitions or divestments on favourable terms or at all. The risks associated with such acquisitions and divestments could have a material adverse effect upon our business, financial condition and results of operations. We are a party to joint ventures and partnerships which may not be successful and expose us to future costs. We are partners in joint ventures and partnerships. Our partnering arrangements may fail to perform as expected for various reasons, including an incorrect assessment of our needs, our inability to take action without the approval of our partners or the capabilities or financial stability of our strategic partners. Our ability to work with these partners or develop new products and solutions may become constrained, which could harm our competitive position in the market. Additionally, our share of any losses from or commitments to contribute additional capital to such partnerships may adversely affect our results of operations or financial position. The Board of Directors’ report includes further information regarding our joint venture ST Ericsson. We rely on a limited number of suppliers of components, production capacity and R&D and IT services, which exposes us to supply disruptions and cost increases. Our ability to deliver according to market demands and contractual commitments depends significantly on obtaining a timely and adequate supply of materials, components, production capacity and other vital services on ERICSSON ANNUAL REPORT ON FORM 20-F 2012 competitive terms. Although we strive to avoid single-source supplier solutions, this is not always possible. Accordingly, there is a risk that we will be unable to obtain key supplies we need to produce our products and provide our services on commercially reasonable terms, or at all. Failure by any of our suppliers could interrupt our product or services supply or operations and significantly limit sales or increase our costs. To find an alternative supplier or re-design products to replace components may take significant time which could cause significant delays or interruptions in the delivery of our products and services. We have from time to time experienced interruptions of supply and we may experience such interruptions in the future. Furthermore, our procurement of supplies requires us to predict future customer demands. If we fail to anticipate customer demand properly, an over or under supply of components and production capacity could occur. In many cases, some of our competitors utilize the same contract manufacturers and if they have purchased capacity ahead of us we could be blocked from acquiring the needed products. This factor could limit our ability to supply our customers or could increase costs. At the same time, we commit to certain capacity levels or component quantities, which, if unused, will result in charges for unused capacity or scrapping costs. We are also exposed to financial counterpart risks to suppliers where we pay in advance for supplies. Product or service quality issues could lead to reduced revenue, gross margins and declining sales to existing customers. Sales contracts normally include warranty undertakings for faulty products and often include provisions regarding penalties and/or termination rights in the event of a failure to deliver ordered products or services on time or with required quality. Although we undertake a number of quality assurance measures to reduce such risks, product quality or service performance issues may negatively affect our reputation, results and financial position. If significant warranty obligations arise due to reliability or quality issues, our operating results and financial position could be negatively impacted by costs associated with fixing software or hardware defects, high service and warranty expenses, high inventory obsolescence expense, delays in collecting accounts receivable or declining sales to existing customers. Due to having a significant portion of our costs in SEK and revenues in other currencies, our business is exposed to foreign exchange fluctuations that could negatively impact our revenue and results of operation. We incur a significant portion of our expenses in SEK. As a result of our international operations, we generate, and expect to continue to generate, a significant portion of our revenue in currencies other than SEK. To the extent we are unable to match revenue received in foreign currencies with costs paid in the same currency, exchange rate fluctuations could have a negative impact on our consolidated income statement, balance sheet and cash flows when foreign currencies are exchanged or translated to SEK, which increases volatility in reported results. As market prices are predominantly established in USD or EUR, we presently have a net revenue exposure in foreign currencies which means that a stronger SEK exchange rate would generally have a negative effect on our reported results. Our attempts to reduce the effects of exchange rate fluctuations through a variety of hedging activities may not be sufficient or successful, resulting in an adverse impact on our results. Our ability to benefit from intellectual property rights (IPR) which are critical to our business may be limited by changes in regulation limiting patents, inability to prevent infringement, the loss of licenses from third parties and IP infringement claims brought against us by competitors. Although we have a large number of patents, there can be no assurance that they will not be challenged, invalidated, or circumvented, or that any rights granted in relation to our patents will in fact provide us with competitive advantages. ERICSSON ANNUAL REPORT ON FORM 20-F 2012 In 2005, the European Union considered restricting the patentability of software. Although the European Union ultimately rejected this proposal, we cannot guarantee that they will not revisit this issue in the future. We rely on many software patents, and limitations on the patentability of software may materially affect our business. We utilize a combination of trade secrets, confidentiality policies, nondisclosure and other contractual arrangements in addition to relying on patent, copyright and trademark laws to protect our intellectual property rights. However, these measures may not be adequate to prevent or deter infringement or other misappropriation. Moreover, we may not be able to detect unauthorized use or take appropriate and timely steps to establish and enforce our proprietary rights. In fact, existing laws of some countries in which we conduct business offer only limited protection of intellectual property rights, if at all. Our solutions may also require us to license technologies from third parties. It may be necessary in the future to seek or renew licenses and there can be no assurance that they would be available on acceptable terms, or at all. Moreover, the inclusion in our products of software or other intellectual property licensed from third parties on a non-exclusive basis could limit our ability to protect proprietary rights in our products. Many key aspects of telecommunications and data network technology are governed by industry-wide standards usable by all market participants. As the number of market entrants and the complexity of technology increases, the possibility of functional overlap and inadvertent infringement of intellectual property rights also increases. Third parties have asserted, and may assert in the future, claims, directly against us or against our customers, alleging infringement of their intellectual property rights. Defending such claims may be expensive, time-consuming and divert the efforts of our management and/or technical personnel. As a result of litigation, we could be required to pay damages and other compensation directly or to indemnify our customers for such damages and other compensation, develop non-infringing products/technology or enter into royalty or licensing agreements. However, we cannot be certain that such licenses will be available to us on commercially reasonable terms or at all, and such judgments could have a materially adverse effect on our business. We are involved in lawsuits and investigations which, if determined against us, could require us to pay substantial damages, fines and/or penalties. In the normal course of our business we are involved in legal proceedings. These lawsuits include such matters as commercial disputes, claims regarding intellectual property, antitrust, tax and labour disputes. Litigation can be expensive, lengthy and disruptive to normal business operations. Moreover, the results of complex legal proceedings are difficult to predict. An unfavourable resolution of a particular lawsuit could have a material adverse effect on our business, reputation, operating results, or financial condition. As a publicly listed company, Ericsson may be exposed to lawsuits in which plaintiffs allege that the Company or its officers have failed to comply with securities laws, stock market regulations or other laws, regulations or requirements. Whether or not there is merit to such claims, the time and costs incurred to defend the Company and its officers and the potential settlement or compensation to the plaintiffs could have significant impact on our reported results and reputation. For additional information regarding certain of the lawsuits in which we are involved, see “Legal proceedings” in the Board of Directors’ Report. Our operations are complex and several critical operations are centralized in a single location. Any disruption of our operations, whether due to natural or man made events, may be highly damaging to the operation of our business. Our business operations rely on complex operations and communications networks, which are vulnerable to damage or disturbance from a variety of sources. Having outsourced a significant portion of our IT operations, we depend partly on security and reliability measures of external companies. Regardless of protection measures, our systems and communications networks are susceptible to disruption due to failure, vandalism, computer ERICSSON ANNUAL REPORT ON FORM 20-F 2012 viruses, security breaches, natural disasters, power outages and other events. We also have a concentration of operations on certain sites, including R&D, production, network operation centres, and logistic centres and shared services centres, where business interruptions could cause material damage and costs. The delivery of goods from suppliers, and to customers, could also be hampered for the reasons stated above. We cannot provide any assurance that interruptions to our systems and communications will not have an adverse effect on our operations and financial conditions. Cyber security incidents affecting our business may have a material adverse effect on our business operations, financial condition and brand. Ericsson’s business operations involve areas that are particularly vulnerable to cyber security incidents such as data breaches, intrusions, espionage, knowhow and data privacy infringements, leakage and general malfeasance. Examples of these areas include, amongst others, research and development, managed services, usage of cloud solutions, software development, lawful interception and product engineering. Any cyber security incident including unintended use, involving our operations, product development, services, our third party providers or installed product base, could cause severe harm to Ericsson and could have a material adverse effect on our business operations, financial condition and brand. Ericsson relies heavily on third parties to whom we have outsourced significant aspects of our IT infrastructure, product development and engineering services. While we have taken precautions relating to the selection, integration and ongoing management of these third parties, any event or attack that is caused as a result of vulnerabilities in their operations or products supplied to us, could have a material adverse effect upon Ericsson, our business operations, financial condition and brand, potentially slowing operations, leaking valuable intellectual property or damaging our products which have been installed in our customers’ networks. We must continue to attract and retain highly qualified employees to remain competitive. We believe that our future success largely depends on our continued ability to hire, develop, motivate and retain engineers and other qualified personnel needed to develop successful new products, support our existing product range and provide services to our customers. Competition for skilled personnel and highly qualified managers in the telecommunications industry remains intense. We are continuously developing our corporate culture, remuneration, promotion and benefits policies as well as other measures aimed at empowering our employees and reducing employee turnover. However, there are no guarantees that we will be successful in attracting and retaining employees with appropriate skills in the future, and failure in retention and recruiting could have a material adverse effect on our business. If our customers’ financial conditions decline, we will be exposed to increased credit and commercial risks. After completing sales to customers, we may encounter difficulty collecting accounts receivables and could be exposed to risks associated with uncollectable accounts receivable. We regularly assess the credit worthiness of our customers and based on that we determine a credit limit for each one of them. Challenging economic conditions have impacted some of our customers’ ability to pay their accounts receivables. Although our credit losses have historically been low and we have policies and procedures for managing customer finance credit risk we may be unable to avoid future losses on our trade receivables. We have also experienced demands for customer financing, and in adverse financial markets or more competitive environments, those demands may increase. Upon the financial failure of a customer, we may experience losses on credit extended and loans made to such customer, losses relating to our commercial risk exposure, and the loss of the customer’s on-going business. If customers fail to meet their obligations to us, we may experience reduced cash flows and losses in excess of reserves, which could materially adversely impact our results of operations and financial position. ERICSSON ANNUAL REPORT ON FORM 20-F 2012 We rely on various capital sources for short-term and long-term capital for the funding of our business. Should such capital become unavailable or available in insufficient amounts or unreasonable terms, our business may materially suffer. If we do not generate sufficient amounts of capital to support our operations, service our debt and continue our research and development and customer finance programs, or if we cannot raise sufficient amounts of capital at the required times and terms, our business is likely to be adversely affected. Access to funding may decrease or become more expensive as a result of our operational and financial condition, market conditions, including financial conditions in the Euro-zone, or due to deterioration in our credit rating. There can be no assurance that additional sources of funds that we from time to time may need, will be available or available on reasonable terms. If we cannot access capital on commercially viable terms, our business could materially suffer. Impairment of goodwill may negatively impact financial condition. An impairment of goodwill or other intangible assets could adversely affect our financial condition or results of operations. We have a significant amount of goodwill and intangible assets, for example patents, customer relations, trademarks and software. Goodwill is the only intangible asset the company has recognized to have indefinite useful life. Other intangible assets are mainly amortized on a straight-line basis over their estimated useful lives, but no more than ten years, and are reviewed for impairment whenever events such as product discontinuances, product dispositions or other changes in circumstances indicate that the carrying amount may not be wholly recoverable. Those not yet in use are tested for impairment annually. Historically, we have recognized impairment charges related to intangible assets mainly due to restructuring. Additional impairment charges may be incurred in the future that could be significant due to various reasons, including restructuring actions or adverse market conditions that are either specific to us or the broader telecommunications industry or more general in nature and that could have an adverse effect on our results of operations or financial condition. Negative deviations in actual cash flows compared to estimated cash flows as well as new estimates that indicate lower future cash flows might result in recognition of impairment charges. Estimates require management judgment as well as the definition of cash generating units for impairment testing purposes. Other judgments might result in significantly different results and financial position in the future. REGULATORY, COMPLIANCE AND CORPORATE GOVERNANCE RISKS Our business may suffer as a result of changes in laws or regulations which could subject us to liability, increase costs, or reduce product demand. Telecommunications is an industry which is subject to regulations. Changes to these regulations may adversely affect both our customers’ and our own operations. For example, regulations imposing more stringent, time-consuming or costly planning and zoning requirements or building approvals for radio base stations and other network infrastructure could adversely affect the timing and costs of network construction or expansion, and ultimately the commercial launch and success of these networks. Similarly, tariff and roaming regulations or rules on network neutrality could also affect operators’ ability or willingness to invest in network infrastructure, which in turn could affect the sales of our systems and services. Additionally, delay in radio frequency spectrum allocation, and allocation between different types of usage may affect operator spending adversely or force us to develop new products to be able to compete. Further, we develop many of our products and services based on existing regulations and technical standards. Changes to existing regulations and technical standards, or the implementation of new regulations and ERICSSON ANNUAL REPORT ON FORM 20-F 2012 technical standards relating to products and services not previously regulated, could adversely affect our development efforts by increasing compliance costs and causing delay. Demand for those products and services could also decline. Regulatory changes in license fees, environmental, health and safety, privacy and other regulatory areas may increase costs and restrict our operations or the operations of network operators and service providers. Also indirect impacts of such changes and regulatory changes in other fields, such as pricing regulations, could have an adverse impact on our business even though the specific regulations may not apply directly to our products or us. Ericsson may fail or be unable to comply with laws or regulations and could experience adverse rulings in enforcement or other proceedings, which could have a material adverse impact on our business operations, financial condition and brand. Our substantial international operations are subject to uncertainties which could affect our operating results. We conduct business throughout the world and are subject to the effects of general global economic conditions as well as conditions unique to specific countries or regions. We have customers in more than 180 countries, with a significant proportion of our sales to emerging markets in the Asia Pacific region, Latin America, Eastern Europe, the Middle East and Africa. Our extensive operations are subject to numerous additional risks, including civil disturbances, economic and political instability, the imposition of exchange controls, economies which are subject to significant fluctuations, nationalization of private assets or other governmental actions affecting the flow of goods and currency, and difficulty of enforcing agreements and collecting receivables through local legal systems. Further, in certain markets in which we operate, there is a risk of protectionist governmental measures implemented to assist domestic market participants at the expense of foreign competitors. The implementation of such measures could adversely affect sales or our ability to purchase critical components. We must always comply with relevant export control regulations and sanctions or other trade embargoes in force, not only at the time of sale but also at the time of delivery. The political situation in parts of the world, particularly in the Middle East, has led to an increase of sanctions imposed by the global community. A universal element of these sanctions is the financial restrictions with respect to individuals and/or legal entities, but sanctions can also restrict certain exports and ultimately lead to a complete trade embargo towards a country. In particular, the sanctions towards Iran have been strengthened significantly during 2012, both by the EU and the U.S. Even though the EU has imposed a ban on deliveries on many items, especially so called dual use items, an exemption for certain standard telecom equipment is still maintained. There is a risk in many of these countries of unexpected changes in regulatory requirements, tariffs and other trade barriers, price or exchange controls, or other governmental policies which could limit our operations and decrease our profitability. Further export control regulations, sanctions or other forms of trade restrictions imposed on countries in which we are active may result in a reduction of commitment in those countries. The need to terminate activities as a result of further trade restrictions may also expose us to customer claims and other actions. Although we seek to comply with all such regulations, there can be no assurance that we are, or will be in the future, compliant with all relevant regulations and such violations, even unintentional violations, could have material adverse effects on our business, operational results and brand. There has been a growing concern reported by media and others, that certain countries may use features of their telecommunications systems violating the human rights. This may adversely affect the telecommunications business and may have a negative impact on our brand. ERICSSON ANNUAL REPORT ON FORM 20-F 2012 As a result of the credit crisis in Europe, concerns persist regarding the debt burden of certain Eurozone countries and their ability to meet future financial obligations, the overall stability of the euro and the suitability of the euro as a single currency given the diverse economic and political circumstances in individual member states. These and other concerns could in worst case lead to the re-introduction of individual currencies in one or more member states, or, in more extreme circumstances, the possible dissolution of the euro entirely. These potential developments, or market perceptions concerning these and related issues, could adversely affect our operations and have a material adverse effect on our business, operating results and financial condition. We may fail to comply with our corporate governance standards which could negatively affect our financial condition, business, results of operations and our brand. We are subject to corporate governance laws and regulations and are also committed to several corporate responsibility and environmental initiatives. In some of the countries where we operate corruption risks are high. In addition, there is higher focus on anticorruption, with changed legislation in many countries. To ensure that our operations are executed in accordance with applicable requirements, our management system includes a Code of Business Ethics, a Sustainability Policy, as well as other policies and directives to govern our processes and operations. Our commitment to apply the UN Guiding principles for business and human rights to our operation cannot prevent unintended or unlawful use of our technology by non democratic regimes. While we attempt to monitor and audit internal compliance with the policies and directives as well as our suppliers’ adherence to our Code of Conduct and strive for continuous improvements, we cannot provide any assurances that violations will not occur which could have material adverse effects on our operations, business results and brand. Failure to comply with environmental, health and safety regulations in many jurisdictions may expose us to significant penalties and other sanctions. We are subject to certain environmental, health and safety laws and regulations that affect our operations, facilities and products in each of the jurisdictions in which we operate. While we believe that we are in compliance with all material laws and regulations related to the environment, health, and safety, we can provide no assurance that we have been, are, or will in the future be compliant with these regulations. If we have failed or fail to comply with these regulations, we could be subject to significant penalties and other sanctions that could have a material adverse effect on our business, operating results and financial condition. Additionally, there is a risk that we may have to incur expenditures to cover environmental and health liabilities to maintain compliance with current or future laws and regulations or to undertake any necessary remediation. It is difficult to reasonably estimate the future impact of environmental matters, such as climate change and weather events, including potential liabilities. This is due to several factors, particularly the length of time often involved in resolving such matters. Adverse future events, regulations, or judgments could have a material effect on our business, operating results and financial condition. Potential health risks related to electromagnetic fields may subject us to various product liability claims and result in regulatory changes. The mobile telecommunications industry is subject to claims that mobile handsets and other devices that generate electromagnetic fields expose users to health risks. At present, a substantial number of scientific studies conducted by various independent research bodies have indicated that electromagnetic fields, at levels within the limits prescribed by public health authority safety standards and recommendations, cause no adverse effects to human health. However, any perceived risk or new scientific findings of adverse health effects from mobile communication devices and equipment could adversely affect us through a reduction in sales or through liability claims. Although Ericsson’s products are designed to comply with all current safety standards and ERICSSON ANNUAL REPORT ON FORM 20-F 2012 recommendations regarding applicable electromagnetic fields, we cannot guarantee that we or the jointly owned ST-Ericsson will not become the subject of product liability claims or be held liable for such claims or be required to comply with future regulatory changes that may have an adverse effect on our business, operating results and financial condition. New regulations related to “conflict minerals” may cause us to incur additional expenses, and may make our supply chain more complex. On August 22, 2012, the US Securities and Exchange Commission (the “SEC”), adopted a new rule requiring disclosures beginning in 2014 of specified minerals (“conflict minerals”) that are necessary to the functionality or production of products manufactured or contracted to be manufactured by companies registered with the SEC, whether or not these products or its components are manufactured by third parties. While we believe that we will be able to fulfill these requirements without materially affecting our costs or access to materials, we can provide no assurance that there will not be material costs associated with complying with the disclosure requirements. While we work and strive to be able to sufficiently verify the origins of these minerals, our supply chain is complex, and we may not be able to sufficiently verify the origins of the relevant minerals used in our products through the due diligence procedures that we implement, which may harm our reputation. In addition, we may encounter challenges if customers require that all of the components of our products be certified as conflict-free. These new disclosure requirements may negatively affect our brand, financial condition, business and results of operations. RISKS ASSOCIATED WITH OWNING ERICSSON SHARES Our share price has been and may continue to be volatile, especially as technology companies, securities and markets as a whole remain volatile. Our share price has been volatile due to various factors, including our operating performance as well as the high volatility in the securities markets generally and volatility in telecommunications and technology companies’ securities in particular. Our share price is also likely to be affected by future developments in our market, our reported financial results and the expectations of financial analysts, as well as statements and market speculation regarding our future prospects or the timing or content of any public communications, including reports of operating results, by us or our competitors. Factors other than our financial results that may affect our share price include, but are not limited to: A weakening of our brand name or other circumstances with adverse effects on our reputation Announcements by our customers, competitors or us regarding capital spending plans of our customers Financial difficulties for our customers Awards of large supply or service contracts Speculation in the press or investment community about the business level or growth in the telecommunications market Technical problems, in particular those relating to the introduction and viability of new network systems, including lte/4g and new platforms such as the rbs 6000 (multi-standard radio base station) platform Actual or expected results of ongoing or potential litigation ERICSSON ANNUAL REPORT ON FORM 20-F 2012 Announcements concerning bankruptcy or investigations into the accounting procedures of ourselves or other telecommunications companies Our ability to forecast and communicate our future results in a manner consistent with investor expectations. Currency fluctuations may adversely affect share value or value of dividends. Because our shares are quoted in SEK on NASDAQ OMX Stockholm (our primary stock exchange), but in USD on NASDAQ New York (ADSs), fluctuations in exchange rates between SEK and USD may affect the value of our shareholders’ investment. In addition, because we pay cash dividends in SEK, fluctuations in exchange rates may affect the value of distributions when converted into other currencies. An increasing part of the trade in our shares is carried out on alternative exchanges or markets, which may lead to less accurate share price information on NASDAQ OMX Stockholm or NASDAQ New York. ERICSSON ANNUAL REPORT ON FORM 20-F 2012 FORWARD-LOOKING STATEMENTS This Annual Report includes forward-looking statements, including statements reflecting management’s current views relating to the growth of the market, future market conditions, future events and expected operational and financial performance. The words “believe”, “expect”, “foresee”, “anticipate”, “assume”, “intend”, “may”, “could”, “plan”, “estimate”, “forecast”, “will”, “should”, “predict”, “aim”, “ambition”, “target”, “might” or, in each case, their negative, and similar words are intended to help identify forward-looking statements. Forward-looking statements may be found throughout this document, but in particular in the chapter “Board of Directors’ Report” and include statements regarding: Our goals, strategies and operational or financial performance expectations Development of corporate governance standards, stock market regulations and related legislation The future characteristics of the markets in which we operate Projections and other characterizations of future events Our liquidity, capital resources, capital expenditures, our credit ratings and the development in the capital markets, affecting our industry or us The expected demand for our existing as well as new products and services The expected operational or financial performance of our joint ventures and other strategic cooperation activities The time until acquired entities will be accretive to income Technology and industry trends including regulatory and standardization environment, competition and our customer structure Our plans for new products and services including research and development expenditures. Although we believe that the expectations reflected in these and other forward-looking statements are reasonable, we cannot assure you that these expectations will materialize. Because forward-looking statements are based on assumptions, judgments and estimates, and are subject to risks and uncertainties, actual results could differ materially from those described or implied herein. Important factors that could affect whether and to what extent any of our forward-looking statements materialize include, but are not limited to: Our ability to respond to changes in the telecommunications market and other general market conditions in a cost effective and timely manner Developments in the political, economic or regulatory environment affecting the markets in which we operate, including trade embargoes, changes in tax rates, changes in patent protection regulations, allegations of health risks from electromagnetic fields, cost of radio licenses for our customers, allocation of radio frequencies for different purposes and results of standardization activities The effectiveness of our strategies and their execution, including partnerships, acquisitions and divestments Financial risks, including changes in foreign exchange rates or interest rates, lack of liquidity or access to financing, our credit ratings, changes in tax liabilities, credit risks in relation to counterparties, customer defaults under significant customer finance arrangements and risks of confiscation of assets in foreign countries ERICSSON ANNUAL REPORT ON FORM 20-F 2012 The financial strength of our customer base The impact of the consolidation in the industry, and the resulting (i) reduction in the number of customers, and adverse consequences of a loss of, or significant decline in, our business with a major customer; (ii) increased strength of a competitor or the establishment of new competitors The impact of changes in product demand, technology adoption, price erosion, competition from existing or new competitors or new technologies or alliances between vendors of different types of technology and the risk that our products and services may not sell at the rates or levels we anticipate The product mix and margins of our sales The volatility of market demand and difficulties to forecast such demand Our ability to develop commercially viable products, systems and services, to acquire licenses of necessary technology, to protect our intellectual property rights through patents and trademarks and to license them to others and defend them against infringement, and the results of patent litigation Our ability to manage cyber security incidents Supply constraints, including component or production capacity shortages, suppliers’ abilities to cost effectively deliver quality products on time and in sufficient volumes, and risks related to concentration of proprietary or outsourced production in a single facility or sole source situations with a single vendor Our ability to successfully manage operators’ networks to their satisfaction with satisfactory margins Our ability to maintain a strong brand and good reputation and to be acknowledged for good corporate governance Our ability to recruit and retain qualified management and other key employees Our ability to trace conflict minerals in our complex supply chain. Certain of these risks and uncertainties are described further in “Risk factors”. We undertake no obligation to publicly update or revise any forward-looking statements included in this Annual Report, whether as a result of new information, future events or otherwise, except as required by applicable law or stock exchange regulation. ERICSSON ANNUAL REPORT ON FORM 20-F 2012 CORPORATE GOVERNANCE REPORT 2012 Corporate governance describes how rights and responsibilities are distributed among corporate bodies according to applicable laws, rules and processes. Corporate governance also defines the decision-making systems and structure through which owners directly or indirectly control a company. Good corporate governance forms the basis for building a robust corporate culture throughout a global organization. Efficient and reliable controls and procedures are important, but it is also crucial that ethical business practices are highly valued and followed by all people in the organization—starting at the top. As Chairman of the Board, it is my responsibility to ensure that the Board’s work is efficient and that applicable principles and processes in the Board’s work procedure are complied with. The Board of Directors’ main tasks include supporting Group management and exercising critical review of their work. To be able to fulfill these tasks successfully, it is also my responsibility as Chairman to enable an open and meaningful dialogue between the Board and Group management. Relevant and timely information from Group management is very important as it forms the best possible basis for the Board’s discussions and resolutions. The Board’s work is constantly evaluated and improved to allow the Board to fulfill its duties successfully. I believe that Ericsson’s continuous focus on corporate governance matters, ethical business and open and meaningful dialogue within the organization promote sustainable business. I believe that this, in turn, generates value for Ericsson’s shareholders. Leif Johansson Chairman of the Board of Directors This Corporate Governance Report is rendered as a separate report added to the Annual Report in accordance with the Annual Accounts Act ((SFS 1995:1554) Chapter 6, Sections 6 and 8) and the Swedish Corporate Governance Code. The report has been reviewed by Ericsson’s auditor in accordance with the Annual Accounts Act. ERICSSON ANNUAL REPORT ON FORM 20-F 2012 REGULATION AND COMPLIANCE External rules As a Swedish public limited liability company with securities quoted on NASDAQ OMX Stockholm as well as on NASDAQ New York, Ericsson is subject to a variety of rules that affect its governance. Major external rules include: The Swedish Companies Act The Rule Book for issuers of NASDAQ OMX Stockholm The Swedish Corporate Governance Code (the “Code”) NASDAQ Stock Market Rules, including applicable NASDAQ New York corporate governance requirements (subject to certain exemptions principally reflecting mandatory Swedish legal requirements) Applicable requirements of the US Securities and Exchange Commission (the “SEC”). Internal rules In addition, to ensure compliance with legal and regulatory requirements and the high ethical standards that we set for ourselves, Ericsson has adopted internal rules that include: A Code of Business Ethics Group Steering Documents, including Group policies and directives, instructions and business processes for approval, control and risk management A Code of Conduct, to be applied in the product development, production, supply and support of Ericsson products and services worldwide. The work procedure for the Board of Directors also includes internal corporate governance rules. Compliance with the Swedish Corporate Governance Code The Code has been applied by Ericsson since 2005. Ericsson is committed to complying with best-practice corporate governance on a global level wherever possible. This includes continued compliance with the Code. Ericsson has not deviated from any of the rules of the Code. The Code can be found on the website of the Swedish Corporate Governance Board which administrates the Code: www.corporategovernanceboard.se. Compliance with applicable stock exchange rules There has been no infringement of applicable stock exchange rules and no breach of good practice on the securities market reported by the stock exchange’s disciplinary committee or the Swedish Securities Council. Code of Business Ethics Ericsson’s Code of Business Ethics sets out how the Group works to achieve and maintain high ethical standards. It summarizes the Group’s basic policies and directives and underpins the importance of ethical conduct in all business activities. The Code of Business Ethics has been translated into 30 languages. This ensures that it is accessible to all employees. During recruitment, employees acknowledge that they are aware of the principles of the Code of ERICSSON ANNUAL REPORT ON FORM 20-F 2012 Business Ethics. This procedure is repeated at regular intervals throughout the term of employment. Through this process, Ericsson strives to raise awareness and to ensure that the business is run with integrity so that Ericsson can maintain credibility with customers, partners, employees, shareholders and other stakeholders. During 2012, the Code of Business Ethics was reviewed and updated and acknowledged by employees throughout the global organization. In addition, Ericsson’s whistleblower procedure was extended to a greater scope. All employees have an individual responsibility to ensure that business practices adhere to the Code of Business Ethics.
GOVERNANCE STRUCTURE Shareholders may exercise their decision-making rights in the Company at General Meetings of shareholders. A Nomination Committee is appointed by the major shareholders in accordance with the Instruction for the Nomination Committee adopted by the Annual General Meeting of shareholders. The tasks of the Nomination Committee include the proposal of an external auditor and the proposal of Board members for election by the Annual General Meeting of shareholders. In addition to the Directors elected by shareholders, the Board of Directors consists of employee representatives appointed by the unions. The Board of Directors is ultimately responsible for the organization of Ericsson and the management of its operations. The President and CEO, appointed by the Board of Directors, is responsible for handling the day-to-day management of Ericsson in accordance with instructions from the Board. The President and CEO is supported by the Executive Leadership Team (ELT). The external auditor of Ericsson is elected by the General Meeting of shareholders. SUSTAINABILITY, CORPORATE RESPONSIBILITY AND CORPORATE GOVERNANCE Sustainability and Corporate Responsibility (CR) are important parts of Ericsson’s corporate governance framework. For Ericsson, sustainability is about long-term social equity, economic prosperity and environmental performance. CR is about maintaining the necessary controls to minimize risks, while creating positive business impacts for Ericsson’s stakeholders and brand, by linking products, services and solutions to an overall business goal of sustainable growth, ensuring that Ericsson is a trusted partner to its stakeholders. Ericsson’s Sustainability and CR strategy is integrated in the Group’s yearly strategy process and implemented in the business units and the regions. The strategy process is further described on pages 204 and 205. CR risks are also included in Ericsson’s risk management framework. ERICSSON ANNUAL REPORT ON FORM 20-F 2012 During 2012, Ericsson’s continued focus on sustainability and CR matters was reflected through a number of corporate governance activities within the organization: Effective October 2012, Ericsson’s Head of Sustainability and Corporate Responsibility reports directly to the President and CEO. This repositioning of the Sustainability and CR unit within the organization was made to better integrate the sustainability and CR work with the company’s business operations, decision-making, culture and ways of working and to help build sustainable value creation for Ericsson. Ericsson’s Code of Business Ethics was reviewed and updated and now includes a commitment to the new UN Guiding Principles on Business and Human Rights. Also, Ericsson’s whistleblower procedure was extended to a wider scope in terms of incidents covered by the procedure and with respect to who can report violations. The updated Code was confirmed by employees throughout the global organization. The Sales Compliance Board was further strengthened and formalized to assess and manage human rights and CR risks.
SHAREHOLDERS Ownership structure As of December 31, 2012, Telefonaktiebolaget LM Ericsson (the “Parent Company”) had 551,719 shareholders (according to the share register kept by Euroclear Sweden AB). Swedish institutions hold approximately 58% of the votes. The largest shareholders are Investor AB, holding 21.37% of the votes, and AB Industrivärden, holding 19.81% of the votes (together with Svenska Handelsbankens Pensionsstiftelse and Pensionskassan SHB Försäkringsförening). A significant number of the shares held by foreign investors are nominee-registered, i.e. held off-record by banks, brokers and/or nominees. This means that the actual shareholder is not displayed in the share register or included in the shareholding statistics. ERICSSON ANNUAL REPORT ON FORM 20-F 2012 More information on Ericsson’s shareholders can be found in the chapter “Share Information” in the Annual Report.
CONTACT THE BOARD OF DIRECTORS Telefonaktiebolaget LM Ericsson The Board of Directors Secretariat SE-164 83 Stockholm Sweden boardsecretariat@ericsson.com Shares and voting rights The share capital of the Parent Company consists of two classes of listed shares: A and B shares. Each Class A share carries one vote and each Class B share carries one tenth of one vote. Class A and B shares entitle the holder to the same proportion of assets and earnings and carry equal rights to dividends. The Parent Company may also issue Class C shares in order to create treasury stock to finance and hedge long-term variable remuneration programs resolved by the General Meeting of shareholders. Class C shares are converted into Class B shares before they are used for long-term variable remuneration programs. The members of the Board of Directors and the Executive Leadership Team have the same voting rights on shares as other shareholders. GENERAL MEETINGS OF SHAREHOLDERS Decision-making at General Meetings The decision-making rights of Ericsson’s shareholders are exercised at General Meetings of shareholders. Most resolutions at General Meetings are passed by a simple majority. However, the Swedish Companies Act requires qualified majorities in certain cases, for example in case of: Amendment of the Articles of Association ERICSSON ANNUAL REPORT ON FORM 20-F 2012 Resolution to transfer own shares to employees participating in long-term variable remuneration programs. The Annual General Meeting of shareholders The Annual General Meeting of shareholders (AGM) is held in Stockholm. The date and venue for the meeting is announced on the Ericsson website no later than at the time of release of the third-quarter interim financial report. Shareholders who cannot participate in person may be represented by proxy. Only shareholders registered in the share register have voting rights. Nominee-registered shareholders who wish to vote may request to be entered into the share register by the record date for the AGM. The AGM is held in Swedish and is simultaneously interpreted into English. All documentation provided by the Company is available in both Swedish and English. The AGM gives shareholders the opportunity to raise questions relating to the operations of the Group. Ericsson always strives to ensure that the members of the Board of Directors and the Executive Leadership Team are present to answer such questions. Shareholders and other interested parties may also correspond in writing with the Company at any time. The external auditor is always present at the AGM. Ericsson’s Annual General Meeting 2012 Including shareholders represented by proxy, 3,224 shareholders were represented at the AGM held on May 3, 2012, representing approximately 70% of the votes. The meeting was also attended by members of the Board of Directors, members of the Executive Leadership Team (ELT) and the external auditor. Decisions of the AGM 2012 included: Payment of a dividend of SEK 2.50 per share Re-election of Leif Johansson as Chairman of the Board of Directors Re-election of members of the Board of Directors: Roxanne S. Austin, Sir Peter L. Bonfield, Börje Ekholm, Ulf J. Johansson, Sverker Martin-Löf, Nancy McKinstry, Anders Nyrén, Hans Vestberg, Michelangelo Volpi and Jacob Wallenberg Election of Alexander Izosimov as a new member of the Board of Directors Board of Directors’ fees: Chairman: SEK 3,750,000 (unchanged) Other non-employed Board members: SEK 875,000 each (previously SEK 825,000) Chairman of the Audit Committee: SEK 350,000 (unchanged) Other non-employed members of the Audit Committee: SEK 250,000 each (unchanged) Chairmen of the Finance and Remuneration Committees: SEK 200,000 each (unchanged) Other non-employed members of the Finance and Remuneration Committees: SEK 175,000 each (unchanged) ERICSSON ANNUAL REPORT ON FORM 20-F 2012 Approval for part of the Directors’ fees to be paid in the form of synthetic shares Approval of Guidelines for remuneration to Group Management Implementation of a Long-Term Variable Remuneration Program 2012, including a share issue of and authorization to the Board to buy back 31,700,000 shares for the program Approval of the Instruction for the Nomination Committee, including among other things, a procedure on how to appoint the members of the Nomination Committee, to apply until the General Meeting of shareholders resolves otherwise. The minutes of the AGM 2012 are available at Ericsson’s website. ANNUAL GENERAL MEETING 2013 Ericsson’s AGM 2013 will take place on April 9, 2013 at Kistamässan in Kista, Stockholm. Shareholders who wish to have a matter addressed at the AGM should submit their written request to the Board in due time before the AGM. Further information is available on Ericsson’s website. CONTACT THE NOMINATION COMMITTEE Telefonaktiebolaget LM Ericsson The Nomination Committee c/o General Counsel’s Office SE-164 83 Stockholm Sweden nomination.committee@ericsson.com NOMINATION COMMITTEE A Nomination Committee was elected by the AGM for the first time in 2001. Since then, each AGM has appointed a Nomination Committee, or resolved on the procedure for appointing the Nomination Committee. The AGM 2012 resolved on an Instruction for the Nomination Committee, including the tasks of the Nomination Committee and the procedure for appointing the members of the Nomination Committee. The Instruction for the Nomination Committee shall apply until the General Meeting of shareholders resolves otherwise. Under the instruction, the Nomination Committee shall consist of: Representatives of the four largest shareholders by voting power by the end of the month in which the AGM was held The Chairman of the Board of Directors. As described in the Instruction for the Nomination Committee, the Committee may include additional members following a request by a shareholder. The request must be justified by changes in the shareholder’s ownership of shares and be received by the Nomination Committee no later than December 31. No fees are paid to the members of the Nomination Committee. Members of the Nomination Committee In addition to the Chairman of the Board of Directors, Leif Johansson, the current Nomination Committee consists of four representatives appointed by the four shareholders with the largest voting power as of May 31, 2012: Petra Hedengran (Investor AB), Chairman of the Nomination Committee ERICSSON ANNUAL REPORT ON FORM 20-F 2012 Carl-Olof By (AB Industrivärden, Svenska Handelsbankens Pensionsstiftelse) Johan Held (AFA Försäkring) Marianne Nilsson (Swedbank Robur Fonder). The tasks of the Nomination Committee Over the years, the tasks of the Nomination Committee have evolved to comply with the requirements of the Code. The main task of the Committee remains to propose Board members for election by the AGM. In doing this, the Committee must not only orientate itself on the Company’s strategy and future challenges to be able to assess the competence and experience that is required by the Board; it must also consider all applicable rules on independence of the Board of Directors and its committees. In addition, the Committee prepares remuneration proposals, for resolution by the AGM, to non-employed Directors elected by the AGM and to the auditor. The assignment of the Nomination Committee further includes proposing auditors, whereby candidates are selected in cooperation with the Audit Committee of the Board. The Committee also proposes a candidate for election of the Chairman at the AGM. Work of the Nomination Committee for the AGM 2013 The Nomination Committee started its work by going through a checklist of all its duties according to the Code and the Instruction for the Nomination Committee, resolved by the AGM. The Committee also set a time plan for its work ahead. A thorough understanding of Ericsson’s business is paramount to the role of the members of the Committee. Therefore, the President and CEO was invited to, together with the Chairman of the Board, present their views on the Company’s position and strategy. The Committee was thoroughly informed of the results of the evaluation of the Board’s work and procedures, including the performance of the Chairman of the Board. On this basis, the Committee was able to assess the competence and experience required by Board members. When proposing Board members, the Nomination Committee considered a number of things, including necessary experience and competence as well as the value of diversity and renewal and the improvement of gender balance. The Committee also acquainted itself with the assessments made by the Company and the Audit Committee on the quality and efficiency of external auditor work, and received recommendations on external auditor and audit fees. As of March 5, 2013 the Nomination Committee has held six meetings. PROPOSALS TO THE NOMINATION COMMITTEE Shareholders may submit proposals to the Nomination Committee at any time, but should do so in due time before the AGM to ensure that the proposals can be considered by the Committee. Further information is available on Ericsson’s website. BOARD OF DIRECTORS The Board of Directors is ultimately responsible for the organization of Ericsson and the management of Ericsson’s operations. The Board of Directors develops guidelines and instructions for day-to-day operations, managed by the President and CEO. The President and CEO ensures that the Board is updated regularly on events of importance to the Group. This includes updates on business development, results, financial position and the liquidity of the Group. ERICSSON ANNUAL REPORT ON FORM 20-F 2012 According to the Articles of Association, the Board of Directors shall consist of no less than five and no more than 12 directors, with no more than six deputies. In addition, under Swedish law, trade unions have the right to appoint three directors and their deputies to the Board. Directors serve from the close of one AGM to the close of the next, but can serve any number of consecutive terms. The President and CEO may be elected director of the Board, but, under the Swedish Companies Act, the President of a public company may not be elected Chairman of the Board. Conflicts of interest Ericsson maintains rules and regulations regarding conflicts of interest. Directors are disqualified from participating in any decision regarding agreements between themselves and Ericsson. The same applies to agreements between Ericsson and any third party or legal entity in which the Board member has an interest. The Audit Committee has implemented a procedure on related-party transactions and a pre-approval process for non-audit services carried out by the external auditor. Composition of the Board of Directors The Board of Directors consists of 12 Directors, including the Chairman of the Board, elected by the shareholders at the AGM 2012 for the period until the close of the AGM 2013. It also consists of three employee representatives, each with a deputy, appointed by the trade unions for the same period of time. The President and CEO, Hans Vestberg, is the only Board member who was also a member of Ericsson’s management during 2012. Work procedure Pursuant to the Swedish Companies Act, the Board of Directors has adopted a work procedure that outlines rules for the distribution of tasks between the Board and its Committees as well as between the Board, its Committees and the President and CEO. This complements the regulations in the Swedish Companies Act and in the Articles of Association of the Company. The work procedure is reviewed, evaluated and adopted by the Board as required and at least once a year. Independence The Board of Directors and its Committees are subject to a variety of independence rules under applicable Swedish law, the Code and applicable US securities laws, SEC rules and the NASDAQ Stock Market Rules. However, Ericsson can rely on exemptions from certain US requirements. The composition of the Board of Directors meets all applicable independence criteria. The Nomination Committee concluded before the AGM 2012 that, for purposes of the Code, at least seven of the nominated Directors were independent of Ericsson, its senior management and its major shareholders. These were Roxanne S. Austin, Sir Peter L. Bonfield, Alexander Izosimov, Leif Johansson, Ulf J. Johansson, Nancy McKinstry and Michelangelo Volpi. Structure of the work of the Board of Directors The work of the Board follows a yearly cycle. This enables the Board to appropriately address each of its duties and to keep strategy, risk assessment and value creation high on the agenda. ERICSSON ANNUAL REPORT ON FORM 20-F 2012 The yearly cycle starts with the statutory Board meeting which is held in connection with the AGM. At this meeting, members of each of the three Board Committees are appointed and the Board resolves on signatory power. First interim report meeting At the next ordinary meeting (depending on the date of the AGM), the Board handles the interim financial report for the first quarter of the year. Various strategic issues are addressed at most of the Board meetings. In accordance with the annual cycle for the strategy process, a main strategy Board meeting is also held, which is in essence dedicated to short- and long-term strategies of the Group. Following the Board’s input on and approval of the overall strategy, the strategy is cascaded throughout the entire organization, starting at the Global Leadership Summit with Ericsson’s top 250 leaders. Second interim report meeting At the second interim report meeting, the Board handles the interim financial report for the second quarter of the year. Follow-up strategy and risk management meeting Following the summer, a meeting is held to address particular strategy matters in further detail and to finally confirm the Group strategy. The meeting also addresses the overall risk management of the Group. Third interim report meeting A Board meeting is held to handle the interim financial report for the third quarter of the year. At this meeting, the results of the Board evaluation are presented to and discussed by the Board. Budget and financial outlook meeting A meeting is held for the Board to address the budget and financial outlook as well as further analysis of internal and external risks. Fourth-quarter and full-year financial results meeting Following the end of the calendar year, the Board holds a meeting which focuses on the financial results of the entire year and handles the fourth-quarter financial report. The Annual Report meeting closes the yearly cycle of work of the Board of Directors. At this meeting the Board approves the Annual Report. As the Board is responsible for financial oversight, financial information is presented and evaluated at each Board meeting. Furthermore, each Board meeting generally includes reports on Committee work by the Chairman of each Committee. In addition, minutes from Committee meetings are distributed to all Directors prior to the Board meeting. ERICSSON ANNUAL REPORT ON FORM 20-F 2012 At every Board meeting, the President and CEO reports on business and market developments as well as on the financial performance of the Company. Strategic issues and risks are also addressed at most Board meetings. The Board is regularly informed of developments in legal and regulatory matters of importance. The Board’s annual work cycle The annual cycle applied to the Board’s work allows the Board to appropriately address its duties during the year. It also facilitates for the organization to align its global processes to allow appropriate Board involvement. This is particularly relevant for the Group’s strategy process and risk management.
Auditor involvement The Board meets with Ericsson’s external auditor in closed sessions at least once a year to receive and consider the auditor’s observations. The auditor reports to management on the accounting and financial reporting practices of the Group. The Audit Committee also meets with the auditor to receive and consider observations on the interim reports and the Annual Report. The auditor has been instructed to report on whether the accounts, the management of funds and the general financial position of the Group are under control in all material respects. In addition, the Board reviews and assesses the process for financial reporting, as described later in “Internal control over financial reporting 2012”. Combined with internal controls, the Board’s and the auditor’s review of interim and annual reports are deemed to give reasonable assurance on the quality of financial reporting. Training of the Board of Directors All new Directors receive comprehensive training tailored to their individual needs. Introductory training typically includes meetings with the heads of the business units and Group functions, as well as training arranged by NASDAQ OMX Stockholm on listing issues and insider rules. In addition, full-day training sessions are held twice a year for all Directors. These sessions enhance the Directors’ knowledge of specific operations and issues as appropriate to ensure that the Board has knowledge and understanding of the forefront of technical development and of the business activities of the Group. As a rule, the Board receives Sustainability and Corporate Responsibility training at least once a year. ERICSSON ANNUAL REPORT ON FORM 20-F 2012 Key focus areas in Board training in 2012 were: Technology leadership, including market development, competitor overview, Ericsson Research long-term view and ways of working. Ericsson’s strategic forecast, including purpose, process, roles and methodology forecast. Work of the Board of Directors in 2012 In 2012, 12 Board meetings were held. For attendance at Board meetings, see the table on page 195. Among the matters addressed by the Board this year (apart from regular matters in the annual Board work cycle) were: A number of acquisitions, including BelAir Networks, Technicolor’s broadcast services division, ConceptWave and increased ownership in Ericsson-LG. Entry to the US bond market through issuing a ten-year US bond. Loan agreements with the European Investment Bank (EIB) and the Nordic Investment Bank (NIB). Strong focus on risk management, strategy and the competitive market development, as well as on sustainability and corporate responsibility matters. A number of divestments, including the divestment of the Multimedia brokering platform (IPX) and EDA 1500 GPON assets. Continued focus on the effects of general financial uncertainty on the market, including the effects of political unrest in the Middle East and Africa and financial uncertainty in Europe. Continuous work relating to strategic plans for the joint venture ST-Ericsson. Board work evaluation A key objective of the Board evaluation is to ensure that the Board is functioning well. This includes gaining an understanding of the issues that the Board thinks warrant greater focus, as well as determining areas where additional competence is needed within the Board. The evaluation also serves as guidance for the work of the Nomination Committee. Each year, the Chairman of the Board initiates and leads the evaluation of the Board and Committee work and procedures. Evaluation tools include detailed questionnaires and discussions. In 2012, all the Directors responded to written questionnaires, covering the Director’s individual performance, Board work in general, Committee work and the Chairman’s performance. The Chairman was not involved in the development or compilation of the questionnaire which related to his performance, nor was he present when his performance was evaluated. The evaluations were thoroughly discussed and an action plan was developed in order to further improve the work of the Board. COMMITTEES OF THE BOARD OF DIRECTORS The Board of Directors has established three Committees: the Audit Committee, the Finance Committee and the Remuneration Committee. Members of each Committee are appointed for one year amongst the Board members. The task of the Committees is mainly to prepare matters for final resolution by the Board. However, the Board has authorized each Committee to determine certain issues in limited areas. It may also on occasion provide extended authorization for the Committees to determine specific matters. ERICSSON ANNUAL REPORT ON FORM 20-F 2012 If deemed appropriate, the Board of Directors and each Committee have the right to engage external expertise, either in general or with respect to specific matters.
Prior to the Board meetings, each Committee submits to the Board minutes from Committee meetings. The Chairman of the Committee also reports on the Committee work at each Board meeting. Audit Committee On behalf of the Board, the Audit Committee monitors the following: The scope and correctness of the financial statements Compliance with legal and regulatory requirements Internal control over financial reporting The effectiveness and appropriateness of the Group’s anti-corruption program. The Audit Committee also reviews the annual and interim financial reports and oversees the external audit process, including audit fees. This involves: Reviewing, with management and the external auditor, the financial statements (including their conformity with generally accepted accounting principles) Reviewing, with management, the reasonableness of significant estimates and judgments made in preparing the financial statements, as well as the quality of the disclosures in the financial statements Reviewing matters arising from reviews and audits performed. The Audit Committee itself does not perform audit work. Ericsson has an internal audit function which reports directly to the Audit Committee. The Committee is also involved in the preparatory work of proposing auditor for election by the AGM. It also monitors Group transactions and the ongoing performance and independence of the auditor with the aim to avoid conflicts of interest. ERICSSON ANNUAL REPORT ON FORM 20-F 2012 In order to ensure the auditor’s independence, the Audit Committee has established pre-approval policies and procedures for non-audit related services to be performed by the external auditor. Pre-approval authority may not be delegated to management. The Audit Committee also oversees: The process for reviewing transactions with related parties The whistleblower procedure for the reporting of alleged violations of the Code of Business Ethics that (i) are conducted by Group or local management, and (ii) relate to corruption, questionable accounting or auditing matters or otherwise seriously affect vital interests of the Group or personal health and safety. The whistleblower procedure was updated and extended during 2012 in connection with the review and update of the Code of Business Ethics. Violations reported through the whistleblower procedure are investigated by Ericsson’s internal audit function together with the relevant Group function. Information regarding any incident is reported to the Audit Committee. Reports include measures taken, details of the responsible Group function and the status of any investigation.
Members of the Audit Committee The Audit Committee consists of five Board members appointed by the Board. In 2012, the Audit Committee comprised Ulf J. Johansson (Chairman of the Committee), Roxanne S. Austin, Sir Peter L. Bonfield, Kristina Davidsson and Sverker Martin-Löf. The composition of the Audit Committee meets all applicable independence requirements. The Board of Directors has determined that each of Ulf J. Johansson, Roxanne S. Austin, Sir Peter L. Bonfield and Sverker Martin-Löf is an audit committee financial expert, as defined under the SEC rules. Each of them is independent under applicable US securities laws, SEC rules and NASDAQ Stock Market Rules and each of them is financially literate and familiar with the accounting practices of an international company, such as Ericsson. Former authorized public accountant Peter Markborn was previously appointed as an external expert advisor to assist and advise the Audit Committee. He left this assignment during 2012. Work of the Audit Committee in 2012 The Audit Committee held six meetings in 2012. Directors’ attendance is reflected in the table on page 195. During the year, the Audit Committee reviewed the scope and results of external financial audits and the independence of the external auditor. It also monitored the external audit fees and approved non-audit services performed by the external auditor in accordance with the Committee’s pre-approval policies and procedures. ERICSSON ANNUAL REPORT ON FORM 20-F 2012 The Committee approved the annual audit plan for the internal audit function and reviewed its reports. Prior to publishing it, the Committee also reviewed and discussed each interim report with the external auditor. The Committee monitored the continued compliance with the Sarbanes-Oxley Act as well as the internal control and risk management process. It also reviewed certain related-party transactions in accordance with its established process. The Committee reviewed and evaluated the effectiveness and appropriateness of the Group’s anti-corruption program. Finance Committee The Finance Committee is primarily responsible for: Handling matters related to acquisitions and divestments Handling capital contributions to companies inside and outside the Ericsson Group Raising loans, issuing guarantees and similar undertakings, and approving financial support to customers and suppliers Continuously monitoring the Group’s financial risk exposure. The Finance Committee is authorized to determine matters such as: Direct or indirect financing Granting of securities and guarantees Certain investments, divestments and financial commitments. Members of the Finance Committee The Finance Committee consists of four Board members appointed by the Board. In 2012, the Finance Committee comprised: Leif Johansson (Chairman of the Committee), Pehr Claesson, Anders Nyrén and Jacob Wallenberg. Work of the Finance Committee in 2012 The Finance Committee held seven meetings in 2012. Directors’ attendance is reflected in the table on page 195. During the year, the Finance Committee approved numerous customer finance credit arrangements and reviewed a number of potential mergers and acquisitions and real estate investments from a financial perspective. As a result of the uncertainty on the financial markets and the macroeconomic development, the Finance Committee has focused particularly on discussing and securing an adequate capital structure, cash flow and cash-generating ability. It has also continuously monitored Ericsson’s financial position and credit exposure. Remuneration Committee The Remuneration Committee’s main responsibility is to prepare for resolution by the Board of Directors matters regarding salary and other remuneration, including pension benefits of the President and CEO, the Executive Vice Presidents and other officers who report directly to the President and CEO. Responsibilities include: Reviewing and preparing for resolution by the Board, proposals on salary and other remuneration, including retirement compensation, for the President and CEO ERICSSON ANNUAL REPORT ON FORM 20-F 2012 Reviewing and preparing for resolution by the Board, proposals to the AGM on guidelines for remuneration to the ELT Approving proposals on salary and other remuneration, including retirement compensation, for the Executive Vice Presidents and other CEO direct reports Reviewing and preparing for resolution by the Board, proposals to the AGM on LTV and similar equity arrangements. Consideration is given to trends in remuneration, legislative changes, disclosure rules and the general global environment surrounding executive remuneration. The Committee reviews salary survey data before approving any salary adjustment for CEO direct reports. In addition, the Committee prepares salary adjustments for the President and CEO for resolution by the Board. Members of the Remuneration Committee The Remuneration Committee consists of four Board members appointed by the Board. In 2012, the Remuneration Committee comprised: Leif Johansson (Chairman of the Committee), Börje Ekholm, Nancy McKinstry and Karin Åberg. Piia Pilv has been appointed by the Remuneration Committee as an independent expert advisor to assist the Committee, particularly regarding international trends and developments. Work of the Remuneration Committee in 2012 The Remuneration Committee held six meetings in 2012. Directors’ attendance is reflected in the table on page 195. The Committee reviewed and prepared a proposal for the LTV 2012 for resolution by the Board. This was approved by the AGM 2012. The Committee further resolved on salaries and Short-Term Variable remuneration (STV) for 2012 for CEO direct reports. It prepared remuneration to the President and CEO, for resolution by the Board. The Committee also prepared guidelines for remuneration to the ELT, which were subsequently referred by the Board to the AGM for approval. Towards the end of the year, the Committee concluded its analysis of the current LTV structure and executive remuneration. The resulting proposals on LTV and guidelines for remuneration to the ELT will be referred to the AGM 2013 for resolution. For further information on fixed and variable remuneration, please see Notes to the consolidated financial statements—Note C28 “Information regarding members of the Board of Directors, the Group management and employees” and the “Remuneration Report” included in the Annual Report. ERICSSON ANNUAL REPORT ON FORM 20-F 2012 Directors’ attendance and fees 2012 | | | | | | | | | | | | | | | | | | | | | | | | | | | | Fees resolved by the
AGM 2012 | | | Number of Board/Committee
meetings attended | | Board member | | Board
fees1) | | | Committee
fees | | | Board | | | Audit
Committee | | | Finance
Committee | | | Remuneration
Committee | | Leif Johansson | | | 3,750,000 | | | | 400,000 | | | | 12 | | | | | | | | 7 | | | | 6 | | Sverker Martin-Löf | | | 875,000 | | | | 250,000 | | | | 12 | | | | 6 | | | | | | | | | | Jacob Wallenberg | | | 875,000 | | | | 175,000 | | | | 12 | | | | | | | | 5 | | | | | | Roxanne S. Austin | | | 875,000 | | | | 250,000 | | | | 11 | | | | 6 | | | | | | | | | | Sir Peter L. Bonfield | | | 875,000 | | | | 250,000 | | | | 12 | | | | 6 | | | | | | | | | | Börje Ekholm | | | 875,000 | | | | 175,000 | | | | 12 | | | | | | | | | | | | 6 | | Alexander Izosimov2) | | | 875,000 | | | | | | | | 8 | | | | | | | | | | | | | | Ulf J. Johansson | | | 875,000 | | | | 350,000 | | | | 12 | | | | 6 | | | | | | | | | | Nancy McKinstry | | | 875,000 | | | | 175,000 | | | | 11 | | | | | | | | | | | | 6 | | Anders Nyrén | | | 875,000 | | | | 175,000 | | | | 12 | | | | | | | | 7 | | | | | | Carl-Henric Svanberg3) | | | — | | | | | | | | 4 | | | | | | | | | | | | | | Hans Vestberg | | | — | | | | | | | | 12 | | | | | | | | | | | | | | Michelangelo Volpi | | | 875,000 | | | | | | | | 10 | | | | | | | | | | | | | | Pehr Claesson | | | 18,000 | 7) | | | | | | | 12 | | | | | | | | 7 | | | | | | Jan Hedlund4) | | | 6,000 | 7) | | | | | | | 4 | | | | 3 | | | | | | | | | | Karin Åberg | | | 18,000 | 7) | | | | | | | 12 | | | | | | | | | | | | 6 | | Kristina Davidsson5) | | | 18,000 | 7) | | | | | | | 12 | | | | 3 | | | | | | | | | | Rickard Fredriksson6) | | | 10,500 | 7) | | | | | | | 7 | | | | | | | | | | | | | | Karin Lennartsson | | | 18,000 | 7) | | | | | | | 12 | | | | | | | | | | | | | | Roger Svensson | | | 18,000 | 7) | | | | | | | 12 | | | | | | | | | | | | | | | | | | | | | | | | | | | | | | | | | | | | | | | Total number of meetings | | | | | | | | | | | 12 | | | | 6 | | | | 7 | | | | 6 | | | | | | | | | | | | | | | | | | | | | | | | | | |
| 1) | Non-employed Directors can choose to receive part of their Board fee (exclusive of Committee fees) in the form of synthetic shares. |
| 2) | Elected Board member as of May 3, 2012. |
| 3) | Resigned as Board member as of May 3, 2012. |
| 4) | Resigned as employee representative and from the Audit Committee as of May 3, 2012. |
| 5) | Member of the Audit Committee since May 3, 2012. |
| 6) | Appointed deputy employee representative as of May 3, 2012. |
| 7) | Employee representative Board members and their deputies are not entitled to a Board fee but compensation in the amount of SEK 1,500 per attended Board meeting. |
REMUNERATION TO BOARD MEMBERS Remuneration to Board members not employed by the Company is proposed by the Nomination Committee for resolution by the AGM. The AGM 2012 approved the Nomination Committee’s proposal for fees to the non-employed Board members for Board and Committee work. For information on Board of Directors’ fees 2012, please refer to Notes to the consolidated financial statements—Note C28 “Information regarding members of the Board of Directors, the Group management and employees” in the Annual Report. The AGM 2012 also approved the Nomination Committee’s proposal that Board members may be paid part of their Board fee in the form of synthetic shares. A synthetic share gives the right to receive a future cash payment of an amount which corresponds to the market value of a Class B share in Ericsson at the time of payment. The director’s right to receive payment with regard to allocated synthetic shares occurs, as a main rule, after the publication of the Company’s year-end ERICSSON ANNUAL REPORT ON FORM 20-F 2012 financial statement during the fifth year following the General Meeting which resolved on the allocation of the synthetic shares. The purpose of paying part of the Board of Directors’ fee in the form of synthetic shares is to further align the Directors’ interest with shareholder interest. For more information on the terms and conditions of the synthetic shares, please refer to the notice convening the AGM 2012 and to the minutes from the AGM 2012, which are available at Ericsson’s website. MEMBERS OF THE BOARD OF DIRECTORS Board members elected by the AGM 2012 Leif Johansson(first elected 2011) Chairman of the Board of Directors, Chairman of the Remuneration Committee and of the Finance Committee Born 1951. Master of Science in Engineering, Chalmers University of Technology, Gothenburg, Sweden. Board Chairman: Astra Zeneca PLC, European Round Table of Industrialists and the International Advisory Board of the Nobel Foundation. Board Member: Svenska Cellulosa Aktiebolaget SCA and Ecolean AB. Holdings in Ericsson1): 17,933 Class B shares. Principal work experience and other information: President of the Royal Swedish Academy of Engineering Sciences. President and CEO of AB Volvo 1997-2011. Executive Vice President of AB Electrolux 1988-1991, President 1991-1994 and President and CEO of AB Electrolux 1994-1997. Holds honorary Doctorates at Blekinge Institute of Technology, the University of Gothenburg and Chalmers University of Technology. Awarded the Large Gold Medal of the Royal Swedish Academy of Engineering Sciences in 2011. Sverker Martin-Löf(first elected 1993) Deputy Chairman of the Board of Directors, Member of the Audit Committee Born 1943. Doctor of Technology and Master of Engineering, KTH Royal Institute of Technology, Stockholm, Sweden. Board Chairman: Svenska Cellulosa Aktiebolaget SCA, SSAB and AB Industrivärden. Board Member: Skanska AB and Svenska Handelsbanken AB. Holdings in Ericsson1): 10,400 Class B shares. Principal work experience and other information: President and CEO of Svenska Cellulosa Aktiebolaget SCA 1990–2002, where he was employed 1977–1983 and 1986–2002. Previous positions at Sunds Defibrator and Mo och Domsjö AB. Jacob Wallenberg(first elected 2011) Deputy Chairman of the Board of Directors, Member of the Finance Committee Born 1956. Bachelor of Science in Economics and Master of Business Administration, Wharton School, University of Pennsylvania, USA. Officer of the Reserve, Swedish Navy. Board Chairman:Investor AB. Deputy Board Chairman: SAS AB and SEB Skandinaviska Enskilda Banken AB (SEB). | 1) | The number of shares reflects ownership as of December 31, 2012 and includes holdings by related natural and legal persons, as well as holdings of any ADS, if applicable. |
ERICSSON ANNUAL REPORT ON FORM 20-F 2012 Board member:ABB Ltd, The Coca-Cola Company, The Knut and Alice Wallenberg Foundation and Stockholm School of Economics. Holdings in Ericsson1): 2,413 Class B shares. Principal work experience and other information: Chairman of the Board of Investor AB since 2005. Extensive experience in banking and finance, including experience from the commercial banks JP Morgan, New York and SEB. Appointed President and CEO of SEB in 1997 and appointed Chairman of SEB’s Board of Directors in 1998. Executive Vice President and CFO of Investor AB 1990-1993. Honorary Chairman of IBLAC (Mayor of Shanghai’s International Business Leaders Advisory Council) and member of The European Round Table of Industrialists. Roxanne S. Austin(first elected 2008) Member of the Audit Committee Born 1961. Bachelor of Business Administration in Accounting, University of Texas, San Antonio, USA. Board Member: Abbott Laboratories, Teledyne Technologies Inc. and Target Corporation. Holdings in Ericsson1): 3,000 Class B shares. Principal work experience and other information: President of Austin Investment Advisors since 2004. President and CEO of Move Networks Inc. 2009–2010. President and COO of DirecTV 2001–2003. Corporate Senior Vice President and CFO of Hughes Electronics Corporation 1997–2000, which she joined in 1993. Previously a partner at Deloitte & Touche. Member of the California State Society of Certified Public Accountants and the American Institute of Certified Public Accountants. Sir Peter L. Bonfield(first elected 2002) Member of the Audit Committee Born 1944. Honors degree in Engineering, Loughborough University, Leicestershire, UK. Board Chairman: NXP Semiconductors N.V. Board Member: Mentor Graphics Inc., Sony Corporation and Taiwan Semiconductor Manufacturing Company, Ltd. Holdings in Ericsson1): 4,400 Class B shares. Principal work experience and other information: CEO and Chairman of the Executive Committee of British Telecommunications plc 1996–2002. Chairman and CEO of ICL plc 1985–1996. Positions with STC plc and Texas Instruments Inc. Member of the Advisory Boards of New Venture Partners LLP, the Longreach Group and Apax Partners LLP. Board Mentor of CMi. Senior Advisor, Rothschild, London. Chair of Council and Senior Pro-Chancellor, Loughborough University, UK. Fellow of the Royal Academy of Engineering. Börje Ekholm(first elected 2006) Member of the Remuneration Committee Born 1963. Master of Science in Electrical Engineering, KTH Royal Institute of Technology, Stockholm, Sweden. Master of Business Administration, INSEAD, France. | 1) | The number of shares reflects ownership as of December 31, 2012 and includes holdings by related natural and legal persons, as well as holdings of any ADS, if applicable. |
ERICSSON ANNUAL REPORT ON FORM 20-F 2012 Board Chairman: KTH Royal Institute of Technology, Stockholm and Nasdaq OMX Group Inc. Board Member: Investor AB, AB Chalmersinvest, EQT Partners AB and Husqvarna AB. Holdings in Ericsson1): 30,760 Class B shares. Principal work experience and other information: President and CEO of Investor AB since 2005. Formerly Head of Investor Growth Capital Inc. and New Investments. Previous positions at Novare Kapital AB and McKinsey & Co Inc. Alexander Izosimov(first elected 2012) Born 1964. Master of Business Administration, INSEAD, France and Master of Science in Production Management Systems and Computer Science, Moscow Aviation Institute, Russian Federation. Board Member: East Capital AB, Modern Times Group MTG AB, EVRAZ Group S.A., Dynasty Foundation, Transcom WorldWide SA and International Chamber of Commerce (ICC). Holdings in Ericsson1): 1,600 Class B shares. Principal work experience and other information: CEO and President of VimpelCom 2003-2011. Previous positions with Mars Inc., including Member of the Global Executive Board and Regional President for CIS, Central Europe and Nordics. Earlier positions with McKinsey & Co as consultant in the Stockholm and London offices. Served as GSMA Board member 2005-2008 and Chairman of GSMA 2008-2010. Ulf J. Johansson(first elected 2005) Chairman of the Audit Committee Born 1945. Doctor of Technology and Master of Science in Electrical Engineering, KTH Royal Institute of Technology, Stockholm, Sweden. Board Chairman: Acando AB, Eurostep Group AB, Novo A/S, Novo Nordisk Foundation and Trimble Navigation Ltd. Board Member: European Institute of Innovation and Technology. Holdings in Ericsson1): 6,435 Class B shares. Principal work experience and other information: Founder of Europolitan Vodafone AB, where he was the Chairman of the Board 1990–2005. Previous positions at Spectra-Physics AB as President and CEO and at Ericsson Radio Systems AB. Member of the Royal Academy of Engineering Sciences. Nancy McKinstry(first elected 2004) Member of the Remuneration Committee Born 1959. Master of Business Administration in Finance and Marketing, Columbia University, USA. Bachelor of Arts in Economics, University of Rhode Island, USA. Board Chairman: CEO and Chairman of the Executive Board of Wolters Kluwer n.v. Board Member: Abbott Laboratories and Sanoma Corporation. | 1) | The number of shares reflects ownership as of December 31, 2012 and includes holdings by related natural and legal persons, as well as holdings of any ADS, if applicable. |
ERICSSON ANNUAL REPORT ON FORM 20-F 2012 Holdings in Ericsson1): 4,000 Class B shares. Principal work experience and other information: CEO and Chairman of the Executive Board of Wolters Kluwer n.v. President and CEO of CCH Legal Information Services 1996–1999. Previous positions at Booz, Allen & Hamilton and New England Telephone Company. Member of the Advisory Board of the University of Rhode Island, the Advisory Council of the Amsterdam Institute of Finance, the Board of Overseers of Columbia Business School and the Advisory Board of the Harrington School of Communication and Media. Anders Nyrén(first elected 2006) Member of the Finance Committee Born 1954. Graduate of Stockholm School of Economics, Sweden, Master of Business Administration from Anderson School of Management, UCLA, USA. Board Chairman: Sandvik AB. Deputy Board Chairman: Svenska Handelsbanken AB. Board Member: Svenska Cellulosa Aktiebolaget SCA, AB Industrivärden, SSAB, AB Volvo, Ernströmgruppen and Stockholm School of Economics. Holdings in Ericsson1): 6,686 Class B shares. Principal work experience and other information: President and CEO of Industrivärden since 2001. CFO and Executive Vice President of Skanska AB 1997–2001. Director Capital Markets of Nordbanken 1996–1997. CFO and EVP of Securum AB 1992–1996. Managing Director of OM International AB 1987–1992. Earlier positions at STC Scandinavian Trading Co AB and AB Wilhelm Becker. Hans Vestberg(first elected 2010) Born 1965. Bachelor of Business Administration and Economics, University of Uppsala, Sweden. Board Chairman: ST-Ericsson and Svenska Handbollförbundet. Board Member: Thernlunds AB. Holdings in Ericsson1): 149,382 Class B shares. Principal work experience and other information: President and CEO of Telefonaktiebolaget LM Ericsson since January 1, 2010. Previously, First Executive Vice President, CFO and Head of Group Function Finance and Executive Vice President and Head of Business Unit Global Services. Various positions in the Group since 1988, including Vice President and Head of Market Unit Mexico and Head of Finance and Control in USA, Brazil and Chile. International advisor to the Governor of Guangdong, China and co-chairman of the Russian-Swedish Business Council. Founding member of the Broadband Commission for Digital Development, and heading the Commission’s climate change working group. Member of the European Cloud Partnership Steering Board and the Leadership Council of the United Nations Sustainable Development Solutions Network. | 1) | The number of shares reflects ownership as of December 31, 2012 and includes holdings by related natural and legal persons, as well as holdings of any ADS, if applicable. |
ERICSSON ANNUAL REPORT ON FORM 20-F 2012 Michelangelo Volpi(first elected 2010) Born 1966. Bachelor of Science in Mechanical Engineering and Masters in Manufacturing Systems Engineering from Stanford University, USA. MBA from the Stanford Graduate School of Business, USA. Board Member: EXOR S.p.A. Holdings in Ericsson1): None. Principal work experience and other information: Partner at Index Ventures since July 2009. Previously CEO of Joost Inc. Various positions in Cisco from 1994-2007, including Senior Vice President and General Manager of the Routing and Service Provider Technology Group and Chief Strategy Officer. Has also worked for Hewlett Packard in the optoelectronics division. Board members and deputies appointed by the unions Pehr Claesson(first appointed 2008) Employee representative, Member of the Finance Committee Born 1966. Appointed by the union The Swedish Association of Graduate Engineers. Holdings in Ericsson1): 999 Class B shares. Employed since 1997. Working with marketing and communication for Consulting and Systems Integration within Business Unit Global Services. Kristina Davidsson(first appointed 2006) Employee representative, Member of the Audit Committee Born 1955. Appointed by the union IF Metall. Holdings in Ericsson1): 1,629 Class B shares. Employed since 1995. Previously working as repairer within Business Unit Networks and currently working full time as union representative. Karin Åberg(first appointed 2007) Employee representative, Member of the Remuneration Committee Born 1959. Appointed by the union Unionen. Holdings in Ericsson1): 2,751 Class B shares. Employed since 1995. Working as a Service Engineer within the IT organization. Rickard Fredriksson(first appointed 2012) Deputy employee representative Born 1969. Appointed by the union IF Metall. Holdings in Ericsson1): 799 Class B shares. Employed since 2000. Previously working as machine operator within Business Unit Networks and currently working full time as union representative. | 1) | The number of shares reflects ownership as of December 31, 2012 and includes holdings by related natural and legal persons, as well as holdings of any ADS, if applicable. |
ERICSSON ANNUAL REPORT ON FORM 20-F 2012 Karin Lennartsson(first appointed 2010) Deputy employee representative Born 1957. Appointed by the union Unionen. Holdings in Ericsson1): 493 Class B shares. Employed since 1976. Working as Process Expert within Group Function Finance—Process Management. Roger Svensson(first appointed 2011) Deputy employee representative Born 1971. Appointed by the union The Swedish Association of Graduate Engineers. Holdings in Ericsson1): 7,710 Class B shares. Employed since 1999. Working as Senior Specialist Test Strategy Power Amplifier within Business Unit Networks. Hans Vestberg was the only Director who held an operational management position at Ericsson in 2012. No Director has been elected pursuant to an arrangement or understanding with any major shareholder, customer, supplier or other person. At the Annual General Meeting 2012, Alexander Izosimov was elected new member of the Board of Directors, replacing Carl-Henric Svanberg. Jan Hedlund resigned as employee representative of the Board of Directors as of the date of the Annual General Meeting 2012 and Kristina Davidsson (previously deputy employee representative) was appointed employee representative as of the same date. Rickard Fredriksson was appointed new deputy employee representative as of the date of the Annual General Meeting 2012. MANAGEMENT The President/CEO and the Executive Leadership Team The Board of Directors appoints the President and CEO and the Executive Vice Presidents. The President and CEO is responsible for the management of day-to-day operations and is supported by the Executive Leadership Team (the “ELT”). During 2012, the ELT consisted of the President and CEO, the heads of Group functions, the heads of business units and the heads of two of Ericsson’s regions. The role of the ELT is to: Establish a strong corporate culture, a long-term vision and Group strategies and policies, all based on objectives stated by the Board Determine targets for operational units, allocate resources and monitor unit performance Secure operational excellence and realize global synergies through efficient organization of the Group. Remuneration to the Executive Leadership Team Guidelines for remuneration to the ELT were approved by the AGM 2012. For further information on fixed and variable remuneration, see the Remuneration report and Notes to the consolidated financial statements—Note C28, “Information regarding members of the Board of Directors, the Group management and employees” in the Annual Report. | 1) | The number of shares reflects ownership as of December 31, 2012 and includes holdings by related natural and legal persons, as well as holdings of any ADS, if applicable. |
ERICSSON ANNUAL REPORT ON FORM 20-F 2012 The Ericsson Group Management System Ericsson has a global management system, the Ericsson Group Management System (EGMS) to drive corporate culture and to ensure that the business is managed: To fulfill the objectives of Ericsson’s major stakeholders (customers, shareholders, employees) Within established risk limits and with reliable internal control In compliance with relevant applicable laws, listing requirements, governance codes and corporate social responsibilities. The EGMS is founded on ISO 9001 (International Standard for Quality management system) but is designed as a dynamic governance system, enabling Ericsson to adapt the system to evolving demands and expectations, including new legislation as well as customers’ and other stakeholders’ requirements. The management system is an important foundation and is continuously evaluated and improved. Certificates are evidence from an independent body verifying that the operations fulfill defined requirements. As the EGMS is a global system, group-wide certificates can be issued by a third party certification body proving that the system is efficient throughout the whole organization. Ericsson is currently globally certified to ISO 9001 (Quality), ISO 14001 (Environment) and OHSAS 18001 (Health & Safety). Selected Ericsson units are also certified to additional standards, for example ISO 27001 (Information Security) and TL 9000 (telecom-specific standard). The EGMS comprises three elements: Ericsson business processes Organization and resources.
ERICSSON ANNUAL REPORT ON FORM 20-F 2012 Management and control Ericsson’s strategy and target setting processes consider the demands and expectations of customers as well as other key stakeholders. The process facilitates the alignment of objectives and their measurement in activities at all levels of the organization. Ericsson uses balanced scorecards as tools for translating strategic objectives into a set of performance indicators for its operational units. Based on annual strategy work, these scorecards are updated with targets for each unit for the next year and are communicated throughout the organization. Group-wide policies and directives govern how the organization works and are core elements in managing and controlling Ericsson. The Group Policies and Directives include a Code of Business Ethics, a Code of Conduct and accounting and reporting directives to fulfill external reporting requirements and the Sarbanes-Oxley Act. The Group Steering Documents Committee works to ensure that the policies and directives cover relevant issues; that they are aligned and consistent with Group strategies, values and structures; and that they are not in conflict with legal and regulatory requirements. In addition, the Group Steering Documents Committee works to ensure that the said strategies, values and structures are implemented by the responsible function. Ericsson business processes As a market leader, Ericsson utilizes the competitive advantages that are gained through global scale and has implemented common processes and IT tools across all operational units worldwide. Customer requirements are identified, clarified and formalized in Ericsson Business Processes where requirements transform from theory to reality. Through management and continuous improvement of processes and IT tools, Ericsson attempts to reduce costs with efficient and effective process flows and with standardized internal controls and performance indicators. Organization and resources Ericsson is operated in two dimensions: one operational structure and one legal structure. The operational structure aligns accountability and authority regardless of country borders and supports the process flow with cross-country operations. During 2012 there were four business units and ten regions. Group functions coordinate Ericsson’s strategies, operations and resource allocation and define the necessary directives, processes and organization for the effective governance of the Group. The legal structure is the basis for legal requirements and responsibility as well as for tax and statutory reporting purposes. There are more than 200 legal entities within the Ericsson Group with representation (via legal entities, branch and representative offices) in more than 140 countries. Risk management Ericsson’s risk management is integrated with the business and its operational processes, and is a part of the EGMS to ensure accountability, effectiveness, efficiency, business continuity and compliance with corporate governance, legal and other requirements. The Board of Directors is also actively engaged in the Company’s risk management. Risks related to set long-term objectives are discussed and strategies are formally approved by the Board as part of the annual strategy process. Risks related to annual targets for the Company are also reviewed by the Board and then monitored continuously during the year. Certain transactional risks require specific Board approval, e.g. acquisitions, management remuneration, borrowing or customer finance in excess of pre-defined limits. ERICSSON ANNUAL REPORT ON FORM 20-F 2012 Strategic and tactical risks Strategic risks constitute the highest risk to the Company if not managed properly as they could have a long-term impact. Ericsson therefore reviews its long-term objectives, main strategies and business scope on an annual basis and continuously works on its tactics to reach these objectives and to mitigate any risks identified. In the annual strategy and target setting process, objectives are set for the next three to five years. Risks and opportunities are assessed and strategies are developed to achieve the objectives. The strategy process in the Company is well established and involves regions, business units and Group functions. The strategy is finally summarized and discussed in a yearly Global Leadership Summit with approximately 250 leaders from all parts of the business. By involving all parts of the business in the process, potential risks are identified early and mitigating actions can be incorporated in the strategy and in the annual target process following the finalization of the strategy. Technology development, industry and market fundamentals and the development of the economy are key components in the evaluation of risks related to Ericsson’s long-term objectives. The outcome from the strategy process forms the basis for the annual target process, which involves regions, business units and Group functions. Risks and opportunities linked to the targets are identified as part of this process together with actions to mitigate the identified risks. Follow-up of targets, risks and mitigating actions are reported and discussed continuously in business unit and region steering groups and are reviewed by the Board of Directors. Ericsson continuously strives to improve its risk management and believes that it is important that the entire global organization takes part in the risk management and strategy work. Therefore, risk management was given a stronger focus in 2012. During the year, an enhanced risk management framework was implemented and aligned with the Strategy and Target setting process. Risks were identified and analyzed in four categories: industry & market risks, commercial risks, operational risks and compliance risks. For more information on risks related to Ericsson’s business, see the chapter “Risk factors” in the Annual Report. Strategic, target setting and risk management cycle The annual strategic, target setting and risk management cycle is part of Ericsson’s strategy process, which is well established within the Group and involves regions, business units and Group functions.
ERICSSON ANNUAL REPORT ON FORM 20-F 2012 Operational and financial risks Operational risks are owned and managed by operational units. Risk management is embedded in various process controls, such as decision tollgates and approvals. Certain cross-process risks are centrally coordinated, such as information security, IT security, corporate responsibility and business continuity and insurable risks. Financial risk management is governed by a Group policy and carried out by the Treasury and Customer Finance functions, both supervised by the Finance Committee. The policy governs risk exposures related to foreign exchange, liquidity/financing, interest rates, credit risk and market price risk in equity instruments. For further information on financial risk management, see Notes to the consolidated financial statements—Note C14, “Trade receivables and customer finance”, Note C19, “Interest-bearing liabilities” and Note C20, “Financial risk management and financial instruments” in the Annual Report. Compliance risks Ericsson has implemented Group policies and directives in order to comply with applicable laws and regulations, including a Code of Business Ethics and a Code of Conduct. Risk management is integrated in the Company’s business processes. Policies and controls are implemented to comply with financial reporting standards and stock market regulations, such as the US Sarbanes-Oxley Act. Compliance officer Ericsson has a Chief Compliance Officer (CCO) whose responsibilities include providing support for compliance with laws, regulations, internal policies and directives, coordinating the different strands of expertise within Ericsson. Attention from senior-management level on compliance matters is crucial, as is ensuring that this is addressed from a cross-functional perspective. Initially, the CCO’s primary focus has been to further develop Ericsson’s Anti-corruption Compliance Program. This is reviewed and evaluated by the Audit Committee at least annually. Monitoring and audits Company management monitors compliance with policies, directives and processes through internal self-assessment within all units. This is complemented by internal and external audits. External financial audits are performed by PricewaterhouseCoopers, and ISO/ management system audits by Intertek. Internal audits are performed by the company’s internal audit function which reports to the Audit Committee. Audits of suppliers are also conducted in order to secure compliance with Ericsson’s Code of Conduct, which is mandatory for suppliers to the Ericsson Group. Risk mitigation Significant ongoing activities in order to mitigate risks include: Establishing flexibility to cost-effectively accommodate to fluctuations in customer demand Conducting regular Supplier Code of Conduct audits Continuous assessment and management of CR risks Conducting business continuity management in an efficient way Conducting corporate governance training as needed Continuous monitoring of information systems to guard against data breaches Reviewing top risks and mitigating actions at various internal governance meetings. ERICSSON ANNUAL REPORT ON FORM 20-F 2012
Example of risk heat map document Risk heat maps are generated by business units, regions and Group functions in four risk categories:
MEMBERS OF THE EXECUTIVE LEADERSHIP TEAM Hans Vestberg President and CEO (since 2010) Born 1965. Bachelor of Business Administration and Economics, University of Uppsala, Sweden. Board Chairman: ST-Ericsson and Svenska Handbollförbundet. ERICSSON ANNUAL REPORT ON FORM 20-F 2012 Board member: Telefonaktiebolaget LM Ericsson and Thernlunds AB. Holdings in Ericsson1): 149,382 Class B shares. Background: Previously First Executive Vice President, CFO and Head of Group Function Finance and Executive Vice President and Head of Business Unit Global Services. Various positions in the Group since 1988, including Vice President and Head of Market Unit Mexico and Head of Finance and Control in USA, Brazil and Chile. International advisor to the Governor of Guangdong, China and co-chairman of the Russian-Swedish Business Council. Founding member of the Broadband Commission for Digital Development, and heading the Commission’s broadband and climate change working group. Member of the European Cloud Partnership Steering Board and the Leadership Council of the United Nations Sustainable Development Solutions Network. Jan Frykhammar Executive Vice President and Chief Financial Officer and Head of Group Function Finance (since 2009) Born 1965. Bachelor of Business Administration and Economics, University of Uppsala, Sweden. Board member: ST-Ericsson and the Swedish International Chamber of Commerce. Holdings in Ericsson1): 14,844 Class B shares. Background: Previously Senior Vice President and Head of Business Unit Global Services. Various positions within Ericsson including Sales and Business Control in Business Unit Global Services, CFO in North America and Vice President, Finance and Commercial within the Global Customer Account Vodafone. Magnus Mandersson Executive Vice President (since 2011) and Head of Business Unit Global Services (since 2010) Born 1959. Bachelor of Business Administration, University of Lund, Sweden. Board member: None. Holdings in Ericsson1): 22,602 Class B shares. Background: Previously Head of Business Unit CDMA, Market Unit Northern Europe, Global Customer Account Deutsche Telekom AG and Product Area Managed Services. Has also been President and CEO of SEC/ Tele2 Europe and COO of Millicom International Cellular S.A. Johan Wibergh Executive Vice President (since 2010) and Head of Business Unit Networks (since 2008) Born 1963. Master of Computer Science, Linköping Institute of Technology, Sweden. | 1) | The number of shares reflects ownership as of December 31, 2012 and includes holdings by related natural and legal persons, as well as holdings of any ADS, if applicable. |
ERICSSON ANNUAL REPORT ON FORM 20-F 2012 Board member: ST-Ericsson, Confederation of Swedish Enterprise, KTH Royal Institute of Technology and Teknikföretagen. Holdings in Ericsson1): 40,448 Class B shares. Background: President of Ericsson Brazil, President of Market Unit Nordic and Baltics and Vice President and Head of Sales at Business Unit Global Services. Per Borgklint Senior Vice President and Head of Business Unit Support Solutions (since 2011) Born 1972. Master of Science in Business Administration, Jönköping International Business School, Sweden. Board member:None. Holdings in Ericsson1): None. Background: Previously CEO of Net1 (Ice.net), Canal Plus Nordic and Versatel. Has also held several leading positions at Tele2. Bina Chaurasia Senior Vice President, Chief Human Resources Officer and Head of Group Function Human Resources and Organization (since 2010) Born 1962. Master of Science in Management and Human Resources, Ohio State University, USA, and Master of Arts in Philosophy, University of Wisconsin, USA. Holdings in Ericsson1): 19,144 Class B shares. Background: Joined Ericsson from Hewlett Packard, where she was Vice President of Global Talent Management. Has held senior HR leadership roles at Gap, Sun Microsystems and PepsiCo/Yum. Ulf Ewaldsson Senior Vice President, Chief Technology Officer and Head of Group Function Technology(since February 1, 2012) Born 1965. Master of Science in Engineering and Business Management, Linköping Institute of Technology, Sweden. Board member: None. | 1) | The number of shares reflects ownership as of December 31, 2012 and includes holdings by related natural and legal persons, as well as holdings of any ADS, if applicable. |
ERICSSON ANNUAL REPORT ON FORM 20-F 2012 Holdings in Ericsson1): 14,985 Class B shares. Background: Previously Head of Product Area Radio within Business Unit Networks. Has held various managerial positions within Ericsson since 1990. Douglas L. Gilstrap Senior Vice President and Head of Group Function Strategy(since 2009) Born 1963. Bachelor of Science in Accounting, University of Richmond, USA, and Master of Business Administration, Emory University, Atlanta, USA. Executive program at INSEAD, France. Board member: Telecom Management Forum (TMF). Deputy board member: ST-Ericsson. Holdings in Ericsson1): 8,643 Class B shares. Background: Has held various global managerial positions within the telecommunications sector for more than 15 years. Nina Macpherson Senior Vice President, General Counsel, Head of Group Function Legal Affairs and secretary to the Board of Directors(since 2011) Born 1958. Master of Laws, LL M, University of Stockholm, Sweden. Board member: The Association for Swedish Listed Companies. Holdings in Ericsson1): 7,857 Class B shares. Background: Previously Vice President and Deputy Head of Group Function Legal Affairs at Ericsson. Previous positions also include private practice and in-house attorney. Member of the Swedish Securities Council. Helena Norrman Senior Vice President and Head of Group Function Communications(since 2011) Born 1970. Master of International Business Administration, Linköping University, Sweden. Board member: None. Holdings in Ericsson1): 8,312 Class B shares. Background: Previously Vice President, Communications Operations at Group Function Communications at Ericsson. Has held various positions within Ericsson’s global communications organization since 1998. Previous positions as communications consultant. Mats H. Olsson Head of Region North East Asia(since 2010) Born 1954. | 1) | The number of shares reflects ownership as of December 31, 2012 and includes holdings by related natural and legal persons, as well as holdings of any ADS, if applicable. |
ERICSSON ANNUAL REPORT ON FORM 20-F 2012 Master of Business Administration, Stockholm School of Economics, Sweden. Board member: None. Holdings in Ericsson1): 61,252 Class B shares. Background: International economic advisor to a number of Chinese provincial and municipal governments. Previously Head of Market Unit Greater China. Appointed President of Ericsson Greater China in 2004, with overall responsibility for mainland China, Hong Kong, Macao and Taiwan. Also assumed overall responsibility for Japan and South Korea in 2010. Has held various executive positions across Asia-Pacific over the last 25 years. Rima Qureshi Senior Vice President and Head of Business Unit CDMA Mobile Systems(since 2010) Born 1965. Bachelor of Information Systems and Master of Business Administration, McGill University, Montreal, Canada. Board member: MasterCard Incorporated. Holdings in Ericsson1): 4,932 Class B shares. Background: Also serves as Head of Ericsson Response. Previously Vice President of Strategic Improvement Program and Vice President Product Area Customer Support. Has held various positions within Ericsson since 1993. Angel Ruiz Head of Region North America(since 2010) Born 1956. Bachelor of Electrical Engineering, University of Central Florida, USA, and Master of Management Science and Information Systems, Johns Hopkins University, USA. Board member: CTIA. Holdings in Ericsson1): 38,546 Class B shares. Background: Joined Ericsson in 1990 and has held a variety of technical, sales and managerial positions within the Company, including heading up the global account teams for Cingular/SBC/BellSouth (now AT&T). Was appointed President of Ericsson North America in 2001. Jan Wäreby Senior Vice President and Head of Sales and Marketing(since 2011) Born 1956. Master of Science, Chalmers University, Gothenburg, Sweden. Board member: ST-Ericsson. | 1) | The number of shares reflects ownership as of December 31, 2012 and includes holdings by related natural and legal persons, as well as holdings of any ADS, if applicable. |
ERICSSON ANNUAL REPORT ON FORM 20-F 2012 Holdings in Ericsson1): 66,495 Class B shares. Background: Senior Vice President and Head of Business Unit Multimedia and Executive Vice President and Head of Sales and Marketing for Sony Ericsson Mobile Communications. Up until January 31, 2012, Håkan Eriksson, former Senior Vice President, Chief Technology Officer and Head of Group Function Technology & Portfolio Management, was a member of the Executive Leadership Team. AUDITOR According to the Articles of Association, the Parent Company shall have no less than one and no more than three registered public accounting firms as external independent auditor. Pursuant to the Swedish Companies Act, the mandate period of an auditor shall be one year, unless the Articles of Association provide for a longer mandate period up to four years. The auditor reports to the shareholders at General Meetings. The duties of the auditor include the following: Updating the Board of Directors regarding the planning, scope and content of the annual audit Examining the interim and year-end financial statements to assess accuracy and completeness of the accounts and adherence to accounting standards and policies Advising the Board of Directors of non-audit services performed, the consideration paid and other issues that determine the auditor’s independence. For further information on the contacts between the Board and the auditor, please see “Work of the Board of Directors” earlier in this Corporate Governance Report. All Ericsson’s quarterly financial reports are reviewed by the auditor. Current auditor PricewaterhouseCoopers AB was elected auditor at the AGM 2012 for a period of one year, i.e. until the close of the AGM 2013. PricewaterhouseCoopers AB has appointed Peter Nyllinge, Authorized Public Accountant, to serve as auditor in charge. Fees to the auditor Ericsson paid the fees (including expenses) for audit-related and other services listed in the table in Notes to the consolidated financial statements—Note C30, “Fees to auditors” in the Annual Report. INTERNAL CONTROL OVER FINANCIAL REPORTING 2012 This section has been prepared in accordance with the Annual Accounts Act and the Swedish Corporate Governance Code and is limited to internal control over financial reporting. Since Ericsson is listed in the United States, the requirements outlined in the Sarbanes-Oxley Act (SOX) apply. These regulate the establishment and maintenance of internal controls over financial reporting as well as management’s assessment of the effectiveness of the controls. In order to support high quality reporting and to meet the requirement of SOX, the Company has implemented detailed documented controls and testing and reporting procedures based on the internationally established COSO framework for internal control. The COSO framework is issued by the Committee of Sponsoring Organizations of the Treadway Commission (COSO). ERICSSON ANNUAL REPORT ON FORM 20-F 2012 Management’s internal control report according to SOX is included in this Annual Report on Form 20-F and filed with the SEC in the United States. During 2012, the Company has included operations of acquired entities as well as continued to improve the design and execution of its financial reporting controls. Disclosure policies Ericsson’s financial disclosure policies aim to ensure transparent, relevant and consistent communication with equity and debt investors on a fair and equal basis. This will support a fair market value for Ericsson securities. Ericsson wants current and potential investors to have a good understanding of how the Company works, including operational performance, prospects and potential risks. To achieve these objectives, financial reporting and disclosure must be: Transparent—enhancing understanding of the economic drivers and operational performance of the business, building trust and credibility Consistent—comparable in scope and level of detail to facilitate comparison between reporting periods Simple—to support understanding of business operations and performance and to avoid misinterpretations Relevant—with focus on what is relevant to Ericsson’s stakeholders or required by regulation or listing agreements, to avoid information overload Timely—with regular scheduled disclosures as well as ad-hoc information, such as press releases on important events, performed in a timely manner Fair and equal—where all material information is published via press releases to ensure that the whole investor community receives the information at the same time Complete, free from material errors and a reflection of best practice—disclosure is compliant with applicable financial reporting standards and listing requirements and in line with industry norms. Ericsson’s website comprises comprehensive information on the Group, including: An archive of annual and interim reports On-demand access to recent news Copies of presentations given by senior management at industry conferences. Disclosure controls and procedures Ericsson has controls and procedures in place to allow for timely information disclosure under applicable laws and regulations, including the US Securities Exchange Act of 1934, and under agreements with NASDAQ OMX Stockholm and NASDAQ New York. These procedures also require that such information is provided to management, including the CEO and CFO, so timely decisions can be made regarding required disclosure. The Disclosure Committee comprises members with various expertise. It assists managers in fulfilling their responsibility regarding disclosures made to the shareholders and the investment community. One of the main tasks of the committee is to monitor the integrity and effectiveness of the disclosure controls and procedures. Ericsson has investments in certain entities that the Company does not control or manage. With respect to such entities, disclosure controls and procedures are substantially more limited than those maintained with respect to subsidiaries. ERICSSON ANNUAL REPORT ON FORM 20-F 2012 During the year, Ericsson’s President and CEO and the CFO evaluated the disclosure controls and procedures and concluded that they were effective at a reasonable assurance level as at December 31, 2012. Internal control over financial reporting Ericsson has integrated risk management and internal control into its business processes. As defined in the COSO framework, internal control is an aggregation of components such as a control environment, risk assessment, control activities, information and communication and monitoring. During the period covered by the Annual Report 2012, there were no changes to the internal control over financial reporting that have materially affected, or are likely to materially affect, the internal control over financial reporting. Control environment The Company’s internal control structure is based on the division of tasks between the Board of Directors and its Committees and the President and CEO. The Company has implemented a management system that is based on: Steering documents, such as policies, directives and a Code of Business Ethics A strong corporate culture The Company’s organization and mode of operations, with well-defined roles and responsibilities and delegations of authority Several well-defined Group-wide processes for planning, operations and support. The most essential parts of the control environment relative to financial reporting are included in steering documents and processes for accounting and financial reporting. These steering documents are updated regularly to include, among other things: Financial reporting standards and listing requirements, such as IFRS and SOX. The processes include specific controls to be performed to ensure high quality financial reports. The management of each reporting legal entity, region and business unit is supported by a financial controller function with execution of controls related to transactions and reporting. The financial controller functions are organized in a number of Company Control Hubs, each supporting a number of legal entities within a geographical area. A financial controller function is also established on Group level, reporting to the CFO. Risk assessment Risks of material misstatements in financial reporting may exist in relation to recognition and measurement of assets, liabilities, revenue and cost or insufficient disclosure. Other risks related to financial reporting include fraud, loss or embezzlement of assets and undue favorable treatment of counterparties at the expense of the Company. Policies and directives regarding accounting and financial reporting cover areas of particular significance to support correct, complete and timely accounting, reporting and disclosure. Identified types of risks are mitigated through well-defined business processes with integrated risk management activities, segregation of duties and appropriate delegation of authority. This requires specific approval of material transactions and ensures adequate asset management. ERICSSON ANNUAL REPORT ON FORM 20-F 2012 Control activities The Company’s business processes include financial controls regarding the approval and accounting of business transactions. The financial closing and reporting process has controls regarding recognition, measurement and disclosure. These include the application of critical accounting policies and estimates, in individual subsidiaries as well as in the consolidated accounts. Regular analyses of the financial results for each subsidiary, region and business unit cover the significant elements of assets, liabilities, revenues, costs and cash flow. Together with further analysis of the consolidated financial statements performed at Group level, these procedures are designed to produce financial reports without material errors. For external financial reporting purposes, the Disclosure Committee performs additional control procedures to review whether the disclosure requirements are fulfilled. The Company has implemented controls to ensure that financial reports are prepared in accordance with its internal accounting and reporting policies and IFRS as well as with relevant listing regulations. It maintains detailed documentation on internal controls related to accounting and financial reporting. It also keeps records on the monitoring of the execution and results of such controls. This allows the President and CEO and the CFO to assess the effectiveness of the controls in a way that is compliant with SOX. Entity-wide controls, focusing on the control environment and compliance with financial reporting policies and directives, are implemented in all subsidiaries. Detailed process controls and documentation of controls performed are also implemented in almost all subsidiaries, covering the items with significant materiality and risk. In order to secure compliance, governance and risk management in the areas of legal entity accounting and taxation, as well as securing funding and equity levels, the Company operates through a Company Control hub structure, covering subsidiaries in each respective geographical area. Based on a common IT platform, a common chart of account and common master data, the hubs and shared services centers perform accounting and financial reporting services for most subsidiaries. Information and communication The Company’s information and communication channels support complete, correct and timely financial reporting by making all relevant internal process instructions and policies accessible to all the employees concerned. Regular updates and briefing documents regarding changes in accounting policies, reporting and disclosure requirements are also supplied. Subsidiaries and operating units prepare regular financial and management reports for internal steering groups and Company management. These include analysis and comments on financial performance and risks. The Board of Directors receives financial reports monthly. Ericsson has established a whistleblower procedure for the reporting of alleged violations that (i) are conducted by Group or local management, and (ii) relate to corruption, questionable accounting or auditing matters or otherwise seriously affect vital interests of the Group or personal health and safety. Monitoring The Company’s process for financial reporting is reviewed annually by the management. This forms a basis for evaluating the internal management system and internal steering documents to ensure that they cover all ERICSSON ANNUAL REPORT ON FORM 20-F 2012 significant areas related to financial reporting. The shared service center and company control hub management continuously monitors accounting quality through a set of performance indicators. Compliance with policies and directives is monitored through annual self-assessments and representation letters from heads and company controllers in all subsidiaries as well as in business units and regions. The Company’s financial performance is also reviewed at each Board meeting. The Committees of the Board fulfill important monitoring functions regarding remuneration, borrowing, investments, customer finance, cash management, financial reporting and internal control. The Audit Committee and the Board of Directors review all interim and annual financial reports before they are released to the market. The Company’s internal audit function reports directly to the Audit Committee. The Audit Committee also receives regular reports from the external auditor. The Audit Committee follows up on any actions taken to improve or modify controls. BOARD OF DIRECTORS Stockholm, March 5, 2013 Telefonaktiebolaget LM Ericsson (publ) Org. no. 556016–0680 ERICSSON ANNUAL REPORT ON FORM 20-F 2012 REMUNERATION REPORT INTRODUCTION This report outlines how the remuneration policy is implemented throughout Ericsson in line with corporate governance best practice, with specific references to Group management. The work of the Remuneration Committee in 2012 and the remuneration policy are explained, at the beginning of the report, followed by descriptions of plans and approaches. More details of the remuneration of Group management and Board members’ fees can be found in the Notes to the Consolidated financial statements—Note C28, “Information regarding members of the Board of Directors, the Group management and employees”. THE REMUNERATION COMMITTEE The Remuneration Committee advises the Board of Directors on an ongoing basis on the remuneration to the Executive Leadership Team (ELT). This includes fixed salaries, pensions, other benefits and short-term and long-term variable remuneration, all in the context of pay and employment conditions throughout Ericsson. The Remuneration Committee reviews and prepares for resolution by the Board: Proposals on salary and other remuneration, including retirement compensation, for the President and CEO Proposals on targets for the short-term variable remuneration for the President and CEO Proposals to the Annual General Meeting on guidelines for remuneration to the ELT Proposals to the Annual General Meeting on long-term variable remuneration and similar equity arrangements The responsibility for the Remuneration Committee is also to: Approve proposals on salary and other remuneration, including retirement compensation, for the Executive Vice Presidents and other ELT. Approve proposals on targets for the short-term variable remuneration for the Executive Vice Presidents and other ELT. Approve pay out of the short-term variable renumeration for the ELT, based on achievements and performance. The Remuneration Committee’s work is the foundation for the governance of Ericsson’s remuneration processes together with Ericsson’s internal systems and audit controls. The Committee is chaired by Leif Johansson and its other members are Börje Ekholm, Nancy McKinstry, and Karin Åberg. All the members are non-executive directors, independent (except for the employee representative) as required by the Swedish Corporate Governance Code and have relevant knowledge and experience of remuneration matters. The Company’s General Counsel acts as secretary to the Committee. The Chief Executive Officer, the Senior Vice President, Head of Human Resources and Organization and the Vice President, Head of Total Rewards attend the Remuneration Committee meetings by invitation and assist the Committee in its considerations, except when issues relating to their own remuneration are being discussed. The Remuneration Committee has appointed an independent expert advisor, Piia Pilv, to assist and advise the Committee. The independent advisor provided no other services to the Company during 2012. The ERICSSON ANNUAL REPORT ON FORM 20-F 2012 Remuneration Committee is also provided with national and international pay data collected from external survey providers and can call on other independent expertise, should it so require. The Chairman continues to ensure that contact is maintained, as necessary and appropriate, with principal shareholders regarding remuneration. The purpose and function of the Remuneration Committee and its responsibilities can be found on the Ericsson website. These responsibilities, together with the Guidelines for remuneration to Group Management (ELT) and the Long-Term Variable remuneration plan, are reviewed and evaluated annually in light of matters such as changes to corporate governance best practice or changes to accounting, legislation, political opinion or business practices among peers. This helps to ensure that the policy continues to provide Ericsson with a competitive remuneration strategy. The Guidelines for remuneration to Group Management are, in accordance with Swedish law, brought to shareholders annually for approval. The Remuneration Committee met six times during the year 2012. The winter meetings focused on following up on results from the 2011 variable remuneration programs and preparing proposals to shareholders for the 2012 Annual General Meeting (AGM). During the spring the committee determined remuneration to a new member of the ELT and revised the remuneration to others. In the fall, the committee reviewed the Guidelines for remuneration to Group Management and decided to continue the Long-Term Variable remuneration plans without any material changes and the Short-Term Variable remuneration plans with an increased weighting on capital and margins for 2013. The committee based its considerations on the business needs, analyses and reviews of the global market trends and feedback from shareholders and institutions. Supported by the independent advisor, the Committee also reviewed the competitiveness of the ELT remuneration in the global market. The Remuneration Committee is of the opinion that the Long-Term Variable remuneration plans fulfill the defined objectives to promote “One Ericsson” and to align the interests of employees with those of shareholders. The number of participants as of December 1, 2012 was 27,000 employees, compared to 24,000 employees as of December 1, 2011. The evaluation also confirms that the Key Contributor Retention Plan meets the purpose of retaining our key employees. The voluntary attrition rate among Key Contributors is about two-thirds compared to the attrition rate in the total number of employees. REMUNERATION POLICY Remuneration at Ericsson is based on the principles of performance, competitiveness and fairness. The remuneration policy, together with the mix of remuneration elements, is designed to reflect these principles by creating a balanced remuneration package. The Guidelines for remuneration to Group Management 2012 approved by AGM can be found in note C28. The auditor’s report regarding whether we have complied with the guidelines for compensation to the ELT during 2012 is posted on the Ericsson website. ERICSSON ANNUAL REPORT ON FORM 20-F 2012 Summaries of 2012 short- and long-term variable remuneration | | | | | | | | | What we call it | | What is it? | | What is the objective? | | Who participates? | | How is it earned? | Short-term: Remuneration delivered over 12 months or less | | | | | | | Fixed salary | | Fixed remuneration paid at set times | | Attract and retain employees, delivering part of annual remuneration in a predictable format | | All employees | | Market appropriate
levels set according
to position and
evaluated according
to individual
performance | | | | | | | Short-Term Variable remuneration (STV) | | A variable plan that is measured and paid over a single year | | Align employees with clear and relevant targets, providing an earnings opportunity in return for performance, and flexible cost | | Enrolled employees, including Executive Leadership Team. Approx. 73,900 in 2012 | | Achievements
against set targets.
Reward can increase
to up to twice the
target level and
decrease to zero,
depending on
performance | | | | | | | Local and Sales Incentive Plans | | Tailored versions of the STV | | As for STV, tailored for local or business requirements, such as sales | | Employees in sales. Approx. 2,300 in 2012 | | Similar to STV. All
plans have maximum
award and vesting
limits | | Long-term: Remuneration delivered over 3 years or more | | | | | | | Stock Purchase Plan (SPP) | | All-employee stock-based plan | | Reinforce a “One Ericsson” mentality and align employees’ interests with those of shareholders | | All employees are eligible | | Buy one share and it
will be matched by
one share after
3 years if still
employed | | | | | | | Key Contributor Retention Plan (KC) | | Share-based plan for selected individuals | | Recognize, retain and motivate key contributors for performance, critical skills and potential | | Up to 10% of employees | | If selected, get one
more matching share
in addition to the
SPP one | | | | | | | Executive Performance Stock Plan (EPSP) | | Share-based plan for senior executives | | Remuneration for long-term commitment and value creation | | Senior executives, including Executive Leadership Team | | Get up to 4, 6 or, for
CEO, 9 further
matching shares to
the SPP one for
long-term
performance |
REMUNERATION 2012 To enhance the understanding of how Ericsson translates remuneration principles and policy into practice, an internal remuneration website was launched in January 2011. The site contains e-learning and training programs targeted at line managers. It supports more informed decisions and better communication to the wider employee population. The next step in this development is the planned implementation of an Integrated HR IT tool. The first phase was launched to all managers in Ericsson in November 2012 and include performance management, talent planning, variable pay and annual salary review. ERICSSON ANNUAL REPORT ON FORM 20-F 2012 TOTAL REMUNERATION When considering the remuneration of an individual, it is the total remuneration that matters. First, the total annual cash compensation is defined, consisting of the target level of short-term variable remuneration plus fixed salary. Thereafter, target long-term variable remuneration may be added to get to the total target remuneration and, finally, pension and other benefits may be added to arrive at the total remuneration. For the ELT, remuneration consists of fixed salary, short-term and long-term variable remuneration, pension and other benefits. If the size of any one of these elements is increased or decreased when setting the remuneration, at least one other element has to change if the competitive position is to remain unchanged. The remuneration costs for the CEO and the ELT are reported in Note C28. Fixed salary When setting fixed salaries, the Remuneration Committee considers the impact on total remuneration, including pension and associated costs. The absolute levels are determined by the size and complexity of the position and the year-to-year performance of the individual. Together with other elements of remuneration, ELT salaries are subject to an annual review by the Remuneration Committee, which considers external pay data to ensure that levels of pay remain competitive and appropriate to the remuneration policy. Variable remuneration Ericsson strongly believes that, where possible, variable compensation should be encouraged as an integral part of total remuneration. First and foremost, this aligns employees with clear and relevant targets, but it also enables more flexible payroll costs and emphasizes the link between performance and pay. All variable remuneration plans have maximum award and vesting limits. Short-term variable remuneration is to a greater extent dependent on the specific unit or function, while long-term variable remuneration is dependent on the achievements of the Ericsson Group. Short-term variable remuneration Annual variable remuneration is delivered through cash-based programs. Specific business targets are derived from the annual business plan approved by the Board of Directors and, in turn, defined by the Company’s long-term strategy. Ericsson strives to grow faster than the market with best-in-class margins and strong cash conversion and therefore the starting point is to have three core targets: For the ELT, targets are thus predominantly financial at either Group level (for Heads of Group functions) or at the individual unit level (for Heads of regions or business units) and may also include operational targets like customer satisfaction and employee engagement. ERICSSON ANNUAL REPORT ON FORM 20-F 2012 The chart below illustrates how payouts to the ELT have varied with performance over the past five years.
Short-term variable remuneration structure | | | | | | | | | | | | | | | | | | | | | | | | | | | | Short-term variable remuneration
as percentage of fixed salary | | | Percentage of short-term variable
remuneration maximal opportunity | | | | | Target
level | | | Maximum
level | | | Actual paid
for 2012 | | | Group financial
targets | | | Unit/functional
financial targets | | | Non-financial
targets | | CEO 2012 | | | 40 | % | | | 80 | % | | | 32 | % | | | 90 | % | | | 0 | % | | | 10 | % | CEO 2013 | | | 40 | % | | | 80 | % | | | — | | | | 100 | % | | | 0 | % | | | 0 | % | Average ELT 20121) | | | 36 | % | | | 72 | % | | | 37 | % | | | 49 | % | | | 27 | % | | | 24 | % | Average ELT 20131) | | | 38 | % | | | 76 | % | | | — | | | | 50 | % | | | 24 | % | | | 26 | % |
| 1) | Excludes CEO—differences in target and maximum levels from year to year are due to changes in the composition of the ELT. |
The Board of Directors and the Remuneration Committee decide on all Ericsson Group targets, which are cascaded to unit-related targets throughout the Company, always subject to a two-level management approval process. The Remuneration Committee monitors the appropriateness and fairness of Group target levels throughout the performance year and has the authority to revise them should they cease to be relevant or stretching or to enhance shareholder value. During 2012, approximately 76,200 employees participated in short-term variable remuneration plans. Long-term variable remuneration Share-based long-term variable remuneration plans are submitted each year for approval by shareholders at the AGM. All long-term variable remuneration plans are designed to form part of a well-balanced total remuneration package and to span over a minimum of three years. As these are variable plans, outcomes are unknown and rewards depend on long-term personal investment, corporate performance and resulting share price performance. During 2012, share-based remuneration was made up of three different but linked plans: the all-employee Stock Purchase Plan, the Key Contributor Retention Plan and the Executive Performance Stock Plan. The Stock Purchase Plan The all-employee Stock Purchase Plan is designed to offer, where practicable, an incentive for all employees to participate, reinforcing aparticipate. This reinforces “One Ericsson” aligned with shareholder interests. Employees can save up to 7.5 7.5% of gross fixed salary (the President and CEO can save up to 10% of gross fixed salary and short-term variable remuneration) for purchase of Class B shares at market price on NASDAQ OMX Stockholm or ADSs onERICSSON ANNUAL REPORT ON FORM 20-F 20092012 percent (CEO 9 percent) of gross fixed salary for purchase of class B shares at market price on the NASDAQ OMX Stockholm or ADSs on NASDAQNew York (contribution shares) over a twelve-month period. If the contribution shares are retained by the employee for three years after the investment and employment with the Ericsson Group continues during that time, the employee’s shares will be matched with a corresponding number of classClass B shares or ADSs.ADSs, as applicable. The plan was introduced in 2002 and employees in 9471 countries participate.participated during its first year. In December 20092012, the number of participants was in excess of 18,000over 27,000, or approximately 25 percent28% of eligible employees.employees in 100 countries.
Participants save each month, beginning with the August payroll, towards quarterly investments. These investments (in November, February, May and August) are matched on the third anniversary of each such investment and hence the matching spans over two financial years and two tax years. The Key Contributor Retention Plan The Key Contributor Retention Plan is part of Ericsson’s talent management strategy andstrategy. It is designed to giverecognize individuals recognition for performance, critical skills and potential as well as to encourage retention of key employees. Under the program, operating units around the world are given quotas that total no more than 10 percentcan nominate up to 10% of employees world-wide.worldwide. Each unit nominates individuals that have been identified according to performance, critical skills and potential. The nominations are calibrated in management teams locally and are reviewed by both local and corporate Human Resources to ensure that there is a minimum of bias and a strong belief in the system. Participants selected obtain one extra matching share in addition to the one matching share for each contribution share purchased under the Stock Purchase Plan during a twelve-month programinvestment period. The plan was introduced in 2004. The Executive Performance Stock Plan The Executive Performance Stock Plan was also first introduced in 2004. The plan is designed to focus management on driving earningslong-term financial performance and to provide market competitive remuneration. Senior executives, including Group Management,the ELT, are selected to obtain up to four or six extra shares (performance matching shares). This is in addition to the one matching share for each contribution share purchased under the all employeeall-employee Stock Purchase Plan and the performancePlan. Performance matching is subject to the fulfillment of an Earnings per Share (EPS) performance target. Fortargets. Since 2010, the programs since 2006, thePresident and CEO is allowed to invest up to 9 percent of fixed salary in contribution shares and may obtain up to eightnine performance matching shares in addition to the Stock Purchase Plan matching share for each contribution share. The use of average annual EPS growth with challenging and stretchingIn the 2004 to 2010 plans, the performance targets as a performance measure has reflected Ericsson’s ongoing strategy of adding shareholder value throughwere Earnings Per Share (EPS) targets.
To support the long-term improvement of profitability. The Remuneration Committee has been satisfied that the use of an EPS performance target has been preferable to other measures, including those that reflect relative performance. However, alternative measures are being considered for future plans. The performance targets are not capable of being retested after the endstrategy and value creation of the three-yearCompany, new targets were defined for the 2011 plan. At the AGM 2012, the following targets for the 2012 Executive Performance Stock Plan were resolved on proposal by the Board:
Up to one-third of the award shall vest provided the compound annual growth rate (CAGR) of consolidated net sales between year 0 (2011 financial year) and year 3 (2014 financial year) is between 2% and 8%. Up to one-third of the award shall vest provided the compound annual growth rate (CAGR) of consolidated operating income between year 0 (2011 financial year) and year 3 (2014 financial year) is between 5% and 15%. Up to one-third of the award will be based on the cash conversion during each of the years during the performance period. Ifperiod, calculated as cash flow from operating activities divided by net income reconciled to cash. One-ninth of the minimum required performancetotal award will vest for any year, i.e. financial years 2012, 2013 and 2014, if cash conversion is not achieved, all matching shares subject to performance will lapse. The Board may also reduceat or above 70%. ERICSSON ANNUAL REPORT ON FORM 20-F 2012 Before the number of performance shares to be matched are finally determined, the Board of Directors shall examine whether the performance matching shares, if deemed appropriate,is reasonable considering the Company’s financial results and position, conditions on the stock market and other relevant circumstances, atand if not, as determined by the timeBoard of matching. The Remuneration Committee analyzesDirectors, reduce the financial results against thosenumber of competitorsperformance shares to be matched to the lower number of shares deemed appropriate by the Board of Directors. When undertaking its evaluation of performance outcomes the Board of Directors will consider, in particular, the industry. ERICSSON ANNUAL REPORT ON FORM 20-F 2009
impact of larger acquisitions, divestitures, the creation of joint ventures and any other significant capital event on the three targets on a case by case basis. REMUNERATION LEVELS AS AT THE BEGINNING OF 2009 (SEK)
| | | | | | | | | | | | | | 2009
Fixed Salary | | 2009 Target
Short-Term
Variable | | 2009 Target
Long-Term
Variable2) | | Total Target
Remuneration
20093) | | Total Target
Remuneration
2008 | CEO | | 15,750,000 | | 6,300,000 | | 7,087,500 | | 29,137,500 | | 29,137,500 | Average Group Management1) | | 3,815,272 | | 1,234,359 | | 1,144,581 | | 6,194,212 | | 6,620,636 |
2) | Excludes personal investment from net income of up to 7.5% of gross fixed salary (9% CEO). Stock Purchase Plan matching shares plus half the maximum number of matching shares under the Executive Performance Stock Plan |
3) | The cost of pensions and other benefits are shown in Note C29. Swedish vacation pay costs are shown under Salary in Note C29 |
Benefits and terms of employment Pension benefits follow the competitive practice in the employee’s home country and may contain various supplementary plans, in addition to any national system for social security. Where possible, pension plans are operated on a defined contribution basis. Under these plans, Ericsson pays contributions into a plan but does not guarantee the ultimate benefit, unless local regulations or legislation prescribe that defined benefit plans that do give such guarantees have to be offered. For the President and CEO and other members of Group Managementthe ELT employed in Sweden before 2011, a supplementary pension plan is applied in addition to the occupational pension plan for salaried staff on the Swedish labor market (ITP). The pension age is according to local practice, for Group Managementthese ELT members is normally 60 years. The pensionable salary for Group ManagementELT members employed in Sweden consistsfrom 2011 are normally covered by the defined contribution plan under the ITP1 scheme, with a pensionable age of the annual fixed salary including vacation pay and the target value of the Short-Term Variable remuneration. 65 years. For members of Group Managementthe ELT who are not employed in Sweden, similarlocal market competitive pension arrangements apply. Other benefits, such as company car and medical insurance, are also set to be competitive in the local market. Group ManagementThe ELT members may not receive loans from the Company. Group ManagementThe ELT members locally employed in Sweden have a mutual notice period of up to six months. Upon termination of employment by the Company, severance pay can amount to up to 18 monthsmonths’ fixed salary.
Total remuneration
When we consider For other ELT members, different notice period and severance pay agreements apply; however, no agreement exceeds the remunerationnotice period of an individual, it is the total remuneration that matters. We first consider the total annual cash compensation, looking at target level of short-term variable compensation plus fixed salary. We then add target long-term variable remuneration to get total target remuneration and, finally, pension and other benefits to arrive at the total package.
The remuneration costs for the CEO and Group Management are reported in Note C29 but as those numbers reflect costs recognized in the income statement rather than the remuneration offeredsix months or the amounts received, we outline in the tables above and below how the total remuneration adds up in its structure and the alternative viewpointseverance pay period of what was received during 2009. The table above shows the remuneration levels expected at the beginning of 2009 with the fixed salary level for the year and the expected value of short- and long-term variable remuneration.
The table below shows how much was received during 2009 as remuneration outcomes. This means adding the fixed salary paid; the short-term variable remuneration from the previous year which was paid out in 2009;
18 months.ERICSSON ANNUAL REPORT ON FORM 20-F 20092012 and the long-term variable remuneration outcomes from the 2002 stock option plan, and parts of the 2005 and 2006 Stock Purchase Plans (the Executive Performance Stock Plan did not vest for either program). The different tables show different aspects but illustrate, in particular, the variability of variable remuneration through the differences of costs, outcomes and expected rewards.SHARE INFORMATION
Board of DirectorsSTOCK EXCHANGE TRADING
The remuneration of Directors not employed by Ericsson is handled separately by the Nomination CommitteeClass A and approved by the Annual General Meeting of shareholders. The remuneration consists of fees for Board and committee work, part of which can be delivered under a synthetic share program. The synthetic shares, which are valued in line with Ericsson’s Class B shares vestare listed on NASDAQ OMX Stockholm. In the United States, the Class B shares are listed on NASDAQ New York in cash after the publicationform of American Depositary Shares (ADS) evidenced by American Depositary Receipts (ADR) under the year-end financial statement duringsymbol ERIC. Each ADS represents one Class B share. In 2012, approximately 2.4 (3.4) billion shares were traded on NASDAQ OMX Stockholm and about 1.1 (1.6) billion shares were traded on NASDAQ New York. A total of 3.5 (5) billion Ericsson shares where thus traded on the fifth year after award.exchanges were we are listed. Trading volume in Ericsson shares decreased by approximately 27% on NASDAQ OMX Stockholm and by approximately 30% on NASDAQ New York compared to 2011. The Ericsson share is also traded on other venues such as BATS Europe, Burgundy, Chi-X Europe. REMUNERATION OUTCOMES 2009 (SEK)The Ericsson share
| | | | | | | | | | | | | | 2009
Fixed Salary | | 2008
Short-Term
Variable2) | | 2002, 2005
and 2006
Long-Term
Variable3) | | Total
Remuneration
Received
20094) | | Total
Remuneration
Received
2008 | CEO | | 15,750,000 | | 630,000 | | 646,470 | | 17,026,470 | | 20,230,551 | Total Group Management1) | | 44,277,637 | | 16,287,601 | | 3,266,122 | | 63,831,360 | | 75,170,676 |
| | | | | Share listings | | | | | NASDAQ OMX Stockholm | | | | | NASDAQ New York | | | | | | | Share data | | | | | Total number of shares in issue | | | 3,305,051,735 | | of which Class A shares, each carrying one vote1) | | | 261,755,983 | | of which Class B shares, each carrying one tenth of one vote1) | | | 3,043,295,752 | | Ericsson treasury shares, Class B | | | 84,798,095 | | Quotient value | | | SEK 5.00 | | Market capitalization, December 31, 2012 | | | approx. SEK 215 b. | | ICB (Industry Classification Benchmark) | | | 9500 | | | | Ticker codes | | | | | NASDAQ OMX Stockholm | | | ERIC A/ERIC B | | NASDAQ New York | | | ERIC | | Bloomberg NASDAQ OMX Stockholm | | | ERICA SS/ERICB SS | | Bloomberg NASDAQ | | | ERIC US | | Reuters NASDAQ OMX Stockholm | | | ERICa.ST/ERICb.ST | | Reuters NASDAQ | | | ERIC.O | |
| 1) | Excludes CEOBoth classes of shares have the same rights of participation in the net assets and earnings. |
Changes in number of shares and capital stock 2008–2012 | | | | | | | | | | | | | | | | Number of shares | | | Share capital | | 2008 | | June 2, reverse split 1:5 | | | 3,226,451,735 | | | | 16,132,258,678 | | 2008 | | July 23, new issue (Class C shares, later converted to Class B) | | | 19,900,000 | | | | 99,500,000 | | 2008 | | December 31 | | | 3,246,351,735 | | | | 16,231,758,678 | | 2009 | | June 8, new issue (Class C shares, later converted to Class B) | | | 27,000,000 | | | | 135,000,000 | | 2009 | | December 31 | | | 3,273,351,735 | | | | 16,366,758,678 | | 2010 | | December 31 | | | 3,273,351,735 | | | | 16,366,758,678 | | 2011 | | December 31 | | | 3,273,351,735 | | | | 16,366,758,678 | | 2012 | | June 29, new issue (Class C shares, later converted to Class B)1) | | | 31,700,000 | | | | 158,500,000 | | 2012 | | December 31 | | | 3,305,051,735 | | | | 16,525,258,678 | |
ERICSSON ANNUAL REPORT ON FORM 20-F 2012 | 1) | The Annual General Meeting (AGM) 2012 resolved to issue 31.7 million Class C shares for the Long-Term Variable Remuneration Program (LTV). In accordance with an authorization from the AGM, in the second quarter 2012, the Board of Directors resolved to repurchase the new issued shares, which were subsequently converted into Class B shares. The quotient value of the repurchased shares was SEK 5.00, totaling SEK 158.5 million, representing less than one percent of capital stock, and the acquisition cost was approximately SEK 158.7 million. |
Share performance indicators | | | | | | | | | | | | | | | | | | | | | | | | 2012 | | | 2011 | | | 2010 | | | 2009 | | | 2008 | | Earnings per share, diluted (SEK)1) | | | 1.78 | | | | 3.77 | | | | 3.46 | | | | 1.14 | | | | 3.52 | | Earnings per share, diluted non-IFRS (SEK)2) | | | 2.74 | | | | 4.72 | | | | 4.80 | | | | 2.87 | | | | 4.24 | | Operating income per share (SEK)3)4) | | | 3.25 | | | | 5.58 | | | | 7.42 | | | | 5.80 | | | | 7.50 | | Stockholders’ equity per share, basic, end of period (SEK)5) | | | 42.51 | | | | 44.57 | | | | 45.34 | | | | 43.79 | | | | 44.21 | | P/E ratio | | | 36 | | | | 19 | | | | 22 | | | | 57 | | | | 17 | | Total shareholder return (%) | | | –3 | | | | –7 | | | | 22 | | | | 15 | | | | –20 | | Dividend per share (SEK)6) | | | 2.75 | | | | 2.50 | | | | 2.25 | | | | 2.00 | | | | 1.85 | |
| 1) | Calculated on average number of shares outstanding, diluted. |
| 2) | The STV payouts for 2009, paid in 2010, were 6,226,920 for the CEOEPS, diluted, excluding amortizations and 15,137,637 for the restwrite-downs of Group Managementacquired intangible assets, SEK. |
| 3) | The CEO did not participate in the 2002 stock option plan. The 2005 and 2006 Long-Term Variable remuneration consistsCalculated on average number of vesting from the 2005 and 2006 Stock Purchase Plans only as the 2005 and 2006 Executive Performance Stock Plans did not vestshares outstanding, basic. |
| 4) | The costFor 2010, 2009 and 2008 excluding restructuring charges. |
| 5) | Calculated on number of pensions and other benefits are shown in Note C29. Swedish vacation pay costs are shown under Salary in Note C29shares, end of period. |
| 6) | For 2012 as proposed by the Board of Directors. |
For definitions of the financial terms used, see Glossary, Financial Terminology and Exchange Rates. SHARE TREND In 2012, Ericsson’s total market capitalization decreased by about 7% to SEK 215 billion, compared to a decrease by 10% reaching SEK 230 billion in 2011. The OMX Stockholm Index on NASDAQ OMX Stockholm increased by 12% and the NASDAQ composite index increased by 16%. The S&P 500 Index increased by 13%. 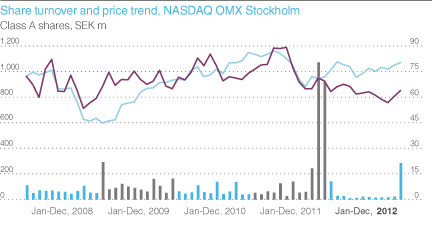
ERICSSON ANNUAL REPORT ON FORM 20-F 2012 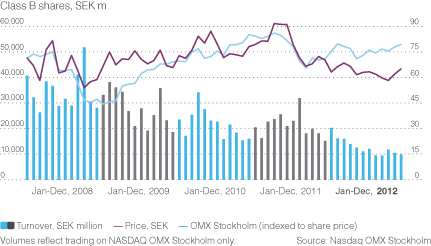
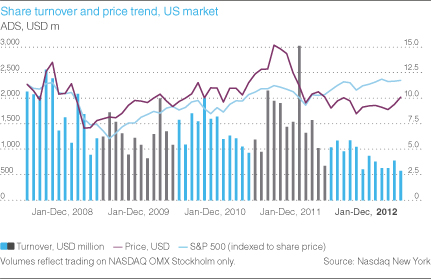

ERICSSON ANNUAL REPORT ON FORM 20-F 2012 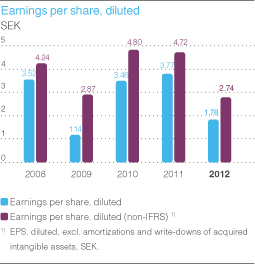
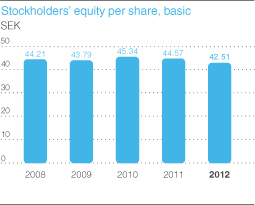
OFFER AND LISTING DETAILS Principal trading market—NASDAQ OMX Stockholm—share prices The table below states the high and low share prices for our Class A and Class B shares as reported by NASDAQ OMX Stockholm for the last five years. Trading on the exchange generally continues until 5:30 p.m. (CET) each business day. In addition to trading on the exchange, there is also trading off the exchange and on alternative venues during trading hours and also after 5:30 p.m. (CET). NASDAQ OMX Stockholm publishes a daily Official Price List of Shares which includes the volume of recorded transactions in each listed stock, together with the prices of the highest and lowest recorded trades of the day. The Official Price List of Shares reflects price and volume information for trades completed by the members. The equity securities listed on the NASDAQ OMX Stockholm Official Price List of Shares currently comprise the shares of 258 companies. ERICSSON ANNUAL REPORT ON FORM 20-F 2012 Share prices on NASDAQ OMX Stockholm | | | | | | | | | | | | | | | | | | | | | (SEK) | | 2012 | | | 2011 | | | 2010 | | | 2009 | | | 2008 | | Class A at last day of trading | | | 63.90 | | | | 69.55 | | | | 74.00 | | | | 65.00 | | | | 59.30 | | Class A high (January 3, 2012) | | | 72.00 | | | | 93.60 | | | | 88.40 | | | | 78.80 | | | | 83.60 | | Class A low (November 16, 2012) | | | 55.55 | | | | 59.05 | | | | 65.20 | | | | 55.40 | | | | 40.60 | | Class B at last day of trading | | | 65.10 | | | | 70.40 | | | | 78.15 | | | | 65.90 | | | | 58.80 | | Class B high (January 3, 2012) | | | 71.90 | | | | 96.65 | | | | 90.45 | | | | 79.60 | | | | 83.70 | | Class B low (July 18, 2012) | | | 55.90 | | | | 61.70 | | | | 65.90 | | | | 55.50 | | | | 40.60 | |
Source: Nasdaq OMX Stockholm Share prices on NASDAQ New York | | | | | | | | | | | | | | | | | | | | | (USD) | | 2012 | | | 2011 | | | 2010 | | | 2009 | | | 2008 | | ADS at last day of trading | | | 10.10 | | | | 10.13 | | | | 11.53 | | | | 9.19 | | | | 7.81 | | ADS high (April 3, 2012) | | | 10.60 | | | | 15.44 | | | | 12.39 | | | | 10.92 | | | | 14.00 | | ADS low (May 17, 2012) | | | 8.23 | | | | 8.83 | | | | 9.40 | | | | 6.60 | | | | 5.49 | |
Source: Nasdaq New York Host market NASDAQ New York—ADS prices The table below states the high and low share prices quoted for our ADSs on NASDAQ New York for the last five years. The NASDAQ New York quotations represent prices between dealers, not including retail mark-ups, markdowns or commissions, and do not necessarily represent actual transactions. ERICSSON ANNUAL REPORT ON FORM 20-F 2012 Share prices on NASDAQ OMX Stockholm and NASDAQ New York | | | | | | | | | | | | | | | | | | | | | | | | | | | | NASDAQ OMX Stockholm | | | NASDAQ New York | | | | | SEK per Class A share | | | SEK per Class B share | | | USD per ADS1) | | Period | | High | | | Low | | | High | | | Low | | | High | | | Low | | Annual high and low | | | | | | | | | | | | | | | | | | | | | | | | | 2008 | | | 83.60 | | | | 40.60 | | | | 83.70 | | | | 40.60 | | | | 14.00 | | | | 5.49 | | 2009 | | | 78.80 | | | | 55.40 | | | | 79.60 | | | | 55.50 | | | | 10.92 | | | | 6.60 | | 2010 | | | 88.40 | | | | 65.20 | | | | 90.45 | | | | 65.90 | | | | 12.39 | | | | 9.40 | | 2011 | | | 93.60 | | | | 59.05 | | | | 96.65 | | | | 61.70 | | | | 15.44 | | | | 8.83 | | 2012 | | | 72.00 | | | | 55.55 | | | | 71.90 | | | | 55.90 | | | | 10.60 | | | | 8.23 | | | | | | | | | Quarterly high and low | | | | | | | | | | | | | | | | | | | | | | | | | 2011 First Quarter | | | 80.05 | | | | 70.50 | | | | 83.00 | | | | 73.25 | | | | 13.06 | | | | 10.99 | | 2011 Second Quarter | | | 93.60 | | | | 73.00 | | | | 96.65 | | | | 75.30 | | | | 15.44 | | | | 12.06 | | 2011 Third Quarter | | | 91.80 | | | | 60.50 | | | | 93.80 | | | | 63.15 | | | | 14.82 | | | | 9.33 | | 2011 Fourth Quarter | | | 71.50 | | | | 59.05 | | | | 72.55 | | | | 61.70 | | | | 11.25 | | | | 8.83 | | 2012 First Quarter | | | 72.00 | | | | 59.25 | | | | 71.90 | | | | 58.15 | | | | 10.53 | | | | 8.58 | | 2012 Second Quarter | | | 69.70 | | | | 58.75 | | | | 69.95 | | | | 59.60 | | | | 10.60 | | | | 8.23 | | 2012 Third Quarter | | | 67.00 | | | | 55.95 | | | | 67.80 | | | | 55.90 | | | | 10.05 | | | | 8.23 | | 2012 Fourth Quarter | | | 64.90 | | | | 55.55 | | | | 66.85 | | | | 56.60 | | | | 10.21 | | | | 8.31 | | | | | | | | | Monthly high and low | | | | | | | | | | | | | | | | | | | | | | | | | August 2012 | | | 67.00 | | | | 60.55 | | | | 67.80 | | | | 61.50 | | | | 10.05 | | | | 9.14 | | September 2012 | | | 62.55 | | | | 58.35 | | | | 64.10 | | | | 59.85 | | | | 9.79 | | | | 8.91 | | October 2012 | | | 59.85 | | | | 56.10 | | | | 61.00 | | | | 57.40 | | | | 9.27 | | | | 8.57 | | November 2012 | | | 60.50 | | | | 55.55 | | | | 62.30 | | | | 56.60 | | | | 9.41 | | | | 8.31 | | December 2012 | | | 64.90 | | | | 60.00 | | | | 66.85 | | | | 62.45 | | | | 10.21 | | | | 9.40 | | January 2013 | | | 74.30 | | | | 62.90 | | | | 76.95 | | | | 64.50 | | | | 11.82 | | | | 9.78 | | February 2013 | | | 77.75 | | | | 72.30 | | | | 79.90 | | | | 74.20 | | | | 12.70 | | | | 11.97 | | March 2013 | | | 84.55 | | | | 75.60 | | | | 86.40 | | | | 77.60 | | | | 13.46 | | | | 12.07 | |
| 1) | One ADS = 1 Class B share. |
Source: Nasdaq OMX Stockholm and Nasdaq New York SHAREHOLDERS As of December 31, 2012, the Parent Company had 551,719 shareholders registered at Euroclear Sweden AB (the Central Securities Depository—CSD), of which 1,080 holders had a US address. According to information provided by our depositary, Citibank, there were 189,454,944 ADSs outstanding as of December 31, 2012, and 4,500 registered holders of such ADSs. A significant number of Ericsson ADSs are held by banks, brokers and/or nominees for the accounts of their customers. As of January 3, 2013, the total number of bank, broker and/or nominee accounts holding Ericsson ADSs was 169,190. According to information known at year-end 2012, approximately 78% of our Class A and Class B shares were owned by institutions, Swedish and international. Our major shareholders do not have different voting rights than other shareholders holding the same classes of shares. As far as we know, the Company is not directly or indirectly owned or controlled by another corporation, by any foreign government or by any other natural or legal person(s) separately or jointly. ERICSSON ANNUAL REPORT ON FORM 20-F 2012 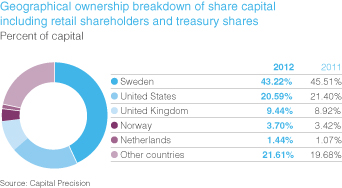
The table shows the total number of shares in the Parent Company owned by the Executive Leadership Team and Board members (including Deputy employee representatives) as a group as of December 31, 2012. The Executive Leadership Team and Board members, ownership | | | | | | | | | | | | | | | | Number of
Class A
shares | | | Number of
Class B
shares | | | Voting
rights,
percent | | The Executive Leadership Team and Board members as a group (31 persons) | | | 0 | | | | 559,450 | | | | 0.01 | |
For individual holdings, see Corporate Governance Report. ERICSSON ANNUAL REPORT ON FORM 20-F 2012 The following table shows share information, as of December 31, 2012, with respect to our 15 largest shareholders, ranked by voting rights, as well as percentage of voting rights as of December 31, 2012, 2011 and 2010. Largest shareholders, December 31, 2012 and percentage of voting rights, December 31, 2012, 2011 and 2010 | | | | | | | | | | | | | | | | | | | | | | | | | | | | | Identity of person or group1) | | Number of
Class A
shares | | | Of total
Class A
shares,
percent | | | Number of
Class B
shares | | | Of total
Class B
shares,
percent | | | 2012
Voting rights,
percent | | | 2011
Voting rights,
percent | | | 2010
Voting rights,
percent | | Investor AB | | | 115,018,707 | | | | 43.94 | | | | 59,284,545 | | | | 1.95 | | | | 21.37 | | | | 21.48 | | | | 19.33 | | AB Industrivärden | | | 84,708,520 | | | | 32.36 | | | | 0 | | | | 0.00 | | | | 14.96 | | | | 14.34 | | | | 13.80 | | Handelsbankens Pensionsstiftelse | | | 21,057,443 | | | | 8.04 | | | | 0 | | | | 0.00 | | | | 3.72 | | | | 4.20 | | | | 3.52 | | Swedbank Robur Fonder AB | | | 1,505,751 | | | | 0.58 | | | | 138,107,152 | | | | 4.54 | | | | 2.71 | | | | 2.79 | | | | 2.73 | | AFA Försäkring AB | | | 11,423,000 | | | | 4.36 | | | | 9,151,631 | | | | 0.30 | | | | 2.18 | | | | 2.31 | | | | 0.45 | | Blackrock Fund Advisors | | | 0 | | | | 0.00 | | | | 77,802,606 | | | | 2.56 | | | | 1.37 | | | | 1.46 | | | | 1.44 | | Norges Bank Investment Management | | | 0 | | | | 0.00 | | | | 77,226,311 | | | | 2.54 | | | | 1.36 | | | | 1.24 | | | | 0.89 | | Skandia Liv | | | 6,263,167 | | | | 2.39 | | | | 11,414,818 | | | | 0.38 | | | | 1.31 | | | | 1.36 | | | | 2.98 | | AMF Pensionsförsäkring AB | | | 0 | | | | 0.00 | | | | 71,108,980 | | | | 2.34 | | | | 1.26 | | | | 1.34 | | | | 1.34 | | Aberdeen Asset Managers Ltd. | | | 0 | | | | 0.00 | | | | 65,706,158 | | | | 2.16 | | | | 1.16 | | | | 1.05 | | | | 1.01 | | Dodge & Cox, Inc. | | | 0 | | | | 0.00 | | | | 64,443,081 | | | | 2.12 | | | | 1.14 | | | | 0.96 | | | | 1.43 | | Pensionskassan SHB Försäkringsförening | | | 6,381,570 | | | | 2.44 | | | | 0 | | | | 0.00 | | | | 1.13 | | | | 1.39 | | | | 2.07 | | Orbis Investment Management Ltd. | | | 0 | | | | 0.00 | | | | 62,271,048 | | | | 2.05 | | | | 1.10 | | | | 0.35 | | | | 0.06 | | OppenheimerFunds, Inc. | | | 0 | | | | 0.00 | | | | 62,070,708 | | | | 2.04 | | | | 1.10 | | | | 1.20 | | | | 1.29 | | Handelsbanken Fonder AB | | | 261,500 | | | | 0.10 | | | | 58,019,980 | | | | 1.91 | | | | 1.07 | | | | 0.96 | | | | 1.05 | | Others | | | 15,136,325 | | | | 5.78 | | | | 2,286,688,734 | | | | 75.14 | | | | 43.07 | | | | 43.57 | | | | 46.61 | | | | | | | | | | | | | | | | | | | | | | | | | | | | | | | Total | | | 261,755,983 | | | | 100 | | | | 3,043,295,752 | | | | 100 | | | | 100 | | | | 100 | | | | 100 | | | | | | | | | | | | | | | | | | | | | | | | | | | | | | |
| 1) | Source: Capital Precision |
ERICSSON ANNUAL REPORT ON FORM 20-F 2012 SUPPLEMENTAL INFORMATION The following information is provided to comply with certain requirements of Form 20-F which are not satisfied in full by the information in the Swedish Annual Report. GENERAL FACTS ON THE COMPANY Legal name of the Parent Company: Telefonaktiebolaget LM Ericsson (publ) Organization number: 556016-0680 Legal form of the Parent Company: A Swedish limited liability company, organized under the Swedish Companies Act. The terms “Ericsson”, the “Company”, the “Group”, “us”, “we”, and “our” all refer to Telefonaktiebolaget LM Ericsson and its subsidiaries. Country of incorporation: Sweden. Date of incorporation: The Parent Company was incorporated on August 18, 1918, as a result of a merger between AB LM Ericsson & Co. and Stockholms Allmänna Telefon AB. Domicile: Our registered office is Telefonaktiebolaget LM Ericsson, SE–164 83 Stockholm, Sweden. Our headquarters are located at Torshamnsgatan 23, Kista, Sweden. Telephone number: +46 10 719 0000 Website: www.ericsson.com The information included on our website is not incorporated herein by reference. Agent in the US: Ericsson Inc., Vice President Legal Affairs, 6300 Legacy Drive, Plano, Texas 75024. Telephone number: +1 972 583 0000. Shares: Ericsson’s Class A and Class B shares are traded on NASDAQ OMX Stockholm. In the US, our American Depository Shares (ADS), each representing one underlying Class B share, are traded on NASDAQ. Parent Company operations: The business of the Parent Company, Telefonaktiebolaget LM Ericsson, consists mainly of corporate management, holding company functions and internal banking activities. Parent Company operations also include customer credit management activities performed by Ericsson Credit AB on a commission basis. Subsidiaries and associated companies: For a listing of our significant subsidiaries, please see section “Investments”. In addition to our joint venture ST-Ericsson, we are engaged in a number of other minor joint ventures and cooperative arrangements. For more information regarding risks associated with joint ventures, strategic alliances and third-party agreements please see Risk Factors, “Market, Technology and Business Risks”. Filings in the US: Annual reports and other information are filed with, or furnished to, the Securities and Exchange Commission (SEC) in the United States, pursuant to the rules and regulations that apply to foreign private issuers. Electronic access to these documents may be obtained from the SEC’s website, www.sec.gov, where they are stored in the EDGAR database. ERICSSON ANNUAL REPORT ON FORM 20-F 2012 COMPANY HISTORY AND DEVELOPMENT Innovating to empower people, business and society Our origins date back to 1876 when Alexander Graham Bell filed a patent application in the United States for the telephone. The same year, Lars Magnus Ericsson opened a small workshop in Stockholm to repair telegraph instruments and sell his own telephone equipment. Today, Ericsson is a leading provider of communications equipment, telecom services and support solutions. Our customers, in over 180 countries, are mainly operators of communications networks worldwide. We manage networks, or parts of networks, for 950 million subscribers. EXCHANGE RATES The following tables provide information with respect to the exchange rate for SEK per USD 1.00, based on the noon buying rate for cable transfers in SEK as certified for customs purposes by the Federal Reserve Bank of New York. The noon buying rate of March 29, 2013, was SEK 6.5280 per USD 1.00. The average is computed using the noon buying rate on the last business day of each month during the period indicated. AVERAGE EXCHANGE RATES | | | | | Year ended December 31 | | Average | | 2008 | | | 6.6424 | | 2009 | | | 7.6232 | | 2010 | | | 7.1895 | | 2011 | | | 6.4263 | | 2012 | | | 6.7247 | |
| | | | | | | | | | EXCHANGE RATES, MONTHLY HIGH AND LOW | | | | | | | | | | | | Month | | High | | | Low | | September 2012 | | | 6.7450 | | | | 6.5018 | | October 2012 | | | 6.7023 | | | | 6.5484 | | November 2012 | | | 6.8019 | | | | 6.6092 | | December 2012 | | | 6.6920 | | | | 6.5074 | | January 2013 | | | 6.5568 | | | | 6.3476 | | February 2013 | | | 6.4764 | | | | 6.2880 | | March 2013 (latest available data is for March 29) | | | 6.5280 | | | | 6.3412 | |
Effects of exchange rate fluctuations on our business is described in the Notes to the Consolidated Financial Statements—Note C20, “Financial Risk Management and Financial Instruments.” Noon buying rates are not used in the preparation of our financial statements. ERICSSON ANNUAL REPORT ON FORM 20-F 2012 PRIMARY MANUFACTURING AND ASSEMBLY FACILITIES We continuously adjust our production capacity to meet expected customer demand. At year-end 2012, our overall capacity utilization was close to 100%. The table “Primary manufacturing and assembly facilities” summarizes where we have major sites and the total floor space at year-end. In Sweden, the majority of the floor space within our production facilities is used for node assembly and verification. PRIMARY MANUFACTURING AND ASSEMBLY FACILITIES | | | | | | | | | | | | | | | | | | | | | | | | | | | | 2012 | | | 2011 | | | 2010 | | | | | Sites | | | Thousands of
sq meters | | | Sites | | | Thousands
of sq meters | | | Sites | | | Thousands
of sq meters | | | | | | | | | Sweden | | | 7 | | | | 125.1 | | | | 7 | | | | 125.1 | * | | | 6 | | | | 204.4 | | China | | | 5 | | | | 83.5 | | | | 5 | | | | 91.1 | | | | 4 | | | | 61.1 | | Estonia | | | 1 | | | | 23.7 | | | | 1 | | | | 23.7 | | | | 1 | | | | 20.6 | | Italy | | | 1 | | | | 10.5 | | | | 2 | | | | 20.1 | | | | 2 | | | | 20.1 | | Brazil | | | 1 | | | | 37.4 | | | | 1 | | | | 33.7 | | | | 1 | | | | 23.3 | | Mexico | | | 1 | | | | 0.6 | | | | — | | | | — | | | | — | | | | — | | India | | | 1 | | | | 25.0 | | | | 1 | | | | 25.0 | * | | | 1 | | | | 15.6 | | | | | | | | | | | | | | | | | | | | | | | | | | | Total | | | 17 | | | | 305.8 | | | | 17 | | | | 318.7 | | | | 15 | | | | 345.1 | | | | | | | | | | | | | | | | | | | | | | | | | | |
| * | Restated for 2011 to only include manufacturing and assembly areas. The reported number for China in the 20-F for 2011 was 80.7 and for Sweden 429.3. These numbers comprised total land use. |
OPERATING RESULTS Years ended December 31, 2011 and 2012 Please refer to Board of Directors’ Report. ERICSSON ANNUAL REPORT ON FORM 20-F 2012 Years ended December 31, 2010 and 2011 FINANCIAL RESULTS OF OPERATIONS ABBREVIATED INCOME STATEMENT WITH RECONCILIATION IFRS—NON-IFRS MEASURES | | | | | | | | | | | | | | | | | | | | | | | | | | | | | | | | | | | | | | | | IFRS | | | Restructuring charges | | | Non-IFRS measures | | SEK billion | | 2011 | | | 2010 | | | 2009 | | | 2011 | | | 2010 | | | 2009 | | | 2011 | | | 2010 | | | 2009 | | Net sales | | | 226.9 | | | | 203.3 | | | | 206.5 | | | | | | | | | | | | | | | | 226.9 | | | | 203.3 | | | | 206.5 | | Cost of sales | | | –147.2 | | | | –129.1 | | | | –136.3 | | | | –1.2 | | | | –3.4 | | | | –4.2 | | | | –146.0 | | | | –125.7 | | | | –132.1 | | | | | | | | | | | | | | | | | | | | | | | | | | | | | | | | | | | | | | | Gross income | | | 79.7 | | | | 74.3 | | | | 70.2 | | | | –1.2 | | | | –3.4 | | | | –4.2 | | | | 80.9 | | | | 77.6 | | | | 74.4 | | Gross margin % | | | 35.1 | % | | | 36.5 | % | | | 34.0 | % | | | | | | | | | | | | | | | 35.7 | % | | | 38.2 | % | | | 36.0 | % | | | | | | | | | | | | | | | | | | | | | | | | | | | | | | | | | | | | | | Operating expenses | | | –59.3 | | | | –58.6 | | | | –60.0 | | | | –2.0 | | | | –3.5 | | | | –7.1 | | | | –57.3 | | | | –55.2 | | | | –52.9 | | Operating expenses as % of sales | | | 26.1 | % | | | 28.8 | % | | | 29.0 | % | | | | | | | | | | | | | | | 25.3 | % | | | 27.1 | % | | | 25.6 | % | Other operating income and expenses | | | 1.3 | | | | 2.0 | | | | 3.1 | | | | — | | | | — | | | | — | | | | 1.3 | | | | 2.0 | | | | 3.1 | | | | | | | | | | | | | | | | | | | | | | | | | | | | | | | | | | | | | | | Operating income before share in earnings of JVs and associated companies | | | 21.7 | | | | 17.6 | | | | 13.3 | | | | –3.2 | | | | –6.8 | | | | –11.3 | | | | 24.9 | | | | 24.4 | | | | 24.6 | | Operating margin % before share in earnings of JVs and associated companies | | | 9.6 | % | | | 8.7 | % | | | 6.5 | % | | | | | | | | | | | | | | | 11.0 | % | | | 12.0 | % | | | 11.9 | % | | | | | | | | | | | | | | | | | | | | | | | | | | | | | | | | | | | | | | Share in earnings of JVs and associated companies | | | –3.8 | | | | –1.2 | | | | –7.4 | | | | –0.6 | | | | –0.5 | | | | –1.3 | | | | –3.2 | | | | –0.7 | | | | –6.1 | | | | | | | | | | | | | | | | | | | | | | | | | | | | | | | | | | | | | | | Operating income | | | 17.9 | | | | 16.5 | | | | 5.9 | | | | –3.7 | | | | –7.3 | | | | –12.6 | | | | 21.6 | | | | 23.7 | | | | 18.5 | | Operating margin % | | | 7.9 | % | | | 8.1 | % | | | 2.9 | % | | | | | | | | | | | | | | | 9.5 | % | | | 11.7 | % | | | 9.0 | % | | | | | | | | | | | | | | | | | | | | | | | | | | | | | | | | | | | | | | Financial income and expense, net | | | 0.2 | | | | –0.7 | | | | 0.3 | | | | | | | | | | | | | | | | | | | | | | | | | | Taxes | | | –5.6 | | | | –4.5 | | | | –2.1 | | | | | | | | | | | | | | | | | | | | | | | | | | Net income | | | 12.6 | | | | 11.2 | | | | 4.1 | | | | | | | | | | | | | | | | | | | | | | | | | | EPS diluted (SEK) | | | 3.77 | | | | 3.46 | | | | 1.14 | | | | | | | | | | | | | | | | | | | | | | | | | | | | | | | | | | | | | | | | | | | | | | | | | | | | | | | | | | | | | | |
The non-IFRS financial measures presented herein are not measures of financial performance calculated or presented under IFRS, but rather are measures used as supplemental information to the IFRS results. Since there were restructuring costs during 2009 and 2010 with significant impact on reported results and margins, certain income statement line items excluding restructuring charges, are presented as non-IFRS financial measures to facilitate analysis by indicating Ericsson’s underlying performance. Non-IFRS financial measures have limitations as analytical tools and should not be viewed in isolation or as substitutes to the IFRS financial measures, and do not necessarily indicate whether cash flow will be sufficient or available to meet Ericsson’s requirements, and may not be indicative of our historical operating results, nor are such measures meant to be predictive of future results. Non-IFRS measures for 2011 have also been included to facilitate comparison with previous years. Sales 2011 was a year with strong sales growth of 12%, driven by strong demand for mobile broadband along with network rollout services. Sales were negatively impacted by the strong SEK. Sales for comparable units, adjusted for currency exchange rate effects and hedging, increased 19%. ERICSSON ANNUAL REPORT ON FORM 20-F 2012 In 2011, the Company executed on its strategy to leverage its strengths in the growth areas mobile broadband, managed services, OSS and BSS. Due to the technology cycle where mobile broadband is being rolled out, the business mix shifted to more coverage projects. Ericsson also implemented its strategy to capture new market share in the network modernization projects in Europe, despite their initial lower margins. In 2011, seven out of ten regions grew. In the year, there was an impact from slower operator spending after a period of high investments in capacity, especially in North America and Russia, as well as political unrest in certain countries. In the last quarter of the year, the Company also noticed some increased operator cautiousness due to uncertainties such as economic development and continued political unrest in certain countries. In 2011, the share of software sales declined to 23% (24%) of sales while the portion of hardware increased to 40% (37%). The increase in hardware is a result of demand for mobile broadband products. In the short term, the software share might continue to decrease due to a higher portion of projects with a lot of hardware. Longer term, the software part should increase following more expansions and upgrades of networks. Services sales amounted to 37% (39%) in 2011. Seasonality The Company’s quarterly sales, income and cash flow from operations are seasonal in nature, generally lowest in the first quarter of the year and highest in the fourth quarter. This is mainly a result of the seasonal purchase patterns of network operators. MOST RECENT FIVE-YEAR AVERAGE SEASONALITY | | | | | | | | | | | | | | | | | | | | First
quarter | | | Second
quarter | | | Third
quarter | | | Fourth
quarter | | Sequential change | | | –21 | % | | | 8 | % | | | –4 | % | | | 27 | % | Share of annual sales | | | 23 | % | | | 24 | % | | | 23 | % | | | 30 | % |
Financial numbers in this section are reported: for 2011, including restructuring charges for 2010, excluding restructuring charges. Gross margin Gross margin declined to 35.1% (38.2%) due to higher share of coverage projects, network modernization projects in Europe and 3G rollouts in India. Gross margin in 2010, including restructuring charges, amounted to 36.5%. Operating expenses To secure continued technology leadership, focus is on innovation and R&D. R&D expenses amounted to SEK 32.6 (29.9) billion. Spending on R&D as a percentage of sales was 14.4% (14.7%). In 2010, R&D spend including restructuring charges was SEK 31.6 billion or 15.5% of sales. The increase in absolute number is a result of planned higher investments in radio, such as TD-LTE, IP and the acquired LG-Ericsson operations. In 2012, R&D expenses of SEK 29–31 billion is estimated. The estimate includes amortizations/write-downs of intangible assets related to major acquisitions previously made. However, currency effects may cause this to change. ERICSSON ANNUAL REPORT ON FORM 20-F 2012 Selling and administrative expenses represented 11.8% of sales compared to 12.4% in 2010. The amount was SEK 26.7 (25.3) billion. In 2010, the amount including restructuring charges was SEK 27.1 billion, representing 13.3% of sales. In the year, there were positive effects from efficiency work along with the strong SEK. Operating margin before JVs Operating margin before share in JV earnings decreased to 9.6% (12.0%). However, in 2010, operating margin before share in JV earnings and including restructuring charges amounted to 8.7%. Share in earnings of JVs In 2011, Sony Ericsson reported a loss. The loss reflects intense competition, price erosion, restructuring charges and supply chain issues following the earthquake and tsunami in Japan. Ericsson’s share in Sony Ericsson’s income before tax was SEK –1.2 (0.9) billion. In 2010, Ericsson’s share amounted to SEK 0.7 billion including restructuring charges. ST-Ericsson reported a loss also in 2011. ST-Ericsson is currently in a shift from legacy to new products. Ericsson’s share in ST-Ericsson’s income before tax, adjusted to IFRS, was SEK –2.7 (–1.5) billion. In 2010, the loss amounted to SEK –1.8 billion including restructuring charges. Operating income Operating income was SEK 17.9 (23.7) billion. However, in 2010, operating income including restructuring charges amounted to SEK 16.5 billion. Financial net The financial net was SEK 0.2 (–0.7) billion. The difference is mainly attributable to a higher interest net of SEK 0.8 billion compared to 2010. Taxes The tax expense for the year was SEK 5.6 (4.5) billion or 30.6% (28.8%) of income after financial items. The tax rate may vary between years depending on business and geographic mix. The tax rate excluding joint ventures and associated companies was 26.4% (25.7%) due to lower tax rates from the loss-making joint ventures. Net income Net income increased 12% to SEK 12.6 (11.2) billion driven by higher sales and lower restructuring charges. Earnings per share, diluted Earnings per share increased 9% to SEK 3.77 (3.46). The Board of Directors proposes a dividend of SEK 2.50 (2.25). This represents an increase of 11%. Restructuring charges Total restructuring charges were SEK 3.2 (6.8) billion, excluding joint ventures. Cash outlays that have been provided for were SEK 3.2 (3.3) billion. At the end of the year, cash outlays of SEK 1.3 billion remain to be made. In 2012, restructuring charges of approximately SEK 4 billion are estimated. ERICSSON ANNUAL REPORT ON FORM 20-F 2012 Ericsson’s share in Sony Ericsson’s restructuring charges amounted to SEK 0.4 (0.2) billion. Ericsson’s share in ST-Ericsson’s restructuring charges was SEK 0.1 (0.3) billion. RESEARCH AND DEVELOPMENT PROGRAM | | | | | | | | | | | | | | | | 2011 | | | 2010 | | | 2009 | | Expenses (SEK billion)1) | | | 32.6 | | | | 29.9 | | | | 27.0 | | As percent of Net sales | | | 14.4 | % | | | 14.7 | % | | | 13.1 | % | Employees within R&D as of December 312) | | | 22,400 | | | | 20,800 | | | | 18,300 | | Patents2) | | | 30,000 | | | | 27,000 | | | | 25,000 | |
| 1) | Excluding restructuring charges for 2009 and 2010. |
| 2) | The number of employees and patents are approximate. |
FINANCIAL POSITION CONSOLIDATED BALANCE SHEET (ABBREVIATED) | | | | | | | | | | | | | December 31, SEK billion | | 2011 | | | 2010 | | | 2009 | | ASSETS | | | | | | | | | | | | | Non-current assets, total | | | 81.5 | | | | 83.4 | | | | 87.4 | | of which intangible assets | | | 44.0 | | | | 46.8 | | | | 48.2 | | of which property, plant and equipment | | | 10.8 | | | | 9.4 | | | | 9.6 | | of which financial assets | | | 13.7 | | | | 14.5 | | | | 15.3 | | of which deferred tax assets | | | 13.0 | | | | 12.7 | | | | 14.3 | | Current assets, total | | | 198.8 | | | | 198.4 | | | | 182.4 | | of which inventory | | | 33.1 | | | | 29.9 | | | | 22.7 | | of which trade receivables | | | 64.5 | | | | 61.1 | | | | 66.4 | | of which other receivables/financing | | | 20.7 | | | | 20.2 | | | | 16.6 | | of which short-term investments, cash and cash equivalents | | | 80.5 | 2) | | | 87.2 | | | | 76.7 | | Total assets | | | 280.3 | | | | 281.8 | | | | 269.8 | | | | | | EQUITY AND LIABILITIES | | | | | | | | | | | | | Equity | | | 145.3 | | | | 146.8 | | | | 141.0 | | Non-current liabilities | | | 38.1 | | | | 38.3 | | | | 43.3 | | of which post-employment benefits | | | 10.0 | | | | 5.1 | | | | 8.5 | | of which borrowings | | | 23.3 | | | | 27.0 | | | | 30.0 | | of which other non-current liabilities | | | 4.8 | | | | 6.2 | | | | 4.8 | | Current liabilities | | | 97.0 | | | | 96.8 | | | | 85.5 | | of which provisions | | | 6.0 | | | | 9.4 | | | | 12.0 | | of which current borrowings | | | 7.8 | | | | 3.8 | | | | 2.1 | | of which trade payables | | | 25.3 | | | | 25.0 | | | | 18.9 | | of which other current liabilities | | | 58.0 | | | | 58.6 | | | | 52.5 | | Total equity and liabilities1) | | | 280.3 | | | | 281.8 | | | | 269.8 | |
| 1) | Of which interest-bearing liabilities and post-employment benefits SEK 41.0 (35.9) billion. |
| 2) | Including loan to ST-Ericsson of SEK 2.8 billion. |
Ericsson’s strategy is to maintain a strong balance sheet including a sufficiently large cash position to ensure the financial flexibility to operate freely and to capture business opportunities. This has been particularly important during the past years’ difficult macroeconomic and financial market situation. ERICSSON ANNUAL REPORT ON FORM 20-F 2012 By maintaining a strong cash position, the Company can also maintain an active strategy for strategic mergers and acquisitions. An important focus area is the monitoring of working capital. Major efforts have been made during the year in order to reduce days sales outstanding and inventory turnover days as well as to increase payable days. The target for payable days was met, while the other two targets were not achieved. The efforts to further reduce working capital will continue in 2012 and the working capital targets are the same as previous years. In 2011, the dividend was SEK 2.25 per share. The Board of Directors will propose to the Annual General Meeting 2012 a dividend of SEK 2.50 per share. This represents a total dividend of approximately SEK 8.2 billion. The proposal reflects year 2011’s earnings and balance sheet structure, as well as coming years’ business plans and expected economic development. Non-current assets Intellectual property rights, brands and other intangible assets decreased to SEK 13.1 (16.7) billion due to amortizations. Customer financing, current and non-current, decreased slightly to SEK 4.2 (4.4) billion. Current assets Inventory levels increased during the year by SEK 3.2 billion due to higher sales and increased share of coverage projects. At year end, inventory was SEK 33.1 (29.9) billion. The higher inventory level followed a higher level of work in progress in the regions. The target of inventory turnover days less than 65 days was not reached and improvement efforts will continue in 2012. Trade receivables: Days sales outstanding reached 91 (88) days at year-end. This reflects a higher portion of coverage projects and higher sales volumes. The Company’s nominal credit losses have historically been low and continued to be so in 2011. Net cash decreased to SEK 39.5 (51.3) billion, mainly due to a negative change in net operating assets, investing and dividend paid to shareholders. Pension liabilities increased due to lower discount rate and this impacted net cash negatively. Equity Equity decreased by SEK –1.5 billion to SEK 145.3 (146.8) billion. Net income was SEK 12.6 (11.2) billion and dividends of SEK 7.5 (6.7) billion was paid during the year. The equity ratio was maintained at a healthy level of 52% (52%). Return on equity increased to 8.5% (7.8%), primarily due to higher sales and lower restructuring charges. Return on capital employed (ROCE) was 11.3% (9.6%). In 2010, ROCE excluding restructuring charges was 13.6%. Non-current liabilities Post-employment benefits related to defined benefit plans increased to SEK 10.0 (5.1) billion. In 2011 there was a decrease in discount rates, and plan assets yielded lower than expected. Consequently, the Company experienced an increase in the net pension liability and the funded ratio (plan assets as percentage of defined benefit obligations) decreased to 77% (89%). ERICSSON ANNUAL REPORT ON FORM 20-F 2012 Current liabilities Provisions declined to SEK 6.0 (9.4) billion. SEK 1.3 (3.2) billion were related to restructuring. The cash outlays of provisions were SEK 6.0 (7.2) billion. The lower amount of provisions is mainly due to lower restructuring. In addition, the business mix with more coverage projects as well as good performance in both hardware and software for new products introduced decreased the need for warranty provisions. There is also an effect of improved project management as well as geographical mix. Provisions will fluctuate over time, depending on business mix, market mix and technology shifts. Payable days was unchanged at 62 (62) days. The target of payable days of above 60 days was met. Non-current borrowings decreased to SEK 23.3 (27.0) billion. No major changes were made in the debt maturity profile during 2011. Debt of SEK 3.4 billion is maturing in 2012 and SEK 5.4 billion in 2013. The Company also has unutilized committed credit facilities of USD 2.0 billion available, maturing in 2014. Off-balance sheet arrangements There are currently no material off-balance sheet arrangements that have, or would be reasonably likely to have, a current or anticipated effect on the Company’s financial condition, revenues, expenses, result of operations, liquidity, capital expenditures or capital resources. CASH FLOW CASH FLOW (ABBREVIATED) JANUARY-DECEMBER | | | | | | | | | | | | | SEK billion | | 2011 | | | 2010 | | | 2009 | | Net income | | | 12.6 | | | | 11.2 | | | | 4.1 | | Income reconciled to cash | | | 25.2 | | | | 23.7 | | | | 21.0 | | Changes in operating net assets | | | –15.2 | | | | 2.9 | | | | 3.5 | | Cash flow from operating activities | | | 10.0 | | | | 26.6 | | | | 24.5 | | Adjusted operating cash flow1) | | | 13.2 | | | | 29.8 | | | | 28.7 | | Cash flow from investing activities | | | 4.5 | | | | –12.5 | | | | –37.5 | | of which capital expenditures, sales of PP&E, product development | | | –6.1 | | | | –5.2 | | | | –4.9 | | of which acquisitions/divestments, net | | | –3.1 | | | | –2.8 | | | | –18.1 | | of which short-term investments for cash management purposes and other investing activities | | | 13.8 | | | | –4.5 | | | | –14.5 | | Cash flow before financing activities | | | 14.5 | | | | 14.0 | | | | –13.0 | | | | | | | | | | | | | | | Cash flow from financing activities | | | –6.5 | | | | –5.7 | | | | –1.7 | | | | | | | | | | | | | | | Cash conversion (Cash flow from operating activities divided by income reconciled to cash) | | | 40 | % | | | 112 | % | | | 117 | % | | | | | | | | | | | | | | Gross cash (Cash, cash equivalents and short-term investments) | | | 80.5 | 2) | | | 87.2 | | | | 76.7 | | | | | | | | | | | | | | | Net cash (Gross cash less interest-bearing liabilities and post-employment benefits) | | | 39.5 | | | | 51.3 | | | | 36.1 | | | | | | | | | | | | | | |
| 1) | Cash flow from operations excl. restructuring cash outlays that have been provided for. |
| 2) | Including loan to ST-Ericsson of SEK 2.8 billion. |
In 2011, gross cash decreased by SEK 6.6 billion to SEK 80.5 (87.2) billion. The net income reconciled to cash of SEK 25.2 billion was offset by a change in net operating assets of SEK –15.2 billion and investing activities of SEK –9.9 billion. Dividends to shareholders amounted to SEK –7.5 (–6.7) billion. Net cash decreased to SEK 39.5 (51.3) billion. ERICSSON ANNUAL REPORT ON FORM 20-F 2012 Cash flow from operating activities The adjusted operating cash flow was negatively impacted by higher working capital. During 2011, cash flow was negatively impacted by a significant increase in working capital as a result of higher sales and more projects. Cash flow from investing activities Cash outlays for regular investing activities increased to SEK –6.1 (–5.2) billion. Acquisitions and divestments during the year were net SEK –3.1 (–2.8) billion, with the major items Nortel’s GDNT operation in China and Nortel’s Multi-Service Switch business (MSS). The Nortel patent portfolio was acquired in partnership with other industry players. Cash flow for short-term investments for cash management purposes and other investing activities was net SEK 13.8 (–4.5) billion, mainly attributable to changes between short-term investments and cash and cash equivalents. Capital expenditures Annual capital expenditures are normally around two percent of sales and are expected to remain at this level. This corresponds to the needs for keeping and maintaining the current capacity level, including the introduction of new technology and methods. The expenditures are largely related to test equipment in R&D units, network operations centers as well as manufacturing and repair operations. The Board of Directors reviews the Company’s investment plans and proposals. The Company has sufficient cash and cash generation capacity to fund expected capital expenditures without external borrowings in 2012. We believe that the Company’s property, plant and equipment and the facilities the Company occupies are suitable for its present needs in most locations. As of December 31, 2011, no material land, buildings, machinery or equipment were pledged as collateral for outstanding indebtedness. CAPITAL EXPENDITURES 2007–2011 | | | | | | | | | | | | | | | | | | | | | SEK billion | | 2011 | | | 2010 | | | 2009 | | | 2008 | | | 2007 | | Capital expenditures | | | 5.0 | | | | 3.7 | | | | 4.0 | | | | 4.1 | | | | 4.3 | | of which in Sweden | | | 1.7 | | | | 1.4 | | | | 1.3 | | | | 1.6 | | | | 1.3 | | as percent of net sales | | | 2.2 | % | | | 1.8 | % | | | 1.9 | % | | | 2.0 | % | | | 2.3 | % |
Cash flow from financing activities Cash flow from financing activities was SEK –6.5 billion. Dividends paid were SEK –7.5 (–6.7) billion and other financing activities net amounted to SEK 1.0 billion. Cash conversion Cash conversion was 40% (112%), below the target of 70%. Over the years 2008–2010, cash conversion was above target. The cash conversion in 2011 was negatively impacted by higher working capital. ERICSSON ANNUAL REPORT ON FORM 20-F 2012 Restricted cash Cash balances in certain countries with restrictions on transfers of funds to the Parent Company as cash dividends, loans or advances amounted to SEK 13.9 (10.8) billion. In this context all countries with currency restrictions are included. In most cases the currency is nonconvertible and flow of funds in a foreign currency requires approval by a central bank or similar. Out of the total amount, China, India, Korea, Brazil and Indonesia are the top five countries accounting for SEK 9.6 billion. BUSINESS RESULTS—REGIONS SALES PER REGION AND SEGMENT 2011 AND 2010 | | | | | | | | | | | | | | | | | | | | | | | | | | | | | | | | | | | | Networks | | | Global Services | | | Multimedia | | | | | | | | SEK billion | | 2011 | | | Percent
change | | | 2011 | | | Percent
change | | | 2011 | | | Percent
change | | | Total
2011 | | | Percent
change | | North America | | | 28.9 | | | | –5% | | | | 18.6 | | | | 5% | | | | 1.3 | | | | 7% | | | | 48.8 | | | | –1% | | Latin America | | | 11.5 | | | | 25% | | | | 9.5 | | | | 23% | | | | 1.0 | | | | 5% | | | | 22.0 | | | | 23% | | Northern Europe and Central Asia | | | 9.7 | | | | 34% | | | | 5.0 | | | | 17% | | | | 0.5 | | | | –20% | | | | 15.2 | | | | 25% | | Western and Central Europe | | | 7.8 | | | | –7% | | | | 10.3 | | | | –2% | | | | 1.0 | | | | –7% | | | | 19.0 | | | | –4% | | Mediterranean | | | 10.7 | | | | 1% | | | | 11.8 | | | | 11% | | | | 1.3 | | | | –5% | | | | 23.8 | | | | 5% | | Middle East | | | 7.4 | | | | 4% | | | | 6.8 | | | | 4% | | | | 1.2 | | | | –13% | | | | 15.5 | | | | 2% | | Sub-Saharan Africa | | | 5.9 | | | | 63% | | | | 3.4 | | | | –26% | | | | 0.9 | | | | –12% | | | | 10.2 | | | | 11% | | India | | | 6.1 | | | | 19% | | | | 3.1 | | | | 13% | | | | 0.5 | | | | –25% | | | | 9.8 | | | | 13% | | China and North East Asia | | | 27.8 | | | | 63% | | | | 9.9 | | | | 19% | | | | 0.5 | | | | –5% | | | | 38.2 | | | | 47% | | South East Asia and Oceania | | | 7.6 | | | | –3% | | | | 5.6 | | | | –14% | | | | 0.7 | | | | 26% | | | | 13.9 | | | | –7% | | Other* | | | 9.1 | | | | 53% | | | | –0.2 | | | | –132% | | | | 1.7 | | | | 57% | | | | 10.6 | | | | 41% | | | | | | | | | | | | | | | | | | | | | | | | | | | | | | | | | | | Total | | | 132.4 | | | | 17% | | | | 83.9 | | | | 5% | | | | 10.6 | | | | 1% | | | | 226.9 | | | | 12% | | Share of total | | | 58 | % | | | | | | | 37 | % | | | | | | | 5 | % | | | | | | | 100 | % | | | | | | | | | | | | | | | | | | | | | | | | | | | | | | | | | | | | | |
| * | Other includes sales of e.g. mobile broadband modules, cables, power modules as well as licensing and IPR. Mobile broadband modules are sold directly by business unit Networks to PC/netbook manufacturers. A central IPR unit manages sales of licenses to equipment vendors or others who wish to use Ericsson’s patented technology. TV solutions are sold both through other equipment vendors as resellers and directly by business unit Multimedia to cable TV operators. |
Regional development The regions are the Company’s primary sales channels. Ericsson reports ten regions, mirroring the internal geographical organization. North America North America is the world’s most developed region in terms of smartphone penetration and mobile data usage. Operators are continuing the implementation of tiered pricing to capitalize on changing user behavior. Half of the net additions of subscriptions in the second half of 2011 came from connected devices or machine to machine communication. Through the year multiple LTE network buildouts have been initiated and launched in both the US and Canada, and Ericsson is a leading supplier to these projects. The networks business developed slower in the second half of 2011 after a period of high operator investments in network capacity. Operators’ focus on cash flow management and operator consolidation also had a negative impact. This was to a large degree offset by a positive uptake in services and multimedia. ERICSSON ANNUAL REPORT ON FORM 20-F 2012 Latin America There is a push for mobile broadband in Latin America, driven by consumer demand for 3G services. Smartphone penetration is still low, but is expected to grow as these handsets become more affordable. Operators show an increasing interest in network performance and Ericsson is taking part in OSS/BSS transformation projects in managed services deals, including network sharing arrangements. Northern Europe and Central Asia The Nordics are mature and advanced markets with strong 3G coverage and LTE commercially available in all countries. Nordic operators are increasingly shifting their business models towards network sharing and the outsourcing of network operations. Deployment of 3G networks started later in the eastern part of the region. Here, operators are focusing on providing coverage and quality in the networks. Mobile broadband is growing rapidly in the region. Many consolidation activities, of both operators and networks, are taking place. In the latter half of the year, network sales slowed, especially in Russia, following strong operator investments in network capacity and coverage. Western and Central Europe Modernization of networks accelerated across the region in 2011. Operator focus is on replacing old 2G/3G equipment with modern, more efficient multi-standard radio base stations. Interest in LTE is limited, with certain countries still to allocate spectrum for this. Penetration of mobile broadband is high, with some operators’ smartphone shipments representing more than half of their totals. Data revenues are growing and represent over 40% with some operators. There is also high interest in managed services and network sharing. Mediterranean This region has seen an impact from weak economies as well as political unrest in Northern Africa. The uptake of mobile broadband is mixed, with the strongest growth in the south west parts of the region. Here, operators are implementing a range of tiered pricing models. Mobile data usage is high in the Mediterranean area, due to the low availability of fixed broadband. Most operators’ investments are for 3G coverage and in the second half of the year, network modernization projects took off. Middle East The Middle East was impacted by political unrest in several countries and by delays in license auctions. As a consequence, some operators have postponed their infrastructure investments and increased their focus on efficiencies. The region has lower penetration rates, mobile broadband adoption and mobile data usage than the world average. The crucial driver for increasing these parameters is the affordability of smartphones. Rollouts of LTE have started in some parts of the region. ERICSSON ANNUAL REPORT ON FORM 20-F 2012 Sub-Saharan Africa Mobile penetration continues to increase rapidly in Africa. Operator focus is still on 2G coverage and capacity buildouts, although some operators are building 3G coverage. With smartphones in the region set to become cheaper, operators are focusing on creating efficiency in their networks to allow them to capitalize on future uptake. Inflation and competition are also driving operators’ need for increased efficiency. This leads them to focus on power consumption reductions and managed services solutions. There is also a need for operators to harmonize policy frameworks to increase data take-up. India Initial 3G rollouts reached a temporary peak in 2011. The Indian market is fragmented and in the near future a telecom policy reform is expected which might make operator consolidation easier. Besides the need for affordable smartphones, availability of dual SIM card phones is a key component in driving mobile data uptake. The Indian market is highly competitive, which drives operator interest in managed services and network sharing. China and North East Asia China’s operators have focused on building 2G capacity with GPRS/EDGE to meet the increase in mobile data traffic from smartphones. In 2011, large scale trials for TD-LTE took place with China Mobile. In Korea and Japan, 3G capacity and LTE coverage rollouts are ongoing, driven by high smartphone penetration, mobile broadband adoption and mobile data usage. In Korea, three LTE networks are live, and Ericsson is a supplier to all of them. South East Asia and Oceania Parts of this region, such as Australia and Singapore, have high penetration rates, adoption and usage. In these areas, LTE is also starting to emerge. Indonesia is moving towards 3G, however take-up is hampered by the affordability of devices. 3G auctions are yet to take place in some markets. Coverage projects, where old equipment is replaced with new, are underway across most markets, as operators build for data growth and seek operating cost efficiencies. The decline in network sales is due to reduced 2G business in Vietnam. The services business declined due to a concluded managed services contract in Australia. BUSINESS RESULTS—SEGMENTS Networks HIGHLIGHTS IN 2011 Increased market share in mobile network equipment by 6 percentage points to 38% (estimated) Market share of more than 60% in LTE Smart Services Router family introduced. Volume deliveries expected in 2012 ERICSSON ANNUAL REPORT ON FORM 20-F 2012 Sales Networks sales increased 17% to SEK 132.4 billion, negatively impacted by a strong SEK in 2011. The increase was an effect of continued high sales in mobile broadband-related equipment including packet core, IP routers and microwave-based backhaul. Demand was especially strong in regions China and North East Asia and North America. The year was characterized by high volumes of mobile broadband equipment and ramp-up of the multi-standard radio base station RBS 6000. The product introduction of the RBS 6000 has been the quickest and most successful in the Company’s history. At the end of the year, the first RBS 6000 with CDMA functionality was shipped. The RBS 6000 accounts for close to 100% of all deliveries of GSM/WCDMA/LTE radio base stations. In the fourth quarter, shipping of the IP Edge router, the Smart Services Router SSR 8000 family, and the Antenna Integrated Radio unit (AIR) also commenced. In 2010, Ericsson acquired Nortel’s CDMA business in order to strengthen its position in North America. Ericsson is now established as the leader in this market. CDMA sales increased slightly in 2011. At the end of the year the Company saw the expected decline in CDMA sales and subsequent rapid shift to LTE. The CDMA acquisition has created substantial value for the Company. In March, the earthquake and tsunami in Japan caused temporary delays in the supply chain, but by the third quarter lead times were back to normal. Profitability Operating margin decreased to 13% (15%). The margin was negatively impacted by planned R&D investments to accelerate technology leadership. Operating margin in 2010 was 11% including restructuring charges. Cost structure In the Networks segment, cost of sales is quite large and to a large part variable. To reduce variable cost, the Company works with product rationalization and product substitution. R&D is a significant cost item and for this reason it is important to focus on R&D effectiveness and efficiency. It is essential to ensure global platforms and common components across the whole portfolio. To maximize the outcome of R&D investment, the Company also seeks to give R&D sites clear accountability and the same IS/IT environment. The networks business Sales to network operators are normally based on multi-year frame agreements after an initial open tender. During the frame agreement, software, equipment, services and spare parts are called off according to price lists. Prior to the introduction of the multi-standard radio base station RBS 6000, operators could have co-siting, with one supplier for GSM and another for WCDMA. Today, a multi-standard approach means that all technologies are supported by one radio base station. Any supplier has to be equally capable of all technologies. R&D investments and scale are therefore essential for a supplier to stay competitive. The footprint of multi-standard radio access network increases opportunities for additional network business, e.g. backhaul and core networks. Following radio and core footprint is a significant software sales opportunity based on capacity, functionality and new features. ERICSSON ANNUAL REPORT ON FORM 20-F 2012 Competitors In the networks segment, Ericsson competes mainly with telecommunication equipment suppliers such as Alcatel-Lucent, Cisco, Huawei, Juniper, Nokia Siemens Networks, Samsung and ZTE. The Company also competes with local and regional manufacturers and providers of telecommunications equipment. Global Services HIGHLIGHTS IN 2011 More than 2 billion subscribers in networks for which Ericsson provides support Over 900 million subscriber in networks managed by Ericsson 500 million subscribers in network operation contracts Sales Global Services sales increased 5% to SEK 83.9 (80.1) billion, driven by network rollout, consulting and systems integration. Professional Services sales were SEK 58.8 billion, up 1% from 2010. Currency adjusted sales of Professional Services increased 7%. The increase is mainly a result of increased sales of consulting and systems integration. Managed Services sales decreased by –1% to SEK 21.0 billion. Currency adjusted sales increased 7%. The growth reflects the 70 (54) signed managed services contracts, of which 32 (26) were extensions or expansions. More than 60% of Professional Services sales were recurring. Network Rollout sales amounted to SEK 25.1 (21.6) billion, an increase of 16%, driven by high volumes of network modernization. Profitability Global Services’ operating margin decreased to 7% (11%). The margin was negatively impacted by a loss in Network Rollout. Operating margin in 2010 was 8% including restructuring charges. Operating margin for Professional Services amounted to 13% (15%). Operating margin in 2010 was 11% including restructuring charges. Operating margin for Network Rollout amounted to –8% (1%), due to high activity levels related to network modernization projects in Europe and 3G rollouts in India. Operating margin in 2010 was 0% including restructuring charges. Cost structure In the services segment, almost all cost resides in cost of sales and the majority of the cost is related to employee costs. A few years ago, the cost of sales base was to a higher degree variable. With the increasing share of managed services, the portion of fixed costs has increased, which makes it important to find scale by winning more deals in the same geographical area. Another measure to keep cost down is to establish a one-to-many delivery model. The development of global tools, methods and processes are also crucial in order to secure efficiencies and knowledge sharing. ERICSSON ANNUAL REPORT ON FORM 20-F 2012 In managed services, Ericsson often insources employees from the customer. In the transition period, restructuring costs are taken, e.g. for replacement of IS/IT systems and migration of employees into new systems and premises. In the transformation phase, following the transition, synergies are carried through. The services business Ericsson’s offering covers all areas within an operator’s operational scope. The Company’s service offering includes consulting, systems integration, managed services, network deployment and integration, education and support services. Ericsson provides services for both mobile and fixed telecom networks as well as for IT and broadcast networks and in some cases for adjacent industries such as the utilities industry. Most often operators turn to Ericsson for support in a certain part of their operations. Contracts for managed services and customer support are typically for five to seven years. Payments with regularity provide a lower rate of working capital. Consulting and systems integration contracts are shorter and paid after fulfillment of contract. In managed services deals the contracts are normally split into fixed and variables, where the variables are a smaller part. The invoicing is based on fulfillment of certain key performance indicators and projects. When an operator explores the possibility of a managed services deal, the financial strength of the supplier is a prerequisite. Network rollout includes coverage and modernization projects with a large part of third-party sourcing, making it a lower-margin business. The Company rolls out its own equipment, but also has high multi-vendor skills in all other parts of the services business. Competitors Competition in services includes the traditional telecommunication equipment suppliers. The Company also competes with companies such as Accenture, HP, IBM, Oracle, Tata Consultancy Services and Tech Mahindra. Among the competition is also a large number of smaller but specialized companies operating on a local or regional basis. Multimedia (CHANGED NAME TO SUPPORT SOLUTIONS IN 2012) HIGHLIGHTS IN 2011 13 new contracts signed for mobile broadband charging World’s largest IPTV upgrade in Taiwan 11 new customers for convergent charging and billing Sales Multimedia sales increased 1% to SEK 10.6 (10.5) billion, negatively impacted by political unrest in the Middle East and weak development in India. Profitability Operating margin was –5% (–4%). Restructuring charges had no material impact on profitability. ERICSSON ANNUAL REPORT ON FORM 20-F 2012 Cost structure In the multimedia segment, cost of sales is low and the majority is variable, due to the fact that third party hardware is used, on which the Company implements its software. Multimedia is a software business with a high degree of fixed R&D cost for software development. The OSS and BSS business The OSS/BSS business is divided into two different sales types: Transformation sales Simplification and consolidation of processes, operations, systems and platforms. Key components are software solutions, consulting and systems integration. Typically these projects last for 18–36 months. The software part represents 25–40% of the contract value and the rest is consulting and systems integration. Product sales Product sales is mainly expansions and upgrades, e.g. upgrading from Ericsson Charging System version 4 to 5. Key components are software solutions and systems integration. Typically these projects last for 1–12 months. The software part represents 70–90% of the contract value and the rest is systems integration. Telcordia acquisition In 2011, Ericsson announced the acquisition of Telcordia, a global leader in the development of software and services for OSS/BSS. The price was USD 1.15 billion in an all cash transaction, on a cash and debt-free basis. The acquisition is expected to be accretive to Ericsson’s earnings per share within twelve months. Telcordia has approximately 2,600 employees. During its last fiscal year, ended January 31, 2011, Telcordia generated revenues of USD 739 million. Telcordia’s revenues will be split between segments Multimedia and Global Services according to portfolio mix. With the acquisition, Ericsson aspires to a leading position in the OSS and BSS market. Competitors In the multimedia segment, Ericsson competes in rather fragmented markets with many local players. Competitors vary depending on the solution being offered. In the OSS and BSS market, they include many of the traditional telecommunication equipment suppliers as well as IT suppliers, such as Amdocs, Comverse and Oracle. Competition in the TV business includes Harmonic and Thompson. Sony Ericsson Sony Ericsson is a 50/50 joint venture between Sony Corporation and Ericsson, established in 2001. Sony Ericsson is accounted for according to the equity method. In October 2011, it was announced that Sony Corporation would acquire Ericsson’s 50% share in Sony Ericsson. As part of the deal, Sony and Ericsson will also enter into a broad IP cross-licensing agreement and create a wireless connectivity initiative to drive connectivity across multiple platforms. The transaction is a logical strategic step that makes it possible for Ericsson to focus on enabling connectivity for all devices. Sony Ericsson will become a wholly-owned subsidiary of Sony and integrated into Sony’s broad platform of network-connected consumer electronics products. The agreed cash consideration for the transaction is a EUR 1.05 billion cash payment. ERICSSON ANNUAL REPORT ON FORM 20-F 2012 Sony Ericsson’s units shipped in 2011 decreased by –20% to 34.4 (43.1) million while the average selling price increased by 4% to EUR 152 (146). Sales decreased by –17% to EUR 5.2 (6.3) billion. In 2011, Sony Ericsson had a market share of 10% in the smartphone market, measured in units, and 10% measured in value. Gross margin decreased during the year to 28% (29%) attributed to product and geographic mix. Income before taxes, including restructuring charges, was EUR –0.24 (0.15) billion. Income decreased during the year due to declining gross margin and increased operating expenses. The result includes restructuring charges of EUR 93 million. Ericsson’s share in Sony Ericsson’s income before taxes was SEK –1.2 (0.7) billion. Sony Ericsson’s primary competitors include Apple, HTC, LG, Motorola, Nokia, RIM and Samsung. ST-Ericsson ST-Ericsson is a 50/50 joint venture between STMicroelectronics and Ericsson, established in February, 2009. ST-Ericsson is accounted for according to the equity method. At the end of 2011, ST-Ericsson was still in a shift from legacy to new products. Though its path to success is challenging, ST-Ericsson is, when entering 2012, continuing to focus on securing the successful execution and delivery of its new products to customers while lowering its break-even point. The changes in the business environment at a large customer during 2011 reduced demand for legacy products and delayed the ramp-up of new products with that customer. In the light of the business environment at the end of 2011, ST-Ericsson’s CEO is reviewing the company’s strategic plan and financial prospects. Ericsson, together with its partner STMicroelectronics, is firmly committed to supporting ST-Ericsson in the transition to turn-over to sustainable profitability and cash generation. As a result of the strategic review, Ericsson may consider additional actions to solidify and accelerate ST-Ericsson’s path to profitability. In such an event, or in case of a significant worsening of business prospects, the value of ST-Ericsson for Ericsson could decrease to a value significantly lower than the current carrying amount of ST-Ericsson on Ericsson’s books and Ericsson might be required to take an impairment charge. Sales in 2011 declined –28% to USD 1.7 (2.3) billion. The operating loss for the year, adjusted for restructuring costs, was USD –0.7 (–0.4) billion. ST-Ericsson reports in US-GAAP. Ericsson’s share in ST-Ericsson’s income before taxes, adjusted to IFRS, was SEK –2.7 (–1.8) billion. Adjustments for IFRS compliance mainly consist of capitalization of R&D expenses for hardware development. The Company’s net financial position was USD –798 (–82) million at year-end. At the end of the year, ST-Ericsson had utilized USD 800 million of a short-term credit facility granted on a 50/50 basis by the parent companies. In December 2011, a new President and CEO of ST-Ericsson was appointed. ST-Ericsson’s major competitor is Qualcomm. The market is growing in complexity as several new operating systems for handsets and other devices have been launched, e.g. Google’s Android, Microsoft’s Windows phone and Samsung’s Bada. MEMORANDUM AND ARTICLES OF ASSOCIATION Telefonaktiebolaget LM Ericsson is entered under no. 556016–0680 in the Company Register kept by the Swedish Companies Registration Office. Our Company’s objective and purposes are described in §2 of the Articles of Association. ERICSSON ANNUAL REPORT ON FORM 20-F 2012 Our Articles of Association do not stipulate anything regarding: a director’s power to vote on a proposal, arrangement, or contract in which the director is materially interested our directors’ power to vote for compensation to themselves our directors’ borrowing powers retirements rules for our directors or the number of shares required for a director’s qualification. Applicable provisions are found in the Swedish Companies Act, as referred to in “Certain Powers of Directors and the President” below. There are no age limit restrictions for directors and they are not required to own any shares in the Company. Share Capital, Increases of Share Capital and Preferential Rights of Shareholders The Articles of Association of Ericsson provide that the share capital of the Company may not be less than SEK 6,000,000,000 nor more than SEK 24,000,000,000, and that the number of shares in the Company shall amount to no less than 3,000,000,000 and no more than 12,000,000,000. The registered share capital is SEK 16,525,258,678 and the Company has in total issued 3,305,051,735 shares. The Company’s shares are divided into three series: Class A shares, Class B shares and Class C shares; however, no Class C shares are currently outstanding. Under the Swedish Companies Act of 2005, applicable as of January 1, 2006 (the “Swedish Companies Act”), shareholders must approve each issue of additional shares either by deciding on the share issue at a shareholders’ meeting, or by a shareholders’ approval of a decision on a share issue by the Board, or by giving an authorization to the Board to decide about a share issue. If we decide to issue new Class A, Class B and Class C shares by means of a cash issue, or an issue against payment through set-off of claims, Class A, Class B and Class C shareholders (except for Ericsson and its subsidiaries, in the event they hold shares in Ericsson) have a primary preferential right to subscribe for new shares of the same type in relation to the number of shares previously held by them. Shares not subscribed for through a preferential right shall be offered to all shareholders for subscription on a pro rata basis. If we decide to issue new shares of only one series by means of a cash issue or an issue against payment through set-off of claims, all shareholders, regardless of whether their shares are Class A, Class B or Class C, are entitled to a preferential right to subscribe for new shares in proportion to the number of shares previously held by them. Shareholders may vote to waive shareholders’ preferential rights at a general meeting. If we decide to issue warrants or convertibles through a cash issue or an issue against payment through set-off of claims, the shareholders have preferential rights to subscribe to warrants as if the issue were of the shares that may be subscribed to pursuant to the warrant and, respectively, preferential rights to subscribe to convertibles as if the issue were of the shares that the convertibles may be converted to. The above does not constitute any restriction to waive the shareholders’ preferential rights when deciding on either a cash issue, an issue against payment through set-off of claims, an issue of warrants or an issue of convertibles. Dividends Our Class A and Class B shareholders have the same right to dividends, while Class C shareholders have a right to a yearly dividend as described in article 15 of our Articles of Association. No Class C shares are currently outstanding. Under Swedish law, only a general meeting of shareholders may decide on payment of dividends, which may not exceed the amount proposed by the Board of Directors (except in certain limited circumstances), and ERICSSON ANNUAL REPORT ON FORM 20-F 2012 may only be paid from funds legally available for that purpose. Under Swedish law, no interim dividends may be paid in respect of any fiscal period for which audited financial statements of the company have not yet been adopted by the annual general meeting of shareholders. The market practice in Sweden is for dividends to be paid annually. Under the Swedish Companies Act, dividends to shareholders and other transfers of value from a company—such as purchases of own shares (see below)—may only be made in case the company’s restricted equity remains fully covered after the transfer of value has been made. The calculation shall be based upon the most recently adopted balance sheet, and any changes in the restricted equity that has occurred after the balance sheet date shall be taken into account. In addition, dividends to shareholders and other transfers of value from the company may only be made if this is justifiable taken into account the type of business activities of the company, their scope and risks related thereto and the company’s need for financial resources, its liquidity and financial position. In respect of parent companies, also the business activities of the group, their scope and risks related thereto and the group’s need for financial resources, its liquidity and financial position should be taken into account. The Company’s shares are registered in the computerized book-entry share registration system administered by Euroclear Sweden AB (“Euroclear”). The rights attached to shares eligible for dividends accrue to those persons whose names are recorded in the register of shareholders on the record day. The dividends are then sent to a specified account as directed by the person registered with Euroclear, or to the address of that person. The relevant record day must, in most circumstances, be specified in the resolution declaring a dividend or resolving upon a capital increase or any similar matter in which shareholders have preferential rights, or the Board of Directors must be authorized to determine the relevant record day. Where the registered holder is a nominee, the nominee receives, for the account of the beneficial owner, dividends and, on issues of shares with preferential rights for the shareholders, shares, as well as rights. Dividends are remitted in a single payment to the nominee who is responsible for the distribution of such dividends to the beneficial owner. A similar procedure is adopted for share issues. Specific authority to act as a nominee must be obtained from Euroclear. The nominee must issue a public report to Euroclear every third month, listing all beneficial holders of more than 500 shares. Euroclear is required to keep a register with regard to any holding on behalf of a single beneficial owner in excess of 500 shares in any one company. This list must reveal the names of the beneficial owner and must be open to public inspection. Voting In a general meeting of Ericsson, each Class A share shall carry one vote, each Class B share one tenth of one vote and each Class C share one-thousandth of one vote. We are required to publish notices to attend annual general meetings no earlier than six weeks and no later than four weeks prior to the general meeting and the same notice period requirements apply regarding extraordinary general meetings concerning changes in our articles of association. Notices to attend other types of extraordinary general meetings at Ericsson must be published no earlier than six weeks and no later than three weeks prior to the general meeting. Directors are elected during the annual general meeting for a period of one year at a time and do not stand for reelection at staggered intervals. A shareholder may attend and vote at the meeting in person or by proxy. For companies whose shares are registered in a central securities depositary register, proxies are valid for up to five years from the date of issuance. Any shareholder wishing to attend a general meeting must notify us no later than on the day specified in the notice, preferably before 4:00 p.m. (CET). We are required to accept all notifications of attendance received at least five business days (Saturdays normally included) prior to the meeting. A person designated in ERICSSON ANNUAL REPORT ON FORM 20-F 2012 the register as a nominee (including the depositary of the ADSs) is not entitled to vote at a general meeting, nor is a beneficial owner whose share is registered in the name of a nominee (including the depositary of the ADSs) unless the beneficial owner first arranges to have such owner’s own name entered in the register of shareholders maintained by Euroclear no later than the designated record day. Under the Swedish Companies Act, resolutions are passed by a simple majority of votes cast at the meeting with the chairman of the meeting having a decisive vote (except in respect of elections), unless otherwise required by law or a company’s articles of association. Under the Swedish Companies Act, certain resolutions require special quorums and majorities, including, but not limited to, the following: | A | a resolution to amend the articles of association requires a majority of two-thirds of the votes cast as well as two-thirds of the shares represented at the meeting, except in those circumstances described in B—D below; |
| B | a resolution to amend the articles of association which reduces any shareholder’s rights to profits or assets, restricts the transferability of shares or alters the legal relationship between shares, normally requires the unanimous approval of the shareholders present at the meeting and who hold nine-tenths of all outstanding shares; |
| C | a resolution to amend the articles of association for the purpose of limiting the number of shares with which a shareholder may vote at a general meeting or allocating part of the net profit for the fiscal year to a restricted fund or limiting the use of the company’s profits or assets in a liquidation or dissolution, normally requires the approval of shareholders representing two-thirds of the votes cast and nine-tenths of the shares represented at the meeting; |
| D | a resolution of the kind referred to under B or C above may, however, be taken with a lower supermajority requirement if the amendments referred to therein will only adversely affect specific shares or classes of shares. In such cases, the requirement under a above will apply together with the following separate supermajority: (a) where only a class of shares is adversely affected, approval of the owners of one-half of all shares of such class and nine-tenths of the shares of such class represented at the meeting, or (b) where the shares adversely affected do not constitute a class of shares, the unanimous approval of all such affected outstanding shares present at the meeting and who hold nine-tenths of all outstanding shares adversely affected; |
| E | a resolution to issue, approve or authorize the issuance for cash of new shares, warrants or convertibles with a deviation from the preferential right for existing shareholders requires a two-thirds majority of votes cast at the meeting as well as two-thirds of the shares represented at the meeting; |
| F | a resolution to reduce the outstanding share capital requires a two-thirds majority of votes cast at the meeting as well as two-thirds of the shares represented at the meeting. In case there are several classes of shares in a company, the above described majority requirement shall apply also within each share class represented at the meeting and for which the rights of the shares are adversely affected; and |
| G | a resolution to approve a merger requires a two-thirds majority of the votes cast at the meeting and two-thirds of the shares represented at the meeting (however, under certain circumstances a higher majority is required). |
At a general meeting of shareholders, a shareholder or proxy for one or more shareholders may cast full number of votes represented by the holder’s shares. Purchase of Own Shares A Swedish public limited liability company whose shares are traded on a regulated market place within the European Economic Area (“EEA”) or a market place comparable to a regulated market place outside the EEA is entitled to purchase its own shares under certain conditions. A purchase by us of our own shares may take place ERICSSON ANNUAL REPORT ON FORM 20-F 2012 only if (a) the purchase has been decided upon by a general meeting of shareholders or the Board has been authorized by a general meeting of shareholders, in both cases by a two thirds majority of votes cast at the meeting as well as two-thirds of the shares represented at the meeting, (b) the purchase is effected on a regulated market place within the EEA or a market place comparable to a regulated market place outside the EEA (in the latter case with the approval of the Swedish Financial Supervisory Authority the “SFSA”) or pursuant to an offer to all shareholders or holders of a specific class of shares, (c) the Company’s restricted equity will still be fully covered and the purchase is justifiable taken into account the type of business activities of the Company and the group, their scope and risks related thereto and the Company’s and the group’s need for financial resources, its liquidity and financial position, and (d) we and our subsidiaries do not hold or, as a result of purchase, will not hold in excess of 10% of all our outstanding shares. As of December 31, 2012, the Company held an aggregate of 84,798,095 treasury stock of Class B shares. Investment Restrictions There are no limitations imposed by Swedish law or by our Articles of Association in respect of the rights of non-residents or foreign persons to purchase, own or sell securities issued by us. There are, however, certain flagging and ownership examination rules that apply, irrespective of nationality. Pursuant to the Swedish Financial Instruments Trading Act any change in a holding of shares, depository receipts with voting rights or financial instruments that entitle the holder to acquire shares in issue in a Swedish limited liability company whose shares are admitted for trading on a regulated market place within the EEA shall be reported by the holder to the company and the SFSA, where the change entails that the holder’s portion of all shares or votes in the company reaches, exceeds or falls below any of the limits of 5, 10, 15, 20, 25, 30, 50, 66 2/3 or 90 per cent. Such a change should, as a main rule, be reported not later than the trading day following the day on which the party with a duty to report has entered into an agreement for the acquisition or transfer of shares or any other change to the shareholding has occurred. In addition, the Act on Reporting Obligations Regarding Certain Holdings of Financial Instruments requires, among other things, certain individuals who own shares representing 10% or more of the share capital or the voting rights in a Swedish public limited liability company whose shares are traded on a regulated market within the EEA to report such ownership to the SFSA, which keeps a public register based on the information contained in such reports, and also to report any changes in such ownership within five business days. EXCHANGE CONTROLS There is no Swedish legislation affecting a) the import or export of capital or b) the remittance of dividends, interest or other payments to non-resident holders of our securities except that, subject to the provisions in any tax treaty, dividends are subject to withholding tax. TAXATION General The taxation discussion set forth below does not purport to be a complete analysis or listing of all potential tax effects relevant to the acquisition, ownership or disposition of Class B shares or ADSs. The statements of United States and Swedish tax laws set forth below are based on the laws in force as of the date of this report and may be subject to any changes in United States or Swedish law, and in any double taxation convention or treaty between the United States and Sweden, occurring after that date, which changes may then have retroactive effect. ERICSSON ANNUAL REPORT ON FORM 20-F 2012 Specific tax provisions may apply for certain categories of tax payers. Your tax treatment if you are a holder of Class B shares or ADSs depends in part on your particular situation. If you are a holder of Class B shares or ADSs, you should therefore consult a tax advisor as to the tax consequences relating to your particular circumstances resulting from the ownership of Class B shares or ADSs. The tax consequences to holders of ADSs, as discussed below, apply equally to holders of Class B shares. Certain Swedish Tax Considerations This section describes the material Swedish income and net wealth tax consequences for a holder of ADSs or Class B shares who is not considered to be a Swedish resident for Swedish tax purposes. This section applies to you only if you are a holder of portfolio investments representing less than 10% of capital and votes and is not applicable if the ADSs or Class B shares pertain to a permanent establishment or fixed place of business in Sweden. TAXATION ON CAPITAL GAINS Generally, non-residents of Sweden are not liable for Swedish capital gains taxation with respect to the sale of ADSs or Class B shares. However, under Swedish tax law, capital gains from the sale of shares in Swedish companies and certain other securities by an individual may be taxed in Sweden at a rate of 30% if the seller has been a resident of Sweden or has lived permanently in Sweden at any time during the year of the sale or the 10 calendar years preceding the year of the sale (absent treaty provisions to the contrary). The provision is applicable on ADSs or Class B shares. From 1 January 2008 the rule has been extended so that it also applies to shares in foreign companies, provided that the shares were acquired during the time that the person was liable to tax in Sweden. This provision may, however, be limited by tax treaties that Sweden has concluded with other countries. Under the tax treaty between Sweden and the United States (the “U.S. Tax Treaty”), this provision applies for ten years from the date the individual became a non-resident of Sweden. TAXATION ON DIVIDENDS A Swedish dividend withholding tax at a rate of 30% is imposed on dividends paid by a Swedish corporation, such as us, to non-residents of Sweden. The same withholding tax applies to certain other payments made by a Swedish corporation, including payments as a result of redemption of shares and repurchase of stock through an offer directed to its shareholders. Exemption from the withholding tax or a lower tax rate may apply by virtue of a tax treaty. Under the U.S. Tax Treaty, the withholding tax on dividends paid on portfolio investments to eligible U.S. holders is reduced to 15%. Under all Swedish tax treaties, except the tax treaty with Switzerland, withholding tax at the applicable treaty rate should be withheld by the payer of the dividends. With regard to dividends paid from shares in corporations registered with the Euroclear Sweden (such as our shares), a reduced rate of dividend withholding tax under a tax treaty is generally applied at the source by the Euroclear Sweden or, if the shares are registered with a nominee, the nominee, as long as the person entitled to the dividend is registered as a non-resident and sufficient information regarding the tax residency of the beneficial owner is available to the Euroclear Sweden or the nominee. In those cases where Swedish withholding tax is withheld at the rate of 30% and the person who received the dividends is entitled to a reduced rate of withholding tax under a tax treaty, a refund may be claimed from the Swedish tax authorities before the end of the fifth calendar year following the year that the distribution was made. ERICSSON ANNUAL REPORT ON FORM 20-F 2012 TAXATION ON INTEREST No Swedish withholding tax is payable on interest paid to non-residents of Sweden. NET WEALTH TAXATION The Swedish net wealth tax has been abolished from 1 January 2007. Certain United States Federal Income Tax Consequences The following discussion is a summary of the material United States federal income tax consequences relevant to the ownership and disposition of ADSs or Class B shares. This discussion is based on the tax laws of the United States (including the Internal Revenue Code of 1986, as amended (the “Code”), its legislative history, existing and proposed regulations thereunder, published rulings and court decisions) as in effect on the date hereof, all of which are subject to change, possibly with retroactive effect. The discussion is not a full discussion of all tax considerations that may be relevant to the ownership and disposition of ADSs or Class B shares. The discussion applies only if you will hold the ADSs and/or the Class B shares as capital assets and you use the USD as your functional currency. It does not deal with the tax treatment of investors subject to special rules, such as grantor trusts, real estate investment trusts, regulated investment companies, banks, brokers or dealers in securities or currencies, traders in securities that elect to use a mark-to-market method of recording for their securities holdings, financial institutions, insurance companies, tax-exempt entities, investors liable for alternative minimum tax, holders (either actually or constructively) of 10% or more of our Class B shares, persons holding ADSs and/or Class B shares as part of a hedging, straddle, conversion or constructive sale transaction and persons who are resident or ordinarily resident in Sweden. In addition, investors holding ADSs and/or Class B shares indirectly through partnerships are subject to special rules not discussed below. You should consult your own tax advisors about the United States federal, state, local and foreign tax consequences to you of the ownership and disposition of the ADSs or Class B shares. The discussion below applies to you only if you are a beneficial owner of ADSs and/or Class B shares not resident in Sweden for purposes of the U.S. Tax Treaty and you are, for United States federal income tax purposes, (1) a citizen or resident of the United States, (2) a corporation or any other entity treated as a corporation that is organized in or under the laws of the United States or its political subdivisions, including the District of Columbia, (3) a trust if all of the trust’s substantial decisions are subject to the control of one or more United States persons and the primary supervision of the trust is subject to a United States court, or if a valid election is in effect with respect to the trust to be taxed as a United States person, or (4) an estate the income of which is subject to United States federal income taxation regardless of its source. The discussion below assumes that the representations contained in the deposit agreement are true and that the obligations in the deposit agreement and any related agreement will be complied with in accordance with the terms. If you hold ADSs, you will be treated as the holder of the underlying Class B shares represented by those ADSs for United States federal income tax purposes. TAXATION OF ADSS OR CLASS B SHARES Dividends Subject to the passive foreign investment company rules discussed below, the gross amount of dividends paid (before reduction for any Swedish withholding taxes) with respect to the ADSs or Class B shares generally will be included in your gross income as ordinary income from foreign sources to the extent paid out of our current or accumulated earnings and profits (as determined for United States federal income tax purposes). Distributions in excess of earnings and profits will be treated as a non-taxable return of capital to the extent of ERICSSON ANNUAL REPORT ON FORM 20-F 2012 your adjusted tax basis in the ADSs or Class B shares and thereafter as capital gain. The dividends will not be eligible for the dividends received deduction available to corporations in respect of dividends received from other U.S. corporations. The amount of any dividend paid in SEK will be the USD value of the dividend payment based on the exchange rate in effect on the date of receipt (or constructive receipt) by you, in the case of Class B shares or by the depositary, in the case of ADSs, whether or not the payment is converted into USD at that time. Your tax basis in the SEK received will equal such USD amount. Gain or loss, if any, recognized on a subsequent sale or conversion of the SEK will be U.S. source ordinary income or loss. If you are a non-corporate holder of ADSs or Class B shares, dividends you receive on the ADSs or Class B shares may be taxed at the lower applicable capital gains rate provided that (1) we are not a passive foreign investment company (as discussed below) for either our taxable year in which the dividend was paid or the preceding taxable year, (2) certain holding period requirements are met, (3) you are not under any obligation to make related payments with respect to substantially similar or related property and (4) either (a) in the case of ADSs our ADSs continue to be listed on the Nasdaq Stock Market (or a national securities exchange that is registered under section 6 of the Securities Exchange Act of 1934, as amended) or (b) we are eligible for the benefits of the U.S. Tax Treaty. You should consult your own tax advisors regarding the availability of the lower rate for dividends paid with respect to ADSs or Class B shares. Subject to certain limitations, you will generally be entitled to receive credit against your United States federal income tax liability (or a deduction against your United States federal taxable income) with respect to any Swedish tax withheld in accordance with the U.S. Tax Treaty and paid over to Sweden. If a refund of the tax withheld is available to you under the laws of Sweden or under the U.S. Tax Treaty, the amount of tax withheld that is refundable will not be eligible for such credit against your United States federal income tax liability (and will not be eligible for the deduction in computing your United States federal taxable income). For foreign tax credit limitation purposes, the dividend will be income from sources without the United States, and will generally be treated as “passive category income” (or, in the case of certain holders, “general category income”). SALE OR EXCHANGE OF ADSS OR CLASS B SHARES Subject to the passive foreign investment company rules discussed below, you will generally recognize capital gain or loss on the sale or other disposition of the ADSs or Class B shares equal to the difference between the USD value of the amount realized and your adjusted tax basis (determined in USD) in the ADSs or Class B shares. Such gain or loss will be capital gain or loss and will generally be treated as arising from U.S. sources for foreign tax credit limitation purposes. The amount realized on a disposition of ADSs or Class B shares will generally be the amount of cash you receive for the ADSs or Class B shares (which, in the case of payment in a non-U.S. currency, will equal the USD value of the payment received determined on (a) the date of receipt of payment if you are a cash basis taxpayer and (b) the date of disposition if you are an accrual basis taxpayer). If the ADSs or Class B shares are treated as traded on an “established securities market,” if you are a cash basis taxpayer (or, if you are an accrual basis taxpayer, if you so elect) you will determine the USD value of the amount realized by translating the amount received at the spot rate of exchange on the settlement date of the sale. You will have a tax basis in any foreign currency received equal to the USD amount realized. Any gain or loss you realize on a subsequent conversion of foreign currency will be U.S. source ordinary income or loss. PASSIVE FOREIGN INVESTMENT COMPANY STATUS A non-U.S. corporation is a passive foreign investment company (a “PFIC”) in any taxable year in which, after taking into account the income and assets of certain subsidiaries, either (a) at least 75% of its gross income ERICSSON ANNUAL REPORT ON FORM 20-F 2012 is passive income or (b) at least 50% of the quarterly average value of its assets is attributable to assets that produce or are held to produce passive income. Based on the market value of our shares, the composition of our assets and income and our operations, we believe we were not a PFIC during the year 2012. However, whether or not we will be considered a PFIC will depend on the nature and source of our income and the value of our assets, as determined from time to time. If we are treated as a PFIC, we will not provide information necessary for the “qualified electing fund” election as the term is defined in the relevant provisions of the Code. You should consult your own tax advisors about the consequences of our potential classification as a PFIC. If we were a PFIC, for any taxable year in which you held ADSs or Class B shares, you would be subject to special rules with respect to: any gain realized on the sale or other disposition of ADSs or Class B shares; and any “excess distribution” made to you (generally, any distributions to you in respect of ADSs or Class B shares during a single taxable year that are, in the aggregate, greater than 125% of the average annual distributions received by you in respect of ADSs or Class B shares during the three preceding taxable years or, if shorter, your holding period for ADSs or Class B shares). Under these rules: the gain or excess distribution would be allocated ratably over your holding period for ADSs or Class B shares; the amount allocated to the taxable year in which the gain or excess distribution was realized and any year before we became a PFIC would be taxable as ordinary income and the amount allocated to each prior year, other than the current year and any taxable year prior to the first taxable year in which we were a PFIC, would be subject to tax at the highest applicable marginal tax rate in effect for each such year; and an interest charge would be imposed. If we are a PFIC for any taxable year, you will also be deemed to own shares in any of our subsidiaries that are also PFICs in such a year. As an alternative to the special rules described above, holders of “marketable stock” in a PFIC may elect mark-to-market treatment with respect to their ADSs or Class B shares. ADSs or Class B shares will not be considered marketable stock unless they are regularly traded on a qualified exchange or other market. If the mark-to-market election is available and you elect mark-to-market treatment you will, in general, include as ordinary income each year an amount equal to the increase in value of your ADSs or Class B shares for that year (measured at the close of your taxable year) and will generally be allowed a deduction for any decrease in the value of your Class B shares for the year, but only to the extent of previously included mark-to-market income. In addition, any gain you recognize upon the sale or other disposition of the ADSs or Class B shares will be treated as ordinary income and any loss will be treated as ordinary loss, but only to the extent of previously included mark-to-market income. However, a mark-to-market election would likely be unavailable with respect to your proportionate share in any of our subsidiaries that are PFICs. If you own ADSs or Class B shares during any year in which we are a PFIC, you will generally be required to make an annual return on IRS Form 8621. INFORMATION REPORTING AND BACKUP WITHHOLDING In general, information reporting requirements may apply to dividends paid in respect of ADSs or Class B shares and the proceeds received on the sale or exchange of the ADSs or Class B shares within the United States or by a broker with certain United States connections. Backup withholding may apply to payments to you of dividends paid in respect of ADSs or Class B shares or the proceeds of a sale or other disposition of ADSs or Class B shares if you fail to provide an accurate taxpayer identification number (certified on IRS Form W–9) or, ERICSSON ANNUAL REPORT ON FORM 20-F 2012 upon request, to certify that you are not subject to backup withholding, or otherwise to comply with the applicable requirements of backup withholding. The amount of any backup withholding from a payment to you will be allowed as a credit against your United States federal income tax liability and a refund of any excess amount withheld under the backup withholding rules may be obtained by filing the appropriate claim for refund with the IRS and furnishing any required information. ADDITIONAL REPORTING REQUIREMENTS Certain holders who are individuals may be required to report information relating to an interest in ADSs or Class B shares, subject to certain exceptions (including an exception for ADSs or Class B shares held in accounts maintained by certain financial institutions). Holders should consult their tax advisors regarding the effects, if any, of these requirements on their ownership and disposition of ADSs or Class B shares. DEPOSITARY FEES AND CHARGES FEES AND CHARGES PAYABLE BY ADS HOLDERS | | | | | | | | | Service | | Rate | | By whom paid | | | | | | 1) | | Receipt of deposits and issuance of receipts | | USD 5 per 100 American Depositary Shares of fraction thereof | | Party to whom receipts are issued | | | | | | 2) | | Delivery of deposited shares against surrender of receipts | | USD 5 per 100 American Depositary Shares or fraction thereof | | Party surrendering receipts | | | | | | 3) | | Payments of dividends distributions or rights offering is respect of shares | | No charge | | Not applicable |
Except as otherwise provided in the Deposit Agreement, any and all other expenses of the Depositary, including without limitation, expenses or charges for printing, stationery, postage, insurances, cables, etc, are to be borne by the Depositary, or by the Company in accordance with agreements entered into from time to time with the Company. Fees payable by the Depositary to the Issuer Citibank, as depositary, has agreed to reimburse Ericsson USD 5 million per year for expenses related to our ADS program (the “Program”), including Program-related legal fees, expenses related to investor relations in the US, US investor presentations, ADS-related financial advertising and public relations, fees and expenses of Citibank as administrator of the ADS Direct Plan, fees in relation to our Form 20-F and SOX compliance. Citibank has further agreed to waive other ADS program related expenses amounting to USD 33,128.79 associated with the administration of the Program. CORPORATE GOVERNANCE REQUIREMENTS The Ericsson Board of Directors is subject to, and applies, a variety of independence requirements. However, it can rely on exemptions from certain U.S. requirements, including those that are different from Swedish Law. ERICSSON ANNUAL REPORT ON FORM 20-F 2012 Independence requirements on the board of directors: A majority of the members of the board of directors must be independent in accordance with the NASDAQ rules. Ericsson relies on an exemption for employee representative directors from NASDAQ’s independence requirements. Independence requirements on the audit committee: All members of the audit committee must be independent in accordance with the SEC and the NASDAQ rules. The SEC rules include a specific exemption from these independence requirements for audit committee members who are non-executive employee representatives. The Company does not consider that reliance on this exemption adversely affects the ability of the Audit Committee to act independently or satisfy other SEC requirements. In addition, foreign private issuers such as Ericsson may follow home-country practice in lieu of certain NASDAQ corporate governance requirements. Below is a list of practices followed by Ericsson that differ from certain corporate governance requirements under the NASDAQ Marketplace Rules: Employee representatives to be elected to the Board of Directors and serve on Committees (including the Audit and the Remuneration Committees) in accordance with Swedish law Shareholders to participate in the election of Directors and the Nomination Committee, in accordance with Swedish law and common market practice, respectively Employee representatives on the Board to attend all Board and Committee meetings (including those of the Audit and the Remuneration Committees) in accordance with Swedish laws concerning attendance and decision making processes No minimum quorum requirements for shareholder meetings, except under certain circumstances. AUDIT COMMITTEE PRE-APPROVAL POLICIES AND PROCEDURES The Audit Committee reviews and approves the scope of audits to be performed (external and internal) and analyzes the results and costs of the audits. The Committee makes recommendations to the Board of Directors regarding the auditor’s performance. It also makes recommendations to the Nomination Committee regarding the external auditor’s fees. In order to ensure the auditor’s independence, the Audit Committee has established pre-approval policies and procedures for non-audit related services to be performed by the external auditor. Pre-approval authority may not be delegated to management. The policies and procedures include a list of prohibited services and services that require pre-approval by the Committee. Such services fall into two broad categories: General pre-approval—certain services regarding taxes, transactions, risk management, business improvement, corporate finance, attestation and accounting and so called general services. These services have received general pre-approval by the Audit Committee, provided that the estimated fee for each project does not exceed SEK 1 million. The external auditor must advise the Audit Committee of services rendered under the general pre-approval policy. Specific pre-approval—all other non-audit related services must receive specific pre-approval. The Audit Committee Chairman has the delegated authority for specific pre-approval in between Committee meetings, provided that the fee in each case does not exceed SEK 2.5 million. The Chairman reports any pre-approval to the Audit Committee at its next meeting. For matters which may not be handled by the Chairman and require specific pre-approval by the Audit Committee, the auditor submits an application to the Parent Company for final approval by the Audit Committee. ERICSSON ANNUAL REPORT ON FORM 20-F 2012 DISCLOSURE PURSUANT TO SECTION 219 OF THE IRAN THREAT REDUCTION AND SYRIA HUMAN RIGHTS ACT OF 2012 (ITRA) Ericsson has conducted business in Iran/Persia since the late nineteenth century, opened an office in Iran in 1973 and later established a local subsidiary in the country. Ericsson strongly believes in enabling communication for all and believes that access to communications can enable the right to health, education and freedom of expression. Ericsson’s business activities in Iran principally involve the sale of telecommunications infrastructure related products and services, including support, installation and maintenance services. Ericsson’s exports from the European Union (the “EU”) to Iran are performed under export licenses from the Swedish Agency for Non-Proliferation and Export Controls. The EU sanctions towards Iran grant an exemption for the supply of certain telecommunications equipment and software based on which these export licenses are granted. While we seek to obtain information regarding the ownership of our customers in Iran, it is sometimes difficult to determine ownership and control with certainty, particularly with respect to the government. During 2012, Ericsson sold telecommunications infrastructure related products and services in Iran to MTNIrancell and to Mobile Communication Company of Iran (“MCCI”), telecommunications companies operating in Iran. During 2012, our gross revenue related to sales to MTNIrancell and MCCI in Iran was approximately SEK 1,149 million. Ericsson does not normally allocate net profit on a country-by-country or activity-by-activity basis, other than as set forth in Ericsson’s consolidated financial statements prepared in accordance with IFRS as issued by the IASB. However, Ericsson has estimated that its net profit from such sales, after internal cost allocation was less than SEK 50 million during 2012. We anticipate that the sales of telecommunications infrastructure related products to MTNIrancell and MCCI in Iran will be phased out during 2013 and that our business activities in Iran after 2013 will consist of the provision of services under existing contracts or with respect to equipment already delivered by Ericsson (which services may include repair and replacements of products) and collection of software license related revenues under existing agreements. Further, Ericsson is party to agreements entered into prior to 2012 with Telecommunications Company of Iran, an affiliate of MCCI, Zaeim Electronic Industries Company and TAKTA (reseller). No sales were made by Ericsson under these contracts during 2012 and we do not anticipate that any sales will be made during 2013. In some instances, we have had to arrange performance bonds or similar financial guarantees to secure our performance of obligations under the commercial agreements we have entered into relating to our business in Iran. In such instances, we usually engage our banks outside Iran, who in turn engage local banks in the country. These local banks include Tejarat Bank, Melli Bank and Saderat Bank. Although some bonds and guarantees involving these banks are still in place, no new performance bonds or similar guarantees with respect to our business activities in Iran were issued during 2012, nor were payments made to beneficiaries under any such existing bond or guarantee. During 2012 Ericsson’s Iranian subsidiary maintained accounts with Bank Mellat and Tejarat Bank. Deposits with those banks generated less than SEK 20 million of interest income during 2012. Those accounts were closed during 2012. Some payments made to our local subsidiary and payments required to be made by our local subsidiary to suppliers involve banks controlled by the government of Iran, such as Bank Mellat, Tejarat Bank, Bank Melli, Saderat Bank, Keshavarzi Bank, Eghtesad Novin Bank, Refah Bank and Bank Sepah. We also received payments from customers to Ericsson’s accounts outside Iran. During 2012, Ericsson purchased telecommunication infrastructure related materials and services from Havafaza Industry Organization (SATAF). Ericsson stopped purchasing from them during 2012. Due to its operations in Iran, and having staff permanently in the country, Ericsson obtains and requires services and has other dealings incidental to its local activities including paying taxes and salaries and obtaining rentals, electricity, water and telecommunications services, office and similar supplies and customs related services from Iranian companies who may be owned or controlled by the government of Iran. ERICSSON ANNUAL REPORT ON FORM 20-F 2012 INVESTMENTS The following listing shows certain shareholdings owned directly and indirectly by the Parent Company as of December 31, 2012. A complete listing of shareholdings, prepared in accordance with the Swedish Annual Accounts Act and filed with the Swedish Companies Registration Office (Bolagsverket), may be obtained upon request to: Telefonaktiebolaget LM Ericsson, External Reporting, SE-164 83 Stockholm, Sweden. SHARES OWNED DIRECTLY BY THE PARENT COMPANY | | | | | | | | | | | | | | | | | | | | | Type | | Company | | Reg. No. | | | Domicile | | Percentage
of ownership | | | Par value
in local
currency,
million | | | Carrying
value,
SEK million | | Subsidiary companies | | | | | | | | | | | | | | | | | | | | I | | Ericsson AB | | | 556056-6258 | | | Sweden | | | 100 | | | | 50 | | | | 20,731 | | | I | | Ericsson Shared Services AB | | | 556251-3266 | | | Sweden | | | 100 | | | | 361 | | | | 2,216 | | | I | | Netwise AB | | | 556404-4286 | | | Sweden | | | 100 | | | | 2 | | | | 306 | | | II | | AB Aulis | | | 556030-9899 | | | Sweden | | | 100 | | | | 14 | | | | 6 | | | III | | Ericsson Credit AB | | | 556326-0552 | | | Sweden | | | 100 | | | | 5 | | | | 5 | | | | Other (Sweden) | | | | | | | | | — | | | | — | | | | 1,742 | | | I | | Ericsson Austria GmbH | | | | | | Austria | | | 100 | | | | 4 | | | | 65 | | | I | | Ericsson Danmark A/S | | | | | | Denmark | | | 100 | | | | 90 | | | | 216 | | | I | | Oy LM Ericsson Ab | | | | | | Finland | | | 100 | | | | 13 | | | | 196 | | | II | | Ericsson Participations France SAS | | | | | | France | | | 100 | | | | 26 | | | | 524 | | | I | | Ericsson Germany GmbH | | | | | | Germany | | | 100 | | | | — | | | | 4,232 | | | I | | Ericsson Hungary Ltd. | | | | | | Hungary | | | 100 | | | | 1,301 | | | | 120 | | | II | | LM Ericsson Holdings Ltd. | | | | | | Ireland | | | 100 | | | | 2 | | | | 15 | | | I | | Ericsson Telecomunicazioni S.p.A. | | | | | | Italy | | | 100 | | | | 44 | | | | 5,857 | | | II | | Ericsson Holding International B.V. | | | | | | The Netherlands | | | 100 | | | | 222 | | | | 3,200 | | | I | | Ericsson A/S | | | | | | Norway | | | 100 | | | | 75 | | | | 114 | | | II | | Ericsson Television AS | | | | | | Norway | | | 100 | | | | 161 | | | | 1,788 | | | I | | Ericsson Corporatia AO | | | | | | Russia | | | 100 | | | | 5 | | | | 5 | | | I | | Ericsson España | | | | | | Spain | | | 100 | | | | 43 | | | | 170 | | | I | | Ericsson AG | | | | | | Switzerland | | | 100 | | | | — | | | | — | | | II | | Ericsson Holding Ltd. | | | | | | United Kingdom | | | 100 | | | | 328 | | | | 4,094 | | | | Other (Europe, excluding Sweden) | | | | | | | | | — | | | | — | | | | 275 | | | II | | Ericsson Holding II Inc. | | | | | | United States | | | 100 | | | | 2,830 | | | | 29,006 | | | I | | Cía Ericsson S.A.C.I. | | | | | | Argentina | | | 95 | 1) | | | 41 | | | | 178 | | | I | | Ericsson Canada Inc. | | | | | | Canada | | | 100 | | | | — | | | | 51 | | | I | | Bel-Air Networks | | | | | | Canada | | | 100 | | | | — | | | | 170 | | | I | | Ericsson Telecom S.A. de C.V. | | | | | | Mexico | | | 100 | | | | n/a | | | | 1,050 | | | | Other (United States, Latin America) | | | | | | | | | — | | | | — | | | | 67 | | | II | | Teleric Pty Ltd. | | | | | | Australia | | | 100 | | | | 20 | | | | 100 | | | I | | Ericsson Ltd. | | | | | | China | | | 100 | | | | 2 | | | | 2 | | | I | | Ericsson (China) Company Ltd. | | | | | | China | | | 100 | | | | 65 | | | | 475 | | | I | | Ericsson India Private Ltd. | | | | | | India | | | 100 | | | | 725 | | | | 147 | | | I | | Ericsson India Global Services PVT. Ltd | | | | | | India | | | 100 | | | | 389 | | | | 64 | | | I | | LG-Ericsson Ltd. | | | | | | Korea | | | 75 | | | | 150 | | | | 3,285 | | | I | | Ericsson (Malaysia) Sdn. Bhd. | | | | | | Malaysia | | | 70 | | | | 2 | | | | 4 | | | I | | Ericsson Telecommunications Pte. Ltd. | | | | | | Singapore | | | 100 | | | | 2 | | | | 1 | | | I | | Ericsson South Africa PTY. Ltd | | | | | | South Africa | | | 100 | | | | — | | | | 108 | | | I | | Ericsson Taiwan Ltd. | | | | | | Taiwan | | | 80 | | | | 240 | | | | 20 | | | I | | Ericsson (Thailand) Ltd. | | | | | | Thailand | | | 49 | 2) | | | 90 | | | | 17 | | | | Other countries (the rest of the world) | | | | | | | | | — | | | | — | | | | 215 | | | | | | | | | | | | | | | | | | | | | | | | | Total | | | | | | | | | | | | | | | | | 80,839 | | | | | | | | | | | | | | | | | | | | | | | Joint ventures and associated companies | | | | | | | | | | | | | | | | | | | | II | | ST-Ericsson SA | | | | | | Switzerland | | | 50 | | | | 137 | | | | — | | | III | | ST-Ericsson AT SA | | | | | | Switzerland | | | 51 | | | | — | | | | — | | | I | | Rockstar Consortium Group | | | | | | Canada | | | 21 | | | | 1 | | | | 7 | | | I | | Ericsson Nikola Tesla d.d. | | | | | | Croatia | | | 49 | | | | 65 | | | | 330 | | | | | | | | | | | | | | | | | | | | | | | | | Total | | | | | | | | | | | | | | | | | 337 | | | | | | | | | | | | | | | | | | | | | | |
ERICSSON ANNUAL REPORT ON FORM 20-F 2012 Key to type of company | I | Manufacturing, distribution and development companies |
| 1) | Through subsidiary holdings, total holdings amount to 100% of Cia Ericsson S.A.C.I. |
| 2) | Through subsidiary holdings, total holdings amount to 100% of Ericsson (Thailand) Ltd. |
SHARES OWNED BY SUBSIDIARY COMPANIES | | | | | | | | | | | | | Type | | Company | | Reg. No. | | | Domicile | | Percentage
of ownership | | | Subsidiary companies | | | | | | | | | | | II | | Ericsson Cables Holding AB | | | 556044-9489 | | | Sweden | | | 100 | | I | | Ericsson France SAS | | | | | | France | | | 100 | | I | | Ericsson Telekommunikation GmbH & Co. KG1) | | | | | | Germany | | | 100 | | I | | LM Ericsson Ltd. | | | | | | Ireland | | | 100 | | II | | Ericsson Nederland B.V. | | | | | | The Netherlands | | | 100 | | I | | Ericsson Telecommunicatie B.V. | | | | | | The Netherlands | | | 100 | | I | | Ericsson Telekomunikasyon A.S. | | | | | | Turkey | | | 100 | | I | | Ericsson Ltd. | | | | | | United Kingdom | | | 100 | | I | | Ericsson Inc. | | | | | | United States | | | 100 | | I | | Ericsson IP Infrastructure Inc. | | | | | | United States | | | 100 | | I | | Drutt Corporation Inc. | | | | | | United States | | | 100 | | I | | Optimi Corporation | | | | | | United States | | | 100 | | I | | Redback Networks Inc. | | | | | | United States | | | 100 | | I | | Telcordia Technologies Inc. | | | | | | United States | | | 100 | | I | | Ericsson Telecommunicações S.A. | | | | | | Brazil | | | 100 | | I | | Ericsson Australia Pty. Ltd. | | | | | | Australia | | | 100 | | I | | Ericsson (China) Communications Co. Ltd. | | | | | | China | | | 100 | | I | | Nanjing Ericsson Panda Communication Co. Ltd. | | | | | | China | | | 51 | | I | | Ericsson Japan K.K. | | | | | | Japan | | | 100 | | I | | Ericsson Communication Solutions Pte Ltd. | | | | | | Singapore | | | 100 | |
Key to type of company | I | Manufacturing, distribution and development companies |
| 1) | Disclosures Pursuant to Section 264b of the German Commercial Code (Handelsgesetzbuch—HGB) Applying Section 264b HGB, LHS Holding GmbH & Co. KG, LHS Communication GmbH & Co. KG and LHS Telekommunikation GmbH & Co. KG, all located in Frankfurt am Main/Germany, are exempted from the obligation to prepare, have audited and disclose financial statements and a management report in accordance with the legal requirements being applicable for German corporations. |
RECONCILIATIONS TO IFRS This section includes a reconciliation of certain non-IFRS financial measures to the most directly comparable IFRS financial measures. The presentation of non-IFRS financial measures has limitations as analytical tools and should not be considered in isolation or as a substitute for our related financial measures prepared in accordance with IFRS. ERICSSON ANNUAL REPORT ON FORM 20-F 2012 We present non-IFRS financial measures to enhance an investor’s evaluation of our ongoing operating results, to aid in forecasting future periods and to facilitate meaningful comparison of our results between periods. Our management uses these non-IFRS financial measures to, among other things, evaluate our ongoing operations in relation to historical results, for internal planning and forecasting purposes and in the calculation of certain performance-based compensation. The non-IFRS financial measures presented in this report may differ from similarly-titled measures used by other companies. ERICSSON—EXPENSES | | | | | | | | | | | | | | | | | | | | | | | | | | | | IFRS | | | Restructuring Charges | | | Non-IFRS | | SEK billion | | 2011 | | | 2010 | | | 2011 | | | 2010 | | | 2011 | | | 2010 | | Selling and administrative expenses | | | 26.7 | | | | 27.1 | | | | 1.4 | | | | 1.8 | | | | 25.3 | | | | 25.3 | | R&D expenses | | | 32.6 | | | | 31.6 | | | | 0.6 | | | | 1.7 | | | | 32.1 | | | | 29.9 | | Net sales | | | 226.9 | | | | 203.3 | | | | | | | | | | | | 226.9 | | | | 203.3 | | | | | | | | | | | | | | | | | | | | | | | | | | | R&D expenses as a percent of net sales | | | 14.4 | % | | | 15.5 | % | | | | | | | | | | | 14.1 | % | | | 14.7 | % | | | | | | | | | | | | | | | | | | | | | | | | | |
ERICSSON EBITA MARGIN (INCLUDING RESTRUCTURING) | | | | | | | | | | | | | | | | | SEK billion | | 2012 | | | 2011 | | | 2010 | | | 2009 | | Net income | | | 5.9 | | | | 12.6 | | | | 11.2 | | | | 4.1 | | Interest | | | 0.3 | | | | –0.2 | | | | 0.7 | | | | –0.3 | | Tax | | | 4.2 | | | | 5.6 | | | | 4.5 | | | | 2.1 | | Amortization and write-downs of acquired intangibles | | | 4.6 | | | | 4.5 | | | | 5.9 | | | | 7.8 | | EBITA | | | 15.0 | | | | 22.4 | | | | 22.4 | | | | 13.8 | | | | | | | | | | | | | | | | | | | Net sales | | | 227.8 | | | | 226.9 | | | | 203.3 | | | | 206.5 | | EBITA margin (%) | | | 6.6 | % | | | 9.9 | % | | | 11.0 | % | | | 6.7 | % | | | | | | | | | | | | | | | | | |
ADJUSTED OPERATING CASH FLOWS | | | | | | | | | SEK billion | | 2011 | | | 2010 | | Operating cash flow | | | 10.0 | | | | 26.6 | | Restructuring cash outlays | | | 3.2 | | | | 3.3 | | | | | | | | | | | Adjusted operating cash flows | | | 13.2 | | | | 29.8 | | | | | | | | | | |
ERICSSON ANNUAL REPORT ON FORM 20-F 2012 SEGMENT NET SALES, OPERATING INCOME AND OPERATING MARGIN | | | | | | | | | SEK billion | | 2011 | | | 2010 | | Net sales | | | | | | | | | Networks | | | 132.4 | | | | 112.7 | | Global Services | | | 83.9 | | | | 80.1 | | Support solutions | | | 10.6 | | | | 10.5 | | | | | | | | | | | Operating income | | | | | | | | | Networks | | | 17.3 | | | | 12.5 | | Global Services | | | 5.5 | | | | 6.5 | | Support solutions | | | –0.5 | | | | –0.6 | | | | | | | | | | | Operating margin | | | | | | | | | Networks | | | 13 | % | | | 11 | % | Global Services | | | 7 | % | | | 8 | % | Support solutions | | | –5 | % | | | –6 | % | | | | | | | | | | Restructuring charges | | | | | | | | | Networks | | | 1.6 | | | | 3.9 | | Global Services | | | 1.4 | | | | 2.7 | | Support solutions | | | 0.1 | | | | 0.2 | | | | | | | | | | | Operating income excl. restructuring charges | | | | | | | | | Networks | | | 18.9 | | | | 16.4 | | Global Services | | | 6.9 | | | | 9.2 | | Support solutions | | | –0.4 | | | | –0.4 | | | | | | | | | | | Operating margin excl. restructuring charges | | | | | | | | | Networks | | | 14 | % | | | 15 | % | Global Services | | | 8 | % | | | 11 | % | Support solutions | | | –3 | % | | | –4 | % | | | | | | | | | |
In 2012, for all above items except EBITA margin, non-IFRS financial measures were not used. CAPITAL EMPLOYED | | | | | | | | | | | | | | | | | | | | | | | | 2012 | | | 2011 | | | 2010 | | | 2009 | | | 2008 | | Total assets | | | 274,996 | | | | 280,349 | | | | 281,815 | | | | 269,809 | | | | 285,684 | | Non-interest-bearing provisions and liabilities | | | | | | | | | | | | | | | | | | | | | Provisions, non-current | | | –211 | | | | –280 | | | | –353 | | | | –461 | | | | –311 | | Deferred tax liabilities | | | –3,120 | | | | –2,250 | | | | –2,571 | | | | –2,270 | | | | –2,738 | | Other non-current liabilities | | | –2,377 | | | | –2,248 | | | | –3,296 | | | | –2,035 | | | | –1,622 | | Provisions, current | | | –8,427 | | | | –5,985 | | | | –9,391 | | | | –11,970 | | | | –14,039 | | Trade payables | | | –23,100 | | | | –25,309 | | | | –24,959 | | | | –18,864 | | | | –23,504 | | Other current liabilities | | | –61,108 | | | | –57,970 | | | | –58,605 | | | | –52,529 | | | | –61,032 | | | | | | | | | | | | | | | | | | | | | | | Capital employed | | | 176,653 | | | | 186,307 | | | | 182,640 | | | | 181,680 | | | | 182,439 | | | | | | | | | | | | | | | | | | | | | | |
ERICSSON ANNUAL REPORT ON FORM 20-F 2012 RETURN ON CAPITAL EMPLOYED | | | | | | | | | | | | | | | | | | | | | | | | 2012 | | | 2011 | | | 2010 | | | 2009 | | | 2008 | | Operating income | | | 10,458 | | | | 17,900 | | | | 16,455 | | | | 5,918 | | | | 16,252 | | Financial income | | | 1,708 | | | | 2,882 | | | | 1,047 | | | | 1,874 | | | | 3,458 | | Average capital employed1) | | | | | | | | | | | | | | | | | | | | | Capital employed at January 1 | | | 186,307 | | | | 182,640 | | | | 181,680 | | | | 182,439 | | | | 168,456 | | Capital employed at December 31 | | | 176,653 | | | | 186,307 | | | | 182,640 | | | | 181,680 | | | | 182,439 | | Average capital employed | | | 181,480 | | | | 184,474 | | | | 182,160 | | | | 182,060 | | | | 175,448 | | | | | | | | | | | | | | | | | | | | | | | Return on capital employed2) | | | 6.7 | % | | | 11.3 | % | | | 9.6 | % | | | 4.3 | % | | | 11.3 | % | | | | | | | | | | | | | | | | | | | | | |
| 1) | Average capital employed is the average of the amounts of capital employed at January 1 and December 31. |
| 2) | Return on capital employed is the total of operating income and financial income as a percentage of average capital employed. |
GROSS CASH AND NET CASH | | | | | | | | | | | | | | | | | | | | | | | | 2012 | | | 2011 | | | 2010 | | | 2009 | | | 2008 | | Cash and cash equivalents | | | 44,682 | | | | 38,676 | | | | 30,864 | | | | 22,798 | | | | 37,813 | | Short term investments | | | 32,026 | | | | 41,866 | | | | 56,286 | | | | 53,926 | | | | 37,192 | | Gross cash | | | 76,708 | | | | 80,542 | | | | 87,150 | | | | 76,724 | | | | 75,005 | | Post-employment benefits | | | –9,503 | | | | –10,016 | | | | –5,092 | | | | –8,533 | | | | –9,873 | | Interest-bearing liabilities | | | | | | | | | | | | | | | | | | | | | Borrowings non-current | | | –23,898 | | | | –23,256 | | | | –26,955 | | | | –29,996 | | | | –24,939 | | Borrowings current | | | –4,769 | | | | –7,765 | | | | –3,808 | | | | –2,124 | | | | –5,542 | | | | | | | | | | | | | | | | | | | | | | | Net cash | | | 38,538 | | | | 39,505 | | | | 51,295 | | | | 36,071 | | | | 34,651 | | | | | | | | | | | | | | | | | | | | | | | | RETURN ON EQUITY | | | | | | | | | | | | | | | | | | | | | | | | 2012 | | | 2011 | | | 2010 | | | 2009 | | | 2008 | | Net income attributable to stockholders of the Parent Company | | | 5,775 | | | | 12,194 | | | | 11,146 | | | | 3,672 | | | | 11,273 | | Average stockholders’ equity1) | | | | | | | | | | | | | | | | | | | | | Stockholders’ equity at January 1 | | | 143,105 | | | | 145,106 | | | | 139,870 | | | | 140,823 | | | | 134,112 | | Stockholders’ equity at December 31 | | | 136,883 | | | | 143,105 | | | | 145,106 | | | | 139,870 | | | | 140,823 | | Average stockholders’ equity | | | 139,994 | | | | 144,106 | | | | 142,488 | | | | 140,347 | | | | 137,468 | | | | | | | | | | | | | | | | | | | | | | | Return on equity2) | | | 4.1 | % | | | 8.5 | % | | | 7.8 | % | | | 2.6 | % | | | 8.2 | % | | | | | | | | | | | | | | | | | | | | | |
| 1) | Average stockholders’ equity is based on the amounts at January 1 and December 31. |
| 2) | Return on equity is Net income attributable to stockholders of the Parent Company as a percentage of average Stockholders’ equity (based on the amounts at January 1 and December 31). |
ERICSSON ANNUAL REPORT ON FORM 20-F 2012 WORKING CAPITAL | | | | | | | | | | | | | | | | | | | | | | | | 2012 | | | 2011 | | | 2010 | | | 2009 | | | 2008 | | Current assets | | | 193,254 | | | | 198,816 | | | | 198,443 | | | | 182,442 | | | | 198,525 | | Current non-interest-bearing provisions and liabilities | | | | | | | | | | | | | | | | | | | | | Provisions, current | | | –8,427 | | | | –5,985 | | | | –9,391 | | | | –11,970 | | | | –14,039 | | Trade payables | | | –23,100 | | | | –25,309 | | | | –24,959 | | | | –18,864 | | | | –23,504 | | Other current liabilities | | | –61,108 | | | | –57,970 | | | | –58,605 | | | | –52,529 | | | | –61,032 | | | | | | | | | | | | | | | | | | | | | | | Working capital1) | | | 100,619 | | | | 109,552 | | | | 105,488 | | | | 99,079 | | | | 99,951 | | | | | | | | | | | | | | | | | | | | | | |
| 1) | Working capital is Current assets less current non-interest-bearing provisions and liabilities |
CASH CONVERSION | | | | | | | | | | | | | | | | | | | | | | | 2012 | | | 2011 | | | 2010 | | Cash flow from operating activities | | | A | | | | 22,031 | | | | 9,982 | | | | 26,583 | | Net income | | | B | | | | 5,938 | | | | 12,569 | | | | 11,235 | | Adjustments to reconcile net income to cash | | | C | | | | 13,077 | | | | 12,613 | | | | 12,490 | | | | | | | | | | | | | | | | | | | Cash conversion = A/(B+C) | | | | | | | 116 | % | | | 40 | % | | | 112 | % | | | | | | | | | | | | | | | | | |
ERICSSON ANNUAL REPORT ON FORM 20-F 2012 GLOSSARY 2G The first digital generation of mobile systems. Includes GSM, TDMA, PDC and cdmaOne. 3G 3rd generation mobile system. includes WCDMA/HSPA, CDMA2000 and TD-SCDMA. 4G See LTE. All-IP A single, common IP infrastructure that can handle all network services, including fixed and mobile communications, for voice and data services as well as video services such as TV. Backhaul Transmission between radio base stations and the core network. BSS Business support systems CaGR Compound Annual Growth Rate. Capex Capital expenditure. CDMA (Code Division Multiple Access) A radio technology on which the cdmaOne (2G) and CDMA2000 (3G) mobile communication standards are both based. CLOUD When data and applications reside in the network. Edge A mobile standard, developed as an enhancement of GSM. Enables the transmission of data at speeds up to 250 kbps. (Evolved EDGE up to 1 Mbps) GDP (Gross Domestic Product) The total annual cost of all finished goods and services produced within a country. ERICSSON ANNUAL REPORT ON FORM 20-F 2012 GPON (Gigabit Passive Optical Network) Used for fiber-optic communication to the home (FTTH). GSM (Global System for Mobile Communications) A first digital generation mobile system. HSPA (High Speed Packet Access) Enhancement of 3G/WCDMA that enables mobile broadband. ICT Information and Communication Technology. IMS (IP Multimedia Subsystem) A standard for offering voice and multimedia services over mobile and fixed networks using internet technology (IP). IP (Internet Protocol) Defines how information travels between network elements across the internet. IPR Intellectual Property Rights IPTV (IP Television) A technology that delivers digital television via fixed broadband access. JV (Joint Venture) A business enterprise in which two or more companies enter a partnership. LTE (Long-Term Evolution) The next evolutionary step of mobile technology beyond HSPA, allowing data rates above 100 Mbps. Managed services Management of operator networks and/or hosting of their services. Mobile broadband Wireless high-speed internet access using the HSPA, LTE and CDMA2000EV-DO technologies. ERICSSON ANNUAL REPORT ON FORM 20-F 2012 OSS Operations support systems Penetration The number of subscriptions divided by the population in a geographical area. PETAbyte Million gigabytes. RAN Radio Access Network. TD-SCDMA (Time Division Synchronous Code Division Multiple Access), an alternative to WCDMA used in China. WCDMA (Wideband Code Division Multiple Access) A 3G mobile communication standard. WCDMA builds on the same core network infrastructure as GSM. xDSL Digital Subscriber Line technologies for broadband multimedia communications in fixed-line networks. Examples: IP-DSL, ADSL and VDSL. The terms “Ericsson”, “the Company”, “the Group”, “us”, “we”, and “our” all refer to Telefonaktiebolaget LM Ericsson and its subsidiaries. ERICSSON ANNUAL REPORT ON FORM 20-F 2012 FINANCIAL TERMINOLOGY Capital employed Total assets less non-interest-bearing provisions and liabilities. (which includes: provisions, non-current; deferred tax liabilities; other non-current liabilities; provisions, current; trade payables; other current liabilities). Capital turnover Net sales divided by average capital employed. Cash conversion Cash flow from operating activities divided by the sum of net income and adjustments to reconcile net income to cash, expressed as percent. Cash dividends per share Dividends paid divided by average number of shares, basic. Compound annual growth rate (CAGR) The year-over-year growth rate over a specified period of time. Days sales outstanding (DSO) Trade receivables balance at quarter end divided by net sales in the quarter and multiplied by 90 days. If the amount of trade receivables is larger than last quarter’s sales, the excess amount is divided by net sales in the previous quarter and multiplied by 90 days, and total DSO are the 90 days of the most current quarter plus the additional days from the previous quarter. Earnings per share (EPS) Basic earnings per share: profit or loss attributable to stockholders of the Parent Company divided by the weighted average number of ordinary shares outstanding during the period. Diluted earnings per share: the weighted average number of shares outstanding are adjusted for the effects of all dilutive potential ordinary shares. EBITA margin Earnings before interest, taxes, amortization and write-downs of acquired intangibles (intellectual property rights, trademarks and other intangible assets, see Note C10 “Intangible assets”) as a percentage of net sales. EPS (non-IFRS) EPS, diluted, excluding amortizations and write-down of acquired intangible assets and including restructuring charges. Equity ratio Equity, expressed as a percentage of total assets. Gross cash Cash and cash equivalents plus short-term investments. ERICSSON ANNUAL REPORT ON FORM 20-F 2012 Inventory turnover days (ITO-days) 365 divided by inventory turnover, calculated as total cost of sales divided by the average inventories for the year (net of advances from customers). Net cash Cash and cash equivalents plus short-term investments less interest-bearing liabilities (which include: borrowings, non-current and borrowings, current) and post-employment benefits. P/E ratio The P/E ratio is calculated as the price of a Class B share at last day of trading divided by Earnings per share, basic. Payable days The average balance of trade payables at the beginning and at the end of the year divided by cost of sales for the year, and multiplied by 365 days. Payment readiness Cash and cash equivalents and short-term investments less short-term borrowings plus long-term unused credit commitments. Payment readiness is also shown as a percentage of net sales. Return on capital employed The total of Operating income plus Financial income as a percentage of average capital employed (based on the amounts at January 1 and December 31). Return on equity Net income attributable to stockholders of the Parent Company as a percentage of average Stockholders’ equity (based on the amounts at January 1 and December 31). Stockholders’ equity per share Stockholders’ equity divided by the number of shares outstanding at end of period, basic. Total shareholder return (TSR) The increase or decrease in Class B share price during the period, adjusted for dividends paid, expressed as a percentage of the share price at the start of the period. Trade receivables turnover Net sales divided by average trade receivables. Value at risk (VaR) A statistical method that expresses the maximum potential loss that can arise with a certain degree of probability during a certain period of time. Working capital Current assets less current non-interest-bearing provisions and liabilities (which include: provisions, current; trade payables; other current liabilities). ERICSSON ANNUAL REPORT ON FORM 20-F 2012 EXCHANGE RATES Exchange rates used in the consolidation | | | | | | | | | | | | January–December | | | | | 2012 | | | 2011 | | SEK/EUR | | | | | | | | | Average rate | | | 8.70 | | | | 9.02 | | Closing rate | | | 8.58 | | | | 8.92 | | SEK/USD | | | | | | | | | Average rate | | | 6.73 | | | | 6.48 | | Closing rate | | | 6.51 | | | | 6.90 | |
ERICSSON ANNUAL REPORT ON FORM 20-F 2012 SHAREHOLDER INFORMATION FOR PRINTED PUBLICATIONS A printed copy of the Annual Report is provided on request. Strömberg Distribution SE-120 88 Stockholm, Sweden Phone: +46 8 449 89 57 Email: ericsson@strd.se IN THE UNITED STATES: Ericsson’s Transfer Agent Citibank: Citibank Shareholder Services Registered holders: +1 877 881 59 69 Interested investors: +1 781 575 45 55 Email: citibank@shareholders-online.com www.citi.com/dr Ordering a hard copy of the Annual Report: +1 888 301 2504 Telefonaktiebolaget LM Ericsson’s shareholders are invited to participate in the Annual General Meeting to be held on Tuesday, April 13, 20109, 2013, at 3 p.m. at Kistamässan, Kistagången 1, Kista/Stockholm.Arne Beurlings Torg 5, Kista, Stockholm, Sweden. Registration and notice of attendance Shareholders who wish to attend the Annual General Meeting mustmust: beBe recorded in the share register kept by Euroclear Sweden AB (the Swedish Securities Registry) on Wednesday, April 7, 2010;3, 2013, and
giveGive notice of attendance to the Company at the latest on Wednesday, April 7, 2010.3, 2013. Notice of attendance can be given on Ericsson’s website: www.ericsson.com, by telephone: +46 8 402 90 54 on weekdays between 10 a.m. and 4 p.m., or by fax: +46 8 21 60 87.on Ericsson’s website.
Notice of attendance may also be given in writing to: Telefonaktiebolaget LM Ericsson General Meeting of Shareholders Box 7835, SE-103 98 Stockholm, Sweden When giving notice of attendance, please state name, date of birth, address, telephone no.number and number of assistants.assistants, if any. The meeting will be conducted in Swedish and simultaneously interpreted into English. Shares registered in the name of a nominee In addition to giving notice of attendance, shareholders who havehaving their shares registered in the name of a nominee, must request the nominee to temporarily enter the shareholder into the share register as per Wednesday, April 3, 2013, in order to be entitled to attend the meeting. In order for such registration to be effective on Wednesday April 7, 2010,The shareholders should contact theirinform the nominee to that effect well before that day. ERICSSON ANNUAL REPORT ON FORM 20-F 2012 Proxy Shareholders represented by proxy shall issue and submit to the Company a power of attorney for the representative. A power of attorney issued by a legal entity must be accompanied by a copy of the entity’s certificate of registration, (shouldor if no such certificate exist, a corresponding document of authority must be submitted).authority. Such documents must not be no moreolder than one year old.unless the power of attorney explicitly provides that it is valid for a longer period, up to a maximum of five years. In order to facilitate the registration at the Annual General Meeting, the power of attorney in original, certificates of registration and other documents of authority should be sent to the Company in advance. All documents should be sentadvance to the Company at the address above for receipt by Monday, April 12, 2010.8, 2013. Forms of power of attorney in Swedish and English are available on Ericsson’s website: www.ericsson.com/investors.website. Dividend The Board of Directors has decided to propose the Annual General Meeting to resolve on a dividend of SEK 2.002.75 per share for the year 20092012 and that Friday, April 16, 201012, 2013 will be the record daydate for dividend. Financial information from EricssonMembers of the Audit Committee
Interim reports 2010: April 23, 2010 (Q1) July 23, 2010 (Q2) October 22, 2010 (Q3) January 25, 2011 (Q4)
Annual Report 2010: March, 2011
Form 20-F forThe Audit Committee consists of five Board members appointed by the Board. In 2012, the Audit Committee comprised Ulf J. Johansson (Chairman of the Committee), Roxanne S. Austin, Sir Peter L. Bonfield, Kristina Davidsson and Sverker Martin-Löf.
The composition of the Audit Committee meets all applicable independence requirements. The Board of Directors has determined that each of Ulf J. Johansson, Roxanne S. Austin, Sir Peter L. Bonfield and Sverker Martin-Löf is an audit committee financial expert, as defined under the SEC rules. Each of them is independent under applicable US market 2009:securities laws, SEC rules and NASDAQ Stock Market Rules and each of them is financially literate and familiar with the accounting practices of an international company, such as Ericsson. Former authorized public accountant Peter Markborn was previously appointed as an external expert advisor to assist and advise the Audit Committee. He left this assignment during Q2, 20102012. Annual reportsWork of the Audit Committee in 2012
The Audit Committee held six meetings in 2012. Directors’ attendance is reflected in the table on page 195. During the year, the Audit Committee reviewed the scope and otherresults of external financial reports are available on our website: www.ericsson.com/investors. audits and the independence of the external auditor. It also monitored the external audit fees and approved non-audit services performed by the external auditor in accordance with the Committee’s pre-approval policies and procedures.ERICSSON ANNUAL REPORT ON FORM 20-F 20092012 The Committee approved the annual audit plan for the internal audit function and reviewed its reports. Prior to publishing it, the Committee also reviewed and discussed each interim report with the external auditor. The Committee monitored the continued compliance with the Sarbanes-Oxley Act as well as the internal control and risk management process. It also reviewed certain related-party transactions in accordance with its established process. The Committee reviewed and evaluated the effectiveness and appropriateness of the Group’s anti-corruption program. Finance Committee The Finance Committee is primarily responsible for: Handling matters related to acquisitions and divestments Handling capital contributions to companies inside and outside the Ericsson Group Raising loans, issuing guarantees and similar undertakings, and approving financial support to customers and suppliers Continuously monitoring the Group’s financial risk exposure. The Finance Committee is authorized to determine matters such as: Direct or indirect financing Granting of securities and guarantees Certain investments, divestments and financial commitments. Members of the Finance Committee The Finance Committee consists of four Board members appointed by the Board. In 2012, the Finance Committee comprised: Leif Johansson (Chairman of the Committee), Pehr Claesson, Anders Nyrén and Jacob Wallenberg. Work of the Finance Committee in 2012 The Finance Committee held seven meetings in 2012. Directors’ attendance is reflected in the table on page 195. During the year, the Finance Committee approved numerous customer finance credit arrangements and reviewed a number of potential mergers and acquisitions and real estate investments from a financial perspective. As a result of the uncertainty on the financial markets and the macroeconomic development, the Finance Committee has focused particularly on discussing and securing an adequate capital structure, cash flow and cash-generating ability. It has also continuously monitored Ericsson’s financial position and credit exposure. Remuneration Committee The Remuneration Committee’s main responsibility is to prepare for resolution by the Board of Directors matters regarding salary and other remuneration, including pension benefits of the President and CEO, the Executive Vice Presidents and other officers who report directly to the President and CEO. Responsibilities include: Reviewing and preparing for resolution by the Board, proposals on salary and other remuneration, including retirement compensation, for the President and CEO ERICSSON ANNUAL REPORT ON FORM 20-F 2012 Reviewing and preparing for resolution by the Board, proposals to the AGM on guidelines for remuneration to the ELT Approving proposals on salary and other remuneration, including retirement compensation, for the Executive Vice Presidents and other CEO direct reports Reviewing and preparing for resolution by the Board, proposals to the AGM on LTV and similar equity arrangements. Consideration is given to trends in remuneration, legislative changes, disclosure rules and the general global environment surrounding executive remuneration. The Committee reviews salary survey data before approving any salary adjustment for CEO direct reports. In addition, the Committee prepares salary adjustments for the President and CEO for resolution by the Board. Members of the Remuneration Committee The Remuneration Committee consists of four Board members appointed by the Board. In 2012, the Remuneration Committee comprised: Leif Johansson (Chairman of the Committee), Börje Ekholm, Nancy McKinstry and Karin Åberg. Piia Pilv has been appointed by the Remuneration Committee as an independent expert advisor to assist the Committee, particularly regarding international trends and developments. Work of the Remuneration Committee in 2012 The Remuneration Committee held six meetings in 2012. Directors’ attendance is reflected in the table on page 195. The Committee reviewed and prepared a proposal for the LTV 2012 for resolution by the Board. This was approved by the AGM 2012. The Committee further resolved on salaries and Short-Term Variable remuneration (STV) for 2012 for CEO direct reports. It prepared remuneration to the President and CEO, for resolution by the Board. The Committee also prepared guidelines for remuneration to the ELT, which were subsequently referred by the Board to the AGM for approval. Towards the end of the year, the Committee concluded its analysis of the current LTV structure and executive remuneration. The resulting proposals on LTV and guidelines for remuneration to the ELT will be referred to the AGM 2013 for resolution. For further information on fixed and variable remuneration, please see Notes to the consolidated financial statements—Note C28 “Information regarding members of the Board of Directors, the Group management and employees” and the “Remuneration Report” included in the Annual Report. ERICSSON ANNUAL REPORT ON FORM 20-F 2012 For printed publications, contactDirectors’ attendance and fees 2012
| | | | | | | | | | | | | | | | | | | | | | | | | | | | Fees resolved by the
AGM 2012 | | | Number of Board/Committee
meetings attended | | Board member | | Board
fees1) | | | Committee
fees | | | Board | | | Audit
Committee | | | Finance
Committee | | | Remuneration
Committee | | Leif Johansson | | | 3,750,000 | | | | 400,000 | | | | 12 | | | | | | | | 7 | | | | 6 | | Sverker Martin-Löf | | | 875,000 | | | | 250,000 | | | | 12 | | | | 6 | | | | | | | | | | Jacob Wallenberg | | | 875,000 | | | | 175,000 | | | | 12 | | | | | | | | 5 | | | | | | Roxanne S. Austin | | | 875,000 | | | | 250,000 | | | | 11 | | | | 6 | | | | | | | | | | Sir Peter L. Bonfield | | | 875,000 | | | | 250,000 | | | | 12 | | | | 6 | | | | | | | | | | Börje Ekholm | | | 875,000 | | | | 175,000 | | | | 12 | | | | | | | | | | | | 6 | | Alexander Izosimov2) | | | 875,000 | | | | | | | | 8 | | | | | | | | | | | | | | Ulf J. Johansson | | | 875,000 | | | | 350,000 | | | | 12 | | | | 6 | | | | | | | | | | Nancy McKinstry | | | 875,000 | | | | 175,000 | | | | 11 | | | | | | | | | | | | 6 | | Anders Nyrén | | | 875,000 | | | | 175,000 | | | | 12 | | | | | | | | 7 | | | | | | Carl-Henric Svanberg3) | | | — | | | | | | | | 4 | | | | | | | | | | | | | | Hans Vestberg | | | — | | | | | | | | 12 | | | | | | | | | | | | | | Michelangelo Volpi | | | 875,000 | | | | | | | | 10 | | | | | | | | | | | | | | Pehr Claesson | | | 18,000 | 7) | | | | | | | 12 | | | | | | | | 7 | | | | | | Jan Hedlund4) | | | 6,000 | 7) | | | | | | | 4 | | | | 3 | | | | | | | | | | Karin Åberg | | | 18,000 | 7) | | | | | | | 12 | | | | | | | | | | | | 6 | | Kristina Davidsson5) | | | 18,000 | 7) | | | | | | | 12 | | | | 3 | | | | | | | | | | Rickard Fredriksson6) | | | 10,500 | 7) | | | | | | | 7 | | | | | | | | | | | | | | Karin Lennartsson | | | 18,000 | 7) | | | | | | | 12 | | | | | | | | | | | | | | Roger Svensson | | | 18,000 | 7) | | | | | | | 12 | | | | | | | | | | | | | | | | | | | | | | | | | | | | | | | | | | | | | | | Total number of meetings | | | | | | | | | | | 12 | | | | 6 | | | | 7 | | | | 6 | | | | | | | | | | | | | | | | | | | | | | | | | | |
| 1) | Non-employed Directors can choose to receive part of their Board fee (exclusive of Committee fees) in the form of synthetic shares. |
| 2) | Elected Board member as of May 3, 2012. |
| 3) | Resigned as Board member as of May 3, 2012. |
| 4) | Resigned as employee representative and from the Audit Committee as of May 3, 2012. |
| 5) | Member of the Audit Committee since May 3, 2012. |
| 6) | Appointed deputy employee representative as of May 3, 2012. |
| 7) | Employee representative Board members and their deputies are not entitled to a Board fee but compensation in the amount of SEK 1,500 per attended Board meeting. |
REMUNERATION TO BOARD MEMBERS Remuneration to Board members not employed by the Company is proposed by the Nomination Committee for resolution by the AGM. The AGM 2012 approved the Nomination Committee’s proposal for fees to the non-employed Board members for Board and Committee work. For information on Board of Directors’ fees 2012, please refer to Notes to the consolidated financial statements—Note C28 “Information regarding members of the Board of Directors, the Group management and employees” in the Annual Report. The AGM 2012 also approved the Nomination Committee’s proposal that Board members may be paid part of their Board fee in the form of synthetic shares. A synthetic share gives the right to receive a future cash payment of an amount which corresponds to the market value of a Class B share in Ericsson at the time of payment. The director’s right to receive payment with regard to allocated synthetic shares occurs, as a main rule, after the publication of the Company’s year-end ERICSSON ANNUAL REPORT ON FORM 20-F 2012 financial statement during the fifth year following the General Meeting which resolved on the allocation of the synthetic shares. The purpose of paying part of the Board of Directors’ fee in the form of synthetic shares is to further align the Directors’ interest with shareholder interest. For more information on the terms and conditions of the synthetic shares, please refer to the notice convening the AGM 2012 and to the minutes from the AGM 2012, which are available at Ericsson’s website. MEMBERS OF THE BOARD OF DIRECTORS Board members elected by the AGM 2012 Leif Johansson(first elected 2011) Chairman of the Board of Directors, Chairman of the Remuneration Committee and of the Finance Committee Born 1951. Master of Science in Engineering, Chalmers University of Technology, Gothenburg, Sweden. Board Chairman: Astra Zeneca PLC, European Round Table of Industrialists and the International Advisory Board of the Nobel Foundation. Board Member: Svenska Cellulosa Aktiebolaget SCA and Ecolean AB. Holdings in Ericsson1): 17,933 Class B shares. Principal work experience and other information: President of the Royal Swedish Academy of Engineering Sciences. President and CEO of AB Volvo 1997-2011. Executive Vice President of AB Electrolux 1988-1991, President 1991-1994 and President and CEO of AB Electrolux 1994-1997. Holds honorary Doctorates at Blekinge Institute of Technology, the University of Gothenburg and Chalmers University of Technology. Awarded the Large Gold Medal of the Royal Swedish Academy of Engineering Sciences in 2011. Sverker Martin-Löf(first elected 1993) Deputy Chairman of the Board of Directors, Member of the Audit Committee Born 1943. Doctor of Technology and Master of Engineering, KTH Royal Institute of Technology, Stockholm, Sweden. Board Chairman: Svenska Cellulosa Aktiebolaget SCA, SSAB and AB Industrivärden. Board Member: Skanska AB and Svenska Handelsbanken AB. Holdings in Ericsson1): 10,400 Class B shares. Principal work experience and other information: President and CEO of Svenska Cellulosa Aktiebolaget SCA 1990–2002, where he was employed 1977–1983 and 1986–2002. Previous positions at Sunds Defibrator and Mo och Domsjö AB. Jacob Wallenberg(first elected 2011) Deputy Chairman of the Board of Directors, Member of the Finance Committee Born 1956. Bachelor of Science in Economics and Master of Business Administration, Wharton School, University of Pennsylvania, USA. Officer of the Reserve, Swedish Navy. Board Chairman:Investor AB. Deputy Board Chairman: SAS AB and SEB Skandinaviska Enskilda Banken AB (SEB). | 1) | The number of shares reflects ownership as of December 31, 2012 and includes holdings by related natural and legal persons, as well as holdings of any ADS, if applicable. |
ERICSSON ANNUAL REPORT ON FORM 20-F 2012 Board member:ABB Ltd, The Coca-Cola Company, The Knut and Alice Wallenberg Foundation and Stockholm School of Economics. Holdings in Ericsson1): 2,413 Class B shares. Principal work experience and other information: Chairman of the Board of Investor AB since 2005. Extensive experience in banking and finance, including experience from the commercial banks JP Morgan, New York and SEB. Appointed President and CEO of SEB in 1997 and appointed Chairman of SEB’s Board of Directors in 1998. Executive Vice President and CFO of Investor AB 1990-1993. Honorary Chairman of IBLAC (Mayor of Shanghai’s International Business Leaders Advisory Council) and member of The European Round Table of Industrialists. Roxanne S. Austin(first elected 2008) Member of the Audit Committee Born 1961. Bachelor of Business Administration in Accounting, University of Texas, San Antonio, USA. Board Member: Abbott Laboratories, Teledyne Technologies Inc. and Target Corporation. Holdings in Ericsson1): 3,000 Class B shares. Principal work experience and other information: President of Austin Investment Advisors since 2004. President and CEO of Move Networks Inc. 2009–2010. President and COO of DirecTV 2001–2003. Corporate Senior Vice President and CFO of Hughes Electronics Corporation 1997–2000, which she joined in 1993. Previously a partner at Deloitte & Touche. Member of the California State Society of Certified Public Accountants and the American Institute of Certified Public Accountants. Sir Peter L. Bonfield(first elected 2002) Member of the Audit Committee Born 1944. Honors degree in Engineering, Loughborough University, Leicestershire, UK. Board Chairman: NXP Semiconductors N.V. Board Member: Mentor Graphics Inc., Sony Corporation and Taiwan Semiconductor Manufacturing Company, Ltd. Holdings in Ericsson1): 4,400 Class B shares. Principal work experience and other information: CEO and Chairman of the Executive Committee of British Telecommunications plc 1996–2002. Chairman and CEO of ICL plc 1985–1996. Positions with STC plc and Texas Instruments Inc. Member of the Advisory Boards of New Venture Partners LLP, the Longreach Group and Apax Partners LLP. Board Mentor of CMi. Senior Advisor, Rothschild, London. Chair of Council and Senior Pro-Chancellor, Loughborough University, UK. Fellow of the Royal Academy of Engineering. Börje Ekholm(first elected 2006) Member of the Remuneration Committee Born 1963. Master of Science in Electrical Engineering, KTH Royal Institute of Technology, Stockholm, Sweden. Master of Business Administration, INSEAD, France. | 1) | The number of shares reflects ownership as of December 31, 2012 and includes holdings by related natural and legal persons, as well as holdings of any ADS, if applicable. |
ERICSSON ANNUAL REPORT ON FORM 20-F 2012 Board Chairman: KTH Royal Institute of Technology, Stockholm and Nasdaq OMX Group Inc. Board Member: Investor AB, AB Chalmersinvest, EQT Partners AB and Husqvarna AB. Holdings in Ericsson1): 30,760 Class B shares. Principal work experience and other information: President and CEO of Investor AB since 2005. Formerly Head of Investor Growth Capital Inc. and New Investments. Previous positions at Novare Kapital AB and McKinsey & Co Inc. Alexander Izosimov(first elected 2012) Born 1964. Master of Business Administration, INSEAD, France and Master of Science in Production Management Systems and Computer Science, Moscow Aviation Institute, Russian Federation. Board Member: East Capital AB, Modern Times Group MTG AB, EVRAZ Group S.A., Dynasty Foundation, Transcom WorldWide SA and International Chamber of Commerce (ICC). Holdings in Ericsson1): 1,600 Class B shares. Principal work experience and other information: CEO and President of VimpelCom 2003-2011. Previous positions with Mars Inc., including Member of the Global Executive Board and Regional President for CIS, Central Europe and Nordics. Earlier positions with McKinsey & Co as consultant in the Stockholm and London offices. Served as GSMA Board member 2005-2008 and Chairman of GSMA 2008-2010. Ulf J. Johansson(first elected 2005) Chairman of the Audit Committee Born 1945. Doctor of Technology and Master of Science in Electrical Engineering, KTH Royal Institute of Technology, Stockholm, Sweden. Board Chairman: Acando AB, Eurostep Group AB, Novo A/S, Novo Nordisk Foundation and Trimble Navigation Ltd. Board Member: European Institute of Innovation and Technology. Holdings in Ericsson1): 6,435 Class B shares. Principal work experience and other information: Founder of Europolitan Vodafone AB, where he was the Chairman of the Board 1990–2005. Previous positions at Spectra-Physics AB as President and CEO and at Ericsson Radio Systems AB. Member of the Royal Academy of Engineering Sciences. Nancy McKinstry(first elected 2004) Member of the Remuneration Committee Born 1959. Master of Business Administration in Finance and Marketing, Columbia University, USA. Bachelor of Arts in Economics, University of Rhode Island, USA. Board Chairman: CEO and Chairman of the Executive Board of Wolters Kluwer n.v. Board Member: Abbott Laboratories and Sanoma Corporation. | 1) | The number of shares reflects ownership as of December 31, 2012 and includes holdings by related natural and legal persons, as well as holdings of any ADS, if applicable. |
ERICSSON ANNUAL REPORT ON FORM 20-F 2012 Holdings in Ericsson1): 4,000 Class B shares. Principal work experience and other information: CEO and Chairman of the Executive Board of Wolters Kluwer n.v. President and CEO of CCH Legal Information Services 1996–1999. Previous positions at Booz, Allen & Hamilton and New England Telephone Company. Member of the Advisory Board of the University of Rhode Island, the Advisory Council of the Amsterdam Institute of Finance, the Board of Overseers of Columbia Business School and the Advisory Board of the Harrington School of Communication and Media. Anders Nyrén(first elected 2006) Member of the Finance Committee Born 1954. Graduate of Stockholm School of Economics, Sweden, Master of Business Administration from Anderson School of Management, UCLA, USA. Board Chairman: Sandvik AB. Deputy Board Chairman: Svenska Handelsbanken AB. Board Member: Svenska Cellulosa Aktiebolaget SCA, AB Industrivärden, SSAB, AB Volvo, Ernströmgruppen and Stockholm School of Economics. Holdings in Ericsson1): 6,686 Class B shares. Principal work experience and other information: President and CEO of Industrivärden since 2001. CFO and Executive Vice President of Skanska AB 1997–2001. Director Capital Markets of Nordbanken 1996–1997. CFO and EVP of Securum AB 1992–1996. Managing Director of OM International AB 1987–1992. Earlier positions at STC Scandinavian Trading Co AB and AB Wilhelm Becker. Hans Vestberg(first elected 2010) Born 1965. Bachelor of Business Administration and Economics, University of Uppsala, Sweden. Board Chairman: ST-Ericsson and Svenska Handbollförbundet. Board Member: Thernlunds AB. Holdings in Ericsson1): 149,382 Class B shares. Principal work experience and other information: President and CEO of Telefonaktiebolaget LM Ericsson since January 1, 2010. Previously, First Executive Vice President, CFO and Head of Group Function Finance and Executive Vice President and Head of Business Unit Global Services. Various positions in the Group since 1988, including Vice President and Head of Market Unit Mexico and Head of Finance and Control in USA, Brazil and Chile. International advisor to the Governor of Guangdong, China and co-chairman of the Russian-Swedish Business Council. Founding member of the Broadband Commission for Digital Development, and heading the Commission’s climate change working group. Member of the European Cloud Partnership Steering Board and the Leadership Council of the United Nations Sustainable Development Solutions Network. | 1) | The number of shares reflects ownership as of December 31, 2012 and includes holdings by related natural and legal persons, as well as holdings of any ADS, if applicable. |
ERICSSON ANNUAL REPORT ON FORM 20-F 2012 Michelangelo Volpi(first elected 2010) Born 1966. Bachelor of Science in Mechanical Engineering and Masters in Manufacturing Systems Engineering from Stanford University, USA. MBA from the Stanford Graduate School of Business, USA. Board Member: EXOR S.p.A. Holdings in Ericsson1): None. Principal work experience and other information: Partner at Index Ventures since July 2009. Previously CEO of Joost Inc. Various positions in Cisco from 1994-2007, including Senior Vice President and General Manager of the Routing and Service Provider Technology Group and Chief Strategy Officer. Has also worked for Hewlett Packard in the optoelectronics division. Board members and deputies appointed by the unions Pehr Claesson(first appointed 2008) Employee representative, Member of the Finance Committee Born 1966. Appointed by the union The Swedish Association of Graduate Engineers. Holdings in Ericsson1): 999 Class B shares. Employed since 1997. Working with marketing and communication for Consulting and Systems Integration within Business Unit Global Services. Kristina Davidsson(first appointed 2006) Employee representative, Member of the Audit Committee Born 1955. Appointed by the union IF Metall. Holdings in Ericsson1): 1,629 Class B shares. Employed since 1995. Previously working as repairer within Business Unit Networks and currently working full time as union representative. Karin Åberg(first appointed 2007) Employee representative, Member of the Remuneration Committee Born 1959. Appointed by the union Unionen. Holdings in Ericsson1): 2,751 Class B shares. Employed since 1995. Working as a Service Engineer within the IT organization. Rickard Fredriksson(first appointed 2012) Deputy employee representative Born 1969. Appointed by the union IF Metall. Holdings in Ericsson1): 799 Class B shares. Employed since 2000. Previously working as machine operator within Business Unit Networks and currently working full time as union representative. | 1) | The number of shares reflects ownership as of December 31, 2012 and includes holdings by related natural and legal persons, as well as holdings of any ADS, if applicable. |
ERICSSON ANNUAL REPORT ON FORM 20-F 2012 Karin Lennartsson(first appointed 2010) Deputy employee representative Born 1957. Appointed by the union Unionen. Holdings in Ericsson1): 493 Class B shares. Employed since 1976. Working as Process Expert within Group Function Finance—Process Management. Roger Svensson(first appointed 2011) Deputy employee representative Born 1971. Appointed by the union The Swedish Association of Graduate Engineers. Holdings in Ericsson1): 7,710 Class B shares. Employed since 1999. Working as Senior Specialist Test Strategy Power Amplifier within Business Unit Networks. Hans Vestberg was the only Director who held an operational management position at Ericsson in 2012. No Director has been elected pursuant to an arrangement or understanding with any major shareholder, customer, supplier or other person. At the Annual General Meeting 2012, Alexander Izosimov was elected new member of the Board of Directors, replacing Carl-Henric Svanberg. Jan Hedlund resigned as employee representative of the Board of Directors as of the date of the Annual General Meeting 2012 and Kristina Davidsson (previously deputy employee representative) was appointed employee representative as of the same date. Rickard Fredriksson was appointed new deputy employee representative as of the date of the Annual General Meeting 2012. MANAGEMENT The President/CEO and the Executive Leadership Team The Board of Directors appoints the President and CEO and the Executive Vice Presidents. The President and CEO is responsible for the management of day-to-day operations and is supported by the Executive Leadership Team (the “ELT”). During 2012, the ELT consisted of the President and CEO, the heads of Group functions, the heads of business units and the heads of two of Ericsson’s regions. The role of the ELT is to: Establish a strong corporate culture, a long-term vision and Group strategies and policies, all based on objectives stated by the Board Determine targets for operational units, allocate resources and monitor unit performance Secure operational excellence and realize global synergies through efficient organization of the Group. Remuneration to the Executive Leadership Team Guidelines for remuneration to the ELT were approved by the AGM 2012. For further information on fixed and variable remuneration, see the Remuneration report and Notes to the consolidated financial statements—Note C28, “Information regarding members of the Board of Directors, the Group management and employees” in the Annual Report. | 1) | The number of shares reflects ownership as of December 31, 2012 and includes holdings by related natural and legal persons, as well as holdings of any ADS, if applicable. |
ERICSSON ANNUAL REPORT ON FORM 20-F 2012 The Ericsson Group Management System Ericsson has a global management system, the Ericsson Group Management System (EGMS) to drive corporate culture and to ensure that the business is managed: To fulfill the objectives of Ericsson’s major stakeholders (customers, shareholders, employees) Within established risk limits and with reliable internal control In compliance with relevant applicable laws, listing requirements, governance codes and corporate social responsibilities. The EGMS is founded on ISO 9001 (International Standard for Quality management system) but is designed as a dynamic governance system, enabling Ericsson to adapt the system to evolving demands and expectations, including new legislation as well as customers’ and other stakeholders’ requirements. The management system is an important foundation and is continuously evaluated and improved. Certificates are evidence from an independent body verifying that the operations fulfill defined requirements. As the EGMS is a global system, group-wide certificates can be issued by a third party certification body proving that the system is efficient throughout the whole organization. Ericsson is currently globally certified to ISO 9001 (Quality), ISO 14001 (Environment) and OHSAS 18001 (Health & Safety). Selected Ericsson units are also certified to additional standards, for example ISO 27001 (Information Security) and TL 9000 (telecom-specific standard). The EGMS comprises three elements: Ericsson business processes Organization and resources.
ERICSSON ANNUAL REPORT ON FORM 20-F 2012 Management and control Ericsson’s strategy and target setting processes consider the demands and expectations of customers as well as other key stakeholders. The process facilitates the alignment of objectives and their measurement in activities at all levels of the organization. Ericsson uses balanced scorecards as tools for translating strategic objectives into a set of performance indicators for its operational units. Based on annual strategy work, these scorecards are updated with targets for each unit for the next year and are communicated throughout the organization. Group-wide policies and directives govern how the organization works and are core elements in managing and controlling Ericsson. The Group Policies and Directives include a Code of Business Ethics, a Code of Conduct and accounting and reporting directives to fulfill external reporting requirements and the Sarbanes-Oxley Act. The Group Steering Documents Committee works to ensure that the policies and directives cover relevant issues; that they are aligned and consistent with Group strategies, values and structures; and that they are not in conflict with legal and regulatory requirements. In addition, the Group Steering Documents Committee works to ensure that the said strategies, values and structures are implemented by the responsible function. Ericsson business processes As a market leader, Ericsson utilizes the competitive advantages that are gained through global scale and has implemented common processes and IT tools across all operational units worldwide. Customer requirements are identified, clarified and formalized in Ericsson Business Processes where requirements transform from theory to reality. Through management and continuous improvement of processes and IT tools, Ericsson attempts to reduce costs with efficient and effective process flows and with standardized internal controls and performance indicators. Organization and resources Ericsson is operated in two dimensions: one operational structure and one legal structure. The operational structure aligns accountability and authority regardless of country borders and supports the process flow with cross-country operations. During 2012 there were four business units and ten regions. Group functions coordinate Ericsson’s strategies, operations and resource allocation and define the necessary directives, processes and organization for the effective governance of the Group. The legal structure is the basis for legal requirements and responsibility as well as for tax and statutory reporting purposes. There are more than 200 legal entities within the Ericsson Group with representation (via legal entities, branch and representative offices) in more than 140 countries. Risk management Ericsson’s risk management is integrated with the business and its operational processes, and is a part of the EGMS to ensure accountability, effectiveness, efficiency, business continuity and compliance with corporate governance, legal and other requirements. The Board of Directors is also actively engaged in the Company’s risk management. Risks related to set long-term objectives are discussed and strategies are formally approved by the Board as part of the annual strategy process. Risks related to annual targets for the Company are also reviewed by the Board and then monitored continuously during the year. Certain transactional risks require specific Board approval, e.g. acquisitions, management remuneration, borrowing or customer finance in excess of pre-defined limits. ERICSSON ANNUAL REPORT ON FORM 20-F 2012 Strategic and tactical risks Strategic risks constitute the highest risk to the Company if not managed properly as they could have a long-term impact. Ericsson therefore reviews its long-term objectives, main strategies and business scope on an annual basis and continuously works on its tactics to reach these objectives and to mitigate any risks identified. In the annual strategy and target setting process, objectives are set for the next three to five years. Risks and opportunities are assessed and strategies are developed to achieve the objectives. The strategy process in the Company is well established and involves regions, business units and Group functions. The strategy is finally summarized and discussed in a yearly Global Leadership Summit with approximately 250 leaders from all parts of the business. By involving all parts of the business in the process, potential risks are identified early and mitigating actions can be incorporated in the strategy and in the annual target process following the finalization of the strategy. Technology development, industry and market fundamentals and the development of the economy are key components in the evaluation of risks related to Ericsson’s long-term objectives. The outcome from the strategy process forms the basis for the annual target process, which involves regions, business units and Group functions. Risks and opportunities linked to the targets are identified as part of this process together with actions to mitigate the identified risks. Follow-up of targets, risks and mitigating actions are reported and discussed continuously in business unit and region steering groups and are reviewed by the Board of Directors. Ericsson continuously strives to improve its risk management and believes that it is important that the entire global organization takes part in the risk management and strategy work. Therefore, risk management was given a stronger focus in 2012. During the year, an enhanced risk management framework was implemented and aligned with the Strategy and Target setting process. Risks were identified and analyzed in four categories: industry & market risks, commercial risks, operational risks and compliance risks. For more information on risks related to Ericsson’s business, see the chapter “Risk factors” in the Annual Report. Strategic, target setting and risk management cycle The annual strategic, target setting and risk management cycle is part of Ericsson’s strategy process, which is well established within the Group and involves regions, business units and Group functions.
ERICSSON ANNUAL REPORT ON FORM 20-F 2012 Operational and financial risks Operational risks are owned and managed by operational units. Risk management is embedded in various process controls, such as decision tollgates and approvals. Certain cross-process risks are centrally coordinated, such as information security, IT security, corporate responsibility and business continuity and insurable risks. Financial risk management is governed by a Group policy and carried out by the Treasury and Customer Finance functions, both supervised by the Finance Committee. The policy governs risk exposures related to foreign exchange, liquidity/financing, interest rates, credit risk and market price risk in equity instruments. For further information on financial risk management, see Notes to the consolidated financial statements—Note C14, “Trade receivables and customer finance”, Note C19, “Interest-bearing liabilities” and Note C20, “Financial risk management and financial instruments” in the Annual Report. Compliance risks Ericsson has implemented Group policies and directives in order to comply with applicable laws and regulations, including a Code of Business Ethics and a Code of Conduct. Risk management is integrated in the Company’s business processes. Policies and controls are implemented to comply with financial reporting standards and stock market regulations, such as the US Sarbanes-Oxley Act. Compliance officer Ericsson has a Chief Compliance Officer (CCO) whose responsibilities include providing support for compliance with laws, regulations, internal policies and directives, coordinating the different strands of expertise within Ericsson. Attention from senior-management level on compliance matters is crucial, as is ensuring that this is addressed from a cross-functional perspective. Initially, the CCO’s primary focus has been to further develop Ericsson’s Anti-corruption Compliance Program. This is reviewed and evaluated by the Audit Committee at least annually. Monitoring and audits Company management monitors compliance with policies, directives and processes through internal self-assessment within all units. This is complemented by internal and external audits. External financial audits are performed by PricewaterhouseCoopers, and ISO/ management system audits by Intertek. Internal audits are performed by the company’s internal audit function which reports to the Audit Committee. Audits of suppliers are also conducted in order to secure compliance with Ericsson’s Code of Conduct, which is mandatory for suppliers to the Ericsson Group. Risk mitigation Significant ongoing activities in order to mitigate risks include: Establishing flexibility to cost-effectively accommodate to fluctuations in customer demand Conducting regular Supplier Code of Conduct audits Continuous assessment and management of CR risks Conducting business continuity management in an efficient way Conducting corporate governance training as needed Continuous monitoring of information systems to guard against data breaches Reviewing top risks and mitigating actions at various internal governance meetings. ERICSSON ANNUAL REPORT ON FORM 20-F 2012
Example of risk heat map document Risk heat maps are generated by business units, regions and Group functions in four risk categories:
MEMBERS OF THE EXECUTIVE LEADERSHIP TEAM Hans Vestberg President and CEO (since 2010) Born 1965. Bachelor of Business Administration and Economics, University of Uppsala, Sweden. Board Chairman: ST-Ericsson and Svenska Handbollförbundet. ERICSSON ANNUAL REPORT ON FORM 20-F 2012 Board member: Telefonaktiebolaget LM Ericsson and Thernlunds AB. Holdings in Ericsson1): 149,382 Class B shares. Background: Previously First Executive Vice President, CFO and Head of Group Function Finance and Executive Vice President and Head of Business Unit Global Services. Various positions in the Group since 1988, including Vice President and Head of Market Unit Mexico and Head of Finance and Control in USA, Brazil and Chile. International advisor to the Governor of Guangdong, China and co-chairman of the Russian-Swedish Business Council. Founding member of the Broadband Commission for Digital Development, and heading the Commission’s broadband and climate change working group. Member of the European Cloud Partnership Steering Board and the Leadership Council of the United Nations Sustainable Development Solutions Network. Jan Frykhammar Executive Vice President and Chief Financial Officer and Head of Group Function Finance (since 2009) Born 1965. Bachelor of Business Administration and Economics, University of Uppsala, Sweden. Board member: ST-Ericsson and the Swedish International Chamber of Commerce. Holdings in Ericsson1): 14,844 Class B shares. Background: Previously Senior Vice President and Head of Business Unit Global Services. Various positions within Ericsson including Sales and Business Control in Business Unit Global Services, CFO in North America and Vice President, Finance and Commercial within the Global Customer Account Vodafone. Magnus Mandersson Executive Vice President (since 2011) and Head of Business Unit Global Services (since 2010) Born 1959. Bachelor of Business Administration, University of Lund, Sweden. Board member: None. Holdings in Ericsson1): 22,602 Class B shares. Background: Previously Head of Business Unit CDMA, Market Unit Northern Europe, Global Customer Account Deutsche Telekom AG and Product Area Managed Services. Has also been President and CEO of SEC/ Tele2 Europe and COO of Millicom International Cellular S.A. Johan Wibergh Executive Vice President (since 2010) and Head of Business Unit Networks (since 2008) Born 1963. Master of Computer Science, Linköping Institute of Technology, Sweden. | 1) | The number of shares reflects ownership as of December 31, 2012 and includes holdings by related natural and legal persons, as well as holdings of any ADS, if applicable. |
ERICSSON ANNUAL REPORT ON FORM 20-F 2012 Board member: ST-Ericsson, Confederation of Swedish Enterprise, KTH Royal Institute of Technology and Teknikföretagen. Holdings in Ericsson1): 40,448 Class B shares. Background: President of Ericsson Brazil, President of Market Unit Nordic and Baltics and Vice President and Head of Sales at Business Unit Global Services. Per Borgklint Senior Vice President and Head of Business Unit Support Solutions (since 2011) Born 1972. Master of Science in Business Administration, Jönköping International Business School, Sweden. Board member:None. Holdings in Ericsson1): None. Background: Previously CEO of Net1 (Ice.net), Canal Plus Nordic and Versatel. Has also held several leading positions at Tele2. Bina Chaurasia Senior Vice President, Chief Human Resources Officer and Head of Group Function Human Resources and Organization (since 2010) Born 1962. Master of Science in Management and Human Resources, Ohio State University, USA, and Master of Arts in Philosophy, University of Wisconsin, USA. Holdings in Ericsson1): 19,144 Class B shares. Background: Joined Ericsson from Hewlett Packard, where she was Vice President of Global Talent Management. Has held senior HR leadership roles at Gap, Sun Microsystems and PepsiCo/Yum. Ulf Ewaldsson Senior Vice President, Chief Technology Officer and Head of Group Function Technology(since February 1, 2012) Born 1965. Master of Science in Engineering and Business Management, Linköping Institute of Technology, Sweden. Board member: None. | 1) | The number of shares reflects ownership as of December 31, 2012 and includes holdings by related natural and legal persons, as well as holdings of any ADS, if applicable. |
ERICSSON ANNUAL REPORT ON FORM 20-F 2012 Holdings in Ericsson1): 14,985 Class B shares. Background: Previously Head of Product Area Radio within Business Unit Networks. Has held various managerial positions within Ericsson since 1990. Douglas L. Gilstrap Senior Vice President and Head of Group Function Strategy(since 2009) Born 1963. Bachelor of Science in Accounting, University of Richmond, USA, and Master of Business Administration, Emory University, Atlanta, USA. Executive program at INSEAD, France. Board member: Telecom Management Forum (TMF). Deputy board member: ST-Ericsson. Holdings in Ericsson1): 8,643 Class B shares. Background: Has held various global managerial positions within the telecommunications sector for more than 15 years. Nina Macpherson Senior Vice President, General Counsel, Head of Group Function Legal Affairs and secretary to the Board of Directors(since 2011) Born 1958. Master of Laws, LL M, University of Stockholm, Sweden. Board member: The Association for Swedish Listed Companies. Holdings in Ericsson1): 7,857 Class B shares. Background: Previously Vice President and Deputy Head of Group Function Legal Affairs at Ericsson. Previous positions also include private practice and in-house attorney. Member of the Swedish Securities Council. Helena Norrman Senior Vice President and Head of Group Function Communications(since 2011) Born 1970. Master of International Business Administration, Linköping University, Sweden. Board member: None. Holdings in Ericsson1): 8,312 Class B shares. Background: Previously Vice President, Communications Operations at Group Function Communications at Ericsson. Has held various positions within Ericsson’s global communications organization since 1998. Previous positions as communications consultant. Mats H. Olsson Head of Region North East Asia(since 2010) Born 1954. | 1) | The number of shares reflects ownership as of December 31, 2012 and includes holdings by related natural and legal persons, as well as holdings of any ADS, if applicable. |
ERICSSON ANNUAL REPORT ON FORM 20-F 2012 Master of Business Administration, Stockholm School of Economics, Sweden. Board member: None. Holdings in Ericsson1): 61,252 Class B shares. Background: International economic advisor to a number of Chinese provincial and municipal governments. Previously Head of Market Unit Greater China. Appointed President of Ericsson Greater China in 2004, with overall responsibility for mainland China, Hong Kong, Macao and Taiwan. Also assumed overall responsibility for Japan and South Korea in 2010. Has held various executive positions across Asia-Pacific over the last 25 years. Rima Qureshi Senior Vice President and Head of Business Unit CDMA Mobile Systems(since 2010) Born 1965. Bachelor of Information Systems and Master of Business Administration, McGill University, Montreal, Canada. Board member: MasterCard Incorporated. Holdings in Ericsson1): 4,932 Class B shares. Background: Also serves as Head of Ericsson Response. Previously Vice President of Strategic Improvement Program and Vice President Product Area Customer Support. Has held various positions within Ericsson since 1993. Angel Ruiz Head of Region North America(since 2010) Born 1956. Bachelor of Electrical Engineering, University of Central Florida, USA, and Master of Management Science and Information Systems, Johns Hopkins University, USA. Board member: CTIA. Holdings in Ericsson1): 38,546 Class B shares. Background: Joined Ericsson in 1990 and has held a variety of technical, sales and managerial positions within the Company, including heading up the global account teams for Cingular/SBC/BellSouth (now AT&T). Was appointed President of Ericsson North America in 2001. Jan Wäreby Senior Vice President and Head of Sales and Marketing(since 2011) Born 1956. Master of Science, Chalmers University, Gothenburg, Sweden. Board member: ST-Ericsson. | 1) | The number of shares reflects ownership as of December 31, 2012 and includes holdings by related natural and legal persons, as well as holdings of any ADS, if applicable. |
ERICSSON ANNUAL REPORT ON FORM 20-F 2012 Holdings in Ericsson1): 66,495 Class B shares. Background: Senior Vice President and Head of Business Unit Multimedia and Executive Vice President and Head of Sales and Marketing for Sony Ericsson Mobile Communications. Up until January 31, 2012, Håkan Eriksson, former Senior Vice President, Chief Technology Officer and Head of Group Function Technology & Portfolio Management, was a member of the Executive Leadership Team. AUDITOR According to the Articles of Association, the Parent Company shall have no less than one and no more than three registered public accounting firms as external independent auditor. Pursuant to the Swedish Companies Act, the mandate period of an auditor shall be one year, unless the Articles of Association provide for a longer mandate period up to four years. The auditor reports to the shareholders at General Meetings. The duties of the auditor include the following: Updating the Board of Directors regarding the planning, scope and content of the annual audit Examining the interim and year-end financial statements to assess accuracy and completeness of the accounts and adherence to accounting standards and policies Advising the Board of Directors of non-audit services performed, the consideration paid and other issues that determine the auditor’s independence. For further information on the contacts between the Board and the auditor, please see “Work of the Board of Directors” earlier in this Corporate Governance Report. All Ericsson’s quarterly financial reports are reviewed by the auditor. Current auditor PricewaterhouseCoopers AB was elected auditor at the AGM 2012 for a period of one year, i.e. until the close of the AGM 2013. PricewaterhouseCoopers AB has appointed Peter Nyllinge, Authorized Public Accountant, to serve as auditor in charge. Fees to the auditor Ericsson paid the fees (including expenses) for audit-related and other services listed in the table in Notes to the consolidated financial statements—Note C30, “Fees to auditors” in the Annual Report. INTERNAL CONTROL OVER FINANCIAL REPORTING 2012 This section has been prepared in accordance with the Annual Accounts Act and the Swedish Corporate Governance Code and is limited to internal control over financial reporting. Since Ericsson is listed in the United States, the requirements outlined in the Sarbanes-Oxley Act (SOX) apply. These regulate the establishment and maintenance of internal controls over financial reporting as well as management’s assessment of the effectiveness of the controls. In order to support high quality reporting and to meet the requirement of SOX, the Company has implemented detailed documented controls and testing and reporting procedures based on the internationally established COSO framework for internal control. The COSO framework is issued by the Committee of Sponsoring Organizations of the Treadway Commission (COSO). ERICSSON ANNUAL REPORT ON FORM 20-F 2012 Management’s internal control report according to SOX is included in this Annual Report on Form 20-F and filed with the SEC in the United States. During 2012, the Company has included operations of acquired entities as well as continued to improve the design and execution of its financial reporting controls. Disclosure policies Ericsson’s financial disclosure policies aim to ensure transparent, relevant and consistent communication with equity and debt investors on a fair and equal basis. This will support a fair market value for Ericsson securities. Ericsson wants current and potential investors to have a good understanding of how the Company works, including operational performance, prospects and potential risks. To achieve these objectives, financial reporting and disclosure must be: Transparent—enhancing understanding of the economic drivers and operational performance of the business, building trust and credibility Consistent—comparable in scope and level of detail to facilitate comparison between reporting periods Simple—to support understanding of business operations and performance and to avoid misinterpretations Relevant—with focus on what is relevant to Ericsson’s stakeholders or required by regulation or listing agreements, to avoid information overload Timely—with regular scheduled disclosures as well as ad-hoc information, such as press releases on important events, performed in a timely manner Fair and equal—where all material information is published via press releases to ensure that the whole investor community receives the information at the same time Complete, free from material errors and a reflection of best practice—disclosure is compliant with applicable financial reporting standards and listing requirements and in line with industry norms. Ericsson’s website comprises comprehensive information on the Group, including: An archive of annual and interim reports On-demand access to recent news Copies of presentations given by senior management at industry conferences. Disclosure controls and procedures Ericsson has controls and procedures in place to allow for timely information disclosure under applicable laws and regulations, including the US Securities Exchange Act of 1934, and under agreements with NASDAQ OMX Stockholm and NASDAQ New York. These procedures also require that such information is provided to management, including the CEO and CFO, so timely decisions can be made regarding required disclosure. The Disclosure Committee comprises members with various expertise. It assists managers in fulfilling their responsibility regarding disclosures made to the shareholders and the investment community. One of the main tasks of the committee is to monitor the integrity and effectiveness of the disclosure controls and procedures. Ericsson has investments in certain entities that the Company does not control or manage. With respect to such entities, disclosure controls and procedures are substantially more limited than those maintained with respect to subsidiaries. ERICSSON ANNUAL REPORT ON FORM 20-F 2012 During the year, Ericsson’s President and CEO and the CFO evaluated the disclosure controls and procedures and concluded that they were effective at a reasonable assurance level as at December 31, 2012. Internal control over financial reporting Ericsson has integrated risk management and internal control into its business processes. As defined in the COSO framework, internal control is an aggregation of components such as a control environment, risk assessment, control activities, information and communication and monitoring. During the period covered by the Annual Report 2012, there were no changes to the internal control over financial reporting that have materially affected, or are likely to materially affect, the internal control over financial reporting. Control environment The Company’s internal control structure is based on the division of tasks between the Board of Directors and its Committees and the President and CEO. The Company has implemented a management system that is based on: Steering documents, such as policies, directives and a Code of Business Ethics A strong corporate culture The Company’s organization and mode of operations, with well-defined roles and responsibilities and delegations of authority Several well-defined Group-wide processes for planning, operations and support. The most essential parts of the control environment relative to financial reporting are included in steering documents and processes for accounting and financial reporting. These steering documents are updated regularly to include, among other things: Financial reporting standards and listing requirements, such as IFRS and SOX. The processes include specific controls to be performed to ensure high quality financial reports. The management of each reporting legal entity, region and business unit is supported by a financial controller function with execution of controls related to transactions and reporting. The financial controller functions are organized in a number of Company Control Hubs, each supporting a number of legal entities within a geographical area. A financial controller function is also established on Group level, reporting to the CFO. Risk assessment Risks of material misstatements in financial reporting may exist in relation to recognition and measurement of assets, liabilities, revenue and cost or insufficient disclosure. Other risks related to financial reporting include fraud, loss or embezzlement of assets and undue favorable treatment of counterparties at the expense of the Company. Policies and directives regarding accounting and financial reporting cover areas of particular significance to support correct, complete and timely accounting, reporting and disclosure. Identified types of risks are mitigated through well-defined business processes with integrated risk management activities, segregation of duties and appropriate delegation of authority. This requires specific approval of material transactions and ensures adequate asset management. ERICSSON ANNUAL REPORT ON FORM 20-F 2012 Control activities The Company’s business processes include financial controls regarding the approval and accounting of business transactions. The financial closing and reporting process has controls regarding recognition, measurement and disclosure. These include the application of critical accounting policies and estimates, in individual subsidiaries as well as in the consolidated accounts. Regular analyses of the financial results for each subsidiary, region and business unit cover the significant elements of assets, liabilities, revenues, costs and cash flow. Together with further analysis of the consolidated financial statements performed at Group level, these procedures are designed to produce financial reports without material errors. For external financial reporting purposes, the Disclosure Committee performs additional control procedures to review whether the disclosure requirements are fulfilled. The Company has implemented controls to ensure that financial reports are prepared in accordance with its internal accounting and reporting policies and IFRS as well as with relevant listing regulations. It maintains detailed documentation on internal controls related to accounting and financial reporting. It also keeps records on the monitoring of the execution and results of such controls. This allows the President and CEO and the CFO to assess the effectiveness of the controls in a way that is compliant with SOX. Entity-wide controls, focusing on the control environment and compliance with financial reporting policies and directives, are implemented in all subsidiaries. Detailed process controls and documentation of controls performed are also implemented in almost all subsidiaries, covering the items with significant materiality and risk. In order to secure compliance, governance and risk management in the areas of legal entity accounting and taxation, as well as securing funding and equity levels, the Company operates through a Company Control hub structure, covering subsidiaries in each respective geographical area. Based on a common IT platform, a common chart of account and common master data, the hubs and shared services centers perform accounting and financial reporting services for most subsidiaries. Information and communication The Company’s information and communication channels support complete, correct and timely financial reporting by making all relevant internal process instructions and policies accessible to all the employees concerned. Regular updates and briefing documents regarding changes in accounting policies, reporting and disclosure requirements are also supplied. Subsidiaries and operating units prepare regular financial and management reports for internal steering groups and Company management. These include analysis and comments on financial performance and risks. The Board of Directors receives financial reports monthly. Ericsson has established a whistleblower procedure for the reporting of alleged violations that (i) are conducted by Group or local management, and (ii) relate to corruption, questionable accounting or auditing matters or otherwise seriously affect vital interests of the Group or personal health and safety. Monitoring The Company’s process for financial reporting is reviewed annually by the management. This forms a basis for evaluating the internal management system and internal steering documents to ensure that they cover all ERICSSON ANNUAL REPORT ON FORM 20-F 2012 significant areas related to financial reporting. The shared service center and company control hub management continuously monitors accounting quality through a set of performance indicators. Compliance with policies and directives is monitored through annual self-assessments and representation letters from heads and company controllers in all subsidiaries as well as in business units and regions. The Company’s financial performance is also reviewed at each Board meeting. The Committees of the Board fulfill important monitoring functions regarding remuneration, borrowing, investments, customer finance, cash management, financial reporting and internal control. The Audit Committee and the Board of Directors review all interim and annual financial reports before they are released to the market. The Company’s internal audit function reports directly to the Audit Committee. The Audit Committee also receives regular reports from the external auditor. The Audit Committee follows up on any actions taken to improve or modify controls. BOARD OF DIRECTORS Stockholm, March 5, 2013 Telefonaktiebolaget LM Ericsson (publ) Org. no. 556016–0680 ERICSSON ANNUAL REPORT ON FORM 20-F 2012 REMUNERATION REPORT INTRODUCTION This report outlines how the remuneration policy is implemented throughout Ericsson in line with corporate governance best practice, with specific references to Group management. The work of the Remuneration Committee in 2012 and the remuneration policy are explained, at the beginning of the report, followed by descriptions of plans and approaches. More details of the remuneration of Group management and Board members’ fees can be found in the Notes to the Consolidated financial statements—Note C28, “Information regarding members of the Board of Directors, the Group management and employees”. THE REMUNERATION COMMITTEE The Remuneration Committee advises the Board of Directors on an ongoing basis on the remuneration to the Executive Leadership Team (ELT). This includes fixed salaries, pensions, other benefits and short-term and long-term variable remuneration, all in the context of pay and employment conditions throughout Ericsson. The Remuneration Committee reviews and prepares for resolution by the Board: Proposals on salary and other remuneration, including retirement compensation, for the President and CEO Proposals on targets for the short-term variable remuneration for the President and CEO Proposals to the Annual General Meeting on guidelines for remuneration to the ELT Proposals to the Annual General Meeting on long-term variable remuneration and similar equity arrangements The responsibility for the Remuneration Committee is also to: Approve proposals on salary and other remuneration, including retirement compensation, for the Executive Vice Presidents and other ELT. Approve proposals on targets for the short-term variable remuneration for the Executive Vice Presidents and other ELT. Approve pay out of the short-term variable renumeration for the ELT, based on achievements and performance. The Remuneration Committee’s work is the foundation for the governance of Ericsson’s remuneration processes together with Ericsson’s internal systems and audit controls. The Committee is chaired by Leif Johansson and its other members are Börje Ekholm, Nancy McKinstry, and Karin Åberg. All the members are non-executive directors, independent (except for the employee representative) as required by the Swedish Corporate Governance Code and have relevant knowledge and experience of remuneration matters. The Company’s General Counsel acts as secretary to the Committee. The Chief Executive Officer, the Senior Vice President, Head of Human Resources and Organization and the Vice President, Head of Total Rewards attend the Remuneration Committee meetings by invitation and assist the Committee in its considerations, except when issues relating to their own remuneration are being discussed. The Remuneration Committee has appointed an independent expert advisor, Piia Pilv, to assist and advise the Committee. The independent advisor provided no other services to the Company during 2012. The ERICSSON ANNUAL REPORT ON FORM 20-F 2012 Remuneration Committee is also provided with national and international pay data collected from external survey providers and can call on other independent expertise, should it so require. The Chairman continues to ensure that contact is maintained, as necessary and appropriate, with principal shareholders regarding remuneration. The purpose and function of the Remuneration Committee and its responsibilities can be found on the Ericsson website. These responsibilities, together with the Guidelines for remuneration to Group Management (ELT) and the Long-Term Variable remuneration plan, are reviewed and evaluated annually in light of matters such as changes to corporate governance best practice or changes to accounting, legislation, political opinion or business practices among peers. This helps to ensure that the policy continues to provide Ericsson with a competitive remuneration strategy. The Guidelines for remuneration to Group Management are, in accordance with Swedish law, brought to shareholders annually for approval. The Remuneration Committee met six times during the year 2012. The winter meetings focused on following up on results from the 2011 variable remuneration programs and preparing proposals to shareholders for the 2012 Annual General Meeting (AGM). During the spring the committee determined remuneration to a new member of the ELT and revised the remuneration to others. In the fall, the committee reviewed the Guidelines for remuneration to Group Management and decided to continue the Long-Term Variable remuneration plans without any material changes and the Short-Term Variable remuneration plans with an increased weighting on capital and margins for 2013. The committee based its considerations on the business needs, analyses and reviews of the global market trends and feedback from shareholders and institutions. Supported by the independent advisor, the Committee also reviewed the competitiveness of the ELT remuneration in the global market. The Remuneration Committee is of the opinion that the Long-Term Variable remuneration plans fulfill the defined objectives to promote “One Ericsson” and to align the interests of employees with those of shareholders. The number of participants as of December 1, 2012 was 27,000 employees, compared to 24,000 employees as of December 1, 2011. The evaluation also confirms that the Key Contributor Retention Plan meets the purpose of retaining our key employees. The voluntary attrition rate among Key Contributors is about two-thirds compared to the attrition rate in the total number of employees. REMUNERATION POLICY Remuneration at Ericsson is based on the principles of performance, competitiveness and fairness. The remuneration policy, together with the mix of remuneration elements, is designed to reflect these principles by creating a balanced remuneration package. The Guidelines for remuneration to Group Management 2012 approved by AGM can be found in note C28. The auditor’s report regarding whether we have complied with the guidelines for compensation to the ELT during 2012 is posted on the Ericsson website. ERICSSON ANNUAL REPORT ON FORM 20-F 2012 Summaries of 2012 short- and long-term variable remuneration | | | | | | | | | What we call it | | What is it? | | What is the objective? | | Who participates? | | How is it earned? | Short-term: Remuneration delivered over 12 months or less | | | | | | | Fixed salary | | Fixed remuneration paid at set times | | Attract and retain employees, delivering part of annual remuneration in a predictable format | | All employees | | Market appropriate
levels set according
to position and
evaluated according
to individual
performance | | | | | | | Short-Term Variable remuneration (STV) | | A variable plan that is measured and paid over a single year | | Align employees with clear and relevant targets, providing an earnings opportunity in return for performance, and flexible cost | | Enrolled employees, including Executive Leadership Team. Approx. 73,900 in 2012 | | Achievements
against set targets.
Reward can increase
to up to twice the
target level and
decrease to zero,
depending on
performance | | | | | | | Local and Sales Incentive Plans | | Tailored versions of the STV | | As for STV, tailored for local or business requirements, such as sales | | Employees in sales. Approx. 2,300 in 2012 | | Similar to STV. All
plans have maximum
award and vesting
limits | | Long-term: Remuneration delivered over 3 years or more | | | | | | | Stock Purchase Plan (SPP) | | All-employee stock-based plan | | Reinforce a “One Ericsson” mentality and align employees’ interests with those of shareholders | | All employees are eligible | | Buy one share and it
will be matched by
one share after
3 years if still
employed | | | | | | | Key Contributor Retention Plan (KC) | | Share-based plan for selected individuals | | Recognize, retain and motivate key contributors for performance, critical skills and potential | | Up to 10% of employees | | If selected, get one
more matching share
in addition to the
SPP one | | | | | | | Executive Performance Stock Plan (EPSP) | | Share-based plan for senior executives | | Remuneration for long-term commitment and value creation | | Senior executives, including Executive Leadership Team | | Get up to 4, 6 or, for
CEO, 9 further
matching shares to
the SPP one for
long-term
performance |
REMUNERATION 2012 To enhance the understanding of how Ericsson translates remuneration principles and policy into practice, an internal remuneration website was launched in January 2011. The site contains e-learning and training programs targeted at line managers. It supports more informed decisions and better communication to the wider employee population. The next step in this development is the planned implementation of an Integrated HR IT tool. The first phase was launched to all managers in Ericsson in November 2012 and include performance management, talent planning, variable pay and annual salary review. ERICSSON ANNUAL REPORT ON FORM 20-F 2012 TOTAL REMUNERATION When considering the remuneration of an individual, it is the total remuneration that matters. First, the total annual cash compensation is defined, consisting of the target level of short-term variable remuneration plus fixed salary. Thereafter, target long-term variable remuneration may be added to get to the total target remuneration and, finally, pension and other benefits may be added to arrive at the total remuneration. For the ELT, remuneration consists of fixed salary, short-term and long-term variable remuneration, pension and other benefits. If the size of any one of these elements is increased or decreased when setting the remuneration, at least one other element has to change if the competitive position is to remain unchanged. The remuneration costs for the CEO and the ELT are reported in Note C28. Fixed salary When setting fixed salaries, the Remuneration Committee considers the impact on total remuneration, including pension and associated costs. The absolute levels are determined by the size and complexity of the position and the year-to-year performance of the individual. Together with other elements of remuneration, ELT salaries are subject to an annual review by the Remuneration Committee, which considers external pay data to ensure that levels of pay remain competitive and appropriate to the remuneration policy. Variable remuneration Ericsson strongly believes that, where possible, variable compensation should be encouraged as an integral part of total remuneration. First and foremost, this aligns employees with clear and relevant targets, but it also enables more flexible payroll costs and emphasizes the link between performance and pay. All variable remuneration plans have maximum award and vesting limits. Short-term variable remuneration is to a greater extent dependent on the specific unit or function, while long-term variable remuneration is dependent on the achievements of the Ericsson Group. Short-term variable remuneration Annual variable remuneration is delivered through cash-based programs. Specific business targets are derived from the annual business plan approved by the Board of Directors and, in turn, defined by the Company’s long-term strategy. Ericsson strives to grow faster than the market with best-in-class margins and strong cash conversion and therefore the starting point is to have three core targets: For the ELT, targets are thus predominantly financial at either Group level (for Heads of Group functions) or at the individual unit level (for Heads of regions or business units) and may also include operational targets like customer satisfaction and employee engagement. ERICSSON ANNUAL REPORT ON FORM 20-F 2012 The chart below illustrates how payouts to the ELT have varied with performance over the past five years.
Short-term variable remuneration structure | | | | | | | | | | | | | | | | | | | | | | | | | | | | Short-term variable remuneration
as percentage of fixed salary | | | Percentage of short-term variable
remuneration maximal opportunity | | | | | Target
level | | | Maximum
level | | | Actual paid
for 2012 | | | Group financial
targets | | | Unit/functional
financial targets | | | Non-financial
targets | | CEO 2012 | | | 40 | % | | | 80 | % | | | 32 | % | | | 90 | % | | | 0 | % | | | 10 | % | CEO 2013 | | | 40 | % | | | 80 | % | | | — | | | | 100 | % | | | 0 | % | | | 0 | % | Average ELT 20121) | | | 36 | % | | | 72 | % | | | 37 | % | | | 49 | % | | | 27 | % | | | 24 | % | Average ELT 20131) | | | 38 | % | | | 76 | % | | | — | | | | 50 | % | | | 24 | % | | | 26 | % |
| 1) | Excludes CEO—differences in target and maximum levels from year to year are due to changes in the composition of the ELT. |
The Board of Directors and the Remuneration Committee decide on all Ericsson Group targets, which are cascaded to unit-related targets throughout the Company, always subject to a two-level management approval process. The Remuneration Committee monitors the appropriateness and fairness of Group target levels throughout the performance year and has the authority to revise them should they cease to be relevant or stretching or to enhance shareholder value. During 2012, approximately 76,200 employees participated in short-term variable remuneration plans. Long-term variable remuneration Share-based long-term variable remuneration plans are submitted each year for approval by shareholders at the AGM. All long-term variable remuneration plans are designed to form part of a well-balanced total remuneration package and to span over a minimum of three years. As these are variable plans, outcomes are unknown and rewards depend on long-term personal investment, corporate performance and resulting share price performance. During 2012, share-based remuneration was made up of three different but linked plans: the all-employee Stock Purchase Plan, the Key Contributor Retention Plan and the Executive Performance Stock Plan. The Stock Purchase Plan The all-employee Stock Purchase Plan is designed to offer, where practicable, an incentive for all employees to participate. This reinforces “One Ericsson” aligned with shareholder interests. Employees can save up to 7.5% of gross fixed salary (the President and CEO can save up to 10% of gross fixed salary and short-term variable remuneration) for purchase of Class B shares at market price on NASDAQ OMX Stockholm or ADSs on ERICSSON ANNUAL REPORT ON FORM 20-F 2012 NASDAQ New York (contribution shares) over a twelve-month period. If the contribution shares are retained by the employee for three years after the investment and employment with the Ericsson Group continues during that time, the employee’s shares will be matched with a corresponding number of Class B shares or ADSs, as applicable. The plan was introduced in 2002 and employees in 71 countries participated during its first year. In December 2012, the number of participants was over 27,000, or approximately 28% of eligible employees in 100 countries. Participants save each month, beginning with the August payroll, towards quarterly investments. These investments (in November, February, May and August) are matched on the third anniversary of each such investment and hence the matching spans over two financial years and two tax years. The Key Contributor Retention Plan The Key Contributor Retention Plan is part of Ericsson’s talent management strategy. It is designed to recognize individuals for performance, critical skills and potential as well as to encourage retention of key employees. Under the program, operating units around the world can nominate up to 10% of employees worldwide. Each unit nominates individuals that have been identified according to performance, critical skills and potential. The nominations are calibrated in management teams locally and are reviewed by both local and corporate Human Resources to ensure that there is a minimum of bias and a strong belief in the system. Participants selected obtain one extra matching share in addition to the one matching share for each contribution share purchased under the Stock Purchase Plan during a twelve-month investment period. The plan was introduced in 2004. The Executive Performance Stock Plan The Executive Performance Stock Plan was first introduced in 2004. The plan is designed to focus management on driving long-term financial performance and to provide market competitive remuneration. Senior executives, including the ELT, are selected to obtain up to four or six extra shares (performance matching shares). This is in addition to the one matching share for each contribution share purchased under the all-employee Stock Purchase Plan. Performance matching is subject to the fulfillment of performance targets. Since 2010, the President and CEO may obtain up to nine performance matching shares in addition to the Stock Purchase Plan matching share for each contribution share. In the 2004 to 2010 plans, the performance targets were Earnings Per Share (EPS) targets. To support the long-term strategy and value creation of the Company, new targets were defined for the 2011 plan. At the AGM 2012, the following targets for the 2012 Executive Performance Stock Plan were resolved on proposal by the Board: Up to one-third of the award shall vest provided the compound annual growth rate (CAGR) of consolidated net sales between year 0 (2011 financial year) and year 3 (2014 financial year) is between 2% and 8%. Up to one-third of the award shall vest provided the compound annual growth rate (CAGR) of consolidated operating income between year 0 (2011 financial year) and year 3 (2014 financial year) is between 5% and 15%. Up to one-third of the award will be based on the cash conversion during each of the years during the performance period, calculated as cash flow from operating activities divided by net income reconciled to cash. One-ninth of the total award will vest for any year, i.e. financial years 2012, 2013 and 2014, if cash conversion is at or above 70%. ERICSSON ANNUAL REPORT ON FORM 20-F 2012 Before the number of performance shares to be matched are finally determined, the Board of Directors shall examine whether the performance matching is reasonable considering the Company’s financial results and position, conditions on the stock market and other circumstances, and if not, as determined by the Board of Directors, reduce the number of performance shares to be matched to the lower number of shares deemed appropriate by the Board of Directors. When undertaking its evaluation of performance outcomes the Board of Directors will consider, in particular, the impact of larger acquisitions, divestitures, the creation of joint ventures and any other significant capital event on the three targets on a case by case basis. Benefits and terms of employment Pension benefits follow the competitive practice in the employee’s home country and may contain various supplementary plans, in addition to any national system for social security. Where possible, pension plans are operated on a defined contribution basis. Under these plans, Ericsson pays contributions into a plan but does not guarantee the ultimate benefit, unless local regulations or legislation prescribe that defined benefit plans that do give such guarantees have to be offered. For the President and CEO and other members of the ELT employed in Sweden before 2011, a supplementary pension plan is applied in addition to the occupational pension plan for salaried staff on the Swedish labor market (ITP). The pension age for these ELT members is normally 60 years. The ELT members employed in Sweden from 2011 are normally covered by the defined contribution plan under the ITP1 scheme, with a pensionable age of 65 years. For members of the ELT who are not employed in Sweden, local market competitive pension arrangements apply. Other benefits, such as company car and medical insurance, are also set to be competitive in the local market. The ELT members may not receive loans from the Company. The ELT members locally employed in Sweden have a mutual notice period of up to six months. Upon termination of employment by the Company, severance pay can amount to up to 18 months’ fixed salary. For other ELT members, different notice period and severance pay agreements apply; however, no agreement exceeds the notice period of six months or the severance pay period of 18 months. ERICSSON ANNUAL REPORT ON FORM 20-F 2012 SHARE INFORMATION STOCK EXCHANGE TRADING The Ericsson Class A and Class B shares are listed on NASDAQ OMX Stockholm. In the United States, the Class B shares are listed on NASDAQ New York in the form of American Depositary Shares (ADS) evidenced by American Depositary Receipts (ADR) under the symbol ERIC. Each ADS represents one Class B share. In 2012, approximately 2.4 (3.4) billion shares were traded on NASDAQ OMX Stockholm and about 1.1 (1.6) billion shares were traded on NASDAQ New York. A total of 3.5 (5) billion Ericsson shares where thus traded on the exchanges were we are listed. Trading volume in Ericsson shares decreased by approximately 27% on NASDAQ OMX Stockholm and by approximately 30% on NASDAQ New York compared to 2011. The Ericsson share is also traded on other venues such as BATS Europe, Burgundy, Chi-X Europe. The Ericsson share | | | | | Share listings | | | | | NASDAQ OMX Stockholm | | | | | NASDAQ New York | | | | | | | Share data | | | | | Total number of shares in issue | | | 3,305,051,735 | | of which Class A shares, each carrying one vote1) | | | 261,755,983 | | of which Class B shares, each carrying one tenth of one vote1) | | | 3,043,295,752 | | Ericsson treasury shares, Class B | | | 84,798,095 | | Quotient value | | | SEK 5.00 | | Market capitalization, December 31, 2012 | | | approx. SEK 215 b. | | ICB (Industry Classification Benchmark) | | | 9500 | | | | Ticker codes | | | | | NASDAQ OMX Stockholm | | | ERIC A/ERIC B | | NASDAQ New York | | | ERIC | | Bloomberg NASDAQ OMX Stockholm | | | ERICA SS/ERICB SS | | Bloomberg NASDAQ | | | ERIC US | | Reuters NASDAQ OMX Stockholm | | | ERICa.ST/ERICb.ST | | Reuters NASDAQ | | | ERIC.O | |
| 1) | Both classes of shares have the same rights of participation in the net assets and earnings. |
Changes in number of shares and capital stock 2008–2012 | | | | | | | | | | | | | | | | Number of shares | | | Share capital | | 2008 | | June 2, reverse split 1:5 | | | 3,226,451,735 | | | | 16,132,258,678 | | 2008 | | July 23, new issue (Class C shares, later converted to Class B) | | | 19,900,000 | | | | 99,500,000 | | 2008 | | December 31 | | | 3,246,351,735 | | | | 16,231,758,678 | | 2009 | | June 8, new issue (Class C shares, later converted to Class B) | | | 27,000,000 | | | | 135,000,000 | | 2009 | | December 31 | | | 3,273,351,735 | | | | 16,366,758,678 | | 2010 | | December 31 | | | 3,273,351,735 | | | | 16,366,758,678 | | 2011 | | December 31 | | | 3,273,351,735 | | | | 16,366,758,678 | | 2012 | | June 29, new issue (Class C shares, later converted to Class B)1) | | | 31,700,000 | | | | 158,500,000 | | 2012 | | December 31 | | | 3,305,051,735 | | | | 16,525,258,678 | |
ERICSSON ANNUAL REPORT ON FORM 20-F 2012 | 1) | The Annual General Meeting (AGM) 2012 resolved to issue 31.7 million Class C shares for the Long-Term Variable Remuneration Program (LTV). In accordance with an authorization from the AGM, in the second quarter 2012, the Board of Directors resolved to repurchase the new issued shares, which were subsequently converted into Class B shares. The quotient value of the repurchased shares was SEK 5.00, totaling SEK 158.5 million, representing less than one percent of capital stock, and the acquisition cost was approximately SEK 158.7 million. |
Share performance indicators | | | | | | | | | | | | | | | | | | | | | | | | 2012 | | | 2011 | | | 2010 | | | 2009 | | | 2008 | | Earnings per share, diluted (SEK)1) | | | 1.78 | | | | 3.77 | | | | 3.46 | | | | 1.14 | | | | 3.52 | | Earnings per share, diluted non-IFRS (SEK)2) | | | 2.74 | | | | 4.72 | | | | 4.80 | | | | 2.87 | | | | 4.24 | | Operating income per share (SEK)3)4) | | | 3.25 | | | | 5.58 | | | | 7.42 | | | | 5.80 | | | | 7.50 | | Stockholders’ equity per share, basic, end of period (SEK)5) | | | 42.51 | | | | 44.57 | | | | 45.34 | | | | 43.79 | | | | 44.21 | | P/E ratio | | | 36 | | | | 19 | | | | 22 | | | | 57 | | | | 17 | | Total shareholder return (%) | | | –3 | | | | –7 | | | | 22 | | | | 15 | | | | –20 | | Dividend per share (SEK)6) | | | 2.75 | | | | 2.50 | | | | 2.25 | | | | 2.00 | | | | 1.85 | |
| 1) | Calculated on average number of shares outstanding, diluted. |
| 2) | EPS, diluted, excluding amortizations and write-downs of acquired intangible assets, SEK. |
| 3) | Calculated on average number of shares outstanding, basic. |
| 4) | For 2010, 2009 and 2008 excluding restructuring charges. |
| 5) | Calculated on number of shares, end of period. |
| 6) | For 2012 as proposed by the Board of Directors. |
For definitions of the financial terms used, see Glossary, Financial Terminology and Exchange Rates. SHARE TREND In 2012, Ericsson’s total market capitalization decreased by about 7% to SEK 215 billion, compared to a decrease by 10% reaching SEK 230 billion in 2011. The OMX Stockholm Index on NASDAQ OMX Stockholm increased by 12% and the NASDAQ composite index increased by 16%. The S&P 500 Index increased by 13%.
ERICSSON ANNUAL REPORT ON FORM 20-F 2012
ERICSSON ANNUAL REPORT ON FORM 20-F 2012
OFFER AND LISTING DETAILS Principal trading market—NASDAQ OMX Stockholm—share prices The table below states the high and low share prices for our Class A and Class B shares as reported by NASDAQ OMX Stockholm for the last five years. Trading on the exchange generally continues until 5:30 p.m. (CET) each business day. In addition to trading on the exchange, there is also trading off the exchange and on alternative venues during trading hours and also after 5:30 p.m. (CET). NASDAQ OMX Stockholm publishes a daily Official Price List of Shares which includes the volume of recorded transactions in each listed stock, together with the prices of the highest and lowest recorded trades of the day. The Official Price List of Shares reflects price and volume information for trades completed by the members. The equity securities listed on the NASDAQ OMX Stockholm Official Price List of Shares currently comprise the shares of 258 companies. ERICSSON ANNUAL REPORT ON FORM 20-F 2012 Share prices on NASDAQ OMX Stockholm | | | | | | | | | | | | | | | | | | | | | (SEK) | | 2012 | | | 2011 | | | 2010 | | | 2009 | | | 2008 | | Class A at last day of trading | | | 63.90 | | | | 69.55 | | | | 74.00 | | | | 65.00 | | | | 59.30 | | Class A high (January 3, 2012) | | | 72.00 | | | | 93.60 | | | | 88.40 | | | | 78.80 | | | | 83.60 | | Class A low (November 16, 2012) | | | 55.55 | | | | 59.05 | | | | 65.20 | | | | 55.40 | | | | 40.60 | | Class B at last day of trading | | | 65.10 | | | | 70.40 | | | | 78.15 | | | | 65.90 | | | | 58.80 | | Class B high (January 3, 2012) | | | 71.90 | | | | 96.65 | | | | 90.45 | | | | 79.60 | | | | 83.70 | | Class B low (July 18, 2012) | | | 55.90 | | | | 61.70 | | | | 65.90 | | | | 55.50 | | | | 40.60 | |
Source: Nasdaq OMX Stockholm Share prices on NASDAQ New York | | | | | | | | | | | | | | | | | | | | | (USD) | | 2012 | | | 2011 | | | 2010 | | | 2009 | | | 2008 | | ADS at last day of trading | | | 10.10 | | | | 10.13 | | | | 11.53 | | | | 9.19 | | | | 7.81 | | ADS high (April 3, 2012) | | | 10.60 | | | | 15.44 | | | | 12.39 | | | | 10.92 | | | | 14.00 | | ADS low (May 17, 2012) | | | 8.23 | | | | 8.83 | | | | 9.40 | | | | 6.60 | | | | 5.49 | |
Source: Nasdaq New York Host market NASDAQ New York—ADS prices The table below states the high and low share prices quoted for our ADSs on NASDAQ New York for the last five years. The NASDAQ New York quotations represent prices between dealers, not including retail mark-ups, markdowns or commissions, and do not necessarily represent actual transactions. ERICSSON ANNUAL REPORT ON FORM 20-F 2012 Share prices on NASDAQ OMX Stockholm and NASDAQ New York | | | | | | | | | | | | | | | | | | | | | | | | | | | | NASDAQ OMX Stockholm | | | NASDAQ New York | | | | | SEK per Class A share | | | SEK per Class B share | | | USD per ADS1) | | Period | | High | | | Low | | | High | | | Low | | | High | | | Low | | Annual high and low | | | | | | | | | | | | | | | | | | | | | | | | | 2008 | | | 83.60 | | | | 40.60 | | | | 83.70 | | | | 40.60 | | | | 14.00 | | | | 5.49 | | 2009 | | | 78.80 | | | | 55.40 | | | | 79.60 | | | | 55.50 | | | | 10.92 | | | | 6.60 | | 2010 | | | 88.40 | | | | 65.20 | | | | 90.45 | | | | 65.90 | | | | 12.39 | | | | 9.40 | | 2011 | | | 93.60 | | | | 59.05 | | | | 96.65 | | | | 61.70 | | | | 15.44 | | | | 8.83 | | 2012 | | | 72.00 | | | | 55.55 | | | | 71.90 | | | | 55.90 | | | | 10.60 | | | | 8.23 | | | | | | | | | Quarterly high and low | | | | | | | | | | | | | | | | | | | | | | | | | 2011 First Quarter | | | 80.05 | | | | 70.50 | | | | 83.00 | | | | 73.25 | | | | 13.06 | | | | 10.99 | | 2011 Second Quarter | | | 93.60 | | | | 73.00 | | | | 96.65 | | | | 75.30 | | | | 15.44 | | | | 12.06 | | 2011 Third Quarter | | | 91.80 | | | | 60.50 | | | | 93.80 | | | | 63.15 | | | | 14.82 | | | | 9.33 | | 2011 Fourth Quarter | | | 71.50 | | | | 59.05 | | | | 72.55 | | | | 61.70 | | | | 11.25 | | | | 8.83 | | 2012 First Quarter | | | 72.00 | | | | 59.25 | | | | 71.90 | | | | 58.15 | | | | 10.53 | | | | 8.58 | | 2012 Second Quarter | | | 69.70 | | | | 58.75 | | | | 69.95 | | | | 59.60 | | | | 10.60 | | | | 8.23 | | 2012 Third Quarter | | | 67.00 | | | | 55.95 | | | | 67.80 | | | | 55.90 | | | | 10.05 | | | | 8.23 | | 2012 Fourth Quarter | | | 64.90 | | | | 55.55 | | | | 66.85 | | | | 56.60 | | | | 10.21 | | | | 8.31 | | | | | | | | | Monthly high and low | | | | | | | | | | | | | | | | | | | | | | | | | August 2012 | | | 67.00 | | | | 60.55 | | | | 67.80 | | | | 61.50 | | | | 10.05 | | | | 9.14 | | September 2012 | | | 62.55 | | | | 58.35 | | | | 64.10 | | | | 59.85 | | | | 9.79 | | | | 8.91 | | October 2012 | | | 59.85 | | | | 56.10 | | | | 61.00 | | | | 57.40 | | | | 9.27 | | | | 8.57 | | November 2012 | | | 60.50 | | | | 55.55 | | | | 62.30 | | | | 56.60 | | | | 9.41 | | | | 8.31 | | December 2012 | | | 64.90 | | | | 60.00 | | | | 66.85 | | | | 62.45 | | | | 10.21 | | | | 9.40 | | January 2013 | | | 74.30 | | | | 62.90 | | | | 76.95 | | | | 64.50 | | | | 11.82 | | | | 9.78 | | February 2013 | | | 77.75 | | | | 72.30 | | | | 79.90 | | | | 74.20 | | | | 12.70 | | | | 11.97 | | March 2013 | | | 84.55 | | | | 75.60 | | | | 86.40 | | | | 77.60 | | | | 13.46 | | | | 12.07 | |
| 1) | One ADS = 1 Class B share. |
Source: Nasdaq OMX Stockholm and Nasdaq New York SHAREHOLDERS As of December 31, 2012, the Parent Company had 551,719 shareholders registered at Euroclear Sweden AB (the Central Securities Depository—CSD), of which 1,080 holders had a US address. According to information provided by our depositary, Citibank, there were 189,454,944 ADSs outstanding as of December 31, 2012, and 4,500 registered holders of such ADSs. A significant number of Ericsson ADSs are held by banks, brokers and/or nominees for the accounts of their customers. As of January 3, 2013, the total number of bank, broker and/or nominee accounts holding Ericsson ADSs was 169,190. According to information known at year-end 2012, approximately 78% of our Class A and Class B shares were owned by institutions, Swedish and international. Our major shareholders do not have different voting rights than other shareholders holding the same classes of shares. As far as we know, the Company is not directly or indirectly owned or controlled by another corporation, by any foreign government or by any other natural or legal person(s) separately or jointly. ERICSSON ANNUAL REPORT ON FORM 20-F 2012
The table shows the total number of shares in the Parent Company owned by the Executive Leadership Team and Board members (including Deputy employee representatives) as a group as of December 31, 2012. The Executive Leadership Team and Board members, ownership | | | | | | | | | | | | | | | | Number of
Class A
shares | | | Number of
Class B
shares | | | Voting
rights,
percent | | The Executive Leadership Team and Board members as a group (31 persons) | | | 0 | | | | 559,450 | | | | 0.01 | |
For individual holdings, see Corporate Governance Report. ERICSSON ANNUAL REPORT ON FORM 20-F 2012 The following table shows share information, as of December 31, 2012, with respect to our 15 largest shareholders, ranked by voting rights, as well as percentage of voting rights as of December 31, 2012, 2011 and 2010. Largest shareholders, December 31, 2012 and percentage of voting rights, December 31, 2012, 2011 and 2010 | | | | | | | | | | | | | | | | | | | | | | | | | | | | | Identity of person or group1) | | Number of
Class A
shares | | | Of total
Class A
shares,
percent | | | Number of
Class B
shares | | | Of total
Class B
shares,
percent | | | 2012
Voting rights,
percent | | | 2011
Voting rights,
percent | | | 2010
Voting rights,
percent | | Investor AB | | | 115,018,707 | | | | 43.94 | | | | 59,284,545 | | | | 1.95 | | | | 21.37 | | | | 21.48 | | | | 19.33 | | AB Industrivärden | | | 84,708,520 | | | | 32.36 | | | | 0 | | | | 0.00 | | | | 14.96 | | | | 14.34 | | | | 13.80 | | Handelsbankens Pensionsstiftelse | | | 21,057,443 | | | | 8.04 | | | | 0 | | | | 0.00 | | | | 3.72 | | | | 4.20 | | | | 3.52 | | Swedbank Robur Fonder AB | | | 1,505,751 | | | | 0.58 | | | | 138,107,152 | | | | 4.54 | | | | 2.71 | | | | 2.79 | | | | 2.73 | | AFA Försäkring AB | | | 11,423,000 | | | | 4.36 | | | | 9,151,631 | | | | 0.30 | | | | 2.18 | | | | 2.31 | | | | 0.45 | | Blackrock Fund Advisors | | | 0 | | | | 0.00 | | | | 77,802,606 | | | | 2.56 | | | | 1.37 | | | | 1.46 | | | | 1.44 | | Norges Bank Investment Management | | | 0 | | | | 0.00 | | | | 77,226,311 | | | | 2.54 | | | | 1.36 | | | | 1.24 | | | | 0.89 | | Skandia Liv | | | 6,263,167 | | | | 2.39 | | | | 11,414,818 | | | | 0.38 | | | | 1.31 | | | | 1.36 | | | | 2.98 | | AMF Pensionsförsäkring AB | | | 0 | | | | 0.00 | | | | 71,108,980 | | | | 2.34 | | | | 1.26 | | | | 1.34 | | | | 1.34 | | Aberdeen Asset Managers Ltd. | | | 0 | | | | 0.00 | | | | 65,706,158 | | | | 2.16 | | | | 1.16 | | | | 1.05 | | | | 1.01 | | Dodge & Cox, Inc. | | | 0 | | | | 0.00 | | | | 64,443,081 | | | | 2.12 | | | | 1.14 | | | | 0.96 | | | | 1.43 | | Pensionskassan SHB Försäkringsförening | | | 6,381,570 | | | | 2.44 | | | | 0 | | | | 0.00 | | | | 1.13 | | | | 1.39 | | | | 2.07 | | Orbis Investment Management Ltd. | | | 0 | | | | 0.00 | | | | 62,271,048 | | | | 2.05 | | | | 1.10 | | | | 0.35 | | | | 0.06 | | OppenheimerFunds, Inc. | | | 0 | | | | 0.00 | | | | 62,070,708 | | | | 2.04 | | | | 1.10 | | | | 1.20 | | | | 1.29 | | Handelsbanken Fonder AB | | | 261,500 | | | | 0.10 | | | | 58,019,980 | | | | 1.91 | | | | 1.07 | | | | 0.96 | | | | 1.05 | | Others | | | 15,136,325 | | | | 5.78 | | | | 2,286,688,734 | | | | 75.14 | | | | 43.07 | | | | 43.57 | | | | 46.61 | | | | | | | | | | | | | | | | | | | | | | | | | | | | | | | Total | | | 261,755,983 | | | | 100 | | | | 3,043,295,752 | | | | 100 | | | | 100 | | | | 100 | | | | 100 | | | | | | | | | | | | | | | | | | | | | | | | | | | | | | |
| 1) | Source: Capital Precision |
ERICSSON ANNUAL REPORT ON FORM 20-F 2012 SUPPLEMENTAL INFORMATION The following information is provided to comply with certain requirements of Form 20-F which are not satisfied in full by the information in the Swedish Annual Report. GENERAL FACTS ON THE COMPANY Legal name of the Parent Company: Telefonaktiebolaget LM Ericsson (publ) Organization number: 556016-0680 Legal form of the Parent Company: A Swedish limited liability company, organized under the Swedish Companies Act. The terms “Ericsson”, the “Company”, the “Group”, “us”, “we”, and “our” all refer to Telefonaktiebolaget LM Ericsson and its subsidiaries. Country of incorporation: Sweden. Date of incorporation: The Parent Company was incorporated on August 18, 1918, as a result of a merger between AB LM Ericsson & Co. and Stockholms Allmänna Telefon AB. Domicile: Our registered office is Telefonaktiebolaget LM Ericsson, SE–164 83 Stockholm, Sweden. Our headquarters are located at Torshamnsgatan 23, Kista, Sweden. Telephone number: +46 10 719 0000 Website: www.ericsson.com The information included on our website is not incorporated herein by reference. Agent in the US: Ericsson Inc., Vice President Legal Affairs, 6300 Legacy Drive, Plano, Texas 75024. Telephone number: +1 972 583 0000. Shares: Ericsson’s Class A and Class B shares are traded on NASDAQ OMX Stockholm. In the US, our American Depository Shares (ADS), each representing one underlying Class B share, are traded on NASDAQ. Parent Company operations: The business of the Parent Company, Telefonaktiebolaget LM Ericsson, consists mainly of corporate management, holding company functions and internal banking activities. Parent Company operations also include customer credit management activities performed by Ericsson Credit AB on a commission basis. Subsidiaries and associated companies: For a listing of our significant subsidiaries, please see section “Investments”. In addition to our joint venture ST-Ericsson, we are engaged in a number of other minor joint ventures and cooperative arrangements. For more information regarding risks associated with joint ventures, strategic alliances and third-party agreements please see Risk Factors, “Market, Technology and Business Risks”. Filings in the US: Annual reports and other information are filed with, or furnished to, the Securities and Exchange Commission (SEC) in the United States, pursuant to the rules and regulations that apply to foreign private issuers. Electronic access to these documents may be obtained from the SEC’s website, www.sec.gov, where they are stored in the EDGAR database. ERICSSON ANNUAL REPORT ON FORM 20-F 2012 COMPANY HISTORY AND DEVELOPMENT Innovating to empower people, business and society Our origins date back to 1876 when Alexander Graham Bell filed a patent application in the United States for the telephone. The same year, Lars Magnus Ericsson opened a small workshop in Stockholm to repair telegraph instruments and sell his own telephone equipment. Today, Ericsson is a leading provider of communications equipment, telecom services and support solutions. Our customers, in over 180 countries, are mainly operators of communications networks worldwide. We manage networks, or parts of networks, for 950 million subscribers. EXCHANGE RATES The following tables provide information with respect to the exchange rate for SEK per USD 1.00, based on the noon buying rate for cable transfers in SEK as certified for customs purposes by the Federal Reserve Bank of New York. The noon buying rate of March 29, 2013, was SEK 6.5280 per USD 1.00. The average is computed using the noon buying rate on the last business day of each month during the period indicated. AVERAGE EXCHANGE RATES | | | | | Year ended December 31 | | Average | | 2008 | | | 6.6424 | | 2009 | | | 7.6232 | | 2010 | | | 7.1895 | | 2011 | | | 6.4263 | | 2012 | | | 6.7247 | |
| | | | | | | | | | EXCHANGE RATES, MONTHLY HIGH AND LOW | | | | | | | | | | | | Month | | High | | | Low | | September 2012 | | | 6.7450 | | | | 6.5018 | | October 2012 | | | 6.7023 | | | | 6.5484 | | November 2012 | | | 6.8019 | | | | 6.6092 | | December 2012 | | | 6.6920 | | | | 6.5074 | | January 2013 | | | 6.5568 | | | | 6.3476 | | February 2013 | | | 6.4764 | | | | 6.2880 | | March 2013 (latest available data is for March 29) | | | 6.5280 | | | | 6.3412 | |
Effects of exchange rate fluctuations on our business is described in the Notes to the Consolidated Financial Statements—Note C20, “Financial Risk Management and Financial Instruments.” Noon buying rates are not used in the preparation of our financial statements. ERICSSON ANNUAL REPORT ON FORM 20-F 2012 PRIMARY MANUFACTURING AND ASSEMBLY FACILITIES We continuously adjust our production capacity to meet expected customer demand. At year-end 2012, our overall capacity utilization was close to 100%. The table “Primary manufacturing and assembly facilities” summarizes where we have major sites and the total floor space at year-end. In Sweden, the majority of the floor space within our production facilities is used for node assembly and verification. PRIMARY MANUFACTURING AND ASSEMBLY FACILITIES | | | | | | | | | | | | | | | | | | | | | | | | | | | | 2012 | | | 2011 | | | 2010 | | | | | Sites | | | Thousands of
sq meters | | | Sites | | | Thousands
of sq meters | | | Sites | | | Thousands
of sq meters | | | | | | | | | Sweden | | | 7 | | | | 125.1 | | | | 7 | | | | 125.1 | * | | | 6 | | | | 204.4 | | China | | | 5 | | | | 83.5 | | | | 5 | | | | 91.1 | | | | 4 | | | | 61.1 | | Estonia | | | 1 | | | | 23.7 | | | | 1 | | | | 23.7 | | | | 1 | | | | 20.6 | | Italy | | | 1 | | | | 10.5 | | | | 2 | | | | 20.1 | | | | 2 | | | | 20.1 | | Brazil | | | 1 | | | | 37.4 | | | | 1 | | | | 33.7 | | | | 1 | | | | 23.3 | | Mexico | | | 1 | | | | 0.6 | | | | — | | | | — | | | | — | | | | — | | India | | | 1 | | | | 25.0 | | | | 1 | | | | 25.0 | * | | | 1 | | | | 15.6 | | | | | | | | | | | | | | | | | | | | | | | | | | | Total | | | 17 | | | | 305.8 | | | | 17 | | | | 318.7 | | | | 15 | | | | 345.1 | | | | | | | | | | | | | | | | | | | | | | | | | | |
| * | Restated for 2011 to only include manufacturing and assembly areas. The reported number for China in the 20-F for 2011 was 80.7 and for Sweden 429.3. These numbers comprised total land use. |
OPERATING RESULTS Years ended December 31, 2011 and 2012 Please refer to Board of Directors’ Report. ERICSSON ANNUAL REPORT ON FORM 20-F 2012 Years ended December 31, 2010 and 2011 FINANCIAL RESULTS OF OPERATIONS ABBREVIATED INCOME STATEMENT WITH RECONCILIATION IFRS—NON-IFRS MEASURES | | | | | | | | | | | | | | | | | | | | | | | | | | | | | | | | | | | | | | | | IFRS | | | Restructuring charges | | | Non-IFRS measures | | SEK billion | | 2011 | | | 2010 | | | 2009 | | | 2011 | | | 2010 | | | 2009 | | | 2011 | | | 2010 | | | 2009 | | Net sales | | | 226.9 | | | | 203.3 | | | | 206.5 | | | | | | | | | | | | | | | | 226.9 | | | | 203.3 | | | | 206.5 | | Cost of sales | | | –147.2 | | | | –129.1 | | | | –136.3 | | | | –1.2 | | | | –3.4 | | | | –4.2 | | | | –146.0 | | | | –125.7 | | | | –132.1 | | | | | | | | | | | | | | | | | | | | | | | | | | | | | | | | | | | | | | | Gross income | | | 79.7 | | | | 74.3 | | | | 70.2 | | | | –1.2 | | | | –3.4 | | | | –4.2 | | | | 80.9 | | | | 77.6 | | | | 74.4 | | Gross margin % | | | 35.1 | % | | | 36.5 | % | | | 34.0 | % | | | | | | | | | | | | | | | 35.7 | % | | | 38.2 | % | | | 36.0 | % | | | | | | | | | | | | | | | | | | | | | | | | | | | | | | | | | | | | | | Operating expenses | | | –59.3 | | | | –58.6 | | | | –60.0 | | | | –2.0 | | | | –3.5 | | | | –7.1 | | | | –57.3 | | | | –55.2 | | | | –52.9 | | Operating expenses as % of sales | | | 26.1 | % | | | 28.8 | % | | | 29.0 | % | | | | | | | | | | | | | | | 25.3 | % | | | 27.1 | % | | | 25.6 | % | Other operating income and expenses | | | 1.3 | | | | 2.0 | | | | 3.1 | | | | — | | | | — | | | | — | | | | 1.3 | | | | 2.0 | | | | 3.1 | | | | | | | | | | | | | | | | | | | | | | | | | | | | | | | | | | | | | | | Operating income before share in earnings of JVs and associated companies | | | 21.7 | | | | 17.6 | | | | 13.3 | | | | –3.2 | | | | –6.8 | | | | –11.3 | | | | 24.9 | | | | 24.4 | | | | 24.6 | | Operating margin % before share in earnings of JVs and associated companies | | | 9.6 | % | | | 8.7 | % | | | 6.5 | % | | | | | | | | | | | | | | | 11.0 | % | | | 12.0 | % | | | 11.9 | % | | | | | | | | | | | | | | | | | | | | | | | | | | | | | | | | | | | | | | Share in earnings of JVs and associated companies | | | –3.8 | | | | –1.2 | | | | –7.4 | | | | –0.6 | | | | –0.5 | | | | –1.3 | | | | –3.2 | | | | –0.7 | | | | –6.1 | | | | | | | | | | | | | | | | | | | | | | | | | | | | | | | | | | | | | | | Operating income | | | 17.9 | | | | 16.5 | | | | 5.9 | | | | –3.7 | | | | –7.3 | | | | –12.6 | | | | 21.6 | | | | 23.7 | | | | 18.5 | | Operating margin % | | | 7.9 | % | | | 8.1 | % | | | 2.9 | % | | | | | | | | | | | | | | | 9.5 | % | | | 11.7 | % | | | 9.0 | % | | | | | | | | | | | | | | | | | | | | | | | | | | | | | | | | | | | | | | Financial income and expense, net | | | 0.2 | | | | –0.7 | | | | 0.3 | | | | | | | | | | | | | | | | | | | | | | | | | | Taxes | | | –5.6 | | | | –4.5 | | | | –2.1 | | | | | | | | | | | | | | | | | | | | | | | | | | Net income | | | 12.6 | | | | 11.2 | | | | 4.1 | | | | | | | | | | | | | | | | | | | | | | | | | | EPS diluted (SEK) | | | 3.77 | | | | 3.46 | | | | 1.14 | | | | | | | | | | | | | | | | | | | | | | | | | | | | | | | | | | | | | | | | | | | | | | | | | | | | | | | | | | | | | | |
The non-IFRS financial measures presented herein are not measures of financial performance calculated or presented under IFRS, but rather are measures used as supplemental information to the IFRS results. Since there were restructuring costs during 2009 and 2010 with significant impact on reported results and margins, certain income statement line items excluding restructuring charges, are presented as non-IFRS financial measures to facilitate analysis by indicating Ericsson’s underlying performance. Non-IFRS financial measures have limitations as analytical tools and should not be viewed in isolation or as substitutes to the IFRS financial measures, and do not necessarily indicate whether cash flow will be sufficient or available to meet Ericsson’s requirements, and may not be indicative of our historical operating results, nor are such measures meant to be predictive of future results. Non-IFRS measures for 2011 have also been included to facilitate comparison with previous years. Sales 2011 was a year with strong sales growth of 12%, driven by strong demand for mobile broadband along with network rollout services. Sales were negatively impacted by the strong SEK. Sales for comparable units, adjusted for currency exchange rate effects and hedging, increased 19%. ERICSSON ANNUAL REPORT ON FORM 20-F 2012 In 2011, the Company executed on its strategy to leverage its strengths in the growth areas mobile broadband, managed services, OSS and BSS. Due to the technology cycle where mobile broadband is being rolled out, the business mix shifted to more coverage projects. Ericsson also implemented its strategy to capture new market share in the network modernization projects in Europe, despite their initial lower margins. In 2011, seven out of ten regions grew. In the year, there was an impact from slower operator spending after a period of high investments in capacity, especially in North America and Russia, as well as political unrest in certain countries. In the last quarter of the year, the Company also noticed some increased operator cautiousness due to uncertainties such as economic development and continued political unrest in certain countries. In 2011, the share of software sales declined to 23% (24%) of sales while the portion of hardware increased to 40% (37%). The increase in hardware is a result of demand for mobile broadband products. In the short term, the software share might continue to decrease due to a higher portion of projects with a lot of hardware. Longer term, the software part should increase following more expansions and upgrades of networks. Services sales amounted to 37% (39%) in 2011. Seasonality The Company’s quarterly sales, income and cash flow from operations are seasonal in nature, generally lowest in the first quarter of the year and highest in the fourth quarter. This is mainly a result of the seasonal purchase patterns of network operators. MOST RECENT FIVE-YEAR AVERAGE SEASONALITY | | | | | | | | | | | | | | | | | | | | First
quarter | | | Second
quarter | | | Third
quarter | | | Fourth
quarter | | Sequential change | | | –21 | % | | | 8 | % | | | –4 | % | | | 27 | % | Share of annual sales | | | 23 | % | | | 24 | % | | | 23 | % | | | 30 | % |
Financial numbers in this section are reported: for 2011, including restructuring charges for 2010, excluding restructuring charges. Gross margin Gross margin declined to 35.1% (38.2%) due to higher share of coverage projects, network modernization projects in Europe and 3G rollouts in India. Gross margin in 2010, including restructuring charges, amounted to 36.5%. Operating expenses To secure continued technology leadership, focus is on innovation and R&D. R&D expenses amounted to SEK 32.6 (29.9) billion. Spending on R&D as a percentage of sales was 14.4% (14.7%). In 2010, R&D spend including restructuring charges was SEK 31.6 billion or 15.5% of sales. The increase in absolute number is a result of planned higher investments in radio, such as TD-LTE, IP and the acquired LG-Ericsson operations. In 2012, R&D expenses of SEK 29–31 billion is estimated. The estimate includes amortizations/write-downs of intangible assets related to major acquisitions previously made. However, currency effects may cause this to change. ERICSSON ANNUAL REPORT ON FORM 20-F 2012 Selling and administrative expenses represented 11.8% of sales compared to 12.4% in 2010. The amount was SEK 26.7 (25.3) billion. In 2010, the amount including restructuring charges was SEK 27.1 billion, representing 13.3% of sales. In the year, there were positive effects from efficiency work along with the strong SEK. Operating margin before JVs Operating margin before share in JV earnings decreased to 9.6% (12.0%). However, in 2010, operating margin before share in JV earnings and including restructuring charges amounted to 8.7%. Share in earnings of JVs In 2011, Sony Ericsson reported a loss. The loss reflects intense competition, price erosion, restructuring charges and supply chain issues following the earthquake and tsunami in Japan. Ericsson’s share in Sony Ericsson’s income before tax was SEK –1.2 (0.9) billion. In 2010, Ericsson’s share amounted to SEK 0.7 billion including restructuring charges. ST-Ericsson reported a loss also in 2011. ST-Ericsson is currently in a shift from legacy to new products. Ericsson’s share in ST-Ericsson’s income before tax, adjusted to IFRS, was SEK –2.7 (–1.5) billion. In 2010, the loss amounted to SEK –1.8 billion including restructuring charges. Operating income Operating income was SEK 17.9 (23.7) billion. However, in 2010, operating income including restructuring charges amounted to SEK 16.5 billion. Financial net The financial net was SEK 0.2 (–0.7) billion. The difference is mainly attributable to a higher interest net of SEK 0.8 billion compared to 2010. Taxes The tax expense for the year was SEK 5.6 (4.5) billion or 30.6% (28.8%) of income after financial items. The tax rate may vary between years depending on business and geographic mix. The tax rate excluding joint ventures and associated companies was 26.4% (25.7%) due to lower tax rates from the loss-making joint ventures. Net income Net income increased 12% to SEK 12.6 (11.2) billion driven by higher sales and lower restructuring charges. Earnings per share, diluted Earnings per share increased 9% to SEK 3.77 (3.46). The Board of Directors proposes a dividend of SEK 2.50 (2.25). This represents an increase of 11%. Restructuring charges Total restructuring charges were SEK 3.2 (6.8) billion, excluding joint ventures. Cash outlays that have been provided for were SEK 3.2 (3.3) billion. At the end of the year, cash outlays of SEK 1.3 billion remain to be made. In 2012, restructuring charges of approximately SEK 4 billion are estimated. ERICSSON ANNUAL REPORT ON FORM 20-F 2012 Ericsson’s share in Sony Ericsson’s restructuring charges amounted to SEK 0.4 (0.2) billion. Ericsson’s share in ST-Ericsson’s restructuring charges was SEK 0.1 (0.3) billion. RESEARCH AND DEVELOPMENT PROGRAM | | | | | | | | | | | | | | | | 2011 | | | 2010 | | | 2009 | | Expenses (SEK billion)1) | | | 32.6 | | | | 29.9 | | | | 27.0 | | As percent of Net sales | | | 14.4 | % | | | 14.7 | % | | | 13.1 | % | Employees within R&D as of December 312) | | | 22,400 | | | | 20,800 | | | | 18,300 | | Patents2) | | | 30,000 | | | | 27,000 | | | | 25,000 | |
| 1) | Excluding restructuring charges for 2009 and 2010. |
| 2) | The number of employees and patents are approximate. |
FINANCIAL POSITION CONSOLIDATED BALANCE SHEET (ABBREVIATED) | | | | | | | | | | | | | December 31, SEK billion | | 2011 | | | 2010 | | | 2009 | | ASSETS | | | | | | | | | | | | | Non-current assets, total | | | 81.5 | | | | 83.4 | | | | 87.4 | | of which intangible assets | | | 44.0 | | | | 46.8 | | | | 48.2 | | of which property, plant and equipment | | | 10.8 | | | | 9.4 | | | | 9.6 | | of which financial assets | | | 13.7 | | | | 14.5 | | | | 15.3 | | of which deferred tax assets | | | 13.0 | | | | 12.7 | | | | 14.3 | | Current assets, total | | | 198.8 | | | | 198.4 | | | | 182.4 | | of which inventory | | | 33.1 | | | | 29.9 | | | | 22.7 | | of which trade receivables | | | 64.5 | | | | 61.1 | | | | 66.4 | | of which other receivables/financing | | | 20.7 | | | | 20.2 | | | | 16.6 | | of which short-term investments, cash and cash equivalents | | | 80.5 | 2) | | | 87.2 | | | | 76.7 | | Total assets | | | 280.3 | | | | 281.8 | | | | 269.8 | | | | | | EQUITY AND LIABILITIES | | | | | | | | | | | | | Equity | | | 145.3 | | | | 146.8 | | | | 141.0 | | Non-current liabilities | | | 38.1 | | | | 38.3 | | | | 43.3 | | of which post-employment benefits | | | 10.0 | | | | 5.1 | | | | 8.5 | | of which borrowings | | | 23.3 | | | | 27.0 | | | | 30.0 | | of which other non-current liabilities | | | 4.8 | | | | 6.2 | | | | 4.8 | | Current liabilities | | | 97.0 | | | | 96.8 | | | | 85.5 | | of which provisions | | | 6.0 | | | | 9.4 | | | | 12.0 | | of which current borrowings | | | 7.8 | | | | 3.8 | | | | 2.1 | | of which trade payables | | | 25.3 | | | | 25.0 | | | | 18.9 | | of which other current liabilities | | | 58.0 | | | | 58.6 | | | | 52.5 | | Total equity and liabilities1) | | | 280.3 | | | | 281.8 | | | | 269.8 | |
| 1) | Of which interest-bearing liabilities and post-employment benefits SEK 41.0 (35.9) billion. |
| 2) | Including loan to ST-Ericsson of SEK 2.8 billion. |
Ericsson’s strategy is to maintain a strong balance sheet including a sufficiently large cash position to ensure the financial flexibility to operate freely and to capture business opportunities. This has been particularly important during the past years’ difficult macroeconomic and financial market situation. ERICSSON ANNUAL REPORT ON FORM 20-F 2012 By maintaining a strong cash position, the Company can also maintain an active strategy for strategic mergers and acquisitions. An important focus area is the monitoring of working capital. Major efforts have been made during the year in order to reduce days sales outstanding and inventory turnover days as well as to increase payable days. The target for payable days was met, while the other two targets were not achieved. The efforts to further reduce working capital will continue in 2012 and the working capital targets are the same as previous years. In 2011, the dividend was SEK 2.25 per share. The Board of Directors will propose to the Annual General Meeting 2012 a dividend of SEK 2.50 per share. This represents a total dividend of approximately SEK 8.2 billion. The proposal reflects year 2011’s earnings and balance sheet structure, as well as coming years’ business plans and expected economic development. Non-current assets Intellectual property rights, brands and other intangible assets decreased to SEK 13.1 (16.7) billion due to amortizations. Customer financing, current and non-current, decreased slightly to SEK 4.2 (4.4) billion. Current assets Inventory levels increased during the year by SEK 3.2 billion due to higher sales and increased share of coverage projects. At year end, inventory was SEK 33.1 (29.9) billion. The higher inventory level followed a higher level of work in progress in the regions. The target of inventory turnover days less than 65 days was not reached and improvement efforts will continue in 2012. Trade receivables: Days sales outstanding reached 91 (88) days at year-end. This reflects a higher portion of coverage projects and higher sales volumes. The Company’s nominal credit losses have historically been low and continued to be so in 2011. Net cash decreased to SEK 39.5 (51.3) billion, mainly due to a negative change in net operating assets, investing and dividend paid to shareholders. Pension liabilities increased due to lower discount rate and this impacted net cash negatively. Equity Equity decreased by SEK –1.5 billion to SEK 145.3 (146.8) billion. Net income was SEK 12.6 (11.2) billion and dividends of SEK 7.5 (6.7) billion was paid during the year. The equity ratio was maintained at a healthy level of 52% (52%). Return on equity increased to 8.5% (7.8%), primarily due to higher sales and lower restructuring charges. Return on capital employed (ROCE) was 11.3% (9.6%). In 2010, ROCE excluding restructuring charges was 13.6%. Non-current liabilities Post-employment benefits related to defined benefit plans increased to SEK 10.0 (5.1) billion. In 2011 there was a decrease in discount rates, and plan assets yielded lower than expected. Consequently, the Company experienced an increase in the net pension liability and the funded ratio (plan assets as percentage of defined benefit obligations) decreased to 77% (89%). ERICSSON ANNUAL REPORT ON FORM 20-F 2012 Current liabilities Provisions declined to SEK 6.0 (9.4) billion. SEK 1.3 (3.2) billion were related to restructuring. The cash outlays of provisions were SEK 6.0 (7.2) billion. The lower amount of provisions is mainly due to lower restructuring. In addition, the business mix with more coverage projects as well as good performance in both hardware and software for new products introduced decreased the need for warranty provisions. There is also an effect of improved project management as well as geographical mix. Provisions will fluctuate over time, depending on business mix, market mix and technology shifts. Payable days was unchanged at 62 (62) days. The target of payable days of above 60 days was met. Non-current borrowings decreased to SEK 23.3 (27.0) billion. No major changes were made in the debt maturity profile during 2011. Debt of SEK 3.4 billion is maturing in 2012 and SEK 5.4 billion in 2013. The Company also has unutilized committed credit facilities of USD 2.0 billion available, maturing in 2014. Off-balance sheet arrangements There are currently no material off-balance sheet arrangements that have, or would be reasonably likely to have, a current or anticipated effect on the Company’s financial condition, revenues, expenses, result of operations, liquidity, capital expenditures or capital resources. CASH FLOW CASH FLOW (ABBREVIATED) JANUARY-DECEMBER | | | | | | | | | | | | | SEK billion | | 2011 | | | 2010 | | | 2009 | | Net income | | | 12.6 | | | | 11.2 | | | | 4.1 | | Income reconciled to cash | | | 25.2 | | | | 23.7 | | | | 21.0 | | Changes in operating net assets | | | –15.2 | | | | 2.9 | | | | 3.5 | | Cash flow from operating activities | | | 10.0 | | | | 26.6 | | | | 24.5 | | Adjusted operating cash flow1) | | | 13.2 | | | | 29.8 | | | | 28.7 | | Cash flow from investing activities | | | 4.5 | | | | –12.5 | | | | –37.5 | | of which capital expenditures, sales of PP&E, product development | | | –6.1 | | | | –5.2 | | | | –4.9 | | of which acquisitions/divestments, net | | | –3.1 | | | | –2.8 | | | | –18.1 | | of which short-term investments for cash management purposes and other investing activities | | | 13.8 | | | | –4.5 | | | | –14.5 | | Cash flow before financing activities | | | 14.5 | | | | 14.0 | | | | –13.0 | | | | | | | | | | | | | | | Cash flow from financing activities | | | –6.5 | | | | –5.7 | | | | –1.7 | | | | | | | | | | | | | | | Cash conversion (Cash flow from operating activities divided by income reconciled to cash) | | | 40 | % | | | 112 | % | | | 117 | % | | | | | | | | | | | | | | Gross cash (Cash, cash equivalents and short-term investments) | | | 80.5 | 2) | | | 87.2 | | | | 76.7 | | | | | | | | | | | | | | | Net cash (Gross cash less interest-bearing liabilities and post-employment benefits) | | | 39.5 | | | | 51.3 | | | | 36.1 | | | | | | | | | | | | | | |
| 1) | Cash flow from operations excl. restructuring cash outlays that have been provided for. |
| 2) | Including loan to ST-Ericsson of SEK 2.8 billion. |
In 2011, gross cash decreased by SEK 6.6 billion to SEK 80.5 (87.2) billion. The net income reconciled to cash of SEK 25.2 billion was offset by a change in net operating assets of SEK –15.2 billion and investing activities of SEK –9.9 billion. Dividends to shareholders amounted to SEK –7.5 (–6.7) billion. Net cash decreased to SEK 39.5 (51.3) billion. ERICSSON ANNUAL REPORT ON FORM 20-F 2012 Cash flow from operating activities The adjusted operating cash flow was negatively impacted by higher working capital. During 2011, cash flow was negatively impacted by a significant increase in working capital as a result of higher sales and more projects. Cash flow from investing activities Cash outlays for regular investing activities increased to SEK –6.1 (–5.2) billion. Acquisitions and divestments during the year were net SEK –3.1 (–2.8) billion, with the major items Nortel’s GDNT operation in China and Nortel’s Multi-Service Switch business (MSS). The Nortel patent portfolio was acquired in partnership with other industry players. Cash flow for short-term investments for cash management purposes and other investing activities was net SEK 13.8 (–4.5) billion, mainly attributable to changes between short-term investments and cash and cash equivalents. Capital expenditures Annual capital expenditures are normally around two percent of sales and are expected to remain at this level. This corresponds to the needs for keeping and maintaining the current capacity level, including the introduction of new technology and methods. The expenditures are largely related to test equipment in R&D units, network operations centers as well as manufacturing and repair operations. The Board of Directors reviews the Company’s investment plans and proposals. The Company has sufficient cash and cash generation capacity to fund expected capital expenditures without external borrowings in 2012. We believe that the Company’s property, plant and equipment and the facilities the Company occupies are suitable for its present needs in most locations. As of December 31, 2011, no material land, buildings, machinery or equipment were pledged as collateral for outstanding indebtedness. CAPITAL EXPENDITURES 2007–2011 | | | | | | | | | | | | | | | | | | | | | SEK billion | | 2011 | | | 2010 | | | 2009 | | | 2008 | | | 2007 | | Capital expenditures | | | 5.0 | | | | 3.7 | | | | 4.0 | | | | 4.1 | | | | 4.3 | | of which in Sweden | | | 1.7 | | | | 1.4 | | | | 1.3 | | | | 1.6 | | | | 1.3 | | as percent of net sales | | | 2.2 | % | | | 1.8 | % | | | 1.9 | % | | | 2.0 | % | | | 2.3 | % |
Cash flow from financing activities Cash flow from financing activities was SEK –6.5 billion. Dividends paid were SEK –7.5 (–6.7) billion and other financing activities net amounted to SEK 1.0 billion. Cash conversion Cash conversion was 40% (112%), below the target of 70%. Over the years 2008–2010, cash conversion was above target. The cash conversion in 2011 was negatively impacted by higher working capital. ERICSSON ANNUAL REPORT ON FORM 20-F 2012 Restricted cash Cash balances in certain countries with restrictions on transfers of funds to the Parent Company as cash dividends, loans or advances amounted to SEK 13.9 (10.8) billion. In this context all countries with currency restrictions are included. In most cases the currency is nonconvertible and flow of funds in a foreign currency requires approval by a central bank or similar. Out of the total amount, China, India, Korea, Brazil and Indonesia are the top five countries accounting for SEK 9.6 billion. BUSINESS RESULTS—REGIONS SALES PER REGION AND SEGMENT 2011 AND 2010 | | | | | | | | | | | | | | | | | | | | | | | | | | | | | | | | | | | | Networks | | | Global Services | | | Multimedia | | | | | | | | SEK billion | | 2011 | | | Percent
change | | | 2011 | | | Percent
change | | | 2011 | | | Percent
change | | | Total
2011 | | | Percent
change | | North America | | | 28.9 | | | | –5% | | | | 18.6 | | | | 5% | | | | 1.3 | | | | 7% | | | | 48.8 | | | | –1% | | Latin America | | | 11.5 | | | | 25% | | | | 9.5 | | | | 23% | | | | 1.0 | | | | 5% | | | | 22.0 | | | | 23% | | Northern Europe and Central Asia | | | 9.7 | | | | 34% | | | | 5.0 | | | | 17% | | | | 0.5 | | | | –20% | | | | 15.2 | | | | 25% | | Western and Central Europe | | | 7.8 | | | | –7% | | | | 10.3 | | | | –2% | | | | 1.0 | | | | –7% | | | | 19.0 | | | | –4% | | Mediterranean | | | 10.7 | | | | 1% | | | | 11.8 | | | | 11% | | | | 1.3 | | | | –5% | | | | 23.8 | | | | 5% | | Middle East | | | 7.4 | | | | 4% | | | | 6.8 | | | | 4% | | | | 1.2 | | | | –13% | | | | 15.5 | | | | 2% | | Sub-Saharan Africa | | | 5.9 | | | | 63% | | | | 3.4 | | | | –26% | | | | 0.9 | | | | –12% | | | | 10.2 | | | | 11% | | India | | | 6.1 | | | | 19% | | | | 3.1 | | | | 13% | | | | 0.5 | | | | –25% | | | | 9.8 | | | | 13% | | China and North East Asia | | | 27.8 | | | | 63% | | | | 9.9 | | | | 19% | | | | 0.5 | | | | –5% | | | | 38.2 | | | | 47% | | South East Asia and Oceania | | | 7.6 | | | | –3% | | | | 5.6 | | | | –14% | | | | 0.7 | | | | 26% | | | | 13.9 | | | | –7% | | Other* | | | 9.1 | | | | 53% | | | | –0.2 | | | | –132% | | | | 1.7 | | | | 57% | | | | 10.6 | | | | 41% | | | | | | | | | | | | | | | | | | | | | | | | | | | | | | | | | | | Total | | | 132.4 | | | | 17% | | | | 83.9 | | | | 5% | | | | 10.6 | | | | 1% | | | | 226.9 | | | | 12% | | Share of total | | | 58 | % | | | | | | | 37 | % | | | | | | | 5 | % | | | | | | | 100 | % | | | | | | | | | | | | | | | | | | | | | | | | | | | | | | | | | | | | | |
| * | Other includes sales of e.g. mobile broadband modules, cables, power modules as well as licensing and IPR. Mobile broadband modules are sold directly by business unit Networks to PC/netbook manufacturers. A central IPR unit manages sales of licenses to equipment vendors or others who wish to use Ericsson’s patented technology. TV solutions are sold both through other equipment vendors as resellers and directly by business unit Multimedia to cable TV operators. |
Regional development The regions are the Company’s primary sales channels. Ericsson reports ten regions, mirroring the internal geographical organization. North America North America is the world’s most developed region in terms of smartphone penetration and mobile data usage. Operators are continuing the implementation of tiered pricing to capitalize on changing user behavior. Half of the net additions of subscriptions in the second half of 2011 came from connected devices or machine to machine communication. Through the year multiple LTE network buildouts have been initiated and launched in both the US and Canada, and Ericsson is a leading supplier to these projects. The networks business developed slower in the second half of 2011 after a period of high operator investments in network capacity. Operators’ focus on cash flow management and operator consolidation also had a negative impact. This was to a large degree offset by a positive uptake in services and multimedia. ERICSSON ANNUAL REPORT ON FORM 20-F 2012 Latin America There is a push for mobile broadband in Latin America, driven by consumer demand for 3G services. Smartphone penetration is still low, but is expected to grow as these handsets become more affordable. Operators show an increasing interest in network performance and Ericsson is taking part in OSS/BSS transformation projects in managed services deals, including network sharing arrangements. Northern Europe and Central Asia The Nordics are mature and advanced markets with strong 3G coverage and LTE commercially available in all countries. Nordic operators are increasingly shifting their business models towards network sharing and the outsourcing of network operations. Deployment of 3G networks started later in the eastern part of the region. Here, operators are focusing on providing coverage and quality in the networks. Mobile broadband is growing rapidly in the region. Many consolidation activities, of both operators and networks, are taking place. In the latter half of the year, network sales slowed, especially in Russia, following strong operator investments in network capacity and coverage. Western and Central Europe Modernization of networks accelerated across the region in 2011. Operator focus is on replacing old 2G/3G equipment with modern, more efficient multi-standard radio base stations. Interest in LTE is limited, with certain countries still to allocate spectrum for this. Penetration of mobile broadband is high, with some operators’ smartphone shipments representing more than half of their totals. Data revenues are growing and represent over 40% with some operators. There is also high interest in managed services and network sharing. Mediterranean This region has seen an impact from weak economies as well as political unrest in Northern Africa. The uptake of mobile broadband is mixed, with the strongest growth in the south west parts of the region. Here, operators are implementing a range of tiered pricing models. Mobile data usage is high in the Mediterranean area, due to the low availability of fixed broadband. Most operators’ investments are for 3G coverage and in the second half of the year, network modernization projects took off. Middle East The Middle East was impacted by political unrest in several countries and by delays in license auctions. As a consequence, some operators have postponed their infrastructure investments and increased their focus on efficiencies. The region has lower penetration rates, mobile broadband adoption and mobile data usage than the world average. The crucial driver for increasing these parameters is the affordability of smartphones. Rollouts of LTE have started in some parts of the region. ERICSSON ANNUAL REPORT ON FORM 20-F 2012 Sub-Saharan Africa Mobile penetration continues to increase rapidly in Africa. Operator focus is still on 2G coverage and capacity buildouts, although some operators are building 3G coverage. With smartphones in the region set to become cheaper, operators are focusing on creating efficiency in their networks to allow them to capitalize on future uptake. Inflation and competition are also driving operators’ need for increased efficiency. This leads them to focus on power consumption reductions and managed services solutions. There is also a need for operators to harmonize policy frameworks to increase data take-up. India Initial 3G rollouts reached a temporary peak in 2011. The Indian market is fragmented and in the near future a telecom policy reform is expected which might make operator consolidation easier. Besides the need for affordable smartphones, availability of dual SIM card phones is a key component in driving mobile data uptake. The Indian market is highly competitive, which drives operator interest in managed services and network sharing. China and North East Asia China’s operators have focused on building 2G capacity with GPRS/EDGE to meet the increase in mobile data traffic from smartphones. In 2011, large scale trials for TD-LTE took place with China Mobile. In Korea and Japan, 3G capacity and LTE coverage rollouts are ongoing, driven by high smartphone penetration, mobile broadband adoption and mobile data usage. In Korea, three LTE networks are live, and Ericsson is a supplier to all of them. South East Asia and Oceania Parts of this region, such as Australia and Singapore, have high penetration rates, adoption and usage. In these areas, LTE is also starting to emerge. Indonesia is moving towards 3G, however take-up is hampered by the affordability of devices. 3G auctions are yet to take place in some markets. Coverage projects, where old equipment is replaced with new, are underway across most markets, as operators build for data growth and seek operating cost efficiencies. The decline in network sales is due to reduced 2G business in Vietnam. The services business declined due to a concluded managed services contract in Australia. BUSINESS RESULTS—SEGMENTS Networks HIGHLIGHTS IN 2011 Increased market share in mobile network equipment by 6 percentage points to 38% (estimated) Market share of more than 60% in LTE Smart Services Router family introduced. Volume deliveries expected in 2012 ERICSSON ANNUAL REPORT ON FORM 20-F 2012 Sales Networks sales increased 17% to SEK 132.4 billion, negatively impacted by a strong SEK in 2011. The increase was an effect of continued high sales in mobile broadband-related equipment including packet core, IP routers and microwave-based backhaul. Demand was especially strong in regions China and North East Asia and North America. The year was characterized by high volumes of mobile broadband equipment and ramp-up of the multi-standard radio base station RBS 6000. The product introduction of the RBS 6000 has been the quickest and most successful in the Company’s history. At the end of the year, the first RBS 6000 with CDMA functionality was shipped. The RBS 6000 accounts for close to 100% of all deliveries of GSM/WCDMA/LTE radio base stations. In the fourth quarter, shipping of the IP Edge router, the Smart Services Router SSR 8000 family, and the Antenna Integrated Radio unit (AIR) also commenced. In 2010, Ericsson acquired Nortel’s CDMA business in order to strengthen its position in North America. Ericsson is now established as the leader in this market. CDMA sales increased slightly in 2011. At the end of the year the Company saw the expected decline in CDMA sales and subsequent rapid shift to LTE. The CDMA acquisition has created substantial value for the Company. In March, the earthquake and tsunami in Japan caused temporary delays in the supply chain, but by the third quarter lead times were back to normal. Profitability Operating margin decreased to 13% (15%). The margin was negatively impacted by planned R&D investments to accelerate technology leadership. Operating margin in 2010 was 11% including restructuring charges. Cost structure In the Networks segment, cost of sales is quite large and to a large part variable. To reduce variable cost, the Company works with product rationalization and product substitution. R&D is a significant cost item and for this reason it is important to focus on R&D effectiveness and efficiency. It is essential to ensure global platforms and common components across the whole portfolio. To maximize the outcome of R&D investment, the Company also seeks to give R&D sites clear accountability and the same IS/IT environment. The networks business Sales to network operators are normally based on multi-year frame agreements after an initial open tender. During the frame agreement, software, equipment, services and spare parts are called off according to price lists. Prior to the introduction of the multi-standard radio base station RBS 6000, operators could have co-siting, with one supplier for GSM and another for WCDMA. Today, a multi-standard approach means that all technologies are supported by one radio base station. Any supplier has to be equally capable of all technologies. R&D investments and scale are therefore essential for a supplier to stay competitive. The footprint of multi-standard radio access network increases opportunities for additional network business, e.g. backhaul and core networks. Following radio and core footprint is a significant software sales opportunity based on capacity, functionality and new features. ERICSSON ANNUAL REPORT ON FORM 20-F 2012 Competitors In the networks segment, Ericsson competes mainly with telecommunication equipment suppliers such as Alcatel-Lucent, Cisco, Huawei, Juniper, Nokia Siemens Networks, Samsung and ZTE. The Company also competes with local and regional manufacturers and providers of telecommunications equipment. Global Services HIGHLIGHTS IN 2011 More than 2 billion subscribers in networks for which Ericsson provides support Over 900 million subscriber in networks managed by Ericsson 500 million subscribers in network operation contracts Sales Global Services sales increased 5% to SEK 83.9 (80.1) billion, driven by network rollout, consulting and systems integration. Professional Services sales were SEK 58.8 billion, up 1% from 2010. Currency adjusted sales of Professional Services increased 7%. The increase is mainly a result of increased sales of consulting and systems integration. Managed Services sales decreased by –1% to SEK 21.0 billion. Currency adjusted sales increased 7%. The growth reflects the 70 (54) signed managed services contracts, of which 32 (26) were extensions or expansions. More than 60% of Professional Services sales were recurring. Network Rollout sales amounted to SEK 25.1 (21.6) billion, an increase of 16%, driven by high volumes of network modernization. Profitability Global Services’ operating margin decreased to 7% (11%). The margin was negatively impacted by a loss in Network Rollout. Operating margin in 2010 was 8% including restructuring charges. Operating margin for Professional Services amounted to 13% (15%). Operating margin in 2010 was 11% including restructuring charges. Operating margin for Network Rollout amounted to –8% (1%), due to high activity levels related to network modernization projects in Europe and 3G rollouts in India. Operating margin in 2010 was 0% including restructuring charges. Cost structure In the services segment, almost all cost resides in cost of sales and the majority of the cost is related to employee costs. A few years ago, the cost of sales base was to a higher degree variable. With the increasing share of managed services, the portion of fixed costs has increased, which makes it important to find scale by winning more deals in the same geographical area. Another measure to keep cost down is to establish a one-to-many delivery model. The development of global tools, methods and processes are also crucial in order to secure efficiencies and knowledge sharing. ERICSSON ANNUAL REPORT ON FORM 20-F 2012 In managed services, Ericsson often insources employees from the customer. In the transition period, restructuring costs are taken, e.g. for replacement of IS/IT systems and migration of employees into new systems and premises. In the transformation phase, following the transition, synergies are carried through. The services business Ericsson’s offering covers all areas within an operator’s operational scope. The Company’s service offering includes consulting, systems integration, managed services, network deployment and integration, education and support services. Ericsson provides services for both mobile and fixed telecom networks as well as for IT and broadcast networks and in some cases for adjacent industries such as the utilities industry. Most often operators turn to Ericsson for support in a certain part of their operations. Contracts for managed services and customer support are typically for five to seven years. Payments with regularity provide a lower rate of working capital. Consulting and systems integration contracts are shorter and paid after fulfillment of contract. In managed services deals the contracts are normally split into fixed and variables, where the variables are a smaller part. The invoicing is based on fulfillment of certain key performance indicators and projects. When an operator explores the possibility of a managed services deal, the financial strength of the supplier is a prerequisite. Network rollout includes coverage and modernization projects with a large part of third-party sourcing, making it a lower-margin business. The Company rolls out its own equipment, but also has high multi-vendor skills in all other parts of the services business. Competitors Competition in services includes the traditional telecommunication equipment suppliers. The Company also competes with companies such as Accenture, HP, IBM, Oracle, Tata Consultancy Services and Tech Mahindra. Among the competition is also a large number of smaller but specialized companies operating on a local or regional basis. Multimedia (CHANGED NAME TO SUPPORT SOLUTIONS IN 2012) HIGHLIGHTS IN 2011 13 new contracts signed for mobile broadband charging World’s largest IPTV upgrade in Taiwan 11 new customers for convergent charging and billing Sales Multimedia sales increased 1% to SEK 10.6 (10.5) billion, negatively impacted by political unrest in the Middle East and weak development in India. Profitability Operating margin was –5% (–4%). Restructuring charges had no material impact on profitability. ERICSSON ANNUAL REPORT ON FORM 20-F 2012 Cost structure In the multimedia segment, cost of sales is low and the majority is variable, due to the fact that third party hardware is used, on which the Company implements its software. Multimedia is a software business with a high degree of fixed R&D cost for software development. The OSS and BSS business The OSS/BSS business is divided into two different sales types: Transformation sales Simplification and consolidation of processes, operations, systems and platforms. Key components are software solutions, consulting and systems integration. Typically these projects last for 18–36 months. The software part represents 25–40% of the contract value and the rest is consulting and systems integration. Product sales Product sales is mainly expansions and upgrades, e.g. upgrading from Ericsson Charging System version 4 to 5. Key components are software solutions and systems integration. Typically these projects last for 1–12 months. The software part represents 70–90% of the contract value and the rest is systems integration. Telcordia acquisition In 2011, Ericsson announced the acquisition of Telcordia, a global leader in the development of software and services for OSS/BSS. The price was USD 1.15 billion in an all cash transaction, on a cash and debt-free basis. The acquisition is expected to be accretive to Ericsson’s earnings per share within twelve months. Telcordia has approximately 2,600 employees. During its last fiscal year, ended January 31, 2011, Telcordia generated revenues of USD 739 million. Telcordia’s revenues will be split between segments Multimedia and Global Services according to portfolio mix. With the acquisition, Ericsson aspires to a leading position in the OSS and BSS market. Competitors In the multimedia segment, Ericsson competes in rather fragmented markets with many local players. Competitors vary depending on the solution being offered. In the OSS and BSS market, they include many of the traditional telecommunication equipment suppliers as well as IT suppliers, such as Amdocs, Comverse and Oracle. Competition in the TV business includes Harmonic and Thompson. Sony Ericsson Sony Ericsson is a 50/50 joint venture between Sony Corporation and Ericsson, established in 2001. Sony Ericsson is accounted for according to the equity method. In October 2011, it was announced that Sony Corporation would acquire Ericsson’s 50% share in Sony Ericsson. As part of the deal, Sony and Ericsson will also enter into a broad IP cross-licensing agreement and create a wireless connectivity initiative to drive connectivity across multiple platforms. The transaction is a logical strategic step that makes it possible for Ericsson to focus on enabling connectivity for all devices. Sony Ericsson will become a wholly-owned subsidiary of Sony and integrated into Sony’s broad platform of network-connected consumer electronics products. The agreed cash consideration for the transaction is a EUR 1.05 billion cash payment. ERICSSON ANNUAL REPORT ON FORM 20-F 2012 Sony Ericsson’s units shipped in 2011 decreased by –20% to 34.4 (43.1) million while the average selling price increased by 4% to EUR 152 (146). Sales decreased by –17% to EUR 5.2 (6.3) billion. In 2011, Sony Ericsson had a market share of 10% in the smartphone market, measured in units, and 10% measured in value. Gross margin decreased during the year to 28% (29%) attributed to product and geographic mix. Income before taxes, including restructuring charges, was EUR –0.24 (0.15) billion. Income decreased during the year due to declining gross margin and increased operating expenses. The result includes restructuring charges of EUR 93 million. Ericsson’s share in Sony Ericsson’s income before taxes was SEK –1.2 (0.7) billion. Sony Ericsson’s primary competitors include Apple, HTC, LG, Motorola, Nokia, RIM and Samsung. ST-Ericsson ST-Ericsson is a 50/50 joint venture between STMicroelectronics and Ericsson, established in February, 2009. ST-Ericsson is accounted for according to the equity method. At the end of 2011, ST-Ericsson was still in a shift from legacy to new products. Though its path to success is challenging, ST-Ericsson is, when entering 2012, continuing to focus on securing the successful execution and delivery of its new products to customers while lowering its break-even point. The changes in the business environment at a large customer during 2011 reduced demand for legacy products and delayed the ramp-up of new products with that customer. In the light of the business environment at the end of 2011, ST-Ericsson’s CEO is reviewing the company’s strategic plan and financial prospects. Ericsson, together with its partner STMicroelectronics, is firmly committed to supporting ST-Ericsson in the transition to turn-over to sustainable profitability and cash generation. As a result of the strategic review, Ericsson may consider additional actions to solidify and accelerate ST-Ericsson’s path to profitability. In such an event, or in case of a significant worsening of business prospects, the value of ST-Ericsson for Ericsson could decrease to a value significantly lower than the current carrying amount of ST-Ericsson on Ericsson’s books and Ericsson might be required to take an impairment charge. Sales in 2011 declined –28% to USD 1.7 (2.3) billion. The operating loss for the year, adjusted for restructuring costs, was USD –0.7 (–0.4) billion. ST-Ericsson reports in US-GAAP. Ericsson’s share in ST-Ericsson’s income before taxes, adjusted to IFRS, was SEK –2.7 (–1.8) billion. Adjustments for IFRS compliance mainly consist of capitalization of R&D expenses for hardware development. The Company’s net financial position was USD –798 (–82) million at year-end. At the end of the year, ST-Ericsson had utilized USD 800 million of a short-term credit facility granted on a 50/50 basis by the parent companies. In December 2011, a new President and CEO of ST-Ericsson was appointed. ST-Ericsson’s major competitor is Qualcomm. The market is growing in complexity as several new operating systems for handsets and other devices have been launched, e.g. Google’s Android, Microsoft’s Windows phone and Samsung’s Bada. MEMORANDUM AND ARTICLES OF ASSOCIATION Telefonaktiebolaget LM Ericsson is entered under no. 556016–0680 in the Company Register kept by the Swedish Companies Registration Office. Our Company’s objective and purposes are described in §2 of the Articles of Association. ERICSSON ANNUAL REPORT ON FORM 20-F 2012 Our Articles of Association do not stipulate anything regarding: a director’s power to vote on a proposal, arrangement, or contract in which the director is materially interested our directors’ power to vote for compensation to themselves our directors’ borrowing powers retirements rules for our directors or the number of shares required for a director’s qualification. Applicable provisions are found in the Swedish Companies Act, as referred to in “Certain Powers of Directors and the President” below. There are no age limit restrictions for directors and they are not required to own any shares in the Company. Share Capital, Increases of Share Capital and Preferential Rights of Shareholders The Articles of Association of Ericsson provide that the share capital of the Company may not be less than SEK 6,000,000,000 nor more than SEK 24,000,000,000, and that the number of shares in the Company shall amount to no less than 3,000,000,000 and no more than 12,000,000,000. The registered share capital is SEK 16,525,258,678 and the Company has in total issued 3,305,051,735 shares. The Company’s shares are divided into three series: Class A shares, Class B shares and Class C shares; however, no Class C shares are currently outstanding. Under the Swedish Companies Act of 2005, applicable as of January 1, 2006 (the “Swedish Companies Act”), shareholders must approve each issue of additional shares either by deciding on the share issue at a shareholders’ meeting, or by a shareholders’ approval of a decision on a share issue by the Board, or by giving an authorization to the Board to decide about a share issue. If we decide to issue new Class A, Class B and Class C shares by means of a cash issue, or an issue against payment through set-off of claims, Class A, Class B and Class C shareholders (except for Ericsson and its subsidiaries, in the event they hold shares in Ericsson) have a primary preferential right to subscribe for new shares of the same type in relation to the number of shares previously held by them. Shares not subscribed for through a preferential right shall be offered to all shareholders for subscription on a pro rata basis. If we decide to issue new shares of only one series by means of a cash issue or an issue against payment through set-off of claims, all shareholders, regardless of whether their shares are Class A, Class B or Class C, are entitled to a preferential right to subscribe for new shares in proportion to the number of shares previously held by them. Shareholders may vote to waive shareholders’ preferential rights at a general meeting. If we decide to issue warrants or convertibles through a cash issue or an issue against payment through set-off of claims, the shareholders have preferential rights to subscribe to warrants as if the issue were of the shares that may be subscribed to pursuant to the warrant and, respectively, preferential rights to subscribe to convertibles as if the issue were of the shares that the convertibles may be converted to. The above does not constitute any restriction to waive the shareholders’ preferential rights when deciding on either a cash issue, an issue against payment through set-off of claims, an issue of warrants or an issue of convertibles. Dividends Our Class A and Class B shareholders have the same right to dividends, while Class C shareholders have a right to a yearly dividend as described in article 15 of our Articles of Association. No Class C shares are currently outstanding. Under Swedish law, only a general meeting of shareholders may decide on payment of dividends, which may not exceed the amount proposed by the Board of Directors (except in certain limited circumstances), and ERICSSON ANNUAL REPORT ON FORM 20-F 2012 may only be paid from funds legally available for that purpose. Under Swedish law, no interim dividends may be paid in respect of any fiscal period for which audited financial statements of the company have not yet been adopted by the annual general meeting of shareholders. The market practice in Sweden is for dividends to be paid annually. Under the Swedish Companies Act, dividends to shareholders and other transfers of value from a company—such as purchases of own shares (see below)—may only be made in case the company’s restricted equity remains fully covered after the transfer of value has been made. The calculation shall be based upon the most recently adopted balance sheet, and any changes in the restricted equity that has occurred after the balance sheet date shall be taken into account. In addition, dividends to shareholders and other transfers of value from the company may only be made if this is justifiable taken into account the type of business activities of the company, their scope and risks related thereto and the company’s need for financial resources, its liquidity and financial position. In respect of parent companies, also the business activities of the group, their scope and risks related thereto and the group’s need for financial resources, its liquidity and financial position should be taken into account. The Company’s shares are registered in the computerized book-entry share registration system administered by Euroclear Sweden AB (“Euroclear”). The rights attached to shares eligible for dividends accrue to those persons whose names are recorded in the register of shareholders on the record day. The dividends are then sent to a specified account as directed by the person registered with Euroclear, or to the address of that person. The relevant record day must, in most circumstances, be specified in the resolution declaring a dividend or resolving upon a capital increase or any similar matter in which shareholders have preferential rights, or the Board of Directors must be authorized to determine the relevant record day. Where the registered holder is a nominee, the nominee receives, for the account of the beneficial owner, dividends and, on issues of shares with preferential rights for the shareholders, shares, as well as rights. Dividends are remitted in a single payment to the nominee who is responsible for the distribution of such dividends to the beneficial owner. A similar procedure is adopted for share issues. Specific authority to act as a nominee must be obtained from Euroclear. The nominee must issue a public report to Euroclear every third month, listing all beneficial holders of more than 500 shares. Euroclear is required to keep a register with regard to any holding on behalf of a single beneficial owner in excess of 500 shares in any one company. This list must reveal the names of the beneficial owner and must be open to public inspection. Voting In a general meeting of Ericsson, each Class A share shall carry one vote, each Class B share one tenth of one vote and each Class C share one-thousandth of one vote. We are required to publish notices to attend annual general meetings no earlier than six weeks and no later than four weeks prior to the general meeting and the same notice period requirements apply regarding extraordinary general meetings concerning changes in our articles of association. Notices to attend other types of extraordinary general meetings at Ericsson must be published no earlier than six weeks and no later than three weeks prior to the general meeting. Directors are elected during the annual general meeting for a period of one year at a time and do not stand for reelection at staggered intervals. A shareholder may attend and vote at the meeting in person or by proxy. For companies whose shares are registered in a central securities depositary register, proxies are valid for up to five years from the date of issuance. Any shareholder wishing to attend a general meeting must notify us no later than on the day specified in the notice, preferably before 4:00 p.m. (CET). We are required to accept all notifications of attendance received at least five business days (Saturdays normally included) prior to the meeting. A person designated in ERICSSON ANNUAL REPORT ON FORM 20-F 2012 the register as a nominee (including the depositary of the ADSs) is not entitled to vote at a general meeting, nor is a beneficial owner whose share is registered in the name of a nominee (including the depositary of the ADSs) unless the beneficial owner first arranges to have such owner’s own name entered in the register of shareholders maintained by Euroclear no later than the designated record day. Under the Swedish Companies Act, resolutions are passed by a simple majority of votes cast at the meeting with the chairman of the meeting having a decisive vote (except in respect of elections), unless otherwise required by law or a company’s articles of association. Under the Swedish Companies Act, certain resolutions require special quorums and majorities, including, but not limited to, the following: | A | a resolution to amend the articles of association requires a majority of two-thirds of the votes cast as well as two-thirds of the shares represented at the meeting, except in those circumstances described in B—D below; |
| B | a resolution to amend the articles of association which reduces any shareholder’s rights to profits or assets, restricts the transferability of shares or alters the legal relationship between shares, normally requires the unanimous approval of the shareholders present at the meeting and who hold nine-tenths of all outstanding shares; |
| C | a resolution to amend the articles of association for the purpose of limiting the number of shares with which a shareholder may vote at a general meeting or allocating part of the net profit for the fiscal year to a restricted fund or limiting the use of the company’s profits or assets in a liquidation or dissolution, normally requires the approval of shareholders representing two-thirds of the votes cast and nine-tenths of the shares represented at the meeting; |
| D | a resolution of the kind referred to under B or C above may, however, be taken with a lower supermajority requirement if the amendments referred to therein will only adversely affect specific shares or classes of shares. In such cases, the requirement under a above will apply together with the following separate supermajority: (a) where only a class of shares is adversely affected, approval of the owners of one-half of all shares of such class and nine-tenths of the shares of such class represented at the meeting, or (b) where the shares adversely affected do not constitute a class of shares, the unanimous approval of all such affected outstanding shares present at the meeting and who hold nine-tenths of all outstanding shares adversely affected; |
| E | a resolution to issue, approve or authorize the issuance for cash of new shares, warrants or convertibles with a deviation from the preferential right for existing shareholders requires a two-thirds majority of votes cast at the meeting as well as two-thirds of the shares represented at the meeting; |
| F | a resolution to reduce the outstanding share capital requires a two-thirds majority of votes cast at the meeting as well as two-thirds of the shares represented at the meeting. In case there are several classes of shares in a company, the above described majority requirement shall apply also within each share class represented at the meeting and for which the rights of the shares are adversely affected; and |
| G | a resolution to approve a merger requires a two-thirds majority of the votes cast at the meeting and two-thirds of the shares represented at the meeting (however, under certain circumstances a higher majority is required). |
At a general meeting of shareholders, a shareholder or proxy for one or more shareholders may cast full number of votes represented by the holder’s shares. Purchase of Own Shares A Swedish public limited liability company whose shares are traded on a regulated market place within the European Economic Area (“EEA”) or a market place comparable to a regulated market place outside the EEA is entitled to purchase its own shares under certain conditions. A purchase by us of our own shares may take place ERICSSON ANNUAL REPORT ON FORM 20-F 2012 only if (a) the purchase has been decided upon by a general meeting of shareholders or the Board has been authorized by a general meeting of shareholders, in both cases by a two thirds majority of votes cast at the meeting as well as two-thirds of the shares represented at the meeting, (b) the purchase is effected on a regulated market place within the EEA or a market place comparable to a regulated market place outside the EEA (in the latter case with the approval of the Swedish Financial Supervisory Authority the “SFSA”) or pursuant to an offer to all shareholders or holders of a specific class of shares, (c) the Company’s restricted equity will still be fully covered and the purchase is justifiable taken into account the type of business activities of the Company and the group, their scope and risks related thereto and the Company’s and the group’s need for financial resources, its liquidity and financial position, and (d) we and our subsidiaries do not hold or, as a result of purchase, will not hold in excess of 10% of all our outstanding shares. As of December 31, 2012, the Company held an aggregate of 84,798,095 treasury stock of Class B shares. Investment Restrictions There are no limitations imposed by Swedish law or by our Articles of Association in respect of the rights of non-residents or foreign persons to purchase, own or sell securities issued by us. There are, however, certain flagging and ownership examination rules that apply, irrespective of nationality. Pursuant to the Swedish Financial Instruments Trading Act any change in a holding of shares, depository receipts with voting rights or financial instruments that entitle the holder to acquire shares in issue in a Swedish limited liability company whose shares are admitted for trading on a regulated market place within the EEA shall be reported by the holder to the company and the SFSA, where the change entails that the holder’s portion of all shares or votes in the company reaches, exceeds or falls below any of the limits of 5, 10, 15, 20, 25, 30, 50, 66 2/3 or 90 per cent. Such a change should, as a main rule, be reported not later than the trading day following the day on which the party with a duty to report has entered into an agreement for the acquisition or transfer of shares or any other change to the shareholding has occurred. In addition, the Act on Reporting Obligations Regarding Certain Holdings of Financial Instruments requires, among other things, certain individuals who own shares representing 10% or more of the share capital or the voting rights in a Swedish public limited liability company whose shares are traded on a regulated market within the EEA to report such ownership to the SFSA, which keeps a public register based on the information contained in such reports, and also to report any changes in such ownership within five business days. EXCHANGE CONTROLS There is no Swedish legislation affecting a) the import or export of capital or b) the remittance of dividends, interest or other payments to non-resident holders of our securities except that, subject to the provisions in any tax treaty, dividends are subject to withholding tax. TAXATION General The taxation discussion set forth below does not purport to be a complete analysis or listing of all potential tax effects relevant to the acquisition, ownership or disposition of Class B shares or ADSs. The statements of United States and Swedish tax laws set forth below are based on the laws in force as of the date of this report and may be subject to any changes in United States or Swedish law, and in any double taxation convention or treaty between the United States and Sweden, occurring after that date, which changes may then have retroactive effect. ERICSSON ANNUAL REPORT ON FORM 20-F 2012 Specific tax provisions may apply for certain categories of tax payers. Your tax treatment if you are a holder of Class B shares or ADSs depends in part on your particular situation. If you are a holder of Class B shares or ADSs, you should therefore consult a tax advisor as to the tax consequences relating to your particular circumstances resulting from the ownership of Class B shares or ADSs. The tax consequences to holders of ADSs, as discussed below, apply equally to holders of Class B shares. Certain Swedish Tax Considerations This section describes the material Swedish income and net wealth tax consequences for a holder of ADSs or Class B shares who is not considered to be a Swedish resident for Swedish tax purposes. This section applies to you only if you are a holder of portfolio investments representing less than 10% of capital and votes and is not applicable if the ADSs or Class B shares pertain to a permanent establishment or fixed place of business in Sweden. TAXATION ON CAPITAL GAINS Generally, non-residents of Sweden are not liable for Swedish capital gains taxation with respect to the sale of ADSs or Class B shares. However, under Swedish tax law, capital gains from the sale of shares in Swedish companies and certain other securities by an individual may be taxed in Sweden at a rate of 30% if the seller has been a resident of Sweden or has lived permanently in Sweden at any time during the year of the sale or the 10 calendar years preceding the year of the sale (absent treaty provisions to the contrary). The provision is applicable on ADSs or Class B shares. From 1 January 2008 the rule has been extended so that it also applies to shares in foreign companies, provided that the shares were acquired during the time that the person was liable to tax in Sweden. This provision may, however, be limited by tax treaties that Sweden has concluded with other countries. Under the tax treaty between Sweden and the United States (the “U.S. Tax Treaty”), this provision applies for ten years from the date the individual became a non-resident of Sweden. TAXATION ON DIVIDENDS A Swedish dividend withholding tax at a rate of 30% is imposed on dividends paid by a Swedish corporation, such as us, to non-residents of Sweden. The same withholding tax applies to certain other payments made by a Swedish corporation, including payments as a result of redemption of shares and repurchase of stock through an offer directed to its shareholders. Exemption from the withholding tax or a lower tax rate may apply by virtue of a tax treaty. Under the U.S. Tax Treaty, the withholding tax on dividends paid on portfolio investments to eligible U.S. holders is reduced to 15%. Under all Swedish tax treaties, except the tax treaty with Switzerland, withholding tax at the applicable treaty rate should be withheld by the payer of the dividends. With regard to dividends paid from shares in corporations registered with the Euroclear Sweden (such as our shares), a reduced rate of dividend withholding tax under a tax treaty is generally applied at the source by the Euroclear Sweden or, if the shares are registered with a nominee, the nominee, as long as the person entitled to the dividend is registered as a non-resident and sufficient information regarding the tax residency of the beneficial owner is available to the Euroclear Sweden or the nominee. In those cases where Swedish withholding tax is withheld at the rate of 30% and the person who received the dividends is entitled to a reduced rate of withholding tax under a tax treaty, a refund may be claimed from the Swedish tax authorities before the end of the fifth calendar year following the year that the distribution was made. ERICSSON ANNUAL REPORT ON FORM 20-F 2012 TAXATION ON INTEREST No Swedish withholding tax is payable on interest paid to non-residents of Sweden. NET WEALTH TAXATION The Swedish net wealth tax has been abolished from 1 January 2007. Certain United States Federal Income Tax Consequences The following discussion is a summary of the material United States federal income tax consequences relevant to the ownership and disposition of ADSs or Class B shares. This discussion is based on the tax laws of the United States (including the Internal Revenue Code of 1986, as amended (the “Code”), its legislative history, existing and proposed regulations thereunder, published rulings and court decisions) as in effect on the date hereof, all of which are subject to change, possibly with retroactive effect. The discussion is not a full discussion of all tax considerations that may be relevant to the ownership and disposition of ADSs or Class B shares. The discussion applies only if you will hold the ADSs and/or the Class B shares as capital assets and you use the USD as your functional currency. It does not deal with the tax treatment of investors subject to special rules, such as grantor trusts, real estate investment trusts, regulated investment companies, banks, brokers or dealers in securities or currencies, traders in securities that elect to use a mark-to-market method of recording for their securities holdings, financial institutions, insurance companies, tax-exempt entities, investors liable for alternative minimum tax, holders (either actually or constructively) of 10% or more of our Class B shares, persons holding ADSs and/or Class B shares as part of a hedging, straddle, conversion or constructive sale transaction and persons who are resident or ordinarily resident in Sweden. In addition, investors holding ADSs and/or Class B shares indirectly through partnerships are subject to special rules not discussed below. You should consult your own tax advisors about the United States federal, state, local and foreign tax consequences to you of the ownership and disposition of the ADSs or Class B shares. The discussion below applies to you only if you are a beneficial owner of ADSs and/or Class B shares not resident in Sweden for purposes of the U.S. Tax Treaty and you are, for United States federal income tax purposes, (1) a citizen or resident of the United States, (2) a corporation or any other entity treated as a corporation that is organized in or under the laws of the United States or its political subdivisions, including the District of Columbia, (3) a trust if all of the trust’s substantial decisions are subject to the control of one or more United States persons and the primary supervision of the trust is subject to a United States court, or if a valid election is in effect with respect to the trust to be taxed as a United States person, or (4) an estate the income of which is subject to United States federal income taxation regardless of its source. The discussion below assumes that the representations contained in the deposit agreement are true and that the obligations in the deposit agreement and any related agreement will be complied with in accordance with the terms. If you hold ADSs, you will be treated as the holder of the underlying Class B shares represented by those ADSs for United States federal income tax purposes. TAXATION OF ADSS OR CLASS B SHARES Dividends Subject to the passive foreign investment company rules discussed below, the gross amount of dividends paid (before reduction for any Swedish withholding taxes) with respect to the ADSs or Class B shares generally will be included in your gross income as ordinary income from foreign sources to the extent paid out of our current or accumulated earnings and profits (as determined for United States federal income tax purposes). Distributions in excess of earnings and profits will be treated as a non-taxable return of capital to the extent of ERICSSON ANNUAL REPORT ON FORM 20-F 2012 your adjusted tax basis in the ADSs or Class B shares and thereafter as capital gain. The dividends will not be eligible for the dividends received deduction available to corporations in respect of dividends received from other U.S. corporations. The amount of any dividend paid in SEK will be the USD value of the dividend payment based on the exchange rate in effect on the date of receipt (or constructive receipt) by you, in the case of Class B shares or by the depositary, in the case of ADSs, whether or not the payment is converted into USD at that time. Your tax basis in the SEK received will equal such USD amount. Gain or loss, if any, recognized on a subsequent sale or conversion of the SEK will be U.S. source ordinary income or loss. If you are a non-corporate holder of ADSs or Class B shares, dividends you receive on the ADSs or Class B shares may be taxed at the lower applicable capital gains rate provided that (1) we are not a passive foreign investment company (as discussed below) for either our taxable year in which the dividend was paid or the preceding taxable year, (2) certain holding period requirements are met, (3) you are not under any obligation to make related payments with respect to substantially similar or related property and (4) either (a) in the case of ADSs our ADSs continue to be listed on the Nasdaq Stock Market (or a national securities exchange that is registered under section 6 of the Securities Exchange Act of 1934, as amended) or (b) we are eligible for the benefits of the U.S. Tax Treaty. You should consult your own tax advisors regarding the availability of the lower rate for dividends paid with respect to ADSs or Class B shares. Subject to certain limitations, you will generally be entitled to receive credit against your United States federal income tax liability (or a deduction against your United States federal taxable income) with respect to any Swedish tax withheld in accordance with the U.S. Tax Treaty and paid over to Sweden. If a refund of the tax withheld is available to you under the laws of Sweden or under the U.S. Tax Treaty, the amount of tax withheld that is refundable will not be eligible for such credit against your United States federal income tax liability (and will not be eligible for the deduction in computing your United States federal taxable income). For foreign tax credit limitation purposes, the dividend will be income from sources without the United States, and will generally be treated as “passive category income” (or, in the case of certain holders, “general category income”). SALE OR EXCHANGE OF ADSS OR CLASS B SHARES Subject to the passive foreign investment company rules discussed below, you will generally recognize capital gain or loss on the sale or other disposition of the ADSs or Class B shares equal to the difference between the USD value of the amount realized and your adjusted tax basis (determined in USD) in the ADSs or Class B shares. Such gain or loss will be capital gain or loss and will generally be treated as arising from U.S. sources for foreign tax credit limitation purposes. The amount realized on a disposition of ADSs or Class B shares will generally be the amount of cash you receive for the ADSs or Class B shares (which, in the case of payment in a non-U.S. currency, will equal the USD value of the payment received determined on (a) the date of receipt of payment if you are a cash basis taxpayer and (b) the date of disposition if you are an accrual basis taxpayer). If the ADSs or Class B shares are treated as traded on an “established securities market,” if you are a cash basis taxpayer (or, if you are an accrual basis taxpayer, if you so elect) you will determine the USD value of the amount realized by translating the amount received at the spot rate of exchange on the settlement date of the sale. You will have a tax basis in any foreign currency received equal to the USD amount realized. Any gain or loss you realize on a subsequent conversion of foreign currency will be U.S. source ordinary income or loss. PASSIVE FOREIGN INVESTMENT COMPANY STATUS A non-U.S. corporation is a passive foreign investment company (a “PFIC”) in any taxable year in which, after taking into account the income and assets of certain subsidiaries, either (a) at least 75% of its gross income ERICSSON ANNUAL REPORT ON FORM 20-F 2012 is passive income or (b) at least 50% of the quarterly average value of its assets is attributable to assets that produce or are held to produce passive income. Based on the market value of our shares, the composition of our assets and income and our operations, we believe we were not a PFIC during the year 2012. However, whether or not we will be considered a PFIC will depend on the nature and source of our income and the value of our assets, as determined from time to time. If we are treated as a PFIC, we will not provide information necessary for the “qualified electing fund” election as the term is defined in the relevant provisions of the Code. You should consult your own tax advisors about the consequences of our potential classification as a PFIC. If we were a PFIC, for any taxable year in which you held ADSs or Class B shares, you would be subject to special rules with respect to: any gain realized on the sale or other disposition of ADSs or Class B shares; and any “excess distribution” made to you (generally, any distributions to you in respect of ADSs or Class B shares during a single taxable year that are, in the aggregate, greater than 125% of the average annual distributions received by you in respect of ADSs or Class B shares during the three preceding taxable years or, if shorter, your holding period for ADSs or Class B shares). Under these rules: the gain or excess distribution would be allocated ratably over your holding period for ADSs or Class B shares; the amount allocated to the taxable year in which the gain or excess distribution was realized and any year before we became a PFIC would be taxable as ordinary income and the amount allocated to each prior year, other than the current year and any taxable year prior to the first taxable year in which we were a PFIC, would be subject to tax at the highest applicable marginal tax rate in effect for each such year; and an interest charge would be imposed. If we are a PFIC for any taxable year, you will also be deemed to own shares in any of our subsidiaries that are also PFICs in such a year. As an alternative to the special rules described above, holders of “marketable stock” in a PFIC may elect mark-to-market treatment with respect to their ADSs or Class B shares. ADSs or Class B shares will not be considered marketable stock unless they are regularly traded on a qualified exchange or other market. If the mark-to-market election is available and you elect mark-to-market treatment you will, in general, include as ordinary income each year an amount equal to the increase in value of your ADSs or Class B shares for that year (measured at the close of your taxable year) and will generally be allowed a deduction for any decrease in the value of your Class B shares for the year, but only to the extent of previously included mark-to-market income. In addition, any gain you recognize upon the sale or other disposition of the ADSs or Class B shares will be treated as ordinary income and any loss will be treated as ordinary loss, but only to the extent of previously included mark-to-market income. However, a mark-to-market election would likely be unavailable with respect to your proportionate share in any of our subsidiaries that are PFICs. If you own ADSs or Class B shares during any year in which we are a PFIC, you will generally be required to make an annual return on IRS Form 8621. INFORMATION REPORTING AND BACKUP WITHHOLDING In general, information reporting requirements may apply to dividends paid in respect of ADSs or Class B shares and the proceeds received on the sale or exchange of the ADSs or Class B shares within the United States or by a broker with certain United States connections. Backup withholding may apply to payments to you of dividends paid in respect of ADSs or Class B shares or the proceeds of a sale or other disposition of ADSs or Class B shares if you fail to provide an accurate taxpayer identification number (certified on IRS Form W–9) or, ERICSSON ANNUAL REPORT ON FORM 20-F 2012 upon request, to certify that you are not subject to backup withholding, or otherwise to comply with the applicable requirements of backup withholding. The amount of any backup withholding from a payment to you will be allowed as a credit against your United States federal income tax liability and a refund of any excess amount withheld under the backup withholding rules may be obtained by filing the appropriate claim for refund with the IRS and furnishing any required information. ADDITIONAL REPORTING REQUIREMENTS Certain holders who are individuals may be required to report information relating to an interest in ADSs or Class B shares, subject to certain exceptions (including an exception for ADSs or Class B shares held in accounts maintained by certain financial institutions). Holders should consult their tax advisors regarding the effects, if any, of these requirements on their ownership and disposition of ADSs or Class B shares. DEPOSITARY FEES AND CHARGES FEES AND CHARGES PAYABLE BY ADS HOLDERS | | | | | | | | | Service | | Rate | | By whom paid | | | | | | 1) | | Receipt of deposits and issuance of receipts | | USD 5 per 100 American Depositary Shares of fraction thereof | | Party to whom receipts are issued | | | | | | 2) | | Delivery of deposited shares against surrender of receipts | | USD 5 per 100 American Depositary Shares or fraction thereof | | Party surrendering receipts | | | | | | 3) | | Payments of dividends distributions or rights offering is respect of shares | | No charge | | Not applicable |
Except as otherwise provided in the Deposit Agreement, any and all other expenses of the Depositary, including without limitation, expenses or charges for printing, stationery, postage, insurances, cables, etc, are to be borne by the Depositary, or by the Company in accordance with agreements entered into from time to time with the Company. Fees payable by the Depositary to the Issuer Citibank, as depositary, has agreed to reimburse Ericsson USD 5 million per year for expenses related to our ADS program (the “Program”), including Program-related legal fees, expenses related to investor relations in the US, US investor presentations, ADS-related financial advertising and public relations, fees and expenses of Citibank as administrator of the ADS Direct Plan, fees in relation to our Form 20-F and SOX compliance. Citibank has further agreed to waive other ADS program related expenses amounting to USD 33,128.79 associated with the administration of the Program. CORPORATE GOVERNANCE REQUIREMENTS The Ericsson Board of Directors is subject to, and applies, a variety of independence requirements. However, it can rely on exemptions from certain U.S. requirements, including those that are different from Swedish Law. ERICSSON ANNUAL REPORT ON FORM 20-F 2012 Independence requirements on the board of directors: A majority of the members of the board of directors must be independent in accordance with the NASDAQ rules. Ericsson relies on an exemption for employee representative directors from NASDAQ’s independence requirements. Independence requirements on the audit committee: All members of the audit committee must be independent in accordance with the SEC and the NASDAQ rules. The SEC rules include a specific exemption from these independence requirements for audit committee members who are non-executive employee representatives. The Company does not consider that reliance on this exemption adversely affects the ability of the Audit Committee to act independently or satisfy other SEC requirements. In addition, foreign private issuers such as Ericsson may follow home-country practice in lieu of certain NASDAQ corporate governance requirements. Below is a list of practices followed by Ericsson that differ from certain corporate governance requirements under the NASDAQ Marketplace Rules: Employee representatives to be elected to the Board of Directors and serve on Committees (including the Audit and the Remuneration Committees) in accordance with Swedish law Shareholders to participate in the election of Directors and the Nomination Committee, in accordance with Swedish law and common market practice, respectively Employee representatives on the Board to attend all Board and Committee meetings (including those of the Audit and the Remuneration Committees) in accordance with Swedish laws concerning attendance and decision making processes No minimum quorum requirements for shareholder meetings, except under certain circumstances. AUDIT COMMITTEE PRE-APPROVAL POLICIES AND PROCEDURES The Audit Committee reviews and approves the scope of audits to be performed (external and internal) and analyzes the results and costs of the audits. The Committee makes recommendations to the Board of Directors regarding the auditor’s performance. It also makes recommendations to the Nomination Committee regarding the external auditor’s fees. In order to ensure the auditor’s independence, the Audit Committee has established pre-approval policies and procedures for non-audit related services to be performed by the external auditor. Pre-approval authority may not be delegated to management. The policies and procedures include a list of prohibited services and services that require pre-approval by the Committee. Such services fall into two broad categories: General pre-approval—certain services regarding taxes, transactions, risk management, business improvement, corporate finance, attestation and accounting and so called general services. These services have received general pre-approval by the Audit Committee, provided that the estimated fee for each project does not exceed SEK 1 million. The external auditor must advise the Audit Committee of services rendered under the general pre-approval policy. Specific pre-approval—all other non-audit related services must receive specific pre-approval. The Audit Committee Chairman has the delegated authority for specific pre-approval in between Committee meetings, provided that the fee in each case does not exceed SEK 2.5 million. The Chairman reports any pre-approval to the Audit Committee at its next meeting. For matters which may not be handled by the Chairman and require specific pre-approval by the Audit Committee, the auditor submits an application to the Parent Company for final approval by the Audit Committee. ERICSSON ANNUAL REPORT ON FORM 20-F 2012 DISCLOSURE PURSUANT TO SECTION 219 OF THE IRAN THREAT REDUCTION AND SYRIA HUMAN RIGHTS ACT OF 2012 (ITRA) Ericsson has conducted business in Iran/Persia since the late nineteenth century, opened an office in Iran in 1973 and later established a local subsidiary in the country. Ericsson strongly believes in enabling communication for all and believes that access to communications can enable the right to health, education and freedom of expression. Ericsson’s business activities in Iran principally involve the sale of telecommunications infrastructure related products and services, including support, installation and maintenance services. Ericsson’s exports from the European Union (the “EU”) to Iran are performed under export licenses from the Swedish Agency for Non-Proliferation and Export Controls. The EU sanctions towards Iran grant an exemption for the supply of certain telecommunications equipment and software based on which these export licenses are granted. While we seek to obtain information regarding the ownership of our customers in Iran, it is sometimes difficult to determine ownership and control with certainty, particularly with respect to the government. During 2012, Ericsson sold telecommunications infrastructure related products and services in Iran to MTNIrancell and to Mobile Communication Company of Iran (“MCCI”), telecommunications companies operating in Iran. During 2012, our gross revenue related to sales to MTNIrancell and MCCI in Iran was approximately SEK 1,149 million. Ericsson does not normally allocate net profit on a country-by-country or activity-by-activity basis, other than as set forth in Ericsson’s consolidated financial statements prepared in accordance with IFRS as issued by the IASB. However, Ericsson has estimated that its net profit from such sales, after internal cost allocation was less than SEK 50 million during 2012. We anticipate that the sales of telecommunications infrastructure related products to MTNIrancell and MCCI in Iran will be phased out during 2013 and that our business activities in Iran after 2013 will consist of the provision of services under existing contracts or with respect to equipment already delivered by Ericsson (which services may include repair and replacements of products) and collection of software license related revenues under existing agreements. Further, Ericsson is party to agreements entered into prior to 2012 with Telecommunications Company of Iran, an affiliate of MCCI, Zaeim Electronic Industries Company and TAKTA (reseller). No sales were made by Ericsson under these contracts during 2012 and we do not anticipate that any sales will be made during 2013. In some instances, we have had to arrange performance bonds or similar financial guarantees to secure our performance of obligations under the commercial agreements we have entered into relating to our business in Iran. In such instances, we usually engage our banks outside Iran, who in turn engage local banks in the country. These local banks include Tejarat Bank, Melli Bank and Saderat Bank. Although some bonds and guarantees involving these banks are still in place, no new performance bonds or similar guarantees with respect to our business activities in Iran were issued during 2012, nor were payments made to beneficiaries under any such existing bond or guarantee. During 2012 Ericsson’s Iranian subsidiary maintained accounts with Bank Mellat and Tejarat Bank. Deposits with those banks generated less than SEK 20 million of interest income during 2012. Those accounts were closed during 2012. Some payments made to our local subsidiary and payments required to be made by our local subsidiary to suppliers involve banks controlled by the government of Iran, such as Bank Mellat, Tejarat Bank, Bank Melli, Saderat Bank, Keshavarzi Bank, Eghtesad Novin Bank, Refah Bank and Bank Sepah. We also received payments from customers to Ericsson’s accounts outside Iran. During 2012, Ericsson purchased telecommunication infrastructure related materials and services from Havafaza Industry Organization (SATAF). Ericsson stopped purchasing from them during 2012. Due to its operations in Iran, and having staff permanently in the country, Ericsson obtains and requires services and has other dealings incidental to its local activities including paying taxes and salaries and obtaining rentals, electricity, water and telecommunications services, office and similar supplies and customs related services from Iranian companies who may be owned or controlled by the government of Iran. ERICSSON ANNUAL REPORT ON FORM 20-F 2012 INVESTMENTS The following listing shows certain shareholdings owned directly and indirectly by the Parent Company as of December 31, 2012. A complete listing of shareholdings, prepared in accordance with the Swedish Annual Accounts Act and filed with the Swedish Companies Registration Office (Bolagsverket), may be obtained upon request to: Telefonaktiebolaget LM Ericsson, External Reporting, SE-164 83 Stockholm, Sweden. SHARES OWNED DIRECTLY BY THE PARENT COMPANY | | | | | | | | | | | | | | | | | | | | | Type | | Company | | Reg. No. | | | Domicile | | Percentage
of ownership | | | Par value
in local
currency,
million | | | Carrying
value,
SEK million | | Subsidiary companies | | | | | | | | | | | | | | | | | | | | I | | Ericsson AB | | | 556056-6258 | | | Sweden | | | 100 | | | | 50 | | | | 20,731 | | | I | | Ericsson Shared Services AB | | | 556251-3266 | | | Sweden | | | 100 | | | | 361 | | | | 2,216 | | | I | | Netwise AB | | | 556404-4286 | | | Sweden | | | 100 | | | | 2 | | | | 306 | | | II | | AB Aulis | | | 556030-9899 | | | Sweden | | | 100 | | | | 14 | | | | 6 | | | III | | Ericsson Credit AB | | | 556326-0552 | | | Sweden | | | 100 | | | | 5 | | | | 5 | | | | Other (Sweden) | | | | | | | | | — | | | | — | | | | 1,742 | | | I | | Ericsson Austria GmbH | | | | | | Austria | | | 100 | | | | 4 | | | | 65 | | | I | | Ericsson Danmark A/S | | | | | | Denmark | | | 100 | | | | 90 | | | | 216 | | | I | | Oy LM Ericsson Ab | | | | | | Finland | | | 100 | | | | 13 | | | | 196 | | | II | | Ericsson Participations France SAS | | | | | | France | | | 100 | | | | 26 | | | | 524 | | | I | | Ericsson Germany GmbH | | | | | | Germany | | | 100 | | | | — | | | | 4,232 | | | I | | Ericsson Hungary Ltd. | | | | | | Hungary | | | 100 | | | | 1,301 | | | | 120 | | | II | | LM Ericsson Holdings Ltd. | | | | | | Ireland | | | 100 | | | | 2 | | | | 15 | | | I | | Ericsson Telecomunicazioni S.p.A. | | | | | | Italy | | | 100 | | | | 44 | | | | 5,857 | | | II | | Ericsson Holding International B.V. | | | | | | The Netherlands | | | 100 | | | | 222 | | | | 3,200 | | | I | | Ericsson A/S | | | | | | Norway | | | 100 | | | | 75 | | | | 114 | | | II | | Ericsson Television AS | | | | | | Norway | | | 100 | | | | 161 | | | | 1,788 | | | I | | Ericsson Corporatia AO | | | | | | Russia | | | 100 | | | | 5 | | | | 5 | | | I | | Ericsson España | | | | | | Spain | | | 100 | | | | 43 | | | | 170 | | | I | | Ericsson AG | | | | | | Switzerland | | | 100 | | | | — | | | | — | | | II | | Ericsson Holding Ltd. | | | | | | United Kingdom | | | 100 | | | | 328 | | | | 4,094 | | | | Other (Europe, excluding Sweden) | | | | | | | | | — | | | | — | | | | 275 | | | II | | Ericsson Holding II Inc. | | | | | | United States | | | 100 | | | | 2,830 | | | | 29,006 | | | I | | Cía Ericsson S.A.C.I. | | | | | | Argentina | | | 95 | 1) | | | 41 | | | | 178 | | | I | | Ericsson Canada Inc. | | | | | | Canada | | | 100 | | | | — | | | | 51 | | | I | | Bel-Air Networks | | | | | | Canada | | | 100 | | | | — | | | | 170 | | | I | | Ericsson Telecom S.A. de C.V. | | | | | | Mexico | | | 100 | | | | n/a | | | | 1,050 | | | | Other (United States, Latin America) | | | | | | | | | — | | | | — | | | | 67 | | | II | | Teleric Pty Ltd. | | | | | | Australia | | | 100 | | | | 20 | | | | 100 | | | I | | Ericsson Ltd. | | | | | | China | | | 100 | | | | 2 | | | | 2 | | | I | | Ericsson (China) Company Ltd. | | | | | | China | | | 100 | | | | 65 | | | | 475 | | | I | | Ericsson India Private Ltd. | | | | | | India | | | 100 | | | | 725 | | | | 147 | | | I | | Ericsson India Global Services PVT. Ltd | | | | | | India | | | 100 | | | | 389 | | | | 64 | | | I | | LG-Ericsson Ltd. | | | | | | Korea | | | 75 | | | | 150 | | | | 3,285 | | | I | | Ericsson (Malaysia) Sdn. Bhd. | | | | | | Malaysia | | | 70 | | | | 2 | | | | 4 | | | I | | Ericsson Telecommunications Pte. Ltd. | | | | | | Singapore | | | 100 | | | | 2 | | | | 1 | | | I | | Ericsson South Africa PTY. Ltd | | | | | | South Africa | | | 100 | | | | — | | | | 108 | | | I | | Ericsson Taiwan Ltd. | | | | | | Taiwan | | | 80 | | | | 240 | | | | 20 | | | I | | Ericsson (Thailand) Ltd. | | | | | | Thailand | | | 49 | 2) | | | 90 | | | | 17 | | | | Other countries (the rest of the world) | | | | | | | | | — | | | | — | | | | 215 | | | | | | | | | | | | | | | | | | | | | | | | | Total | | | | | | | | | | | | | | | | | 80,839 | | | | | | | | | | | | | | | | | | | | | | | Joint ventures and associated companies | | | | | | | | | | | | | | | | | | | | II | | ST-Ericsson SA | | | | | | Switzerland | | | 50 | | | | 137 | | | | — | | | III | | ST-Ericsson AT SA | | | | | | Switzerland | | | 51 | | | | — | | | | — | | | I | | Rockstar Consortium Group | | | | | | Canada | | | 21 | | | | 1 | | | | 7 | | | I | | Ericsson Nikola Tesla d.d. | | | | | | Croatia | | | 49 | | | | 65 | | | | 330 | | | | | | | | | | | | | | | | | | | | | | | | | Total | | | | | | | | | | | | | | | | | 337 | | | | | | | | | | | | | | | | | | | | | | |
ERICSSON ANNUAL REPORT ON FORM 20-F 2012 Key to type of company | I | Manufacturing, distribution and development companies |
| 1) | Through subsidiary holdings, total holdings amount to 100% of Cia Ericsson S.A.C.I. |
| 2) | Through subsidiary holdings, total holdings amount to 100% of Ericsson (Thailand) Ltd. |
SHARES OWNED BY SUBSIDIARY COMPANIES | | | | | | | | | | | | | Type | | Company | | Reg. No. | | | Domicile | | Percentage
of ownership | | | Subsidiary companies | | | | | | | | | | | II | | Ericsson Cables Holding AB | | | 556044-9489 | | | Sweden | | | 100 | | I | | Ericsson France SAS | | | | | | France | | | 100 | | I | | Ericsson Telekommunikation GmbH & Co. KG1) | | | | | | Germany | | | 100 | | I | | LM Ericsson Ltd. | | | | | | Ireland | | | 100 | | II | | Ericsson Nederland B.V. | | | | | | The Netherlands | | | 100 | | I | | Ericsson Telecommunicatie B.V. | | | | | | The Netherlands | | | 100 | | I | | Ericsson Telekomunikasyon A.S. | | | | | | Turkey | | | 100 | | I | | Ericsson Ltd. | | | | | | United Kingdom | | | 100 | | I | | Ericsson Inc. | | | | | | United States | | | 100 | | I | | Ericsson IP Infrastructure Inc. | | | | | | United States | | | 100 | | I | | Drutt Corporation Inc. | | | | | | United States | | | 100 | | I | | Optimi Corporation | | | | | | United States | | | 100 | | I | | Redback Networks Inc. | | | | | | United States | | | 100 | | I | | Telcordia Technologies Inc. | | | | | | United States | | | 100 | | I | | Ericsson Telecommunicações S.A. | | | | | | Brazil | | | 100 | | I | | Ericsson Australia Pty. Ltd. | | | | | | Australia | | | 100 | | I | | Ericsson (China) Communications Co. Ltd. | | | | | | China | | | 100 | | I | | Nanjing Ericsson Panda Communication Co. Ltd. | | | | | | China | | | 51 | | I | | Ericsson Japan K.K. | | | | | | Japan | | | 100 | | I | | Ericsson Communication Solutions Pte Ltd. | | | | | | Singapore | | | 100 | |
Key to type of company | I | Manufacturing, distribution and development companies |
| 1) | Disclosures Pursuant to Section 264b of the German Commercial Code (Handelsgesetzbuch—HGB) Applying Section 264b HGB, LHS Holding GmbH & Co. KG, LHS Communication GmbH & Co. KG and LHS Telekommunikation GmbH & Co. KG, all located in Frankfurt am Main/Germany, are exempted from the obligation to prepare, have audited and disclose financial statements and a management report in accordance with the legal requirements being applicable for German corporations. |
RECONCILIATIONS TO IFRS This section includes a reconciliation of certain non-IFRS financial measures to the most directly comparable IFRS financial measures. The presentation of non-IFRS financial measures has limitations as analytical tools and should not be considered in isolation or as a substitute for our related financial measures prepared in accordance with IFRS. ERICSSON ANNUAL REPORT ON FORM 20-F 2012 We present non-IFRS financial measures to enhance an investor’s evaluation of our ongoing operating results, to aid in forecasting future periods and to facilitate meaningful comparison of our results between periods. Our management uses these non-IFRS financial measures to, among other things, evaluate our ongoing operations in relation to historical results, for internal planning and forecasting purposes and in the calculation of certain performance-based compensation. The non-IFRS financial measures presented in this report may differ from similarly-titled measures used by other companies. ERICSSON—EXPENSES | | | | | | | | | | | | | | | | | | | | | | | | | | | | IFRS | | | Restructuring Charges | | | Non-IFRS | | SEK billion | | 2011 | | | 2010 | | | 2011 | | | 2010 | | | 2011 | | | 2010 | | Selling and administrative expenses | | | 26.7 | | | | 27.1 | | | | 1.4 | | | | 1.8 | | | | 25.3 | | | | 25.3 | | R&D expenses | | | 32.6 | | | | 31.6 | | | | 0.6 | | | | 1.7 | | | | 32.1 | | | | 29.9 | | Net sales | | | 226.9 | | | | 203.3 | | | | | | | | | | | | 226.9 | | | | 203.3 | | | | | | | | | | | | | | | | | | | | | | | | | | | R&D expenses as a percent of net sales | | | 14.4 | % | | | 15.5 | % | | | | | | | | | | | 14.1 | % | | | 14.7 | % | | | | | | | | | | | | | | | | | | | | | | | | | |
ERICSSON EBITA MARGIN (INCLUDING RESTRUCTURING) | | | | | | | | | | | | | | | | | SEK billion | | 2012 | | | 2011 | | | 2010 | | | 2009 | | Net income | | | 5.9 | | | | 12.6 | | | | 11.2 | | | | 4.1 | | Interest | | | 0.3 | | | | –0.2 | | | | 0.7 | | | | –0.3 | | Tax | | | 4.2 | | | | 5.6 | | | | 4.5 | | | | 2.1 | | Amortization and write-downs of acquired intangibles | | | 4.6 | | | | 4.5 | | | | 5.9 | | | | 7.8 | | EBITA | | | 15.0 | | | | 22.4 | | | | 22.4 | | | | 13.8 | | | | | | | | | | | | | | | | | | | Net sales | | | 227.8 | | | | 226.9 | | | | 203.3 | | | | 206.5 | | EBITA margin (%) | | | 6.6 | % | | | 9.9 | % | | | 11.0 | % | | | 6.7 | % | | | | | | | | | | | | | | | | | |
ADJUSTED OPERATING CASH FLOWS | | | | | | | | | SEK billion | | 2011 | | | 2010 | | Operating cash flow | | | 10.0 | | | | 26.6 | | Restructuring cash outlays | | | 3.2 | | | | 3.3 | | | | | | | | | | | Adjusted operating cash flows | | | 13.2 | | | | 29.8 | | | | | | | | | | |
ERICSSON ANNUAL REPORT ON FORM 20-F 2012 SEGMENT NET SALES, OPERATING INCOME AND OPERATING MARGIN | | | | | | | | | SEK billion | | 2011 | | | 2010 | | Net sales | | | | | | | | | Networks | | | 132.4 | | | | 112.7 | | Global Services | | | 83.9 | | | | 80.1 | | Support solutions | | | 10.6 | | | | 10.5 | | | | | | | | | | | Operating income | | | | | | | | | Networks | | | 17.3 | | | | 12.5 | | Global Services | | | 5.5 | | | | 6.5 | | Support solutions | | | –0.5 | | | | –0.6 | | | | | | | | | | | Operating margin | | | | | | | | | Networks | | | 13 | % | | | 11 | % | Global Services | | | 7 | % | | | 8 | % | Support solutions | | | –5 | % | | | –6 | % | | | | | | | | | | Restructuring charges | | | | | | | | | Networks | | | 1.6 | | | | 3.9 | | Global Services | | | 1.4 | | | | 2.7 | | Support solutions | | | 0.1 | | | | 0.2 | | | | | | | | | | | Operating income excl. restructuring charges | | | | | | | | | Networks | | | 18.9 | | | | 16.4 | | Global Services | | | 6.9 | | | | 9.2 | | Support solutions | | | –0.4 | | | | –0.4 | | | | | | | | | | | Operating margin excl. restructuring charges | | | | | | | | | Networks | | | 14 | % | | | 15 | % | Global Services | | | 8 | % | | | 11 | % | Support solutions | | | –3 | % | | | –4 | % | | | | | | | | | |
In 2012, for all above items except EBITA margin, non-IFRS financial measures were not used. CAPITAL EMPLOYED | | | | | | | | | | | | | | | | | | | | | | | | 2012 | | | 2011 | | | 2010 | | | 2009 | | | 2008 | | Total assets | | | 274,996 | | | | 280,349 | | | | 281,815 | | | | 269,809 | | | | 285,684 | | Non-interest-bearing provisions and liabilities | | | | | | | | | | | | | | | | | | | | | Provisions, non-current | | | –211 | | | | –280 | | | | –353 | | | | –461 | | | | –311 | | Deferred tax liabilities | | | –3,120 | | | | –2,250 | | | | –2,571 | | | | –2,270 | | | | –2,738 | | Other non-current liabilities | | | –2,377 | | | | –2,248 | | | | –3,296 | | | | –2,035 | | | | –1,622 | | Provisions, current | | | –8,427 | | | | –5,985 | | | | –9,391 | | | | –11,970 | | | | –14,039 | | Trade payables | | | –23,100 | | | | –25,309 | | | | –24,959 | | | | –18,864 | | | | –23,504 | | Other current liabilities | | | –61,108 | | | | –57,970 | | | | –58,605 | | | | –52,529 | | | | –61,032 | | | | | | | | | | | | | | | | | | | | | | | Capital employed | | | 176,653 | | | | 186,307 | | | | 182,640 | | | | 181,680 | | | | 182,439 | | | | | | | | | | | | | | | | | | | | | | |
ERICSSON ANNUAL REPORT ON FORM 20-F 2012 RETURN ON CAPITAL EMPLOYED | | | | | | | | | | | | | | | | | | | | | | | | 2012 | | | 2011 | | | 2010 | | | 2009 | | | 2008 | | Operating income | | | 10,458 | | | | 17,900 | | | | 16,455 | | | | 5,918 | | | | 16,252 | | Financial income | | | 1,708 | | | | 2,882 | | | | 1,047 | | | | 1,874 | | | | 3,458 | | Average capital employed1) | | | | | | | | | | | | | | | | | | | | | Capital employed at January 1 | | | 186,307 | | | | 182,640 | | | | 181,680 | | | | 182,439 | | | | 168,456 | | Capital employed at December 31 | | | 176,653 | | | | 186,307 | | | | 182,640 | | | | 181,680 | | | | 182,439 | | Average capital employed | | | 181,480 | | | | 184,474 | | | | 182,160 | | | | 182,060 | | | | 175,448 | | | | | | | | | | | | | | | | | | | | | | | Return on capital employed2) | | | 6.7 | % | | | 11.3 | % | | | 9.6 | % | | | 4.3 | % | | | 11.3 | % | | | | | | | | | | | | | | | | | | | | | |
| 1) | Average capital employed is the average of the amounts of capital employed at January 1 and December 31. |
| 2) | Return on capital employed is the total of operating income and financial income as a percentage of average capital employed. |
GROSS CASH AND NET CASH | | | | | | | | | | | | | | | | | | | | | | | | 2012 | | | 2011 | | | 2010 | | | 2009 | | | 2008 | | Cash and cash equivalents | | | 44,682 | | | | 38,676 | | | | 30,864 | | | | 22,798 | | | | 37,813 | | Short term investments | | | 32,026 | | | | 41,866 | | | | 56,286 | | | | 53,926 | | | | 37,192 | | Gross cash | | | 76,708 | | | | 80,542 | | | | 87,150 | | | | 76,724 | | | | 75,005 | | Post-employment benefits | | | –9,503 | | | | –10,016 | | | | –5,092 | | | | –8,533 | | | | –9,873 | | Interest-bearing liabilities | | | | | | | | | | | | | | | | | | | | | Borrowings non-current | | | –23,898 | | | | –23,256 | | | | –26,955 | | | | –29,996 | | | | –24,939 | | Borrowings current | | | –4,769 | | | | –7,765 | | | | –3,808 | | | | –2,124 | | | | –5,542 | | | | | | | | | | | | | | | | | | | | | | | Net cash | | | 38,538 | | | | 39,505 | | | | 51,295 | | | | 36,071 | | | | 34,651 | | | | | | | | | | | | | | | | | | | | | | | | RETURN ON EQUITY | | | | | | | | | | | | | | | | | | | | | | | | 2012 | | | 2011 | | | 2010 | | | 2009 | | | 2008 | | Net income attributable to stockholders of the Parent Company | | | 5,775 | | | | 12,194 | | | | 11,146 | | | | 3,672 | | | | 11,273 | | Average stockholders’ equity1) | | | | | | | | | | | | | | | | | | | | | Stockholders’ equity at January 1 | | | 143,105 | | | | 145,106 | | | | 139,870 | | | | 140,823 | | | | 134,112 | | Stockholders’ equity at December 31 | | | 136,883 | | | | 143,105 | | | | 145,106 | | | | 139,870 | | | | 140,823 | | Average stockholders’ equity | | | 139,994 | | | | 144,106 | | | | 142,488 | | | | 140,347 | | | | 137,468 | | | | | | | | | | | | | | | | | | | | | | | Return on equity2) | | | 4.1 | % | | | 8.5 | % | | | 7.8 | % | | | 2.6 | % | | | 8.2 | % | | | | | | | | | | | | | | | | | | | | | |
| 1) | Average stockholders’ equity is based on the amounts at January 1 and December 31. |
| 2) | Return on equity is Net income attributable to stockholders of the Parent Company as a percentage of average Stockholders’ equity (based on the amounts at January 1 and December 31). |
ERICSSON ANNUAL REPORT ON FORM 20-F 2012 WORKING CAPITAL | | | | | | | | | | | | | | | | | | | | | | | | 2012 | | | 2011 | | | 2010 | | | 2009 | | | 2008 | | Current assets | | | 193,254 | | | | 198,816 | | | | 198,443 | | | | 182,442 | | | | 198,525 | | Current non-interest-bearing provisions and liabilities | | | | | | | | | | | | | | | | | | | | | Provisions, current | | | –8,427 | | | | –5,985 | | | | –9,391 | | | | –11,970 | | | | –14,039 | | Trade payables | | | –23,100 | | | | –25,309 | | | | –24,959 | | | | –18,864 | | | | –23,504 | | Other current liabilities | | | –61,108 | | | | –57,970 | | | | –58,605 | | | | –52,529 | | | | –61,032 | | | | | | | | | | | | | | | | | | | | | | | Working capital1) | | | 100,619 | | | | 109,552 | | | | 105,488 | | | | 99,079 | | | | 99,951 | | | | | | | | | | | | | | | | | | | | | | |
| 1) | Working capital is Current assets less current non-interest-bearing provisions and liabilities |
CASH CONVERSION | | | | | | | | | | | | | | | | | | | | | | | 2012 | | | 2011 | | | 2010 | | Cash flow from operating activities | | | A | | | | 22,031 | | | | 9,982 | | | | 26,583 | | Net income | | | B | | | | 5,938 | | | | 12,569 | | | | 11,235 | | Adjustments to reconcile net income to cash | | | C | | | | 13,077 | | | | 12,613 | | | | 12,490 | | | | | | | | | | | | | | | | | | | Cash conversion = A/(B+C) | | | | | | | 116 | % | | | 40 | % | | | 112 | % | | | | | | | | | | | | | | | | | |
ERICSSON ANNUAL REPORT ON FORM 20-F 2012 GLOSSARY 2G The first digital generation of mobile systems. Includes GSM, TDMA, PDC and cdmaOne. 3G 3rd generation mobile system. includes WCDMA/HSPA, CDMA2000 and TD-SCDMA. 4G See LTE. All-IP A single, common IP infrastructure that can handle all network services, including fixed and mobile communications, for voice and data services as well as video services such as TV. Backhaul Transmission between radio base stations and the core network. BSS Business support systems CaGR Compound Annual Growth Rate. Capex Capital expenditure. CDMA (Code Division Multiple Access) A radio technology on which the cdmaOne (2G) and CDMA2000 (3G) mobile communication standards are both based. CLOUD When data and applications reside in the network. Edge A mobile standard, developed as an enhancement of GSM. Enables the transmission of data at speeds up to 250 kbps. (Evolved EDGE up to 1 Mbps) GDP (Gross Domestic Product) The total annual cost of all finished goods and services produced within a country. ERICSSON ANNUAL REPORT ON FORM 20-F 2012 GPON (Gigabit Passive Optical Network) Used for fiber-optic communication to the home (FTTH). GSM (Global System for Mobile Communications) A first digital generation mobile system. HSPA (High Speed Packet Access) Enhancement of 3G/WCDMA that enables mobile broadband. ICT Information and Communication Technology. IMS (IP Multimedia Subsystem) A standard for offering voice and multimedia services over mobile and fixed networks using internet technology (IP). IP (Internet Protocol) Defines how information travels between network elements across the internet. IPR Intellectual Property Rights IPTV (IP Television) A technology that delivers digital television via fixed broadband access. JV (Joint Venture) A business enterprise in which two or more companies enter a partnership. LTE (Long-Term Evolution) The next evolutionary step of mobile technology beyond HSPA, allowing data rates above 100 Mbps. Managed services Management of operator networks and/or hosting of their services. Mobile broadband Wireless high-speed internet access using the HSPA, LTE and CDMA2000EV-DO technologies. ERICSSON ANNUAL REPORT ON FORM 20-F 2012 OSS Operations support systems Penetration The number of subscriptions divided by the population in a geographical area. PETAbyte Million gigabytes. RAN Radio Access Network. TD-SCDMA (Time Division Synchronous Code Division Multiple Access), an alternative to WCDMA used in China. WCDMA (Wideband Code Division Multiple Access) A 3G mobile communication standard. WCDMA builds on the same core network infrastructure as GSM. xDSL Digital Subscriber Line technologies for broadband multimedia communications in fixed-line networks. Examples: IP-DSL, ADSL and VDSL. The terms “Ericsson”, “the Company”, “the Group”, “us”, “we”, and “our” all refer to Telefonaktiebolaget LM Ericsson and its subsidiaries. ERICSSON ANNUAL REPORT ON FORM 20-F 2012 FINANCIAL TERMINOLOGY Capital employed Total assets less non-interest-bearing provisions and liabilities. (which includes: provisions, non-current; deferred tax liabilities; other non-current liabilities; provisions, current; trade payables; other current liabilities). Capital turnover Net sales divided by average capital employed. Cash conversion Cash flow from operating activities divided by the sum of net income and adjustments to reconcile net income to cash, expressed as percent. Cash dividends per share Dividends paid divided by average number of shares, basic. Compound annual growth rate (CAGR) The year-over-year growth rate over a specified period of time. Days sales outstanding (DSO) Trade receivables balance at quarter end divided by net sales in the quarter and multiplied by 90 days. If the amount of trade receivables is larger than last quarter’s sales, the excess amount is divided by net sales in the previous quarter and multiplied by 90 days, and total DSO are the 90 days of the most current quarter plus the additional days from the previous quarter. Earnings per share (EPS) Basic earnings per share: profit or loss attributable to stockholders of the Parent Company divided by the weighted average number of ordinary shares outstanding during the period. Diluted earnings per share: the weighted average number of shares outstanding are adjusted for the effects of all dilutive potential ordinary shares. EBITA margin Earnings before interest, taxes, amortization and write-downs of acquired intangibles (intellectual property rights, trademarks and other intangible assets, see Note C10 “Intangible assets”) as a percentage of net sales. EPS (non-IFRS) EPS, diluted, excluding amortizations and write-down of acquired intangible assets and including restructuring charges. Equity ratio Equity, expressed as a percentage of total assets. Gross cash Cash and cash equivalents plus short-term investments. ERICSSON ANNUAL REPORT ON FORM 20-F 2012 Inventory turnover days (ITO-days) 365 divided by inventory turnover, calculated as total cost of sales divided by the average inventories for the year (net of advances from customers). Net cash Cash and cash equivalents plus short-term investments less interest-bearing liabilities (which include: borrowings, non-current and borrowings, current) and post-employment benefits. P/E ratio The P/E ratio is calculated as the price of a Class B share at last day of trading divided by Earnings per share, basic. Payable days The average balance of trade payables at the beginning and at the end of the year divided by cost of sales for the year, and multiplied by 365 days. Payment readiness Cash and cash equivalents and short-term investments less short-term borrowings plus long-term unused credit commitments. Payment readiness is also shown as a percentage of net sales. Return on capital employed The total of Operating income plus Financial income as a percentage of average capital employed (based on the amounts at January 1 and December 31). Return on equity Net income attributable to stockholders of the Parent Company as a percentage of average Stockholders’ equity (based on the amounts at January 1 and December 31). Stockholders’ equity per share Stockholders’ equity divided by the number of shares outstanding at end of period, basic. Total shareholder return (TSR) The increase or decrease in Class B share price during the period, adjusted for dividends paid, expressed as a percentage of the share price at the start of the period. Trade receivables turnover Net sales divided by average trade receivables. Value at risk (VaR) A statistical method that expresses the maximum potential loss that can arise with a certain degree of probability during a certain period of time. Working capital Current assets less current non-interest-bearing provisions and liabilities (which include: provisions, current; trade payables; other current liabilities). ERICSSON ANNUAL REPORT ON FORM 20-F 2012 EXCHANGE RATES Exchange rates used in the consolidation | | | | | | | | | | | | January–December | | | | | 2012 | | | 2011 | | SEK/EUR | | | | | | | | | Average rate | | | 8.70 | | | | 9.02 | | Closing rate | | | 8.58 | | | | 8.92 | | SEK/USD | | | | | | | | | Average rate | | | 6.73 | | | | 6.48 | | Closing rate | | | 6.51 | | | | 6.90 | |
ERICSSON ANNUAL REPORT ON FORM 20-F 2012 SHAREHOLDER INFORMATION FOR PRINTED PUBLICATIONS A printed copy of the Annual Report is provided on request. Strömberg Distribution i Huddinge AB SE-120 88 Stockholm, Sweden Phone: +46 8 449 89 57 Email: ericsson@strd.se In the United States, IN THE UNITED STATES:
Ericsson’s Transfer Agent Citibank: Citibank Shareholder Services Registered holders: +1 877 881 59 69 (toll free within the U.S.) Interested investors: +1 781 575 45 55 (outside of the U.S.) Email: ericsson@shareholders-online.com citibank@shareholders-online.com www.citi.com/dr Ordering a hard copy of the Annual Report: Phone toll free: +1 866 216 046
http://proxy.georgeson.com/annualreport/ericsson.htm
Contact information
Investor Relations for Europe, Middle East, Africa and Asia Pacific:888 301 2504
Telefonaktiebolaget LM Ericsson SE-164 83Ericsson’s shareholders are invited to participate in the Annual General Meeting to be held on Tuesday, April 9, 2013, at 3 p.m. at Kistamässan, Arne Beurlings Torg 5, Kista, Stockholm, Sweden
Telephone: +46 10 719 00 00
Email: investor.relations@ericsson.comSweden.
Investor Relations forRegistration and notice of attendance
Shareholders who wish to attend the Americas: Ericsson
The Grace Building
1114 Ave of the Americas, Suite #3410
New York, NY 10036, USA
Telephone: +1 212 685 40 30
Email: investor.relations@ericsson.com
ERICSSON ANNUAL REPORT ON FORM 20-F 2009
CORPORATE GOVERNANCE REPORT 2009
CONTENTS
Our corporate governance is based on a strong ethos of ethical business practice that starts at the top and permeates to all Ericsson employees. The Board is committed to high standards of corporate governance and we encourage all employees to constantly seek ways of making our internal controls and oversight even more effective and reliable. It is during challenging times that the quality of a company’s governance truly shows and during the past year we have been able to draw on our strengths in this area.
Michael Treschow
Chairman of the Board of Directors
Corporate governance describes the ways in which rights and responsibilities are distributed among the various corporate bodies according to the laws, rules and processes to which they are subject. Corporate governance defines the decision-making systems and structure through which owners directly or indirectly control a company.
This Corporate Governance Report is rendered in accordance with the Swedish Code of Corporate Governance. The report has not been reviewed by Ericsson’s auditor and does not constitute a part of the formal Annual Report.
HIGHLIGHTS OF 2009General Meeting must:
Hans Vestberg, CFO, was appointed new President and CEO succeeding Carl-Henric Svanberg as of January 1, 2010.
Jan Frykhammar was appointed new CFO succeeding Hans Vestberg as of November 1, 2009.
Three new members joined the Group Management Team.
REGULATION AND COMPLIANCE
As a Swedish public limited liability company with securities quoted on NASDAQ OMX Stockholm as well as on NASDAQ, Ericsson is subject to a variety of rules that affect its governance. Major external rules include:
The Swedish Companies Act.
ERICSSON ANNUAL REPORT ON FORM 20-F 2009
Rulebook for issuers of NASDAQ OMX Stockholm.
The Swedish Code of Corporate Governance (the “Code”).
NASDAQ Stock Market Rules—including applicable NASDAQ corporate governance requirements, subject to certain exemptions principally reflecting mandatory Swedish legal requirements.
Applicable requirements of the US Securities and Exchange Commission including the Sarbanes-Oxley Act.
In addition, to ensure compliance with legal and regulatory requirements and the high ethical standards that we set for ourselves, Ericsson has internal rules that include:
Group Steering Documents including Group policies and directives, instructions and business processes for approval, control and risk management.
Code of Conduct to be appliedBe recorded in the product development, production, supply and support of Ericsson products and services worldwide.
Further, the Board of Directors has included internal rules in its work procedure.
Compliance with the Swedish Code of Corporate Governance
The Code has been applied by Ericsson since July 2005. Ericsson is committed to complying with best-practice corporate governance on a global level wherever possible. This includes continued compliance with the corporate governance provisions expressed by the Code.
An ethical business
Ericsson’s Code of Business Ethics sets out how the Group achieves and maintains its high ethical standards and summarizes the Group’s fundamental policies and directives.
The ethical code has been translated into more than 20 languages. This ensures that it is accessible to all employees and underpins the importance of ethical conduct in all business activities. During recruitment employees sign a form to acknowledge that they are aware of the principles of the Code of Business Ethics. This procedure is repeated at regular intervals throughout the term of employment.
Through this meticulous process, Ericsson strives to ensure that high ethical standards are upheld continuously. All employees have an individual responsibility to ensure that business practice adheres to the rules of the Code of Business Ethics. The Code of Business Ethics satisfies the applicable requirements of the Sarbanes-Oxley Act of 2002 and NASDAQ Stock Market rules.
The Code of Business Ethics can be found at: www.ericsson.com/ericsson/corporate_responsibility/ employees/code_businessethics.shtml (information on the Ericsson website does not form part of this Report).
SHAREHOLDERS
Ownership structure
According to the share register kept by Euroclear Sweden AB as(the Swedish Securities Registry) on Wednesday, April 3, 2013, and
Give notice of December 31, 2009attendance to the Company at the latest on Wednesday, April 3, 2013. Notice of attendance can be given by telephone: +46 8 402 90 54 on weekdays between 10 a.m. and 4 p.m., or on Ericsson’s website. Notice of attendance may also be given in writing to: Telefonaktiebolaget LM Ericsson had 690,726 shareholders. Almost 77 percent General Meeting of the shares are owned by institutions, bothShareholders Box 7835, SE-103 98 Stockholm, Sweden When giving notice of attendance, please state name, date of birth, address, telephone number and number of assistants, if any. The meeting will be conducted in Swedish and international. Investor and Industrivärden, two public listed Swedish industrial holding companies, aresimultaneously interpreted into English. Shares registered in the largest shareholders. They hold 5.01 and 2.34 percentname of a nominee In addition to giving notice of attendance, shareholders having their shares registered in the name of a nominee, must request the nominee to temporarily enter the shareholder into the share capital and 19.33 and 13.62 percent ofregister as per Wednesday, April 3, 2013, in order to be entitled to attend the voting rights, respectively. meeting. The shareholders should inform the nominee to that effect well before that day.ERICSSON ANNUAL REPORT ON FORM 20-F 20092012 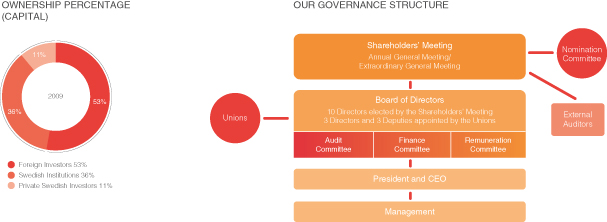
Shareholders represented by proxy shall issue and submit to the Company a power of attorney for the representative. A significant numberpower of attorney issued by a legal entity must be accompanied by a copy of the shares held by foreign investors are nominee-registered, i.e. held off record by banks, brokers and/entity’s certificate of registration, or nominees. This means thatif no such certificate exist, a corresponding document of authority. Such documents must not be older than one year unless the actual shareholder is not displayed in the share register or included in the shareholding statistics. As a result, the ultimate shareholder does not show in the shareholder statistics used, for example, for the purposepower of appointing members of the Nomination Committee. For more information on the Company’s shareholders, see the chapter “Share Information” in the Annual Report.
Shares and voting rights
The share capital of Telefonaktiebolaget LM Ericsson consists of two classes of listed shares; A and B. Each class A share carries one vote and each class B share carries one tenth of one vote. Class A and B shares entitle the holder to the same proportion of assets and earnings and carry equal rights in terms of dividends. In addition, the Parent Company may issue Class C shares in order to create treasury stock to hedge incentive programs resolved by the General Meeting. Class C shares held by Ericsson do not entail rights to dividend or voting rights. The class C shares are converted into class B shares before they are transferred to participants of the incentive programs.
The members of the Board of Directors and the Group Management Team do not have different voting rights on shares than other shareholders.
GENERAL MEETING OF SHAREHOLDERS
The decision-making rights of Ericsson’s shareholders are exercised at General Meetings. The Annual General Meeting is held in Stockholm. The date and venue for the meeting is announced on the Ericsson website no later than in conjunction with the release of the third-quarter report.
Shareholders who cannot participate in person may be represented by proxy. Shareholders who have their shares nominee-registered must, to be able to vote, request to be entered into the share register in the owner’s own name by the record date for the General Meeting. The Annual General Meeting is held in Swedish and simultaneously interpreted into English. All documentation provided by the Company is also available in English.
ERICSSON ANNUAL REPORT ON FORM 20-F 2009
The Annual General Meeting gives shareholders the opportunity to raise questions relating to the operations of the Group. Normally, the members of the Board of Directors and the Group Management Team are present to answer such questions. The auditor is always present at the Annual General Meeting. Shareholders and other interested parties may also correspond in writing with the Company at any time.
Most resolutions at General Meetings are passed by a simple majority. However, the Swedish Companies Act requires qualified majorities in certain cases. For example, qualified majority is required for the resolution to transfer own shares to employees participating in Ericsson’s Stock Purchase Plan and for amending the articles of association.
Ericsson’s Annual General Meeting 2009
696 shareholders, representing approximately 59 percent of the votes, attended the Annual General Meeting (AGM) held on April 22, 2009. The meeting was held at the Annex to the Ericsson Globe in Stockholm.
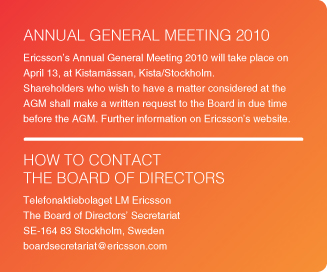
The Board of Directors, members of the Group Management Team and the external auditor were present at the meeting. Decisions of the AGM 2009 included:
Payment of a dividend of SEK 1.85 per share for 2008.
Re-election of Chairman of the Board of Directors, Michael Treschow.
Re-election of members of the Board of Directors, Roxanne S. Austin, Sir Peter L. Bonfield, Börje Ekholm, Ulf J. Johansson, Sverker Martin-Löf, Marcus Wallenberg, Nancy McKinstry, Anders Nyrén and Carl-Henric Svanberg.
Board of Directors’ fees to remain unchanged: Chairman SEK 3,750,000 and other non-employed Board members SEK 750,000 each. SEK 350,000 to the Chairman of the Audit Committee and SEK 250,000 each to the other two non-employed members of the Audit Committee. SEK 125,000 each to the Chairmen and other non-employed members of the Finance and Remuneration committees. Additionally, part of the Directors’ Board fees may be paid in the form of synthetic shares.
Approval of the remuneration policy for senior management.
Implementation of a Long-Term Variable Remuneration Program.
Conditional amendments to the Articles of Association regarding the way General Meetings are convened.
ERICSSON ANNUAL REPORT ON FORM 20-F 2009
The minutes of the AGM 2009 are available at: www.ericsson.com/ericsson/investors/shareholders/agm (information on the Ericsson website does not form part of this Report).
NOMINATION COMMITTEE
A Nomination Committee was elected by the Annual General Meeting for the first time in 2001. Since then, each Annual General Meeting has appointed a Nomination Committee, or resolved on the procedure for appointing the Nomination Committee.
The Annual General Meeting 2009 resolved that the Nomination Committee shall consist of representatives of the four largest shareholders by voting power by the end of the month in which the Annual General Meeting was held plus the Chairman of the Board of Directors. However, as further described in the procedure for appointing members of the Nomination Committee, it may include additional members following a request by a larger shareholder. Such a request must be justified by changes in the shareholder’s share ownership and be received by the Nomination Committee no later than December 31.
Members of the Nomination Committee
The current Nomination Committee consists of, in addition to the Chairman of the Board of Directors, the four representatives appointed by the four shareholders with the largest voting power as of April 30, 2009:
These are Petra Hedengran (Investor AB), Carl-Olof By (AB Industrivärden, Svenska Handelsbankens Pensionsstiftelse and Pensionskassan SHB Försäkringsförening, Chairman of the Nomination Committee), Caroline af Ugglas (Livförsäkrings-aktiebolaget Skandia) and Marianne Nilsson (Swedbank Robur Fonder). Marianne Nilsson replaced Mats Lagerqvist (Swedbank Robur Fonder) during the year.
The tasks of the Nomination Committee
Over the years the tasks of the Nomination Committee have evolved to comply with the requirements of the Code. The main task of the Committee is to propose candidates for election to the Board of Directors. The Committee must consider all applicable rules on the independence of the Board of Directors.
It also prepares remuneration proposals for those Directors elected by the Annual General Meeting but not employed by Ericsson, for the auditors and for members of the Nomination Committee, for resolution by the Annual General Meeting. To date, the Committee has not proposedattorney explicitly provides that it should be paid any fees. When proposing auditors, the Nomination Committee selects candidates in co-operation with the Audit Committeeis valid for a longer period, up to a maximum of the Board.
The Committee also proposes a candidate for election of the Chairman of General Meetings.
Work of the Nomination Committee for the Annual General Meeting 2010
As of February 18, 2010 the Nomination Committee has held six meetings. The Committee starts its work by orientating itself on the functioning of the Board work and Ericsson’s strategy and future development. In 2009, the Nomination Committee has met with both the resigning President and CEO, Carl-Henric Svanberg, and the incoming President and CEO, Hans Vestberg, both of whom have given their views on the Company’s development and future. From this basis the Committee is able to make assessments on the competence and experience required by the Board members.
ERICSSON ANNUAL REPORT ON FORM 20-F 2009
The Committee has been informed of the results of the evaluation of the Board work and procedures, including the performance of the Chairman of the Board. The Committee applies a recruitment procedure where it assesses potential candidates for the Board of Directors. The Committee has also acquainted itself with the assessments made by the Company and the Audit Committee in terms of quality and efficiency of external auditor work, including recommendations regarding audit fees.
BOARD OF DIRECTORS
The Board of Directors is ultimately responsible for the organization of Ericsson and the management of the operations. It develops guidelines and instructions for the day-to-day operations, managed by the President and CEO. In turn, the President and CEO ensures the Board is updated regularly on events of importance to the Parent Company, including business development, results, financial position and liquidity of the Group.
According to the Articles of Association, the Board of Directors shall consist of no less than five directors and no more than 12 directors, with no more than six deputies. Directors will serve from the close of the Annual General Meeting where they are elected to the close of the following Annual General Meeting, but can serve any number of consecutive terms. In addition, under Swedish law, trade unions have the right to appoint three directors and their deputies to the Board.
While the President and CEO may be elected as a director of the Board, the Swedish Companies Act prohibits the President of a public company from being elected Chairman of the Board. Ericsson strictly follows rules and regulations regarding conflicts of interest. Directors are disqualified to participate in any decision regarding agreements between themselves and Ericsson. The same applies for agreements between Ericsson and any third party or legal entity in which the Board member has an interest.
years. In order to ensure compliance with NASDAQ Stock Market Rules,facilitate the Audit Committee has implemented a procedure on related-party transactions. Further, the Audit Committee has established a pre-approval process for non-audit services carried out by the external auditor. Composition of the Board of Directors
The Board of Directors consists of 10 Directors, including the Chairman of the Board, elected by the shareholdersregistration at the Annual General Meeting, 2009, for the period until the closepower of the Annual General Meeting
ERICSSON ANNUAL REPORT ON FORM 20-F 2009
2010,attorney in original, certificates of registration and three employee representatives, each with a deputy, appointed by the trade unions for the same periodother documents of time. The President and CEO, Carl-Henric Svanberg, is the only Board member who was also a member of Ericsson’s management during 2009.
Work procedure of the Board of Directors
Pursuantauthority should be sent to the Swedish Companies Act, the Board of Directors has adopted a work procedure that outlines rules for the distribution of tasks between the Board and its Committees as well as between the Board, its Committees and the President and CEO. This complements the regulationCompany in the Swedish Companies Act and the Articles of Association of the Company. The work procedure is reviewed, evaluated and adopted by the Board at least once a year as required.
Independence of the Directors
The Board of Directors and its Committees are subject to a variety of independence requirements. Ericsson applies independence rules in applicable Swedish law, the Rulebook for issuers of NASDAQ OMX Stockholm, the Swedish Code of Corporate Governance, the NASDAQ Stock Market Rules and in the Sarbanes-Oxley Act of 2002. However, Ericsson has sought and received exemptions from certain requirements in the Sarbanes-Oxley Act and in the NASDAQ Stock Market Rules, including those that are contrary to Swedish Law.
The composition of the Board of Directors meets all applicable independence criteria.
The Nomination Committee concluded before the Annual General Meeting of Shareholders 2009, that, for the purposes of the Code of Corporate Governance, at least five of the persons nominatedadvance to the Board were independentaddress above for receipt by Monday, April 8, 2013. Forms of Ericsson, its senior managementpower of attorney in Swedish and its major shareholders. These were Roxanne S. Austin, Sir Peter L. Bonfield, Ulf J. Johansson, Nancy McKinstry and Michael Treschow.English are available on Ericsson’s website.
Work of the Board of Directors
The work of the Board follows a yearly cycle, starting with the statutory Board meeting which is held in connection with the Annual General Meeting. At this meeting, members of each of the three Committees are appointed and the Board resolves on matters such as signatory power.
At the next ordinary meeting, the Board handles the first interim report for the year. In June, a Board meeting generally takes place away from the headquarters, giving Directors a chance to visit major Ericsson business operations. In July, the Board convenes to handle the interim report for the second-quarter of the year. Particular strategy matters are regularly addressed at appropriate Board meetings and a two-day Board meeting following the summer is mainly devoted to the overall strategy of the Group. The strategy meeting also addresses the overall risk management of the Group. A Board meeting is held at the end of October to handle the third-quarter interim report.
The Board has developed a process to thoroughly evaluate its own work. The results of the evaluation are presented and discussed by the Board during the fall. The last meeting of the calendar year addresses budget and financial outlook. At the first meeting of the calendar year the Board focuses on the financial result of the entire year and handles the fourth-quarter report. At the second Board meeting in February, which closes the yearly cycle of work, the Board concludes the Annual Report.
As the Board is responsible for financial oversight, financials are presented and evaluated at each Board meeting. Each Board meeting generally also includes reports on committee work by the Chairman of each committee. In addition, minutes from the committee meetings are distributed to all Directors prior to the Board meeting.
ERICSSON ANNUAL REPORT ON FORM 20-F 2009
A Board meeting also typically includes the President and CEO’s report on business and market developments, including the financial performance of the Company. The Board is regularly informed of developments in legal and regulatory matters of importance.
The Board meets with Ericsson’s external auditor at least once a year to receive and consider the auditor’s observations. The auditor also prepares reports for the management on the accounting and financial reporting practices of the Group. The Audit Committee also meets with the auditor to receive and consider observations on the interim reports. The auditor has been instructed to report on whether the accounts, the management of funds and the general financial position of the Group are well controlled in all material respects.
The Board also reviews and assesses the process for financial reporting, as described later in “Internal control over financial reporting 2009”. Combined with the internal controls, the Board’s and the auditor’s review of interim and annual reports are deemed to give reasonable assurance on the quality of the financial reporting.
Training of the Board of Directors
All new Directors receive comprehensive training tailored to their individual requirements. Introductory training typically includes meetings with the heads of the major businesses and functions and training arranged by NASDAQ OMX Stockholm on listing issues and insider rules. In addition, full-day training sessions are generally held twice a year for all Directors, to enhance their knowledge of specific operations and specific issues as appropriate.
Training sessions organized in 2009 have provided the Directors with an in-depth knowledge of the industry landscape, new technologies, network transformation and future products. In addition, annual training has been conducted to advise the Board on material issues and key focus areas regarding corporate responsibility and sustainability. These include energy efficiency, climate and health, human rights, supply chain management and anti-corruption.
Work of the Board of Directors in 2009
The work of the Board of Directors is continuously characterized by a high level of activity and 14 Board meetings were held in 2009. Two meetings were held away from the headquarters, one in Geneva, Switzerland and one in Lund, Sweden. Both meetings were particularly focusing on the joint ventures ST-Ericsson and Sony Ericsson respectively. For attendance at Board meetings see table on page 203.
2009 has been characterized by the financial turmoil and uncertainty in the market development. During the year the Board has thoroughly monitored and analyzed related risk factors. In a market downturn, focus on key strategic areas such as maintaining technology and services leadership, profitability and risk management has been continuously important. A leading position and effectiveness in research and development is key in the rapid technology evolution and in the increasingly competitive landscape, sharpened over the year by the uncertainty in the financial market.
ERICSSON ANNUAL REPORT ON FORM 20-F 2009
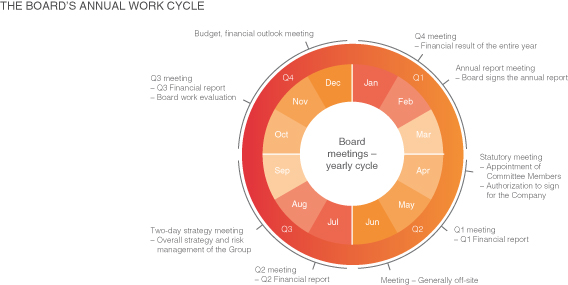
Apart from regular matters in the annual Board work cycle, the Board addressed various acquisitions that were completed during the year, namely Nortel’s North American CDMA and LTE businesses, Bizitek and certain operations of Elcoteq and also the establishment of the new joint venture ST-Ericsson together with STMicroelectronics.
The Board addressed long and short-term goals and strategies with regard to the joint ventures Sony Ericsson and ST-Ericsson and a network transformation strategy. Also, in 2009, Hans Vestberg was appointed new President and CEO following Carl-Henric Svanberg’s resignation as of January 1, 2010.
The heads of the business units have provided the Board with thorough updates of their respective business operations and strategies. In terms of remuneration, the Board put forward a proposal for a Long-Term Variable Remuneration Program 2009 (LTV) to the Annual General Meeting 2009. For the purposes of financing the LTV, the Board further proposed a new directed issue and re-purchase of Class C shares to be converted into B shares.
The Board is continuously working to improve its ways of working based on the Board evaluation and discussions with the Chairman of the Board and the Committee Chairmen.
Board work evaluation
A key objective of the Board evaluation is to ensure that the Board is functioning well. This includes gaining an understanding of the issues which the Board thinks warrant greater scope and determining areas within the Board where additional competence is needed. The evaluation also serves as guidance for the work of the Nomination Committee.
Each year, the Chairman of the Board initiates and leads the evaluation of Board and Committee work and procedures. The evaluation tools include detailed questionnaires, interviews and discussions. In 2009, the Chairman held individual meetings with all the Directors, following their response to two separate written questionnaires; one covering the Board work in general and one covering the Chairman’s performance. The Chairman was not involved in the development, compilation or evaluation of the questionnaire which related to his performance. Nor was he present when his performance was evaluated. The results of the evaluations were thoroughly discussed in order to further improve the work of the Board. Normally, an evaluation of the CEO’s work is conducted. However, in view of Carl-Henric Svanberg’s resignation as of January 1, 2010, it was deemed redundant this year.
ERICSSON ANNUAL REPORT ON FORM 20-F 2009
Committees of the Board of DirectorsDividend
The Board of Directors has established three Committees: Audit Committee, Finance Committee and Remuneration Committee. Membersdecided to propose the Annual General Meeting to resolve on a dividend of each Committee are appointed amongst the Board members. The work of the Committees is mainly to prepare matters for final resolution by the Board. However, the Board has authorized each Committee to determine certain issues in limited areas and may also on occasion provide extended authorization to determine specific matters.
If deemed appropriate, the Board of Directors and each Committee have the right to engage external expertise, either in general or in respect to specific matters.
Prior to every Board meeting, each Committee submits, in addition to minutes, a written summary to the Board on the issues handled or resolved since the previous ordinary Board meeting. In addition to the minutes and the written summary, the Chairman of the Committee also reports on the Committee work at each Board meeting.
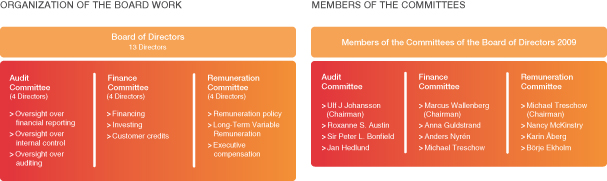
Audit Committee
On behalf of the Board, the Audit Committee monitors the scope and correctness of the financial statements, compliance with legal and regulatory requirements and internal control over financial reporting. The Audit Committee also reviews the annual and interim financial reports and oversees the external audit process, including audit fees.
This involves:
Reviewing, with management and the external auditor, the financial statements, including conformity with generally accepted accounting principles.
Reviewing, with management, the reasonableness of significant estimates and judgments made in preparing the financial statements, as well as the quality of the disclosures in the financial statements.
Reviewing matters arising from reviews and audits performed.
The Audit Committee itself does not perform audit work. Ericsson has an internal audit function, which reports to the Audit Committee and performs independent audits.
ERICSSON ANNUAL REPORT ON FORM 20-F 2009
When applicable, the Committee is also involved in the preparatory work of proposing candidatesSEK 2.75 per share for the election of auditor. It also monitors Group transactionsyear 2012 and that Friday, April 12, 2013 will be the ongoing performance and independence of the auditor to avoid conflicts of interest.
To achieve this, the Audit Committee has implemented approval proceduresrecord date for audit and other services performed by the external auditor (see “Audit Committee pre-approval policies and procedures”). A process for reviewing transactions with related parties and a whistle-blower procedure for the reporting of violations relating to accounting, internal control and auditing matters are also in place.dividend.
Alleged violations are investigated by Ericsson’s internal audit function in conjunction with the relevant Group Function. Information regarding any incidents, including measures taken, details of the responsible Group Function and the status of any investigation are reported to the Audit Committee.
Members of the Audit Committee The Audit Committee consists of fourfive Board members as appointed by the Board. In 2009,2012, the Audit Committee comprised:comprised Ulf J. Johansson (Chairman of the Committee), Roxanne S. Austin, Sir Peter L. Bonfield, Kristina Davidsson and Jan Hedlund.Sverker Martin-Löf. All members, except Jan Hedlund, whoThe composition of the Audit Committee meets all applicable independence requirements. The Board of Directors has determined that each of Ulf J. Johansson, Roxanne S. Austin, Sir Peter L. Bonfield and Sverker Martin-Löf is appointed Board member byan audit committee financial expert, as defined under the unions pursuant to Swedish mandatory law, areSEC rules. Each of them is independent from the Companyunder applicable US securities laws, SEC rules and senior management. Each memberNASDAQ Stock Market Rules and each of them is financially literate and familiar with the accounting practices of an international company, such as Ericsson. At least one member must be an audit committee financial expert, in accordance with the Sarbanes-Oxley Act, Section 407. The Board of Directors has determined that Ulf J. Johansson, Roxanne S. Austin and Sir Peter L. Bonfield all satisfy this requirement.
Former authorized public accountant Peter Markborn iswas previously appointed as an external expert advisor to assist and advise the Audit Committee. He left this assignment during 2012. Work of the Audit Committee in 20092012 The Audit Committee held eightsix meetings in 2009.2012. Directors’ attendance is reflected in the table on page 203.195. During the year, the Audit Committee reviewed the scope and results of external financial audits and the independence of the external auditors andauditor. It also monitored the external audit fees. Further, certain additionalfees and approved non-audit services performed by the external auditor were approved by the Audit Committee Chairman underin accordance with the Committee’s pre-approval policies and procedures.
ERICSSON ANNUAL REPORT ON FORM 20-F 2012 The Committee approved the annual audit plan for the internal audit function and reviewed its reports. Prior to publishing it, the Committee also reviewed and discussed each interim report with the external auditor. The Committee also monitored the continued compliance with the Sarbanes-Oxley Act andas well as the internal control and risk management process. The Committee hasIt also reviewed certain related-party transactions in accordance with its established process. AuditThe Committee pre-approval policiesreviewed and procedures
The Audit Committee reviewsevaluated the effectiveness and approves the scope of audits to be performed (external and internal) and analyzes the results and costsappropriateness of the audits. The Committee makes recommendations to the Board of Directors regarding the auditor’s performance and to the Nomination Committee regarding the external auditor’s fees.Group’s anti-corruption program.
In order to ensure the auditor’s independence, the Audit Committee has established pre-approval policies and procedures for non-audit related services to be performed by the external auditor. Pre-approval authority may
ERICSSON ANNUAL REPORT ON FORM 20-F 2009
not be delegated to management. The policies and procedures include a list of prohibited services and services that require pre-approval by the Committee. Such services fall into two broad categories; general pre-approval and specific pre-approval:
General pre-approval—certain services regarding taxes, transactions, risk management, corporate finance, attestation and accounting and so called general services. These services have received general pre-approval by the Audit Committee, provided that the estimated fee for each project does not exceed SEK 1 million. The external auditor must advise the Audit Committee of services rendered under the general pre-approval policy.
Specific pre-approval—all other non-audit related services must receive specific pre-approval. The Audit Committee Chairman has the delegated authority for specific pre-approval in between Committee meetings, provided that the fee in each case does not exceed SEK 2.5 million. The Chairman reports any pre-approval to the Audit Committee at its next meeting. For matters which may not be handled by the Chairman and, hence, require specific pre-approval by the Audit Committee, the auditor submits an application to the Parent Company for final approval by the Audit Committee.
Finance Committee The Finance Committee is primarily responsible for: Handling matters related to acquisitions and divestments.divestments Handling capital contributions to companies inside and outside the Ericsson Group.Group Raising of loans, issuances ofissuing guarantees and similar undertakings, and the approval ofapproving financial support to customers and suppliers.suppliers Continuously monitoring the Group’s financial risk exposure. The Finance Committee is authorized to determine matters such as directas: Direct or indirect financing provision Provision of credits granting Granting of securities and guarantees and certain Certain investments, divestments and financial commitments. Members of the Finance Committee The Finance Committee consists of four Board members as appointed by the Board. In 2009,2012, the Finance Committee comprised: Marcus WallenbergLeif Johansson (Chairman of the Committee), Anna Guldstrand,Pehr Claesson, Anders Nyrén and Michael Treschow.Jacob Wallenberg. Work of the Finance Committee in 20092012 The Finance Committee held seven meetings in 2009.2012. Directors’ attendance is reflected in the table on page 203. The195. During the year, the Finance Committee approved numerous customer finance credit arrangements and reviewed a number of potential mergers and acquisitions and real estate investments from a financial perspective. As a result of the uncertainty on the financial markets and the macroeconomic development, the Finance Committee has devoted considerable time to the uncertainty in the financial marketfocused particularly on discussing and securing an adequate capital structure, cash flow and cash-generating ability. It has thoroughlyalso continuously monitored the Company’sEricsson’s financial position and credit exposure. In order to reduce gross debt and to gain net interest savings, the Committee has approved a premature re-purchase during 2009 of a EUR 471 million bond loan, maturing in November 2010. In view of the unstable financial sector over the year, the Committee has re-arranged the investment policy and procedures to reduce the credit exposure. During the year the Committee has also approved customer finance and credit facility arrangements, with a continued focus on capital structure, cash flow and cash generating ability.
ERICSSON ANNUAL REPORT ON FORM 20-F 2009
Remuneration Committee The Remuneration Committee’s main responsibility is to prepare for resolution by the Board of Directors matters regarding salary and other remuneration. This includesremuneration, including pension benefits of the President and CEO, the Executive Vice Presidents and other officers who report directly to the President and CEO. Other responsibilitiesResponsibilities include: DevelopingReviewing and monitoring strategiespreparing for resolution by the Board, proposals on salary and generalother remuneration, including retirement compensation, for the President and CEO
ERICSSON ANNUAL REPORT ON FORM 20-F 2012 Reviewing and preparing for resolution by the Board, proposals to the AGM on guidelines for employeeremuneration to the ELT Approving proposals on salary and other remuneration, including short-term variable remunerationretirement compensation, for the Executive Vice Presidents and pension benefits.other CEO direct reports Reviewing the results of short-term variable pay plans before pay out. Preparation of the long-term variable remuneration program for referral to the Board and resolution by the General Meeting.
Preparation of targets for short-term variable pay for the following year,preparing for resolution by the Board.Board, proposals to the AGM on LTV and similar equity arrangements.
To achieve this, the Committee holds annual remuneration reviews with Company representatives to determine the strategic direction and align program designs and pay policies with the business objectives.
Consideration is given to trends in remuneration, legislative changes, disclosure rules and the general global environment surrounding executive pay.remuneration. The Committee reviews salary survey data before approving any salary adjustment for CEO direct reports. In addition, the Committee prepares salary adjustments for the President and CEO for resolution by the Board. Members of the Remuneration Committee The Remuneration Committee consists of four Board members as appointed by the Board. In 2009,2012, the Remuneration Committee comprised: Michael TreschowLeif Johansson (Chairman of the Committee), Börje Ekholm, Nancy McKinstry and Karin Åberg. Gerrit Aronson isPiia Pilv has been appointed by the Remuneration Committee as an independent expert advisor to assist the Committee, particularly regarding international trends and developments.
Work of the Remuneration Committee in 20092012 The Remuneration Committee held sevensix meetings in 2009.2012. Directors’ attendance is reflected in the table on page 203. 195. The Committee reviewed and prepared a proposal for the LTV 2012 for resolution by the Board a proposal for a Long-term Variable Remuneration Program 2009, whichBoard. This was approved by the Annual General Meeting in April 2009.AGM 2012. The Committee further resolved on salaries and short term variable payShort-Term Variable remuneration (STV) for 20092012 for CEO direct reportsreports. It prepared remuneration to the President and preparedCEO, for resolution by the BoardBoard. The Committee also prepared guidelines for remuneration to the incoming President and CEO, Hans Vestberg. Also, the Committee prepared a remuneration policy,ELT, which waswere subsequently referred by the Board to the Annual General MeetingAGM for approval. Towards the end of the year, the Committee concluded its analysis of the current long-term variable remunerationLTV structure and executive remuneration. The resulting proposals on LTV and guidelines for remuneration policy. Proposals in respect hereofto the ELT will be referred to the Annual General Meeting 2010AGM 2013 for resolution. For further information on remuneration, fixed and variable pay,remuneration, please see Notes to the consolidated financial statements—Note C29C28 “Information Regarding Membersregarding members of the Board of Directors, the ManagementGroup management and Employees” in the Annual Reportemployees” and the “Remuneration Report” included in the Annual Report. ERICSSON ANNUAL REPORT ON FORM 20-F 2012 RemunerationDirectors’ attendance and fees 2012
| | | | | | | | | | | | | | | | | | | | | | | | | | | | Fees resolved by the
AGM 2012 | | | Number of Board/Committee
meetings attended | | Board member | | Board
fees1) | | | Committee
fees | | | Board | | | Audit
Committee | | | Finance
Committee | | | Remuneration
Committee | | Leif Johansson | | | 3,750,000 | | | | 400,000 | | | | 12 | | | | | | | | 7 | | | | 6 | | Sverker Martin-Löf | | | 875,000 | | | | 250,000 | | | | 12 | | | | 6 | | | | | | | | | | Jacob Wallenberg | | | 875,000 | | | | 175,000 | | | | 12 | | | | | | | | 5 | | | | | | Roxanne S. Austin | | | 875,000 | | | | 250,000 | | | | 11 | | | | 6 | | | | | | | | | | Sir Peter L. Bonfield | | | 875,000 | | | | 250,000 | | | | 12 | | | | 6 | | | | | | | | | | Börje Ekholm | | | 875,000 | | | | 175,000 | | | | 12 | | | | | | | | | | | | 6 | | Alexander Izosimov2) | | | 875,000 | | | | | | | | 8 | | | | | | | | | | | | | | Ulf J. Johansson | | | 875,000 | | | | 350,000 | | | | 12 | | | | 6 | | | | | | | | | | Nancy McKinstry | | | 875,000 | | | | 175,000 | | | | 11 | | | | | | | | | | | | 6 | | Anders Nyrén | | | 875,000 | | | | 175,000 | | | | 12 | | | | | | | | 7 | | | | | | Carl-Henric Svanberg3) | | | — | | | | | | | | 4 | | | | | | | | | | | | | | Hans Vestberg | | | — | | | | | | | | 12 | | | | | | | | | | | | | | Michelangelo Volpi | | | 875,000 | | | | | | | | 10 | | | | | | | | | | | | | | Pehr Claesson | | | 18,000 | 7) | | | | | | | 12 | | | | | | | | 7 | | | | | | Jan Hedlund4) | | | 6,000 | 7) | | | | | | | 4 | | | | 3 | | | | | | | | | | Karin Åberg | | | 18,000 | 7) | | | | | | | 12 | | | | | | | | | | | | 6 | | Kristina Davidsson5) | | | 18,000 | 7) | | | | | | | 12 | | | | 3 | | | | | | | | | | Rickard Fredriksson6) | | | 10,500 | 7) | | | | | | | 7 | | | | | | | | | | | | | | Karin Lennartsson | | | 18,000 | 7) | | | | | | | 12 | | | | | | | | | | | | | | Roger Svensson | | | 18,000 | 7) | | | | | | | 12 | | | | | | | | | | | | | | | | | | | | | | | | | | | | | | | | | | | | | | | Total number of meetings | | | | | | | | | | | 12 | | | | 6 | | | | 7 | | | | 6 | | | | | | | | | | | | | | | | | | | | | | | | | | |
| 1) | Non-employed Directors can choose to receive part of their Board fee (exclusive of Committee fees) in the form of synthetic shares. |
| 2) | Elected Board member as of May 3, 2012. |
| 3) | Resigned as Board member as of May 3, 2012. |
| 4) | Resigned as employee representative and from the Audit Committee as of May 3, 2012. |
| 5) | Member of the Audit Committee since May 3, 2012. |
| 6) | Appointed deputy employee representative as of May 3, 2012. |
| 7) | Employee representative Board members and their deputies are not entitled to a Board fee but compensation in the amount of SEK 1,500 per attended Board meeting. |
REMUNERATION TO BOARD MEMBERS Remuneration to Board members not employed by the Company is proposed by the Nomination Committee for resolution by the Annual General Meeting. ERICSSON ANNUAL REPORT ON FORM 20-F 2009
AGM. The Annual General Meeting 2009AGM 2012 approved the Nomination Committee’s proposal for fees to the non-employed Board members for Board and Committee work. For information on Board of Directors’ fees 2009,2012, please refer to Notes to the Consolidated Financial Statements—consolidated financial statements—Note C29C28 “Information Regarding Membersregarding members of the Board of Directors, the ManagementGroup management and employees” in the Annual Report. The Annual General Meeting 2009AGM 2012 also approved the Nomination Committee’s proposal that non-employed Board members may be paid part of their Board fee in the form of synthetic shares. A synthetic share gives the right to receive a future cash payment of an amount which corresponds to the market value of a Class B share in Ericsson at the time of payment. The director’s right to receive payment with regard to allocated synthetic shares occurs, as a main rule, after the publication of the Company’s year-end ERICSSON ANNUAL REPORT ON FORM 20-F 2012 financial statement during the fifth year following the General Meeting which resolved on the allocation of the synthetic shares. The purpose of paying part of the Board of Director’sDirectors’ fee in the form of synthetic shares is to further align the Directors’ interest with shareholder interest. For more information on the terms and conditions of the synthetic shares, please refer to the notice convening the Annual General Meeting 2009 (www.ericsson. com/ericsson/investors/shareholders/agm). (Information onAGM 2012 and to the Ericsson website does not form part of this document.)minutes from the AGM 2012, which are available at Ericsson’s website. DIRECTORS’ ATTENDANCE AND FEES 2009
| | | | | | | | | | | | | | | | Fees resolved by the
AGM 2009 | | | | Number of Board/Committee
meetings attended | Board member | | Board fees4) | | Committee fees | | Board | | Audit
Committee | | Finance
Committee | | Remuneration
Committee | Michael Treschow | | 3,750,000 | | 250,000 | | 14 | | | | 7 | | 7 | Sverker Martin-Löf1) | | 750,000 | | | | 14 | | 3 | | | | | Marcus Wallenberg | | 750,000 | | 125,000 | | 14 | | | | 7 | | | Roxanne S. Austin | | 750,000 | | 250,000 | | 13 | | 5 | | | | | Sir Peter L. Bonfield | | 750,000 | | 250,000 | | 14 | | 8 | | | | | Börje Ekholm | | 750,000 | | 125,000 | | 13 | | | | | | 7 | Ulf J. Johansson | | 750,000 | | 350,000 | | 13 | | 8 | | | | | Nancy McKinstry | | 750,000 | | 125,000 | | 14 | | | | | | 7 | Anders Nyrén | | 750,000 | | 125,000 | | 12 | | | | 7 | | | Carl-Henric Svanberg | | — | | | | 14 | | | | | | | Monica Bergström2) | | — | | | | 13 | | | | | | 1 | Jan Hedlund | | — | | | | 12 | | 6 | | | | | Pehr Claesson | | — | | | | 14 | | | | | | | Anna Guldstrand | | — | | | | 14 | | | | 7 | | | Kristina Davidsson | | — | | | | 14 | | | | | | | Karin Åberg3) | | — | | | | 13 | | | | | | 6 | | | | | | | | | | | | | | Total number of meetings | | | | | | 14 | | 8 | | 7 | | 7 | | | | | | | | | | | | | |
1) | Member of the Audit Committee until April 22, 2009 and thereafter replaced by Roxanne S. Austin |
2) | Deputy employee representative as of April 22, 2009. |
3) | Ordinary employee representative and member of the Remuneration Committee as of April 22, 2009 (replacing Monica Bergström). |
4) | Non-employed Directors can choose to receive part of their Board fee (i.e. exclusive of Committee fees) in the form of synthetic shares. |
MEMBERS OF THE BOARD OF DIRECTORS Board members elected by the Annual General Meeting 2009AGM 2012 Michael Treschow (firstLeif Johansson(first elected 2002)2011)
Chairman of the Board of Directors, Chairman of the Remuneration Committee Member and of the Finance Committee
ERICSSON ANNUAL REPORT ON FORM 20-F 2009
Born 1943,1951. Master of Science Lund Institutein Engineering, Chalmers University of Technology.Technology, Gothenburg, Sweden. Board Chairman:Unilever NV, and Unilever PLC.Board member:ABB Ltd Astra Zeneca PLC, European Round Table of Industrialists and the Knut and Alice WallenbergInternational Advisory Board of the Nobel Foundation.Holdings in Ericsson1):164,008 Class B shares. Principal work experienceBoard Member: Svenska Cellulosa Aktiebolaget SCA and other information: Board Chairman of the Confederation of Swedish Enterprise 2004–2007, President and CEO of AB Electrolux 1997–2002 and Chairman of its Board of Directors 2004–2007. Earlier positions include positions in Atlas Copco, where he served as President and CEO 1991–1997. Member of the Royal Academy of Engineering Sciences.Ecolean AB.
Marcus Wallenberg (first elected 1996)
Deputy Chairman of the Board of Directors
Chairman of the Finance Committee
Born 1956, Bachelor of Science of Foreign Service, Georgetown University, USA.Board Chairman:Skandinaviska Enskilda Banken, Saab AB and AB Electrolux.Honorary Chairman: International Chamber of Commerce (ICC).Board member:AstraZeneca PLC, Stora Enso Oy, the Knut and Alice Wallenberg Foundation and Temasek Holdings Limited.Holdings in Ericsson1): 1,200 Class A shares and 140,80017,933 Class B shares.
Principal work experience and other information: Positions in Investor AB, where he served as President of the Royal Swedish Academy of Engineering Sciences. President and CEO 1999–2005. Prior to this he wasof AB Volvo 1997-2011. Executive Vice President of AB Electrolux 1988-1991, President 1991-1994 and President and CEO of AB Electrolux 1994-1997. Holds honorary Doctorates at Investor. Previous employers include Stora Feldmühle AG, Citicorp, CitibankBlekinge Institute of Technology, the University of Gothenburg and Deutsche Bank.Chalmers University of Technology. Awarded the Large Gold Medal of the Royal Swedish Academy of Engineering Sciences in 2011. Sverker Martin-Löf (first(first elected 1993) Deputy Chairman of the Board of Directors, Member of the Audit Committee Born 1943,1943. Doctor of Technology and Master of Engineering, KTH Royal Institute of Technology, Stockholm.Stockholm, Sweden. Board Chairman:Skanska AB, Svenska Cellulosa Aktiebolaget SCA, SSAB and SSAB.Deputy Chairman: AB Industrivärdenrden. Board Member: Skanska AB and the Confederation of Swedish Enterprise.Board member:Svenska Handelsbanken.Handelsbanken AB. Holdings in Ericsson1): 10,400 Class B shares. Principal work experience and other information: President and CEO of Svenska Cellulosa Aktiebolaget SCA 1990–2002, where he was employed 1977–1983 and 1986–2002. Previous positions at Sunds Defibrator and Mo och Domsjö AB. Jacob Wallenberg(first elected 2011) Deputy Chairman of the Board of Directors, Member of the Finance Committee Born 1956. Bachelor of Science in Economics and Master of Business Administration, Wharton School, University of Pennsylvania, USA. Officer of the Reserve, Swedish Navy. Board Chairman:Investor AB. Deputy Board Chairman: SAS AB and SEB Skandinaviska Enskilda Banken AB (SEB). | 1) | The number of shares reflects ownership as of December 31, 2012 and includes holdings by related natural and legal persons, as well as holdings of any ADS, if applicable. |
ERICSSON ANNUAL REPORT ON FORM 20-F 2012 Board member:ABB Ltd, The Coca-Cola Company, The Knut and Alice Wallenberg Foundation and Stockholm School of Economics. Holdings in Ericsson1): 2,413 Class B shares. Principal work experience and other information: Chairman of the Board of Investor AB since 2005. Extensive experience in banking and finance, including experience from the commercial banks JP Morgan, New York and SEB. Appointed President and CEO of SEB in 1997 and appointed Chairman of SEB’s Board of Directors in 1998. Executive Vice President and CFO of Investor AB 1990-1993. Honorary Chairman of IBLAC (Mayor of Shanghai’s International Business Leaders Advisory Council) and member of The European Round Table of Industrialists. Roxanne S. Austin (first(first elected 2008) Member of the Audit Committee Born 1961, B.B.A.1961. Bachelor of Business Administration in Accounting, University of Texas, San Antonio, USA. Board member: Move Networks Inc.,Member: Abbott Laboratories, Teledyne Technologies Inc., and Target Corporation. Holdings in Ericsson1): 3,000 Class B shares. Principal work experience and other information: President and CEO of Move Networks Inc. since 2009. President of Austin Investment Advisors since 2004. President and CEO of DIRECTVMove Networks Inc. 2009–2010. President and COO of DirecTV 2001–2003. Corporate Senior Vice President and Chief Financial OfficerCFO of Hughes Electronics Corporation 1997–2000, which company she joined in 1993. Prior to joining Hughes, Roxanne Austin wasPreviously a partner at Deloitte & Touche. Member of the board of trustees of the California Science Center, member of the California State Society of Certified Public Accountants and the American Institute of Certified Public Accountants. 1) | The number of Class B shares (and Class A shares, if applicable) includes holdings by related natural or legal persons and American Depositary Receipts, where applicable. |
ERICSSON ANNUAL REPORT ON FORM 20-F 2009
Sir Peter L. Bonfield (first(first elected 2002) Member of the Audit Committee Born 1944,1944. Honors degree in Engineering, Loughborough University, Leicestershire, UK. Board Chairman: Supervisory Board of NXP.Deputy Chairman: British Quality Foundation.NXP Semiconductors N.V. Board member:Member: Mentor Graphics Inc., Sony Corporation and TSMC.Taiwan Semiconductor Manufacturing Company, Ltd. Holdings in Ericsson1)1):4,400 Class B shares. Principal work experience and other information:CEO and Chairman of the Executive Committee of British Telecommunications plc 1996–2002. Chairman and CEO of ICL PLC 1990–plc 1985–1996. Positions with STC PLCplc and Texas Instruments Inc. Member of the International Advisory Board of Citigroup. Member of the Advisory Boards of New Venture Partners LLP, Thethe Longreach Group and Apax Partners LLP. Non-executive Director of Actis Capital LLP. Board Mentor of CMi. Senior Advisor, Rothschild, London. Chair of Council and Senior Pro-Chancellor, Loughborough University, UK. Fellow of the Royal Academy of Engineering. Börje Ekholm (first(first elected 2006) Member of the Remuneration Committee Born 1963,1963. Master of Science in Electrical Engineering, KTH Royal Institute of Technology, Stockholm.Stockholm, Sweden. Master of Business Administration, INSEAD, France. | 1) | The number of shares reflects ownership as of December 31, 2012 and includes holdings by related natural and legal persons, as well as holdings of any ADS, if applicable. |
ERICSSON ANNUAL REPORT ON FORM 20-F 2012 Board member:Chairman: KTH Royal Institute of Technology, Stockholm and Nasdaq OMX Group Inc. Board Member: Investor AB, AB Chalmersinvest, EQT Partners AB and Husqvarna AB, Scania, KTH Holding AB, Lindorff Group AB and the Royal Institute of Technology, Stockholm.AB. Holdings in Ericsson1):21,760 30,760 Class B shares. Principal work experience and other information: President and CEO of Investor AB since 2005. Prior to this, he wasFormerly Head of Investor Growth Capital Inc. and New Investments. Previous positions at Novare Kapital AB and McKinsey & Co Inc. Alexander Izosimov(first elected 2012) Born 1964. Master of Business Administration, INSEAD, France and Master of Science in Production Management Systems and Computer Science, Moscow Aviation Institute, Russian Federation. Board Member: East Capital AB, Modern Times Group MTG AB, EVRAZ Group S.A., Dynasty Foundation, Transcom WorldWide SA and International Chamber of Commerce (ICC). Holdings in Ericsson1): 1,600 Class B shares. Principal work experience and other information: CEO and President of VimpelCom 2003-2011. Previous positions with Mars Inc., including Member of the Global Executive Board and Regional President for CIS, Central Europe and Nordics. Earlier positions with McKinsey & Co as consultant in the Stockholm and London offices. Served as GSMA Board member 2005-2008 and Chairman of GSMA 2008-2010. Ulf J. Johansson (first(first elected 2005) Chairman of the Audit Committee Born 1945,1945. Doctor of Technology and Master of Science in Electrical Engineering, KTH Royal Institute of Technology, Stockholm.Stockholm, Sweden. Board Chairman: Acando AB, Eurostep Group AB, Novo A/S, Novo Nordisk Foundation and Trimble Navigation Ltd. Board member:Member: Jump Tap Inc.European Institute of Innovation and Technology. Holdings in Ericsson1):6,435 Class B shares. Principal work experience and other information: Founder of Europolitan Vodafone AB, where he was the Chairman of the Board 1990–2005. Previous positions at Spectra-Physics AB as President and CEO and at Ericsson Radio Systems AB. Member of the Royal Academy of Engineering Sciences. Nancy McKinstry (first(first elected 2004) Member of the Remuneration Committee Born 1959,1959. Master of Business Administration in Finance and Marketing, Columbia University, USA. Bachelor of Arts in Economics, University of Rhode Island, USA. Board Chairman:CEO and Chairman of the Executive Board of Wolters Kluwer n.v. Board member:Member: The American Chamber of Commerce, TiasNimbas Business School.Abbott Laboratories and Sanoma Corporation. | 1) | The number of shares reflects ownership as of December 31, 2012 and includes holdings by related natural and legal persons, as well as holdings of any ADS, if applicable. |
ERICSSON ANNUAL REPORT ON FORM 20-F 2012 Holdings in Ericsson:Ericsson1): None. 4,000 Class B shares. Principal work experience and other information:CEO and Chairman of the Executive Board of Wolters Kluwer n.v., President and CEO of CCH Legal Information Services 1996–1999. Previous positions at Booz, Allen & Hamilton and New England Telephone Company. Member of the Advisory Board of the University of Rhode Island, the Advisory Council of the Amsterdam Institute of Finance, the Dutch Advisory Council of INSEAD, and the Board of Overseers of Columbia Business School.School and the Advisory Board of the Harrington School of Communication and Media. 1) | The number of Class B shares (and Class A shares, if applicable) includes holdings by related natural or legal persons and American Depositary Receipts, where applicable. |
ERICSSON ANNUAL REPORT ON FORM 20-F 2009
Anders Nyrén (first(first elected 2006) Member of the Finance Committee Born 1954,1954. Graduate of Stockholm School of Economics, Sweden, Master of Business Administration from Anderson School of Management, UCLA, USA. Board Chairman: Association of Exchange Listed Companies and Association for Generally Accepted Principles in the Securities Market.Sandvik AB. Deputy Board Chairman:Sandvik AB and Svenska Handelsbanken.Handelsbanken AB. Board member:Member:Svenska Cellulosa Aktiebolaget SCA, AB Industrivärden, SSAB, AB Volvo, Ernströmgruppen and AB Volvo.Stockholm School of Economics. Holdings in Ericsson1):6,686 Class B shares. Principal work experience and other information: President and CEO of Industrivärden since 2001. CFO and EVPExecutive Vice President of Skanska AB 1997–2001. Director Capital Markets of Nordbanken 1996–1997. CFO and EVP of Securum AB 1992–1996. Managing Director of OM International AB 1987–1992. Earlier positions at STC Scandinavian Trading Co AB and AB Wilhelm Becker. Carl-Henric Svanberg (firstHans Vestberg(first elected 2003)2010)
Born 1965. Bachelor of Business Administration and Economics, University of Uppsala, Sweden. Board Chairman: ST-Ericsson and Svenska Handbollförbundet. Born 1952, Master of Science, Linköping Institute of Technology. Bachelor of Science in Business Administration, University of Uppsala.Board member:Member:Sony Ericsson Mobile Communications AB and ST-Ericsson until end of 2009, the Confederation of Swedish Enterprise, Melker Schörling AB, Uppsala University and BP PLC. Thernlunds AB.
Holdings in Ericsson1):3,234,441 149,382 Class B shares. Principal work experience and other information: President and CEO of Telefonaktiebolaget LM Ericsson 2003–2009. Prior to this, Carl-Henric Svanberg was thesince January 1, 2010. Previously, First Executive Vice President, CFO and Head of Group Function Finance and Executive Vice President and CEOHead of Assa Abloy AB (1994–2003). He held variousBusiness Unit Global Services. Various positions within Securitas AB (1986–1994)in the Group since 1988, including Vice President and ABB Group (1977–1985). Carl-Henric Svanberg does not have material shareholdings or part ownershipsHead of Market Unit Mexico and Head of Finance and Control in companies with whichUSA, Brazil and Chile. International advisor to the Company has material business relationships. Board membersGovernor of Guangdong, China and deputies appointed byco-chairman of the unions
Jan Hedlund (first appointed 1994)
Employee representative
Russian-Swedish Business Council. Founding member of the Broadband Commission for Digital Development, and heading the Commission’s climate change working group. Member of the Audit CommitteeEuropean Cloud Partnership Steering Board and the Leadership Council of the United Nations Sustainable Development Solutions Network. | 1) | The number of shares reflects ownership as of December 31, 2012 and includes holdings by related natural and legal persons, as well as holdings of any ADS, if applicable. |
ERICSSON ANNUAL REPORT ON FORM 20-F 2012 Michelangelo Volpi(first elected 2010) Born 1966. Bachelor of Science in Mechanical Engineering and Masters in Manufacturing Systems Engineering from Stanford University, USA. MBA from the Stanford Graduate School of Business, USA. Board Member: EXOR S.p.A. Born 1946. Appointed by the IF Metall union.Holdings in Ericsson1): 735 Class B shares.None.
Anna Guldstrand (firstPrincipal work experience and other information: Partner at Index Ventures since July 2009. Previously CEO of Joost Inc. Various positions in Cisco from 1994-2007, including Senior Vice President and General Manager of the Routing and Service Provider Technology Group and Chief Strategy Officer. Has also worked for Hewlett Packard in the optoelectronics division.
Board members and deputies appointed 2004)by the unions Pehr Claesson(first appointed 2008) Employee representative, Member of the Finance Committee Born 1964. Appointed by the union The Swedish Association of Graduate Engineers.Holdings in Ericsson1): 1,373 Class B shares.
Karin Åberg (first appointed 2007)
Employee representative
Member of the Remuneration Committee
Born 1959. Appointed by the union Unionen.Holdings in Ericsson1): 1,596 Class B shares.
Kristina Davidsson (first appointed 2006)
Deputy employee representative
Born 1955. Appointed by the IF Metall union.Holdings in Ericsson1): 988 Class B shares.
1) | The number of Class B shares (and Class A shares, if applicable) includes holdings by related natural or legal persons and American Depositary Receipts, where applicable. |
ERICSSON ANNUAL REPORT ON FORM 20-F 2009
Pehr Claesson (first appointed 2008)
Deputy employee representative
Born 1966. Appointed by the union The Swedish Association of Graduate Engineers. Holdings in Ericsson1): 513999 Class B sharesshares. Employed since 1997. Working with marketing and communication for Consulting and Systems Integration within Business Unit Global Services. Monica Bergström (firstKristina Davidsson(first appointed 1998)2006)
Deputy employeeEmployee representative, Member of the Audit Committee
Born 1961.1955. Appointed by the union Unionen.IF Metall. Holdings in Ericsson1): 1,5081,629 Class B shares. Employed since 1995. Previously working as repairer within Business Unit Networks and currently working full time as union representative. Karin Åberg(first appointed 2007) Employee representative, Member of the Remuneration Committee Born 1959. Appointed by the union Unionen. Holdings in Ericsson1): 2,751 Class B shares. Employed since 1995. Working as a Service Engineer within the IT organization. Rickard Fredriksson(first appointed 2012) Deputy employee representative Born 1969. Appointed by the union IF Metall. Holdings in Ericsson1): 799 Class B shares. Carl-Henric SvanbergEmployed since 2000. Previously working as machine operator within Business Unit Networks and currently working full time as union representative.
| 1) | The number of shares reflects ownership as of December 31, 2012 and includes holdings by related natural and legal persons, as well as holdings of any ADS, if applicable. |
ERICSSON ANNUAL REPORT ON FORM 20-F 2012 Karin Lennartsson(first appointed 2010) Deputy employee representative Born 1957. Appointed by the union Unionen. Holdings in Ericsson1): 493 Class B shares. Employed since 1976. Working as Process Expert within Group Function Finance—Process Management. Roger Svensson(first appointed 2011) Deputy employee representative Born 1971. Appointed by the union The Swedish Association of Graduate Engineers. Holdings in Ericsson1): 7,710 Class B shares. Employed since 1999. Working as Senior Specialist Test Strategy Power Amplifier within Business Unit Networks. Hans Vestberg was the only Director who held an operational management position at Ericsson in 2009.2012. No Director has been elected pursuant to an arrangement or understanding with any major shareholder, customer, supplier or other person. At the Annual General Meeting 2012, Alexander Izosimov was elected new member of the Board of Directors, replacing Carl-Henric Svanberg. Jan Hedlund resigned as employee representative of the Board of Directors as of the date of the Annual General Meeting 2012 and Kristina Davidsson (previously deputy employee representative) was appointed employee representative as of the same date. Rickard Fredriksson was appointed new deputy employee representative as of the date of the Annual General Meeting 2012. COMPANY MANAGEMENT
The President/CEO and Group Managementthe Executive Leadership Team The Board of Directors appoints the President and CEO and the Executive Vice Presidents. The President and CEO is responsible for the management of day-to-day operations and is supported by the Group ManagementExecutive Leadership Team which, in addition to(the “ELT”). During 2012, the ELT consisted of the President and CEO, consists ofthe heads of Group functions, andthe heads of business units. units and the heads of two of Ericsson’s regions. The role of the Group Management TeamELT is to: Establish a long-term vision, a strong corporate culture, a long-term vision and groupGroup strategies and policies, all based on objectives stated by the Board.Board Determine targets for operational units, allocate resources and monitor unit performance.performance Secure operational excellence and realize global synergies through efficient organization of the Group. Remuneration of Group Managementto the Executive Leadership Team Guidelines onfor remuneration and other employment terms for Group Managementto the ELT were approved by the Annual General Meeting 2009.AGM 2012. For further information on remuneration, fixed and variable pay,remuneration, see the Remuneration Reportreport and Notes to the Consolidated Financial Statements—consolidated financial statements—Note C29,C28, “Information Regarding Membersregarding members of the Board of Directors, the ManagementGroup management and Employees”employees” in the Annual Report. | 1) | The number of shares reflects ownership as of December 31, 2012 and includes holdings by related natural and legal persons, as well as holdings of any ADS, if applicable. |
ERICSSON ANNUAL REPORT ON FORM 20-F 2012 The Ericsson Group Management System The CEO and heads of Group functions have implementedEricsson has a global management system, the Ericsson Group Management System (EGMS) to drive corporate culture and to ensure that the business is managed:
so thatTo fulfill the objectives of Ericsson’s major stakeholders (customers, shareholders, employees) are fulfilled,
withinWithin established risk limits and with reliable internal control
so that the Company is compliantIn compliance with relevant applicable laws, listing requirements, and governance codes and fulfills its corporate social responsibilities.
1) | The number of Class B shares (and Class A shares, if applicable) includes holdings by related natural or legal persons and American Depositary Receipts, where applicable. |
ERICSSON ANNUAL REPORT ON FORM 20-F 2009
EricssonThe EGMS is founded on ISO 9001 (International Standard for Quality management system) but is designed as a dynamic governance system, enabling Ericsson to adapt the system to evolving demands and ISO 14001 certified.expectations, including new legislation as well as customers’ and other stakeholders’ requirements. The management system is an important foundation and is continuously evaluated and improved in line withimproved.
Certificates are evidence from an independent body verifying that the operations fulfill defined requirements. As the EGMS is a global system, group-wide certificates can be issued by a third party certification body proving that the system is efficient throughout the whole organization. Ericsson is currently globally certified to ISO requirements.9001 (Quality), ISO 14001 (Environment) and OHSAS 18001 (Health & Safety). Selected Ericsson units are also certified to additional standards, for example ISO 27001 (Information Security) and TL 9000 (telecom-specific standard). The Ericsson Group Management SystemEGMS comprises three elements: Management and control; i.e. corporate culture, objective setting and strategy formulation, and steering documents, such as Group policies and directives.control OperationalEricsson business processes and IT tools, to support operational excellence and leverage Ericsson’s scale advantages.
Organization and resources. Risk management is an integrated part
ERICSSON ANNUAL REPORT ON FORM 20-F 2012 Management and control Ericsson’s strategy and target setting processes consider the demands and expectations of customers as well as other key stakeholders. The process facilitates the alignment of objectives and their measurement in activities at all levels of the Ericsson Group Management System. Management and controlorganization.
Ericsson uses balanced scorecards as tools for translating strategic objectives into a set of performance indicators for its operatingoperational units. These focus primarily on market and customer performance, competitive position, internal efficiency, financial performance and employee satisfaction and empowerment. Based on the annual strategy work, these scorecards are updated with targets for each unit for the next year and are communicated throughout the organization. The balanced scorecard is also used as a management tool to align operating unit and personal goals to Company goals, follow up progress and monitor identified risks. Corporate culture has long been acknowledged as an important factor for driving behavior, not only for compliance but also in communication, decision making, efficiency and the reaching of objectives. Respect, professionalism and perseverance are the values that underpin Ericsson’s culture, guiding daily work, relationships and business. Consequently, executive management makes the communication and development of Ericsson’s culture a key task in the management of the Group.
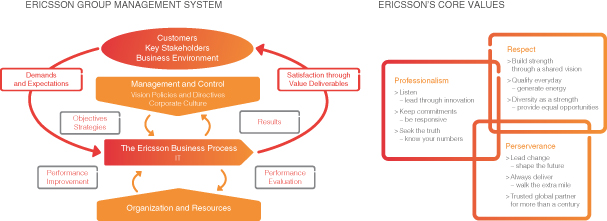
Group-wide policies and directives govern how the organization works. Theseworks and are core elements in managing and controlling Ericsson. The Group Policies and Directives include important areas, such as a codeCode of business ethics,Business Ethics, a Code of Conduct and accounting and reporting directives to fulfill external reporting requirements and the Sarbanes-Oxley Act. The Group Steering Documents Committee works to ensure that the policies on roles and responsibilities, segregation of duties, capital expenditures, management of intellectual property rights, financial reporting, environmental matters,directives cover relevant issues; that they are aligned and risk management. ERICSSON ANNUAL REPORT ON FORM 20-F 2009
consistent with Group strategies, values and structures; and that they are not in conflict with legal and regulatory requirements. In addition, the Group Steering Documents Committee works to ensure that the said strategies, values and structures are implemented by the responsible function. Operational Processes and IT toolsEricsson business processes
As a leading vendor,market leader, Ericsson tries to utilizeutilizes the competitive advantages that are gained through global scale and has implemented common processes and IT tools across all its operating units.operational units worldwide. Customer requirements are identified, clarified and formalized in Ericsson Business Processes where requirements transform from theory to reality. Through management and continuous improvement of these processes and IT tools, Ericsson reducesattempts to reduce costs with efficient and effective process flows and with standardized internal controls and performance indicators. Organization and resources Ericsson is operated in two dimensions: one operational structure and one legal structure. Legal entities: more than 200 companies in more than 100 countries, eachThe operational structure aligns accountability and authority regardless of country borders and supports the process flow with a board of directors, in many cases also with local non-Ericsson employee members. Ericsson also operates through two joint ventures.
Operational units:cross-country operations. During 2012 there were four business units (4) and market units (23).
In addition,ten regions. Group functions coordinate Ericsson’s strategies, operations and resource allocation and define the necessary directives, processes and organization for the effective governance of the Group.
The legal structure is the basis for legal requirements and responsibility as well as for tax and statutory reporting purposes. There are more than 200 legal entities within the Ericsson Group with representation (via legal entities, branch and representative offices) in more than 140 countries. Risk management Ericsson’s risk management is integrated with the business and its operational processes, and is a part of the EGMS to ensure accountability, effectiveness, efficiency, business continuity and compliance with corporate governance, legal and other requirements. The Board of Directors is also actively engaged in the Company’s risk management. Risks related to set long-term objectives are discussed and strategies are formally approved by the Board as part of the annual strategy process. Risks related to annual targets for the Company are also reviewed by the Board and then monitored continuously during the year. Certain transactional risks require specific Board approval, e.g. acquisitions, management remuneration, borrowing or customer finance in excess of pre-defined limits. ERICSSON ANNUAL REPORT ON FORM 20-F 2012 Strategic and tactical risks Strategic risks constitute the highest risk to the Company if not managed properly as they could have a long-term impact. Ericsson therefore reviews its long-term objectives, main strategies and business scope on an annual basis and continuously works on its tactics to reach these objectives and to mitigate any risks identified. In the annual strategy and target setting process, objectives are set for the next three to five years. Risks and opportunities are assessed and strategies are developed to achieve the objectives. The strategy process in the Company is well established and involves regions, business units and Group functions. The strategy is finally summarized and discussed in a yearly Global Leadership Summit with approximately 250 leaders from all parts of the business. By involving all parts of the business in the process, potential risks are identified early and mitigating actions can be incorporated in the strategy and in the annual target process following the finalization of the strategy. Technology development, industry and market fundamentals and the development of the economy are key components in the evaluation of risks related to Ericsson’s long-term objectives. The outcome from the strategy process forms the basis for the annual target process, which involves regions, business units and Group functions. Risks and opportunities linked to the targets are identified as part of this process together with actions to mitigate the identified risks. Follow-up of targets, risks and mitigating actions are reported and discussed continuously in business unit and region steering groups and are reviewed by the Board of Directors. Ericsson continuously strives to improve its risk management and believes that it is important that the entire global organization takes part in the risk management and strategy work. Therefore, risk management was given a stronger focus in 2012. During the year, an enhanced risk management framework was implemented and aligned with the Strategy and Target setting process. Risks were identified and analyzed in four categories: industry & market risks, commercial risks, operational risks and compliance risks. For more information on risks related to Ericsson’s organization,business, see the chapter “Information on the Company”“Risk factors” in the Annual Report. RiskStrategic, target setting and risk management cycle
Risks are broadly categorized into operationalThe annual strategic, target setting and risk management cycle is part of Ericsson’s strategy process, which is well established within the Group and involves regions, business units and Group functions.
ERICSSON ANNUAL REPORT ON FORM 20-F 2012 Operational and financial risks. Ericsson’s risk management is based on the following principles, which apply universally across all business activitiesrisks Operational risks are owned and risk types: managed by operational units. Risk management is an integrated part of the Ericsson Group Management System. Each operational unit is accountable for owning and managing its risks according to policies, directives and process tools. Decisions are made or escalated according to a well-defined delegation of authority. Financial risks are coordinated through Group Function Finance.
Risks are dealt with during the strategy process, the annual planning and target setting and during operational processes by transaction (customer bid/contract, acquisition, investment, product development project). They are subject toembedded in various process controls, such as decision tollgates and approvals.
A central security unit coordinates management of certain Certain cross-process risks are centrally coordinated, such as information security, IT security, corporate responsibility and business interruption, information security/ITcontinuity and physical security. A Crisis Management Council deals with ad-hoc events ofinsurable risks. Financial risk management is governed by a serious nature.
Group policy and carried out by the Treasury and Customer Finance functions, both supervised by the Finance Committee. The policy governs risk exposures related to foreign exchange, liquidity/financing, interest rates, credit risk and market price risk in equity instruments. For morefurther information on Ericsson’sfinancial risk management, see Notes to the “Board of Directors’ Report”consolidated financial statements—Note C14, “Trade receivables and customer finance”, Note C19, “Interest-bearing liabilities” and Note C20, “Financial risk management and financial instruments” in the Annual Report. Compliance risks Ericsson has implemented Group policies and directives in order to comply with applicable laws and regulations, including a Code of Business Ethics and a Code of Conduct. Risk management is integrated in the Company’s business processes. Policies and controls are implemented to comply with financial reporting standards and stock market regulations, such as the US Sarbanes-Oxley Act. Compliance officer Ericsson has a Chief Compliance Officer (CCO) whose responsibilities include providing support for compliance with laws, regulations, internal policies and directives, coordinating the different strands of expertise within Ericsson. Attention from senior-management level on compliance matters is crucial, as is ensuring that this is addressed from a cross-functional perspective. Initially, the CCO’s primary focus has been to further develop Ericsson’s Anti-corruption Compliance Program. This is reviewed and evaluated by the Audit Committee at least annually. Monitoring and audits Company management monitors compliance with policies, directives and processes through internal self-assessment within all units. This is complemented by internal and external audits. External financial audits are performed by PricewaterhouseCoopers, and ISO/ management system audits by Intertek. Internal audits are performed by the company’s internal audit function which reports to the Audit Committee. Audits of suppliers are also conducted in order to secure compliance with Ericsson’s Code of Conduct, which is mandatory for suppliers to the Ericsson Group. Risk mitigation Significant ongoing activities in order to mitigate risks include: Establishing flexibility to cost-effectively accommodate to fluctuations in customer demand Conducting regular Supplier Code of Conduct audits Continuous assessment and management of CR risks Conducting business continuity management in an efficient way Conducting corporate governance training as needed Continuous monitoring of information systems to guard against data breaches Reviewing top risks and mitigating actions at various internal governance meetings. ERICSSON ANNUAL REPORT ON FORM 20-F 2012
Example of risk heat map document Risk heat maps are generated by business units, regions and Group functions in four risk categories:
MEMBERS OF THE GROUP MANAGEMENTEXECUTIVE LEADERSHIP TEAM Carl-Henric SvanbergHans Vestberg
President and CEO until December 31, 2009 and member of the Board of Directors (since 2003)2010) Born 1952, Master of Science, Linköping Institute of Technology, 1965. Bachelor of Science in Business Administration and Economics, University of Uppsala. Carl-Henric Svanberg holds honorary doctorates at Luleå University ofUppsala, Sweden. Board Chairman: ST-Ericsson and Svenska Handbollförbundet. ERICSSON ANNUAL REPORT ON FORM 20-F 20092012 Technology and Linköping University of Technology.Board member: SonyTelefonaktiebolaget LM Ericsson Mobile Communications AB and ST-Ericsson until end of 2009, the Confederation of Swedish Enterprise, Melker Schörling AB, Uppsala University and BP PLC.Thernlunds AB.
Holdings in Ericsson1): 3,234,441149,382 Class B shares. Background: President and CEO of Assa Abloy AB (1994–2003). Various positions within Securitas AB (1986–1994) and ABB Group (1977–1985). Hans Vestberg
Previously First Executive Vice President, until December 31, 2009. President and CEO as of January 1, 2010. Born 1965, Bachelor of Business Administration and Economics, University of Uppsala.Board member: Sony Ericsson Mobile Communications AB, Chairman of ST-Ericsson and Svenska Handbollsförbundet.Holdings in Ericsson1):39,825 Class B shares.
Background: Hans Vestberg was Chief Financial OfficerCFO and Head of Group Function Finance until October 31, 2009. Prior to these positions Hans Vestberg wasand Executive Vice President and Head of Business Unit Global Services. He has held variousVarious positions in the CompanyGroup since 1988, including Vice President and Head of Market Unit Mexico and Head of Finance and Control in USA, Brazil and Chile. International advisor to the Governor of Guangdong, China and co-chairman of the Russian-Swedish Business Council. Founding member of the Broadband Commission for Digital Development, and heading the Commission’s broadband and climate change working group. Member of the European Cloud Partnership Steering Board and the Leadership Council of the United Nations Sustainable Development Solutions Network.
Jan Frykhammar Executive Vice President and Chief Financial OficerOfficer and Head of Group Function Finance (since November 1, 2009) and Head of Business Unit Global Services (since 2008) Born 1965. Bachelor of Business Administration and Economics, University of Uppsala.Uppsala, Sweden. Board member: ST-Ericsson and the Swedish International Chamber of Commerce. Holdings in Ericsson1): 2,30714,844 Class B shares. Background: Jan Frykhammar has held variousPreviously Senior Vice President and Head of Business Unit Global Services. Various positions within Ericsson such asincluding Sales and Business Control in Business Unit Global Services, CFO in North America and Vice President, Finance and Commercial within the Global Customer Account Vodafone. Johan WiberghMagnus Mandersson
Executive Vice President (as of January 1, 2010)(since 2011) and Head of Business Unit NetworksGlobal Services (since 2008)2010) Born 1959. Bachelor of Business Administration, University of Lund, Sweden. Board member: None. Born 1963. Master of Computer Science, Linköping Institute of Technology.Holdings in Ericsson1): 14,02422,602 Class B shares.
Background: Prior to assuming these positions, Previously Head of Business Unit CDMA, Market Unit Northern Europe, Global Customer Account Deutsche Telekom AG and Product Area Managed Services. Has also been President and CEO of SEC/ Tele2 Europe and COO of Millicom International Cellular S.A. Johan Wibergh was Executive Vice President (since 2010) and Head of Business Unit Networks (since 2008) Born 1963. Master of Computer Science, Linköping Institute of Technology, Sweden. | 1) | The number of shares reflects ownership as of December 31, 2012 and includes holdings by related natural and legal persons, as well as holdings of any ADS, if applicable. |
ERICSSON ANNUAL REPORT ON FORM 20-F 2012 Board member: ST-Ericsson, Confederation of Swedish Enterprise, KTH Royal Institute of Technology and Teknikföretagen. Holdings in Ericsson1): 40,448 Class B shares. Background: President of Ericsson Brazil. He has also beenBrazil, President of Market Unit Nordic and Baltics and Vice President and Head of Sales at Business Unit Global Services. Per Borgklint Senior Vice President and Head of Business Unit Support Solutions (since 2011) Born 1972. Master of Science in Business Administration, Jönköping International Business School, Sweden. Board member:None. Holdings in Ericsson1): None. Background: Previously CEO of Net1 (Ice.net), Canal Plus Nordic and Versatel. Has also held several leading positions at Tele2. Bina Chaurasia Senior Vice President, Chief Human Resources Officer and Head of Group Function Human Resources and Organization (since 2010) Born 1962. Master of Science in Management and Human Resources, Ohio State University, USA, and Master of Arts in Philosophy, University of Wisconsin, USA. Holdings in Ericsson1): 19,144 Class B shares. Background: Joined Ericsson from Hewlett Packard, where she was Vice President of Global Talent Management. Has held senior HR leadership roles at Gap, Sun Microsystems and PepsiCo/Yum. Ulf Ewaldsson Senior Vice President, Chief Technology Officer and Head of Group Function Technology(since February 1, 2012) Born 1965. Master of Science in Engineering and Business Management, Linköping Institute of Technology, Sweden. Board member: None. | 1) | The number of shares reflects ownership as of December 31, 2012 and includes holdings by related natural and legal persons, as well as holdings of any ADS, if applicable. |
ERICSSON ANNUAL REPORT ON FORM 20-F 2012 Holdings in Ericsson1): 14,985 Class B shares. Background: Previously Head of Product Area Radio within Business Unit Networks. Has held various managerial positions within Ericsson since 1990. Douglas L. Gilstrap Senior Vice President and Head of Group Function Strategy(since 2009) Born 1963. Bachelor of Science in Accounting, University of Richmond, USA, and Master of Business Administration, Emory University, Atlanta, USA. Executive program at INSEAD, France. Board member: Telecom Management Forum (TMF). Deputy board member: ST-Ericsson. Holdings in Ericsson1): 8,643 Class B shares. Background: Has held various global managerial positions within the telecommunications sector for more than 15 years. Nina Macpherson Senior Vice President, General Counsel, Head of Group Function Legal Affairs and secretary to the Board of Directors(since 2011) Born 1958. Master of Laws, LL M, University of Stockholm, Sweden. Board member: The Association for Swedish Listed Companies. Holdings in Ericsson1): 7,857 Class B shares. Background: Previously Vice President and Deputy Head of Group Function Legal Affairs at Ericsson. Previous positions also include private practice and in-house attorney. Member of the Swedish Securities Council. Helena Norrman Senior Vice President and Head of Group Function Communications(since 2011) Born 1970. Master of International Business Administration, Linköping University, Sweden. Board member: None. Holdings in Ericsson1): 8,312 Class B shares. Background: Previously Vice President, Communications Operations at Group Function Communications at Ericsson. Has held various positions within Ericsson’s global communications organization since 1998. Previous positions as communications consultant. Mats H. Olsson Head of Region North East Asia(since 2010) Born 1954. | 1) | The number of shares reflects ownership as of December 31, 2012 and includes holdings by related natural and legal persons, as well as holdings of any ADS, if applicable. |
ERICSSON ANNUAL REPORT ON FORM 20-F 2012 Master of Business Administration, Stockholm School of Economics, Sweden. Board member: None. Holdings in Ericsson1): 61,252 Class B shares. Background: International economic advisor to a number of Chinese provincial and municipal governments. Previously Head of Market Unit Greater China. Appointed President of Ericsson Greater China in 2004, with overall responsibility for mainland China, Hong Kong, Macao and Taiwan. Also assumed overall responsibility for Japan and South Korea in 2010. Has held various executive positions across Asia-Pacific over the last 25 years. Rima Qureshi Senior Vice President and Head of Business Unit CDMA Mobile Systems(since 2010) Born 1965. Bachelor of Information Systems and Master of Business Administration, McGill University, Montreal, Canada. Board member: MasterCard Incorporated. Holdings in Ericsson1): 4,932 Class B shares. Background: Also serves as Head of Ericsson Response. Previously Vice President of Strategic Improvement Program and Vice President Product Area Customer Support. Has held various positions within Ericsson since 1993. Angel Ruiz Head of Region North America(since 2010) Born 1956. Bachelor of Electrical Engineering, University of Central Florida, USA, and Master of Management Science and Information Systems, Johns Hopkins University, USA. Board member: CTIA. Holdings in Ericsson1): 38,546 Class B shares. Background: Joined Ericsson in 1990 and has held a variety of technical, sales and managerial positions within the Company, including heading up the global account teams for Cingular/SBC/BellSouth (now AT&T). Was appointed President of Ericsson North America in 2001. Jan Wäreby Senior Vice President and Head of Sales and Marketing(since 2011) Born 1956. Master of Science, Chalmers University, Gothenburg, Sweden. Board member: ST-Ericsson. | 1) | The number of shares reflects ownership as of December 31, 2012 and includes holdings by related natural and legal persons, as well as holdings of any ADS, if applicable. |
ERICSSON ANNUAL REPORT ON FORM 20-F 2012 Holdings in Ericsson1): 66,495 Class B shares. Background: Senior Vice President and Head of Business Unit Multimedia (since 2007) Born 1956, Master of Science, Chalmers University, Göteborg.Board member: Sony Ericsson Mobile Communications AB, ST-Ericsson, LHS Telekommunikation.Holdings in Ericsson1): 41,733 Class B shares.
1) | The number of Class B shares (and Class A shares, if applicable) includes holdings by related natural or legal persons. Options and matching rights are reported in Notes to the Consolidated Financial Statements—Note C29, “Information Regarding Members of the Board of Directors, the Management and employees” in the Annual Report. |
ERICSSON ANNUAL REPORT ON FORM 20-F 2009
Background: From 2002 to 2006, Jan Wäreby was Executive Vice President and Head of Sales and Marketing for Sony Ericsson Mobile Communications.
Magnus Mandersson
Senior Vice President and Head of Business Unit CDMA (since November 2009)
Born 1959, Bachelor of Business Administration, University of Lund.Holdings in Ericsson1): 5,146 Class B shares.
Background:Prior to assuming this position, Magnus Mandersson was Head of Market Unit Northern Europe and Global Customer Account Deutsche Telekom AG.
Cesare Avenia
Chief Brand Officer (since November 2009) and Head of Market Unit South East Europe (since 2006)
Born 1950, Bachelor’s degree of science, Tele Communication, University of Naples, Italy.Board member: Ericsson Telecomunicazioni S.P.A. and sole Director in Ericsson Network Services Italia S.P.A.Holdings in Ericsson1):10,913 Class B shares.
Background:Prior to assuming these positions he was Head of Market Unit Italy.
Carl Olof Blomqvist
Senior Vice President, General Counsel and Head of Group Function Legal Affairs (since 1999)
Born 1951, Master of Law, LLM, University of Uppsala.Board member:Aktiemarknadsbolagens Förening and the Swedish Securities Council (since 2010).Holdings in Ericsson1): 1,216 Class A shares and 31,839 Class B shares.
Background: Prior to assuming this position, Carl Olof Blomqvist was a partner of Mannheimer Swartling law firm.
Up until January 31, 2012, Håkan Eriksson, former Senior Vice President, Chief Technology Officer and Head of Group Function Technology & Portfolio Management, (since 2003). As of January 1, 2010 also Head of Ericsson Silicon Valley. Born 1961, Master of Science and Honorary Ph D, Linköping Institute of Technology.Board member:Linköping University, Anoto, Vestas, Stockholm Chamber of Commerce.Holdings in Ericsson1): 25,500 Class B shares.
Background: Prior to assuming these positions, Håkan Eriksson was Senior Vice President and Head of Research and Development. He has held various positions within Ericsson since 1986.
1) | The number of Class B shares (and Class A shares, if applicable) includes holdings by related natural or legal persons. Options and matching rights are reported in Notes to the Consolidated Financial Statements—Note C29, “Information Regarding Members of the Board of Directors, the Management and employees” in the Annual Report. |
ERICSSON ANNUAL REPORT ON FORM 20-F 2009
Douglas L. Gilstrap
Senior Vice President and Head of Group Function Strategy (since September 2009)
Born 1963, Master of Business Administration, Emory University, Atlanta.Holdings in Ericsson1): 385 Class B shares.
Background:Prior to assuming this position, Douglas L. Gilstrap held senior management positions at Equant Networks and Cable and Wireless.
Marita Hellberg
Senior Vice President and Head of Group Function Human Resources and Organization (since 2003)
Born 1955, Bachelor of Human Resources Management, Stockholm University, Advanced Management Program, Cedep, France.Board member: Utbildningsradion.Holdings in Ericsson1): 29,554 Class B shares.
Background: Prior to assuming this position, Marita Hellberg was Senior Vice President of Human Resources of the NCC Group.
Torbjörn Possne
Senior Vice President and Head of Group Function Sales and Marketing (since 2008)
Born 1953. Master of Science, Royal Institute of Technology, Stockholm.Holdings in Ericsson1): 21,874 Class B shares.
Background: Prior to assuming this position, Torbjörn Possne was Head of Market Unit Northern Europe and Global Customer Account Deutsche Telekom. He has held various positions within Ericsson since 1979.
Henry Sténson
Senior Vice President and Head of Group Function Communications (since 2002)
Born 1955, Studied law, sociology and political science, Linköping University and at the Swedish War Academy, Karlberg, Stockholm.Board member: Stronghold.Holdings in Ericsson1): 22,729 Class B shares.
Background: Prior to assuming this position, Henry Sténson was Head of SAS Group Communication.
Up to August 31, 2009, Bert Nordberg was Executive Vice President and Chairman of Redback and Entrisphere, and also Head of Ericsson Silicon Valley and a member of the Group Management Team of the Company. Bert Nordberg joined Sony Ericsson as Co-President on September 1, 2009, to become its President as of October 15, 2009.Executive Leadership Team.
AUDITORSAUDITOR
According to the Articles of Association, the Parent Company shall have no less than one and no more than three registered public accounting firms as external independent auditors. The auditors are elected byauditor. Pursuant to the shareholders atSwedish Companies Act, the Annual General Meetingmandate period of an auditor shall be one year, unless the Articles of Association provide for a longer mandate period ofup to four years. The auditors reportauditor reports to the shareholders at General Meetings. 1) | The number of Class B shares (and Class A shares, if applicable) includes holdings by related natural or legal persons. Options and matching rights are reported in Notes to the Consolidated Financial Statements—Note C29, “Information Regarding Members of the Board of Directors, the Management and Employees” in the Annual Report. |
ERICSSON ANNUAL REPORT ON FORM 20-F 2009
The auditors:duties of the auditor include the following: UpdateUpdating the Board of Directors regarding the planning, scope and content of the annual audit.audit
ExamineExamining the interim and year-end financial statements to assess accuracy and completeness of the accounts and adherence to accounting proceduresstandards and principles.policies
AdviseAdvising the Board of Directors of non-audit services performed, the consideration paid and other issues that determine the auditors’auditor’s independence.
For further information on the contacts between the Board and the auditors,auditor, please see “Work of the Board of Directors” earlier in the report.this Corporate Governance Report. All Ericsson’s quarterly financial reports are reviewed by the auditors.auditor. Current auditor PricewaterhouseCoopers AB was elected auditor at the Annual General Meeting 2007AGM 2012 for a period of four yearsone year, i.e. until the close of the Annual General Meeting 2011.AGM 2013. PricewaterhouseCoopers AB has appointed Peter Clemedtson,Nyllinge, Authorized Public Accountant, to serve as auditor in charge. Peter Clemedtson is also auditor in charge of Skandinaviska Enskilda Banken. Fees to the auditor Ericsson paid the fees (including expenses) for audit-related and other services listed in the table in Notes to the Consolidated Financial Statements—consolidated financial statements—Note C31,C30, “Fees to Auditors”auditors” in the Annual Report. INTERNAL CONTROL OVER FINANCIAL REPORTING 20092012 This section has been prepared in accordance with the Annual Accounts Act and the Swedish Code of Corporate Governance section 10.5,Code and is limited to internal control over financial reporting. Since Ericsson is listed in the United States, the requirements outlined in the Sarbanes-Oxley Act (SOX) apply. These regulate the establishment and maintenance of internal controls over financial reporting and alsoas well as management’s assessment of the effectiveness of the controls. In order to comply withsupport high quality reporting and to meet the requirement of SOX, the Company has implemented detailed documented controls as well as documentation,and testing and reporting procedures in accordance withbased on the internationally established COSO framework for internal control. The COSO framework is issued by the Committee of Sponsoring Organizations of the Treadway Commission. Commission (COSO). ERICSSON ANNUAL REPORT ON FORM 20-F 2012 Management’s internal control report according to SOX will beis included in Ericsson’sthis Annual Report on Form 20-F and filed with the SEC in the United States. During 2009,2012, the Company has included operations of acquired entities as well as continued to improve the design and execution of its financial reporting controls as well as include operations in acquired entities.controls. Disclosure policies Ericsson’s financial disclosure policies aim to ensure transparent, relevant and consistent communication with the equity and debt investors on a fair and equal basis. This will support a fair market value for Ericsson shares.securities. Ericsson wants current and potential investors to have a good understanding of how the Company works, including operational performance, prospects and potential risks. To achieve these objectives, financial reporting and disclosure must be: Transparent—enhanceenhancing understanding of the economic drivers and operational performance of the business, hence buildbuilding trust and credibility.credibility ERICSSON ANNUAL REPORT ON FORM 20-F 2009
Consistent—comparable in scope and level of detail to facilitate comparison between reporting periods.periods Simple—to support understanding of business operations and performance and to avoid misinterpretations.misinterpretations Relevant—with focus on what is relevant to Ericsson’s stakeholders or required by regulation or listing agreements, to avoid information overload.overload Timely—with regular scheduled disclosures as well as ad-hoc information, such as press releases on important events, performed onin a timely basis.manner Fair and equal—where all material information is published via press releases to ensure that the whole investor community receives the information at the same time.time Complete, free from material errors and a reflection of best practice—disclosure is compliant with applicable financial reporting standards and listing requirements and in line with industry norms. Ericsson’s website (www.ericsson.com/investors) includescomprises comprehensive information on the Group, including anincluding: An archive of annual and interim reports on-demand On-demand access to recent news and copies Copies of presentations given by senior management at industry conferences. (Information on the Ericsson website does not form part of this document.) Disclosure controls and procedures Ericsson has controls and procedures in place to ensureallow for timely information disclosure under applicable laws and regulations, including the U.S.US Securities Exchange Act of 1934, and under agreements with NASDAQ OMX Stockholm and NASDAQ OMX Stockholm.New York. These procedures also ensurerequire that such information is provided to management, including the CEO and CFO, so timely decisions can be made regarding required disclosure. AThe Disclosure Committee comprising 15comprises members with various expertiseexpertise. It assists managers in fulfilling their responsibility regarding disclosures made to the shareholders and the investment community. One of the main tasks of the committee is to monitor the integrity and effectiveness of the disclosure controls and procedures.
Ericsson has investments in certain entities that the Company does not control or manage. With respect to such entities, disclosure controls and procedures are substantially more limited than those maintained with respect to subsidiaries. ERICSSON ANNUAL REPORT ON FORM 20-F 2012 During the year, Ericsson’s President and CEO and the CFO evaluated the disclosure controls and procedures and concluded that they were effective at a reasonable assurance level as at December 31, 2009. During the period covered by the Annual Report 2009, there were no changes to the disclosure controls and procedures that have materially affected, or are likely to materially affect, the internal control over financial reporting.2012.
Internal control over financial reporting Ericsson has integrated risk management and internal control into its business processes. As defined in the COSO framework, internal control includesis an aggregation of components such as a control environment, risk assessment, control activities, information and communication and monitoring. Changes in Internal Control over Financial Reporting
ThereDuring the period covered by the Annual Report 2012, there were no changes in Ericsson’sto the internal control over financial reporting that occurred during the year ended December 31, 2009, that have materially affected, or are reasonably likely to materially affect, the Group’s
ERICSSON ANNUAL REPORT ON FORM 20-F 2009
internal control over financial reporting during 2009. On November 13, 2009, Ericsson completed the acquisition of the Nortel operation. The Nortel operation is part of the Network segment and Ericsson is in the process of integrating the Nortel operation into the Ericsson internal control environment.reporting. Control environment The Company’s internal control structure is based on the division of labortasks between the Board of Directors and its Committees and the President and CEO. The Company has implemented a management system that is based on: Steering documents, such as policies, directives and a codeCode of business ethics, and aBusiness Ethics A strong corporate culture.culture The Company’s organization and mode of operations, with well-defined roles and responsibilities and delegations of authority.authority Several well-defined group-wideGroup-wide processes for planning, operations and support. The most essential parts of the control environment relative to financial reporting are included in steering documents and processes for accounting and financial reporting. These steering documents are updated regularly to include, among other things, changesthings: Changes to laws financial Financial reporting standards and listing requirements, such as IFRS and SOX. The processes include specific controls to be performed to ensure high quality financial reports. EachThe management of each reporting legal entity, market unitregion and business unit hasis supported by a financial controller function supporting the entity management with execution of controls related to transactions and reporting. The financial controller functions are organized in a number of Company Control Hubs, each supporting a number of legal entities within a geographical area. A financial controller function is also established on groupGroup level, reporting to the CFO. Risk assessment Risks of material misstatements in financial reporting may occurexist in relation to recognition and measurement of assets, liabilities, revenue and cost or insufficient disclosure. Other risks related to financial reporting include fraud, loss or embezzlement of assets and undue favorable treatment of counterparties at the expense of the Company. Policies and directives regarding accounting and financial reporting cover areas of particular significance to support correct, complete and timely accounting, reporting and disclosure. Identified types of risks are mitigated through well definedwell-defined business processes with integrated risk management activities, and segregation of duties and appropriate delegation of authority. This requires specific approval of material transactions and ensures adequate asset management. ERICSSON ANNUAL REPORT ON FORM 20-F 2012 Control activities The Company’s business processes include financial controls regarding the approval and accounting of business transactions. The financial closing and reporting process has controls regarding recognition, measurement and disclosure. These include the application of critical accounting policies and estimates, in individual subsidiaries as well as in the consolidated accounts. Regular analyses of the financial results for each subsidiary, market unitregion and business unit cover the significant elements of assets, liabilities, revenues, costs and cash flow. Together with further analysis of the consolidated financial statements performed at Group level, this ensures that thethese procedures are designed to produce financial reports do not containwithout material errors. For external financial reporting purposes, additional controls performed by the Disclosure Committee ensure that allperforms additional control procedures to review whether the disclosure requirements are fulfilled. ERICSSON ANNUAL REPORT ON FORM 20-F 2009
The Company has implemented controls to ensure that the financial reports are prepared in accordance with its internal accounting and reporting policies and IFRS as well as with relevant listing regulations. The Company alsoIt maintains detailed documentation on internal controls related to accounting and financial reporting, as well asreporting. It also keeps records on the monitoring of the execution and results of such controls. This ensures thatallows the President and CEO and the CFO canto assess the effectiveness of the controls in a way that is compliant with SOX. Entity-wide controls, focusing on the control environment and compliance with the financial reporting policies and directives, are implemented in all subsidiaries. Detailed process controls and documentation of controls performed are also implemented in almost all subsidiaries, covering allthe items with significant materiality and risk. To ensure efficientIn order to secure compliance, governance and standardizedrisk management in the areas of legal entity accounting and reporting processes,taxation, as well as securing funding and equity levels, the Company operates several shared services centers. through a Company Control hub structure, covering subsidiaries in each respective geographical area.
Based on a common IT platform, a common chart of account and common master data, the hubs and shared services centers perform accounting and financial reporting services for most subsidiaries. Information and communication The Company’s information and communication channels support complete, correct and timely financial reporting by making all relevant internal process instructions and policies accessible to all the employees concerned. Regular updates and briefing documents regarding changes in accounting policies, reporting and disclosure requirements are also supplied. Subsidiaries and operating units prepare regular financial and management reports tofor internal steering groups and Company management. These include analysis and comments on financial performance and risks. The Board of Directors receives financial reports monthly. The Audit Committee of the BoardEricsson has established a whistle blowerwhistleblower procedure for the reporting of alleged violations inthat (i) are conducted by Group or local management, and (ii) relate to corruption, questionable accounting internal controlsor auditing matters or otherwise seriously affect vital interests of the Group or personal health and auditing matters.safety. Monitoring The Company’s process for financial reporting is reviewed annually by the management. This forms a basis for evaluating the internal management system and internal steering documents to ensure that they cover all ERICSSON ANNUAL REPORT ON FORM 20-F 2012 significant areas related to financial reporting. The shared service center and company control hub management continuously monitors the accounting quality through a set of performance indicators. Compliance with policies and directives is monitored through annual self-assessments and representation letters from heads and company controllers in all subsidiaries as well as in business units and market units.regions. The Company’s financial performance is also reviewed at each Board meeting. The committeesCommittees of the Board fulfill important monitoring functions regarding remuneration, borrowing, investments, customer finance, cash management, financial reporting and internal control. The Audit Committee and the Board of Directors review all interim and annual financial reports before they are released to the market. The Company’s internal audit function which reports directly to the Audit Committee, performs independent audits.Committee. The Audit Committee also receives regular reports from the external auditor. The Audit Committee follows up on any actions taken to improve or modify controls. BOARD OF DIRECTORS Stockholm, March 5, 2013 Telefonaktiebolaget LM Ericsson (publ) Org. no. 556016–0680 ERICSSON ANNUAL REPORT ON FORM 20-F 20092012 UNCERTAINTIES IN THE FUTUREREMUNERATION REPORT
SomeINTRODUCTION
This report outlines how the remuneration policy is implemented throughout Ericsson in line with corporate governance best practice, with specific references to Group management. The work of the information providedRemuneration Committee in this material is or may contain forward-looking information such as statements about expectations, assumptions about future market2012 and the remuneration policy are explained, at the beginning of the report, followed by descriptions of plans and approaches. More details of the remuneration of Group management and Board members’ fees can be found in the Notes to the Consolidated financial statements—Note C28, “Information regarding members of the Board of Directors, the Group management and employees”. THE REMUNERATION COMMITTEE The Remuneration Committee advises the Board of Directors on an ongoing basis on the remuneration to the Executive Leadership Team (ELT). This includes fixed salaries, pensions, other benefits and short-term and long-term variable remuneration, all in the context of pay and employment conditions projections orthroughout Ericsson. The Remuneration Committee reviews and prepares for resolution by the Board: Proposals on salary and other characterizations of future events. The words “believe”, “expect”, “anticipate”, “intend”, “may”, “plan”,remuneration, including retirement compensation, for the negative of such terms,President and CEO Proposals on targets for the short-term variable remuneration for the President and CEO Proposals to the Annual General Meeting on guidelines for remuneration to the ELT Proposals to the Annual General Meeting on long-term variable remuneration and similar expressions are intended to identify these statements. Although we believe thatequity arrangements The responsibility for the expectations reflected in theseRemuneration Committee is also to: Approve proposals on salary and other forward-looking statementsremuneration, including retirement compensation, for the Executive Vice Presidents and other ELT. Approve proposals on targets for the short-term variable remuneration for the Executive Vice Presidents and other ELT. Approve pay out of the short-term variable renumeration for the ELT, based on achievements and performance. The Remuneration Committee’s work is the foundation for the governance of Ericsson’s remuneration processes together with Ericsson’s internal systems and audit controls. The Committee is chaired by Leif Johansson and its other members are reasonable, we can give no assurance that these expectations will prove to be correctBörje Ekholm, Nancy McKinstry, and actual results may differ materially. We undertake no obligation to publicly update or revise any forward-looking statements, whether as a result of new information, future events or otherwise, exceptKarin Åberg. All the members are non-executive directors, independent (except for the employee representative) as required by law or stock exchange regulation. Wethe Swedish Corporate Governance Code and have relevant knowledge and experience of remuneration matters. The Company’s General Counsel acts as secretary to the Committee. The Chief Executive Officer, the Senior Vice President, Head of Human Resources and Organization and the Vice President, Head of Total Rewards attend the Remuneration Committee meetings by invitation and assist the Committee in its considerations, except when issues relating to their own remuneration are being discussed. The Remuneration Committee has appointed an independent expert advisor, Piia Pilv, to assist and advise you that Ericsson is subjectthe Committee. The independent advisor provided no other services to risks both specific to our industry and specific to our company that could cause the actual results to differ materially from those contained in our projections or forward-looking statements, including, among others, changing conditions in the telecommunications industry, political economic and regulatory developments in our markets, our management’s ability to develop and execute a successful strategy, various financial risks such as interest rate changes and exchange rate changes, erosion of our market position, structure and financial strength of our customer base, our credit ratings, product development risks, supply constraints, and our ability to recruit and retain quality staff. Company during 2012. TheERICSSON ANNUAL REPORT ON FORM 20-F 20092012 MANAGEMENT’S REPORT ON INTERNAL CONTROL OVER FINANCIAL REPORTINGRemuneration Committee is also provided with national and international pay data collected from external survey providers and can call on other independent expertise, should it so require. The Chairman continues to ensure that contact is maintained, as necessary and appropriate, with principal shareholders regarding remuneration.
Ericsson’s management is responsibleThe purpose and function of the Remuneration Committee and its responsibilities can be found on the Ericsson website. These responsibilities, together with the Guidelines for establishingremuneration to Group Management (ELT) and maintaining adequate internal control over financial reportingthe Long-Term Variable remuneration plan, are reviewed and evaluated annually in light of matters such as changes to corporate governance best practice or changes to accounting, legislation, political opinion or business practices among peers. This helps to ensure that the policy continues to provide Ericsson with a competitive remuneration strategy.
The Guidelines for remuneration to Group Management are, in accordance with Swedish law, brought to shareholders annually for approval. The Remuneration Committee met six times during the year 2012. The winter meetings focused on following up on results from the 2011 variable remuneration programs and preparing proposals to shareholders for the Company. Ericsson’s internal control system related2012 Annual General Meeting (AGM). During the spring the committee determined remuneration to financial reportinga new member of the ELT and revised the remuneration to others. In the fall, the committee reviewed the Guidelines for remuneration to Group Management and decided to continue the Long-Term Variable remuneration plans without any material changes and the Short-Term Variable remuneration plans with an increased weighting on capital and margins for 2013. The committee based its considerations on the business needs, analyses and reviews of the global market trends and feedback from shareholders and institutions. Supported by the independent advisor, the Committee also reviewed the competitiveness of the ELT remuneration in the global market. The Remuneration Committee is of the opinion that the Long-Term Variable remuneration plans fulfill the defined objectives to promote “One Ericsson” and to align the interests of employees with those of shareholders. The number of participants as of December 1, 2012 was 27,000 employees, compared to 24,000 employees as of December 1, 2011. The evaluation also confirms that the Key Contributor Retention Plan meets the purpose of retaining our key employees. The voluntary attrition rate among Key Contributors is about two-thirds compared to the attrition rate in the total number of employees. REMUNERATION POLICY Remuneration at Ericsson is based on the principles of performance, competitiveness and fairness. The remuneration policy, together with the mix of remuneration elements, is designed to provide reasonable assurancereflect these principles by creating a balanced remuneration package. The Guidelines for remuneration to Group Management 2012 approved by AGM can be found in note C28. The auditor’s report regarding whether we have complied with the reliability of financial reporting and the preparation of financial statementsguidelines for external purposes in accordance with generally accepted accounting principles and includes those policies and procedures that: pertaincompensation to the maintenance of records that, in reasonable detail, accurately and fairly reflect the transactions and dispositions of the assets of the Company;
provide reasonable assurance that transactions are recorded as necessary to permit preparation of financial statements in accordance with generally accepted accounting principles, and that receipts and expenditures of the Company are being made only in accordance with authorizations of management and directors of the Company; and
provide reasonable assurance regarding prevention or timely detection of unauthorized acquisition, use or disposition of the Company’s assets that could have a material effectELT during 2012 is posted on the financial statements.
Although the purpose of internal control systems is to enable risks to be optimally managed, all internal control systems, no matter how well designed, have inherent limitations which may result in that misstatements are not prevented or detected. Therefore, even systems determined to be effective can provide only reasonable assurance with respect to the reliability of financial statement preparation and presentation.
Ericsson’s management assessed the effectiveness of Ericsson’s internal control over financial reporting as of December 31, 2009. In making this assessment, management used the criteria set forth in “Internal Control—Integrated Framework”, issued by the Committee of Sponsoring Organizations of the Treadway Commission.
Management has excluded activities from the acquired Nortel operation from the assessment of internal control over financial reporting as at December 31, 2009, because the Nortel operation was acquired by Ericsson in a purchase business combination during 2009. The Nortel operation is part of the Network segment. The total assets and total net sales of the Nortel operation represent approximately 0.6 percent and 1.3 percent, respectively, of our related consolidated financial statement amounts as at and for the year ended December 31, 2009.
Based on this assessment, management has concluded that, as of December 31, 2009, Ericsson’s internal control over financial reporting was effective. The effectiveness of the Company’s internal control over financial reporting as of December 31, 2009, has been audited by PricewaterhouseCoopers AB, an independent registered public accounting firm. PricewaterhouseCoopers AB has issued an attestation report on Ericsson’s internal control over financial reporting, which appears on page 43.
website.ERICSSON ANNUAL REPORT ON FORM 20-F 2012 Summaries of 2012 short- and long-term variable remuneration | | | | | | | | | What we call it | | What is it? | | What is the objective? | | Who participates? | | How is it earned? | Short-term: Remuneration delivered over 12 months or less | | | | | | | Fixed salary | | Fixed remuneration paid at set times | | Attract and retain employees, delivering part of annual remuneration in a predictable format | | All employees | | Market appropriate
levels set according
to position and
evaluated according
to individual
performance | | | | | | | Short-Term Variable remuneration (STV) | | A variable plan that is measured and paid over a single year | | Align employees with clear and relevant targets, providing an earnings opportunity in return for performance, and flexible cost | | Enrolled employees, including Executive Leadership Team. Approx. 73,900 in 2012 | | Achievements
against set targets.
Reward can increase
to up to twice the
target level and
decrease to zero,
depending on
performance | | | | | | | Local and Sales Incentive Plans | | Tailored versions of the STV | | As for STV, tailored for local or business requirements, such as sales | | Employees in sales. Approx. 2,300 in 2012 | | Similar to STV. All
plans have maximum
award and vesting
limits | | Long-term: Remuneration delivered over 3 years or more | | | | | | | Stock Purchase Plan (SPP) | | All-employee stock-based plan | | Reinforce a “One Ericsson” mentality and align employees’ interests with those of shareholders | | All employees are eligible | | Buy one share and it
will be matched by
one share after
3 years if still
employed | | | | | | | Key Contributor Retention Plan (KC) | | Share-based plan for selected individuals | | Recognize, retain and motivate key contributors for performance, critical skills and potential | | Up to 10% of employees | | If selected, get one
more matching share
in addition to the
SPP one | | | | | | | Executive Performance Stock Plan (EPSP) | | Share-based plan for senior executives | | Remuneration for long-term commitment and value creation | | Senior executives, including Executive Leadership Team | | Get up to 4, 6 or, for
CEO, 9 further
matching shares to
the SPP one for
long-term
performance |
REMUNERATION 2012 To enhance the understanding of how Ericsson translates remuneration principles and policy into practice, an internal remuneration website was launched in January 2011. The site contains e-learning and training programs targeted at line managers. It supports more informed decisions and better communication to the wider employee population. The next step in this development is the planned implementation of an Integrated HR IT tool. The first phase was launched to all managers in Ericsson in November 2012 and include performance management, talent planning, variable pay and annual salary review. ERICSSON ANNUAL REPORT ON FORM 20-F 2012 TOTAL REMUNERATION When considering the remuneration of an individual, it is the total remuneration that matters. First, the total annual cash compensation is defined, consisting of the target level of short-term variable remuneration plus fixed salary. Thereafter, target long-term variable remuneration may be added to get to the total target remuneration and, finally, pension and other benefits may be added to arrive at the total remuneration. For the ELT, remuneration consists of fixed salary, short-term and long-term variable remuneration, pension and other benefits. If the size of any one of these elements is increased or decreased when setting the remuneration, at least one other element has to change if the competitive position is to remain unchanged. The remuneration costs for the CEO and the ELT are reported in Note C28. Fixed salary When setting fixed salaries, the Remuneration Committee considers the impact on total remuneration, including pension and associated costs. The absolute levels are determined by the size and complexity of the position and the year-to-year performance of the individual. Together with other elements of remuneration, ELT salaries are subject to an annual review by the Remuneration Committee, which considers external pay data to ensure that levels of pay remain competitive and appropriate to the remuneration policy. Variable remuneration Ericsson strongly believes that, where possible, variable compensation should be encouraged as an integral part of total remuneration. First and foremost, this aligns employees with clear and relevant targets, but it also enables more flexible payroll costs and emphasizes the link between performance and pay. All variable remuneration plans have maximum award and vesting limits. Short-term variable remuneration is to a greater extent dependent on the specific unit or function, while long-term variable remuneration is dependent on the achievements of the Ericsson Group. Short-term variable remuneration Annual variable remuneration is delivered through cash-based programs. Specific business targets are derived from the annual business plan approved by the Board of Directors and, in turn, defined by the Company’s long-term strategy. Ericsson strives to grow faster than the market with best-in-class margins and strong cash conversion and therefore the starting point is to have three core targets: For the ELT, targets are thus predominantly financial at either Group level (for Heads of Group functions) or at the individual unit level (for Heads of regions or business units) and may also include operational targets like customer satisfaction and employee engagement. ERICSSON ANNUAL REPORT ON FORM 20-F 2012 The chart below illustrates how payouts to the ELT have varied with performance over the past five years.
Short-term variable remuneration structure | | | | | | | | | | | | | | | | | | | | | | | | | | | | Short-term variable remuneration
as percentage of fixed salary | | | Percentage of short-term variable
remuneration maximal opportunity | | | | | Target
level | | | Maximum
level | | | Actual paid
for 2012 | | | Group financial
targets | | | Unit/functional
financial targets | | | Non-financial
targets | | CEO 2012 | | | 40 | % | | | 80 | % | | | 32 | % | | | 90 | % | | | 0 | % | | | 10 | % | CEO 2013 | | | 40 | % | | | 80 | % | | | — | | | | 100 | % | | | 0 | % | | | 0 | % | Average ELT 20121) | | | 36 | % | | | 72 | % | | | 37 | % | | | 49 | % | | | 27 | % | | | 24 | % | Average ELT 20131) | | | 38 | % | | | 76 | % | | | — | | | | 50 | % | | | 24 | % | | | 26 | % |
| 1) | Excludes CEO—differences in target and maximum levels from year to year are due to changes in the composition of the ELT. |
The Board of Directors and the Remuneration Committee decide on all Ericsson Group targets, which are cascaded to unit-related targets throughout the Company, always subject to a two-level management approval process. The Remuneration Committee monitors the appropriateness and fairness of Group target levels throughout the performance year and has the authority to revise them should they cease to be relevant or stretching or to enhance shareholder value. During 2012, approximately 76,200 employees participated in short-term variable remuneration plans. Long-term variable remuneration Share-based long-term variable remuneration plans are submitted each year for approval by shareholders at the AGM. All long-term variable remuneration plans are designed to form part of a well-balanced total remuneration package and to span over a minimum of three years. As these are variable plans, outcomes are unknown and rewards depend on long-term personal investment, corporate performance and resulting share price performance. During 2012, share-based remuneration was made up of three different but linked plans: the all-employee Stock Purchase Plan, the Key Contributor Retention Plan and the Executive Performance Stock Plan. The Stock Purchase Plan The all-employee Stock Purchase Plan is designed to offer, where practicable, an incentive for all employees to participate. This reinforces “One Ericsson” aligned with shareholder interests. Employees can save up to 7.5% of gross fixed salary (the President and CEO can save up to 10% of gross fixed salary and short-term variable remuneration) for purchase of Class B shares at market price on NASDAQ OMX Stockholm or ADSs on ERICSSON ANNUAL REPORT ON FORM 20-F 2012 NASDAQ New York (contribution shares) over a twelve-month period. If the contribution shares are retained by the employee for three years after the investment and employment with the Ericsson Group continues during that time, the employee’s shares will be matched with a corresponding number of Class B shares or ADSs, as applicable. The plan was introduced in 2002 and employees in 71 countries participated during its first year. In December 2012, the number of participants was over 27,000, or approximately 28% of eligible employees in 100 countries. Participants save each month, beginning with the August payroll, towards quarterly investments. These investments (in November, February, May and August) are matched on the third anniversary of each such investment and hence the matching spans over two financial years and two tax years. The Key Contributor Retention Plan The Key Contributor Retention Plan is part of Ericsson’s talent management strategy. It is designed to recognize individuals for performance, critical skills and potential as well as to encourage retention of key employees. Under the program, operating units around the world can nominate up to 10% of employees worldwide. Each unit nominates individuals that have been identified according to performance, critical skills and potential. The nominations are calibrated in management teams locally and are reviewed by both local and corporate Human Resources to ensure that there is a minimum of bias and a strong belief in the system. Participants selected obtain one extra matching share in addition to the one matching share for each contribution share purchased under the Stock Purchase Plan during a twelve-month investment period. The plan was introduced in 2004. The Executive Performance Stock Plan The Executive Performance Stock Plan was first introduced in 2004. The plan is designed to focus management on driving long-term financial performance and to provide market competitive remuneration. Senior executives, including the ELT, are selected to obtain up to four or six extra shares (performance matching shares). This is in addition to the one matching share for each contribution share purchased under the all-employee Stock Purchase Plan. Performance matching is subject to the fulfillment of performance targets. Since 2010, the President and CEO may obtain up to nine performance matching shares in addition to the Stock Purchase Plan matching share for each contribution share. In the 2004 to 2010 plans, the performance targets were Earnings Per Share (EPS) targets. To support the long-term strategy and value creation of the Company, new targets were defined for the 2011 plan. At the AGM 2012, the following targets for the 2012 Executive Performance Stock Plan were resolved on proposal by the Board: Up to one-third of the award shall vest provided the compound annual growth rate (CAGR) of consolidated net sales between year 0 (2011 financial year) and year 3 (2014 financial year) is between 2% and 8%. Up to one-third of the award shall vest provided the compound annual growth rate (CAGR) of consolidated operating income between year 0 (2011 financial year) and year 3 (2014 financial year) is between 5% and 15%. Up to one-third of the award will be based on the cash conversion during each of the years during the performance period, calculated as cash flow from operating activities divided by net income reconciled to cash. One-ninth of the total award will vest for any year, i.e. financial years 2012, 2013 and 2014, if cash conversion is at or above 70%. ERICSSON ANNUAL REPORT ON FORM 20-F 2012 Before the number of performance shares to be matched are finally determined, the Board of Directors shall examine whether the performance matching is reasonable considering the Company’s financial results and position, conditions on the stock market and other circumstances, and if not, as determined by the Board of Directors, reduce the number of performance shares to be matched to the lower number of shares deemed appropriate by the Board of Directors. When undertaking its evaluation of performance outcomes the Board of Directors will consider, in particular, the impact of larger acquisitions, divestitures, the creation of joint ventures and any other significant capital event on the three targets on a case by case basis. Benefits and terms of employment Pension benefits follow the competitive practice in the employee’s home country and may contain various supplementary plans, in addition to any national system for social security. Where possible, pension plans are operated on a defined contribution basis. Under these plans, Ericsson pays contributions into a plan but does not guarantee the ultimate benefit, unless local regulations or legislation prescribe that defined benefit plans that do give such guarantees have to be offered. For the President and CEO and other members of the ELT employed in Sweden before 2011, a supplementary pension plan is applied in addition to the occupational pension plan for salaried staff on the Swedish labor market (ITP). The pension age for these ELT members is normally 60 years. The ELT members employed in Sweden from 2011 are normally covered by the defined contribution plan under the ITP1 scheme, with a pensionable age of 65 years. For members of the ELT who are not employed in Sweden, local market competitive pension arrangements apply. Other benefits, such as company car and medical insurance, are also set to be competitive in the local market. The ELT members may not receive loans from the Company. The ELT members locally employed in Sweden have a mutual notice period of up to six months. Upon termination of employment by the Company, severance pay can amount to up to 18 months’ fixed salary. For other ELT members, different notice period and severance pay agreements apply; however, no agreement exceeds the notice period of six months or the severance pay period of 18 months. ERICSSON ANNUAL REPORT ON FORM 20-F 2012 SHARE INFORMATION STOCK EXCHANGE TRADING The Ericsson Class A and Class B shares are listed on NASDAQ OMX Stockholm. In the United States, the Class B shares are listed on NASDAQ New York in the form of American Depositary Shares (ADS) evidenced by American Depositary Receipts (ADR) under the symbol ERIC. Each ADS represents one Class B share. In 2012, approximately 2.4 (3.4) billion shares were traded on NASDAQ OMX Stockholm and about 1.1 (1.6) billion shares were traded on NASDAQ New York. A total of 3.5 (5) billion Ericsson shares where thus traded on the exchanges were we are listed. Trading volume in Ericsson shares decreased by approximately 27% on NASDAQ OMX Stockholm and by approximately 30% on NASDAQ New York compared to 2011. The Ericsson share is also traded on other venues such as BATS Europe, Burgundy, Chi-X Europe. The Ericsson share | | | | | Share listings | | | | | NASDAQ OMX Stockholm | | | | | NASDAQ New York | | | | | | | Share data | | | | | Total number of shares in issue | | | 3,305,051,735 | | of which Class A shares, each carrying one vote1) | | | 261,755,983 | | of which Class B shares, each carrying one tenth of one vote1) | | | 3,043,295,752 | | Ericsson treasury shares, Class B | | | 84,798,095 | | Quotient value | | | SEK 5.00 | | Market capitalization, December 31, 2012 | | | approx. SEK 215 b. | | ICB (Industry Classification Benchmark) | | | 9500 | | | | Ticker codes | | | | | NASDAQ OMX Stockholm | | | ERIC A/ERIC B | | NASDAQ New York | | | ERIC | | Bloomberg NASDAQ OMX Stockholm | | | ERICA SS/ERICB SS | | Bloomberg NASDAQ | | | ERIC US | | Reuters NASDAQ OMX Stockholm | | | ERICa.ST/ERICb.ST | | Reuters NASDAQ | | | ERIC.O | |
| 1) | Both classes of shares have the same rights of participation in the net assets and earnings. |
Changes in number of shares and capital stock 2008–2012 | | | | | | | | | | | | | | | | Number of shares | | | Share capital | | 2008 | | June 2, reverse split 1:5 | | | 3,226,451,735 | | | | 16,132,258,678 | | 2008 | | July 23, new issue (Class C shares, later converted to Class B) | | | 19,900,000 | | | | 99,500,000 | | 2008 | | December 31 | | | 3,246,351,735 | | | | 16,231,758,678 | | 2009 | | June 8, new issue (Class C shares, later converted to Class B) | | | 27,000,000 | | | | 135,000,000 | | 2009 | | December 31 | | | 3,273,351,735 | | | | 16,366,758,678 | | 2010 | | December 31 | | | 3,273,351,735 | | | | 16,366,758,678 | | 2011 | | December 31 | | | 3,273,351,735 | | | | 16,366,758,678 | | 2012 | | June 29, new issue (Class C shares, later converted to Class B)1) | | | 31,700,000 | | | | 158,500,000 | | 2012 | | December 31 | | | 3,305,051,735 | | | | 16,525,258,678 | |
ERICSSON ANNUAL REPORT ON FORM 20-F 2012 | 1) | The Annual General Meeting (AGM) 2012 resolved to issue 31.7 million Class C shares for the Long-Term Variable Remuneration Program (LTV). In accordance with an authorization from the AGM, in the second quarter 2012, the Board of Directors resolved to repurchase the new issued shares, which were subsequently converted into Class B shares. The quotient value of the repurchased shares was SEK 5.00, totaling SEK 158.5 million, representing less than one percent of capital stock, and the acquisition cost was approximately SEK 158.7 million. |
Share performance indicators | | | | | | | | | | | | | | | | | | | | | | | | 2012 | | | 2011 | | | 2010 | | | 2009 | | | 2008 | | Earnings per share, diluted (SEK)1) | | | 1.78 | | | | 3.77 | | | | 3.46 | | | | 1.14 | | | | 3.52 | | Earnings per share, diluted non-IFRS (SEK)2) | | | 2.74 | | | | 4.72 | | | | 4.80 | | | | 2.87 | | | | 4.24 | | Operating income per share (SEK)3)4) | | | 3.25 | | | | 5.58 | | | | 7.42 | | | | 5.80 | | | | 7.50 | | Stockholders’ equity per share, basic, end of period (SEK)5) | | | 42.51 | | | | 44.57 | | | | 45.34 | | | | 43.79 | | | | 44.21 | | P/E ratio | | | 36 | | | | 19 | | | | 22 | | | | 57 | | | | 17 | | Total shareholder return (%) | | | –3 | | | | –7 | | | | 22 | | | | 15 | | | | –20 | | Dividend per share (SEK)6) | | | 2.75 | | | | 2.50 | | | | 2.25 | | | | 2.00 | | | | 1.85 | |
| 1) | Calculated on average number of shares outstanding, diluted. |
| 2) | EPS, diluted, excluding amortizations and write-downs of acquired intangible assets, SEK. |
| 3) | Calculated on average number of shares outstanding, basic. |
| 4) | For 2010, 2009 and 2008 excluding restructuring charges. |
| 5) | Calculated on number of shares, end of period. |
| 6) | For 2012 as proposed by the Board of Directors. |
For definitions of the financial terms used, see Glossary, Financial Terminology and Exchange Rates. SHARE TREND In 2012, Ericsson’s total market capitalization decreased by about 7% to SEK 215 billion, compared to a decrease by 10% reaching SEK 230 billion in 2011. The OMX Stockholm Index on NASDAQ OMX Stockholm increased by 12% and the NASDAQ composite index increased by 16%. The S&P 500 Index increased by 13%.
ERICSSON ANNUAL REPORT ON FORM 20-F 2012
ERICSSON ANNUAL REPORT ON FORM 20-F 2012
OFFER AND LISTING DETAILS Principal trading market—NASDAQ OMX Stockholm—share prices The table below states the high and low share prices for our Class A and Class B shares as reported by NASDAQ OMX Stockholm for the last five years. Trading on the exchange generally continues until 5:30 p.m. (CET) each business day. In addition to trading on the exchange, there is also trading off the exchange and on alternative venues during trading hours and also after 5:30 p.m. (CET). NASDAQ OMX Stockholm publishes a daily Official Price List of Shares which includes the volume of recorded transactions in each listed stock, together with the prices of the highest and lowest recorded trades of the day. The Official Price List of Shares reflects price and volume information for trades completed by the members. The equity securities listed on the NASDAQ OMX Stockholm Official Price List of Shares currently comprise the shares of 258 companies. ERICSSON ANNUAL REPORT ON FORM 20-F 2012 Share prices on NASDAQ OMX Stockholm | | | | | | | | | | | | | | | | | | | | | (SEK) | | 2012 | | | 2011 | | | 2010 | | | 2009 | | | 2008 | | Class A at last day of trading | | | 63.90 | | | | 69.55 | | | | 74.00 | | | | 65.00 | | | | 59.30 | | Class A high (January 3, 2012) | | | 72.00 | | | | 93.60 | | | | 88.40 | | | | 78.80 | | | | 83.60 | | Class A low (November 16, 2012) | | | 55.55 | | | | 59.05 | | | | 65.20 | | | | 55.40 | | | | 40.60 | | Class B at last day of trading | | | 65.10 | | | | 70.40 | | | | 78.15 | | | | 65.90 | | | | 58.80 | | Class B high (January 3, 2012) | | | 71.90 | | | | 96.65 | | | | 90.45 | | | | 79.60 | | | | 83.70 | | Class B low (July 18, 2012) | | | 55.90 | | | | 61.70 | | | | 65.90 | | | | 55.50 | | | | 40.60 | |
Source: Nasdaq OMX Stockholm Share prices on NASDAQ New York | | | | | | | | | | | | | | | | | | | | | (USD) | | 2012 | | | 2011 | | | 2010 | | | 2009 | | | 2008 | | ADS at last day of trading | | | 10.10 | | | | 10.13 | | | | 11.53 | | | | 9.19 | | | | 7.81 | | ADS high (April 3, 2012) | | | 10.60 | | | | 15.44 | | | | 12.39 | | | | 10.92 | | | | 14.00 | | ADS low (May 17, 2012) | | | 8.23 | | | | 8.83 | | | | 9.40 | | | | 6.60 | | | | 5.49 | |
Source: Nasdaq New York Host market NASDAQ New York—ADS prices The table below states the high and low share prices quoted for our ADSs on NASDAQ New York for the last five years. The NASDAQ New York quotations represent prices between dealers, not including retail mark-ups, markdowns or commissions, and do not necessarily represent actual transactions. ERICSSON ANNUAL REPORT ON FORM 20-F 2012 Share prices on NASDAQ OMX Stockholm and NASDAQ New York | | | | | | | | | | | | | | | | | | | | | | | | | | | | NASDAQ OMX Stockholm | | | NASDAQ New York | | | | | SEK per Class A share | | | SEK per Class B share | | | USD per ADS1) | | Period | | High | | | Low | | | High | | | Low | | | High | | | Low | | Annual high and low | | | | | | | | | | | | | | | | | | | | | | | | | 2008 | | | 83.60 | | | | 40.60 | | | | 83.70 | | | | 40.60 | | | | 14.00 | | | | 5.49 | | 2009 | | | 78.80 | | | | 55.40 | | | | 79.60 | | | | 55.50 | | | | 10.92 | | | | 6.60 | | 2010 | | | 88.40 | | | | 65.20 | | | | 90.45 | | | | 65.90 | | | | 12.39 | | | | 9.40 | | 2011 | | | 93.60 | | | | 59.05 | | | | 96.65 | | | | 61.70 | | | | 15.44 | | | | 8.83 | | 2012 | | | 72.00 | | | | 55.55 | | | | 71.90 | | | | 55.90 | | | | 10.60 | | | | 8.23 | | | | | | | | | Quarterly high and low | | | | | | | | | | | | | | | | | | | | | | | | | 2011 First Quarter | | | 80.05 | | | | 70.50 | | | | 83.00 | | | | 73.25 | | | | 13.06 | | | | 10.99 | | 2011 Second Quarter | | | 93.60 | | | | 73.00 | | | | 96.65 | | | | 75.30 | | | | 15.44 | | | | 12.06 | | 2011 Third Quarter | | | 91.80 | | | | 60.50 | | | | 93.80 | | | | 63.15 | | | | 14.82 | | | | 9.33 | | 2011 Fourth Quarter | | | 71.50 | | | | 59.05 | | | | 72.55 | | | | 61.70 | | | | 11.25 | | | | 8.83 | | 2012 First Quarter | | | 72.00 | | | | 59.25 | | | | 71.90 | | | | 58.15 | | | | 10.53 | | | | 8.58 | | 2012 Second Quarter | | | 69.70 | | | | 58.75 | | | | 69.95 | | | | 59.60 | | | | 10.60 | | | | 8.23 | | 2012 Third Quarter | | | 67.00 | | | | 55.95 | | | | 67.80 | | | | 55.90 | | | | 10.05 | | | | 8.23 | | 2012 Fourth Quarter | | | 64.90 | | | | 55.55 | | | | 66.85 | | | | 56.60 | | | | 10.21 | | | | 8.31 | | | | | | | | | Monthly high and low | | | | | | | | | | | | | | | | | | | | | | | | | August 2012 | | | 67.00 | | | | 60.55 | | | | 67.80 | | | | 61.50 | | | | 10.05 | | | | 9.14 | | September 2012 | | | 62.55 | | | | 58.35 | | | | 64.10 | | | | 59.85 | | | | 9.79 | | | | 8.91 | | October 2012 | | | 59.85 | | | | 56.10 | | | | 61.00 | | | | 57.40 | | | | 9.27 | | | | 8.57 | | November 2012 | | | 60.50 | | | | 55.55 | | | | 62.30 | | | | 56.60 | | | | 9.41 | | | | 8.31 | | December 2012 | | | 64.90 | | | | 60.00 | | | | 66.85 | | | | 62.45 | | | | 10.21 | | | | 9.40 | | January 2013 | | | 74.30 | | | | 62.90 | | | | 76.95 | | | | 64.50 | | | | 11.82 | | | | 9.78 | | February 2013 | | | 77.75 | | | | 72.30 | | | | 79.90 | | | | 74.20 | | | | 12.70 | | | | 11.97 | | March 2013 | | | 84.55 | | | | 75.60 | | | | 86.40 | | | | 77.60 | | | | 13.46 | | | | 12.07 | |
| 1) | One ADS = 1 Class B share. |
Source: Nasdaq OMX Stockholm and Nasdaq New York SHAREHOLDERS As of December 31, 2012, the Parent Company had 551,719 shareholders registered at Euroclear Sweden AB (the Central Securities Depository—CSD), of which 1,080 holders had a US address. According to information provided by our depositary, Citibank, there were 189,454,944 ADSs outstanding as of December 31, 2012, and 4,500 registered holders of such ADSs. A significant number of Ericsson ADSs are held by banks, brokers and/or nominees for the accounts of their customers. As of January 3, 2013, the total number of bank, broker and/or nominee accounts holding Ericsson ADSs was 169,190. According to information known at year-end 2012, approximately 78% of our Class A and Class B shares were owned by institutions, Swedish and international. Our major shareholders do not have different voting rights than other shareholders holding the same classes of shares. As far as we know, the Company is not directly or indirectly owned or controlled by another corporation, by any foreign government or by any other natural or legal person(s) separately or jointly. ERICSSON ANNUAL REPORT ON FORM 20-F 2012
The table shows the total number of shares in the Parent Company owned by the Executive Leadership Team and Board members (including Deputy employee representatives) as a group as of December 31, 2012. The Executive Leadership Team and Board members, ownership | | | | | | | | | | | | | | | | Number of
Class A
shares | | | Number of
Class B
shares | | | Voting
rights,
percent | | The Executive Leadership Team and Board members as a group (31 persons) | | | 0 | | | | 559,450 | | | | 0.01 | |
For individual holdings, see Corporate Governance Report. ERICSSON ANNUAL REPORT ON FORM 20-F 2012 The following table shows share information, as of December 31, 2012, with respect to our 15 largest shareholders, ranked by voting rights, as well as percentage of voting rights as of December 31, 2012, 2011 and 2010. Largest shareholders, December 31, 2012 and percentage of voting rights, December 31, 2012, 2011 and 2010 | | | | | | | | | | | | | | | | | | | | | | | | | | | | | Identity of person or group1) | | Number of
Class A
shares | | | Of total
Class A
shares,
percent | | | Number of
Class B
shares | | | Of total
Class B
shares,
percent | | | 2012
Voting rights,
percent | | | 2011
Voting rights,
percent | | | 2010
Voting rights,
percent | | Investor AB | | | 115,018,707 | | | | 43.94 | | | | 59,284,545 | | | | 1.95 | | | | 21.37 | | | | 21.48 | | | | 19.33 | | AB Industrivärden | | | 84,708,520 | | | | 32.36 | | | | 0 | | | | 0.00 | | | | 14.96 | | | | 14.34 | | | | 13.80 | | Handelsbankens Pensionsstiftelse | | | 21,057,443 | | | | 8.04 | | | | 0 | | | | 0.00 | | | | 3.72 | | | | 4.20 | | | | 3.52 | | Swedbank Robur Fonder AB | | | 1,505,751 | | | | 0.58 | | | | 138,107,152 | | | | 4.54 | | | | 2.71 | | | | 2.79 | | | | 2.73 | | AFA Försäkring AB | | | 11,423,000 | | | | 4.36 | | | | 9,151,631 | | | | 0.30 | | | | 2.18 | | | | 2.31 | | | | 0.45 | | Blackrock Fund Advisors | | | 0 | | | | 0.00 | | | | 77,802,606 | | | | 2.56 | | | | 1.37 | | | | 1.46 | | | | 1.44 | | Norges Bank Investment Management | | | 0 | | | | 0.00 | | | | 77,226,311 | | | | 2.54 | | | | 1.36 | | | | 1.24 | | | | 0.89 | | Skandia Liv | | | 6,263,167 | | | | 2.39 | | | | 11,414,818 | | | | 0.38 | | | | 1.31 | | | | 1.36 | | | | 2.98 | | AMF Pensionsförsäkring AB | | | 0 | | | | 0.00 | | | | 71,108,980 | | | | 2.34 | | | | 1.26 | | | | 1.34 | | | | 1.34 | | Aberdeen Asset Managers Ltd. | | | 0 | | | | 0.00 | | | | 65,706,158 | | | | 2.16 | | | | 1.16 | | | | 1.05 | | | | 1.01 | | Dodge & Cox, Inc. | | | 0 | | | | 0.00 | | | | 64,443,081 | | | | 2.12 | | | | 1.14 | | | | 0.96 | | | | 1.43 | | Pensionskassan SHB Försäkringsförening | | | 6,381,570 | | | | 2.44 | | | | 0 | | | | 0.00 | | | | 1.13 | | | | 1.39 | | | | 2.07 | | Orbis Investment Management Ltd. | | | 0 | | | | 0.00 | | | | 62,271,048 | | | | 2.05 | | | | 1.10 | | | | 0.35 | | | | 0.06 | | OppenheimerFunds, Inc. | | | 0 | | | | 0.00 | | | | 62,070,708 | | | | 2.04 | | | | 1.10 | | | | 1.20 | | | | 1.29 | | Handelsbanken Fonder AB | | | 261,500 | | | | 0.10 | | | | 58,019,980 | | | | 1.91 | | | | 1.07 | | | | 0.96 | | | | 1.05 | | Others | | | 15,136,325 | | | | 5.78 | | | | 2,286,688,734 | | | | 75.14 | | | | 43.07 | | | | 43.57 | | | | 46.61 | | | | | | | | | | | | | | | | | | | | | | | | | | | | | | | Total | | | 261,755,983 | | | | 100 | | | | 3,043,295,752 | | | | 100 | | | | 100 | | | | 100 | | | | 100 | | | | | | | | | | | | | | | | | | | | | | | | | | | | | | |
| 1) | Source: Capital Precision |
ERICSSON ANNUAL REPORT ON FORM 20-F 2012 SUPPLEMENTAL INFORMATION The following information is provided for purposes of complyingto comply with certain requirements of Form 20-F which are not satisfied in full by the information in the Swedish Annual Report. GENERAL FACTS ON THE COMPANY Legal name of the Parent Company: Telefonaktiebolaget LM Ericsson (publ) Organization number: 556016-0680 Legal form of the Parent Company: A Swedish limited liability company, organized under the Swedish Companies Act. The terms “Ericsson”, the “Company”, the “Group”, “us”, “we”, and “our” all refer to Telefonaktiebolaget LM Ericsson and its subsidiaries. Country of incorporation: Sweden. Date of incorporation: The Parent Company was incorporated on August 18, 1918, as a result of a merger between AB LM Ericsson & Co. and Stockholms Allmänna Telefon AB. Domicile: Our registered office is Telefonaktiebolaget LM Ericsson, SE–164 83 Stockholm, Sweden. Our headquarters are located at Torshamnsgatan 23, Kista, Sweden. Telephone number: +46 10 719 0000 Website: www.ericsson.com The information included on our website is not incorporated herein by reference. Agent in the US: Ericsson Inc., Vice President Legal Affairs, 6300 Legacy Drive, Plano, Texas 75024. Telephone number: +1 972 583 0000. Shares: Ericsson’s Class A and Class B shares are traded on NASDAQ OMX Stockholm. In the US, our American Depository Shares (ADS), each representing one underlying Class B share, are traded on NASDAQ. Parent Company operations: The business of the Parent Company, Telefonaktiebolaget LM Ericsson, consists mainly of corporate management, holding company functions and internal banking activities. Parent Company operations also include customer credit management activities performed by Ericsson Credit AB on a commission basis. Subsidiaries and associated companies: For a listing of our significant subsidiaries, please see section “Investments”. In addition to our joint venture ST-Ericsson, we are engaged in a number of other minor joint ventures and cooperative arrangements. For more information regarding risks associated with joint ventures, strategic alliances and third-party agreements please see Risk Factors, “Market, Technology and Business Risks”. Filings in the US: Annual reports and other information are filed with, or furnished to, the Securities and Exchange ratesCommission (SEC) in the United States, pursuant to the rules and regulations that apply to foreign private issuers. Electronic access to these documents may be obtained from the SEC’s website, www.sec.gov, where they are stored in the EDGAR database. ERICSSON ANNUAL REPORT ON FORM 20-F 2012 COMPANY HISTORY AND DEVELOPMENT Innovating to empower people, business and society Our origins date back to 1876 when Alexander Graham Bell filed a patent application in the United States for the telephone. The same year, Lars Magnus Ericsson opened a small workshop in Stockholm to repair telegraph instruments and sell his own telephone equipment. Today, Ericsson is a leading provider of communications equipment, telecom services and support solutions. Our customers, in over 180 countries, are mainly operators of communications networks worldwide. We manage networks, or parts of networks, for 950 million subscribers. EXCHANGE RATES The following tables provide information with respect to the exchange rate for SEK per USD 1.00, based on the noon buying rate for cable transfers in SEK as certified for customs purposes by the Federal Reserve Bank of New York. The noon buying rate of April 16, 2010,March 29, 2013, was SEK 7.19096.5280 per USD 1.00. The average is computed using the noon buying rate on the last business day of each month during the period indicated. AVERAGE EXCHANGE RATES | | | Year ended December 31 | | Average | 2005 | | 7.5170 | 2006 | | 7.3098 | 2007 | | 6.7232 | 2008 | | 6.6424 | 2009 | | 7.6232 |
| | | | | Month | | High | | Low | September 2009 | | 7.2470 | | 6.8049 | October 2009 | | 7.0508 | | 6.7908 | November 2009 | | 7.1360 | | 6.7950 | December 2009 | | 7.3322 | | 6.8419 | January 2010 | | 7.3852 | | 7.0217 | February 2010 | | 7.4777 | | 7.1010 | March 2010 | | 7.2712 | | 7.0597 |
| | | | | Year ended December 31 | | Average | | 2008 | | | 6.6424 | | 2009 | | | 7.6232 | | 2010 | | | 7.1895 | | 2011 | | | 6.4263 | | 2012 | | | 6.7247 | |
We describe the effects
| | | | | | | | | | EXCHANGE RATES, MONTHLY HIGH AND LOW | | | | | | | | | | | | Month | | High | | | Low | | September 2012 | | | 6.7450 | | | | 6.5018 | | October 2012 | | | 6.7023 | | | | 6.5484 | | November 2012 | | | 6.8019 | | | | 6.6092 | | December 2012 | | | 6.6920 | | | | 6.5074 | | January 2013 | | | 6.5568 | | | | 6.3476 | | February 2013 | | | 6.4764 | | | | 6.2880 | | March 2013 (latest available data is for March 29) | | | 6.5280 | | | | 6.3412 | |
Effects of exchange rate fluctuations on our business in the Board of Directors’ Report under the heading “Risk Management” andis described in the Notes to the Consolidated Financial Statements—Note C20, “Financial Risk Management and Financial Instruments.” Noon buying rates are not used in the preparation of our financial statements. ERICSSON ANNUAL REPORT ON FORM 20-F 2012 Operating resultsPRIMARY MANUFACTURING AND ASSEMBLY FACILITIES
We continuously adjust our production capacity to meet expected customer demand. At year-end 2012, our overall capacity utilization was close to 100%. The table “Primary manufacturing and assembly facilities” summarizes where we have major sites and the total floor space at year-end. In Sweden, the majority of the floor space within our production facilities is used for node assembly and verification. PRIMARY MANUFACTURING AND ASSEMBLY FACILITIES | | | | | | | | | | | | | | | | | | | | | | | | | | | | 2012 | | | 2011 | | | 2010 | | | | | Sites | | | Thousands of
sq meters | | | Sites | | | Thousands
of sq meters | | | Sites | | | Thousands
of sq meters | | | | | | | | | Sweden | | | 7 | | | | 125.1 | | | | 7 | | | | 125.1 | * | | | 6 | | | | 204.4 | | China | | | 5 | | | | 83.5 | | | | 5 | | | | 91.1 | | | | 4 | | | | 61.1 | | Estonia | | | 1 | | | | 23.7 | | | | 1 | | | | 23.7 | | | | 1 | | | | 20.6 | | Italy | | | 1 | | | | 10.5 | | | | 2 | | | | 20.1 | | | | 2 | | | | 20.1 | | Brazil | | | 1 | | | | 37.4 | | | | 1 | | | | 33.7 | | | | 1 | | | | 23.3 | | Mexico | | | 1 | | | | 0.6 | | | | — | | | | — | | | | — | | | | — | | India | | | 1 | | | | 25.0 | | | | 1 | | | | 25.0 | * | | | 1 | | | | 15.6 | | | | | | | | | | | | | | | | | | | | | | | | | | | Total | | | 17 | | | | 305.8 | | | | 17 | | | | 318.7 | | | | 15 | | | | 345.1 | | | | | | | | | | | | | | | | | | | | | | | | | | |
| * | Restated for 2011 to only include manufacturing and assembly areas. The reported number for China in the 20-F for 2011 was 80.7 and for Sweden 429.3. These numbers comprised total land use. |
OPERATING RESULTS Years ended December 31, 20082011 and 20092012 Please refer to Board of Directors’ Report. Years ended December 31, 2007 and 2008
Net Sales
Consolidated
Consolidated net sales increased by SEK 11 percent, to SEK 208.9 billion in 2008 from SEK 187.8 billion in 2007, driven by higher Networks and professional services sales. Fluctuations in foreign exchange rates had a rather significant negative effect on reported sales during the first nine months of the year although the trend shifted in the fourth quarter, resulting in a limited effect for the full year.
In an increasingly challenging macro-economic environment, the Company adjusts it’s cost base continuously. The cost reduction targets launched in 2008 were exceeded. In February 2008, a cost reduction plan of targeting SEK 4 billion in annual savings was announced, including estimated charges of the same size. All activities with related charges were launched by the third quarter, and it was announced that further charges would be made in the fourth quarter. Charges for the full year 2008 amounted to SEK 6.7 billion in total. This has resulted in annual savings of approximately SEK 6.5 billion from year end. The activities to reduce costs has been continued in 2009.
ERICSSON ANNUAL REPORT ON FORM 20-F 20092012 Primary SegmentsYears ended December 31, 2010 and 2011
Ericsson has reorganized its operating structure as from January 1, 2007.FINANCIAL RESULTS OF OPERATIONS
NetworksABBREVIATED INCOME STATEMENT WITH RECONCILIATION IFRS—NON-IFRS MEASURES
Net sales in segment Networks increased by 10 percent, to SEK 142.0 billion in 2008 from SEK 129.0 billion in 2007. Sales of related network rollout services grew 16 percent to SEK 21.5 (18.5) billion during 2008. Mobile network build-outs, especially in high-growth markets, continued to represent the majority of sales. Sales of mobile broadband solutions increased during the year, driven by consumer need for higher speeds and better coverage. Networks’ business continued to grow where network build-outs and break-in contracts were predominant and price competition was the most intense.
| | | | | | | | | | | | | | | | | | | | | | | | | | | | | | | | | | | | | | | | IFRS | | | Restructuring charges | | | Non-IFRS measures | | SEK billion | | 2011 | | | 2010 | | | 2009 | | | 2011 | | | 2010 | | | 2009 | | | 2011 | | | 2010 | | | 2009 | | Net sales | | | 226.9 | | | | 203.3 | | | | 206.5 | | | | | | | | | | | | | | | | 226.9 | | | | 203.3 | | | | 206.5 | | Cost of sales | | | –147.2 | | | | –129.1 | | | | –136.3 | | | | –1.2 | | | | –3.4 | | | | –4.2 | | | | –146.0 | | | | –125.7 | | | | –132.1 | | | | | | | | | | | | | | | | | | | | | | | | | | | | | | | | | | | | | | | Gross income | | | 79.7 | | | | 74.3 | | | | 70.2 | | | | –1.2 | | | | –3.4 | | | | –4.2 | | | | 80.9 | | | | 77.6 | | | | 74.4 | | Gross margin % | | | 35.1 | % | | | 36.5 | % | | | 34.0 | % | | | | | | | | | | | | | | | 35.7 | % | | | 38.2 | % | | | 36.0 | % | | | | | | | | | | | | | | | | | | | | | | | | | | | | | | | | | | | | | | Operating expenses | | | –59.3 | | | | –58.6 | | | | –60.0 | | | | –2.0 | | | | –3.5 | | | | –7.1 | | | | –57.3 | | | | –55.2 | | | | –52.9 | | Operating expenses as % of sales | | | 26.1 | % | | | 28.8 | % | | | 29.0 | % | | | | | | | | | | | | | | | 25.3 | % | | | 27.1 | % | | | 25.6 | % | Other operating income and expenses | | | 1.3 | | | | 2.0 | | | | 3.1 | | | | — | | | | — | | | | — | | | | 1.3 | | | | 2.0 | | | | 3.1 | | | | | | | | | | | | | | | | | | | | | | | | | | | | | | | | | | | | | | | Operating income before share in earnings of JVs and associated companies | | | 21.7 | | | | 17.6 | | | | 13.3 | | | | –3.2 | | | | –6.8 | | | | –11.3 | | | | 24.9 | | | | 24.4 | | | | 24.6 | | Operating margin % before share in earnings of JVs and associated companies | | | 9.6 | % | | | 8.7 | % | | | 6.5 | % | | | | | | | | | | | | | | | 11.0 | % | | | 12.0 | % | | | 11.9 | % | | | | | | | | | | | | | | | | | | | | | | | | | | | | | | | | | | | | | | Share in earnings of JVs and associated companies | | | –3.8 | | | | –1.2 | | | | –7.4 | | | | –0.6 | | | | –0.5 | | | | –1.3 | | | | –3.2 | | | | –0.7 | | | | –6.1 | | | | | | | | | | | | | | | | | | | | | | | | | | | | | | | | | | | | | | | Operating income | | | 17.9 | | | | 16.5 | | | | 5.9 | | | | –3.7 | | | | –7.3 | | | | –12.6 | | | | 21.6 | | | | 23.7 | | | | 18.5 | | Operating margin % | | | 7.9 | % | | | 8.1 | % | | | 2.9 | % | | | | | | | | | | | | | | | 9.5 | % | | | 11.7 | % | | | 9.0 | % | | | | | | | | | | | | | | | | | | | | | | | | | | | | | | | | | | | | | | Financial income and expense, net | | | 0.2 | | | | –0.7 | | | | 0.3 | | | | | | | | | | | | | | | | | | | | | | | | | | Taxes | | | –5.6 | | | | –4.5 | | | | –2.1 | | | | | | | | | | | | | | | | | | | | | | | | | | Net income | | | 12.6 | | | | 11.2 | | | | 4.1 | | | | | | | | | | | | | | | | | | | | | | | | | | EPS diluted (SEK) | | | 3.77 | | | | 3.46 | | | | 1.14 | | | | | | | | | | | | | | | | | | | | | | | | | | | | | | | | | | | | | | | | | | | | | | | | | | | | | | | | | | | | | | |
Professional Services
Net Sales in segment Professional Services increased by 14 percent during 2008, to SEK 49.0 billion in 2008 from SEK 42.9 billion in 2007. Growth measured in local currencies amounted to 13 percent compared with an estimated marked growth of some 10 percent. Managed services sales grew by 17 percent to 14.3 (12.2) billion, as the Company continued to win contracts for network operations and hosting services.
Multimedia
Net sales in segment Multimedia increased by 13 percent for comparable units i.e. excluding divestment of the enterprise PBX operations, to SEK 17.9 billion in 2008 from SEK 15.9 billion 2007. Revenue management and Service Delivery & Provisioning continued to show good growth while the mobile platform business was starting to experience effects of the weakening handset market.
Phones
Since the transfer of the operation of the Phones segment to Sony Ericsson Mobile Communications, on October 1, 2001, net salesThe non-IFRS financial measures presented herein are not reported for this segment.
Secondary Segments
The following regions increased their sales: North America by 34 percent, Latin America by 25 percent, Asia Pacific sales by 16 Percent, and Central and Eastern Europe Middle East and Africa by 9 percent. Western Europe decreased their sales by –2 percent .
Financial Resultsmeasures of Operations
In the external communication for 2008 non-IFRSfinancial performance calculated or presented under IFRS, but rather are measures are used in the income statement to provide meaningfulas supplemental information to the IFRS results. Since there were significant restructuring costs during 2008, but2009 and 2010 with relatively little benefit and consequently a significant impact on reported results and margins, and as there were insignificant restructuring charges in 2007, non-IFRS measurescertain income statement line items excluding restructuring charges, are presented as non-IFRS financial measures to facilitate analysis by indicating Ericsson’s underlying performance. However, theseNon-IFRS financial measures have limitations as analytical tools and should not be viewed in isolation or as substitutes to the IFRS measures.financial measures, and do not necessarily indicate whether cash flow will be sufficient or available to meet Ericsson’s requirements, and may not be indicative of our historical operating results, nor are such measures meant to be predictive of future results. Non-IFRS measures for 2011 have also been included to facilitate comparison with previous years.
The gross marginSales
2011 was 36.8 percent in 2008 compared to 39.3 percent in 2007 excluding restructuring charges. The decline was due to business mixa year with high proportionstrong sales growth of 12%, driven by strong demand for mobile broadband along with network rollout project which often also include significant third party content. A higher proportion of managed services sales with lower than group average gross margins contributed toservices. Sales were negatively impacted by the decline. strong SEK. Sales for comparable units, adjusted for currency exchange rate effects and hedging, increased 19%.ERICSSON ANNUAL REPORT ON FORM 20-F 20092012 Operating expensesIn 2011, the Company executed on its strategy to leverage its strengths in 2008 excluding restructuring charges were SEK –56.4 billion comparedthe growth areas mobile broadband, managed services, OSS and BSS. Due to SEK –52.0 billionthe technology cycle where mobile broadband is being rolled out, the business mix shifted to more coverage projects. Ericsson also implemented its strategy to capture new market share in 2007. Operating expenses excluding restructuring charges measuredthe network modernization projects in Europe, despite their initial lower margins.
In 2011, seven out of ten regions grew. In the year, there was an impact from slower operator spending after a period of high investments in capacity, especially in North America and Russia, as well as political unrest in certain countries. In the last quarter of the year, the Company also noticed some increased operator cautiousness due to uncertainties such as economic development and continued political unrest in certain countries. In 2011, the share of software sales declined to 23% (24%) of sales while the portion of hardware increased to 40% (37%). The increase in hardware is a percentage, changed from 28 percentresult of demand for mobile broadband products. In the short term, the software share might continue to decrease due to a higher portion of projects with a lot of hardware. Longer term, the software part should increase following more expansions and upgrades of networks. Services sales amounted to 37% (39%) in 2007 to 27 percent in 2008.2011. Excluding restructuring charges operating income declined by 22 percent to SEK 23.9 (30.6) billion with an operating margin of 11.4 (16.3) percent. Seasonality
The main reasons were the decline in grossCompany’s quarterly sales, income and a negative contributioncash flow from Sony Ericssonoperations are seasonal in nature, generally lowest in the first quarter of SEK –0,5 billion, compared with SEK 7.1 billionthe year and highest in 2007. Earnings per share (EPS) diluted was SEK 3.52 (6.84) down 49 percent. EPS declined substantially as EPS includes restructuring charges. Based on Ericsson’s strengthened market position relative to its peers, the Board considered the underlying earnings capacity and the financial position to be strong and proposed a dividend also for 2008, however reduced to SEK 1.85 (2.50) per share.
Financial Position
Net Cash was SEK 34.7(24.3) billion. The improved net cash position was largelyfourth quarter. This is mainly a result of the favorable cash flow from operations reflecting working capital efficiency improvements during 2008.seasonal purchase patterns of network operators.
Working Capital was SEK 100 (86) billion. ResultsMOST RECENT FIVE-YEAR AVERAGE SEASONALITY
| | | | | | | | | | | | | | | | | | | | First
quarter | | | Second
quarter | | | Third
quarter | | | Fourth
quarter | | Sequential change | | | –21 | % | | | 8 | % | | | –4 | % | | | 27 | % | Share of annual sales | | | 23 | % | | | 24 | % | | | 23 | % | | | 30 | % |
Financial numbers in this section are reported: for 2011, including restructuring charges for 2010, excluding restructuring charges. Gross margin Gross margin declined to 35.1% (38.2%) due to higher share of efforts to improve working capital efficiencies relating to receivables, inventoriescoverage projects, network modernization projects in Europe and payables were been partly offset by strong movements3G rollouts in currency translation effects. The improvement of cash contributed to the increaseIndia. Gross margin in working capital. Return on Equity was 8.2(17.2) percent. The return on equity,2010, including restructuring charges, developed unfavorably comparedamounted to 2007. This development36.5%.
Operating expenses To secure continued technology leadership, focus is on innovation and R&D. R&D expenses amounted to SEK 32.6 (29.9) billion. Spending on R&D as a percentage of sales was a major reason for the continued efforts to improve profitability through continued focus on a more competitive product portfolio, harvesting of market share gains and of acquisitions made as well as continued cost reductions. Cash Flow
14.4% (14.7%). In 2008 cash flow from operations2010, R&D spend including restructuring charges was SEK 24.0 (19.2) billion.31.6 billion or 15.5% of sales. The improvement from 2007 was largely attributable to a more favorable development of net operating assets which grew substantially less than Net Sales, asincrease in absolute number is a result of increased focus on working capital management.planned higher investments in radio, such as TD-LTE, IP and the acquired LG-Ericsson operations. In 2008 Ericsson received SEK 3.6 (3.9) billion in dividends from Sony Ericsson. Cash flow from investing activities was SEK –8,5 (–27.5) billion. During 2008, the company divested/acquired operations with less than SEK 1 (–26) billion net cash received. This was partly offset by short-term investments2012, R&D expenses of SEK –7.2 (–3.5)29–31 billion is estimated. The estimate includes amortizations/write-downs of intangible assets related to cash management.
In 2008 the cash flow from financing activities reached SEK –7.2 (6.3) billion. The negative cash flow was largely attributablemajor acquisitions previously made. However, currency effects may cause this to the dividend paid to shareholders.
Restructuring in 2008 and 2009
Impact on Networks operating income due to restructuring amounted to SEK 8.7 billion in 2009 compared with SEK 5.1 billion in 2008. This increase was primarily due to SEK 4.2 billion (SEK 0.5 billion) in impairment losses relating to the restructuring program decision to phase out certain products.
The impact on Professional Services in relation to restructuring was SEK 2.0 billion (SEK 1.3 billion) and for Multimedia SEK 0.4 billion (SEK 0.3 billion). Professional Services recognized no impairment losses, neither 2009 nor 2008 while the impact on restructuring for Multimedia was SEK 0.1 billion (SEK 0.0 billion).
change.ERICSSON ANNUAL REPORT ON FORM 20-F 2012 Selling and administrative expenses represented 11.8% of sales compared to 12.4% in 2010. The amount was SEK 26.7 (25.3) billion. In 2010, the amount including restructuring charges was SEK 27.1 billion, representing 13.3% of sales. In the year, there were positive effects from efficiency work along with the strong SEK. Operating margin before JVs Operating margin before share in JV earnings decreased to 9.6% (12.0%). However, in 2010, operating margin before share in JV earnings and including restructuring charges amounted to 8.7%. Share in earnings of JVs In 2011, Sony Ericsson reported a loss. The loss reflects intense competition, price erosion, restructuring charges and supply chain issues following the earthquake and tsunami in Japan. Ericsson’s share in Sony Ericsson’s income before tax was SEK –1.2 (0.9) billion. In 2010, Ericsson’s share amounted to SEK 0.7 billion including restructuring charges. ST-Ericsson reported a loss also in 2011. ST-Ericsson is currently in a shift from legacy to new products. Ericsson’s share in ST-Ericsson’s income before tax, adjusted to IFRS, was SEK –2.7 (–1.5) billion. In 2010, the loss amounted to SEK –1.8 billion including restructuring charges. Operating income Operating income was SEK 17.9 (23.7) billion. However, in 2010, operating income including restructuring charges amounted to SEK 16.5 billion. Financial net The financial net was SEK 0.2 (–0.7) billion. The difference is mainly attributable to a higher interest net of SEK 0.8 billion compared to 2010. Taxes The tax expense for the year was SEK 5.6 (4.5) billion or 30.6% (28.8%) of income after financial items. The tax rate may vary between years depending on business and geographic mix. The tax rate excluding joint ventures and associated companies was 26.4% (25.7%) due to lower tax rates from the loss-making joint ventures. Net income Net income increased 12% to SEK 12.6 (11.2) billion driven by higher sales and lower restructuring charges. Earnings per share, diluted Earnings per share increased 9% to SEK 3.77 (3.46). The Board of Directors proposes a dividend of SEK 2.50 (2.25). This represents an increase of 11%. Restructuring charges Total restructuring charges were SEK 3.2 (6.8) billion, excluding joint ventures. Cash outlays that have been provided for were SEK 3.2 (3.3) billion. At the end of the year, cash outlays of SEK 1.3 billion remain to be made. In 2012, restructuring charges of approximately SEK 4 billion are estimated. ERICSSON ANNUAL REPORT ON FORM 20-F 2012 Ericsson’s share in Sony Ericsson’s restructuring charges amounted to SEK 0.4 (0.2) billion. Ericsson’s share in ST-Ericsson’s restructuring charges was SEK 0.1 (0.3) billion. RESEARCH AND DEVELOPMENT PROGRAM | | | | | | | | | | | | | | | | 2011 | | | 2010 | | | 2009 | | Expenses (SEK billion)1) | | | 32.6 | | | | 29.9 | | | | 27.0 | | As percent of Net sales | | | 14.4 | % | | | 14.7 | % | | | 13.1 | % | Employees within R&D as of December 312) | | | 22,400 | | | | 20,800 | | | | 18,300 | | Patents2) | | | 30,000 | | | | 27,000 | | | | 25,000 | |
| 1) | Excluding restructuring charges for 2009 and 2010. |
| 2) | The number of employees and patents are approximate. |
FINANCIAL POSITION CONSOLIDATED BALANCE SHEET (ABBREVIATED) | | | | | | | | | | | | | December 31, SEK billion | | 2011 | | | 2010 | | | 2009 | | ASSETS | | | | | | | | | | | | | Non-current assets, total | | | 81.5 | | | | 83.4 | | | | 87.4 | | of which intangible assets | | | 44.0 | | | | 46.8 | | | | 48.2 | | of which property, plant and equipment | | | 10.8 | | | | 9.4 | | | | 9.6 | | of which financial assets | | | 13.7 | | | | 14.5 | | | | 15.3 | | of which deferred tax assets | | | 13.0 | | | | 12.7 | | | | 14.3 | | Current assets, total | | | 198.8 | | | | 198.4 | | | | 182.4 | | of which inventory | | | 33.1 | | | | 29.9 | | | | 22.7 | | of which trade receivables | | | 64.5 | | | | 61.1 | | | | 66.4 | | of which other receivables/financing | | | 20.7 | | | | 20.2 | | | | 16.6 | | of which short-term investments, cash and cash equivalents | | | 80.5 | 2) | | | 87.2 | | | | 76.7 | | Total assets | | | 280.3 | | | | 281.8 | | | | 269.8 | | | | | | EQUITY AND LIABILITIES | | | | | | | | | | | | | Equity | | | 145.3 | | | | 146.8 | | | | 141.0 | | Non-current liabilities | | | 38.1 | | | | 38.3 | | | | 43.3 | | of which post-employment benefits | | | 10.0 | | | | 5.1 | | | | 8.5 | | of which borrowings | | | 23.3 | | | | 27.0 | | | | 30.0 | | of which other non-current liabilities | | | 4.8 | | | | 6.2 | | | | 4.8 | | Current liabilities | | | 97.0 | | | | 96.8 | | | | 85.5 | | of which provisions | | | 6.0 | | | | 9.4 | | | | 12.0 | | of which current borrowings | | | 7.8 | | | | 3.8 | | | | 2.1 | | of which trade payables | | | 25.3 | | | | 25.0 | | | | 18.9 | | of which other current liabilities | | | 58.0 | | | | 58.6 | | | | 52.5 | | Total equity and liabilities1) | | | 280.3 | | | | 281.8 | | | | 269.8 | |
| 1) | Of which interest-bearing liabilities and post-employment benefits SEK 41.0 (35.9) billion. |
| 2) | Including loan to ST-Ericsson of SEK 2.8 billion. |
Ericsson’s strategy is to maintain a strong balance sheet including a sufficiently large cash position to ensure the financial flexibility to operate freely and to capture business opportunities. This has been particularly important during the past years’ difficult macroeconomic and financial market situation. ERICSSON ANNUAL REPORT ON FORM 20-F 2012 By maintaining a strong cash position, the Company can also maintain an active strategy for strategic mergers and acquisitions. An important focus area is the monitoring of working capital. Major efforts have been made during the year in order to reduce days sales outstanding and inventory turnover days as well as to increase payable days. The target for payable days was met, while the other two targets were not achieved. The efforts to further reduce working capital will continue in 2012 and the working capital targets are the same as previous years. In 2011, the dividend was SEK 2.25 per share. The Board of Directors will propose to the Annual General Meeting 2012 a dividend of SEK 2.50 per share. This represents a total dividend of approximately SEK 8.2 billion. The proposal reflects year 2011’s earnings and balance sheet structure, as well as coming years’ business plans and expected economic development. Non-current assets Intellectual property rights, brands and other intangible assets decreased to SEK 13.1 (16.7) billion due to amortizations. Customer financing, current and non-current, decreased slightly to SEK 4.2 (4.4) billion. Current assets Inventory levels increased during the year by SEK 3.2 billion due to higher sales and increased share of coverage projects. At year end, inventory was SEK 33.1 (29.9) billion. The higher inventory level followed a higher level of work in progress in the regions. The target of inventory turnover days less than 65 days was not reached and improvement efforts will continue in 2012. Trade receivables: Days sales outstanding reached 91 (88) days at year-end. This reflects a higher portion of coverage projects and higher sales volumes. The Company’s nominal credit losses have historically been low and continued to be so in 2011. Net cash decreased to SEK 39.5 (51.3) billion, mainly due to a negative change in net operating assets, investing and dividend paid to shareholders. Pension liabilities increased due to lower discount rate and this impacted net cash negatively. Equity Equity decreased by SEK –1.5 billion to SEK 145.3 (146.8) billion. Net income was SEK 12.6 (11.2) billion and dividends of SEK 7.5 (6.7) billion was paid during the year. The equity ratio was maintained at a healthy level of 52% (52%). Return on equity increased to 8.5% (7.8%), primarily due to higher sales and lower restructuring charges. Return on capital employed (ROCE) was 11.3% (9.6%). In 2010, ROCE excluding restructuring charges was 13.6%. Non-current liabilities Post-employment benefits related to defined benefit plans increased to SEK 10.0 (5.1) billion. In 2011 there was a decrease in discount rates, and plan assets yielded lower than expected. Consequently, the Company experienced an increase in the net pension liability and the funded ratio (plan assets as percentage of defined benefit obligations) decreased to 77% (89%). ERICSSON ANNUAL REPORT ON FORM 20-F 2012 MemorandumCurrent liabilities
Provisions declined to SEK 6.0 (9.4) billion. SEK 1.3 (3.2) billion were related to restructuring. The cash outlays of provisions were SEK 6.0 (7.2) billion. The lower amount of provisions is mainly due to lower restructuring. In addition, the business mix with more coverage projects as well as good performance in both hardware and Articlessoftware for new products introduced decreased the need for warranty provisions. There is also an effect of Associationimproved project management as well as geographical mix. Provisions will fluctuate over time, depending on business mix, market mix and technology shifts. Payable days was unchanged at 62 (62) days. The target of payable days of above 60 days was met. Non-current borrowings decreased to SEK 23.3 (27.0) billion. No major changes were made in the debt maturity profile during 2011. Debt of SEK 3.4 billion is maturing in 2012 and SEK 5.4 billion in 2013. The Company also has unutilized committed credit facilities of USD 2.0 billion available, maturing in 2014. Off-balance sheet arrangements There are currently no material off-balance sheet arrangements that have, or would be reasonably likely to have, a current or anticipated effect on the Company’s financial condition, revenues, expenses, result of operations, liquidity, capital expenditures or capital resources. CASH FLOW CASH FLOW (ABBREVIATED) JANUARY-DECEMBER | | | | | | | | | | | | | SEK billion | | 2011 | | | 2010 | | | 2009 | | Net income | | | 12.6 | | | | 11.2 | | | | 4.1 | | Income reconciled to cash | | | 25.2 | | | | 23.7 | | | | 21.0 | | Changes in operating net assets | | | –15.2 | | | | 2.9 | | | | 3.5 | | Cash flow from operating activities | | | 10.0 | | | | 26.6 | | | | 24.5 | | Adjusted operating cash flow1) | | | 13.2 | | | | 29.8 | | | | 28.7 | | Cash flow from investing activities | | | 4.5 | | | | –12.5 | | | | –37.5 | | of which capital expenditures, sales of PP&E, product development | | | –6.1 | | | | –5.2 | | | | –4.9 | | of which acquisitions/divestments, net | | | –3.1 | | | | –2.8 | | | | –18.1 | | of which short-term investments for cash management purposes and other investing activities | | | 13.8 | | | | –4.5 | | | | –14.5 | | Cash flow before financing activities | | | 14.5 | | | | 14.0 | | | | –13.0 | | | | | | | | | | | | | | | Cash flow from financing activities | | | –6.5 | | | | –5.7 | | | | –1.7 | | | | | | | | | | | | | | | Cash conversion (Cash flow from operating activities divided by income reconciled to cash) | | | 40 | % | | | 112 | % | | | 117 | % | | | | | | | | | | | | | | Gross cash (Cash, cash equivalents and short-term investments) | | | 80.5 | 2) | | | 87.2 | | | | 76.7 | | | | | | | | | | | | | | | Net cash (Gross cash less interest-bearing liabilities and post-employment benefits) | | | 39.5 | | | | 51.3 | | | | 36.1 | | | | | | | | | | | | | | |
| 1) | Cash flow from operations excl. restructuring cash outlays that have been provided for. |
| 2) | Including loan to ST-Ericsson of SEK 2.8 billion. |
In 2011, gross cash decreased by SEK 6.6 billion to SEK 80.5 (87.2) billion. The net income reconciled to cash of SEK 25.2 billion was offset by a change in net operating assets of SEK –15.2 billion and investing activities of SEK –9.9 billion. Dividends to shareholders amounted to SEK –7.5 (–6.7) billion. Net cash decreased to SEK 39.5 (51.3) billion. ERICSSON ANNUAL REPORT ON FORM 20-F 2012 Cash flow from operating activities The adjusted operating cash flow was negatively impacted by higher working capital. During 2011, cash flow was negatively impacted by a significant increase in working capital as a result of higher sales and more projects. Cash flow from investing activities Cash outlays for regular investing activities increased to SEK –6.1 (–5.2) billion. Acquisitions and divestments during the year were net SEK –3.1 (–2.8) billion, with the major items Nortel’s GDNT operation in China and Nortel’s Multi-Service Switch business (MSS). The Nortel patent portfolio was acquired in partnership with other industry players. Cash flow for short-term investments for cash management purposes and other investing activities was net SEK 13.8 (–4.5) billion, mainly attributable to changes between short-term investments and cash and cash equivalents. Capital expenditures Annual capital expenditures are normally around two percent of sales and are expected to remain at this level. This corresponds to the needs for keeping and maintaining the current capacity level, including the introduction of new technology and methods. The expenditures are largely related to test equipment in R&D units, network operations centers as well as manufacturing and repair operations. The Board of Directors reviews the Company’s investment plans and proposals. The Company has sufficient cash and cash generation capacity to fund expected capital expenditures without external borrowings in 2012. We believe that the Company’s property, plant and equipment and the facilities the Company occupies are suitable for its present needs in most locations. As of December 31, 2011, no material land, buildings, machinery or equipment were pledged as collateral for outstanding indebtedness. CAPITAL EXPENDITURES 2007–2011 | | | | | | | | | | | | | | | | | | | | | SEK billion | | 2011 | | | 2010 | | | 2009 | | | 2008 | | | 2007 | | Capital expenditures | | | 5.0 | | | | 3.7 | | | | 4.0 | | | | 4.1 | | | | 4.3 | | of which in Sweden | | | 1.7 | | | | 1.4 | | | | 1.3 | | | | 1.6 | | | | 1.3 | | as percent of net sales | | | 2.2 | % | | | 1.8 | % | | | 1.9 | % | | | 2.0 | % | | | 2.3 | % |
Cash flow from financing activities Cash flow from financing activities was SEK –6.5 billion. Dividends paid were SEK –7.5 (–6.7) billion and other financing activities net amounted to SEK 1.0 billion. Cash conversion Cash conversion was 40% (112%), below the target of 70%. Over the years 2008–2010, cash conversion was above target. The cash conversion in 2011 was negatively impacted by higher working capital. ERICSSON ANNUAL REPORT ON FORM 20-F 2012 Restricted cash Cash balances in certain countries with restrictions on transfers of funds to the Parent Company as cash dividends, loans or advances amounted to SEK 13.9 (10.8) billion. In this context all countries with currency restrictions are included. In most cases the currency is nonconvertible and flow of funds in a foreign currency requires approval by a central bank or similar. Out of the total amount, China, India, Korea, Brazil and Indonesia are the top five countries accounting for SEK 9.6 billion. BUSINESS RESULTS—REGIONS SALES PER REGION AND SEGMENT 2011 AND 2010 | | | | | | | | | | | | | | | | | | | | | | | | | | | | | | | | | | | | Networks | | | Global Services | | | Multimedia | | | | | | | | SEK billion | | 2011 | | | Percent
change | | | 2011 | | | Percent
change | | | 2011 | | | Percent
change | | | Total
2011 | | | Percent
change | | North America | | | 28.9 | | | | –5% | | | | 18.6 | | | | 5% | | | | 1.3 | | | | 7% | | | | 48.8 | | | | –1% | | Latin America | | | 11.5 | | | | 25% | | | | 9.5 | | | | 23% | | | | 1.0 | | | | 5% | | | | 22.0 | | | | 23% | | Northern Europe and Central Asia | | | 9.7 | | | | 34% | | | | 5.0 | | | | 17% | | | | 0.5 | | | | –20% | | | | 15.2 | | | | 25% | | Western and Central Europe | | | 7.8 | | | | –7% | | | | 10.3 | | | | –2% | | | | 1.0 | | | | –7% | | | | 19.0 | | | | –4% | | Mediterranean | | | 10.7 | | | | 1% | | | | 11.8 | | | | 11% | | | | 1.3 | | | | –5% | | | | 23.8 | | | | 5% | | Middle East | | | 7.4 | | | | 4% | | | | 6.8 | | | | 4% | | | | 1.2 | | | | –13% | | | | 15.5 | | | | 2% | | Sub-Saharan Africa | | | 5.9 | | | | 63% | | | | 3.4 | | | | –26% | | | | 0.9 | | | | –12% | | | | 10.2 | | | | 11% | | India | | | 6.1 | | | | 19% | | | | 3.1 | | | | 13% | | | | 0.5 | | | | –25% | | | | 9.8 | | | | 13% | | China and North East Asia | | | 27.8 | | | | 63% | | | | 9.9 | | | | 19% | | | | 0.5 | | | | –5% | | | | 38.2 | | | | 47% | | South East Asia and Oceania | | | 7.6 | | | | –3% | | | | 5.6 | | | | –14% | | | | 0.7 | | | | 26% | | | | 13.9 | | | | –7% | | Other* | | | 9.1 | | | | 53% | | | | –0.2 | | | | –132% | | | | 1.7 | | | | 57% | | | | 10.6 | | | | 41% | | | | | | | | | | | | | | | | | | | | | | | | | | | | | | | | | | | Total | | | 132.4 | | | | 17% | | | | 83.9 | | | | 5% | | | | 10.6 | | | | 1% | | | | 226.9 | | | | 12% | | Share of total | | | 58 | % | | | | | | | 37 | % | | | | | | | 5 | % | | | | | | | 100 | % | | | | | | | | | | | | | | | | | | | | | | | | | | | | | | | | | | | | | |
| * | Other includes sales of e.g. mobile broadband modules, cables, power modules as well as licensing and IPR. Mobile broadband modules are sold directly by business unit Networks to PC/netbook manufacturers. A central IPR unit manages sales of licenses to equipment vendors or others who wish to use Ericsson’s patented technology. TV solutions are sold both through other equipment vendors as resellers and directly by business unit Multimedia to cable TV operators. |
Regional development The regions are the Company’s primary sales channels. Ericsson reports ten regions, mirroring the internal geographical organization. North America North America is the world’s most developed region in terms of smartphone penetration and mobile data usage. Operators are continuing the implementation of tiered pricing to capitalize on changing user behavior. Half of the net additions of subscriptions in the second half of 2011 came from connected devices or machine to machine communication. Through the year multiple LTE network buildouts have been initiated and launched in both the US and Canada, and Ericsson is a leading supplier to these projects. The networks business developed slower in the second half of 2011 after a period of high operator investments in network capacity. Operators’ focus on cash flow management and operator consolidation also had a negative impact. This was to a large degree offset by a positive uptake in services and multimedia. ERICSSON ANNUAL REPORT ON FORM 20-F 2012 Latin America There is a push for mobile broadband in Latin America, driven by consumer demand for 3G services. Smartphone penetration is still low, but is expected to grow as these handsets become more affordable. Operators show an increasing interest in network performance and Ericsson is taking part in OSS/BSS transformation projects in managed services deals, including network sharing arrangements. Northern Europe and Central Asia The Nordics are mature and advanced markets with strong 3G coverage and LTE commercially available in all countries. Nordic operators are increasingly shifting their business models towards network sharing and the outsourcing of network operations. Deployment of 3G networks started later in the eastern part of the region. Here, operators are focusing on providing coverage and quality in the networks. Mobile broadband is growing rapidly in the region. Many consolidation activities, of both operators and networks, are taking place. In the latter half of the year, network sales slowed, especially in Russia, following strong operator investments in network capacity and coverage. Western and Central Europe Modernization of networks accelerated across the region in 2011. Operator focus is on replacing old 2G/3G equipment with modern, more efficient multi-standard radio base stations. Interest in LTE is limited, with certain countries still to allocate spectrum for this. Penetration of mobile broadband is high, with some operators’ smartphone shipments representing more than half of their totals. Data revenues are growing and represent over 40% with some operators. There is also high interest in managed services and network sharing. Mediterranean This region has seen an impact from weak economies as well as political unrest in Northern Africa. The uptake of mobile broadband is mixed, with the strongest growth in the south west parts of the region. Here, operators are implementing a range of tiered pricing models. Mobile data usage is high in the Mediterranean area, due to the low availability of fixed broadband. Most operators’ investments are for 3G coverage and in the second half of the year, network modernization projects took off. Middle East The Middle East was impacted by political unrest in several countries and by delays in license auctions. As a consequence, some operators have postponed their infrastructure investments and increased their focus on efficiencies. The region has lower penetration rates, mobile broadband adoption and mobile data usage than the world average. The crucial driver for increasing these parameters is the affordability of smartphones. Rollouts of LTE have started in some parts of the region. ERICSSON ANNUAL REPORT ON FORM 20-F 2012 Sub-Saharan Africa Mobile penetration continues to increase rapidly in Africa. Operator focus is still on 2G coverage and capacity buildouts, although some operators are building 3G coverage. With smartphones in the region set to become cheaper, operators are focusing on creating efficiency in their networks to allow them to capitalize on future uptake. Inflation and competition are also driving operators’ need for increased efficiency. This leads them to focus on power consumption reductions and managed services solutions. There is also a need for operators to harmonize policy frameworks to increase data take-up. India Initial 3G rollouts reached a temporary peak in 2011. The Indian market is fragmented and in the near future a telecom policy reform is expected which might make operator consolidation easier. Besides the need for affordable smartphones, availability of dual SIM card phones is a key component in driving mobile data uptake. The Indian market is highly competitive, which drives operator interest in managed services and network sharing. China and North East Asia China’s operators have focused on building 2G capacity with GPRS/EDGE to meet the increase in mobile data traffic from smartphones. In 2011, large scale trials for TD-LTE took place with China Mobile. In Korea and Japan, 3G capacity and LTE coverage rollouts are ongoing, driven by high smartphone penetration, mobile broadband adoption and mobile data usage. In Korea, three LTE networks are live, and Ericsson is a supplier to all of them. South East Asia and Oceania Parts of this region, such as Australia and Singapore, have high penetration rates, adoption and usage. In these areas, LTE is also starting to emerge. Indonesia is moving towards 3G, however take-up is hampered by the affordability of devices. 3G auctions are yet to take place in some markets. Coverage projects, where old equipment is replaced with new, are underway across most markets, as operators build for data growth and seek operating cost efficiencies. The decline in network sales is due to reduced 2G business in Vietnam. The services business declined due to a concluded managed services contract in Australia. BUSINESS RESULTS—SEGMENTS Networks HIGHLIGHTS IN 2011 Increased market share in mobile network equipment by 6 percentage points to 38% (estimated) Market share of more than 60% in LTE Smart Services Router family introduced. Volume deliveries expected in 2012 ERICSSON ANNUAL REPORT ON FORM 20-F 2012 Sales Networks sales increased 17% to SEK 132.4 billion, negatively impacted by a strong SEK in 2011. The increase was an effect of continued high sales in mobile broadband-related equipment including packet core, IP routers and microwave-based backhaul. Demand was especially strong in regions China and North East Asia and North America. The year was characterized by high volumes of mobile broadband equipment and ramp-up of the multi-standard radio base station RBS 6000. The product introduction of the RBS 6000 has been the quickest and most successful in the Company’s history. At the end of the year, the first RBS 6000 with CDMA functionality was shipped. The RBS 6000 accounts for close to 100% of all deliveries of GSM/WCDMA/LTE radio base stations. In the fourth quarter, shipping of the IP Edge router, the Smart Services Router SSR 8000 family, and the Antenna Integrated Radio unit (AIR) also commenced. In 2010, Ericsson acquired Nortel’s CDMA business in order to strengthen its position in North America. Ericsson is now established as the leader in this market. CDMA sales increased slightly in 2011. At the end of the year the Company saw the expected decline in CDMA sales and subsequent rapid shift to LTE. The CDMA acquisition has created substantial value for the Company. In March, the earthquake and tsunami in Japan caused temporary delays in the supply chain, but by the third quarter lead times were back to normal. Profitability Operating margin decreased to 13% (15%). The margin was negatively impacted by planned R&D investments to accelerate technology leadership. Operating margin in 2010 was 11% including restructuring charges. Cost structure In the Networks segment, cost of sales is quite large and to a large part variable. To reduce variable cost, the Company works with product rationalization and product substitution. R&D is a significant cost item and for this reason it is important to focus on R&D effectiveness and efficiency. It is essential to ensure global platforms and common components across the whole portfolio. To maximize the outcome of R&D investment, the Company also seeks to give R&D sites clear accountability and the same IS/IT environment. The networks business Sales to network operators are normally based on multi-year frame agreements after an initial open tender. During the frame agreement, software, equipment, services and spare parts are called off according to price lists. Prior to the introduction of the multi-standard radio base station RBS 6000, operators could have co-siting, with one supplier for GSM and another for WCDMA. Today, a multi-standard approach means that all technologies are supported by one radio base station. Any supplier has to be equally capable of all technologies. R&D investments and scale are therefore essential for a supplier to stay competitive. The footprint of multi-standard radio access network increases opportunities for additional network business, e.g. backhaul and core networks. Following radio and core footprint is a significant software sales opportunity based on capacity, functionality and new features. ERICSSON ANNUAL REPORT ON FORM 20-F 2012 Competitors In the networks segment, Ericsson competes mainly with telecommunication equipment suppliers such as Alcatel-Lucent, Cisco, Huawei, Juniper, Nokia Siemens Networks, Samsung and ZTE. The Company also competes with local and regional manufacturers and providers of telecommunications equipment. Global Services HIGHLIGHTS IN 2011 More than 2 billion subscribers in networks for which Ericsson provides support Over 900 million subscriber in networks managed by Ericsson 500 million subscribers in network operation contracts Sales Global Services sales increased 5% to SEK 83.9 (80.1) billion, driven by network rollout, consulting and systems integration. Professional Services sales were SEK 58.8 billion, up 1% from 2010. Currency adjusted sales of Professional Services increased 7%. The increase is mainly a result of increased sales of consulting and systems integration. Managed Services sales decreased by –1% to SEK 21.0 billion. Currency adjusted sales increased 7%. The growth reflects the 70 (54) signed managed services contracts, of which 32 (26) were extensions or expansions. More than 60% of Professional Services sales were recurring. Network Rollout sales amounted to SEK 25.1 (21.6) billion, an increase of 16%, driven by high volumes of network modernization. Profitability Global Services’ operating margin decreased to 7% (11%). The margin was negatively impacted by a loss in Network Rollout. Operating margin in 2010 was 8% including restructuring charges. Operating margin for Professional Services amounted to 13% (15%). Operating margin in 2010 was 11% including restructuring charges. Operating margin for Network Rollout amounted to –8% (1%), due to high activity levels related to network modernization projects in Europe and 3G rollouts in India. Operating margin in 2010 was 0% including restructuring charges. Cost structure In the services segment, almost all cost resides in cost of sales and the majority of the cost is related to employee costs. A few years ago, the cost of sales base was to a higher degree variable. With the increasing share of managed services, the portion of fixed costs has increased, which makes it important to find scale by winning more deals in the same geographical area. Another measure to keep cost down is to establish a one-to-many delivery model. The development of global tools, methods and processes are also crucial in order to secure efficiencies and knowledge sharing. ERICSSON ANNUAL REPORT ON FORM 20-F 2012 In managed services, Ericsson often insources employees from the customer. In the transition period, restructuring costs are taken, e.g. for replacement of IS/IT systems and migration of employees into new systems and premises. In the transformation phase, following the transition, synergies are carried through. The services business Ericsson’s offering covers all areas within an operator’s operational scope. The Company’s service offering includes consulting, systems integration, managed services, network deployment and integration, education and support services. Ericsson provides services for both mobile and fixed telecom networks as well as for IT and broadcast networks and in some cases for adjacent industries such as the utilities industry. Most often operators turn to Ericsson for support in a certain part of their operations. Contracts for managed services and customer support are typically for five to seven years. Payments with regularity provide a lower rate of working capital. Consulting and systems integration contracts are shorter and paid after fulfillment of contract. In managed services deals the contracts are normally split into fixed and variables, where the variables are a smaller part. The invoicing is based on fulfillment of certain key performance indicators and projects. When an operator explores the possibility of a managed services deal, the financial strength of the supplier is a prerequisite. Network rollout includes coverage and modernization projects with a large part of third-party sourcing, making it a lower-margin business. The Company rolls out its own equipment, but also has high multi-vendor skills in all other parts of the services business. Competitors Competition in services includes the traditional telecommunication equipment suppliers. The Company also competes with companies such as Accenture, HP, IBM, Oracle, Tata Consultancy Services and Tech Mahindra. Among the competition is also a large number of smaller but specialized companies operating on a local or regional basis. Multimedia (CHANGED NAME TO SUPPORT SOLUTIONS IN 2012) HIGHLIGHTS IN 2011 13 new contracts signed for mobile broadband charging World’s largest IPTV upgrade in Taiwan 11 new customers for convergent charging and billing Sales Multimedia sales increased 1% to SEK 10.6 (10.5) billion, negatively impacted by political unrest in the Middle East and weak development in India. Profitability Operating margin was –5% (–4%). Restructuring charges had no material impact on profitability. ERICSSON ANNUAL REPORT ON FORM 20-F 2012 Cost structure In the multimedia segment, cost of sales is low and the majority is variable, due to the fact that third party hardware is used, on which the Company implements its software. Multimedia is a software business with a high degree of fixed R&D cost for software development. The OSS and BSS business The OSS/BSS business is divided into two different sales types: Transformation sales Simplification and consolidation of processes, operations, systems and platforms. Key components are software solutions, consulting and systems integration. Typically these projects last for 18–36 months. The software part represents 25–40% of the contract value and the rest is consulting and systems integration. Product sales Product sales is mainly expansions and upgrades, e.g. upgrading from Ericsson Charging System version 4 to 5. Key components are software solutions and systems integration. Typically these projects last for 1–12 months. The software part represents 70–90% of the contract value and the rest is systems integration. Telcordia acquisition In 2011, Ericsson announced the acquisition of Telcordia, a global leader in the development of software and services for OSS/BSS. The price was USD 1.15 billion in an all cash transaction, on a cash and debt-free basis. The acquisition is expected to be accretive to Ericsson’s earnings per share within twelve months. Telcordia has approximately 2,600 employees. During its last fiscal year, ended January 31, 2011, Telcordia generated revenues of USD 739 million. Telcordia’s revenues will be split between segments Multimedia and Global Services according to portfolio mix. With the acquisition, Ericsson aspires to a leading position in the OSS and BSS market. Competitors In the multimedia segment, Ericsson competes in rather fragmented markets with many local players. Competitors vary depending on the solution being offered. In the OSS and BSS market, they include many of the traditional telecommunication equipment suppliers as well as IT suppliers, such as Amdocs, Comverse and Oracle. Competition in the TV business includes Harmonic and Thompson. Sony Ericsson Sony Ericsson is a 50/50 joint venture between Sony Corporation and Ericsson, established in 2001. Sony Ericsson is accounted for according to the equity method. In October 2011, it was announced that Sony Corporation would acquire Ericsson’s 50% share in Sony Ericsson. As part of the deal, Sony and Ericsson will also enter into a broad IP cross-licensing agreement and create a wireless connectivity initiative to drive connectivity across multiple platforms. The transaction is a logical strategic step that makes it possible for Ericsson to focus on enabling connectivity for all devices. Sony Ericsson will become a wholly-owned subsidiary of Sony and integrated into Sony’s broad platform of network-connected consumer electronics products. The agreed cash consideration for the transaction is a EUR 1.05 billion cash payment. ERICSSON ANNUAL REPORT ON FORM 20-F 2012 Sony Ericsson’s units shipped in 2011 decreased by –20% to 34.4 (43.1) million while the average selling price increased by 4% to EUR 152 (146). Sales decreased by –17% to EUR 5.2 (6.3) billion. In 2011, Sony Ericsson had a market share of 10% in the smartphone market, measured in units, and 10% measured in value. Gross margin decreased during the year to 28% (29%) attributed to product and geographic mix. Income before taxes, including restructuring charges, was EUR –0.24 (0.15) billion. Income decreased during the year due to declining gross margin and increased operating expenses. The result includes restructuring charges of EUR 93 million. Ericsson’s share in Sony Ericsson’s income before taxes was SEK –1.2 (0.7) billion. Sony Ericsson’s primary competitors include Apple, HTC, LG, Motorola, Nokia, RIM and Samsung. ST-Ericsson ST-Ericsson is a 50/50 joint venture between STMicroelectronics and Ericsson, established in February, 2009. ST-Ericsson is accounted for according to the equity method. At the end of 2011, ST-Ericsson was still in a shift from legacy to new products. Though its path to success is challenging, ST-Ericsson is, when entering 2012, continuing to focus on securing the successful execution and delivery of its new products to customers while lowering its break-even point. The changes in the business environment at a large customer during 2011 reduced demand for legacy products and delayed the ramp-up of new products with that customer. In the light of the business environment at the end of 2011, ST-Ericsson’s CEO is reviewing the company’s strategic plan and financial prospects. Ericsson, together with its partner STMicroelectronics, is firmly committed to supporting ST-Ericsson in the transition to turn-over to sustainable profitability and cash generation. As a result of the strategic review, Ericsson may consider additional actions to solidify and accelerate ST-Ericsson’s path to profitability. In such an event, or in case of a significant worsening of business prospects, the value of ST-Ericsson for Ericsson could decrease to a value significantly lower than the current carrying amount of ST-Ericsson on Ericsson’s books and Ericsson might be required to take an impairment charge. Sales in 2011 declined –28% to USD 1.7 (2.3) billion. The operating loss for the year, adjusted for restructuring costs, was USD –0.7 (–0.4) billion. ST-Ericsson reports in US-GAAP. Ericsson’s share in ST-Ericsson’s income before taxes, adjusted to IFRS, was SEK –2.7 (–1.8) billion. Adjustments for IFRS compliance mainly consist of capitalization of R&D expenses for hardware development. The Company’s net financial position was USD –798 (–82) million at year-end. At the end of the year, ST-Ericsson had utilized USD 800 million of a short-term credit facility granted on a 50/50 basis by the parent companies. In December 2011, a new President and CEO of ST-Ericsson was appointed. ST-Ericsson’s major competitor is Qualcomm. The market is growing in complexity as several new operating systems for handsets and other devices have been launched, e.g. Google’s Android, Microsoft’s Windows phone and Samsung’s Bada. MEMORANDUM AND ARTICLES OF ASSOCIATION Telefonaktiebolaget LM Ericsson is entered under no. 556016–0680 in the Company Register kept by the Swedish Companies Registration Office. Our Company’s objective and purposes are described in §2 of the Articles of Association. ERICSSON ANNUAL REPORT ON FORM 20-F 2012 Our Articles of Association do not stipulate anything regardingregarding: a)
a director’s power to vote on a proposal, arrangement, or contract in which the director is materially interested b) our directors’ power to vote for compensation to themselves c) our directors’ borrowing powers d) retirements rules for our directors or e) the number of shares required for a director’s qualification. Applicable provisions are found in the Swedish Companies Act, as referred to in “Certain Powers of Directors and the President” below. There are no age limit restrictions for directors and they are not required to own any shares in the Company. Share Capital, Increases of Share Capital and Preferential Rights of Shareholders The Articles of Association of Ericsson provide that the share capital of the Company may not be less than SEK 6,000 million6,000,000,000 nor more than SEK 24,000 million,24,000,000,000, and that the number of shares in the Company shall amount to no less than 3,000,000,000 and no more than 12,000,000,000. The registered share capital is SEK 16,366,758,67816,525,258,678 and the Company has in total issued SEK 3,273,351,7353,305,051,735 shares. The Company’s shares are divided into three series: Class A shares, Class B shares and Class C shares; however, no Class C shares are currently outstanding. Under the Swedish Companies Act of 2005, applicable as of January 1, 2006 (the “Swedish Companies Act”), shareholders must approve each issue of additional shares either by deciding on the share issue at a shareholders’ meeting, or by a shareholders’ approval of a decision on a share issue by the Board, or by giving an authorization to the Board to decide about a share issue. If we decide to issue new Class A, Class B and Class C shares by means of a cash issue, or an issue against payment through set-off of claims, Class A, Class B and Class C shareholders (except for Ericsson and its subsidiaries, in the event they hold shares in Ericsson) have a primary preferential right to subscribe for new shares of the same type in relation to the number of shares previously held by them. Shares not subscribed for through a preferential right shall be offered to all shareholders for subscription on a pro rata basis. If we decide to issue new shares of only one series by means of a cash issue or an issue against payment through set-off of claims, all shareholders, regardless of whether their shares are Class A, Class B or Class C, are entitled to a preferential right to subscribe for new shares in proportion to the number of shares previously held by them. Shareholders may vote to waive shareholders’ preferential rights at a general meeting. If we decide to issue warrants or convertibles through a cash issue or an issue against payment through set-off of claims, the shareholders have preferential rights to subscribe to warrants as if the issue were of the shares that may be subscribed to pursuant to the warrant and, respectively, preferential rights to subscribe to convertibles as if the issue were of the shares that the convertibles may be converted to. The above does not constitute any restriction to waive the shareholders’ preferential rights when deciding on either a cash issue, an issue against payment through set-off of claims, an issue of warrants or an issue of convertibles. Dividends Our Class A and Class B shareholders have the same right to dividends, while Class C shareholders have a right to a yearly dividend as described in article 15 of our Articles of Association. No Class C shares are currently outstanding. ERICSSON ANNUAL REPORT ON FORM 20-F 2009
Under Swedish law, only a general meeting of shareholders may decide on payment of dividends, which may not exceed the amount proposed by the Board of Directors (except in certain limited circumstances), and ERICSSON ANNUAL REPORT ON FORM 20-F 2012 may only be paid from funds legally available for that purpose. Under Swedish law, no interim dividends may be paid in respect of any fiscal period for which audited financial statements of the company have not yet been adopted by the annual general meeting of shareholders. The market practice in Sweden is for dividends to be paid annually. Under the Swedish Companies Act, dividends to shareholders and other transfers of value from a company—such as purchases of own shares (see below)—may only be made in case the company’s restricted equity remains fully covered after the transfer of value has been made. The calculation shall be based upon the most recently adopted balance sheet, and any changes in the restricted equity that has occurred after the balance sheet date shall be taken into account. In addition, dividends to shareholders and other transfers of value from the company may only be made if this is justifiable taken into account the type of business activities of the company, their scope and risks related thereto and the company’s need for financial resources, its liquidity and financial position. In respect of parent companies, also the business activities of the group, their scope and risks related thereto and the group’s need for financial resources, its liquidity and financial position should be taken into account. The Company’s shares are registered in the computerized book-entry share registration system administered by Euroclear Sweden AB (“Euroclear”). The rights attached to shares eligible for dividends accrue to those persons whose names are recorded in the register of shareholders on the record day. The dividends are then sent to a specified account as directed by the person registered with Euroclear, or to the address of that person. The relevant record day must, in most circumstances, be specified in the resolution declaring a dividend or resolving upon a capital increase or any similar matter in which shareholders have preferential rights, or the Board of Directors must be authorized to determine the relevant record day. Where the registered holder is a nominee, the nominee receives, for the account of the beneficial owner, dividends and, on issues of shares with preferential rights for the shareholders, shares, as well as rights. Dividends are remitted in a single payment to the nominee who is responsible for the distribution of such dividends to the beneficial owner. A similar procedure is adopted for share issues. Specific authority to act as a nominee must be obtained from Euroclear. The nominee must issue a public report to Euroclear every third month, listing all beneficial holders of more than 500 shares. Euroclear is required to keep a register with regard to any holding on behalf of a single beneficial owner in excess of 500 shares in any one company. This list must reveal the names of the beneficial owner and must be open to public inspection. Voting In a general meeting of Ericsson, each Class A share shall carry one vote, each Class B share one tenth of one vote and each Class C share one-thousandth of one vote. We are required to publish notices to attend annual general meetings no earlier than six weeks and no later than four weeks prior to the general meeting and the same notice period requirements apply regarding extraordinary general meetings concerning changes in our articles of association. Notices to attend other types of extraordinary general meetings at Ericsson must be published no earlier than six weeks and no later than twothree weeks prior to the general meeting. Directors are elected during the annual general meeting for a period of one year at a time and do not stand for reelection at staggered intervals. A shareholder may attend and vote at the meeting in person or by proxy. ProxiesFor companies whose shares are notregistered in a central securities depositary register, proxies are valid for longer than a yearup to five years from the date of issuance. Any shareholder wishing to attend a general meeting must notify us no later than on the day specified in the notice, preferably before 4:00 p.m. (CET). We are required to accept all notifications of attendance received at least five business days (Saturdays normally included) prior to the meeting. A person designated inERICSSON ANNUAL REPORT ON FORM 20-F 20092012 meeting. A person designated in the register as a nominee (including the depositary of the ADSs) is not entitled to vote at a general meeting, nor is a beneficial owner whose share is registered in the name of a nominee (including the depositary of the ADSs) unless the beneficial owner first arranges to have such owner’s own name entered in the register of shareholders maintained by Euroclear no later than the designated record day.
Under the Swedish Companies Act, resolutions are passed by a simple majority of votes cast at the meeting with the chairman of the meeting having a decisive vote (except in respect of elections), unless otherwise required by law or a company’s articles of association. Under the Swedish Companies Act, certain resolutions require special quorums and majorities, including, but not limited to, the following: A a resolution to amend the articles of association requires a majority of two-thirds of the votes cast as well as two-thirds of the shares represented at the meeting, except in those circumstances described in B–D below;
| A | a resolution to amend the articles of association requires a majority of two-thirds of the votes cast as well as two-thirds of the shares represented at the meeting, except in those circumstances described in B—D below; |
B a resolution to amend the articles of association which reduces any shareholder’s rights to profits or assets, restricts the transferability of shares or alters the legal relationship between shares, normally requires the unanimous approval of the shareholders present at the meeting and who hold nine-tenths of all outstanding shares;
| B | a resolution to amend the articles of association which reduces any shareholder’s rights to profits or assets, restricts the transferability of shares or alters the legal relationship between shares, normally requires the unanimous approval of the shareholders present at the meeting and who hold nine-tenths of all outstanding shares; |
C a resolution to amend the articles of association for the purpose of limiting the number of shares with which a shareholder may vote at a general meeting or allocating part of the net profit for the fiscal year to a restricted fund or limiting the use of the company’s profits or assets in a liquidation or dissolution, normally requires the approval of shareholders representing two-thirds of the votes cast and nine-tenths of the shares represented at the meeting;
| C | a resolution to amend the articles of association for the purpose of limiting the number of shares with which a shareholder may vote at a general meeting or allocating part of the net profit for the fiscal year to a restricted fund or limiting the use of the company’s profits or assets in a liquidation or dissolution, normally requires the approval of shareholders representing two-thirds of the votes cast and nine-tenths of the shares represented at the meeting; |
D a resolution of the kind referred to under B or C above may, however, be taken with a lower supermajority requirement if the amendments referred to therein will only adversely affect specific shares or classes of shares. In such cases, the requirement under a above will apply together with the following separate supermajority: (a) where only a class of shares is adversely affected, approval of the owners of one-half of all shares of such class and nine-tenths of the shares of such class represented at the meeting, or (b) where the shares adversely affected do not constitute a class of shares, the unanimous approval of all such affected outstanding shares present at the meeting and who hold nine-tenths of all outstanding shares adversely affected;
| D | a resolution of the kind referred to under B or C above may, however, be taken with a lower supermajority requirement if the amendments referred to therein will only adversely affect specific shares or classes of shares. In such cases, the requirement under a above will apply together with the following separate supermajority: (a) where only a class of shares is adversely affected, approval of the owners of one-half of all shares of such class and nine-tenths of the shares of such class represented at the meeting, or (b) where the shares adversely affected do not constitute a class of shares, the unanimous approval of all such affected outstanding shares present at the meeting and who hold nine-tenths of all outstanding shares adversely affected; |
E a resolution to issue, approve or authorize the issuance for cash of new shares, warrants or convertibles with a deviation from the -preferential right for existing shareholders requires a two-thirds-majority of votes cast at the meeting as well as two-thirds of the shares represented at the meeting;
| E | a resolution to issue, approve or authorize the issuance for cash of new shares, warrants or convertibles with a deviation from the preferential right for existing shareholders requires a two-thirds majority of votes cast at the meeting as well as two-thirds of the shares represented at the meeting; |
F a resolution to reduce the outstanding share capital requires a two-thirds majority of votes cast at the meeting as well as two-thirds of the shares represented at the meeting. In case there are several classes of shares in a company, the above described majority requirement shall apply also within each share class represented at the meeting and for which the rights of the shares are adversely affected; and
| F | a resolution to reduce the outstanding share capital requires a two-thirds majority of votes cast at the meeting as well as two-thirds of the shares represented at the meeting. In case there are several classes of shares in a company, the above described majority requirement shall apply also within each share class represented at the meeting and for which the rights of the shares are adversely affected; and |
G a resolution to approve a merger requires a two-thirds majority of the votes cast at the meeting and two-thirds of the shares represented at the meeting (however, under certain circumstances a higher majority is required).
| G | a resolution to approve a merger requires a two-thirds majority of the votes cast at the meeting and two-thirds of the shares represented at the meeting (however, under certain circumstances a higher majority is required). |
At a general meeting of shareholders, a shareholder or proxy for one or more shareholders may cast full number of votes represented by the holder’s shares. Purchase Ofof Own Shares A Swedish public limited liability company whose shares are traded on a regulated market place within the European Economic Area (“EEA”) or a market place comparable to a regulated market place outside the EEA is entitled to purchase its own shares under certain conditions. A purchase by us of our own shares may take place ERICSSON ANNUAL REPORT ON FORM 20-F 20092012 only if (a) the purchase has been decided upon by a general meeting of shareholders or the Board has been authorized by a general meeting of shareholders, in both cases by a two thirds majority of votes cast at the meeting as well as two-thirds of the shares represented at the meeting, (b) the purchase is effected on a regulated market place within the EEA or a market place comparable to a regulated market place outside the EEA (in the latter case with the approval of the Swedish Financial Supervisory Authority the “SFSA”) or pursuant to an offer to all shareholders or holders of a specific class of shares, (c) the Company’s restricted equity will still be fully covered and the purchase is justifiable taken into account the type of business activities of the Company and the group, their scope and risks related thereto and the Company’s and the group’s need for financial resources, its liquidity and financial position, and (d) we and our subsidiaries do not hold or, as a result of purchase, will not hold in excess of 10 percent10% of all our outstanding shares. As of December 31, 2009,2012, the Company held an aggregate of 78,978,53384,798,095 treasury stock of Class B shares. Investment Restrictions There are no limitations imposed by Swedish law or by our Articles of Association in respect of the rights of non-residents or foreign persons to purchase, own or sell securities issued by us. There are, however, certain flagging and ownership examination rules that apply, irrespective of nationality. Pursuant to the Swedish Financial Instruments Trading Act any change in a holding of shares, depository receipts with voting rights or financial instruments that entitle the holder to acquire shares in issue in a Swedish limited liability company whose shares are admitted for trading on a regulated market place within the EEA shall be reported by the holder to the company and the SFSA, where the change entails that the holder’s portion of all shares or votes in the company reaches, exceeds or falls below any of the limits of 5, 10, 15, 20, 25, 30, 50, 66 2/3 or 90 per cent. Such a change should, as a main rule, be reported not later than the trading day following the day on which the party with a duty to report has entered into an agreement for the acquisition or transfer of shares or any other change to the shareholding has occurred. In addition, the Act on Reporting Obligations Regarding Certain Holdings of Financial Instruments requires, among other things, certain individuals who own shares representing 10 percent10% or more of the share capital or the voting rights in a Swedish public limited liability company whose shares are traded on a regulated market within the EEA to report such ownership to the SFSA, which keeps a public register based on the information contained in such reports, and also to report any changes in such ownership within five business days. Exchange controlsEXCHANGE CONTROLS
There is no Swedish legislation affecting a) the import or export of capital or b) the remittance of dividends, interest or other payments to non-resident holders of our securities except that, subject to the provisions in any tax treaty, dividends are subject to withholding tax. TaxationTAXATION
General The taxation discussion set forth below does not purport to be a complete analysis or listing of all potential tax effects relevant to the acquisition, ownership or disposition of Class B shares or ADSs. The statements of United States and Swedish tax laws set forth below are based on the laws in force as of the date of this report and may be subject to any changes in United States or Swedish law, and in any double taxation convention or treaty between the United States and Sweden, occurring after that date, which changes may then have retroactive effect. ERICSSON ANNUAL REPORT ON FORM 20-F 2012 Specific tax provisions may apply for certain categories of tax payers. Your tax treatment if you are a holder of Class B shares or ADSs depends in part on your particular situation. If you are a holder of Class B shares or ERICSSON ANNUAL REPORT ON FORM 20-F 2009
ADSs, you should therefore consult a tax advisor as to the tax consequences relating to your particular circumstances resulting from the ownership of Class B shares or ADSs. The tax consequences to holders of ADSs, as discussed below, apply equally to holders of Class B shares. Certain Swedish Tax Considerations This section describes the material Swedish income and net wealth tax consequences for a holder of ADSs or Class B shares who is not considered to be a Swedish resident for Swedish tax purposes. This section applies to you only if you are a holder of portfolio investments representing less than 10 percent10% of capital and votes and is not applicable if the ADSs or Class B shares pertain to a permanent establishment or fixed place of business in Sweden. Taxation on Capital GainsTAXATION ON CAPITAL GAINS
Generally, non-residents of Sweden are not liable for Swedish capital gains taxation with respect to the sale of ADSs or Class B shares. However, under Swedish tax law, capital gains from the sale of shares in Swedish companies and certain other securities by an individual may be taxed in Sweden at a rate of 30 percent30% if the seller has been a resident of Sweden or has lived permanently in Sweden at any time during the year of the sale or the 10 calendar years preceding the year of the sale (absent treaty provisions to the contrary). The provision is applicable on ADSs or Class B shares. From 1 January 2008 the rule has been extended so that it also applies to shares in foreign companies, provided that the shares were acquired during the time that the person was liable to tax in Sweden. This provision may, however, be limited by tax treaties that Sweden has concluded with other countries. Under the tax treaty between Sweden and the United States (the “U.S. Tax Treaty”), this provision applies for ten years from the date the individual became a non-resident of Sweden. Taxation on DividendsTAXATION ON DIVIDENDS
A Swedish dividend withholding tax at a rate of 30 percent30% is imposed on dividends paid by a Swedish corporation, such as us, to non-residents of Sweden. The same withholding tax applies to certain other payments made by a Swedish corporation, including payments as a result of redemption of shares and repurchase of stock through an offer directed to its shareholders. Exemption from the withholding tax or a lower tax rate may apply by virtue of a tax treaty. Under the U.S. Tax Treaty, the withholding tax on dividends paid on portfolio investments to eligible U.S. holders is reduced to 15 percent.15%. Under all Swedish tax treaties, except the tax treaty with Switzerland, withholding tax at the applicable treaty rate should be withheld by the payer of the dividends. With regard to dividends paid from shares in corporations registered with the VPCEuroclear Sweden (such as our shares), a reduced rate of dividend withholding tax under a tax treaty is generally applied at the source by the VPCEuroclear Sweden or, if the shares are registered with a nominee, the nominee, as long as the person entitled to the dividend is registered as a non-resident and sufficient information regarding the tax residency of the beneficial owner is available to the VPCEuroclear Sweden or the nominee. In those cases where Swedish withholding tax is withheld at the rate of 30 percent30% and the person who received the dividends is entitled to a reduced rate of withholding tax under a tax treaty, a refund may be claimed from the Swedish tax authorities before the end of the fifth calendar year following the year that the distribution was made. ERICSSON ANNUAL REPORT ON FORM 20-F 2012 Taxation on InterestTAXATION ON INTEREST
No Swedish withholding tax is payable on interest paid to nonresidentsnon-residents of Sweden. ERICSSON ANNUAL REPORT ON FORM 20-F 2009
Net Wealth TaxationNET WEALTH TAXATION
The Swedish net wealth tax has been abolished from 1 January 2007. Certain United States Federal Income Tax Consequences The following discussion is a summary of the material United States federal income tax consequences relevant to the ownership and disposition of ADSs or Class B shares. This discussion is based on the tax laws of the United States (including the Internal Revenue Code of 1986, as amended (the “Code”), its legislative history, existing and proposed regulations thereunder, published rulings and court decisions) as in effect on the date hereof, all of which are subject to change, possibly with retroactive effect. The discussion is not a full discussion of all tax considerations that may be relevant to the ownership and disposition of ADSs or Class B shares. The discussion applies only if you will hold the ADSs and/or the Class B shares as capital assets and you use the USD as your functional currency. It does not deal with the tax treatment of investors subject to special rules, such as grantor trusts, real estate investment trusts, regulated investment companies, banks, brokers or dealers in securities or currencies, traders in securities or currencies that elect to use a mark-to-market method of recording for their securities holdings, financial institutions, insurance companies, tax-exempt entities, investors liable for alternative minimum tax, holders (either actually or constructively) of 10 percent10% or more of our Class B shares, persons holding ADSs and/or Class B shares as part of a hedging, straddle, conversion or constructive sale transaction and persons who are resident or ordinarily resident in Sweden. In addition, investors holding ADSs and/or Class B shares indirectly through partnerships are subject to special rules not discussed below. You should consult your own tax advisersadvisors about the United States federal, state, local and foreign tax consequences to you of the ownership and disposition of the ADSs or Class B shares. The discussion below applies to you only if you are a beneficial owner of ADSs and/or Class B shares not resident in Sweden for purposes of the U.S. Tax Treaty and you are, for United States federal income tax purposes, (1) a citizen or resident of the United States, (2) a corporation or any other entity treated as a corporation that is organized in or under the laws of the United States or its political subdivisions, including the District of Columbia, (3) a trust if all of the trust’s substantial decisions are subject to the control of one or more United States persons and the primary supervision of the trust is subject to a United States court, or if a valid election is in effect with respect to the trust to be taxed as a United States person, or (4) an estate the income of which is subject to United States federal income taxation regardless of its source. The discussion below assumes that the representations contained in the deposit agreement are true and that the obligations in the deposit agreement and any related agreement will be complied with in accordance with the terms. If you hold ADSs, you will be treated as the holder of the underlying Class B shares represented by those ADSs for United States federal income tax purposes. Taxation of ADSs or ClassTAXATION OF ADSS OR CLASS B shares SHARES
Dividends Subject to the passive foreign investment company rules discussed below, the gross amount of dividends paid (before reduction for any Swedish withholding taxes) with respect to the ADSs or Class B shares generally will be included in your gross income as ordinary income from foreign sources to the extent paid out of our current or accumulated earnings and profits (as determined for United States federal income tax purposes). Distributions in excess of earnings and profits will be treated as a non-taxable return of capital to the extent of ERICSSON ANNUAL REPORT ON FORM 20-F 2012 your adjusted tax basis in the ADSs or Class B shares and thereafter as capital gain. The dividends will not be eligible for the dividends received deduction available to corporations in respect of dividends received from other U.S. corporations. The amount of any dividend paid in SEK will be the U.S. dollarUSD value of the dividend payment based on the exchange rate in effect on the date of receipt by you (or constructive receipt), by you, in the case of Class B shares or by the depositary, in the case of ADSs, whether or not the payment is converted into USD at that time. Your tax basis in the SEK received will equal such USD amount. Gain or loss, if any, recognized on a subsequent sale or conversion of the SEK will be U.S. source ordinary income or loss. ERICSSON ANNUAL REPORT ON FORM 20-F 2009
If you are a non-corporate holder of ADSs or Class B shares, dividends you receive on the ADSs or Class B shares for taxable years beginning before January 1, 2011, may be taxed at the lower applicable capital gains rate provided that (1) we are not a passive foreign investment company (as discussed below) for either our taxable year in which the dividend was paid or the preceding taxable year, (2) certain holding period requirements are met, (3) you are not under any obligation to make related payments with respect to substantially similar or related property and (3)(4) either (a) in the case of ADSs our ADSs continue to be listed on the Nasdaq Stock Market (or a national securities exchange that is registered under section 6 of the Securities Exchange Act of 1934, as amended) or (b) we are eligible for the benefits of the U.S. Tax Treaty. You should consult your own tax advisors regarding the availability of the lower rate for dividends paid with respect to ADSs or Class B shares. Subject to certain limitations, you will generally be entitled to receive credit against your United States federal income tax liability (or a deduction against your United States federal taxable income) with respect to any Swedish tax withheld in accordance with the U.S. Tax Treaty and paid over to Sweden. If a refund of the tax withheld is available to you under the laws of Sweden or under the U.S. Tax Treaty, the amount of tax withheld that is refundable will not be eligible for such credit against your United States federal income tax liability (and will not be eligible for the deduction in computing your United States federal taxable income). For foreign tax credit limitation purposes, the dividend will be income from sources without the United States, and will generally be treated as “passive category income” (or, in the case of certain holders, “general category income”). Sale or Exchange of Adss or ClassSALE OR EXCHANGE OF ADSS OR CLASS B SharesSHARES
Subject to the passive foreign investment company rules discussed below, you will generally recognize capital gain or loss on the sale or other disposition of the ADSs or Class B shares equal to the difference between the USD value of the amount realized and your adjusted tax basis (determined in USD) in the ADSs or Class B shares. Such gain or loss will be capital gain or loss and will generally be treated as arising from U.S. sources for foreign tax credit limitation purposes. The amount realized on a disposition of ADSs or Class B shares will generally be the amount of cash you receive for the ADSs or Class B shares (which, in the case of payment in a non-U.S. currency, will equal the USD value of the payment received determined on (a) the date of receipt of payment if you are a cash basis taxpayer and (b) the date of disposition if you are an accrual basis taxpayer). If the ADSs or Class B shares are treated as traded on an “established securities market,” if you are a cash basis taxpayer (or, if you are an accrual basis taxpayer, if you so elect) you will determine the USD value of the amount realized by translating the amount received at the spot rate of exchange on the settlement date of the sale. You will have a tax basis in any foreign currency received equal to the USD amount realized. Any gain or loss you realize on a subsequent conversion of foreign currency will be U.S. source ordinary income or loss. Passive Foreign Investment Company StatusPASSIVE FOREIGN INVESTMENT COMPANY STATUS
A non-U.S. corporation is a passive foreign investment company (a “PFIC”) in any taxable year in which, after taking into account the income and assets of certain subsidiaries, either (a) at least 75 percent75% of its gross income ERICSSON ANNUAL REPORT ON FORM 20-F 2012 is passive income or (b) at least 50 percent50% of the quarterly average value of its assets is attributable to assets that produce or are held to produce passive income. Based on the market value of our shares, the composition of our assets and income and our operations, we believe we were not a PFIC during the year 2009.2012. However, whether or not we will be considered a PFIC will depend on the nature and source of our income and the value of our assets, as determined from time to time. If we are treated as a PFIC, we will not provide information necessary for the “qualified electing fund” election as the term is defined in the relevant provisions of the Code. You should consult your own tax advisors about the consequences of our potential classification as a PFIC. ERICSSON ANNUAL REPORT ON FORM 20-F 2009
If we were a PFIC, for any taxable year in which you held ADSs or Class B shares, you would be subject to special rules with respect to: any gain realized on the sale or other disposition of ADSs or Class B shares; and any “excess distribution” made to you (generally, any distributions to you in respect of ADSs or Class B shares during a single taxable year that are, in the aggregate, greater than 125 percent125% of the average annual distributions received by you in respect of ADSs or Class B shares during the three preceding taxable years or, if shorter, your holding period for ADSs or Class B shares). Under these rules: the gain or excess distribution would be allocated ratably over your holding period for ADSs or Class B shares; the amount allocated to the taxable year in which the gain or excess distribution was realized and any year before we became a PFIC would be taxable as ordinary income and the amount allocated to each prior year, other than the current year and any taxable year prior to the first taxable year in which we were a PFIC, would be subject to tax at the highest applicable marginal tax rate in effect for each such year; and an interest charge would be imposed. If we are a PFIC for any taxable year, you will also be deemed to own shares in any of our subsidiaries that are also PFICs in such a year. As an alternative to the special rules described above, holders of “marketable stock” in a PFIC may elect mark-to-market treatment with respect to their ADSs or Class B shares. ADSs or Class B shares will not be considered marketable stock unless they are regularly traded on a qualified exchange or other market. If the mark-to-market election is available and you elect mark-to-market treatment you will, in general, include as ordinary income each year an amount equal to the increase in value of your ADSs or Class B shares for that year (measured at the close of your taxable year) and will generally be allowed a deduction for any decrease in the value of your Class B shares for the year, but only to the extent of previously included mark-to-market income. In addition, any gain you recognize upon the sale or other disposition of the ADSs or Class B shares will be treated as ordinary income and any loss will be treated as ordinary loss, but only to the extent of previously included mark-to-market income. However, a mark-to-market election would likely be unavailable with respect to your proportionate share in any of our subsidiaries that are PFICs. If you own ADSs or Class B shares during any year in which we are a PFIC, you arewill generally be required to make an annual return on IRS Form 8621 regarding distributions received with respect to ADSs or Class B shares and any gain realized on the disposition of your ADSs or Class B shares.8621. Information reporting and backup withholdingINFORMATION REPORTING AND BACKUP WITHHOLDING
In general, information reporting requirements may apply to dividends paid in respect of ADSs or Class B shares and the proceeds received on the sale or exchange of the ADSs or Class B shares within the United States or by a broker with certain United States connections. Backup withholding currently at a rate of 28 percent may apply to payments to you of dividends paid in respect of ADSs or Class B shares or the proceeds of a sale or other disposition of ADSs or Class B shares if you fail to provide an accurate taxpayer identification number (certified on IRS Form W–9) or, ERICSSON ANNUAL REPORT ON FORM 20-F 2012 upon request, to certify that you are not subject to backup withholding, or otherwise to comply with the applicable requirements of backup withholding. The amount of any backup withholding from a payment to you will be allowed as a credit against your United States federal income tax liability and a refund of any excess amount withheld under the backup withholding rules may be obtained by filing the appropriate claim for refund with the IRS and furnishing any required information. ADDITIONAL REPORTING REQUIREMENTS ERICSSON ANNUAL REPORT ON FORM 20-F 2009
Certain holders who are individuals may be required to report information relating to an interest in ADSs or Class B shares, subject to certain exceptions (including an exception for ADSs or Class B shares held in accounts maintained by certain financial institutions). Holders should consult their tax advisors regarding the effects, if any, of these requirements on their ownership and disposition of ADSs or Class B shares. Depositary fees and chargesDEPOSITARY FEES AND CHARGES
Fees and charges payable byFEES AND CHARGES PAYABLE BY ADS holdersHOLDERS
| | | | | | | | | | Service | | Rate | | By Whom Paidwhom paid | | | | | | 1) | | Receipt of deposits and issuance of receipts | | USD 5 per 100 American Depositary Shares of fraction thereof | | Party to whom receipts are issued | | | | | | 2) | | Delivery of deposited shares against surrender of receipts | | USD 5 per 100 American Depositary Shares or fraction thereof | | Party surrendering receipts | | | | | | 3) | | Payments of dividends distributions or rights offering is respect of shares | | No charge | | Not applicable |
Except as otherwise provided in the Deposit Agreement, any and all other expenses of the Depositary, including , without limitation, expenses or charges for printing, stationery, postage, insurances, cables, etc, are to be borne by the Depositary, or by the Company in accordance with agreements entered into from time to time with the Company. Fees payable by the Depositary to the Issuer Citibank, as depositary, has agreed to reimburse Ericsson USD 5 million per year for expenses related to our ADS program (the “Program”), including Program-related legal fees, expenses related to investor relations in the US, US investor presentations, ADS-related financial advertising and public relations, fees and expenses of Citibank as administrator of the ADS Direct Plan, fees in relation to our Form 20-F and SOX compliance. Citibank has further agreed to waive other ADS program related expenses amounting to USD 36,00033,128.79 associated with the administration of the Program. Independence requirementsCORPORATE GOVERNANCE REQUIREMENTS
The Ericsson Board of Directors is subject to, and applies, a variety of independence requirements. However, it has sought and receivedcan rely on exemptions from certain Sarbanes-Oxley Act and NASDAQU.S. requirements, including those that are contrary todifferent from Swedish Law, see “NASDAQ Corporate Governance Exemptions” for more information.Law. NASDAQ Marketplace Rules
ERICSSON ANNUAL REPORT ON FORM 20-F 2012 Independence requirements on the board of directors: A majority of the members of the board of directors must be independent in lineaccordance with the NASDAQ rules. Ericsson has obtainedrelies on an exemption from NASDAQ which meansfor employee representative directors can be exempt from NASDAQ’s independence requirements. Sarbanes-Oxley Act of 2002 and corresponding NASDAQ rules
Independence requirements on the audit committee: All members of the audit committee must be independent in lineaccordance with the Sarbanes-Oxley Act of 2002. ERICSSON ANNUAL REPORT ON FORM 20-F 2009
SEC and the NASDAQ rules. The Sarbanes-Oxley Act of 2002 includesSEC rules include a specific exemption from these independence requirements for audit committee members who are non-executive employee representatives. The Company does not consider that reliance on thethis exemption adversely affectaffects the ability of the Audit Committee to act independently or satisfy other SEC requirements. NASDAQ Corporate Governance Exemptions
Following a 2005 amendment to NASDAQ’s Marketplace Rules,In addition, foreign private issuers such as Ericsson may follow home-country practice in lieu of certain NASDAQ corporate governance requirements.
Before the amendment was adopted, NASDAQ’s Marketplace Rules statedBelow is a list of practices followed by Ericsson that upon application, foreign private issuers could be exemptdiffer from certain corporate governance requirements. This only applied when the requirements were contrary to the laws, rules or regulations, or generally accepted business practices of the issuer’s home jurisdiction.
Ericsson has received exemptions from NASDAQ’s corporate governance requirements under the NASDAQ Marketplace Rules (and is entitled to continue to rely thereon under the 2005 amendment). This is in order to allow:Rules:
Employee representatives to be elected to the Board of Directors and serve on Committees (including the Audit Committee),and the Remuneration Committees) in accordance with Swedish law.law Shareholders to participate in the election of Directors and the Nomination Committee, in accordance with Swedish law and common market practice, respectively.respectively Employee representatives on the Board to attend all Board and Committee meetings (including those of the Audit Committee),and the Remuneration Committees) in accordance with Swedish laws concerning attendance and decision making processes.processes No minimum quorum requirements for shareholder meetings, except under certain circumstances. AUDIT COMMITTEE PRE-APPROVAL POLICIES AND PROCEDURES The Company does not consider that reliance onAudit Committee reviews and approves the exemption fromscope of audits to be performed (external and internal) and analyzes the audit committeeresults and costs of the audits. The Committee makes recommendations to the Board of Directors regarding the auditor’s performance. It also makes recommendations to the Nomination Committee regarding the external auditor’s fees. In order to ensure the auditor’s independence, requirements adversely affects the ability of the Audit Committee has established pre-approval policies and procedures for non-audit related services to act independentlybe performed by the external auditor. Pre-approval authority may not be delegated to management. The policies and procedures include a list of prohibited services and services that require pre-approval by the Committee. Such services fall into two broad categories: General pre-approval—certain services regarding taxes, transactions, risk management, business improvement, corporate finance, attestation and accounting and so called general services. These services have received general pre-approval by the Audit Committee, provided that the estimated fee for each project does not exceed SEK 1 million. The external auditor must advise the Audit Committee of services rendered under the general pre-approval policy. Specific pre-approval—all other non-audit related services must receive specific pre-approval. The Audit Committee Chairman has the delegated authority for specific pre-approval in between Committee meetings, provided that the fee in each case does not exceed SEK 2.5 million. The Chairman reports any pre-approval to the Audit Committee at its next meeting. For matters which may not be handled by the Chairman and require specific pre-approval by the Audit Committee, the auditor submits an application to the Parent Company for final approval by the Audit Committee. ERICSSON ANNUAL REPORT ON FORM 20-F 2012 DISCLOSURE PURSUANT TO SECTION 219 OF THE IRAN THREAT REDUCTION AND SYRIA HUMAN RIGHTS ACT OF 2012 (ITRA) Ericsson has conducted business in Iran/Persia since the late nineteenth century, opened an office in Iran in 1973 and later established a local subsidiary in the country. Ericsson strongly believes in enabling communication for all and believes that access to communications can enable the right to health, education and freedom of expression. Ericsson’s business activities in Iran principally involve the sale of telecommunications infrastructure related products and services, including support, installation and maintenance services. Ericsson’s exports from the European Union (the “EU”) to Iran are performed under export licenses from the Swedish Agency for Non-Proliferation and Export Controls. The EU sanctions towards Iran grant an exemption for the supply of certain telecommunications equipment and software based on which these export licenses are granted. While we seek to obtain information regarding the ownership of our customers in Iran, it is sometimes difficult to determine ownership and control with certainty, particularly with respect to the government. During 2012, Ericsson sold telecommunications infrastructure related products and services in Iran to MTNIrancell and to Mobile Communication Company of Iran (“MCCI”), telecommunications companies operating in Iran. During 2012, our gross revenue related to sales to MTNIrancell and MCCI in Iran was approximately SEK 1,149 million. Ericsson does not normally allocate net profit on a country-by-country or satisfyactivity-by-activity basis, other SEC requirements.than as set forth in Ericsson’s consolidated financial statements prepared in accordance with IFRS as issued by the IASB. However, Ericsson has estimated that its net profit from such sales, after internal cost allocation was less than SEK 50 million during 2012. We anticipate that the sales of telecommunications infrastructure related products to MTNIrancell and MCCI in Iran will be phased out during 2013 and that our business activities in Iran after 2013 will consist of the provision of services under existing contracts or with respect to equipment already delivered by Ericsson (which services may include repair and replacements of products) and collection of software license related revenues under existing agreements. Further, Ericsson is party to agreements entered into prior to 2012 with Telecommunications Company of Iran, an affiliate of MCCI, Zaeim Electronic Industries Company and TAKTA (reseller). No sales were made by Ericsson under these contracts during 2012 and we do not anticipate that any sales will be made during 2013. In addition, Ericsson relies onsome instances, we have had to arrange performance bonds or similar financial guarantees to secure our performance of obligations under the exemption providedcommercial agreements we have entered into relating to our business in Iran. In such instances, we usually engage our banks outside Iran, who in turn engage local banks in the country. These local banks include Tejarat Bank, Melli Bank and Saderat Bank. Although some bonds and guarantees involving these banks are still in place, no new performance bonds or similar guarantees with respect to our business activities in Iran were issued during 2012, nor were payments made to beneficiaries under any such existing bond or guarantee. During 2012 Ericsson’s Iranian subsidiary maintained accounts with Bank Mellat and Tejarat Bank. Deposits with those banks generated less than SEK 20 million of interest income during 2012. Those accounts were closed during 2012. Some payments made to our local subsidiary and payments required to be made by our local subsidiary to suppliers involve banks controlled by the 2005 amendmentgovernment of Iran, such as Bank Mellat, Tejarat Bank, Bank Melli, Saderat Bank, Keshavarzi Bank, Eghtesad Novin Bank, Refah Bank and Bank Sepah. We also received payments from customers to overcomeEricsson’s accounts outside Iran. During 2012, Ericsson purchased telecommunication infrastructure related materials and services from Havafaza Industry Organization (SATAF). Ericsson stopped purchasing from them during 2012. Due to its operations in Iran, and having staff permanently in the requirements regarding quorums forcountry, Ericsson obtains and requires services and has other dealings incidental to its General Meetingslocal activities including paying taxes and salaries and obtaining rentals, electricity, water and telecommunications services, office and similar supplies and customs related services from Iranian companies who may be owned or controlled by the government of Shareholders since they are contrary to Swedish law. Iran.ERICSSON ANNUAL REPORT ON FORM 20-F 20092012 INVESTMENTS The following listing shows certain shareholdings owned directly and indirectly by the Parent Company as of December 31, 2009.2012. A complete listing of shareholdings, prepared in accordance with the Swedish Annual Accounts Act and filed with the Swedish Companies Registration Office (Bolagsverket), may be obtained upon request to: Telefonaktiebolaget LM Ericsson, External Reporting, SE-164 83 Stockholm, Sweden. SHARES OWNED DIRECTLY BY THE PARENT COMPANY | | | | | | | | | | | | | | Type | | Company | | Reg. No. | | Domicile | | Percentage
of ownership | | | Par value
in local
currency,
million | | Carrying
value,
SEK million | | Subsidiary companies | | | | | | | | | | | | I | | Ericsson AB | | 556056-6258 | | Sweden | | 100 | | | 50 | | 20,731 | I | | Ericsson Shared Services AB | | 556251-3266 | | Sweden | | 100 | | | 361 | | 2,216 | I | | Netwise AB | | 556404-4286 | | Sweden | | 100 | | | 2 | | 306 | II | | AB Aulis | | 556030-9899 | | Sweden | | 100 | | | 14 | | 6 | III | | Ericsson Credit AB | | 556326-0552 | | Sweden | | 100 | | | 5 | | 5 | | | Other (Sweden) | | | | | | — | | | — | | 2,058 | I | | Ericsson Austria GmbH | | | | Austria | | 100 | | | 4 | | 115 | I | | Ericsson Danmark A/S | | | | Denmark | | 100 | | | 90 | | 216 | I | | Oy LM Ericsson Ab | | | | Finland | | 100 | | | 13 | | 196 | II | | Ericsson Participations France SAS | | | | France | | 100 | | | 26 | | 524 | I | | Ericsson GmbH | | | | Germany | | 100 | | | 20 | | 4,227 | I | | Ericsson Hungary Ltd. | | | | Hungary | | 100 | | | 1,301 | | 120 | II | | LM Ericsson Holdings Ltd. | | | | Ireland | | 100 | | | 2 | | 15 | I | | Ericsson Telecomunicazioni S.p.A. | | | | Italy | | 53 | 1) | | 23 | | 3,151 | II | | Ericsson Holding International B.V. | | | | The Netherlands | | 100 | | | 222 | | 3,200 | I | | Ericsson A/S | | | | Norway | | 100 | | | 75 | | 114 | II | | TANDBERG Television ASA | | | | Norway | | 100 | | | 161 | | 1,788 | I | | Ericsson Corporatia AO | | | | Russia | | 100 | | | 5 | | 5 | I | | Ericsson AG | | | | Switzerland | | 100 | | | — | | — | II | | Ericsson Holding Ltd. | | | | United Kingdom | | 100 | | | 328 | | 4,094 | | | Other (Europe, excluding Sweden) | | | | | | — | | | — | | 428 | II | | Ericsson Holding II Inc. | | | | United States | | 100 | | | 2,817 | | 29,006 | I | | Cía Ericsson S.A.C.I. | | | | Argentina | | 95 | 2) | | 60 | | 260 | I | | Ericsson Telecom S.A. de C.V. | | | | Mexico | | 100 | | | n/a | | 1,550 | | | Other (United States, Latin America) | | | | | | — | | | — | | 61 | II | | Teleric Pty Ltd. | | | | Australia | | 100 | | | 20 | | 100 | I | | Ericsson Ltd. | | | | China | | 100 | | | 2 | | 2 | I | | Ericsson (China) Company Ltd. | | | | China | | 100 | | | 65 | | 475 | I | | Ericsson India Private Ltd. | | | | India | | 100 | | | 725 | | 147 | I | | Ericsson (Malaysia) Sdn. Bhd. | | | | Malaysia | | 70 | | | 2 | | 4 | I | | Ericsson Telecommunications Pte. Ltd. | | | | Singapore | | 100 | | | 2 | | 1 | I | | Ericsson Taiwan Ltd. | | | | Taiwan | | 80 | | | 240 | | 20 | I | | Ericsson (Thailand) Ltd. | | | | Thailand | | 49 | 3) | | 90 | | 17 | | | Other countries (the rest of the world) | | | | | | — | | | — | | 382 | | | | | | | | | | | | | | | | | Total | | | | | | | | | — | | 75,540 | | | | | | | | | | | | | | | Joint ventures and associated companies | | | | | | | | | | | | I | | Sony Ericsson Mobile Communications AB | | 556615-6658 | | Sweden | | 50 | | | 50 | | 4,136 | II | | ST-Ericsson Holdings AG | | | | Switzerland | | 50 | | | 436 | | 8,325 | III | | ST-Ericsson AT Holding AG | | | | Switzerland | | 50 | | | 5 | | 275 | I | | Ericsson Nikola Tesla d.d. | | | | Croatia | | 49 | | | 65 | | 330 | | | | | | | | | | | | | | | | | Total | | | | | | | | | — | | 13,066 | | | | | | | | | | | | | | |
| | | | | | | | | | | | | | | | | | | | | Type | | Company | | Reg. No. | | | Domicile | | Percentage
of ownership | | | Par value
in local
currency,
million | | | Carrying
value,
SEK million | | Subsidiary companies | | | | | | | | | | | | | | | | | | | | I | | Ericsson AB | | | 556056-6258 | | | Sweden | | | 100 | | | | 50 | | | | 20,731 | | | I | | Ericsson Shared Services AB | | | 556251-3266 | | | Sweden | | | 100 | | | | 361 | | | | 2,216 | | | I | | Netwise AB | | | 556404-4286 | | | Sweden | | | 100 | | | | 2 | | | | 306 | | | II | | AB Aulis | | | 556030-9899 | | | Sweden | | | 100 | | | | 14 | | | | 6 | | | III | | Ericsson Credit AB | | | 556326-0552 | | | Sweden | | | 100 | | | | 5 | | | | 5 | | | | Other (Sweden) | | | | | | | | | — | | | | — | | | | 1,742 | | | I | | Ericsson Austria GmbH | | | | | | Austria | | | 100 | | | | 4 | | | | 65 | | | I | | Ericsson Danmark A/S | | | | | | Denmark | | | 100 | | | | 90 | | | | 216 | | | I | | Oy LM Ericsson Ab | | | | | | Finland | | | 100 | | | | 13 | | | | 196 | | | II | | Ericsson Participations France SAS | | | | | | France | | | 100 | | | | 26 | | | | 524 | | | I | | Ericsson Germany GmbH | | | | | | Germany | | | 100 | | | | — | | | | 4,232 | | | I | | Ericsson Hungary Ltd. | | | | | | Hungary | | | 100 | | | | 1,301 | | | | 120 | | | II | | LM Ericsson Holdings Ltd. | | | | | | Ireland | | | 100 | | | | 2 | | | | 15 | | | I | | Ericsson Telecomunicazioni S.p.A. | | | | | | Italy | | | 100 | | | | 44 | | | | 5,857 | | | II | | Ericsson Holding International B.V. | | | | | | The Netherlands | | | 100 | | | | 222 | | | | 3,200 | | | I | | Ericsson A/S | | | | | | Norway | | | 100 | | | | 75 | | | | 114 | | | II | | Ericsson Television AS | | | | | | Norway | | | 100 | | | | 161 | | | | 1,788 | | | I | | Ericsson Corporatia AO | | | | | | Russia | | | 100 | | | | 5 | | | | 5 | | | I | | Ericsson España | | | | | | Spain | | | 100 | | | | 43 | | | | 170 | | | I | | Ericsson AG | | | | | | Switzerland | | | 100 | | | | — | | | | — | | | II | | Ericsson Holding Ltd. | | | | | | United Kingdom | | | 100 | | | | 328 | | | | 4,094 | | | | Other (Europe, excluding Sweden) | | | | | | | | | — | | | | — | | | | 275 | | | II | | Ericsson Holding II Inc. | | | | | | United States | | | 100 | | | | 2,830 | | | | 29,006 | | | I | | Cía Ericsson S.A.C.I. | | | | | | Argentina | | | 95 | 1) | | | 41 | | | | 178 | | | I | | Ericsson Canada Inc. | | | | | | Canada | | | 100 | | | | — | | | | 51 | | | I | | Bel-Air Networks | | | | | | Canada | | | 100 | | | | — | | | | 170 | | | I | | Ericsson Telecom S.A. de C.V. | | | | | | Mexico | | | 100 | | | | n/a | | | | 1,050 | | | | Other (United States, Latin America) | | | | | | | | | — | | | | — | | | | 67 | | | II | | Teleric Pty Ltd. | | | | | | Australia | | | 100 | | | | 20 | | | | 100 | | | I | | Ericsson Ltd. | | | | | | China | | | 100 | | | | 2 | | | | 2 | | | I | | Ericsson (China) Company Ltd. | | | | | | China | | | 100 | | | | 65 | | | | 475 | | | I | | Ericsson India Private Ltd. | | | | | | India | | | 100 | | | | 725 | | | | 147 | | | I | | Ericsson India Global Services PVT. Ltd | | | | | | India | | | 100 | | | | 389 | | | | 64 | | | I | | LG-Ericsson Ltd. | | | | | | Korea | | | 75 | | | | 150 | | | | 3,285 | | | I | | Ericsson (Malaysia) Sdn. Bhd. | | | | | | Malaysia | | | 70 | | | | 2 | | | | 4 | | | I | | Ericsson Telecommunications Pte. Ltd. | | | | | | Singapore | | | 100 | | | | 2 | | | | 1 | | | I | | Ericsson South Africa PTY. Ltd | | | | | | South Africa | | | 100 | | | | — | | | | 108 | | | I | | Ericsson Taiwan Ltd. | | | | | | Taiwan | | | 80 | | | | 240 | | | | 20 | | | I | | Ericsson (Thailand) Ltd. | | | | | | Thailand | | | 49 | 2) | | | 90 | | | | 17 | | | | Other countries (the rest of the world) | | | | | | | | | — | | | | — | | | | 215 | | | | | | | | | | | | | | | | | | | | | | | | | Total | | | | | | | | | | | | | | | | | 80,839 | | | | | | | | | | | | | | | | | | | | | | | Joint ventures and associated companies | | | | | | | | | | | | | | | | | | | | II | | ST-Ericsson SA | | | | | | Switzerland | | | 50 | | | | 137 | | | | — | | | III | | ST-Ericsson AT SA | | | | | | Switzerland | | | 51 | | | | — | | | | — | | | I | | Rockstar Consortium Group | | | | | | Canada | | | 21 | | | | 1 | | | | 7 | | | I | | Ericsson Nikola Tesla d.d. | | | | | | Croatia | | | 49 | | | | 65 | | | | 330 | | | | | | | | | | | | | | | | | | | | | | | | | Total | | | | | | | | | | | | | | | | | 337 | | | | | | | | | | | | | | | | | | | | | | |
ERICSSON ANNUAL REPORT ON FORM 20-F 20092012 SHARES OWNED BY SUBSIDIARY COMPANIES
| | | | | | | | | Type
| | Company
| | Reg. No. | | Domicile | | Percentage
of ownership | Subsidiary companies
| | | | | | | II
| | Ericsson Cables Holding AB | | 556044-9489 | | Sweden | | 100 | I
| | Ericsson France SAS | | | | France | | 100 | I
| | LHS Telekommunikation GmbH & Co. KG | | | | Germany | | 100 | I
| | LM Ericsson Ltd. | | | | Ireland | | 100 | II
| | Ericsson Nederland B.V. | | | | The Netherlands | | 100 | I
| | Ericsson Telecommunicatie B.V. | | | | The Netherlands | | 100 | I
| | Ericsson España S.A. | | | | Spain | | 100 | I
| | Ericsson Telekomunikasyon A.S. | | | | Turkey | | 100 | I
| | Ericsson Ltd. | | | | United Kingdom | | 100 | I
| | Ericsson Canada Inc. | | | | Canada | | 100 | I
| | Ericsson Inc. | | | | United States | | 100 | I
| | Ericsson IP Infrastructure Inc. | | | | United States | | 100 | I
| | Ericsson Amplified Technologies Inc. | | | | United States | | 100 | I
| | Ericsson Services Inc. | | | | United States | | 100 | I
| | Drutt Corporation Inc. | | | | United States | | 100 | I
| | Redback Networks Inc. | | | | United States | | 100 | I
| | Ericsson Telecommunicações S.A. | | | | Brazil | | 100 | I
| | Ericsson Australia Pty. Ltd. | | | | Australia | | 100 | I
| | Ericsson (China) Communications Co. Ltd. | | | | China | | 100 | I
| | Nanjing Ericsson Panda Communication Co. Ltd. | | | | China | | 51 | I
| | Nippon Ericsson K.K. | | | | Japan | | 100 | I
| | Ericsson Communication Solutions Pte Ltd. | | | | Singapore | | 100 |
Key to type of company | I | Manufacturing, distribution and development companies |
| 1) | Through subsidiary holdings, total holdings amount to 100% of Ericsson Telecomunicazioni S.p.A. |
2) | Through subsidiary holdings, total holdings amount to 100% of Cia Ericsson S.A.C.I. |
3)2) | Through subsidiary holdings, total holdings amount to 100% of Ericsson (Thailand) Ltd. |
SHARES OWNED BY SUBSIDIARY COMPANIES | | | | | | | | | | | | | Type | | Company | | Reg. No. | | | Domicile | | Percentage
of ownership | | | Subsidiary companies | | | | | | | | | | | II | | Ericsson Cables Holding AB | | | 556044-9489 | | | Sweden | | | 100 | | I | | Ericsson France SAS | | | | | | France | | | 100 | | I | | Ericsson Telekommunikation GmbH & Co. KG1) | | | | | | Germany | | | 100 | | I | | LM Ericsson Ltd. | | | | | | Ireland | | | 100 | | II | | Ericsson Nederland B.V. | | | | | | The Netherlands | | | 100 | | I | | Ericsson Telecommunicatie B.V. | | | | | | The Netherlands | | | 100 | | I | | Ericsson Telekomunikasyon A.S. | | | | | | Turkey | | | 100 | | I | | Ericsson Ltd. | | | | | | United Kingdom | | | 100 | | I | | Ericsson Inc. | | | | | | United States | | | 100 | | I | | Ericsson IP Infrastructure Inc. | | | | | | United States | | | 100 | | I | | Drutt Corporation Inc. | | | | | | United States | | | 100 | | I | | Optimi Corporation | | | | | | United States | | | 100 | | I | | Redback Networks Inc. | | | | | | United States | | | 100 | | I | | Telcordia Technologies Inc. | | | | | | United States | | | 100 | | I | | Ericsson Telecommunicações S.A. | | | | | | Brazil | | | 100 | | I | | Ericsson Australia Pty. Ltd. | | | | | | Australia | | | 100 | | I | | Ericsson (China) Communications Co. Ltd. | | | | | | China | | | 100 | | I | | Nanjing Ericsson Panda Communication Co. Ltd. | | | | | | China | | | 51 | | I | | Ericsson Japan K.K. | | | | | | Japan | | | 100 | | I | | Ericsson Communication Solutions Pte Ltd. | | | | | | Singapore | | | 100 | |
Key to type of company | I | Manufacturing, distribution and development companies |
| 1) | Disclosures Pursuant to Section 264b of the German Commercial Code (Handelsgesetzbuch—HGB) Applying Section 264b HGB, LHS Holding GmbH & Co. KG, LHS Communication GmbH & Co. KG and LHS Telekommunikation GmbH & Co. KG, all located in Frankfurt am Main/Germany, are exempted from the obligation to prepare, have audited and disclose financial statements and a management report in accordance with the legal requirements being applicable for German corporations. |
RECONCILIATIONS TO IFRS This section includes a reconciliation of certain non-IFRS financial measures to the most directly comparable IFRS financial measures. The presentation of non-IFRS financial measures has limitations as analytical tools and should not be considered in isolation or as a substitute for our related financial measures prepared in accordance with IFRS. ERICSSON ANNUAL REPORT ON FORM 20-F 20092012 We present non-IFRS financial measures to enhance an investor’s evaluation of our ongoing operating results, to aid in forecasting future periods and to facilitate meaningful comparison of our results between periods. Our management uses these non-IFRS financial measures to, among other things, evaluate our ongoing operations in relation to historical results, for internal planning and forecasting purposes and in the calculation of certain performance-based compensation. The non-IFRS financial measures presented in this report may differ from similarly-titled measures used by other companies. FINANCIAL TERMINOLOGYERICSSON—EXPENSES
| | | | | | | | | | | | | | | | | | | | | | | | | | | | IFRS | | | Restructuring Charges | | | Non-IFRS | | SEK billion | | 2011 | | | 2010 | | | 2011 | | | 2010 | | | 2011 | | | 2010 | | Selling and administrative expenses | | | 26.7 | | | | 27.1 | | | | 1.4 | | | | 1.8 | | | | 25.3 | | | | 25.3 | | R&D expenses | | | 32.6 | | | | 31.6 | | | | 0.6 | | | | 1.7 | | | | 32.1 | | | | 29.9 | | Net sales | | | 226.9 | | | | 203.3 | | | | | | | | | | | | 226.9 | | | | 203.3 | | | | | | | | | | | | | | | | | | | | | | | | | | | R&D expenses as a percent of net sales | | | 14.4 | % | | | 15.5 | % | | | | | | | | | | | 14.1 | % | | | 14.7 | % | | | | | | | | | | | | | | | | | | | | | | | | | |
Capital employedERICSSON EBITA MARGIN (INCLUDING RESTRUCTURING)
Total assets less non-interest-bearing provisions and liabilities.
| | | | | | | | | | | | | | | | | SEK billion | | 2012 | | | 2011 | | | 2010 | | | 2009 | | Net income | | | 5.9 | | | | 12.6 | | | | 11.2 | | | | 4.1 | | Interest | | | 0.3 | | | | –0.2 | | | | 0.7 | | | | –0.3 | | Tax | | | 4.2 | | | | 5.6 | | | | 4.5 | | | | 2.1 | | Amortization and write-downs of acquired intangibles | | | 4.6 | | | | 4.5 | | | | 5.9 | | | | 7.8 | | EBITA | | | 15.0 | | | | 22.4 | | | | 22.4 | | | | 13.8 | | | | | | | | | | | | | | | | | | | Net sales | | | 227.8 | | | | 226.9 | | | | 203.3 | | | | 206.5 | | EBITA margin (%) | | | 6.6 | % | | | 9.9 | % | | | 11.0 | % | | | 6.7 | % | | | | | | | | | | | | | | | | | |
Capital turnoverADJUSTED OPERATING CASH FLOWS
Net sales divided by average Capital employed.
Cash conversion
Cash flow from operating activities divided by net income reconciled to cash—expressed in percent.
Cash dividends per share
Dividends paid divided by average number of shares, basic.
Compound annual growth rate (CAGR)
The year-over-year growth rate over a specified period of time.
Days sales outstanding (DSO)
Trade receivables balance at quarter end divided by Net Sales in the quarter and multiplied by 90 days. If the amount of trade receivables is larger than last quarter’s sales, the excess amount is divided by Net Sales in the previous quarter and multiplied by 90 days, and total days outstanding (DSO) are the 90 days of the most current quarter plus the additional days from the previous quarter.
Earnings per share
Basic earnings per share; profit or loss attributable to stockholders of the Parent Company divided by the weighted average number of ordinary shares outstanding during the period. Diluted earnings per share; the weighted average number of shares outstanding are adjusted for the effects of all dilutive potential ordinary shares.
EBITDA margin
Earnings Before Interest, Taxes, Depreciation and Amortization, as a percentage of Net Sales.
Equity ratio
Equity, expressed as a percentage of total assets.
Gross Cash
Gross cash consists, in addition to cash and cash equivalents plus short-term cash investments less interest-bearing liabilities and post-employment benefits, also of short-term investments held for cash management purposes.
| | | | | | | | | SEK billion | | 2011 | | | 2010 | | Operating cash flow | | | 10.0 | | | | 26.6 | | Restructuring cash outlays | | | 3.2 | | | | 3.3 | | | | | | | | | | | Adjusted operating cash flows | | | 13.2 | | | | 29.8 | | | | | | | | | | |
ERICSSON ANNUAL REPORT ON FORM 20-F 20092012 Inventory turnover days (ITO-days)SEGMENT NET SALES, OPERATING INCOME AND OPERATING MARGIN
365 divided by inventory turnover, calculated as total adjusted cost of sales divided by the average inventories
| | | | | | | | | SEK billion | | 2011 | | | 2010 | | Net sales | | | | | | | | | Networks | | | 132.4 | | | | 112.7 | | Global Services | | | 83.9 | | | | 80.1 | | Support solutions | | | 10.6 | | | | 10.5 | | | | | | | | | | | Operating income | | | | | | | | | Networks | | | 17.3 | | | | 12.5 | | Global Services | | | 5.5 | | | | 6.5 | | Support solutions | | | –0.5 | | | | –0.6 | | | | | | | | | | | Operating margin | | | | | | | | | Networks | | | 13 | % | | | 11 | % | Global Services | | | 7 | % | | | 8 | % | Support solutions | | | –5 | % | | | –6 | % | | | | | | | | | | Restructuring charges | | | | | | | | | Networks | | | 1.6 | | | | 3.9 | | Global Services | | | 1.4 | | | | 2.7 | | Support solutions | | | 0.1 | | | | 0.2 | | | | | | | | | | | Operating income excl. restructuring charges | | | | | | | | | Networks | | | 18.9 | | | | 16.4 | | Global Services | | | 6.9 | | | | 9.2 | | Support solutions | | | –0.4 | | | | –0.4 | | | | | | | | | | | Operating margin excl. restructuring charges | | | | | | | | | Networks | | | 14 | % | | | 15 | % | Global Services | | | 8 | % | | | 11 | % | Support solutions | | | –3 | % | | | –4 | % | | | | | | | | | |
In 2012, for the year (net of advances from customers).all above items except EBITA margin, non-IFRS financial measures were not used. Net cashCAPITAL EMPLOYED
Cash and cash equivalents plus short-term cash investments less interest-bearing liabilities and post-employment benefits.
Payable days
The average balance of Trade payables at the beginning and at the end of the year divided by Cost of sales for the year, and multiplied by 365 days.
Payment readiness
Cash and cash equivalents and short-term investments less short-term borrowings plus long-term unused credit commitments. Payment readiness is also shown as a percentage of Net Sales.
Return on capital employed
The total of Operating income plus Financial income as a percentage of average capital employed (based on the amounts at January 1 and December 31).
Return on equity
Net income attributable to stockholders of the Parent Company as a percentage of average Stockholders’ equity (based on the amounts at January 1 and December 31).
Stockholders’ equity per share
Stockholders’ equity divided by the number of shares outstanding at end of period, basic.
Trade receivables turnover
Net sales divided by average Trade receivables.
Value at Risk (VaR)
A statistical method that expresses the maximum potential loss that can arise with a certain degree of probability during a certain period of time.
Working capital
Current assets less current non-interest-bearing provisions and liabilities.
| | | | | | | | | | | | | | | | | | | | | | | | 2012 | | | 2011 | | | 2010 | | | 2009 | | | 2008 | | Total assets | | | 274,996 | | | | 280,349 | | | | 281,815 | | | | 269,809 | | | | 285,684 | | Non-interest-bearing provisions and liabilities | | | | | | | | | | | | | | | | | | | | | Provisions, non-current | | | –211 | | | | –280 | | | | –353 | | | | –461 | | | | –311 | | Deferred tax liabilities | | | –3,120 | | | | –2,250 | | | | –2,571 | | | | –2,270 | | | | –2,738 | | Other non-current liabilities | | | –2,377 | | | | –2,248 | | | | –3,296 | | | | –2,035 | | | | –1,622 | | Provisions, current | | | –8,427 | | | | –5,985 | | | | –9,391 | | | | –11,970 | | | | –14,039 | | Trade payables | | | –23,100 | | | | –25,309 | | | | –24,959 | | | | –18,864 | | | | –23,504 | | Other current liabilities | | | –61,108 | | | | –57,970 | | | | –58,605 | | | | –52,529 | | | | –61,032 | | | | | | | | | | | | | | | | | | | | | | | Capital employed | | | 176,653 | | | | 186,307 | | | | 182,640 | | | | 181,680 | | | | 182,439 | | | | | | | | | | | | | | | | | | | | | | |
ERICSSON ANNUAL REPORT ON FORM 20-F 20092012 RETURN ON CAPITAL EMPLOYED | | | | | | | | | | | | | | | | | | | | | | | | 2012 | | | 2011 | | | 2010 | | | 2009 | | | 2008 | | Operating income | | | 10,458 | | | | 17,900 | | | | 16,455 | | | | 5,918 | | | | 16,252 | | Financial income | | | 1,708 | | | | 2,882 | | | | 1,047 | | | | 1,874 | | | | 3,458 | | Average capital employed1) | | | | | | | | | | | | | | | | | | | | | Capital employed at January 1 | | | 186,307 | | | | 182,640 | | | | 181,680 | | | | 182,439 | | | | 168,456 | | Capital employed at December 31 | | | 176,653 | | | | 186,307 | | | | 182,640 | | | | 181,680 | | | | 182,439 | | Average capital employed | | | 181,480 | | | | 184,474 | | | | 182,160 | | | | 182,060 | | | | 175,448 | | | | | | | | | | | | | | | | | | | | | | | Return on capital employed2) | | | 6.7 | % | | | 11.3 | % | | | 9.6 | % | | | 4.3 | % | | | 11.3 | % | | | | | | | | | | | | | | | | | | | | | |
| 1) | Average capital employed is the average of the amounts of capital employed at January 1 and December 31. |
| 2) | Return on capital employed is the total of operating income and financial income as a percentage of average capital employed. |
GROSS CASH AND NET CASH | | | | | | | | | | | | | | | | | | | | | | | | 2012 | | | 2011 | | | 2010 | | | 2009 | | | 2008 | | Cash and cash equivalents | | | 44,682 | | | | 38,676 | | | | 30,864 | | | | 22,798 | | | | 37,813 | | Short term investments | | | 32,026 | | | | 41,866 | | | | 56,286 | | | | 53,926 | | | | 37,192 | | Gross cash | | | 76,708 | | | | 80,542 | | | | 87,150 | | | | 76,724 | | | | 75,005 | | Post-employment benefits | | | –9,503 | | | | –10,016 | | | | –5,092 | | | | –8,533 | | | | –9,873 | | Interest-bearing liabilities | | | | | | | | | | | | | | | | | | | | | Borrowings non-current | | | –23,898 | | | | –23,256 | | | | –26,955 | | | | –29,996 | | | | –24,939 | | Borrowings current | | | –4,769 | | | | –7,765 | | | | –3,808 | | | | –2,124 | | | | –5,542 | | | | | | | | | | | | | | | | | | | | | | | Net cash | | | 38,538 | | | | 39,505 | | | | 51,295 | | | | 36,071 | | | | 34,651 | | | | | | | | | | | | | | | | | | | | | | | | RETURN ON EQUITY | | | | | | | | | | | | | | | | | | | | | | | | 2012 | | | 2011 | | | 2010 | | | 2009 | | | 2008 | | Net income attributable to stockholders of the Parent Company | | | 5,775 | | | | 12,194 | | | | 11,146 | | | | 3,672 | | | | 11,273 | | Average stockholders’ equity1) | | | | | | | | | | | | | | | | | | | | | Stockholders’ equity at January 1 | | | 143,105 | | | | 145,106 | | | | 139,870 | | | | 140,823 | | | | 134,112 | | Stockholders’ equity at December 31 | | | 136,883 | | | | 143,105 | | | | 145,106 | | | | 139,870 | | | | 140,823 | | Average stockholders’ equity | | | 139,994 | | | | 144,106 | | | | 142,488 | | | | 140,347 | | | | 137,468 | | | | | | | | | | | | | | | | | | | | | | | Return on equity2) | | | 4.1 | % | | | 8.5 | % | | | 7.8 | % | | | 2.6 | % | | | 8.2 | % | | | | | | | | | | | | | | | | | | | | | |
| 1) | Average stockholders’ equity is based on the amounts at January 1 and December 31. |
| 2) | Return on equity is Net income attributable to stockholders of the Parent Company as a percentage of average Stockholders’ equity (based on the amounts at January 1 and December 31). |
ERICSSON ANNUAL REPORT ON FORM 20-F 2012 WORKING CAPITAL | | | | | | | | | | | | | | | | | | | | | | | | 2012 | | | 2011 | | | 2010 | | | 2009 | | | 2008 | | Current assets | | | 193,254 | | | | 198,816 | | | | 198,443 | | | | 182,442 | | | | 198,525 | | Current non-interest-bearing provisions and liabilities | | | | | | | | | | | | | | | | | | | | | Provisions, current | | | –8,427 | | | | –5,985 | | | | –9,391 | | | | –11,970 | | | | –14,039 | | Trade payables | | | –23,100 | | | | –25,309 | | | | –24,959 | | | | –18,864 | | | | –23,504 | | Other current liabilities | | | –61,108 | | | | –57,970 | | | | –58,605 | | | | –52,529 | | | | –61,032 | | | | | | | | | | | | | | | | | | | | | | | Working capital1) | | | 100,619 | | | | 109,552 | | | | 105,488 | | | | 99,079 | | | | 99,951 | | | | | | | | | | | | | | | | | | | | | | |
| 1) | Working capital is Current assets less current non-interest-bearing provisions and liabilities |
CASH CONVERSION | | | | | | | | | | | | | | | | | | | | | | | 2012 | | | 2011 | | | 2010 | | Cash flow from operating activities | | | A | | | | 22,031 | | | | 9,982 | | | | 26,583 | | Net income | | | B | | | | 5,938 | | | | 12,569 | | | | 11,235 | | Adjustments to reconcile net income to cash | | | C | | | | 13,077 | | | | 12,613 | | | | 12,490 | | | | | | | | | | | | | | | | | | | Cash conversion = A/(B+C) | | | | | | | 116 | % | | | 40 | % | | | 112 | % | | | | | | | | | | | | | | | | | |
ERICSSON ANNUAL REPORT ON FORM 20-F 2012 GLOSSARY 2G FirstThe first digital generation of mobile systems, includessystems. Includes GSM, TDMA, PDC and cdmaOne.
3G 3rd generation mobile system,system. includes WCDMA/HSPA, EDGE, CDMA2000 and TD-SCDMA. 4G See LTE. All-IP A single, common IP infrastructure that can handle all network services, including fixed and mobile communications, for voice and data services and alsoas well as video services such as TV. ATM
(Asynchronous Transfer Mode) A communication standard for transmission and management of high-speed packet-switched networks.
Backhaul Transmission between radio base stations and the core network. BroadbandBSS
Data speeds that are high enough to allow transmission of multimedia services with good quality.Business support systems
CaGR Compound Annual Growth Rate. Capex Capital expenditure. CDMA (Code division multiple access ) TheDivision Multiple Access) A radio technology on which the cdmaOne (2G) and CDMA2000 (3G) mobile communication standards are both based on CDMA.based. DSL accessCLOUD
Digital Subscriber Line technologies for broadband multimedia communicationsWhen data and applications reside in fixed line networks. Examples: IP-DSL, ADSL and VDSL.the network.
EDGEEdge
A 3G mobile standard, developed as an enhancement of GSM. Enables the transmission of data at speeds up to 250 kbps. Emerging market
Defined as a country that has a GNP per capita index below the World Bank average and a mobile subscription penetration below 60 percent.
ERICSSON ANNUAL REPORT ON FORM 20-F 2009
Evo RAN
A Radio Access Network (RAN) solution (Evolved EDGE up to run GSM, WCDMA and LTE as a single network.
Exabyte
= billion gigabytes.
FTTx
Fiber-To-The-x, e.g. FTTH (Fiber-to-the-home) refers to fiber optic broadband connections to individual homes.1 Mbps)
GDP (Gross domestic product theDomestic Product) The total annual cost of all finished goods and services produced within a country. ERICSSON ANNUAL REPORT ON FORM 20-F 2012 GPON (Gigabit Passive Optical Network) Used for fiber-optic communication to the home (FTTH). GPRSGSM
(General Packet Radio Service)Global System for Mobile Communications) A packet-switched technology (2.5G) that enables GSM networks to handlefirst digital generation mobile data communications at rates up to 115 kbps.system. HSPA (High Speed Packet Access) Enhancement of 3G/WCDMA that enables mobile broadband. A subscriber can download files to a 3G mobile device at speeds of several Mbps. ICT Information and Communication Technology. IMS (IP Multimedia Subsystem) A standard for offering voice and multimedia services over mobile and fixed networks using internet technology (IP). IP (Internet Protocol) Defines how information travels between network elements across the internet. IPR Intellectual Property Rights IPTV (IP Television) A technology that delivers digital television via fixed broadband access. IPX
(Internet Payment eXchange) The global payment and messaging delivery solution for SMS, MMS, Web and WAP.
ERICSSON ANNUAL REPORT ON FORM 20-F 2009
JV (Joint venture)Venture) A business enterprise in which two or more companies enter a partnership. LTE (Long-Term Evolution) The next evolutionary step of mobile technology beyond HSPA, allowing data rates above 100 Mbps. Managed services Management of operator networks and/or hosting of their services. OpexMobile broadband
Operating expenses.Wireless high-speed internet access using the HSPA, LTE and CDMA2000EV-DO technologies.
ERICSSON ANNUAL REPORT ON FORM 20-F 2012 PBXOSS
(Private Branch eXchange) A telephone exchange that serves a particular business or office.
Packet switching
A method of switching data in a network where individual packets are accepted by the network and delivered to their destinations. The method is used by the Internet and replaces traditional circuit switching.Operations support systems
Penetration The number of subscriptions divided by the population in a geographical area. SoftswitchPETAbyte
A software-based system for handling call management functionality. Integrates IP-telephony and the legacy circuit-switched part of the network.Million gigabytes.
TDMRAN
Time division multiplexing, legacy technology for circuit switching.Radio Access Network.
Telecom gradeTD-SCDMA
99.999 percent availability; performance requirement on telecom networks.
VoIP
Voice over IP, same as IP telephony.(Time Division Synchronous Code Division Multiple Access), an alternative to WCDMA used in China.
WCDMA (Wideband Code Division Multiple Access) A 3G mobile communication standard. WCDMA builds on the same core network infrastructure as GSM. WDMxDSL
(Wavelength division multiplexing) Uses multiple light wavelengthsDigital Subscriber Line technologies for broadband multimedia communications in fixed-line networks. Examples: IP-DSL, ADSL and VDSL.
The terms “Ericsson”, “the Company”, “the Group”, “us”, “we”, and “our” all refer to increase the transmission capacity of fiber cables for optical networks. Telefonaktiebolaget LM Ericsson and its subsidiaries.ERICSSON ANNUAL REPORT ON FORM 20-F 20092012 FINANCIAL TERMINOLOGY Capital employed Total assets less non-interest-bearing provisions and liabilities. (which includes: provisions, non-current; deferred tax liabilities; other non-current liabilities; provisions, current; trade payables; other current liabilities). Capital turnover Net sales divided by average capital employed. Cash conversion Cash flow from operating activities divided by the sum of net income and adjustments to reconcile net income to cash, expressed as percent. Cash dividends per share Dividends paid divided by average number of shares, basic. Compound annual growth rate (CAGR) The year-over-year growth rate over a specified period of time. Days sales outstanding (DSO) Trade receivables balance at quarter end divided by net sales in the quarter and multiplied by 90 days. If the amount of trade receivables is larger than last quarter’s sales, the excess amount is divided by net sales in the previous quarter and multiplied by 90 days, and total DSO are the 90 days of the most current quarter plus the additional days from the previous quarter. Earnings per share (EPS) Basic earnings per share: profit or loss attributable to stockholders of the Parent Company divided by the weighted average number of ordinary shares outstanding during the period. Diluted earnings per share: the weighted average number of shares outstanding are adjusted for the effects of all dilutive potential ordinary shares. EBITA margin Earnings before interest, taxes, amortization and write-downs of acquired intangibles (intellectual property rights, trademarks and other intangible assets, see Note C10 “Intangible assets”) as a percentage of net sales. EPS (non-IFRS) EPS, diluted, excluding amortizations and write-down of acquired intangible assets and including restructuring charges. Equity ratio Equity, expressed as a percentage of total assets. Gross cash Cash and cash equivalents plus short-term investments. ERICSSON ANNUAL REPORT ON FORM 20-F 2012 Inventory turnover days (ITO-days) 365 divided by inventory turnover, calculated as total cost of sales divided by the average inventories for the year (net of advances from customers). Net cash Cash and cash equivalents plus short-term investments less interest-bearing liabilities (which include: borrowings, non-current and borrowings, current) and post-employment benefits. P/E ratio The P/E ratio is calculated as the price of a Class B share at last day of trading divided by Earnings per share, basic. Payable days The average balance of trade payables at the beginning and at the end of the year divided by cost of sales for the year, and multiplied by 365 days. Payment readiness Cash and cash equivalents and short-term investments less short-term borrowings plus long-term unused credit commitments. Payment readiness is also shown as a percentage of net sales. Return on capital employed The total of Operating income plus Financial income as a percentage of average capital employed (based on the amounts at January 1 and December 31). Return on equity Net income attributable to stockholders of the Parent Company as a percentage of average Stockholders’ equity (based on the amounts at January 1 and December 31). Stockholders’ equity per share Stockholders’ equity divided by the number of shares outstanding at end of period, basic. Total shareholder return (TSR) The increase or decrease in Class B share price during the period, adjusted for dividends paid, expressed as a percentage of the share price at the start of the period. Trade receivables turnover Net sales divided by average trade receivables. Value at risk (VaR) A statistical method that expresses the maximum potential loss that can arise with a certain degree of probability during a certain period of time. Working capital Current assets less current non-interest-bearing provisions and liabilities (which include: provisions, current; trade payables; other current liabilities). ERICSSON ANNUAL REPORT ON FORM 20-F 2012 EXCHANGE RATES Exchange rates used in the consolidation | | | | | | | | | | | | January–December | | | | | 2012 | | | 2011 | | SEK/EUR | | | | | | | | | Average rate | | | 8.70 | | | | 9.02 | | Closing rate | | | 8.58 | | | | 8.92 | | SEK/USD | | | | | | | | | Average rate | | | 6.73 | | | | 6.48 | | Closing rate | | | 6.51 | | | | 6.90 | |
ERICSSON ANNUAL REPORT ON FORM 20-F 2012 SHAREHOLDER INFORMATION FOR PRINTED PUBLICATIONS A printed copy of the Annual Report is provided on request. Strömberg Distribution SE-120 88 Stockholm, Sweden Phone: +46 8 449 89 57 Email: ericsson@strd.se IN THE UNITED STATES: Ericsson’s Transfer Agent Citibank: Citibank Shareholder Services Registered holders: +1 877 881 59 69 Interested investors: +1 781 575 45 55 Email: citibank@shareholders-online.com www.citi.com/dr Ordering a hard copy of the Annual Report: +1 888 301 2504 Telefonaktiebolaget LM Ericsson’s shareholders are invited to participate in the Annual General Meeting to be held on Tuesday, April 9, 2013, at 3 p.m. at Kistamässan, Arne Beurlings Torg 5, Kista, Stockholm, Sweden. Registration and notice of attendance Shareholders who wish to attend the Annual General Meeting must: Be recorded in the share register kept by Euroclear Sweden AB (the Swedish Securities Registry) on Wednesday, April 3, 2013, and Give notice of attendance to the Company at the latest on Wednesday, April 3, 2013. Notice of attendance can be given by telephone: +46 8 402 90 54 on weekdays between 10 a.m. and 4 p.m., or on Ericsson’s website. Notice of attendance may also be given in writing to: Telefonaktiebolaget LM Ericsson General Meeting of Shareholders Box 7835, SE-103 98 Stockholm, Sweden When giving notice of attendance, please state name, date of birth, address, telephone number and number of assistants, if any. The meeting will be conducted in Swedish and simultaneously interpreted into English. Shares registered in the name of a nominee In addition to giving notice of attendance, shareholders having their shares registered in the name of a nominee, must request the nominee to temporarily enter the shareholder into the share register as per Wednesday, April 3, 2013, in order to be entitled to attend the meeting. The shareholders should inform the nominee to that effect well before that day. ERICSSON ANNUAL REPORT ON FORM 20-F 2012 Proxy Shareholders represented by proxy shall issue and submit to the Company a power of attorney for the representative. A power of attorney issued by a legal entity must be accompanied by a copy of the entity’s certificate of registration, or if no such certificate exist, a corresponding document of authority. Such documents must not be older than one year unless the power of attorney explicitly provides that it is valid for a longer period, up to a maximum of five years. In order to facilitate the registration at the Annual General Meeting, the power of attorney in original, certificates of registration and other documents of authority should be sent to the Company in advance to the address above for receipt by Monday, April 8, 2013. Forms of power of attorney in Swedish and English are available on Ericsson’s website. Dividend The Board of Directors has decided to propose the Annual General Meeting to resolve on a dividend of SEK 2.75 per share for the year 2012 and that Friday, April 12, 2013 will be the record date for dividend. Financial information from Ericsson | | | | | | | | | | | | | Interim reports 2013: | | • | | | | Q1, April 24, 2013 | | • | | | | Q3, October 24, 2013 | | | • | | | | Q2, July 18, 2013 | | • | | | | Q4, January 30, 2014 |
Annual Report 2013: March, 2014 2012 Form 20-F for the US market: March-April 2013 WHERE YOU CAN FIND OUT MORE Information about Ericsson and its development is available on our website. Annual and interim reports and other relevant shareholder information can be found on our website. Ericsson headquarters Torshamnsgatan 23 Kista, Stockholm, Sweden Registered office Telefonaktiebolaget LM Ericsson SE–164 83 Stockholm, Sweden Investor relations For questions on the Company, please contact Investor Relations: Telephone: +46 10 719 00 00 Email: investor.relations@ ericsson.com ERICSSON ANNUAL REPORT ON FORM 20-F 2012 SIGNATURES The registrant hereby certifies that it meets all of the requirements for filing on Form 20-F and that it has duly caused and authorized the undersigned to sign this Annual Report on its behalf. TELEFONAKTIEBOLAGET LM ERICSSON April 21, 20108, 2013 | | | By: | | /s/ ROLAND HAGMAN | | | Roland Hagman Vice President
GroupFunction Financial Control
|
| | | By: | | /s/ CNARLINA OMLOF BLOMQVISTACPHERSON | | | Carl Olof BlomqvistNina Macpherson
Senior Vice President and General Counsel
|
239274
|