UNITED STATES
SECURITIES AND EXCHANGE COMMISSION
WASHINGTON, D.C. 20549
FORM 20-F
| ¨ | REGISTRATION STATEMENT PURSUANT TO SECTION 12(b) OR 12(g) OF THE SECURITIES EXCHANGE ACT OF 1934 |
OR
| x | ANNUAL REPORT PURSUANT TO SECTION 13 OR 15(d) OF THE SECURITIES EXCHANGE ACT OF 1934 |
FOR THE FISCAL YEAR ENDED DECEMBER 31, 20102011
OR
| ¨ | TRANSITION REPORT PURSUANT TO SECTION 13 OR 15(d) OF THE SECURITIES EXCHANGE ACT OF 1934 |
OR
| ¨ | SHELL COMPANY REPORT PURSUANT TO SECTION 13 OR 15(d) OF THE SECURITIES EXCHANGE ACT OF 1934 |
Date of event requiring this shell company report
For the transition period from to
Commission file number 001-31236
TSAKOS ENERGY NAVIGATION LIMITED
(Exact name of Registrant as specified in its charter)
Not Applicable
(Translation of Registrant’s name into English)
Bermuda
(Jurisdiction of incorporation or organization)
367 Syngrou Avenue
175 64 P. Faliro
Athens, Greece
011-30210-9407710
(Address of principal executive offices)
Paul Durham
367 Syngrou Avenue
175 64 P. Faliro
Athens, Greece
Telephone: 011-30210-9407710
E-mail: ten@tenn.gr
Facsimile: 011-30210-9407716
(Name, Address, Telephone Number, E-mail and Facsimile Number of Company Contact Person)
Securities registered or to be registered pursuant to Section 12(b) of the Act:
Title of each class | Name of each exchange on which registered | |
Common Shares, par value $1.00 per share | New York Stock Exchange | |
Preferred share purchase rights | New York Stock Exchange |
Securities registered or to be registered pursuant to Section 12(g) of the Act: None
Securities for which there is a reporting obligation pursuant to Section 15(d) of the Act: None
As of December 31, 2010,2011, there were 46,081,487 shares46,208,737 of the registrant’s Common Shares outstanding.
Indicate by check mark if the registrant is a well-known seasoned issuer, as defined in Rule 405 of the Securities Act. Yes ¨ No x
If this report is an annual or transition report, indicate by check mark if the registrant is not required to file reports pursuant to Section 13 or 15(d) of the Securities Exchange Act of 1934. Yes ¨ No x
Note – Note—Checking the box above will not relieve any registrant required to file reports pursuant to Section 13 or 15(d) of the Securities Exchange Act of 1934 from their obligations under those Sections.
Indicate by check mark whether the registrant (1) has filed all reports required to be filed by Section 13 or 15(d) of the Securities Exchange Act of 1934 during the preceding 12 months (or for such shorter period that the registrant was required to file such reports), and (2) has been subject to such filing requirements for the past 90 days. Yes x No ¨
Indicate by check mark whether the registrant has submitted electronically and posted on its corporate Website, if any, every Interactive Data File required to be submitted and posted pursuant to Rule 405 of Regulation S-T (§232.405 of this chapter) during the preceding 12 months (or for such shorter period that the registrant was required to submit and post such files). Yes ¨ No ¨
Indicate by check mark whether the registrant is a large accelerated filer, an accelerated filer, or a non-accelerated filer. See definition of “accelerated filer and large accelerated filer” in Rule 12b-2 of the Exchange Act. (Check one):
Large accelerated filer ¨ Accelerated filer x Non-accelerated filer ¨
Indicate by check mark which basis of accounting the registrant has used to prepare the financial statements included in this filing:
| U.S. GAAP x | International Financial Reporting Standards ¨ | Other ¨ |
If “Other” has been checked in response to the previous question, indicate by check mark which financial statement item the registrant has elected to follow. Item 17 ¨ Item 18 ¨
If this is an annual report, indicate by check mark whether the registrant is a shell company (as defined in Rule 12b-2 of the Exchange Act). Yes ¨ No x
| Page | ||||
| 1 | ||||
| 2 | ||||
Item 1. Identity of Directors, Senior Management and Advisers | 2 | |||
| 2 | ||||
| 2 | ||||
Item 11. Quantitative and Qualitative Disclosures About Market Risk | ||||
Item 12. Description of Securities Other than Equity Securities | ||||
Item 14. Material Modifications to the Rights of Security Holders and Use of Proceeds | ||||
Item 16D. Exemptions from the Listing Standards for Audit Committees | ||||
Item 16E. Purchases of Equity Securities by the Issuer and Affiliated Purchasers | ||||
| 115 | ||||
| 115 | ||||
| 115 | ||||
All statements in this Annual Report on Form 20-F that are not statements of historical fact are “forward-looking statements” within the meaning of the United States Private Securities Litigation Reform Act of 1995. The disclosure and analysis set forth in this Annual Report on Form 20-F includes assumptions, expectations, projections, intentions and beliefs about future events in a number of places, particularly in relation to our operations, cash flows, financial position, plans, strategies, business prospects, changes and trends in our business and the markets in which we operate. These statements are intended as forward-looking statements. In some cases, predictive, future-tense or forward-looking words such as “believe”, “intend”, “anticipate”, “estimate”, “project”, “forecast”, “plan”, “potential”, “may”, “predict,” “should” and “expect” and similar expressions are intended to identify forward-looking statements, but are not the exclusive means of identifying such statements.
Forward-looking statements include, but are not limited to, such matters as:
future operating or financial results and future revenues and expenses;
future, pending or recent business and vessel acquisitions, business strategy, areas of possible expansion and expected capital spending and our ability to fund such expenditure;
operating expenses including the availability of key employees, crew, length and number of off-hire days, dry-docking requirements and fuel and insurance costs;
general market conditions and shipping industry trends, including charter rates, vessel values and factors affecting supply and demand of crude oil and petroleum products;
our financial condition and liquidity, including our ability to make required payments under our credit facilities, comply with our loan covenants and obtain additional financing in the future to fund capital expenditures, acquisitions and other corporate activities;
the overall health and condition of the U.S. and global financial markets, including the value of the U.S. dollar relative to other currencies;
the carrying value of our vessels and the potential for any asset impairments;
our expectations about the time that it may take to construct and deliver new vessels or the useful lives of our vessels;
our continued ability to enter into period time charters with our customers and secure profitable employment for our vessels in the spot market;
the ability of our counterparties including our charterers to honor their contractual obligations;
our expectations relating to dividend payments and ability to make such payments;
our ability to leverage to our advantage the relationships and reputation of Tsakos Columbia Shipmanagement within the shipping industry;
our anticipated general and administrative expenses;
environmental and regulatory conditions, including changes in laws and regulations or actions taken by regulatory authorities;
risks inherent in vessel operation, including terrorism, piracy and discharge of pollutants;
potential liability from future litigation;
global and regional political conditions;
tanker and product carrier supply and demand; and
other factors discussed in the “Risk Factors” described in Item 3. of this Annual Report on Form 20-F.
We caution that the forward-looking statements included in this Annual Report on Form 20-F represent our estimates and assumptions only as of the date of this Annual Report on Form 20-F and are not intended to give any assurance as to future results. These forward-looking statements are not statements of historical fact and represent
only our management’s belief as of the date hereof, and involve risks and uncertainties that could cause actual results to differ materially and inversely from expectations expressed in or indicated by the forward-looking statements. Assumptions, expectations, projections, intentions and beliefs about future events may, and often do, vary from actual results and these differences can be material. There are a variety of factors, many of which are beyond our control, which affect our operations, performance, business strategy and results and could cause actual reported results and performance to differ materially from the performance and expectations expressed in these forward-looking statements. These factors include, but are not limited to, supply and demand for crude oil carriers and product tankers, charter rates and vessel values, supply and demand for crude oil and petroleum products, accidents, collisions and spills, environmental and other government regulation, the availability of debt financing, fluctuation of currency exchange and interest rates and the other risks and uncertainties that are outlined in this Annual Report on Form 20-F. As a result, the forward-looking events discussed in this Annual Report on Form 20-F might not occur and our actual results may differ materially from those anticipated in the forward-looking statements. Accordingly, you should not unduly rely on any forward-looking statements.
We undertake no obligation to update or revise any forward-looking statements contained in this Annual Report on Form 20-F, whether as a result of new information, future events, a change in our views or expectations or otherwise. New factors emerge from time to time, and it is not possible for us to predict all of these factors. Further, we cannot assess the impact of each such factor on our business or the extent to which any factor, or combination of factors, may cause actual results to be materially different from those contained in any forward-looking statement.
Tsakos Energy Navigation Limited is a Bermuda company that is referred to in this Annual Report on Form 20-F, together with its subsidiaries, as Tsakos Energy Navigation, “the Company,” “we,” “us,” or “our.” This report should be read in conjunction with our consolidated financial statements and the accompanying notes thereto, which are included in Item 18 to this report.
| Item 1. | Identity of Directors, Senior Management and Advisers |
Not Applicable.
| Item 2. | Offer Statistics and Expected Timetable |
Not Applicable.
| Item 3. | Key Information |
Selected Consolidated Financial Data and Other Data
The following table presents selected consolidated financial and other data of Tsakos Energy Navigation Limited for each of the five years in the five-year period ended December 31, 2010.2011. The table should be read together with “Item 5. Operating and Financial Review and Prospects.” The selected consolidated financial data of Tsakos Energy Navigation Limited is a summary of, is derived from and is qualified by reference to, our consolidated financial statements and notes thereto which have been prepared in accordance with U.S. generally accepted accounting principles (“US GAAP”).
Per share data has been adjusted to give effect to our two for one share split which became effective on November 14, 2007.
Our audited consolidated statements of income, comprehensive income, stockholders’ equity and cash flows for the years ended December 31, 2008, 2009, 2010 and 2010,2011, and the consolidated balance sheets at December 31, 20092010 and 2010,2011, together with the notes thereto, are included in “Item 18. Financial Statements” and should be read in their entirety.
Selected Consolidated Financial and Other Data
(Dollars in thousands, except for share and per share amounts and fleet data)
| 2006(11) | 2007(11) | 2008 | 2009 | 2010 | 2007(11) | 2008 | 2009 | 2010 | 2011 | |||||||||||||||||||||||||||||||
Income Statement Data | ||||||||||||||||||||||||||||||||||||||||
Voyage revenues | $ | 427,654 | $ | 500,617 | $ | 623,040 | $ | 444,926 | $ | 408,006 | $ | 500,617 | $ | 623,040 | $ | 444,926 | $ | 408,006 | $ | 395,162 | ||||||||||||||||||||
Expenses | ||||||||||||||||||||||||||||||||||||||||
Commissions | 15,441 | 17,976 | 22,997 | 16,086 | 13,837 | 17,976 | 22,997 | 16,086 | 13,837 | 14,290 | ||||||||||||||||||||||||||||||
Voyage expenses | 69,065 | 72,075 | 83,065 | 77,224 | 85,813 | 72,075 | 83,065 | 77,224 | 85,813 | 127,156 | ||||||||||||||||||||||||||||||
Charter hire expense | 24,461 | 15,330 | 13,487 | — | 1,905 | 15,330 | 13,487 | — | 1,905 | — | ||||||||||||||||||||||||||||||
Vessel operating expenses (1) | 76,095 | 108,356 | 143,757 | 144,586 | 126,022 | |||||||||||||||||||||||||||||||||||
Vessel operating expenses(1) | 108,356 | 143,757 | 144,586 | 126,022 | 129,884 | |||||||||||||||||||||||||||||||||||
Depreciation | 59,058 | 81,567 | 85,462 | 94,279 | 92,889 | 81,567 | 85,462 | 94,279 | 92,889 | 101,050 | ||||||||||||||||||||||||||||||
Amortization of deferred dry-docking costs | 4,857 | 3,217 | 5,281 | 7,243 | 4,553 | 3,217 | 5,281 | 7,243 | 4,553 | 4,878 | ||||||||||||||||||||||||||||||
Management fees | 7,103 | 9,763 | 12,015 | 13,273 | 14,143 | 9,763 | 12,015 | 13,273 | 14,143 | 15,598 | ||||||||||||||||||||||||||||||
General and administrative expenses | 3,510 | 4,382 | 4,626 | 4,069 | 3,627 | 4,382 | 4,626 | 4,069 | 3,627 | 4,292 | ||||||||||||||||||||||||||||||
Management incentive award | 3,500 | 4,000 | 4,750 | — | 425 | 4,000 | 4,750 | — | 425 | — | ||||||||||||||||||||||||||||||
Stock compensation expense | 216 | 5,670 | 3,046 | 1,087 | 1,068 | 5,670 | 3,046 | 1,087 | 1,068 | 820 | ||||||||||||||||||||||||||||||
Foreign currency losses (gains) | 279 | 691 | 915 | 730 | (378 | ) | 691 | 915 | 730 | (378 | ) | 458 | ||||||||||||||||||||||||||||
Amortization of deferred gain on sale of vessels | (3,168 | ) | (3,168 | ) | (634 | ) | — | — | (3,168 | ) | (634 | ) | — | — | — | |||||||||||||||||||||||||
Net gain on sale of vessels | (38,009 | ) | (68,944 | ) | (34,565 | ) | (5,122 | ) | (19,670 | ) | (68,944 | ) | (34,565 | ) | (5,122 | ) | (19,670 | ) | (5,001 | ) | ||||||||||||||||||||
Vessel impairment charge | — | — | — | 19,066 | 3,077 | — | — | 19,066 | 3,077 | 39,434 | ||||||||||||||||||||||||||||||
Operating income | 205,246 | 249,702 | 278,838 | 72,405 | 80,695 | |||||||||||||||||||||||||||||||||||
Operating income (loss) | 249,702 | 278,838 | 72,405 | 80,695 | (37,697 | ) | ||||||||||||||||||||||||||||||||||
Other expenses (income): | ||||||||||||||||||||||||||||||||||||||||
Gain on sale of shares in subsidiary | (25,323 | ) | — | — | — | — | — | — | — | — | — | |||||||||||||||||||||||||||||
Interest and finance costs, net | 42,486 | 77,382 | 82,897 | 45,877 | 62,283 | 77,382 | 82,897 | 45,877 | 62,283 | 53,571 | ||||||||||||||||||||||||||||||
Interest and investment income | (7,164 | ) | (13,316 | ) | (8,406 | ) | (3,572 | ) | (2,626 | ) | (13,316 | ) | (8,406 | ) | (3,572 | ) | (2,626 | ) | (2,715 | ) | ||||||||||||||||||||
Other, net | (1,159 | ) | (924 | ) | 350 | (75 | ) | 3 | (924 | ) | 350 | (75 | ) | 3 | 397 | |||||||||||||||||||||||||
Total other expenses (income), net | 8,840 | 63,142 | 74,841 | 42,230 | 59,660 | 63,142 | 74,841 | 42,230 | 59,660 | 51,253 | ||||||||||||||||||||||||||||||
Net income | 196,406 | 186,560 | 203,997 | 30,175 | 21,035 | |||||||||||||||||||||||||||||||||||
Less: Net income attributable to non-controlling interest | (2 | ) | (3,389 | ) | (1,066 | ) | (1,490 | ) | (1,267 | ) | ||||||||||||||||||||||||||||||
Net income attributable to Tsakos Energy Navigation Ltd. | $ | 196,404 | $ | 183,171 | $ | 202,931 | $ | 28,685 | $ | 19,768 | ||||||||||||||||||||||||||||||
Net income (loss) | 186,560 | 203,997 | 30,175 | 21,035 | (88,950 | ) | ||||||||||||||||||||||||||||||||||
Less: Net (income) loss attributable to non-controlling interest | (3,389 | ) | (1,066 | ) | (1,490 | ) | (1,267 | ) | 546 | |||||||||||||||||||||||||||||||
Net income (loss) attributable to Tsakos Energy Navigation Ltd. | $ | 183,171 | $ | 202,931 | $ | 28,685 | $ | 19,768 | $ | (89,496 | ) | |||||||||||||||||||||||||||||
Per Share Data | ||||||||||||||||||||||||||||||||||||||||
Earnings per share, basic | $ | 5.15 | $ | 4.81 | $ | 5.40 | $ | 0.78 | $ | 0.50 | ||||||||||||||||||||||||||||||
Earnings per share, diluted | $ | 5.15 | $ | 4.79 | $ | 5.33 | $ | 0.77 | $ | 0.50 | ||||||||||||||||||||||||||||||
Earnings (loss) per share, basic | $ | 4.81 | $ | 5.40 | $ | 0.78 | $ | 0.50 | $ | (1.94 | ) | |||||||||||||||||||||||||||||
Earnings (loss) per share, diluted | $ | 4.79 | $ | 5.33 | $ | 0.77 | $ | 0.50 | $ | (1.94 | ) | |||||||||||||||||||||||||||||
Weighted average number of shares, basic | 38,127,692 | 38,075,859 | 37,552,848 | 36,940,198 | 39,235,601 | 38,075,859 | 37,552,848 | 36,940,198 | 39,235,601 | 46,118,534 | ||||||||||||||||||||||||||||||
Weighted average number of shares, diluted | 38,141,052 | 38,234,079 | 38,047,134 | 37,200,187 | 39,601,678 | 38,234,079 | 38,047,134 | 37,200,187 | 39,601,678 | 46,118,534 | ||||||||||||||||||||||||||||||
Dividends per common share, paid | $ | 1.175 | $ | 1.575 | $ | 1.80 | $ | 1.15 | $ | 0.60 | $ | 1.575 | $ | 1.80 | $ | 1.15 | $ | 0.60 | $ | 0.60 | ||||||||||||||||||||
Cash Flow Data | ||||||||||||||||||||||||||||||||||||||||
Net cash provided by operating activities | 214,998 | 190,611 | 274,141 | 117,161 | 83,327 | 190,611 | 274,141 | 117,161 | 83,327 | 45,587 | ||||||||||||||||||||||||||||||
Net cash used in investing activities | (829,326 | ) | (375,641 | ) | (164,637 | ) | (75,568 | ) | (240,115 | ) | (375,641 | ) | (164,637 | ) | (75,568 | ) | (240,115 | ) | (69,187 | ) | ||||||||||||||||||||
Net cash provided by /(used in) financing activities | 643,126 | 191,910 | 21,218 | (57,581 | ) | 137,244 | 191,910 | 21,218 | (57,581 | ) | 137,244 | (77,329 | ) | |||||||||||||||||||||||||||
Balance Sheet Data | ||||||||||||||||||||||||||||||||||||||||
Cash and cash equivalents | $ | 174,567 | $ | 181,447 | $ | 312,169 | $ | 296,181 | $ | 276,637 | $ | 181,447 | $ | 312,169 | $ | 296,181 | $ | 276,637 | $ | 175,708 | ||||||||||||||||||||
Cash, restricted | 4,347 | 6,889 | 7,581 | 6,818 | 6,291 | 6,889 | 7,581 | 6,818 | 6,291 | 5,984 | ||||||||||||||||||||||||||||||
Investments | 14,045 | 1,000 | 1,000 | 1,000 | 1,000 | 1,000 | 1,000 | 1,000 | 1,000 | 1,000 | ||||||||||||||||||||||||||||||
Advances for vessels under construction | 261,242 | 169,739 | 53,715 | 49,213 | 81,882 | 169,739 | 53,715 | 49,213 | 81,882 | 37,636 | ||||||||||||||||||||||||||||||
Vessels, net book value | 1,458,647 | 1,900,183 | 2,155,489 | 2,009,965 | 2,235,065 | 1,900,183 | 2,155,489 | 2,009,965 | 2,235,065 | 2,194,359 | ||||||||||||||||||||||||||||||
Total assets | 1,969,875 | 2,362,776 | 2,602,317 | 2,549,720 | 2,702,260 | 2,362,776 | 2,602,317 | 2,549,720 | 2,702,260 | 2,535,336 | ||||||||||||||||||||||||||||||
Long-term debt, including current portion | 1,133,661 | 1,389,943 | 1,513,629 | 1,502,574 | 1,562,467 | 1,389,943 | 1,513,629 | 1,502,574 | 1,562,467 | 1,515,663 | ||||||||||||||||||||||||||||||
Total stockholders’ equity | 755,275 | 857,931 | 915,115 | 914,327 | 1,019,930 | 857,931 | 915,115 | 914,327 | 1,019,930 | 919,158 | ||||||||||||||||||||||||||||||
Fleet Data | ||||||||||||||||||||||||||||||||||||||||
Average number of vessels (2) | 33.8 | 41.7 | 44.1 | 46.6 | 46.1 | |||||||||||||||||||||||||||||||||||
Number of vessels (at end of period) (2) | 37.0 | 43.0 | 46.0 | 47.0 | 48.0 | |||||||||||||||||||||||||||||||||||
Average age of fleet (in years) (3) | 5.9 | 5.6 | 6.1 | 6.8 | 6.8 | |||||||||||||||||||||||||||||||||||
Earnings capacity days (4) | 12,335 | 15,213 | 16,143 | 17,021 | 16,836 | |||||||||||||||||||||||||||||||||||
Off-hire days (5) | 322 | 523 | 431 | 390 | 400 | |||||||||||||||||||||||||||||||||||
Average number of vessels(2) | 41.7 | 44.1 | 46.6 | 46.1 | 47.8 | |||||||||||||||||||||||||||||||||||
Number of vessels (at end of period)(2) | 43.0 | 46.0 | 47.0 | 48.0 | 48.0 | |||||||||||||||||||||||||||||||||||
Average age of fleet (in years)(3) | 5.6 | 6.1 | 6.8 | 6.8 | 7.0 | |||||||||||||||||||||||||||||||||||
Earnings capacity days(4) | 15,213 | 16,143 | 17,021 | 16,836 | 17,431 | |||||||||||||||||||||||||||||||||||
Off-hire days(5) | 523 | 431 | 390 | 400 | 502 | |||||||||||||||||||||||||||||||||||
Net earnings days(6) | 14,690 | 15,712 | 16,631 | 16,436 | 16,929 | |||||||||||||||||||||||||||||||||||
Percentage utilization(7) | 96.6 | % | 97.3 | % | 97.7 | % | 97.6 | % | 97.1 | % | ||||||||||||||||||||||||||||||
Average TCE per vessel per day(8) | $ | 29,421 | $ | 34,600 | $ | 22,329 | $ | 19,825 | $ | 16,047 | ||||||||||||||||||||||||||||||
Vessel operating expenses per ship per day(9) | $ | 7,669 | $ | 9,450 | $ | 8,677 | $ | 7,647 | $ | 7,606 | ||||||||||||||||||||||||||||||
Vessel overhead burden per ship per day(10) | $ | 1,565 | $ | 1,514 | $ | 1,083 | $ | 1,144 | $ | 1,188 | ||||||||||||||||||||||||||||||
Net earnings days (6) Percentage utilization (7) Average TCE per vessel per day (8) Vessel operating expenses per ship per day (9) Vessel overhead burden per ship per day (10) 2006(11) 2007(11) 2008 2009 2010 12,013 14,690 15,712 16,631 16,436 97.4 % 96.6 % 97.3 % 97.7 % 97.6 % $ 30,154 $ 29,421 $ 34,600 $ 22,329 $ 19,825 $ 6,979 $ 7,669 $ 9,450 $ 8,677 $ 7,647 $ 1,162 $ 1,565 $ 1,514 $ 1,083 $ 1,144
| (1) | Vessel operating expenses are costs that vessel owners typically bear, including crew wages and expenses, vessel supplies and spares, insurance, tonnage tax, routine repairs and maintenance, quality and safety costs and other direct operating costs. |
| (2) | Includes chartered vessels. |
| (3) | The average age of our fleet is the age of each vessel in each year from its delivery from the builder, weighted by the vessel’s deadweight tonnage (“dwt”) in proportion to the total dwt of the fleet for each respective year. |
| (4) | Earnings capacity days are the total number of days in a given period that we own or control vessels. |
| (5) | Off-hire days are days related to repairs, dry-dockings and special surveys, vessel upgrades and initial positioning after delivery of new vessels. |
| (6) | Net earnings days are the total number of days in any given period that we own vessels less the total number of off-hire days for that period. |
| (7) | Percentage utilization represents the percentage of earnings capacity days that the vessels were actually employed, i.e., earnings capacity days less off-hire days. |
| (8) | The shipping industry uses time charter equivalent, or TCE, to calculate revenues per vessel in dollars per day for vessels on voyage charters. The industry does this because it does not commonly express charter rates for vessels on voyage charters in dollars per day. TCE allows vessel operators to compare the revenues of vessels that are on voyage charters with those on time charters. TCE is a non-GAAP measure. For vessels on voyage charters, we calculate TCE by taking revenues earned on the voyage and deducting the voyage costs and dividing by the actual number of voyage days. For vessels on bareboat charter, for which we do not incur either voyage or operation costs, we calculate TCE by taking revenues earned on the charter and adding a representative amount for vessel operating expenses. TCE differs from average daily revenue earned in that TCE is based on revenues before commissions and does not take into account off-hire days. |
Derivation of time charter equivalent per day (amounts in thousands except for days and per day amounts):
| 2006 | 2007 | 2008 | 2009 | 2010 | 2007 | 2008 | 2009 | 2010 | 2011 | |||||||||||||||||||||||||||||||
Voyage revenues | $ | 427,654 | $ | 500,617 | $ | 623,040 | $ | 444,926 | $ | 408,006 | $ | 500,617 | $ | 623,040 | $ | 444,926 | $ | 408,006 | $ | 395,162 | ||||||||||||||||||||
Less: Voyage expenses | (69,065 | ) | (72,075 | ) | (83,065 | ) | (77,224 | ) | (85,813 | ) | (72,075 | ) | (83,065 | ) | (77,224 | ) | (85,813 | ) | (127,156 | ) | ||||||||||||||||||||
Add: Representative operating expenses for bareboat charter ($10,000 daily) | 3,650 | 3,650 | 3,660 | 3,650 | 3,650 | 3,650 | 3,660 | 3,650 | 3,650 | 3,650 | ||||||||||||||||||||||||||||||
Time charter equivalent revenues | 362,239 | 432,192 | 543,635 | 371,352 | 325,843 | 432,192 | 543,635 | 371,352 | 325,843 | 271,656 | ||||||||||||||||||||||||||||||
Net earnings days | 12,013 | 14,690 | 15,712 | 16,631 | 16,436 | 14,690 | 15,712 | 16,631 | 16,436 | 16,929 | ||||||||||||||||||||||||||||||
Average TCE per vessel per day | $ | 30,154 | $ | 29,421 | $ | 34,600 | $ | 22,329 | $ | 19,825 | $ | 29,421 | $ | 34,600 | $ | 22,329 | $ | 19,82 5 | $ | 16,047 | ||||||||||||||||||||
| (9) | Vessel operating expenses per ship per day represents vessel operating expenses divided by the earnings capacity days of vessels incurring operating expenses. Earnings capacity days of vessels on bareboat or chartered-in have been excluded. |
| (10) | Vessel overhead burden per ship per day is the total of management fees, management incentive awards, stock compensation expense and general and administrative expenses divided by the total number of earnings capacity days. |
| (11) | The unaudited selected consolidated financial data for the year ended December 31, |
Capitalization
The following table sets forth as of December 31, 2010, our (i) cash and cash equivalents, (ii) restricted cash and (ii)(iii) consolidated capitalization as adjusted for the following events through Marchof December 31, 2011:2011 on:
|
|
our payment of vessel construction installments amounting to $21.6 million;an actual basis; and
as adjusted basis giving effect to (i) scheduled debt repayments of $43.1 million, (ii) the drawdown of $28.4 million, being the unused amount under an existing credit facility at December 31, 2011, and (iii) our payment of a $6.9 million dividend on February 1,14, 2012.
Other than these adjustments, there has been no material change in our capitalization from debt or equity issuances, re-capitalization or special dividends between December 31, 2011 and the declaration of a further $6.9 million dividend on March 14, 2011, payable on April 28, 2011.16, 2012.
This table should be read in conjunction with our consolidated financial statements and the notes thereto, and “Item 5. Operating and Financial Review and Prospects,” included elsewhere in this Annual Report.
| As of December 31, 2010 | ||||||||||||||||||||||||
| Actual | Adjustments | Adjusted | ||||||||||||||||||||||
| (Unaudited) | As of December 31, 2011 | |||||||||||||||||||||||
In thousands of U.S. Dollars | Actual | Adjustments | Adjusted | |||||||||||||||||||||
| (Unaudited) | (Unaudited) | |||||||||||||||||||||||
Cash | ||||||||||||||||||||||||
Cash and cash equivalents | $ | 276,637 | $ | (38,752 | ) | $ | 237,885 | $ | 175,708 | $ | (21,632 | ) | $ | 154,076 | ||||||||||
Restricted cash | 6,291 | — | 6,291 | 5,984 | — | 5,984 | ||||||||||||||||||
|
|
| ||||||||||||||||||||||
Total cash | $ | 282,928 | $ | (38,752 | ) | $ | 244,176 | $ | 181,692 | $ | (21,632 | ) | $ | 160,060 | ||||||||||
|
|
| ||||||||||||||||||||||
Capitalization | ||||||||||||||||||||||||
Debt: | ||||||||||||||||||||||||
Long-term secured debt obligations (including current portion) | $ | 1,562,467 | $ | (44,240 | ) | $ | 1,518,227 | $ | 1,515,663 | $ | (14,701 | ) | $ | 1,500,962 | ||||||||||
|
|
| ||||||||||||||||||||||
Stockholders equity: | ||||||||||||||||||||||||
Common shares, $1.00 par value; 100,000,000 shares authorized; 46,081,481 shares issued and outstanding on an actual and as adjusted basis | 46,081 | — | 46,081 | |||||||||||||||||||||
Common shares, $1.00 par value; 100,000,000 shares authorized; 46,208,738 shares issued and outstanding on an actual and as adjusted basis | 46,209 | — | 46,209 | |||||||||||||||||||||
Additional paid-in capital | 350,946 | — | 350,946 | 351,566 | — | 351,566 | ||||||||||||||||||
Accumulated other comprehensive loss | (52,329 | ) | — | (52,329 | ) | (35,030 | ) | — | (35,030 | ) | ||||||||||||||
Retained earnings | 671,480 | (8,490 | ) | 662,990 | 554,314 | (6,931 | ) | 547,383 | ||||||||||||||||
Non-controlling interest | 3,752 | — | 3,752 | 2,099 | — | 2,099 | ||||||||||||||||||
|
|
| ||||||||||||||||||||||
Total stockholders’ equity | 1,019,930 | (8,490 | ) | 1,011,440 | 919,158 | (6,931 | ) | 912,227 | ||||||||||||||||
|
|
| ||||||||||||||||||||||
Total capitalization | $ | 2,582,397 | $ | (52,730 | ) | $ | 2,529,667 | $ | 2,434,821 | $ | (21,632 | ) | $ | 2,413,189 | ||||||||||
|
|
| ||||||||||||||||||||||
Reasons For the Offer and Use of Proceeds
Not Applicable.
Risk Factors
Risks Related To Our Industry
The charter markets for crude oil carriers and product tankers have deteriorated significantly since the summer of 2008, which could affect our future revenues, earnings and profitability.
After reaching highs during the summer of 2008, charter rates for crude oil carriers and product tankers fell dramatically thereafter. While the rates occasionally improved during 2009 and 2010, generally they remained significantly below the levels that contributed to our increasing revenues and profitability through 2008. TheA further significant decline inoccurred during 2011 to low levels, and, apart from possible temporary seasonal or regional rate spikes, charter rates wasare likely to remain at historically low levels throughout much of 2012. This decline is primarily due to various factors, including the significantnet increase in the supply of vessels which is expected to peak in 2012. Other reasons for the decline from 2008 charter rates include the fall in demand for crude oil and petroleum products in the United States, although this has been offset to an extent by growing demand in the emerging economies, the consequent rising inventories of crude oil and petroleum products in the United States and in other industrialized nations and the corresponding reduction in oil refining, the net increase in supply of new vessels and the restrictions on crude oil production that the Organization of Petroleum Exporting Countries (OPEC) and other non-OPEC oil producing countries have imposed in an effort to stabilize the price of oil.refining.
As of March 31, 2011, twelve2012, thirteen of our vessels were employed under spot charters that are scheduled to expire by May 1, 2011,April 22, 2012, and 1413 of our vessels were employed on time charters, which, if not extended, are scheduled to expire during the period between MayJune 2012 and November of 2011.March 2016. In addition, 1916 of our vessels have profit sharing provisions in their time charters that are based upon prevailing market rates and two of our vessels are under contracts of affreightment which provide for periodic adjustments of their charter rates, also based upon prevailing market rates. In addition, six of our vessels
are employed in pool arrangements at variable rates. Moreover, there are two newbuildings which are scheduled to be delivered within the next six months, for which we do not have charters. If the current low rates in the charter market continue for any significant period in 20112012 it will affect the charter revenue we will receive from these vessels, which could have an adverse effect on our revenues, profitability and cash flows. The decline in charter rates also affects the value of our vessels, which follows the trends of charter rates and earnings on our charters.
Disruptions in world financial markets and the resulting governmental action in the United States and in other parts of the world and the sovereign debt crisis in Europe could have a further material adverse impact on our results of operations, financial condition and cash flows, and could cause the market price of our common stock to further decline.
The economic crisis that started in 2008 has affected the global economy and the shipping markets. Extraordinary steps that were taken by the governments of several leading economic countrieseconomies to combat the economicfinancial crisis appear to have restrained the downturn; however, the long-term impact of these measures is not yet known and cannot be predicted. While there are positive indications that the global economy is improving, wethe sovereign debt crisis in Europe and poor liquidity of European banks and attempts to find appropriate solutions will lead to slow growth and possible recession in most of Europe in 2012. We cannot provide any assurance that the global recession will not return and tight credit markets will not continue or become more severe.
We face risks attendant to changes in economic environments, changes in interest rates, and instability in the banking, commodities and securities markets around the world, among other geopolitical factors. Major market disruptions and the current adverse changes in market conditions and regulatory climate in the United States and worldwide may adversely affect our business or impair our ability to borrow amounts under our credit facilities or any future financial arrangements. We cannot predict how long the current market conditions will last. However, these recent and developing economic, geopolitical and governmental factors, together with the concurrent decline in charter rates and vessel values, could have a material adverse effect on our results of operations, financial condition or cash flows. This has caused the price of our common shares on the New York Stock Exchange to decline and could cause the price of our common shares to decline further.
The tanker industry is highly dependent upon the crude oil and petroleum products industries.
The employment of our vessels is driven by the availability of and demand for crude oil and petroleum products, the availability of modern tanker capacity and the scrapping, conversion or loss of older vessels. Historically, the world oil and petroleum markets have been volatile and cyclical as a result of the many conditions and events that affect the supply, price, production and transport of oil, including:
increases and decreases in the demand for crude oil and petroleum products;
availability of crude oil and petroleum products;
demand for crude oil and petroleum product substitutes, such as natural gas, coal, hydroelectric power and other alternate sources of energy that may, among other things, be affected by environmental regulation;
actions taken by OPEC and major oil producers and refiners;
political turmoil in or around oil producing nations;
global and regional political and economic conditions;
developments in international trade;
international trade sanctions;
environmental factors;
natural catastrophes;
terrorist acts;
weather; and
changes in seaborne and other transportation patterns.
The turbulence and uncertainty the world economies have encountered over the last three years has resulted in a fall innegatively affected the demand for crude oil and oil products which in turn has resulted in a decrease in freight rates and values. However, there has been some rebound in worldwide demand for oil and oil products, which industry observers forecast will continue. In the event that this rebound falters, the production of and demand for crude oil and petroleum products will again encounter pressure which could lead to a decrease in shipments of these products and consequently this would have an adverse impact on the employment of our vessels and the charter rates that they command. In particular, the charter rates that we earn from our vessels employed on spot charters, under pool arrangements and contracts of affreightment, and on time-charters with profit-share may remain at low levels for a prolonged period of time or further decline. In addition, overbuilding of tankers has, in the past, led to a decline in charter rates. If the supply of tanker capacity increasesremains high and the demand for tanker capacity does not increase proportionally, the charter rates paid for our vessels could materiallyalso remain low or further decline. The resulting decline in revenues could have a material adverse effect on our revenues and profitability.
Charter hire rates are cyclical and volatile.
The crude oil and petroleum products shipping industry is cyclical with attendant volatility in charter hire rates and profitability. After reaching highs in mid-2008, charter hire rates for oil product carriers have remained poor with some short periods of relative respite. In addition, hire and spot rates for large crude carriers remained low since the middle of 2010, often resulting in rates well below break-even. The charter rates for 3935 of our vessels are on variable basis or include a variable element and the time charters (whether fixed or partly variable) for 147 of our vessels may expire within eightsix months if not extended. As a result, we will be exposed to changes in the charter rates which could affect our earnings and the value of our vessels at any given time. Because the factors affecting the supply and demand for vessels are outside of our control and are unpredictable, the nature, timing, direction and degree of changes in industry conditions are also unpredictable.
Our operating results are subject to seasonal fluctuations.
Our tankers operate in markets that have historically exhibited seasonal variations in tanker demand, which may result in variability in our results of operations on a quarter-by-quarter basis. Tanker markets are typically stronger in the winter months as a result of increased oil consumption in the northern hemisphere, but weaker in the summer months as a result of lower oil consumption in the northern hemisphere and refinery maintenance. As a result, revenues generated by the tankers in our fleet have historically with the exception of 2008, been weaker during the fiscal quarters ended June 30 and September 30. However, the expected seasonal strength of the fourth quarter of 20102011 and first quarter of 20112012 did not materialize to the extent required to return to sustainable profitable rates due to tanker overcapacity, despite an unusually harsh winter in the Northern hemisphere.overcapacity.
An increase in the supply of vessels without an increase in demand for such vessels could cause charter rates to decline, which could have a material adverse effect on our revenues and profitability.
Historically, the marine transportation industry has been cyclical. The profitability and asset values of companies in the industry have fluctuated based on certain factors, including changes in the supply and demand of vessels. The supply of vessels generally increases with deliveries of new vessels and decreases with the scrapping of older vessels.vessels and/or the removal of vessels from the competitive fleet either for storage purposes or for utilization in offshore projects. The newbuilding order book equalled 26%equaled approximately 17% of the existing world tanker fleet as of mid-March 2011 (per Clarkson Research Services)2012 and no assurance can be given that the order book will not increase further in proportion to the existing fleet. If the number of new ships delivered exceeds the number of vessels being scrapped, capacity will increase. In addition, if dry-bulk vessels are converted to oil tankers, the supply of oil
tankers will increase. If supply increases and demand does not match that increase, the charter rates for our vessels could decline significantly, as we have witnessed in the past three quarters.eighteen months. In addition, any decline of trade on specific long-haul trade routes will effectively increase available capacity with a detrimental impact on rates. A decline in charter rates could have a material adverse effect on our revenues and profitability.
The global tanker industry is highly competitive.
We operate our fleet in a highly competitive market. Our competitors include owners of VLCCs, suezmax, aframax, panamax, handymax and handysize tankers. These competitors include other independent tanker companies, as well as national and independent oil companies, some of whom have greater financial strength and capital resources than we do. In addition, in the event of trade disruptions caused by hostilities in the Middle East, tanker companies that operate in Middle East trade routes may seek to employ their vessels in the trade routes that our vessels serve, which would further increase the level of competition that we face. Competition in the tanker industry is intense and depends on price, location, size, age, condition, and the acceptability of the available tankers and their operators to potential charterers.
Acts of piracy on ocean-going vessels have recently increased in frequency, which could adversely affect our business.
ThroughoutSince 2009, and 2010 into 2011, the frequency of pirate attacks on seagoing vessels has remained high, particularly in the Gulfwestern part of Adenthe Indian Ocean and off the west coast of Africa. If piracy attacks result in regions (inin which our vessels are deployed)deployed being characterized by insurers as “war risk” zones, as the Gulf of Aden has been, or Joint War Committee (JWC) “war and strikes” listed areas, premiums payable for such insurance coverage could increase significantly and such insurance coverage may be more difficult to obtain. Crew costs, including those due to employing onboard security guards, could increase in such circumstances. In addition, while we believe the charterer remains liable for charter payments when a vessel is seized by pirates, the charterer may dispute this and withhold charter hire until the vessel is released. A charterer may also claim that a vessel seized by pirates was not “on-hire” for a certain number of days and it is therefore entitled to cancel the charter party, a claim that we would dispute. We may not be adequately insured to cover losses from these incidents, which could have a material adverse effect on us. In addition, hijacking as a result of an act of piracy against our vessels, or an increase in cost, or unavailability of insurance for our vessels, could have a material adverse impact on our business, financial condition, results of operations and cash flows.
Terrorist attacks, and international hostilities and economic and trade sanctions can affect the tanker industry, which could adversely affect our business.
An attack like that of September 11, 2001, or longer-lasting wars or international hostilities, such as in Afghanistan, Iraq and currentlyLibya, or continued turmoil and hostilities in Libya,the Middle East or North Africa could damage the world economy and adversely affect the availability of and demand for crude oil and petroleum products and negatively affect our investment and our customers’ investment decisions over an extended period of time. If the current threat by Iran to close the Straits of Hormuz becomes an actuality, it could result in similar consequences. In addition, sanctions against oil exporting countries such as Iran, Sudan and Syria may also impact the availability of crude oil which would increase the availability of tankers thereby impacting negatively charter rates. We conduct our vessel operations internationally and despite undertaking various security measures, our vessels may become subject to terrorist acts and other acts of hostility like piracy, either at port or at sea. Such actions could adversely impact our overall business, financial condition and operations. In addition, our financial viability may also be negatively affected by changing economic, political and governmental conditions in the countries and regions where our vessels are employed. Moreover, we operate in a sector of the economy that is likely to be adversely impacted by the effects of local or international political instability, terrorist or other attacks, war or international hostilities.
The earthquake and resulting tsunami and nuclear power plant crisisOur vessels may call on ports located in countries that struck Japan in March 2011 could, in bothare subject to restrictions imposed by the short and intermediate terms, result in reduced trade and demand in Japan for crude oil and oil products,U.S. government, which could reducenegatively affect the numbertrading price of chartersour shares of common stock.
From time to time on charterers’ instructions, our vessels have called and from Japan and global charter rates and could have a material adverse effectmay again call on our business, financial condition and results of operations.
In March 2011, a severe earthquake struck the northeast portion of Japan. The earthquake created a severe tsunami, the effects of which were felt in Japan and other countries throughout the Pacific Ocean. In addition, the earthquake and resulting tsunami have caused several nuclear power plantsports located in Japancountries subject to fail, emit radiationsanctions and possibly resultembargoes imposed by the U.S. government, the UN or the EU and countries identified by the U.S. government, the UN or the EU as state sponsors of terrorism. The U.S., UN- and EU- sanctions and embargo laws and regulations vary in meltdowns that could have catastrophic effects. The full effecttheir application, as they do not all apply to the same covered persons or proscribe the same activities, and such sanctions and embargo laws and regulations may be amended or strengthened over time. In 2010, the United States enacted the Comprehensive Iran Sanctions Accountability and Divestment Act, or “CISADA,” which expanded the scope of these disasters, boththe Iran Sanctions Act (as amended, the “ISA”). Among other things, CISADA expands the application of the prohibitions to non-U.S. companies, such as our company, and introduces limits on the Japaneseability of companies and global economiespersons to do business or trade with Iran when such activities relate to the investment, supply or export of refined petroleum or petroleum products. On November 21, 2011, the President of the United States issued Executive Order 13590, which expands on the existing energy-related sanctions available under the ISA.
Although we believe that we are in compliance with all applicable sanctions and the environment, is not currently known,embargo laws and may not be known for a significant period of time. These disasters will likely result in reduced traderegulations, and demand in Japan for crude oil and oil products, in both the short and intermediate terms, which could reduce the number of charters for our vessels, and could reduce charter rates globally both in the short and longer terms. In addition,intend to maintain such compliance, there can be no assurancesassurance that we will be in compliance in the future, particularly as the scope of certain laws may be unclear and may be subject to changing interpretations. Any such violation could result in fines or other penalties and could result in some investors deciding, or being required, to divest their interest, or not to invest, in our company. Additionally, some investors may decide to divest their interest, or not to invest, in our company simply because we do business with companies that do business in sanctioned countries. Moreover, our charterers may violate applicable sanctions and embargo laws and regulations as a result of actions that do not involve us or our vessels, tradingand those violations could in turn negatively affect our reputation. Investor perception of the Pacificvalue of our common stock may notalso be impactedadversely affected by the possibleconsequences of war, the effects of spreading radiation. These disastersterrorism, civil unrest or governmental actions in these and the resulting economic instability, both in the region and globally, could have a material adverse effect on our financial condition and results of operations.surrounding countries.
Taking advantage of attractive opportunities in pursuit of our growth strategy may result in financial or commercial difficulties.
Despite the economic downturn in the past three years, a key strategy of management is to continue to further renew and grow ourthe fleet by pursuing the acquisition of additional vessels or fleets or tanker companies that are complementary to our existing operations, assuming we have the financial resources and debt capacity to do so.so remain available. The depressed charter market and credit crisis may present opportunities in the short to medium term to acquire new vessels or tanker companies or contracts to construct new vessels or even to undertake new construction contracts at prices more favorable than those seen in the recent past. If we seek to expand through such acquisitions, of other tanker or companies, we face numerous challenges, including:
difficulties in raising all the required capital;
depletion of existing cash resources greater than anticipated;
difficulties in the assimilation of acquired operations;
diversion of management’s attention from other business concerns;
assumption of potentially unknown material liabilities or contingent liabilities of acquired companies;
competition from other potential acquirers, some of which have greater financial resources; and
potential loss of clients or key employees of acquired companies.
We cannot assure you that we will be able to integrate successfully the operations, personnel, services or vessels that we might acquire in the future, and our failure to do so could adversely affect our profitability.
We are subject to regulation and liability under environmental, health and safety laws that could require significant expenditures and affect our cash flows and net income.
Our business and the operation of our vessels are subject to extensive international, national and local environmental and health and safety laws and regulations in the jurisdictions in which our vessels operate, as well as in the country or countries of their registration. In addition, major oil companies chartering our vessels impose, from time to time, their own environmental and health and safety requirements. We have incurred significant expenses in order to comply with these regulations and requirements, including the costs of ship modifications and changes in operating procedures, additional maintenance and inspection requirements, contingency arrangements for potential spills, insurance coverage and full implementation of the new security-on-vessels requirements which came into effect on July 1, 2004.
In particular, certain international, national and local laws and regulations require, among other things, double hull construction for new tankers, as well as the retrofitting or phasing-out of single hull tankers based on each vessel’s date of build, gross tonnage (a unit of measurement for the total enclosed spaces within a vessel) and/or hull configuration. We have sold all our vessels which were not double hull, except for theVergina II which has been converted to a double hull vessel.hull. All of the newbuildings we have contracted to purchase are double-hulled. However, because environmental regulations may become stricter, future regulations may limit our ability to do
business, increase our operating costs and/or force the early retirement of our vessels, all of which could have a material adverse effect on our financial condition and results of operations.
International, national and local laws imposing liability for oil spills are also becoming increasingly stringent. Some impose joint, several, and in some cases, unlimited liability on owners, operators and charterers regardless of fault. We could be held liable as an owner, operator or charterer under these laws. In addition, under certain circumstances, we could also be held accountable under these laws for the acts or omissions of Tsakos Shipping & Trading (“Tsakos Shipping”), Tsakos Columbia Shipmanagement (“TCM” or “Tsakos Columbia Shipmanagement”) or Tsakos Energy Management Limited (“Tsakos Energy Management”), companies that provide technical and commercial management services for our vessels and us, or others in the management or operation of our vessels. Although we currently maintain, and plan to continue to maintain, for each of our vessels pollution liability coverage in the amount of $1 billion per incident (the maximum amount available), liability for a catastrophic spill could exceed the insurance coverage we have available, and result in our having to liquidate assets to pay claims. In addition, we may be required to contribute to funds established by regulatory authorities for the compensation of oil pollution damage or provide financial assurances for oil spill liability to regulatory authorities.
Increased inspection procedures and tighter import and export controls could increase costs and disrupt our business.
International shipping is subject to various security and customs inspections and related procedures in countries of origin and destination. Inspection procedures can result in the seizure of contents of our vessels, delays in the loading, offloading or delivery and the levying of customs, duties, fines and other penalties against us.
It is possible that changes to inspection procedures could impose additional financial and legal obligations on us. Furthermore, changes to inspection procedures could also impose additional costs and obligations on our customers and may, in certain cases, render the shipment of certain types of cargo impractical. Any such changes or developments may have a material adverse effect on our business, financial condition, results of operations and our ability to pay dividends and/or principal, premium, if any, and interest on the notes.
Maritime disasters and other operational risks may adversely impact our reputation, financial condition and results of operations.
The operation of ocean-going vessels has an inherent risk of maritime disaster, environmental mishaps, cargo and property losses or damage and business interruptions caused by, among others:
mechanical failure;
human error;
labor strikes;
adverse weather conditions;
vessel off hire periods;
regulatory delays; and
political action, civil conflicts, terrorism and piracy in countries where vessel operations are conducted, vessels are registered or from which spare parts and provisions are sourced and purchased.
Any of these circumstances could adversely affect our operations, result in loss of revenues or increased costs and adversely affect our profitability and our ability to perform our charters. Terrorist acts and regional hostilities around the world in recent years have led to increases in our insurance premium rates and the implementation of special “war risk” premiums for certain trading routes. Natural disasters, such as the hurricanes striking the United States and earthquake in Chile, have led to yet further increases. Such increases in insurance rates adversely affect our profitability.
Our vessels could be arrested at the request of third parties.
Under general maritime law in many jurisdictions, crew members, tort claimants, vessel mortgagees, suppliers of goods and services and other claimants may lien a vessel for unsatisfied debts, claims or damages. In many jurisdictions a maritime lien holder may enforce its lien by arresting a vessel through court process. In some
jurisdictions, under the extended sister ship theory of liability, a claimant may arrest not only the vessel with respect to which the claimant’s maritime lien has arisen, but also any associated vessel under common ownership or control. While in some jurisdictions which have adopted this doctrine, liability for damages is limited in scope and would only extend to a company and its ship-owning subsidiaries, we cannot assure you that liability for damages caused by some other vessel determined to be under common ownership or control with our vessels would not be asserted against us.
Our vessels may be requisitioned by governments without adequate compensation.
A government could requisition or seize our vessels. Under requisition for title, a government takes control of a vessel and becomes its owner. Under requisition for hire, a government takes control of a vessel and effectively becomes its charterer at dictated charter rates. Generally, requisitions occur during periods of war or emergency. Although we would be entitled to compensation in the event of a requisition, the amount and timing of payment would be uncertain.
Risks Related To Our Business
We are not in compliance with certain financial covenants under our secured credit facilities.
The loan agreements we use to finance our ships require us not to exceed specified loan-to-asset value ratios. Our only significant assets are our ships, which are appraised each year. The appraised value of a ship fluctuates depending on a variety of factors including the age of the ship, its hull configuration, prevailing charter market conditions, supply and demand balance for ships and new and pending legislation.
Due to the decline in vessel values, we are not in compliance with certain financial covenants in our loans and credit facilities, mainly the loan-to-value ratios in certain of our loans and credit facilities and the leverage
ratio required by one of our loans. Even though none of our lenders has declared an event of default under the loan agreements, the non-compliance constitutes defaults and potential events of default and, together with the cross default provisions in the various loan and credit facility agreements, could result in the lenders requiring immediate repayment of all of the loans and credit facilities, if not waived or cured.
As of December 31, 2011, we were not in compliance with the leverage ratio required by one of our loans relating to a subsidiary in which we have a 51% interest, under which the amount of $48.1 million was outstanding as of that date. We have agreed upon the terms of a waiver of this covenant covering the period from December 31, 2011 through December 31, 2012. We have also agreed to make a prepayment of $8.1million on the loan against the balloon installment due in 2016 and to increases in the interest rate margin during the waiver period and the remaining term of the loan. As existing cash is deducted from both assets and liabilities to calculate this leverage ratio, apart from the generation of new cash from operations or equity input, only an increase of vessel value or alternative additional security (of up to $11.3 million, with no change in vessel value) would bring the leverage ratio down to 70% upon expiration of the waiver. There can be no assurance that we will regain compliance with the original covenant when the waiver expires or be able to obtain extension upon the expiration of such waiver.
As of December 31, 2011, we were not in compliance with the loan-to-value ratios contained in certain of our loan agreements and credit facilities under which a total of $621.0 million was outstanding, out of our total outstanding indebtedness of approximately $1.5 billion as of that date. No waiver of such non-compliance has been obtained. As a result of the aforementioned non-compliance, we may be required, upon request from our lenders, to prepay indebtedness or provide additional collateral to our lenders in the form of cash or other property in the total amount of $65.4 million in order to comply with these ratios. If we do not prepay indebtedness or provide additional collateral to our lenders within the period required by our respective loan agreements, we will be considered in default. There can be no assurance that we will obtain waivers for this non-compliance. Even though none of our lenders have requested prepayment or additional collateral, nor have any declared an event of default under the applicable loan agreements, if not remedied when requested, these non-compliances would constitute events of default and could result in the lenders requiring immediate repayment of the loans. We cannot guarantee that a further deterioration of our asset values will not result in defaults in the future, nor can we guarantee that we will be able to negotiate a waiver in the event of a default.
Furthermore, the majority of our loans contain a cross-default provision that may be triggered by a default under one of our other loans. A cross-default provision means that a default on one loan would result in a default on all of our other loans. Because of the presence of cross-default provisions in our credit facilities, the refusal of any one lender to grant or extend a waiver could result in most of our indebtedness being accelerated even if our other lenders have waived covenant defaults under the respective credit facilities. If our indebtedness is accelerated, it will be very difficult in the current financing environment for us to refinance our debt or obtain additional financing and we could lose our vessels if our lenders foreclose their liens. In addition, if the value of our vessels deteriorates significantly from their currently depressed levels, we may have to record an impairment adjustment to our financial statements, which would adversely affect our financial results and further hinder our ability to raise capital.
We expect that the lenders will not demand payment of the loans before their maturity, provided that we pay loan installments and accumulated or accrued interest as they fall due under the existing credit facilities. We do not expect that cash on hand and cash generated from operations will be sufficient to repay those loans with cross-default provisions which aggregated approximately $1,373 million as of December 31, 2011, if such debt is accelerated by the lenders. In such a scenario, we would have to seek to access the capital markets to fund the mandatory payments.
If we default under any of our loan agreements, we could forfeit our rights in our vessels and their charters.
All of our vessels and related collateral are individually pledged as security to the respective lenders under our loan agreements. Default under any of these loan agreements, if not waived or modified, would permit the lenders to foreclose on the mortgages over the vessels and the related collateral, and we could lose our rights in the vessels and their charters.
Charters at attractive rates may not be available when our current time charters expire or when we negotiate employment for our four newbuildings.expire.
In 2010,2011, we derived approximately 59%51% of our revenues from time charters, as compared to 65%59% in 2009.2010. As our current period charters on 14seven of our vessels expire in the remainder of 2012, it may not be possible to re-charter these vessels on a period basis at attractive rates given the currently depressed state of the charter market. In addition, there can be no assurance that we will be successful in entering into time charters at attractive rates for the two newbuildings that will be delivered to us in April and July of 2011. If attractive period charter opportunities are not available, we would seek to charter our vessels on the spot market. Charter rates in the spot market are currently low and are subject to significant fluctuations, and tankers traded in the spot market may experience substantial off-hire time. In the event a vessel may not find employment at economically viable rates, management may opt to lay up the vessel until such time that rates become attractive again. During the period of lay up, the vessel will continue to incur expenditure such as insurance, reduced crew wages and maintenance costs.
If our exposure to the spot market or contracts of affreightment increases, our revenues could suffer and our expenses could increase.
The spot market for crude oil and petroleum product tankers is highly competitive. As a result of any increased reliance onparticipation in the spot market, we may experience a lower overall utilization of our fleet through waiting time or ballast voyages, leading to a decline in operating revenue. Moreover, to the extent our vessels are employed in the spot market, both our revenue from vessels and our operating costs, specifically, our voyage expenses will be more significantly impacted by increases in the cost of bunkers (fuel). See “—Fuel prices may adversely affect our profits.” Unlike time charters in which the charterer bears all of the bunker costs, in spot market voyages we bear the bunker charges as part of our voyage costs. As a result, while historical increases in bunker charges are factored into the prospective freight rates for spot market voyages periodically announced by WorldScale Association (London) Limited and similar organizations, increases in bunker charges in any given period could have a material adverse effect on our cash flow and results of operations for the period in which the increase occurs. In addition, to the extent we employ our vessels pursuant to contracts of affreightment or under pooling arrangements, the rates that we earn from the charterers under those contracts may be subject to reduction based on market conditions, which could lead to a decline in our operating revenue.
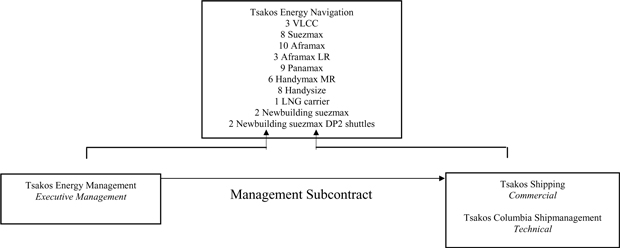
We depend on Tsakos Energy Management, Tsakos Shipping and TCM to manage our business.
We do not have the employee infrastructure to manage our operations and have no physical assets except our vessels and the newbuildings that we have under contract. We have engaged Tsakos Energy Management to perform all of our executive functions. Tsakos Energy Management directly provides us with financial, accounting and other back-office services, including acting as our liaison with the New York Stock Exchange and the Bermuda Stock Exchange. Tsakos Energy Management, in turn, oversees and subcontracts part of commercial management (including, treasury, chartering and vessel purchase and sale functions) to Tsakos Shipping, and day-to-day fleet technical management, such as crewing, charteringvessel operations, repairs, supplies and vessel purchase and
sale functions,crewing, to TCM, one of the world’s largest independent tanker managers. As a result, we depend upon the continued services of Tsakos Energy Management and Tsakos Energy Management depends on the continued services of Tsakos Shipping and TCM.
We derive significant benefits from our relationship with the Tsakos Group, including purchasing discounts to which we otherwise would not have access. We would be materially adversely affected if either Tsakos Energy Management or Tsakos Shipping becomes unable or unwilling to continue providing services for our benefit at the level of quality they have provided such services in the past and at comparable costs as they have charged in the past. If we were required to employ a ship management company other than Tsakos Energy Management, we cannot offer any assurances that the terms of such management agreements and results of operations would be more beneficial to the Company in the long term.
If the TCM joint venture between Tsakos interests and Schoeller Holdings is unsuccessful, our business may be adversely affected.
In February 2010, Tsakos Shippingfamily interests and thea private German company, Schoeller Holdings Ltd., the owner of Columbia Shipmanagement Ltd., formed a joint-venture ship management company. The entity, TCM, assumed onOn July 1, 2010, the new entity, TCM,
assumed the technical management for most of the vessels previously managed by Tsakos Shipping, including mostShipping. All of our fleet.vessels, apart from the LNG carrier and the VLCC Millenium, are under the technical management of TCM. TCM has so far achieved significant savings in the purchase of supplies for our fleet, but there is no guarantee that it will continue to succeeddo so in the future.
Although the TCM staff is primarily comprised of former Tsakos Shipping employees, there is no guarantee that the quality of technical management services that it providesis currently provided by TCM will be equal in future to thator better than what we received from Tsakos Shipping. TCM will seek to provide technical management services to other owners of vessels, who may be competitors of ours. Such efforts to grow its customer base may be unsuccessful and inhibit TCM’s ability to provide technical management services to its existing customers, including us.Shipping in the past.
Tsakos Energy Management, Tsakos Shipping and TCM are privately held companies and there is little or no publicly available information about them.
The ability of Tsakos Energy Management, Tsakos Shipping and TCM to continue providing services for our benefit will depend in part on their own financial strength. Circumstances beyond our control could impair their financial strength and, because each of these companies is privately held, it is unlikely that information about their financial strength would become public unless these companies began to default on their obligations.public. As a result, an investor in our common shares might have little or no advance warning of problems affecting Tsakos Energy Management, Tsakos Shipping or TCM, even though these problems could have a material adverse effect on us.
Tsakos Energy Management has the right to terminate its management agreement with us and Tsakos Shipping and TCM have the right to terminate their respective contracts with Tsakos Energy Management.
Tsakos Energy Management may terminate its management agreement with us at any time upon one year’s notice. In addition, if even one director were to be elected to our board without having been recommended by our existing board, Tsakos Energy Management would have the right to terminate the management agreement on 10 days’ notice. If Tsakos Energy Management terminates the agreement for this reason, we would be obligated to pay Tsakos Energy Management the present discounted value of all payments that would have otherwise become due under the management agreement until June 30 in the tenth year following the date of the termination plus the average of the incentive awards previously paid to Tsakos Energy Management multiplied by 10. A termination as of December 31, 20102011 would have resulted in a payment of approximately $134$135 million.
Tsakos Energy Management’s contracts with Tsakos Shipping and with TCM may be terminated by either party upon six months’ notice and would terminate automatically upon termination of our management agreement with Tsakos Energy Management.
Our ability to pursue legal remedies against Tsakos Energy Management, and Tsakos Shipping and TCM is very limited.
In the event Tsakos Energy Management breached its management agreement with us, we could bring a lawsuit against Tsakos Energy Management.it. However, because we are not ourselves party to a contract with Tsakos
Shipping or TCM, it may be impossibledifficult for us to sue Tsakos Shipping and TCM for breach of itstheir obligations under its contracttheir contracts with Tsakos Energy Management, and Tsakos Energy Management may have no incentive to sue Tsakos Shipping and TCM. Tsakos Energy Management is a company with no substantial assets and no income other than the income it derives under our management agreement. Therefore, it is unlikely that we would be able to obtain any meaningful recovery if we were to sue Tsakos Energy Management, Tsakos Shipping or TCM on contractual grounds.
Tsakos Shipping provides chartering services to other tankers and TCM manages other tankers and could experience conflicts of interests in performing obligations owed to us and the operators of the other tankers.
In addition to the vessels that it manages for us, TCM technically manages two other double-hull VLCC tankers, that operate under long term charters which will expire in April, 2011.a fleet of privately owned vessels and seeks to acquire new third-party clients. These vessels are operated by the same group of TCM employees
that manage our vessels, and we are advised that its employees manage these vessels on an “ownership neutral” basis; that is, without regard to who owns them. It is possible that Tsakos Shipping, which provides chartering service for nearly all vessels technically managed by TCM, might allocate charter or spot opportunities to other TCM managed vessels when our vessels are unemployed, or could allocate more lucrative opportunities to its other vessels. It is also possible that TCM could in the future agree to manage more tankers that directly compete with us.
Clients of Tsakos Shipping have acquired and may acquire further vessels that may compete with our fleet.
Tsakos Shipping has givenand we have an arrangement whereby it affords us a right of first refusal on any opportunity to purchase a tanker which is 10 years of age or younger or contract to construct a tanker that is referred to or developed by Tsakos Shipping. Were we to decline any opportunity offered to us, or if we do not have the resources or desire to accept it, other clients of Tsakos Shipping might decide to accept the opportunity. In this context, Tsakos Shipping clients have in the past acquired modern tankers and have ordered the construction of vessels. They may acquire or order tankers in the future, which, if we decline to buy from them, could be entered into charters in competition with our vessels. These charters and future charters of tankers by Tsakos Shipping could result in conflicts of interest between their own interests and their obligations to us.
Our chief executive officer has affiliations with Tsakos Energy Management, Tsakos Shipping and TCM which could create conflicts of interest.
Nikolas Tsakos is the president, chief executive officer and a director of our company and the director and sole shareholder of Tsakos Energy Management. Nikolas Tsakos is also the son of the founder of Tsakos Shipping. These responsibilities and relationships could create conflicts of interest that could result in our losing revenue or business opportunities or increase our expenses.
Our commercial arrangements with Tsakos Energy Management and Argosy may not always remain on a competitive basis.
We pay Tsakos Energy Management a management fee for its services pursuant to our management agreement. We also place our hull and machinery insurance, increased value insurance and loss of hire insurance through Argosy Insurance Company, Bermuda, a captive insurance company affiliated with Tsakos Shipping.interests. We believe that the management fees that we pay Tsakos Energy Management compare favorably with management compensation and related costs reported by other publicly traded shipping companies and that our arrangements with Argosy are structured at arms-length market rates. Our board reviews publicly available data periodically in order to confirm this. However, we cannot assure you that the fees charged to us are or will continue to be as favorable to us as those we could negotiate with third parties and our board could determine to continue transacting business with Tsakos Energy Management and Argosy even if less expensive alternatives were available from third parties.
We depend on our key personnel.
Our future success depends particularly on the continued service of Nikolas Tsakos, our president and chief executive officer and the sole shareholder of Tsakos Energy Management. The loss of Mr. Tsakos’s services or the services of any of our key personnel could have a material adverse effect on our business. We do not maintain key man life insurance on any of our executive officers.
Because the market value of our vessels may fluctuate significantly, we may incur impairment changes or losses when we sell vessels which may adversely affect our earnings.
The fair market value of tankers may increase or decrease depending on any of the following:
general economic and market conditions affecting the tanker industry;
supply and demand balance for ships within the tanker industry;
competition from other shipping companies;
types and sizes of vessels;
other modes of transportation;
cost of newbuildings;
governmental or other regulations;
prevailing level of charter rates; and
technological advances.
The global economic downturn that commenced in 2008 has resulted in a decrease in vessel values. The decrease in value accelerated during 2011 as a result of excess fleet capacity and falling freight rates. In addition, although we currently own a modern fleet, with an average age of 6.97.2 years as of March 31, 2011,2012, as vessels grow older, they generally decline in value.
We have a policy of considering the disposal of tankers periodically and in particular after they reach 20 years of age. If we sell tankers at a time when tanker prices have fallen, the sale may be at less than the vessel’s carrying value on our financial statements, with the result that we will incur a loss.
In addition, accounting pronouncements require that we periodically review long-lived assets and certain identifiable intangibles for impairment whenever events or changes in circumstances indicate that the carrying amount of the assets may not be recoverable. An impairment charge for an asset held for use should be recognized when the estimate of undiscounted cash flows, excluding interest charges, expected to be generated by the use of the asset is less than its carrying amount. Measurement of the impairment charge is based on the fair value of the asset as provided by third parties. In this respect, management regularly reviews the carrying amount of our vessels in connection with the estimated recoverable amount for each vessel. Such reviews may from time to time result in asset write-downs that could adversely affect our financial condition and results of operations. Such impairment charge was incurred in 2009 amounting to $19.1 million relating to the three oldest vessels of the fleet,Hesnes,Victory III andVergina II and again in 2010, with a further impairment charge of $3.1 million on the value of theVergina II. An impairment charge of $39.4 million was incurred in 2011 in relation to the VLCCsLa Prudencia andLa Madrina both approximately 20 years old following their classification as held for sale.
If either Tsakos Shipping or TCM is unable to attract and retain skilled crew members, our reputation and ability to operate safely and efficiently may be harmed.
Our continued success depends in significant part on the continued services of the officers and seamen whom TCM provide to crew our vessels. The market for qualified, experienced officers and seamen is extremely competitive and has grown more so in recent periods as a result of the growth in world economies and other employment opportunities. Although TCM has a contract with a number of manning agencyagencies and sponsors various marine academies in the Philippines, Greece and Russia, we cannot assure you that TCM will be successful in its efforts to recruit and retain properly skilled personnel at commercially reasonable salaries. Any failure to do so could adversely affect our ability to operate cost-effectively and our ability to increase the size of our fleet.
Labor interruptions could disrupt our operations.
Substantially all of the seafarers and land based employees of TCM are covered by industry-wide collective bargaining agreements that set basic standards. We cannot assure you that these agreements will prevent labor interruptions. In addition, some of our vessels operate under flags of convenience and may be vulnerable to unionization efforts by the International Transport Federation and other similar seafarer organizations which could be disruptive to our operations. Any labor interruption or unionization effort which is disruptive to our operations could harm our financial performance.
The contracts to purchase our newbuildings present certain economic and other risks.
As of March 31, 2011,2012, we have contracts to construct fourtwo newbuildings that are scheduled for delivery during 2011,the first half of 2013 and are entering into a contract for the construction of an LNG carrier, with delivery in the first quarter of 2015, together with an option to construct one additional LNG carrier. We also have obtained options to acquire two suezmax tanker newbuildings, one with delivery in the second quarter of 2012 and one with delivery in the first quarter of 2013. If available, we may also order additional newbuildings. During the course of construction of a vessel, we are typically required to make progress payments. While we have refund guarantees from banks to cover defaults by the shipyards and our construction contracts would be saleable in the event of our payment default, we can still incur economic losses in the event that we or the shipyards are unable to perform our respective obligations. Shipyards periodically experience financial difficulties.
Credit conditions internationally might impact our ability to raise debt financing.
We have traditionally financed our vessel acquisitions with cash (equity) and bank debt from various reputable national and international commercial banks. In relation to newbuilding contracts, the equity portion covers all or part of the pre-delivery obligations while the debt portion covers the outstanding amount due to the shipyard on delivery. To date,Although we have not secured bank financing for our remaining obligations to the shipyardsshipyard with respect to one of our two newbuilding shuttle tankers, with respect to our four newbuildings, although negotiationsother newbuilding shuttle tanker, the LNG carrier for which we are entering into a construction contract or in progress. Termsthe event of any further acquisitions, including pursuant to the options we have for three additional newbuilding vessels, terms and conditions however, could be different from terms obtained in the past and could result in higher cost of capital.capital, if available at all. In addition revised covenants might be imposed that might limit our flexibility in terms of dividend payments and other operational matters and materially affect our ability to raise additional debt from the market. In addition, we cannot guarantee the financial state of the banks we deal with nor their short or long term viability as going-concerns. Any adverse development in that respect could materially alter our current and future financial planning and growth and have a potentially negative impact on our balance sheet.
We may not be able to finance all of the vessels we have on order as of March 31, 2011.order.
We have not finalized financing arrangements to satisfyfund the balance of the purchase price due approximately $40 million, for financing one of the two suezmax vessels on order (for delivery in the second and third quarters of 2011), and for financing of the newly ordered twonewbuild DP2 suezmax shuttle tankers scheduled for delivery atin the end of 2012 and first quarter 2013.2013 or for the LNG carrier (and the options to construct one additional LNG carrier and acquire two suezmax tanker newbuildings) that we recently ordered with scheduled delivery in the first quarter of 2015. We cannot assure you that we will be able to obtain additional financing for these newbuildings on terms that are favorable to us or at all.
If we were unable to finance further installments for the newbuildings we have on order, an alternative would be to use the available cash holdings of the Company or, if we should lack adequate cash, to attempt to sell the uncompleted vessels to a buyer who would assume the remainder of the contractual obligations. The amount we would receive from the buyer would depend on market circumstances and could result in a deficit over the advances we had paid to the date of sale plus capitalized costs. Alternatively, we may default on the contract, in which case the builder would sell the vessel and refund our advances less any amounts the builder would deduct to cover all of its own costs. We would be obliged to cover any deficiency arising in such circumstances.
Apart from the delay in receiving the refund of advances and the possible payment of any deficiencies, the direct effect on our operations of not acquiring the vessel would be to forego any revenues and related vessel operating cash flows.
We may sell one or more of our newbuildings.
While we intend to take delivery of and operate all four newbuildings we have on order as of March 31, 2011, attractive opportunities may arise to sell one or more of these vessels while they are under construction or after they are delivered. Our board of directors will review any such opportunity and may conclude that the sale of one or more vessels would be in our best interests. If we sell a vessel, we would receive the proceeds from the sale, repay any indebtedness we had incurred relating to such newbuilding and we would no longer be responsible for further installments under the relevant newbuilding contract. We would, however, forego any revenues and operating cash flows associated with such newbuilding.
The profitability of our LNG vesselinvestment in the Liquefied Natural Gas (“LNG”) sector is subject to market volatility.
The Liquefied Natural Gas (“LNG”)LNG transportation market could failhas recently entered a highly lucrative phase which is forecast by certain market experts to develop into a mature statelast for profitableanother three years. Prior to this the LNG carrier market generated relatively poor
returns since 2007. Levels of LNG production and demand for LNG and LNG shipping investments. are significantly affected by the overall demand for and price of natural gas, which can be volatile. Growth in LNG production and demand for LNG and LNG shipping could also be negatively impacted by material delays in the construction of new liquefaction facilities, increases in the production levels of low-cost natural gas in domestic natural gas consuming markets or in areas linked by pipelines to consuming markets, new taxes or regulations affecting LNG production or liquefaction, or any significant explosion, spill or other incident involving an LNG facility or carrier.
If we decide to exit this sector during a future down cycle for the sector, for whatever reason, we might have to sell the vesselour LNG carriers at a price below itstheir cost and subsequently suffer an economic loss or might be forced to operate the vessel at unprofitable or
breakeven levels. TheOur existing LNG vessel is on charter until August 2011, with optionsMarch 2016 and we have not arranged a charter for a further six months.our recently ordered LNG carrier newbuilding. If the charter market is weak on the expiration of the charter for our LNG carrier or when we are attempting to secure a charter for our new LNG carrier, we might not be able to secure new employment or be obliged to accept charters for rates materially below those originally factored into our investment evaluation.
The future performance of our LNG carriers depends on continued growth in LNG production and demand for LNG and LNG shipping.
The future performance of our LNG carriers will depend on continued growth in LNG production and the demand for LNG and LNG shipping. A complete LNG project includes production, liquefaction, storage, regasification and distribution facilities, in addition to the marine transportation of LNG. Increased infrastructure investment has led to an expansion of LNG production capacity in recent years, but material delays in the construction of new liquefaction facilities could constrain the amount of LNG available for shipping, reducing ship utilization. While global LNG demand has continued to rise, it has risen at a slower pace than previously predicted and the rate of its growth has fluctuated due to several factors, including the global economic crisis and continued economic uncertainty, fluctuations in the price of natural gas and other sources of energy, the continued acceleration in natural gas production from unconventional sources in regions such as North America and the highly complex and capital intensive nature of new or expanded LNG projects, including liquefaction projects. Continued growth in LNG production and demand for LNG and LNG shipping could be negatively affected by a number of factors, including:
increases in interest rates or other events that may affect the availability of sufficient financing for LNG projects on commercially reasonable terms;
increases in the cost of natural gas derived from LNG relative to the cost of natural gas generally;
increases in the production levels of low-cost natural gas in domestic natural gas consuming markets, which could further depress prices for natural gas in those markets and make LNG uneconomical;
increases in the production of natural gas in areas linked by pipelines to consuming areas, the extension of existing, or the development of new pipeline systems in markets we may serve, or the conversion of existing non-natural gas pipelines to natural gas pipelines in those markets;
decreases in the consumption of natural gas due to increases in its price, decreases in the price of alternative energy sources or other factors making consumption of natural gas less attractive;
any significant explosion, spill or other incident involving an LNG facility or carrier;
infrastructure constraints such as delays in the construction of liquefaction facilities, the inability of project owners or operators to obtain governmental approvals to construct or operate LNG facilities, as well as community or political action group resistance to new LNG infrastructure due to concerns about the environment, safety and terrorism;
labor or political unrest or military conflicts affecting existing or proposed areas of LNG production or regasification;
decreases in the price of LNG, which might decrease the expected returns relating to investments in LNG projects;
new taxes or regulations affecting LNG production or liquefaction that make LNG production less attractive; or
negative global or regional economic or political conditions, particularly in LNG consuming regions, which could reduce energy consumption or its growth.
Reduced demand for LNG or LNG shipping, or any reduction or limitation in LNG production capacity, could have a material adverse effect on our ability to secure future multi-year time charters for our LNG carriers, or for any new LNG carriers we acquire, which could harm our business, financial condition, results of operations and cash flows, including cash available for dividends to our shareholders.
Demand for LNG shipping could be significantly affected by volatile natural gas prices and the overall demand for natural gas.
Gas prices are volatile and are affected by numerous factors beyond our control, including but not limited to the following:
worldwide demand for natural gas;
the cost of exploration, development, production, transportation and distribution of natural gas;
expectations regarding future energy prices for both natural gas and other sources of energy;
the level of worldwide LNG production and exports;
government laws and regulations, including but not limited to environmental protection laws and regulations;
local and international political, economic and weather conditions;
political and military conflicts; and
the availability and cost of alternative energy sources, including alternate sources of natural gas in gas importing and consuming countries.
An oversupply of LNG carriers may lead to a reduction in the charter hire rates we are able to obtain when seeking charters in the future.
Driven in part by an increase in LNG production capacity, the market supply of LNG carriers has been increasing as a result of the construction of new ships. During the period from 2005 to 2010, the global fleet of LNG carriers grew by an average of 15% per year due to the construction and delivery of new LNG carriers. Although the global newbuilding order book dropped steeply in 2009 and 2010, orders for over 50 newbuilding LNG carriers were placed during 2011. The newbuilding order book of almost 60 ships as of December 31, 2011 amounts to 17% of global LNG carrier fleet capacity, with the majority of the newbuildings scheduled for delivery in 2013 and 2014. This and any future expansion of the global LNG carrier fleet may have a negative impact on charter hire rates, ship utilization and ship values, which impact could be amplified if the expansion of LNG production capacity does not keep pace with fleet growth.
In addition, if an active short-term or spot LNG carrier charter market continues to develop, our revenues and cash flows from our LNG carriers may become more volatile and may decline following expiration or early termination of our charters. An active short-term or spot charter market may require us to enter into charters based on changing market prices, as opposed to contracts based on fixed rates, which could affect our revenues and cash flows, including cash available for dividends to our shareholders, if we enter into charters during periods when the market price for shipping LNG is depressed. Most shipping requirements for new LNG projects continue to be provided on a multi-year basis, though the level of spot voyages and short-term time charters of less than 12 months in duration has grown in the past few years.
Our effectiveness ofin attaining accretive charters for theour existing LNG carrier wouldat the end of its existing charter or for newbuilding LNG carriers will be determined by the reliability and experience of third-party technical managers.
We have subcontracted all technical management aspects of our LNG operation to Hyundai Merchant Marine (“HMM”) for a fee. Neither Tsakos Energy Management nor Tsakos ShippingTCM has the dedicated personnel for running LNG operations nor can we guarantee that they will employ an adequate number of employees in the future. As such, we are totally dependent on the reliability and effectiveness of third-party managers for whom we can notcannot guarantee that their employees, both onshore and at-sea are adequate in their assigned role. We can notcannot guarantee the quality of their services or the longevity of the management contract.
Our earnings may be adversely affected if we do not successfully employ our tankers.
We seek to employ our tankers on time charters, contracts of affreightment, tanker pools and in the spot market in a manner that will optimize our earnings. As of March 31, 2011, 342012, 36 of our tankers were contractually committed to period employment (including contract of affreightment) with remaining terms ranging from one month to fiveeleven years. Although these period charters provide steady streams of revenue, our tankers committed to period charters may not be available for spot voyages during an upswing in the tanker industry cycle, when spot voyages may be more profitable. If we cannot re-charter these vessels on long-term period charters or trade them in the spot market profitably, our results of operations and operating cash flow may suffer.
Fuel prices may adversely affect our profits.
While we do not bear the cost of fuel or bunkers, under time and bareboat charters, fuel is a significant, if not the largest, expense in our shipping operations when vessels are under spot charter. Changes in the price of fuel may adversely affect our profitability. The price and supply of fuel is unpredictable and fluctuates based on events outside our control, including geopolitical developments, supply and demand for oil and gas, actions by the OPEC and other oil and gas producers, war and unrest in oil producing countries and regions, regional production patterns and environmental concerns. Further, fuel may become much more expensive in the future, which may reduce the profitability of our business.
Our significant investment in ice-class vessels might not prove successful.
We have made significant investments in building a solid presence in the ice-class tanker market through both building and acquiring ice strengthened vessels. This type of vessel commonly commands a premium to build and/or acquire to compensate for the ice-class features of the hull and engine. The versatility of these vessels allows them to operate not only in ice-bound routes, but also in conventional tanker routes. Usually rates for ice bound trades are at a premium to conventional tanker trades for the period the vessel operates in such demanding conditions. Ice-class vessels do not commonly operate throughout the year in such harsh environments. We can notcannot guarantee that our vessels will operate in ice-class trades for meaningful periods and/or earn rates with premiums sufficient to compensate for the investment made. If our vessels fail to earn any material and sustained ice-class premium, their revenues would derive from conventional routes which we can notcannot guarantee will be adequate to financially support our ice-class investment.
If our counterparties were to fail to meet their obligations under a charter agreements we could suffer losses or our business could be otherwise adversely affected.
As of March 31, 2011, twenty-six2012, twenty-eight of our vessels were employed under time charters and twoone of our vessels werewas employed on contracts of affreightment.under a bareboat charter. The ability and willingness of each of our counterparties to perform its obligations under their charters with us will depend on a number of factors that are beyond our control and may include, among other things, general economic conditions, the condition of the oil and energy industries and of the oil and oil products shipping industry as well as the overall financial condition of the counterparties. With the steep declines in the prices of crude oilcounterparties and oil products, thereprevailing charter rates. There can be no assurance that some of our customers would not fail to pay charter hire or attempt to renegotiate charter rates. Should a counterparty fail to honor its obligations under agreements with us, it may be difficult for us to secure substitute employment for the affected vessels, and any
new charter arrangements we secure in the spot market or on time charters could be at lower rates given the depressed charter rate levels as of March 31, 2011.2012. If our charterers fail to meet their obligations to us or attempt to renegotiate our charter agreements, we could sustain significant losses which could have a material adverse effect on our business, financial condition, results of operations and cash flows, as well as our ability to pay dividends in the future.
If the charterer under our bareboat charter is unable to perform under the charter, we may lose revenues.
As of March 31 2011,2012, we had a bareboat charter contract for theMillennium and time charters with profit share for one other vessel with HMM,Hyundai Merchant Marine, a member of the Hyundai group of companies. The financial difficulties that the Hyundai group has faced in the past may still affect HMM’s ability to perform under these charters, which areis scheduled to expire between April, 2011 andin September 2013. This could result in the loss of significant revenue. In addition, we may expand this chartering relationship with HMM to other vessels in our fleet which would ultimately increase our exposure to that particular charterer.
We will face challenges as we diversify and position our fleet to meet the needs of our customers.
We may need to diversify our fleet to accommodate the transportation of forms of energy other than crude oil and petroleum products in response to industry developments and our customers’ needs. Accordingly, the Company is continually exploring opportunities in other areas such as the Liquefied Petroleum Gas (LPG) market and the greater oil onshore / offshore sector.sector, as well as expanding our presence in the LNG market. For example, on March 21, 2011, we ordered two new suezmax DP2 shuttle tankers that are expected to be delivered in the fourthfirst and second quarter of 20122013, respectively, and we are entering into a contract for the construction of an LNG carrier, with delivery in the first quarter of 2013, respectively.2015, together with an option to construct one additional LNG carrier. A shuttle tanker is a specialized vessel designed to transport crude oil and condensates from offshore oil fields to onshore terminal and refineries. As the composition of our fleet continues to change, we may not have adequate experience in transporting these other forms of energy. In addition, if the cost structure of a diversified fleet that is able to transport other forms of energy differs significantly from the cost structure of our current fleet, our profitability could be adversely affected.
We may not have adequate insurance.
In the event of a casualty to a vessel or other catastrophic event, we will rely on our insurance to pay the insured value of the vessel or the damages incurred. We believe that we maintain as much insurance on our vessels, through insurance companies, including Argosy, a related party company and P&I clubs as is appropriate and consistent with industry practice. However, particularly in view of the conflicts in Afghanistan, Iraq and elsewhere, and pirate activity off the coast of Africa, we cannot assure you that this insurance will remain available at reasonable rates, and we cannot assure you that the insurance we are able to obtain will cover all foreseen liabilities that we may incur, particularly those involving oil spills and catastrophic environmental damage. In addition, we may not be able to insure certain types of losses, including loss of hire, for which insurance coverage may become unavailable.
We are subject to funding calls by our protection and indemnity clubs, and our clubs may not have enough resources to cover claims made against them.
Our subsidiaries are indemnified for legal liabilities incurred while operating our vessels through membership in P&I clubs. P&I clubs are mutual insurance clubs whose members must contribute to cover losses sustained by other club members. The objective of a P&I club is to provide mutual insurance based on the aggregate tonnage of a member’s vessels entered into the club. Claims are paid through the aggregate premiums of all members of the club, although members remain subject to calls for additional funds if the aggregate premiums are insufficient to cover claims submitted to the club. Claims submitted to the club may include those incurred by members of the club, as well as claims submitted to the club from other P&I clubs with which our P&I club has entered into interclub agreements. We cannot assure you that the P&I clubs to which we belong will remain viable or that we will not become subject to additional funding calls which could adversely affect our profitability.
The insolvency or financial deterioration of any of our insurers or reinsurers would negatively affect our ability to recover claims for covered losses on our vessels.
We have placed our hull and machinery, increased value and loss of hire insurance with Argosy, a captive insurance company affiliated with Tsakos Shipping.family interests. Argosy reinsures the insurance it underwrites for us with
various reinsurers, however, the coverage deductibles of the reinsurance policies periodically exceed the coverage deductibles of the insurance policies Argosy underwrites for us. Argosy, therefore, would be liable with respect to the difference between those deductibles in the event of a claim by us to which the deductibles apply. Although these reinsurers have a minimum credit ratings ranging from BBB to AA,rating of A, we do not have the ability to independently determine our insurers’ and reinsurers’ creditworthiness or their ability to pay on any claims that we may have as a result of a loss. In the event of insolvency or other financial deterioration of our insurer or its reinsurers, we cannot assure you that we would be able to recover on any claims we suffer.
Our degree of leverage and certain restrictions in our financing agreements impose constraints on us.
We incur substantial debt to finance the acquisition of our tankers.vessels. At December 31, 2010,2011, our debt to capital ratio was 60.562.2 % (debt / debt plus equity), with $1.56$1.52 billion in long-term debt outstanding. We are required to apply a substantial portion of our cash flow from operations, before interest payments, to the payment of principal and interest on this debt. In 2010, approximately2011, all of our cash flow derived from operations plus an amount from existing cash resources was dedicated to debt service, excluding any debt prepayment upon the sale of vessels. This limits the funds available for working capital, capital expenditures, dividends and other purposes. Our degree of leverage could have important consequences for us, including the following:
a substantial decrease in our net operating cash flows or an increase in our expenses could make it difficult for us to meet our debt service requirements and force us to modify our operations;
we may be more highly leveraged than our competitors, which may make it more difficult for us to expand our fleet; and
any significant amount of leverage exposes us to increased interest rate risk and makes us vulnerable to a downturn in our business or the economy generally.
In addition, our financing arrangements, which we secured by mortgages on our ships, impose operating and financial restrictions on us that restrict our ability to:
incur additional indebtedness;
create liens;
sell the capital of our subsidiaries or other assets;
make investments;
engage in mergers and acquisitions;
make capital expenditures;
repurchase common shares; and
pay cash dividends.
We have a holding company structure which depends on dividends from our subsidiaries and interest income to pay our overhead expenses and otherwise fund expenditures consisting primarily of advances on newbuilding contracts and the payment of dividends to our shareholders. As a result, restrictions contained in our financing arrangements and those of our subsidiaries on the payment of dividends may restrict our ability to fund our various activities.
If the recent volatility in LIBOR continues, it could affect our profitability, earnings and cash flow.
Although relatively stable infrom 2009 and 2010,to 2011, LIBOR was volatile in 2008,prior years, during which the spread between LIBOR and the prime lending rate widened, at times significantly. Because the interest rates borne by our outstanding indebtedness fluctuate with changes in LIBOR, if these rates increase significantly or become significantly volatile once again, it would affect the amount of interest payable on our debt, which in turn, could have an adverse effect on our profitability, earnings and cash flow.
Furthermore, interest in most loan agreements in our industry has been based on published LIBOR rates. Recently, however, in certain cases potential lenders have insisted on provisions that entitle the lenders, in their discretion, to replace published LIBOR as the base for the interest calculation with their cost-of-funds rate. If we are required to agree to
such a provision in future loan agreements, our lending costs could increase significantly, which would have an adverse effect on our profitability, earnings and cash flow.
We selectively enter into derivative contracts, which can result in higher than market interest rates and charges against our income.
In the past teneleven years we have selectively entered into derivative contracts both for investment purposes and to hedge our overall interest expense and, more recently, our bunker expenses. Our board of directors is regularly informed of the status of our derivatives in order to assess that such derivatives are within reasonable limits and reasonable in light of our particular investment strategy at the time we entered into the derivative contracts.
Loans advanced under our secured credit facilities are, generally, advanced at a floating rate based on LIBOR. Our financial condition could be materially adversely affected at any time that we have not entered into interest rate hedging arrangements to hedge our interest rate exposure and the interest rates applicable to our credit facilities and any other financing arrangements we may enter into in the future, including those we enter into to finance a portion of the amounts payable with respect to newbuildings. Moreover, even if we have entered into interest rate swaps or other derivative instruments for purposes of managing our interest rate or bunker cost exposure, our hedging strategies may not be effective and we may incur substantial loss.
We have a risk management policy and a risk committee to oversee all our derivative transactions. It is our policy to monitor our exposure to business risk, and to manage the impact of changes in interest rates, foreign exchange rate movements and bunker prices on earnings and cash flows through derivatives. Derivative contracts are executed when management believes that the action is not likely to significantly increase overall risk. Entering into swaps and derivatives transactions is inherently risky and presents various possibilities for incurring significant expenses. The derivatives strategies that we employ in the future may not be successful or effective, and we could, as a result, incur substantial additional interest costs. See “Quantitative“Item 11. Quantitative and Qualitative Disclosures About Market Risk” for a description of how our current interest rate swap arrangements have been impacted by recent events.
The appraised values of our ships could deteriorate as the result of a variety of factors, resulting in our inability to comply with covenants under our loan agreements.
The loan agreements we use to finance our ships require us not to exceed specified debt-to-asset ratios. Our only significant assets are our ships, which are appraised each year. The appraised value of a ship fluctuates depending on a variety of factors including the age of the ship, its hull configuration, prevailing charter market conditions, supply and demand balance for ships and new and pending legislation.
We cannot guarantee that a deterioration of our asset values will not result in defaults in the future, nor can we guarantee that we will be able to negotiate a waiver in the event of a default. A default under one of our loan agreements could trigger cross-acceleration or cross-default provisions in our other loan agreements, which in turn could result in all or a substantial amount of our debt becoming due at a time when we could not satisfy our obligations.
If we default under any of our loan agreements, we could forfeit our rights in our vessels and their charters.
All of our vessels and related collateral are individually pledged as security to the respective lenders under our loan agreements. Default under any of these loan agreements, if not waived or modified, would permit the lenders to foreclose on the mortgages over the vessels and the related collateral, and we could lose our rights in the vessels and their charters.
Our vessels may suffer damage and we may face unexpected dry-docking costs which could affect our cash flow and financial condition.
If our vessels suffer damage, they may need to be repaired at a dry-docking facility. The costs of dry-dock repairs can be both substantial and unpredictable. We may have to pay dry-docking costs that our insurance does not cover. This would result in decreased earnings.
A significant amount of our 20102011 revenues was derived from five customers and a significant amount of our 20092010 revenues was derived from sixfive customers, and our revenues could decrease significantly if we lost these customers.
In 2010, 16%2011, 14% of our revenues came from Petrobras, 10% of our revenues came from Houston Refining, 9%Flopec, 8% of our revenues from BP, 9%7% from Flopec,STBL, and 9%6% from STBL,HMM, certain of which were also among our largest customers in 2009.2010. Our inability or failure to continue to employ our vessels at rates comparable to those earned from these customers, the loss of these customers or our failure to charter these vessels otherwise in a reasonable period of time or at all could adversely affect our operations and performance. Although our customers generally include leading national, major and other independent oil companies and refiners, we are unable to assure you that future economic circumstances will not render one or more of such customers unable to pay us amounts that they owe us, or that these important customers will not decide to contract with our competitors or perform their shipping functions themselves.
Approximately 10% of our revenue is derived from our customers that conduct a significant amount of business in Venezuela.
Houston Refining (formerly Lyondell/Citgo), accounted for approximately 10% in 2010 and 2009 of our revenues. This company conducts a significant amount of business in Venezuela. Venezuela has experienced economic difficulties and social and political changes in recent years and we cannot say whether there will be further unrest or political upheavals in Venezuela. If we were to lose this customer, or if its exports were curtailed, or if this customer was to become unable to perform their contractual obligations to us, our earnings would be adversely affected.
If we were to be subject to tax in jurisdictions in which we operate, our financial results would be adversely affected.
Our income is not presently subject to taxation in Bermuda, which has no corporate income tax. We believe that we should not be subject to tax under the laws of various countries other than the United States in which we conduct activities or in which our customers are located. However, our belief is based on our understanding of the tax laws of those countries, and our tax position is subject to review and possible challenge by taxing authorities and to possible changes in law or interpretation. We cannot determine in advance the extent to which certain jurisdictions may require us to pay tax or to make payments in lieu of tax. In addition, payments due to us from our customers may be subject to tax claims.
Under the United States Internal Revenue Code of 1986, as amended (the “Internal Revenue Code”), 50% of the gross shipping income of a vessel owning or chartering corporation, such as ourselves and our subsidiaries, that is attributable to transportation that begins or ends, but that does not both begin and end, in the United States is characterized as United States source shipping income and such income is subject to a gross 4% United States federal income tax without allowance for deductions, unless that corporation qualifies for exemption from tax under Section 883 of the Internal Revenue Code and the Treasury Regulations thereunder.
We believe that we and our subsidiaries qualified for this exemption for 2010.2011. There are, however, factual circumstances beyond our control that could cause us and our subsidiaries to be unable to obtain the benefit of this tax exemption in future years and thus to be subject to United States federal income tax on United States source shipping income. Due to the factual nature of the issues involved, we can give no assurances on our tax-exempt status or that of any of our subsidiaries. See “Tax Considerations—United States federal income tax considerations” for additional information about the requirements of this exemption.
If we or our subsidiaries are not entitled to this exemption under Section 883 for any taxable year, we or our subsidiaries would be subject for those years to a 4% United States federal income tax on our gross U.S.-source shipping revenue, without allowance for deductions, under Section 887 of the Internal Revenue Code. The imposition of such tax could have a negative effect on our business and would result in decreased earnings available for distribution to our stockholders.
If we were treated as a passive foreign investment company, a U.S. investor in our common shares would be subject to disadvantageous rules under the U.S. tax laws.
If we were treated as a passive foreign investment company (a “PFIC”) in any year, U.S. holders of our common shares would be subject to unfavorable U.S. federal income tax treatment. We do not believe that we will be a PFIC in 20112012 or in any future year. However, PFIC classification is a factual determination made annually and we could become a PFIC if the portion of our income derived from bareboat charters or other passive sources were to increase substantially or if the portion of our assets that produce or are held for the production of passive income were to increase substantially. Moreover, the IRS may disagree with our position that time and voyage charters do not give rise to passive income for purposes of the PFIC rules. Accordingly, we can provide no assurance that we will not be treated as a PFIC for 20102012 or for any future year. Please see “Tax Considerations—United States federal income tax considerations—Passive Foreign Investment Company Considerations” herein for a description of the PFIC rules.
Dividends we pay with respect to our common shares to United States holders would not be eligible to be taxed at reduced U.S. tax rates applicable to qualifying dividends if we were a passive foreign investment company or under other circumstances.
For taxable years beginning prior to January 1, 2013, distributions on the common shares of non-U.S. companies that are treated as dividends for U.S. federal income tax purposes and are received by individuals generally will be eligible for taxation at capital gain rates if the common shares with respect to which the dividends are paid are readily tradable on an established securities market in the United States. This treatment will not be available to dividends we pay, however, if we qualify as a PFIC for the taxable year of the dividend or the preceding taxable year, or to the extent that (i) the shareholder does not satisfy a holding period requirement that generally requires that the shareholder hold the shares on which the dividend is paid for more than 60 days during the 121-day period that begins 60 days before the date on which the shares become ex-dividend with respect to such dividend, (ii) the shareholder is under an obligation to make related payments with respect to substantially similar or related property or (iii) such dividend is taken into account as investment income under Section 163(d)(4)(B) of the Internal Revenue Code. We do not believe that we qualified as a PFIC for our last taxable year and, as described above, we do not expect to qualify as a PFIC for our current or future taxable years. Legislation has been proposed in the United States Congress which, if enacted in its current form, would likely cause dividends on our shares to be ineligible for the preferential tax rates described above. There can be no assurance regarding whether, or in what form, such legislation will be enacted.
Because some of our expenses are incurred in foreign currencies, we are exposed to exchange rate risks.
The charterers of our vessels pay us in U.S. dollars. While we incur most of our expenses in U.S. dollars, we have in the past incurred expenses in other currencies, most notably the Euro. In 2010,2011, Euro expenses accounted for approximately 46%49% of our total operating expenses. Declines in the value of the U.S. dollar relative to the Euro, or the other currencies in which we incur expenses, would increase the U.S. dollar cost of paying these expenses and thus would adversely affect our results of operations.
The Tsakos Holdings Foundation and the Tsakos family can exert considerable control over us, which may limit your ability to influence our actions.
As of March 31, 2011,2012, companies controlled by the Tsakos Holdings Foundation or affiliated with the Tsakos Group own approximately 36%39% of our outstanding common shares. The Tsakos Holdings Foundation is a Liechtenstein foundation whose beneficiaries include persons and entities affiliated with the Tsakos family, charitable institutions and other unaffiliated persons and entities. The council which controls the Tsakos Holdings Foundation consists of five members, two of whom are members of the Tsakos family. As long as the Tsakos Holdings Foundation and the Tsakos family beneficially own a significant percentage of our common shares, each will have the power to influence the election of the members of our board of directors and the vote on substantially all other matters, including significant corporate actions.
The Public Company Accounting Oversight Board (PCAOB) is currently unable to inspect the audit work and practices of auditors operating in Greece, including our auditor.
Auditors of U.S. public companies are required by law to undergo periodic Public Company Accounting Oversight Board (PCAOB) inspections that assess their compliance with U.S. law and professional standards in connection with performance of audits of financial statements filed with the SEC. Certain EU countries do not permit the PCAOB to conduct inspections of accounting firms established and operating in EU countries, even if they are part of major international firms. Accordingly, unlike for most U.S. public companies, the PCAOB is prevented from evaluating our auditor’s performance of audits and its quality control procedures, and, unlike the shareholders of most U.S. public companies, our shareholders are deprived of the possible benefits of such inspections.
Risks Related To Our Common Shares
Future sales of our common shares could cause the market price of our common shares to decline.
During 2010, we issued and sold an aggregate of almost 1.2 million common shares pursuant to an at-the-market offering, resulting in net proceeds of $19.9$19.7 million, and a further 7.6 million common shares in a follow-on offering raising an additional $85.1 million of net proceeds. SalesAlthough there were no offerings in 2011, sales of a substantial number of our common shares in the public market, or the perception that these sales could occur, may depress the market price for our common shares. These sales could also impair our ability to raise additional capital through the sale of our equity securities in the future.
We may issue additional common shares in the future and our shareholders may elect to sell large numbers of shares held by them from time to time. Our authorized capital stock consists of 100,000,000 shares, par value $1.00 per share, of which 46,081,48746,208,737 common shares are outstanding as of March 31, 2011.2012.
The market price of our common shares may be unpredictable and volatile.
The market price of our common shares may fluctuate due to factors such as actual or anticipated fluctuations in our quarterly and annual results and those of other public companies in our industry, mergers and strategic alliances in the tanker industry, market conditions in the tanker industry, changes in government regulation, shortfalls in our operating results from levels forecast by securities analysts, announcements concerning us or our competitors, our sales of our common shares and the general state of the securities market. The tanker industry has been highly unpredictable and volatile. The market for common stock in this industry may be equally volatile. Therefore, we cannot assure you that you will be able to sell any of our common shares you may have purchased, or will purchase in the future, at a price greater than or equal to the original purchase price.
We may not be able to pay cash dividends on our common shares as intended.
During 2010,2011, we paid dividends totaling $0.60 per common share. In February 20112012 we paid a quarterly share of $0.15 per common share and in March, 2011, our board of directors declared a further quarterly dividend of $0.15 per common share to be paid on April 28, 2011.share. Subject to the limitations discussed below, we currently intend to continue to pay regular quarterly cash dividends on our common shares of between one-quarter and one-half of our annual net income for the year in respect of which the dividends are paid.shares. However, there can be no assurance that we will pay dividends or as to the amount of any dividend. The payment and the amount will be subject to the discretion of our board of directors and will depend, among other things, on available cash balances, anticipated cash needs, our results of operations, our financial condition, and any loan agreement restrictions binding us or our subsidiaries, as well as other relevant factors. For example, if we earned a capital gain on the sale of a vessel or newbuilding contract, we could determine to reinvest that gain instead of using it to pay dividends. Depending on our operating performance for that year, this could result in no dividend at all despite the existence of net income, or a dividend that represents a lower percentage of our net income. Any payment of cash dividends could slow our ability to renew and expand our fleet, and could cause delays in the completion of our current newbuilding program.
Because we are a holding company with no material assets other than the stock of our subsidiaries, our ability to pay dividends will depend on the earnings and cash flow of our subsidiaries and their ability to pay us dividends. In addition, the financing arrangements for indebtedness we incur in connection with our newbuilding program may further restrict our ability to pay dividends. In the event of any insolvency, bankruptcy or similar proceedings of a subsidiary, creditors of such subsidiary would generally be entitled to priority over us with respect to assets of the affected subsidiary. Investors in our common shares may be adversely affected if we are unable to or do not pay dividends as intended.
Provisions in our Bye-laws, our management agreement with Tsakos Energy Management and our shareholder rights plan would make it difficult for a third party to acquire us, even if such a transaction is beneficial to our shareholders.
Our Bye-laws provide for a staggered board of directors, blank check preferred stock, super majority voting requirements and other anti-takeover provisions, including restrictions on business combinations with interested persons and limitations on the voting rights of shareholders who acquire more than 15% of our common shares. In
addition, Tsakos Energy Management would have the right to terminate our management agreement and seek liquidated damages if a board member were elected without having been approved by the current board. Furthermore, our shareholder rights plan authorizes issuance to existing shareholders of substantial numbers of preferred share rights and common shares in the event a third party seeks to acquire control of a substantial block of our common shares. These provisions could deter a third party from tendering for the purchase of some or all of our shares. These provisions may have the effect of delaying or preventing changes of control of the ownership and management of our company, even if such transactions would have significant benefits to our shareholders.
Our shareholder rights plan could prevent you from receiving a premium over the market price for your common shares from a potential acquirer.
Our board of directors has adopted a shareholder rights plan that authorizes issuance to our existing shareholders of substantial preferred share rights and additional common shares if any third party acquires 15% or more of our outstanding common shares or announces its intent to commence a tender offer for at least 15% of our common shares, in each case, in a transaction that our board of directors has not approved. The existence of these rights would significantly increase the cost of acquiring control of our company without the support of our board of directors because, under these limited circumstances, all of our shareholders, other than the person or group that caused the rights to become exercisable, would become entitled to purchase our common shares at a discount. The existence of the rights plan could therefore deter potential acquirers and thereby reduce the likelihood that you will receive a premium for your common shares in an acquisition. See “Description“Item 10. Additional Information Description of Capital Stock—Shareholder Rights Plan” for a description of our shareholder rights plan.
Because we are a foreign corporation, you may not have the same rights as a shareholder in a U.S. corporation.
We are a Bermuda corporation. Our Memorandum of Association and Bye-laws and the Companies Act 1981 of Bermuda, as amended (the “Companies Act”) govern our affairs. While many provisions of the Companies Act resemble provisions of the corporation laws of a number of states in the United States, Bermuda law may not as clearly establish your rights and the fiduciary responsibilities of our directors as do statutes and judicial precedent in some U.S. jurisdictions. In addition, apart from one non-executive director, our directors and officers are not resident in the United States and all or substantially all of our assets are located outside of the United States. As a result, investors may have more difficulty in protecting their interests and enforcing judgments in the face of actions by our management, directors or controlling shareholders than would shareholders of a corporation incorporated in a U.S. jurisdiction.
In addition, you should not assume that courts in the country in which we are incorporated or where our assets are located would enforce judgments of U.S. courts obtained in actions against us based upon the civil liability provisions of applicable U.S. federal and state securities laws or would enforce, in original actions, liabilities against us based on those laws.
| Item 4. | Information on the Company |
Tsakos Energy Navigation Limited is a leading provider of international seaborne crude oil and petroleum product transportation services. In 2007 it also started to transport liquefied natural gas. It was incorporated in 1993 as an exempted company under the laws of Bermuda under the name Maritime Investment Fund Limited. In 1996, Maritime Investment Fund Limited was renamed MIF Limited. Our common shares were listed in 1993 on the Oslo Stock Exchange (OSE) and the Bermuda Stock Exchange, although we de-listed from the OSE in March 2005 due to limited trading. The Company’s shares are no longer actively traded on the Bermuda exchange. In July 2001, the Company’s name was changed to Tsakos Energy Navigation Limited to enhance our brand recognition in the tanker industry, particularly among charterers. In March 2002, we completed an initial public offering of our common shares in the United States and our common shares began trading on the New York Stock Exchange under the ticker symbol “TNP.” Since incorporation, the Company has owned and operated 6575 vessels and has sold 2328 vessels (of which three had been chartered back and eventually repurchased at the end of their charters. All three have since been sold again).
Our principal offices are located at 367 Syngrou Avenue, 175 64 P. Faliro, Athens, Greece. Our telephone number at this address is 011 30 210 9407710. Our website address ishttp://www.tenn.gr.
For additional information on the Company, see “Item 5 Operating and Financial Review and Prospects.”
Business Overview
Tsakos Energy Navigation Limited is a leading provider of international seaborne crude oil and petroleum product transportation services and, as of March 31, 2011,2012, operated a fleet of 4748 modern crude oil carriers and petroleum product tankers that provide world-wide marine transportation services for national, major and other independent oil companies and refiners under long, medium and short-term charters. Our fleet also includes one 2007-built Liquefied Natural Gas (“LNG”) carrier. In addition to the vessels currently operating in our fleet as of March 31, 2011,2012, we are building two additionalDP2 shuttle suezmax tankers, which we expect to take delivery of in the secondfirst and thirdsecond quarters of 2011. In addition, we expect2013 and have agreed, subject to takefinal documentation, for the construction of a 162,000 cbm LNG carrier delivery of the first in a series of two DP2 shuttle tankers in the fourth quarter of 2012 and the second in the first quarter of 2013.2015. The resulting fleet (assuming no further sales)sales or acquisitions) would comprise 51 vessels representing approximately 5.5 million dwt. We do, however, expect to sell two VLCC vessels,La Madrina andLa Prudencia,in the second quarter of 2012 and the first quarter of 2013, respectively. We also have options to purchase two 158,000 dwt suezmax tanker newbuildings and an option to construct one additional 162,000 cbm LNG carrier. The first suezmax newbuilding would be delivered from a South Korean shipyard during the second quarter of 2012, the second newbuilding would be delivered in the first quarter of 2013 and the LNG carrier would be delivered in late 2015.
We believe that we have established a reputation as a safe, high quality, cost efficient operator of modern and well-maintained tankers. We also believe that these attributes, together with our strategy of proactively working towards meeting our customers’ chartering needs, has contributed to our ability to attract leadingworld-class energy producers charterers as customers and to our success in obtaining charter renewals generating strong fleet utilization.
Our fleet is managed by Tsakos Energy Management Limited, or Tsakos Energy Management, an affiliate company owned by our chief executive officer. Tsakos Energy Management, which performs its services exclusively for our benefit, provides us with strategic advisory, financial, accounting and back-office services, while subcontracting the commercial management of our business to Tsakos Shipping & Trading, S.A., or Tsakos Shipping. In its capacity as commercial manager, Tsakos Shipping manages vessel purchases and sales and identifies and negotiates charter opportunities for our fleet. Until June 30, 2010, Tsakos Shipping also provided technical and operational management for the majority of our vessels.
Since July 1, 2010, Tsakos Energy Management subcontracts the technical and operational management of our fleet to Tsakos Columbia Shipmanagement S.A., or TCM. TCM was formed in February 2010 by Tsakos family interests and a Tsakos affiliatedGerman private company, and the German company, Schoeller Holdings Ltd., the owner of the ship management company Columbia Shipmanagement Ltd., or CSM, as a joint-venture ship management company on an equal partnership basis to provide technical and operational management services to owners of vessels, primarily within the Greece-based market. TCM, which formally commenced operations on July 1, 2010, now manages the technical and
operational activities of all of our vessels apart from three vesselsthe LNG carrierNeo Energy and VLCCMillennium which are both technically managed by othera non-affiliated ship managers.manager. TCM is based in Athens, Greece and is staffed primarily with former Tsakos Shipping personnel, in addition to certain CSM executives. TCM and CSM cooperate in the purchase of certain supplies and services on a combined basis. By leveraging the purchasing power of CSM, which currently provides full technical management services for over 130150 vessels and crewing services for an additional 200 vessels, we believe TCM is able to procure services and supplies at lower prices than Tsakos Shipping could alone, thereby reducing overall operating expenses for us. We also expect to benefit from CSM’s significant crewing capabilities. In its capacity as technical manager, TCM manages our day-to-day vessel operations, including provision of supplies, maintenance and repair, crewing and supervising newbuilding construction.crewing. Members of the Tsakos family are involved in the decision-making processes of Tsakos Energy Management, Tsakos Shipping and TCM.
Tsakos Shipping will continuecontinues to provide commercial management services for our vessels, which include chartering, charterer relations, obtaining insurance and vessel sale and purchase, supervising newbuilding construction and vessel financing.
As of March 31, 2011,2012, our fleet consisted of the following 4748 vessels:
Number of Vessels | Vessel Type | |
3 | VLCC | |
| Suezmax | |
| Aframax | |
3 | Aframax LR2 | |
9 | Panamax LR1 | |
6 | Handymax MR2 | |
8 | Handysize MR1 | |
1 | LNG carrier | |
Total | ||
Twenty-one of the operating vessels are of ice-class specification. This fleet diversity, which includes a number of sister ships, provides us with the opportunity to be one of the more versatile operators in the market. The current fleet totals approximately 4.95.1 million dwt, all of which is double-hulled. This compares favorably to the worldwide average of 6% single-hulled dwt as of March 31, 2011. As of March 31, 2011,2012, the average age of the tankers in our current operating fleet was 6.97.3 years, compared with the industry average of 7.78.2 years.
In addition to the vessels operating in our fleet as of March 31, 2011,2012, we are building an additional four vessels.two suezmax DP2 shuttle tankers and are entering into a contract for the construction of a LNG carrier, with delivery in the first quarter of 2015, together with an option to construct one additional LNG carrier. We expect delivery of two suezmax DP2 shuttle tankers in the secondfirst and thirdsecond quarters of 2011. On March 23, 2011, we delivered2013 and the aframax tankerOpal Queento its buyers.LNG carrier in the first quarter of 2015.
We believe the following factors distinguish us from other public tanker companies:
| • | Modern, high-quality, fleet.We own a fleet of modern, high-quality tankers that are designed for enhanced safety and low operating costs. Since inception, we have committed to investments of |
| • | Diversified fleet.Our diversified fleet, which includes VLCC, suezmax, aframax, panamax, handysize and handymax tankers, as well as one LNG carrier, allows us to better serve our customers’ international crude oil and petroleum product transportation needs. We have also committed a sizable part of our newbuilding and acquisition program to ice-class vessels. We have 21 ice-class vessels. Additionally, we entered the LNG market with the delivery of our LNG carrier in 2007. In addition, we have ordered two new suezmax DP2 shuttle tankers that are expected to be delivered in the |
| • | Stability throughout industry cycles.Historically, we have employed a high percentage of our fleet on long and medium-term employment with fixed rates or minimum rates plus profit sharing agreements. We believe this approach has resulted in high utilization rates for our vessels. At the same time, we maintain flexibility in our chartering policy to allow us to take advantage of favorable rate trends through spot market employment and contract of affreightment charters with periodic adjustments. Over the last five years, our overall average fleet utilization rate was 97.3%. |
| • |
|
| • | Developing LNG platform. We believe we are well positioned to capitalize on rising demand for LNG sea transport because of our extensive relationships with existing customers, strong safety track record, superior technical management capabilities and financial flexibility. We already operate one LNG carrier and have agreed upon one newbuilding LNG carrier for delivery in the first quarter of 2015. In addition, we have an option to purchase an additional newbuilding LNG carrier for delivery in late 2015. |
| • | Significant leverage from our relationship with Tsakos Shipping and TCM.We believe the expertise, scale and scope of |
efficiency, quality and safety. We leverage Tsakos Shipping’s reputation and longstanding relationships with leading charterers to foster charter renewals. In addition, due to its anticipated size, we believe that TCM has the ability to spread costs over a larger vessel base than that previously of Tsakos Shipping, thereby capturing even greater economies of scale that may lead to additional cost savings for us. |
As of March 31, 2011,2012, our fleet consisted of the following 4748 vessels:
Vessel | Year Built | Deadweight Tons | Year Acquired | Charter Type | Expiration of Charter | Hull Type(1) (all double hull) | Year Built | Deadweight Tons | Year Acquired | Charter Type | Expiration of Charter | Hull Type(1) (all double hull) | ||||||||||||||||||||||||||||||
VLCC | ||||||||||||||||||||||||||||||||||||||||||
1. Millennium | 1998 | 301,171 | 1998 | bareboat charter | September 2013 | 1998 | 301,171 | 1998 | bareboat charter | September 2013 | ||||||||||||||||||||||||||||||||
2. La Madrina | 1994 | 299,700 | 2004 | spot | — | 1994 | 299,700 | 2004 | spot | — | ||||||||||||||||||||||||||||||||
3. La Prudencia | 1993 | 298,900 | 2006 | spot | — | 1993 | 298,900 | 2006 | spot | — | ||||||||||||||||||||||||||||||||
SUEZMAX | ||||||||||||||||||||||||||||||||||||||||||
1. Silia T | 2002 | 164,286 | 2002 | time charter | October 2011 | 2002 | 164,286 | 2002 | time charter | March 2015 | ||||||||||||||||||||||||||||||||
2. Triathlon(2) | 2002 | 164,445 | 2002 | time charter | January 2014 | 2002 | 164,445 | 2002 | time charter | January 2014 | ||||||||||||||||||||||||||||||||
3. Eurochampion 2004(2) | 2005 | 164,608 | 2005 | time charter | October 2012 | ice-class 1C | 2005 | 164,608 | 2005 | time charter | October 2012 | ice-class 1C | ||||||||||||||||||||||||||||||
4. Euronike(2) | 2005 | 164,565 | 2005 | time charter | October 2011 | ice-class 1C | 2005 | 164,565 | 2005 | time charter | September 2014 | ice-class 1C | ||||||||||||||||||||||||||||||
5. Archangel(2) | 2006 | 163,216 | 2006 | time charter | September 2011 | ice-class 1A | 2006 | 163,216 | 2006 | time charter | March 2014 | ice-class 1A | ||||||||||||||||||||||||||||||
6. Alaska(2) | 2006 | 163,250 | 2006 | time charter | November 2011 | ice-class 1A | 2006 | 163,250 | 2006 | time charter | September 2014 | ice-class 1A | ||||||||||||||||||||||||||||||
7. Arctic(2) | 2007 | 163,216 | 2007 | time charter | July 2012 | ice-class 1A | 2007 | 163,216 | 2007 | time charter | July 2012 | ice-class 1A | ||||||||||||||||||||||||||||||
8. Antarctic(2) | 2007 | 163,216 | 2007 | time charter | September 2012 | ice-class 1A | 2007 | 163,216 | 2007 | time charter | September 2012 | ice-class 1A | ||||||||||||||||||||||||||||||
AFRAMAX | ||||||||||||||||||||||||||||||||||||||||||
1. Vergina II | 1991 | 96,709 | 1996 | spot | — | |||||||||||||||||||||||||||||||||||||
2. Proteas(2) | 2006 | 117,055 | 2006 | time charter | June 2011 | ice-class 1A | ||||||||||||||||||||||||||||||||||||
3. Promitheas(2) | 2006 | 117,055 | 2006 | time charter | May 2011 | ice-class 1A | ||||||||||||||||||||||||||||||||||||
4. Propontis(2) | 2006 | 117,055 | 2006 | time charter | October 2011 | ice-class 1A | ||||||||||||||||||||||||||||||||||||
5. Izumo Princess | 2007 | 105,374 | 2007 | spot | — | DNA | ||||||||||||||||||||||||||||||||||||
6. Sakura Princess(4) | 2007 | 105,365 | 2007 | | contract of affreightment | | Evergreen | DNA | ||||||||||||||||||||||||||||||||||
7. Maria Princess | 2008 | 105,346 | 2008 | spot | — | DNA | ||||||||||||||||||||||||||||||||||||
8. Nippon Princess | 2008 | 105,392 | 2008 | spot | — | DNA | ||||||||||||||||||||||||||||||||||||
9. Spyros K(3) | 2011 | 157,740 | 2011 | time charter | May 2022 | |||||||||||||||||||||||||||||||||||||
10. Dimitris P(3) | 2011 | 157,648 | 2011 | time charter | August 2023 | |||||||||||||||||||||||||||||||||||||
Vessel 9. Ise Princess(4) 10. Asahi Princess 11. Sapporo Princess 12. Uraga Princess PANAMAX 1. Andes(3) 2. Maya(3)(5) 3. Inca(3)(5) 4. Selecao 5. Socrates 6. World Harmony(3) 7. Chantal(3) 8. Selini 9. Salamina HANDYMAX 1. Artemis(2) 2. Afrodite(2) 3. Ariadne(2) 4. Aris 5. Apollon(2) 6. Ajax HANDYSIZE 1. Didimon 2. Arion 3. Delphi Year
Built Deadweight
Tons Year
Acquired Charter Type Expiration of
Charter Hull Type(1)
(all double hull) 2009 105,361 2009 contract of
affreightment Evergreen DNA 2009 105,372 2009 spot — DNA 2010 105,354 2010 spot — DNA 2010 105,344 2010 spot — DNA 2003 68,439 2003 time charter November 2011 2003 68,439 2003 time charter September 2012 2003 68,439 2003 time charter May 2013 2008 74,296 2008 time-charter July 2011 2008 74,327 2008 time-charter June 2011 2009 74,200 2010 time-charter April 2013 2009 74,329 2010 time-charter June 2013 2009 74,296 2010 pool — 2009 74,251 2010 pool — 2005 53,039 2006 time charter October 2011 ice-class 1A 2005 53,082 2006 time charter January 2012 ice-class 1A 2005 53,021 2006 time charter September 2011 ice-class 1A 2005 53,107 2006 pool — ice-class 1A 2005 53,149 2006 time charter January 2012 ice-class 1A 2005 53,095 2006 pool — ice-class 1A 2005 37,432 2005 time charter March 2012 2006 37,061 2006 pool — ice-class 1A 2004 37,432 2006 time charter November 2011
Vessel | Year Built | Deadweight Tons | Year Acquired | Charter Type | Expiration of Charter | Hull Type(1) (all double hull) | Year Built | Deadweight Tons | Year Acquired | Charter Type | Expiration of Charter | Hull Type(1) (all double hull) | ||||||||||||||||||||||||||
AFRAMAX | ||||||||||||||||||||||||||||||||||||||
1. Proteas(2) | 2006 | 117,055 | 2006 | time charter | March 2013 | ice-class 1A | ||||||||||||||||||||||||||||||||
2. Promitheas | 2006 | 117,055 | 2006 | spot | — | ice-class 1A | ||||||||||||||||||||||||||||||||
3. Propontis | 2006 | 117,055 | 2006 | spot | — | ice-class 1A | ||||||||||||||||||||||||||||||||
4. Izumo Princess | 2007 | 105,374 | 2007 | spot | — | DNA | ||||||||||||||||||||||||||||||||
5. Sakura Princess | 2007 | 105,365 | 2007 | spot | — | DNA | ||||||||||||||||||||||||||||||||
6. Maria Princess | 2008 | 105,346 | 2008 | time charter | July 2012 | DNA | ||||||||||||||||||||||||||||||||
7. Nippon Princess | 2008 | 105,392 | 2008 | time charter | June 2012 | DNA | ||||||||||||||||||||||||||||||||
8. Ise Princess | 2009 | 105,361 | 2009 | spot | — | DNA | ||||||||||||||||||||||||||||||||
9. Asahi Princess | 2009 | 105,372 | 2009 | spot | — | DNA | ||||||||||||||||||||||||||||||||
10. Sapporo Princess | 2010 | 105,354 | 2010 | spot | — | DNA | ||||||||||||||||||||||||||||||||
11. Uraga Princess | 2010 | 105,344 | 2010 | spot | — | DNA | ||||||||||||||||||||||||||||||||
PANAMAX | ||||||||||||||||||||||||||||||||||||||
1. Andes(3) | 2003 | 68,439 | 2003 | time charter | November 2013 | |||||||||||||||||||||||||||||||||
2. Maya(3)(4) | 2003 | 68,439 | 2003 | time charter | September 2012 | |||||||||||||||||||||||||||||||||
3. Inca(3)(4) | 2003 | 68,439 | 2003 | time charter | May 2013 | |||||||||||||||||||||||||||||||||
4. Selecao | 2008 | 74,296 | 2008 | time charter | August 2014 | |||||||||||||||||||||||||||||||||
5. Socrates | 2008 | 74,327 | 2008 | time charter | July 2014 | |||||||||||||||||||||||||||||||||
6. World Harmony(3) | 2009 | 74,200 | 2010 | time charter | April 2013 | |||||||||||||||||||||||||||||||||
7. Chantal(3) | 2009 | 74,329 | 2010 | time charter | June 2013 | |||||||||||||||||||||||||||||||||
8. Selini | 2009 | 74,296 | 2010 | pool | — | |||||||||||||||||||||||||||||||||
9. Salamina | 2009 | 74,251 | 2010 | pool | — | |||||||||||||||||||||||||||||||||
HANDYMAX | ||||||||||||||||||||||||||||||||||||||
1. Artemis | 2005 | 53,039 | 2006 | time charter | November 2014 | ice-class 1A | ||||||||||||||||||||||||||||||||
2. Afrodite(2) | 2005 | 53,082 | 2006 | time charter | January 2013 | ice-class 1A | ||||||||||||||||||||||||||||||||
3. Ariadne(2) | 2005 | 53,021 | 2006 | time charter | September 2012 | ice-class 1A | ||||||||||||||||||||||||||||||||
4. Aris | 2005 | 53,107 | 2006 | pool | — | ice-class 1A | ||||||||||||||||||||||||||||||||
5. Apollon(2) | 2005 | 53,149 | 2006 | time charter | January 2013 | ice-class 1A | ||||||||||||||||||||||||||||||||
6. Ajax | 2005 | 53,095 | 2006 | pool | — | ice-class 1A | ||||||||||||||||||||||||||||||||
HANDYSIZE | ||||||||||||||||||||||||||||||||||||||
1. Didimon | 2005 | 37,432 | 2005 | time charter | March 2014 | |||||||||||||||||||||||||||||||||
2. Arion | 2006 | 37,061 | 2006 | pool | — | ice-class 1A | ||||||||||||||||||||||||||||||||
3. Delphi | 2004 | 37,432 | 2006 | time charter | November 2013 | |||||||||||||||||||||||||||||||||
4. Amphitrite (formerly Antares) | 2006 | 37,061 | 2006 | pool | — | ice-class 1A | 2006 | 37,061 | 2006 | pool | — | ice-class 1A | ||||||||||||||||||||||||||
5. Andromeda | 2007 | 37,061 | 2007 | spot | — | ice-class 1A | 2007 | 37,061 | 2007 | spot | — | ice-class 1A | ||||||||||||||||||||||||||
6. Aegeas | 2007 | 37,061 | 2007 | time charter | October 2013 | ice-class 1A | 2007 | 37,061 | 2007 | time charter | October 2013 | ice-class 1A | ||||||||||||||||||||||||||
7. Byzantion | 2007 | 37,275 | 2007 | spot | — | ice-class 1B | 2007 | 37,275 | 2007 | spot | — | ice-class 1B | ||||||||||||||||||||||||||
8. Bosporos | 2007 | 37,275 | 2007 | spot | — | ice-class 1B | 2007 | 37,275 | 2007 | spot | — | ice-class 1B | ||||||||||||||||||||||||||
LNG | ||||||||||||||||||||||||||||||||||||||
1. Neo Energy | 2007 | 85,602 | 2007 | time charter | August 2011 | Membrane | 2007 | 85,602 | 2007 | time charter | March 2016 | Membrane | ||||||||||||||||||||||||||
Total Vessels | 47 | 4,854,124 | 48 | 5,072,803 | ||||||||||||||||||||||||||||||||||
| (1) | Ice-class classifications are based on ship resistance in brash ice channels with a minimum speed of 5 knots for the following conditions ice-1A: 1m brash ice, ice-1B: 0.8m brash ice, ice-1C: 0.6m brash ice. DNA- design new aframax with shorter length overall allowing greater flexibility in the Caribbean and the United States. |
| (2) | The charter rate for these vessels is based on a fixed minimum rate for the Company plus different levels of profit sharing above the minimum rate, determined and settled on a calendar month basis. |
| (3) | These vessels are chartered under fixed and variable hire rates. The variable portion of hire is recognized to the extent the amount becomes fixed and determinable at the reporting date. Determination is every six months. |
| (4) |
| 49% of the holding company of these vessels is held by a third party. |
Our newbuildings under construction
We have on order and expect to takeOn March 21, 2011, the Company ordered two suezmax DP2 shuttle tankers from Sungdong Shipbuilding in South Korea with expected delivery dates in the secondfirst and thirdsecond quarters of 2011 two suezmaxes under construction by Sungdong Shipbuilding.2013, respectively. The newbuildings have a double hull design compliant with all classification requirements and prevailing environmental laws and regulations. On March 21, 2011, the Company ordered two suezmax DP2 shuttle tankers with expected delivery dates the fourth quarter of 2012 and the first quarter of 2013, respectively. Tsakos Shipping has worked closely with the Sungdong yardshipyard in South Korea in the design of all the newbuildings and continues to work with the yardshipyard during the construction period. TCM provides supervisory personnel present during the construction.
Our newbuildings under construction as of March 31, 20112012 consisted of the following:
Vessel Type | Expected Delivery | Shipyard | Deadweight Tons | Purchase Price(1) (in millions of U.S. dollars) | ||||||||||||
SUEZMAX | ||||||||||||||||
Conventional | ||||||||||||||||
1. Hull S2034 | 2nd Quarter 2011 | | Sungdong Shipbuilding | | 158,000 | $ | 70.2 | |||||||||
Vessel Type 2. Hull S2035 Shuttle 3. Hull S7001 4. Hull S7002 Total Vessel Type Shuttle Tankers 1. Hull S7001 2. Hull S7002 Total Expected Delivery Shipyard Deadweight
Tons Purchase
Price(1)
(in millions
of U.S.
dollars) 3rd Quarter 2011
Sungdong
Shipbuilding
158,000 $ 70.2 4th Quarter 2012
Sungdong
Shipbuilding
157,000 $ 92.0 1st Quarter 2013
Sungdong
Shipbuilding
157,000 $ 92.0 630,000 $ 324.4 Expected Delivery Shipyard Deadweight
Tons Purchase
Price(1)
(in millions
of U.S.
dollars) 1st Quarter 2013 Sungdong
Shipbuilding 157,000 $ 92.8 2nd Quarter 2013 Sungdong
Shipbuilding 157,000 $ 92.8 314,000 $ 185.6
| (1) | Including extra cost agreed as of March 31, |
Under the newbuilding contracts, the purchase prices for the ships are subject to deductions for delayed delivery, excessive fuel consumption and failure to meet specified deadweight tonnage requirements. We make progress payments equal to 30% or 40%50% of the purchase price of each vessel during the period of its construction. In the case of Hulls S2034 and S2035, we renegotiated the purchase price of the vessels down by $2.5 million each in return for 80% progress payments. The remainder of the purchase price with respect to each vessel will be paid upon delivery of the given vessel. As of March 31, 2011,2012, we had made progress payments of $100.4$36.8 million out of the total purchase price of approximately $324.4$185.6 million for these newbuildings. Of the remaining amount, a further $76.8$55.2 million will be paid during 2011.2012. As of March 31, 2011,2012, we have not secured bank financing for one of our remaining obligationstwo newbuilding vessels.
We are entering into a contract for the construction by Hyundai Heavy Industries of one 162,000 cbm LNG carrier. The vessel, which will be equipped with the latest tri-fuel diesel electric propulsion technology, will be scheduled for delivery in the first quarter of 2015. We also have an option for the construction of a second LNG carrier of the same specification, whose delivery would be scheduled for the fourth quarter 2015, if we exercise the option.
We have obtained options to acquire two 158,000 dwt suezmax newbuildings, the shipyardsfirst of which would be expected to be delivered by a South Korean shipyard in this fiscal quarter, with respectthe second newbuilding to our four newbuildings, although negotiations arebe delivered in progress.
While we intend to expandthe first quarter of 2013. We would have a total of 14 suezmaxes in our fleet, attractive opportunities may arise to sell one or more of our vessels, including the four newbuildingsif we have on order, and our board of directors may conclude that the sale of one or more vessels, if an attractive opportunity arises, could be in our best interest.acquire these vessels.
Fleet Deployment
We strive to optimize the financial performance of our fleet by deploying at least two-thirds of our vessels on either time charters or period employment with variable rates. In the past two years, this proportion has been over 85%75% as we took proactive steps to meet any potential impact of the expanding world fleet on freight rates. The remainder of the fleet is in the spot market. We believe that our fleet deployment strategy provides us with
the ability to benefit from increases in tanker rates while at the same time maintaining a measure of stability through cycles in the industry. The following table details the respective employment basis of our fleet during 2011, 2010 2009 and 20082009 as a percentage of operating days.
| Year Ended December 31, | Year Ended December 31, | |||||||||||||||||||||||
Employment Basis | 2010 | 2009 | 2008 | 2011 | 2010 | 2009 | ||||||||||||||||||
Time Charter – fixed rate | 19 | % | 25 | % | 29 | % | ||||||||||||||||||
Time Charter – variable rate | 45 | % | 44 | % | 54 | % | ||||||||||||||||||
Time Charter—fixed rate | 22 | % | 19 | % | 25 | % | ||||||||||||||||||
Time Charter—variable rate | 39 | % | 45 | % | 44 | % | ||||||||||||||||||
Period Employment at variable rates | 19 | % | 15 | % | 9 | % | 15 | % | 19 | % | 15 | % | ||||||||||||
Spot Voyage | 17 | % | 16 | % | 8 | % | 25 | % | 17 | % | 16 | % | ||||||||||||
Total Net Earnings Days | 16,436 | 16,631 | 15,712 | 16,929 | 16,436 | 16,631 | ||||||||||||||||||
Tankers operating on time charters may be chartered for several months or years whereas tankers operating in the spot market typically are chartered for a single voyage that may last up to several weeks. Vessels on period
employment at variable rates related to the market are either in a pool or operating under contract of affreightment for a specific charterer. Tankers operating in the spot market may generate increased profit margins during improvements in tanker rates, while tankers operating on time charters generally provide more predictable cash flows. Accordingly, we actively monitor macroeconomic trends and governmental rules and regulations that may affect tanker rates in an attempt to optimize the deployment of our fleet. Our fleet has eleven13 tankers currently operating on spot voyages.
Operations and Ship Management
Our operations
Management policies regarding our fleet that are formulated by our board of directors are executed by Tsakos Energy Management under a management contract. Tsakos Energy Management’s duties, which are performed exclusively for our benefit, include overseeing the purchase, sale and chartering of vessels, supervising day-to-day technical management of our vessels and providing strategic, financial, accounting and other services, including investor relations. Our fleet’s technical management, including crewing, maintenance and repair, and voyage operations, has been subcontracted by Tsakos Energy Management to Tsakos Columbia Shipmanagement. Tsakos Energy Management also engages Tsakos Shipping to arrange chartering of our vessels, provide sales and purchase brokerage services, and procure vessel insurance.insurance and arrange bank financing. Seven vessels were sub-contracted to third-party ship managers during part or all of 2010.2011.
The following chart illustrates the management of our fleet:
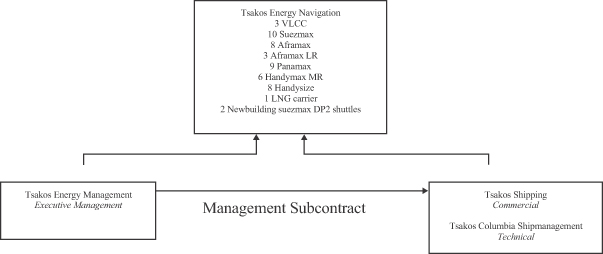
Management Contract
Executive and Commercial Management
Pursuant to our management agreement with Tsakos Energy Management, our operations are executed and supervised by Tsakos Energy Management, based on the strategy devised by our board of directors and subject to the approval of our board of directors as described below. In accordance with the management agreement, we pay Tsakos Energy Management monthly management fees for its management of our vessels. From January 1, 2009, we paid Tsakos Energy Management management fees $23,700 per month per owned vessel and $17,500 per month for vessels chartered-in or chartered out on a bareboat basis or under construction. There is a prorated adjustment if at each year end the Euro has appreciated by 10% or more against the Dollar since January 1, 2007. In addition, there is an increase each year by a percentage figure reflecting 12 month Euribor, if both parties agree. As a consequence, from January 1, 2010,For 2012 monthly fees for operating vessels were increased to $24,000will be $27,500 per owned vessel and $17,700$20,400 for chartered-in vessels or chartered out on a bareboat basis or under construction. From July 1, 2010, theThe monthly management fees for operating vessels were increased to $27,000 per owned vessel exceptfee for the LNG carrier, which bears a monthly fee of $32,000 of which $7,000 is paid to the Management Company and $25,000 to a third party manager. The monthly management fees for chartered-in vessels or for owned vessels chartered out on a bare-boat basis were increased to $20,000. It was agreed that no further increase wouldNeo Energy, will be
implemented at the beginning of 2011. $35,000 from April 2012. The management fee starts to accrue for a vessel at the point a newbuilding contract is executed. To help ensure that these fees are competitive with industry standards, our management has periodically made presentations to our board of directors in which the fees paid to Tsakos Energy Management are compared against the publicly available financial information of integrated, self-contained tanker companies. We paid Tsakos Energy Management aggregate management fees of $15.3 million in 2011, $13.8 million in 2010.2010 and $13.0 million in 2009. From these amounts, Tsakos Energy Management paid a technical management fee to Tsakos Shipping up to the end of June 2010 and from July 1, 2010 to Tsakos Columbia Shipmanagement. For additional information about the management agreement, including the calculation of management fees, see “Item 7. Major Shareholders and Related Party Transactions” and our consolidated financial statements which are included as Item 18 to this Annual Report.
Chartering. Our board of directors formulates our chartering strategy for all our vessels and Tsakos Shipping, under the supervision of Tsakos Energy Management, implements the strategy by:
evaluating the short, medium, and long-term opportunities available for each type of vessel;
balancing short, medium, and long-term charters in an effort to achieve optimal results for our fleet; and
positioning such vessels so that, when possible, re-delivery occurs at times when Tsakos Shipping expects advantageous charter rates to be available for future employment.
Tsakos Shipping utilizes the services of various charter brokers to solicit, research, and propose charters for our vessels. The charter brokers’ role involves researching and negotiating with different charterers and proposing charters to Tsakos Shipping for cargoes to be shipped in our vessels. Tsakos Shipping negotiates the exact terms and conditions of charters, such as delivery and re-delivery dates and arranges cargo and country exclusions, bunkers, loading and discharging conditions and demurrage. Tsakos Energy Management is required to obtain our approval for charters in excess of six months and is required to obtain the written consent of the administrative agents for the lenders under our secured credit facilities for charters in excess of thirteen months. There are frequently two or more brokers involved in fixing a vessel on a charter. Brokerage fees typically amount to 2.5% of the value of the freight revenue or time charter hire derived from the charters. We pay a chartering commission of 1.25% to Tsakos Shipping for every charter involving our vessels. In addition, Tsakos Shipping may charge a brokerage commission on the sale of a vessel. In 2011, 2010 and 2009 this commission was approximately 1% of the sale price of a vessel. The total amount we paid for these chartering and sale brokerage commissions was $6.3$5.5 million in 2010.2011. Tsakos Shipping may also charge a fee of $200,000 (or such other sum as may be agreed) on delivery of each new-building vessel in payment for the cost of design and supervision of the new-building by Tsakos Shipping. In 2011, $2.8 million has been charged for fourteen vessels delivered between 2007 and September 2011. This amount was added to the cost of the vessels concerned and is being amortized over the remaining life of the vessels.
Tsakos Shipping supervises the post fixture business of our vessels, including:
monitoring the daily geographic position of such vessels in order to ensure that the terms and conditions of the charters are fulfilled by us and our charterers;
collection of monies payable to us; and
resolution of disputes through arbitration and legal proceedings.
In addition, Tsakos Shipping appoints superintendents to supervise the construction of newbuildings and the loading and discharging of cargoes when necessary. Tsakos Shipping also participates in the monitoring of vessels’ operations that are under TCM management and TCM’s performance under the management contract.
General Administration. Tsakos Energy Management provides us with general administrative, office and support services necessary for our operations and our fleet, including technical and clerical personnel, communication, accounting, and data processing services.
Sale and Purchase of Vessels. Tsakos Energy Management advises our board of directors when opportunities arise to purchase, including through newbuildings, or to sell any vessels. All decisions to purchase or sell vessels require the approval of our board of directors.
Any purchases or sales of vessels approved by our board of directors are arranged and completed by Tsakos Energy Management. This involves the appointment of superintendents to inspect and take delivery of vessels and to monitor compliance with the terms and conditions of the purchase or newbuilding contracts.
In the case of a purchase of a vessel by us, each broker involved will receive commissions from the seller generally at the industry standard rate of one percent of the purchase price, but subject to negotiation. In the case of a sale of a vessel by us, each broker involved will receive a commission from us generally at the industry standard rate of one percent of the sale price, but subject to negotiation. In accordance with the management agreement,
Tsakos Energy Management is entitled to charge us for sale and purchase brokerage commission, but to date has not done so.
Technical Management
Pursuant to a technical management agreement, Tsakos Energy Management employs Tsakos Columbia Shipmanagement, or TCM, to manage the day-to-day aspects of vessel operations, including maintenance and repair, provisioning, and crewing of our vessels. We benefit from the economies of scale of having our vessels managed as part of the Tsakos ShippingTCM managed fleet. On occasion, TCM subcontracts the technical management and manning responsibilities of our vessels to third parties. The executive and commercial management of our vessels, however, is not subcontracted to third parties., TCM, which is privately held, is one of the largest independent tanker managers with a total of 6867 operating vessels under management (including our 4748 vessels) at March 31, 2011,2012, with a further sixfour to be delivered, fourtwo of which are vessels under construction for us, totaling approximately 7.76.6 million dwt. TCM employs full-time superintendents, technical experts and maritimemarine engineers and has expertise in supervising the construction of newbuild vessels and inspecting second-hand vessels for purchase and sale, and in fleet maintenance and repair. They have approximately 120 employees engaged in ship management and approximately 2,500 seafaring employees of whom half are employed at sea and the remainder areis on leave at any given time. Tsakos Shipping maintains representative offices in several locations covering key areas of the shipping business such as London, New York, Houston, Montevideo, Manila, Beijing, Tokyo and Panama. Their principal office is in Athens, Greece. The fleet managed by TCM consists mainly of tankers, but also includes feeder container vessels, dry bulk carriers and other vessels owned by affiliates and unaffiliated third parties.
Tsakos Energy Management pays TCM a fee per vessel per month for technical management of operating vessels and vessels under construction. This fee was determined by comparison to the rates charged by other major independent vessel managers. We generally pay all monthly operating requirements of our fleet in advance.
TCM performs the technical management of our vessels under the supervision of Tsakos Energy Management. Tsakos Energy Management approves the appointment of fleet supervisors and oversees the establishment of operating budgets and the review of actual operating expenses against budgeted amounts.
Maintenance and Repair. Each of our vessels is dry-docked once every five years in connection with special surveys and, after the vessel is fifteen years old, the vessel is dry-docked every two and one-half years after a special survey (referred to as an intermediate survey), or as necessary to ensure the safe and efficient operation of such vessels and their compliance with applicable regulations. TCM arranges dry-dockings and repairs under instructions and supervision from Tsakos Energy Management. We believe that the continuous maintenance program we conduct results in a reduction of the time periods during which our vessels are in dry-dock.
TCM routinely employs on each vessel additional crew members whose primary responsibility is the performance of maintenance while the vessel is in operation. Tsakos Energy Management awards and, directly or through TCM, negotiates contracts with shipyards to conduct such maintenance and repair work. They seek competitive tender bids in order to minimize charges to us, subject to the location of our vessels and any time constraints imposed by a vessel’s charter commitments. In addition to dry-dockings, TCM, where necessary, utilizes superintendents to conduct periodic physical inspections of our vessels.
Crewing and Employees
We do not employ the personnel to run our business on a day-to-day basis. We outsource substantially all of our executive, commercial and technical management functions.
TCM arranges employment of captains, officers, engineers and other crew who serve on our vessels. TCM ensures that all seamen have the qualifications and licenses required to comply with international regulations and shipping conventions and that experienced and competent personnel are employed for our vessels.
Customers
Several of the world’s major oil companies are among our regular customers. The table below shows the approximate percentage of revenues we earned from some of our customers in 2010.2011.
Customer | Year Ended December 31, | |||
Petrobras | % | |||
| % | |||
BP | 7.6 | % | ||
STBL | ||||
| ||||
| % | |||
HMM | % | |||
Houston Refineries | 4.3 | % | ||
Mansel | 4.1 | % | ||
Dorado | 3.9 | % | ||
Shell | 3.7 | % | ||
Stena | % | |||
| ||||
| ||||
| 2.8 | % | ||
Clearlake | 2.8 | % | ||
Unipec | 2.3 | % | ||
Litasco | 2.2 | % | ||
Star | 2.1 | % | ||
TOR | % | |||
Standard | 1.8 | % | ||
Sun | % | |||
| ||||
| ||||
| ||||
| ||||
| ||||
| ||||
| % | |||
Regulation
Our business and the operation of our vessels are materially affected by government regulation in the form of international conventions and national, state and local laws and regulations in force in the jurisdictions in
which the vessels operate, as well as in the country or countries of their registration. Because these conventions, laws, and regulations are often revised, we cannot predict the ultimate cost of complying with them or their impact on the resale price and/or the useful lives of our vessels. Additional conventions, laws and regulations may be adopted which could limit our ability to do business or increase the cost of our doing business and which may have a material adverse effect on our operations. Various governmental and quasi-governmental agencies require us to obtain permits, licenses, certificates, and financial assurances with respect to our operations. Subject to the discussion below and to the fact that the kinds of permits, licenses, certificates and financial assurances required for the operations of the vessels we own will depend upon a number of factors, we believe that weWe have been and will be able to obtainobtained all permits, licenses, certificates and financial assurances material to the conduct of our current operations.
The heightened environmental and quality concerns of classification societies, insurance underwriters, regulators and charterers have led to the imposition of increased inspection and safety requirements on all vessels in the tanker market and acceleratedthe scrapping of older vessels throughout the industry.industry has been accelerated.
IMOIMO.. The International Maritime Organization (“IMO”) has negotiated international conventions that impose liability for oil pollution in international waters and in a signatory’s territorial waters. In March 1992, the IMO adopted amendments to
On January 1, 2007 Annex I of the 1993 International Convention for the Prevention of Pollution from Ships (“MARPOL”) which set forth new and upgraded requirements for oil pollution prevention for tankers. These regulations, which became effective in July 1993 (in relation to newbuildings) and in July 1995 (in relation to existing tankers) in many jurisdictions in which our tanker fleet operates, provide that (1) tankers 25 years old and older must be of double-hull construction or of a mid-deck design with double side construction (with some exceptions for tankers between 25 and 30 years old), and (2) all tankers will be subject to enhanced inspections. Also, under IMO regulations, a tanker must be of double-hull construction or a mid-deck design with double-side construction or be of another approved design if that tanker (1) is the subject of a contract for a major conversion or
original construction on or after July 6, 1993, (2) commences a major conversion or has its keel laid on or after January 6, 1994, or (3) completes a major conversion or is a newbuilding delivered on or after July 6, 1996. All of the vessels in our fleet are of double hull construction.
Revisions to Annex I were adopted in 2001. The revised regulations, which became effective in September 2002, provide for increased inspection and verification requirements and for a more aggressive phase-out of single-hull oil tankers, in most cases by 2015 or earlier, depending on the age of the vessel and whether the vessel complies with requirements for protectively located segregated ballast tanks. Segregated ballast tanks use ballast water that is completely separate from the cargo oil and oil fuel system. Segregated ballast tanks are currently required by the IMO on crude oil tankers of 20,000 tonnes deadweight constructed after 1982. The changes, which will likely increase the number of tankers that are scrapped, are intended to reduce the likelihood of oil pollution in international waters.
In December 2003, as a result of the oil spill in November 2002 following the loss of the oil tanker Prestige, which was owned by a company not affiliated with us, the IMO proposed an amendment to MARPOL to accelerate further the phase out of single-hull tankers from 2015 to 2010 unless the relevant flag state, in a particular case, extends the date to either 2015 or the date on which the ship reaches 25 years of age after the date of its delivery, whichever is earlier. This amendment became effective on April 5, 2005.
On January 1, 2007, Annex I of MARPOL was revised to incorporate all amendments since the MARPOL Convention entered into force in 1983 and to clarify the requirements for new and existing tankers.
Regulation 12A of MARPOL Annex I , came into force on August 1, 2007 and governs oil fuel tank protection. The requirements apply to oil fuel tanks on all ships with an aggregate capacity of 600 cubic meters and above which are delivered on or after August 1, 2010 and all ships for which shipbuilding contracts are placed on or after August 1, 2007.
EffectiveSince January 1, 2011 a new chapter 8 of Annex I on the prevention of pollution during transfer of oil cargo between oil tankers at sea has applied to oil tankers of 150 gross tons and above are subject to new Annex I pollution prevention requirements for transfers of oil cargo between oil tankers at sea.above. This requires any subject oil tanker involved in oil cargo ship-to-ship (STS) operations to (1) carry a plan, approved by its flag state administration, prescribing the conduct of STS operations and (2) comply with notification requirements. Also, with effect from that date,effective January 1, 2011, Annex I has beenwas amended to clarify the long standinglong-standing requirements for on board management of oil residue (sludge). and, effective August 1, 2011, the use or carriage of certain heavy oils has been banned in the Antarctic area.
In September 1997, the IMO adopted Annex VI to MARPOL to address air pollution from ships. Annex VI came into force onin May 19, 2005. It sets limits on sulfur oxide and nitrogen oxide emissions from ship exhausts and prohibits deliberate emissions of ozone depleting substances, such as chlorofluorocarbons. Annex VI also includes a global cap on the sulfur content of fuel oil and allows for special areas to be established with more stringent controls on sulfur emissions. Annex VI has been ratified by some, but not all IMO member states. All vessels subject to Annex VI and built after May 19, 2005 must carry an International Air Pollution Prevention Certificate evidencing compliance with Annex VI. Implementing the requirements of Annex VI may require modifications to vessel engines or the addition of post combustion emission controls, or both, as well as the use of lower sulfur fuels. In October 2008, the Marine Environment Protection Committee (MEPC),(“MEPC”) of the IMO approved proposedadopted amendments to Annex VI regarding particulate matter, nitrogen oxide and sulfur oxide emissions standards. These amendments, which entered into force in July 2010. They2010, seek to reduce air pollution from vessels by establishing a series of progressive standards to further limit the sulfur content in fuel oil, which would be phased in by 2020, and by establishing new tiers of nitrogen oxide emission standards for new marine diesel engines, depending on their date of installation. Additionally, more stringent emission standards could apply in coastal areas designated as Emission Control Areas (“ECAs”).Areas. The United States ratified the amendments in October 2008. In November 2010July 2011 the IMO proposedadopted amendments to Annex VI to makefurther reduce emissions from shipping by imposing mandatory technical and operational measures foron new shipsvessels of 400 gross tons or more. These requirements are expected to further reduce emissions from shipping; such amendments will be considered for adoption in July 2011. Meanwhile, weenter force on January 1, 2013. We have obtained International Air Pollution Prevention certificatesCertificates for all of our vessels and believe that maintaining compliance with Annex VI will not have an adverse financial impact on the operation of our vessels.
In 2001, the IMO adopted the International Convention on the Control of Harmful Anti-fouling Systems on Ships (the “Anti-fouling Convention”) which prohibits the use of organotin compound coatings to prevent the attachment of mollusks and other sea life to the hulls of vessels. The Anti-fouling Convention came into force on
in September 17, 2008 and applies to vessels constructed prior to January 1, 2003 that have not been in dry-dock since that date. By January 1, 2008, the effective date ofUnder the Anti-fouling Convention, exteriors of vessels must be either be free of the prohibited compounds, or have had coatings applied that act as a barrier to the leaching of the prohibited compounds must be applied to the vessel exterior.organotin compounds. Vessels of over 400 gross tons engaged in international voyages must obtain an International Anti-fouling System Certificate and must undergo a survey before the vessel is put into service or when the anti-fouling systems are altered or replaced. We have obtained Anti-Fouling System Certificates for all of our vessels that are subject to the Anti-Fouling Convention and do not believe that maintaining such certificates will have an adverse financial impact on the operation of our vessels.
In addition, theThe Company’s LNGliquefied natural gas (“LNG”) carrier meetsis subject to IMO requirements for liquefied gas carriers.such vessels. In order to operate in the navigable waters of the IMO’s member states, liquefied gas carriers must have an IMO Certificate of Fitness demonstrating compliance with construction codes for liquefied gas carriers. These codes, and similar regulations in individual member states, address fire and explosion risks posed by the transport of liquefied gases. Collectively, these standards and regulations impose detailed requirements relating to the design and arrangement of cargo tanks, vents, and pipes; construction materials and compatibility; cargo pressure; and temperature control. We have obtained an IMO Certificate of Fitness for our LNG carrier.
Liquefied gas carriers are also subject to international conventions that regulate pollution in international waters and a signatory’s territorial waters. Under the IMO regulations, gas carriers that comply with the IMO construction certification requirements are deemed to satisfy the requirements of Annex II of MARPOL applicable to transportation of chemicals at sea, which would otherwise apply to certain liquefied gases. Effective January 1, 2007, the IMO revised theThe Annex II regulations that restrict discharges of “noxious liquid substances” during cleaning or de-ballasting operations. TheEffective January 2007, revisions to the Annex II regulations include significantly lower permitted discharge levels for discharges of noxious liquid substances for vessels constructed on or after the effective date, made possible by improvements in vessel technology.date. These newmore stringent discharge levels apply to the Company’s LNG carrier.
TCM, our technical manager, is ISO 14001 compliant. ISO 14001 requires companies to commit to the prevention of pollution as part of the normal management cycle. Additional or new conventions, laws and regulations may be adopted that could adversely affect our ability to manage our ships.
In addition, the European Union and countries elsewhere have considered stricter technical and operational requirements for tankers and legislation that would affect the liability of tanker owners and operators for oil pollution. In December 2001, the European Union adopted a legislative resolution confirming an accelerated phase-out schedule for single hull tankers in line with the schedule adopted by the IMO in April 2001. Any additional laws and regulations that are adopted could limit our ability to do business or increase our costs. The results of these or potential future environmental regulations could have a material adverse affect on our operations.
Under the current regulations, the vessels of our existing fleet will be able to operate for substantially all of their respective economic lives. However, compliance with the new regulations regarding inspections of all vessels may adversely affect our operations. We cannot at the present time evaluate the likelihood or magnitude of any such adverse effect on our operations due to uncertainty of interpretation of the IMO regulations.
The operation of our vessels is also affected by the requirements set forth in the IMO’s International Management Code for the Safe Operation of Ships and for Pollution Prevention (“ISM Code”) which came into effect in relation to oil tankers in July 1998.1998 and which was further amended on July 1, 2010. The ISM Code requires shipowners, ship managers and bareboat (or demise) charterers to develop and maintain an extensive “safety management system” that includes the adoption of a safety and environmental protection policy setting forth instructions and procedures for safe operation and describing procedures for dealing with emergencies. The failure of a shipowner,ship owner, ship manager or bareboat charterer to comply with the ISM Code may subject that party to increased liability, may decrease available insurance coverage for the affected vessels and mayor result in a denial of access to, or detention in, some ports. All of our vessels are ISM Code certified. Tsakos Columbia Shipmanagement S.A. or TCM, our technical manager, is ISO 14001 compliant. ISO 14001 requires companies to commit to the prevention of pollution as part of the normal management cycle.
Environmental RegulationWe believe that under the current IMO regulations, the vessels of our existing fleet will be able to operate for substantially all of their respective economic lives. However, additional or new conventions, laws and regulations may be adopted that could adversely affect our ability to manage our ships, increase our costs, or have a material adverse effect on our operations.
OPA 90. The U.S. Oil Pollution Act of 1990 (“OPA 90”) established an extensive regulatory and liability regime for the protection and cleanup of the environment from oil spills. OPA 90 affects all owners and operators whose vessels trade to the United States or its territories or possessions or whose vessels operate in United States waters, which include the United States’ territorial sea and its two hundred nautical mile exclusive economic zone.
Under OPA 90, vessel owners, operators and bareboat charterers are “responsible parties” and are jointly, severally and strictly liable (unless the spill results solely from the act or omission of a third party not acting pursuant to a contractual relationship with a responsible party, an act of God or an act of war) for all containment and clean-up costs and other damages arising from discharges or threatened discharges of oil from their vessels. Tsakos Shipping and Tsakos Energy Management would not qualify as “third parties” because they perform under contracts with us. These other damages are defined broadly to include (1) natural resources damages and the costs of assessing them, (2) real and personal property damages, (3) net loss of taxes, royalties, rents, fees and other lost revenues, (4) lost profits or impairment of earning capacity due to property or natural resources damage, (5) net cost of public services necessitated by a spill response, such as protection from fire, safety or health hazards, and (6) loss of subsistence use of natural resources. OPA 90 incorporates limits on the liability of responsible parties for a spill. EffectiveSince July 31, 2009, the limits on liability forin respect of a double-hulled tanker over 3,000 gross tons ishas been limited to the greater of $2,000 per gross ton or $17,088,000 (subject to periodic adjustment)adjustment by the United States Coast Guard). These limits onof liability would not apply if the incident was proximately caused by violation of applicable United States federal safety, construction or operating regulations, or by the responsible party (or its agents or employees or any person acting pursuant to a contractual relationship with the responsible party) or by gross negligence or willful misconduct, or if the responsible party fails or refuses to report the incident or to cooperate and assist in connection with the oil removal activities. The U.S. Congress is considering legislation to increase the limits of OPA liability for all vessels in response to the 2010 oil spill in the Gulf of Mexico resulting from the explosion of theDeepwater Horizon drilling rig. We continue to maintain, for each of our vessels, pollution liability coverage in the amount of $1 billion per incident. A catastrophic spill could exceed the insurance coverage available, in which case there could be a material adverse effect on us.
Under OPA 90, with some limited exceptions, all newly built or converted tankers operating in United States waters must be built with double-hulls, and existing vessels which do not comply with the double-hull requirement must be phased out by 2015. Currently, all of our fleet is of double-hull construction.
OPA 90 requires owners and operators of vessels to establish and maintain with the United States Coast Guard evidence of financial responsibility sufficient to meet their potential liabilities under OPA 90. In October 2008 the Coast Guard adopted amendments to the financial responsibility regulations to require – with effect from January 15, 2009 – evidence of financial responsibility in an amount equal to or greater than the limitations on liability adjusted from time to time. Under theOPA 90 regulations, evidence of financial responsibility may be demonstrated by insurance, surety bond, letter of credit, self-insurance, guaranty or other satisfactory evidence. Under the self-insurance provisions, the ship owner or operator must have a net worth and working capital, measured in assets located in the United States against liabilities located anywhere in the world, that exceeds the applicable amount of financial responsibility. OPA 90 requires an owner or operator of a fleet of tankers only to demonstrate evidence of financial responsibility in an amount sufficient to cover the tanker in the fleet having the greatest maximum liability under OPA 90. We have provided evidence of financial responsibility to the Coast Guard and obtained a certificate of financial responsibilitymaintain, for each of our vessels, that is subject topollution liability coverage in the financial responsibility requirements.amount of $1 billion per incident. A catastrophic spill could exceed the insurance coverage available, in which case there could be a material adverse effect on us.
The Coast Guard’s regulations concerning certificates of financial responsibility provide, in accordance with OPA 90, that claimants may bring suit directly against an insurer or guarantor that furnishes certificates of financial responsibility. If an insurer or guarantor is sued directly, it is prohibited from asserting any contractual defense that it may have had against the responsible party and is limited to asserting those defenses available to the responsible party and the defense that the incident was caused by the willful misconduct of the responsible party. Some organizations, including the major protection and indemnity organizations, which had typically provided certificates of financial responsibility under pre-OPA 90 laws, including the major protection and indemnity organizations, have declined to furnish evidence of insurance for vessel owners and operators if they have beenare subject to direct actions or required to waive insurance policy defenses.
OPA 90 specifically permits individual U.S. coastal states to impose their own liability regimes with regard to oil pollution incidents occurring within their boundaries, and some states have enacted legislation providing for unlimited liability for oil spills.
Owners or operators of tankers operating in United States waters are required to file vessel response plans with the Coast Guard, and their tankers are required to operate in compliance with their Coast Guard approved plans. These response plans must, among other things, (1) address a “worst case” scenario and identify and ensure, through contract or other approved means, the availability of necessary private response resources to respond to a “worst case discharge,” (2) describe crew training and drills, and (3) identify a qualified individual with full authority to implement removal actions.
We have approved vessel response plans and complycomplied with all applicable Coast Guard and state regulations for allin the ports where our vessels operating in U.S. waters.
Environmental Regulation
U.S. Clean Water Act:Act: The U.S. Clean Water Act of 1972 (“CWA”) prohibits the discharge of oil or hazardous substances in navigable waters and imposes strict liability in the form of penalties for any unauthorized discharges. The CWA also imposes substantial liability for the costs of removal, remediation and damages and complements the remedies available under OPA 90. TheUnder U.S. Environmental Protection Agency or EPA, has enacted rules regulating ballast water discharges and other discharges incidental to the normal operation of vessels within U.S. waters. Under these rules, commercial vessels 79 feet in length or longer (other than commercial fishing vessels), or Regulated Vessels,(“EPA”) regulations we are required to obtain a CWA permit regulatingto discharge ballast water and authorizing such discharges.other wastewaters incidental to the normal operation of our vessels if we operate within the three mile territorial waters or inland waters of the United States. This permit, which the EPA has designated as the Vessel General Permit for Discharges Incidental to the Normal Operation of Vessels, or VGP, incorporates the current U.S. Coast Guard requirements for ballast water management, as well as supplemental ballast water requirements, and includes limitsrequirements applicable to 26 specific discharge streams. Regulated Vessels delivered after September 19 2009 cannot operate in United States waters unless they are covered by the VGP. To be covered by the VGP, a vessel owner must submit a Notice of Intent, or NOI, at least 30 days before the vessel operates in United States waters. Any Regulated Vessel that is not covered by a VGP cannot discharge into United States waters. Owners and operators of vessels visiting United States waters will be required to comply with this VGP program or face penalties. Compliance with the VGP could require the installation of equipment on our vessels to treat ballast water before it is discharged or the implementation of other port facility disposal arrangements or procedures at potentially substantial cost, and/or otherwise restrict our vessels from entering United States waters. In addition, the CWA requires each state to certify federal discharge permitsstreams, such as the VGP. Certain states have enacted more stringent discharge standards as conditions to their certification of the VGP. Earlier this year, thedeck runoff, bilge water and gray water. The U.S. Coast Guard and the EPA publishedhave entered into a memorandum of understanding which provides for collaboration on the enforcement of the VGP requirements andrequirements. As a result, it is expected that the U.S. Coast Guard will include the VGP as part of its normal Port State Control inspections. As part ofThe EPA has proposed a settlement of a lawsuit challengingnew draft VGP to replace the existing VGP when it expires in December 2013. We have obtained coverage under the VGP EPA has recently agreed to propose a new VGP with numerical restrictions on organisms in ballast water discharges by November 2011. We intend to comply withfor all of our vessels operating within the VGPterritorial waters of the United States, and the record keeping requirements andwe do not believe that the costs associated with obtaining and complying with the obligations of the VGP will have a material impact on our operations. We have submitted NOIs for each Regulated Vessel in our fleet.
TheU.S. Clean Air Act: The U.S. Clean Air Act (“CAA”) requires the EPA to promulgate standards applicable to emissions of volatile organic compounds and other air contaminants. Our vessels are subject to CAA vapor control and recovery standards for cleaning fuel tanks and conducting other operations in regulated port areas and emissions standards for so-called “Category 3” marine diesel engines operating in U.S. waters. The marine diesel engine emission standards are currently limited to new engines beginning with the 2004 model year. Effective June 29,On April 30, 2010 the EPA adopted final emission standards for Category 3 marine diesel engines equivalent to those adopted in the amendments to Annex VI to MARPOL. As a result, the most stringent engine emissions and marine fuel sulfur requirements of Annex VI will apply to all vessels regardless of flag entering U.S. ports or operating in U.S. waters.waters, regardless of flag. The emission standards apply in two stages: near-term standards for newly-built engines, which have applied since the beginning of 2011, and long-term standards requiring an 80% reduction in nitrogen dioxides (NOx), which will apply from 2016. Compliance with these standards may cause us to incurresult in additional incurred costs to install control equipment on our vessels.
The IMO has designated the waters extending 200 nautical miles from the coasts ofIn March 2009, the United States and Canada requested the French territoriesIMO to designate specific areas of St. Pierre and Miquelon, andtheir respective coastal waters (extending to 200 nautical miles offshore) as Emission Control Areas (“ECA”) under the eight main Hawaiian IslandsAnnex VI amendments. On March 26, 2010 the IMO designated the waters off North American coasts as an ECA, meaning that vessels entering the designated ECA will need tomust use compliant fuel whilewhen operating in the area. The North American ECA will be enforceable from August 1, 2012, whereupon fuel used by all vessels operating in the ECA will not be permitted tocannot exceed a 1.0% sulfur content, dropping to a 0.1% sulfur content in 2015. From 2016 NOx after-treatment requirements will also apply. In July 2011 the IMO established the U. S. Caribbean ECA in the waters of Puerto Rico and the U.S. Virgin Islands. The new ECA will become enforceable on January 1, 2014. California has already implemented awill require vessels operating within 24 nautical mile ECA zone within which fuel must havemiles of its coast to use marine gas oil with a sulfur content of 1.0% of less.or less, effective August 1, 2012. It is expected that the CalifornianCalifornia fuel content regulations will be phased out in favor of the requirements of the North American ECA once thisit is in force. Compliance with the North American ECA, as well as the possibility ofany more stringent emissions requirements fromfor marine diesel engines or port operations by vessels adopted by the EPA or by the states where we operate, could entail significant capital expenditures or otherwise increase the costs of our operations.
European Union Initiatives: In December 2001, in response to the oil tanker Erika1999 oil spill of December 1999,from the tankerErika, the European Union adopted a legislative resolution confirming an accelerated phase-out schedule for single-hull tankers in line with the schedule adopted by the IMO in April 2001. Since 2010 (1) all single hull tankers have been banned from entering European Union ports or offshore terminals; (2) all single hull tankers carrying heavy grades of oil have been banned from entering or leaving European Union ports or offshore terminals or anchoring in
areas under its jurisdiction; and (3) since 2005 a Condition Assessment Scheme Survey for single-hull tankers older than 15 years of age has been imposed. In September 2005 the European Union adopted legislation to incorporate international standards for ship-source pollution into European Community law and to establish penalties for discharge of polluting substances from ships (irrespective
(irrespective of flag). Since April 1, 2007 Member States of the European Union have had to ensure that illegal discharges of polluting substances, participation in and incitement to carry out such discharges are penalized as criminal offences and that sanctions can be applied against any person, including the master, owner and/or operator of the polluting ship, found to have caused or contributed to ship-source pollution “with intent, recklessly or with serious negligence” (this is a lower threshold for liability than that applied by MARPOL, upon which the ship-source pollution legislation is partly based). In the most serious cases, infringements will be regarded as criminal offences (where sanctions include imprisonment) and will carry fines of up to Euro 1.5 million. On November 23, 2005 the European Commission published its Third Maritime Safety Package, commonly referred to as the Erika III proposals, and two bills (dealing with the obligation of Member States to exchange information among themselves and to check that vessels comply with international rules, and with the allocation of responsibility in the case of accident) were adopted in March 2007. The Treaty of Lisbon entered into force on December 1, 2009 following ratification by all 27 European Union member states and identifies protection and improvement of the environment as an explicit objective of the European Union. The European Union adopted its Charter of Fundamental Rights at the same time, declaring high levels of environmental protection as a fundamental right of European Union citizens. Additionally, the 2002 sinking of thePrestige has led to the adoption of other environmental regulations by certain European Union Member States. It is impossible to predict what legislation or additional regulations, if any, may be promulgated by the European Union or any other country or authority.
The EU has ECAs in place in the Baltic Sea and the North Sea and /EnglishEnglish Channel within which use of fuel with a sulfur content in excess of 1.5% is not permitted. Operators must comply with the stricter limit of 1.0% imposed by revised MARPOL Annex VI, and the European Union is now in the process of aligning its limits with MARPOL. In addition, the EU SulfurSulphur directive provides thethat from January 1, 2010 inland waterway vessels and ships that berth in EU ports have been banned form usingcannot use marine fuels with a sulfur content exceeding 0.1% myby mass. The prohibition applies to use in all equipment, including main and auxiliary engines and boilers. Some EU Member States also require vessels to record the times of any fuel-changeover operations in the ship’s logbook.
Other Environmental Initiatives:Initiatives: Many countries have ratified and follow the liability scheme adopted by the IMO and set out in the International Convention on Civil Liability for Oil Pollution Damage, 1969, as amended (“CLC”), and the International Convention on the Establishment of an International Fund for Compensation for Oil Pollution Damage of 1971, as amended (“Fund Convention”). The United States is not a party to these conventions. Under these conventions, a vessel’s registered owner is strictly liable for pollution damage caused onin the territorial waters of a contracting state by discharge of persistent oil, subject to certain complete defenses. The liability regime was increased (in limit and scope) in 1992 by the adoption of Protocols to the CLC and Fund Convention which became effective in 1996. The Fund Convention was terminated in 2002 and the Supplementary Fund Protocol entered into force in March 2005. The liability limit in the countries that have ratified the 1992 CLC Protocol is tied to a unit of account which varies according to a basket of currencies. Under an amendment to the Protocol that became effective on November 1, 2003, for vessels of 5,000 to 140,000 gross tons, liability is limited to approximately $7.13$6.99 million plus $998$977 for each additional gross ton over 5,000. For vessels of over 140,000 gross tons, liability is limited to approximately $141.93$139.1 million. As the Convention calculates liability in terms of IMF Special Drawing Rights, these figures are based on currency exchange rates on April 1, 2011.March 30, 2012. From May 1998, parties to the 1992 CLC Protocol ceased to be parties to the CLC due to a mechanism established in the 1992 Protocol for compulsory denunciation of the “old” regime; however, the two regimes will co-exist until the 1992 Protocol has been ratified by all original parties to the CLC. The right to limit liability is forfeited under the CLC where the spill is caused by the owner’s actual fault and under the 1992 Protocol where the spill is caused by the owner’s intentional or reckless conduct. The 1992 Protocol channels more of the liability to the owner by exempting other groups from this exposure. Vessels trading to states that are parties to these conventions must provide evidence of insurance covering the liability of the owner. In jurisdictions where the CLC has not been adopted, various legislative schemes or common law govern, and liability is imposed either on the basis of fault or in a manner similar to that convention. We believe that our protection and indemnity insurance will cover the liability under the plan adopted by IMO.
The U.S. National Invasive Species Act (“NISA”) was enacted in 1996 in response to growing reports of harmful organisms being released into U.S. ports through ballast water taken on by ships in foreign ports. In July 2004,Under
NISA, the U.S. Coast Guard adopted regulations under NISAin July 2004 establishing a national mandatory ballast water management program for all vessels equipped with ballast water tanks that enter or operate in U.S. waters. These
regulations require vessels to maintain a specific ballast water management plan. The requirements can be met by performing mid-ocean ballast exchange, by retaining ballast water on board the ship, or by using environmentally sound alternative ballast water management methods approved by the U.S. Coast Guard. However, mid-ocean ballast exchange is mandatory for ships heading to the Great Lakes or Hudson Bay, or vessels engaged in the foreign export of Alaskan North Slope crude oil.). Mid-ocean ballast exchange is the primary method for compliance with the Coast Guard regulations, since holdingregulations. On March 23, 2012, the Coast Guard adopted ballast water can prevent ships from performing cargo operations upon arrivaldischarge standards, which set maximum acceptable limits for living organisms in the U.S., and alternative methods are still under development. Vessels that are unable to conduct mid-ocean ballast exchange due to voyage or safety concerns may discharge minimum amounts of ballast water (in areas other than the Great Lakesdischarge and the Hudson River), provided that they comply with record keeping requirements and document the reasons they could not follow the requiredestablished standards for ballast water management requirements. On August 28, 2009systems. The regulations will take effect on June 21, 2012, and will be phased in depending on a vessel’s ballast water tank size and its next drydocking date. The requirements of the U.S. Coast Guard regulations are consistent with those in EPA’s proposed amendments to its ballast management regulations that, if approved, will impose standards on ballast water discharged in U.S. waters. The final rules are expected to be published in April 2011.VGP. In the absence of federal standards, some states have enacted legislation or regulations to address invasive species through ballast water and hull cleaning management and permitting requirements. These requirementsWe could increaseincur additional costs to comply with the costs of operating innew Coast Guard regulations, the proposed VGP, or additional state waters.ballast water management regulations.
At the international level, the IMO adopted an International Convention for the Control and Management of Ships’ Ballast Water and Sediments in February 2004 (the “BWM Convention”). The Convention’s implementing regulations call for a phased introduction of mandatory ballast water exchange requirements, to be replaced in time with mandatory concentration limits. The BWM Convention will not enter into force until 12 months after it has been adopted by 30 states, the combined merchant fleets of which represent not less than 35% of the gross tonnage of the world’s merchant shipping. As of February 28, 201129, 2012, the BWM Convention has not been adopted by 27a sufficient number of states representing 25.32% of world tonnage. Nonetheless, in March 2010with sufficient tonnage to enter into force. However, the MEPC passed a resolution in March 2010 calling uponon those countries that hadhave already ratified the conventionBWM Convention to encourage the installation of ballast water management systems.
If mid-ocean ballast exchange is made mandatory throughout the United States or at the international level, or if ballast water treatment requirements or options are instituted, the cost of compliance could increase for ocean carriers. Although we do not believe that the costs of compliance with a mandatory mid-ocean ballast exchange would be material, it is difficult to predict the overall impact of such a requirement on our operations.
Although the Kyoto Protocol to the United Nations Framework Convention on Climate Change requires adopting countries to implement national programs to reduce emissions of greenhouse gases, emissions of greenhouse gases from international shipping are not subject to the protocol.Kyoto Protocol. No new treaty was adopted at the United Nations’ climate change conference in Cancun in December 2010. However, agreements were signed extending the deadline to decide on whether or not to extend the validity of the Kyoto Protocol, and requiring developed countries to raise the level of their emission reductions whilst helping poordeveloping countries to do the same. ThereWe believe there is pressure to include greenhouse gas emissions from shipping in any new treaty. In July 2011 MEPC adopted two new sets of mandatory requirements addressing greenhouse gas emissions from shipping. The Energy Efficiency Design Index establishes minimum energy efficiency levels per capacity mile and will apply to new vessels. Currently operating vessels must develop Ship Energy Efficiency Plans. These requirements will enter into force in January 2013 and could cause us to incur additional compliance costs. The IMO is also considering the development of market-based mechanisms for limiting greenhouse gas emissions from ships, but it is impossible to predict with certainty the likelihood of adoption of such a standard or its potential impact on our operations. The European Union intends to expand its emissions trading scheme to emissions of greenhouse gases from vessels, and IMO’s MEPC is developing technical and operational measures to limit emissions of greenhouse gases from international shipping, including market-based mechanisms and energy efficiency standards.vessels. In the United States, the EPA has issued a finding that greenhouse gasesgas emissions endanger the public health and safety and has adopted regulations relating to the control of greenhouse gases fromgas emissions standards for certain mobile sources and certain large stationary sources. Although the EPA findings and regulationsmobile source emissions do not extendapply to vessels and vessel engines,greenhouse gas emissions from ships, the EPA is separately considering a petition from the California Attorney General and a coalition of environmental groups to regulate greenhouse gas emissions from ocean-going vessels under the CAA.vessels. The IMO, the EU or individual countries in which we operate could pass climate control legislation or implement other regulatory initiatives to control greenhouse gas emissions from vessels that could require us to limit our operations or make significant financial expenditures that we cannot predict with certainty at this time.
Trading Restrictions:The Company is aware of the restrictions applicable to it on trading with Cuba, Iran, Sudan and Syria and it has complied with those restrictions and intends to continue to so comply in all respects. The Company has not, nor does it intend to, directly provide any goods, fees or otherwise limit our operations.services to the referenced countries and has had no contacts with governmental entities in these countries nor does it intend to have any in the future. Its vessels are not chartered to any Cuban, Iranian, Sudanese or Syrian companies. More recent charterer-party agreements relating to the Company’s vessels now preclude Iran from the vessels’ trading unless agreed between owner and charterer after taking into account all relevant sanctions legislation. Between January 1, 2011 and March 31, 2012, the Company’s vessels made nearly 2,500 port calls around the world, of which only six involved visits, under charterers’ instructions, to these countries ( a quarter of 1% of total calls). One call was to Iran in February 2011, three to Syria between January and April 2011, and two to Sudan between July and September 2011. There were no calls to Cuba. None of the vessels the Company owns or operates or charters have provided, or are anticipated to provide, any U.S.-origin goods to these countries, or involve employees who are U.S. nationals in operations associated with these countries. The Company has no relationships with governmental entities in those countries, nor does it charter its vessels to companies based in those countries. The Company derives its revenue directly from the charterers.
Classification and inspection
Our vessels have been certified as being “in class” by their respective classification societies: Bureau Veritas, Det Norske Veritas, American Bureau of Shipping, Korean Register, Lloyd’s Register of Shipping or Nippon Kaiji Kyokai. Every vessel’s hull and machinery is “classed” by a classification society authorized by its country of registry. The classification society certifies that the vessel has been built and maintained in accordance with the rules of such classification society and complies with applicable rules and regulations of the country of registry of the vessel and the international conventions of which that country is a member. Each vessel is inspected by a surveyor of the classification society every year, an annual survey, every two to three years, an intermediate survey, and every
four to five years, a special survey. Vessels also may be required, as part of the intermediate survey process, to be dry-docked every 24 to 30 months for inspection of the underwater parts of the vessel and for necessary repair related to such inspection.
In addition to the classification inspections, many of our customers, including the major oil companies, regularly inspect our vessels as a precondition to chartering voyages on these vessels. We believe that our well-maintained, high quality tonnage should provide us with a competitive advantage in the current environment of increasing regulation and customer emphasis on quality of service.
TCM, our technical manager, has a document of compliance with the ISO 9000 standards of total quality management. ISO 9000 is a series of international standards for quality systems that includes ISO 9002, the standard most commonly used in the shipping industry. Our technical manager has also completed the implementation of the ISM Code. Our technical manager has obtained documents of compliance for our offices and safety management certificates for our vessels, as required by the IMO. Our technical manager has also received ISO 14001 certification.
Risk of loss and insurance
The operation of any ocean-going vessel carries an inherent risk of catastrophic marine disasters and property losses, including:
collision;
adverse weather conditions;
fire and explosion;
mechanical failures;
negligence;
war;
terrorism; and
piracy.
In addition, the transportation of crude oil is subject to the risk of crude oil spills, and business interruptions due to political circumstances in foreign countries, hostilities, labor strikes, and boycotts. Tsakos Shipping arranges insurance coverage to protect against most risks involved in the conduct of our business and we maintain environmental damage and pollution insurance coverage. Tsakos Shipping arranges insurance covering the loss of revenue resulting from vessel off-hire time. We believe that our current insurance coverage is adequate to protect against most of the risks involved in the conduct of our business. The terrorist attacks in the United States and various locations abroad and international hostilities have lead to increases in our insurance premium rates and the implementation of special “war risk” premiums for certain trading routes. See “Item 5. Operating and Financial Review and Prospects” for a description of how our insurance rates have been affected by recent events.
We have hull and machinery insurance, increased value (total loss or constructive total loss) insurance and loss of hire insurance with Argosy Insurance Company. Each of our ship owning subsidiaries is a named insured under our insurance policies with Argosy. Argosy provides the same full coverage as provided through London and Norwegian underwriters and reinsures its exposure, subject to customary deductibles, in the London, French, Norwegian and U.S. reinsurance markets. We were charged by Argosy aggregate premiums of $10.3$9.9 million in 2009.2011. By placing our insurance through Argosy, we believe that we achieve cost savings over the premiums we would otherwise pay to third party insurers. Argosy reinsures most insurance it underwrites for us with various reinsurers. These reinsurers have a minimum credit ratings ranging from BBB to AA.rating of A.
Our subsidiaries are indemnified for legal liabilities incurred while operating our vessels by protection and indemnity insurance that we maintain through their membership in a P&I club. This protection and indemnity insurance covers legal liabilities and other related expenses of injury or death of crew members and other third parties, loss or damage to cargo, claims arising from collisions with other vessels, damage to other third party property and pollution arising from oil or other substances, including wreck removal. The object of P&I clubs is to provide mutual insurance against liability to third parties incurred by P&I club members in connection with the
operation of their vessels “entered into” the P&I club in accordance with and subject to the rules of the P&I club and the individual member’s terms of participation. A member’s individual P&I club premium is typically based on the aggregate tonnage of the member’s vessels entered into the P&I club according to the risks of insuring the vessels as determined by the P&I club. P&I club claims are paid from the aggregate premiums paid by all members, although members remain subject to “calls” for additional funds if the aggregate insurance claims made exceed aggregate member premiums collected. P&I clubs enter into reinsurance agreements with other P&I clubs and with third party underwriters as a method of preventing large losses in any year from being assessed directly against members of the P&I club. As of March 31, 2011,2012, applicable P&I club rules provide each of its members with more than $4 billion of liability coverage except for pollution coverage which is limited to $1 billion.
Recent worldWorld events have in the past led to increases in our insurance premium rates and the implementation of special “war risk” premiums for certain trading routes. For 2009-2010,Although for 2011-2012, our P&I club insurance premiums increased by between 6% and 11%was renewed at an almost 2% reduction, it was renewed for most of our vessels.2012-2013 at an almost 2% increase. Our hull and machinery insurance premiums also increaseddecreased on average by almost 2% for 2011-12. During 2011, there were huge global catastrophe losses, including the earthquakes of New Zealand and Japan, tornadoes in most cases upthe U.S., cyclones in Australia and floods in Thailand. However, although the resulting losses will eventually have to 23%. We have been advisedbe paid for, it is expected that hull & machinery renewals for 2010-2011 our P&I club insurance premiums2012-2013 will remain at approximately the same level as the previous year, and our hull and machinery insurance premiums are also expected to remain at the same level mainlyagain be modest, partly due to reduced vessel values. “War risk” coverage for vessels operating in certain geographical areas has increased, but this type of coverage represents a relatively small portion of our total insurance premiums. P&I, hull and machinery and
war risk insurance premiums are accounted for as part of operation expenses in our financial statements. Accordingly, any change in insurance premium rates directly impacts our operating results.
Competition
We operate in markets that are highly competitive and where no owner controlled more than 5% of the world tanker fleet as of March 31, 2011.2012. Ownership of tankers is divided among independent tanker owners and national and independent oil companies. Many oil companies and other oil trading companies, the principal charterers of our fleet, also operate their own vessels and transport oil for themselves and third party charterers in direct competition with independent owners and operators. We compete for charters based on price, vessel location, size, age, condition and acceptability of the vessel, as well as Tsakos Shipping’s reputation as a manager. Currently we compete primarily with owners of tankers in the ULCCs, VLCCs, suezmax, aframax, panamax, handymax and handysize class sizes, and we also compete with owners of LNG carriers.
Although we do not actively trade to a significant extent in Middle East trade routes, disruptions in those routes as a result of international hostilities, including those in Afghanistan and Iraq, economic sanctions, including those with respect to Iran, and terrorist attacks such as those made against the United States in September 2001 and various international locations since then may affect our business. We may face increased competition if tanker companies that trade in Middle East trade routes seek to employ their vessels in other trade routes in which we actively trade.
Other significant operators of multiple aframax and suezmax tankers in the Atlantic basin that compete with us include Overseas Shipholding Group Inc., Teekay Shipping Corporation and General Maritime Corporation. There are also numerous smaller tanker operators in the Atlantic basin.
Employees
We have no salaried employees. See “—Management Contract—Crewing and Employees.”
Properties
We operate out of Tsakos Energy Management offices in the building also occupied by Tsakos Shipping at Megaron Makedonia, 367 Syngrou Avenue, Athens, Greece.
Legal proceedings
We are involved in litigation from time to time in the ordinary course of business. In our opinion, the litigation in which we were involved as of March 31, 2011,2012, individually and in the aggregate, was not material to us.
| Item 4A. | Unresolved Staff Comments |
None.
| Item 5. | Operating and Financial Review and Prospects |
General Market Overview—World Oil Demand / Supply and Trade (ICAP)
All of the statistical data and other information presented in this section entitled “General Market Overview—World Oil Demand / Supply and Trade,” including the analysis of the various sectors of the oil tanker industry, has been provided by ICAP Shipping (“ICAP”). ICAP has advised that the statistical data and other information contained herein are drawn from its database and other sources. In connection therewith,
ICAP has advised that: (a) certain information in ICAP’s database is derived from estimates or subjective judgments; (b) the information in the databases of other maritime data collection agencies may differ from the information in ICAP’s database; and (c) while ICAP has taken reasonable care in the compilation of the statistical and other information and believes it to be accurate and correct, data compilation is subject to limited audit and validation procedures.
In comparison toFollowing years of tracking one another, 2011 was the previous two years,year the world’s major crude oil prices were relatively stable for most of 2010, with NYMEXbenchmarks parted company. WTI front month futures prices trading withinhas historically traded at a range of $68-$92/barrel andslight premium to Brent front month futures remaining within a range of $69-$95/barrel. OPEC pronounced that it was content with these price levels and therefore the group maintainedrepresenting its crude oil production levels within a relatively narrow band ranging from 28.9 million bpd to 29.6 million bpd. Average production levels were, superior quality—however some 0.52 million bpd higher than those seen in 2009. Towardsby the end of 2010 the former was trading at a discount of over $3/barrel. By early September 2011 this discount had increased to over $28/barrel. The change was brought about by a number of factors, including disruptions to North Sea production and the loss of Libyan output applying upward pressure on Brent prices, but the downward pressure of WTI was the main contributing factor as rising Canadian and North Dakotan oil production began to swell the tanks of the storage hub at Cushing, Oklahoma, combined with weak domestic demand. With few export options from the landlocked delivery point for NYMEX WTI futures contracts, prices came under pressure relative to the supply-constrained Brent and Brent-priced crudes. By year-end the discount had dropped to around $8/barrel following resurgent production from Libya and the news of the Seaway pipeline reversal, which will enable 150,000 bpd of crude to flow north-south from June 2012, having previously fed the Midwest refineries with crude from the US Gulf. However the forward market believes the historical relationship is some way from returning, with WTI continuing to trade at a discount to Brent out to 2016.
Despite supply disruptions arising from the Arab Spring, prices remained relatively stable throughout the year, with Brent trading between $93/barrel and $126/barrel, which tightened to between $100/barrel and $120/barrel following the initial shock from the Libyan uprising. WTI saw a wider range, with highs following Libya at $114/barrel and lows coinciding with the record discount to Brent at $75/barrel.
Following a continued weak global economic outlook as well as supply disruptions, OPEC played its part in trying to keep the early partmarket well supplied, helping to prevent oil prices from increasing during an economically sensitive time. Lost Libyan barrels (1.6m bpd of production with exports of 1.2m bpd before the uprising) were promptly replaced by Saudi Arabia, which increased production to above 10m bpd by some estimates towards the end of 2011, the group startedhighest in 30 years. Even as Libyan production returned (with recent suggestions implying the full 1.6m bpd levels will be online in the second half of 2012) Saudi Arabian production remained high, citing strong demand from Asian buyers and that the country is happy to continue to pump at similar levels if demand is there. OPEC then made its first formal change to its oil quota since slashing output in December 2008 in the wake of the global financial crisis, setting a new target of 30m bpd (including Iraq), an increase its productionfrom 24.845m bpd (excluding Iraq, which produced an average of 2.67m bpd in response to rising oil prices, which breached the $100/barrel mark2011). The new target has no country-specific quotas, and is based on a slight reduction from actual output at the end of January, and also in response to the strong rebound in demand that had now become evident. Preliminary figures for January 2011 showed that OPEC crude oil output was some 0.90 million bpd higher than in January 2010. In early March 2011, disruption of Libyan crude oil exports meant that trade patterns seemed likely to shift somewhat with increased production from Arabian Gulf countries compensating for the lost volumes from Libya. This was also expected to increase demand for Suezmax tankers to transport grades of crude oil similar to the missing Libyan production, from West Africa to Europe.2011.
According to the International Energy Agency (IEA), world oil supply averaged 88.45m bpd in 2011, up 1.12m bpd (+1.3%) from 2010. Nearly 90% of the increase came from OPEC, increasing production by 0.99m bpd (+2.8%), with the remaining 130,000 bpd (+0.2%) increase coming from non-OPEC sources. The larger OPEC increase lifted the group’s share of world oil production from 39.8% to 40.4%. OECD stocks fell by 55.7m bbl in 2011 to end the year at 2.61bn bbl, suggesting average effective additional supply of around 150,000 bpd. Stock levels finished 2011 lower than in July 2008 (2.63bn bbl) when oil prices were rising to above $147/bbl—however due to falling OECD demand the forward cover is around 57 days versus 53 days previously, implying stocks were not as low as the headline numbers suggests.
Supply problems have continued into 2012, with Syrian production subject to US and EU sanctions, although exports were negligible at around 150,000 bpd on production of around 380,000 bpd, the latter of which has now been cut to sub-250,000 bpd. Yemeni supply has dropped to almost zero following strikes and political issues, whilst disagreements over transit fees between the recently split Sudan and South Sudan has shut in around 300,000 bpd of production. The North Sea continues to see production problems and Iraq perennially under performs on the increased production the country promises – however increasing export facilities
beginning to come on stream now (five single-point moorings, each capable of loading at 850,000 bpd) should ease the infrastructure constraints. The largest wildcard remains Iran, with the EU passing sanctions against the country in January to begin in July (to allow time for EU buyers to source alternative supplies), only then for Iran to pre-empt the ban by halting exports to some European countries. The EU had previously imported around 500,000 bpd of Iranian production, and with the US applying pressure to Asian buyers, Iran’s export options look set to diminish further as the year goes on. Once again Saudi Arabia has repeatedly said it will make up for a short-fall, and is able to increase production to 11.4-11.8m bpd within a number of days, and reach its full capacity of 12.5m bpd within 90 days. However with Saudi Arabia the only significant holder of spare production capacity, any further production increase leaves global oil supply increasingly vulnerable to a new supply disruption, potentially sending prices upwards and destroying demand. Production gains are expected in 2012 from Brazil, Canada and the US, Angola and Iraq, all of which will be of vital importance if Saudi Arabia does begin to increase production to offset the falling Iranian exports.
The latest (March) Oil Market Report from the IEA estimates global oil demand increased by 2.88 million760,000 bpd in 2010,2011 (+0.9%), a significant slowdown from the largest2010/2009 increase inof 2.75m bpd (+3.2%) as the global economy continued to stall. Non-OECD demand since 2004. The increase in demand in 2010 more than reversed the decline in demand that was witnessed in 2008 and 2009, meaning that oil demand reached a new peak annual average level of 87.9 million bpd. Very large increases were recorded in China where demandestimated to have increased by as much as 1.01 million1.30m bpd and also the United States where demand increased(+3.1%), led by 0.46 million bpd. Demand growth was recorded in every region with the exception of Europe which recorded a further fall in demand of 0.08 million bpd. Among the major crude oil importers, Japan and Korea recorded demand growth of 0.05 and 0.07 million bpd, respectively, while India recorded further demand growth of 0.08 million bpd. Demand in the other developing Asian countries grew by 0.21 million bpd, while demand growth in Latin AmericaChina and the Former Soviet Union, rebounded stronglyincreasing by 440,000 bpd (+4.9%) and 230,000 bpd (+5.2%) respectively. Africa was the only non-OECD region to post a decline, down 50,000 bpd (-1.5%). OECD demand contracted by 530,000 bpd (-1.1%), with each region recordingOECD Europe falling by 310,000 bpd (-2.1%) and OECD North America down by 260,000 bpd (-1.1%)—the loss in the West was tempered by a slight gain of 40,000 bpd (+0.5%) in OECD Pacific. The difference between the initial IEA forecast for 2011 demand growth of 0.28 million bpd. +1.35m bpd back in July 2010 and the latest estimate is a stark reminder of the sensitivity of oil demand to the global economy.
The Middle East recorded similarcurrent estimate for demand growth in demand of 0.27 million bpd, while African demand growth accelerated to 0.05 million bpd.
Apart from the increase in OPEC crude oil production that provided for part of the increase in global demand, there was also2012 is an increase of some 0.49 million820,000 bpd (+0.9%), which itself has been lowered from a forecasted increase of 1.61m bpd made in OPEC natural gas liquidsAugust 2011. OECD demand is set to fall by 390,000 bpd (-0.9%), with 330,000 bpd (-2.3%) expected to be removed from OECD Europe and an120,000 bpd (-0.5%) from OECD North America, whilst OECD Pacific should once again offset a fraction of these declines increasing by 60,000 bpd (+0.8%). China, other Asia (including India) and Africa are set to lead the 1.21m bpd (+2.8%) non-OECD gains, increasing by 370,000 bpd (+3.9%), 250,000 bpd (+2.3%) and 170,000 bpd (+5.1%) respectively. However one important caveat hangs over the current estimate: it assumes global GDP growth of 3.3%, but the IEA warns if this drops to 2.6%, effective oil demand growth would drop to zero.
The weak state of the global economy as well as supply disruptions—both limiting demand growth through uncertainty and higher prices—filtered through to imply a reduced increase in non-OPEC production of some 1.14 million bpd, including a 0.24 million bpd increasetrade volumes in biofuels production. A major year-on-year increase in production was recorded in the United States in spite of the moratorium on drilling new offshore wells. Production rose by 0.36 million bpd assisted by increased shale oil production and by the fact that in spite of the strong hurricane season, the worst effects were felt on the Atlantic coast rather than in the US Gulf. Other large increases in production were recorded in Canada which saw an increase of 0.15 million bpd and2011. In China, where output increased by 0.21 million bpd. Among major non-OPEC oil exporting countries, Russian production increased by 0.24 million bpd, while Brazilian output rose by a further 0.11 million bpd and Columbian production rose by a further 0.12 million bpd.
The very strong resurgence in demand and increased OPEC and non-OPEC production led to a strong rebound in seaborne crude oil trade. Our latest estimates show that seaborne crude oil trade increased by 1.12 million bpd in 2010 or 3.1%. In terms of tonne-miles (international trade x distance traveled) we estimate that the impact was even greater, with an estimated increase of 5.5% as long-haul trade from West Africa, South America and the Arabian Gulf increased.
The largest rise in seaborne crude imports was once again recorded in China, which saw an increase of some 0.65 million bpd. Meanwhile data for the United States show that seaborne crude oil imports were some 0.07 millionup year-on-year, however only by 260,000 bpd higher in 2010 than in 2009. Japanese imports rose by some 0.02 million bpd in 2010. Japan’s imports seem set to rise further in 2011, as additional crude oil is likely to be imported for use in thermal power stations to replace power output(+5.4%), from facilities damaged by the earthquake and tsunami. Preliminary estimates of European seaborne crude imports show a decline of 0.02 million4.8m bpd in 2010 while preliminary data for in India indicate that imports may have risen by as much as 0.3 million bpd. Korean imports rebounded by 0.10 millionto 5.1m bpd in 2010.2011. This was the lowest increase since 2005/2004, with the interim years posting gains of between 9% and 18%. Further examining the data shows this small increase had an even smaller effect on trade. Normally the increase in Chinese crude oil imports is reflected in a similar percentage increase in tonne-mile demand, however despite the 5.4% growth in imports, Chinese tonne-mile demand only managed to increase by 1.1% to 1.71 trillion. There are a number of reasons as to why tonne-mile demand growth associated to China floundered in 2011. The supply disruptions in the Atlantic basin drove up the price of Brent and related crudes versus Dubai, discouraging long-haul imports from West Africa. In turn the increased Saudi Arabian production provided a more plentiful supply closer to market, damping any increase in tonne-mile demand. West African exports to China were down 140,000 bpd (-14.6%), whilst Middle Eastern exports were up 340,000 bpd (+15.1%). Furthermore, exports from North Africa, encompassing Libya, were down 80,000 bpd (-40.7%) due to falling supply stemming from the uprising. Further downside to shipping was seen through rising Russian volumes, increasing by 70,000 bpd (+21.2%), mostly due to the new Chinese spur from the Eastern Siberia-Pacific Ocean (ESPO) pipeline commencing operations. The Russian increase accounted for nearly 25% of China’s year-on-year increase. A 12.6% increase in supply from the Americas helped ensure there was at least some positive tonne-mile demand effect.
DuringIn the first halfUS, crude oil imports were down 290,000 bpd (-3.1%) as increasing domestic production, falling demand and a policy of reducing dependence on foreign oil took its toll. Imports from West Africa fell by
280,000 bpd (-17.5%) due to falling refinery utilization on the US Atlantic Coast due to rising West African crude prices on the back of the Libyan outage and the falling domestic demand. The Libyan outage itself reduced imports from North Africa by 190,000 bpd (-49.9%). Although imports from the Middle East actually increased by 180,000 bpd (+10.6%) as Saudi Arabia increased production, the 220,000 bpd increase (+11.0%) in imports from Canada to 2.19m bpd, equating to 24.5% of total US imports, meant US tonne-mile demand fell by 3.4% to 1.86 trillion, having peaked at 2.35 trillion in 2004. In fact in Q1 2011 Chinese tonne-mile demand was higher than that of the US, despite imports of 5.19m bpd and 8.69m bpd that quarter respectively—which highlights the importance of supply source as well as volume. Whilst the US spent the remainder of the year ahead of China, the gap is narrowing once more. With Chinese and US demand forecast to increase by 3.9% and fall by 0.5% respectively, China becoming the most influential economy on the crude tanker market is not far off.
The forecast 4.0% increase in Chinese demand for 2012 should lead to a larger increase in tonne-mile demand due to increasing West African and returning Libyan production reducing the premium of Brent-priced crudes, encouraging an increase in West Africa-loading voyages for Asian discharge. This should offset the likely continued decline from US tonne-miles due to increasing domestic and Canadian production and weaker demand.
Supply from Iran remains a wildcard, with 500,000 bpd of Middle East to Europe volumes being removed through to July and Asian buyers reducing imports or under pressure from the US to do so, trade has the potential to change significantly. If Saudi Arabia continues to replace production, little may change, however whilst their spare capacity could cover all Iranian exports, it would leave the market with little spare capacity, which would inevitably keep a premium on oil prices, potentially damaging demand. If Saudi Arabia does not meet the shortfall created by the Iranian sanctions there would likely be a scramble for West African and other Middle Eastern barrels, both of which could either shorten or lengthen the average voyage—however what would be certain is it would push up prices, likely damaging demand in an already uncertain economy.
The use of crude oil tankers for floating storage declined in 2011 to become an insignificant employer of the global fleet. Whilst a number of vessels fromIranian-owned tankers remained under-employed due to difficulty in trading with Iran, the tradingremainder of the fleet only saw up to a maximum of seven VLCCs employed in floating storage, remained at a high level,along with on average 37 VLCCs occupied in this way,some Suezmaxes. In previous years the equivalent of 7% of the fleet. An average of 9 Suezmaxes and 61 coated and uncoated vessels from the Aframax and Panamax trading fleets were also employed in oil products storage in the first half of 2010, which helped to support freight market earnings. These numbers began to fall sharply in the second half of the year. The average number of VLCCs storing (excluding Iranian tonnage) had reached as high as 50 vessels (2009), providing significant support to the supply/demand balance. The Iranian-owned fleet across all crude sectors currently accounts for around 2% of the global fleet (by number).
The crude oil market remains in steep backwardation (where future prices trade at a discount to prompt prices), a scenario which does not lend itself to storing crude oil at sea (contango, whereby the prompt price trades at a discount to future prices, enables traders, oil companies and banks to buy the prompt cargoes, store at sea, and sell forward the higher priced future contracts to lock in a profit). The backwardation in the market is partly caused by the supply disruptions and, albeit small, growing demand. Unless the oil market returns to contango, large-scale use of tankers for floating storage remains unlikely. One scenario under which contango could return would be another global recession, weakening oil demand and sending prompt prices lower, with anticipation of returning demand holding up future prices, exactly what happened in 2008/9—however any benefit to the tanker market through increased floating storage would likely be more than offset by a decline in trade volumes following that recession.
The oil product market is also in backwardation, which has led to a gentle decline in oil product tankers storing refined products at sea. Following a peak of 100+ vessels (all sizes) storing approximately 12m tonnes of refined products in late 2009 and early 2010, it is now estimated only a handful, primarily older vessels, continue to store—mostly for strategic reasons off West Africa.
For the second half of the year was reduced to 16 vessels while just 3 Suezmaxes were known to be involved in oil products storage. Meanwhile the average number of vessels from the Aframax and Panamax fleets involved in storage fell to 37.
In the productsproduct tanker sector,market, imports of gasoline, distillates,gasoil/diesel, jet fuelfuel/kerosene and fuel oil into the United States, US fell by 190,000 bpd (-12.2%)—the world largest products importing country, declined very slightly once again decline since 2008—from 2009’s level of 1.59 million bpd to 1.57 million1.57m bpd in 2010.2010 to 1.38m bpd in 2011. However increasing export volumes, fed by weak domestic demand and high utilization rates for US Gulf
refineries (due to relatively cheap WTI crude, unlike the U.S. entrenched its position asAtlantic Coast refineries which are more dependent on Brent-priced crude), meant the US is now a net exporter for the combined major exporteroil products. Exports increased by 430,000 bpd (+29.5%) to 1.87m bpd, led by an increase of refined products, with exports183,000 bpd (+61.9%) in gasoline exports. Gasoline remains the only product for which the US continues to be a net importer. Much of the 4gasoline exports were destined for Central and South America, especially Brazil, which had a poor sugarcane harvest and so ethanol production, a key transportation fuel component, was disrupted. The gasoil/diesel exports contributed more to tonne mile demand with around half shipped to Europe, with the remainder staying within the Americas.
Imports of the four main oil products groups rising to 1.44 millioninto OECD Europe remained broadly flat for the third consecutive year at 2.19m bpd, from 1.27 million bpd in 2009.
up just 1.4%. Gasoline imports contributed the largest increase at 26.9%, but it still only makes up 10% of total OECD Europe once again recorded high levelsimports. Gasoil/diesel, the largest component of product imports with 45% of gasoil and jet fuel, although jet fuel imports were negatively impactedthe total, decreased by the closure of European airspace in the 2nd quarter due to hazards posed by a volcanic ash cloud. Chinese imports of most refined products were lower in 2010. An exception was naphtha which was in strong demand from the petrochemicals sector. In addition Chinese5.5%, however imports of gasoil/diesel increased at the end of the year as diesel powered generators were once again used to cover power shortages, this time caused by the closure of older coal fired power stations. Naphtha imports into Japan and South Korea also increased from a combined total of 0.87 million bpd in 2009 to 0.93 million bpd in 2010, again buoyed by the strong demand for petrochemicals in Asia.
Looking forward, the IEA in its March 2011 report predicted that oil demand would continue to rebound in 2011. The latest forecast showed an increase of 1.44 million bpd. This compares to a forecast increase of 1.51 million bpd from the U.S. Energy Information Administration and 1.44 million bpd forecast from OPEC. The IEA,US surged by 80%. In China, despite continued refinery expansion, the country remained a net importer of oil products in its latest report has forecast that demand in the developed world will fall slightly, by 0.10 million bpd, while further strong demand growth of 1.55 million bpd2011 which is predicted for developing countries including growth of 0.86 million bpd in Asia. As was shown last year these estimates are often subject to revision as a result of changes in economic and oil market developments. The IEA’s comparable forecast in March 2010 of a 1.57 million bpd increase in demand in 2010 was eventually upgraded to an estimate of 2.88 million bpd of growth in its March 2011 report. Global oil demand is expectedlikely to continue its upward trend over the medium-term, even if greater energy efficiency is seen in the developed world. In its most recent medium-term outlook, the IEA forecast further annual average increases infor some years yet. However continued mismatch between refinery output and consumer demand in the developing world of 1.4 – 1.5 million bpd per annum from 2012 to 2015 led by growth in Asia. Further increases in refining capacity in Asia and strategic stock building are also expected to help to drive crude oil trade growth.allows for some cross-trading, primarily intra-Asia.
World Tanker Fleet
Growth in the crude oil tankerVLCC fleet slowed to 4.5%was 8.0% in 2010 from some 7.2% in 2009, in terms of dwt. 54 new VLCCs were delivered into2011, significantly higher than the market, one more than in 2009, although this was from an original list of 75 vessels reported for delivery in 2010. 41 vessels were removed from the trading fleet, compared to 39 in 2009. This meant that the trading fleet (excluding changes to thepast five years (2006-2010 inclusive averaged 2.1%), led by a high number of vessels employed in storage) increased bydeliveries and a modest 2.6%, compared to 2.8% in 2009. Thereduced number of VLCCs that are listed for delivery in 2011 is quite substantial – in excess of 80 vessels – however as has been the case for the past 2 years, it is expected that many of these recorded orders will not in fact materialize this year.
In the Suezmax sector 36removals. 63 vessels were delivered in 2010, compared to 46 deliveries in 2009. Thisfrom shipyards, however this was down from an original list of some 55 vessels that were due to be delivered in 2010. A total of 17 Suezmaxes were removed from service in 2010 compared to 10 vessels in 2009. As a result fleet growth was much lower at 5.5%, in terms of the number of vessels, whereas 2009 saw fleet growth of some 11.6%. At the start of 2011, 66 vessels were listed as due for delivery this year however a substantial number of these vessels are also expected to remain undelivered at the end of the year.
In the Aframax segment 68 vessels were delivered in 2010 from an original list of 96 vessels that were listed as being due for delivery. Eventual deliveries were markedly lower than in 2009 when a total of 96 Aframaxes were actually delivered. A further 30 vessels were removed from service on top of the 21 vessels removed from service in 2009. Fleet growth therefore fell sharply from 9.8% in 2009 to 4.6% in 2010. 69 vessels were listed as due83 scheduled for delivery at the start of 2011 howeverthe year, implying a slippage rate of deliveries is also expected in24%. Following the Aframax segment. Aframax fleet growth is expected to be lower once again in 2011 and the overall orderbook is now relatively modest at 16%removal of the existing fleet.
In the Panamax tanker segment (60,000 – 80,000 dwt) the number of deliveries fell for the 5th successive year, with 30 vessels delivered compared to 37 in 2009. Removals of vessels from the trading fleet increased to 21 vessels from 14 in 2009, therefore,trading, net fleet growthadditions were 42 vessels. In comparison 2009 and 2010 saw net deliveries of 14 and 13 respectively—whilst deliveries were relatively high at 53 and 54 vessels respectively, this was reducedtempered by the removal of 39 and 41 vessels in each year—a combination of scrapping, permanent storage employment and conversion to 2.3%, from 4.9% in 2009. 36 vessels are listed as due for deliveryoffshore and dry cargo vessels. Whilst all three exit routes continued in 2011, reduced requirement for further permanent storage (primarily off Singapore) and fewer candidates for dry cargo conversion (plus strong fleet growth in the samelargest dry cargo vessel sector, for which the converted VLCCs would be joining) played a role in the falling removals. The orderbook at the start of 2012 for deliveries in the year ahead was 71 vessels, however it is expected that a number as were listedof these will not deliver on time.
Suezmax fleet growth registered 7.8% in 2011, with 44 deliveries and 12 removals. 22 of the 66 vessels scheduled for 2010 delivery at the start of last year. the year slipped into later years. Whilst fleet growth was high with net deliveries of 32 vessels, it came in under the 9.7% seen in 2009 (net deliveries of 35 vessels). However 2009 had the support of floating storage for clean petroleum products, which saw a number of newbuilding Suezmaxes load gasoil/diesel in the Far East to then proceed to store off Europe for a number of months, effectively slowing the rate of deliveries from the shipyards. Whilst gasoil/diesel shipments east/west on newbuildings continue, they are now purely repositioning voyages with no storage element, meaning the strong fleet growth was felt more acutely in 2011. In comparison, fleet growth in 2010 was 4.3%, with 36 vessels delivered and 19 removed, however in reality, the high fleet growth of 2009 was somewhat smoothed into 2010 as vessels delivered in the former which then stored off Europe redelivered their cargo and began trading in the latter. At the start of 2012 there were 62 vessels scheduled for delivery in the coming year, however with slippage averaging 34% over the previous three years, a significant number of these will likely be delayed.
Fleet growth is therefore expected to be broadly equivalent to 2010’s levelfor the Aframax sector was just 3.7% in this market sector, as more 1980s built2011, the lowest since 2002. 59 vessels and non double hulled vessels arewere delivered from shipyards, down 16 from the 75 listed, implying 21% slippage, whilst 26 were removed from service. The orderbookthe fleet, giving net deliveries of 33 vessels. This is significantly down from the highs of 2009, which saw net deliveries of 75 vessels (96 deliveries and 21 removals), and 40 in 2010 (70 deliveries and 30 removals). Just 64 vessels were listed for 2012 delivery at the start of the year—with some slippage, the number of deliveries could be the lowest in this segmenta number of years.
The number of deliveries in the Panamax sector continues to fall year-on-year, the sixth year of declines, with just 27 vessels added to the fleet in 2011, down 25% on the 36 listed at the start of 2011. However with only
six vessels removed in 2011, net deliveries of 21 vessels was the highest since 2008 (net deliveries of 27 vessels), giving fleet growth of 5.3%. There were 32 vessels listed for 2012 delivery at the start of the year, if historical slippage continues a seventh year of falling deliveries is lower still, with fewer than 20 vessels currently scheduledpossible, but a stronger showing on removals will be needed to be delivered.slow the fleet growth.
In theThe MR products tanker sector (45,000 – dwt—55,000 dwt), saw its lowest fleet growth fell substantiallyin ten years in 2011, despite just two removals. The 68 vessels delivered from 17.5% in 2009 to 8.3% in 2010. Meanwhile the 103 listed (34% slippage), giving net deliveries of 66 vessels meant fleet in the more mature Handy tanker segment (27,000 dwt – 45,000 dwt) segment contracted for the first time since 2002, with negative growth of -2.3%7.5%, a marked decline from the highs seen in 2008 and 2009 at 20.8% and 17.2%. This meant thatThe modern fleet means fleet growth is much more sensitive to deliveries as there is a relatively small number of candidates for removal (although as the combined Handyyears progress this stock will increase), and MR segments (27,000 – 55,000 dwt) was some 2.6% overall. In total 90 MRs and 35 Handy tankers were delivered, from an original list of 153 MRs and 50 Handy tankers. Removals of vessels increased in both the MR and Handy tanker segments. In total 82 vessels were removed from service. At the start of 2011, 101 MRs and 36 Handy tankers werewith 73 listed as due for delivery in 2011, however substantial2012, after slippage, of deliveries is expectedfleet growth looks set to slow further. For the smaller Handy product tanker sector (27,000 dwt—45,000 dwt) fleet growth once again came in negative, just, at -0.1% following 28 deliveries from 37 originally listed (24% slippage), with 29 removals—this year. Fleet growthfollows a decline of 2.3% in 2010. The orderbook for 2012 is therefore expectedjust 20 vessels and with an aging fleet removals should continue to be lower once again in 2011 with feweroutpace deliveries, and a large number of 1980s built and non double hulled Handy tankers still available to be removed fromseeing the fleet.
The total deep sea oil tanker fleet from 27,000 – 445,000 dwt increased by 3.9% in 2010 to 412 million dwt. A further 110 million dwt remained on order for delivery at the beginning of 2011, while there was 16 million dwt of non double hulled tonnage to be removed from service under MARPOL Annex 1 regulations. Fleet growth in the Aframax and products tankers sectors is expected to be significantly lower in 2011 and 2012 than in the period from 2008 to 2010, however strong fleet growth is expected in both the VLCC and Suezmax sectors, notwithstanding the fact that further slippage is expected from the list of vessels to be delivered.size reduce further.
Newbuildings
(Newbuilding and second hand price
| Newbuilding Tanker Prices (South Korea) | ||||||||||||||||||||
| Jan-03 | Jan-04 | Jan-05 | Jan-06 | Jan-07 | Jan-08 | Jan-09 | Jan-10 | Jan-11 | Jan-12 | |||||||||||
VLCC | $65.5m | $79.0m | $120.0m | $122.0m | $130.0m | $146.0m | n/a | $100.0m | $105.0m | $100.0m | ||||||||||
Suezmax | $45.0m | $53.0m | $ 74.0m | $ 73.0m | $ 80.5m | $ 86.0m | n/a | $ 60.0m | $ 65.0m | $ 62.0m | ||||||||||
Aframax (Uncoated) | $36.0m | $44.5m | $ 62.5m | $ 61.0m | $ 65.5m | $ 72.0m | n/a | $ 51.0m | $ 57.0m | $ 52.0m | ||||||||||
47k dwt (Epoxy Coated) | $28.0m | $34.0m | $ 41.0m | $ 43.5m | $ 47.0m | $ 51.0m | n/a | $ 32.0m | $ 37.0m | $ 34.5m | ||||||||||
Price assessments were temporarily suspended in late 2008 and early 2009 due to a lack of liquidity in the shiptanker sale and purchase markets)markets
| Newbuilding Tanker Prices at January Each Year | ||||||||||||||||||||||||||||||||||||||||
| 2002 | 2003 | 2004 | 2005 | 2006 | 2007 | 2008 | 2009 | 2010 | 2011 | |||||||||||||||||||||||||||||||
VLCC | $ | 70m | $ | 66m | $ | 79m | $ | 118m | $ | 122m | $ | 130m | $ | 147m | N/A | $ | 100m | $ | 105m | |||||||||||||||||||||
Suezmax | $ | 47m | $ | 45m | $ | 53m | $ | 74m | $ | 73m | $ | 81m | $ | 91m | N/A | $ | 60m | $ | 65m | |||||||||||||||||||||
Aframax (Uncoated) | $ | 36m | $ | 36m | $ | 45m | $ | 62m | $ | 61m | $ | 66m | $ | 73m | N/A | $ | 51m | $ | 57m | |||||||||||||||||||||
47k dwt (Epoxy Coated) | $ | 26m | $ | 28m | $ | 34m | $ | 41m | $ | 44m | $ | 47m | $ | 53m | N/A | $ | 32m | $ | 37m | |||||||||||||||||||||
Tanker newbuilding prices increasedFollowing the 52 VLCC orders seen in 2010, just 14 were placed in 2011 as we saw resurgent ordering of dry bulk carriers, VLCCsoversupply in the existing fleet and Suezmaxes helping to fill shipyards’ forward orderbooks. In total 52 VLCC newbuilding contracts were recorded in 2010. More than halfcontinued finance constraints kept owners away from the shipyards. Of the 14, Chinese yards received 10 of the VLCC orders, were placed at Chinese shipyards atwith South Korea the remainder. As well as prices ranging from $95 - 100 million. Most ofbeing lower, another reason for the remainingstrong showing in China was because South Korea has been actively seeking higher value orders, were placed at South Korean yards, with several orders reportedespecially in the 3rd
quartergas and offshore sectors as it looks to secure business at a time of excess yard capacity. Japanese yards continue to be priced out due to the strong yen. Prices softened slightly through the year at pricesas orders failed to materialize, moving from $105m in January 2011 to $100m by the regionyear-end.
After the strong contracting of $105 – 108 million. Japanese yards2010 with 57 orders, 2011 saw a similar decline to the Suezmaxes, with orders totaling just 18 vessels. Of these, 12 were largely priced out ofspecialist shuttle tankers, reflecting the potential future shortfall in vessels able to serve the growing offshore oil industry. Whilst these 12 shuttle tankers could trade in the international market, by the strengthmajority have been ordered against long-term time charters and it is unlikely they will affect the trading fleet, therefore effective orders totaled just six vessels for 2011. Prices remained flat around $62m from February 2011 to January 2012, down from $68m in 2010, from when prices were pushed higher on the heavy ordering activity that year. The shuttle tanker orders were priced between $95 and $105m, reflecting their superior specification. Five of the Yen.
Fifty-seven new Suezmax contractssix conventional Suezmaxes were recorded in 2010. Over 70% of these vesselsordered at Chinese yards, whilst the remainder, and all the shuttle tankers, were ordered at South Korean yards with prices reaching $67 – 68 millionyards.
Just 11 orders were placed for contracts reportedAframax vessels during 2011, however only eight have been ordered for international trading due to one order being a shuttle tanker and two ordered by a US major for domestic trading (at a cost of $200m—the US Jones Act stipulates tankers that will trade port-to-port in the middle ofUS must be US built, flagged and crewed. The price highlights the year. Chinesehuge gulf in costs between Far Eastern shipyards accounted for nearly all ofand western shipyards, however the remaining contracts with vessels priced in the range of $60 – 62 million.
Fifty-four new contracts were recorded for Aframax tankers in 2010 although several of these were for relatively far out delivery in 2014 or laterare likely to have been ordered to a very high specification relative to a standard conventional Aframax). The shuttle tanker and seven of these orders were for shuttle tankers rather than conventional trading ships. Indicative prices forthree conventional vessels to be builthave been ordered at South Korean yards increased from $51 millionshipyards, one at the start ofa Chinese shipyard and four in Japan. Similarly to other sectors, prices softened through the year as ordering remain subdued, falling from $57m in January 2011 to $57 million in the second quarter of 2010.$52m a year later.
There was little newbuildinga strong showing of contracting in the MR product tanker sector, with 55 orders placed, primarily in South Korean shipyards. The sector has often been selected as the one with the best prospects going forward, and Handythis has not been ignored as owners try to order at the bottom of the cycle. Prices held up throughout the year, fluctuating between $36m and $37m.
Shipyard capacity continues to exceed demand, suggesting downward pressure on prices, however yards appear to have little room to adjust prices further due to the high-cost (raw materials and labor) environment. This has the benefit of slowing ordering, however yards eventually may drop prices below breakeven (if they are not already) in order to ensure cash flow. Once a sustained freight rate recovery is underway, prices look likely to increase as ordering activity picks up ahead of a new cycle, however with a number of owners struggling financially, the orders will come from fewer owners, which may keep any price increases relatively small.
Second-hand Prices
| 5-Year Old Tanker Prices | ||||||||||||||||||||
| Jan-03 | Jan-04 | Jan-05 | Jan-06 | Jan-07 | Jan-08 | Jan-09 | Jan-10 | Jan-11 | Jan-12 | |||||||||||
VLCC | $60.0m | $72.0m | $110.0m | $120.0m | $117.0m | $138.0m | n/a | $77.0m | $80.0m | $55.0m | ||||||||||
Suezmax | $42.5m | $49.5m | $ 75.0m | $ 76.0m | $ 80.0m | $ 96.0m | n/a | $55.0m | $56.0m | $43.0m | ||||||||||
Aframax (Uncoated) | $34.0m | $39.0m | $ 59.0m | $ 65.0m | $ 65.0m | $ 73.0m | n/a | $39.0m | $41.0m | $32.0m | ||||||||||
47k dwt (Epoxy Coated) | $23.0m | $30.0m | $ 40.0m | $ 47.0m | $ 47.0m | $ 52.0m | n/a | $24.5m | $26.0m | $25.5m | ||||||||||
Price assessments were suspended in late 2008 and early 2009 due to a lack of liquidity in the tanker segment (27,000 dwt – 55,000 dwt), however newbuilding prices were driven higher by activity in other market sectors. Indicative newbuildingsale and purchase markets.
Second-hand prices for MR productsthe larger crude tankers rose from $32 million atwere holding up relatively well during the start of the year to $37 million by the middle of the year.
The early partfirst half of 2011 has seen a lowering of newbuilding pricesfollowing the rebound and subsequent decline in some sectors, with indicative VLCC newbuilding prices in South Korea reduced to $104 million from a 2010, peak of $108 million and indicative Suezmax newbuilding prices reduced to $62 million from $68 million inhowever by the second half of 2010. Although shipyards face rising input costs, relatively abundant yard space for 2013 deliveries and2011, prices succumbed to the continued weak market, with a number of large owners beginning to offload their older vessels, which had a knock-on effect on the younger second-hand tonnage. 5-year old VLCCs dropped from $80m in July 2011 to $55m by November 2011, with 5-year old Suezmaxes dropping from $52m to $43m over the same period. 5-year old Aframax prices have been in a slow continuous decline from a peak in Q4 2010 at $45m to $32m by the start to the year in both the tanker and dry bulk carrier markets has meant that there is downward pressure on newbuilding prices.
Secondhand Prices
| 5-Year-Old Tanker Prices at January Each Year | ||||||||||||||||||||||||||||||||||||||||
| 2002 | 2003 | 2004 | 2005 | 2006 | 2007 | 2008 | 2009 | 2010 | 2011 | |||||||||||||||||||||||||||||||
VLCC | $ | 58m | $ | 60m | $ | 72m | $ | 110m | $ | 120m | $ | 117m | $ | 138m | N/A | $ | 77m | $ | 80m | |||||||||||||||||||||
Suezmax | $ | 39m | $ | 43m | $ | 50m | $ | 75m | $ | 76m | $ | 80m | $ | 96m | N/A | $ | 55m | $ | 56m | |||||||||||||||||||||
Aframax (Uncoated) | $ | 30m | $ | 34m | $ | 39m | $ | 59m | $ | 65m | $ | 65m | $ | 73m | N/A | $ | 39m | $ | 41m | |||||||||||||||||||||
47k dwt (Epoxy Coated) | $ | 21m | $ | 23m | $ | 30m | $ | 40m | $ | 47m | $ | 48m | $ | 52m | N/A | $ | 24.5m | $ | 26m | |||||||||||||||||||||
Secondhand tanker sales activity picked up in 2010 after a very quiet period in 2009. Indicativeof 2012. MR product tankers saw prices for 5-year old vessels rebounded quicklyrise from $26m in January 2011 to $30.5m by early summer, reflecting strong interest in the first halfprospects for the sector, however the remainder of the year peaking in the third quartersaw prices edge back down to $25m as interest switched to newbuilding ordering for MRs with market prices in some sectors estimated to be more that 20% higher than at the start of the year. By early 2011 indicative prices had subsided from their peaks, however indicative prices of modern secondhand tankers generally remained slightly above year ago levels at the start of 2011.economical engines.
Vessel Earningsearnings
Tanker spot market earnings increasedFollowing the increase in 2010 vis-à-vis 2009’s levels. Thefrom the lows of 2009, freight rates quickly reversed in 2011, with all three crude tanker sectors recording their lowest annual averages in the modern era. Continued uncertainty in the global economy, strong growth in oil demand, the rebound in seaborne crude oil trade, storage employment and lower fleet growth and no support from floating storage, as well as geopolitical events dampening tonne-mile demand growth were all contributedpart of the cause. The MR product tanker market broke the trend and saw rates remain broadly flat year-on-year, as increasing volumes on growing routes, such as exports out of the US and imports into Brazil and Africa helped absorb some of the over-supply, further supported by falling fleet growth. Although headline numbers were generally weak, this reflects vessels steaming at 14.5kts, the historical standard, when in reality, the high cost of bunker fuel and weak market have led owners to slow-steam. This has the risebenefit of reducing bunker fuel consumption and so saving costs, but it also tightens the supply/demand balance as vessels take longer to complete a voyage, buoying rates. Once slow-steaming is factored in, the market.decline in rates from 2010 levels are less dramatic, but nonetheless still weak.
VLCC
Benchmark VLCC spot market earnings reboundedhad a relatively strong start to strong levels2011, posting an average of nearly $23,000/day in Q1, higher than Q4 2010—however Q1 and Q4 are typically the first half of 2010. Estimated time charter equivalent (TCE) earningsstrongest (due to the northern
hemisphere winter when shipping demand tends to increase)—and given Q1 2011 was down on the benchmark AG-Far East route averaged some $55k/$55,000/day as storage employment absorbed 7% ofseen in Q1 2010 and $44,500 seen in Q1 2009, the vessels that would otherwise have been trading. Vesseloutlook for the year was possibly set early on. Continued downward revisions to 2011 demand also increasedestimates due to the very large rise in Chinese seaborne crude imports and increased long-haul tradeglobal economic uncertainty, the loss of Libyan output altering tonne-mile demand into China, and India from the Atlantic Basin. Duringheavy delivery schedule took their toll into Q2 and Q3, with rates averaging just $9,500/day and $1,500/day respectively, with long-periods of negative earnings, whereby freight rates did not completely cover bunker fuel costs (assuming normal speeding) and port costs. By Q4, traditionally the second halfstrongest quarter, only a very lackluster rebound ensued, seeing rates average $11,000/day as the full force of the year, when8.0% fleet growth and no support from floating storage employment(as seen in previous years) was reduced, earnings fellfelt, bringing the annual average to $11,000/day, enough to cover daily operating costs (crewing, communications, maintenance and so on), but not enough to cover finance costs. The first part of 2012 has seen rates continue to increase from Q4 2011, helped by continued momentum in removals carried over from 2011, however the average for Q1 2012 is currently lower levels averaging some $18k/day. In earlythan that of Q1 2011, earnings have been volatile, remainingsuggesting the removals will need to continue at low levelspace to ensure a recovery in January before spiking to in excess of $50k/day in mid-February.freight rates.
Suezmax
Freight ratesThe Suezmax composite (basis 70% of the West Africa/USAC rate and 30% of the Black Sea/Med. rate, reflecting the fixture split) slid from Q4 2010 into Q1 2011 at $23,000/day and $19,000/day respectively. Turkish straits delays, typically a support for Suezmax tankers also recovered to relatively strong levelsthe Suezmaxes and Aframaxes trading in the first half of 2010,Black Sea and Med. saw their typical spike (vessels over 200m in length cannot transit the strait during darkness, therefore in wintertime, with indicative TCE earnings averaging some $34k/day. In the second half of the year earnings were lower, after the redelivery of both VLCC and Suezmax tonnage that had been storing. Indicative TCE earnings therefore fell to
some $18k/day. The start of 2011 also saw low levels of earnings,fewer daylight hours, delays build up either side), however the conflictloose supply/demand balance meant this had a dampened effect on rates. As with the VLCCs, Q2 and Q3 weakened further, with rates at $8,500/day and $3,500/day, with a particularly weak showing from the Black Sea/Med. market, before picking up on winter demand to $16,000/day in Libya andQ4 2011. Further upside was prevented from the anticipationdeclining volumes of resulting changes inWest African crude exported to the US Atlantic Coast as a number of refineries began to shut down due to poor refining economics with high Brent prices. The annual average was therefore $11,000/day, under half the previous year. Despite falling volumes into the US from West Africa, the Q1 2012 average is currently around the level of a year ago at $19,000/day, however going forward, as well as further refinery shutdowns already announced, Russia looks set to continue to divert crude oil from its export terminals in the Black Sea to the Baltic as it starts up its new Baltic Pipeline System (BPS-2), further cutting Suezmax supply volumes. It is therefore expected the Suezmaxes will be forced to trade helped to drive earnings to higher levels close to $40k/day by early March 2011. Any prolonged disruptionon an increasing number of North African crude oil exports is expected to result in greater demand for Suezmax shipments on the longer-haul route fromalternative routes, predominantly West Africa to the MediterraneanFar East.
Aframax
Earnings forThe Aframax composite (a straight average of six worldwide voyages) saw Q1 2011 continue where Q4 2010 left off, with rates averaging $13,000/day and $13,500/day respectively. By far the best performer was Aframaxes were also higher in the first half of 2010, averaging some $20k/day, supported by both storage employment and the return of a premium for ice-classed tonnage in the Baltic during the first quarter. As was the case with the VLCC and Suezmax sectors, indicative TCE earnings were lower in the second half of the year, once storage employment had been reduced, at some $12k/day. Whilst earnings remained at low levels in the early part of 2011, the uncertainty in Libya, bad weather in the Mediterranean and the ice-season in the Baltic led to a sharp rise in earnings levels in March. Indicative TCE earnings for ice-class vessels exporting cargoeslifting 100,000t from the Baltic roseto NW Europe, due to ice restrictions, helping increase the average significantly. By Q2 and Q3, with the ice no longer a support, and a similarly poor Black Sea/Med. market as seen by the Suezmaxes, the widespread weak rates across the sector were revealed in the Aframax composite, averaging $7,000/day and $3,500/day respectively. Q4 managed a slight increase to $8,500/day, with cross-Med. Aframaxes the best performer, although by no large margin as seen by the Baltic/NW Europe voyage in Q1 2011. The annual average for 2011 was therefore just $8,000/day, a 50% decline on 2010. The current average for Q1 2012 is marginally up on Q4 2011, but significantly down on Q1 2011 at $10,000/day, primarily due to the ice season being far less severe this winter compared with previous years.
MR
The MR composite (a straight average of six worldwide voyages) has seen freight rates remain broadly flat in 2010 and 2011, and this is replicated within the quarters, with the range of quarterly earnings between Q1 2010 and Q4 2011 remaining between $9,500/day and $12,500/day. The cross-Med. voyage continued to be the most lucrative, helping lift the average slightly—however Q3 freight rates were relatively weak due to a peakshortage of some $122k/day, while earnings for vessels trading inLibyan exports and an inability to import into the Mediterranean rosecountry due to $57k/day.the unrest. The Q3 average was further
Products Carriers
Indicative TCE earnings for MR products carriers rose slightly in 2010, but remained at relatively low levels as the large number of newbuildings delivered in 2008 and 2009 continued to weigh on the market. Earnings were relatively flat throughout the year, ranging from some $8k/day in October to $16k/day in July, when there was a brief surge in the United States’ gasoline import requirement. Although earnings generally remained at low levels in early 2011, the unrest in Libya, higherdampened by falling gasoline imports into the U.S. and strong diesel demand from Latin America helped to push earnings for vessels trading in the Atlantic Basin and Mediterranean upwards in March. Indicative TCE earningsUS, lowering freight rates on the benchmark NorthwestNW Europe to US Atlantic Coast route peakedvoyage. This combined effect saw Q3 2011 record the lowest quarterly earnings for the MR composite since 2009. The annual average for 2011 was just shy of $11,500/day—$100 or so lower than 2010. The current average for Q1 2012 continues to fall within the recent range at some $19k/day latejust over $10,000/day.
LNG market
The natural gas market has remained in the month. Overallspotlight over the past year, with continued production growth from shale gas in North America, which has kept prices low and encouraged duel-fire power stations to switch from expensive fuel oil and end-consumers to switch to more natural gas consumption where possible. The devastating earthquake and tsunami off Japan in March 2011 further increased demand for natural gas, as well as coal, fuel oil and crude oil, as the country looks to lower levelits dependence on nuclear power.
The abundant supply of fleetshale gas (although much of it is not in production) and the relatively low emissions in comparison to other fossil fuels (despite questions over the environmental impact of extraction of shale gas) suggests natural gas has a significant role to play meeting future global energy needs, with demand set to grow from 300 billion cubic feet per day (Bcf/day) in 2010 to almost 470 Bcf/day by 2030.
This potential demand growth has led to strong investment in the LNG infrastructure to cater for the inevitable trade growth, with new liquefaction and re-gasification plants as well as LNG vessels. 2009 and 2010 saw just two and 12 LNG vessel orders respectively, whereas in 2011 this had risen to 47, all placed at South Korean yards, which have been diversifying into higher value orders in the face of falling orders for tankers and dry cargo vessels.
Given the investment required in the LNG sector, and the relative complexity of the sector, the recent ordering has been confined to established shipowners, either with a history in the sector, or a large shipowner with experience in the tanker sector looking to diversify. The tanker sector has seen a number of new entrants on the orderbook looking to enter at the bottom of the market having seen the potential returns from historical freight rates. This perhaps puts the LNG sector at an advantage—keeping it within established traditional shipowners—however as with all shipping sectors it is expectedparamount ordering is balanced to benefit this sector in 2011.future demand to prevent over-ordering of capital-intense assets.
Company Overview
As of March 31, 2011,2012, we operated a fleet of 4748 modern double-hull tankers providing world-wide marine transportation services for national, major and other independent oil companies and refiners under long, medium and short-term charters and one LNG carrier. Our current fleet consists of three VLCCs eight(of which two are expected to be sold within 2012), ten suezmaxes, twelveeleven aframaxes, nine panamaxes, six handymaxes, eight handysizes and one LNG carrier. All vessels are owned by our subsidiaries. The charter rates that we obtain for these services are determined in a highly competitive global tanker charter market. We operate our tankers in markets that have historically exhibited both cyclical and seasonal variations in demand and corresponding fluctuations in charter rates. Tanker markets are typically stronger in the winter months as a result of increased oil consumption in the northern hemisphere. In addition, unpredictable weather conditions in the winter months tend to disrupt vessel scheduling. The oil price volatility resulting from these factors has historically led to increased oil trading activities. Changes in available tanker capacity have also had a strong impact on tanker charter markets over the past 20 years.years and especially in 2011.
Results from Operations—20102011
The following discussion of our financial condition and results of operations should be read in conjunction with the financial statements and the notes to those statements included elsewhere in this Annual Report. This discussion includes forward-looking statements that involve risks and uncertainties. As a result of many factors, such as those set forth under “Risk Factors” and elsewhere in this Annual Report our actual results may differ materially from those anticipated in these forward-looking statements.
The year 2010 saw increasing signs of recovery toworld economy remained in a weak and uncertain state throughout 2011, particularly in the global economy with GDP up 5%, the growth engine being the continued development in Asia, but also the U.S. clearly on the road to recovery albeit without the hoped for reduction in unemployment. Even Europe, beset withWest. The national debt and deficit problems and takingof Europe coupled with the long route to recovery throughextreme austerity measures saw some slow growth, primarilyrequired in Germany. The recovery and growingseveral countries, continued to cause considerable concern, further threatening global financial stability. In such an environment, expected demand for oil was inevitably affected negatively, the actual increase in global demand for oil up 2.7%in 2011 (740 thousand barrels per day) now reckoned to be about half of what was being forecast even in mid-2011. Demand in Europe and North America actually fell, but was compensated by increasing demand in non-OECD countries, primarily China and India. While demand for oil was stalling, the supply of crude-carrying vessels continued to increase substantially despite some slippage from 2009, gave rise to optimismoriginally forecast delivery numbers. In addition, the supply, distribution and distillation of oil suffered various disruptions throughout the world during 2011 including the consequences of the earthquake in Japan which impacted refinery operations, the closure of U.S. refineries on the Atlantic coast affecting imports from West Africa and the civil war in Libya and political strife elsewhere in the earlier part of the year that 2010 could seeMiddle East which dislocated production and exports. The mild winter in North America was also a strong recoveryfactor in the tanker marketreducing oil consumption. Although there was some reduction in oil inventories it was not significant enough impact trade. Opportunities for storage at sea were also limited by the fourth quarter. Such hope was fueled by increasing usecontinued expectation that future oil prices would remain at a discount to prompt oil prices. As a result of tankers for storage as the oil price contango moved upwards, from a more relaxed policy by OPEC regarding oil production and from the increased scrapping of older vessels. These hopes dissipated by mid-year as the contango evaporated and more vessels came onto the market, both newbuildings and those released from storage, and inventories of crude and
product remained high. The fact that fleet growth was far exceeding vessel demand became more evident towards the fourth quarter as overcapacity pushed industry spot rates to levels near or below vessels’ operating expenses, forcing globalall these factors, overall fleet utilization to approximately 85%. It was not until December thatremained historically poor, freight rates for the crude carrying marketcarriers saw healthier rates more in line with seasonal expectations, but this was not to last long into 2011.their lowest average levels for over a decade, exacerbated by high bunker (fuel) costs, and valuations of vessels fell substantially worsened by distress sales by financially troubled owners. Product carrier rates sawdid not see such a dramatic fall due to a more favorable vessel supply situation. Although there was some modest improvement over the previous year, but the market stillin certain classes and locations, in general they remained relatively soft.flat.
Our fleet achieved voyage revenues of $395.2 million in 2011, a decrease of 3.1% from $408.0 million in 2010, a decrease of 8.3% from $444.9 million in 2009.2010. The average size of the fleet declined slightlyincreased in 20102011 to 47.8 from 46.1 from 46.6 in 2009,2010, and fleet utilization decreased only marginally from 97.7%97.6% to 97.6%97.1% over the same period. The decrease in revenue was primarily due to the decline in rates in a softer market caused by the oversupply of vessels mentioned above. The average daily time charter rate per vessel after deducting voyage expenses, decreased to $19,825$16,047 compared to $22,329$19,825 in 2009.2010. Voyage expenses increased, despite a decreaseminor increase in operating days on voyages incurring such expenses, because of higher bunker (fuel) prices caused by rising oil prices. Operating expenses decreasedincreased by 12.8%3.1% to $126.0$129.9 million, while average daily costs per vessel fell by 11.9%0.5% due to the acquisition of two new vessels and the disposal of two older ones. In addition, better pricing obtained by our new technical managers for purchases of spares, stores and lubricants and reduced crew costs derived from actions taken since 2009 reduced P&I insurance costs and a stronger dollar which impacted primarily crew expenses.
Depreciation was $101.0 million in 2011 compared to $92.9 million in 2010 compared to $94.3 million in 2009 due to the disposal of vessels in the earlier part of 20102011 offset by new additions in the latter part of the year. Management fees totaled $15.6 million for 2011 compared to $14.1 million for 2010, compared to $13.3 million for 2009, an increase of 6.6%10.3%, mainly due to an increase in monthly fees from JulyJanuary 1, 2010.2011. General and administrative expenses were $4.3 million during 2011 compared to $3.6 million during 2010 compared to $4.1 million during 2009.2010.
The net gain on the sale of fivetwo vessels in 20102011 amounted to $19.7$5.0 million, compared to the sale of one vesselfive vessels in 20092010 with a net gain of $5.1$19.7 million. The Company incurred an impairment charge in 2010,2011, relating to the oldest vesseltwo VLCC vessels in the fleet, amounting to $3.1$39.4 million, compared to impairment chargescharge on three vesselsone vessel in 2009 totalling $19.12010 amounting to $3.1 million. OperatingThere was an operating loss of $37.7 million in 2011, including the impairment charge, compared to operating income increased toof $80.7 million income in 2010, from $72.4 million in 2009.including the impairment charge. Interest and finance costs, net increaseddecreased by 35.8%14.1% in 20102011 to $62.3$51.2 million, due mainly to negativepositive valuation movements on non-hedging interest rate and $6.4 million cash received on bunker swaps. Net incomeloss was $19.8$89.5 million compared to $28.7$19.8 million income in 2009.2010. Diluted earningslosses per share were $0.50$1.94 in 20102011 based on 39.6046.12 million diluted weighted average shares outstanding compared to $0.77diluted earnings per share of $0.50 in 20092010 based on 37.2039.60 million diluted weighted average shares outstanding.
Some of the more significant developments for the Company during 20102011 were:
| • | the delivery of the two |
the order of the two DP2 suezmax shuttle tankers;
| • | the sale of the |
|
| • | the dry-docking of |
the continuation of an at-the-market offering, initiated in December 2009, resulting in the sale of approximately 1.2 million common shares for net proceeds of approximately $19.9 million in 2010;
a follow-on offering of approximately 7.6 million common shares that resulted in net proceeds of $85.1 million;
the payment to our shareholders of dividends totaling $0.60 per common share with total cash paid out amounting to $22.8$27.7 million;
the charter for 15-year periods of two DP2 suezmax shuttle tankers to be built with delivery expected in the fourth quarter of 2012 and first quarter of 2013, respectively; and
|
The Company operated the following types of vessels during, and at the end of 2010:2011:
Vessel Type | LNG carrier | VLCC | Suezmax | Aframax | Panamax | Handymax MR2 | Handysize MR1 | Total Fleet | LNG carrier | VLCC | Suezmax | Aframax | Panamax | Handymax MR2 | Handysize MR1 | Total Fleet | ||||||||||||||||||||||||||||||||||||||||||||||||
Average number of vessels | 1.0 | 3.0 | 8.4 | 12.7 | 7.0 | 6.0 | 8.0 | 46.1 | 1.0 | 3.0 | 9.1 | 11.7 | 9.0 | 6.0 | 8.0 | 47.8 | ||||||||||||||||||||||||||||||||||||||||||||||||
Number of vessels at end of year | 1.0 | 3.0 | 8.0 | 13.0 | 9.0 | 6.0 | 8.0 | 48.0 | 1.0 | 3.0 | 10.0 | 11.0 | 9.0 | 6.0 | 8.0 | 48.0 | ||||||||||||||||||||||||||||||||||||||||||||||||
Dwt at end of year (in thousands) | 86.0 | 900.0 | 1,311.0 | 1,398.0 | 651.0 | 318.0 | 298.0 | 4,962 | 86.0 | 900.0 | 1,626.0 | 1,194.0 | 651.0 | 318.0 | 298.0 | 5,073 | ||||||||||||||||||||||||||||||||||||||||||||||||
Percentage of total fleet | 1.7 | % | 18.1 | % | 26.4 | % | 28.2 | % | 13.1 | % | 6.4 | % | 6.0 | % | 100.0 | % | 1.7 | % | 17.7 | % | 32.1 | % | 23.5 | % | 12.8 | % | 6.3 | % | 5.9 | % | 100.0 | % | ||||||||||||||||||||||||||||||||
Average age, in years, at end of year | 3.9 | 15.8 | 5.6 | 4.4 | 3.9 | 5.5 | 4.5 | 6.8 | 4.9 | 16.8 | 5.5 | 3.7 | 4.9 | 6.5 | 5.5 | 7.0 | ||||||||||||||||||||||||||||||||||||||||||||||||
We believe that the key factors which determined our financial performance in 2010,2011, within the given freight rate environment in which we operated, were:
the diversified aspect of the fleet, including our acquisition in recent years of purpose-built vessels to access ice-bound ports and carry LNG (liquefied natural gas), which allowed us to take advantage of all tanker sectors;
the benefits of the new vessels acquired in recent years in terms of operating efficiencies and desirability on the part of charterers;
our balanced chartering strategy (discussed further below) which ensured a stable cash flow while allowing us to take advantage of any upside in the freight market;
the long-established relationships with our chartering clients and the development of new relationships with renowned oil-majors;
the continued control over costs by our technical managers despite pressures caused by rising operating and fuel costs;
our ability to mitigate financial costs by negotiating competitive terms with reputable banks;
our ability to manage leverage levels through cash generation and repayment/prepayment of debt;
our ability to reward our shareholders through a dividend policy which is linked directly to the profitability of the Company;policy;
our ability to raise new financing through bank debt at competitive terms despite the current tight credit environment; and
the sale of vessels when attractive opportunities arise.
We believe that the above factors will also be those that will be behind our future financial performance and will play an especially significant role in the current world economic climate as we proceed through 2011.2012 and into 2013. To these may be added:
a possible recovery in the product charter market during the year and for the crude charter market inby the latter partend of the year;
the securing of a high level of utilization for our vessels (as at March 31, 2011, 62%2012, 65% of the operational days available for 2011,2012, and 35%48% for 2012,2013, excluding expected new deliveries, have secured employment);
the continued appetite by oil majors to fix vessels on medium to long term charters at economic rates;
the delivery of the two newbuilding suezmaxes that will join the fleet in 2011 and the newbuilding suezmax shuttle tankers to be delivered in 2012 andearly 2013; and
the build upbuildup of our cash reserves through operations, vessel sales and possibly equity issuance.
We look forward from a 2010 backgroundConsiderable economic and political uncertainty remains in the world as we approach the second quarter of overcapacity of tankers and high crude inventory levels, and, more recently, with the images of Middle East political turmoil, civil war in Libya and natural catastrophe in Japan still before us. Against this backdrop, and the considerable uncertainty which still exists relating to the global economy, there2012. There are some positive signs of whichemanating from the most important is the continued recoveryU.S. in terms of the western economieseconomy and growthgrowing confidence of sustainable recovery. Recent measures in Europe to stabilize the financial situation of certain countries have also provided some confidence that feared dangers (sovereign debt default, Eurozone collapse) are now under control, or at least policies and instruments exist to minimize any potential impact of those dangers. Many of the developing nations. Rising oil demand and geopolitical factorscountries still have contributedsurging economies albeit with the occasional readjustment or correction in speed. Two significant dampers to an upward movement ofexpectations for the near future are increasing oil prices and potential conflict over Iran. The combination of rising demand for oil and supply limitations (including fear of future limitations) is leading to higher prices which will clearly lead to GDP growth inhibitions and therefore be detrimental to tanker demand. A conflict in the Arabian/Persian Gulf, while possibly resulting in a variation from current tanker trading routes which may continue through 2011. Demand from China, India and other developing
countries will continue to have aor may not be beneficial impact on transportation requirements for petroleum and its products in the absorption of capacity to meet demand.
We expect, therefore, that 2011 will also prove to be a challenging year for the tanker industry, even withsector, will likely lead to higher oil prices.
We believe it likely, therefore, that 2012 will be another difficult year, but could well see further occasional spikes in rates as we have seen so far this year. There is reserved optimism for the beneficial effecttanker sector that in 2012 on average, if we do not at least see a rebound from the depths of increasingthe trough in terms of rates, at least the trough should not deepen as far as crude oil demand. The current economic and financial problems, together withtransportation is concerned. On the forecasted increaseproduct trade there is increased optimism as the supply of new product carriers is considerably muted compared to the supply of crude tankers. In addition, new or upgraded refineries in the size of the global tanker fleet, will continueMiddle East and Asia are forecast to dampen the potential for reviving the returns from the transportation of oillead to the levels seen in previous years. Nevertheless, the governments of the world continue to make an effort to revitalize their own economies and by extension, the world economy. The rising level of oil prices has stopped the production cuts witnessed in 2009. The orderingexpansion of new vessels has eased and trading patterns with long-haul requirements will continue to absorb many of the new vessels to be delivered. In particular, the creation of new refining capacity in the East is expected to generate newlonger trade routes for product carriers. In addition, LNG carriers will continue to enjoy an extremely lucrative year given the high demand for natural gas and limited number of liquefied natural gas carriers. A further related area which together withmay enjoy respectable returns is in the reductionoff-shore support area, which would include storage and shuttle services to off-shore production units. The new fields off Brazil and West Africa are becoming increasingly attractive for development, especially in new orders in this sector, should lead to a boost in product carrier rates.the light of supply constraints from existing sources and rising oil prices.
Subsequent Events
On January 11, 2011, we17, 2012, the Company drew down $28.4 million, the available unused amount of an existing credit facility. On January 25, 2012, the Company announced a quarterly dividend of $0.15 per common share, which was paid on February 1, 201114, 2012 to shareholders of record on February 9, 2012. On January 25, 2011. On March 14, 2011, we announced a quarterly dividend of $0.15 per common share to be paid on April 28, 2011, to shareholders of record on April 21, 2011. On March 21, 2011, we signed with Sungdong yard of South Korea contracts for31, 2012, the construction of two suezmax DP2 shuttle tankers at a price of $92.0 million each, to be delivered in the fourth quarter of 2012 and first quarter of 2013, respectively. On March 23, 2011, the aframax tankerOpal Queen, recorded in the consolidated Balance Sheet as Held-for-Sale, was delivered to its new owners.Opal Queen was sold for $34.0 million, resulting in an estimated gain of $5.3 million. On April 4, 2011, weCompany agreed to the terms of a bank loan for an amount of $48.0$73.6 million relating to the financing of theits first DP2 suezmax shuttle tanker,Spyros K,expected to be delivered atin the endfirst quarter of April 2011.2013.
We are entering into a contract for the construction by Hyundai Heavy Industries of one 162,000 cbm LNG carrier. The vessel, which will be equipped with the latest tri-fuel diesel electric propulsion technology, will be scheduled for delivery in the first quarter of 2015. We also have an option for the construction of a second LNG carrier of the same specification, whose delivery would be scheduled for the fourth quarter 2015, if we exercise the option.
We have obtained options to acquire two 158,000 dwt suezmax newbuildings, the first of which would be expected to be delivered by Sungdong Shipbuilding in South Korea in this fiscal quarter, with the second newbuilding to be delivered in the first quarter of 2013. We would have a total of 14 suezmaxes in our fleet, if we acquire these vessels.
Chartering Strategy
We typically charter our vessels to third parties in any of five basic types of charter. First are “voyage charters” or “spot voyages,” under which a shipowner is paid freight on the basis of moving cargo from a loading port to a discharging port at a given rate per ton or other unit of cargo. Port charges, bunkers and other voyage expenses (in addition to normal vessel operating expenses) are the responsibility of the shipowner.
Second are “time charters,” under which a shipowner is paid hire on a per day basis for a given period of time. Normal vessel operating expenses, such as stores, spares, repair and maintenance, crew wages and insurance premiums, are incurred by the shipowner, while voyage expenses, including bunkers and port charges, are the responsibility of the charterer. The time charterer decides the destination and types of cargoes to be transported, subject to the terms of the charter. Time charters can be for periods of time ranging from one or two months to more than three years. The agreed hire may be for a fixed daily rate throughout the period or may be at a guaranteed minimum fixed daily rate plus a share of a determined daily rate above the minimum, based on a given variable charter index or on a decision by an independent brokers’ panel for a defined period. Many of our charters have been renewed on this time charter with profit share basis over the past three years. Time charters can also be “evergreen,” which means that they automatically renew for successive terms unless the shipowner or the charterer gives notice to the other party to terminate the charter.
Third are “bareboat charters” under which the shipowner is paid a fixed amount of hire for a given period of time. The charterer is responsible for substantially all the costs of operating the vessel including voyage expenses, vessel operating expenses, dry-docking costs and technical and commercial management. Longer-term time charters and bareboat charters are sometimes known as “period charters.”
Fourth are “contracts of affreightment” which are contracts for multiple employments that provide for periodic market related adjustments, sometimes within prescribed ranges, to the charter rates.
Fifth are “pools”. At various stages during 2010, eight2011, six of our vessels also entered into and operated within a pool of similar vessels whereby all income (less voyage expenses) is earned on a market basis and shared between pool participants on the basis of a formula which takes into account the vessel’s age, size and technical features.
Our chartering strategy continues to be one of fixing the greater portion of our fleet on medium to long-term employment in order to secure a stable income flow, but one which also ensures a satisfactory return. This strategy
has enabled us to level the effects of the cyclical nature of the tanker industry, achieving almost optimal utilization of the fleet. In order to capitalize on possible upturns in rates, we have chartered out several of our vessels on a basis related to market rates for either spot or time charter. As of March 31, 2011,2012, we have 3335 of our 4748 vessels on time charter or other form of period employment, ensuring thatresulting in at least 62%65% of the remaining days of 2011 year2012 and 35%48% of the available days of 2012 are2013 already being fixed.
Our Board of Directors, through its Chartering Committee, formulates our chartering strategy and our commercial manager Tsakos Energy Management implements this strategy through the Chartering Department of Tsakos Shipping. They evaluate the opportunities for each type of vessel, taking into account the strategic preference for medium and long-term charters and ensure optimal positioning to take account of redelivery opportunities at advantageous rates.
The cooperation with Tsakos Shipping, who still provide the Company with chartering services, enables us to take advantage of the long-established relationships they have built with many of the world’s major oil companies and refiners over 3839 years of existence and high quality commercial and technical service.
Since July 1, 2010, through our cooperation with TCM, the new technical managers, we are able to take advantage of the inherent economies of scale associated with two large fleet operators working together and its commitment to contain running costs without jeopardizing the vessels’ operations. TCM provides top grade officers and crew for our vessels and first class superintendent engineers and port captains to ensure that the vessels are in prime condition.
Critical Accounting Estimates
Our consolidated financial statements are prepared in accordance with U.S. generally accepted accounting principles. Our significant accounting policies are described in Note 1 of the attached consolidated financial statements.statements included elsewhere in this annual report. The application of such policies may require management to make
estimates and assumptions. We believe that the following are the more critical accounting estimates used in the preparation of our consolidated financial statements that involve a higher degree of judgment and could have a significant impact on our future consolidated results of operations and financial position:
Revenue recognition. Our vessels are employed under a variety of charter contracts, including time, bareboat and voyage charters, contracts of affreightment and pool arrangements. Time and bareboat charter revenues are recorded over the term of the charter as the service is provided. Revenues from voyage charters on the spot market or under contract of affreightment are recognized ratably from when a vessel becomes available for loading (discharge of the previous charterer’s cargo) to when the next charterer’s cargo is discharged, provided an agreed non-cancelable charter between the Company and the charterer is in existence, the charter rate is fixed or determinable and collectivity is reasonably assured. Vessel voyage and operating expenses and charter hire expense are expensed when incurred. The operating revenues and voyage expenses of vessels operating under a tanker pool are pooled and are allocated to the pool participants on a time charter equivalent basis, according to an agreed formula. Revenues from variable hire arrangements are recognized to the extent the variable amounts earned beyond an agreed fixed minimum hire at the reporting date and all other revenue recognition criteria are met.
Depreciation.We depreciate our vessels on a straight-line basis over their estimated useful lives, after considering their estimated residual values, based on the assumed value of the scrap steel available for recycling after demolition, calculated at $300 per lightweight ton since January 1, 2008 (previously calculated at $180 per lightweight ton). The impact of the increase in the scrap price used in the estimation of residual values was to reduce the depreciation charge for 2008 by $5.3 million. We revised our estimate of scrap prices, as prices in the past five years had reached historically high levels, significantly in excess of $300. Scrap prices currently approximate $500. While there remains overcapacity within the tanker sector and scrap prices remain at these levels we would expect scrapping to remain a viable alternative to trading older vessels. We also expect commodity prices to remain at buoyant levels as the economic recovery continues to gather pace. Given the historical volatility of scrap prices, management will monitor prices going forward and where a distinctive trend is observed over a given length of time, management may consider revising the scrap price accordingly. In assessing the useful lives of vessels, we have adopted the industry-wide accepted practice of assuming a vessel has a useful life of 25 years (40 years for the LNG carrier), given that all classification society rules have been adhered to concerning survey certification and statutory regulations are followed.
Impairment. The carrying value of the Company’s vessels includes the original cost of the vessels plus capitalized expenses since acquisition relating to improvements and upgrading of the vessel, less accumulated depreciation. Carrying value also includes the unamortized portion of deferred special survey and dry-docking costs. The carrying value of vessels usually differs from the fair market value applicable to any vessel, as market values fluctuate continuously depending on the market supply and demand conditions for vessels, as determined primarily by prevailing freight rates and newbuilding costs.
The Company reviews vessels for impairment whenever events or changes in circumstances indicate that the carrying amount of a vessel may not be recoverable, such as during severe disruptions in global economic and market conditions. When such indicators are present, a vessel to be held and used is tested for recoverability by comparing the estimate of future undiscounted net operating cash flows expected to be generated by the use of the vessel over its remaining useful life and its eventual disposition to its carrying amount. Future undiscounted net operating cash flows are determined by applying various assumptions regarding future revenues net of commissions, operating expenses, scheduled dry-dockings, expected off-hire and scrap values, and taking into account historical revenue data and published forecasts on future world economic growth and inflation.
These estimates are based on historical industry freight rate averages for each category of vessel taking into account the age, specifications and likely trading pattern of each vessel and the likely condition and operating costs of each vessel. Economic forecasts of world growth and inflation are also taken into account. Such estimations are inevitably subjective and actual freight rates may be volatile. As a consequence, estimations may differ considerably from actual results.
The estimations also take into account new regulations regarding the permissible trading of tankers depending on their structure and age. As a consequence of new European Union regulations effective from October 2003, the IMO adopted new regulations in December 2003 regarding early phase out of non-double hull tankers. Since April 2007, the Company has owned only double-hulled vessels.
While management, therefore, is of the opinion that the assumptions it has used in assessing whether there are grounds for impairment are justifiable and reasonable, the possibility remains that conditions in future periods may vary significantly from current assumptions, which may result in a material impairment loss. If the current economic recovery stalls or if oil prices continue to trend upwards, oil demand over an extended period of time could be negatively impacted. This will exacerbate the consequences of overcapacity in the tanker sector. In such circumstances, the possibility will increase that both the market value of the older vessels of our fleet and the future cash flow they are likely to earn over their remaining lives will be less than their carrying value and an impairment loss will occur. Management tests the value and future cash flows for the possibility of impairment on a quarterly basis.
Should the carrying value of the vessel exceed its estimated undiscounted cash flows, impairment is measured based on the excess of the carrying amount over the fair value of the asset. As vessel values are also volatile, the actual market value of a vessel may differ significantly from estimated values within a short period of time.
During the latter part 2009,2011, the global economicovercapacity in the crude tanker sector and market conditions, combined with a growing fleet,the lack of viable alternative employment for the older VLCCs led to a further fall in the values and earnings capacity of threetwo older vesselsVLCCs owned by the Company.Company,La Prudencia andLa Madrina. We performeddetermined that both vessels, at December 31, 2011, met the tests described above under various future scenarioscriteria to be classified as held for these vessels and arrivedsale. Therefore, we revalued them at a weighted estimated undiscounted future cash flow for each vessel.fair value less cost to sell. As a result, it was determined that the carrying values of the three vessels,Hesnes,Victory III andVergina II, were impaired in 2009 and an impairment loss of $19.1$39.4 million was incurred. During the latter part of 2010, when the tanker market remained exceptionally weak despite seasonal expectations, it became increasinglywas apparent that overcapacity in tanker supply was having a profound impact on rates and that the aframaxVergina IIwould suffer from age discrimination for the remainder of its life (five years). Taking this into account, it was determined that the carrying value of the vessel was further impaired and an impairment loss of $3.1 million was incurred in 2010. At December 31, 2010,2011, the market value of the fleet, as determined based on management estimates and assumptions and by making use of available market data and taking into consideration third party valuations was $2.3$2.0 billion, compared to a total carrying value also of $2.3$2.2 billion. While the future cash flow expected to be generated by all the vessels of the fleet, apart fromVergina IILa Prudencia andLa Madrina, was comfortably in excess of their carrying value, there were 2631 further vessels in our fleet that had an aggregate carrying value
of $189.7$396.7 million in excess of their combined market value as determined at December 31, 2010.2011. These vessels were:
| • | VLCC: |
| • | Suezmax:Spyros K, Dimitris P |
| • | Aframax:Proteas, Promitheas, Propontis, Izumo Princess, Sakura Princess, Maria Princess, Nippon Princess, Ise Princess, Asahi Princess, Sapporo Princess, Uraga Princess |
|
| • | Panamax:Selecao, Socrates, |
| • | Handymax:Artemis, Afrodite, Ariadne, |
| • | Handysize:Delphi, Amphitrite, Arion, Byzantion, Bosporos |
Allowance for doubtful accounts. Revenue is based on contracted charter parties and although our business is with customers whom we believe to be of the highest standard, there is always the possibility of dispute over terms and payment of freight and demurrage. In particular, disagreements may arise as to the responsibility for lost time and demurrage revenue due to the Company as a result. As such, we periodically assess the recoverability of amounts outstanding and we estimate a provision if there is a possibility of non-recoverability. Although we believe any provision that we might record to be based on fair judgment at the time of its creation, it is possible that an amount under dispute is not ultimately recovered and the estimated provision for doubtful recoverability is inadequate.
Amortization of deferred charges. In accordance with Classification Society requirements, a special survey is performed on our vessels every five years. A special survey requires a dry-docking. In between special surveys, a further intermediate survey takes place, for which a dry-docking is obligatory for vessels over ten years. During a dry-docking, work is undertaken to bring the vessel up to the condition required for the vessel to be given its classification certificate. The costs include the yard charges for labor, materials and services, possible new equipment and parts where required, plus part of the participating crew costs incurred during the survey period. We defer these charges and amortize them over the period up to the vessel’s next scheduled dry-docking.
Fair value of financial instruments. Management reviews the fair values of financial assets and liabilities included in the balance sheet on a quarterly basis as part of the process of preparing financial statements. The carrying amounts of financial assets and accounts payable are considered to approximate their respective fair values due to the short maturity of these instruments. The fair value of long-term bank loans with variable interest rates approximate the recorded values, generally due to their variable interest rates. The present value of the future cash flows of the portion of any long-term bank loan with a fixed interest rate is estimated and compared to its carrying amount. The fair value of the investments equates to the amounts that would be received by the Company in the event of sale of those investments, and any shortfall in from carrying value is treated as an impairment of the value of that investment. The fair value of the interest rate swap and bunker swap agreements held by the Company are determined through Level 2 of the fair value hierarchy as defined in FASB guidance and are derived principally from or corroborated by observable market data, interest rates, yield curves and other items that allow value to be determined. The fair values of impaired vessels are determined through Level 3 of the fair value hierarchy based on management estimates and assumptions and by making use of available market data and taking into consideration third party valuations.
Basis of Presentation and General Information
Voyage revenues. Revenues are generated from freight billings and time charters. Time and bareboat charter revenues are recorded over the term of the charter as the service is provided. Revenues from voyage charters on the spot market or under contract of affreightment are recognized ratably from when a vessel becomes available for loading (discharge of the previous charterer’s cargo) to when the next charterer’s cargo is discharged, provided an agreed non-cancelable charter between the Company and the charterer is in existence, the charter rate is fixed or determinable and collectivity is reasonably assured. The operating revenues of vessels operating under a tanker pool are pooled and are allocated to the pool participants on a time charter equivalent basis according to an agreed upon formula. Revenues from variable hire arrangements are recognized to the extent the variable amounts earned beyond an agreed fixed minimum hire at the reporting date and all other revenue recognition criteria are met. Unearned revenue represents cash received prior to the year end and is related to revenue applicable to periods after December 31 of each year.
Time Charter Equivalent (“TCE”) allows vessel operators to compare the revenues of vessels that are on voyage charters with those on time charters. For vessels on voyage charters, we calculate TCE by taking revenues earned on the voyage and deducting the voyage costs and dividing by the actual number of net earning days, which does not take into account off-hire days. For vessels on bareboat charters, for which we do not incur either voyage or operating costs, we calculate TCE by taking revenues earned on the charter and adding a representative amount for the vessels’ operating expenses. TCE differs from average daily revenue earned in that TCE is based on revenues before commissions less voyage expenses and does not take into account off-hire days.
Commissions. We pay commissions on all chartering arrangements to Tsakos Shipping, as our broker, and to any other broker we employ. Each of these commissions generally amounts to 1.25% of the daily charter hire or lump sum amount payable under the charter. In addition, on some trade routes, certain charterers may include in the charter agreement an address commission which is a payment due to the charterer, usually ranging from 1.25% to 3.75% of the daily charter hire or freight payable under the relevant charter. These commissions, as well as changes in prevailing charter rates, will cause our commission expenses to fluctuate from period to period.
Voyage expenses. Voyage expenses include all our costs, other than vessel operating expenses, that are related to a voyage, including port charges, canal dues and bunker fuel costs.
Charter hire expense. We hire certain vessels from third-party owners or operators for a contracted period and rate in order to charter the vessels to our customers. These vessels may be hired when an appropriate market opportunity arises or as part of a sale and lease back transaction or on a short-term basis to cover the time-charter obligations of one of our vessels in dry-dock. During 2010, we sold theDecathlon while it was on time-charter and in order to fulfill our obligations under that time-charter we chartered the vessel back on market terms from the buyers for 103 days under its new nameNordic Passat. Another vessel was chartered-in during 2010 to cover for the product carrierDidimon while it was in dry-dock. As of December 31, 2011 and 2010, the Company had no vessel under hire from a third-party.
Vessel operating expenses. These expenses consist primarily of manning, hull and machinery insurance, P&I and other vessel insurance, repairs and maintenance, stores and lubricant costs.
Management fees. These are the fixed fees we pay to Tsakos Energy Management under our management agreement with them. Prior to 2010, the existing management agreement was last amended effective January 1, 2007. According to the amendments, from each January 1, there is a prorated adjustment if at beginning of the year the Euro has appreciated by 10% or more against the U.S. Dollar since January 1, 2007, and an increase each year by a percentage figure reflecting 12 month Euribor, if both parties agree. As a consequence, from January 1, 2008,For 2012, monthly fees for operating vessels were increased to $23,000will be $27,500 per owned vessel and $17,000to $20,400 for chartered-in vessels or chartered out on a bareboat basis or vessels under construction. Under the same terms, theThe monthly fees have been increased to $23,700 and $17,500, respectively, effective January 1, 2009, and effective January 1, 2010, such fees were further increased to $24,000 and $17,700, respectively. Following the start of TCM as technical managers, the fees were raised from July 1, 2010, to $27,000 and $20,000, respectively ($32,000 in respect offee for the LNG carrier). It was agreed that no further increase shouldcarrier will be implemented at January 1, 2011.$35,000 from April 2012.
Depreciation. We depreciate our vessels on a straight-line basis over their estimated useful lives, after considering their estimated scrap values, calculated at $300 per lightweight ton. In assessing the useful lives of vessels, we have estimated them to be 25 years (40 years for the LNG carrier), which is in line with the industry wide accepted practice, assuming that all classification society rules have been adhered to concerning survey certification and statutory regulations are followed. Useful life is ultimately dependent on customer demand and if customers were to reject our vessels, either because of new regulations or internal specifications, then the useful life of the vessel will require revision.
Amortization of deferred charges. We amortize the costs of dry-docking and special surveys of each of our ships over the period up to the ship’s next scheduled dry-docking (generally every 5 years for vessels aged up to 10 years and every 2.5 years thereafter). These charges are part of the normal costs we incur in connection with the operation of our fleet.
Impairment loss. An impairment loss for an asset held for use should be recognized when indicators of impairment exist and when the estimate of undiscounted cash flows, expected to be generated by the use of the asset is less than its carrying amount (the vessel’s net book value plus any unamortized deferred dry-docking charges). Measurement of the impairment loss is based on the fair value of the asset as provided by third parties. An impairment loss for an asset held for sale should be recognized when its fair value less cost to sell is lower than its carrying value at the date it meets the held for sale criteria. In this respect, management reviews regularly the carrying amount of the vessels in connection with the estimated recoverable amount for each of the Company’s vessels. As a result of such reviews it was determined in 2011, 2010 and 2009 that an impairment loss had been incurred with respect to the carrying values of two older vessels in 2011, one older vessel in 2010 and three older vessels in 2009. There were no impairment losses in 2008.
General and administrative expenses. These expenses consist primarily of professional fees, office supplies, investor relations, advertising costs, directors’ liability insurance, and reimbursement of our directors’ and officers’ travel-related expenses.
Insurance claim proceeds. In the event of an incident involving one of our vessels, where the repair costs or loss of hire is insurable, we immediately initiate an insurance claim and account for such claim when it is determined that recovery of such costs or loss of hire is probable and collectability is reasonably assured within the terms of the relevant policy. Depending on the complexity of the claim, we would generally expect to receive
the proceeds from claims within a twelve month period. During 2010,2011, we received approximately $2.9$5.6 million in net proceeds from hull and machinery and loss of hire claims arising from incidents with or damage incurred on our vessels. Such settlements were generally received as credit-notes from our insurers, Argosy Insurance Company Limited, and used as a set off against insurance premiums due to that company. Within the consolidated statements of cash flows therefore, these proceeds are included in decreases in receivables and in decreases in accounts payable. There is no material impact on reported earnings arising from these settlements.
Financial Analysis
(Percentage calculations are based on the actual amounts shown in the accompanying consolidated financial statements)
Year ended December 31, 2011 versus year ended December 31, 2010
Voyage revenues
Voyage revenues earned in 2011 and 2010 per charter category were as follows:
| 2011 | 2010 | |||||||||||||||
| $ million | % of total | $ million | % of total | |||||||||||||
Time charter-bareboat | 9.3 | 2 | % | 9.3 | 2 | % | ||||||||||
Time charter-fixed rate | 67.0 | 17 | % | 69.8 | 17 | % | ||||||||||
Time charter-variable rate (profit share) | 123.4 | 32 | % | 162.6 | 40 | % | ||||||||||
Pool arrangement | 23.6 | 6 | % | 14.3 | 4 | % | ||||||||||
Voyage charter-contract of affreightment | 13.0 | 3 | % | 45.3 | 11 | % | ||||||||||
Voyage charter-spot market | 158.9 | 40 | % | 106.7 | 26 | % | ||||||||||
|
|
|
|
|
|
|
| |||||||||
Total voyage revenue | 395.2 | 100 | % | 408.0 | 100 | % | ||||||||||
|
|
|
|
|
|
|
| |||||||||
Revenue from vessels was $395.2 million during the year ended December 31, 2011 compared to $408.0 million during the year ended December 31, 2010, a 3.1% decrease. There was an average of 47.8 vessels in 2011 compared to an average of 46.1 in 2010. During the course of 2011, two tankers were sold and two tankers were acquired. Based on the total days that the vessels were actually employed as a percentage that we owned or controlled the vessels, the fleet had 97.1% employment compared to 97.6% in the previous year, the lost time being mainly off-hire of the two VLCC’sLa MadrinaandLa Prudencia,and due to dry-docking activity. In 2011, seven vessels undertook dry-docking and another seven vessels undertook dry-dock in 2010 (discussed further below).
Due to poorer market conditions in 2011 as a result primarily of excess capacity within the tanker sector, the increased bunker prices by 38%, coupled with the fact that we had more vessels on spot in 2011, the average time charter equivalent rate per vessel achieved for the year 2011 was $16,047 per day compared to $19,825 per day for the previous year. Only the smaller Handysize and Handymax tankers saw marginally better rates in 2011 than in 2010. Panamax tankers, which were under fixed employment throughout the year achieved lower TCE by 12%, compared to 2010, still earning more than the TCE that they would achieve trading in the spot market. Aframax tankers were trading on spot for more than half their available days in the year achieving a TCE 34% lower than in 2010. Suezmax rates achieved were 17% less on average in 2011 than in 2010. Suezmaxes were under profit sharing arrangements for most of their available days in both years earning only the minimum in 2011. The two VLCCsLa MadrinaandLa Prudenciaafter a long period of profitable fixed employment were trading on spot, earning substantially lower TCE compared to 2010, due to high bunker prices. The third VLCCMillenniumis under bareboat charter for both years. The LNG carrier was under time charter during 2011 and 2010 achieving a TCE below the breakeven levels.
Commissions
Commissions during 2011 amounted to $14.3 million compared to $13.8 million in 2010, a 3.3% increase. Commissions were 3.6% of revenue from vessels in 2011 compared to 3.4% in 2010. The increase in commission charges relates to changes in employment on several vessels, where commission rates were higher, especially in vessels employed in the spot market.
Voyage expenses
| Total voyage expenses per category | Average daily voyage expenses per vessel | |||||||||||||||||||||||
| Year ended December 31, | % increase/ (decrease) | Year ended December 31, | % increase/ (decrease) | |||||||||||||||||||||
| 2011 | 2010 | 2011 | 2010 | |||||||||||||||||||||
| U.S.$ million | U.S.$ million | U.S.$ | U.S.$ | |||||||||||||||||||||
Bunkering expenses | 91.5 | 54.5 | 67.9 | % | 20,079 | 13,271 | 51.3 | % | ||||||||||||||||
Port and other expenses | 35.7 | 31.3 | 14.1 | % | 7,830 | 7,608 | 2.9 | % | ||||||||||||||||
|
|
|
|
|
|
|
| |||||||||||||||||
Total voyage expenses | 127.2 | 85.8 | 48.2 | % | 27,909 | 20,879 | 33.7 | % | ||||||||||||||||
|
|
|
|
|
|
|
| |||||||||||||||||
Days on spot and Contract of Affreightment (COA) employment |
| 4,556 | 4,110 | 10.9 | % | |||||||||||||||||||
Voyage expenses include all our costs, other than vessel operating expenses and commissions that are related to a voyage, including port charges, agents’ fees, canal dues and bunker (fuel) costs. Voyage expenses were $127.2 million during 2011 compared to $85.8 million during the prior year, a 48.2% increase. The total operating days on spot charter and contract of affreightment totaled 4,556 days in 2011 compared to 4,110 days in 2010. Although voyage expenses are highly dependent on the voyage patterns followed and size of vessels employed on spot, much of the increase can be partly explained by the average cost of bunkers (fuel) purchased for the fleet increasing by 38% from 2010 to 2011, contributing to a $37.0 million increase in the overall expenditure on bunkers between the two years.
Charter hire expense
There was no charter hire expense in 2011. In 2010, charter hire expense amounted to $1.9 million. The charter hire expense in 2010 related primarily to the vesselDecathlon, which was sold to a third-party, but immediately re-chartered at market rate in order that the vessel fulfill its obligations relating to the charter that the vessel was employed on at the time of sale.
Vessel operating expenses
| Operating expenses per category | Average daily operating expenses per vessel | |||||||||||||||||||||||
| 2011 | 2010 | 2011 | 2010 | |||||||||||||||||||||
| U.S.$ million | U.S.$ million | % increase/ (decrease) | U.S.$ | U.S.$ | % increase/ (decrease) | |||||||||||||||||||
Crew expenses | 76.4 | 74.1 | 3.2 | % | 4,478 | 4,495 | (0.4 | )% | ||||||||||||||||
Insurances | 15.3 | 14.4 | 5.6 | % | 891 | 873 | 2.1 | % | ||||||||||||||||
Repairs and maintenance, and spares | 15.2 | 14.5 | 4.4 | % | 888 | 883 | 0.6 | % | ||||||||||||||||
Stores | 6.7 | 7.4 | (9.4 | )% | 391 | 447 | (12.5 | )% | ||||||||||||||||
Lubricants | 6.1 | 6.0 | 1.3 | % | 358 | 366 | (2.2 | )% | ||||||||||||||||
Quality and Safety | 1.5 | 1.7 | (8.3 | )% | 91 | 102 | (10.8 | )% | ||||||||||||||||
Other (taxes, registration fees, communications) | 8.7 | 7.9 | 9.8 | % | 509 | 481 | 5.8 | % | ||||||||||||||||
|
|
|
|
|
|
|
| |||||||||||||||||
Total operating expenses | 129.9 | 126.0 | 3.1 | % | 7,606 | 7,647 | (0.5 | )% | ||||||||||||||||
|
|
|
|
|
|
|
| |||||||||||||||||
Earnings capacity days excluding vessel on bare-boat charter |
| 17,066 | 16,471 | |||||||||||||||||||||
Vessel operating expenses include crew costs, insurances, repairs and maintenance, spares, stores, lubricants, quality and safety costs and other expenses such as tonnage tax, registration fees and communication costs. Total operating costs were $129.9 million during 2011, compared to $126.0 million during 2010, an increase of 3.1%, primarily due to the increase in earnings capacity days by 3.6%. As a percentage of voyage revenues, vessel operating expenses were 32.9% in 2011 and 30.9% in 2010.
Operating expenses per ship per day for the fleet decreased to $7,606 for 2011 from $7,647 in 2010. This was mostly due to cost reduction efforts and disposal of older vessels. The creation of TCM in 2010 which took over the technical management of the fleet, and the cooperation which existed between Tsakos Shipping and Columbia Shipmanagement Ltd. prior to July 1, 2010, the formal start date of TCM, resulted in a purchasing power based on the combined fleets managed by Tsakos Shipping and Columbia. This provided considerable savings in the purchase of stores, spares and lubricants both in 2011 and 2010. Approximately 49% of operating expenses (26% of total costs) incurred are in Euro, mainly relating to vessel officers (losing approximately $2.6 million due to the weakening of the US dollar by 5% during 2011), and also to various parts, supplies and repairs acquired or undertaken in Euro zone countries. Despite a weakening of the US dollar against the Euro during 2011, which negatively affected costs, operating expenses per ship per day remained stable due to the cost reduction efforts by our technical managers.
Depreciation
Depreciation was $101.1 million during 2011 compared to $92.9 million during 2010, an increase of $8.2 million, or 8.8%. This was partly due to the addition of six vessels acquired in 2010, and two vessels in 2011. All those additions are high-value new vessels which contribute in the increase of depreciation expense. In 2010 five vessels were sold, but they had all been accounted for as held for sale from the end of 2009 and, therefore, had no impact on depreciation expense during 2010 and 2011. In addition, the aframax tankerOpal Queenbore no depreciation during 2011 as it was accounted as held for sale from the end of 2010.
Amortization
We amortize the cost of dry-dockings related to classification society surveys over the period to the next dry-docking, and this amortization is included as part of the normal costs we incur in connection with the operation of our vessels. During 2011, amortization of deferred dry-docking charges was $4.9 million compared to $4.6 million during 2010, an increase of 7.1%. The increase is due to the completion of six new dry-dockings within 2011. The relatively small increase in amortization given the number of vessels dry-docked in 2011, was due to younger and smaller vessels that underwent their first dry-dockings in 2011, the costs of which were lower than dry-dockings of older and larger vessels. The next dry-docking of these vessels would be in five years, and, therefore, the amortization would be spread over this extended period resulting in a relatively lower annual charge, whereas older vessels would be amortized over 30 months.
Management fees
The Company pays to Tsakos Energy Management fixed fees per vessel under a management agreement between the companies. The fee pays for services that cover both the management of the individual vessels and of the enterprise as a whole. According to the amended management agreement (from January 2007), there is a prorated adjustment if at beginning of the year the Euro has appreciated by 10% or more against the U.S. Dollar since January 1, 2007, and an increase each year by a percentage figure reflecting 12 month Euribor, if both parties agree.
As a consequence, from January 1, 2010, monthly fees for owned operating vessels were $24,000 and for operating vessels chartered-in or chartered out on a bareboat basis or for vessels under construction, $17,700. From July 1, 2010, most of the fleet is managed by TCM, apart from four vessels which continued to be managed by Columbia Shipmanagement Ltd. until early 2011 and three by other third-party ship managers. Vessel
monthly fees were increased to $27,000 for owned operating vessels or approximately $99 per day per vessel, substantially less than the savings achieved from the creation of the new ship management company. The monthly fee relating chartered-in or chartered out on a bareboat basis or for vessels under construction increased to $20,000 and for the LNG carrier to $32,000. Management fees totaled $15.6 million during the year ended December 31, 2011, compared to $14.1 million for the year ended December 31, 2010, a 10.3% increase over the year ended December 31, 2010 due to increased management fees. Total fees include fees paid directly to a third-party ship manager in the case of the LNG carrier. Fees paid relating to vessels under construction are capitalized as part of the vessels’ costs. From January 1, 2012 monthly fees for operating vessels are $27,500 for vessels chartered out or on a bare-boat basis are $20,400 and from April 1, 2012 for the LNG carrier $35,000 of which $10,000 is paid to the Management company and $25,000 to a third party manager.
General and administrative expenses
General and administrative expenses consist primarily of professional fees, investor relations, office supplies, advertising costs, directors’ liability insurance, directors’ fees and reimbursement of our directors’ and officers’ travel-related expenses. General and administrative expenses were $4.3 million during 2011 compared to $3.6 million during 2010, an increase of 18.3 %. The increase is mainly due to new XBRL reporting system installed, costs and travelling expenses incurred on various new projects that were evaluated during the year and increased directors fees.
Total general and administrative expenses plus management fees paid to Tsakos Energy Management, the incentive award and stock compensation expense, together represent the overhead of the Company. On a per vessel basis, daily overhead costs were $1,188 in 2011 compared to $1,144 in 2010, the increase being mainly due to increases in management fees, general and administrative expenses described above, offset partly by the lack of an incentive award in 2011, and decrease in the stock compensation expense described below.
Management incentive award
There was no management incentive award in 2011. An amount of $0.4 million was awarded to Tsakos Energy Management for 2010.
Stock compensation expense
The compensation expense in 2011 of $0.8 million represents the 2011 portion of the total amortization of the value of restricted share units (“RSUs”). In 2010, an amount of $1.1 million was amortized. At the beginning of 2011, there were 199,750 RSUs granted, but unvested. A further 12,000 RSUs were awarded in the year, none forfeited, with 127,250 grants vesting in the year. Almost half of the RSUs outstanding had been issued to staff of the commercial and technical managers who are considered as non-employees. In the case of RSUs issued to non-employees, amortization is based on the share price on vesting with quarterly adjustments until vesting. As the average share price in 2011 was lower than in 2010, the amortization charge per outstanding RSU fell accordingly. Furthermore the average number of RSUs was lower in 2011 than 2010.
Gain on sale of vessels
During 2011, we sold the aframax tankersOpal Queen, which was held for sale at December 31, 2010, for net proceeds of $32.8 million resulting in a gain of $5.8 million and the aframax tankerVergina IIfor net proceeds of $9.7 million resulting in a loss of $0.8 million. During 2010, we sold the suezmax tankerDecathlon, the aframax tankersParthenon andMarathon and the panamax tankersHesnes andVictory III for total net proceeds of $140.5 million with total net gains of $19.7 million.
Vessel impairment charge
There was an impairment charge in 2011 of $39.4 million relating to the 1993 built VLCCLa Prudencia and the 1994 built VLCCLa Madrina. An impairment charge relating to the 1991 built aframax tankerVergina II totaled $3.1 million in 2010. The negative market forces existing in most of 2009 impacted the ability to charter older vessels at accretive rates. In the case of these three vessels, the total weighted average cash flow expected to be generated over the future remaining lives of the vessels under various possible scenarios, was less than the current carrying values of the vessels in our books and consequently the amount of carrying value in excess of the fair market value of these vessels was written-off as an impairment charge. The poor market for crude carriers continued through much of 2011 and especially in the fourth quarter when the expected usual seasonal uplift in rates did not occur because of the large increase in the supply of larger crude tankers which surpassed the demand for sea-transported crude oil. As these two VLCCs were amongst the oldest of double-hulled VLCCs, they were amongst the last to be considered for employment by charterers. Expectations for alternative employment for storage or conversion for off-shore projects also diminished towards the end of the year. As a consequence, the revised scenarios for our more recent cash flow tests gave greater probability to disposing of theLa Prudencia andLa Madrina. As such, both vessels were classified as held for sale and therefore the carrying values have been reduced to their fair value less cost to sell at December 31, 2011. In 2010, with respect toVergina II, our tests indicated that the vessel would not generate adequate cash flows in excess of her carrying value and therefore, at December 31, 2010, the carrying value has been reduced to the fair value.
At December 31, 2011, as vessel values continued to decline in the year, 31 of our vessels had carrying values in excess of market values. Apart from the two VLCCs mentioned above, the remainder of our fleet is for the most part young and in all these cases the vessels are expected to generate considerably more cash during their remaining expected lives than the carrying values as at December 31, 2011.
Operating loss/income
The loss from vessel operations was $37.7 million for 2011, including the impairment charge of $39.4 million, versus $80.7 million operating income for 2010, including an impairment charge of $3.1 million.
Interest and finance costs, net
| 2011 | 2010 | |||||||
| $ million | $ million | |||||||
Loan interest expense | 25.9 | 24.5 | ||||||
Interest rate swap cash settlements—hedging | 25.8 | 28.5 | ||||||
Less: Interest capitalized | (2.5 | ) | (2.5 | ) | ||||
|
|
|
| |||||
Interest expense, net | 49.2 | 50.5 | ||||||
Interest rate swap cash settlements—non-hedging | 9.0 | 7.2 | ||||||
Bunkers swap cash settlements | (6.4 | ) | (2.9 | ) | ||||
Change in fair value of non-hedging bunker swaps | 2.1 | 2.6 | ||||||
Amortization of deferred loss on de-designated interest rate swap | 1.5 | 1.3 | ||||||
Expense of portion of accumulated negative valuation of de-designated interest rate swap | 0.5 | 0.8 | ||||||
Change in fair value of non-hedging interest rate swaps | (3.6 | ) | 1.3 | |||||
Amortization of loan expenses | 1.0 | 1.1 | ||||||
Bank loan charges | 0.3 | 0.4 | ||||||
|
|
|
| |||||
Net total | 53.6 | 62.3 | ||||||
|
|
|
| |||||
Interest and finance costs, net were $53.6 million for 2011 compared to $62.3 million for 2010, a 14.0% decrease. Loan interest, excluding payment of swap interest, increased to $25.9 million from $24.5 million, a 5.7% increase. Total weighted average bank loans outstanding were approximately $1,539 million for 2011
compared to $1,495 million for 2010. However, cash settlements on both hedging and non-hedging interest rate swaps, based on the difference between fixed payments and variable 6-month LIBOR, decreased to $34.8 million from $35.7 million as LIBOR increased slightly during 2011. The average loan financing cost in 2011, including the impact of all interest rate swap cash settlements, was 3.89% compared to 3.98% for 2010. Capitalized interest in 2011 was $2.5 million in both years as there were four vessels under construction in each year, and average accumulated installments and average interest in the two years being approximately the same.
There was a positive movement in the fair value (mark-to-market) of the non-hedging interest rate swaps in 2011 of $3.6 million compared to a negative movement of $1.3 million in 2010. During 2010, the panamax tankersHesnesandVictory IIIwere sold. As a consequence, the interest rate swap relating to the loan which included the part financing of these vessels became ineligible for special hedge accounting and was de-designated. As a result, a part of the accumulated negative valuation relating to this swap amounting to $0.8 million was transferred from other comprehensive income to the income statement in 2010. In addition, the remaining part of the accumulated negative valuation relating to this interest rate swap is being amortized to earnings over the term of the original hedge. $1.5 million was amortized within 2011 and $1.3 million in 2010. In 2011, the aframax tankerVergina II, which was financed by the same loan, was also sold, and a further lump-sum of $0.5 million was transferred from the unamortized negative valuation directly to the income statement.
In 2009, the Company entered into swap arrangements relating to bunker (fuel) costs, which do not qualify as hedging instruments. In 2011, the Company received $6.4 million on these swaps in realized gains compared to $2.9 million in 2010. However, unrealized mark-to-market valuation losses were $2.1 million in 2011 and $2.6 million in 2010.
Amortization of loan expenses was $1.0 million in 2011 and approximately $1.1 million in 2010. Other loan charges, including commitment fees, amounted to $0.3 million in 2011 and 2010.
Interest and investment income
For 2011, interest and investment income amounted to $2.7 million almost unchanged from $2.6 million in 2010. In both years the income related to bank deposit interest. In 2011, the average total cash balances were lower than in 2010, but due to effective cash management and slightly better interest rates on deposits, investment income remained at the same levels as in 2010.
Non-controlling interest
The amount earned by the non-controlling interest (49%) shareholding of the subsidiary which owns the owning companies of the vesselsMaya andInca was $0.5 million in 2011 compared to $1.3 million in 2010. Although revenue earned per day was at the same level in 2011 and 2010, the difference was due to reduced operating expenses in 2010.
Net loss/income
As a result of the foregoing, net loss for 2011 was $89.5 million or $1.94 per diluted share versus net income of $19.8 million or $0.50 per diluted share for 2010.
Year ended December 31, 2010 versus year ended December 31, 2009
Voyage revenues
Voyage revenues earned in 2010 and 2009 per charter category were as follows:
| 2010 | 2009 | |||||||||||||||
| $ million | % of total | $ million | % of total | |||||||||||||
Time charter-bareboat | 9.3 | 2 | % | 9.3 | 2 | % | ||||||||||
Time charter-fixed rate | 69.8 | 17 | % | 111.0 | 25 | % | ||||||||||
Time charter-variable rate (profit share) | 162.6 | 40 | % | 170.2 | 38 | % | ||||||||||
Pool arrangement | 14.3 | 4 | % | 7.3 | 2 | % | ||||||||||
Voyage charter-contract of affreightment | 45.3 | 11 | % | 43.0 | 10 | % | ||||||||||
Voyage charter-spot market | 106.7 | 26 | % | 104.1 | 23 | % | ||||||||||
|
|
|
|
|
|
|
| |||||||||
Total voyage revenue | 408.0 | 100 | % | 444.9 | 100 | % | ||||||||||
|
|
|
|
|
|
|
| |||||||||
Revenue from vessels was $408.0 million during the year ended December 31, 2010 compared to $444.9 million during the year ended December 31, 2009, an 8.3% decrease. There was an average of 46.1 vessels in 2010
compared to an average of 46.6 in 2009. During the course of 2010, five tankers were sold, mostly in the earlier part of 2010 and six vessels were acquired, mostly in the latter part of the year. Based on the total days that the vessels were actually employed as a percentage that we owned or controlled the vessels, the fleet had 97.6% employment compared to 97.7% in the previous year, the lost time being mainly due to dry-docking activity. In 2010, seven vessels undertook dry-docking and eight vessels underwent dry-dock in 2009 (discussed further below).
Due to poorer market conditions in 2010 as a result primarily of excess capacity within the tanker sector and also to a slow recovery in oil demand and high oil inventories, the average time charter equivalent rate per vessel achieved for the year 2010 was $19,825 per day compared to $22,329 for the previous year. Only the VLCC and aframax categories saw marginally better rates in 2010 than in 2009. Suezmax rates achieved were 5% less on average than in 2009. The product carriers saw a significant decline in rates, with little profit-share being earned during 2010 and eight relatively lucrative time-charters ending during late 2009 and 2010 and new charters being fixed at lower rates. Nevertheless, these lower product carrier minimum time-charter rates were still higher than rates these vessels would have been able to earn in the spot market. The LNG carrier also ended a profitable charter in 2010 and was re-fixed for a year at a lower rate.
Commissions
Commissions during 2010 amounted to $13.8 million compared to $16.1 million in 2009, a 14.0% decrease compared to an 8.3% decrease in voyage revenues. Commissions were 3.4% of revenue from vessels in 2010 compared to 3.6% in 2009. The reduction in commission charges relates to changes in employment on several vessels where commission rates were less and to reduced rates by specific brokers on existing charters.
Voyage expenses
| Total voyage expenses per category | Average daily voyage expenses per vessel | |||||||||||||||||||||||
| Year ended December 31, | % increase/ (decrease) | Year ended December 31, | % increase/ (decrease) | |||||||||||||||||||||
| 2010 | 2009 | 2010 | 2009 | |||||||||||||||||||||
| $ million | $ million | $ million | $ million | |||||||||||||||||||||
Bunkering expenses | 54.5 | 47.8 | 14.1 | % | 13,271 | 11,253 | 17.9 | % | ||||||||||||||||
Port and other expenses | 31.3 | 29.4 | 6.4 | % | 7,608 | 6,917 | 10.0 | % | ||||||||||||||||
|
|
|
|
|
|
|
| |||||||||||||||||
Total voyage expenses | 85.8 | 77.2 | 11.1 | % | 20,879 | 18,170 | 14.9 | % | ||||||||||||||||
|
|
|
|
|
|
|
| |||||||||||||||||
Days on spot and Contract of Affreightment (COA) employment |
| 4,110 | 4,250 | (3.3 | )% | |||||||||||||||||||
Voyage expenses include all our costs, other than vessel operating expenses and commissions that are related to a voyage, including port charges, agents’ fees, canal dues and bunker (fuel) costs. Voyage expenses were $85.8 million during 2010 compared to $77.2 million during the prior year, an 11.1% increase, despite the fact that the total operating days on spot charter and contract of affreightment totaled 4,110 days in 2010 compared to 4,250 days in 2009. Although voyage expenses are highly dependent on the voyage patterns followed and size of vessels employed on spot, much of the increase can be partly explained by the average cost of bunkers (fuel) purchased for the fleet increasing by 32% from 2009 to 2010, contributing to a $6.7 million increase in the overall expenditure on bunkers between the two years.
Charter hire expense
Charter hire expense amounted to $1.9 million in 2010. There was no charter hire expense in 2009. The charter hire expense in 2010 related primarily to the vesselDecathlon, which was sold to a third-party, but immediately re-chartered at market rate in order that the vessel fulfill its obligations relating to the charter that the vessel was employed on at the time of sale.
Vessel operating expenses
| Operating expenses per category | Average daily operating expenses per vessel | |||||||||||||||||||||||
| 2010 | 2009 | 2010 | 2009 | |||||||||||||||||||||
| U.S.$ million | U.S.$ million | % increase/ (decrease) | U.S.$ | U.S.$ | % increase/ (decrease) | |||||||||||||||||||
Crew expenses | 74.1 | 79.0 | (6.3 | )% | 4,495 | 4,743 | (5.2 | )% | ||||||||||||||||
Insurances | 14.4 | 18.7 | (23.0 | )% | 873 | 1,118 | (21.9 | )% | ||||||||||||||||
Repairs and maintenance, and spares | 14.5 | 17.9 | (18.6 | )% | 883 | 1,071 | (17.6 | )% | ||||||||||||||||
Stores | 7.4 | 9.7 | (24.2 | )% | 447 | 583 | (23.3 | )% | ||||||||||||||||
Lubricants | 6.0 | 8.4 | (28.4 | )% | 366 | 505 | (27.5 | )% | ||||||||||||||||
Quality and Safety | 1.7 | 1.7 | (2.4 | )% | 102 | 104 | (1.9 | )% | ||||||||||||||||
Other (taxes, registration fees, communications) | 7.9 | 9.2 | (13.9 | )% | 481 | 553 | (13.0 | )% | ||||||||||||||||
|
|
|
|
|
|
|
| |||||||||||||||||
Total operating expenses | 126.0 | 144.6 | (12.8 | )% | 7,647 | 8,677 | (11.9 | )% | ||||||||||||||||
|
|
|
|
|
|
|
| |||||||||||||||||
Earnings capacity days excluding vessel on bare-boat charter |
| 16,471 | 16,656 | |||||||||||||||||||||
Vessel operating expenses include crew costs, insurances, repairs and maintenance, spares, stores, lubricants, quality and safety costs and other expenses such as tonnage tax, registration fees and communication costs. Total operating costs were $126.0 million during 2010, compared to $144.6 million during 2009, a decrease of 12.8%. As a percentage of voyage revenues, vessel operating expenses were 30.9% in 2010 and 32.5% in 2009.
Operating expenses per ship per day for the fleet decreased to $7,647 for 2010 from $8,677 in 2009, an 11.9% decrease. This decrease was in part due to reductions in crew expenses resulting from actions taken in 2009 and 2010 to cut costs by reducing the number of Greek officers on certain vessels. The creation of TCM in order to take over the technical management of the fleet, and the cooperation which existed between Tsakos Shipping and Columbia Shipmanagement Ltd. prior to July 1, 2010, the formal start date of TCM, resulted in a purchasing power based on the combined fleets managed by Tsakos Shipping and Columbia. This provided considerable savings in the purchase of stores, spares and lubricants. A reduction in P&I Club back calls contributed to the decrease in insurance costs. A 5% appreciation of the US dollar against the Euro during 2010 also benefited costs, as approximately 46% of operating expenses (26% of total costs) incurred are in Euro, mainly relating to vessel officers (saving approximately $2.3 million), but also to various parts, supplies and repairs acquired or undertaken in Euro zone countries.
Depreciation
Depreciation was $92.9 million during 2010 compared to $94.3 million during 2009, a decrease of $1.4 million, or 1.5%. This was partly due to the sale of one vessel in the fourth quarter of 2009 and five vessels during 2010. The five vessels sold in 2010 had all been accounted for as held for sale from the end of 2009 and, therefore, bore no depreciation during 2010. In addition, the depreciation charge relating to the aframaxVergina II was reduced following the impairment of its carrying value at the end of 2009. The impact of these vessels sold or impaired was to reduce the total depreciation charge for 2010 compared to 2009 by $9.7 million, offset by $8.3 million extra depreciation in 2010 over 2009 incurred by the addition of two new high-value vessels in 2009 and a further six in 2010.
Amortization
We amortize the cost of dry-dockings related to classification society surveys over the period to the next dry-docking, and this amortization is included as part of the normal costs we incur in connection with the operation of our vessels. During 2010, amortization of deferred dry-docking charges was $4.6 million compared to $7.2 million during 2009, a decrease of 37.1%. The decrease was mainly due to the sale of four vessels in 2010 that had dry-docking amortization amounting to $3.3 million in 2009, but no new amortization in 2010 due to their held for sale categorization as from the end of 2009. There were fourteen dry-dockings in the two years 2009 and 2010, which explains most of the net increase of approximately $0.7$2.7 million amortization in 2010 over 2009, after taking account of the amortization reduction due to sale of vessels. Ten of the dry-dockings in these two years related to younger and smaller vessels that underwent their first dry-dockings, the costs of which were lower than dry-dockings of older and larger vessels. The next dry-docking of these vessels would be in five years, and, therefore, the amortization would be spread over this extended period resulting in a relatively lower annual charge, whereas older vessels would be amortized over 30 months.
Management fees
The Company pays to Tsakos Energy Management fixed fees per vessel under a management agreement between the companies. The fee pays for services that cover both the management of the individual vessels and of the enterprise as a whole. According to the amended management agreement (from January 2007), there is a prorated adjustment if at beginning of the year the Euro has appreciated by 10% or more against the U.S. Dollar since January 1, 2007, and an increase each year by a percentage figure reflecting 12 month Euribor, if both parties agree.
As a consequence, from January 1, 2009 monthly fees for owned operating vessels increased from $23,000 to $23,700 and for operating vessels chartered-in or chartered out on a bareboat basis or for vessels under construction, from $17,000 to $17,500. From January 1, 2010, monthly fees for owned operating vessels increased from $23,700 to $24,000 and for operating vessels chartered-in or chartered out on a bareboat basis or for vessels under construction, from $17,500 to $17,700. From July 1, 2010, most of the fleet is managed by TCM, apart from four vessels which continued to be managed by Columbia Shipmanagement Ltd. until early 2011 and three by other third-party ship managers. Vessel monthly fees have been increased by $3,000 for owned operating vessels or approximately $85$99 per day per vessel, substantially less than the savings achieved from the creation of the new ship management company. The monthly fee relating chartered-in or chartered out on a bareboat basis or for vessels under construction increased to $20,000 and for the LNG carrier to $32,000. Management fees totaled $14.1 million during the year ended December 31, 2010, compared to $13.3 million for the year ended December 31, 2009, a 6.6% increase over the year ended December 31, 2009 due to increased management fees, offset by a slightly reduced fleet. Total fees include fees paid directly to a third-party ship manager in the case of the LNG carrier. Fees paid relating to vessels under construction are capitalized as part of the vessels’ costs.
General and administrative expenses
General and administrative expenses consist primarily of professional fees, investor relations, office supplies, advertising costs, directors’ liability insurance, directors’ fees and reimbursement of our directors’ and officers’ travel-related expenses. General and administrative expenses were $3.6 million during 2010 compared to $4.1 million during 2009, a decrease of 10.9 %. Apart from the result of a general effort to keep administrative costs down, there were significant reductions in legal fees, in advertising costs, in expenses associated with the issuance of the annual general meeting proxy statement and in costs related to project evaluations.
Total general and administrative expenses plus management fees paid to Tsakos Energy Management, the incentive award and stock compensation expense, together represent the overhead of the Company. On a per vessel basis, daily overhead costs were $1,144 in 2010 compared to $1,083 in 2009, the increase being mainly due to increases in management fees and the incentive award, offset partly by the reduction in general and administrative expenses described above, and decrease in the stock compensation expense described below.
Management incentive award
An amount of $0.4 million was awarded to Tsakos Energy Management for 2010. There was no management incentive award in 2009. The 2008 award amounted to $4.75 million and was paid in 2009.
Stock compensation expense
The compensation expense in 2010 of $1.1 million represents the 2010 portion of the total amortization of the value of restricted share units (“RSUs”). In 2009, a similar amount of $1.1 million was amortized. At the beginning of 2010, there were 399,500 RSUs granted, but unvested. A further 145,000 RSUs were awarded in the year and 3,100 forfeited, with 341,650 grants vesting in the year. The average number of RSUs was actually higher in 2010 than 2009. However, over half of the RSUs outstanding had been issued to staff of the commercial and technical managers who are considered as non-employees. In the case of RSUs issued to non-employees, amortization is based on the share price on vesting with quarterly adjustments until vesting. As the average share price in 2010 was lower than in 2009, the amortization charge per outstanding RSU fell accordingly.
Gain on sale of vessels
During 2010, we sold the suezmax tankerDecathlon for sales proceeds of $51.5 million resulting in a gain of approximately $5.9 million, the aframax tankersParthenon andMarathon for sales proceed of $39.5 million and $38.5 million, respectively, giving rise to gains of $8.4 million and $5.8 million, respectively, and the panamax tankersHesnes andVictory III for sales proceeds of $7.4 million and $7.2 million, respectively, with a gain of $0.1 million and a loss of $0.5 million, respectively. During 2009, the suezmaxPentathlon was sold for sales proceeds of $50.5 million and a capital gain of $5.1 million.
Vessel impairment charge
There was an impairment charge in 2010 of $3.1 million relating to the 1991 built aframax tankerVergina II. The vessel had previously incurred an impairment charge in 2009 together with the first generation 1990 built double-hull panamax tankersHesnes andVictory III. An impairment charge relating to these three vessels totaled $19.1 million in 2009. The negative market forces existing in most of 2009 impacted the ability to charter older vessels at accretive rates. In the case of these three vessels, the total weighted average cash flow expected to be generated over the future remaining life of the vessels under various possible scenarios, was less than the current carrying value of the vessels in our books and consequently the amount of carrying value in excess of the fair market value of these vessels was written-off as an impairment charge. The market continued to be poor in 2010 and especially in the fourth quarter when the expected usual seasonal uplift in rates did not occur and the probability ofVergina II finding new extended profitable employment after the end of its current charter
diminished in an environment of increasing discrimination against older vessels. As a consequence, the revised scenarios for our more recent cash flow tests gave greater probability to disposing of the vessels well before the end of 25 years. As such, the vessel would not generate adequate cash flow in excess of itstheir carrying value and therefore the carrying value, has been reduced to fair market at December 31, 2010.
At December 31, 2010, following a decline in vessel values in the latter part of the year, apart from theVergina II, a further 26 of our vessels had carrying values in excess of market values. The remainder of our fleet is, for the most part young and in all cases the vessels are expected to generate considerably more cash than the carrying values.
Operating income
Income from vessel operations was $80.7 million during 2010 versus $72.4 million during 2009, an 11.4% increase. As a percentage of voyage revenues, operating income was 19.8% in 2010 and 16.3% in 2009.
Interest and finance costs, net
| 2010 | 2009 | 2010 | 2009 | |||||||||||||
Loan interest expense | 24.5 | 41.1 | 24.5 | 41.1 | ||||||||||||
Swap interest expense | 35.8 | 19.9 | ||||||||||||||
Interest rate swap cash settlements-hedging | 28.5 | 17.9 | ||||||||||||||
Less: Interest capitalized | (2.5 | ) | (2.1 | ) | (2.5 | ) | (2.1 | ) | ||||||||
|
| |||||||||||||||
Interest expense, net | 57.8 | 58.9 | 50.5 | 56.9 | ||||||||||||
Interest rate swap cash settlements-non-hedging | 7.2 | 2.0 | ||||||||||||||
Bunkers swap cash settlements | (2.9 | ) | (1.7 | ) | (2.9 | ) | (1.7 | ) | ||||||||
Change in fair value of non-hedging bunker swaps | 2.6 | (6.5 | ) | 2.6 | (6.5 | ) | ||||||||||
Amortization of deferred loss on de-designated interest rate swap | 1.3 | — | 1.3 | — | ||||||||||||
Expense of portion of accumulated negative valuation of de-designated interest rate swap | 0.8 | — | 0.8 | — | ||||||||||||
Change in fair value of non-hedging interest rate swaps | 1.3 | (6.1 | ) | 1.3 | (6.1 | ) | ||||||||||
Amortization of loan expenses | 1.1 | 1.0 | 1.1 | 1.0 | ||||||||||||
Bank loan charges | 0.3 | 0.3 | 0.4 | 0.3 | ||||||||||||
|
| |||||||||||||||
Net total | 62.3 | 45.9 | 62.3 | 45.9 | ||||||||||||
|
| |||||||||||||||
Interest and finance costs, net were $62.3 million for 2010 compared to $45.9 million for 2009, a 35.8% increase. Loan interest, excluding payment of swap interest, decreased to $24.5 million from $41.1 million, a 40.3% decrease. Total weighted average bank loans outstanding were approximately $1,495 million for 2010 compared to $1,503 million for 2009. However, interest rate payments on interest swaps, based on the difference between fixed payments and variable 6-month LIBOR, increased to $35.8$35.7 million from $19.9 million as LIBOR fell during 2010. The average loan financing cost in 2010, including the impact of swap interest, was 3.98% compared to 4.00% for 2009. Capitalized interest in 2010 was $2.5 million and $2.1 million in the previous year. The increase is due primarily to the payments made on the new suezmaxes under construction based on contracts placed in late 2009.
There was a negative movement in the fair value (mark-to-market) of the non-hedging interest rate swaps in 2010 compared to a positive movement of $6.1 million in 2009. At the end of the first quarter, an agreement was made to sell the panamax tankerHesneswhich eventually was sold in the second quarter of 2010, and in the third quarter the panamax tankerVictory IIIwas also sold. As a consequence, the interest rate swap relating to the loan which included the part financing ofHesnesandVictory III became ineligible for special hedge accounting and was de-designated. As a result, a part of the accumulated negative valuation relating to this swap amounting to $0.8 million was transferred from other comprehensive income to the income statement. In addition, the remaining part of the accumulated negative valuation relating to this interest rate swap is being amortized to earnings over the term of the original hedge. The total amount amortized in 2010 was $1.3 million.
In 2009, the Company entered into swap arrangements relating to bunker (fuel) costs, which do not qualify as hedging instruments. In 2010, the Company received $2.9 million on these swaps in realized gains compared to $1.7 million in 2009. However, unrealized mark-to-market valuation losses were $2.6 million in 2010, whereas mark-to-market valuation gains amounted to nearly $6.5 million in 2009.
Amortization of loan expenses was $1.1 million in 2010 and approximately $1.0 million in 2009. Other loan charges, including commitment fees, amounted to $0.3$0.4 million in 2010 and $0.3 million in 2009.
Interest and investment income
For 2010, interest and investment income amounted to $2.6 million compared to $3.6 million in 2009. In both years the income related to bank deposit interest. In 2010, although the average total cash balances were slightly higher than in 2009, and interest rates on deposits were lower.
Non-controlling interest
The amount earned by the minority (49%) shareholding of the subsidiary which owns the owning companies of the vesselsMaya andInca was $1.3 million in 2010 compared to $1.5 million in 2009. Although these vessels earned less revenue per day in 2010 compared to 2009, the difference was more than offset by reductions in operating expenses.
Net income
As a result of the foregoing, net income for 2010 was $19.8 million or $0.50 per diluted share versus $28.7 million or $0.77 per diluted share for 2009.
Year ended December 31, 2009 versus year ended December 31, 2008
Voyage revenues
Revenue from vessels was $444.9 million during the year ended December 31, 2009 compared to $623.0 million during the year ended December 31, 2008, a 28.6% decrease despite an increase in the number of vessels to an average of 46.6 in 2009 from an average of 44.1 in 2008.
Due to much poorer market conditions in 2009, the average time charter equivalent rate per vessel achieved for the year 2009 was $22,329 per day compared to $34,600 for the previous year. During the course of 2009, two aframax tankers were newly-delivered to us and one vessel was sold. The fleet had 97.7% employment compared to 97.3% in the previous year, mainly due to dry-docking activity for surveys.
Commissions
Commissions during 2009 amounted to $16.1 million, or 3.6% of revenue from vessels compared to 3.7% in the prior year in which commissions totaled $23.0 million.
Voyage expenses
Voyage expenses include all our costs, other than vessel operating expenses and commissions that are related to a voyage, including port charges, agents’ fees, canal dues and bunker (fuel) costs. Voyage expenses were $77.2 million during 2009 compared to $83.1 million during the prior year, a 7.0% decrease, despite the fact that the total operating days on spot charter and contract of affreightment totaled 5,223 days in 2009 compared to only 2,712 days in 2008. Although voyage expenses are highly dependent on the voyage patterns followed, much of the decrease can be explained partly by the average cost of bunkers (fuel) falling considerably from 2008 to 2009, resulting in a $12 million reduction in the overall expenditure on bunkers between the two years. As a result, bunkers share of total voyage expenses fell to 62% from 72% in 2008 while port expenses in total increased by nearly $7 million and share of voyage expenses rose from 27% to 37%. As a percentage of voyage revenues, voyage expenses were 17.4% in 2009 and 13.3% in 2008.
Charter hire expense
There was no charter hire expense in 2009 while in 2008 charter hire expense amounted to $13.5 million. The charter hire expense in 2008 related primarily to the two vessels,Cape Baker andCape Balboa, which were time chartered had been chartered for several years until their repurchase by us in October and November 2008, respectively.
Vessel operating expenses
Vessel operating expenses include crew costs, maintenance, repairs, spares, stores, lubricants, insurance and sundry expenses such as tonnage tax, registration fees and communication costs. Total operating costs were $144.6 million during 2009 compared to $143.8 million during 2008, an increase of 0.6% despite the increase in the size of the fleet and the repurchase of two vessels previously chartered-in. As a percentage of voyage revenues, vessel operating expenses were 32.5% in 2009 and 23.1% in 2008. However, costs per vessel fell.
Operating expenses per ship per day for the fleet decreased to $8,677 for 2009 from $9,450 in 2008, an 8.2% decrease. This decrease was primarily due to decreases in crew costs mostly due to an appreciation of the US dollar during 2009 which also affected other costs. Also, several of the dry-dockings of vessels during 2009 were on relatively new vessels which did not require extensive routine repairs and replacements as occurred on the vessels dry-docked in the previous year, such costs being necessarily expensed as they were not part of the cost of dry-dockings.
Depreciation
Depreciation was $94.3 million during 2009 compared to $85.5 million during 2008, an increase of 10.3%, due to the repurchase of the two suezmaxes previously chartered-in plus the addition of two new, mostly high-value vessels towards the end of 2008 plus a further two similar vessels in 2009 partly offset towards the end of 2009 by the sale of one older vessel, the suezmaxPentathlon. We depreciate our vessels on a straight-line basis over their estimated useful lives, after considering their estimated residual values, based on the assumed value of the scrap steel available for recycling after demolition. For the purpose of estimating the residual values of vessels, the scrap is calculated at $300 per lightweight ton since the beginning of 2008 (previously a price of $180 was used, but scrap values increased substantially over recent years). In assessing the useful lives of vessels, we have adopted the industry-wide accepted practice of assuming a vessel has a useful life of 25 years (40 years for the LNG carrier), given that all classification society rules have been adhered to concerning survey certification and statutory regulations are followed.
Amortization
We amortize the cost of dry-dockings related to classification society surveys over the period to the next dry-docking, and this amortization is included as part of the normal costs we incur in connection with the operation of our vessels. During 2009, amortization of deferred dry-docking charges was $7.2 million compared to $5.3 million during 2008, an increase of 37.2%. The increase was mainly due to the heavy program of dry-dockings occurring throughout 2008 and 2009.
Management fees
Management fees are primarily the fixed fees per vessel we pay to Tsakos Energy Management Limited under the management agreement. The fee pays for services that cover both the management of the individual vessels and of the Company as a whole. The management agreement had been amended effective January 1, 2007, to raise the monthly fee to $20,000 per owned vessel and $15,000 for vessels chartered in or chartered out on a bareboat basis and for vessels under construction. Additionally, according to the same amendments, from January 1, 2008, there is a prorated adjustment if at beginning of the year the Euro has appreciated by 10% or more against the U.S. Dollar since January 1, 2007, and an increase each year by a percentage figure reflecting 12 month Euribor, if both parties agree. As a consequence, from January 1, 2008, the monthly fees for operating vessels were increased to $23,000 per owned vessel and $17,000 for chartered in vessels and vessels on bareboat charter and for vessels under construction. In accordance with the terms of the same agreement, monthly fees have been increased to $23,700 and $17,500, respectively, from January 1, 2009 and from January 1, 2010, to $24,000 and $17,700, respectively. During 2009, 11 vessels operated under third-party ship managers, and 5 vessels in 2008. Also six more vessels had their crewing operations managed by a third-party ship manager for both years.
Management fees totaled $13.3 million for 2009 compared to $12.0 million for 2008, an increase of 10.5%, due both to the increase in number of vessels in the fleet and the increase in monthly fees.
General and administrative expenses
General and administrative expenses consist primarily of professional fees, office supplies, advertising costs, directors’ liability insurance, directors’ fees and reimbursement of our directors’ and officers’ travel-related expenses. General and administrative expenses were $4.1 million during 2009 compared to $4.6 million during 2008, a decrease of 12.0 % due mainly to decreases in advertising and event expenses.
Total general and administrative expenses plus management fees paid to Tsakos Energy Management Limited represent the overhead of the Company. On a per vessel basis, daily overhead costs were $1,019 in 2009 compared to $1,031 in 2008, the decrease being mainly due to the decrease in general and administrative expenses offset partly
by increases in management fees. If the incentive award and stock compensation expense described below are taken into account, the 2009 daily overhead cost per vessel is $1,083 compared to $1,514 for 2008.
Management incentive award
As the 2009 targets for management to achieve an incentive award were not met, there is no management incentive award to be accounted for in 2009. The 2008 award amounted to $4.75 million and was paid in 2009 to Tsakos Energy Management.
Stock compensation expense
At the beginning of 2009, there were 283,000 RSUs granted, but unvested. A further 121,800 RSUs were awarded in the year and 5,300 forfeited, with no grants vesting in the year. The 2009 compensation expense of $1.1 million represents the 2009 portion of the total amortization of the value of these RSUs. In 2008, an amount of $3.0 million was amortized. The reduction in compensation expense is mainly due to the fact that approximately half of the RSUs were issued to staff of the commercial and technical managers who are considered as non-employees and, therefore, amortization is based on the share price on vesting with quarterly adjustments until vesting. As the average share price in 2009 was lower than in 2008, the amortization charge fell accordingly.
Amortization of the deferred gain on the sale of vessels.
There was no amortization of deferred gains in 2009 as the deferred gain relating to two suezmaxes sold in a sale and leaseback transaction during 2003 was fully amortized in 2008 following the decision to repurchase the vessels.
Gain on sale of vessels
During 2009, the suezmaxPentathlon was sold for net sales proceeds of $50.5 million and a capital gain of $5.1 million. During 2008, we sold the aframax tankerOlympia for net sales proceeds of $62.1 million resulting in a gain of approximately $34.6 million.
Vessel impairment charge
An impairment charge relating to three vessels and totaling $19.1 million was incurred in 2009. There was no impairment charge in 2008. During 2009 the negative market forces especially impacted the ability to charter older vessels at accretive rates. In the case of our three oldest vessels, the first generation 1990 built double-hull panamax tankersHesnes andVictory III, and the aframax tankerVergina II(built in 1991 and converted to double-hull in 2007), the total weighted average cash flow expected to be generated over the future remaining life of the vessels under various possible scenarios, was less than the current carrying value of the vessels in our books and consequently the amount of carrying value in excess of the fair market value of these vessels has been written-off as an impairment charge.
Operating income
Income from vessel operations was $72.4 million during 2009 versus $278.8 million during 2008, a 74.0% decrease. As a percentage of voyage revenues, operating income was 16.3% in 2009 and 44.8% in 2008.
Interest and finance costs, net
Interest and finance costs, net were $45.9 million for 2009 compared to $82.9 million for 2008, a 44.7% decrease. Loan interest, including payment of swap interest, decreased to $61.0 million from $70.2 million, a 13.2% decrease. Total weighted average bank loans outstanding were approximately $1,503 million for 2009 compared to $1,417 million for 2008. The average loan financing cost in 2009, including the impact of swap interest, was 4.07% compared to 4.87% for 2008.
There was a positive movement of $6.1 million in the fair value (mark-to-market) of the non-hedging interest rate swaps in 2009 compared to a negative $15.5 million for 2008.
Capitalized interest in 2009 was $2.1 million compared to $4.3 million in the previous year. The decline is due primarily to the decrease in the number of vessels under construction, with two newbuildings delivered in 2009, leaving only four to be delivered by the end of the third quarter of 2011.
In 2009, the Company entered into swap arrangements relating to bunker (fuel) costs which resulted in the receipt of $1.7 million in realized gains and a further $6.4 million in unrealized positive mark-to-market valuation gains.
Amortization of loan expenses was $0.9 million in 2009 and in 2008. Other loan charges, including commitment fees amounted to $0.3 million in 2009 and $0.6 million in 2008.
Interest and investment income
For 2009, interest and investment income amounted to $3.6 million compared to $8.4 million in 2008. In both years the income related to bank deposit interest. In 2009, the average total cash balances were slightly lower than 2008, and interest rates on deposits were lower.
Non-controlling interest
The amount earned by the minority (49%) shareholding of the subsidiary which owns the owning companies of the vesselsMaya andInca was $1.5 million in 2009 compared to $1.1 million in 2008. Although these vessels earned less revenue per day in 2009 compared to 2008, in 2008 they suffered from increased expenses and time lost resulting from dry-dockings for repair and special survey purposes.
Net income
As a result of the foregoing, net income for 2009 was $28.7 million or $0.77 per diluted share versus $202.9 million or $5.33 per diluted share for 2008.
Liquidity and Capital Resources
Our liquidity requirements relate to servicing our debt, funding the equity portion of investments in vessels, funding working capital and controlling fluctuations in cash flow. In addition, our newbuilding commitments, other expected capital expenditure on dry-dockings and possible vessel acquisitions, which in total equaled $113.8 million in 2011, $386.7 million in 2010 and $130.4 million in 2009, and $238.1 million in 2008, will again require us to expend cash in 20112012 and in future years. Net cash flow generated by operations is our main source of liquidity. Apart from the possibility of securingissuing further equity, additional sources of cash include proceeds from asset sales and borrowings, although all borrowing arrangements to date have specifically related to the acquisition of vessels.
We believe, given our current cash holdings (approximately $265 million at March 31, 2011) and the number of vessels we have on time charter, that even if there is a further major and sustained downturn in market conditions, our financial resources, including the cash expected to be generated within the year, will be sufficient to meet our liquidity and working capital needs through January 1, 2012,2013, taking into account our existing capital commitments and debt service requirements.
Working capital (non-restricted net current assets) amounted to approximately $137.0$1.9 million at December 31, 20102011 compared to $200.6$143.9 million at December 31, 2009.2010. Current assets decreased to $287.6 million at December 31, 2011 from $367.5 million at December 31, 2010 from $471.6 million at December 31, 2009 mainly due to decreased cash in non-restricted cash holdings by $100.9 million for the fivereasons described in the following paragraphs and the fact there were two vessels sold within 2010, which were accounted for at December 31, 20092011 as Held for sale in the Consolidated balance sheet with an aggregate net value of $120.9 million. There was$41.4 million, compared to only one vessel held for sale at December 31, 2010 with a value of $27.0.$27.0 million. Current liabilities decreasedincreased to $224.2$279.7 million at December 31, 2011 from $217.2 million at December 31, 2010, from $264.2 million due mainly to a decreasean increase in the current portion of long-term debt by approximately $38.8$63.2 million relating mainly to reduced expectedthe potential prepayments of debt on vessels held for sale.
Net cash provided by operating activities was $83.3$45.6 million during 20102011 compared to $117.2$83.3 million in the previous year, a 28.9%45.3% decrease. The decrease is mainly due to the decreasefall in revenue (net of voyage expenses) generated by operations offset by reduced operational expenses, and to higher receivables compared toas described in the previous year.section on voyage revenue above. Expenditure for dry-dockings is deducted from cash generated by operating activities. Total expenditure during 20102011 on dry-dockings amounted to $4.6million compared to $6.1 million compared to $4.3 million in 2009.2010. In 2011, dry-docking work was performed onArchangel,Alaska,Promitheas,Proteas,Amphitrite,Andromeda andArion. In 2010, dry-docking work was performed on
the vesselsDidimon,Ariadne,Propontis,Euronike,Eurochampion 2004,La Prudencia andLa Madrina. In 2009, dry-docking work was performed on the vesselsDelphi,Didimon,Promitheas,Vergina II,Ajax,Apollon,Artemis andAfrodite. Expenditure was higherlower in 2011 as all the vessels undertaking dry-dock were undertaking their first 5-year special survey while the vessels undertaking dry-dock in 2010 as the vessels were mostly larger than those vessels (mostly product carriers) dry-docked in 2009 andincludedLa Prudencia andLa Madrina (both VLCCs) werewhich are older and larger vessels requiring more work. Apart from the two VLCCs and theVergina II, all the vessels in both years underwent their first dry-docking.
Net cash used in investing activities was $240.1$69.2 million for the year 2010,2011, compared to $75.6$240.1 million for 2009.2010. In 2010,2011, we took delivery of and paid the final installments on the two suezmaxesSpyros K andDimitris P. Total expenditure on these two vessels in 2011 amounted to $66.6 million. Capitalized expenditure on improvements to existing vessels in 2011 amounted to $4.6 million. In 2010, we took delivery of two aframaxesSapporo Princess andUraga Princess for a total cost of $94.2 million. Also, in 2010, wemillion, acquired four 2009-built panamaxes for a total of $218.0 million and undertook certain improvements on several existing vessels amounting to $1.4 million. During 2009, the Company took delivery of two aframaxesAsahi PrincessandIse Princess, which together with improvements to existing vessels, totaled $103.3 million.Installments and capitalized expenditure amounting to $67.0$37.9 million in 2011 were also paid on vessels which are under construction compared to $22.8$67.0 million paid in 2009.2010. At December 31, 2010,2011, we had two DP2 suezmax shuttle tankers on order with total remaining payments totaling $61.6$148.7 million, all of which $21.6 million was paidwe expect to be covered by new debt (see below). Delivery of the vessels is expected in the first quarter, 2011. On March 21, 2011, the Company signed contracts for the construction of two DP2 suezmax shuttle tankers at a total contract price of $92.0 million each, with delivery in the fourth quarter of 2012 and the first quartersecond quarters of 2013, respectively. The anticipated payment schedule onfor the fourtwo vessels under construction, which is subject to change for delays or advanced work, is as follows (in $ millions) as at March 31, 2011:2012:
Contractual Obligations | 2011 | 2012 | 2013 | Total | 2012 | 2013 | Total | |||||||||||||||||||||
Quarter 1 | — | 27.6 | 46.0 | — | 46.8 | |||||||||||||||||||||||
Quarter 2 | 43.8 | 13.8 | — | 13.8 | 46.7 | |||||||||||||||||||||||
Quarter 3 | 33.0 | 13.8 | — | 27.6 | — | |||||||||||||||||||||||
Quarter 4 | 46.0 | — | 13.8 | — | ||||||||||||||||||||||||
Total Year | 76.8 | 101.2 | 46.0 | 224.0 | 55.2 | 93.5 | 148.7 | |||||||||||||||||||||
|
|
| ||||||||||||||||||||||||||
In the first quarter of 2010,2011, net sale proceeds from the sale of the aframax tankerParthenonOpal Queen amounted to $38.7$32.8 million and from the sale of the suezmaxaframax tankerDecathlonVergina IIto $50.7$9.7 million. In the second quarter, 2010, net sales proceeds from the sale of the aframaxMarathon amounted to $37.7 million and from the sale of the panamaxHesnes to $7.0 million. In the third quarter 2010, the panamaxVictory III was sold with net proceeds amounting to $6.4 million. In 2009,total net sale proceeds from the sale of the suezmax tankerPentathlonDecathlon, the aframax tankersParthenon inandMarathon and the fourth quarter of 2009panamax tankersHesnes andVictory III, amounted to $50.5$140.5 million.
Net cash provided byused in financing activities in 20102011 amounted to $137.2$77.3 million compared to net cash used in financing activities of $57.6$137.2 million in 2009.2010. Proceeds from new bank loans in 20102011 amounted to $235.0$96.7 million compared to $80.8$235.0 million in the previous year. Scheduled repayments of debt amounted to $106.2$119.2 million in 20102011 compared to $91.8$106.2 million of repayments in 2009.2010. Prepayments of debt as a result of vessel sales amounted to $24.2 million in 2011 compared to prepayments of $68.9 million (no prepayments in 2009). There2010. Although the Company announced, in August 2011, the authorization by the Board of Directors of a new share buyback program of up to $20.0 million, there were no repurchases of common shares during 2010.2011 and 2010, nor have there been in the first quarter of 2012. During 2009, as part of the share buy back program, 245,4002010, 1,199,833 shares were repurchased as treasury stock at a cost of $4.1 million. All the repurchases were open market transactions with a maximum price set by the Board of Directors. In December 2009, the Company initiatedsold for net proceeds $19.9 million under an at-the-market share issuance program for the sale of up to 3,000,000 common shares. During 2010, 1,199,833 shares were sold for net proceeds $19.9 million.that the Company had initiated in December 2009. The program was closed in September 2010. In 2009, 17,394 shares had been sold for net proceeds of approximately $0.3 million. On November 1, 2010, a follow-on offering the Company had initiated, closed with the sale of 6,726,457 common shares for $75.0 million, plus a further 896,861 common shares sold to Tsakos family interests for $10.1 million. Offering expenses amounted to $0.5 million.
A cash dividend of $0.30 was paid in April 2010 representing the final dividend for the fiscal year 2009.
In June 2010, the Company decided to change the dividend policy from a semi-annual payment basis to a quarterly payment basis. Thebasis, the first quarterly dividend of $0.15 wasbeing paid in July 2010 and a second quarterly dividend of $0.15 paid in October, 2010, bringing the total paid to $0.60 per common share and total payments in 2010 to $22.8 million.2010. In 2011, a quarterly dividend of $0.15 per share was announcedpaid in January for payment on February, 1April, August and November. Total dividend payments in 2011 amounting to $27.7 million. In 2012, a further quarterly dividend of $0.15 per share was declaredpaid on MarchFebruary 14, with payment on April 28.amounting to $6.9 million. In 2009,2010, total dividends amounted to $1.15$0.60 per common share and payments totaled $42.4$22.8 million. The dividend policy of the Company is to pay between 25% and 50% of the net income in any given year, payable, since the change in policy,a dividend on a quarterly basis. The payment and the amount are subject to the discretion of our board of directors and depend, among other things,
on available cash balances, anticipated cash needs, our results of operations, our financial condition, and any loan agreement restrictions binding us or our subsidiaries, as well as other relevant factors.
Investment in Fleet and Related Expenses
We operate in a capital-intensive industry requiring extensive investment in revenue-producing assets. As discussed previously in the section “Our Fleet,” we continue to have an active fleet development program resulting in a fleet of modern and young vessels with an average age of 6.97.3 years at March 31, 2011.2012. We raise the funds for such investments in newbuildings mainly from borrowings and partly out of internally generated funds. Newbuilding contracts generally provide for multiple staged payments of 5% to 10%, with the balance of the vessel purchase price paid upon delivery. ForIn the case of one the shuttle tankers currently under construction pre-delivery financing has been arranged for the part of the installment payments to the shipbuilding yard, and is being negotiated for the sister vessel under construction. Otherwise, for the equity portion of an investment in a newbuilding or a second-hand vessel, we generally pay from our own cash approximately 30% of the contract price. Repayment of the debt incurred to purchase the vessel is made from vessel operating cash flow, typically over eightseven to twelve years, compared to the vessel’s asset life of approximately 25 years (LNG carrier 40 years).
As of December 31, 2010,2011, we were committed to two newbuilding contracts totaling approximately $140.4$185.5 million (including extras), of which $78.8$36.8 million had been paid by December 31, 2010.2011. As mentioned above, we expect all of the remaining payments in 2012 and 2013 to be financed by bank debt.
Debt
As is customary in our industry, we anticipate financing the majority of our commitments on the newbuildings with bank debt. Generally we raise at least 70% of the vessel purchase price with bank debt for a period of between eightseven and twelve years (while the expected life of a tanker is 25 years and an LNG carrier is 40 years). For vessels for which we have secured long-term charters with first-class charterers, we would expect to raise up to 80% of the vessel purchase price with bank debt. As of December 31, 2010,2011, we had available unused and undesignated loan amounts under an existing credit facility totaling $32.5 million.$28.4 million, which was drawn down in full in January 2012. Financing amounting to $48.0$73.6 million has been arranged in January 2012 for the first DP2 suezmax shuttle tanker (80% of purchase price), under construction at December 31, 20102011 with expected delivery in February 2013. Negotiations for debt financing for the second suezmax, scheduled to be delivered at the end ofin April 2011. Negotiations for the second suezmax2013, are currently in progress and are expected to be concluded prior to delivery of the vessel in July 2011.shortly.
Summary of Loan Movements Throughout 20102011 (in $ millions):
Loan | Vessel | Balance at January 1, 2010 | New Loans | Repaid | Balance at December 31, 2010 | Vessel | Balance at January 1, 2011 | New Loans | Repaid | Balance at December 31, 2011 | ||||||||||||||||||||||||||
12-year term loan | Opal Queen | 17.4 | 0 | 1.8 | 15.6 | Opal Queen | 15.6 | 0 | 15.6 | 0 | ||||||||||||||||||||||||||
Credit facility | La Madrina, Hesnes, Vergina II, Victory III, Sakura Princess | 111.6 | 0 | 23.9 | 87.7 | La Madrina, Vergina II, Sakura Princess | 87.7 | 0 | 19.2 | 68.5 | ||||||||||||||||||||||||||
Credit facility | Silia T, Andes, Didimon, Antares, Izumo Princess, Aegeas | 173.7 | 0 | 13.2 | 160.5 | Silia T, Andes, Didimon, Amphitrite, Izumo Princess, Aegeas | 160.5 | 0 | 13.2 | 147.3 | ||||||||||||||||||||||||||
Credit facility | Millennium, Parthenon, Marathon, Triathlon, Eurochampion 2004, Euronike | 218.7 | 0 | 69.9 | 148.8 | Millennium, Triathlon, Eurochampion 2004, Euronike | 148.7 | 0 | 11.8 | 136.9 | ||||||||||||||||||||||||||
Credit facility | Archangel, Alaska, Arctic, Antarctic | 115.6 | 0 | 10.5 | 105.1 | Archangel, Alaska, Arctic, Antarctic | 105.1 | 0 | 10.6 | 94.5 | ||||||||||||||||||||||||||
Credit facility | Delphi, La Prudencia, Byzantion, Bosporos | 117.7 | 0 | 8.4 | 109.3 | Delphi, La Prudencia, Byzantion, Bosporos | 109.4 | 0 | 8.4 | 101.0 | ||||||||||||||||||||||||||
Credit facility | Artemis, Afrodite, Ariadne, Ajax, Apollon, Aris, Proteas Promitheas, Propontis | 311.0 | 0 | 20.0 | 291.0 | Artemis, Afrodite, Ariadne, Ajax, Apollon, Aris, Proteas Promitheas, Propontis | 291.0 | 0 | 20.0 | 271.0 | ||||||||||||||||||||||||||
10-year term loan | Arion, Andromeda | 41.4 | 0 | 3.1 | 38.3 | Arion, Andromeda | 38.3 | 0 | 3.1 | 35.2 | ||||||||||||||||||||||||||
Credit facility | Maya, Inca | 56.8 | 0 | 4.3 | 52.5 | Maya, Inca | 52.5 | 0 | 4.4 | 48.1 | ||||||||||||||||||||||||||
Credit facility | Neo Energy | 104.9 | 0 | 2.4 | 102.5 | Neo Energy | 102.5 | 0 | 5.0 | 97.5 | ||||||||||||||||||||||||||
10-year term loan | Maria Princess, Nippon Princess | 82.9 | 0 | 5.6 | 77.3 | Maria Princess, Nippon Princess | 77.3 | 0 | 5.5 | 71.8 | ||||||||||||||||||||||||||
Credit facility | Selecao, Socrates | 75.1 | 0 | 4.6 | 70.5 | Selecao, Socrates | 70.5 | 0 | 4.6 | 65.9 | ||||||||||||||||||||||||||
10-year term loan | Ise Princess | 35.8 | 0 | 2.3 | 33.5 | Ise Princess | 33.5 | 0 | 2.3 | 31.2 | ||||||||||||||||||||||||||
10-year term loan | Asahi Princess | 40.0 | 0 | 2.6 | 37.4 | Asahi Princess | 37.4 | 0 | 2.7 | 34.7 | ||||||||||||||||||||||||||
12-year term loan | Sapporo Princess | 0 | 40.0 | 1.2 | 38.8 | Sapporo Princess | 38.8 | 0 | 2.5 | 36.3 | ||||||||||||||||||||||||||
10-year term loan | Uraga Princess | 0 | 39.0 | 1.3 | 37.7 | Uraga Princess | 37.7 | 0 | 2.6 | 35.1 | ||||||||||||||||||||||||||
7-year term loan | World Harmony | 0 | 35.0 | 0 | 35.0 | World Harmony | 35.0 | 0 | 2.3 | 32.7 | ||||||||||||||||||||||||||
7-year term loan | Chantal | 0 | 35.0 | 0 | 35.0 | Chantal | 35.0 | 0 | 2.3 | 32.7 | ||||||||||||||||||||||||||
10-year term loan | Selini | 0 | 43.9 | 0 | 43.9 | Selini | 43.9 | 0 | 3.2 | 40.7 | ||||||||||||||||||||||||||
8-year term loan | Salamina | 0 | 42.1 | 0 | 42.1 | Salamina | 42.1 | 0 | 2.6 | 39.5 | ||||||||||||||||||||||||||
10-year term loan | Spyros K | 0 | 48.0 | 1.6 | 46.4 | |||||||||||||||||||||||||||||||
9-year term loan | Dimitris P | 0 | 48.7 | 0 | 48.7 | |||||||||||||||||||||||||||||||
|
|
|
| |||||||||||||||||||||||||||||||||
Total | 1,502.6 | 235.0 | 175.1 | 1,562.5 | 1,562.5 | 96.7 | 143.5 | 1515.7 | ||||||||||||||||||||||||||||
|
|
|
| |||||||||||||||||||||||||||||||||
As a result of such financing activities, long-term debt increaseddecreased in 20102011 by a net amount $59.9of $46.8 million compared to a net decreaseincrease of $11.0$59.9 million in 2009.2010. The debt to capital (equity plus debt) ratio was 60.5%62.2% at
December 31, 20102011 or, net of cash, 55.6%59.1%. As a percentage of total liabilities against total assets at fair value, our consolidated leverage (a non-GAAP measure) as computed in accordance with our credit facilities at December 31, 20102011 was 56.9%68.9%, well below the loan covenant maximum of 70% which is applicable to all the above loans on a fleet and total liabilities basis. With respect to only one of our loans, as further discussed below, the leverage was in excess of the requirement at December 31, 2011.
All other bankthe loan covenantsagreements also include a requirement for the value of the vessel or vessels secured against the related loan to be at least 120% of the outstanding debt thereunder at all times. As at December 31, 2011, in certain cases, due to the fall in tanker values, the value-to-loan ratios were less than 120% and, therefore, we were in non-compliance with this covenant. In such circumstances, upon request from our lenders, we have also been metto either provide the lenders acceptable additional security with a net realizable value at least equal to the shortfall, or prepay an amount that will eliminate the shortfall, which would amount to $65.4 million in the aggregate. Even though none of our lenders have requested prepayment or additional collateral, nor have any declared an event of default under the applicable loan agreements, if not remedied when requested, these non-compliances would constitute events of default and could result in the lenders requiring immediate repayment of the loans. Two of these loans (together totaling $169.4 million at December 31, 2011) include the vesselsLa Madrina andLa Prudencia as security. These vessels are accounted for as held for sale and management expects to sell these vessels within 2012. On sale of these vessels it is expected that, in accordance with the terms of the respective
loans, prepayments will be calculated on a basis that takes into account the value-to-loan ratios of the remaining vessels providing security to the loans. These prepayments, based on estimated values as at December 31, 2010. 2011, are expected to amount to $56.9 million in addition to scheduled payments within 2012. This amount has been reclassified as a current liability as of December 31, 2011. In addition, a further $8.6 million has been reclassified as a current liability as of December 31, 2011 in relation to a further seven loans (together totaling $451 million at December 31, 2011) which were in non-compliance relating to the value-to-loan ratios at December 31, 2011. One of these nine loans relates to the financing of the subsidiary company in which we have a 51% interest. This loan has a leverage covenant similar to that defined above which relates only to the assets and liabilities of that particular company. As at December 31, 2011, the leverage on this particular loan only was in excess of 70%. We have agreed upon the terms of a waiver of this covenant covering the period from December 31, 2011 through December 31, 2012. We have also agreed to make a prepayment of $8.1million on the loan against the balloon installment due in 2016 and to increases in the interest rate margin during the waiver period and the remaining term of the loan. As existing cash is deducted from both assets and liabilities to calculate leverage, apart from the generation of new cash from operations or equity input, only an increase of vessel value or alternative additional security (of up to $11.3 million, with no change in vessel value) would bring the leverage ratio down to 70% upon expiration of the waiver.
In all the aforementioned cases we do not expect to pay down the loans in 2012 beyond the amounts that we have already classified as current liabilities, even though all the loan agreements do include the right of lenders to accelerate repayments and even foreclose their liens on the vessels. The majority of our loan agreements also contain a cross-default provision that may be triggered by a default under one of our other loans. A cross-default provision means that a default on one loan would result in a default on all of our other loans. Because of the presence of cross-default provisions in our credit facilities under which $1,373 million was outstanding as of December 31, 2011, out of our total outstanding indebtedness of approximately $1.5 billion as of that date, the refusal of any one lender to grant or extend a waiver could result in most of our indebtedness being accelerated even if our other lenders have waived covenant defaults under the respective credit facilities.
Interest payable is usually at a variable rate, based on six-month LIBOR plus a margin. Interest rate swap instruments coveredcurrently cover approximately 56%50% of the outstanding debt as of March 31, 2011,April 2012. Seven of the existing thirteen interest rate swaps will mature in the second half of 2012, bringing coverage to an estimated 27% of expected outstanding debt at the end of 2012. We review our hedging position relating to interest on a continuous basis and further coverage is being discussedhave regular discussions with major banks.banks with regards to terms for potential new instruments to hedge our interest.
Off-Balance Sheet Arrangements
None.
Long-Term Contractual Obligations as of December 31, 20102011 (in $ millions) were:
Contractual Obligations | Total | Less than 1 year (2011) | 1-3 years (2012-2013) | 3-5 years (2014-2015) | More than 5 years (after January 1, 2016) | Total | Less than 1 year (2012) | 1-3 years (2013-2014) | 3-5 years (2015-2016) | More than 5 years (after January 1, 2017) | ||||||||||||||||||||||||||||||
Long-term debt obligations (excluding interest) | 1,562.5 | 133.8 | 272.7 | 347.3 | 808.7 | 1,515.7 | 197.0 | 245.7 | 423.5 | 649.4 | ||||||||||||||||||||||||||||||
Interest on long-term debt obligations | 304.0 | 54.5 | 89.4 | 91.4 | 68.7 | 153.2 | 31.4 | 42.2 | 46.0 | 33.6 | ||||||||||||||||||||||||||||||
Purchase Obligations (newbuildings) | 61.6 | 61.6 | 148.7 | 55.2 | 93.5 | — | — | |||||||||||||||||||||||||||||||||
Management Fees payable to Tsakos Energy Management (based on existing fleet plus contracted future deliveries as at December 31, 2010) | 145.6 | 15.5 | 31.1 | 31.3 | 67.7 | |||||||||||||||||||||||||||||||||||
Management Fees payable to Tsakos Energy Management (based on existing fleet plus contracted future deliveries as at December 31, 2011) | 148.8 | 16.0 | 31.2 | 31.1 | 70.3 | |||||||||||||||||||||||||||||||||||
Total | 2,073.7 | 265.4 | 393.2 | 470.0 | 945.1 | 1,966.4 | 299.6 | 412.6 | 500.6 | 753.3 | ||||||||||||||||||||||||||||||
The amounts shown above for interest obligations include contractual fixed interest obligations and interest obligations for floating rate debt as at December 31, 20102011 based on the amortization schedule for such debt and the average interest rate as described in “Item 11. Quantitative and Qualitative Disclosures About Market Risk.” The Company is a party to floating-to-fixed interest rate swaps covering notional amounts aggregating $859.2 million at December 31, 2010 that effectively convert the Company’s interest rate exposure from a floating rate based on LIBOR to a fixed rate. Three of these swaps covering a total notional amount of $263.6 million include cap and floor option features by which interest rate payable may revert to a variable rate if certain defined criteria based on LIBOR or US swap rates are breached. Obligations arising from swaps are based on rates described in “Item 11.”
| Item 6. | Directors, Senior Management and Employees |
The following table sets forth, as of March 31, 2011,2012, information for each of our directors and senior managers.
Name | Age | Positions | Year First Elected | Age | Positions | Year First Elected | ||||||||||||||
D. John Stavropoulos | 78 | Chairman of the Board | 1994 | 79 | Chairman of the Board | 1994 | ||||||||||||||
Nikolas P. Tsakos | 47 | President and Chief Executive Officer, Director | 1993 | 48 | President and Chief Executive Officer, Director | 1993 | ||||||||||||||
Michael G. Jolliffe | 61 | Deputy Chairman of the Board | 1993 | 62 | Deputy Chairman of the Board | 1993 | ||||||||||||||
George V. Saroglou | 46 | Vice President, Chief Operating Officer, Director | 2001 | 47 | Vice President, Chief Operating Officer, Director | 2001 | ||||||||||||||
Paul Durham | 60 | Chief Financial Officer | — | 61 | Chief Financial Officer | — | ||||||||||||||
Vladimir Jadro | 65 | Chief Marine Officer | — | 66 | Chief Marine Officer | — | ||||||||||||||
Peter Nicholson | 77 | Director | 1993 | |||||||||||||||||
Peter C. Nicholson | 78 | Director | 1993 | |||||||||||||||||
Francis T. Nusspickel | 70 | Director | 2004 | 71 | Director | 2004 | ||||||||||||||
William A. O’Neil | 83 | Director | 2004 | 84 | Director | 2004 | ||||||||||||||
Richard L. Paniguian | 61 | Director | 2009 | 62 | Director | 2009 | ||||||||||||||
Aristides A.N. Patrinos | 63 | Director | 2006 | 64 | Director | 2006 | ||||||||||||||
Takis Arapoglou | 60 | Director | 2011 | 61 | Director | 2011 | ||||||||||||||
Efthimios E. Mitropoulos | 72 | Director | 2012 | |||||||||||||||||
Certain biographical information regarding each of these individuals is set forth below.
D. JOHN STAVROPOULOS
CHAIRMAN
Mr. Stavropoulos served as Executive Vice President and Chief Credit Officer of The First National Bank of Chicago and its parent, First Chicago Corporation, before retiring in 1990 after 33 years with the bank. He chaired the bank’s Credit Strategy Committee, Country Risk Management Council and Economic Council. His memberships in professional societies have included Robert Morris Associates (national director), the Association of Reserve City Bankers and the Financial Analysts Federation. Mr. Stavropoulos was appointed by President George H.W. Bush to serve for life on the Presidential Credit Standards Advisory Committee. Mr. Stavropoulos was elected to the board of directors of Aspis Bank in Greece and served as its Chairman from July 2008 to April 2010. Mr. Stavropoulos was a director of CIPSCO from 1979 to 1992, an instructor of Economics and Finance at Northwestern University from 1962 to 1968, serves as a member on the EMEA Alumni Advisory Board of the Kellogg School of Management and is a Chartered Financial Analyst.
NIKOLAS P. TSAKOS
PRESIDENT
Mr. Tsakos has been President, Chief Executive Officer and a director of the Company since inception. Mr. Tsakos is the sole shareholder of Tsakos Energy Management Limited. He has been involved in ship management since 1981 and has 36 months of seafaring experience. He is the former President of the Hellenic Marine Environment Protection Agency (HELMEPA). Mr. Tsakos is a member of the councilexecutive committee of the Independent Tanker Owners Association (INTERTANKO), a board member of the UK P&I Club, a board member of the Union of Greek Shipowners (UGS), a council member of the board of the Greek Shipping Co-operation Committee (GSCC) and a council member of the American Bureau of Shipping (ABS), Bureau Veritas (BV) and of the Greek Committee of Det Norske Veritas (DNV) and a board member of Bank of Cyprus. He graduated from Columbia University in New York in 1985 with a degree in Economics and Political Science and obtained a Masters Degree in Shipping, Trade and Finance from the City of London University Business School in 1987. In 2011, Mr. Tsakos was awarded an honorary doctorate from the City of London University Business School, for his pioneering work in the equity financial markets relating to shipping companies. Mr. Tsakos served as an officer in the Hellenic Navy in 1988. Mr. Tsakos is the cousin of Mr. Saroglou.
MICHAEL G. JOLLIFFE
DEPUTY CHAIRMAN
Mr. Jolliffe has been joint Managing Director and then Deputy Chairman of Wigham-Richardson Shipbrokers Ltd., oneour Board since 1993. He is a director of the oldest established shipbrokinga number of companies in the City of London, since 1987shipping, agency representation, shipbroking capital services, mining and Chairman of Shipping Spares Repairs and Supplies Ltd., an agency company based in Piraeus, Greece since 1976.telemarketing. Mr. Jolliffe is also the Joint PresidentChief Executive Officer of Hanjin Eurobulk Ltd.,Titans Maritime Ltd, a shipping company set up in joint venture between Hanjin Shipping Co., Ltd., of Seoul, KoreaTsakos/Jolliffe families and Wigham-Richardson Shipbrokers Ltd.Anchorage Capital, a N.Y. fund manager. He is also Chairman of the BoardWighams Group of StealthGas Inc., a shipping company whose common stock is listed on the Nasdaq Global Select Market. Mr.companies owning companies involved in shipbroking, agency representation and capital markets businesses. Mr Jolliffe is also a director of INTERNETQ,InternetQ a tele-marketingtelemarketing, multi player games and social content company quoted on the London AIM Stock Marketstock exchange as well as the Chairman of Papua Mining Plc, a gold and hecopper mining company quoted on the London AIM. Michael Jolliffe is chief executive officeralso Chairman of Titans Maritime Ltd.,StealthGas a private shipping company.company owning 36 LPG ships and 4 product tankers and which is quoted on the NASDAQ stock exchange in New York.
GEORGE V. SAROGLOU
CHIEF OPERATING OFFICER
Mr. Saroglou has been Chief Operating Officer of the Company since 1996. Mr. Saroglou is a shareholder and director of Pansystems S.A., a leading Greek information technology systems integrator, where he also worked from 1987 until 1994. From 1995 to 1996 he was employed in the Trading Department of the Tsakos Group. He graduated from McGill University in Canada in 1987 with a Bachelors Degree in Science (Mathematics). Mr. Saroglou is the cousin of Mr. Tsakos.
PAUL DURHAM
CHIEF FINANCIAL OFFICER
Mr. Durham joined the Tsakos Grouporganization in 1999 and has served as ourthe Chief Financial Officer and Chief Accounting Officer of Tsakos Energy Navigation Limited since 2000. Mr. Durham is a United KingdomFellow of the Institute of Chartered Accountant.Accountants of England & Wales. From 1989 through 1998, Mr. Durham was employed in Athens with the Latsis Group, a shipping, refinery and banking enterprise, becoming Financial Director of Shipping in 1995. From 1983 to 1989, Mr. Durham was employed by RJR Nabisco Corporation, serving as audit manager for Europe, Asia and Africa until 1986 and then as financial controller of one of their United Kingdom food divisions. Mr. Durham worked with public accounting firms Ernst & Young (London and Paris) from 1972 to 1979 and Deloitte & Touche (Chicago and Athens) from 1979 to 1983. Mr. Durham is a graduate in Economics from the University of Exeter, England.
VLADIMIR JADRO
CHIEF MARINE OFFICER
Mr. Jadro joined Tsakos Energy Navigation Limited in February 2006. He was appointed Chief Marine Officer of the Company in June 2006. Mr. Jadro was employed by Exxon/ExxonMobil Corp. from 1980 until 2004 in various technical and operational positions including operations, repairs, newbuilding constructions, off shore conversions and projects of the marine department of ExxonMobil Corp. He was in charge of various tankers and gas carriers from 28,000 dwt to 409,000 dwt, and responsible for the company vetting system. He was also involved in the development of oil companies’ international “SIRE” vessel inspection system. From 1978 until 1980 he was employed by the Bethlehem Steel shipyard. From 1967 until 1977, Mr. Jadro was employed on various tankers starting as third engineer and advancing to Chief Engineer. Mr. Jadro is a member of the Society of Naval Architects and Marine Engineers (SNAME) and Port Engineers of New York.
PETER C. NICHOLSON, CBE
DIRECTOR
Mr. Nicholson is trained as a naval architect and spent the majority of his professional career with Camper & Nicholson Limited, the world-famous yacht builder. He became Managing Director of the firm and later, Chairman. When Camper & Nicholson merged with Crest Securities to form Crest Nicholson Plc in 1972, Mr. Nicholson became an executive director, a role he held until 1988 when he became a non-executive in order to pursue a wider range of business interests. Since that time, he has been a non-executive director of Lloyds TSB Group Plc (from 1990 to 2000) and Chairman of Carisbrooke Shipping Plc (from 1990 to 1999). He was a director of various companies in the Marsh Group of insurance brokers and remained a consultant to the company until recently.brokers. In 2010, Mr. Nicholson became a partner and chairman of a limited liability partnership, R.M.G. Wealth Management
LLP. He has served on the boards of a variety of small companies, has been active in the administration of the United Kingdom marine industry and is a trustee of the British Marine Federation. He is a Younger Brother of Trinity House. He was Chairman of the Royal National Lifeboat Institution from 2000 to 2004.
FRANCIS T. NUSSPICKEL
DIRECTOR
Mr. Nusspickel is a retired partner of Arthur Andersen LLP with 35 years of public accounting experience. He is a Certified Public Accountant in several U.S. states. During his years with Arthur Andersen, he served as a member of their Transportation Industry Group and was worldwide Industry Head for the Ocean Shipping segment. His responsibilities included projects for mergers and acquisitions, fraud investigations, arbitrations and debt and equity offerings. He was President of the New York State Society of Certified Public Accountants from 1996 to 1997, a member of the AICPA Council from 1992 to 1998, and from 2004 to 2007 was Chairman of the Professional Ethics Committee of the New York State Society of Certified Public Accountants. Mr. Nusspickel is also a Director of Symmetry Medical Inc., a New York Stock Exchange listed medical device manufacturer.
WILLIAM A. O’ NEIL, CMG, CM
DIRECTOR
Mr. O’Neil is Secretary-General Emeritus of the International Maritime Organization, or IMO, the United Nations agency concerned with maritime safety and security and the prevention of pollution from ships. He was first elected Secretary-General of the IMO in 1990 and was re-elected four times, remaining Secretary-General until the end of 2003. Mr. O’Neil has served in various positions with the Canadian Federal Department of Transport and subsequently held senior positions during the construction and operation of the St. Lawrence Seaway Authority. He was appointed the first Commissioner of the Canadian Coast Guard where he served from 1975 until 1980 and then became President and Chief Executive Officer of the St. Lawrence Seaway Authority for ten years. During this period, Mr. O’Neil was a Director of CanArctic Shipping, a Canadian entity engaged in shipping activities in the Canadian Arctic. Mr. O’Neil originally represented Canada in 1972 at the IMO Council, later becoming Chairman of the IMO Council in 1980. In 1991, he became Chancellor of the World Maritime University, Malmo, Sweden and Chairman of the Governing Board of the International Maritime Law Institute in Malta. Mr. O’Neil is a past President of the Institute of Chartered Shipbrokers and is President of Videotel Marine International, both of which are engaged in the training of seafarers. He is a civil engineer graduate of the University of Toronto, a fellow of the Royal Academy of Engineering and the Chairman of the Advisory Board of the Panama Canal Authority.
RICHARD L. PANIGUIAN, CBE
DIRECTOR
Mr. Paniguian was appointed Head of UK DefenceDefense and Security Organisation,Organization, or DSO, in August 2008, which supports UK defencedefense and security businesses seeking to export and develop joint ventures and partnerships overseas, as well as overseas defencedefense and security businesses seeking to invest in the UK. Previously,
Mr. Paniguian pursued a career with BP plc. where he worked for 37 years. He held a wide range of posts with BP, including, in the 1980s, as Commercial Director in the Middle East, Head of International Oil Trading in New York and Head of Capital Markets in London. In the 1990s he completed assignments as a Director of BP Europe, Chief Executive of BP Shipping and subsequently Head of Gas Development in the Middle East and Africa. In 2001 he was appointed Group Vice President for Russia, the Caspian, Middle East and Africa, where he was responsible for developing and delivering BP’s growth strategy in these regions. He played a leading role in support of the TNK-BP joint venture; in delivering the Baku Tbilisi Ceyhan pipeline project; in driving for new gas exploration in Libya, Egypt and Oman and, in completing BP’s first oil project in Angola. In 2007 he was appointed CBE for services to business. Between 2002 and 2007 he was Chairman of the Egyptian British Business Council, and between 2000 and 2002 President of the UK Chamber of Shipping. Mr. Paniguian has a degree in Arabic and Middle East politics and an MBA.
ARISTIDES A.N. PATRINOS, PH.D
DIRECTOR
Dr. Patrinos has been instrumental in advancing the scientific and policy framework underpinning key governmental energy and environmental initiatives. Dr. Patrinos is currently the Senior Vice President offor Corporate Affairs at Synthetic Genomics, Inc., a
privately-held company dedicated to developing and commercializing clean and sustainable biofuels that alleviate our dependence on petroleum, enable carbon sequestration and reduce greenhouse gases. Dr. Patrinos joined Synthetic Genomics in February 2006 fromand served as President until February 2011. He served in the U.S. Department of Energy’s Office of Science. There he servedScience from December 1988 to February 2006 as associate director of the Office of Biological and Environmental Research, overseeing the department’s research activities in human and microbial genome research, structural biology, nuclear medicine, and global environmental change. Dr. Patrinos played a historic role in the Human Genome Project, the founding of the DOE Joint Genome Institute and the design and launch of the DOE’s Genomes to Life Program, a research program dedicated to developing technologies to use microbes for innovative solutions to energy and environmental challenges. Dr. Patrinos is a Fellow of the American Association for the
Advancement of Science and of the American Meteorological Society, and a Member of the American Geophysical Union, the American Society of Mechanical Engineers, and the Greek Technical Society. He is the recipient of numerous awards and honorary degrees, including three Presidential Rank Awards and two Secretary of Energy Gold Medals, as well as an honorary doctorate from the National Technical University of Athens. A native of Greece, Dr. Patrinos received his undergraduate degree from the National Technical University of Athens, and a Ph.D. in mechanical engineering and astronautical sciences from Northwestern University.
TAKIS ARAPOGLOU
DIRECTOR
From 1978 to 1991, Mr. Arapoglou held various executive positions at Paine Webber, Citicorp Investment Bank and Chase Investment Bank in London. In 1991, he was appointed by the Greek Government as Chairman and Chief Executive OfficerCEO of the Ionian Bank Group, Athens. During the same period, he was appointed by the Hellenic Banks Association, Chairman of DIAS S.A., the Greek Interbank Payments System. In 1994, he joined American Express Bank Ltd., Greece, as Senior Country Executive. In 1997, he joined Citibank Greece, as Managing Director, Market Manager and Citigroup Country Officer. In 2000, he moved to Citibank, London, as Managing Director, Global Industry Head for the Banks & Securities Industry, covering Banks, Broker/Dealers, Consumer Finance companies and Financial Infrastructures, within the Citigroup Global Corporate and Investment Bank.Industry. From May 2003 to March 2004, he was Senior Advisor for Financial Institution customers, in Citigroup, London. Since MarchFrom 2004 to 2009 he iswas Chairman and CEO of the National Bank of Greece. Since April 2005 he is PresidentGreece and Chairman of the Hellenic Bank Association.Bankers Association from 2005 to 2009. In October 2010, Mr. Arapoglou joined EFG Hermes (the largest investment bank in the Middle East, listed in Cairo and London) as Chief Executive Officer of Commercial Banking and in 2011 he was elected board member of EFG Hermes Holding. Mr. Arapoglou has served in several international bank advisory boards in Europe and Africa and on the board of European educational foundations and institutions, including the Institute of Corporate Cultural Affairs in Frankfurt, as Chairman. He is currently a member of the international advisory board at Tufts University in Boston, Chairman of the Business Advisory committee of the Athens University of Economics and Business and non-executive Vice-Chairman of Titan Cement, listed in Athens. Mr. Arapoglou holds a B.A. in Mathematics and Physics from the University of Athens, a B.Sc. in Naval Architecture and Ocean Engineering from the University of Glasgow and an M.Sc. in Finance and Management from Brunel University, London.
EFTHIMIOS E. MITROPOULOS
DIRECTOR
Mr. Mitropoulos is Secretary-General Emeritus of the International Maritime Organization (IMO), the United Nations specialised agency responsible for the regulation of international shipping from the safety, security and environmental protection points of view. After 23 years of service at IMO (ten of which as Director of the Maritime Safety Division), he was elected Secretary-General in 2003 and re-elected in 2007 for a total of the maximum time permitted of eight years. As a graduate of both Merchant and Naval Academies of Greece, he spent time at sea as a navigation officer and twenty years as a commissioned Hellenic Coast Guard officer retiring as a rear admiral, having represented Greece at IMO and various other international fora dealing with shipping matters over a twelve year period and having spent two years as Harbour Master of Corfu. Between 2004 and 2012, he was Chancellor of the World Maritime University, Malmô, Sweden and Chairman of the Governing Board of the International Maritime Law Institute in Malta. He is the author of several books on shipping, including books on tankers, modern types of merchant ships, safety of navigation and shipping economics and policy. He is Chairman of the Board of the “Maria Tsakos Foundation—International Centre for Maritime Research and Tradition.”
Corporate Governance
Board of Directors
Our business is managed under the direction of the Board, in accordance with the Companies Act and our Memorandum of Association and Bye-laws. Members of the Board are kept informed of our business through: discussions with the Chairman of the Board, the President and Chief Executive Officer and other members of our management team; the review of materials provided to directors; and, participation in meetings of the Board and its committees. In accordance with our Bye-laws, the Board has specified that the number of directors will be set at no less than five nor more than fifteen. At December 31, 20102011 we had ten members on our Board and on March 9, 2012 the board was expanded to 11 members with Mr. Mitropoulos elected by the Board. Mr. O’Neil has informed us he will not stand for reelection at the 2012 annual meeting of shareholders. Under our Bye-laws, one third (or the number nearest one third) of the Board (with the exception of any executive director) retires by rotation each year. The Bye-laws require that the one third of the directors to retire by rotation be those who have been in office longest since their last appointment or re-appointment. The Bye-laws specify that where the directors to retire have been in office for an equal length of time, those to retire are to be determined by lot (unless they agree otherwise among themselves).
During the fiscal year ended December 31, 2010,2011, the full Board held four meetings three meetings.of which were in person and one via telephone conference. Each director attended all of the meetings of the Board with the exception of Dr. Patrinos who was absent from all 2010 Board meetings.Board. In addition, each director except Dr. Patrinos, attended all of the meetings of committees of which the director was a member.
Independence of Directors
The foundation for the Company’s corporate governance is the Board’s policy that a substantial majority of the members of the Board should be independent. With the exception of the two Executive Directors (Messrs. Tsakos and Saroglou) and one Non-executive Director (Mr. Jolliffe), the Board believes that each of the other incumbent directors (Messrs. Stavropoulos, Nicholson, Nusspickel, O’Neil, Paniguian, Patrinos and Arapoglou) is independent under the standards established by the New York Stock Exchange (the “NYSE”) because none has a material relationship with the Company directly or indirectly or any relationship that would interfere with the exercise of their independent judgment as directors of the Company.
The Board made its determination of independence in accordance with its Corporate Governance Guidelines, which specifies standards and a process for evaluating director independence. The Guidelines provide that:
A director cannot be independent if he or she fails to meet the objective requirements as to “independence” under the NYSE listing standards.
If a director meets the objective NYSE standards, he or she will be deemed independent, absent unusual circumstances, if in the current year and the past three years the director has had no related-party transaction or relationship with the Company or an “interlocking” relationship with another entity triggering disclosure under the SEC disclosure rules.
If a director who meets the objective NYSE independence requirements either has had a disclosable transaction or relationship or the Corporate Governance, Nominating and Compensation Committee requests that the Board consider any other circumstances in determining the director’s independence, the Board will make a determination of the director’s independence.
To promote open discussion among the independent directors, those directors met three times in 20102011 in regularly scheduled executive sessions without participation of the Company’s management and will continue to do so in 2011.2012. Mr. Nicholson currently serves as the Presiding Director for purposes of these meetings.
Documents Establishing Our Corporate Governance
The Board and the Company’s management have engaged in an ongoing review of our corporate governance practices in order to oversee our compliance with the applicable corporate governance rules of the NYSE and the SEC.
The Company has adopted a number of key documents that are the foundation of its corporate governance, including:
a Code of Business Conduct and Ethics for Directors, Officers and Employees;
a Corporate Governance, Nominating and Compensation Committee Charter; and
an Audit Committee Charter.
These documents and other important information on our governance, including the Board’s Corporate Governance Guidelines, are posted in the “Investor Relations” section of the Tsakos Energy Navigation Limited website, and may be viewed athttp://www.tenn.gr. We will also provide any of these documents in hard copy upon the written request of a shareholder. Shareholders may direct their requests to the attention of Investor Relations, c/o George Saroglou or Paul Durham, Tsakos Energy Navigation Limited, 367 Syngrou Avenue, 175 64 P. Faliro, Athens, Greece.
The Board has a long-standing commitment to sound and effective corporate governance practices. The Board’s Corporate Governance Guidelines address a number of important governance issues such as:
Selection and monitoring of the performance of the Company’s senior management;
Succession planning for the Company’s senior management;
Qualifications for membership on the Board;
Functioning of the Board, including the requirement for meetings of the independent directors; and
Standards and procedures for determining the independence of directors.
The Board believes that the Corporate Governance Guidelines and other governance documents meet current requirements and reflect a very high standard of corporate governance.
Committees of the Board
The Board has established an Audit Committee, a Corporate Governance, Nominating and Compensation Committee, a Capital Markets Committee, a Risk Committee, an Operational and Environmental R&D Committee and a Chartering Committee.
Audit Committee
The members of the Audit Committee are Messrs. Nicholson, Nusspickel and Stavropoulos, each of whom is an independent Director. Mr. Nusspickel is the Chairman of the Audit Committee. The Audit Committee is governed by a written charter, which is approved and adopted annually by the Board. The Board has determined that the continuing members of the Audit Committee meet the applicable independence requirements, and that all continuing members of the Audit Committee meet the requirement of being financially literate. The Audit Committee held four meetings during the fiscal year ended December 31, 2010,2011, three of which were in person and one via telephone conference. Mr. Jolliffe was absent from the March 2010 meeting that was held via telephone conference call. In October, 2010, Mr. Jolliffe resigned from the Audit and Corporate Governance, Nominating and Compensation Committees to provide services to the Company that would preclude him from satisfying the NYSE requirements for independence. The Audit Committee is appointed by the Board and is responsible for, among other matters:
engaging the Company’s external and internal auditors;
approving in advance all audit and non-audit services provided by the auditors;
approving all fees paid to the auditors;
reviewing the qualification and independence of the Company’s external auditors;
reviewing the Company’s relationship with external auditors, including the consideration of audit fees which should be paid as well as any other fees which are payable to auditors in respect of non-audit activities, discussions with the external auditors concerning such issues as compliance with accounting standards and any proposals which the external auditors have made vis-à-vis the Company’s accounting standards;
overseeing the Company’s financial reporting and internal control functions;
overseeing the Company’s whistleblower’s process and protection; and
overseeing general compliance with related regulatory requirements.
The Board of Directors has determined that Messrs. Nusspickel and Stavropoulos, whose biographical details are included herein, each qualifies as an “audit committee financial expert” as defined under current SEC regulations and each is independent in accordance with SEC rules and the listing standards of the NYSE.
Corporate Governance, Nominating and Compensation Committee
The members of the Corporate Governance, Nominating and Compensation Committee are Messrs. Arapoglou, Nicholson, Nusspickel, O’Neil, Paniguian, Patrinos and Stavropoulos, each of whom is an independent Director. Mr. Nicholson is Chairman of the Committee. The Corporate Governance, Nominating and Compensation Committee is appointed by the Board and is responsible for:
assisting the Board and the Company’s management in establishing and maintaining a high standard of ethical principles;
ensuring appropriate independence of directors under NYSE and SEC rules;
identifying and nominating candidates for election to the Board and appointing the Chief Executive Officer and the Company’s senior management team;
designing the compensation structure for the Company and for the members of the Board and its various committees; and
designing and overseeing the short-term and long-term incentive compensation program of the Company.
During 2010,2011, there were three meetings of the Corporate Governance, Nominating and Compensation Committee. Dr. Patrinos did not participate in these committee meetings.
Capital Markets Committee
The members of the Capital Markets Committee are Messrs. Arapoglou, Jolliffe, Tsakos and Stavropoulos. Mr. Jolliffe is Chairman of the Capital Markets Committee. The Capital Markets Committee assists the Board and the Company’s management regarding matters relating to the raising of capital in the equity and debt markets, relationships with investment banks, communications with existing and prospective investors and compliance with related regulatory requirements.
Risk Committee
The members of the Risk Committee are Messrs. Arapoglou, Nicholson, Saroglou, Stavropoulos, Tsakos, and our chief financial officer,Chief Financial Officer, Mr. Durham. Mr. Stavropoulos is Chairman of the Risk Committee. The primary role of the Risk Committee is to assist the Board and the Company’s management regarding matters relating to insurance protection coverage of physical assets, third party liabilities, contract employees, charter revenues and officer and director liability. The Risk Committee also assists in the development and maintenance of commercial banking and other direct lender relationships, including loans and, when appropriate, interest rate hedging instruments.
Operational and Environmental R&D Committee
The members of the Operational and Environmental R&D Committee was established at the Board of Directors meeting held on May 31, 2007. The members of the committee are Messrs. O’Neil, Nusspickel, Patrinos and Patrinos.(from September 23, 2011) Jolliffe. It also includes the Deputy Chairman of Tsakos Shipping, Mr. Vasilis Papageorgiou. Mr. Papageorgiou is not a director or officer of our Company. Dr. PatrinosMr. O’Neil is Chairman of the Operational and Environmental R&D Committee. Mr. O’Neil chaired the Committee meeting in May 2010 in the absence of Dr. Patrinos. The primary role of the Operational and Environmental R&D Committee is to draw the attention of the Board and the Company’s management to issues of concern regarding the safety of crew and vessel and the impact of the maritime industry on the environment, to provide an update on related legislation and technological innovations, and more specifically highlight areas in which the Company itself may play a more active role in being in the forefront of adopting operational procedures and technologies that will ensure maximum safety for crew and vessel and contribute to a better environment.
Chartering Committee
The members of the Chartering Committee are Messrs. Stavropoulos, Saroglou and Tsakos. Mr. Tsakos is Chairman of the Chartering Committee. The Chartering Committee assists the Board and the Company’s management regarding the strategies of fleet employment, fleet composition and the general structuring of charter agreements.
Board Compensation
We pay no cash compensation to our senior management or to our directors who are senior managers. We have no salaried employees. For the year ended December 31, 2010,2011, the aggregate cash compensation of all of the members of the Board was $460,000$590,000 per the following annual fee allocation which was approved by the shareholders of the Company on May 31, 2007:June 3, 2011:
Service on the Board - $45,000$50,000
Service on the Audit Committee - $17,500$20,000
Service on the Capital Markets Committee - $10,000
Service on the Operational and Environmental R&D Committee - $10,000
Service as Chairman of the Corporate Governance, Nominating and Compensation Committee - $10,000
Service as Chairman of the Operational and Environmental R&D Committee - $10,000
Service as Chairman of the Audit Committee - $20,000
Service as Chairman of the Capital Markets Committee - $10,000$20,000
Service as Chairman of the Board - $30,000$40,000
No fees are paid for service on the Corporate Governance, Nominating and Compensation Committee, Risk Committee and Chartering Committee.
In March 2011, the annual fee allocation was revised, subject to shareholder approval at our 2011 annual meeting of shareholders.
We do not provide benefits for directors upon termination of their service with us.
Management Company
Our senior managers, other thenthan Mr. Tsakos, receive salaried compensation from Tsakos Energy Management, which receives a monthly management fee from us pursuant to the management agreement to provide overall executive and commercial management of its affairs. See “Management and Other Fees” in Item 7 for more information on the management agreement and the management fees we paid for the fiscal year ended December 31, 2010.2011.
Management Compensation
Messrs. Tsakos, Saroglou, Durham and Jadro serve as President and Chief Executive Officer, Vice President and Chief Operating Officer, Chief Financial Officer, and Chief Marine Officer, respectively. Such individuals are employees of Tsakos Energy Management and, except for the equity compensation discussed below, are not directly compensated by the Company.
The Corporate Governance, Nominating and Compensation Committee has adopted a short-term performance incentive program for Tsakos Energy Management based on the return on equity (R.O.E.) measured by the book value per share at the beginning of each fiscal year and basic earnings per share for that year. U.S. GAAP accounting defines the value of the components. The award scale for 2006 ranged from R.O.E. greater than 15% corresponding to an award amount of $1.25 million ($1.0 million in 2004 and 2005) up to R.O.E. greater than 25%
with an award amount of $3.5 million ($2.5 million in 2004 and 2005). For 2006 and 2005 incentive awards of $3.5 million and $2.5 million, respectively, were approved by the Board of Directors and are expensed and recognized in accrued liabilities in the Company’s December 31, 2006 and 2005 Consolidated Balance Sheets.
The Corporate Governance, Nominating and Compensation Committee established the incentive award scale, and the Company’s Board of Directors approved the final award, for fiscal years 2007, 2008 and 2009, as follows:
R.O.E | Amount of award in US $ millions | |||||
| 2007 | 2008 | 2009 | ||||
15.0% | 1.50 | 2.50 | 3.00 | |||
17.5% | 2.25 | 3.25 | 4.00 | |||
20.0% | 3.00 | 4.00 | 5.50 | |||
22.5% | 3.75 | 4.75 | — | |||
25.0% | 4.50 | 5.50 | — | |||
Final award | 4.00 | 4.75 | 0.00 | |||
The awards were given to Tsakos Energy Management and were distributed to the senior personnel of Tsakos Energy Management and Tsakos Shipping whose performance was critical in achieving a return of equity of 24.2% in 2007 and 23.7% in 2008. The ultimate award of the management incentive award is always at the sole discretion of the Company’s Board of Directors.
Additionally in 2009, if the R.O.E. was less than 15.0% but greater than 10.0% then an alternative award was possible if the Company’s R.O.E. exceeded the average R.O.E. of its peers (Overseas Shipholding Group, Inc. and Teekay Corporation). In such case, the Board of Directors may elect to award a bonus of $1.5 million. However, as the 2009 R.O.E. was less than 10%, no incentive award was approved by the Company’s Board of Directors.
A scale was not set for 2010.2010 and 2011. However, for 2010 the Corporate Governance, Nominating and Compensation Committee recommended a special award of $425,000 to be distributed to the senior personnel of Tsakos Energy Management and Tsakos Shipping. No such award has been recommended for 2011. A scale has not been set for 2011.2012.
Employees
Tsakos Energy Navigation Limited has no salaried employees. All crew members are employed by the owning-company of the vessel on which they serve, except where the vessel is on a bareboat charter-out (Millennium),or the vessels, or crewing of the vessels, are under third-party management arranged by our technical managers. All owning-companies with the exception of the company owning the chartered-in vessel, are subsidiaries of Tsakos Energy Navigation Limited. Approximately 8601,018 officers and crew members served on board the vessels we own and are managed by our technical managers as of December 31, 2010.2011.
Share Ownership
The common shares beneficially owned by our directors and senior managers and/or companies affiliated with these individuals are disclosed in “Item 7. Major Shareholders and Related Party Transactions” below.
Stock Compensation Plan
We currently have one equity incentive plan, the Tsakos Energy Navigation Limited 2004 Incentive Plan (the “2004 Plan”), which was adopted by our Board and approved by our shareholders at the 2004 Annual Meeting of shareholders. This plan permits us to grant share options or other share based awards to our directors and officers, to the officers of our vessels, and to the directors, officers and employees of our manager, Tsakos Energy Management, and our technicalcommercial manager, Tsakos Shipping.
The purpose of the 2004 Plan is to provide a means to attract, retain, motivate and reward our present and prospective directors, officers and consultants of the Company and its subsidiaries, and the officers of our vessels and the employees of the management companies providing administrative, commercial, technical and maritime services to, or for the benefit of, the Company, its subsidiaries and their vessels by increasing their ownership in our
Company. Awards under the 2004 Plan may include options to purchase our common shares, restricted share awards, other share-based awards (including share appreciation rights granted separately or in tandem with other awards) or a combination thereof.
The 2004 Plan is administered by our Corporate Governance, Nominating and Compensation Committee. Such committee has the authority, among other things, to: (i) select the present or prospective directors, officers, consultants and other personnel entitled to receive awards under the 2004 Plan; (ii) determine the form of awards, or combinations of awards; (iii) determine the number of shares covered by an award; and (iv) determine the terms and conditions of any awards granted under the 2004 Plan, including any restrictions or limitations on transfer, any vesting schedules or the acceleration of vesting schedules and any forfeiture provision or waiver of the same.
The 2004 Plan authorizes the issuance of up to 1,000,000 common shares in the form of RSUs or options.
Movements of RSUs under the 2004 Plan thoughthrough December 31, 2010,2011, are as follows:
| Issued | Forfeited | Vested | Non-Vested (as of December 31, 2010) | Issued | Forfeited | Vested | Non-Vested (as of December 31, 2011) | |||||||||||||||||||||||||||||
2006 | Directors and officers (D&O) | 21,000 | Directors and officers (D&O) | 21,000 | ||||||||||||||||||||||||||||||||
2007 | D&O and ships’ officers | 190,650 | (21,000 | ) | D&O and ships’ officers | 190,650 | (21,000 | ) | ||||||||||||||||||||||||||||
Other personnel | 394,000 | Other personnel | 394,000 | |||||||||||||||||||||||||||||||||
2008 | D&O and ships’ officers | (3,200 | ) | (96,050 | ) | D&O and ships’ officers | (3,200 | ) | (96,050 | ) | ||||||||||||||||||||||||||
Other personnel | (7,800 | ) | (194,600 | ) | Other personnel | (7,800 | ) | (194,600 | ) | |||||||||||||||||||||||||||
2009 | D&O | 67,800 | (1,300 | ) | — | D&O | 67,800 | (1,300 | ) | — | ||||||||||||||||||||||||||
Other personnel | 54,000 | (4,000 | ) | — | Other personnel | 54,000 | (4,000 | ) | — | |||||||||||||||||||||||||||
2010 | D&O | 69,000 | (2,100 | ) | (130,450 | ) | D&O | 69,000 | (2,100 | ) | (130,450 | ) | ||||||||||||||||||||||||
Other personnel | 76,000 | (1,000 | ) | (211,200 | ) | Other personnel | 76,000 | (1,000 | ) | (211,200 | ) | |||||||||||||||||||||||||
2011 | D&O | 12,000 | — | (62,250 | ) | |||||||||||||||||||||||||||||||
| Other personnel | — | (65,000 | ) | |||||||||||||||||||||||||||||||||
| Total | 872,450 | (19,400 | ) | (653,300 | ) | 199,750 |
|
|
|
| ||||||||||||||||||||||||||
Total | 884,450 | (19,400 | ) | (780,550 | ) | 84,500 | ||||||||||||||||||||||||||||||
|
|
|
| |||||||||||||||||||||||||||||||||
As of December 31, 2010,2011, the weighted average remaining contractual life of outstanding (non-vested) RSUs is 1.0 year.0.5 years. The unvested RSUs are scheduled to vest on June 30, 2011 (72,500), 31 December 2011 (54,750) and June 30, 2012 (72,500)(84,500). Total compensation expense recognized for the year ended December 31, 20102011 was $1.1$0.8 million and for the year ended December 31, 2009, also2010, $1.1 million. On November 14, 2007, the Company paid a 100% common share dividend which effected a two-for-one split of the Company’s common shares. RSUs that were unvested on that date were adjusted for the share dividend.
| Item 7. | Major Shareholders and Related Party Transactions |
It is our policy that transactions with related parties are entered into on terms no less favorable to us than would exist if these transactions were entered into with unrelated third parties on an arm’s length basis. Tsakos Energy Management has undertaken to ensure that all transactions with related parties are reported to the board of directors. Under the management agreement, any such transaction or series of transactions involving payments in excess of $100,000 and which is not in the ordinary course of business requires the prior consent of the board of directors. Transactions not involving payments in excess of $100,000 may be reported quarterly to the board of directors.
To help minimize any conflict between our interests and the interests of other companies affiliated with the Tsakos family and the owners of other vessels managed by such companies if an opportunity to purchase a tanker which is 10 years of age or younger is referred to or developed by Tsakos Shipping, Tsakos Shipping will notify us of this opportunity and allow us a 10 business day period within which to decide whether or not to accept the opportunity before offering it to any of its affiliates or other clients.
Management Affiliations
Nikolas P. Tsakos, our president, chief executive officer and one of our directors, is an officer, director and the sole shareholder of Tsakos Energy Management. He is also the son of the founder of Tsakos Shipping.
George V. Saroglou, our chief operating officer and one of our directors, is a cousin of Nikolas P. Tsakos.
Management and Other Fees
We prepay or reimburse our technical manager at cost for all vessel operating expenses payable by them in their capacity as technical manager of our fleet. At July 1, 2010, TCM took over the technical management of most of our vessels from Tsakos Shipping. At December 31, 2010,2011, outstanding advances to Tsakos ShippingTCM amounted to $3.0 million relating in part to vessels disposed of within 2009 and 2010.$1.6 million. At December 31, 2010,2011, there was an amount due to TCMTsakos Shipping of $0.1$0.8 million.
From the management fee we pay Tsakos Energy Management, Tsakos Energy Management in turn from July 1, 2010, pays a management fee to TCM for its services as technical manager of our fleet and for its supervision of the construction of our newbuildings.fleet. Prior to July 1, 2010, Tsakos Energy Management paid Tsakos Shipping a management fee for such services. Under the terms of our management agreement with Tsakos Energy Management, we paid Tsakos Energy Management management fees of $13.8$15.3 million and supervisory fees of $0.6 million relating to the construction of our vessels in 2010.2011. An additional amount of $0.6$1.2 million was paid in fees directly by the Company to TCM for extra services provided or arranged by TCM in relation to information technology services and application of corporate governance procedures required by the Company.
No incentive award was payable to Tsakos Energy management for 2011. An incentive award amounting to $425,000 was payable at December 31, 2010 to Tsakos Energy Management for 2010.
Management Agreement
Our management agreement with Tsakos Energy Management was amended and restated on March 8, 2007 and has a term of ten years from the effective date of January 1, 2007. Tsakos Energy Management may terminate the management agreement at any time upon not less than one year’s notice. In addition, each party may terminate the management agreement in the following circumstances:
certain events of bankruptcy or liquidation involving either party;
a material breach by either party; or
a failure by either party, for a continuous period of six months, materially to perform under circumstances resulting from war, governmental actions, riot, civil commotion, weather, accident, labor disputes or other causes not in the control of the non-performing party.
Moreover, following a change in control of us, which would occur if at least one director were elected to our board without having been recommended by our existing board, Tsakos Energy Management may terminate the agreement on 10 business days’ notice. If Tsakos Energy Management terminates the agreement for this reason, then we would immediately be obligated to pay Tsakos Energy Management the present discounted value of all of the payments that would have otherwise been due under the management agreement up until June 30 of the tenth year following the date of termination plus the average of the incentive awards previously paid to Tsakos Energy Management multiplied by ten. Under these terms, therefore, a termination as of December 31, 20102011 would have resulted in a payment of approximately $134$135 million. Under the terms of the Management Agreement between the Company and Tsakos Energy Management Limited, the Company may terminate the agreement only under specific circumstances, such as breach of contract by the manager and change of control in the shareholding of the manager without the prior approval of the Company’s Board of Directors.
Under the management agreement, we pay monthly fees for Tsakos Energy Management’s management of our vessels. The managementThese fees we pay Tsakos Energy Management under our management agreement are based on the number of ships in our fleet. The per-ship charges begin to accrue for a vessel at the point that a newbuilding contract is acquired, which is 18 to 24 months before the vessel begins to earn revenue for us. The management agreement was amended on March 8, 2007, to raise the monthly fee to $20,000 per owned vessel and $15,000 for vessels chartered-in or chartered out on a bareboat basis and vessels under construction, effective January 1, 2007. Per the same management agreement, effective from January 1, 2008, there is a prorated adjustment if at beginning of the year the Euro has appreciated by 10% or more against the U.S. Dollar since January 1, 2007. In addition, there is an increase each year by a percentage figure reflecting 12 month Euribor, if both parties agree. As a consequence, from January 1, 2008,For 2012, monthly fees for operating vessels were increased accordingly to $23,000will be $27,500 per owned vessel
and $17,000$20,400 for chartered-in vessels. In accordance with the terms of the same agreement, theThe monthly fee was increased, effective January 1, 2009, to $23,700 for owned vessels and $17,500 for vessels chartered-in or chartered out on a bareboat basis and vessels under construction. Effective January 1, 2010, the monthly fees were raised to $24,000 and $17,700, respectively. An amendment to this fee structure was made on June 30, 2010, which raised the monthly fee to $27,000 per owned vessel ($32,000 for the LNG carrier)carrier will be $35,000 from April 2012. We paid Tsakos Energy Management aggregate management fees of $15.3 million in 2011, $13.8 million in 2010 and to $20,000 per operated vessel chartered-in or chartered out on bare-boat and per vessel under construction. It was agreed that there would be no change$13.0 million in monthly management fee as at January 1, 2011.2009.
Chartering Commissions and Vessel New-delivery Fees
We pay a chartering commission to Tsakos Shipping equal to 1.25% on all freights, hires and demurrages involving our vessels. Tsakos Shipping may also charge a brokerage commission on the sale of a vessel which for 20102011 was 1%. We have been charged by Tsakos Shipping chartering and brokerage commissions aggregating $6.3$5.5 million in 2010.2011.
Tsakos Shipping may also charge a fee of $0.2 million (or such other sum as may be agreed) on delivery of each new-building vessel in payment for the cost of design and supervision of the new-building by Tsakos Shipping. An aggregate of $2.8 million has been charged for fourteen vessels delivered between 2007 and 2011. This amount has been added to the cost of the vessels concerned and is being amortized over the remaining life of the vessels.
Captive Insurance Policies
We pay Argosy Insurance Company, an affiliate of Tsakos Shipping,family interests, premiums to provide hull and machinery, increased value and loss of hire insurance for our vessels. In 2010,2011, we were charged an aggregate of $9.4$9.9 million by Argosy for insurance premiums.
Travel Services
We use AirMania Travel S.A., an affiliate of the Tsakos Group,family interests, for travel services primarily to transport our crews to and from our vessels. In 2010,2011, we were charged an aggregate of $0.4$2.1 million by AirMania for travel services.
Major Shareholders
The following table sets forth certain information regarding the beneficial ownership of our outstanding common shares as of March 31, 20112012 held by:
each person or entity that we know beneficially owns 5% or more of our common shares;
each of our officers and directors; and
all our directors and officers as a group.
Beneficial ownership is determined in accordance with the rules of the SEC. In general, a person who has or shares voting power or investment power with respect to securities is treated as a beneficial owner of those securities. Beneficial ownership does not necessarily imply that the named person has the economic or other benefits of ownership. Under SEC rules, shares subject to options, warrants or rights currently exercisable or exercisable within 60 days are considered as beneficially owned by the person holding those options, warrants or rights. The applicable percentage of ownership of each shareholder is based on 46,081,48746,208,737 common shares outstanding on March 31, 2011.2012. Except as noted below, the address of all shareholders, officers, directors and director nominees identified in the table and accompanying footnotes below is in care of the Company’s principal executive offices.
Name of Beneficial Owner | Number of Shares Beneficially Owned | Percentage of Outstanding Common Shares | Number of Shares Beneficially Owned | Percentage of Outstanding Common Shares | ||||||||||||
Tsakos Holdings Foundation(1) | 11,985,218 | 26.0 | % | |||||||||||||
Redmont Trading Corp.(1) | 2,828,217 | 6.1 | % | |||||||||||||
First Tsakos Investments Inc.(1) | 9,157,001 | 19.9 | % | |||||||||||||
Kelley Enterprises Inc.(1) | 5,708,703 | 12.4 | % | |||||||||||||
Marsland Holdings Limited(1) | 3,448,298 | 7.5 | % | |||||||||||||
Sea Consolidation S.A. of Panama(2) | 3,952,232 | 8.6 | % | |||||||||||||
DePrince, Race & Zollo, Inc.(3) | 2,425,307 | 5.3 | % | |||||||||||||
Intermed Champion S.A. of Panama(2) | 307,900 | * | ||||||||||||||
Tsakos Holdings Foundation(1) | 11,985,218 | 26.0 | % | |||||||||||||
Redmont Trading Corp.(1) | 2,828,217 | 6.1 | % | |||||||||||||
First Tsakos Investments Inc.(1) | 9,157,001 | 19.9 | % | |||||||||||||
Kelley Enterprises Inc.(1) | 5,708,703 | 12.4 | % | |||||||||||||
Marsland Holdings Limited(1) | 3,448,298 | 7.5 | % | |||||||||||||
Sea Consolidation S.A. of Panama(2) | 3,952,232 | 8.6 | % | |||||||||||||
DePrince, Race & Zollo, Inc.(3) | 3,650,891 | 7.9 | % | |||||||||||||
Intermed Champion S.A. of Panama(2) | 1,755,200 | 3.8 | % | |||||||||||||
Officers and Directors | Number of Shares Beneficially Owned | Number of RSUs Granted | Number of Shares Beneficially Owned | Number of RSUs Granted | ||||||||||||
D. John Stavropoulos(4) | 248,353 | * | — | |||||||||||||
Nikolas P. Tsakos(5) | 129,000 | * | 55,000 | A | ||||||||||||
D. John Stavropoulos(4) | 270,985 | * | 3,000 A | |||||||||||||
Nikolas P. Tsakos(5) | 165,000 | * | 19,000A | |||||||||||||
Michael G. Jolliffe | 22,800 | * | — | 22,800 | * | 2,000 A | ||||||||||
George V. Saroglou | 29,000 | * | 19,000 | A | 41,000 | * | 7,000A | |||||||||
Paul Durham | 43,000 | * | 19,000 | A | 55,000 | * | 7,000A | |||||||||
Peter C. Nicholson | 31,900 | * | — | 31,900 | * | 2,000A | ||||||||||
Francis T. Nusspickel | 10,350 | * | — | 13,350 | * | 2,000 A | ||||||||||
William A. O’Neil | 4,150 | * | — | 4,150 | * | 1,000 A | ||||||||||
Richard L. Paniguian | — | — | — | — | ||||||||||||
Aristides A.N. Patrinos, Ph.D. | 5,400 | * | — | 16,591 | * | 1,000 A | ||||||||||
Vladimir Jadro | 7,000 | * | 4,000 | A | 9,500 | * | 1,500A | |||||||||
Takis Arapoglou | — | — | — | 1,000 A | ||||||||||||
All officers and directors as a group (12 persons)(5) | 530,953 | ** | 97,000 | |||||||||||||
Efthimios E. Mitropoulos | — | — | ||||||||||||||
All officers and directors as a group (13 persons)(5) | 630,276 | ** | 46,500 | |||||||||||||
| * | Represents less than 1% of the common shares outstanding. |
| ** | Represents |
RSU Vesting DatesDate
A – A—The RSUs granted to the officers have three different vesting dates: June 30, 2011, December 31, 2011 andwill vest on: June 30, 2012. Although the shares for which these RSUs may be settled are not considered beneficially owned by the respective individuals, the RSUs are presented here as additional information because they represent an economic interest of the individuals in the Company’s common shares.
| (1) | First Tsakos Investments Inc. (“First Tsakos”) is the sole holder of the outstanding capital stock of Kelley Enterprises Inc. (“Kelley”) and Marsland Holdings Limited (“Marsland”) and may be deemed to have shared voting and dispositive power of the common shares reported by Kelley and Marsland. Tsakos Holdings Foundation (“Tsakos Holdings”) is the sole holder of outstanding capital stock of First Tsakos and Redmont Trading Corp. (“Redmont”) and may be deemed to have shared voting and dispositive power of the common shares reported by Kelley, Marsland and Redmont. According to a Schedule 13D/A filed on February |
| (2) | According to the Schedule 13D/A filed on February |
Sea Consolidation and Intermed as a result of his control relationship with each entity. Panayotis Tsakos is the father of Nikolas Tsakos, our president and chief executive officer. The business address of each of Sea Consolidation, Intermed and Mr. Panayotis Tsakos is 367 Syngrou Avenue, 175 64 P. Faliro, Athens, Greece. |
| (3) | According to a Schedule 13G filed on February |
| (4) | Mr. Stavropoulos, individually or jointly with his spouse, owns |
| (5) | Does not include shares owned by Tsakos Holdings, Kelley, Marsland, Redmont Trading Corp., Sea Consolidation or Intermed. |
As of March 31, 2011,2012, we had 3432 shareholders of record. These shareholders of record include CEDEFAST which, as nominee for the Depository Trust Company, is the record holder of 46,011,08546,138,935 common shares representing approximately 99.8% of our outstanding common shares. CEDEFAST is the nominee of banks and brokers which hold shares on behalf of their customers, the beneficial owners of the shares, who may or may not be resident in the United States. However, apart from the shareholders indicated in the footnotes (1), (2), (4) above and certain of the directors and officers, who together represent approximately 35% of the total, we believe that the majority of the remaining shareholders are resident in the United States. The Company is not aware of any arrangements the operation of which may at a subsequent date result in a change of control of the Company.
| Item 8. | Financial Information |
See “Item 18. Financial Statements” below.
Significant Changes. No significant change has occurred since the date of the annual financial statements included in this Annual Report on Form 20-F.
Legal Proceedings. We are involved in litigation from time to time in the ordinary course of business. In our opinion, the litigation in which we are involved as of March 31, 2011,2012, individually or in the aggregate, is not material to us.
Dividend Policy. While we cannot assure you that we will do so, and subject to the limitations discussed below, we intend to pay regular quarterly cash dividends on our common shares of between one-quarter and one-half of our annual net income for the year in respect of which the dividends are paid. We plan to pay dividends on a quarterly basis.shares. The Board of Directors will give consideration each April to the declaration of a supplementary dividend.
There can be no assurance that we will pay dividends or as to the amount of any dividend. The payment and the amount will be subject to the discretion of our board of directors and will depend, among other things, on available cash balances, anticipated cash needs, our results of operations, our financial condition, and any loan agreement restrictions binding us or our subsidiaries, as well as other relevant factors. For example, if we earned a capital gain on the sale of a vessel or newbuilding contract, we could determine to reinvest that gain instead of using it to pay dividends. Depending on our operating performance for that year, this could result in no dividend at all despite the existence of net income, or a dividend that represents a lower percentage of our net income. Of course, any payment of cash dividends could slow our ability to renew and expand our fleet, and could cause delays in the completion of our current newbuilding program.
Because we are holding a company with no material assets other than the stock of our subsidiaries, our ability to pay dividends will depend on the earnings and cash flow of our subsidiaries and their ability to pay dividends to us.
Under the terms of our existing credit facilities, we are permitted to declare or pay a cash dividend in any year as long as the amount of the dividend does not exceed 50% of our net income for that year. Net income will be determined based on the audited financial statements we deliver to the banks under our credit facilities which are required to be in accordance with U.S. generally accepted accounting principles. This amount can be carried forward and applied to a dividend payment in a subsequent year provided the aggregate amount of all dividends we declare and/or pay after January 1, 1998 does not exceed 50% of our accumulated net income from January 1, 1998 up to
the most recent date on which audited financial statements have been delivered under the credit facility. We anticipate incurring significant additional indebtedness in connection with our newbuilding program, which will affect our net income and cash available to pay dividends. In addition, cash dividends can be paid only to the extent permitted by Bermuda law and our financial covenants. See “Description of Capital Stock—Bermuda Law—Dividends.” See “Item 3. Key Information—Risks Related to our Common Shares—We may not be able to pay cash dividends as intended.”
| Item 9. | The Offer and Listing |
Our common shares are listed on the New York Stock Exchange and the Bermuda Stock Exchange. Following a decision of our Board of Directors, our common shares were de-listed from Oslo Børs on March 18, 2005 and our2005. Our common shares are not actively traded on the Bermuda Stock Exchange.
Trading on the New York Stock Exchange
Since our initial public offering in the United States in March of 2002, our common shares have been listed on the New York Stock Exchange under the ticker symbol “TNP.” The following table shows the high and low closing prices for our common shares during the indicated periods, all prices have been adjusted to take account of the two-for-one share split which became effective on November 14, 2007.
| High | Low | High | Low | |||||||||||||
2006 (Annual) | $ | 24.83 | $ | 17.01 | ||||||||||||
2007 (Annual) | $ | 38.90 | $ | 22.00 | $ | 38.90 | $ | 22.00 | ||||||||
2008 (Annual) | $ | 38.59 | $ | 16.71 | $ | 38.59 | $ | 16.71 | ||||||||
2009 (Annual) | $ | 22.99 | $ | 12.43 | $ | 22.99 | $ | 12.43 | ||||||||
2010 (Annual) | $ | 18.06 | $ | 9.18 | $ | 18.06 | $ | 9.18 | ||||||||
2009 | ||||||||||||||||
2011 (Annual) | $ | 10.99 | $ | 4.78 | ||||||||||||
2010 | ||||||||||||||||
First Quarter | $ | 22.20 | $ | 12.43 | $ | 18.06 | $ | 14.74 | ||||||||
Second Quarter | $ | 22.99 | $ | 14.42 | $ | 16.53 | $ | 13.10 | ||||||||
Third Quarter | $ | 18.69 | $ | 15.09 | $ | 14.88 | $ | 12.64 | ||||||||
Fourth Quarter | $ | 17.15 | $ | 14.66 | $ | 13.84 | $ | 9.18 | ||||||||
2010 | ||||||||||||||||
2011 | ||||||||||||||||
First Quarter | $ | 18.06 | $ | 14.74 | $ | 10.98 | $ | 9.24 | ||||||||
Second Quarter | $ | 16.53 | $ | 13.10 | $ | 10.99 | $ | 9.87 | ||||||||
Third Quarter | $ | 14.88 | $ | 12.64 | $ | 10.13 | $ | 5.58 | ||||||||
Fourth Quarter | $ | 13.84 | $ | 9.18 | $ | 6.20 | $ | 4.78 | ||||||||
October | $ | 13.84 | $ | 10.34 | $ | 6.08 | $ | 5.31 | ||||||||
November | $ | 10.49 | $ | 9.18 | $ | 6.20 | $ | 4.86 | ||||||||
December | $ | 10.40 | $ | 9.84 | $ | 5.39 | $ | 4.78 | ||||||||
2011 | ||||||||||||||||
2012 | ||||||||||||||||
First Quarter | $ | 10.97 | $ | 9.24 | $ | 8.79 | $ | 5.16 | ||||||||
January | $ | 10.31 | $ | 9.24 | $ | 6.68 | $ | 5.16 | ||||||||
February | $ | 9.96 | $ | 9.50 | $ | 6.99 | $ | 6.17 | ||||||||
March | $ | 10.97 | $ | 9.30 | $ | 8.79 | $ | 6.37 | ||||||||
Second Quarter(1) | $ | 10.99 | $ | 10.84 | ||||||||||||
April(1) | $ | 10.99 | $ | 10.84 | ||||||||||||
Second Quarter(1) | $ | 8.67 | $ | 7.80 | ||||||||||||
April(1) | $ | 8.67 | $ | 7.80 | ||||||||||||
| (1) | Through April |
Source: Bloomberg
Comparison of Cumulative Total Shareholder Return
Set forth below is a graph comparing the cumulative total shareholder return of our common shares for the five years endingended December 31, 2010,2011 and the quarter ended March 31, 2012, with the cumulative total return of the S&P 500 Index, and the Dow Jones U.S. Marine Transportation Index and the Bloomberg Tanker Index. Total shareholder return represents stock price changes and assumes the reinvestment of dividends. The graph assumes the investment of $100 on December 31, 2005.2006. Past performance is not necessarily an indicator of future results.
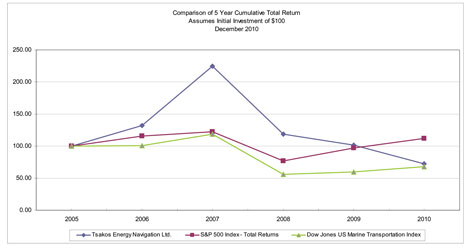
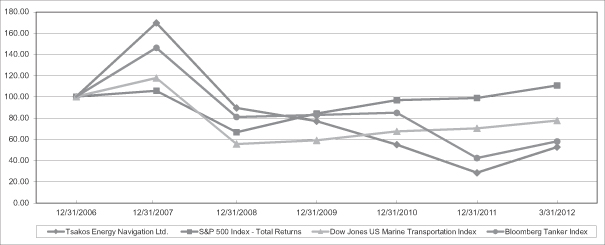
Source: ZacksZachs Investment Research, Inc.
| Item 10. | Additional Information |
DESCRIPTION OF CAPITAL STOCK
Our authorized capital stock consists of 100,000,000 shares, par value $1.00 per share. As of March 31, 2011,2012, there were 46,081,48746,208,737 outstanding common shares. On November 14, 2007, there was a 2-for-1 split of our common shares, effected as a share dividend.
Common Shares
The holders of common shares are entitled to receive dividends out of assets legally available for that purpose at times and in amounts as our board of directors may from time to time determine. Each shareholder is entitled to one vote for each common share held on all matters submitted to a vote of shareholders. Cumulative voting for the election of directors is not provided for in our Memorandum of Association or Bye-laws, which means that the holders of a majority of the common shares voted can elect all of the directors then standing for election. Our Bye-laws provide for a staggered board of directors, with one-third of our non-executive directors being selected each year. The common shares are not entitled to preemptive rights and are not subject to conversion or redemption. Upon the occurrence of a liquidation, dissolution or winding-up, the holders of common shares would be entitled to share ratably in the distribution of all of our assets remaining available for distribution after satisfaction of all our liabilities.
Shareholder Rights Plan
Our board of directors has adopted a shareholder rights plan under which our shareholders received one right for each common share they held. Each right will entitle the holder to purchase from the Company a unit consisting of one one-hundredth of a share of our Series A Junior Participating Preferred Shares, or a combination of securities
and assets of equivalent value, at an exercise price of $127.00, subject to adjustment. The following summary description of the rights agreement does not purport to be complete and is qualified in its entirety by reference to the rights agreement between us and The Bank of New York, as rights agent.
If any person or group acquires shares representing 15% or more of our outstanding common shares, the “flip-in” provision of the rights agreement will be triggered and the rights will entitle a holder, other than such person, any member of such group or related person, as such rights will be null and void, to acquire a number of additional common shares having a market value of twice the exercise price of each right. In lieu of requiring payment of the purchase price upon exercise of the rights following any such event, we may permit the holders simply to surrender the rights, in which event they will be entitled to receive common shares (and other property, as the case may be) with a value of 50% of what could be purchased by payment of the full purchase price.
Until a right is exercised, the holder of the right, as such, will have no rights as a shareholder of our company, including, without limitation, no right to vote or to receive dividends. While the distribution of the rights will not be taxable to shareholders or to us, shareholders may, depending upon the circumstances, recognize taxable income in the event that the rights become exercisable for preferred shares (or other consideration) or for common shares of the acquiring or surviving company or in the event of the redemption of the rights as set forth above.
The existence of the rights agreement and the rights could deter a third party from tendering for the purchase of some or all of our common shares and could have the effect of entrenching management. In addition, they could have the effect of delaying or preventing changes of control of the ownership and management of our company, even if such transactions would have significant benefits to our shareholders.
Bermuda Law
We are an exempted company organized under the Companies Act. Bermuda law and our Memorandum of Association and Bye-laws govern the rights of our shareholders. Our objects and purposes are set forth in paragraph 6 and the Schedule to our Memorandum of Association. Our objects and purposes include to act and to perform all the functions of a holding company in all its branches and to coordinate the policy and administration of any subsidiary company or companies wherever incorporated or carrying on business or of any group of companies of which the Company or any subsidiary company is a member or which are in any manner controlled directly or indirectly by the Company. We refer you to our Memorandum of Association, which is filed as an exhibit to this Annual Report, for a full description of our objects and purposes. The Companies Act differs in some material respects from laws generally applicable to United States corporations and their shareholders. The following is a summary of the material provisions of Bermuda law and our organizational documents.
Dividends. Under Bermuda law, a company may pay dividends that are declared from time to time by its board of directors unless there are reasonable grounds for believing that the company is or would, after the payment, be unable to pay its liabilities as they become due or that the realizable value of its assets would then be less than the aggregate of its liabilities and issued share capital and share premium accounts.
Voting rights. Under Bermuda law, except as otherwise provided in the Companies Act or our Bye-laws, questions brought before a general meeting of shareholders are decided by a majority vote of shareholders present at the meeting. Our Bye-laws provide that, subject to the provisions of the Companies Act, any question proposed for the consideration of the shareholders will be decided in a general meeting by a simple majority of the votes cast, on a show of hands, with each shareholder present (and each person holding proxies for any shareholder) entitled to one vote for each common share held by the shareholder, except for special situations
where a shareholder has lost the right to vote because he has failed to comply with the terms of a notice requiring him to provide information to the company pursuant to the Bye-laws, or his voting rights have been partly suspended under the Bye-laws as a consequence of becoming an interested person. In addition, a super-majority vote of not less than seventy-five percent (75%) of the votes cast at the meeting is required to effect the following actions: variation of class rights, removal of directors, approval of business combinations with certain “interested” persons and for any alteration to the provisions of the Bye-laws relating to the staggered board, removal of directors and business combinations.
Rights in liquidation. Under Bermuda law, in the event of liquidation or winding up of a company, after satisfaction in full of all claims of creditors and subject to the preferential rights accorded to any series of preferred shares, the proceeds of the liquidation or winding up are distributed ratably among the holders of the company’s common shares.
Meetings of shareholders. Under Bermuda law, a company is required to convene at least one general shareholders’ meeting each calendar year. Bermuda law provides that a special general meeting may be called by the board of directors and must be called upon the request of shareholders holding not less than 10% of the paid-up capital of the company carrying the right to vote. Bermuda law also requires that shareholders be given at least five (5) days’ advance notice of a general meeting but the accidental omission to give notice to any person does not invalidate the proceedings at a meeting. Under our Bye-laws, we must give each shareholder at least ten (10) days’ notice of the annual general meeting and of any special general meeting.
Under Bermuda law, the number of shareholders constituting a quorum at any general meeting of shareholders is determined by the Bye-laws of a company. Our Bye-laws provide that the presence in person or by proxy of two shareholders constitutes a quorum; but if we have only one shareholder, one shareholder present in person or by proxy shall constitute the necessary quorum.
Access to books and records and dissemination of information. Members of the general public have the right to inspect the public documents of a company available at the office of the Registrar of Companies in Bermuda. These documents include a company’s Certificate of Incorporation, its Memorandum of Association (including its objects and powers) and any alteration to its Memorandum of Association. The shareholders have the additional right to inspect the Bye-laws of the company, minutes of general meetings and the company’s audited financial statements, which must be presented at the annual general meeting. The register of shareholders of a company is also open to inspection by shareholders without charge and by members of the general public on the payment of a fee. A company is required to maintain its share register in Bermuda but may, subject to the provisions of Bermuda law, establish a branch register outside Bermuda. We maintain a share register in Hamilton, Bermuda. A company is required to keep at its registered office a register of its directors and officers that is open for inspection for not less than two (2) hours each day by members of the public without charge. Bermuda law does not, however, provide a general right for shareholders to inspect or obtain copies of any other corporate records.
Election or removal of directors. Under Bermuda law and our Bye-laws, directors are elected or appointed at the annual general meeting and serve until re-elected or re-appointed or until their successors are elected or appointed, unless they are earlier removed or resign. Our Bye-laws provide for a staggered board of directors, with one-third of the non-executive directors selected each year.
Under Bermuda law and our Bye-laws, a director may be removed at a special general meeting of shareholders specifically called for that purpose, provided the director is served with at least 14 days’ notice. The director has a right to be heard at that meeting. Any vacancy created by the removal of a director at a special general meeting may be filled at that meeting by the election of another director in his or her place or, in the absence of any such election, by the board of directors.
Amendment of Memorandum of Association.Bermuda law provides that the Memorandum of Association of a company may be amended by a resolution passed at a general meeting of shareholders of which due notice has
been given. An amendment to the Memorandum of Association, other than an amendment which alters or reduces a company’s share capital as provided in the Companies Act, also requires the approval of the Bermuda Minister of Finance, who may grant or withhold approval at his discretion. Generally, our Bye-laws may be amended by the directors with the approval of a majority vote of the shareholders in a general meeting. However, a super-majority vote is required for certain resolutions relating to the variation of class rights, the removal of directors, the approval of business combinations with certain ‘interested persons’ and for any alteration to the provisions of the Bye-laws relating to the staggered board, removal of directors and business combinations.
Under Bermuda law, the holders of an aggregate of no less than 20% in par value of a company’s issued share capital or any class of issued share capital have the right to apply to the Supreme Court of Bermuda Court (the “Bermuda Court”) for an annulment of any amendment of the Memorandum of Association adopted by shareholders at any general meeting, other than an amendment which alters or reduces a company’s share capital as provided in the Companies Act. Where such an application is made, the amendment becomes effective only to the extent that it is confirmed by the Bermuda Court. An application for the annulment of an amendment of the Memorandum of Association must be made within 21 days after the date on which the resolution altering the company’s memorandum is passed and may be made on behalf of the persons entitled to make the application by one or more of their number as they may appoint in writing for the purpose. Persons voting in favor of the amendment may make no such application.
Appraisal rights and shareholder suits. Under Bermuda law, in the event of an amalgamation involving a Bermuda company, a shareholder who is not satisfied that fair value has been paid for his shares may apply to the Bermuda Court to appraise the fair value of his shares. The amalgamation of a company with another company requires the amalgamation agreement to be approved by the board of directors and, except where the amalgamation is between a holding company and one or more of its wholly owned subsidiaries or between two or more wholly owned subsidiaries, by meetings of the holders of shares of each company and of each class of such shares.
Class actions and derivative actions are generally not available to shareholders under Bermuda law. The Bermuda Court, however, would ordinarily be expected to permit a shareholder to commence an action in the name of a company to remedy a wrong done to the company where the act complained of is alleged to be beyond the corporate power of the company or is illegal or would result in the violation of the company’s Memorandum of Association or Bye-laws. Further consideration would be given by the Bermuda Court to acts that are alleged to constitute a fraud against the minority shareholders or, for instance, where an act requires the approval of a greater percentage of the company’s shareholders than that which actually approved it.
When the affairs of a company are being conducted in a manner oppressive or prejudicial to the interests of some part of the shareholders, one or more shareholders may apply to the Bermuda Court for an order regulating the company’s conduct of affairs in the future or compelling the purchase of the shares by any shareholder, by other shareholders or by the company.
Anti-takeover effects of provisions of our charter documents. Several provisions of our Bye-laws may have anti-takeover effects. These provisions are intended to avoid costly takeover battles, lessen our vulnerability to a hostile change of control and enhance the ability of our board of directors to maximize shareholder value in connection with any unsolicited offer to acquire us. However, these anti-takeover provisions, which are summarized below, could also discourage, delay or prevent (1) the merger or acquisition of our company by means of a tender offer, a proxy contest or otherwise, that a shareholder may consider in our best interest and (2) the removal of incumbent officers and directors.
Blank check preferred shares. Under the terms of our Bye-laws, our board of directors has authority, without any further vote or action by our shareholders, to issue preferred shares with terms and preferences determined by our board. Our board of directors may issue preferred shares on terms calculated to discourage, delay or prevent a change of control of our company or the removal of our management.
Staggered board of directors. Our Bye-laws provide for a staggered board of directors with one-third of our non-executive directors being selected each year. This staggered board provision could discourage a third party from making a tender offer for our shares or attempting to obtain control of our company. It could also delay shareholders who do not agree with the policies of the board of directors from removing a majority of the board of directors for two years.
Transactions involving certain business combinations. Our Bye-Laws prohibit the consummation of any business combination involving us and any interested person, unless the transaction is approved by a vote of a majority of 80% of those present and voting at a general meeting of our shareholders, unless:
the ratio of (i) the aggregate amount of cash and the fair market value of other consideration to be received per share in the business combination by holders of shares other than the interested person involved in the business combination, to (ii) the market price per share, immediately prior to the announcement of the proposed business combination is at least as great as the ratio of (iii) the highest per share price, which the interested person has theretofore paid in acquiring any share prior to the business combination, to (iv) the market price per share immediately prior to the initial acquisition by the interested person of any shares;
the aggregate amount of the cash and the fair market value of other consideration to be received per share in the business combination by holders of shares other than the interested person involved in the business combination (i) is not less than the highest per share price paid by the interested person in acquiring any shares, and (ii) is not less than the consolidated earnings per share of our company for our four full consecutive fiscal quarters immediately preceding the record date for solicitation of votes on the business combination multiplied by the then price/earnings multiple (if any) of the interested person as customarily computed and reported in the financial community;
the consideration (if any) to be received in the business combination by holders of shares other than the interested person involved shall, except to the extent that a shareholder agrees otherwise as to all or part of the shares which the shareholder owns, be in the same form and of the same kind as the consideration paid by the interested person in acquiring shares already owned by it;
after the interested person became an interested person and prior to the consummation of the business combination: (i) such interested person shall have taken steps to ensure that the board includes at all times representation by continuing directors proportionate in number to the ratio that the number of shares carrying voting rights in our company from time to time owned by shareholders who are not interested persons bears to all shares carrying voting rights in our company outstanding at the time in question (with a continuing director to occupy any resulting fractional position among the directors); (ii) the interested person shall not have acquired from us or any subsidiary of ours directly or indirectly, any shares (except (x) upon conversion of convertible securities acquired by it prior to becoming an interested person, or (y) as a result of a pro rata share dividend, share split or division or subdivision of shares, or (z) in a transaction consummated on or after June 7, 2001 and which satisfied all requirements of our Bye-laws); (iii) the interested person shall not have acquired any additional shares, or rights over shares, carrying voting rights or securities convertible into or exchangeable for shares, or rights over shares, carrying voting rights except as a part of the transaction which resulted in the interested person becoming an interested person; and (iv) the interested person shall not have (x) received the benefit, directly or indirectly (except proportionately as a shareholder), of any loans, advances, guarantees, pledges or other financial assistance or tax credits provided by us or any subsidiary of ours, or (y) made any major change in our business or equity capital structure or entered into any contract, arrangement or understanding with us except any change, contract, arrangement or understanding as may have been approved by the favorable vote of not less than a majority of the continuing directors; and
a proxy statement complying with the requirements of the U.S. Securities Exchange Act of 1934, as amended, shall have been mailed to all holders of shares carrying voting rights for the purpose of soliciting shareholders of the business combination. The proxy statement shall contain at the front thereof, in a prominent place, any recommendations as to the advisability (or inadvisability) of the business combination which the continuing directors, or any of them, may have furnished in writing and, if deemed advisable by a majority of the continuing directors, an opinion of a reputable investment banking firm as to the adequacy (or inadequacy) of the terms of the business combination from the point of view of the holders of shares carrying voting rights other than any interested person (the investment banking firm to be selected by a majority of the continuing directors, to be furnished with all information it reasonably requests, and to be paid a reasonable fee for its services upon receipt by us of the opinion).
combination which the continuing directors, or any of them, may have furnished in writing and, if deemed advisable by a majority of the continuing directors, an opinion of a reputable investment banking firm as to the adequacy (or inadequacy) of the terms of the business combination from the point of view of the holders of shares carrying voting rights other than any interested person (the investment banking firm to be selected by a majority of the continuing directors, to be furnished with all information it reasonably requests, and to be paid a reasonable fee for its services upon receipt by us of the opinion). |
For purposes of this provision, a “business combination” includes mergers, consolidations, exchanges, asset sales, leases and other transactions resulting in a financial benefit to the interested shareholder and an “interested person” is any person or entity that beneficially owns 15% or more of our outstanding voting shares and any person or entity affiliated with or controlling or controlled by that person or entity. “Continuing directors” means directors who have been elected before June 7, 2001 or designated as continuing directors by the majority of the then continuing directors.
Consequences of becoming an interested person. Our Bye-Laws provide that, at any time a person acquires or becomes the beneficial owner of 15% or more of our voting shares, which we refer to as the “threshold”, then the person will not be entitled to exercise voting rights for the number of common shares in excess of the threshold he holds or beneficially owns. This disability applies to any general meeting of our company as to which the record date or scheduled meeting date falls within a period of five years from the date such person acquired beneficial ownership of a number of common shares in excess of the threshold.
The above restrictions do not apply to us, our subsidiaries or to:
any person who on June 7, 2001 was the holder or beneficial owner of a number of shares carrying voting rights that exceeded the threshold and who continues at all times after June 7, 2001 to hold shares in excess of the threshold; and
any person whose acquisition of a number of shares exceeding the threshold has been approved by (1) a majority of 80% of those present and voting at a general meeting or (2) by a resolution adopted by the continuing directors, followed by a resolution adopted by a shareholder vote in excess of 50% of the voting shares not owned by such interested person.
|
Transfer agent and registrar. The Bank of New York Mellon serves as transfer agent and registrar for our common shares.
New York Stock Exchange listing. Our common shares are listed on the New York Stock Exchange under the ticker symbol “TNP.”
Other listings.Our common shares were listed on the Oslo Børs under the symbol TEN until a voluntary de-listing on March 18, 2005 and on the Bermuda Stock Exchange under the symbol TEN. Our common shares are no longer actively traded on either of these exchanges.
Material Contracts
See description of Management Agreement under Item 4. “Information on the Company—Management Contract—Executive and Commercial Management.” Such description is not intended to be complete and reference is made to the contract itself, which is an exhibit to this Annual Report on Form 20-F.
Exchange Controls
Under Bermuda and Greek law, there are currently no restrictions on the export or import of capital, including foreign exchange controls, or restrictions that affect the remittance of dividends, interest or other payments to nonresident holders of our common shares.
TAX CONSIDERATIONS
Taxation of Tsakos Energy Navigation Limited
We believe that none of our income will be subject to tax in Bermuda, which currently has no corporate income tax, or by other countries in which we conduct activities or in which our customers are located, excluding the United States. However, this belief is based upon the anticipated nature and conduct of our business which may change, and upon our understanding of our position under the tax laws of the various countries in which we have assets or conduct activities, which position is subject to review and possible challenge by taxing authorities and to possible changes in law, which may have retroactive effect. The extent to which certain taxing jurisdictions may require us to pay tax or to make payments in lieu of tax cannot be determined in advance. In addition, payments due to us from our customers may be subject to withholding tax or other tax claims in amounts that exceed the taxation that we might have anticipated based upon our current and anticipated business practices and the current tax regime.
Bermuda tax considerations
Under current Bermuda law, we are not subject to tax on income or capital gains. Furthermore, we have obtained from the Minister of Finance of Bermuda, under the Exempted Undertakings Tax Protection Act 1966 of Bermuda, as amended (the “Exempted Undertakings Act”), assurance that, in the event that Bermuda enacts any legislation imposing tax computed on profits or income or computed on any capital asset, gain or appreciation, or any tax in the nature of estate duty or inheritance tax, then the imposition of such tax will not be applicable to us or to any of our operations, or to the shares, capital or common stock of Tsakos Energy Navigation, until March 28, 2016. The Government of Bermuda has recently amended the Exempted Undertakings Act to extend the aforementioned tax assurance through March 31, 2035. We intend to apply to the Minister of Finance of Bermuda for such an extension. This assurance does not, however, prevent the imposition of property taxes on any company owning real property or leasehold interests in Bermuda or on any person ordinarily resident in Bermuda. We pay an annual government fee on our authorized share capital and share premium, which for 20102011 is $10,455.$10,461.
Under current Bermuda law, shareholders not ordinarily resident in Bermuda will not be subject to any income, withholding or other taxes or stamp or other duties upon the issue, transfer or sale of common shares or on any payments made on common shares.
United States federal income tax considerations
The following summary of United States federal income tax matters is based on the Internal Revenue Code, judicial decisions, administrative pronouncements, and existing and proposed regulations issued by the United States department of the treasury, all of which are subject to change, possibly with retroactive effect. This discussion does not address any United States local or state taxes.
The following is a summary of the material United States federal income tax considerations that apply to (1) our operations and the operations of our vessel-operating subsidiaries and (2) the acquisition, ownership and disposition of common shares by a shareholder that is a United States holder. This summary is based upon our beliefs and expectations concerning our past, current and anticipated activities, income and assets and those of our subsidiaries, the direct, indirect and constructive ownership of our shares and the trading and quotation of our shares. Should any such beliefs or expectations prove to be incorrect, the conclusions described herein could be adversely affected. For purposes of this discussion, a United States holder is a beneficial owner of common shares who or which is:
An individual citizen or resident of the United States;
A corporation, or other entity taxable as a corporation for United States federal income tax purposes, created or organized in or under the laws of the United States or any of its political subdivisions; or
An estate or trust the income of which is subject to United States federal income taxation regardless of its source.
This summary deals only with common shares that are held as capital assets by a United States holder, and does not address tax considerations applicable to United States holders that may be subject to special tax rules, such as:
Dealers or traders in securities or currencies;
Financial institutions;
Insurance companies;
Tax-exempt entities;
United States holders that hold common shares as a part of a straddle or conversion transaction or other arrangement involving more than one position;
United States holders that own, or are deemed for United States tax purposes to own, ten percent or more of the total combined voting power of all classes of our voting stock;
A person subject to United States federal alternative minimum tax;
A partnership or other entity classified as a partnership for United States federal income tax purposes;
United States holders that have a principal place of business or “tax home” outside the United States; or
United States holders whose “functional currency” is not the United States dollar.
The discussion below is based upon the provisions of the Internal Revenue Code and regulations, administrative pronouncements and judicial decisions as of the date of this Annual Report; any such authority may be repealed, revoked or modified, perhaps with retroactive effect, so as to result in federal income tax consequences different from those discussed below.
Because United States tax consequences may differ from one holder to the next, the discussion set out below does not purport to describe all of the tax considerations that may be relevant to you and your particular situation. Accordingly, you are advised to consult your own tax advisor as to the United States federal, state, local and other tax consequences of investing in the common shares.
Taxation of our operations
In General
Unless exempt from United States federal income taxation under the rules discussed below, a foreign corporation is subject to United States federal income taxation in respect of any income that is derived from the use of vessels, from the hiring or leasing of vessels for use on a time, voyage or bareboat charter basis, from the participation in a pool, partnership, strategic alliance, joint operating agreement, code sharing arrangements or other joint venture it directly or indirectly owns or participates in that generates such income, or from the performance of services directly related to those uses, which we refer to as “shipping income,” to the extent that the shipping income is derived from sources within the United States. For these purposes, 50% of shipping income that is attributable to transportation that begins or ends, but that does not both begin and end, in the United States constitutes income from sources within the United States, which we refer to as “U.S.-source shipping income.”
Shipping income attributable to transportation that both begins and ends in the United States is considered to be 100% from sources within the United States. We do not expect that we or any of our subsidiaries will engage in transportation that produces income which is considered to be 100% from sources within the United States.
Shipping income attributable to transportation exclusively between non-United States ports will be considered to be 100% derived from sources outside the United States. Shipping income derived from sources outside the United States will not be subject to any United States federal income tax.
In the absence of exemption from tax under Section 883, our gross U.S.-source shipping income would be subject to a 4% tax imposed without allowance for deductions as described below.
Exemption of Operating Income from United States Federal Income TaxationTaxation.
Under Section 883, we and our subsidiaries will be exempt from United States federal income taxation on our U.S.-source shipping income if:
We and the relevant subsidiary are each organized in a foreign country (the “country of organization”) that grants an “equivalent exemption” to corporations organized in the United States; and either
More than 50% of the value of our stock is owned, directly or indirectly, by “qualified stockholders,” individuals who are (i) “residents” of our country of organization or of another foreign country that grants an “equivalent exemption” to corporations organized in the United States and (ii) satisfy certain documentation requirements, which we refer to as the “50% Ownership Test,” or
Our common shares are “primarily and regularly traded on an established securities market” in our country of organization, in another country that grants an “equivalent exemption” United States corporations, or in the United States, which we refer to as the “Publicly-Traded Test.”
We believe that each of Bermuda, Cyprus, Liberia and Panama, the jurisdictions where we and our ship-owning subsidiaries are incorporated, grants an “equivalent exemption” to United States corporations. Therefore, we believe that we and each of our subsidiaries will be exempt from United States federal income taxation with respect to our U.S.-source shipping income if we satisfy either the 50% Ownership Test or the Publicly-Traded Test.
Due to the widely-held nature of our stock, we will have difficulty satisfying the 50% Ownership Test. Our ability to satisfy the Publicly-Traded Test is discussed below.
The regulations provide, in pertinent part, that stock of a foreign corporation will be considered to be “primarily traded” on anone or more established securities marketmarkets in a country if the number of shares of each class of stock that are traded during any taxable year on all established securities markets in that country exceeds the number of shares in each such class that are traded during that year on established securities markets in any other single country. Our common shares, which are our sole class of our issued and outstanding shares, were “primarily traded” on an established securities market in the United States (the New York Stock ExchangeExchange) in 20102011 and we expect that will continue to be the case in subsequent years.
Under the regulations, our stock will be considered to be “regularly traded” on an established securities market if one or more classes of our stock representing more than 50% of our outstanding shares, by total combined voting power of all classes of stock entitled to vote and total value, is listed on the market, which we refer to as the listing requirement. Since our common shares, which are our sole class of issued and outstanding shares, were listed on the New York Stock Exchange throughout 2010,2011, we satisfied the listing requirement for 2010.2011. We expect that we will continue to do so for subsequent years.
It is further required that with respect to each class of stock relied upon to meet the listing requirement (i) such class of the stock is traded on the market, other than in minimal quantities, on at least 60 days during the taxable year or1/ 1/6 of the days in a short taxable year; and (ii) the aggregate number of shares of such class of stock traded on such market is at least 10% of the average number of shares of such class of stock outstanding during such year or as appropriately adjusted in the case of a short taxable year. We believe our common shares
satisfied the trading frequency and trading volume tests for 20102011 and will also do so in subsequent years. Even if this were not the case, the regulations provide that the trading frequency and trading volume tests will be deemed satisfied by a class of stock if, as we believe was the case with our common shares in 20102011 and we expect to be the case with our common shares in subsequent years, such class of stock is traded on an established market in the United States and such class of stock is regularly quoted by dealers making a market in such stock.
Notwithstanding the foregoing, the regulations provide, in pertinent part, that our common shares will not be considered to be “regularly traded” on an established securities market for any taxable year in which 50% or more of our outstanding common shares are owned, actually or constructively under specified stock attribution rules, on more than half the days during the taxable year by persons who each own 5% or more of our common shares, which we refer to as the “5 Percent Override Rule.”
For purposes of being able to determine the persons who own 5% or more of our stock, or “5% Stockholders,” the regulations permit us to rely on Schedule 13G and Schedule 13D filings with the SEC to identify persons who have a 5% or more beneficial interest in our common shares. The regulations further provide that an investment company which is registered under the Investment Company Act of 1940, as amended, will not be treated as a 5% Stockholder for such purposes.
In the event the 5 Percent Override Rule is triggered, the regulations provide that the 5 Percent Override Rule will nevertheless not apply if we can establish, in accordance with specified ownership certification procedures, that a sufficient portion of the common shares within the closely-held block are owned, actually or under applicable constructive ownership rules, by qualified shareholders for purposes of Section 883 to preclude the common shares in the closely-held block that are not so owned from constituting 50% or more of the our common shares for more than half the number of days during the taxable year.
We do not believe that we were subject to the 5 Percent Override Rule for 2010.2011. Therefore, we believe that we satisfied the Publicly-Traded Test for 2010.2011. However, there is no assurance that we will continue to satisfy the Publicly-Traded Test. If we were to be subject to the 5 Percent Override Rule for any tax year, then our ability and that of our subsidiaries to qualify for the benefits of Section 883 would depend upon our ability to establish, in accordance with specified ownership certification procedures, that a sufficient portion of the common shares within the closely-held block are owned, actually or under applicable constructive ownership rules, by qualified shareholders for purposes of Section 883, to preclude the common shares in the closely-held block that are not so owned from constituting 50% or more of the our common shares for more than half the number of days during the tax year. Since there can be no assurance that we would be able to establish these requirements, there can be no assurance that we or our subsidiaries will qualify for the benefits of Section 883 for any subsequent tax year.
Taxation in Absence of Exemption
To the extent the benefits of Section 883 are unavailable, our U.S.-source shipping income, to the extent not considered to be “effectively connected” with the conduct of a United States trade or business, as described below, would be subject to a 4% tax imposed by Section 887 of the Internal Revenue Code on a gross basis, without the benefit of deductions. Since under the sourcing rules described above, nowe do not expect that more than 50% of our shipping income would be treated as being derived from United States sources, the maximum effective rate of United States federal income tax on our shipping income would never exceed 2% under the 4% gross basis tax regime.
To the extent the benefits of the Section 883 exemption are unavailable and our U.S.-source shipping income or that of any of our subsidiaries is considered to be “effectively connected” with the conduct of a United States trade or business, as described below, any such “effectively connected” U.S.-source shipping income, net of applicable deductions, would be subject to the United States federal corporate income tax currently imposed at rates of up to 35%. In addition, we or our subsidiaries may be subject to the 30% “branch profits” taxes on
earnings effectively connected with the conduct of such trade or business, as determined after allowance for certain adjustments, and on certain interest paid or deemed paid attributable to the conduct of its United States trade or business.
U.S.-source shipping income would be considered “effectively connected” with the conduct of a United States trade or business only if:
We or one of our subsidiaries has, or is considered to have, a fixed place of business in the United States involved in the earning of shipping income; and
(i) in the case of shipping income other than that derived from bareboat charters, substantially all of our or such subsidiary’s U.S.-source shipping income is attributable to regularly scheduled transportation, such as the operation of a vessel that follows a published schedule with repeated sailings at regular intervals between the same points for voyages that begin or end in the United States and (ii) in the case of shipping income from bareboat charters, substantially all of our or such subsidiary’s income from bareboat charters is attributable to a fixed place of business in the U.S.
|
We do not intend that we or any of our subsidiaries will have any vessel operating to the United States on a regularly scheduled basis. Based on the foregoing and on the expected mode of our shipping operations and other activities, we believe that none of the U.S.-source shipping income of us or our subsidiaries will be “effectively connected” with the conduct of a United States trade or business.
United States Taxation of Gain on Sale of Vessels
Regardless of whether we or our subsidiaries qualify for exemption under Section 883, we and our subsidiaries will not be subject to United States federal income taxation with respect to gain realized on a sale of a vessel, provided the sale is considered to occur outside of the United States under United States federal income tax principles. In general, a sale of a vessel will be considered to occur outside of the United States for this purpose if title to the vessel, and risk of loss with respect to the vessel, pass to the buyer outside of the United States. It is expected that any sale of a vessel by us or our subsidiaries will be considered to occur outside of the United States.
United States Holders
Distributions
Subject to the discussion below under “—Passive Foreign Investment Company Considerations,” distributions that we make with respect to the common shares, other than distributions in liquidation and distributions in redemption of stock that are treated as exchanges, will be taxed to United States holders as dividend income to the extent that the distributions do not exceed our current and accumulated earnings and profits (as determined for United States federal income tax purposes). Distributions, if any, in excess of our current and accumulated earnings and profits will constitute a nontaxable return of capital to a United States holder and will be applied against and reduce the United States holder’s tax basis in its common shares. To the extent that distributions in excess of our current and accumulated earnings and profits exceed the tax basis of the United States holder in its common shares, the excess generally will be treated as capital gain.
Qualifying dividends received by individuals in taxable years beginning prior to January 1, 2013 are eligible for taxation at capital gains rates (currently 15% for individuals not eligible for a lower rate). We are a non- United States corporation for U.S. federal income tax purposes. Dividends paid by a non-United States corporation are eligible to be treated as qualifying dividends only if (i) the non-United States corporation is incorporated in a possession of the United States, (ii) the non- United States corporation is eligible for the benefits of a comprehensive income tax treaty with the United States or (iii) the stock with respect to which the dividends are paid is “readily tradable on an established securities market in the United States.” We will not satisfy either of the conditions described in clauses (i) and (ii) of the preceding sentence. We expect that distributions on our common shares that are treated as dividends will qualify as dividends on stock that is “readily
“readily tradable on an established securities market in the United States” so long as our common shares are traded on the New York Stock Exchange. In addition, dividends paid by a non-United States corporation will not be treated as qualifying dividends if the non-United States corporation is a “passive foreign investment company” (a “PFIC”) for the taxable year of the dividend or the prior taxable year. Our potential treatment as a PFIC is discussed below under the heading “—passive foreign investment company considerations.” A dividend will also not be treated as a qualifying dividend to the extent that (i) the shareholder does not satisfy a holding period requirement that generally requires that the shareholder hold the shares on which the dividend is paid for more than 60 days during the 121-day period that begins on the date which is sixty days before the date on which the shares become ex-dividend with respect to such dividend, (ii) the shareholder is under an obligation to make related payments with respect to substantially similar or related property or (iii) such dividend is taken into account as investment income under Section 163(d)(4)(b) of the Internal Revenue Code. Legislation has been proposed in the United States Congress which, if enacted in its current form, would likely cause dividends on our shares to be ineligible for the preferential tax rates described above. There can be no assurance regarding whether, or in what form, such legislation will be enacted.
Special rules may apply to any “extraordinary dividend,” generally a dividend in an amount which is equal to or in excess of ten percent of a shareholder’s adjusted basis (or fair market value in certain circumstances) in a common share paid by us. If we pay an “extraordinary dividend” on our common shares and such dividend is treated as “qualified dividend income,” then any loss derived by a U.S. individual holder from the sale or exchange of such common shares will be treated as long-term capital loss to the extent of such dividend.
Dividend income derived with respect to the common shares generally will constitute portfolio income for purposes of the limitation on the use of passive activity losses, and, therefore, generally may not be offset by passive activity losses, and, unless treated as qualifying dividends as described above (for taxable years beginning before January 1, 2013), investment income for purposes of the limitation on the deduction of investment interest expense. Dividends that we pay will not be eligible for the dividends received deduction generally allowed to United States corporations under Section 243 of the Internal Revenue Code.
For foreign tax credit purposes, if at least 50 percent of our stock by voting power or by value is owned, directly, indirectly or by attribution, by United States persons, then, subject to the limitation described below, a portion of the dividends that we pay in each taxable year will be treated as United States -source income, depending in general upon the ratio for that taxable year of our United States -source earnings and profits to our total earnings and profits. The remaining portion of our dividends (or all of our dividends, if we do not meet the 50 percent test described above) will be treated as foreign-source income and generally will be treated as passive category income or, in the case of certain types of United States holders, general category income for purposes of computing allowable foreign tax credits for United States federal income tax purposes. However, if, in any taxable year, we have earnings and profits and less than ten percent of those earnings and profits are from United States sources, then, in general, dividends that we pay from our earnings and profits for that taxable year will be treated entirely as foreign-source income. Where a United States holder that is an individual receives a dividend on our shares that is a qualifying dividend (as described in the second preceding paragraph) in a taxable year beginning before January 1, 2013, special rules will apply that will limit the portion of such dividend that will be included in such individual’s foreign source taxable income and overall taxable income for purposes of calculating such individual’s foreign tax credit limitation.
Sale or exchange
Subject to the discussion below under “—Passive Foreign Investment Company Considerations,” upon a sale or exchange of common shares to a person other than us or certain entities related to us, a United States holder will recognize gain or loss in an amount equal to the difference between the amount realized on the sale or exchange and the United States holder’s adjusted tax basis in the common shares. Any gain or loss recognized will be capital gain or loss and will be long-term capital gain or loss if the United States holder has held the common shares for more than one year.
Gain or loss realized by a United States holder on the sale or exchange of common shares generally will be treated as United States -source gain or loss for United States foreign tax credit purposes. A United States holder’s ability to deduct capital losses against ordinary income is subject to certain limitations.
Passive Foreign Investment Company Considerations
PFIC classification. Special and adverse United States tax rules apply to a United States holder that holds an interest in a PFIC. In general, a PFIC is any foreign corporation, if (1) 75 percent or more of the gross income of the corporation for the taxable year is passive income (the “PFIC income test”) or (2) the average percentage of assets held by the corporation during the taxable year that produce passive income or that are held for the production of passive income is at least 50 percent (the “PFIC asset test”). In applying the PFIC income test and the PFIC asset test, a corporation that owns, directly or indirectly, at least 25 percent by value of the stock of a second corporation must take into account its proportionate share of the second corporation’s income and assets.
If a corporation is classified as a PFIC for any year during which a United States person is a shareholder, then the corporation generally will continue to be treated as a PFIC with respect to that shareholder in all succeeding years, regardless of whether the corporation continues to meet the PFIC income test or the PFIC asset test, subject to elections to recognize gain that may be available to the shareholder.
There are legal uncertainties involved in determining whether the income derived from time chartering activities constitutes rental income or income derived from the performance of services. InTidewater Inc. v. United States, 565 F.2d 299 (5th Cir. 2009), the United States Court of Appeals for the Fifth Circuit held that income derived from certain time chartering activities should be treated as rental income rather than services income for purposes of a foreign sales corporation provision of the Code. In a recent published guidance, however, the Internal Revenue Service (the “IRS”) states that it disagrees with the holding in Tidewater, and specifies that time charters should be treated as service contracts. On this basis, we do not believe that we were treated as a PFIC for our most recent taxable year or that we will be treated as a PFIC for any subsequent taxable year. This conclusion is based in part upon our beliefs regarding our past assets and income and our current projections and expectations as to our future business activity, including, in particular, our expectation that the proportion of our income derived from bareboat charters will not materially increase. However, we have not sought, and we do not expect to seek, an IRS ruling on this matter. As a result, the IRS or a court could disagree with our position. No assurance can be given that this result will not occur. In addition, although we intend to conduct our affairs in a manner to avoid, to the extent possible, being classified as a PFIC with respect to any taxable year, we cannot assure you that the nature of our operations will not change in the future, or that we can avoid PFIC status in the future.
Consequences of PFIC Status. As discussed below, if we were to be treated as a PFIC for any taxable year, a United States holder generally would be subject to one of three different U.S. income tax regimes, depending on whether or not the United States holder makes certain elections. Additionally, the United States holder would be required to file an annual information report with the IRS for taxable years beginning on or after March 18, 2010.IRS.
Taxation of United States Holders that Make No Election. If we are treated as a PFIC for any taxable year during which a United States holder holds our common shares, then, subject to the discussion of the qualified electing fund (“QEF”) and mark-to-market rules below, the United States holder will be subject to a special and adverse tax regime in respect of (1) gains realized on the sale or other disposition of our common shares and (2) distributions on our common shares to the extent that those distributions are treated as excess distributions. An excess distribution generally includes dividends or other distributions received from a PFIC in any taxable year of a United States holder to the extent that the amount of those distributions exceeds 125 percent of the average distributions made by the PFIC during a specified base period.period (or, if shorter, the United States holder’s holding period for the shares). A United States holder that is subject to the PFIC rules (1) will be required to allocate excess distributions received in respect of our common shares and gain realized on the sale of common shares to each day during the United States holder’s holding period for the common shares, (2) will be required
to include in income as ordinary income the portion of the excess distribution or gain that is allocated to the current taxable year and to certain pre-PFIC years, and (3) will be taxable at the highest rate of taxation applicable to ordinary income for the prior years, other than pre-PFIC years, to which the excess distribution or gain is allocable, without regard to the United States holder’s other items of income and loss for such prior taxable years (“deferred tax”). The deferred tax for each prior year will be increased by an interest charge for the period from the due date for tax returns for the prior year to the due date for tax returns for the year of the excess distribution or gain, computed at the rates that apply to underpayments of tax. Pledges of PFIC shares will be treated as dispositions for purposes of the foregoing rules. In addition, a United States holder who acquires common shares from a decedent prior to 2010 generally will not receive a stepped-up basis in the common shares. Instead, the United States holder will have a tax basis in the common shares equal to the lower of the fair market value of the common shares and the decedent’s basis.
If we are treated as a PFIC for any taxable year during which a United States holder holds our common shares and one of our subsidiaries also qualifies as a PFIC for such year, then such United States holder may also be subject to the PFIC rules with respect to its indirect interest in such subsidiary. No mark-to-market election will be available with respect to the indirect interest in the shares of such subsidiary and we currently do not intend to comply with reporting requirements necessary to permit the making of QEF elections in such circumstances.
Taxation of United States Holders that Make a QEF Election. In some circumstances, a United States holder may avoid the unfavorable consequences of the PFIC rules by making a QEF election with respect to us. A QEF election effectively would require an electing United States holder to include in income currently its pro rata share of our ordinary earnings and net capital gain. However, a United States holder cannot make a QEF election with respect to us unless we comply with certain reporting requirements and we currently do not intend to provide the required information.
Taxation of United States Holders that Make a Mark-to-Market Election. A United States holder that holds “marketable” stock in a PFIC may, in lieu of making a QEF election, avoid some of the unfavorable consequences of the PFIC rules by electing to mark the PFIC stock to market as of the close of each taxable year. The common shares will be treated as marketable stock for a calendar year if the common shares are traded on the New York Stock Exchange, in other than de minimis quantities, on at least 15 days during each calendar quarter of the year. A United States holder that makes the mark-to-market election generally will be required to include in income each year as ordinary income an amount equal to the increase in value of the common shares for that year, regardless of whether the United States holder actually sells the common shares. The United States holder generally will be allowed a deduction for the decrease in value of the common shares for the taxable year, to the extent of the amount of gain previously included in income under the mark-to-market rules, reduced by prior deductions under the mark-to-market rules. Any gain from the actual sale of the PFIC stock will be treated as ordinary income, and any loss will be treated as ordinary loss to the extent of net mark-to-market gains previously included in income and not reversed by prior deductions.
Other PFIC Elections. If a United States holder held our stock during a period when we were treated as a PFIC, but the United States holder did not have a QEF election in effect with respect to us, then in the event that we failed to qualify as a PFIC for a subsequent taxable year, the United States holder could elect to cease to be subject to the rules described above with respect to those shares by making a “deemed sale” or, in certain circumstances, a “deemed dividend” election with respect to our stock. If the United States holder makes a deemed sale election, the United States holder will be treated, for purposes of applying the rules described above under the heading “consequences of PFIC status”, as having disposed of our stock for its fair market value on the last day of the last taxable year for which we qualified as a PFIC (the “termination date”). The United States holder would increase his, her or its basis in such common stock by the amount of the gain on the deemed sale described in the preceding sentence. Following a deemed sale election, the United States holder would not be treated, for purposes of the PFIC rules, as having owned the common stock during a period prior to the termination date when we qualified as a PFIC.
If we were treated as a “controlled foreign corporation” for United States federal income tax purposes for the taxable year that included the termination date, then a United States holder could make a “deemed dividend” election with respect to our common stock. If a deemed dividend election is made, the United States holder is required to include in income as a dividend his, her or its pro rata share (based on all of our stock held by the United States holder, directly or under applicable attribution rules, on the termination date) of our post-1986 earnings and profits as of the close of the taxable year that includes the termination date (taking only earnings and profits accumulated in taxable years in which we were a PFIC into account). The deemed dividend described in the preceding sentence is treated as an excess distribution for purposes of the rules described above under the heading “consequences of PFIC status.” The United States holder would increase his, her or its basis in our stock by the amount of the deemed dividend. Following a deemed dividend election, the United States holder would not be treated, for purposes of the PFIC rules, as having owned the stock during a period prior to the termination date when we qualified as a PFIC. For purposes of determining whether the deemed dividend election is available, we generally will be treated as a controlled foreign corporation for a taxable year when, at any time during that year, United States persons, each of whom owns, directly or under applicable attribution rules, shares having 10% or more of the total voting power of our stock, in the aggregate own, directly or under applicable attribution rules, shares representing more than 50% of the voting power or value of our stock.
A deemed sale or deemed dividend election must be made on the United States holder’s original or amended return for the shareholder’s taxable year that includes the termination date and, if made on an amended return, such amended return must be filed not later than the date that is three years after the due date of the original return for such taxable year. Special rules apply where a person is treated, for purposes of the PFIC rules, as indirectly owning our common stock.
You are urged to consult your own tax advisor regarding our possible classification as a PFIC, as well as the potential tax consequences arising from the ownership and disposition, directly or indirectly, of interests in a PFIC.
Recent Legislation
Recently-adopted legislation requires certain United States holders that are individuals, estates or trusts to pay an additional 3.8% tax on, among other things, dividends on and capital gains from the sale or other disposition of stock for taxable years beginning after December 31, 2012. You are encouraged to consult your own tax advisors regarding the effect, if any, of this legislation on their ownership and disposition of our stock.
In addition, recently-adopted legislation imposes new U.S. return disclosure obligations (and related penalties for failure to disclose) on U.S. individuals that hold certain specified foreign financial assets with value in excess of reporting thresholds of $50,000 or more (which include shares in a foreign corporation). Such U.S. individuals are required to file IRS Form 8938, listing these assets, with their U.S. Federal income tax returns. You are encouraged to consult your own tax advisors concerning the filing of IRS Form 8938.
Information reporting and backup withholding
Payments of dividends and sales proceeds that are made within the United States or through certain U.S.-related financial intermediaries generally are subject to information reporting and backup withholding unless (i) you
are a corporation or other exempt recipient or (ii) in the case of backup withholding, you provide a correct taxpayer identification number and certify that you are not subject to backup withholding.
The amount of any backup withholding from a payment to you will be allowed as a credit against your United States federal income tax liability and may entitle you to a refund, provided that the required information is furnished to the Internal Revenue Service.
Available Information
We are subject to the informational requirements of the Securities Exchange Act of 1934, as amended. In accordance with these requirements, we file reports and other information as a foreign private issuer with the SEC. You may inspect and copy our public filings without charge at the public reference facilities maintained by the SEC at 100 F Street, N.E., Washington, D.C. 20549. Please call the SEC at 1-800-SEC-0330 for further information about the public reference room. You may obtain copies of all or any part of such materials from the SEC upon payment of prescribed fees. You may also inspect reports and other information regarding registrants, such as us, that file electronically with the SEC without charge at a web site maintained by the SEC athttp://www.sec.gov. In addition, material filed by Tsakos Energy Navigation can be inspected at the offices of the New York Stock Exchange at 20 Broad Street, New York, New York 10005.
| Item 11. | Quantitative and Qualitative Disclosures About Market Risk |
Our risk management policy. Our policy is to continuously monitor our exposure to business risks, including the impact of changes in interest rates, currency rates, and bunker prices on earnings and cash flows. We intend to assess these risks and, when appropriate, enter into derivative contracts with creditworthy counter parties to minimize our exposure to these risks. As part of our efforts to manage our risk, we have in the past entered into derivative contracts for both hedging and, periodically, trading purposes.
In August 2001, we created a Risk Committee, which is comprised of our finance directorchief financial officer and a standing committee of the board of directors. The primary role of the Risk Committee is to:
continuously review and assess all activities that may generate exposure to risk and ensure we are taking appropriate measures;
ensure that our policies and procedures for evaluating and managing risks are effective and do not significantly increase overall risk; and
assess the effectiveness of derivative contracts and recommend, if necessary, the early termination of any contract.
Our risk management policy provides for the following procedures:
All recommendations to enter into a derivative contract must originate either from qualified officers or directors of the company or from equivalent specialized officers of our technicalcommercial manager;
All recommendations to enter into a derivative contract must be reviewed by a combined team of officers and advice is taken, as applicable, from third-party sources (e.g., our bankers, other banks, bunker brokers, insurers, etc.);
Any recommendation must be formalized into a specific proposal which defines the risks to be managed, the action to be implemented, and the benefits and potential risks of the proposed derivative contract, which proposal shall be presented to the risk committee; and
All derivative contracts must be approved by the Risk Committee and be within the overall limits set by the board of directors.
Interest rate risk
The Company is exposed to market risk from changes in interest rates, which could impact its results of operations, financial condition and cash flow. The Company manages its ratio of fixed to floating rate debt with the objective of achieving a mix that reflects management’s interest rate outlook. As of March 31, 20112012 we had $605$536 million in effective hedging swaps and a further $237$210 million in interest rate swaps that do not meet hedging criteria. The annualized impact in terms of swap related interest payable resulting from a one-percentage0.5% point increase in interest rates based on the notional amount at December 31, 2011 would be an increase of approximately $3.4$3.8 million in earnings and cash flow. The annualized impact
resulting from a one-percentage0.5% point decrease in interest rates based on the notional amount at December 31, 2011 would be a decrease of approximately $8.8$3.8 million in earnings and cash flow.
The table below provides information about our financial instruments at December 31, 2010,2011, which are sensitive to changes in interest rate, including our debt and interest rate swaps. For debt obligations, the table presents principal cash flows and related weighted average interest rates by expected maturity dates. Weighted-average variable rates are based on the implied forward rates in the yield curves at the reporting date. For interest rate swaps, the table presents notional amounts and weighted- average interest rates by expected contractual maturity dates. Notional amounts are used to calculate the contractual payments to be exchanged under the contracts.
| Balance as of Dec. 31, 2010 | Expected Maturities(1) | Balance as of Dec. 31, 2011 | Expected Maturities(1) | |||||||||||||||||||||||||||||||||||||||||||||||||||||
| 2011 | 2012 | 2013 | 2014 | 2015 | Thereafter | 2012 | 2013 | 2014 | 2015 | 2016 | Thereafter | |||||||||||||||||||||||||||||||||||||||||||||
| (In millions of U.S. dollars, except percentages) | (In millions of U.S. dollars, except percentages) | |||||||||||||||||||||||||||||||||||||||||||||||||||||||
Long-Term Debt: | ||||||||||||||||||||||||||||||||||||||||||||||||||||||||
Fixed Rate Debt | 84.9 | 10.6 | 10.6 | 10.6 | 10.6 | 10.6 | 31.9 | 74.4 | 10.6 | 10.6 | 10.6 | 10.6 | 10.6 | 21.4 | ||||||||||||||||||||||||||||||||||||||||||
Weighted Average Interest Rate | 5.19 | % | 5.19 | % | 5.19 | % | 5.19 | % | 5.19 | % | 5.19 | % | 5.19 | % | 5.19 | % | 5.19 | % | 5.19 | % | 5.19 | % | 5.19 | % | 5.19 | % | 5.19 | % | ||||||||||||||||||||||||||||
Variable Rate Debt(2) | 1,477.6 | 123.2 | 107.6 | 143.9 | 97.7 | 228.5 | 776.7 | |||||||||||||||||||||||||||||||||||||||||||||||||
Variable Rate Debt(2) | 1,441.3 | 186.4 | 124.2 | 100.3 | 200.3 | 202.0 | 628.0 | |||||||||||||||||||||||||||||||||||||||||||||||||
Weighted Average Interest Rate | 1.34 | % | 1.74 | % | 1.74 | % | 3.23 | % | 4.09 | % | 4.97 | % | 6.21 | % | 1.41 | % | 2.24 | % | 1.36 | % | 2.11 | % | 2.70 | % | 3.32 | % | 4.62 | % | ||||||||||||||||||||||||||||
| 1,562.5 | 133.8 | 118.2 | 154.5 | 108.3 | 239.1 | 808.6 | 1,515.7 | 197.0 | 134.8 | 110.9 | 210.9 | 212.6 | 649.4 | |||||||||||||||||||||||||||||||||||||||||||
Interest Rate Swaps (or Derivatives): | ||||||||||||||||||||||||||||||||||||||||||||||||||||||||
Interest rate swaps – variable to fixed | ||||||||||||||||||||||||||||||||||||||||||||||||||||||||
Notional Amount at December 31, 2010 | 595.6 | 42.3 | 378.0 | 145.9 | 2.7 | 2.7 | 24.0 | |||||||||||||||||||||||||||||||||||||||||||||||||
Interest rate swaps—variable to fixed(3) | ||||||||||||||||||||||||||||||||||||||||||||||||||||||||
Notional Amount at December 31, 2011 | 594.9 | 378 | 147.5 | 5.9 | 5.9 | 27.2 | 30.4 | |||||||||||||||||||||||||||||||||||||||||||||||||
Average Pay Rate | 4.54 | % | 4.75 | % | 3.87 | % | 3.49 | % | 3.49 | % | 3.49 | % | 3.49 | % | 4.42 | % | 3.13 | % | 3.26 | % | 3.26 | % | 3.25 | % | 3.09 | % | 3.09 | % | ||||||||||||||||||||||||||||
Average Receive Rate | 0.54 | % | 0.77 | % | 0.29 | % | 1.74 | % | 2.65 | % | 3.74 | % | 3.74 | % | 0.44 | % | 0.77 | % | 0.42 | % | 0.78 | % | 1.43 | % | 2.03 | % | 2.63 | % | ||||||||||||||||||||||||||||
Cap and Floor Options | ||||||||||||||||||||||||||||||||||||||||||||||||||||||||
Cap and Floor Options(4) | ||||||||||||||||||||||||||||||||||||||||||||||||||||||||
Notional Amount | 263.6 | 95.4 | 22.7 | 22.7 | 70.0 | 52.8 | 168.1 | 22.7 | 22.7 | 70 | 5 | 47.7 | ||||||||||||||||||||||||||||||||||||||||||||
Average Pay Rate(2) | 4.66 | % | 3.90 | % | 4.07 | % | 3.69 | % | 4.98 | % | 5.33 | % | ||||||||||||||||||||||||||||||||||||||||||||
Average Pay Rate(2) | 4.03 | % | 4.31 | % | 4.30 | % | 4.48 | % | 5.05 | % | 2.64 | % | ||||||||||||||||||||||||||||||||||||||||||||
Average Receive Rate | 0.54 | % | 0.52 | % | 0.75 | % | 1.05 | % | 3.01 | % | 3.81 | % | 0.47 | % | 0.84 | % | 0.69 | % | 0.95 | % | 1.43 | % | 0.93 | % | ||||||||||||||||||||||||||||||||
| 859.2 | 137.7 | 400.7 | 168.6 | 72.7 | 55.5 | 24.0 | 763 | 400.7 | 170.2 | 75.9 | 10.9 | 74.9 | 30.4 | |||||||||||||||||||||||||||||||||||||||||||
| (1) | These are the expected maturities based on the balances as of December 31, |
| (2) | Interest Payments on US Dollar–denominated debt and interest rate swaps are based on LIBOR. |
| (3) | As of December 31, 2011 we had $542.1 million in effecting hedging swap and a further $52.7 million in interest rate swaps that do not meet hedging criteria. |
| (4) | As of December 31, 2011 we had $168.1 million in interest rate swaps that do not meet hedging criteria. |
Bunker price risk
During 2010,2011, we entered into, or had open from 2009,2010, the following fixed price bunker (vessel fuel) swap agreements for 3.5% Fuel FOB Rotterdam (barges):
Trade Date | Swap Effective Date | Swap Termination Date | Notional Quantity Per Month | Total Notional Quantity | Fixed Price per MT | |||||||||||||||
March 11, 2009 | January 1, 2009 | January 31, 2010 | 1,000 MT | 12,000 MT | $ | 265.00 | ||||||||||||||
March 11, 2009 | January 1, 2010 | December 31, 2010 | 1,000 MT | 12,000 MT | $ | 298.00 | ||||||||||||||
July 7, 2009 | January 1, 2010 | January 31, 2010 | 1,000 MT | 12,000 MT | $ | 376.00 | ||||||||||||||
July 7, 2009 | January 1, 2011 | January 31, 2011 | 1,000 MT | 12,000 MT | $ | 398.00 | ||||||||||||||
February 5, 2010 | January 1, 2012 | December 31, 2012 | 500 MT | 6,000 MT | $ | 450.00 | ||||||||||||||
Trade Date | Swap Effective Date | Swap Termination Date | Notional Quantity Per Month | Total Notional Quantity | Fixed Price per MT | |||||||||||||||
February 5, 2010 | January 1, 2012 | December 31, 2012 | 500 MT | 6,000 MT | $ | 450.00 | ||||||||||||||
May 14, 2010 | January 1, 2012 | December 31, 2012 | 500 MT | 6,000 MT | $ | 497.75 | ||||||||||||||
May 20, 2010 | January 1, 2012 | December 31, 2012 | 250 MT | 3,000 MT | $ | 446.50 | ||||||||||||||
One further bunker swap arrangement was entered into on August 9, 2011 for a notional monthly quantity of 250MT for a period of one year effective January 1, 2012. However, the swap was sold on September 7, 2011 for $0.1 million.
May 14, 2010 May 20, 2010 January 1, 2012 December 31, 2012 500 MT 6,000 MT $ 497.75 January 1, 2012 December 31, 2012 250 MT 3,000 MT $ 446.50
In 2010,2011, the Company received an aggregate cash payment of $2.9$6.4 million for the monthly settlement of the open bunker swap agreements during 2010.2011, including the amount received on the sold swap agreement.
Foreign exchange rate fluctuation
The currency the international tanker industry is primarily using is the U.S. dollar. Virtually all of our revenues are in U.S. dollars and the majority of our operating costs are incurred in U.S. dollars. We incur certain operating expenses in foreign currencies, the most significant of which are in Euros. During fiscal 2010,2011, approximately 26% of the total of our vessel and voyage costs overhead and dry-dockoverhead expenditures were denominated in Euro. Based on 20102011 Euro expenditure, therefore, we estimate that for every 1% change in the Euro/U.S. dollar rate there would be a 0.5% impact on vessel operating expenses and on general and administrative expenses and minimal impact on other cost categories apart from dry-docking which would depend on the location of the selected yard. However, we have the ability to shift our purchase of goods and services from one country to another and, thus, from one currency to another in order to mitigate the effects of exchange rate fluctuations. We have a policy of continuously monitoring and managing our foreign exchange exposure. On occasion, we do directly purchase amounts of Euro with U.S. dollars, but to date, we have not engaged in any foreign currency hedging transactions, as we do not believe we have had material risk exposure to foreign currency fluctuations.
Inflation
Although inflation has had a moderate impact on operating expenses, dry docking expenses and corporate overhead, our management does not consider inflation to be a significant risk to direct costs in the current and foreseeable economic environment. However, if inflation becomes a significant factor in the world economy, inflationary pressures could result in increased operating and financing costs.
| Item 12. | Description of Securities Other than Equity Securities |
Not Applicable.
| Item 13. | Defaults, Dividend Arrearages and Delinquencies |
Not Applicable.
| Item 14. | Material Modifications to the Rights of Security Holders and Use of Proceeds |
None.
| Item 15. | Controls and Procedures |
A. Evaluation of Disclosure Controls and Procedures
The Company’s management, with the participation of the Company’s chief executive officer and chief financial officer, evaluated the effectiveness of the Company’s disclosure controls and procedures, as defined in Rules 13a-15(e) and 15d-15(e) under the Securities Exchange Act of 1934, as amended (the “Exchange Act”), as of the end of the period covered by this Annual Report. Based on that evaluation, the chief executive officer and the chief financial officer concluded that the Company’s disclosure controls and procedures as of the end of the period covered by this Annual Report were designed and were functioning effectively to provide reasonable assurance that the information required to be disclosed by the Company in reports filed under the Exchange Act is recorded, processed, summarized and reported within the time periods specified in the SEC’s rules and forms, and is accumulated and communicated to the Company’s management, including our chief executive officer and chief financial officer and principal financial officers, or persons performing similar functions, as appropriate, to allow timely decisions regarding required disclosure.
The Company believes that a system of controls, no matter how well designed and operated, cannot provide absolute assurance that the objectives of the controls are met, and no evaluation of controls can provide absolute assurance that all control issues and instances of fraud, if any, within a company have been detected.
B. Management’s Annual Report on Internal Control Over Financial Reporting
The management of Tsakos Energy Navigation Limited and its subsidiaries, according to Rule 13a-15(f) of the Securities Exchange Act, is responsible for the establishment and maintenance of adequate internal controls over financial reporting for the Company. Internal control over financial reporting is a process designed to provide reasonable assurance regarding the reliability of financial reporting and the preparation of the Company’s financial statements for external reporting purposes in accordance with U.S. generally accepted accounting principles. However, in any system of internal control there are inherent limitations and consequently internal control over financial reporting may not absolutely prevent or detect misstatements.
The Company’s system of internal control over financial reporting includes policies and procedures that:
| (i) | pertain to the maintenance of records that, in reasonable detail, accurately and fairly reflect the transactions and dispositions of the assets of the Company; |
| (ii) | provide reasonable assurance that transactions are recorded as necessary to permit preparation of financial statements in accordance with U.S. generally accepted accounting principles, and that receipts and expenditures of the Company are being made only in accordance with authorizations of management and directors of the Company; and |
| (iii) | provide reasonable assurance regarding prevention or timely detection of unauthorized acquisition, use, or disposition of the Company’s assets that could have a material effect on the financial statements. |
Management has performed an assessment of the effectiveness of the Company’s internal control over financial reporting as of December 31, 2010,2011, based on the criteria established withinInternal Control—Integrated Framework issued by the Committee of Sponsoring Organizations of the Treadway Commission.
Based on our assessment, management has determined that the Company’s internal control over financial reporting as of December 31, 2010,2011, is effective.
C. Attestation Report of Independent Registered Public Accounting Firm
Ernst & Young (Hellas) Certified Auditors Accountants S.A., or Ernst & Young (Hellas), which has audited the consolidated financial statements of the Company for the year ended December 31, 2010,2011, has also audited the effectiveness of the Company’s internal control over financial reporting as stated in their audit report which is incorporated into Item 18 of this Form 20-F from page F-2 hereof.
D. Change in Internal Control over Financial Reporting
No change in the Company’s internal control over financial reporting occurred during the Company’s most recent fiscal year that has materially affected, or is reasonably likely to materially affect, the Company’s internal control over financial reporting.
| Item 16A. | Audit Committee Financial Expert |
The Board of Directors of the Company has determined that Francis T. Nusspickel and D. John Stavropoulos, whose biographical details are included in Item 6 of this Annual Report, each qualifies as an “audit committee financial expert” as defined under current SEC regulations and each is independent in accordance with the rules of the SEC and the listing standards of the New York Stock Exchange.
| Item 16B. | Code of Ethics |
The Company has adopted a code of ethics that applies to its directors, officers and employees. A copy of our code of ethics is posted in the “Investor Relations” section of the Tsakos Energy Navigation Limited website, and may be viewed athttp://www.tenn.gr. We will also provide a hard copy of our code of ethics free of charge upon written request of a shareholder. Shareholders may direct their requests to the attention of Investor Relations, c/o
George Saroglou or Paul Durham, Tsakos Energy Navigation Limited, 367 Syngrou Avenue, 175 64 P. Faliro, Athens, Greece.
| Item 16C. | Principal Accountant Fees and Services |
Ernst & Young (Hellas) has audited our annual financial statements acting as our independent auditor for the fiscal years ended December 31, 20102011 and 2009.2010.
The chart below sets forth the total amount billed and accrued for the Ernst & Young services performed in 20102011 and 20092010 and breaks down these amounts by the category of service (in Euros).
| 2010 | 2009 | 2011 | 2010 | |||||||||||||
Audit fees | € | 762,900 | € | 749,695 | €651,000 | €762,900 | ||||||||||
Audit-Related fees | — | — | ||||||||||||||
Tax fees | 23,494 | 18,418 | 21,846 | 23,494 | ||||||||||||
All other fees | — | — | ||||||||||||||
Total fees | € | 786,394 | € | 768,113 | €672,846 | €786,394 | ||||||||||
Audit Fees
The audit fees include the aggregate fees billed for professional services rendered for the audit of our 20102011 and 20092010 annual financial statements and for related services that are reasonably related to the performance of the audit or services that are normally provided by the auditor in connection with regulatory filings or engagements for those financial years (including comfort letters, review of the 20-F, consents and other services related to SEC matters and including the review of work performed by other parties relating to the implementation of Sarbanes-Oxley requirements).
Audit-Related Fees
The audit-related fees include the aggregate fees billed for certain accounting consultations andErnst & Young did not provide any other work which are not reported under audit services.services that would be classified in this category during 2011 or 2010.
Tax Fees
The Ernst & Young office in Columbus, Ohio, United States provided tax services for 20102011 and 20092010 by assisting the Company in submitting tax declarations for those subsidiaries whose vessels performed voyages to the United States within 2010 and 2009.
All Other Fees
Ernst & Young did not provide any other services that would be classified in this category during 20102011 or 2009.2010.
Pre-approval Policies and Procedures
The Audit Committee Charter sets forth the Company’s policy regarding retention of the independent auditors, requiring the Audit Committee to review and approve in advance the retention of the independent auditors for the performance of all audit and lawfully permitted non-audit services and the fees related thereto. The Chairman of the Audit Committee or in the absence of the Chairman, any member of the Audit Committee designated by the Chairman, has authority to approve in advance any lawfully permitted non-audit services and fees. The Audit Committee is authorized to establish other policies and procedures for the pre-approval of such services and fees. Where non-audit services and fees are approved under delegated authority, the action must be reported to the full Audit Committee at its next regularly scheduled meeting.
| Item 16D. | Exemptions from the Listing Standards for Audit Committees |
Not Applicable.
| Item 16E. | Purchases of Equity Securities by the Issuer and Affiliated Purchasers |
In September 2005, we announced that our board of directors had authorized a common share repurchase program to repurchase up to $40.0 million of our common shares. In September 2008, we announced that our board of directors had authorized a new common share repurchase program to repurchase up to an additional $40.0 million of our common shares. The current repurchase program supplemented our prior share repurchase program which was completed on October 1, 2008. The new share repurchase program took effect immediately and will continue until either the amount is fully utilized or the board of directors elects to terminate the program. In 2009 we repurchased an aggregate of 245,400 common shares as treasury stock in the open market pursuant to the share repurchase programs described above at a cost of approximately $4.0 million. The purchases were made in open market transactions through the New York Stock Exchange with a maximum price set by our board of directors. There have been no share repurchases since October 2009. An amountOn August 11, 2011, the Company announced the authorization of approximately $25.7a new share buy-back program allocating up to $20.0 million remainsfor purchases in the open market and in other transactions. There were no repurchases of common shares under this program during 2011.
| Item 16F. | Change in Registrant’s Certifying Accountant |
Not Applicable.
| Item 16G. | Corporate Governance |
Pursuant to certain exceptions for foreign private issuers, we are not required to comply with certain of the corporate governance practices followed by U.S. companies under the program forNew York Stock Exchange listing standards. However, during 2011 there were no significant differences between our corporate governance practices and the purpose of share repurchase.New York Stock Exchange standards applicable to listed U.S. companies.
| Item 16H. | Mine Safety Disclosure |
Not Applicable.
| Item 17. | Financial Statements |
Not Applicable.
| Item 18. | Financial Statements |
The following financial statements together with the report of our independent registered public accounting firm, are set forth on pages F-1 through F-31F-27 included herein.
| Item 19. | Exhibits |
The following Exhibits are filed as part of this Annual Report. Certain exhibits have been previously filed with the SEC pursuant to the Securities Exchange Act of 1934, as amended (Commission File Number 001-31236).
Number | Description | |
| 1.1 | Memorandum of Association of Tsakos Energy Navigation Limited* | |
| 1.2 | Bye-laws of Tsakos Energy Navigation Limited (filed as an exhibit to the Company’s Form 6-K filed with the SEC on June 12, 2008, and hereby incorporated by reference) | |
| 4.1 | Rights Agreement, dated as of September 29, 2005, between Tsakos Energy Navigation Limited and The Bank of New York, as Rights Agent (filed as an exhibit to the Company’s Form 6-K filed with the SEC on September 30, 2005, and hereby incorporated by reference) | |
| 4.2 | 1998 Stock Option Plan of Tsakos Energy Navigation Limited* | |
| 4.3 | Tsakos Energy Navigation Limited 2004 Incentive Plan† | |
| 4.4 | Amended and Restated Management Agreement between Tsakos Energy Navigation Limited and Tsakos Energy Management Limited effective January 1, 2007** | |
| 8 | List of subsidiaries of Tsakos Energy Navigation Limited (filed herewith) | |
| 11 | Code of Ethics† | |
| 12.1 | Certification of Chief Executive Officer pursuant to Rule 13a-14(a) of the Securities Exchange Act of 1934, as amended (filed herewith) | |
| 12.2 | Certification of Chief Financial Officer pursuant to Rule 13a-14(a) of the Securities Exchange Act of 1934, as amended (filed herewith) | |
| 13.1 | Certification of Chief Executive Officer pursuant to 18 U.S.C. Section 1350 as adopted pursuant to Section 906 of the Sarbanes-Oxley Act of 2002 (filed herewith) | |
| 13.2 | Certification of Chief Financial Officer pursuant to 18 U.S.C. Section 1350 as adopted pursuant to Section | |
|
| |
| 906 of the Sarbanes-Oxley Act of 2002 (filed herewith) | ||
| 15.1 | Consent of Independent Registered Public Accounting Firm (filed herewith) | |
| 15.2 | Consent of ICAP Shipping (filed herewith) | |
| * | Previously filed as an exhibit to the Company’s Registration Statement on Form F-1 (File No. 333-82326) filed with the SEC and hereby incorporated by reference to such Registration Statement. |
| ** | Previously filed as an exhibit to the Company’s 20-F filed with the SEC on May 15, 2007, hereby incorporated by reference to such Annual Report. |
| † | Previously filed as an exhibit to the Company’s Annual Report on Form 20-F filed with the SEC on June 29, 2004 and hereby incorporated by reference to such Annual Report. |
SIGNATURES
The registrant hereby certifies that it meets all of the requirements for filing on Form 20-F and that it has duly caused and authorized the undersigned to sign this annual report on its behalf.
| TSAKOS ENERGY NAVIGATION LIMITED | ||||
/s/ Nikolas P. Tsakos | ||||
Name: | Nikolas P. Tsakos | |||
Title: | President and Chief Executive Officer | |||
Date: | April | |||
TSAKOS ENERGY NAVIGATION LIMITED AND SUBSIDIARIES
INDEX TO CONSOLIDATED FINANCIAL STATEMENTS
REPORT OF INDEPENDENT REGISTERED PUBLIC ACCOUNTING FIRM
To the Board of Directors and Shareholders of
TSAKOS ENERGY NAVIGATION LIMITED
We have audited the accompanying consolidated balance sheets of TSAKOS ENERGY NAVIGATION LIMITED and subsidiaries as of December 31, 20102011 and 2009,2010, and the related consolidated statements of income, comprehensive income, stockholders’ equity, and cash flows for each of the three years in the period ended December 31, 2010.2011. These financial statements are the responsibility of the Company’s management. Our responsibility is to express an opinion on these financial statements based on our audits.
We conducted our audits in accordance with the standards of the Public Company Accounting Oversight Board (United States). Those standards require that we plan and perform the audit to obtain reasonable assurance about whether the financial statements are free of material misstatement. An audit includes examining, on a test basis, evidence supporting the amounts and disclosures in the financial statements. An audit also includes assessing the accounting principles used and significant estimates made by management, as well as evaluating the overall financial statement presentation. We believe that our audits provide a reasonable basis for our opinion.
In our opinion, the financial statements referred to above present fairly, in all material respects, the consolidated financial position of TSAKOS ENERGY NAVIGATION LIMITED and subsidiaries at December 31, 20102011 and 2009,2010, and the consolidated results of its operations and its cash flows for each of the three years in the period ended December 31, 2010,2011, in conformity with U.S. generally accepted accounting principles.
We also have audited, in accordance with the standards of the Public Company Accounting Oversight Board (United States), TSAKOS ENERGY NAVIGATION LIMITED and subsidiaries’ internal control over financial reporting as of December 31, 2010,2011, based on criteria established in Internal Control-Integrated Framework issued by the Committee of Sponsoring Organizations of the Treadway Commission and our report dated April 8, 201116, 2012 expressed an unqualified opinion thereon.
/s/ ERNST & YOUNG (HELLAS) CERTIFIED AUDITORS – ACCOUNTANTS S.A.
Athens, Greece
April 8, 201116, 2012
REPORT OF INDEPENDENT REGISTERED PUBLIC ACCOUNTING FIRM
To the Board of Directors and Shareholders of
TSAKOS ENERGY NAVIGATION LIMITED
We have audited TSAKOS ENERGY NAVIGATION LIMITED and subsidiaries’ internal control over financial reporting as of December 31, 2010,2011, based on criteria established in Internal Control—Integrated Framework issued by the Committee of Sponsoring Organizations of the Treadway Commission (the COSO criteria). TSAKOS ENERGY NAVIGATION LIMITED and subsidiaries’ management is responsible for maintaining effective internal control over financial reporting, and for its assessment of the effectiveness of internal control over financial reporting included in the accompanying Management’s Report on Internal Control over Financial Reporting. Our responsibility is to express an opinion on the company’s internal control over financial reporting based on our audit.
We conducted our audit in accordance with the standards of the Public Company Accounting Oversight Board (United States). Those standards require that we plan and perform the audit to obtain reasonable assurance about whether effective internal control over financial reporting was maintained in all material respects. Our audit included obtaining an understanding of internal control over financial reporting, assessing the risk that a material weakness exists, testing and evaluating the design and operating effectiveness of internal control based on the assessed risk, and performing such other procedures as we considered necessary in the circumstances. We believe that our audit provides a reasonable basis for our opinion.
A company’s internal control over financial reporting is a process designed to provide reasonable assurance regarding the reliability of financial reporting and the preparation of financial statements for external purposes in accordance with generally accepted accounting principles. A company’s internal control over financial reporting includes those policies and procedures that (1) pertain to the maintenance of records that, in reasonable detail, accurately and fairly reflect the transactions and dispositions of the assets of the company; (2) provide reasonable assurance that transactions are recorded as necessary to permit preparation of financial statements in accordance with generally accepted accounting principles, and that receipts and expenditures of the company are being made only in accordance with authorizations of management and directors of the company; and (3) provide reasonable assurance regarding prevention or timely detection of unauthorized acquisition, use, or disposition of the company’s assets that could have a material effect on the financial statements.
Because of its inherent limitations, internal control over financial reporting may not prevent or detect misstatements. Also, projections of any evaluation of effectiveness to future periods are subject to the risk that controls may become inadequate because of changes in conditions, or that the degree of compliance with the policies or procedures may deteriorate.
In our opinion, TSAKOS ENERGY NAVIGATION LIMITED and subsidiaries maintained, in all material respects, effective internal control over financial reporting as of December 31, 2010,2011, based on the COSO criteria.
We also have audited, in accordance with the standards of the Public Company Accounting Oversight Board (United States), the consolidated balance sheets of TSAKOS ENERGY NAVIGATION LIMITED and subsidiaries as of December 31, 20102011 and 2009,2010, and the related consolidated statements of income, comprehensive income, stockholders’ equity, and cash flows for each of the three years in the period ended December 31, 20102011 and our report dated April 8, 201116, 2012 expressed an unqualified opinion thereon.
/s/ ERNST & YOUNG (HELLAS) CERTIFIED AUDITORS – ACCOUNTANTS S.A.
Athens, Greece
April 8, 201116, 2012
TSAKOS ENERGY NAVIGATION LIMITED AND SUBSIDIARIES
CONSOLIDATED BALANCE SHEETS
DECEMBER 31, 20102011 AND DECEMBER 31, 20092010
(Expressed in thousands of U.S. Dollars - Dollars—except share and per share data)
| 2010 | 2009 | |||||||
ASSETS | ||||||||
CURRENT ASSETS: | ||||||||
Cash and cash equivalents | $ | 276,637 | $ | 296,181 | ||||
Restricted cash | 6,291 | 6,818 | ||||||
Accounts receivable, net (Note 1(e)) | 24,417 | 12,661 | ||||||
Insurance claims | 5,018 | 3,814 | ||||||
Due from related companies (Note 2) | 2,977 | 5,359 | ||||||
Advances and other | 4,789 | 6,158 | ||||||
Vessels held for sale (Note 1(i)) | 26,986 | 120,877 | ||||||
Inventories | 14,011 | 13,014 | ||||||
Prepaid insurance and other | 2,949 | 3,431 | ||||||
Current portion of financial instruments-Fair value (Note 7) | 3,378 | 3,334 | ||||||
Total current assets | 367,453 | 471,647 | ||||||
INVESTMENTS (Note 3) | 1,000 | 1,000 | ||||||
FINANCIAL INSTRUMENTS - FAIR VALUE, net of current portion (Note 7) | 498 | 3,112 | ||||||
FIXED ASSETS (Notes 1(g), 1(h), 4) | ||||||||
Advances for vessels under construction | 81,882 | 49,213 | ||||||
Vessels | 2,638,550 | 2,335,031 | ||||||
Accumulated depreciation | (403,485 | ) | (325,066 | ) | ||||
Vessels’ Net Book Value | 2,235,065 | 2,009,965 | ||||||
Total fixed assets | 2,316,947 | 2,059,178 | ||||||
DEFERRED CHARGES, net (Note 5) | 16,362 | 14,783 | ||||||
Total assets | $ | 2,702,260 | $ | 2,549,720 | ||||
LIABILITIES AND STOCKHOLDERS’ EQUITY | ||||||||
CURRENT LIABILITIES: | ||||||||
Current portion of long-term debt (Note 6) | $ | 133,819 | $ | 172,668 | ||||
Payables | 23,914 | 29,223 | ||||||
Due to related companies (Note 2) | 779 | 40 | ||||||
Accrued liabilities | 10,576 | 15,273 | ||||||
Accrued bank interest | 6,481 | 6,079 | ||||||
Unearned revenue | 9,189 | 11,265 | ||||||
Current portion of financial instruments - Fair value (Note 7) | 32,486 | 29,683 | ||||||
Total current liabilities | 217,244 | 264,231 | ||||||
LONG-TERM DEBT, net of current portion (Note 6) | 1,428,648 | 1,329,906 | ||||||
FINANCIAL INSTRUMENTS - FAIR VALUE, net of current portion (Note 7) | 36,438 | 41,256 | ||||||
STOCKHOLDERS’ EQUITY: | ||||||||
Common stock, $ 1.00 par value; 100,000,000 shares authorized; 46,081,487 issued and outstanding at December 31, 2010 and 37,671,392 issued at December 31, 2009. Additional paid-in capital Retained earnings Cost of treasury stock (nil and 754,706 shares) Accumulated other comprehensive loss Noncontrolling Interest Total stockholders’ equity Total liabilities and stockholders’ equity 46,081 37,671 350,946 266,706 671,480 679,597 1,068,507 983,974 — 17,863 1,068,507 966,111 (52,329 ) (57,731 ) 3,752 5,947 1,019,930 914,327 $ 2,702,260 $ 2,549,720
The accompanying notes are an integral part of these consolidated financial statements.
| 2011 | 2010 | |||||||
| ASSETS | ||||||||
CURRENT ASSETS: | ||||||||
Cash and cash equivalents | $ | 175,708 | $ | 276,637 | ||||
Restricted cash | 5,984 | 6,291 | ||||||
Marketable Securities (Note 4) | 2,534 | — | ||||||
Accounts receivable, net | 23,421 | 24,417 | ||||||
Insurance claims | 2,448 | 5,018 | ||||||
Due from related companies (Note 2) | 1,641 | 2,977 | ||||||
Advances and other | 7,508 | 4,789 | ||||||
Vessels held for sale | 41,427 | 26,986 | ||||||
Inventories | 19,835 | 14,011 | ||||||
Prepaid insurance and other | 5,372 | 2,949 | ||||||
Current portion of financial instruments-Fair value (Note 8) | 1,755 | 3,378 | ||||||
|
|
|
| |||||
Total current assets | 287,633 | 367,453 | ||||||
|
|
|
| |||||
INVESTMENTS | 1,000 | 1,000 | ||||||
FINANCIAL INSTRUMENTS—FAIR VALUE, net of current portion (Note 8) | — | 498 | ||||||
FIXED ASSETS (Notes 5) | ||||||||
Advances for vessels under construction | 37,636 | 81,882 | ||||||
Vessels | 2,639,878 | 2,638,550 | ||||||
Accumulated depreciation | (445,518 | ) | (403,485 | ) | ||||
|
|
|
| |||||
Vessels’ Net Book Value | 2,194,360 | 2,235,065 | ||||||
|
|
|
| |||||
Total fixed assets | 2,231,996 | 2,316,947 | ||||||
|
|
|
| |||||
DEFERRED CHARGES, net (Note 6) | 14,708 | 16,362 | ||||||
|
|
|
| |||||
Total assets | $ | 2,535,337 | $ | 2,702,260 | ||||
|
|
|
| |||||
| LIABILITIES AND STOCKHOLDERS’ EQUITY | ||||||||
CURRENT LIABILITIES: | ||||||||
Current portion of long-term debt (Note 7) | $ | 196,996 | $ | 133,819 | ||||
Payables | 23,707 | 23,914 | ||||||
Due to related companies (Note 2) | 1,063 | 779 | ||||||
Accrued liabilities | 14,168 | 10,576 | ||||||
Accrued bank interest | 7,081 | 6,481 | ||||||
Unearned revenue | 7,469 | 9,189 | ||||||
Current portion of financial instruments—Fair value (Note 8) | 29,228 | 32,486 | ||||||
|
|
|
| |||||
Total current liabilities | 279,712 | 217,244 | ||||||
|
|
|
| |||||
LONG-TERM DEBT, net of current portion (Note 7) | 1,318,667 | 1,428,648 | ||||||
FINANCIAL INSTRUMENTS—FAIR VALUE, net of current portion (Note 8) | 17,800 | 36,438 | ||||||
STOCKHOLDERS’ EQUITY: | ||||||||
Common stock, $ 1.00 par value; 100,000,000 shares authorized; 46,208,737 issued and outstanding at December 31, 2011 and 46,081,487 issued at December 31, 2010. | 46,209 | 46,081 | ||||||
Additional paid-in capital | 351,566 | 350,946 | ||||||
Accumulated other comprehensive loss | (35,030 | ) | (52,329 | ) | ||||
Retained earnings | 554,314 | 671,480 | ||||||
|
|
|
| |||||
Total Tsakos Energy Navigation Limited stockholders’ equity | 917,059 | 1,016,178 | ||||||
Noncontrolling Interest | 2,099 | 3,752 | ||||||
|
|
|
| |||||
Total stockholders’ equity | 919,158 | 1,019,930 | ||||||
|
|
|
| |||||
Total liabilities and stockholders’ equity | $ | 2,535,337 | $ | 2,702,260 | ||||
|
|
|
| |||||
TSAKOS ENERGY NAVIGATION LIMITED AND SUBSIDIARIES
CONSOLIDATED STATEMENTS OF INCOME
FOR THE YEARS ENDED DECEMBER 31, 2011, 2010 2009 AND 20082009
(Expressed in thousands of U.S. Dollars - except share and per share data)
| 2010 | 2009 | 2008 | 2011 | 2010 | 2009 | |||||||||||||||||||
VOYAGE REVENUES: | $ | 408,006 | $ | 444,926 | $ | 623,040 | $ | 395,162 | $ | 408,006 | $ | 444,926 | ||||||||||||
EXPENSES: | ||||||||||||||||||||||||
Commissions | 13,837 | 16,086 | 22,997 | 14,290 | 13,837 | 16,086 | ||||||||||||||||||
Voyage expenses | 85,813 | 77,224 | 83,065 | 127,156 | 85,813 | 77,224 | ||||||||||||||||||
Charter hire expense (Note 4) | 1,905 | — | 13,487 | |||||||||||||||||||||
Charter hire expense (Note 5) | — | 1,905 | — | |||||||||||||||||||||
Vessel operating expenses | 126,022 | 144,586 | 143,757 | 129,884 | 126,022 | 144,586 | ||||||||||||||||||
Depreciation | 92,889 | 94,279 | 85,462 | 101,050 | 92,889 | 94,279 | ||||||||||||||||||
Amortization of deferred dry-docking costs | 4,553 | 7,243 | 5,281 | 4,878 | 4,553 | 7,243 | ||||||||||||||||||
Management fees (Note 2(a)) | 14,143 | 13,273 | 12,015 | 15,598 | 14,143 | 13,273 | ||||||||||||||||||
General and administrative expenses | 3,627 | 4,069 | 4,626 | 4,292 | 3,627 | 4,069 | ||||||||||||||||||
Management incentive award (Note 2(a)) | 425 | — | 4,750 | |||||||||||||||||||||
Stock compensation expense (Note 8) | 1,068 | 1,087 | 3,046 | |||||||||||||||||||||
Foreign currency (gains) / losses | (378 | ) | 730 | 915 | ||||||||||||||||||||
Amortization of deferred gain on sale of vessels | — | — | (634 | ) | ||||||||||||||||||||
Management incentive award | — | 425 | — | |||||||||||||||||||||
Stock compensation expense (Note 9) | 820 | 1,068 | 1,087 | |||||||||||||||||||||
Foreign currency losses / (gains) | 458 | (378 | ) | 730 | ||||||||||||||||||||
Net gain on sale of vessels | (19,670 | ) | (5,122 | ) | (34,565 | ) | (5,001 | ) | (19,670 | ) | (5,122 | ) | ||||||||||||
Vessel impairment charge (Notes 1(h), 4, 13) | 3,077 | 19,066 | — | |||||||||||||||||||||
Vessel impairment charge | 39,434 | 3,077 | 19,066 | |||||||||||||||||||||
|
|
| ||||||||||||||||||||||
Total expenses | 327,311 | 372,521 | 344,202 | 432,859 | 327,311 | 372,521 | ||||||||||||||||||
|
|
| ||||||||||||||||||||||
Operating income | 80,695 | 72,405 | 278,838 | |||||||||||||||||||||
Operating (loss)/ income | (37,697 | ) | 80,695 | 72,405 | ||||||||||||||||||||
|
|
| ||||||||||||||||||||||
OTHER INCOME (EXPENSES): | ||||||||||||||||||||||||
Interest and finance costs, net (Note 7) | (62,283 | ) | (45,877 | ) | (82,897 | ) | ||||||||||||||||||
Interest and finance costs, net (Note 8) | (53,571 | ) | (62,283 | ) | (45,877 | ) | ||||||||||||||||||
Interest income | 2,626 | 3,572 | 8,406 | 2,715 | 2,626 | 3,572 | ||||||||||||||||||
Other, net | (3 | ) | 75 | (350 | ) | (397 | ) | (3 | ) | 75 | ||||||||||||||
|
|
| ||||||||||||||||||||||
Total other expenses, net | (59,660 | ) | (42,230 | ) | (74,841 | ) | (51,253 | ) | (59,660 | ) | (42,230 | ) | ||||||||||||
|
|
| ||||||||||||||||||||||
Net income | 21,035 | 30,175 | 203,997 | |||||||||||||||||||||
Net (loss)/income | (88,950 | ) | 21,035 | 30,175 | ||||||||||||||||||||
Less: Net income attributable to the noncontrolling interest | (1,267 | ) | (1,490 | ) | (1,066 | ) | (546 | ) | (1,267 | ) | (1,490 | ) | ||||||||||||
|
|
| ||||||||||||||||||||||
Net (loss)/income attributable to Tsakos Energy Navigation Limited | $ | (89,496 | ) | $ | 19,768 | $ | 28,685 | |||||||||||||||||
|
|
| ||||||||||||||||||||||
Net income attributable to Tsakos Energy Navigation Limited | $ | 19,768 | $ | 28,685 | $ | 202,931 | ||||||||||||||||||
(Loss)/Earnings per share, basic attributable to Tsakos Energy Navigation Limited common shareholders | $ | (1.94 | ) | $ | 0.50 | $ | 0.78 | |||||||||||||||||
|
|
| ||||||||||||||||||||||
Earnings per share, basic attributable to Tsakos Energy Navigation Limited common shareholders | $ | 0.50 | $ | 0.78 | $ | 5.40 | ||||||||||||||||||
Earnings per share, diluted attributable to Tsakos Energy Navigation Limited common shareholders | $ | 0.50 | $ | 0.77 | $ | 5.33 | ||||||||||||||||||
(Loss)/Earnings per share, diluted attributable to Tsakos Energy Navigation Limited common shareholders | $ | (1.94 | ) | $ | 0.50 | $ | 0.77 | |||||||||||||||||
|
|
| ||||||||||||||||||||||
Weighted average number of shares, basic | 39,235,601 | 36,940,198 | 37,552,848 | 46,118,534 | 39,235,601 | 36,940,198 | ||||||||||||||||||
|
|
| ||||||||||||||||||||||
Weighted average number of shares, diluted | 39,601,678 | 37,200,187 | 38,047,134 | 46,118,534 | 39,601,678 | 37,200,187 | ||||||||||||||||||
|
|
| ||||||||||||||||||||||
TSAKOS ENERGY NAVIGATION LIMITED AND SUBSIDIARIES
STATEMENT OF CONSOLIDATED COMPREHENSIVE INCOME
FOR THE YEARS ENDED DECEMBER 31, 2011, 2010 AND 2009
(Expressed in thousands of U.S. Dollars)
| 2011 | 2010 | 2009 | ||||||||||
Net (loss)/income | $ | (88,950 | ) | $ | 21,035 | $ | 30,175 | |||||
Other comprehensive income/(loss) | ||||||||||||
Unrealized gains/(losses) from hedging financial instruments | ||||||||||||
Unrealized gain on interest rate swaps | 15,245 | 3,289 | 14,508 | |||||||||
Amortization of deferred loss on dedesignated financial instruments | 2,020 | 2,113 | — | |||||||||
|
|
|
|
|
| |||||||
Total unrealized gains from hedging financial instruments | 17,265 | 5,402 | 14,508 | |||||||||
Unrealized gain on marketable securities | 34 | — | — | |||||||||
|
|
|
|
|
| |||||||
Other Comprehensive income | 17,299 | 5,402 | 14,508 | |||||||||
|
|
|
|
|
| |||||||
|
|
|
|
|
| |||||||
Comprehensive (loss)/income | (71,651 | ) | 26,437 | 44,683 | ||||||||
|
|
|
|
|
| |||||||
Less: comprehensive income attributable to the noncontrolling interest | — | — | — | |||||||||
|
|
|
|
|
| |||||||
Comprehensive (loss)/income attributable to Tsakos Energy Navigation Limited | $ | (71,651 | ) | $ | 26,437 | $ | 44,683 | |||||
|
|
|
|
|
| |||||||
The accompanying notes are an integral part of these consolidated financial statements.statements
TSAKOS ENERGY NAVIGATION LIMITED AND SUBSIDIARIES
CONSOLIDATED STATEMENTS OF STOCKHOLDERS’ EQUITY
FOR THE YEARS ENDED DECEMBER 31, 2011, 2010 2009 AND 20082009
(Expressed in thousands of U.S. Dollars - Dollars—except share and per share data)
| Comprehensive Income (Loss) | Common Stock | Additional Paid-in Capital |
Treasury Stock | Accumulated Other Comprehensive Income (Loss) | Tsakos Energy | Total | ||||||||||||||||||||||||||||||||||
| Retained Earnings | Shares | Amount | Navigation Limited | Non-controlling Interest | ||||||||||||||||||||||||||||||||||||
BALANCE, December 31, 2007 | $ | 38,059 | $ | 273,036 | $ | 567,220 | — | — | $ | (23,775 | ) | $ | 854,540 | $ | 3,391 | $ | 857,931 | |||||||||||||||||||||||
Net income | 203,997 | 202,931 | 202,931 | 1,066 | 203,997 | |||||||||||||||||||||||||||||||||||
- Repurchase and cancellation of common stock (392,400 shares) | (393 | ) | (2,425 | ) | (9,414 | ) | (12,232 | ) | (12,232 | ) | ||||||||||||||||||||||||||||||
- Purchase of Treasury stock | 812,700 | (21,937 | ) | (21,937 | ) | (21,937 | ) | |||||||||||||||||||||||||||||||||
- Issuance of 4,650 shares of restricted share units | 5 | (5 | ) | — | — | |||||||||||||||||||||||||||||||||||
- Treasury stock granted to employees as part of stock compensation plan | (7,720 | ) | (286,000 | ) | 7,720 | — | — | |||||||||||||||||||||||||||||||||
- Cash dividends declared and paid ($1.80 per share) | (67,226 | ) | (67,226 | ) | (67,226 | ) | ||||||||||||||||||||||||||||||||||
- Fair value of financial instruments | (48,464 | ) | (48,464 | ) | (48,464 | ) | (48,464 | ) | ||||||||||||||||||||||||||||||||
- Amortization of restricted share units | 3,046 | 3,046 | 3,046 | |||||||||||||||||||||||||||||||||||||
Comprehensive income | $ | 155,533 | ||||||||||||||||||||||||||||||||||||||
BALANCE, December 31, 2008 | $ | 37,671 | $ | 265,932 | $ | 693,511 | 526,700 | $ | (14,217 | ) | $ | (72,239 | ) | $ | 910,658 | $ | 4,457 | $ | 915,115 | |||||||||||||||||||||
Net income | $ | 30,175 | $ | 28,685 | $ | 28,685 | $ | 1,490 | $ | 30,175 | ||||||||||||||||||||||||||||||
- Purchase of Treasury stock (245,400 shares) | 245,400 | (4,058 | ) | (4,058 | ) | (4,058 | ) | |||||||||||||||||||||||||||||||||
- Proceeds from Stock Issuance Program | (313 | ) | (154 | ) | (17,394 | ) | 412 | (55 | ) | (55 | ) | |||||||||||||||||||||||||||||
- Cash dividends declared and paid ($1.15 per share) | (42,445 | ) | (42,445 | ) | (42,445 | ) | ||||||||||||||||||||||||||||||||||
- Fair value of financial instruments | 14,508 | 14,508 | 14,508 | 14,508 | ||||||||||||||||||||||||||||||||||||
- Amortization of restricted share units | 1,087 | 1,087 | 1,087 | |||||||||||||||||||||||||||||||||||||
Comprehensive income BALANCE, December 31, 2009 Net income - Proceeds from Stock Issuance Program - Issuance of common stock under Stock Issuance Program - Issuance of common stock-offering - Issuance of 341,650 shares of restricted share units - Cash dividends paid ($0.60 per share) -Distribution from Subsidiary to non controlling interest - Fair value of financial instruments - Amortization of restricted share units Comprehensive income BALANCE December 31, 2010 BALANCE, December 31, 2008 Net income —Purchase of Treasury stock (245,400 shares) —Proceeds from Stock Issuance Program —Cash dividends declared and paid ($1.15 per shares) —Other comprehensive income (loss) —Amortization of restricted share units BALANCE, December 31, 2009 Net income —Proceeds from Stock Issuance Program —Issuance of common stock under Stock Issuance Program —Issuance of common stock-offering —Issuance of 341,650 shares of restricted share units —Cash dividends paid ($0.60 per share) —Distribution from Subsidiary to non controlling interest —Other comprehensive income (loss) —Amortization of restricted share units BALANCE, December 31, 2010 Net income/(loss) —Expenses of 2010 common stock-offering —Issuance of 127,250 shares of restricted share units —Cash dividends paid ($0.60 per share) —Distribution from Subsidiary to non controlling interest —Other comprehensive income (loss) —Amortization of restricted share units BALANCE December 31, 2011 $ 44,683 $ 37,671 $ 266,706 $ 679,597 754,706 $ (17,863 ) $ (57,731 ) $ 908,380 $ 5,947 $ 914,327 $ 21,035 $ 19,768 $ 19,768 $ 1,267 $ 21,035 (156 ) (5,036 ) (754,706 ) 17,863 12,671 12,671 446 6,596 7,042 7,042 7,622 77,074 84,696 84,696 342 (342 ) — (22,849 ) (22,849 ) (22,849 ) — (3,462 ) (3,462 ) 5,402 5,402 5,402 5,402 1,068 1,068 1,068 $ 26,437 $ 46,081 $ 350,946 $ 671,480 — $ — $ (52,329 ) $ 1,016,178 $ 3,752 $ 1,019,930 Common
Stock Additional
Paid-in
Capital Retained
Earnings Treasury Stock Accumulated
Other
Comprehensive
Income (Loss) Tsakos
Energy
Navigation
Limited Noncontrolling
Interest Shares Amount Total $ 37,671 $ 265,932 $ 693,511 526,700 $ (14,217 ) $ (72,239 ) $ 910,658 $ 4,457 $ 915,115 28,685 28,685 1,490 30,175 245,400 (4,058 ) (4,058 ) (4,058 ) (313 ) (154 ) (17,394 ) 412 (55 ) (55 ) (42,445 ) (42,445 ) (42,445 ) 14,508 14,508 14,508 1,087 1,087 1,087 $ 37,671 $ 266,706 $ 679,597 754,706 $ (17,863 ) $ (57,731 ) $ 908,380 $ 5,947 $ 914,327 19,768 19,768 1,267 21,035 (156 ) (5,036 ) (754,706 ) 17,863 12,671 12,671 446 6,596 7,042 7,042 7,622 77,074 84,696 84,696 342 (342 ) — — (22,849 ) (22,849 ) (22,849 ) — (3,462 ) (3,462 ) 5,402 5,402 5,402 1,068 1,068 1,068 $ 46,081 $ 350,946 $ 671,480 — $ — $ (52,329 ) $ 1,016,178 $ 3,752 $ 1,019,930 $ (89,496 ) (89,496 ) 546 (88,950 ) (72 ) (72 ) (72 ) 128 (128 ) — — (27,670 ) (27,670 ) (27,670 ) — (2,199 ) (2,199 ) 17,299 17,299 17,299 820 820 820 $ 46,209 $ 351,566 $ 554,314 — $ — $ (35,030 ) $ 917,059 $ 2,099 $ 919,158
The accompanying notes are an integral part of these consolidated financial statements.statements
TSAKOS ENERGY NAVIGATION LIMITED AND SUBSIDIARIES
CONSOLIDATED STATEMENTS OF CASH FLOWS
FOR THE YEARS ENDED DECEMBER 31, 2011, 2010 2009 AND 20082009
(Expressed in thousands of U.S. Dollars)
| 2010 | 2009 | 2008 | ||||||||||
Cash Flows from Operating Activities: | ||||||||||||
Net income | $ | 21,035 | $ | 30,175 | $ | 203,997 | ||||||
Adjustments to reconcile net income to net cash provided by operating activities: | ||||||||||||
Depreciation | 92,889 | 94,279 | 85,462 | |||||||||
Amortization of deferred dry-docking costs | 4,553 | 7,243 | 5,281 | |||||||||
Amortization of loan fees | 1,138 | 877 | 944 | |||||||||
Amortization of deferred income | — | — | (634 | ) | ||||||||
Stock compensation expense | 1,068 | 1,087 | 3,046 | |||||||||
Change in fair value of derivative instruments | 5,957 | (12,552 | ) | 15,470 | ||||||||
Gain on sale of vessels | (19,670 | ) | (5,122 | ) | (34,565 | ) | ||||||
Vessel impairment charge | 3,077 | 19,066 | — | |||||||||
Payments for dry-docking | (6,055 | ) | (4,347 | ) | (11,374 | ) | ||||||
(Increase) Decrease in: | ||||||||||||
Receivables | (9,209 | ) | 9,142 | 5,728 | ||||||||
Inventories | (997 | ) | (2,095 | ) | 1,180 | |||||||
Prepaid insurance and other | 482 | (453 | ) | 1,052 | ||||||||
Increase (Decrease) in: | ||||||||||||
Payables | (4,570 | ) | 1,106 | (9,142 | ) | |||||||
Accrued liabilities | (4,295 | ) | (17,801 | ) | 4,926 | |||||||
Unearned revenue | (2,076 | ) | (3,444 | ) | 2,770 | |||||||
Net Cash provided by Operating Activities | 83,327 | 117,161 | 274,141 | |||||||||
Cash Flows from Investing Activities: | ||||||||||||
Advances for vessels under construction and acquisitions | (67,024 | ) | (22,762 | ) | (3,471 | ) | ||||||
Vessel acquisitions and/or improvements | (313,639 | ) | (103,269 | ) | (223,266 | ) | ||||||
Proceeds from the sale of vessels | 140,548 | 50,463 | 62,100 | |||||||||
Net Cash used in Investing Activities | (240,115 | ) | (75,568 | ) | (164,637 | ) | ||||||
Cash Flows from Financing Activities: | ||||||||||||
Proceeds from long-term debt | 235,024 | 80,750 | 168,050 | |||||||||
Financing costs | (1,870 | ) | (1,044 | ) | (382 | ) | ||||||
Payments of long-term debt | (175,131 | ) | (91,805 | ) | (44,363 | ) | ||||||
(Increase)/decrease in restricted cash | 527 | 763 | (692 | ) | ||||||||
Repurchase and cancellation of common stock | — | — | (12,232 | ) | ||||||||
Purchase of treasury stock | — | (4,058 | ) | (21,937 | ) | |||||||
Proceeds from stock issuance program, net | 105,005 | 258 | — | |||||||||
Cash dividend | (22,849 | ) | (42,445 | ) | (67,226 | ) | ||||||
Distribution from subsidiary to noncontrolling interest owners | (3,462 | ) | — | — | ||||||||
Net Cash provided by / (used in) Financing Activities | 137,244 | (57,581 | ) | 21,218 | ||||||||
Net (decrease)/increase in cash and cash equivalents | (19,544 | ) | (15,988 | ) | 130,722 | |||||||
Cash and cash equivalents at beginning of year | 296,181 | 312,169 | 181,447 | |||||||||
Cash and cash equivalents at end of year | $ | 276,637 | $ | 296,181 | $ | 312,169 | ||||||
Interest paid | ||||||||||||
Cash paid for interest, net of amounts capitalized | 57,353 | 67,490 | 68,213 | |||||||||
The accompanying notes are an integral part of these consolidated financial statements.
| 2011 | 2010 | 2009 | ||||||||||
Cash Flows from Operating Activities: | ||||||||||||
Net (loss) income | $ | (88,950 | ) | $ | 21,035 | $ | 30,175 | |||||
Adjustments to reconcile net (loss)/income to net cash provided by operating activities: | ||||||||||||
Depreciation | 101,050 | 92,889 | 94,279 | |||||||||
Amortization of deferred dry-docking costs | 4,878 | 4,553 | 7,243 | |||||||||
Amortization of loan fees | 995 | 1,138 | 877 | |||||||||
Stock compensation expense | 820 | 1,068 | 1,087 | |||||||||
Change in fair value of derivative instruments | 515 | 5,957 | (12,552 | ) | ||||||||
Gain on sale of vessels | (5,001 | ) | (19,670 | ) | (5,122 | ) | ||||||
Vessel impairment charge | 39,434 | 3,077 | 19,066 | |||||||||
Payments for dry-docking | (4,639 | ) | (6,055 | ) | (4,347 | ) | ||||||
(Increase) Decrease in: | ||||||||||||
Receivables | 2,183 | (9,209 | ) | 9,142 | ||||||||
Inventories | (5,824 | ) | (997 | ) | (2,095 | ) | ||||||
Prepaid insurance and other | (2,423 | ) | 482 | (453 | ) | |||||||
Increase (Decrease) in: | ||||||||||||
Payables | 77 | (4,570 | ) | 1,106 | ||||||||
Accrued liabilities | 4,192 | (4,295 | ) | (17,801 | ) | |||||||
Unearned revenue | (1,720 | ) | (2,076 | ) | (3,444 | ) | ||||||
|
|
|
|
|
| |||||||
Net Cash provided by Operating Activities | 45,587 | 83,327 | 117,161 | |||||||||
|
|
|
|
|
| |||||||
Cash Flows from Investing Activities: | ||||||||||||
Advances for vessels under construction and acquisitions | (37,937 | ) | (67,024 | ) | (22,762 | ) | ||||||
Vessel acquisitions and/or improvements | (71,205 | ) | (313,639 | ) | (103,269 | ) | ||||||
Purchase of marketable securities | (2,500 | ) | — | — | ||||||||
Proceeds from the sale of vessels | 42,455 | 140,548 | 50,463 | |||||||||
|
|
|
|
|
| |||||||
Net Cash used in Investing Activities | (69,187 | ) | (240,115 | ) | (75,568 | ) | ||||||
|
|
|
|
|
| |||||||
Cash Flows from Financing Activities: | ||||||||||||
Proceeds from long-term debt | 96,650 | 235,024 | 80,750 | |||||||||
Financing costs | (963 | ) | (1,870 | ) | (1,044 | ) | ||||||
Payments of long-term debt | (143,454 | ) | (175,131 | ) | (91,805 | ) | ||||||
Decrease in restricted cash | 307 | 527 | 763 | |||||||||
Purchase of treasury stock | — | (4,058 | ) | |||||||||
Proceeds from stock issuance program, net | — | 105,005 | 258 | |||||||||
Cash dividend | (27,670 | ) | (22,849 | ) | (42,445 | ) | ||||||
Distribution from subsidiary to noncontrolling interest owners | (2,199 | ) | (3,462 | ) | — | |||||||
|
|
|
|
|
| |||||||
Net Cash used in Financing Activities | (77,329 | ) | 137,244 | (57,581 | ) | |||||||
|
|
|
|
|
| |||||||
Net (decrease)/increase in cash and cash equivalents | (100,929 | ) | (19,544 | ) | (15,988 | ) | ||||||
Cash and cash equivalents at beginning of period | 276,637 | 296,181 | 312,169 | |||||||||
|
|
|
|
|
| |||||||
Cash and cash equivalents at end of period | $ | 175,708 | $ | 276,637 | $ | 296,181 | ||||||
|
|
|
|
|
| |||||||
Interest paid | ||||||||||||
Cash paid for interest, net of amounts capitalized | $ | 48,588 | $ | 50,129 | $ | 65,527 | ||||||
TSAKOS ENERGY NAVIGATION LIMITED AND SUBSIDIARIES
NOTES TO CONSOLIDATED FINANCIAL STATEMENTS
DECEMBER 31, 2011, 2010 2009 AND 20082009
(Expressed in thousands of U.S. Dollars, except for share and per share data, unless otherwise stated)
| 1. | Significant Accounting Policies |
| (a) | Basis of presentation and description of business: The accompanying consolidated financial statements have been prepared in accordance with U.S. generally accepted accounting principles (“U.S. GAAP”) and include the accounts of Tsakos Energy Navigation Limited (the “Holding Company”), and its wholly-owned and majority-owned subsidiaries (collectively, the “Company”). |
Effective January 1, 2009, the Company adopted new guidance issued by the FASB for the noncontrolling interest in a subsidiary and for the deconsolidation of a subsidiary. This guidance defines a noncontrolling interest, previously called a minority interest, as the portion of equity in a subsidiary not attributable, directly or indirectly, to the Company. This guidance requires, among other items, that a noncontrolling interest be included in the consolidated statement of financial position within equity separate from the Company’s equity; consolidated net income to be reported at amounts inclusive of both the Company’s and noncontrolling interest’s shares and, separately, the amounts of consolidated net income attributable to the Company and noncontrolling interest all on the consolidated statement of income; and if a subsidiary is deconsolidated, any retained noncontrolling equity investment in the former subsidiary be measured at fair value and a gain or loss be recognized in net income based on such fair value. The 2008 financial information has been adjusted so the basis of presentation is consistent with that of the 2009 and 2010 financial information. The adoption of this guidance did not have a material effect on our consolidated statement of financial position, results of operations or cash flows.
The Holding Company consolidates voting interest entities in which it owns all, or at least a majority of the voting interest. A voting interest entity is an entity in which the total equity investment at risk is sufficient to enable the entity to finance itself independently and provides the equity holders with the obligation to absorb losses, the right to receive residual returns and the right to make financial and operating decisions.
As at December 31, 2010, 2009 and 2008, the Holding Company consolidated two variable interest entities (“VIE”) for which it is deemed to be the primary beneficiary, i.e. it has a controlling financial interest in those entities. A VIE is an entity that in general does not have equity investors with voting rights or that has equity investors that do not provide sufficient financial resources for the entity to support its activities. A controlling financial interest in a VIE is present when a company absorbs a majority of an entity’s expected losses, receives a majority of an entity’s expected residual returns, or both.
All intercompany balances and transactions have been eliminated upon consolidation.
Effective December 31, 2011, the Company adopted new guidance issued by the FASB for the presentation of Comprehensive income revising the manner in which entities present comprehensive income in their financial statements. The updated guidance eliminates the current option used by the Company to report other comprehensive income and its components in the statement of changes in equity. Instead, upon adoption, an entity can elect to present items of net income and other comprehensive income in one continuous statement-referred to as the statement of comprehensive income or in two separate, but consecutive statements. The updated guidance should be applied retrospectively, and is effective for fiscal years and interim periods within those years beginning after December 15, 2011. Early adoption is permitted. The updated guidance did not have any effect on the Company’s consolidated statement of financial position, results of operations or cash flows.
The Company owns and operates a fleet of crude and product oil carriers and one LNG carrier providing worldwide marine transportation services under long, medium or short-term charters.
| (b) | Use of Estimates:The preparation of financial statements in conformity with U.S. GAAP requires management to make estimates and assumptions that affect the amounts of assets and liabilities reported in the consolidated financial statements and the accompanying notes. Actual results could differ from those estimates. |
TSAKOS ENERGY NAVIGATION LIMITED AND SUBSIDIARIES
NOTES TO CONSOLIDATED FINANCIAL STATEMENTS
DECEMBER 31, 2010, 2009 AND 2008
(Expressed in thousands of U.S. Dollars, except for share and per share data, unless otherwise stated)
| (c) | Foreign Currency Translation:The functional currency of the Company is the U.S. Dollar because the Company’s vessels operate in international shipping markets in which the U.S. Dollar is utilized to transact most business. The accounting books of the Company are also maintained in U.S. Dollars. Transactions involving other currencies during the year are converted into U.S. Dollars using the exchange rates in effect at the time of the transactions. At the balance sheet dates, monetary assets and liabilities, which are denominated in other currencies, are translated into U.S. Dollars at the year-end exchange rates. Resulting gains or losses are separately reflected in the accompanying Consolidated Statements of Income. |
| (d) | Cash and Cash Equivalents:The Company classifies highly liquid investments such as time deposits and certificates of deposit with original maturities of three months or less as cash and cash equivalents. Minimum cash deposits required to be maintained with banks for loan and interest rate swap compliance purposes and deposits with certain banks that may only be used for the purpose of loan repayments are classified as Restricted cash. |
TSAKOS ENERGY NAVIGATION LIMITED AND SUBSIDIARIES
NOTES TO CONSOLIDATED FINANCIAL STATEMENTS—(Continued)
DECEMBER 31, 2011, 2010 AND 2009
(Expressed in thousands of U.S. Dollars, except for share and per share data, unless otherwise stated)
| (e) | Trade Accounts Receivable, Net:Trade accounts receivable, net at each balance sheet date includes estimated recoveries from charterers for hire, freight and demurrage billings and revenue earned but not yet billed, net of an allowance for doubtful accounts (nil as of December 31, |
| (f) | Inventories: Inventories consist of bunkers, lubricants, victualling and stores and are stated at the lower of cost or market value. The cost is determined primarily by the first-in, first-out method. |
| (g) | Fixed Assets: Fixed assets consist primarily of vessels. Vessels are stated at cost, less accumulated depreciation. The cost of vessels includes the contract price and pre-delivery costs incurred during the construction of new buildings, including capitalized interest, and expenses incurred upon acquisition of second-hand vessels. Subsequent expenditures for conversions and major improvements are capitalized when they appreciably extend the life, increase the earning capacity or improve the efficiency or safety of the vessels; otherwise they are charged to expense as incurred. Expenditures for routine repairs and maintenance are expensed as incurred. |
Depreciation is provided on the straight-line method based on the estimated remaining economic useful lives of the vessels, less an estimated residual value based on a scrap price. Economic useful lives are estimated at 25 years for crude and product oil carriers and 40 years for the LNG carrier from the date of original delivery from the shipyard. Scrap prices have increased over the past seven years. Accordingly, effective January 1, 2008, the Company made a change in estimate related to the scrap price for all of its vessels from $180 per lightweight ton to $300 per lightweight ton.
TSAKOS ENERGY NAVIGATION LIMITED AND SUBSIDIARIES
NOTES TO CONSOLIDATED FINANCIAL STATEMENTS
DECEMBER 31, 2010, 2009 AND 2008
(Expressed in thousands of U.S. Dollars, except for share and per share data, unless otherwise stated)
| (h) | Impairment of Vessels: The Company reviews vessels for impairment whenever events or changes in circumstances indicate that the carrying amount of a vessel may not be recoverable, such as during severe disruptions in global economic and market conditions. When such indicators are present, a vessel to be held and used is tested for recoverability by comparing the estimate of future undiscounted net operating cash flows expected to be generated by the use of the vessel over its remaining useful life and its eventual disposition to its carrying amount. Net operating cash flows are determined by applying various assumptions regarding future revenues net of commissions, operating expenses, scheduled dry-dockings, expected off-hire and scrap values, and taking into account historical revenue data and published forecasts on future world economic growth and inflation. Should the carrying value of the vessel exceed its estimated future undiscounted net operating cash flows, impairment is measured based on the excess of the carrying amount over the fair market value of the asset. The Company determines the fair value of its vessels based on management estimates and assumptions and by making use of available market data and taking into consideration third party valuations. |
The review of the carrying amounts in connection with the estimated recoverable amount for certain of the Company’s vessels as of December 31, 2011, 2010 and 2009 indicated an impairment charge (Note 5).
| (i) | Reporting Assets held for sale:It is the Company’s policy to dispose of vessels and other fixed assets when suitable opportunities occur and not necessarily to keep them until the end of their useful life. Long-lived assets classified as held for sale are measured at the lower of their carrying amount or fair value less cost to sell. These assets are not depreciated once they meet the criteria to be held for sale. At December 31, 2011, the VLCC’sLa PrudenciaandLa Madrinawere classified as held for sale, and at December 31, 2010, the aframax vesselOpal Queenwas classified as held for |
TSAKOS ENERGY NAVIGATION LIMITED AND SUBSIDIARIES
NOTES TO CONSOLIDATED FINANCIAL STATEMENTS—(Continued)
DECEMBER 31, 2011, 2010 AND 2009
(Expressed in thousands of U.S. Dollars, except for share and per share data, unless otherwise stated)
| (j) | Accounting for Special Survey and Dry-docking |
| (k) | Loan Costs:Costs incurred for obtaining new loans or refinancing existing loans are capitalized and included in deferred charges and amortized over the term of the respective loan, using the effective interest rate method. Any unamortized balance of costs relating to loans repaid or refinanced as debt extinguishments is expensed in the period the repayment or extinguishment is made. |
| (l) | Accounting for Revenue and Expenses: Voyage revenues are generated from freight billings and time charter hire. Time charter revenue, including bare-boat hire, is recorded over the term of the charter as the service is provided. Revenues from voyage charters on the spot market or under contract of affreightment are recognized ratably from when a vessel becomes available for loading (discharge of the previous charterer’s cargo) to when the next charterer’s cargo |
TSAKOS ENERGY NAVIGATION LIMITED AND SUBSIDIARIES
NOTES TO CONSOLIDATED FINANCIAL STATEMENTS
DECEMBER 31, 2010, 2009 AND 2008
(Expressed in thousands of U.S. Dollars, except for share and per share data, unless otherwise stated)
Voyage revenues for 2010, 2009 and 2008, included revenues derived from significant charterers as follows (in percentages of total voyage revenues):
Charterer | 2010 | 2009 | 2008 | 2011 | 2010 | 2009 | ||||||||||||||||||
A | 16 | % | 14 | % | 15 | % | 14 | % | 16 | % | 14 | % | ||||||||||||
B | 10 | % | 10 | % | 11 | % | 10 | % | 10 | % | 10 | % | ||||||||||||
C | 9 | % | 9 | % | 10 | % | ||||||||||||||||||
| (m) | Segment Reporting:The Company does not evaluate the operating results by type of vessel or by type of charter or by type of cargo. Although operating results may be identified by type of vessel, management, including the chief operating decision maker, reviews operating results primarily by revenue per day and operating results of the fleet. Thus the Company has determined that it operates in one reportable segment, the worldwide maritime transportation of crude and refined oil. In 2007, the Company acquired a liquefied natural gas (LNG) carrier. This is the only vessel of its kind that the Company currently operates and, as it does not meet the quantitative thresholds used to determine reportable segments, the LNG carrier segment is not a reportable segment. The Company’s vessels operate on many trade routes throughout the world and, therefore, the provision of geographic information is considered impracticable by management. |
TSAKOS ENERGY NAVIGATION LIMITED AND SUBSIDIARIES
NOTES TO CONSOLIDATED FINANCIAL STATEMENTS—(Continued)
DECEMBER 31, 2011, 2010 AND 2009
(Expressed in thousands of U.S. Dollars, except for share and per share data, unless otherwise stated)
| (n) | Derivative Financial Instruments: The Company regularly enters into interest rate swap contracts to manage its exposure to fluctuations of interest rates associated with its specific borrowings. Also the Company enters bunker swap contracts to manage its exposure to fluctuations of bunker prices associated with the consumption of bunkers by its vessels. Interest rate and bunker price differentials paid or received under these swap agreements are recognized as part of |
TSAKOS ENERGY NAVIGATION LIMITED AND SUBSIDIARIES
NOTES TO CONSOLIDATED FINANCIAL STATEMENTS
DECEMBER 31, 2010, 2009 AND 2008
(Expressed in thousands of U.S. Dollars, except for share and per share data, unless otherwise stated)
The Company formally documents all relationships between hedging instruments and hedged items, as well as the risk-management objective and strategy for undertaking various hedge transactions.This process includes linking all derivatives that are designated as cash flow hedges of the variable cash flows of a forecasted transaction to a specific forecasted transactions or variability of cash flow.transaction. The Company also formally assesses, both at the hedge’s inception and on an ongoing basis, whether the derivatives that are used in hedging transactions are highly effective in offsetting changes in cash flow of hedged items. When it is determined that a derivative is not highly effective as a hedge or that it has ceased to be a highly effective hedge, the Company discontinues hedge accounting prospectively.
| (o) | Fair Value Measurements: When assets or liabilities in the financial statements are to be measured at fair value, the Company defines fair value as the price that would be received to sell an asset or paid to transfer a liability in an orderly transaction between market participants (Note |
| (p) | Accounting for Leases: Leases of assets under which substantially all the risks and rewards of ownership are effectively retained by the lessor are classified as operating leases. Lease payments under an operating lease are recognized as an expense on a straight-line method over the lease term. The Company held no operating leases at December 31, |
| (q) | Stock Based Compensation:The Company has a share based incentive plan that covers directors and officers of the Company and employees of the related companies discussed in Note 2. Awards granted are valued at fair value and compensation cost is recognized on a straight line basis, net of estimated forfeitures, over the requisite service period of each award. The fair value of restricted stock issued to crew members, directors and officers of the Company at the grant date is equal to the closing stock price on that date and is amortized over the applicable vesting period using the straight-line method. The fair value of restricted stock issued to non-employees is equal to the closing stock price at the grant date adjusted by the closing stock price at each reporting date and is amortized over the applicable performance period (Note |
TSAKOS ENERGY NAVIGATION LIMITED AND SUBSIDIARIES
NOTES TO CONSOLIDATED FINANCIAL STATEMENTSSTATEMENTS—(Continued)
DECEMBER 31, 2011, 2010 2009 AND 20082009
(Expressed in thousands of U.S. Dollars, except for share and per share data, unless otherwise stated)
| Recent Accounting Pronouncements:In |
In December 2011, the FASB issued the ASU No. 2011-12, “Comprehensive income (Topic 220): Presentation of comprehensive income”, to effectively defer only those changes in Update No 2011-05, early adopted by the Company as of December 31, 2011, that relate to the presentation of reclassification adjustments out of Accumulated Other Comprehensive Income.
| 2. | Transactions with Related Parties |
| The following amounts were charged by |
| 2010 | 2009 | 2008 | ||||||||||
Tsakos Shipping and Trading S.A. (commissions) | 6,276 | 6,086 | 7,707 | |||||||||
Tsakos Energy Management Limited (management fees) | 13,843 | 12,973 | 11,715 | |||||||||
Tsakos Columbia Shipmanagement S.A. | 634 | — | — | |||||||||
Argosy Insurance Company Limited | 9,361 | 10,316 | 8,277 | |||||||||
AirMania Travel S.A. | 437 | 727 | 1,309 | |||||||||
Total expenses with related parties | 30,551 | 30,102 | 29,008 | |||||||||
Balances due from and to related parties are as follows:for services rendered:
| December 31, | ||||||||
| 2010 | 2009 | |||||||
Due from related parties | ||||||||
Tsakos Shipping and Trading S.A. | 2,977 | 2,681 | ||||||
Argosy Insurance Company Limited | — | 2,678 | ||||||
Total due from related parties | 2,977 | 5,359 | ||||||
Due to related parties | ||||||||
Tsakos Energy Management Limited | 75 | 22 | ||||||
Tsakos Columbia Shipmanagement Ltd | 56 | — | ||||||
Argosy Insurance Company Limited | 612 | — | ||||||
AirMania Travel S.A. | 36 | 18 | ||||||
Total due to related parties | 779 | 40 | ||||||
| 2011 | 2010 | 2009 | ||||||||||
Tsakos Shipping and Trading S.A. (commissions) | 5,461 | 6,276 | 6,086 | |||||||||
Tsakos Energy Management Limited (management fees) | 15,298 | 13,843 | 12,973 | |||||||||
Tsakos Columbia Shipmanagement S.A. | 1,237 | 634 | — | |||||||||
Argosy Insurance Company Limited | 9,933 | 9,361 | 10,316 | |||||||||
AirMania Travel S.A. | 2,129 | 437 | 727 | |||||||||
|
|
|
|
|
| |||||||
Total expenses with related parties | 34,058 | 30,551 | 30,102 | |||||||||
|
|
|
|
|
| |||||||
TSAKOS ENERGY NAVIGATION LIMITED AND SUBSIDIARIES
NOTES TO CONSOLIDATED FINANCIAL STATEMENTSSTATEMENTS—(Continued)
DECEMBER 31, 2011, 2010 2009 AND 20082009
(Expressed in thousands of U.S. Dollars, except for share and per share data, unless otherwise stated)
Balances due from and to related parties are as follows:
| December 31, | ||||||||
| Due from related parties | 2011 | 2010 | ||||||
Tsakos Shipping and Trading S.A. | — | 2,977 | ||||||
Tsakos Columbia Shipmanagement Ltd | 1,641 | — | ||||||
|
|
|
| |||||
Total due from related parties | 1,641 | 2,977 | ||||||
|
|
|
| |||||
Due to related parties | ||||||||
Tsakos Shipping and Trading S.A. | 89 | — | ||||||
Tsakos Energy Management Limited | 52 | 75 | ||||||
Tsakos Columbia Shipmanagement Ltd | — | 56 | ||||||
Argosy Insurance Company Limited | 607 | 612 | ||||||
AirMania Travel S.A. | 315 | 36 | ||||||
|
|
|
| |||||
Total due to related parties | 1,063 | 779 | ||||||
|
|
|
| |||||
There is also, at December 31, 2011 an amount of $691 ($794 in 2010) due to Tsakos Shipping and Trading S.A. and $243 ($207 in 2010) due to Argosy Insurance Limited, included in Accrued liabilities which relates to services rendered by related parties not yet invoiced.
| (a) | Tsakos Energy Management Limited (the “Management Company”):The Holding Company has a Management Agreement (“Management Agreement”) with the Management Company, a Liberian corporation, to provide overall executive and commercial management of its affairs for a monthly fee. Per the Management Agreement of March 8, 2007, effective from January 1, 2008,there |
In addition to the management fee, the Management Agreement provides for an incentive award to the Management Company, which is at the absolute discretion of the Holding Company’s Board of Directors. The incentive award program is based on the Company’s annual return on equity (“ROE”). In 2011 and 2009, there was no such award. For 2008 the amount of $4,750award, whereas in 2010, there was awarded. For 2010, the Board of Directors resolved to award a special award of $425. The awards are expensed and recognized in accrued liabilities in the accompanying Consolidated Financial Statements wherewhen applicable.
The Holding Company and the Management Company have certain officers and directors in common. The President, who is also the Chief Executive Officer and a Director of the Holding Company, is also the sole stockholder of the Management Company. The Management Company may unilaterally terminate its Management Agreement with the Holding Company at any time upon one year’s notice. In addition, if even one director was elected to the Holding Company’s Board of Directors without having been recommended by the existing board, the Management Company would have the right to terminate the Management Agreement on ten days notice, and the Holding Company would be obligated as at December 31, 2010 to pay the Management Company an amount of approximately $134,044 calculated in accordance with the terms of the Management Agreement. Under the terms of the Management Agreement between the Holding Company and the Management Company, the Holding Company may terminate the Management Agreement only under specific circumstances, without the prior approval of the Holding Company’s Board of Directors.
TSAKOS ENERGY NAVIGATION LIMITED AND SUBSIDIARIES
NOTES TO CONSOLIDATED FINANCIAL STATEMENTSSTATEMENTS—(Continued)
DECEMBER 31, 2011, 2010 2009 AND 20082009
(Expressed in thousands of U.S. Dollars, except for share and per share data, unless otherwise stated)
| (a) | Tsakos Energy Management Limited (continued): |
Estimated future management fees payable over the next ten years under the Management Agreement, exclusive of any incentive awards and based on existing vessels and known vessels as at December 31, 2011, scheduled for future delivery, are:
Year | Amount | |||
2011 | 15,529 | |||
2012 | 15,552 | |||
2013 | 15,573 | |||
2014 | 15,636 | |||
2015 to 2020 | 83,352 | |||
| 145,642 | ||||
Year | Amount | |||
2012 | 16,025 | |||
2013 | 15,524 | |||
2014 | 15,630 | |||
2015 | 15,630 | |||
2016 to 2021 | 85,965 | |||
|
| |||
| 148,774 | ||||
|
| |||
Management fees for vessels are included in the accompanying Consolidated Statements of Income. Also, under the terms of the Management Agreement, the Management Company provides supervisory services for the construction of new vessels for a monthly fee of $20.0 in 2011 and in the second half of 2010, $17.7 per vessel in the first half of 2010, and $20.0 from July 1, 2010, $17.5 per vessel in 2009 and $17.0 in 2008.2009. These fees in total amounted to $588, $620 and $858 for 2011, 2010 and $1,222 during the years ended December 31, 2010, 2009, and 2008, respectively, and are either accounted for as part of construction costs for delivered vessels or are included in Advances for vessels under construction.
| (b) | Tsakos Columbia Shipmanagement S.A. (“TCM”):The Management Company appointed TCM to provide technical management to the Company’s vessels from July 1, 2010. TCM is owned jointly and in equal part by Tsakos family private interests and by a private German Group. TCM, at the consent of the Holding Company, may subcontract all or part of the technical management of any vessel to an alternative unrelated technical manager. |
Effective July 1, 2010, the Management Company, at its own expense, pays technical management fees to TCM, and the Company bears and pays directly to TCM most of its operating expenses, including repairs and maintenance, provisioning and crewing of the Company’s vessels, as well as certain charges which are capitalized or deferred, including reimbursement of the costs of TCM personnel sent overseas to supervise repairs and perform inspections on Company vessels. The Company also pays to TCM certain fees to cover expenses relating to internal control procedures and information technology services which are borne by TCM on behalf of the Company.
TSAKOS ENERGY NAVIGATION LIMITED AND SUBSIDIARIES
NOTES TO CONSOLIDATED FINANCIAL STATEMENTS—(Continued)
DECEMBER 31, 2011, 2010 AND 2009
(Expressed in thousands of U.S. Dollars, except for share and per share data, unless otherwise stated)
| (c) | Tsakos Shipping and Trading S.A. (“Tsakos Shipping”):Until June 30, 2010 the Management Company had appointed Tsakos Shipping to provide technical management to the Company’s vessels. From July 1, 2010 such technical management is performed by TCM, while Tsakos Shipping continues to provide services to the Company’s vessels as described below. Certain members of the Tsakos family are involved in the decision-making processes of Tsakos Shipping and of the Management Company, and are also shareholders, and directors of the Holding Company. |
TSAKOS ENERGY NAVIGATION LIMITED AND SUBSIDIARIES
NOTES TO CONSOLIDATED FINANCIAL STATEMENTS
DECEMBER 31, 2010, 2009 AND 2008
(Expressed in thousands of U.S. Dollars, except for share and per share data, unless otherwise stated)
Up to June 30, 2010, the Management Company, at its own expenses, paid technical management fees to Tsakos Shipping, and the Company paid directly to Tsakos Shipping most of its operating expenses,including repairs and maintenance, provisioning and crewing of the Company’s vessels, as well as certain charges which are capitalized or deferred, including reimbursement of the costs of Tsakos Shipping personnel sent overseas to supervise repairs and perform inspections on Company vessels. Commissions due to Tsakos Shipping by the Company have been netted-off against amounts due from Tsakos Shipping for advances made, and the net amount is included in Due from related Companies.
| (d) | Other affiliated companies: |
On July 22, 2010,The Company also assumed the Company exercised an option to purchase two panamax tankers,Salamina andSelini, from affiliated companies for $54,500 million each. On October 20, 2010, the Company signed agreements to purchase theSalamina andSeliniwith attached pool employment arrangements. The vessels were delivered to the Company on November 12, 2010 and October 26, 2010, respectively (Note 4). The attached pool employment arrangements were at market rates (Note 13(c)); therefore, no gains or losses were recognized upon assumption of the pool employment arrangements.
The remaining unpaid loan balances of $43,924 and $42,100$86,024 related to the vesselsSeliniandSalamina were agreed to be assumed byfinancing of two of the Company from an affiliated company on October 18, 2010 and November 6, 2010, respectively (Note 6).panamaxes. The assumed loans were determined to be at fair market value (Note 13(c)15(c)); therefore, no gain or loss was recognized upon assumption of the loans.
| (e) | Argosy Insurance Company Limited (“Argosy”): The Company places its hull and machinery insurance, increased value insurance and war risk and certain other insurance through Argosy, a captive insurance company affiliated with Tsakos Shipping. |
| (f) | AirMania Travel S.A. (“AirMania”): Apart from third-party agents, the Company also uses an affiliated company, AirMania, for travel services. |
TSAKOS ENERGY NAVIGATION LIMITED AND SUBSIDIARIES
NOTES TO CONSOLIDATED FINANCIAL STATEMENTS
DECEMBER 31, 2010, 2009 AND 2008
(Expressed in thousands of U.S. Dollars, except for share and per share data, unless otherwise stated)
| 3. | Long-term Investments |
At December 31, 2010, 20092011 and 2008,2010, the Company held 125,000 common shares at a total cost of $1,000 in a private U.S. company which undertakes research into synthetic genomic processes which may have a beneficial environmental impact within the energy and maritime industries. Management has determined
TSAKOS ENERGY NAVIGATION LIMITED AND SUBSIDIARIES
NOTES TO CONSOLIDATED FINANCIAL STATEMENTS
DECEMBER 31, 2011, 2010 AND 2009
(Expressed in thousands of U.S. Dollars, except for share and per share data, unless otherwise stated)
that there has been no impairment to the cost of this investment since its acquisition in 2007. A Director of the Company is an officer and shareholder of this company.
No income was received from this investment during 2011, 2010 2009 and 2008, and there were no new investments during 2010, 2009 and 2008.2009.
| 4. | Marketable securities |
In March 2011, the Company placed $2,500 in highly liquid, low risk marketable securities which are considered to be available-for-sale for reporting purposes. The fair value of these marketable securities as of December 31, 2011 was $2,534, and the change in fair value amounting to $34 (positive) is included in Accumulated other comprehensive loss.
| 5. | Vessels |
Acquisitions
ThereIn 2011 there were two scheduled deliveries of the newly constructed suezmaxesSpyros KandDimitris Pat a total cost of $148,526 of which $66,643 was paid within 2011. In 2010 there were two scheduled deliveries of newly constructed vessels in 2010 at a total cost of $128,539 of which $94,184 was paid in 2010. Also in 2010 the Company acquired four panamax tankers built in 2009 for a total cost of $218,013 (Note 2(d)).
In 2009 there were two scheduled deliveries of newly constructed vessels at a total cost of $127,718 of which $100,457 was paid in 2009. In 2008, there were four scheduled deliveries of newly constructed vessels at a total cost of $245,129 of which $126,943 was paid in 2008. Also in October 2008, the Company repurchased two suezmax tankers for $47,500 each.
Sales
In 2011, the Company sold the aframax tankerOpal Queen,classified as held for sale at December 31, 2010 for net proceeds of $32,753 realizing a gain of $5,802 and the aframax tankerVergina IIfor net proceeds of $9,702 realizing a loss of $801. The net capital gain of $5,001 is separately reflected in the accompanying Consolidated Statements of Income. In 2010, the Company sold all five vessels classified as held for sale at December 31, 2009, the suezmaxDecathlon,the aframax tankersMarathonandParthenonand the panamax tankersHesnesandVictory IIIfor net proceeds $140,548 in total realizing a net capital gain of $19,670, which is separately reflected in the accompanying Consolidated Statements of Income. On December 30, 2010, the Company agreed to sell the aframax tankerOpal Queenfor $34,000 for delivery in March 2011 resulting in an estimated gain of $5,334 to be recorded in the first quarter of 2011. At December 31, 2010, the vessel is accounted for as held for sale (Note 1(i)). During$19,670. In 2009, the Company sold the suezmaxPentathlonfor net proceeds of $50,463 realizing a capital gain of $5,122. In February 2008, the Company sold the aframax tankerOlympia for net proceeds of $62,100 and a capital gain of $34,565.
Charters-out
The future minimum revenues, before reduction for brokerage commissions, expected to be recognized on non-cancelable time charters are as follows:
Year | Amount | |||
2011 | 163,184 | |||
2012 | 64,520 | |||
2013 | 23,160 | |||
2014 | 438 | |||
Net minimum charter payments | 251,302 | |||
TSAKOS ENERGY NAVIGATION LIMITED AND SUBSIDIARIES
NOTES TO CONSOLIDATED FINANCIAL STATEMENTS
DECEMBER 31, 2010, 2009 AND 2008
(Expressed in thousands of U.S. Dollars, except for share and per share data, unless otherwise stated)
Charters-out (continued)
These amounts do not assume any off-hire.
On December 9, 2010, the Company signed two charter-party agreements with the same charterer, each for the charter of a DP 2 suezmax shuttle tanker for a period of fifteen years to commence on delivery of the vessels, expected in the fourth quarter of 2012 and in the first quarter of 2013, respectively (Note 14(c)). The revenue to be generated by these vessels has not been included in the above table.
Charter hire expense
TheThere was no charter hire expense in 2011 and 2009. In 2010, the suezmaxNordic Passat was chartered by the Company from March 2 to June 13, 2010. The total amount of hire charged during this period was $1,755. Another vessel was chartered from January 30, 2010 to February 9, 2010 at a total hire of $150.
ImpairmentHeld for sale and impairment
In the latter part of 2010,2011, events occurred and circumstances changed, which in the ensuing period indicated that the carrying amountamounts of the aframax tankerVLCC tankers LaVergina II,MadrinaandLa Prudencia,built in 1991 was1994 and 1993 respectively were not fully recoverable. More specifically, market conditions led to a significant drop ofin VLCC tanker hire rates and the preference for younger vessels. The Company evaluated this vessel by comparingdetermined that these vessels met the weighted estimated undiscounted cash flowscriteria to be generated by this vessel under various scenarios against its carrying value. Based on this evaluationclassified as held for sale. Therefore, the Company determined thatremeasured the carryingvessels at fair value less costs to sell and recognized a total impairment charge of theVergina II was impaired.$39,434. Consequently, the total carrying value of the vesselvalues at December 31, 20102011 of $13,623 was$30,987 forLa Madrinaand $49,875 forLa Prudencia were written down to $10,546,$20,714 each, which is thea level 3 measurement of fair market value of the vessel as determined by
TSAKOS ENERGY NAVIGATION LIMITED AND SUBSIDIARIES
NOTES TO CONSOLIDATED FINANCIAL STATEMENTS—(Continued)
DECEMBER 31, 2011, 2010 AND 2009
(Expressed in thousands of U.S. Dollars, except for share and per share data, unless otherwise stated)
management taking into consideration valuations from independent marine valuers and making use of current available market data relating to the vessel and similar vessels (Note 13(c)15(c)). ForDuring 2010, the remaining vesselscarrying value of the aframax tankerVergina IIwas written down resulting in the fleet, there is no indicationan impairment charge of impairment in 2010.$3,077. During 2009, the carrying value of three vessels the panamax tankersHesnesandVictory IIIand the aframax tankerVergina IIwere written down resulting in a total impairment charge of $19,066.
| Deferred Charges |
Deferred charges, consistedconsist of dry-docking and special survey costs, net of accumulated amortization, amounted to $12,221$10,672 and $10,778$12,221 at December 31, 20102011 and 2009,2010, respectively, and loan fees, net of accumulated amortization, amounted to $4,036 and $4,141 and $4,005 at December 31, 20102011 and 2009,2010, respectively. Amortization of deferred dry-docking costs is separately reflected in the accompanying Consolidated Statements of Income, while amortization of loan fees is included in Interest and finance costs, net.
TSAKOS ENERGY NAVIGATION LIMITED AND SUBSIDIARIES
NOTES TO CONSOLIDATED FINANCIAL STATEMENTS
DECEMBER 31, 2010, 2009 AND 2008
(Expressed in thousands of U.S. Dollars, except for share and per share data, unless otherwise stated)
| Long–Term Debt |
Facility | 2010 | 2009 | 2011 | 2010 | ||||||||||||
(a) Credit Facilities | 1,127,925 | 1,285,213 | ||||||||||||||
(b) Term Bank Loans | 434,542 | 217,361 | ||||||||||||||
(a) Credit facilities | 1,030,798 | 1,127,925 | ||||||||||||||
(b) Term bank loans | 484,865 | 434,542 | ||||||||||||||
|
| |||||||||||||||
Total | 1,562,467 | 1,502,574 | 1,515,663 | 1,562,467 | ||||||||||||
Less – current portion | (133,819 | ) | (172,668 | ) | (196,996 | ) | (133,819 | ) | ||||||||
|
| |||||||||||||||
Long-term portion | 1,428,648 | 1,329,906 | 1,318,667 | 1,428,648 | ||||||||||||
|
| |||||||||||||||
(a) Credit facilities
| (a) | Credit facilities |
As at December 31, 2010,2011, the Company had seven open reducing revolving credit facilities, all of which are reduced in semi-annual installments, and two open facilities which have both a reducing revolving credit component and a term bank loan component. The aggregate available unused amount under these facilities at December 31, 20102011 is $32,522.$28,358. This amount was drawn down on January 17, 2012 (Note 16 (a)). Interest is payable at a rate based on LIBOR plus a spread. At December 31, 2010,2011, the interest rates on these facilities ranged from 1.11%0.93% to 5.19%.
(b) Term bank loans
| (b) | Term bank loans |
Term loan balances outstanding at December 31, 20102011 amounted to $434,542.$484,865. In April 2010,May 2011, the Company drew down $40,000$48,000 on a 12-year10-year term loan agreed in November 2009,April 2011, relating to the financing of the vesselSapporo Princess.Spyros K.In June 2010,July 2011, the Company drew down $39,000$48,650 on a 10-year9-year term loan agreed in May 2010,July 2011, relating to the financing of the vesselUraga Princess.Dimitris P.In July and August 2010, the Company drew down $35,000 each on a 7-yearThe term loan agreed in July 2010, relating to the financing ofWorld HarmonyandChantal,respectively. In October 2010, the Company drew down $43,924 on a 10-year loan term agreed in October 2010 relating to the financing of the vesselSelini. In November 2010, the Company drew down $42,100 on an 8-year term loan agreed in October 2010 relating to the financing of the vesselSalamina.These bank loans are payable in U.S. Dollars in semi-annual installments with balloon payments due at maturity between October 2016 and April 2022. Interest rates on the outstanding loans as at December 31, 2010,2011, are based on LIBOR plus a spread.
At December 31, 2010,2011, the interest rates on these term bank loans ranged from 0.94%1.09% to 3.03%3.00%.
The weighted-average interest rates on the above executed loans for the applicable periods were:
Year ended December 31, 2011 | 1.66 | % | ||
Year ended December 31, 2010 | 1.62 | % | ||
Year ended December 31, 2009 | 2.70 | % | ||
|
TSAKOS ENERGY NAVIGATION LIMITED AND SUBSIDIARIES
NOTES TO CONSOLIDATED FINANCIAL STATEMENTSSTATEMENTS—(Continued)
DECEMBER 31, 2011, 2010 2009 AND 20082009
(Expressed in thousands of U.S. Dollars, except for share and per share data, unless otherwise stated)
Loan movements for credit facilities and term loans throughout 2010:2011:
Loan | Origination Date | Original Amount | Balance at January 1, 2010 | New Loans | Repaid | Balance at December 31, 2010 | Origination Date | Original Amount | Balance at January 1, 2011 | New Loans | Repaid | Balance at December 31, 2011 | ||||||||||||||||||||||||||||||||||||
12-year term loan1 | 2002 | 30,500 | 17,375 | — | 1,750 | 15,625 | 2002 | 30,500 | 15,625 | — | 15,625 | — | ||||||||||||||||||||||||||||||||||||
Credit facility2 | 2005 | 250,000 | 111,550 | — | 23,826 | 87,724 | 2005 | 250,000 | 87,724 | — | 19,240 | 68,484 | ||||||||||||||||||||||||||||||||||||
Credit facility | 2005 | 220,000 | 173,630 | — | 13,135 | 160,495 | 2005 | 220,000 | 160,495 | — | 13,135 | 147,360 | ||||||||||||||||||||||||||||||||||||
Credit facility | 2006 | 275,000 | 148,738 | — | 11,823 | 136,915 | ||||||||||||||||||||||||||||||||||||||||||
Credit facility3 | 2006 | 275,000 | 218,650 | — | 69,912 | 148,738 | 2004 | 179,384 | 105,108 | — | 10,555 | 94,553 | ||||||||||||||||||||||||||||||||||||
Credit facility4 | 2004 | 179,384 | 115,664 | — | 10,556 | 105,108 | ||||||||||||||||||||||||||||||||||||||||||
Credit facility | 2005 | 220,000 | 117,750 | — | 8,400 | 109,350 | 2005 | 220,000 | 109,350 | — | 8,400 | 100,950 | ||||||||||||||||||||||||||||||||||||
Credit facility | 2006 | 371,010 | 311,010 | — | 20,000 | 291,010 | 2006 | 371,010 | 291,010 | — | 20,000 | 271,010 | ||||||||||||||||||||||||||||||||||||
10-year term loan | 2004 | 71,250 | 41,406 | — | 3,125 | 38,281 | 2004 | 71,250 | 38,281 | — | 3,124 | 35,157 | ||||||||||||||||||||||||||||||||||||
Credit facility | 2006 | 70,000 | 56,875 | — | 4,375 | 52,500 | 2006 | 70,000 | 52,500 | — | 4,375 | 48,125 | ||||||||||||||||||||||||||||||||||||
Credit facility | 2007 | 120,000 | 104,984 | — | 2,484 | 102,500 | 2007 | 120,000 | 102,500 | — | 5,000 | 97,500 | ||||||||||||||||||||||||||||||||||||
10-year term loan | 2007 | 88,350 | 82,830 | — | 5,520 | 77,310 | 2007 | 88,350 | 77,310 | — | 5,520 | 71,790 | ||||||||||||||||||||||||||||||||||||
Credit facility | 2007 | 82,000 | 75,100 | — | 4,600 | 70,500 | 2007 | 82,000 | 70,500 | — | 4,600 | 65,900 | ||||||||||||||||||||||||||||||||||||
10-year term loan | 2009 | 38,600 | 35,750 | — | 2,234 | 33,516 | 2009 | 38,600 | 33,516 | — | 2,235 | 31,281 | ||||||||||||||||||||||||||||||||||||
8-year term loan | 2009 | 40,000 | 40,000 | — | 2,664 | 37,336 | 2009 | 40,000 | 37,336 | — | 2,664 | 34,672 | ||||||||||||||||||||||||||||||||||||
12 year term loan | 2009 | 40,000 | — | 40,000 | 1,250 | 38,750 | 2009 | 40,000 | 38,750 | — | 2,500 | 36,250 | ||||||||||||||||||||||||||||||||||||
10-year term loan | 2010 | 39,000 | — | 39,000 | 1,300 | 37,700 | 2010 | 39,000 | 37,700 | — | 2,600 | 35,100 | ||||||||||||||||||||||||||||||||||||
7-year term loan | 2010 | 70,000 | — | 70,000 | — | 70,000 | 2010 | 70,000 | 70,000 | — | 4,640 | 65,360 | ||||||||||||||||||||||||||||||||||||
10-year term loan | 2010 | 43,924 | — | 43,924 | — | 43,924 | 2010 | 43,924 | 43,924 | — �� | 3,218 | 40,706 | ||||||||||||||||||||||||||||||||||||
8-year term loan | 2010 | 42,100 | — | 42,100 | — | 42,100 | ||||||||||||||||||||||||||||||||||||||||||
9-year term loan | 2010 | 42,100 | 42,100 | — | 2,600 | 39,500 | ||||||||||||||||||||||||||||||||||||||||||
10-year term loan | 2011 | 48,000 | — | 48,000 | 1,600 | 46,400 | ||||||||||||||||||||||||||||||||||||||||||
9-year term loan | 2011 | 48,650 | — | 48,650 | — | 48,650 | ||||||||||||||||||||||||||||||||||||||||||
|
|
|
| |||||||||||||||||||||||||||||||||||||||||||||
Total | 1,502,574 | 235,024 | 175,131 | 1,562,467 | 1,562,467 | 96,650 | 143,454 | 1,515,663 | ||||||||||||||||||||||||||||||||||||||||
|
|
|
| |||||||||||||||||||||||||||||||||||||||||||||
| 1 |
|
TSAKOS ENERGY NAVIGATION LIMITED AND SUBSIDIARIES
The Company sold one of its vessels(Vergina II) secured under this credit facility within 2011 and accordingly, prepaid an amount of $8,623 included in the repayments in the above table. This credit facility includes a fixed interest rate portion amounting to $74,354 as at December 31, 2011 (Note 15). The above revolving credit facilities and term bank loans are secured by first priority mortgages on The loan agreements include, among other covenants, covenants requiring the Company to obtain the lenders’ prior consent in order to incur or issue any financial indebtedness, additional borrowings, pay dividends in an amount more than 50% of cumulative net income (as defined in the related agreements), sell vessels and assets, and change the beneficial ownership or management of the vessels. Also, the covenants require the Company to maintain a minimum liquidity, a minimum hull value in connection with the vessels’ outstanding loans, insurance coverage of the vessels against all customary risks and maintenance of Year 2011 2012 2013 2014 2015 2016 and thereafter TSAKOS ENERGY NAVIGATION LIMITED AND SUBSIDIARIES NOTES TO CONSOLIDATED FINANCIAL DECEMBER 31, 2011, 2010 (Expressed in thousands of U.S. Dollars, except for share and per share data, unless otherwise stated)NOTES TO CONSOLIDATED FINANCIAL STATEMENTS2 DECEMBER 31, 2010, 2009 AND 2008(Expressed in thousands of U.S. Dollars, except for share and per share data, unless otherwise stated)6.3Long-Term Debt (continued)2 The Company sold two of its vessels(Hesnesand Victory III) secured under this credit facility within 2010 and accordingly, has prepaid an amount of $11,906 included in the repayments in the above table.3 The Company sold two of its vessels(Marathonand Parthenon)secured under this credit facility in 2010, and accordingly, has prepaid an amount of $57,000 included in the repayments in the above table.4This credit facility includes a fixed interest rate portion amounting to $84,909 as at December 31, 2010. substantially all vessels, and to assignments of earnings and insurances of the respectively mortgaged vessels, and by corporate guarantees of the relevant ship-owning subsidiaries. operating bank accounts with minimum balances.The annual principal payments required to be made after December 31, 2010, including balloon payments totaling $747,554 due through April 2022, are as follows: Amount 133,819 118,194 154,537 108,305 239,038 808,574 1,562,467 STATEMENTSSTATEMENTS—(Continued)2009 AND 20082009
operating bank accounts with minimum balances. As at December 31, 2011, the Company was in non-compliance with minimum value-to-loan ratios contained in certain of its debt agreements under which a total of $621,021 was outstanding at that date. These agreements include two loans which relate to the vesselsLa Madrina andLa Prudencia which are accounted for as held for sale and which management expects to sell within the first half year of 2012. On sale of these vessels it is expected that, in accordance with the terms of the respective loans, prepayments will be calculated on a basis that takes into account the value-to-loans ratios of the remaining vessels covered by the loans. These prepayments, based on existing values, are expected to amount to $56,855. These agreements also include further loans in non-compliance with minimum value-to-loan ratios in relation to which the Company may be required to prepay indebtedness in the form of cash or provide additional security in the total of $8,555. Accordingly, in addition to the required scheduled payments, the amount of $65,410 has been classified as a current liability as of December 31, 2011.
As of December 31, 2011, a subsidiary, in which the Company has a 51% interest, was not in compliance with the leverage ratio required by its loan, under which the amount of $48,125 was outstanding as of that date. In this respect, on April 16, 2012, the subsidiary entered into an amendatory agreement with the lenders which waives the non-compliance of the leverage ratio covenant referred to above for the period from December 31, 2011 through December 31, 2012. This agreement requires the subsidiary to make a prepayment in 2012 in the amount of $8,125 on the loan (classified in current liabilities at December 31, 2011) against the balloon installment due in 2016 and pay increased interest rate margins during the waiver period and remaining term of the loan.
The annual principal payments required to be made after December 31, 2011, including balloon payments totaling $716,543 due through April 2022, are as follows:
Year | Amount | |||
2012 | 196,996 | |||
2013 | 134,804 | |||
2014 | 110,913 | |||
2015 | 210,937 | |||
2016 | 212,568 | |||
2017 and thereafter | 649,445 | |||
|
| |||
| 1,515,663 | ||||
|
| |||
| Interest and Finance Costs, net |
| 2010 | 2009 | 2008 | 2011 | 2010 | 2009 | |||||||||||||||||||
Interest expense | 60,275 | 60,963 | 70,236 | 51,720 | 53,051 | 59,000 | ||||||||||||||||||
Less: Interest capitalized | (2,520 | ) | (2,050 | ) | (4,319 | ) | (2,532 | ) | (2,520 | ) | (2,050 | ) | ||||||||||||
|
|
| ||||||||||||||||||||||
Interest expense, net | 57,755 | 58,913 | 65,917 | 49,188 | 50,531 | 56,950 | ||||||||||||||||||
Interest swap cash settlements non-hedging | 8,977 | 7,224 | 1,963 | |||||||||||||||||||||
Bunkers swap cash settlements | (2,926 | ) | (1,662 | ) | — | (6,382 | ) | (2,926 | ) | (1,662 | ) | |||||||||||||
Amortization of loan fees | 1,138 | 877 | 944 | 995 | 1,138 | 877 | ||||||||||||||||||
Bank charges | 359 | 302 | 566 | 277 | 359 | 302 | ||||||||||||||||||
Sub-total | 56,326 | 58,430 | 67,427 | |||||||||||||||||||||
Amortization of deferred loss on termination of financial instruments | 2,113 | — | 1,132 | 2,020 | 2,113 | — | ||||||||||||||||||
Change in fair value of non-hedging financial instruments | 3,844 | (12,553 | ) | 14,338 | (1,504 | ) | 3,844 | (12,553 | ) | |||||||||||||||
|
|
| ||||||||||||||||||||||
Sub-total | 5,957 | (12,553 | ) | 15,470 | ||||||||||||||||||||
Net total | 62,283 | 45,877 | 82,897 | 53,571 | 62,283 | 45,877 | ||||||||||||||||||
|
|
| ||||||||||||||||||||||
TSAKOS ENERGY NAVIGATION LIMITED AND SUBSIDIARIES
NOTES TO CONSOLIDATED FINANCIAL STATEMENTS—(Continued)
DECEMBER 31, 2011, 2010 AND 2009
(Expressed in thousands of U.S. Dollars, except for share and per share data, unless otherwise stated)
At December 31, 2010,2011, the Company was committed to thirteen floating-to-fixed interest rate swaps with major financial institutions covering notional amounts aggregating to $859,168$716,543 maturing from August 2012 through May 2018, on which it pays fixed rates averaging 4.63%4.59% and receives floating rates based on the six-month London interbank offered rate (“LIBOR”) (Note 13)15).
At December 31, 2010,2011, the Company held ten of the thirteen interest rate swap agreements in order to hedge its exposure to interest rate fluctuations associated with its debt covering notional amounts aggregating to $610,831.$542,142. The fair value of such financial instruments as of December 31, 20102011 and 20092010 in aggregate amounted to $47,105$28,835 (negative) and $59,063$47,105 (negative), respectively. The estimated net amount of cash flow hedge losses at December 31, 2011 that is estimated to be reclassified into earnings within the next twelve months is $21,896.
On March 24,At December 31, 2011 and 2010, the Company discontinued as a cash flow hedge one hedgingheld three interest rate swap. This interest rate swap is associated with a secured term loan facility for certain held-for-sale vessels at December 31, 2009. Under the terms of the facility, a vessel sale will permanently reduce the debt balance by an amount equivalent to the relevant fraction of the facility computed by taking the fair market value of the vessel sold divided by the fair market value of all the vessels secured under the facility. When an agreement to sell one of those vessels was reached on March 24, 2010, the hedge no longer met the criteria for specialswaps that did not meet hedge accounting as it was no longer highly effective and it was determined by management that the future cash flows associated with the repayment of the related financing of such sold vessel would be probable of not occurring.criteria. As such, the changes in their fair valuevalues during the first quarter of2011 and 2010 of the ineffective part of $143 (negative) have been included directly in earnings for the period with the remaining change in fair value (for those vessels underof non-hedging financial instruments in the facility which were not sold) reflected directly in Accumulated other comprehensive loss in Stockholder’s Equity. In addition, the loss within Accumulated other comprehensive loss that was considered to be directly related to the portion of the loan to be prepaid on the sale of the vessel was immediately reclassified to incometable above, and amounted to $428. A second vessel financed by$3,626 (positive) and $1,274 (negative), respectively. In March 2010, one of these swaps that previously met hedge accounting criteria was de-designated as a hedging swap and the same loan was sold in July 2010, and a further amount of $380 of the loss within Accumulated other comprehensive loss, that was considered to be directly related to the portion of the loan to be prepaid, was immediately reclassified to income.
TSAKOS ENERGY NAVIGATION LIMITED AND SUBSIDIARIES
NOTES TO CONSOLIDATED FINANCIAL STATEMENTS
DECEMBER 31, 2010, 2009 AND 2008
(Expressed in thousands of U.S. Dollars, except for share and per share data, unless otherwise stated)
The remaining loss included in Accumulated other comprehensive loss, related to the portion of the loan that will not be prepaid, and for which the associated future cash flows are deemed probable of occurring ($5,2243,204 at December 31, 2010)2011), is being amortized to income over the term of the original hedge provided that the variable-rate interest obligations continue. The amount of such loss amortized during the year ended December 31,2011 and 2010 was $1,514 and $1,305, respectively and for the next year up to December 31, 20112012; amortization is expected to be $1,644.$1,475. In addition, in June 2011, a vessel financed by the loan previously hedged by the de-designated swap, was sold and the loss within Accumulated other comprehensive loss of $506 that was considered to be directly associated with future cash flows, which were not probable of occurring was immediately reclassified to income. In 2010 an aggregate loss of $808 due to the de-designation of the swap in March 2010 and a sale of a second vessel in July 2010, was reclassified to income for the same reasons.
At December 31, 2011 and 2010, the Company held two other interest rate swaps that did not meet hedge accounting criteria. As such, the changes in their fair values during 2010 have been included in change in fair value of non-hedging financial instruments, in the table abovehad three and amounted to $89 (positive).
During 2010 and 2009, the Company had seven and sixfive bunker swap agreements, respectively, in order to hedge its exposure to bunker price fluctuations associated with the consumption of bunkers by its vessels. During 2011, the Company entered into one bunker swap agreement and disposed it of prior to maturity resulting in a realized gain of $115 which is included in Bunker swap cash settlements in the table above. The fair value of these financial instruments as of December 31, 2011 and 2010 and 2009 was $3,876$1,755 (positive) and $6,446$3,876 (positive), respectively and the changes in their fair values during 20102011 and 20092010 amounting to $2,122 (negative) and $2,570 (positive) and $6,446 (positive)(negative) respectively have been included in Change in fair value of non-hedging financial instruments in the table above, as such agreements do not meet the hedging criteria.
| Stockholders’ Equity |
The Company has a shareholder rights plan that authorizes to existing shareholders substantial preferred share rights and additional common shares if any third party acquires 15% or more of the outstanding common shares or announces its intent to commence a tender offer for at least 15% of the common shares, in each case, in a transaction that the Board of Directors has not approved.
On August 11, 2011, the Company announced the authorization of a new share buy-back program allocating up to $20,000 for purchases in the open market and in other transactions. The program replaces all open prior programs. There were no repurchases of common shares under this program during 2011.
TSAKOS ENERGY NAVIGATION LIMITED AND SUBSIDIARIES
NOTES TO CONSOLIDATED FINANCIAL STATEMENTS—(Continued)
DECEMBER 31, 2011, 2010 AND 2009
(Expressed in thousands of U.S. Dollars, except for share and per share data, unless otherwise stated)
During 2009, the Company repurchased 245,400 shares as treasury stock at a cost of $4,058. In 2008, 812,700 common shares were repurchased as treasury stock at a cost of $21,937. In addition, repurchases of stock for cancellation for the years ended December 31, 2008 amounted to $12,232. The transactions were open market based through the New York Stock Exchange. There were no repurchases of common shares during 2011 and 2010.
On December 4, 2009, the Company entered into a distribution agency agreement with a Bank for the offer and sale of up to three million of common shares. In accordance with the terms of the distribution agency agreement, the shares may be offered and sold at any time and from time to time through the sales agent by means of ordinary brokers’ transactions on the New York Stock Exchange at market prices prevailing at the time of sale or as otherwise agreed with the Bank. Under this program, during 2010, the Company sold all of its 754,706 treasury shares remaining at December 31, 2009 for net proceeds of $12,671 before the issuance and sale of 445,127 new shares for net proceeds of $7,042. No further sales of shares under this program were made after May 3, 2010 and the program was formally closed by the Company on October 5, 2010.
TSAKOS ENERGY NAVIGATION LIMITED AND SUBSIDIARIES
NOTES TO CONSOLIDATED FINANCIAL STATEMENTS
DECEMBER 31, 2010, 2009 AND 2008
(Expressed in thousands of U.S. Dollars, except for share and per share data, unless otherwise stated)
On October 26, 2010, the Company commenced a public offering of its common shares through an appointed underwriter and sold 6,726,457 shares at $11.15 per share. A further 896,861 shares were sold to Tsakos private interests at $11.30 per share. The offering formally closed on November 1, 2010. The total amount raised was $85,135 for the purpose of fleet expansion and general corporate purposes. Expenses amounted to $437.
In 2004, the shareholders approved a share-based incentive plan providing for the granting of up to 1,000,000 of stock options or other share-based awards to directors and officers of the Company, crew members and to employees of the related companies (the “2004 Plan”).
As at December 31, 2010, 872,4502011, 884,450 restricted share units (RSUs) had been issued to directors, officers and seafarers employed by the Company and to staff of the commercial and technical managers (who are considered as non-employees for accounting purposes), of which 653,300780,550 had vested and 19,400 were forfeited).
Movements under this plan are as follows:
| No of RSUs Granted | No of RSUs Forfeited | No of RSUs Vested | Balance of Non-Vested RSUs | Weighted- Average Grant-Date Fair Value Per Share | ||||||||||||||||
December 31, 2009 | 727,450 | (16,300 | ) | (311,650 | ) | 399,500 | $ | 14.56 | ||||||||||||
Granted July 1, 2010 | 145,000 | — | — | 145,000 | $ | 13.06 | ||||||||||||||
Vested during 2010 | — | — | (341,650 | ) | (341,650 | ) | $ | 15.20 | ||||||||||||
Forfeited during 2010 | — | (3,100 | ) | — | (3,100 | ) | $ | 15.50 | ||||||||||||
December 31, 2010 | 872,450 | (19,400 | ) | (653,300 | ) | 199,750 | $ | 12.37 | ||||||||||||
| Number of RSUs Granted | Number of RSUs Forfeited | Number of RSUs Vested | Balance of Non- Vested RSUs | Weighted- Average Grant – Date Fair Value per share | ||||||||||||||||
December 31, 2010 | 872,450 | (19,400 | ) | (653,300 | ) | 199,750 | $ | 12.37 | ||||||||||||
Granted June 30,2011 | 12,000 | — | — | 12,000 | $ | 9.36 | ||||||||||||||
Vested during 2011 | — | — | (127,250 | ) | (127,250 | ) | $ | 12.20 | ||||||||||||
|
|
|
|
|
|
|
|
|
| |||||||||||
December 31, 2011 | 884,450 | (19,400 | ) | (780,550 | ) | 84,500 | $ | 12.34 | ||||||||||||
|
|
|
|
|
|
|
|
|
| |||||||||||
During 2011 and 2010, 127,250 and 341,650 RSUs vested.vested respectively. No RSU’s vested in 2009. On July 1, 2010June 30, 2011 a further 145,00012,000 RSUs were issued, vesting 50% on June 30, 2011 and 50% on June 30, 2012. The number of RSUs granted and outstanding as at December 31, 2011 and 2010 was 84,500 and 2009 was 199,750, and 399,500, respectively. At the date of the awards the weighted average fair market value of the Company’s stock granted was $9.36 (2011), $13.06 (2010) and $15.20 (2009). There were no RSUs granted in 2008. The total fair value of shares vested during the years ended December 31, 2011 and 2010 were $987 and 2008 were $3,687, and $5,240, respectively. No RSUs vested in 2009.
The 84,500 outstanding RSUs as of December 31, 20102011 will vest as follows:at June 30, 2012.
| ||||
| ||||
| ||||
| ||||
| ||||
TSAKOS ENERGY NAVIGATION LIMITED AND SUBSIDIARIES
NOTES TO CONSOLIDATED FINANCIAL STATEMENTSSTATEMENTS—(Continued)
DECEMBER 31, 2011, 2010 2009 AND 20082009
(Expressed in thousands of U.S. Dollars, except for share and per share data, unless otherwise stated)
Total compensation expenseexpenses recognized in 2011 amounted to $820 consisting of $624 for employees and $196 for non employees. In 2010 total compensation expense amounted to $1,068 consisting of $1,024 for employees and $44 for non-employees. In 2009, total compensation expense amounted to $1,087 consisting of $676 for employees and $411 for non-employees. In 2008, total compensation expense was $3,046 consisting of $1,237 for employees and $1,809 for non-employees. As at December 31, 2010,2011, the total compensation cost related to the non-vested RSUs for both employees and non-employees not yet recognized is $1,148$153 ($1,4841,148 at December 31, 2009)2010) and the weighted average remaining contractual life of outstanding grants is 1.00.5 years.
| 10. | Accumulated other comprehensive loss |
In 2011, Accumulated other comprehensive loss decreased with unrealized gains on interest rate swaps of $15,245, and $2,020 related to amortization of deferred loss on de-designated financial instruments. Also included in the above gains is $34 which resulted from unrealized gains on marketable securities. In 2010, Accumulated other comprehensive income increasedloss decreased with unrealized gains on interest rate swaps of $5,402$3,289, and $2,113 related to amortization of which $3,289 resulted from changes in fair value ofdeferred loss on de-designated financial instruments, $808 were reclassified to income on sale of vessels and $1,305 were amortized to income.instruments. In 2009, and 2008, Accumulated other comprehensive income increasedloss decreased with unrealized gains on interest rate swaps of $14,508 and decreased with unrealized losses of $48,464, respectively, that resulted from the changes in the fair value of financial instruments.$14,508.
| Earnings per Common Share |
The computation of basic earnings per share is based on the weighted average number of common shares outstanding during the year. The computation of diluted earnings per share assumes the foregoing and the exercise of all RSUs (Note 8)9) using the treasury stock method.
| 2010 | 2009 | 2008 | 2011 | 2010 | 2009 | |||||||||||||||||||
Net income available to common stockholders | $ | 19,768 | $ | 28,685 | $ | 202,931 | ||||||||||||||||||
Net (loss)/ income available to common stockholders | $ | (89,496 | ) | $ | 19,768 | $ | 28,685 | |||||||||||||||||
|
|
| ||||||||||||||||||||||
Weighted average common shares outstanding | 39,235,601 | 36,940,198 | 37,552,848 | 46,118,534 | 39,235,601 | 36,940,198 | ||||||||||||||||||
Dilutive effect of RSUs | 366,077 | 259,989 | 494,286 | — | 366,077 | 259,989 | ||||||||||||||||||
|
|
| ||||||||||||||||||||||
Weighted average common shares – diluted | 39,601,678 | 37,200,187 | 38,047,134 | 46,118,534 | 39,601,678 | 37,200,187 | ||||||||||||||||||
|
|
| ||||||||||||||||||||||
Basic earnings per common share | $ | 0.50 | $ | 0.78 | $ | 5.40 | $ | (1.94 | ) | $ | 0.50 | $ | 0.78 | |||||||||||
Diluted earnings per common share | $ | 0.50 | $ | 0.77 | $ | 5.33 | $ | (1.94 | ) | $ | 0.50 | $ | 0.77 | |||||||||||
For 2010, 2009 and 2008, there were no RSUs2011, the RSU’s are considered anti-dilutive due to the loss from continuing operations which would have resulted in their exclusion from the computation of diluted earnings per common share. For 2010 and 2009, there were no RSUs considered anti-dilutive; therefore, they are included in the computation of diluted earnings per common share.
| Noncontrolling Interest in Subsidiary |
In August 2006, the Company signed an agreement with Polaris Oil Shipping Inc. (Polaris), an affiliate of Flota Petrolera Ecuatoriana (Flopec), by which Polaris acquired 49% of Mare Success S.A., a previously wholly-owned subsidiary of the Holding Company. Mare Success S.A. is the holding-company of two Panamanian registered companies which own respectively the vesselsMaya andInca. The agreement became effective on November 30, 2006. Mare Success S.A. is fully consolidated in the accompanying financial statements.
TSAKOS ENERGY NAVIGATION LIMITED AND SUBSIDIARIES
NOTES TO CONSOLIDATED FINANCIAL STATEMENTSSTATEMENTS—(Continued)
DECEMBER 31, 2011, 2010 2009 AND 20082009
(Expressed in thousands of U.S. Dollars, except for share and per share data, unless otherwise stated)
| Income Taxes |
Under the laws of the countries of the companies’Company’ incorporation and/or vessels’ registration, the companies are not subject to tax on international shipping income. However, they are subject to registration and tonnage taxes, which have been included in the Vessel operating expenses. However, the Company is not expected to be subject to United Stated Federal income tax on their gross income from the international operations of ships. In general, foreign persons operating ships to and from the United States are subject to United States Federal income tax of 4% of their United States source gross transportation income, which equals 50% of their gross income from transportation to or from the United States. The Company believes that it and its subsidiaries areis exempt from U.S. federalUnited States Federal income tax which is normally levied at a rate of 4% on 50% of the U.S.its United States source shipping revenue,gross transportation income, as each vessel-operating subsidiary is organized in a foreign country that grants an equivalent exemption to corporations organized in the United States, and derives income from the international operation of ships and satisfies the stock ownership test as defined by the Internal Revenue Code and related regulations as a result of the Company’s stock isbeing primarily and regularly traded on an established securities market in the United States, as defined by the Internal Revenue Code of the United States. Under the regulations, a Company’s stock will beis considered to be regularly traded on an established securities market if (i) one or more classes of its stock representing 50% or more of its outstanding shares, by voting power and value, is listed on the market and is traded on the market, other than in minimal quantities, on at least 60 days during the taxable year; and (ii) the aggregate number of shares of stock traded during the taxable year is at least 10% of the average number of shares of the stock outstanding during the taxable year. Other requirements such as the substantiation and reporting requirements under the regulations also must be satisfied to qualify for the exemption from United States Federal income tax.
| Commitments and Contingencies |
As at December 31, 2010,2011, the Company had under construction two DP2 suezmax shuttle tankers. The total contracted amount remaining to be paid for the two vessels under construction, plus the extra costs agreed as at December 31, 20102011 was $61,580 which is scheduled to be paid$148,712. Scheduled remaining payments as of December 31, 2011 were $55,200 payable in 2011.2012 and $93,512 in 2013.
In the ordinary course of the shipping business, various claims and losses may arise from disputes with charterers, agents and other suppliers relating to the operations of the Company���sCompany’s vessels. Management believes that all such matters are either adequately covered by insurance or are not expected to have a material adverse effect on the Company’s results from operations or financial condition.
Charters-out
The future minimum revenues, before reduction for brokerage commissions, expected to be recognized on non-cancelable time charters are as follows:
Year | Amount | |||
2012 | 176,275 | |||
2013 | 125,479 | |||
2014 | 77,724 | |||
2015 to 2023 | 172,110 | |||
|
| |||
Net minimum charter payments | 551,588 | |||
|
| |||
These amounts do not assume any off-hire.
TSAKOS ENERGY NAVIGATION LIMITED AND SUBSIDIARIES
NOTES TO CONSOLIDATED FINANCIAL STATEMENTS—(Continued)
DECEMBER 31, 2011, 2010 AND 2009
(Expressed in thousands of U.S. Dollars, except for share and per share data, unless otherwise stated)
On December 9, 2010, the Company signed two charter-party agreements with the same charterer, each for the charter of a DP 2 suezmax shuttle tanker for a period of fifteen years to commence on delivery of the vessels, expected in the first and second quarter of 2013 respectively. The revenue to be generated by these vessels has not been included in the above table.
| Financial Instruments |
| (a) | Interest rate risk: The Company’s interest rates and loan repayment terms are described in Notes |
| (b) | Concentration of credit risk: Financial Instruments consist principally of cash, trade accounts receivable, marketable securities, investments and derivatives. The Company places its temporary cash investments, consisting mostly of deposits, primarily with high credit qualified financial institutions. The Company performs periodic evaluations of the relative credit standing of those financial institutions that are considered in the Company’s investment strategy. The Company limits its credit risk with accounts receivable by performing ongoing credit evaluations of its customers’ financial condition and generally does not require collateral for its accounts receivable and does not have any agreements to mitigate credit risk. |
TSAKOS ENERGY NAVIGATION LIMITED AND SUBSIDIARIES
NOTES TO CONSOLIDATED FINANCIAL STATEMENTS
DECEMBER 31, 2010, 2009 AND 2008
(Expressed in thousands of U.S. Dollars, except for share and per share data, unless otherwise stated)
The Company limits the exposure of non-performance by counterparties to derivative instruments by diversifying among counterparties with high credit ratings, and performing periodic evaluations of the relative credit standing of the counterparties.
| (c) | Fair value:The carrying amounts reflected in the accompanying Consolidated Balance Sheet of financial assets and accounts payable approximate their respective fair values due to the short maturity of these instruments. The fair value of time charters and pool arrangements attached to |
The estimated fair values of the Company’s financial instruments, other than derivatives at December 31, 2010 and 2009 are as follows:
| Carrying Amount 2010 | Fair Value 2010 | Carrying Amount 2009 | Fair Value 2009 | |||||||||||||
Financial assets/(liabilities) | ||||||||||||||||
Cash and cash equivalents | 276,637 | 276,637 | 296,181 | 296,181 | ||||||||||||
Restricted cash | 6,291 | 6,291 | 6,818 | 6,818 | ||||||||||||
Short-term investments | 1,000 | 1,000 | 1,000 | 1,000 | ||||||||||||
Debt | 1,562,467 | 1,555,374 | 1,502,574 | 1,493,910 | ||||||||||||
TSAKOS ENERGY NAVIGATION LIMITED AND SUBSIDIARIES
NOTES TO CONSOLIDATED FINANCIAL STATEMENTSSTATEMENTS—(Continued)
DECEMBER 31, 2011, 2010 2009 AND 20082009
(Expressed in thousands of U.S. Dollars, except for share and per share data, unless otherwise stated)
The estimated fair values of the Company’s financial instruments, other than derivatives at December 31, 2011 and 2010 are as follows:
| 2011 | 2010 | |||||||||||||||
| Carrying Amount | Fair Value | Carrying Amount | Fair Value | |||||||||||||
Financial assets/(liabilities) | ||||||||||||||||
Cash and cash equivalents | 175,708 | 175,708 | 276,637 | 276,637 | ||||||||||||
Restricted cash | 5,984 | 5,984 | 6,291 | 6,291 | ||||||||||||
Marketable securities | 2,534 | 2,534 | — | — | ||||||||||||
Investments | 1,000 | 1,000 | 1,000 | 1,000 | ||||||||||||
Debt | 1,515,663 | 1,512,651 | 1,562,467 | 1,555,374 | ||||||||||||
Tabular Disclosure of Derivatives Location
Derivatives are recorded in the balance sheet on a net basis by counterparty when a legal right of setoff exists. The following tables present information with respect to the fair values of derivatives reflected in the balance sheet on a gross basis by transaction. The tables also present information with respect to gains and losses on derivative positions reflected in the statementStatement of operationsincome or in the balance sheet, as a component of Accumulated other comprehensive loss.
Fair Value of Derivative Instruments
| Asset Derivatives | Liability Derivatives | |||||||||||||||||
Derivative | Balance Sheet Location | December 31, 2010 Fair Value | December 31, 2009 Fair Value | December 31, 2010 Fair Value | December 31, 2009 Fair Value | |||||||||||||
Derivatives designated as hedging instruments | ||||||||||||||||||
| Interest rate swaps | Current portion of financial instruments - Fair value | — | — | 23,053 | 25,370 | |||||||||||||
| FINANCIAL INSTRUMENTS - FAIR VALUE, net of current portion | — | — | 24,052 | 33,693 | ||||||||||||||
Subtotal | — | — | 47,105 | 59,063 | ||||||||||||||
Derivatives not designated as hedging instruments | ||||||||||||||||||
| Interest rate swaps | Current portion of financial instruments - Fair value | — | — | 9,433 | 4,313 | |||||||||||||
| FINANCIAL INSTRUMENTS - FAIR VALUE, net of current portion | — | — | 12,386 | 7,563 | ||||||||||||||
| Bunker swaps | Current portion of financial instruments-Fair value | 3,378 | 3,334 | — | — | |||||||||||||
| FINANCIAL INSTRUMENTS - FAIR VALUE, net of current portion | 498 | 3,112 | — | — | ||||||||||||||
Subtotal | 3,876 | 6,446 | 21,819 | 11,876 | ||||||||||||||
Total derivatives | 3,876 | 6,446 | 68,924 | 70,939 | ||||||||||||||
| Asset Derivatives | Liability Derivatives | |||||||||||||||||
| December 31, 2011 | December 31, 2010 | December 31, 2011 | December 31, 2010 | |||||||||||||||
Derivative | Balance Sheet Location | Fair Value | Fair Value | Fair Value | Fair Value | |||||||||||||
Derivatives designated as hedging instruments |
| |||||||||||||||||
Interest rate swaps | Current portion of financial instruments—Fair value | — | — | 20,421 | 23,053 | |||||||||||||
| FINANCIAL INSTRUMENTS—FAIR VALUE, net of current portion | — | — | 8,414 | 24,052 | ||||||||||||||
|
|
|
|
|
|
|
| |||||||||||
Subtotal | — | — | 28,835 | 47,105 | ||||||||||||||
|
|
|
|
|
|
|
| |||||||||||
Derivatives not designated as hedging instruments |
| |||||||||||||||||
Interest rate swaps | Current portion of financial instruments—Fair value | — | — | 8,807 | 9,433 | |||||||||||||
| FINANCIAL INSTRUMENTS—FAIR VALUE, net of current portion | — | — | 9,386 | 12,386 | ||||||||||||||
Bunker swaps | Current portion of financial instruments—Fair value | 1,755 | 3,378 | — | — | |||||||||||||
| FINANCIAL INSTRUMENTS—FAIR VALUE, net of current portion | — | 498 | — | — | ||||||||||||||
|
|
|
|
|
|
|
| |||||||||||
Subtotal | 1,755 | 3,876 | 18,193 | 21,819 | ||||||||||||||
|
|
|
|
|
|
|
| |||||||||||
Total derivatives | 1,755 | 3,876 | 47,028 | 68,924 | ||||||||||||||
|
|
|
|
|
|
|
| |||||||||||
TSAKOS ENERGY NAVIGATION LIMITED AND SUBSIDIARIES
NOTES TO CONSOLIDATED FINANCIAL STATEMENTSSTATEMENTS—(Continued)
DECEMBER 31, 2011, 2010 2009 AND 20082009
(Expressed in thousands of U.S. Dollars, except for share and per share data, unless otherwise stated)
The Effect of Derivative Instruments on the Statement of Financial Performance for the Years Ended December 31, 2011, 2010 and 2009
Derivatives in Cash Flow Hedging Relationships
Gain (Loss) Recognized in Accumulated | ||||||||||||||
Derivative | Amount | |||||||||||||
| 2011 | 2010 | 2009 | ||||||||||||
Interest rate swaps | (9,624 | ) | (25,236 | ) | (8,083 | ) | ||||||||
|
|
|
|
|
| |||||||||
Total | (9,624 | ) | (25,236 | ) | (8,083 | ) | ||||||||
|
|
|
|
|
| |||||||||
Gain (Loss) Reclassified from Location | ||||||||||||||
Derivative | Amount | |||||||||||||
| 2011 | 2010 | 2009 | ||||||||||||
Interest rate swaps | Depreciation expense | (117 | ) | (42 | ) | (13 | ) | |||||||
Interest rate swaps | Interest and finance costs, net | (26,772 | ) | (29,424 | ) | (21,891 | ) | |||||||
|
|
|
|
|
| |||||||||
Total | (26,889 | ) | (29,466 | ) | (21,904 | ) | ||||||||
|
|
|
|
|
| |||||||||
Gain (Loss) Recognized in Income on Derivative (Ineffective Portion) Location | ||||||||||||||
Derivative | Amount | |||||||||||||
| 2011 | 2010 | 2009 | ||||||||||||
Interest rate swaps | Interest and finance costs, net | — | (143 | ) | 278 | |||||||||
|
|
|
|
|
| |||||||||
Total | — | (143 | ) | 278 | ||||||||||
|
|
|
|
|
| |||||||||
Derivatives Not Designated as Hedging Instruments
Derivative | Gain (Loss) Recognized on Derivative Location | Amount | ||||||||||||
| 2011 | 2010 | 2009 | ||||||||||||
Interest rate swaps | Interest and finance costs, net | (5,352 | ) | (8,356 | ) | 3,866 | ||||||||
Bunker swaps | Interest and finance costs, net | 4,260 | 356 | 8,108 | ||||||||||
|
|
|
|
|
| |||||||||
Total | (1,092 | ) | (8,000 | ) | 11,974 | |||||||||
|
|
|
|
|
| |||||||||
The following tables summarize the fair values for assets and liabilities measured on a recurring basis as of December 31, 2011 and 2010:
Recurring measurements: | December 31, 2011 | Quoted Prices in Active Markets for Identical Assets/ (Liabilities) (Level 1) | Significant Other Observable Inputs Assets/ (Liabilities) (Level 2) | Unobservable Inputs Assets/ (Liabilities) (Level 3) | ||||||||||||
Interest rate swaps | (47,028 | ) | — | (47,028 | ) | — | ||||||||||
Marketable Securities | 2,534 | 2,534 | ||||||||||||||
Bunker swaps | 1,755 | — | 1,755 | — | ||||||||||||
|
|
|
|
|
|
|
| |||||||||
| (42,739 | ) | — | (42,739 | ) | — | |||||||||||
|
|
|
|
|
|
|
| |||||||||
TSAKOS ENERGY NAVIGATION LIMITED AND SUBSIDIARIES
NOTES TO CONSOLIDATED FINANCIAL STATEMENTS—(Continued)
DECEMBER 31, 2011, 2010 AND 2009
(Expressed in thousands of U.S. Dollars, except for share and per share data, unless otherwise stated)
The Effect of Derivative Instruments on the Statement of Financial Performance for the Years Ended December 31, 2010, 2009 and 2008
Derivatives in Cash Flow Hedging Relationships
Gain (Loss) Recognized in Accumulated OCI on Derivative (Effective Portion)
Derivative | Amount | |||||||||||||
| 2010 | 2009 | 2008 | ||||||||||||
Interest rate swaps | 3,289 | 14,508 | (48,464 | ) | ||||||||||
Total | 3,289 | 14,508 | (48,464 | ) | ||||||||||
| Gain (Loss) Reclassified from Accumulated OCI into Income (Effective Portion) | ||||||||||||||
Derivative | Location | Amount | ||||||||||||
| 2010 | 2009 | 2008 | ||||||||||||
Interest rate swaps | Interest and finance costs, net | (2,113 | ) | — | — | |||||||||
Total | (2,113 | ) | — | — | ||||||||||
| Gain (Loss) Recognized in Income on Derivative (Ineffective Portion) | ||||||||||||||
Derivative | Location | Amount | ||||||||||||
| 2010 | 2009 | 2008 | ||||||||||||
Interest rate swaps | Interest and finance costs, net | (143 | ) | 278 | (1,610 | ) | ||||||||
Total | (143 | ) | 278 | (1,610 | ) | |||||||||
| Derivatives Not Designated as Hedging Instruments | ||||||||||||||
| Gain (Loss) Recognized on Derivative | ||||||||||||||
Derivative | Location | Amount | ||||||||||||
| 2010 | 2009 | 2008 | ||||||||||||
Interest rate swaps | Interest and finance costs, net | (8,356 | )�� | 3,866 | (14,119 | ) | ||||||||
Bunker swaps | Interest and finance costs, net | 356 | 8,108 | — | ||||||||||
Total | (8,000 | ) | 11,974 | (14,119 | ) | |||||||||
TSAKOS ENERGY NAVIGATION LIMITED AND SUBSIDIARIES
NOTES TO CONSOLIDATED FINANCIAL STATEMENTS
DECEMBER 31, 2010, 2009 AND 2008
(Expressed in thousands of U.S. Dollars, except for share and per share data, unless otherwise stated)
Recurring measurements: | December 31, 2010 | Quoted Prices in Active Markets for Identical Assets/ (Liabilities) (Level 1) | Significant Other Observable Inputs Assets/ (Liabilities) (Level 2) | Unobservable Inputs Assets/ (Liabilities) (Level 3) | ||||||||||||
Interest rate swaps | (68,924 | ) | — | (68,924 | ) | — | ||||||||||
Bunker swaps | 3,876 | — | 3,876 | — | ||||||||||||
|
|
|
|
|
|
|
| |||||||||
| (65,048 | ) | — | (65,048 | ) | — | |||||||||||
|
|
|
|
|
|
|
| |||||||||
The following table summarizes the fair values for assets and liabilities measured on a recurring basis as of December 31, 2010:
Recurring measurements: | December 31, 2010 | Quoted Prices in Active Markets for Identical Assets/(Liabilities) (Level 1) | Significant Other Observable Inputs Assets/(Liabilities) (Level 2) | Unobservable Inputs Assets/(Liabilities) (Level 3) | ||||||||||||
Interest rate swaps | (68,924 | ) | — | (68,924 | ) | — | ||||||||||
Bunker swaps | 3,876 | — | 3,876 | — | ||||||||||||
| (65,048 | ) | — | (65,048 | ) | — | |||||||||||
The following table presentstables present the fair values of items measured at fair value on a nonrecurring basis for the yearyears ended December 31, 2011 and 2010:
Nonrecurring basis | December 31, 2010 | Unobservable Inputs (Level 3) | December 31, 2011 | Unobservable Inputs (Level 3) | ||||||||||||
Impairment-Vessels held for use (Note 4) | $ | 10,546 | $ | 10,546 | ||||||||||||
Vessels held for sale (Note 5) | $ | 43,674 | $ | 43,674 | ||||||||||||
|
| |||||||||||||||
| $ | 10,546 | $ | 10,546 | $ | 43,674 | $ | 43,674 | |||||||||
|
| |||||||||||||||
In accordance with the provisions of the impairment of Long-Lived Assets guidance, a vessel held and used with a carrying amount of $13,623 was written down to its fair value of $ 10,546, resulting in an impairment charge of $3,077, which was included in earnings for the period.
Nonrecurring basis | December 31, 2010 | Unobservable Inputs (Level 3) | ||||||
Vessels held for use (Note 5) | $ | 10,546 | $ | 10,546 | ||||
|
|
|
| |||||
| $ | 10,546 | $ | 10,546 | |||||
|
|
|
| |||||
| Subsequent Events |
| (a) | On January |
| (b) | On January 25, 2012, the Company announced a quarterly dividend of $0.15 cents per share, which was paid on February |
| (c) |
| On |
F-31F-27