
As filed with Securities and Exchange Commission on June 24, 2011April 29, 2013
UNITED STATES
SECURITIES AND EXCHANGE COMMISSION
Washington, D.C. 20549
FORM 20-F
| ¨ | REGISTRATION STATEMENT PURSUANT TO SECTION 12(b) OR (g) OF THE SECURITIES EXCHANGE ACT OF 1934 |
OR
| x | ANNUAL REPORT PURSUANT TO SECTION 13 OR 15(d) OF THE SECURITIES EXCHANGE ACT OF 1934 |
For the fiscal year ended December 31, 20102012
OR
| ¨ | TRANSITION REPORT PURSUANT TO SECTION 13 or 15(d) OF THE SECURITIES EXCHANGE ACT OF 1934 |
OR
| ¨ | SHELL COMPANY REPORT PURSUANT TO SECTION 13 OR 15(d) OF THE SECURITIES EXCHANGE ACT OF 1934 |
Date of event requiring this shell company report
Commission file number: 001-14714

(Exact name of Registrant as specified in its charter)
Yanzhou Coal Mining Company Limited
(Translation of Registrant’s name into English)
People’s Republic of China
(Jurisdiction of incorporation or organization)
298 Fushan South Road
Zoucheng, Shandong Province
People’s Republic of China
(Address of principal executive offices)
Zhang Baocai
298 South Fushan Road
Zoucheng, Shandong Province
People’s Republic of China (273500)
Tel: (86)537 5382319
Fax: (86)537 5383311
(Name, Telephone, E-mail and/or Facsimile number and Address of Company Contact Person)
Securities registered or to be registered pursuant to Section 12(b) of the Act.
Title of each class | Name of each exchange on which registered | |
| American Depositary Shares | New York Stock Exchange | |
| Class H Ordinary Shares | New York Stock Exchange* | |
| * | Not for trading in the United States, but only in connection with the registration of American Depositary Shares, pursuant to the requirements of the Securities and Exchange Commission. |
Securities registered or to be registered pursuant to Section 12(g) of the Act.
None
(Title of class)
Securities for which there is a reporting obligation pursuant to Section 15(d) of the Act.
None
(Title of class)
Indicate the number of outstanding shares of each of the issuer’s classes of capital or common stock as of the close of the period covered by the annual report.
2,960,000,000 Domestic Shares, par value RMB1.00 per share
1,958,400,000 H Shares, par value RMB1.00 per share, including H Shares that were represented by 13,933,698 ADSs
Indicate by check mark if the registrant is a well-known seasoned issuer, as defined in Rule 405 of the Securities Act. Yes x No ¨
If this report is an annual or transition report, indicate by check mark if the registrant is not required to file reports pursuant to Section 13 or 15(d) of the Securities Exchange Act of 1934. Yes ¨ No x
Indicate by check mark whether the registrant (1) has filed all reports required to be filed by Section 13 or 15(d) of the Securities Exchange Act of 1934 during the preceding 12 months (or for such shorter period that the registrant was required to file such reports), and (2) has been subject to such filing requirements for the past 90 days. Yes x No ¨
Indicate by check mark whether the registrant has submitted electronically and posted on its corporate web site, if any, every Interactive Data File required to be submitted and posted pursuant to Rule 405 of Regulation S-T (§232.405 of this Chapter) during the preceding 12 months (or for such shorter period that the registrant was required to submit and post such files.) Yes ¨ No ¨
Indicate by check mark whether the registrant is a large accelerated filer, an accelerated filer, or a non-accelerated filer. See definition of “accelerated filer and large accelerated filer” in Rule 12b-2 of the Exchange Act. (Check one):
| Large accelerated filer x | Accelerated filer ¨ | Non-accelerated filer ¨ |
Indicate by check mark which basis of accounting the registrant has used to prepare the financial statements included in this filing:
| U.S. GAAP ¨ | International Financial Reporting Standards as issued by the International Accounting Standards Board x | Other ¨ |
If “Other” has been checked in response to the previous question, indicate by check mark which financial statement item the registrant has elected to follow. Item 17 ¨ Item 18 ¨
If this is an annual report, indicate by check mark whether the registrant is a shell company (as defined in Rule 12b-2 of the Exchange Act). Yes ¨ No x
CAUTIONARY STATEMENT REGARDING FORWARD-LOOKING STATEMENTS
This annual report includes statements of our expectations, intentions, plans and beliefs that constitute “forward-looking statements” within the meaning of Section 27A of the Securities Act of 1933, as amended (the “Securities Act”) and Section 21E of the Securities Exchange Act of 1934, as amended (the “Exchange Act”), and are intended to come within the safe harbor protection provided by those sections. The statements relate to future events or our financial performance, including, but not limited to, projections and estimates concerning the timing and success of specific projects and acquisitions. We use words such as “anticipate,” “believe,” “continue,” “could,” “estimate,” “expect,” “forecast,” “intend,” “may,” “plan,” “potential,” “predict,” “project,” “should,” “will” and the negatives of such terms or other similar expressions to identify forward-looking statements.
Without limiting the foregoing, all statements relating to our future operating results and anticipated capital expenditures, borrowings and sources of funding are forward-looking statements and speak only as of the date of this annual report. These statements are based on numerous assumptions that we believe are reasonable, but are subject to a wide range of risks, uncertainties and contingencies, which may cause actual results to differ materially from those discussed in these statements. Among the factors that could cause actual results to differ materially are:
|
price volatility for our coal and other related products;
demand for coal in the PRC and overseas markets;
difficulty in managing our rapid growth, business diversification, geographic expansion and integrating our acquisitions;
changes in legislation, regulations and policies;
the recovery offactors affecting the methanol industry and methanol prices;
our ability to reduce costs and compete effectively;
our need for, and ability to obtain, capital to finance our future expansion plans and capital expenditures;
expected increases in production capacity and utilization of new facilities;
intensity of competition;competitive landscape;
uncertainties in estimating our proven and probable coal reserves and our ability to replace and develop coal reserves;
effects of land reclamation and other liabilities;
geologic, equipment and operational risks related to mining;
changes in economic strength and political stability of countries in which we have operations or serve customers;
our ability to realize the anticipated benefits of our acquisition of equity interests or assets of coal mines;
obtaining governmental permits and approvals for our operations;
proximity of our coal resources to end-markets and costcosts of transportation;
availability, timing of delivery and cost of key supplies;
impacts of natural disasters, epidemics and safety accidents; and
other factors, including, but not limited to, those discussed in the section headed Risk Factors,under “Risk Factors”, set forth in Part D of Item 3 of this annual report.
All of the forward-looking statements made in this annual report are qualified by this cautionary statement. We cannot assure you that the actual results or developments anticipated by us will be realized or, even if substantially realized, that they will have the expected effect on us, our business or our operations. We caution you not to place undue reliance on any such forward-looking statements. Unless we are required to do so under U.S. federal securities laws or other applicable laws, we do not intend to update or revise any forward-looking statements.
DEFINITIONS AND SUPPLEMENTAL INFORMATION
As used in this annual report, references to “Yanzhou Coal,” “we,” “our,” “our Company,” “the Group” or “us” refer to Yanzhou Coal Mining Company Limited and its subsidiaries, which have been consolidated into its accounts for the purpose of the consolidated financial statements, unless the context indicates otherwise. References to “the Company” refer to Yanzhou Coal as a stand-alone statutory entity.
“ADSs” are to the American depositary shares of the Company.
“A Shares” refersare to domestic shares in the ordinary share capital of the Company, with nominal value of RMB1.00 each, which are listed on the Shanghai Stock Exchange.
“Articles of Association” refersare to our Articles of Association, as amended from time to time.
“ASX” are to ASX Limited or, as the context requires, the financial market known as the Australian Securities Exchange operated by it.
“Austar Company” refersare to Austar Coal Mine Pty Limited, a wholly owned subsidiary of Yancoal Australia Limited incorporated in Australia, which mainly engages in the mining, processing and sale of coal in Australia.
“Australia” are to the Commonwealth of Australia.
“BBSY” are to the Australian Bank Bill Swap Rate.
“Beisheng Industry and Trade” are to Zoucheng Yankuang Beisheng Industry and Trade Co., Ltd., a limited liability company incorporated in the PRC.
“Beisu Company” are to Yankuang Group Beisu Coal Mine Co., Ltd., a limited liability company incorporated in the PRC, which is a wholly owned subsidiary of Yankuang Group.
“CAGR” are to the compound annual growth rate.
“CASs” refersare to Accounting Standard for Business Enterprises (2006) and the relevant regulations and explanations issued by the Ministry of Finance of the PRC.
“CBRC” refersChina” or the “PRC” are to the People’s Republic of China, Bankingexcluding, for purposes of this annual report, the Hong Kong Special Administrative Region (“Hong Kong”), Macau Special Administrative Region and Taiwan.
“CSRC” are to the China Securities Regulatory Committee.Commission.
“CVR Shares” are to fully paid shares in the share capital of Yancoal Australia as defined in the amended merger proposal deed for the Gloucester acquisition.
“Directors” as used herein refer to our directors as discussed in Item 6 herein.
“eastern China” are collectively to Shandong Province, Jiangsu Province, Anhui Province, Zhejiang Province, Fujian Province, Jiangxi Province and Shanghai Municipality; “southern China” are to Guangdong Province, Hunan Province and Guangxi Zhuang Autonomous Region; “northern China” are to Beijing Municipality, Tianjin Municipality, Hebei Province, Shanxi Province and the Inner Mongolia Autonomous Region; and “northwestern China” are to Shaanxi Province, Gansu Province, Qinghai Province, Xinjiang Uyghur Autonomous Region and Ningxia Hui Autonomous Region.
“Excluded Assets” are the following assets which are excluded from Yancoal Australia prior to the merger with Gloucester and currently held by Yancoal International (Holding):
all of the issued shares in Tonford Pty Limited and as a result a 100% interest in the Harrybrandt Project tenements near Nebo in Queensland’s Bowen Basin (“Harrybrandt”);
all of the issued shares in Athena Coal Pty Limited and as a result a 51% interest in the Athena Coal Project joint venture in Queensland (“Athena”);
100% interest in certain Wilpeena tenements held by Yarrabee Coal Company Pty Limited in Queensland (“Wilpeena”);
all of the issued shares in each of Syntech Holdings Pty Limited and Syntech Holdings II Pty Limited and as a result a 100% interest in the Cameby Downs open-pit mine located approximately 30 kilometers from the town of Chinchilla in the Surat Basin, Queensland (“Syntech”);
all of the issued shares in Premier Coal Limited (“Premier Coal”) and Premier Char Pty Limited (“Premier Char”) and thereby, among other things, a 100% interest in the Premier Coal Mine (together, “Premier”);
all of the issued shares in Yancoal Technology Development Pty Limited; and
all of the issued shares in UCC Energy Pty Limited.
“Felix” refersare to Yancoal Resources (formerly Felix Resources Limited,Limited).
“FOB” are to Free on Board, meaning the risk passes to the buyer, including payment of all transportation and insurance costs, once goods are delivered on board of the ship by the seller, as defined in the latest edition of the International Rules for the Interpretation of Trade Terms as published by ICC Publishing SA, 38 cours Albert 1er, 75008 Paris, France from time to time or such official rules for interpretation of trade terms as issued by the ICC in substitution therefore as amended from time to time.
“Gloucester” are to Gloucester Coal Ltd., a wholly owned subsidiary of Yancoal Australia Limitedcompany incorporated in Australia, which mainly engages infocuses on the exploration, mining and sale of coal in Australia. We completed the merger with Gloucester in June 2012, which turned Gloucester a wholly-owned subsidiary of Yancoal Australia.
“Grant Thornton” refersare to a registered firm of certified public accountants in the People’s Republic of China and is the principal auditor for the purpose of reporting to the United States Securities and Exchange Commission and other relevant U.S. regulatory bodies.
“Grant Thornton Hong Kong” refersare to a firm of certified public accountants in Hong Kong, Special Administrative Region which wasoriginally practised as a former member firmpartnership under the name of Grant Thornton International LtdJingdu Tianhua and has since changed itsnow operates as a corporate practice under the name to JBPB & Co as of December 10, 2010. (original official name in Hong Kong: Grant Thornton)
“Grant Thornton Jingdu Tianhua” refers to a firm of certified public accountants in Hong Kong Special Administrative Region, which has been a member firm of Grant Thornton International Ltd since November 2010.Hong Kong Limited. This firm is the auditor for the purpose of the Hong Kong H Share listing only.
“H Shares” refersare to overseas listed foreign invested shares in the ordinary share capital of the Company, with nominal value of RMB1.00 each, which are listed on the Hong Kong Stock Exchange.HKSE.
“Haosheng Company” refersare to Inner Mongolia Haosheng Coal Mining Company Limited, a 61% ownedCompany incorporated in the PRC and a 74.82%-owned subsidiary of the Company, which engages in applying for project development and mining rights for Shilawusu Coal Field in the Inner Mongolia Autonomous Region.
“Heze Nenghua” refersare to Yanmei Heze Nenghua Company Limited, a Company incorporated in the PRC and a 98.33% owned-owned subsidiary of the Company, thatwhich manages our exploration for coal resources at the Juye Mine in Heze City, Shandong Province.
“Hong Kong Listing Rules” are to the Rules Governing the Listing of Securities on the HKSE.
“Hong Kong Stock Exchange” refersor “HKSE” are to The Stock Exchange of Hong Kong Limited.
“Hua Ju Energy” refersare to ShangdongShandong Hua Ju Energy Co., Limited, a Company incorporated in the PRC and a 95.14% owned-owned subsidiary of the Company, thatwhich engages in the generation of electric power from coal gangue and coal slurry, which are by-productsbyproducts of our coal mining process.
“IFRS” refersare to International Financial Reporting Standards, as issued by the International Accounting Standard Board.Board (“IASB”).
“JBPB” refersIndustry Guide 7” are to JBPB &the United States Securities and Exchange Commission Industry Guide 7.
“Inner Mongolia Xintai” are to Inner Mongolia Xintai Coal Mining Company Limited, a company incorporated in the PRC that is a 80%-owned subsidiary of Ordos Neng Hua, which operates the Wenyu Coal Mine in Inner Mongolia Autonomous Region.
“Jiemei Wall Materials” are to Jining Jiemei New Wall Materials Co., Ltd., a firmlimited liability company incorporated in the PRC.
“JORC Code” are to the 2004 Australasian Code for Reporting Exploration Results, Mineral Resources and Ore Reserves prepared by the Joint Ore Reserves Committee of certified public accountantsthe Australasian Institute of Mining and Metallurgy, Australian Institute of Geoscientists and Minerals Council of Australia.
“LIBOR” are to the London Interbank Offered Rate.
“MEP” are to the Ministry of Environmental Protection of the PRC.
“MLR” are to the Ministry of Land and Resources of the PRC.
“MOC” are to the Ministry of Commerce of the PRC.
“MOT” are to the Ministry of Transportation of the PRC.
“MRRT” are to the Minerals Resource Rent Tax, a tax on assessable profits generated from the extraction of coal and iron ore in Hong Kong Special Administrative Region formerly known as Grant Thornton in Hong Kong.Australia.
“NDRC” refersare to the National Development and Reform Commission of the PRC.
“NYSE” refersare to the New York Stock Exchange.Exchange, Inc.
“Ordos Neng Hua” refersare to Yanzhou Coal Ordos Neng Hua Company Limited, a wholly owned subsidiary of the Company that mainly engagesincorporated in the constructionPRC that is principally engaged in the development of a 600,000-tonne methanol project in Ordos Citycoal resources and the development of coal resourceschemical business in the Inner Mongolia Autonomous Region.
“PBOC” refersare to the People’s Bank of China.
“PRC” refersPRC government” are to the People’s Republiccentral, provincial or municipal government of China.the PRC.
“PRC Standards” are to the standards in the Solid Mineral Resource/Reserve Classification of the PRC (GB/T17766-1999).
“Promoter Shares” refersare to the domestic legal person shares held by Yankuang Group.
“SAFE” are to the State Administration of Foreign Exchange of the PRC.
“SASAC” are to the State-owned Assets Supervision and Administration Commission.
“SAT” are to the State Administration of Taxation of the PRC.
“SEC” are to the United States Securities and Exchange Commission.
“SERC” are to the State Electricity Regulatory Commission of the PRC.
“Shanxi Nenghua” refersare to Yanzhou Coal Shanxi Nenghua Company Limited, a wholly owned subsidiary of the Company incorporated in the PRC that manages our investment projects in Shanxi Province.
“Shares” refers collectively to our (i) domestic invested shares listed on the Shanghai Stock Exchange, par value RMB1.00 each (the “Domestic Shares” or “A Shares”), (ii) foreign-invested shares issued and traded in HK dollars and listed on the Hong Kong Stock Exchange, par value RMB1.00 each (the “H Shares”) and (iii) American Depositary Shares, (the “ADSs”), each of which represents ten H Shares.
“Shengyang Wood” are to Shandong Shengyang Wood Co., Ltd., a limited liability company incorporated in the PRC.
“significant subsidiary” are to a significant subsidiary as defined in Rule 1-02 of Regulation S-X under the U.S. Securities Act of 1933.
“SSE” are to the Shanghai Stock Exchange.
“Tianhao Chemicals” refersare to Shanxi Tianhao Chemicals Company Limited, a 99.89% owned-owned subsidiary of Shanxi Nenghua that mainly engagesand a Company incorporated in the PRC, which is principally engaged in the operation of a 100,000 tonne methanol project in Shanxi Province.
“Tianchi Energy” refers to Shanxi Heshun Tianchi Energy Company Limited, an 81.31% owned subsidiary of Shanxi Nenghua that mainly engages in the operation of Tianchi Coal Mine.
“Tonne” meansare to metric tonne, which is equivalent to 1,000 kilograms or approximately 2,205 pounds.
“Twelfth Five-Year Plan” refersare to the Twelfth Five-Year Plan (2011 to 2015) for National Economic and Social Development in the PRC.
“Yancoal Australia” refersare to Yancoal Australia Limited, an ASX-listed subsidiary of the Company incorporated in Australia that manages our investment projects in Australia, which is 78%-owned by the Company.
“Yancoal Canada” are to Yancoal Canada Resources Co., Ltd., a wholly owned subsidiary of the Company that manages our investment projects in Australia.Canada.
“Yancoal Resources” are to Yancoal Resources Limited, formerly known as Felix Resources Limited (“Felix”), a limited company incorporated under the laws of Australia and an indirect wholly owned subsidiary of Yancoal Australia, which mainly engages in coal mining, sales and exploration of coal.
“Yancoal International (Holding)” are to Yancoal International (Holding) Co., Limited, a wholly owned subsidiary of the Company.
“Yankuang Finance” is Yankuang Group Finance Company Limited, a joint venture established by the Yankuang Group, China Credit Trust Co., Ltd. and Yanzhou Coal Mining.
“Yankuang Group” or “Controlling Shareholder” refersare to Yankuang Group Corporation Limited (formerly known as Yanzhou Mining (Group) Corporation Limited)., a wholly state-owned enterprise established in the PRC, and the Controlling Shareholder of our Company.
“Yulin Nenghua” refersare to Yanzhou Coal Yulin Nenghua Company Limited, a wholly owned subsidiary of the Company that mainly engagesincorporated in the PRC, which is principally engaged in the operation of a 600,000-tonne methanol project in Shaanxi Province.
“Yushuwan Coal Mine Company” refers to Shaanxi Yushuwan Coal Mine Company Limited, a joint venture among the Company, Chia Tai Energy & Chemicals Company Limited and Yushen Coal Company Limited, of which we will hold a 41% equity interest. As of the date of this annual report, the establishment of Yushuwan Coal Mine Company is still pending regulatory approval.
For purpose of this annual report, “Eastern China” refers collectively to Shandong Province, Jiangsu Province, Anhui Province, Zhejiang Province, Fujian Province, Jiangxi Province and Shanghai Municipality; “Southern China” refers to Guangdong Province and Hunan Province and Guangxi Autonomous Region; and “Northern China” refers to Beijing Municipality, Tianjin Municipality, Hebei Province, Shanxi Province and the Inner Mongolia Autonomous Region.
Certain mining terms used in this annual report are defined in the “Glossary of Mining Terms”, which was included as Appendix B to our registration statement on Form F-l that we filed with the U.S. Securities and Exchange Commission. A copy of the “Glossary of Mining Terms” may be obtained upon written request to the Company.
Unless otherwise specified, all references in this annual report to “U.S. dollars”, “USD” or “US$” are to United States dollars, the lawful currency of the United States of America; all references to “HK dollars”, “HKD” or “HK$” are to Hong Kong dollars, the lawful currency of Hong Kong; all references to “AUD” or “A$” are to Australian dollars, andthe lawful currency of Australia; all references to “RMB” are to Renminbi, the lawful currency of the PRC.PRC; all references to “Euro” or “€” are to Euro, the lawful currency of the European Union; and all references to “British Pound” or “£” are to British Pound, the lawful currency of the British Kingdom. Our financial statements are denominated in RMB and, except as otherwise stated, all monetary amounts in this annual report are presented in RMB.
Solely for your convenience, certain items in this annual report contain translations of Renminbi amounts into U.S. dollars, which have been made at the rate of RMB6.6000RMB6.2301 to US$1.00, being the certified exchange rate as set forth in the H.10 weekly statistical release of the Board of Governors of the Federal Reserve BoardSystem of the United States on December 31, 2012. All such translations in this annual report are provided solely for December 30, 2010. Noyour convenience and no representation is made that the Renminbi amounts could have been or could be converted into U.S. dollars at that rate, or at all.
In this annual report, where information has been presented in percentages, or thousands or millions or billions of units, amounts may have been rounded up or down. Accordingly, the amounts identified as total amounts in tables may not be equal to the apparent sum of the amounts listed therein.
In this annual report, business taxes and surcharges have been reclassified as corresponding costs of each category of revenue to provide a more appropriate presentation. The same adjustments have been made to the corresponding prior year. The reclassification has no impact on our overall results. The attention of Shareholders and potential investors is drawn to such adjustments.
Coal resources and reserves are key elements in our Company’s investment decision-making process. The term “resources” describes a concentration or occurrence of material of intrinsic economic interest in or on the Earth’s crust in such form, quality and quantity that there are reasonable prospects for eventual economic extraction. The location, quantity, grade, geological characteristics and continuity of a mineral resource are known, estimated or interpreted from specific geological evidence and knowledge. The term “reserves” describes the recoverable quantity of coal that is commercially viable for development given the prevailing economic situation, particularly with respect to the prices of coal at the time of estimation. Reserves are estimated using a deterministic method, in which a single best estimate is made based on known geological, engineering and economic data, or a probabilistic method, in which known geological, engineering and economic data are used to generate a range of estimates and their associated probabilities. All coal reserves data are estimates, which are revised when additional information becomes available (for example, when additional coal mines commence operations or when actual coal production or extraction commences). “Proven reserves” refers to estimated quantities of coal that geological and engineering data demonstrate have reasonable certainty of being recovered in future years from known deposits under existing economic and operating conditions (that is, prices and costs at the date the estimate is made). “Probable reserves” refers to the estimated quantities of coal that geological and engineering data demonstrate have fair to good probability of being recovered in future years from known deposits under existing economic and operating conditions. To qualify as proven reserves, there should be at least a 90% probability that the quantities actually recovered will equal or exceed the proven estimate. To qualify as probable reserves, there should be at least a 50% probability that the quantities actually recovered will equal or exceed the proven plus probable estimate. Our total in-place proven and probable reserves are presented to include all mining and preparation losses that occur during the processing of coal after it is mined. Recoverable reserves refer to the amount of in-place proven and probable reserves but exclude all mining and preparation losses that occur during the processing of coal after it is mined. Our estimates of recoverable reserves are reported after deduction of actual production volume and nonaccessibe reserves up to December 31, 2012. Unless otherwise specified, coal reserves and resources are presented on a 100% basis.
A majority of our Company’s total estimated proven coal reserves are located in China and Australia. The coal reserves data in this annual report represent estimates of our Company that were calculated by its internal reserves system, which includes, among others, procedures for classifying and estimating reserves. Our Company believes that the methods it uses to estimate these reserves are consistent with definitions and classifications in Securities Act Industry Guide 7, the JORC Code and the PRC Standards, as applicable, to its PRC and Australian mines. Our Company’s internal geological team focuses on periodically estimating reserves information based on geological data obtained from various geological, geophysical and engineering studies. Estimates of net reserves are based on numerous assumptions and estimates relating to technical factors such as initial coal reserves, initial production rates, production decline rates, ultimate recovery of reserves, as well as commercial factors such as future coal prices, timing and amount of capital expenditures, and operating costs that may occur during the production life of the coal reserves.
Unless otherwise indicated, information regarding our Company’s coal production in this annual report refers to our Company’s share of production based on its percentage of equity interest in the relevant subsidiaries or coal mining projects.
PART I
| ITEM 1. | IDENTITY OF DIRECTORS, SENIOR MANAGEMENT AND ADVISERS |
Not applicable.
| ITEM 2. | OFFER STATISTICS AND EXPECTED TIMETABLE |
Not applicable.
| ITEM 3. | KEY INFORMATION |
| A. | Selected Financial Data |
Historical Financial Data
The following table sets forth selected financial data as of and for the years ended December 31, 2006, 2007, 2008, 2009, 2010, 2011 and 2010.2012. The selected income statement and cash flow data for the years ended December 31, 2008, 20092010, 2011 and 20102012 and the selectedsummary balance sheet data as of December 31, 20092010, 2011 and 20102012 have been derived from our audited consolidated financial statements included elsewhere in this annual report and should be read in conjunction with those financial statements and the accompanying notes. Unless otherwise indicated, the financial statements have been prepared and presented in accordance with IFRS, as issued by the International Accounting Standards Board. Our selected income statement and cash flow data for the years ended December 31, 2006 and 2007 and our selected balance sheet data as of December 31, 2006, 2007 and 2008 have been derived from our audited consolidated financial statements for those periods and dates, which are not included in this annual report.IASB.
| As of and for the Year Ended December 31, | ||||||||||||||||||||||||
| 2006 | 2007 | 2008 | 2009 | 2010 | 2010 | |||||||||||||||||||
| RMB | RMB | RMB | RMB | RMB | US$ | |||||||||||||||||||
| (in millions except per Share and per ADS data) | ||||||||||||||||||||||||
INCOME STATEMENT DATA | ||||||||||||||||||||||||
Total revenue(1) | 13,224.3 | 15,403.7 | 25,287.4 | 20,677.1 | 33,944.3 | 5,143.1 | ||||||||||||||||||
Gross sales of coal | 13,058.8 | 15,193.0 | 24,933.3 | 19,947.8 | 32,590.9 | 4,938.0 | ||||||||||||||||||
Railway transportation services income | 165.5 | 210.7 | 255.7 | 267.3 | 513.3 | 77.8 | ||||||||||||||||||
Gross sales of electricity power | — | — | 59.8 | 187.5 | 185.5 | 28.1 | ||||||||||||||||||
Gross sales of methanol | — | — | 38.6 | 258.9 | 629.3 | 95.3 | ||||||||||||||||||
Gross sales of heat supply | — | — | — | 15.6 | 25.2 | 3.8 | ||||||||||||||||||
Transportation costs of coal | (936.6 | ) | (549.8 | ) | (508.7 | ) | (403.3 | ) | (1,160.5 | ) | (175.8 | ) | ||||||||||||
Cost of sales and service provided(1) | (6,470.4 | ) | (7,625.2 | ) | (12,201.1 | ) | (10,590.0 | ) | (16,801.3 | ) | (2,545.7 | ) | ||||||||||||
Cost of electricity power | — | — | (88.3 | ) | (190.8 | ) | (195.5 | ) | (29.6 | ) | ||||||||||||||
Cost of methanol | — | — | (37.8 | ) | (352.9 | ) | (716.8 | ) | (108.6 | ) | ||||||||||||||
Cost of heat supply | — | — | — | (9.7 | ) | (12.5 | ) | (1.9 | ) | |||||||||||||||
Gross profit | 5,817.3 | 7,228.7 | 12,451.5 | 9,130.4 | 15,057.6 | 2,281.5 | ||||||||||||||||||
Selling, general and administrative expenses | (2,230.1 | ) | (2,854.7 | ) | (3,832.0 | ) | (3,820.2 | ) | (5,093.9 | ) | (771.8 | ) | ||||||||||||
Share of income (loss) of an associate | — | (2.4 | ) | (67.4 | ) | 109.8 | 8.9 | 1.3 | ||||||||||||||||
Other income | 165.8 | 198.9 | 351.5 | 311.0 | 3,108.1 | 470.9 | ||||||||||||||||||
Interest expense | (26.3 | ) | (27.2 | ) | (38.4 | ) | (45.1 | ) | (603.3 | ) | (91.4 | ) | ||||||||||||
Profit before income taxes | 3,726.7 | 4,543.3 | 8,865.2 | 5,685.8 | 12,477.3 | 1,890.5 | ||||||||||||||||||
Income taxes | (1,354.7 | ) | (1,315.5 | ) | (2,385.6 | ) | (1,553.3 | ) | (3,171.0 | ) | (480.5 | ) | ||||||||||||
Profit for the year | 2,372.0 | 3,227.8 | 6,479.6 | 4,132.5 | 9,306.3 | 1,410.0 | ||||||||||||||||||
Profit attributable to our equity holders | 2,373.0 | 3,230.5 | 6,488.9 | 4,117.3 | 9,281.4 | 1,406.3 | ||||||||||||||||||
Earnings per Share | 0.48 | 0.66 | 1.32 | 0.84 | 1.89 | 0.3 | ||||||||||||||||||
Earnings per ADS | 4.82 | 6.56 | 13.19 | 8.37 | 18.87 | 2.9 | ||||||||||||||||||
Operating income per Share before income tax | 0.76 | 0.92 | 1.80 | 1.16 | 2.54 | 0.4 | ||||||||||||||||||
Profit from continuing operation per ADS before income tax | 7.58 | 9.24 | 18.02 | 11.56 | 25.37 | 3.8 | ||||||||||||||||||
CASH FLOW DATA | ||||||||||||||||||||||||
Net cash from operating activities | 3,767.2 | 4,558.6 | 7,095.5 | 6,520.1 | 5,399.8 | 818.2 | ||||||||||||||||||
Net cash from (used in) investing activities | (3,625.5 | ) | (3,790.9 | ) | (2,091.5 | ) | (24,842.9 | ) | (5,884.4 | ) | (891.6 | ) | ||||||||||||
Net cash from (used in) financing activities | (1,291.5 | ) | (1,018.7 | ) | (921.7 | ) | 18,503.7 | 1,360.5 | 206.1 | |||||||||||||||
BALANCE SHEET DATA | ||||||||||||||||||||||||
Total current assets | 9,871.9 | 9,908.2 | 14,994.4 | 20,000.9 | 24,281.4 | 3,679.0 | ||||||||||||||||||
Total current liabilities | 3,828.0 | 4,099.5 | 5,297.0 | 10,410.4 | 10,133.9 | 1,535.4 | ||||||||||||||||||
Net current assets | 6,043.9 | 5,808.7 | 9,697.4 | 9,590.5 | 14,147.5 | 2,143.6 | ||||||||||||||||||
Property, plant and equipment | 12,139.9 | 13,524.6 | 14,149.4 | 18,877.1 | 19,874.6 | 3,011.3 | ||||||||||||||||||
Total assets | 23,458.7 | 26,187.4 | 32,338.6 | 62,432.6 | 72,755.9 | 11,023.6 | ||||||||||||||||||
Long-term bank borrowing | 330.0 | 258.0 | 176.0 | 20,911.7 | 22,400.8 | 3,394.1 | ||||||||||||||||||
Equity attributable to our equity holders | 18,931.8 | 21,417.5 | 26,755.1 | 29,151.8 | 37,331.9 | 5,656.3 | ||||||||||||||||||
DIVIDEND DECLARED PER SHARE | ||||||||||||||||||||||||
A and H Shares | 0.22 | 0.20 | 0.17 | 0.40 | 0.59 | 0.09 | ||||||||||||||||||
ADSs | 2.20 | 2.00 | 1.70 | 4.00 | 5.9 | 0.9 | ||||||||||||||||||
| As of and for the Year Ended December 31, | ||||||||||||||||||||||||
| 2008 | 2009 | 2010 | 2011 | 2012 | 2012 | |||||||||||||||||||
| RMB | RMB | RMB | RMB | RMB | US$ | |||||||||||||||||||
| (in millions except per Share and per ADS data) | ||||||||||||||||||||||||
INCOME STATEMENT DATA | ||||||||||||||||||||||||
Total revenue1 | 25,287.4 | 20,677.1 | 33,944.3 | 47,065.8 | 58,146.2 | 9,333.1 | ||||||||||||||||||
Gross sales of coal | 24,933.3 | 19,947.8 | 32,590.9 | 45,181.2 | 56,200.6 | 9,020.8 | ||||||||||||||||||
Railway transportation service income | 255.7 | 267.3 | 513.3 | 476.9 | 464.1 | 74.5 | ||||||||||||||||||
Gross sales of electricity power | 59.8 | 187.5 | 185.5 | 328.0 | 323.6 | 51.9 | ||||||||||||||||||
Gross sales of methanol | 38.6 | 258.9 | 629.3 | 1,059.3 | 1,118.0 | 179.5 | ||||||||||||||||||
Gross sales of heat supply | — | 15.6 | 25.2 | 20.5 | 39.9 | 6.4 | ||||||||||||||||||
Transportation costs of coal | (508.7 | ) | (403.3 | ) | (1,160.5 | ) | (1,248.3 | ) | (2,104.2 | ) | (337.7 | ) | ||||||||||||
Cost of sales and service provided | (12,201.1 | ) | (10,590.0 | ) | (16,801.3 | ) | (25,725.3 | ) | (41,961.5 | ) | (6,735.3 | ) | ||||||||||||
Cost of electricity power | (88.3 | ) | (190.8 | ) | (195.5 | ) | (362.5 | ) | (330.8 | ) | (53.1 | ) | ||||||||||||
Cost of methanol | (37.8 | ) | (352.9 | ) | (716.8 | ) | (930.2 | ) | (911.2 | ) | (146.3 | ) | ||||||||||||
Cost of heat supply | — | (9.7 | ) | (12.5 | ) | (13.8 | ) | (25.1 | ) | (4.0 | ) | |||||||||||||
|
|
|
|
|
|
|
|
|
|
|
| |||||||||||||
Gross profit | 12,451.5 | 9,130.4 | 15,057.6 | 18,785.8 | 12,813.3 | 2,056.7 | ||||||||||||||||||
Selling, general and administrative expenses | (3,832.0 | ) | (3,820.2 | ) | (5,093.4 | ) | (6,570.2 | ) | (7,987.6 | ) | (1,282.1 | ) | ||||||||||||
Share of profit of associates | (67.4 | ) | 109.8 | 8.9 | 68.9 | 142.0 | 22.8 | |||||||||||||||||
Share of loss of jointly controlled entities | — | — | (0.5 | ) | — | (103.2 | ) | (16.6 | ) | |||||||||||||||
Other income | 351.5 | 311.0 | 3,108.1 | 1,075.8 | 2,930.4 | 470.4 | ||||||||||||||||||
Interest expense | (38.4 | ) | (45.1 | ) | (603.3 | ) | (839.3 | ) | (1,448.7 | ) | (232.5 | ) | ||||||||||||
|
|
|
|
|
|
|
|
|
|
|
| |||||||||||||
Profit before income taxes | 8,865.2 | 5,685.8 | 12,477.3 | 12,521.0 | 6,346.2 | 1,018.6 | ||||||||||||||||||
Income taxes | (2,385.6 | ) | (1,553.3 | ) | (3,171.0 | ) | (3,545.4 | ) | (123.9 | ) | (19.9 | ) | ||||||||||||
Profit for the year | 6,479.6 | 4,132.5 | 9,306.3 | 8,975.6 | 6,222.2 | 998.7 | ||||||||||||||||||
|
|
|
|
|
|
|
|
|
|
|
| |||||||||||||
Profit attributable to our equity holders | 6,488.9 | 4,117.3 | 9,281.4 | 8,928.1 | 6,219.0 | 998.2 | ||||||||||||||||||
Earnings per Share | 1.32 | 0.84 | 1.89 | 1.82 | 1.26 | 0.2 | ||||||||||||||||||
Earnings per ADS | 13.19 | 8.37 | 18.87 | 18.15 | 12.64 | 2.0 | ||||||||||||||||||
Operating income per Share before income tax | 1.80 | 1.16 | 2.54 | 2.55 | 1.29 | 0.21 | ||||||||||||||||||
Profit from continuing operation per ADS before income tax | 18.02 | 11.56 | 25.37 | 25.46 | 12.90 | 2.07 | ||||||||||||||||||
CASH FLOW DATA | ||||||||||||||||||||||||
Net cash from operating activities | 7,095.5 | 6,520.1 | 5,399.8 | 17,977.3 | 6,503.6 | 1,043.9 | ||||||||||||||||||
Net cash from (used in) investing activities | (2,091.5 | ) | (24,842.9 | ) | (5,884.4 | ) | (25,611.1 | ) | (3,187.4 | ) | (511.6 | ) | ||||||||||||
Net cash from (used in) financing activities | (921.7 | ) | 18,503.7 | 1,360.5 | 9,441.1 | 1,145.1 | 183.8 | |||||||||||||||||
BALANCE SHEET DATA | ||||||||||||||||||||||||
Total current assets | 14,994.4 | 20,000.9 | 24,281.4 | 30,431.1 | 30,282.4 | 4,860.7 | ||||||||||||||||||
Total current liabilities | 5,297.0 | 10,410.4 | 10,133.9 | 34,721.5 | 28,622.7 | 4,594.3 | ||||||||||||||||||
Net current assets/(liabilities) | 9,697.4 | 9,590.5 | 14,147.5 | (4,290.4 | ) | 1,659.7 | 266.4 | |||||||||||||||||
Property, plant and equipment | 14,149.4 | 18,877.1 | 19,874.6 | 31,273.8 | 39,503.1 | 6,340.7 | ||||||||||||||||||
Total assets | 32,338.6 | 62,432.6 | 72,755.9 | 97,151.6 | 122,702.3 | 19,695.1 | ||||||||||||||||||
Long-term bank borrowing | 176.0 | 20,911.7 | 22,400.8 | 14,869.3 | 33,283.8 | 5,342.4 | ||||||||||||||||||
Equity attributable to our equity holders | 26,755.1 | 29,151.8 | 37,331.9 | 42,634.5 | 45,826.4 | 7,355.6 | ||||||||||||||||||
DIVIDEND PER SHARE | ||||||||||||||||||||||||
A and H Shares | 0.40 | 0.25 | 0.59 | 0.57 | 0.36 | 0.06 | ||||||||||||||||||
ADS | 4.0 | 2.5 | 5.9 | 5.7 | 3.6 | 0.58 | ||||||||||||||||||
| In this annual report, business taxes and surcharges have been reclassified as corresponding costs of each category of revenue to provide a more appropriate presentation. The same adjustments have been made to the corresponding prior year. The reclassification has no impact on the overall results of the Group. The attention of Shareholders and potential investors is drawn to such adjustments. For details, please see Note 2 of the consolidated financial statements attached to this annual report. |
Number of Shares Outstanding
The following table sets forth the number of our A Shares, H Shares and ADSs outstanding as of the dates indicated.
| As of December 31, | ||||||||||||||||||||
| 2006 | 2007 | 2008 | 2009 | 2010 | ||||||||||||||||
A Shares | 2,960,000,000 | 2,960,000,000 | 2,960,000,000 | 2,960,000,000 | 2,960,000,000 | |||||||||||||||
H Shares | 1,958,400,000 | 1,958,400,000 | 1,958,400,000 | 1,958,400,000 | 1,958,400,000 | |||||||||||||||
ADSs | 5,461,179 | 3,338,368 | 18,919,105 | 19,403,533 | 19,744,158 | |||||||||||||||
A Shares H Shares ADS As of December 31, 2008 2009 2010 2011 2012 2,960,000,000 2,960,000,000 2,960,000,000 2,960,000,000 2,960,000,000 1,958,400,000 1,958,400,000 1,958,400,000 1,958,400,000 1,958,400,000 18,919,105 19,403,533 19,744,158 13,933,698 12,915,380
Exchange Rate Information
The following table sets forth information concerning exchange rates between the Renminbi and the U.S. dollar for the periods indicated. These rates are provided solely for your convenience and are not necessarily the exchange rates that we use in this annual report or will use in the preparation of our periodic reports or any other information to be provided to you. The source of these rates is the Federal Reserve H.10 Statistical Release.
Period | Period End | Average(1) | High | Low | ||||||||||||
| (expressed in RMB per US$) | ||||||||||||||||
2005 | 8.0702 | 8.1826 | 8.2765 | 8.0702 | ||||||||||||
2006 | 7.8041 | 7.9579 | 8.0702 | 7.8041 | ||||||||||||
2007 | 7.2946 | 7.5806 | 7.8127 | 7.2946 | ||||||||||||
2008 | 6.8225 | 6.9193 | 7.2946 | 6.7800 | ||||||||||||
2009 | 6.8259 | 6.8295 | 6.8470 | 6.8176 | ||||||||||||
2010 | 6.6000 | 6.7603 | 6.8330 | 6.6000 | ||||||||||||
October | 6.6707 | 6.6678 | 6.6912 | 6.6397 | ||||||||||||
November | 6.6670 | 6.6538 | 6.6892 | 6.6330 | ||||||||||||
December | 6.6000 | 6.6497 | 6.6745 | 6.6000 | ||||||||||||
2011 | ||||||||||||||||
January | 6.6017 | 6.5964 | 6.6364 | 6.5809 | ||||||||||||
February | 6.5713 | 6.5761 | 6.5965 | 6.5520 | ||||||||||||
March | 6.5483 | 6.5645 | 6.5743 | 6.5483 | ||||||||||||
April | 6.4900 | 6.5224 | 6.5477 | 6.4900 | ||||||||||||
May | 6.4786 | 6.4957 | 6.5073 | 6.4786 | ||||||||||||
June (through June 17, 2011) | 6.4700 | 6.4785 | 6.4830 | 6.4700 | ||||||||||||
Period | Period End | Average(1) | High | Low | ||||||||||||
| (expressed in RMB per US$) | ||||||||||||||||
2006 | 7.8041 | 7.9579 | 8.0702 | 7.8041 | ||||||||||||
2007 | 7.2946 | 7.5806 | 7.8127 | 7.2946 | ||||||||||||
2008 | 6.8225 | 6.9193 | 7.2946 | 6.7800 | ||||||||||||
2009 | 6.8259 | 6.8295 | 6.8470 | 6.8176 | ||||||||||||
2010 | 6.6000 | 6.7603 | 6.8330 | 6.6000 | ||||||||||||
2011 | 6.2939 | 6.4475 | 6.6364 | 6.2939 | ||||||||||||
2012 | 6.2301 | 6.3093 | 6.3449 | 6.2221 | ||||||||||||
October | 6.2265 | 6.2338 | 6.2454 | 6.2221 | ||||||||||||
November | 6.2301 | 6.2328 | 6.2502 | 6.2251 | ||||||||||||
December | 6.2186 | 6.2215 | 6.2303 | 6.2134 | ||||||||||||
2013 | ||||||||||||||||
January | 6.2213 | 6.2323 | 6.2438 | 6.2213 | ||||||||||||
February | 6.2301 | 6.3093 | 6.3449 | 6.2221 | ||||||||||||
March | 6.2108 | 6.2154 | 6.2246 | 6.2105 | ||||||||||||
April (through April 19, 2013) | 6.1772 | 6.1926 | 6.2078 | 6.1720 | ||||||||||||
| (1) | Determined by averaging the rates on the last business day of each month during the respective period, except for monthly averages, which are determined by averaging the rates on each business day of the month. |
On June 17, 2011,April 19, 2013, the noon buying rate was US$1.00 = RMB6.4700.RMB6.1772.
| B. | Capitalization and Indebtedness |
Not applicable.
| C. | Reasons for the Offer and Use of Proceeds |
Not applicable.
| D. | Risk Factors |
Our business, financial condition and results of operations are subject to various changing business, industry, competitive, economic, political and social conditions in China and worldwide. In addition to the factors discussed elsewhere in this annual report, the following are some of the important factors that could cause our actual results to differ materially from those projected in any forward-looking statements.
Risks Relating to Our Business and Industry
Our business and profitability are affected by global economic conditions.
The coal industry depends on general economic conditions, including the strengthconditions of global and local economies. In 2008 and 2009,For the past several years, the economies of the United States, Europe and certain countries in Asia experienced a severe and prolonged recession and China experienced a slowdown in overall economic growth, which has led to a reduction in economic activity. Moreover, the economic conditions in Europe remain uncertain. In 2010,this regard, following GDP growth of 9.2% in 2011 and 7.8% in 2012, according to statistics published by the average selling priceNational Bureau of Statistics of the PRC, the PRC maintained its GDP growth target for 2013 at approximately 7.5% in the face of continuing global turbulence and pressing domestic demand for economic restructuring. In the first quarter of 2013, the PRC’s GDP grew at an annualized rate of 7.7%, according to statistics published by the National Bureau of Statistics of the PRC. Australia’s overall economy, as well as its export-oriented coal industry, has also been adversely affected by these developments. Australia experienced GDP growth of 3.4% in 2012 and, according to the Reserve Bank of Australia, Australia’s GDP was expected to grow by 3.0% in 2013, lower than its actual growth in 2012. From late 2008 to mid-2009, the export prices of thermal coal in the PRC experienced fluctuations dueand Australia each decreased significantly. Since late 2009, the export prices of thermal coal in China and Australia have recovered but continue to globalfluctuate. In addition, in the period from February 2011 to April 2012, demand for semi-hard coking coal declined considerably and local economic conditions. In spitedemand for semi-soft coking coal also declined.
We expect that the export coal market and, in particular, the semi-soft coking coal segment of certainthe market, will remain weak for the balance of the current financial year. Despite policies and initiatives implemented by the PRC government to alternately stimulate and then moderate economic conditions, we cannot assure you that another recession would not occur or that a decline in overall economic conditions would notmay recur in the future. In the event of such a recession or decline in economic conditions, whether globally, locally in the PRC or Australia or in our other major markets, our business and profitability may be materially and adversely affected. We cannot assure you thatIn addition, increases in inflation and the consumer price index may put pressure on governments to maintain caps on the price of coal and to subsidize power generation companies. At various times, the PRC government will notor Australian governments may implement tightening policies to managestimulate or slow the growth of the economy or to control an overheated economy in the future which may, in turn, affect coal prices. In the event that this occurs, our business, results of operations and profitabilityfinancial condition may be materially and adversely affected.
Our business, and results of operations and financial condition depend on the volatile domestic and international coal markets.
Coal sales accounted for 96.0%, 96.0% and 96.7% of our revenues in 2010, 2011 and 2012, respectively, and we expect our coal sales to continue to account for a substantial portion of our revenue. As we derive a substantial portion of our revenue from sales of coal and coal-related products, our business and operating results depend heavily upon supply and demand for coal and coal-related products in the domestic and international coal markets. Accordingly, we are vulnerable to downturns in the demand for coal, increases in supply of coal through new or expanded coal production and declines in coal prices.
The prices of coal and coal-related products have historically been historically volatile and fluctuate in response to general economic conditions, supply and demand and the level of global inventories. FromIn 2012, the fourth quarter of 2008 through early 2009, the demand for coal decreased significantly as a result of thesluggish global financial crisis. Since 2009,economy has led to weak demand for coal in Chinaboth the PRC and worldwide, alongthe overseas markets and the average selling price of our coal products decreased as compared with coal prices, has substantially recovered.that of 2011. The average selling price of our coal products was RMB663.9, RMB529.2RMB663.5, RMB707.7 and RMB663.5RMB599.3 per tonne in 2008, 20092010, 2011 and 2010, respectively. However, we2012, respectively, representing a drop of RMB108.4 per tonne from 2011 to 2012, which in turn had a direct and adverse impact on our sales income. Our operating profit also decreased by 30.7% from 2011 to 2012. We cannot assure you that demand for and prices of coal will not further decline, again, the occurrence of which may adversely affect our business, results of operations.operations and financial condition.
Global coal demand correlates strongly with the global economy and the performance of coal-consuming industries, including but not limited to the power generation, chemical, metallurgy and construction materials industries. In addition, the availability and prices of alternative energy sources to coal, as well as international shipping costs, also affect coal demand. Coal supply on the other hand, is primarily affected by the geographicalgeographic location of coal reserves, transportation capacity, the level of domestic and international coal supplies and the type, quality and price of coal from othervarious producers. Developments in the international coal market may adversely affect our overseas sales, which we expect to increase following the expansion of our Australian operations.sales. A significant increase in global coal supply or reduction in demand for coal from key consuming industries may decrease coal prices, which in turn may significantly reduce our profitability and adversely affect our business, and results of operations.operations and financial condition.
The PRC government’s new policy on removing state-sponsored contracts and ceasing to reserve allocations of railway capacity for thermal coal transportation may materially and adversely affect our business, results of operations, financial condition and prospects.
Historically, power utilities purchased coal either on the spot market or through the annual NDRC coordinated contracts. The prices negotiated under this system were lower than prevailing market prices on the spot market and many producers were unwilling to fulfill their contracts when market prices were higher than contract prices. In December 2012, the NDRC announced a policy to change the Chinese domestic thermal coal pricing mechanism. The stated goal of the policy is to eliminate the state-controlled annual contracts which currently govern a large share of domestic coal sales. At the same time, the NDRC has also ceased reserving allocations of railway capacity for thermal coal transportation. Similarly, the stated aim of the new railway capacity ruling is to force coal producers and power utilities to compete with other railway users and negotiate directly with local railway departments.
By removing these state-sponsored contracts, the intended aim of the NDRC policy change is to expose domestic thermal coal pricing to market forces and encourage coal suppliers and power utilities to reach medium- to long-term contracts. The policy change of thermal coal transportation capacity reservation is intended to encourage sales to local customers and stable supply agreements between miners and power plants. However, we cannot assure you that we will obtain enough coal sale contracts without the coordination of the NDRC, or obtain sufficient railway capacity for thermal coal transportation under the new policy, to sustain our historical operating results. As a result, our business, results of operations, financial condition and prospects may be materially and adversely affected.
OurWe derive a significant portion of our revenue from a limited number of customers, and the loss of, or a significant reduction in, sales to any of these customers could materially and adversely affect our business, results of operations and financial condition.
For the years ended December 31, 2010, 2011 and 2012, our top five customers accounted for 24.7%, 19.4% and 19.4% of our revenue, respectively, and sales to our largest customer accounted for 13.0%, 8.5% and 6.3% of our revenue, respectively. We expect that our results of operations will continue to depend on sales to a limited number of customers for the foreseeable future. We may not be able to rely on these customers for revenue generation in the future. We may lose these customers due to the intensified competition. See “— Competition in the PRC and the international coal industry is dependentintensifying, and we may not be able to maintain our competitiveness.” We may also experience reduction, delay or cancellation of orders from one or more of our significant customers, and any decline in the businesses of our customers could also reduce their purchases of our products. The loss of sales to any of these customers could have a material adverse effect on short-termour business, results of operations and financial condition.
We face risks associated with our sales contracts and lettersstrategic framework agreements, which may materially and adversely affect our business, results of intent.operations and financial condition.
In 2008, 2009 and 2010, the majoritySales of our coal produced in China are made primarily on the spot market or pursuant to strategic framework agreements and to a lesser extent, pursuant to sales income (the invoiced amountcontracts. Sales of our coal sold net of returns and discounts) of coal was derived from short-term sales contracts or letters of intent. Theseproduced in Australia are made pursuant to sales contracts and lettersspot market sales. Our PRC sales contracts generally have terms of intentone year and specify the price, quantity and quality of coal and delivery schedule of coal. Our Australian sales contracts generally have terms of one year and specify the quantity and quality of coal and delivery schedule of purchases for a termcoal, while the purchase price is determined every month or quarter by our customer and us, subject to market conditions. In 2012, due to the volatile international coal markets, customers purchasing our coal produced in Australia generally not exceeding one year. Ifentered into quarterly contracts with us. As such, if we experience a weak coal pricing environment that results in a decline in coal prices at the time of actual sale,delivery, our revenue and profitability wouldmay be reduced.
Historically,materially and adversely affected. In addition, our customers have performed a significant majority of their purchase obligations under the sales contracts and letters of intent with us. However, a significant increase in the proportion of unperformed sales contracts and letters of intent or unrealized sales could have a material adverse impact on our results of operations ifare not automatically renewable. If we are not able to locate alternative purchasersmaintain our sales contracts with our major customers on terms commercially acceptable to us or at all, our business, results of operations and financial condition may be adversely affected.
In addition, the strategic framework agreements used in the sales of our coal produced in China generally only specify the quantity and quality of coal, while the purchase price is determined in the annual or monthly sales contracts we enter into under the strategic framework agreements. As a result, we are subject to market conditions at the similar leveltime of profitability. Furthermore, any changes in the cost or availability of labor, raw materials or transportation or volatility in foreign exchange rates during the period between the formation and performance of these sales contracts andactual delivery. Moreover, as letters of intent are not legally binding, customers entering into letters of intent with us are not obligated to purchase the agreed quantity of products, or any products at all. In addition, in accordance with industry practice, our customers do not enter into long-term contracts (those exceeding one year) with us. Therefore, we do not have long-term commitments from our customers to purchase our products, and our customers may reduce or stop purchasing products from us for various reasons, which may also materially and adversely affect our ability to perform our contractual obligations or our profitability.business, results of operations and financial condition.
Our products may be subjectWe rely primarily on ports, highways and third party operated railway systems in the PRC and Australia to governmental price control measures,deliver our coal, any major disruption of which may adversely affect our profitability.business, results of operations and financial condition.
Although the PRC government has implemented measures to overhaul historical price and supply controls and continues to support the development of a market-orientated PRC coal market, it may intervene in the domestic coal market from time to time through the use of macroeconomic measures to stabilize the market and achieve national social and economic goals. For example, the State Council of China and the NDRC published announcements in November and December 2010, respectively, imposing price caps on coal sold pursuant to key thermal coal supply agreements imposed with reference to the coal prices of the agreements entered into by the relevant enterprises in 2010. Such price caps were reemphasized by the NDRC in announcements issued in April 2011. These price-intervention measures may limit the degree of control we have over certain aspects of our business and may have a negative impact on our operations, pricing and profitability.
We rely primarily on the PRC nationalhighways and our own railway network, as well as third party operated railway system, to deliver our products.
We rely on the PRC national railway system, as well as our railway network, to deliver coal to customers.customers in China. We generated approximately 33.6%, 32.1% and 22.7% of our sales income (the invoiced amountalso deliver small volumes of coal sold net of returnsthrough ports and discounts) ofcanals. Coal resources and production in China are mainly located in northern and northwestern China, while coal products soldconsumption is primarily in eastern and transported on the PRC state-ownedsouthern China. As a result, coal suppliers must transport coal via third party operated railway system (exclusive of coal transported on our own railway network) in 2008, 2009 and 2010, respectively.systems from major supply areas to major demand areas. Although the PRC government has taken steps to upgrade and expand the national railway system,systems, its current capacity is not sufficient to meet the entire domestic coal transportation requirement.demand resulting from regional imbalances. Even though our domestic customers are mainly located in Easterneastern China, where the railway system is relatively more developed than other regions of China, our ability to deliver coal is still restricted by the transportation capacity. Pursuant to the Twelfth Five-Year Plan, the PRC government plans to construct several railways for coal transportation in cities in northern China and northwestern China, such as Shanxi Province, Shaanxi Province and the Inner Mongolia Autonomous Region. However, as it will take a significant amount of time for the relevant PRC authorities to grant approvals and permits and to complete the construction of the railway, we anticipate that we will continue to face challenges with respect to access to railway transportation. In addition to railway transportation, we use major coal shipping ports along the coast of China to deliver coal to customers located along the coastal regions of China. However, we cannot assure you that we willmay not be able to continue securing sufficient railway andor port capacity to deliver our coal or that we will notand may experience any material delivery delays or substantial increases in transportation costs as a result of insufficient railway capacity. For details about
In Australia, we rely substantially on third party operated railway networks to deliver coal to ports in New South Wales and Queensland, for onward shipping to our sales incomecustomers. We generally enter into transportation agreements with national and privately operated railway networks, rail haulage operators and ports to secure transportation capacity, generally for terms of coal, please referfive to “Item 5. Operatingten years and Financial Review and Prospects — Coal Business”.
The coal reserve data in this annual report are only estimates, which may differ materially from actual results.
Our coal reserve data are only estimates, which may differ materially from actual reserves. Our reserve estimates may change substantially if new information becomes available. There are inherent uncertainties in estimating reserves, which requiregenerally on a “take or pay” basis. As the consideration of a number of factors, assumptions and variables, many of which may be beyond our control and cannot be ascertained despite due investigation. Our actual results of operations may differ materially from our long-term business and operational plans, which aretransportation capacity secured by these agreements is based on assumed production volume, we may not have sufficient capacity if our actual production volume exceeds our estimated production volume. Conversely, we may have excess transportation capacity (which, in the case of “take or pay” agreements, we will have to pay for even if unused) if our actual production volume is lower than our estimated production volume. In 2012, the sluggish global economy led to weak demand for coal reserve estimates.in both the PRC and overseas markets. We expect that global economic conditions will remain uncertain and international coal markets to continue to be volatile in 2013, and as a result, we cannot assure you that we will fully use the transportation capacity secured on a “take or pay” basis. In addition, we may not adjustbe able to secure sufficient transportation capacity to deliver our coal reserve estimates downward in the future and may experience material delivery delays or substantial increases in such event,transportation costs as a result of insufficient transportation capacity, which may also adversely affect our long-term productionbusiness, results of operations and the useful life of our mines may be materially and adversely affected.financial condition.
Competition in the PRC and the international coal industry is intensifying, and we may not be able to maintain our competitiveness.
We face competition in all aspects of our business, including pricing, production capacity, coal quality and specifications, transportation capacity, cost structure and brand recognition. Our coal business competes in the domestic and international markets with other large domestic and international coal producers. OngoingThe ongoing consolidation in the PRC and Australian coal industry has increased the level of competition we face in China.our core business. In addition, countries such as Mongolia and U.S. have significantly increased their coal exports, which has intensified the competition among international coal exporters. Our competitors may have higher production capacities, stronger brand names and more financial, marketing, distribution and other resources than we do.
We may not be able to maintain our competitiveness if changes or developments in the market weaken our existing competitive advantages. We cannot assure you that efforts takenEfforts by our competitors to improve the quality of their coal will not erode themay render obsolete or irrelevant any quality advantage we have over them. Continual improvements in China’s transportation infrastructure, particularly the national railway transportation network, may diminish our proximity advantage of being located in Eastern China, the region with the highest coal demand in the PRC. Our principal competitors are located predominately in Shanxi Province, Shaanxi Province and the Inner Mongolia Autonomous Region, where there have been occasional rail capacity shortages and the costs of transporting coalfailure to Eastern China are more significant. However, the PRC government has constructed and plans to continue constructing additional railways to transport coal from northern and northwestern China to Eastern China. The completion of these railway projects may increase the supply of coal to customers in Eastern China, increasing the effective supply of coal, whichcompete effectively may have a material adverse impact on our business, results of operations and financial condition.
We may not be able to meet our capital expenditure requirements or secure additional external financing in the future.
Our business is capital intensive and will require substantial expenditures for, among other things, the acquisition of equity interests in and assets of coal mines as well as mining rights, purchase of and investment in properties, machinery and equipment and operational capital expenditures. In 2010, 2011 and 2012, our total capital expenditures were approximately RMB3,785.3 million, RMB23,336.4 million and RMB20,809.2 million, respectively, largely due to investment in our core coal businesses. We intend to use cash on hand, funds from operations and additional debt and equity financing to finance our capital expenditures going forward. However, we may not be able to obtain sufficient amounts of capital in a timely manner, on terms acceptable to us, or at all, which could result in a material adverse effect on our business, results of operations and financial condition.
In recent years, the size of our interest-bearing debt obligations has increased along with our expansion plans. In May and July 2012, we issued U.S. dollar and RMB denominated corporate bonds in aggregate principal amounts of US$1.0 billion and RMB5.0 billion, respectively. As of December 31, 2012, we had approximately RMB40,996.4 million in bank borrowings, of which approximately RMB7,712.6 million is due within a year and approximately RMB33,283.8 million is due after one year. In the first quarter of 2013, we entered into several U.S. dollar and RMB denominated loan agreements for aggregate amounts of US$601.4 million and RMB700 million. This level of debt could have significant consequences for our operations, including reducing the availability of our cash flow to fund working capital, capital expenditures, acquisitions and other general corporate purposes as a result of our debt servicing obligations, limiting our flexibility in planning for, or reacting to, and increasing our vulnerability to, changes in our business, our industry and the general economy and potentially limiting our ability to obtain, or increasing the cost of, any additional financing. In addition, our business plans may change from time to time due to changing circumstances, new opportunities or unforeseen contingencies. If we change our business plans, we may need to obtain additional external financing which may include bank borrowings or issuances of debt securities to meet our capital expenditure plans. If we raise additional funds through debt financing, our interest and debt repayment obligations will increase and we may be subject to additional covenants that could limit our ability to access cash flows from operations. We may not be able to raise sufficient financing to fund our future capital expenditures and service our debt obligations or at all. Failure to obtain sufficient financing could cause delays or abandonment of business development plans and have a material adverse effect on our business, results of operations and financial condition.
The coal reserve data in this annual report are only estimates, which may differ materially from actual reserve amounts.
Our coal reserve data are only estimates, which may differ materially from actual reserve amounts. There are inherent uncertainties in estimating reserves, which require the consideration of a number of factors, assumptions and variables, many of which may be beyond our control and cannot be ascertained despite due investigation. Our reserve estimates may change substantially if new information becomes available.
In addition, reserve data for certain of our PRC mines are estimated in accordance with Industry Guide 7 for proven and probable reserves and the JORC Code for reserves. Reserve data for our Australian mines are typically estimated in accordance with the JORC Code. As the mining standards and mining terminology of the JORC Code may differ substantially from Industry Guide 7, our reserve data may materially vary when we compile and present such data. As such, our actual results of operations may differ materially from our long-term business and operational projections, which are based on our coal reserve estimates. We may adjust our coal reserve estimates downward in the future, and in such event, our long-term production and the useful lives of our mines may be materially and adversely affected.
Our business, results of operations and financial condition depend on in part our ability to continue acquiring or developing suitable coal reserves.
The recoverable coalCoal reserves in our existing mines decline as we produce coal.coal is produced. Due to the limitation on our ability tolimitations in significantly increaseincreasing our production capacity at existing mines, such as Jining II Coal Mine, Jining III Coal Mine and Tianchi Coal Mine, the increase inour ability to expand our coal production capacity depends on theour development of coal reserves, we developed recently or will develop in the future, as well as our newly acquired coal resources.
We acquired the mining rights of Zhaolou Coal Mine through Heze Nenghua in May 2008,reserves and commenced production at Zhaolou Coal Mine in December 2009. On December 23, 2009, we completed the acquisition of the entire equity interest in Felix, which had an equity interest in three operational minesresources domestically and three exploratory mines. In December 2009, we established Ordos Neng Hua to manage our investments in the Inner Mongolia Autonomous Region, including a coal mining project. In 2010, Ordos Neng Hua acquired a 100% equity interest in a 600,000 tonnes methanol project. We acquired the entire assets of Anyuan Coal Mine in December 2010, which has commenced production in early 2011. We also obtained a 61% equity interest in Haosheng Company as of the date of this annual report. We are also in the process of establishing an associate company for a coal mining project in Yushuwan, Shaanxi Province. For more information about the development and acquisition of our coal resources, please refer to “Item 4. Information on the Company — History and Development of Our Company” in this annual report.overseas.
The acquisition of new mines by PRC coal companies, either within China or overseas, and the procurement of related licenses and permits are subject to PRC government approval.approvals. Delays or failures in securing or failure to secure relevantthe required PRC government approvals, licenses or permits, as well as any adverse change in government policies, may hinder our expansion plans, which may materially and adversely affect our future profitability and growth prospects. In connection with overseas acquisitions and expansion, we may encounter challenges due to our unfamiliarity with local laws and regulations, and may suffer foreign exchange losses on overseas investments or face political or regulatory obstacles to acquisitions. We cannot assure you thatAs a result of these challenges, our overseas expansion plans and investments willmay not be successful.successful and may not achieve our anticipated results.
We cannot assure you thatIn addition, the acquisition of new mines or the grant of mining leases in Australia are subject to approval under Australia’s foreign acquisition legislation and policy, including the Foreign Acquisitions and Takeovers Act 1975, which is administered by the Treasurer of Australia acting through the Foreign Investment Review Board. Such foreign investment approvals may be granted subject to conditions imposed by the Treasurer of Australia. This foreign investment regime subjects us to additional risks and uncertainties, and may adversely impact our ongoing and potential expansion plans in Australia.
Moreover, we willmay not be able to continue to identify suitable acquisition targets or acquire these targets on competitive terms, andat an acceptable cost or in a timely manner. We may not be able to successfully develop new coal mines or expand our existing ones in accordance with our development plans, or at all. Failure to successfully acquire suitable targets on competitive terms, develop new coal mines or expand our existing coal mines could have an adverse effect on our competitiveness and growth prospects.
We may experience difficulty integrating our acquisitions, which could result in a material adverse effect on our business, results of operations and financial condition.
We may from time to time expand our business through acquisitions of other coal mining companies, assets or other coal or mining-related businesses. We are devoting significant resources to the integration of our operations in order to achieve the anticipated synergies and benefits of the acquisitions and expansion.
Acquisitions and expansion involve uncertainties and a number of risks, including:
difficulty in integrating the assets, operations and technologies of the acquired companies or assets, including their employees, corporate cultures, managerial systems, processes and procedures and management information systems and services;
complying with the laws, regulations and policies applicable to the acquired businesses;
failure to achieve the objectives or benefits, or to generate sufficient revenue to recover the costs and expenses, resulting from the acquisition and integration of such companies or assets;
managing relationships with employees, customers and business partners during the course of integrating new businesses;
integrating other acquired employee groups with our employee groups and on maintaining productive employee relations;
attracting, training and motivating members of our management and workforce;
accessing our capital resources and internally generated funds to fund acquisitions, which may divert financial resources otherwise available for other purposes;
strengthening our operational, financial and management controls, particularly those of our newly acquired assets and subsidiaries, to maintain the reliability of our reporting processes;
difficulty in exercising control and supervision over the newly acquired operations, including failure to implement and communicate our safety management procedures resulting in additional safety hazards and risks;
potential ongoing financial obligations and unforeseen or hidden liabilities of the acquired companies or coal or potash-related businesses; and
failure to diversify our operations to include new products or successfully manage our operations in new markets, such as potash.
In the event that we are unable to efficiently and effectively integrate newly acquired companies or coal or potash-related businesses into our Company, we may be unable to achieve the objectives or anticipated benefits of such acquisitions, which may adversely impact our business, results of operations and financial condition. In addition, we may have to write down the carrying value of the intangible assets associated with any acquired companies, which could adversely affect our earnings.
Our merger with Gloucester may not strengthen our coal mining operations and market profile, globally and in Australia, as we expect.
In June 2012, Gloucester became a wholly owned subsidiary of Yancoal Australia, and the Company and Gloucester shareholders held 78% and 22%, respectively, of the ordinary share capital of Yancoal Australia. However, as a condition of the foreign investment approval for our merger with Gloucester, we are required by the Treasurer of Australia to reduce our economic ownership in Yancoal Australia to less than 70% by December 31, 2013, and our economic ownership must not exceed 70% thereafter. In addition, we must reduce our economic ownership in Yancoal Resources’s underlying assets to no more than 50% by December 31, 2013.
Although we believe this transaction has significantly increased our total resource base and strengthened our coal mining operations and market profile in Australia and globally, we may face difficulty integrating the operations of Gloucester. The continued integration of Yancoal Resources and Gloucester into Yancoal Australia specifically may be affected by uncertain mining conditions.
Our operations are subject to certain risks inherent in underground mining, which may affect the safetyterms and conditions of our workforcemerger with Gloucester, as it will result in Yancoal Australia, other than the Excluded Assets, ceasing to be a wholly owned subsidiary of our Company. As a result of this reduced control, we may not be able to influence the actions or cost of producing coal, including, without limitation, roof collapses, deteriorationimplement the measures necessary to successfully integrate Yancoal Resources and Gloucester. See “— We may experience difficulty integrating our acquisitions, which could result in the quality or variations in the thickness of coal seams, minewater discharge, explosions from methane gas or coal dust, ground falls and other mining hazards. Additionally, we are exposed to operational risks associated with industrial or engineering activities, such as maintenance problems or equipment failures. Although we conduct geological assessments on mining conditions and adapt our mining plans to the mining conditions at each mine, we cannot assure you that adverse mining conditions would not endanger our workforce, increase our production costs, reduce our coal output or temporarily suspend our operations. The occurrence of any of the foregoing events or conditions would have a material adverse impacteffect on our business, and results of operations.
We may suffer losses resulting from mining safety incidents.
Our coal mines and operating facilities may be damaged by water, gas, fire or cave-ins due to unstable geological structures. Like other coal mining companies, we have experienced accidents that have resulted in property damage and personal injuries. Although we have implemented safety measures at our mining sites, trained our employees on occupational safety and maintain liability insurance for personal injuries as well as limited property damage for certain of our operations, we cannot assure you that safety incidents will not occur. Any significant accident, business disruption or safety incident could result in substantial uninsured costs and the diversion of our resources, which could materially and adversely affect our business operations and financial condition.condition” and “– Our business, results of operations and financial condition depend on in part our ability to continue acquiring or developing suitable coal reserves.” We also expect that we will make significant capital expenditures to develop Gloucester’s projects.
We may be required to allocate additional funds for land subsidence.subsidence, restoration, rehabilitation and environmental protection.
Underground and surface mining may cause the land above mining sites to subside.subside, or may otherwise adversely affect the environment. We may compensate inhabitants in areas surrounding our mining sites for their relocation expenses or for any property loss or damage as a result of our mining activities. PRC regulations require us to set aside provisions to cover the costs associated with land subsidence, restoration, rehabilitation and environmental protection. An estimated provision is deducted as ana cost and expense item in our income statement based on the amount of coal actually extracted. In addition, under the relevant Australian environmental regulations, rehabilitation costs are generally estimated in accordance with the expected costs of land rehabilitation. These land rehabilitation costs may exceed current estimates. Environmental legislation may also change, which could result in mandated modifications to mining operations that are costly.
In 2010, 2011 and 2012, we expensed approximately RMB693.7RMB1,532.2 million, RMB1,513.1 million and RMB1,450.6 million, respectively, of our provisions for land subsidence, restoration, rehabilitation and environmental protection was expensed. The provision for land subsidence, restoration, rehabilitation and environmental costs isas determined by our Directorsdirectors based on estimations onof various factors, including past occurrences of land subsidence. However, the provisions that we make are only estimates and may be adjusted to reflect the actual effects of our mining activities on the land above and surrounding our mining sites. Therefore, there can be no assurance that such estimates willmay not be accurate or that ourand land subsidence, restoration, rehabilitation and environmental costs will notmay substantially increase in the future or that the PRC government will notfuture. Moreover, governments may impose new fees or change the basis of calculating compensation and reclamation costs in respect of land subsidence, the occurrence of any of which could increase our costs and have a material adverse effect on our business, results of operations.operations and financial condition.
PRC quotas for coal exportsOur business and industry may adversely affectbe affected by the leveldevelopment of our coal export sales.alternative energy sources and climate change.
Our export sales conducted from China (not includingWe supply coal as fuel to, among others, the salesPRC thermal power generation industry and, as a result, are affected by Yancoal Australia) accounted for approximately 0.9%, 0.3%the demand and 0.03%growth of our sales income of coal in 2008, 2009 and 2010, respectively.The NDRC and the Ministry of Commerce set an annual export quota for domestic coal producers and allocate the quota among authorized coal exporters. Our export agents have historically received sufficient export quota to satisfy our export requirements. However, we are unable to predict what impact, if any, the national export quota may have on the level of our future export sales. If the national quota for coal exports is further reduced, our future export sales could be limited,PRC thermal power industry, which in turn is affected by the development of alternative energy sources, climate change and global environmental factors. If alternative combustion technologies develop and reduce the demand for coal in electricity generation, then demand for coal in the PRC thermal power generation industry may decrease, which would materially and adversely affect its demand for our products.
In addition, while the majority of global energy consumption is from conventional energy sources such as coal, alternative energy industries are rapidly developing and are gradually gaining widespread acceptance. Coal combustion generates significant greenhouse gas and other pollutants, and the effects of climate change resulting from global warming and increased pollution levels may provide incentives for governments to promote or invest in “green” energy technologies such as wind, solar, nuclear and biomass power plants, or to reduce their consumption of conventional energy sources such as coal. In particular, pursuant to the Twelfth Five-Year Plan, the PRC government plans to continue to encourage the development of non-fossil fuel energy sources, such as wind power, solar power, biomass and geothermal energy, in the next five years. As such, alternative energy industries may rapidly develop and gradually gain mainstream acceptance in the PRC and the rest of the world. If alternative energy technologies continue to develop and prove suitable for wide commercial application in the PRC and overseas, demand for conventional energy sources such as coal could gradually be reduced, which would have a material adverse effect on the coal mining industry and, consequently, our business, results of operations and financial condition. See “— Our business, results of operations and financial condition may be adversely affected by present or future environmental regulations.”
Exploration of mineral properties and development of resources could involve significant uncertainties.
We currently have exploration projects in Australia and Canada and we may have additional exploration projects in the PRC and other countries and regions in the future. The success of any mining exploration program depends on various factors including, among other things, whether mineral bodies can be located and whether the locations of mineral bodies are economically viable to mine. In addition, the development of these resources could face significant uncertainties. It can take several years and would require capital expenditures from the initial exploration phase until production commences, during which time market fundamentals, capital costs and economic feasibility may change, and the actual results may differ from those anticipated by third party independent technical studies. Furthermore, there are a number of uncertainties inherent in the development and expansion of mining operations, including: (i) the availability and timing of necessary governmental permits, licenses and approvals; (ii) the timing and cost necessary to construct mining and processing facilities; (iii) the availability and cost of labor, utilities, and supplies; (iv) the accessibility of transportation and other infrastructure; and (v) the availability of funds to finance construction and production activities. As a result, we cannot assure you that any of our exploration activities will result in the discovery of valuable resources or reserves, or that reported resources can be converted into reserves in the future.
We are exposed to fluctuations in exchange rates and interest rates.
We face risks relating to fluctuations in exchange rates for RMB against other currencies, primarily the Australian dollar and the U.S. dollar. China has adopted a managed floating exchange rate system to allow the value of the Renminbi to fluctuate within a regulated band based on market supply and demand with reference to a basket of currencies. In April 2012, the PRC government further enlarged the trading band. In this regard, the PBOC has allowed the Renminbi to rise or fall 1% against the U.S. dollar from the daily central parity rate, effective April 16, 2012, compared with its previous 0.5% limit. We expect that the PRC government will continue to adopt prudent monetary policy in 2013, which could result in further and more significant revaluations of the Renminbi against the U.S. dollar or any other foreign currency. We are primarily affected by exchange rate fluctuations that arise from our export sales denominated in Australian dollars and U.S. dollars, which may affect the RMB values of such export sales. In addition, exchange rate fluctuations can result in exchange losses on our foreign currency deposits and loans and other indebtedness. As of December 31, 2012, the exchange rate for the Australian dollar against the U.S. dollar was US$1.00 = A$1.0393, compared with US$1.00 = A$1.0251 as of December 30, 2011. We recorded an exchange gain of RMB518.6 million for the year ended December 31, 2011 and RMB714.2 million for the year ended December 31, 2012, respectively. Exchange rate fluctuations can affect our cost of imported equipment and components. See “Item 3. — Key Information — A. Selective Financial Data — Exchange Rate Information.”
On April 9, 2013, with the authorization of the PBOC, the China Foreign Exchange Trade System (CFETS) launched direct trading between Renminbi and Australian dollar on the inter-bank foreign exchange market, which is based on the direct exchange rate between the two currencies. We expect that this will help lower the currency conversion costs between the two currencies. However, we cannot assure you that the new policy will decrease our currency conversion costs. The conversion costs we realized in the previous trading scheme, which used U.S. dollars, may be lower, reflecting that the U.S. dollar is more liquid than the Australian dollar.
We are exposed to interest rate risk caused by interest rate changes in relation to our bank borrowings and our other indebtedness, as well as our variable rate bank balances, term deposits and restricted cash held with banks. Our interest rate risk primarily arises from fluctuations in the PBOC benchmark interest rate in relation to our RMB-denominated borrowings, and fluctuations in the LIBOR rate in relation to our U.S. dollar-denominated borrowings. As of December 31, 2012, we had approximately US$4,162.0 million of borrowings denominated in U.S. dollars and RMB13,493.5 million of borrowings denominated in RMB.A substantial majority of our borrowings denominated in RMB are linked to the benchmark lending rate published by the PBOC, which is subject to fluctuations as the PRC government adjusts interest rates and related policies from time to time as a matter of national economic policy.
In addition, a substantial majority of our borrowings denominated in U.S. dollars are linked to floating LIBOR rates, the fluctuation of which are beyond our control. Our lending rates may increase in the future as a result of reasons beyond our control, and may result in an adverse effect on our business, results of operations and financial condition.
To manage uncertainty in our revenue stream and capital expenditures caused by exchange rate fluctuations, we have entered into forward foreign exchange contracts to sell or purchase specified amounts of foreign currencies at stipulated exchange rates. We have also entered into interest rate swap contracts with banks to hedge a portion of our variable interest rate borrowings. As of December 31, 2012, the fair value of our derivative assets in respect of our forward foreign exchange contracts was RMB76.6 million, compared with the fair value liability of our forward foreign exchange contracts and interest rate swap contracts of approximately RMB128.1 million. See “Item 11. Quantitative and Qualitative Disclosures of Market Risks.” Our hedging arrangements may not be effective and our business, results of operations and financial condition may be materially and adversely affected by fluctuations in exchange rates or interest rates.
Our business, results of operations and financial condition are subject to resource taxes and we may not be able to pass on our increased costs relating to resource taxes to our customers.
We currently pay a resource tax of RMB3.60, RMB3.20 and RMB3.20 per tonne of raw coal output in Shandong Province, Shanxi Province and Inner Mongolia Autonomous Region, respectively. The PRC government is considering changes to this tax whereby it would be based on pricing and not on volume. If such a change is adopted and the tax based on pricing is significantly higher than current tax, we may fail to pass on all of the increased costs to our customers, which could have a material adverse effect on our business, results of operations and financial condition. In addition, on March 29, 2012, the Australian MRRT was passed into law, effective July 1, 2012. The MRRT is a profits-based tax that is charged at an effective rate of 22.5% on the assessable profits (excess of annual mining revenue over annual mining expenditures with respect to mineral interests, less certain allowances) of, among others, coal mining enterprises. In 2012, as the result of the MRRT, our Australian subsidiaries recognized deferred tax assets, leading to a decrease in the income tax expense of our Australian subsidiaries by RMB1,085.2 million. However, this is a one-off tax impact and we expect the MRRT has the potential to increase the overall tax liability of our Australian subsidiaries and adversely affect our results of operations.operations and financial condition in the future.
Our Controlling Shareholder has significant influence over us.
We do not have an export permit and cannot directly exportAs of December 31, 2012, our coal. AllControlling Shareholder, the Yankuang Group, owned 52.86% of our export sales must be made through intermediary export agentsoutstanding shares and has significant influence over us. Pursuant to approval granted at the annual shareholder meeting of the Company held on June 22, 2012, the Company entered into five continuing connected transaction agreements with the Yankuang Group, namely a materials supply agreement, a supply of labor and services agreement, a pension fund management agreement, a coal products and materials supply agreement and an electricity and heat energy supply agreement, together with the respective annual caps for such transactions from 2012 to 2014, in the ordinary course of business. In addition, pursuant to approval granted at the third meeting of the fifth session of the Board of Directors held on August 19, 2011, the Company entered into a financial services agreement. These related party transactions were reviewed and approved according to the procedures under relevant regulations and standards of the HKSE, SSE, NYSE and SEC. However, we may continue to enter into related party transactions with Yankuang Group and, as such, any material financial or operational developments experienced by the Yankuang Group that lead to the disruption of its operations or impairs its ability to perform its obligations under the agreements could materially affect our business, results of operations and financial condition and future prospects.
As our Controlling Shareholder, the Yankuang Group has the ability to exercise control over the Company’s business and affairs, including, but not limited to, decisions with respect to:
mergers or other business combinations;
the acquisition or disposition of assets;
the issuance of additional shares or other debt or equity securities; and
management of our Company.
Accordingly, our Controlling Shareholder may vote, take other actions or make decisions that conflict with our interests or the interests of our other security holders.
Our coal operations are extensively regulated by the PRC and Australian government, and government regulations may limit our activities and adversely affect our business, results of operations and financial condition.
Our coal operations in China are subject to extensive regulation by the PRC government. National governmental authorities, such as Chinathe NDRC, the MEP, the MLR, the State Administration of Coal Mine Safety (“SACMS”), the State Administration of Work Safety, the National Coal Industry ImportEnergy Administration and Export Corporation, Chinathe State Bureau of Taxation, as well as corresponding provincial and local authorities and agencies, exercise extensive control over the mining and transportation (including rail and sea transport) of coal within China. Our operations in Australia are subject to similar laws and regulations of general application governing mining and processing, land tenure and use, environmental requirements, including site-specific environmental licenses, permits and statutory authorizations, workplace health and safety, trade and export, competition, access to infrastructure, foreign investment and taxation. These regulations may be implemented by various federal, state and local government departments and authorities including the Department of Resources, Energy and Tourism, the Department of Sustainability, Environment, Water, Population and Communities, and the National Minerals ImportNative Title Tribunal. Regulatory oversight from these authorities and Export Company Limited and Shanxi Coal Import and Export Group Company. The termsagencies may affect the following aspects of our export salesoperations, among others:
the use and granting of mining rights;
access to land for mining and mining-related purposes;
exploration and production licenses;
rehabilitation of mining sites and surrounding areas;
mining recovery rates;
pricing of our transportation services for coal in China;
taxes, levies and fees on our business;
return on investments;
application of capital investments;
pension fund contributions;
technological innovations;
preferential tax treatment;
environmental and safety standards; and
MRRT and carbon tax for Australian operations.
As a result of the foregoing regulation, our ability to execute our business strategies or to carry out or expand our business operations may be restricted. We are determined collectivelystill in the process of obtaining or renewing some of the regulatory approvals, permits and licenses required for our business operations, and may experience substantial delays in obtaining such regulatory approvals, permits and licenses.
Our business may also be adversely affected by future changes in PRC or Australian regulations and policies that affect the coal industry. The adoption of new legislation or regulations or the new interpretation of existing legislation or regulations or changes in conditions attaching to approvals may materially and adversely affect our operations, our tax costs and cost structure or product demand. The occurrence of any of the foregoing may cause us to substantially change our existing operations, incur significant compliance costs and increase the export agentsrisk of our future investment or prevent us from carrying out mining operations, which could have a material adverse effect on the profitability of our operations in Australia and our overseas customers. Although we have appliedoverall business, results of operations and financial condition. See “— Our business, results of operations and financial condition may be adversely affected by present or future environmental regulations” and “— Our business, results of operations and financial condition are subject to the PRC central government for direct export rights with the assistance of the Shandong provincial government,resource taxes and we may not be able to pass on our increased costs relating to resource taxes to our customers.”
We may not be able to obtain all necessary approvals, permits and licenses.
Pursuant to applicable laws and regulations in China, we are required to renew approvals, permits and licenses with respect to our exploration activities, mining operations and environmental protection for our existing operational mines and obtain more approvals, permits and licenses for our development-stage or exploration projects such as Zhuanlongwan, Shilawusu, Yingpanhao and Wanfu. In addition, we are required to obtain or maintain land use rights certificates and building ownership certificates for property we own or lease properties from owners possess valid land use rights certificates or building ownership certificates.
With respect to our operations in Australia and Canada, we are also required to obtain a number of material regulatory approvals, permits and license. We are in the process of obtaining or renewing certain regulatory approvals, permits and licenses for our coal mines, such as the open-pit project at Moolarben Coal Mine and the Southeast open-pit project at Ashton Coal Mine.
If any of these or our other mining licenses, coal production licenses, safety production licenses or other certificates, approvals or permits are revoked, not renewed or not obtained, we could be required to cease operations of the affected mine or production facility. The loss of some or all of our mining licenses, coal production licenses, safety production licenses or other certificates, approvals or permits may have to continue relyinga material adverse effect on export agents to export our coal from China.business, results of operations and financial condition.
Our business, results of operations and financial condition may be adversely affected by present or future environmental regulations.
Our coal mining operations produce waste water, gas emissions and solid waste materials. In addition, surface mining operations also produce noise pollution. As a PRC and Australian coal producer, we are subject to extensive and increasingly stringent environmental protection laws and regulations. These laws and regulations:
impose fees for the discharge of waste substances;
require provisions for land reclamation and rehabilitation;
impose fines and other penalties for serious environmental offenses; and
authorize the PRC government to close any facility that fails to comply with environmental regulations and suspend any coal operation that causes excessive environmental damage.damage; and
Our coal
establish the conditions (including environmental requirements) for domestic mining operations produce waste water, gas emissions and solid waste materials. Theoperations.
Due to the increasing awareness of environmental issues, the PRC government has tightened its enforcement of applicable laws and regulations and adopted more stringent environmental standards. On December 1, 2011, the State Council issued the Working Plan for the Control of Discharge of Greenhouse Gases under the Twelfth Five-Year Plan (the “Working Plan”), pursuant to which China plans to continue to increase the proportion of non-fossil fuels used as an overall primary energy source to 11.4% by 2015 and reduce the proportion of coal used as an overall primary energy source. In addition, pursuant to the Working Plan, the PRC government aims to reduce energy consumption per unit of GDP by 17% by 2015 compared to 2010. In addition, pursuant to the administrative energy-saving and emission reduction policies carried out by the central and provincial governments in accordance with the Twelfth Five-Year Plan of Energy-Saving and Emission Reduction issued in August 6, 2012, the PRC government aims to reduce approximately 670 million tonnes of coal from 2011 to 2015, develop clean coal technology such as underground coal gasification, desulfurization and coal water fuel and improve the utilization of coal gangue.
Similarly, our Australian operations are subject to Australia’s stringent federal and state and territory environmental laws and regulations. OurIn March 2012, the Australian government enacted a carbon pricing mechanism (or carbon tax) law, effective July 1, 2012, which imposed a charge on the amount of carbon dioxide emissions with an eventual transition to a “cap and trade” carbon emissions scheme. The carbon tax law imposes a charge based on tonnage of carbon dioxide equivalent (CO2-e) emissions, which is intended to disincentivize the use of fossil fuels such as coal.
In addition, there have recently been cases in New South Wales and Queensland relating to the environmental effects of greenhouse gas emissions produced as a result of coal mining. Compliance with laws and involvement in litigation can be expensive, lengthy and disruptive to normal business operations. If this area of law develops further, more stringent regulations may be developed, particularly in relation to greenhouse gas emissions, which could increase the costs of using coal and reduce demand for coal as a fuel source, thus adversely affecting the sales volumes and prices of our coal. Moreover, Australian environmental approval processes require a technical environmental assessment to be prepared prior to granting approval, as well as public consultation. Community groups may lobby for more restrictive conditions to be imposed on approvals granted or for the approval to be declined, either of which may result in a material adverse effect on our business and results of operations.
If efforts to increase energy efficiency, control greenhouse gas emissions and enhance environmental protection result in a decrease in coal consumption, our revenue may decrease and our business may be adversely affected. In addition, our budgeted amount for environmental regulatory compliance may not be sufficient, and we may need to allocate additional funds for this purpose. If we fail to comply with current or future environmental laws and regulations, we may be required to pay penalties or fines or take corrective actions, any of which may have a material adverse effect on our business, results of operations and financial condition.
Our ability to operate effectively could be impaired if we lose key personnel, including mine planners, or if we are unable to attract and retain skilled and qualified personnel.
In March 2011, the NDRC promulgatedconduct of our operations, we rely substantially on the main targetsservices of resources conservationour key employees with professional skills, qualifications and environment protection for 2011, which setexperience, including mine planners. We may not be able to continue to employ our key personnel or attract and retain skilled and qualified personnel and the goals to decrease the amountloss of energy consumed per unitany of GDP by 3.5%these personnel could materially and to reduce the emission of certain major pollutants by 1.5% in 2011 compared with that in 2010. If efforts to increase energy efficiency, control greenhouse gas emissions and enhance environmental protection result in a decrease in coal consumption,adversely affect our revenue may decrease andoperations.
As our business expands, we believe our success will depend on our continued ability to attract and retain skilled and qualified personnel familiar with internationalized operation. Any difficulty in attracting, recruiting, training and retaining skilled and qualified personnel could materially and adversely affect our business, results of operations and financial condition.
Our operations may be adversely affected.affected by uncertain mining conditions and we may suffer losses resulting from mining safety incidents.
Our coal mines and operating facilities may be damaged by water, gas, fire or cave-ins due to unstable geological structures, which may affect the safety of our workforce as well as our costs of producing coal, including without limitation, roof collapses, deterioration in the quality or variations in the thickness of coal seams, mine water discharge and flooding, inclement weather, explosions from methane gas or coal dust, ground falls and other mining hazards. Additionally, we are exposed to operational risks associated with industrial or engineering activities, such as maintenance problems or equipment failures. Although we conduct geological assessments on mining conditions and adapt our mining plans to the mining conditions at each mine, adverse mining conditions may endanger our workforce, increase our production costs, reduce our coal output or temporarily suspend our operations. Although we have implemented safety measures at our mining sites, trained our employees on occupational safety and maintain liability insurance for personal injuries as well as limited property damage for certain of our operations, safety incidents may occur. The occurrence of any of the foregoing events or conditions would have a material adverse impact on our business, results of operations and financial condition.
We face pricingprice volatility and intense competition in our methanol operations.
We entered the PRC methanol market and commenced production of coal-based methanol at Tianhao Chemicals and Yulin Nenghua in September 2008 and August 2009, respectively. In 2010, 2011 and 2012, we generated revenue of RMB629.3 million, RMB1,059.3 million and RMB1,118.0 million from sales of methanol, respectively, which represented 1.9%, 2.3% and 1.9% of our total revenue for the same periods, respectively. However, we ceased production of coal-based methanol at Tianhao Chemicals in April 2012 due to the shortage of raw materials and are in the process of disposing of its methanol assets.
The methanol business is a cyclical and competitive commodity industry with dynamicrapidly changing supply and demand fundamentals. From 2006 to 2010,In addition, there is currently significant overcapacity in the domestic methanol industry, suffered from significant overcapacity following a period of rapid expansionwhich is not expected to change, and increased investment, which were stimulated by speculation on the developmentmarket demand of methanol downstream applications andis not expected to grow significantly in the overheated coal chemical industry. Stagnation in market demand for methanol as a result of difficulty in promoting the utilization of methanol downstream products caused the over capacity issue to further deteriorate. We expect methanol prices in domestic market to remain sluggish due to the above mentioned conditions. In March 2011, the PRC benchmark methanol price increased to RMB2,670 per tonne from RMB2,590 per tonne in March 2010, representing a 3.1% increase.short term.
We expect our methanol prices to be affected by a number of factors, including, without limitation:
global and domestic methanol production;
global energy prices;
methanol plant utilization rates, capacity additionsexpansions and shut downs;shutdowns;
global economic conditions;
our cost structure, product quality, availability of raw materials and utilization of our methanol plants;
compliance costs and environmental risks; and
foreign competition from low costlow-cost methanol producers which may have greater resources.producers.
As of the end of 2010,2012, we had a total annual methanol production capacity of 700,000600,000 tonnes. As with developing any new business,In addition, we are currently constructing a 600,000-tonne methanol project in Ordos City, Inner Mongolia Autonomous Region, which we expect to become operational in the second half of 2013. We may not be able to optimize the utilization of our new facilities as planned. For example, Tianhao Chemicals has not been able to procure a steady supply of key raw material from its sole supplier of coke oven waste gas and has not been able to maintain steady operations as of the date of this annual report, which significantly curtailed its production in 2010.
If our projections for the domestic methanol market prove incorrect or if we are unable to otherwise compete effectively, we may not recover the capital and resources we have invested in our methanol operations and may not realize the intended benefits of our business expansion.expansion into this industry. In either event, our business, results of operations and profitabilityfinancial condition will be adversely affected.
Our electric power business is heavily regulated, which may affectinsurance will not cover all the potential risks associated with our results of operations.
We generated RMB185.5 million of revenue from electric power sales, which represented approximately 0.5% of our total revenue in 2010. The majority of electricity that we produced was for our internal use and we sold the remaining portion to external customers. To the extent that we do sell electricity, any decrease in the government-set grid power prices, the price at which power grid operators purchase electricity from power plants, including our power plants, may reduce our profitability and adversely affect our results of operations.
The operation of coal-fired power plantsOur business is subject to increasingly stringent emission standardsa number of risks and hazards generally, including adverse environmental conditions, industrial accidents, labor disputes, unusual or unexpected geological conditions, ground or slope failures, changes in regulatory environment and natural phenomena such as inclement weather conditions, floods, earthquakes and fires. Such occurrences could result in damage to mineral properties or production facilities, personal injury or death, environmental damage to our properties or properties of others, delays in development or mining, monetary losses and possible legal liability. Customary to what we believe to be industry practice, we have maintained insurance to protect against certain risks in such amounts we consider to be reasonable. However, our insurance may not cover all potential risks associated with our operations. We may also be unable to maintain insurance to cover these risks at economically feasible premiums and may not be able to pass on any increased costs relating to insurance to our customers. If such costs exceed the PRC government, in particular, the resources conservationlevels which we expect, there could be a material adverse effect on our business, results of operations and environmental protection standards for 2011 set forth by the NDRC, which stipulated the standards for air pollutant emissions for the power plants. As a result, our compliance costs will likely increase and the profitability of our electric power business may be reduced.financial condition.
We are exposedmay not be able to fluctuations in exchange rates and interest rates.
We mainly face risks relating to RMB fluctuations and risks stemming from exchange rate fluctuations between the Australian dollar and U.S. dollar. China has adopted a managed floating exchange rate system to allow the value of the Renminbi to fluctuate within a regulated band based on market supply and demand with reference to a basket of currencies. The primary effect of exchange rate fluctuations on us is due toprotect our exports denominated in U.S. dollars and Australian dollars. As a result, exchange rate fluctuations can affect our export sales. In addition, exchange rate fluctuations can result in exchange losses on our foreign currency deposits and loans. As of December 31, 2010, the exchange rate for the Australian dollar against the U.S. dollar was 1.0163 (A$1.00 = US$1.0163), compared with A$1.00 = US$0.8985 as of December 31, 2009. Yancoal Australia recorded an exchange gain of RMB2,688.2 million during the reporting period. Exchange rate fluctuations can affect our cost of imported equipment and components.
To manage uncertainty in our revenue stream and capital expenditures caused by exchange rate fluctuations, we have entered into forward foreign exchange contracts to sellpatents or purchase specified amounts of foreign currencies at stipulated exchange rates. We have also entered into interest rate swap contracts with banks to hedge a portion of our variable interest rate borrowings. As of December 31, 2010, the fair value of our derivative assets in respect of our foreign exchange contracts was RMB239.5 million, compared with the fair value of our derivative liabilities in respect of our forward contracts and interest rate swap contracts of approximately RMB166.2 million. See “Item 11. Quantitative and Qualitative Disclosures about Market Risks — Foreign Currency Exchange Rate Risk” for details on our hedging activities. We cannot assure you that our hedging arrangements will remain effective or that our results of operations will be not negatively affected by fluctuations in exchange rates or interest rates.
Our substantial indebtedness could adversely affect our business, financial condition and results of operations.
As of December 31, 2010, we had approximately RMB23,015.8 million in bank borrowings, ofother intellectual property rights, which approximately RMB614.9 million is due within a year, approximately RMB22,356.8 million is due after one year but within five years and approximately RMB44.0 million is due after more than five years. This level of debt could have significant consequences on our operations, including:
reducing the availability of our cash flow to fund working capital, capital expenditures, acquisitions and other general corporate purposes as a result of our debt servicing obligations;
limiting our flexibility in planning for, or reacting to, and increasing our vulnerability to, changes in our business, our industry and the general economy; and
potentially limiting our ability to obtain or increasing the cost of any additional financing.
In addition, Yancoal Australia obtained a syndicated loan amounting to approximately US$3,040.0 million attributable to the Felix acquisition in December 2009, which is guaranteed by us and secured by a counter guarantee from Yankuang Group. Failure by us to satisfy our repayment obligations could result in an event of a default that, if not cured or waived, could have a material adverse effect on us.our business.
IfFrom 2010 to 2012, we completed 306 technology improvement projects, and obtained 103 patents and over 10 technology advancement prizes, which have enhanced our coal mining and related business operations. Further, we own other intellectual property such as proprietary technologies procedures and processes. We believe our patents and other intellectual property rights are important to our success. Existing laws in China offer limited protection for our intellectual property rights. We rely upon a combination of patents, confidentiality policies and agreements, nondisclosure and other contractual arrangements to protect our intellectual property rights. We cannot assure you that we will be able to detect any unauthorized use of, or take appropriate, adequate and timely actions to enforce, our intellectual property rights. Consequently, we may not be able to effectively prevent unauthorized use of our patents in other countries where such patents are not ableregistered.
The measures we take to generate sufficient cash flowprotect our intellectual property rights may not be adequate, and monitoring and preventing unauthorized use is difficult. The protection of our intellectual property may be compromised as a result of (i) expiration of the protection period of our registered intellectual property rights, (ii) infringement by others of our intellectual property rights; and (iii) refusal by relevant regulatory authorities to serviceapprove our debt obligations, we may needpending patent applications. Furthermore, the application of laws governing intellectual property rights in China and abroad is uncertain and evolving, and could involve substantial risks to refinance or restructure our debt, sell assets, reduce or delay capital investments, or seek to raise additional capital.us. If we are unable to implement one or more of these alternatives,adequately protect our results of operationsintellectual property rights, our reputation may be negatively impacted and financial conditionour business may be materially and adversely affected.
The audit report included in this annual report is prepared by an auditor who is not inspected by the Public Company Accounting Oversight Board and, as such, you are deprived of the benefits of such inspection.
Auditors of companies that are registered with the SEC and traded publicly in the United States, including our independent registered public accounting firm, must be registered with the United States Public Company Accounting Oversight Board (the “PCAOB”) and are required by the laws of the United States to undergo regular inspections by the PCAOB to assess their compliance with the laws of the United States and professional standards in connection with their audits of financial statements filed with the SEC. Because we have substantial operations within the Peoples’ Republic of China and the PCAOB is currently unable to conduct inspections of the work of our Controlling Shareholderauditors as it relates to those operations without the approval of the Chinese authorities, our auditor’s work related to our operations in China is not currently inspected by the PCAOB.
This lack of PCAOB inspections of audit work performed in China prevents the PCAOB from regularly evaluating the audits performed by Grant Thornton and its quality control procedures. As a result, investors are deprived of the full benefits of PCAOB inspections of auditors.
The inability of the PCAOB to conduct inspections of audit work performed in China makes it more difficult to evaluate the effectiveness of our auditor’s audit procedures as compared to auditors in other jurisdictions that are subject to PCAOB inspections on all of their work. Investors may lose confidence in our reported financial information and procedures and the quality of our financial statements.
Risks Relating to the PRC
Changes in China’s economic, political and social conditions as well as governmental policies could affect our business, results of operations and financial condition.
China’s economy differs from the economies of more developed countries in many respects, including the structure of the economy, level of government involvement, level of development, growth rate, control of capital investment, control of foreign currency and allocation of resources. China’s economy has been in transition from a planned economy to a more market-oriented economy. For the past three decades, the PRC government authorities have implemented economic reform measures to emphasize market forces in economic development. The PRC government authorities implement various macroeconomic and other policies and measures from time to time, including contractionary and expansionary policies and measures at times of, or in anticipation of, changes in China’s economic conditions. Economic reform measures, however, may be adjusted, modified or applied inconsistently from industry to industry or across different regions of the country. We cannot predict whether changes in the PRC’s political, economic and social conditions, laws, regulations and policies will have any adverse effect on our current or future business, results of operations and financial condition.
Interpretation of PRC laws and regulations involves uncertainty.
The PRC legal system is a significant impactcivil law system based on written statutes. Prior court decisions may be cited for reference but have limited precedential value. Since 1979, PRC legislation and regulations have significantly enhanced the protections afforded to various forms of foreign investments in China. However, due to the fact that these laws and regulations have not been fully developed, and because of the limited volume of published cases and the non-binding nature of prior court decisions, interpretation of PRC laws and regulations involves a degree of uncertainty. Under certain circumstances, some of these laws may be changed without being immediately published or may be amended with retroactive effect. We cannot predict the effect of future developments in the PRC legal system, particularly with regard to the coal mining industry in China, including the promulgation of new laws, changes to existing laws or the interpretation or enforcement thereof, or the preemption of local regulations by national laws. These uncertainties could limit the legal protections available to us. In addition, any litigation in China may be protracted and result in substantial costs and diversion of our resources and management attention.
Government control of currency conversion and future movements in exchange rates may adversely affect our business, results of operations and financial condition.
A portion of our Renminbi revenue may need to be converted into other currencies to meet our substantial requirements for foreign currencies, including debt service on foreign currency denominated debt, overseas acquisitions of mining properties, purchases of imported equipment, and payment of dividends declared in respect of shares held by international investors.
Foreign exchange transactions under the capital account, including principal payments with respect to foreign currency denominated obligations, are subject to the approval requirements of SAFE. In addition, the value of Renminbi against the U.S. dollar and other currencies may fluctuate and is affected by, among other things, changes in China’s political and economic conditions. Fluctuations in the exchange rate of the Renminbi against the U.S. dollar, the Australian dollar and certain other foreign currencies may adversely affect our business, results of operations and financial condition. For further information, please see “Item 11. Quantitative and Qualitative Disclosures of Market Risks — Foreign Currency Exchange Rate Risk.”
Our subsidiaries are subject to restrictions on the payment of dividends to us.
As of December 31, 2010, our Controlling Shareholder, the Yankuang Group, owned 52.86%The ability of our outstanding sharessubsidiaries to pay dividends to their shareholders is subject to, among other things, distributable earnings and exertsrestrictions contained in the articles of association of our subsidiaries, restrictions contained in the debt instruments and the requirements of PRC laws and regulations. For example, certain loan agreements of our subsidiaries contain covenants that limit their ability to pay dividends to us if there is a default in such loan agreements, or unless certain thresholds are satisfied or, in certain cases, limit their ability to pay dividends to us if their after-tax profits are nil or negative. PRC laws and regulations permit payment of dividends only out of accumulated profits as determined in accordance with PRC accounting standards and regulations. Such profits differ from profits determined in accordance with IFRS in certain significant influencerespects, including the use of different bases of recognition of expenses. Our PRC subsidiaries are also required to set aside a portion of their after-tax profits according to PRC accounting standards and regulations to fund certain reserves that are not distributable as such dividends.
Risks Relating to Australia
Coal mining operations in Australia have inherent title risks associated with renewal and native title rights.
Interests in tenements in Australia are governed by the respective State and Territory legislation and are evidenced by the granting of licenses or leases. Each license or lease is for a specific term and carries with it annual expenditure and reporting commitments, as well as other conditions requiring compliance. Consequently, we could lose title to or our interest in tenements if license or lease conditions are not met or if insufficient funds are available to meet expenditure commitments.
It is also possible that, in relation to tenements which we have an interest in or will in the future acquire, there may be areas over us. We may continuewhich legitimate native title rights of Aboriginal Australians exist. If native title rights do exist, our ability to enter into a numbergain access to tenements (through obtaining consent of connected transactions withany relevant landowner), or to progress from the Yankuang Group. Pursuantexploration phase to the regulationsdevelopment and mining phases of operations, may be adversely affected. The tenements in which we have an interest are subject to applications for renewal. There is a risk that these applications will not be granted or transfers not approved.
All of the Hong Kong Stock Exchange andgranted tenements in which we have or may earn an interest in will be subject to applications for renewal or grant (as the Shanghai Stock Exchange on continuing connected transactions, we completecase may be). The renewal or grant of each tenement or license is usually at the necessary review and approval procedures before entering into continuing connected transactions. We have entered into five continuing connected transaction agreements with the Yankuang Group, namely the Materials Supply Agreement, Supply of Labor and Services Agreement, Pension Fund Management Agreement, Coal Products and Materials Supply Agreement and Electricity and Heat Energy Supply Agreement, each of which has a term from 2009 to 2011. In the fourth quarter of 2008, our shareholders approved the amendment and renewaldiscretion of the five foregoing continuing connected agreements. On April 23, 2011, we also entered intorelevant government authority which will consider various factors, including our compliance with any conditions placed on an existing license, when making its decisions. It is possible that the Finance Services Agreement with Yankuang Group Finance Company Limited, a joint venture established by the Yankuang Group, China Credit Trust Co., Ltd and us. Any material financialgovernment authority may reject our applications for renewal or operational developments experienced by the Yankuang Group that lead to the disruption of its operations or impairs its ability to perform its obligations under the agreements could materially affectgrant, in which case, our operations and future prospects.in Australia may be adversely affected.
As our Controlling Shareholder, the Yankuang Group has the ability to exercise control over the Company’s business and affairs, including, but not limited to, decisions with respect to:
mergers or other business combinations;
the acquisition or disposition of assets;
the issuance of any additional shares or other equity securities;
the timing and amount of dividend payments; and
the management of our Company.
Our operations are affected by a number of risks relating to the PRC.
Because a significant majority of our assets and operations are located in China, weAdditionally, tenements are subject to a number of risks relatingspecific legislative conditions including payment of rent and meeting minimum annual expenditure and reporting commitments. Our inability to conducting business in China, including, butmeet these conditions could affect the standing of a tenement or restrict its ability to be renewed. If a tenement is not limited to, the following:
The central and local governmentsrenewed, we may suffer significant damage through loss of the PRC have historically supported the development of the PRC coal industry and the continued operation of selected coal producers. A change in current policiesopportunity to discover and/or develop any mineral resources on that are favorable to us may adversely affect our ability to expand our business operations or increase our profitability.tenement.
Under current PRC regulatory requirements, we must obtain approval from relevant administrative authorities of the PRC government for any material capital expenditure project. Failure to obtain timely approvals for our projects may adversely affect our business plans and operating results.
China is still in the process of developing a comprehensive legal system. The enforcement of certain laws in China may still be subject to uncertainty. For instance, under current PRC tax laws, dividends payable to an non-PRC individual holders of shares outside the PRC are no longer exempted from PRC individual income tax and are subject to 20% individual income tax. However, this rate is still subject to adjustment in accordance with the applicable tax treaties or arrangement, pending on further confirmation from the relevant PRC authorities. Please refer to “Item 10. Additional Information — E. Taxation” for more details about this tax treatment.
The PRC government’s ongoing reform of the PRC economic system may increase the uncertainties in our business as a number of reforms are unprecedented or experimental and may be subject to refinement and adjustments. We may be directly affected by these reforms or indirectly affected by changes in political, economic and social factors that result from these reform measures. Our operating results may be adversely affected by changes in economic and social conditions in China and changes in the PRC government policies related, but not limited, to inflation control, economic stimulus policies, tax policies and rates, currency conversion restrictions and tariffs and other import restrictions.
Our coal operations are extensively regulated by the PRC and Australian government and government regulations may limit our activities and adversely affect our business operations.
Our coal operations in China are subject to extensive regulation by the PRC government. National governmental authorities, such as the NDRC, the Ministry of Environmental Protection, the Ministry of Land and Resources, the State Administration of Coal Mine Safety and the State Bureau of Taxation, as well as corresponding provincial and local authorities and agencies, exercise extensive control over the mining and transportation (including rail and sea transport) of coal within China.
Our operations in Australia are subject to similar lawscertain domestic operational risks.
Our coal mining operations in Australia are subject to certain domestic operational risks, which include the following.
Land access. The granting of mining tenure does not remove the need to enter into land access arrangements with third party land holders (where the land underlying the mining tenure is owned by a third party). In some cases, the underlying land may be owned by a competitor, pastoralist or other third parties. In addition, elements of the agricultural industry and regulationsother groups are opposed to the future development of general application governingland for mining or mining-related purposes. These groups are actively lobbying the relevant government entities or seeking public support in an effort to limit the amount of land available for mining, and processing,to make access arrangements for mines more difficult.
Coordination agreements. Coal mining tenure in Australia is frequently granted over land over which coal seam gas tenure and use, environmental requirements, including site specific environmental licenses, permits and statutory authorizations, workplace health and safety, trade and export, competition, access to infrastructure, foreign investment and taxation. These regulationshas or may be implemented by various federalgranted. Where coal mining and state government departmentscoal seam gas tenures overlap, it is necessary for the coal miner and authorities includingcoal seam gas producer to enter into a coordination agreement. Where overlapping tenure exists, mining operations cannot commence without a coordination agreement. In some cases, the Department of Resources, Energy and Tourism, the Department of Environment, Water, Heritage and the Arts and the National Native Title Tribunal.
Regulatory oversight from these authorities and agencies may affect the following, among others, aspects of our operations:
the use and grant of mining rights;
rehabilitation of mining sites and surrounding areas;
mining recovery rates;
pricing of our transportation services for coal in China;
taxes, levies and fees on our business;
application of capital investments;
export quotas and procedures;
pension fund contributions;
preferential tax treatment; and
environmental and safety standards.
As a resultinterests of the foregoing regulation, our ability to execute our business strategies or to carry out or expand our businesscoal miner and coal seam gas producer may not be aligned and accordingly, mining operations may be restricted. We may experience substantial delaysdelayed or adversely affected.
Environmental conditions and action groups. Before any mining tenure is granted in obtaining regulatory approvals, permits and licenses for our business operations. Our business may also be adversely affected by future changes in PRC or Australian regulations and policiesAustralia, it is required that affecta comprehensive public environmental assessment on the coal industry. The adoption of new legislation or regulations, or the new interpretation of existing legislation or regulations, may materially and adversely affect our operations, our cost structure or product demand. The occurrence of anyimpact of the foregoing may cause usproposed mining operations be undertaken. Such an assessment involves a public consultation process, which often involves encountering organized environmental or community groups that seek to substantially change our existing operationsrestrict or incur significant compliance costs. For example, the Australia federal government announced proposals to implement a 40% Resource Super Profits Tax generated from non-renewable resources byblock contemplated mining companies, which is currently scheduled to come into effect on July 1, 2012. The tax payable of coal producers will increase substantially should this tax proposal become effective. The newly elected prime minister of Australia, Julia Gillard, later announced certain modifications to the Resource Super Profits Tax proposal, including, without limitation, reducing the number of affected companies, decreasing the applicable tax rate and increasing the range of tax credit available tooperations. Generally, where environmental approvals are granted, conditions are frequently imposed that materially affect mining companies. Notwithstanding the substantial modifications, the new tax proposal will still increase the taxation obligation of coal producers. In addition, we are subject to various uncertainties in relation to the foregoing tax proposal which has not yet been approved by the Australian government, including, without limitation, the final arrangement and the time of implementation. We expect the implementation of the foregoing tax proposal will have a material adverse effect to the profitability of our operations in Australia.operations.
| ITEM 4. | INFORMATION ON THE COMPANY |
| A. | History and Development of our Company |
Overview
Yanzhou Coal Mining Company Limited was established on September 25, 1997 as a joint stock company with limited liability under the Company Law of the PRC (the “Company Law”). The predecessor of our Company, Yanzhou Mining Bureau, was established in 1976. With the approval of the former State Economic and Trade Commission and the former Ministry of Coal Industry in 1996, the predecessor was incorporated under the name Yanzhou Mining (Group) Corporation Limited and subsequently renamed Yankuang Group Corporation Limited after undergoing a reorganization in 1999.
In 1999, the Minister of Foreign Trade and Economic Cooperation, the predecessor of the Ministry of Commerce, approved our conversion into a Sino-foreign joint stock company with limited liability under the Company Law and the Sino-Foreign Joint Venture Law of the PRC.
Our contact information is:
| : | 298 South Fushan Road | ||
| Zoucheng, Shandong Province | ||||
| People’s Republic of China (273500) | ||||
| : | (86) 537 538 2319 | ||
| : | http://www.yanzhoucoal.com.cn | ||
| (the contents of our website do not form part of this annual report) | ||||
Establishment of Ordos Neng Hua and Acquisition of Coal Chemical ProjectAcquisitions
We established Ordos Neng Huawere involved in the Inner Mongolia Autonomous Regionthree acquisitions in December, 2009. Ordos Neng Hua will act2012, a description of which is as our investment management platform for coal mining, coal chemicals and a coal power project in Inner Mongolia. Asfollows:
Acquisition of the date of this annual report, the registered capital of Ordos Neng Hua was RMB3.1 billion.
Subsequently, the Company and Ordos Neng Hua successively completed the following related acquisitions: acquisition of 100% of the equity interests in a 600,000-tonne methanol project, the acquisition of a 61% equity interestEquity Interests in Haosheng Company the acquisition of the entire assets of Anyuan Coal Mine and obtaining the mining rights of Zhuan Longwan coal mine field through public bidding. These acquisitions should assist us in acquiring coal resources in Ordos City, further participating in coal resources development in the Inner Mongolia Autonomous Region and enhancing the sustainable development ability and core competitiveness of the Company.
Acquisition of 100% equity interest in the 600,000-tonne methanol project
Pursuant toOn May 22, 2012, upon approval grantedobtained at the general manager working meeting, held on December 1, 2009, Ordos Neng Hua acquired 100%we completed the acquisition of the equity interests held by Kingboard Chemical Holdings Limited in Inner Mongolia Rongxin Chemicals Co., Ltd, Inner Mongolia Daxin Industrial Gas Co., Ltd and Inner Mongolia Yize Mining Investment Co., Ltd, for a consideration of RMB190 million out of its own resources. The relevant procedures for the share ownership transfer procedures were completed on April 16, 2010. The above companies are responsible for the establishment of the first phase of the 600,000-tonne methanol project.
Acquisition of Inner Mongolia Haosheng Coal Mining Company Limited
Currently, Haosheng Company is primarily responsible for the approval application for the mining project and the grant of the mining rights of Shilawusu Coal Mine field Project in the Inner Mongolia Dongsheng Coal Field.
Pursuant to approval granted at the fifteenth meeting of the fourth session of the Board held on August 20, 2010, we entered into the equity transfer agreement of Haosheng Company and its supplementary agreement on September 6, 2010 and October 19, 2010, respectively. Under such agreements, we acquired 51% of equity interests in Haosheng Company originally held by Shanghai Huayi (Group) Company (“Huayi”), Ordos Jinchengtai Chemical Co., Ltd (“Jinchengtai”) and Shandong Jiutai Chemical Industrial Technology Company Limited (“Jiutai Technology”) in Haosheng Company for a consideration of approximately RMB6,649 million. The Company and other shareholders of Haosheng Company are obligated to inject further capital on a pro-rata basis in order to increase the registered capital from RMB50 million to RMB150 million.
The initial payment of the consideration and capital increase in Haosheng Company in a total amount of approximately RMB2,045.8 million was paid by us on October 20, 2010 and the share ownership transfer procedures were completed on November 4, 2010. We are obligated to pay a second installment of approximately RMB2,659.6 million within 15 working days when any of the following requirements has been met: (i) Haosheng Company obtains the exploration rights license of Shilawusu Coal Mine field; (ii) the mining zone delineation of Shilawsu Coal Mine Zone or other applications related to mining rights have been approved by the Ministry of Land and Resources (the main body to have obtained the mining zone delineation or other mining rights must be Haosheng Company). The third installment of approximately RMB1,994.7 million shall be paid within 10 months after completion of the second payment.
As of March 31, 2011, we entered into an equity transfer agreement of Haosheng Company with Ordos City Jiutaimanlai Coal Mining Company Limited (“Jiutaimanlai”) and Jiutai Technology to acquire 10%9.45% of the equity interests in Haosheng Company held by Jiutaimanlai and Jiutai TechnologyJinchengtai Chemical for a consideration of RMB863.86 million. This amount represented approximately RMB1,313.8 million. We paid the initial payment of approximately RMB394.1 million (representing 30%15.5% of the Group’s audited total amount) on April 7, 2011. Currently, we are processingprofits under CASs of RMB5.5604 billion in 2012. Upon the share ownership transfer procedures. Upon completion of the transfer, we will hold 61% of theacquisition, our equity interests in Haosheng Company. We are obligatedCompany increased to pay the second74.82%.
Gloucester Acquisition
In December 2011, we and third installments upon the same conditions as the payment arrangementsour subsidiary Yancoal Australia entered into a merger proposal deed with Gloucester (amended in our acquisitionMarch 2012), pursuant to which Yancoal Australia implemented a merger by way of 51%a scheme of arrangement under Australian law pursuant to which it or its wholly owned subsidiary acquired all of the equity interests.shares of Gloucester, and Gloucester’s shareholders received a combination of Yancoal Australia ordinary shares and CVR Shares, unless they elected to receive only Yancoal Australia ordinary shares.
Upon approval obtained from the SASAC of the Shandong Provincial Government, the NDRC and the MOC and approval or permission obtained from the Treasury of Australia, the ASX, Gloucester Shareholders and the Supreme Court of Victoria, Australia, the Merger was completed in June 2012 and Yancoal Australia was listed on the ASX on June 28, 2012. Gloucester is currently a wholly owned subsidiary of Yancoal Australia, which is a 78%-owned subsidiary of the Company
Acquisition of AnyuanCoal Mines From Yankuang Group
On April 23, 2012, Yankuang Group and its wholly owned subsidiary, Beisu Company, and our Company entered into an assets transfer agreement, pursuant to which we purchased from Yankuang Group and Beisu Company all of the assets and liabilities of Beisu Coal Mine
Pursuant to approval granted at the general manager working meeting held on November 12, 2010, Ordos Neng Hua entered into Anyuan and Yangcun Coal Mine. The assets included mining rights, building ownership certificates, mining and related equipment and other fixed assets, as well as certain equity investments of Beisu Coal Mine Transfer Agreement and its supplementary agreement on November 20, 2010 and January 20, 2011, respectively, to acquire the total assets of AnyuanYangcun Coal Mine for a consideration of approximately RMB1,435 million. Pursuant toand in Beisheng Industry and Trade, Shengyang Wood and Jiemei Wall Materials. Our entry into the assets transfer agreement Ordos Neng Hua acquiredconstituted a connected transaction of our Company under Chapter 14A of the Anyuan Coal MineHong Kong Listing Rules.
The consideration was determined by the appraised net asset value of the target assets, or RMB824,142,000, as appraised by Beijing China Enterprise Appraisal as of August 31, 2011. The appraisal value was approved by the SASAC of the Shandong Provincial Government on December 1, 2010, but still subjectApril 16, 2012. We completed the acquisition in May 2012.
Assets Disposal of Tianhao Chemicals
Tianhao Chemicals methanol project has ceased production since April 2012, due to relevant governmental approval. Since December 1, 2010, Ordos Neng Hua owns alla shortage of raw materials supply. At the coal produced2012 first extraordinary general meeting of Tianhao Chemicals, the shareholders approved to publicly sell the methanol assets. According to Shandong Zhongxin Assets Appraisal Co., Ltd., the valuation of Tianhao Chemicals’ assets was RMB268 million as of April 30, 2012. The transaction is currently undergoing a sale procedure on the Shandong Property Right Exchange Center.
Bond Offerings
The RMB Bond Offering
In August 2012, we completed the issuance of RMB5 billion aggregate principal amount of guaranteed notes in a public offering in the PRC, comprising one tranche of RMB1 billion notes due 2017 bearing interest of 4.20% per year, and earnings derived from Anyuan Coal Mine.one tranche of RMB4 billion notes due 2022 bearing interest of 4.95% per year (together, the “RMB Bond Offering”). The notes are guaranteed by the Yankuang Group. The notes were listed on the SSE on August 15, 2012. As of the date of this annual report, approximately RMB1,290 million has been paid by Ordos Neng Hua, and the balancewe have utilized all of the consideration is expected to be paidnet proceeds of approximately RMB4.95 billion for working capital purposes.
The RMB Bond Offering include covenants that, in July 2011.
Anyuan Coal Mine, located in Ejin Horo Banner of Ordos City, is an underground coal mine. Anyuan Coal Mine covers an area of 9.26 km2 and with coal reserves of 40.51 million tonnes and recoverable coal reserves of 20.47 million tonnes. Its designed annual production capacity is 600,000 tonnes of raw coal. The Department of Coal Industry of Inner Mongolia Autonomous Region has approved the increase in annual production capacityevent of the mineCompany’s default in payments, limit our ability to, 1.2among other things: distribute dividends to Shareholders, make material investments, merge with or into other companies, pay salaries and bonus to Directors and senior management and transfer major responsible staff to other positions.
The US$ Bond Offering
In May 2012, we completed the issuance of US$1 billion aggregate principal amount of guaranteed notes through Yancoal International Resources Development Co., Limited, our second-tier wholly owned subsidiary in a private placement exempt from registration under the Securities Act, comprising one tranche of US$450 million tonnes. Currently, its expansionnotes due 2017 bearing interest of 4.461% per year and acceptance inspection proceduresone tranche of US$550 million notes due 2022 bearing interest of 5.730% per year (together, the “US$ Bond Offering”). The notes are in progress.
Bidding for Mining Rights of Zhuan Longwan Coal Mine Field
Pursuant to approval granted atguaranteed by our Company. The notes were listed on the nineteenth meetingHKSE on May 17, 2012. As of the fourth sessiondate of this annual report, we have utilized all of the Board held on January 28, 2011, Ordos Neng Hua successfully bidnet proceeds of approximately US$991.2 million for the mining rights of Zhuan Longwan coal mine field of Dongsheng Coal Field in Inner Mongolia Autonomous Region for a consideration of RMB7,800 million. Ordos Neng Hua paid the first installment of RMB3,120 million (representing 40%working capital purposes.
The indenture of the total consideration) on February 25, 2011. Ordos Neng Hua is obligatedUS$ Bond Offering includes covenants that limit our ability to, payamong other things: use assets as securities in other transactions, enter into sale and leaseback transactions and sell certain assets or merge with or into other companies. If we experience a change of control (as defined in the second installment of RMB2,340 million (representing 30%indenture), we will be required to offer to purchase the notes at a purchase price equal to 101% of the total consideration) in full by November 30, 2011principal amount , plus accrued and the third installment of RMB2,340 million (representing 30% of the total consideration) in full by November 30, 2012.
Pursuant to the Announcement in relation to Public Auction of the Mining Rights of Zhuan Longwan Coal Mine Field of Dongsheng Coal Field issued by the Department of Land and Resources of the Inner Mongolia Autonomous Region, the coal mining field of Zhuan Longwan coal mine covers an area of 43.50 km2 and with reserves of 548 million tonnes. Extra large mines with a designed production capacity of 5 million tonnes per year can be constructed in the coal mine field.
The Department of Land and Resources of the Inner Mongolia Autonomous Region was entrusted by the Ministry of Land and Resources of the PRC to conduct the auction. At present, Ordos Neng Hua is undertaking the application procedure for the mining rights of Zhuan Longwan coal mine zone. The bidding was approved at the 2010 annual general meeting of the Company held on May 20, 2011.
Acquisition of Ashton Coal Mine Joint Venture in Australia
Pursuant to approval granted at the seventeenth meeting of the fourth session of the Board held on December 30, 2010, White Mining (NSW) Pty Limited, a wholly-owned subsidiary of Yancoal Australia, started the process of acquiring 30% of the equity interests in the Ashton Coal Mine Joint Venture originally held by Austral-Asia Coal Holdings Pty Ltd, a wholly-owned subsidiary of Singapore IMC Group, for a consideration of US$250 million. Upon the completion of this acquisition in May 2011, our ownership in the Ashton Coal Mine Joint Venture increased from 60% to 90%.
Ashton Coal Mine, located in Hunter Valley, New South Wales, Australia, consists of an open-cut coal mine and an underground coal mine, with annual designed production capacity of 5.20 million tonnes of raw coal. According to an assessment based on the Australian JORC Code, the aggregate coal reserves of Ashton Coal Mine amounted to 96.50 million tonnes. The types of coal are semi-soft coking coal and premium thermal coal with characteristics of low ash and high calorific value.
Disposal of equity interests in Minerva Coal Mine Joint Venture in Australia
Pursuant to approval granted at the seventeenth meeting of the fourth session of the Board held on December 30, 2010, Felix, a wholly-owned subsidiary of Yancoal Australia, disposed its 51% equity interests in the Minerva Coal Mine Joint Venture to Sojitz Coal Resources Pty Ltd, a wholly-owned subsidiary of Sojitz Corporation in Australia, for a consideration of A$201 million. Upon completion of the disposal, we have no interest in the Minerva Mine Coal Joint Venture.
Minerva Coal Mine, located in Bowen Basin, Queensland, is an open-cut coal mine, with annual production capacity of 2.80 million tonnes of raw coal. According to an assessment based on the Australia JORC Code, the aggregate coal resources of Minerva Coal Mine amounted to 76 million tones, with reserves of 23.6 million tonnes. The type of coal is thermal coal.
Establishment of Yankuang Group Finance Company Limited
Pursuant to approval granted at the thirteenth meeting of the third session of the Board held on August 3, 2007, we established a joint venture company, Yankuang Group Finance Company Limited (“Yankuang Finance”) on September 13, 2010, jointly with Yankuang Group and China Credit Trust Co., Ltd. The registered capital of Yankuang Finance is RMB500.0 million, of which we have contributed cash of RMB125.0 million representing 25% of the equityunpaid interest. Yankuang Finance commenced operation on November 1, 2010, with its principal business including making the bill acceptance and discount for the members and accepting deposits from and lending funds to members.
At the fourteenth meeting of the fourth session of the Board held on April 23, 2010, we entered into the Financial Services Agreement with Yankuang Finance on January 7, 2011. Under the financial service agreement, Yankuang Finance agreed to provide deposit service, loan service and miscellaneous financial services to us with transaction caps for 2010 and 2011. Pursuant to the agreement, the fees charged by Yankuang Finance for the financial services to be provided to us shall be in accordance with the relevant benchmark rates determined by the PBOC or the CBRC (if any), which shall not exceed those charged by the major commercial banks in the PRC for the same kind of financial services provided to us. The agreement also provided risk control measures on funds for both parties to secure the safety of funds.
Establishment of Shaanxi Future Energy Chemical Corp. Ltd
Pursuant to approval granted at the seventeenth meeting of the fourth session of the Board held on December 30, 2010, we established Shaanxi Future Energy Chemical Corp. Ltd (“Future Energy”) jointly with Yankuang Group and Shaanxi Yanchang Petroleum (Group) Corp. Ltd on February 25, 2011. The registered capital of Future Energy is RMB5,400 million, of which we will contribute RMB1,350 million in cash, representing an equity interest of 25%. The registered capital will be paid in full in three installments by August 2012. Future Energy will mainly engage in investment and participation in the coal liquefaction project in Shaanxi Province as well as the preparation for development of ancillary coal mines.
Increasing Investments in Ordos Neng Hua
Pursuant to approval granted at the eighteenth meeting of the fourth session of the Board held on January 17, 2011, we increased our capital investment in Ordos Neng Hua by RMB2,600 million with our own funds. On January 24, 2011, the registered capital of Ordos Neng Hua increased from RMB500 million to RMB3,100 million.
Increasing Investments in Yancoal Australia
Pursuant to approval granted at the seventeenth meeting of the fourth session of the Board held on December 30, 2010, we increased the capital investment in Yancoal Australia by A$909 million (approximately RMB5,900 million) with our own funds. Upon completion of the capital injection, our capital investment in Yancoal Australia increased from A$64 million to A$973 million. The capital increase has been approved by the Foreign Investment Review Board of Australia and the NDRC and the procedures for remitting the capital increase are currently in progress.
Capital Expenditures
Our principal source of cash in 20102012 was cash generated from our operating activities, the RMB Bond Offering, the US$ Bond Offering and bank borrowings. Our capital expenditures in 20102012 were primarily for operational capital expenditures, purchase of properties, machinery and equipment, payment of dividends, the acquisitionand consideration paid for our acquisitions of 51%assets and equity interests in Haosheng Company, the acquisition of Anyuan Coal Mine and investment in Yankuang Finance.interests.
The following table sets forth a summary of our capital expenditures in the periods indicated:
| Year Ended December 31, | Year Ended December 31, | |||||||||||||||||||||||||||||||
| 2008 | 2009 | 2010 | 2010 | 2010 | 2011 | 2012 | 2012 | |||||||||||||||||||||||||
| RMB | RMB | RMB | US$ | RMB | RMB | RMB | US$ | |||||||||||||||||||||||||
| (in millions) | (in millions) | |||||||||||||||||||||||||||||||
Capital Expenditure | ||||||||||||||||||||||||||||||||
Coal mining | 1,925.3 | 24,086.5 | 3,298.0 | 486.5 | 3,298.0 | 22,736.5 | 19,170.1 | 3,077.0 | ||||||||||||||||||||||||
Coal railway transportation | 29.2 | 11.4 | 34.5 | 5.1 | 34.5 | 40.9 | 33.8 | 5.4 | ||||||||||||||||||||||||
Electricity power and methanol | 925.1 | 1,220.0 | 452.8 | 66.8 | 452.8 | 555.2 | 1,605.3 | 257.7 | ||||||||||||||||||||||||
Undistributed items | — | — | — | — | — | — | — | — | ||||||||||||||||||||||||
Corporate | 2.1 | 7.0 | — | — | — | 3.8 | 0.1 | — | ||||||||||||||||||||||||
|
|
|
| |||||||||||||||||||||||||||||
Total | 2,881.7 | 25,324.9 | 3,785.3 | 558.4 | 3,785.3 | 23,336.4 | 20,809.2 | 3,340.1 | ||||||||||||||||||||||||
|
|
|
| |||||||||||||||||||||||||||||
Our planned capital expenditures for 2011 is2013 are approximately RMB5,103.1RMB12,004.6 million. For more information, see “Item 5. Operating and Financial Review and Prospects — B. Liquidity and Capital Resources — Capital Expenditures” in this annual report.
Potential Takeovers by Third Parties
There were no indications of any public takeover offers by third parties in respect of our common shares in 2010.
| B. | Business Overview |
The Company isWe are one of the primary coal producers in China and Australia, with rapidly growing coal mining operations in Australia.operations. We primarily engage in the mining, preparationwashing, processing and saledistribution of coal as well as thethrough railway transportation of coal. In recent years, we have expanded our operations to include the productiontransportation. We offer a wide variety of coal chemicals and generation of electricity and heat.
The Company directly owns and operates six coal mines: Nantun, Xinglongzhuang, Baodian, Dongtan, Jining II and Jining III (collectively, the “Six Coal Mines”), which produce a substantial majority of our total coal output. As of December 31, 2010, the Six Coal Mines had an estimated collective in-place proven and probable reserve base of approximately 1,797.3 million tonnes.
Through our subsidiaries, we also hold equity interests in a number of coal mines in China and Australia. Yancoal Australia operates Austar Coal Mine, Yarrabee Coal Mine, Minerva Coal Mine, Ashton Coal Mine and Moolarben Coal Mine, which collectively hold approximately 547.3 million tonnes of recoverable coal reserves. Shanxi Nenghua operates Tianchi Coal Mine, which holds approximately 26.7 million tonnes of recoverable reserves, and Heze Nenghua operates Zhaolou Coal Mine, which holds approximately 105.0 million tonnes of recoverable reserves. Since December 1, 2010, Ordos Neng Hua operates Anyuan Coal Mine, which holds approximately 20.5 million tonnes of recoverable coal reserves.
Our main products in our coal business areincluding thermal coal, semi-hard coking coal, semi-soft coking coal, PCI coal and 1/3 coking other mixed coal products which are sold to power plants, metallurgical mills, chemical manufacturers, construction material manufacturers and fuel trading companies in Eastern China and other countries, such asincluding Japan and South Korea. Since 2004, we have expanded our operations to include the production of coal chemicals and the generation of electricity and heat. We also commenced our potash exploration business in 2011.
As of December 31, 2012, we were 52.86% owned by our parent, the Yankuang Group, which is wholly owned by the Shandong Provincial Government under the control of the SASAC of the Shandong Provincial Government. The Yankuang Group was founded in 1973 to focus on coal mining and sales, the coal chemical industry, power generation, aluminum production, machinery manufacturing and financial investments. We were established in 1997 and listed on the SSE, HKSE and NYSE in 1998. In addition, our subsidiary, Yancoal Australia, was listed on the ASCX in 2012. Our revenue increased from RMB33,944.3 million in 2010 to RMB47,065.8 million in 2011 and further to RMB58,146.2 million in 2012, representing a CAGR of 30.9%.
As of December 31, 2012, we owned and operated 21 coal mines across regions with abundant coal resources, including Shandong and Shanxi Provinces and the Inner Mongolia Autonomous Region in China, as well as Queensland, New South Wales and Western Australia in Australia. In addition, as of December 31, 2012, we had nine developmental-stage projects in China and Australia and a number of exploration tenements in Australia that might be potentially developed.
We directly own and operate six coal mines in the PRC, namely, Nantun, Xinglongzhuang, Baodian, Dongtan, Jining II and Jining III, which produced in the aggregate approximately 48.8% of our total coal output in 2012. As of December 31, 2012, these six mines had approximately 1,729.43 million tonnes of in-place proven and probable reserves. In addition, we directly own and operate Beisu and Yangcun Coal Mines. We also hold equity interests in a number of coal mines in China through our subsidiaries. Shanxi Nenghua operates Tianchi Coal Mine, which holds approximately 25.7 million tonnes of recoverable reserves; Heze Nenghua operates Zhaolou Coal Mine, which holds approximately 102.2 million tonnes of recoverable reserves; and Ordos Neng Hua operates Anyuan Coal Mine and Wenyu Coal Mine. In addition, we had four projects under development in China as of December 31, 2012.
The map below shows the approximate locations of our coal mines and project in China.
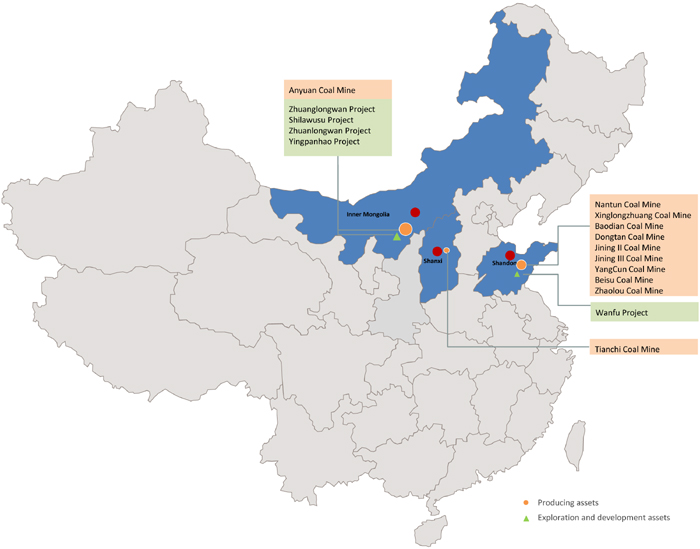
We conduct our operations in Australia primarily through our subsidiaries, Yancoal Australia and Yancoal International (Holding). Yancoal Australia currently operates six coal mines in Australia including Austar, Yarrabee, Ashton, Moolarben, Gloucester and Donaldson which collectively held approximately 703.7 million tonnes of JORC-compliant reserves as of December 31, 2012. In addition, Yancoal Australia owns approximately 50% of the equity interest in the joint venture that owns and operates Middlemount Coal Mine, which held approximately 96.0 million tonnes of JORC-compliant reserves as of December 31, 2012. Yancoal Australia also holds a developmental-stage project, Monash. Yancoal International (Holding) currently owns Cameby Downs and Premier Coal Mines, which collectively held approximately 590.2 million tonnes of JORC-compliant reserves as of December 31, 2012, as well as the developmental-stage projects Athena, Harrybrandt, Wilpeena and Wilga. In addition, we had a number of exploration tenements in Australia with potential for developments as of December 31, 2012.
The map below shows the approximate locations of our coal mines and projects in Australia.
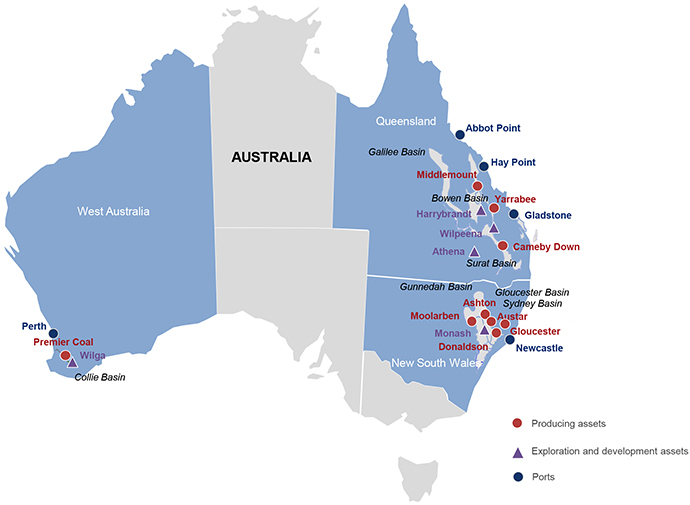
Coal Business
We are primarily engaged in the production of coal, which involves the mining, washing, processing and distribution of coal. Historically, our coal operations were primarily based in the PRC, but we began our operations in Australia in 2004 after we acquired the Austar Coal Mine, and have rapidly expanded our Australian coal operations since the fourth quarter of 2009 when we acquired Felix and in June 2012 when we completed the merger with Gloucester. Our products consist principallyprimarily of thermal coal, semi-soft coking coal, and semi-hard coking coal, PCI coal and other mixed coal products which are suitable for power generation and metallurgical production, respectively.production. The following table sets forth the specifications and principal applications of our coal products.
| Sulfur Content | Range of and Average Ash Content | Calorific Value | Washed | Principal Applications | ||||||||
| % | % | (megajoule/ kilogram) | ||||||||||
The Company | ||||||||||||
No. 1 clean coal | 0.44 | 7-8 average 7.79 | 26-28 average 27.84 | Yes | High quality metallurgical production | |||||||
No. 2 clean coal | 0.49 | 8-9 average 8.57 | 26-28 average 27.57 | Yes | Metallurgical production, construction, liquified coal production | |||||||
No. 3 clean coal | 0.53 | 10-11 average 10.43 | 26.3-26.9 average 26.63 | Yes | Electricity generation and coal chemical production | |||||||
Lump coal | 0.48 | 9-14 average 9.81 | 25-28 average 27.86 | Yes | Construction, power generation, coal for oven application | |||||||
Screened raw coal | 0.6 | 18-27 average 25.7 | 20-23.5 average 21.36 | No | Power generation | |||||||
Mixed coal | 0.6 | 22-30 average 29.3 | 18-22 average 20.1 | Yes | Power generation | |||||||
Shanxi Nenghua | ||||||||||||
Screened raw coal | 1.06 | 27-30, average 29 | 21-23, average 22.05 | No | Power generation | |||||||
Heze Nenghua | ||||||||||||
No. 2 clean coal | 0.49 | 8-9, average 8.43 | 29.85 | Yes | Metallurgical production, construction, coal slurry | |||||||
Mixed coal and others | 0.51 | average 25.69 | average 22.25 | Yes | Power generation | |||||||
Yancoal Australia | ||||||||||||
Semi-hard coking coal | 1.30 | 5.0 | average 33.18 | Yes | Metallurgical production | |||||||
Semi-soft coking coal | 0.65 | 9.5 | average 29.82 | Yes | Metallurgical production, construction | |||||||
PCI coal | 0.7 | 9.5-10.5 | average 30.66 | Yes | Metallurgical production | |||||||
Thermal coal | 0.5-0.6 | 13.5-17.0 | 27.30-27.93 | No | Power generation | |||||||
In 2010, we produced approximately 49.4 million tonnes of raw coal, including approximately 34.3 million tonnes by the Company, approximately 12.0 million tonnes by Yancoal Australia, approximately 1.5 million tonnes by Shanxi Nenghua and approximately 1.6 million tonnes by Heze Nenghua.
We sold approximately 49.6 million tonnes of coal in 2010, which consisted of approximately 1.4 million tonnes of internal sales and approximately 48.2 million tonnes of external sales, consisting of approximately 5.4 million tonnes that we had purchased from other coal producers for resale. Our coal sales volume in 2010 increased approximately 11.6 million tonnes, or 30.6%, from 2009 primarily due to the expansion of our Australian operations. We sold approximately 44.3 million tonnes of self-produced coal, representing an increase of approximately 8.3 million tonnes or 23.1%, compared to 2009. The Company sold approximately 33.7 million tonnes of coal, representing an increase of approximately 0.3 million tonnes, or 1.0%, from 2009. Shanxi Nenghua and Heze Nenghua sold approximately 1.5 million and approximately 1.1 million tonnes of coal, respectively. Yancoal Australia sold approximately 8.0 million tonnes of coal, representing an increase of approximately 6.4 million tonnes, or 392.0%, in sales volume from 2009.
| Sulfur Content | Range of and Average Ash Content | Calorific Value | Washed | Principal | ||||||
| % | % | (megajoule/ kilogram) | ||||||||
The Company | ||||||||||
No. 1 clean coal | 0.43 | 7-8 average 7.75 | 26-28 average 28 | Yes | High quality metallurgical production | |||||
No. 2 clean coal | 0.53 | 8-9 average 8.36 | 26-28 average 27.94 | Yes | Metallurgical production, construction, liquid coal production | |||||
No. 3 clean coal | 0.57 | 10-11 average 10.32 | 26.3-26.9 average 26.79 | Yes | Electricity generation and coal chemical production | |||||
Lump coal | 0.51 | 9-14 average 10.83 | 25-28 average 27.44 | Yes | Construction, power generation, coal for oven application | |||||
Mixed coal | 0.90 | 22-30 average 27.93 | 18-22 average 20.37 | Yes | Power generation | |||||
Shanxi Nenghua | ||||||||||
Screened raw coal | 1.07 | 27-35, average 33.91 | 19-23, average 19.93 | No | Power generation | |||||
Lump coal | 0.77 | 9-11, average 9.09 | 30-32, average 30.72 | Power generation, construction | ||||||
Heze Nenghua | ||||||||||
No. 2 clean coal | 0.71 | 8-9, average 8.41 | average 29.73 | Yes | Metallurgical production, construction | |||||
Mixed coal | 1.2 | average 31.87 | average 19.07 | Yes | Power generation | |||||
Ordos Nenghua | ||||||||||
Screened raw coal | <0.63 | 7.85-14.00, average 13.50 | 20.90-21.33, average 22.0 | No | Power generation | |||||
Yancoal Australia | ||||||||||
Semi-hard coking coal | 1.30 | 5.0 | average 33.18 | Yes | Metallurgical production | |||||
Semi-soft coking coal | 0.65 | 9.5 | average 29.82 | Yes | Metallurgical production, construction | |||||
PCI coal | 0.7 | 9.5-10.5 | average 30.66 | Yes | Metallurgical production | |||||
Thermal coal | 0.5-0.6 | 13.5-17.0 | 27.30-27.93 | No | Power generation |
The following table sets forth our principal coal products by sales volume and sales income of coal infor the indicated periods.periods indicated. For the purposes of the table below, the figures of sales income and sales volume include inter-segment sales.
The Company No. 1 clean coal No. 2 clean coal No. 3 clean coal Lump coal Screened raw coal Mixed coal and others Shanxi Nenghua Screened raw coal Heze Nenghua No. 2 clean coal Screened raw coal Mixed coal and others Ordos Neng Hua Screened raw coal Yancoal Australia Semi-hard coking coal Semi-soft coking coal PCI coal Thermal coal Yancoal International (Holding) Thermal coal Externally purchased coal Total Year Ended December 31, 2010 2011 2012 Sales volume
(‘000 tonnes) Sales income(1)
(RMB
in millions) Sales volume
(‘000 tonnes) Sales income(1)
(RMB
in millions) Sales volume
(‘000 tonnes) Sales income(1)
(RMB in
millions) 33,657 21,324.8 33,276 22,827.6 33,943 20,789.4 691 677.2 534 587.9 385 353.0 9,002 8,771.2 8,950 9,373.4 9,042 8,039.5 1,560 1,293.7 2,222 1,969.3 2,540 1,829.1 1,297 1,206 1,786 1,845.5 1,245 1,112.9 16,726 8,085.5 13,495 6,714.0 14,190 7,195.4 4,381 1,290.7 6,289 2,337.5 6,541 2,259.5 1,498 572.3 1,223 572.1 1,343 469.5 1,498 572.3 1,223 572.1 1,343 469.5 1,079 833.0 2,004 1,829.2 2,292 1,662.5 546 603.2 1,211 1,471.0 1,183 1,234.4 119 62.6 37 19.7 — — 414 167.2 756 338.4 1,109 428.1 — — 4,379 1,273.0 6,834 1,621.7 — — 4,379 1,273.0 6,834 1,621.7 8,022 6,210.2 10,060 9,353.4 14,350 9,296.0 1,146 1,043.3 914 1,023.2 506 377.4 1,279 1,202.3 1,049 1,319.6 1,124 1,048.1 2,046 1,893.8 2,333 2,988.9 2,056 1,917.6 3,551 2,070.8 5,764 4,021.7 10,663 5,952.9 — — — — 2,965 994.3 — — — — 2,965 994.3 5,378 3,990.0 13,308 9,613.2 32,421 21,586.5 49,634 32,930.3 64,250 45,468.5 94,148 56,419.9
| Year Ended December 31, | ||||||||||||||||||||||||
| 2008 | 2009 | 2010 | ||||||||||||||||||||||
| Sales volume (‘000 tonnes) | Sales income (RMB in millions) | Sales volume (‘000 tonnes) | Sales income (RMB in millions) | Sales volume (‘000 tonnes) | Sales income (RMB in millions) | |||||||||||||||||||
The Company | 32,402 | 21,094 | 33,330 | 17,507.3 | 33,657 | 21,324.8 | ||||||||||||||||||
No. 1 clean coal | 363 | 407 | 694 | 526.6 | 691 | 677.2 | ||||||||||||||||||
No. 2 clean coal | 7,431 | 7,800 | 8,362 | 6,414.4 | 9,002 | 8,771.2 | ||||||||||||||||||
No. 3 clean coal | 2,916 | 2,654 | 1,717 | 1,156 | 1,560 | 1,293.7 | ||||||||||||||||||
Lump coal | 1,161 | 1,159 | 1,402 | 1,036.8 | 1,297 | 1,206 | ||||||||||||||||||
Screened raw coal | 17,934 | 8,669 | 17,100 | 7,359.6 | 16,726 | 8,085.5 | ||||||||||||||||||
Mixed coal and others | 2,597 | 404 | 4,055 | 1,013.4 | 4,381 | 1,290.7 | ||||||||||||||||||
Shanxi Nenghua | 1,099 | 298 | 986 | 289.5 | 1,498 | 572.3 | ||||||||||||||||||
Screened raw coal | 1,099 | 298 | 986 | 289.5 | 1,498 | 572.3 | ||||||||||||||||||
Heze Nenghua | — | — | 16 | 8.3 | 1,079 | 833.0 | ||||||||||||||||||
No. 2 clean coal | — | — | 5 | 4.9 | 546 | 603.2 | ||||||||||||||||||
Screened raw coal | — | — | 2 | 1.2 | 119 | 62.6 | ||||||||||||||||||
Mixed coal and others | — | — | 9 | 2.2 | 414 | 167.2 | ||||||||||||||||||
Yancoal Australia | 1,484 | 1,636 | 1,627 | 1,199.3 | 8,022 | 6,210.2 | ||||||||||||||||||
Semi-hard coking coal | 1,484 | 1,636 | 1,627 | 1,199.3 | 1,146 | 1,043.3 | ||||||||||||||||||
Semi-soft coking coal | — | — | — | — | 1,279 | 1,202.3 | ||||||||||||||||||
PCI | — | — | — | — | 2,046 | 1,893.8 | ||||||||||||||||||
Thermal coal | — | — | — | — | 3,551 | 2,070.8 | ||||||||||||||||||
Externally purchased coal | 2,577 | 1,910 | 2,058 | 1,112.5 | 5,378 | 3,990.0 | ||||||||||||||||||
Total | 37,562 | 24,938 | 38,017 | 20,116.9 | 49,634 | 32,930.3 | ||||||||||||||||||
| (1) | Sales income comprises the invoiced amount of coal sold net of returns and discounts. |
Sales and Marketing
A significant portion of our PRC domestic sales in 2010 wasis made on the spot market or pursuant to strategic framework agreements, while the remainder of our coal sales wereare made pursuant to sales contracts. Our customers may also sign letters of intent from time to time. These sales contracts and letters of intent generally specify the quantity and delivery schedule of the coal to be purchased, generally for a term not exceeding one year. The contract price in sales contracts areThese strategic framework agreements generally specify the resultquantity of market-based negotiations between the contracting parties, while the contract pricescoal to be purchased. Prices for letters of intentstrategic framework agreements are generally determined atin the timeannual sales contracts or monthly sales contracts which we enter under the strategic framework agreements.
We sell the majority of saleour domestic coal products to reflect prevailingpower plants, metallurgical mills, coking manufacturers, chemical manufacturers and construction material manufacturers with whom we have established long-standing and stable relationships. The majority of the coal sales of our Australian subsidiary, Yancoal Australia, are to power plants and metallurgical mills. The following table sets forth a breakdown of our sales income, which represents the invoiced amount of products sold net of returns and discounts of coal by the industry of our customers for the periods indicated. For the purposes of the table below, the figures of sales income include inter-segment sales.
| Year Ended December 31, | ||||||||||||||||||||||||
| 2010 | 2011 | 2012 | ||||||||||||||||||||||
| Sales income(1) | % of Sales income | Sales income(1) | % of Sales income | Sales income(1) | % of Sales income | |||||||||||||||||||
(RMB in millions) | (RMB in millions) | (RMB in millions) | ||||||||||||||||||||||
Power plants | 7,493.8 | 22.8 | 8,875.0 | 19.5 | 8,230.0 | 14.6 | ||||||||||||||||||
Metallurgical mills | 5,200.2 | 15.8 | 6,445.7 | 14.2 | 4,902.7 | 8.7 | ||||||||||||||||||
Chemical manufacturers | 1,405.3 | 4.3 | 1,740.6 | 3.8 | 6,830.0 | 12.1 | ||||||||||||||||||
Others(2) | 18,831.0 | 57.2 | 28,407.2 | 62.5 | 36,457.2 | 64.6 | ||||||||||||||||||
|
|
|
|
|
|
|
|
|
|
|
| |||||||||||||
Total | 32,930.3 | 100.0 | 45,468.5 | 100.0 | 56,419.8 | 100.0 | ||||||||||||||||||
|
|
|
|
|
|
|
|
|
|
|
| |||||||||||||
| (1) | Sales income comprises the invoiced amount of coal sold net of returns and discounts. |
| (2) | Others comprises industries such as coking and construction material manufacturing. |
The following table sets forth a breakdown of sales income of coal by geographical region for the periods indicated. For the purposes of the table below, the figures of sales income include inter-segment sales.
| Year Ended December 31, | ||||||||||||||||||||||||
| 2010 | 2011 | 2012 | ||||||||||||||||||||||
| Sales income(1) | % of sales income | Sales income(1) | % of sales income | Sales income(1) | % of sales income | |||||||||||||||||||
| (RMB in millions) | (RMB in millions) | (RMB in millions) | ||||||||||||||||||||||
China | 27,619.7 | 83.9 | 36,703.8 | 80.7 | 46,792.6 | 82.9 | % | |||||||||||||||||
Eastern China | 21,861.5 | 66.4 | 28,464.1 | 62.6 | 42,835.4 | 75.9 | % | |||||||||||||||||
Southern China | 511.9 | 1.6 | 2,449.6 | 5.4 | 76.1 | 0.1 | % | |||||||||||||||||
Northern China | 251.1 | 0.8 | 211.4 | 0.5 | 2,957.6 | 5.3 | % | |||||||||||||||||
Other regions | 4,995.2 | 15.2 | 5,578.8 | 12.3 | 923.5 | 1.6 | % | |||||||||||||||||
Japan | 2,349.0 | 7.1 | 4,030.3 | 8.9 | 1,777.9 | 3.2 | % | |||||||||||||||||
South Korea | 1,920.0 | 5.8 | 1,972.4 | 4.3 | 2,394.2 | 4.2 | % | |||||||||||||||||
Australia | 482.2 | 1.5 | 271.0 | 0.6 | 2,297.6 | 4.1 | % | |||||||||||||||||
Others | 559.3 | 1.7 | 2,490.9 | 5.5 | 3,157.6 | 5.6 | % | |||||||||||||||||
|
|
|
|
|
|
|
|
|
|
|
| |||||||||||||
Total | 32,930.3 | 100.0 | 45,468.5 | 100.0 | 56,419.8 | 100.0 | ||||||||||||||||||
|
|
|
|
|
|
|
|
|
|
|
| |||||||||||||
| (1) | Sales income comprises the invoiced amount of coal sold net of returns and discounts. |
Our domestic coal sales are concentrated primarily in eastern China, particularly in Shandong and, to a lesser extent, in northern China. Our sales income, which represents the invoiced amount of products sold net of returns and discounts, generated from eastern China as a percentage of total sales income was 66.4%, 62.6% and 75.9% in 2010, 2011 and 2012, respectively. The majority of our sales income is in the PRC. In 2010, 2011 and 2012, we generated 83.9%, 80.7% and 82.9%, respectively, of our sales income from the PRC.
The following table sets forth a breakdown of export sales of our Company and Yancoal Australia for the periods indicated.
| Year Ended December 31, | ||||||||||||||||||||||||
| 2010 | 2011 | 2012 | ||||||||||||||||||||||
| Sales income(1) | % of sales income | Sales income(1) | % of sales income | Sales income(1) | % of sales income | |||||||||||||||||||
| (RMB in millions) | (RMB in millions) | (RMB in millions) | ||||||||||||||||||||||
The Company | ||||||||||||||||||||||||
Japan | 9.7 | 0.2 | 14.3 | 0.2 | 7.4 | 0.1 | ||||||||||||||||||
Our Australian subsidiaries | ||||||||||||||||||||||||
South Korea | 2,349.0 | 38.5 | 4,030.3 | 44.2 | 2,394.2 | 29.9 | ||||||||||||||||||
Japan | 1,910.3 | 31.3 | 1,958.1 | 21.5 | 1,770.5 | 22.1 | ||||||||||||||||||
China | 909.4 | 14.9 | 603.0 | 6.6 | 670.4 | 8.4 | ||||||||||||||||||
Others | 926.4 | 15.2 | 2,506.7 | 27.5 | 3,157.6 | 39.5 | ||||||||||||||||||
|
|
|
|
|
|
|
|
|
|
|
| |||||||||||||
Total | 6,104.8 | 100.0 | 9,112.4 | 100.0 | 8,000.1 | 100.0 | ||||||||||||||||||
|
|
|
|
|
|
|
|
|
|
|
| |||||||||||||
| (1) | Sales income comprises the invoiced amount of coal sold net of returns and discounts. |
Export sales, excluding the coal sales in Australia by our Australian subsidiaries, represent only a small percentage of our total coal sales income. In 2010, 2011 and 2012, we generated 18.5%, 20.0% and 14.2%, respectively, of our sales income from export sales. Our major overseas markets include South Korea and Japan. The majority of our overseas customers are located in Asia, and South Korea is our biggest market prices.in this region. Even though we conduct all of our export sales from the PRC through export agents, we maintain close relationships with our overseas customers.
In 2010, 2011 and 2012, our Australian subsidiaries’ domestic sales income was 1.9%, 2.7% and 22.3%, respectively, of their total sales income and in these same years their export sales income was 98.1%, 97.3% and 77.7%, respectively, of its total sales income. Our Australian subsidiaries’ export sales income represented 99.8%, 99.8% and 99.9% of our total export sales income in 2010, 2011 and 2012, respectively. Our Australian subsidiaries primarily conduct their export sales directly by entering into agreements with end user customers. Our Australian subsidiaries also export a small portion of coal through export agents with which our Australian subsidiaries have established longstanding relationships. The primary destinations for the export sales of our Australian subsidiaries are South Korea, Japan and China.
Customers
As of December 31, 2012, our major customers include Huadian International, Yongcheng Coal and Electricity Holding Group Shanghai Co., Ltd., Noble Resources Limited, Linyi Yehua Coking Co., Ltd. and Baoshan Iron & Steel Co., Ltd., among which Huadian International was our largest customer. In 2010, 2011 and 2012, sales to our top five largest customers accounted for 24.7%, 19.4% and 19.4% of our sales income, respectively. In 2010, 2011 and 2012, sales to our largest customer, Huadian International, accounted for 13.0%, 8.5% and 6.3%, respectively, of our sales income. A substantial portion of Huadian International’s coal purchases was, in turn, supplied to Zouxian Power Plant.
Leveraging the high quality of our products and the strength of our brand, we have established long-term relationships with our customers. We make significant efforts to establish and maintain long-term cooperative relationships with our customers, and in particular, with our key customers. We have annual evaluations of our customers to identify key customers. To maintain the relationships with our key customers, we generally provide favorable price terms and product delivery priority. Our sales and marketing department conducts routine customer visits and customer surveys to keep abreast of market developments, collect and evaluate customers’ responses, maintain customer relationships and continually improve our business. In addition, we closely monitor the market information about eastern China, South Korea, Japan and other regions, which we use for business planning and execution.
We have a flexible credit policy, and the credit terms we grant to our customers may vary from customer to customer depending on each customer’s creditworthiness, historical relationship with the Company and the credit amount involved. We may allow open accounts, require acceptance bills or require cash on delivery. We rely on data from our ERPenterprise resource planning system to determine the appropriate payment arrangement and credit terms for each customer, which generally do not exceed 180 days. We evaluate the creditworthiness of potential new customers before entering into a sales contract with them and reassess the creditworthiness of all of our customers on an annual basis. For customers without a strong credit history, we require them to settle their accounts upon delivery. A majority of our domestic coal sales is made to power plants, metallurgical mills, chemical manufacturers and construction material manufacturers with whom we have established long-standing and stable relationships.
Sales taxes include resource taxes imposed by Shandong and Shanxi Provinces. The applicable resource tax rate is RMB3.6 per tonne for our coal mines located in Shandong Province and RMB3.2 per tonne for our coal mines in Shanxi Province. These taxes are paid to the local tax bureau. The following table sets forth a breakdown of our sales income, which represents the invoiced amount of products sold net of returns and discounts of coal by the industry of our customers for the periods indicated. For the purposes of the table below, the figures of sales income include inter-segment sales.
| Year Ended December 31, | ||||||||||||||||||||||||
| 2008 | 2009 | 2010 | ||||||||||||||||||||||
| Sales income | % of sales income | Sales income | % of sales income | Sales income | % of sales income | |||||||||||||||||||
| (RMB in millions) | (RMB in millions) | (RMB in millions) | ||||||||||||||||||||||
Power plants | 7,641.1 | 30.6 | 5,845.4 | 29.1 | 7,493.8 | 22.8 | ||||||||||||||||||
Metallurgical mills | 3,574.7 | 14.3 | 2,085.3 | 10.4 | 5,200.2 | 15.8 | ||||||||||||||||||
Chemical manufacturers | 4,526.5 | 18.2 | 2,764.3 | 13.7 | 1,405.3 | 4.3 | ||||||||||||||||||
Others | 9,195.6 | 36.9 | 9,421.9 | 46.8 | 18,831.0 | 57.2 | ||||||||||||||||||
Total | 24,937.9 | 100.0 | 20,116.9 | 100.0 | 32,930.3 | 100.0 | ||||||||||||||||||
Our domestic coal sales are concentrated in Eastern China, particularly in Shandong Province. The following table sets forth a breakdown of sales income of coal by geographical region for the periods indicated. For the purposes of the table below, the figures of sales income include inter-segment sales.
| Year Ended December 31, | ||||||||||||||||||||||||
| 2008 | 2009 | 2010 | ||||||||||||||||||||||
| Sales income | % of sales income | Sales income | % of sales income | Sales income | % of sales income | |||||||||||||||||||
| (RMB in millions) | (RMB in millions) | (RMB in millions) | ||||||||||||||||||||||
China | 23,066.5 | 92.5 | 19,081.7 | 94.9 | 27,619.7 | 83.9 | ||||||||||||||||||
Eastern China | 19,819.4 | 79.5 | 14,573.1 | 72.4 | 21,861.5 | 66.4 | ||||||||||||||||||
Southern China | 1,246.4 | 5.0 | 340.8 | 1.7 | 251.1 | 0.8 | ||||||||||||||||||
Northern China | 496.5 | 2.0 | 254.3 | 1.3 | 511.9 | 1.6 | ||||||||||||||||||
Other regions | 1,504.2 | 6.0 | 3,913.4 | 19.5 | 4,995.2 | 15.2 | ||||||||||||||||||
Japan | 1,476.1 | 5.9 | 479.8 | 2.4 | 1,920.0 | 5.8 | ||||||||||||||||||
South Korea | 312.4 | 1.3 | 235.2 | 1.2 | 2,349.0 | 7.1 | ||||||||||||||||||
Australia | 16.9 | 0.1 | 44.8 | 0.2 | 482.2 | 1.5 | ||||||||||||||||||
Others | 66.0 | 0.3 | 275.4 | 1.4 | 559.3 | 1.7 | ||||||||||||||||||
Total | 24,937.9 | 100.0 | 20,116.9 | 100.0 | 32,930.3 | 100.0 | ||||||||||||||||||
As of December 31, 2010, our major customers were Huadian International, Baoshan Iron & Steel Co., Ltd., Posco, Yankuang Meihua Gongxiao Co., Ltd. and Linyi Yehua Coking Co., Ltd., among which Huadian International was our largest customer. In 2008, 2009 and 2010, we sold approximately 8.8 million, 7.5 million and 9.2 million tonnes of coal, respectively, to Huadian International, which represented approximately 23.3%, 19.8% and 18.5% of our sales volume, respectively, in those years. A substantial portion of Huadian International’s coal purchases was, in turn, supplied to Zouxian Power Plant.
As of the date of this annual report, we have entered into domestic sales contracts and letters of intent to provide a total of approximately 32.4 million tonnes of coal, including contracts to sell approximately 9.0 million tonnes of coal at a tax-inclusive price of RMB571.3 per tonne, representing a decrease of approximately RMB7.0 per tonne, or 1.2%, from our average selling price in 2009. The sales price under the letters of intent will be determined at the time of sale. Yancoal Australia has entered into agreements to sell approximately 2.7 million tonnes of coal in the first quarter of 2011.
Our Company’s sales income, which represents the invoiced amount of products sold net of returns and discounts, generated from export sales (including the export sales of Yancoal Australia) as a percentage of total sales increased significantly from 6.3% in 2009 to 19.1% in 2010, reflecting the expansion of our Australian operations, whose coal is primarily destined for overseas markets. Our major overseas markets include South Korea, Japan, Australia, India and Mexico. The majority of our overseas customers are located in Asia, and South Korea is our biggest market in this region. Even though we conduct all of our export sales from the PRC through export agents, we maintain close relationships with our overseas customers.
Our sales and marketing department conducts routine customer visits and customer surveys of keep abreast of market developments, maintain customer relationships and continually improve our business. In addition, we regularly collect market information about Eastern China and other regions, which we use for business planning and execution.
Pricing
The pricing for our coal products sold in the PRC is generally based on negotiations between the contracting parties that reflect market conditions. However, a portion of our thermal coal sales may be affected by pricing guidelines announced by the PRC government from time to time or subject to temporary price controls. For example, the State Council and the NDRC adopted measures to control the prices of thermal coal in 2010 and 2011, pursuant to which prices of thermal coal supplied to power generating enterprises in 2012 may not increase by more than 5% from 2011 prices, and the spot prices of thermal coal (5,500 kcal/kg) received at major domestic ports must be less than RMB800 per tonne. In December 2012, the General Office of the State Council issued a guideline to further implement the market reform for thermal coal. Pursuant to the guideline, beginning in 2013, the PRC government will discontinue the compulsory thermal coal supply contracts arrangement, which required coal producers to sell thermal coal to power generation enterprises at preferential prices set by the government. In addition, prices of thermal coal will be negotiated between power generation enterprises and coal producers, instead of pursuant to government-guided prices. See “Item 3. Key Information — D. Risk Factors —“— Regulatory Oversight of Our Group.” For our Australian operations, the pricing of our coal products may be subject to governmentalis dependent on negotiations between the contracting parties, as well as prevailing market prices. There are no price control measures, which may adversely affectschemes in Australia. In both our profitability.”
ToPRC and Australian markets, to price our coal products, we consider the prevailing prices in the relevant local coal markets, the grade and quality of the coal and our relationship with the purchaser. Our sales and marketing department monitors domestic and international market information, enabling us to keep abreast of pricing developments in our principal markets.
Transportation
Most of our major coal customers are located in Easterneastern China and our remaining domestic customers are located in Southernsouthern and Northernnorthern China. We deliver coal to our customers primarily useby railways and highways to transport coal and, to a lesser extent, wehighways. We also shipdeliver our coal onby domestic and international shipping lanes. With our private railway network, we are able to connect to the national railway system or deliver coal directly to our largest end-user customer, Zouxian Power Plant.
We also transportship coal on the national railway system to ports, such as Rizhao, Qingdao and Lianyungang, from which we ship coalfor delivery to customers. Rizhao portPort is our main port for shipping coal. We also use the Beijing-Hangzhou Grand Canal to ship coal on barges to customers located in the area serviced by the canal.canal, primarily Jiangsu and Zhejiang. In Shanxi, Province, we rely on the Yangshe Railway, which intersects the Tianchi Coal Mine, and trucks to deliver coal to Hebei, Province, Shandong Province and other nearby areas. We rely on the Baoshen Railway and trucks to deliver coal from Anyuan Coal Mine and Wenyu Coal Mine to Hebei and the surrounding areas.
We plan to construct a privately operated railway to connect Zhaolou Coal Mine with the national railway system. Before completing the completion of such plan,construction, we will continue to rely on trucks to deliver coal from Zhaolou Coal Mine to the national railway and customers.
ToWe transport Yancoal Australia’s coal products to Newcastle Port and Gladstone Port in Australia we use Australia’s stateat our cost using third parties’ railway networknetworks. These coal products are then exported to South Korea, Japan and private railway networks.other destinations by sea. Yancoal Australia owns a 27.0% interest in NCIG, a joint venture responsible for constructing and operating the third export terminal at Newcastle Port, and will have an annual port capacity of 14.6 million tonnes through NCIG’s facility when it reaches its full design capacity of 66.0 million tonnes per annum. Yancoal Australia also had an annual port capacity of 11.0 million tonnes at Newcastle Port in 2012 through a facility owned by PWCS pursuant to an agreement between Yancoal Australia and PWCS, increasing to 11.5 million tonnes per year from 2013 and 11.9 million tonnes from 2015. Yancoal Australia may apply for additional capacity at PWCS’s terminal 4 if the approval to construct this terminal can be granted. In addition, Yancoal Australia owns a 5.6% interest in Wiggins Island Coal Export Terminal Holdings Pty Limited in Queensland, which is the parent company of the developer of the Wiggins Island Coal Export Terminal. Yancoal Australia has been allocated an annual port capacity of 26.8 million tonnes in 2013. We believe these allocated port capacities will support current export sales.
Mining Processprocess
The geological characteristics of our reserves largely determine the coal mining method that we employ. We use two primary methods of miningto mine coal: underground mining and open-pit mining.
Domestic Underground Mining Operations.PRC underground mining operations
Our domesticPRC underground mining operations consist of four main steps: tunneling, coal extraction, transportation and coal preparation. The tunneling process is necessary for the construction of underground roadways, which are required for the installation of mining equipment. We conduct a majority of our tunneling using high poweredhigh-powered headers and use this method whenever geological conditions permit. When the use of headers is not feasible, we use explosives to excavate tunnels. Coal extracted during tunneling is carried by conveyor adhesive tapes to our underground storage bunkers to be stored together with other extracted coal. Rock and other minerals produced during the excavation of roadways are separated and transported out of the mine.
The extraction process is completedundertaken by a standardized and fully mechanized longwall operation, which includes shearers that work in conjunction with conveyers to cut and transport the coal away from the longwall work-face. For coal seams up to 4.5 meters thick, we use a fully mechanized method to extract coal. Generally, for coal seams that are thicker than 4.5 meters, we add a caving method to the fully mechanized longwall mining operation, whereby coal that is beyond the reach of our shearers collapse in a controlled manner onto our conveyers as the coal support underneath it is removed by our shearers. Coal is then transported away from a longwall work-face by a series of conveyors positioned in front of and behind the system of roof supports. Roof supports provide continuous support for and protection along the length of the long-wall work-face and they also move the conveyors and shearers forward after each pass of the shearers along the work-face using horizontal hydraulic rams positioned at the base of each support. Our hydraulic roof supports are manufactured in China.work face.
The shaft hoist system equipment that we use at most of our mines iswas imported. Coal is transported from the coal shaft either to a surface storage or directly to a coal preparation plant. In addition to the main coal shaft, our mines also have a service shaft and supplemental roadways and rail systems within the mines that provide a means of underground transportation for workers and equipment.
After raw coal is carried to the surface, it undergoes a mechanized selection process that separates coal from other mineral materials. A small portion of such selected coal is directly sold to customers as raw coal, and the remainder is transported to our coal preparation plants for further processing and classification. Each of the Six Coal Mines, Heze Nenghua Zhaolou Coal Mine, Austar Coal Mine, Yarrabee Coal Mine and Ashton Coal Mine has a coal preparation plant. In general, the coal-washing conducted in our coal preparation plants include a water bed washing and separation process by jig machines, a sink-and-float separation process and a final floating separation process. Most of the equipment used in our coal preparation plants is automated, enabling us to control the ash content and grade of our processed coal. The aggregate recovery rate of our coal preparation plants was 66.6%, 69.1% and 69.5% in 2008, 2009 and 2010, respectively.
Australian Mining operations.With respect to underground mines in our Yancoal Australiaopen-pit mining operations we conduct continuous tunneling, longwall operation and coal extraction by fully mechanized caving method. Open-pit
The open-pit mining is used when coal is found relatively close to the surface. This methodprocess involves the removal of topsoil and overburden (earth and rock covering the coal), tunneling and extraction of coal from coal seams. The extracted coal undergoes selection and is then transported to treatment facilities for preparation. After coal is removed, we restore the affected land by replacing the overburden and topsoil.
Australian mining operations
With respect to underground mines in our Yancoal Australia mining operations, we conduct continuous tunneling, longwall operations and coal extraction by the fully mechanized caving method. Open-pit mining is used when coal is found relatively close to the surface, which is the same as our domestic open-pit mining operations.
Materials, Water and Energy Supply
PRC mining operations
The primary materials we use to conduct our coal mining and processing operations are steel to support work-faceswork faces and underground tunnels, cement for the construction of underground tunnels and ground structures and water used in our production process. We primarily procure steel principallyprimarily from Jinan Iron and Steel Company Ltd., Laiwu Iron & Steel Group Corp. Ltd. and Shandong Shiheng Special Steel Group Co., Ltd., Shandong Iron and Steel Group Co., Ltd., Xilin Steel Group Acheng Steel Co., Ltd. and Angang Steel Company Limited and cement primarily from Shandong Lucheng Cement Company, Ltd. and China UnitedShandong Luzhu Group Cement Taishan Co.Company Ltd. We procure water primarily from the Yankuang Group pursuant to the Materials Supply Agreement and its supplemental agreements, and, to a lesser extent, from local water companies. The priceprices of materialssteel, cement and water is set at market rates or determined through negotiation.negotiations. We believe that we have well-established, cooperative relationships with our suppliers, enabling us to secure reliable supplies of materials required in our production process. We believe that a number of alternative suppliers exist for our key materials in our coal operations, and, therefore,accordingly, we do not foresee any difficulty in obtaining adequate supplies.
We use a significant amountsamount of electricity in our operations. Electricity prices in China are regulated by the government. Even though we have not experienced any material disruptions toin our electricity supply in the past, three years, we acquired Hua Ju Energy to secure a stable supply of energy for our SixNantun, Xinglongzhuang, Baodian, Dongtan, Jining II, Jining III, Beisu and Yangcun Coal Mines and to reduce our electricity costs. In 2010,After we commenced selling substantially all of the electricity generated by Hua Ju Energy supplied approximately 726.7 million kWh ofto the local grid company in 2011, we began to purchase electricity from the local grid company for Nantun, Xinglongzhuang, Baodian, Dongtan, Jining II, Jining III Coal Mines. We also purchase electricity from the local grid company for Beisu and Yangcun Coal Mines after we acquired them in May 2012.
Australian mining operations
Similar to our domestic coal mining and preparation operations, the primary materials we use in our Australian mining operations are steel, cement, explosives and water. We procure such materials primarily from local suppliers with which we have established long-standing relationships, and are able to procure sufficient materials for our mining and preparation operations.
Competition
PRC mining operations
Our primary market, the PRC domestic coal market, is characterized by numerous small-scale coal suppliers. Although the PRC coal market is segmented principally by geographic regions due to the wide distribution of coal reserves, the domestic market in China is dominated by a number of large-scale coal producers. We compete principally on the basis of the availability and cost of transportation, coal quality and timely deliveries.
Our PRC competitors primarily include a number of coal mines located in Shanxi, Shaanxi and Inner Mongolia. Certain of our competitors from these regions have substantial reserves and favorable geological conditions. However, these competitors incur significant transportation costs when they supply to their end-user customers located in eastern China. In addition to coal mines located in Shanxi, Shaanxi Provinces and Inner Mongolia Autonomous Region, we also compete with local mines located in close proximity to our customers. In addition, we expect to face increasingly intense competition among coal mining enterprises as the results of an significant increase in the amount of coal export to China and an increase of industry giants in the coal mining industry due to the industry reform. Although we have strengths in the quality of our coal product and our sales network, we may not be able to compete effectively with Shandong Energy in this region. Our failure to compete effectively may in turn materially and adversely affect our results of operations.
Australian mining operations
We primarily compete with several large coal mining enterprises in Australia, including BHP Billiton, Peabody Energy Australia, Rio Tinto Coal, Xstrata and Whitehaven Coal. Given that we mainly export our coal production in Australia to other Asian countries, particularly South Korea and Japan, we also compete with other mining enterprises located in China, Indonesia and Inner Mongolia, some of which are located in close proximity to our customers. Some of our competitors are large mining companies with a longer operating history, greater financial resources, stronger brand recognition and greater economies of scale as compared to our Company. However, we believe we are able to maintain our competitiveness. Through the use of our independently developed longwall top caving mining method, we believe we are able to extract coal more efficiently in our mining operation than our competitors, particularly those competitors with mining operations that involve coal extraction from thick coal seams.
Seasonality
Our coal business is not affected by seasonality.
Quality Controlcontrol
We have implemented a quality assurance program at each of our PRC coal mines to control quality throughout our coal operations from production to transportation. Utilizing advanced processing technology and management techniques, our coal preparation plants are able to separate both metal and non-metal impurities from coal. Our quality inspection division within our sales and marketing department conducts spot inspections on our coal production to maintain high quality standards.
Each of Nantun, Coal Mine, Xinglongzhuang, Coal Mine, Baodian, Coal Mine, Dongtan, Coal Mine, Jining II, Jining III, Beisu, Yangcun, Zhaolou and Tianchi Coal MineMines has obtained the Quality/Environmental Management/Occupational Health and Safety Certificate.
Each of Nantun, Baodian, Dongtan, Jining II, Jining III Coal MineMines has obtained ISO 9002 qualityMeasurement Management System AAA certificate. We have been awarded a National Quality Management Award, a China Quality Tripod and ISO 14000 environmental management certification. Tianchi Coal Minean Asia-Pacific International Quality Gold Medal. In addition, we were awarded the Quality Excellence Award (Asian Recognition for Excellent in Quality Practice) by the Asian Network for Quality in 2012, which made us the only Chinese coal company which has obtained ISO 9000 quality and ISO 14000 environmental management certification, and Zhaolou Coal Mine has obtained ISO 9001 quality and ISO 14001 environmental management certification.ever won this prize.
Yancoal Australia has hiredengaged Bureau Veritas, Societe Generale De Surveillance and ALS Laboratory Group to supervise and inspect the quality of the coal produced from the respective mines in Australia to ensure quality control and suggestadvise on quality improvement measures.improvement.
Safety Controlcontrol
In our PRC operations, we have implemented a safety control program to achieve the targets set in our internal guidelines for safety and risk control management and to maintain compliance with the PRC Coal Industry Law and the National Mining Safety Law in China. In Australia, our operations in New South Wales comply with the Coal Mine Health and Safety Act 2002 (NSW) and Occupational Health and Safety Act 20002011 (NSW) and, our operations in Queensland comply with the Occupational Health and Safety Act 2011 (QLD) and Coal Mining Safety and Health Act 1999 (QLD) and our operations in West Australia comply with the Coal Mine Safety and Inspection Act 1994 (WA) and Occupational Health and Safety Act 1984 (WA).
Our safety control program combines close supervision and routine inspection of mining conditions with continual implementation of safety features and procedures at our mines and safety training for our production team. Moreover,In addition, in our PRC operations, the compensation of the officers and managers of each division reflects the division’s safety record. Each of our mines has a safety inspection unit which is responsible for the supervision and inspection of our mining activities. We reward employees who report unsafe mining conditions to encourage accident prevention.
As a result of our safety control program, we have been able to maintain a zero fatality rate in our PRC operations since 2007 compared with the national average of 0.7490.374 fatalities per million tonnes of coal produced in 20102012, according to the State Administration of Work Safety of the PRC. In 2010,2012, we produced approximately 37.468.7 million tonnes of coal in our PRC operations and did not experience any production accidents that involved serious work injuries or death in our PRC operations. Following our acquisition of Felix in December 2009, wedeath. We have been continuously reviewing and evaluating itsour safety control and performance.performance in Australia. With respect to our Australian operations (inclusive of Felix) in 2010,2012, our lost time injury frequency rate, (“LTIFR”), measured as the number of lost time injuries per million man-hours worked, was 6.42.5 for open cutopen-pit mines and 13.413 for underground mines. We had no fatalities in our Australian operations in 2010.2012.
Environmental Protectionprotection
We are subject to PRC environmental protection laws and regulations which impose fees for the discharge of waste substances and require the payment of fines for serious pollution. PRC regulations also authorize government agencies to close any facility that fails to comply with orders to cease, or bring into compliance with relevant laws and regulations, operations that cause environmental damage. In addition, the operations of Yancoal Australia must comply with relevant Australian environmental protection laws and regulations.
According In 2012, we incurred expenses related to the Provision of Labor and Services Supply Agreement that we entered into with Yankuang Group, it will provide us environmental protection services. In 2010, we paid Yankuang Group a total of RMB41.7 million for such services to reduce the effects of our operations on the environment.RMB175.3 million.
Competition
The development of the PRC coal industry is characterized by a large number of small-scale enterprises and a wide geographical distribution of coal reserves. There are relatively few large-scale coal production enterprises in China.
Our primary market, the PRC domestic coal market, is characterized by numerous small-scale coal suppliers. The domestic coal market is segmented principally by geographical region, as a result of the wide geographical distribution of coal reserves. However, there are a number of large-scale coal production enterprises that dominate the domestic market. We compete principally on the basis of the availability and cost of transportation, coal quality and reliability of deliveries.
Our domestic competitors primarily include a number of coal mines located in Shanxi Province, Shaanxi Province and the Inner Mongolia Autonomous Region. Certain of our competitors from these regions have substantial reserves and favorable geological conditions. However, these competitors incur significant transportation costs when they supply to end-user customers located in Eastern China. In addition to coal mines located in Shanxi Province, Shaanxi Province and the Inner Mongolia Autonomous Region, we also compete to a certain extent with local mines located close to our customers. In addition, Shandong Energy Group Co. Ltd (“Shandong Energy”), which was established in March 2011, is our sole competitor in Shandong Province. Shandong Energy has a large-scale production capacity and marketing capability. Although we have strengths in the quality of our coal product and our sales network, we may not be able to compete effectively with Shandong Energy in this region. Our failure to compete effectively may in turn materially and adversely affect our results of operations.
We export coal mainly to South Korea, Japan, Australia, India and Mexico. With respect to export sales, we compete with certain major overseas coal mining companies, most of which are located in Australia and Indonesia.
Seasonality
Our coal business is not affected by seasonality.
Railway Transportation Business
In addition to transporting coal to support our own operations, we also provide railway transportation services to our customers, including the Yankuang Group, for fees. In 2012, we transported 17.5 million tonnes of coal on our railway network, representing a decrease of 0.6 million tonnes, or 3.2%, from 18.1 million tonnes in 2011. We generated sales income of RMB464.1 million from railway transportation services in 2012, representing a decrease of RMB12.8 million, or 2.7%, from RMB476.9 million in 2011.
We own ten steam locomotives, two heavy-duty rail motors and operate aapproximately 204 kilometers of railway tracks constructed for coal transportation networkthat connect most of our coal mines with Zouxian Power Plant located in Jining City, of Shandong Province that connects our coal mines to the national railway system and Zouxian Power Plant. As of the date of this annual report, ourShandong. Our railway network spanned a total length of 204 kilometers.also connects to two major national railways, namely, Beijing-Shanghai Railway and Yanzhou-Shijiugang Railway. Our railway network provides us a greater degree ofwith substantial control over a major modemeans of transportation for our key product, allowing us to benefit from the synergies of having a consolidated coal operation that comprisesfrom coal production, sales and transportation.
In addition to transporting coal to support As of December 31, 2012, our own operations, we also offer railway transportation services to customers, including Yankuang Group. Our transport volume has remained steady in recent years. In 2010, we transported 19.7 million tonnes of coal on our railway network, representing a slight decrease of 0.16 million tonnes, or 0.8%, from 2009. We generated approximately RMB513.3 million from railway transportation services in 2010, representing an increase of RMB245.9 million, or 92.0%, from 2010 mainly due to the increase in the rates we charge to customers for railway transportation.business had 3,626 employees.
We have obtainedmaintain ISO 9001 quality accreditation, ISO 14001 environmental management certification, OHS 18000 occupational safety and GB/T19022-2003health certificate and ISO 10012:2003 management certification for the operation of our railway network.
Our railway network connects us to the national railway system via the Jinghu railway and Yanshi railway and provides us direct access to Huadian Power International Corporation Limited, our largest end customer. We use our railway network to provide railway transportation services for our own internal use as well as to Yankuang Group and other customers. We do not face significant competition from other railway operators. However, we compete with other ground transportation services that serve the same region as our railway network.
Coal Chemical Business
Our coal chemical business focuses on the production of methanol, a liquid commodity that can be produced from coal or natural gas. We operate our coal chemical business through Yulin Nenghua and Tianhao Chemicals. In 2010,2012, we produced 367,000572,000 tonnes of methanol and sold 376,000574,000 tonnes including inventoryof methanol. We generated sales income of RMB1,118.0 million in 2012, representing an increase of RMB58.6 million, or 5.5%, from the prior year.RMB1,059.3 million in 2011. Yulin Nenghua completed its first full year of operations and produced 311,000 tonnes and sold 319,000 tonnes. Tianhao Chemicals increased production to 56,000552,000 tonnes of methanol, and sold 57,000 tonnes. AsTianhao Chemicals produced 20,000 tonnes of methanol, in 2012. We are in the process of disposing Tianhao Chemical’s methanol assets. In addition, we are currently constructing a result,600,000-tonne methanol project in Ordos City, Inner Mongolia Autonomous Region, which we generated total revenuesexpect to become operational in the second half of approximately RMB629.3 million from our coal chemical business.2013.
Sales and Marketingmarketing
Our coal chemical sales are made pursuant to sales contracts that we enter into from time to time with customers. We sell our methanol exclusively in China and predominately to chemical producers in Northernnorthern and Easterneastern China and methanol distributors, relyingdistributors. We rely on regional highways to deliver our products.
Pricing
The pricing for our methanol product is generally based on negotiation between the contracting parties, taking into consideration prevailing market prices, market conditions and the customer’s creditworthiness.
Production Processprocess
Yulin Nenghua.Yulin Nenghua is primarily responsible for the operation of the 600,000 tonne methanol project using.At Yunlin Nenghua’s plant, raw coal as raw material. Coal is pulverized, cleaned and then fed to a gasifier bed where it reacts with oxygen and steam. The product is synthesized into crude methanol and then purified through distillation.
Materials, water and energy supply
Coal and coke oven waste gas are the primary materials in our methanol production. Production at Yulin Nenghua is reliant on thermal coal, which it currently sources from local coal mines owned by third parties. We plan to source thermal coal internally once our adjoining Yushuwan Coal Mine is registered and commences operations. Yulin Nenghua sources water from a local reservoir.
Quality control
We have implemented a series of quality control measures for our coal chemical operations to ensure product quality and obtained AAA measurement management system, ISO 9001 quality accreditation and ISO 14001 environmental management certification in November 2009. We perform regular inspections and maintenance on our methanol plants.
Safety control
For our coal chemical operations, we have implemented safety control measures in compliance with the People’s Republic of China Production Safety Law, the People’s Republic of China Regulations on the Safe Administration of Dangerous Chemicals and other safety guidelines for chemical manufacturers.
Competition
We compete with domestic methanol manufacturers in Shanxi and Shaanxi Provinces and the Inner Mongolia Autonomous Region. We expect to benefit from economies of scale as Yulin Nenghua’s 600,000-tonne methanol project achieves optimal utilization of its facilities and Ordos Neng Hua’s 600,000-tonne methanol plant commences operations in the second half of 2013.
Seasonality
Our coal chemical operations are not affected by seasonality.
Electric Power and Heat Supply Business
As of the date of this annual report, we owned and operated seven power plants, which generate electricity for internal use and external sales. In 2012, we generated a total of 1,155.2 million KWh of electricity, 856.4 million KWh of which we sold to third parties. We generated sales income of RMB323.6 million in 2012, representing a decrease of RMB4.4 million, or 1.3%, from RMB328.0 million in 2011.
Hua Ju Energy operates coal-fired power plants whose main facilities consist of energy conversion CFB boilers and extraction and condensing steam turbines. The power plants at Hua Ju Energy have an aggregate installed capacity of 144 MW. In 2010, 2011 and 2012, Hua Ju Energy generated 1,090.4 million KWh, 1,028.8 million KWh and 968.2 million KWh, respectively, and sold 469.6 million KWh, 895.5 million KWh and 831.9 million KWh, respectively, to the local power grid company.
The power plants at Yulin Nenghua and Tianhao Chemicals were established with the primary intention to satisfy the power demand of the methanol projects of these two entities; we sell a small amount of electricity to third parties. These plants had an aggregate installed capacity of 84 MW as of the date of this annual report; however, Tianhao Chemicals has stopped generating electricity since January 1, 2012 due to the high cost of fuel, and we are in the process of disposing of the power plant together with Tianhao Chemical’s methanol assets. In 2012, the power plants operated by Yulin Nenghua generated 187.0 million KWh of electricity, of which 24.5 million KWh was sold to third parties.
We commenced the construction of the Zhaolou Coal Mine power plant for Zhaolou Coal Mine in March 2010. The integrated power plant has two phases with a designed capacity of 300 MW for each phase. As of the date of this annual report, phase I was under construction. For further information on the Zhaolou Coal Mine power plants, please see “D. Property, Plant and Equipment — Methanol and Cogeneration Power Plants — Zhaolou Coal Mine Power Plants.”
We commenced heat supply operations, which consist of the production and sale of heat, following our acquisition of Hua Ju Energy in 2009. In 2012, Hua Ju Energy generated 1.4 million steam tonnes of heat energy. Our coal mines consume the substantial majority of heat energy produced by Hua Ju Energy. We sold 0.2 million steam tonnes of heat to third parties and generated sales income of RMB39.9 million in 2012.
Sales and marketing
We consume a major portion of the heat generated by our power plants and, to a lesser extent, sell to the Yankuang Group. In addition to our own use and our sales to the Yankuang Group, we sold 73.5% of the electric power we produced to other end-users through power grids in 2012.
Pricing
The pricing and adjustments for the on-grid tariff and the pricing of our heat products are determined in accordance with regulations set by price administration authorities.
Production process
Yulin Nenghua. We select, break, grind and feed coal to a boiler where the coal is burned to generate steam, which is converted by steam turbines into electricity.
Hua Ju Energy. We recycle by-products of our coal mining operations, such as coal gangue and coal slurry, to generate electricity. Coal gangue and coal slurry are fed to a CFB boiler by means of a conveyer belt and fuel-feeding device where they are burned to generate steam, which is converted by steam turbines into electricity. The power plants of Hua Ju Energy are cogeneration systems that are able to produce heat simultaneously with power generation. Part of the steam produced in power generation is extracted from the steam turbines and provided to our mining operations via a heat supply system.
In the production processes, we filter the exhaust gas that we produce and recycle the cinder for future use.
Materials, water and energy supply
Our power plants are all coal-fired power plants. The power plants of Hua Ju Energy generate electricity by recycling coal gangue and coal slurry. Yulin Nenghua currently sources thermal coal from local coal mines.
Quality control
Hua Ju Energy obtained ISO 9001 quality accreditation and ISO 14001 environmental management certification in November 2003 and has maintained its certification since then. Yulin Nenghua obtained AAA measurement management system, ISO 9001 quality accreditation and ISO 14001 environmental management certification in November 2009.
Safety control
Safety measures for our electric power and heat supply operations were designed to meet the requirement of the Electricity Law and other related laws.
Seasonality
Our electric power operations are not affected by seasonality. Our heat supply operations are affected by seasonality and experience higher demand during winter.
Regulatory Oversight of Our Group
Regulation of the PRC Coal Industry
Mining activities in the PRC are also subject to the MLR. To establish a coal mining enterprise under the Coal Industry Law of the People’s Republic of China, amended in 2011 (the “PRC Coal Industry Law”), the applicant must submit an application to the relevant department in charge of the coal industry. After obtaining approval to establish a coal mining enterprise, the applicant will be granted a mining permit by the MLR. Thereafter, the applicant must obtain a coal production permit before it commences coal production. Coal mining enterprises that have legally obtained coal production licenses will have the right to sell the coal that they produce. To establish a coal trading enterprise, an applicant must apply for a different business license and may engage in coal trading only after it obtains a trading license from the relevant administrative department of industry and commerce.
The Mineral Resources Law of the PRC (the “Mineral Resources Law”) regulates any matters relating to the planning or the exploration, exploitation and mining of mineral resources. According to the Mineral Resources Law, all mineral resources in China, including coal, are owned by the State. Any enterprise planning to engage in the exploration, development and mining of mineral resources must obtain exploration rights and mining rights before commencing the relevant activities. The transfer of exploration and exploitation rights shall be subject to governmental approval pursuant to the PRC Coal Industry Law, the Mineral Resources Law and other relevant regulations.
The following is a summary of the principal laws, regulations, policies and administrative directives to which we are subject.
Pricing Laws
Until 2002, the production and pricing of coal was generally subject to the close control and supervision of the PRC government, which centrally managed the production and pricing of coal. To transition from a planned economy to market economy practices, the PRC government eliminated the state guidelines for coal prices on January 1, 2002 and took other measures intended to establish a pricing mechanism that would reflect market demand. In December 2012, the State Council issued a guideline to further implement the market reform for thermal coal. Pursuant to the guideline, beginning in 2013, the PRC government will discontinue the compulsory thermal coal supply contracts arrangement, which required coal producers to sell thermal coal to power generation enterprises at preferential prices set by the government. In addition, prices of thermal coal will be negotiated between power generation enterprises and coal producers, instead of pursuant to government-guided prices.
Regulation of fees and taxes
The table below sets forth material taxes and fees that are imposed upon coal producers in China, as well as reserves which we are required to set aside.
Item | Base | Rate | ||
| Corporate income tax | Taxable income | 25% | ||
| VAT | Sales revenue | 17% | ||
| Business tax | Revenue from service | 3% or 5% | ||
| City construction tax | Amount of VAT and business tax | 7% | ||
| Education surcharge | Amount of VAT and business tax | 3% | ||
| Local education surcharge | Amount of VAT and business tax | 2% | ||
| Resource tax | Aggregate volume of raw coal sold or used (1) | RMB3.6 per tonne (Shandong Province) RMB3.2 per tonne (Shanxi Province) | ||
Compensation for the depletion of coal resources | Revenue from coal produced by us | 1% | ||
| Price adjustment fund | Volume of raw coal produced or sales volume of merchantable coal | 1. Jining City, Shandong Province: RMB8 per tonne based on volume of raw coal produced; 2. Heze City, Shandong Province: (1) RMB1.5 per tonne for 20% of the sales volume of clean coal and RMB20 per tonne for 80% of the sales volume of clean coal; (2) RMB1 per tonne for 20% of the sales volume of other types of coal and RMB15 per tonne for 80% of the sales volume of other types of coal. | ||
| (1) | The resource tax applicable to our coal operation in Shandong and Shanxi Provinces is calculated by multiplying the aggregate volume of raw coal sold and raw coal consumed in the production of clean coal by the applicable per tonne resource tax in the respective province. |
Coal producers may be fined if they damage the environment, arable land, grasslands or forest areas. Under the Mineral Resources Law, if a mining enterprise’s mining activities result in damage to arable land, grasslands or forest areas, the mining enterprise must return the land to an arable state or plant trees or grass or take other restorative measures. The Mineral Resources Law and other applicable laws and regulations also state that anyone who causes others to suffer loss in terms of production or living standards is liable for the loss and must compensate the affected persons and remedy the situation.
Additionally, all coal producers are subject to PRC environmental protection laws and regulations which currently impose fees for the discharge of waste substances, require the payment of fines for serious pollution and provide for the discretion of the PRC government to close any facility which fails to comply with orders requiring it to cease or cure operations causing environmental damage.
Foreign exchange laws
The Notice of the State Administration of Foreign Exchange on Deciding the External Financing Guarantee Balance Quota of Domestic Banks in 2011 (Hui Fa [2011] No. 30), promulgated by the SAFE on July 27, 2011, provides that the SAFE will conduct a strict review of any application from a domestic enterprise with respect to external financing guarantees. In addition, when domestic banks provide offshore financing guarantees, the SAFE will conduct a strict review of the financing measures with respect to the external financing guarantee. The proceeds of any offshore financing under an offshore financing guarantee must not be repatriated into the PRC, directly or indirectly, either in the form of equity or debt interests, through, including but not limited to, the following methods:
financing applied towards the repayment of the original loans of the enterprise or other offshore companies which were repatriated into the PRC through equity or debt interests;
financing directly applied towards the acquisition of the equity of an offshore target company, and the principal assets of the target company are predominantly located in the PRC; or other methods of repatriation recognized by the SAFE.
Import and export laws
According to the Foreign Trade Law, the Cargo Import and Export Ordinance and the Administrative Measures of Coal Export Quota, coal exports prior to 2013 are subject to State control and required governmental approval.
Our company has not been authorized as a PRC coal exporter. Our coal exports are conducted through three export agents, namely China National Coal Industry Import and Export Corporation, China National Minerals Import and Export Company Limited and Shanxi Coal Import and Export Group Company.
Pursuant to the Administrative Measures of Coal Export Quota, the NDRC and the MOC have been responsible for determining China’s national coal export quota and allocating the quota among authorized coal exporters. Upon receiving a quota approval, authorized coal exporters may apply for coal export permits to the relevant authority designated by the MOC. Authorized coal exporters are also required to report their monthly quota usage to the NDRC.
The regulations provided that quotas may be adjusted in the event of:
a major change in the international market;
a major change in domestic coal resources;
an imbalance in the usage of the coal export quota by an authorized coal exporter compared to its allocation of the coal export quota; and
other circumstances which require an adjustment to the coal export quotas.
The total national quotas approved for coal exports in 2011 and 2012 remained at 38.0 million tonnes. The first 19.0 million tonnes’ national quota for 2013 has been granted to exporters.
According to the Notice of the Customs Tariff Committee of the State Council on Tariff Adjustment on Certain Export Commodities (Notice 2008 No. 56), since August 20, 2008, the provisional tariff rate of coke, coking coal and soft coal has been 40%, 10% and 10%, respectively. However, we do not export any coke, coking coal or soft coal from the PRC and we do not expect changes in export tariffs will affect us.
Domestic trading regulations
Pursuant to the Measures for the Regulation of Coal Operations promulgated by the NDRC on December 27, 2004, the State implemented a system to examine the qualifications of an entity to engage in coal operations, including the wholesale and retail of raw coal and processed coal products and the processing and distribution of coal for civilian use. Before an entity can engage in coal operations, it must obtain a coal operation qualification certificate. A coal production enterprise that deals in coal products produced and processed by a third party is required to obtain a coal operation qualification.
Environmental protection
China has promulgated a series of laws and regulations which establish national and local legal frameworks for environmental protection. These laws and regulations include standards applicable to emission controls, discharges of wastes and pollutants to the environment, generation, handling, storage, transportation, treatment and disposal of waste materials by production facilities, land rehabilitation and reforestation.
The Environmental Protection Law requires any entity operating a facility that produces pollutants or may create a hazard to incorporate environmental protection measures into its operations and to establish an environmental protection responsibility system which includes effective measures to control and properly dispose of waste materials.
According to the Law on Prevention and Control of Water Pollution of the PRC, and the Administrative Regulations on the Levy and Use of Discharge Fees, any new construction projects which directly or indirectly discharge pollutants to water, such as coal mines and coking plants, must conduct an environmental impact assessment. Every new production facility must be equipped with wastewater processing facilities which must be put in use together with the production facilities. Construction projects that discharge pollutants into water shall pay a pollutant discharge fee in accordance with state regulations.
The rehabilitation of mining sites is another priority of the PRC government. Under the Law of Land Administration of the PRC as amended on August 28, 2004, the Regulation on Land Reclamation effected on March 5, 2011 and the Implementation Measures on the Regulation on Land Reclamation effected on March 1, 2013, coal producers must undertake measures to restore a mining site to its original state within a prescribed time frame if their mining activities result in damage to arable land, grassland or forest. The rehabilitated land must meet rehabilitation standards, as required by law from time to time, and may only be subsequently used upon examination and approval by the land authorities.
In addition to the PRC environmental laws and regulations, China is a signatory to the 1992 United Nations Framework Convention on Climate Change and the 1998 Kyoto Protocol, which propose emission targets to reduce greenhouse gas emissions. The Kyoto Protocol came into force in 2005. At present, the Kyoto Protocol has not set any specific emission targets for certain countries, including China.
Mining safety
On June 7, 2005, the State Council promulgated Several Opinions on Promoting the Healthy Development of the Coal Industry, which contains the PRC government’s policies with respect to the development and restructuring of the coal industry. The opinions reiterated the PRC government’s policies with respect to the administration of coal reserves, enhancement of coal mine safety, encouragement of industry consolidation among coal producers, acceleration of the construction of large coal production bases, improvement of mining techniques and equipment for coal production and the organization and regulation of small coal mines.
According to the Measures for Implementing Work Safety Permits in Coal Mine Enterprises issued by the State Administration of Work Safety and the SACMS, a coal mine enterprise without a work safety permit may not engage in coal production activities. Coal mining enterprises and their mines that do not satisfy the safety conditions set forth in this document, or those that violate the provisions of this document, may be punished by fines, warnings, temporary suspension of the work safety permit, mandatory remediation measures, orders to cease production and cancellation of the work safety permit. Coal mine enterprises that remain compliant with the requirements set in these documents may apply for administrative approval to extend the validity period of their Work Safety Permits.
The Special Regulations by the State Council on Preventing Work Safety Related Accidents in Coal Mines were promulgated and entered into effect on September 3, 2005. These regulations specify that coal mine enterprises are responsible for preventing coal mine work safety-related accidents. If a coal mine has not obtained, in accordance with the law, a mining right permit, work safety permit, coal production permit or business license and if the mine manager has not obtained, in accordance with the law, a mine manager qualification certificate and a mine manager safety qualification certificate, the coal mine may not engage in production. Coal mining enterprises should establish a sound system for the detection, elimination, treatment and reporting of latent work safety-related dangers. If a major latent work safety-related danger exists in a coal mine, the enterprise should immediately suspend production and eliminate the latent danger. Coal mining enterprises should provide their personnel working underground and their special operation personnel with safety education and training in accordance with relevant state regulations. The person in charge of a coal mine and the production and operation management personnel should go into mines and act as foremen on a rotating basis in accordance with state regulations, and a file recording their entry into the mine should be maintained.
In addition, the State Administration of Work Safety issued three sets of measures on September 26, 2005: (i) the Measures for Determining Major Latent Work Safety Related Dangers in Coal Mines (for Trial Implementation); (ii) the Implementing Measures for the Detection and Elimination of Latent Dangers in Coal Mines and the Rectification and Closure of Such Mines (for Trial Implementation); and (iii) the Measures for the Supervision and Inspection of Coal Mine Safety Training (for Trial Implementation). On October 31, 2005, the State Administration of Work Safety issued the Guiding Opinions on Persons in Charge of Coal Mines and Production and Operation Management Personnel Going into Mines as Foremen. The State Administration of Work Safety and Ministry of Finance of the PRC jointly issued the Incentive Arrangement for Report on Working Safety on May 2, 2012, which encourages reporting on material accident hazards on working safety systems and other illegal activities.
The State Administration of Work Safety, the State Administration of Coal Mine Safety and the All China Federation of Trade Unions jointly issued the Rules regarding the Working Safety Construction of Coal Mine Working Teams in June 2012, which requires coal mining enterprises to promote working safety target management and improve the salary structure to reflect the combination of working safety, production and profits. In addition, coal mining enterprises are required to improve working environments and labor protection facilities, provide employees with labor protection articles and occupational health examinations, establish occupational health files for employees and provide relevant remuneration for workers engaging in hazardous works.
Coal mining industry and resources integration
Several measures have been enacted by various PRC government and provincial authorities to promote the integration and enhancement of mineral resources to maximize domestic coal production and encourage developmental efficiency.
The General Office of the Shandong Provincial Government issued the Notice to Implement Circular Guo Fa Ban [2006] No. 108 and Notice to Effectively Implement Integration of Mineral Resources (Lu Zheng Ban Fa [2007] No. 37), on June 19, 2007, which further implement Circular Guo Fa Ban [2006] No. 108 and promote the integration of mineral resources in Shandong Province.
In addition, the Shandong Provincial Government issued the Notice to Deepen Integration Works of Mineral Resources (Lu Zheng Ban Fa [2010] No. 1), on January 4, 2010, which requires further promotion of integration of mineral resources, reduces the number of mines and mining approvals, and enhances intensive production in Shandong Province. The State-owned Assets Supervision and Administration Commission of Shandong Province issued the Notice Regarding Document Lu Zheng Ban Fa [2010] No. 1 from the General Office of Provincial Government to Deepen the Integration Work of Integrated Exploitation of Mineral Resources (Lu Guozi Guihua [2010] No. 1) on February 3, 2010, which requires enterprises under provincial administration to review and integrate resources, as well as actively participate in the integration of mineral resources province-wide.
The government authorities of Inner Mongolia issued the Notice of Printing and Distributing the Work Plan of Mergers and Reorganizations of Coal Mining Enterprises in Inner Mongolia Autonomous Region (Nei Zheng Fa [2011] No. 32) on March 15, 2011, which sets forth the guiding principles, integrative approach, applicable policies, regulations and working requirements for coal resources in the region. By the end of 2013, the notice indicates that coal mining enterprises located in Inner Mongolia Autonomous Region must achieve production of 1.2 million tonnes per annum (three million tonnes per annum may apply to certain regions upon certain conditions) or be required to merge with other enterprises. Enterprises with a production capacity of more than five million tonnes of raw coal, among others, or enterprises with at least either one underground coal mine with a singular well production capacity of more than 1.2 million tonnes or an open-pit coal mine with a singular well production capacity of more than three million tonnes, subject to certain operational safety conditions, will be given preference as entities into which other smaller entities may merge.
In addition, the government authorities of Inner Mongolia Autonomous Region issued the Notice of Working Well on the Related Issues Concerning Integration of Coal Resources (Nei Zheng Ban Fa [2011] No. 92) on October 9, 2011, which sets forth supplemental information on the determination of the status of coal mining entities and the scope of coal resources to be integrated in the region.
The National Energy Administration of the PRC issued the amended Coal Mining Industry Policy in February 2013 seeking for comments, which aims to further implement the reform of coal mining enterprises and the market-oriented reform.
These mining industry and resources integration regulations will affect the production capacity and rates of our mines that are located in the particular provinces or regions.
Regulation of the Australian Coal Industry
Our operations in Australia are subject to laws and regulations of general application governing mining and processing, land tenure and use, environmental requirements, including site-specific environmental licenses, permits and statutory authorizations, industrial relations, workplace health and safety, trade and export, competition, access to infrastructure, foreign investment and taxation. These regulations are implemented by various federal, state and local government departments and authorities, including the Department of Resources, Energy and Tourism, the Department of Sustainability, Environment, Water, Population and Communities and the National Native Title Tribunal.
Environmental and planning issues
Our mining operations in Australia are regulated by Australian federal, state and local governments with respect to environmental issues (such as water quality, air quality, dust impact, noise impact) and planning issues (such as approvals to expand existing mines or to develop new mines or to change mining interests). Australian state governments require coal companies to post deposits or give other security on the land which is being used for mining and exploration, with those deposits being returned or security released after satisfactory reclamation is completed.
The particular provisions of the various state and territory environment and planning legal regimes vary depending upon the jurisdiction. Despite variation in details, each state and territory has a system involving broadly at least two major phases, including: (i) obtaining major environment/planning developmental approval addressing planning and significant environmental issues and (ii) obtaining pollution control approvals regarding pollution control issues such as emissions to the atmosphere; emissions in waters; noise impact, impact from blasting; dust impact; and the generation, handling, storage and transportation of waste.
The federal environmental protection regime will apply if matters of national environmental significance are likely to be significantly impacted. If so, federal regulatory approval will be required. Most coal projects require such federal approval.
Occupational health and safety
The combined effect of various state and federal statutes requires an employer to ensure that persons employed in a mine are safe from injury by providing a safe working environment and systems of work; safety machinery; safety equipment, plant and work materials; and appropriate information, instruction, training and supervision.
In recognition of the specialized nature of mining and mining activities, specific occupational health and safety obligations have been mandated under law and legislation that deals specifically with the coal mining industry. Mining employers, owners, directors and managers, persons in control of work places, mine managers, supervisors and employees are all subject to these duties. The Australian federal government is currently conducting a review of health and safety legislation with a view to harmonizing requirements across the country.
It is mandatory for an employer to have insurance coverage with respect to the compensation of injured workers. Similar coverage is in effect throughout Australia which is of a no-fault nature and which provides for benefits up to a prescribed level. The specific benefits vary by jurisdiction, but generally include the payment of weekly compensation to an injured employee, together with payment of medical, hospital and related expenses. The injured employee may have a right to sue his or her employer for further damages if a case of negligence can be established (but on the condition that the injured employee waives his or her right to the insurance coverage).
MRRT
On March 29, 2012, the Australian MRRT became law, effective July 1, 2012. The MRRT is a profits-based tax that is charged at an effective rate of 22.5% on the assessable profits (excess of annual mining revenue over annual mining expenditures with respect to mineral interests, less certain allowances) of, among others, coal mining enterprises. According to the relevant provisions of the MRRT tax laws, our subsidiaries in Australia are required to determine the starting base allowance on their balance sheets. A book value or market value approach can be selected in calculating the starting base and may be amortized over the prescribed useful lives of such assets.
Carbon tax scheme
A number of countries, including Australia have ratified the Kyoto Protocol to the United Nations Framework Convention on Climate Change. The Australian government has devoted efforts in meeting the emissions target for Australia as set forth in the Kyoto Protocol. To this end, the Australian federal government has recently passed laws imposing a tax on the amount of carbon dioxide emissions by enterprises having significant emissions, which may include coal mining enterprises in Australia. In addition, the Australian federal government intends to gradually shift from a carbon tax scheme to a “cap and trade” carbon emissions scheme. The legislation became effective from July 1, 2012.
Foreign investment
There are no specific restrictions on foreign investment in Australia’s coal industry. However, under Australian law and Australia’s foreign investment policy, certain acquisitions require prior approval of the Treasurer of Australia. Generally, these include acquisitions of substantial interests (15% or more) in an Australian business where the value of the business’ total assets is, or the proposal value is, above A$244 million.
Power generation industry
The Electric Power Law and the Electric Power Regulatory Ordinance
The Electric Power Law of the PRC (the “Electric Power Law”) sets out the regulatory framework of the power industry. The Electric Power Law encourages power plant operators to focus on environmental protection and adopt new technology to decrease waste discharge.
In 2005, the State Council promulgated the Electric Power Regulatory Ordinance. The Electric Power Regulatory Ordinance sets forth regulatory requirements for many aspects of the power industry, including, among others, the issuance of electric power business permits, the regulatory inspections of power generators and grid companies and the legal liabilities resulting from violations of the regulatory requirements.
Approvals and licenses for power plants
Applications for all new coal-fired power plants are required to be submitted to the NDRC for approval, as well as to the State Council for significant power plant projects. According to the Provisions on the Administration of Electric Power Business Licenses, applicants are also required to obtain requisite permits, including an Electric Power Business for Power Generation and approvals related to plant site, land use rights, construction and the environment.
Pricing
Since 1996, the Electric Power Law has set forth general principles for determining power tariffs. The Interim Provisions for the Administration of Grid Power Price promulgated by NDRC states that tariffs are to be formulated to provide reasonable compensation for costs and a reasonable return on investment, to share expenses fairly and to promote the construction of power projects. With the exception of grid power prices set by governmental bids or power plants that produce alternative energy, grid power prices of new power plants within the same region should be uniform. The on-grid tariffs for planned output and excess output are subject to a review and approval process involving the NDRC and the provincial price bureaus. In 2004, the NDRC, with the approval of the State Council, issued a policy to link thermal coal and power prices. This policy allows on-grid tariffs to increase if the average price of coal increases by more than 5% within a six-month period.
Safety
In accordance with the Measures for Supervising the Safe Production of Electricity, issued by the SERC, power plants are responsible for maintaining safe operations in accordance with requirements set by the regional grid in which they are located. Power plants are required to report worker fatalities or serious or extraordinary accidents to the SERC and relevant local government authorities.
Coal chemical processing industry
The PRC Coal Industry Law, encourages and supports coal mining enterprises and other enterprises to produce both coal and electricity, coking coal and coal chemicals. In July 2006, the NDRC issued the Notice of Strengthening the Administration of Coal Chemical Processing Industry and Improving the Healthy Development of the Industry (Fa Gai Chan Ye [2011] No. 635), which was aimed at strengthening the coal chemical processing industry through the promotion of transportation safety, risk prevention and management standardization. According to the Enterprise Income Tax Law (the “EIT Law”) and its implementation regulations, enterprises that produce products which are not restricted by the State and satisfy State and industry standards by using resources encouraged by industrial policies of the State are eligible for preferential tax treatment. If an enterprise uses any of the materials that are listed in the Catalogue of Income Tax Preference for Enterprises of Comprehensive Utilization of Resources as a major raw material in its product, 90% of the total income derived from such product will be treated as taxable income under the preferential tax arrangement. Coke oven gas, one of the primary raw materials at one of our methanol production facilities, is one of the materials listed in the catalogue.
| C. | Organizational Structure |
As of December 31, 2012, our Company consisted of 20 departments, namely the Secretariat of the Board of Directors, Audit Department of the Board of Directors, Department of Coordination, Department of Human Resources, Financial Department, Planning and Management Department, Information Management Department, Enterprise Development Department, Risk Management Department, General Control Center, Department of Production Technology, Department of Safety Inspection, Electrical Engineering and Power Department, Ventilation and Dust Elimination Department, Geological Survey Department, Office of Community Relationship, Technical Center, Overseas Management Department, Department of Environmental Protection and Energy-saving and Resources Development Department.
The following chart shows our simplified corporate structure as of December 31, 2012:
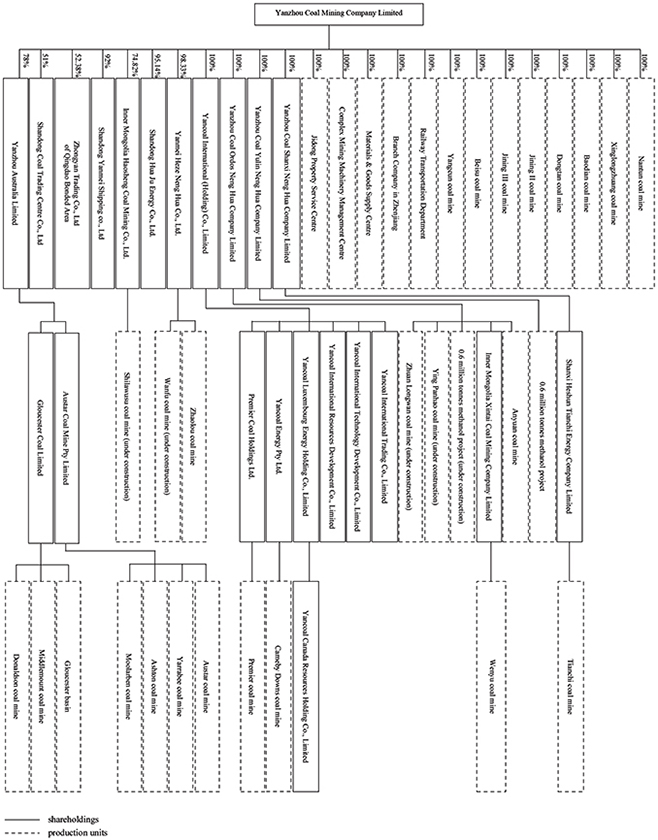
| D. | Property, Plant and Equipment |
Real Property and Leasehold Property
As of December 31, 2012, the net book value of our property, plant and equipment was RMB 39,503.1 million. The properties for which we own land use rights in China occupy an area of approximately 6.93 million square meters, while the coalfields to which we possess mining rights in Australia occupy an area of approximately 1.8 billion square meters. Under PRC law, land use rights for properties in China are granted for 50 years commencing from the respective grant dates of such land use rights and are freely transferable. In addition, the land ownership rights held by Yancoal Australia are held in perpetuity pursuant to Australian law.
As of the date of this annual report, we have not obtained certain land-use rights and building ownership certificates in China. In addition, we have not completed the registration procedure with relevant real estate administrative authorities with respect to certain properties we lease in China. We do not expect that our rights to use or occupy such properties will be challenged by third parties and as of the date of this annual report, we are not aware of any administrative or legal action with respect to these properties. However, we are prohibited from the transfer, lease, mortgage, or disposal of such properties until we obtain the relevant real estate or building ownership certificates.
Coal Mines and Coal Production Facilities
Nantun, Xinglongzhuang, Baodian, Dongtan, Jining II, Jining III, Beisu and Yangcun Coal Mines are all located in the southwestern part of Shandong Province. Except for Yangcun Coal Mine, all of these mines are connected by our railway network, which directly connect to our customers or the PRC national railway or highway systems. We acquired Jining II Coal Mine in 1998 and Jining III Coal Mine in 2001. We acquired Heze Nenghua, the operator of Tianchi Coal Mine in 2006 and subsequently the mining rights of Zhaolou Coal Mine through Heze Nenghua in 2008. Our wholly owned subsidiary, Ordos Neng Hua, acquired Anyuan Coal Mine in 2010 and acquired the mining rights of Zhuanlongwan coalfield through public bidding in 2011. In addition, Ordos Neng Hua acquired 80% of the equity interest in Inner Mongolia Xintai in 2011, which has operated Wenyu Coal Mine since July 2011.
We acquired Austar Coal Mine in Australia in 2004, and we acquired the entire equity interest in Yancoal Resources (formerly Felix) through Yancoal Australia in 2009, which operates Ashton Coal Mine, Yarrabee Coal Mine and Moolarben Coal Mine. We acquired an additional 30% of the equity interest in the Ashton Coal Mine Joint Venture and disposed of 51% of the equity interest in the Minerva Coal Mine Joint Venture in 2011. As of December 31, 2012, we held 90% of the equity interest in the Ashton Coal Mine Joint Venture. In August 2011, we acquired the entire equity interest of both Syntech Holdings Pty Ltd. and Syntech Holdings II Pty Ltd., which operate the Cameby Downs Coal Mine and have five exploration tenements that can be potentially developed. In September 2011, we acquired the entire equity interest of both Premier Coal, which operates the Premier Coal Mine and Wilga Exploration Area, and Premier Char. In May 2012, we purchased from Yankuang Group and Beisu Company all of the assets and liabilities of Beisu Coal Mine and Yangcun Coal Mine, including mining rights, building ownership certificates, mining and related equipment and other fixed assets. In addition, as a result of its merger with Gloucester in June 2012, Yancoal Australia is the largest listed Australian pure-play coal mining enterprise in terms of saleable coal production in 2011.
As of the date of this annual report, the following material approvals, permits and licenses need to be obtained or renewed for our coal mines or projects in China:
the permit for our acquisition of Anyuan Coal Mine is pending regulatory review and approval by the Inner Mongolia government authorities. In addition, we are in the process of renewing the working safety permit, mining permit and coal production permit for Anyuan Coal Mine, which we expect to complete by the second half of 2013;
we obtained the approval from the NDRC to conduct preliminary work on Shilawusu and Zhuanlongwan projects in December 2012 and March 2013, respectively;
Yingpanhao Project has been included into the NDRC’s twelfth five-year plan for the coal mining industry in March 2012. We are in the process of obtaining permits for our commencement of construction on this project;
we are in the process of obtaining a mining permit for Wanfu Project;
we are undergoing transfer procedures for Yangcun and Beisu Coal Mines; and
we are in the process of renewing the water pollution discharge permit for Jining II and Jining III Coal Mines.
In addition to the above, a number of material Australian regulatory approvals, permits and licenses are pending, outstanding, have not been applied for as yet or have expired, including:
surface mining leases for the development of proposed additional stages of the Moolarben Coal Mine, as well as agreements with affected landholders (including a competitor of Yancoal Australia), which are still in process; and
we have obtained the planning approval for the proposed additional “South East Open Cut” project of the Ashton Coal Mine from the Planning Institution of Australia. We expect to have the hearing for the Environmental Impact Assessment in the second half of 2013.
We operate substantially all of our mines either directly or through our subsidiaries and we have contracted the mining operations at Anyuan, Wenyu and Cameby Downs Coal Mines and Duralie open-pit mine at Gloucester Coal Mine to third party contractors.
The map below shows the location of Nantun, Xinglongzhuang, Baodian, Dongtan, Jining II, Jining III Coal Mines and our railway system:
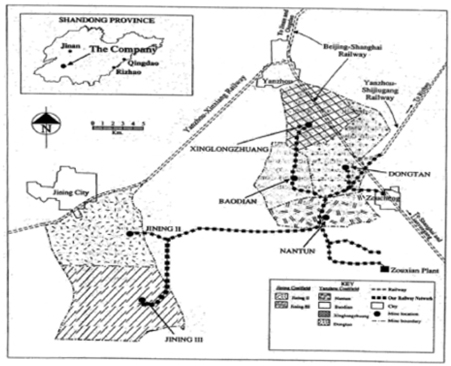
The map below shows the location of Tianchi Coal Mine:
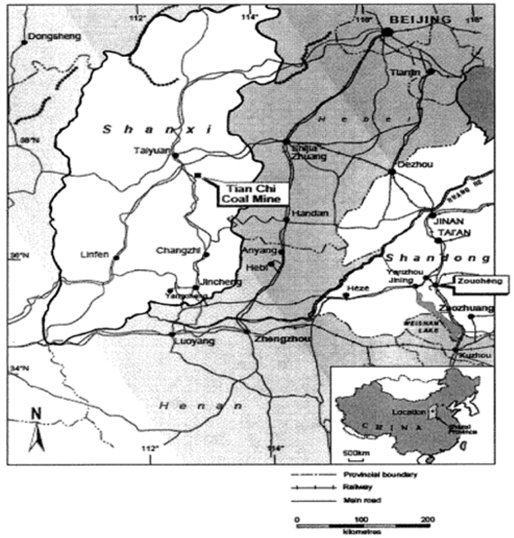
The map below shows the location of Zhaolou Coal Mine:
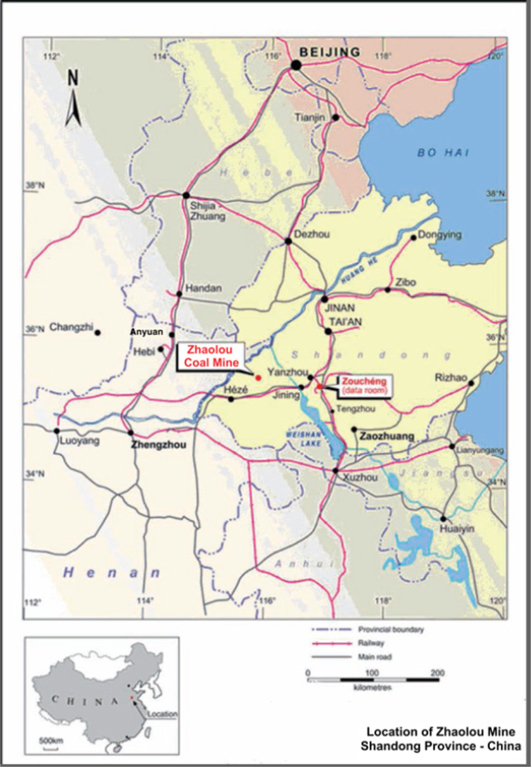
The map below shows the location of Anyuan and Wenyu Coal Mines:
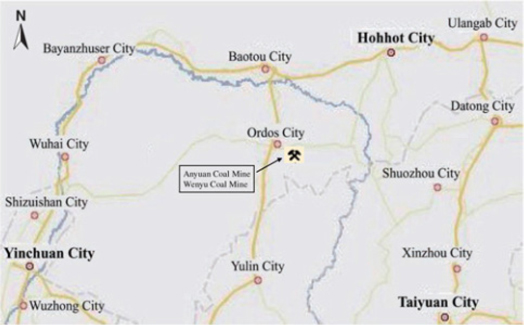
The map below shows the location of Beisu Coal Mine:
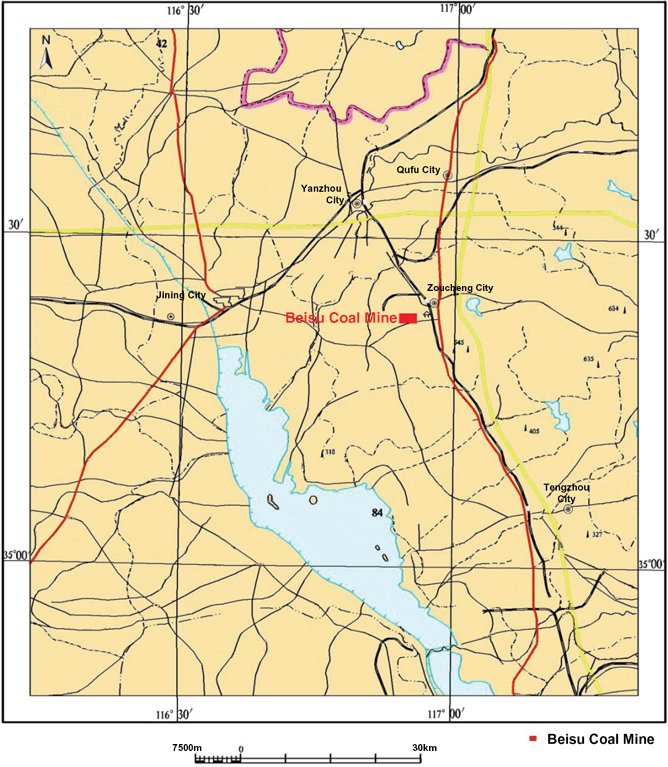
The map below shows the location of Yangcun Coal Mine:
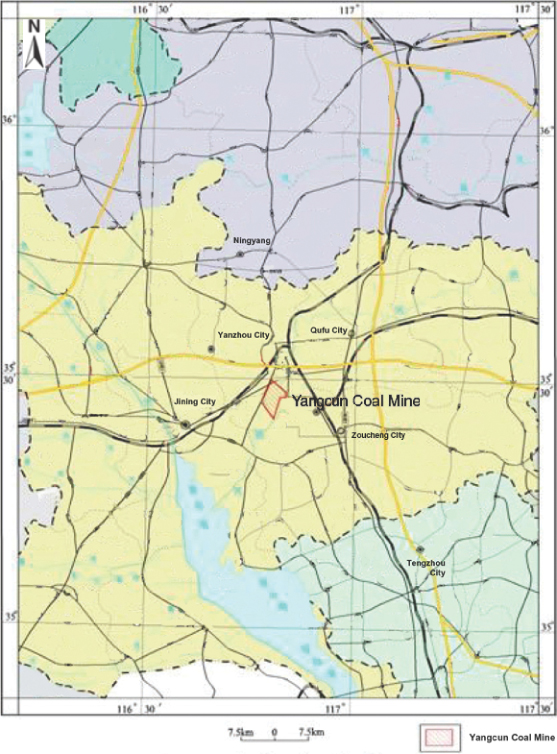
The map below shows the location of Austar, Yarrabee, Ashton and Moolarben Coal Mines as well as developmental-stage projects Athena, Harrybrandt, Wilpeena and Wilga.
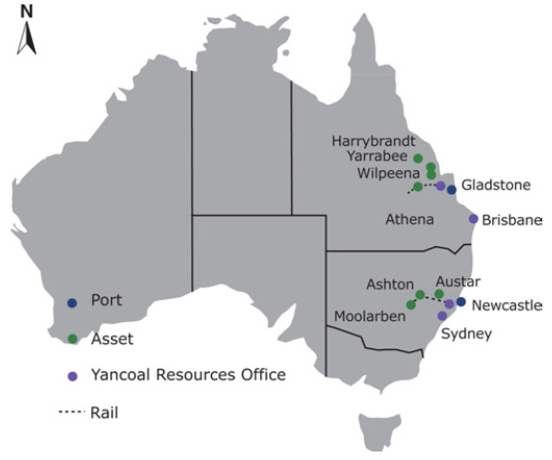
The map below shows the location of Cameby Downs Coal Mine:
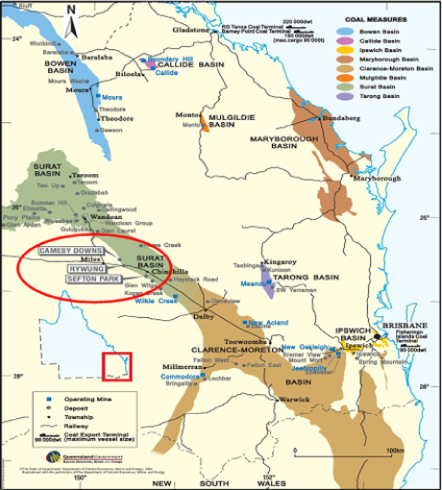
The map below shows the location of Premier Coal Mine:
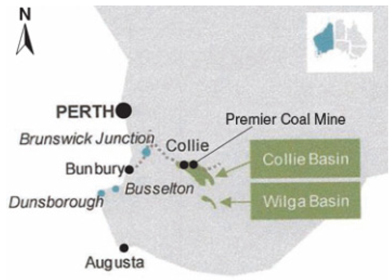
The map below shows the location of Gloucester, Donaldson and Middlemount Coal Mines and Monash Project:
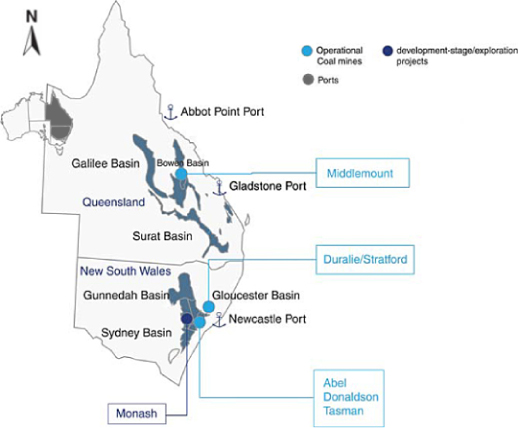
The Six Coal Mines
The following table sets forth information about Nantun, Xinglongzhuang, Baodian, Dongtan, Jining II, Jining III Coal Mines, which are directly owned and operated by the Company:
| Nantun | Xinglong- zhuang | Baodian | Dongtan | Jining II | Jining III | Total | ||||||||
Background data: | ||||||||||||||
Commencement of construction | 1966 | 1975 | 1977 | 1979 | 1989 | 1993 | N/A | |||||||
Commencement of commercial production | 1973 | 1981 | 1986 | 1989 | 1997 | 2000 | N/A | |||||||
Coalfield area (square kilometers) | 35.2 | 59.81 | 36.4 | 60.0 | 87.1 | 105.1 | 383.61 | |||||||
Reserve data:(1) (millions tonnes as of December 31, 2012) | ||||||||||||||
Total in-place proven and probable reserves(1) | 108.05 | 304.08 | 269.85 | 436.94 | 400.53 | 209.98 | 1.729.43 | |||||||
Mining recovery rate(2)(%) | 81.20 | 81.26 | 80.45 | 84.09 | 79.51 | 80.46 | N/A | |||||||
Coal preparation plant recovery rate (%)(3) | 74.31 | 86.82 | 72.51 | 46.99 | 72.71 | 62.65 | 65.37 | |||||||
Depth of mine(meters underground) | 397.0 | 429.2 | 474.7 | 710.0 | 593.0 | 556.0 | N/A | |||||||
Average thickness of main coal seam(meters) | 10.43 | 8.3 | 8.8 | 8.4 | 6.8 | 6.2 | N/A | |||||||
Type of coal | thermal coal | thermal coal | thermal coal | thermal coal | thermal coal | thermal coal | N/A | |||||||
Leased/owned | owned | owned | owned | owned | owned | owned | N/A | |||||||
Assigned/unassigned(4) | assigned | assigned | assigned | assigned | assigned | assigned | N/A | |||||||
Average calorific value (Kcal/kg) | 5290 | 5484 | 5507 | 5249 | 5158 | 5227 | N/A | |||||||
Sulfur content (%) | 0.91 | 0.51 | 0.55 | 0.53 | 0.56 | 0.59 | N/A | |||||||
Production data: (million tonnes) | ||||||||||||||
Designed raw coal production capacity | 2.4 | 3.0 | 3.0 | 4.0 | 4.0 | 5.0 | 21.4 | |||||||
Designed washing capacity | 1.8 | 3.0 | 3.0 | 4.0 | 3.0 | 5.0 | 19.8 | |||||||
Raw coal production | ||||||||||||||
1997-2005 | 37.9 | 56.1 | 50.2 | 62.5 | 35.3 | 37.5 | 279.5 | |||||||
2006 | 3.9 | 7.2 | 5.6 | 8.0 | 4.0 | 6.8 | 35.5 | |||||||
2007 | 3.9 | 6.8 | 5.8 | 7.6 | 3.4 | 5.3 | 32.8 | |||||||
2008 | 3.5 | 6.6 | 6.0 | 7.0 | 3.9 | 6.1 | 33.1 | |||||||
2009 | 3.8 | 6.6 | 5.7 | 7.5 | 3.6 | 6.2 | 33.4 | |||||||
2010 | 3.6 | 6.8 | 6.1 | 7.4 | 4.2 | 6.2 | 34.3 | |||||||
2011 | 3.3 | 6.8 | 6.1 | 7.3 | 4.4 | 6.0 | 34.0 | |||||||
2012 | 3.2 | 7.0 | 6.1 | 7.6 | 3.7 | 5.5 | 33.1 | |||||||
Cumulative raw coal production as of December 31, 2012 | 63.1 | 103.9 | 91.6 | 114.9 | 62.5 | 79.7 | 515.7 | |||||||
| (1) | The proven and probable reserves of the above coal mines are based on the report dated February 6, 1998 prepared by International Mining Consultants Limited, a UK-based company, in accordance with the standards in Industry Guide 7. |
Under Industry Guide 7, “proven reserves” are reserves for which (a) quantity is computed from dimensions revealed in outcrops, trenches, workings or drill holes, grade and/or quality are computed from the results of detailed sampling and (b) the sites for inspection, sampling and measurement are spaced so closely and the geologic character is so well defined that size, shape, depth and mineral content of reserves are well-established. “Probable reserves” are reserves for which quantity and grade and/or quality are computed from information similar to that used for proven reserves, but the sites for inspection, sampling, and measurement are further apart or are otherwise less adequately spaced. The degree of assurance of “probable reserves,” although lower than that for proven reserves, is high enough to assume continuity between points of observation.
The total proven and probable reserves as of the end of a year are derived by deducting the proven and probable reserves consumed in the coal production in the same year from the proven and probable reserves as of the end of the immediately preceding year.
| (2) | The mining recovery rate is the rate of the amount of coal recovered from a determined amount of proven and probable reserves, which is calculated by dividing the actual volume of coal recovered in a year by the volume of proven and probable reserves mined and consumed in the same year. |
| (3) | “Coal preparation plant recovery rate” refers to the wash plant recovery rate of raw coal used during the production of our coal products. |
| (4) | “Assigned” refers to coal reserves which have been committed to a particular mining complex (mine shafts, mining equipment, and plant facilities), and all coal which has been leased by the company to others. “Unassigned” refer to coal reserves which have not been committed, and which would require new mine shafts, mining equipment or plant facilities before operations could begin on the property. |
Nantun Coal Mine
Nantun is located in the southern portion of our coalfield, with a coalfield area of approximately 35.2 square kilometers. Nantun began commercial production in 1973 with a designed annual raw coal production capacity of 2.4 million tonnes of coal. The main coal seam of Nantun is divided into four leaves. The thickness of the upper leaf averages 5.35 and 3.21 meters and the thickness of the lower leaf averages 0.89 and 1.03 meters. As of December 31, 2012, the total in-place proven and probable reserves on the main coal layer were approximately 108.05 million tonnes.
We primarily use the fully mechanized sublevel caving mining method to extract coal. As of December 31, 2012, Nantun produced coal from three work faces. Nantun’s coal preparation plant produces mainly No. 2 Clean Coal and employs movable-sieve jig machines and jig machines. Most of the equipment used in the Nantun coal preparation plant was manufactured in the PRC.
Xinglongzhuang Coal Mine
Xinglongzhuang is located in the northern portion of our coalfield, with coalfield area of approximately 59.8 square kilometers. Xinglongzhuang began commercial production in 1986 with a designed annual raw coal production capacity of 3.0 million tonnes. The main coal seam of Xinglongzhuang is concentrated in one leaf with an average thickness of 8.3 meters. As of December 31, 2012, the total in-place proven and probable reserves on the main coal layer were approximately 304.08 million tonnes.
We primarily use the fully mechanized sublevel caving method to extract coal from the coal seam of Xinglongzhuang Coal Mine. At this coal mine, we produced coal from two work faces as of December 31, 2012. The Xinglongzhuang coal preparation plant produces No. 1 and No. 2 Clean Coal and lump coal. The majority of the equipment in the Xinglongzhuang coal preparation plant, including its jig machines and movable-sieve jig machines, was manufactured in the PRC while a small portion of the equipment was imported.
Baodian Coal Mine
Baodian is located in the central western portion of our coalfield, with coalfield area of approximately 36.4 square kilometers. Baodian began commercial production in 1986 with a designed annual raw coal production capacity of 3.0 million tonnes. Certain sections of the main coal seam of Baodian are concentrated in one leaf, with an average thickness of 8.81 meters. The remaining sections are divided into two leaves with an average thickness of 5.74 meters for the upper leaf and 3.38 meters for the lower leaf. As of December 31, 2012, the total in-place proven and probable reserves on the main coal layer were approximately 269.85 million tonnes.
We primarily use the fully mechanized sublevel caving method to extract coal. At this coal mine, we maintained two work faces as of December 31, 2012. The Baodian coal preparation plant produces No. 2 Clean Coal and lump coal. The majority of equipment in the Baodian coal preparation plant, including its slanted wheel, cyclones and jig machines, was manufactured in the PRC.
Dongtan Coal Mine
Dongtan is located in the central eastern portion of our coalfield, with coalfield area of approximately 60.0 square kilometers. Dongtan began commercial production in 1989 with a designed annual raw coal production capacity of 4.0 million tonnes. Certain sections of the main coal seam consist of one layer with an average thickness of 8.41 meters, and the remaining sections are divided into two layers, with an average thickness of 5.38 meters for the upper layer and 3.22 meters for the lower layer. As of December 31, 2012, the main coal layer held approximately 436.94 million tonnes of in-place proven and probable reserves.
We primarily use the fully mechanized sublevel caving method to extract coal. At this mine, we maintained two work faces as of December 31, 2012. The Dongtan coal preparation plant produces No. 2 and No. 3 Clean Coal and lump coal. The principal pieces of equipment in the Dongtan coal preparation plant, including its slanted wheel, cyclones and jig machines, were manufactured in the PRC.
Jining II Coal Mine
Jining II is located in the northern portion of the Jining coalfield, with coalfield area of approximately 87.1 square kilometers. Jining II began commercial production in 1997 with a designed annual raw coal production capacity of 4.0 million tonnes. Certain sections of the main coal seam of Jining II are concentrated in one layer, with an average thickness of 6.78 meters. The remaining sections are divided into two layers, with an average thickness of 2.1 meters for the upper leaf and an average thickness of 4.68 meters for the lower leaf. As of December 31, 2012, the total in-place proven and probable reserves on the main coal layer were approximately 400.53 million tonnes.
We primarily use the fully mechanized sublevel caving method to extract coal. At this coal mine, we produced coal from two work faces as of December 31, 2012. The main equipment used in Jining II are movable-sieve jig machines and jig machines, most of which were manufactured in the PRC. The principal product of the coal preparation plant of Jining II is No. 2 Clean Coal.
Jining III Coal Mine
Jining III is located in the southern portion of the Jining coalfield and covers an area of 105.0 square kilometers. Jining III has a designed annual raw coal production capacity of 5 million tonnes. Certain sections of the main coal seam of Jining III are concentrated in one layer, with an average thickness of 6.2 meters. The remaining sections are divided into two layers, with an average thickness of 1.21 meters for the upper leaf and an average thickness of 4.9 meters for the lower leaf. As of December 31, 2012, the total in-place proven and probable reserves on the main coal layer were approximately 209.98 million tonnes.
We primarily used the fully mechanized sublevel caving method to extract coal from three work faces in Jining III Coal Mine as of December 31, 2012. The main pieces of equipment used in Jining III are slanted wheel, cyclones and movable-sieve jig machines, which were manufactured in the PRC. The principal products of the coal preparation plant of Jining III are No. 2 and No. 3 Clean Coal. In 2010, Jining III made technical improvements which provided it with washing capacity.
Beisu and Yangcun Coal Mines
The following table sets forth information about Beisu and Yangcun Coal Mines, which are directly owned and operated by the Company:
| Beisu | Yangcun | Total | ||||
Background data: | ||||||
Commencement of construction | 1972 | 1981 | N/A | |||
Commencement of commercial production | 1976 | 1988 | N/A | |||
Coalfield area(square kilometers) | 29.3 | 27.46 | 75.38 | |||
Reserve data: (as of December 31, 2012) | ||||||
Mining recovery rate (%)(1) | 87.7% | 83.3% | N/A | |||
Coal preparation plant recovery rate (%)(2) | N/A | N/A | N/A | |||
Depth of mine(meters underground) | 269.7 | 318.8 | N/A | |||
Average thickness of main coal seam(meters) | 1.89 | 10.53 | N/A | |||
Type of coal | thermal coal | thermal coal | N/A | |||
Leased/owned | owned | owned | N/A | |||
Assigned/unassigned(3) | assigned | assigned | N/A | |||
Average calorific value(Kcal/kg) | 5,302 | 5,215 | N/A | |||
Sulfur content (%) | 3.55 | 1.29 | N/A | |||
Production data:(million tonnes) | ||||||
Designed raw coal production capacity | 1.0 | 1.15 | 2.15 | |||
Designed coal preparation input washing capacity | — | — | — | |||
Raw coal production | ||||||
2011 | — | — | — | |||
2012 | 1.0 | 1.1 | 2.1 | |||
Cumulative raw coal production as of December 31, 2012 | 1.0 | 1.1 | 2.1 | |||
| (1) | The mining recovery rate is the rate of the amount of coal recovered from a determined amount of proven and probable reserves, which is calculated by dividing the actual volume of coal recovered in a year by the volume of proven and probable reserves mined and consumed in the same year. |
| (2) | “Coal preparation plant recovery rate” refers to the wash plant recovery rate of raw coal used during the production of our coal products. |
| (3) | “Assigned” reserves refer to coal reserves which have been committed to a particular mining complex (mine shafts, mining equipment and plant facilities), and all coal which has been leased by the company to others. “Unassigned” reserves refers to coal reserves which have not been committed, and which would require new mine shafts, mining equipment, or plant facilities before operations could begin on the property. |
Beisu Coal Mine
Beisu Coal Mine is located in the south portion of our coalfield, and covers an area of approximately 29.3 square kilometers. We acquired the entire assets of Beisu Coal Mine in May 2012.
Beisu Coal Mine commenced operations in 1976 with a designed annual raw coal production capacity of 0.75 million tonnes. The annual raw coal production capacity has been increased to 1.0 million tonnes since 2006. The main coal seam of Beisu is divided into two thin-seam leaves. The thickness of the upper leaf averages 0.9 meters and the thickness of the lower leaf averages 0.99 meters. We primarily used the thin coal seam blasting method and the fully mechanized system to extract coal from three work faces in Beisu Coal Mine as of December 31, 2012. Beisu Coal Mine primarily produces thermal coal. Beisu Coal Mine has a coal preparation plant. The main equipment used in the coal preparation plant is a waste discharge system, which was manufactured in China.
Yangcun Coal Mine
Yangcun Coal Mine is located in the north portion of our coalfield, and covers an area of approximately 27.46 square kilometers. We acquired the entire assets of Yangcun Coal Mine in May 2012.
Yangcun Coal Mine commenced operations in 1988 with a designed annual raw coal production capacity of 0.6 million tonnes. The annual raw coal production capacity has been increased to 1.15 million tonnes since 2006. The main coal seam of Yangcun is divided into three leaves. The thickness of the upper leaf averages 8.34 meters and the thickness of the lower leaves average 1.17 and 1.02 meters. We primarily used the fully mechanized sublevel caving method to extract coal from the upper leaf and the fully mechanized system to extract coal from the lower leaves. As of December 31, 2012, Yangcun Coal Mine has three work faces. Yangcun Coal Mine primarily produces thermal coal. Yangcun Coal Mine does not have any coal preparation plant.
Coal Mines operated by Shanxi Nenghua and Heze Nenghua
The following table sets forth information about Tianchi Coal Mine and Zhaolou Coal Mine in China that are operated by Shanxi Nenghua and Heze Nenghua:
| Tianchi | Zhaolou | Total | ||||
Background data: | ||||||
Commencement of construction(1) | 2004 | 2009 | N/A | |||
Commencement of commercial production(1) | 2004 | 2009 | N/A | |||
Coalfield area(square kilometers) | 18.7 | 143.4 | 162.1 | |||
Reserve data: (millions tonnes as of December 31, 2012) | ||||||
Recoverable reserves(2) | 25.7 | 102.2 | 127.9 | |||
Mining recovery rate(3)(%) | 80.4 | 87.4 | N/A | |||
Coal preparation plant recovery rate (%)(4) | N/A | 46.08 | N/A | |||
Depth of mine(meters underground) | 225 | 905 | N/A | |||
Average thickness of main coal seam(meters) | 4.6 | 5.2 | N/A | |||
Type of coal | thermal coal | 1/3 coking coal | N/A | |||
Leased/owned | owned | owned | N/A | |||
Assigned/unassigned(4) | assigned | assigned | N/A | |||
Average calorific value(Kcal/kg) | 4,803 | 5,806 | N/A | |||
Sulfur content (%) | 1.09 | 0.87 | N/A | |||
Production data:(million tonnes) | ||||||
Designed raw coal production capacity | 1.2 | 3.0 | 4.2 | |||
Designed coal preparation input washing capacity | — | 3.0 | 3.0 | |||
Raw coal production | ||||||
2006 | 0.1 | — | 0.1 | |||
2007 | 1.2 | — | 1.2 | |||
2008 | 1.1 | — | 1.1 | |||
2009 | 1.0 | 0.04 | 1.04 | |||
2010 | 1.5 | 1.6 | 3.1 | |||
2011 | 1.2 | 3.0 | 4.2 | |||
2012 | 1.4 | 2.7 | 4.1 | |||
Cumulative raw coal production as of December 31, 2012 | 7.5 | 7.3 | 14.8 | |||
| (1) | With respect to the Tianchi Coal Mine, the “commencement of construction” refers to capacity expansion and technology upgrade undertaken after our 2006 acquisition; the “commencement of commercial production” refers to the resumption of production after completion of the foregoing expansion and upgrade. |
| (2) | The recoverable reserves of the above coal mines are based on the report prepared by Minarco Asia Pacific Pty Limited in May 2006 in accordance with the standards in the JORC Code. |
“Recoverable reserves” generally refer to proved and probable reserves under the JORC Code as revised in 2004,. “Proved reserves” are the economically mineable part of a measured coal resource and “probable reserves” are the economically mineable part of an indicated, and in some circumstances, measured coal resource. Both “proved reserves” and “probable reserves” incorporate mining dilution and allow for mining losses and are based on an appropriate level of mine planning, mine design and scheduling.
| (3) | The mining recovery rate is the rate of the amount of coal recovered from a determined amount of proven and probable reserves, which is calculated by dividing the actual volume of coal recovered in a year by the volume of proven and probable reserves mined and consumed in the same year. |
| (4) | “Coal preparation plant recovery rate” refers to the wash plant recovery rate of raw coal used during the production of our coal products. |
| (5) | “Assigned” refer to coal reserves which have been committed to a particular mining complex (mine shafts, mining equipment and plant facilities), and all coal which has been leased by the company to others. “Unassigned” refers to coal reserves which has not been committed, and which would require new mine shafts, mining equipment, or plant facilities before operations could begin on the property. |
Tianchi Coal Mine
Tianchi Coal Mine is an underground mine located in Heshun County of Shanxi, with an area of approximately 18.7 square kilometers. Tianchi Coal Mine commenced commercial production in 2006 and the designed production capacity was increased to 1.2 million tonnes per annum in the same year. Tianchi Coal Mine is operated by inclined shaft development and primarily produces thermal coal. The average thickness of the target coal seam is 4.6 meters. As of December 31, 2012, the total recoverable reserves of Tianchi Coal Mine were approximately 25.7 million tonnes.
We primarily used the longwall caving mining method to extract coal from one work face at Tianchi Coal Mine as of December 31, 2012. The primary piece of equipment in this system is a slanted wheel, which was manufactured in China. The operations at Tianchi Coal Mine are powered by electricity from local power grids. We ship coal products from the Tianchi Coal Mine to Hebei and surrounding areas on the Yangshe Railway and the national railway network, as well as the highway network.
Zhaolou Coal Mine
Zhaolou Coal Mine is an underground longwall mine located in the central portion of Juye Coal Field in Shandong. Zhaolou Coal Mine covers an area of approximately 143.4 square kilometers, and is accessible by roadway and railway.
Zhaolou Coal Mine commenced commercial production in December 2009 and has a designed annual raw coal production capacity of 3.0 million tonnes. Zhaolou Coal Mine produces 1/3 coking coal. The average thickness of the main coal seam of Zhaolou Coal Mine is 5.2 meters. The total recoverable reserves of Zhaolou Coal Mine were approximately 102.2 million tonnes as of December 31, 2012, which was net of coal preparation and plant recovery losses.
We primarily used the longwall caving mining method to extract coal from the two work faces at Zhaolou Coal Mine as of December 31, 2012. The coal preparation plant at Zhaolou Coal Mine commenced commercial production in September 2009. The main equipment used in the coal preparation plant was a slanted wheel, cyclone machines and TBS separators, which were mainly produced in China. The main product of Zhaolou’s coal preparation plant is No. 2 Clean Coal. The operations at Zhaolou Coal Mine are powered by electricity from local power grids. We ship coal products to Shandong and Hebei Provinces and surrounding areas by truck.
Coal Mines operated by Ordos Neng Hua
The following table sets forth information about Anyuan Coal Mine and Wenyu Coal Mine in China that are operated by Ordos Neng Hua:
| Anyuan | Wenyu | Total | ||||
Background data: | ||||||
Commencement of construction | — | 1996 | N/A | |||
Commencement of commercial production | 2004 | 1997 | N/A | |||
Coalfield area(square kilometers) | 9.26 | 9.36 | 75.38 | |||
Reserve data: (as of December 31, 2012) | ||||||
Mining recovery rate (%)(1) | 88.4 | 88.7 | N/A | |||
Coal preparation plant recovery rate (%)(2) | N/A | N/A | N/A | |||
Depth of mine(meters underground) | 68 | 59 | N/A | |||
Average thickness of main coal seam(meters) | 2.8 | 3.9 | N/A | |||
Type of coal | thermal coal | thermal coal | N/A | |||
Leased/owned | owned | owned | N/A | |||
Assigned/unassigned(3) | assigned | assigned | N/A | |||
Average calorific value(Kcal/kg) | 5,309 | 2,237 | N/A | |||
Sulfur content (%) | 0.32 | 0.75 | N/A | |||
Production data:(million tonnes) | ||||||
Designed raw coal production capacity | 1.2 | 3.0 | 6.35 | |||
Designed coal preparation input washing capacity | — | — | — | |||
Raw coal production | �� | |||||
2011 | 2.3 | 2.1 | 4.4 | |||
2012 | 2.3 | 4.6 | 6.9 | |||
Cumulative raw coal production as of December 31, 2012 | 4.6 | 6.7 | 11.3 | |||
| (1) | The mining recovery rate is the rate of the amount of coal recovered from a determined amount of proven and probable reserves, which is calculated by dividing the actual volume of coal recovered in a year by the volume of proven and probable reserves mined and consumed in the same year. |
| (2) | “Coal preparation plant recovery rate” refers to the wash plant recovery rate of raw coal used during the production of our coal products. |
| (3) | “Assigned” reserves refer to coal reserves which have been committed to a particular mining complex (mine shafts, mining equipment and plant facilities), and all coal which has been leased by the company to others. “Unassigned” reserves refers to coal reserves which have not been committed, and which would require new mine shafts, mining equipment, or plant facilities before operations could begin on the property. |
Anyuan Coal Mine
Through Ordos Neng Hua, we wholly control Anyuan Coal Mine, which is located in Yijinhuoluoqi of Ordos City in Inner Mongolia Autonomous Region, and covers an area of approximately 9.3 square kilometers. Ordos Neng Hua commenced commercial production in 2011.
In 2011, we increased the annual production capacity of Anyuan Coal Mine from the designed annual production capacity of 600,000 tonnes to 1.2 million tonnes through reconstruction and expansion. Anyuan Coal Mine primarily produces thermal coal. The average thickness of the main coal seam of Anyuan Coal Mine is 2.8 meters. We principally extracted coal from one work face at Anyuan Coal Mine as of December 31, 2012. Anyuan Coal Mine has a coal separation system. Anyuan Coal Mine is located in close proximity to railway and road transportation. The provincial highway and Baoshen railway are located approximately six kilometers to the west of the coalfield.
Wenyu Coal Mine
Through our subsidiary, Inner Mongolia Xintai, we operate Wenyu Coal Mine, which is located in Ordos City in Inner Mongolia Autonomous Region, and covers an area of approximately 9.36 square kilometers.
The original designed annual raw coal production capacity of Wenyu Coal Mine was 1.1 million tonnes. We completed production capacity expansion from 1.1 million tonnes to 3.0 million tonnes upon approvals from the relevant administrative authority and commenced commercial production in 2011. The average thickness of the main seam of Wenyu Coal Mine is 4.0 meters. The type of coal is thermal coal. We principally extracted coal from two work faces at Wenyu Coal Mine as of December 31, 2012. Wenyu Coal Mine has a simplified coal separation system. Wenyu Coal Mine is located in close proximity to Baofu road, Anyuan Coal Mine and railway transportation.
Coal Mines operated by Yancoal Australia
The following table sets forth information about our operational coal mines in Australia, which are directly or indirectly held by Yancoal Australia:
| Austar | Yarrabee | Ashton | Moolarben | Gloucester Mine | Donaldson Mine | Middlemount(6) | Total | |||||||||
Background data: | ||||||||||||||||
Commencement of construction(1) | 1998 | 1981 | 2003 | 2009 | 1998 | 2001 | 2009 | N/A | ||||||||
Commencement of commercial production(1) | 2000 | 1982 | 2004 | 2010 | 1999 | 2001 | 2011 | N/A | ||||||||
Coalfield area(2)(square kilometers) | 63 | 62.7 | 19.2 | 17.4 | 20.5 | 42.3 | 27.7 | 252.8 | ||||||||
Reserve data: (millions of tonnes as of December 31, 2012) | ||||||||||||||||
Recoverable reserves(3) | 49.7 | 61.4 | 74.0 | 300.9 | 69.4 | 148.3 | 96.0 | 799.7 | ||||||||
Depth of mine(4) (meters underground) | 300-700 | N/A | 190-280 | N/A | N/A | 50-150 | N/A | N/A | ||||||||
Type of coal | semi-hard coking coal | PCI coal | semi-soft coking coal | thermal coal | semi-hard coking coal | semi-soft coking coal | Coking coal PCI coal | N/A | ||||||||
Leased/owned | owned | owned | owned | owned | owned | owned | owned | N/A | ||||||||
Assigned/unassigned(5) | assigned | assigned | assigned | assigned | assigned | assigned | assigned | N/A | ||||||||
Average calorific value (Kcal/kg) | 6196 | 7300 | 7100 | 6650 | 7550 | 8200 | 7300 | N/A | ||||||||
Sulfur content (%) | 1.75 | 0.7 | 0.65 | 0.5 | 1.05 | 0.90 | 0.5 | N/A | ||||||||
Production data:(million tonnes) | ||||||||||||||||
Designed raw coal production capacity | 3.6 | 3.0 | 5.2 | 16.0 | 3.8 | 3.0 | 5.25 | 34.6 | ||||||||
Designed coal preparation input washing capacity | 3.3 | 2.4 | 6.5 | 16.0 | 3.8 | 3.0 | 5.25 | 30.0 | ||||||||
Raw coal production | ||||||||||||||||
2006 | 0.4 | — | — | — | — | — | — | 0.4 | ||||||||
2007 | 1.6 | — | — | — | — | — | — | 1.6 | ||||||||
2008 | 1.9 | — | — | — | — | — | — | 1.9 | ||||||||
2009 | 1.9 | — | — | — | — | — | — | 1.9 | ||||||||
2010 | 1.7 | 2.3 | 2.7 | 3.9 | — | — | — | 10.6 | ||||||||
2011 | 1.9 | 3.1 | 1.7 | 5.6 | — | — | — | 12.3 | ||||||||
2012 | 1.7 | 3.2 | 2.3 | 7.2 | 1.8 | 2.0 | — | 18.2 | ||||||||
Cumulative raw coal production as of December 31, 2012 | 11.1 | 8.6 | 6.7 | 16.7 | 1.8 | 2.0 | — | 46.9 | ||||||||
| (1) | The Austar Coal Mine was closed in 2003 as the result of an underground fire. We acquired Austar Coal Mine in 2004 and implemented a production expansion and technology upgrade in 2005. Austar Coal Mine resumed part of its operations in October 2006. Each of the Ashton Coal Mine and Moolarben Coal Mine has an open-pit coal mine and an underground coal mine. The “commencement of commercial production” indicates the time when the open-pit mines, the earlier of the two types of mines, commenced commercial production. |
| (2) | The coalfield area refers to the area of current leased land for mining, excluding the area on which we own prospecting rights. The coalfield area of Harry-Brandt refers to the area on which we own prospecting rights. |
| (3) | The recoverable reserves of the above coal mines are based on the report prepared by the competent persons appointed by Yancoal Australia or Yancoal Resources and other companies which have been acquired by Yancoal Australia and such reserves refer to total proved and probable reserves that were prepared in accordance with the standards in the JORC Code. |
| (4) | Ashton Coal Mine has both open-pit and underground coal mines. The depth of mine indicates the depth of the underground mines. |
| (5) | “Assigned” refers to coal reserves which have been committed to a particular mining complex (mine shafts, mining equipment and plant facilities), and all coal which has been leased by the company to others. “Unassigned” refers to coal reserves which have not been committed, and which would require new mine shafts, mining equipment, or plant facilities before operations could begin on the property. |
| (6) | As Middlemount Coal Mine is owned and operated by a joint venture jointly controlled by Yancoal Australia and a third party, its production data and financial performance will not be consolidated in to our reports. |
Austar Coal Mine
Austar Coal Mine is an underground mine located in Hunter Valley, New South Wales, Australia and is accessible by railway. Austar Coal Mine covers an area of 63.0 square kilometers. Austar Coal Mine was constructed in 1998 and commenced commercial production in 2000.
In 2003, an underground fire occurred at Austar Coal Mine when it was still owned by Southland Coal Pty Limited, resulting in the closure of the mine. On December 24, 2004, we acquired the entire interest in the Austar Coal Mine for approximately A$32.0 million from Southland Coal Pty Limited, an independent third party. After we invested approximately A$230.3 million in the reconstruction, capacity expansion and technology upgrade of Austar Coal Mine in 2005, which included funding for equipment and machinery, the mine resumed commercial production of semi-hard coking coal in October 2006.
The average thickness of the main coal seam of Austar Coal Mine is 6.5 meters. As of December 31, 2012, the mine’s JORC-compliant reserves were approximately 49.7 million tonnes. As of the same date, the mine’s marketable coal reserves, representing beneficiated or otherwise enhanced coal products where modifications resulting from mining, dilution and processing have been considered, were approximately 39.6 million tonnes.
We principally use the fully mechanized longwall top coal caving mining method to extract coal from the underground mine. The main equipment used in the coal handling preparation plant consists of coal crushing equipment, cyclones and other associated equipment which were generally manufactured in Australia. The operations at Austar Coal Mine are powered by electricity from local power grids. We transport coal products from Austar Coal Mine to Newcastle Port via railway.
Yarrabee Coal Mine
Yarrabee Coal Mine is an open-pit mine located in Bowen Basin, Queensland, Australia and is accessible by railway to the Gladstone Port. Yarrabee Coal Mine covers an area of 62.7 square kilometers. The construction of Yarrabee Coal Mine started in 1981 and commercial production commenced in 1982.
Through Yancoal Resources, Yancoal Australia wholly owns Yarrabee Coal Mine. Currently, the designed annual capacity of Yarrabee Coal Mine is approximately 3.2 million tonnes. Yarrabee Coal Mine mainly produces low volatility PCI coal.
The thickness of the main coal seam of Yarrabee Coal Mine ranges from 3.2 to 4 meters. As of December 31, 2012, the mine’s JORC-compliant reserves were approximately 61.4 million tonnes. As of the same date, the mine’s marketable coal reserves were approximately 49.4 million tonnes. We utilize conventional truck shovel and open-pit mining methods to extract coal at Yarrabee Coal Mine.
Yarrabee Coal Mine has a coal preparation plant. The main pieces of equipment used in the coal preparation plant are heavy medium cyclone machines and floating separation machines, which were generally manufactured in Australia. The operations at Yarrabee Coal Mine are powered by electricity from local power grids. We transport coal products from Yarrabee Coal Mine to Gladstone Port via railway.
Ashton Coal Mine
Ashton Coal Mine consists of an underground mine and an open-pit mine located in Hunter Valley, New South Wales, Australia and is accessible by railway to Newcastle Port. Ashton Coal Mine covers an area of approximately 19.2 square kilometers. The construction of the open-pit and underground mines of Ashton Coal Mine started in 2003 and commercial production commenced in 2004.
The designed annual capacity of Ashton Coal Mine is approximately 5.2 million tonnes of coal. Ashton Coal Mine mainly produces semi-soft coking coal.
The thickness of the main coal seams of the open-pit mine and the underground mine of Ashton Coal Mine ranges from 2.14 to 2.26 meters and 1.7 to 2.4 meters, respectively. As of December 31, 2012, the mine’s JORC-compliant reserves were approximately 74.0 million tonnes. As of the same date, the mine’s marketable coal reserves were approximately 44.5 million tonnes, according to our internal estimates. We principally use longwall operations to extract coal from the underground coal seam and use conventional truck shovel mining methods at the open-pit mine of Ashton Coal Mine.
The main pieces of equipment used in the coal preparation plant of Ashton Coal Mine are heavy-medium cyclone machines and floating separation machines, which were generally manufactured in Australia. The operations at Ashton Coal Mine are powered by electricity from local power grids. We transport coal products from Ashton Coal Mine to Newcastle Port via railway.
Moolarben Coal Mine
Moolarben Coal Mine consists of an open-pit mine and an underground development project and is located near Mudgee in central western New South Wales. It is connected by railway to Newcastle Port. Moolarben Coal Mine covers an area of 17.4 square kilometers. Construction of the open-pit mine commenced in 2009 with commercial production starting in mid-2010. The construction of the underground mine at Moolarben is expected to commence in the second half of 2013.
Yancoal Australia holds 80% of the equity interest in Moolarben Coal Mine through its subsidiary, Moolarben Coal Mines Pty Limited. The designed annual capacity of Moolarben Coal Mine is approximately 17.0 million tonnes, of which the annual capacity of the underground mine is expected to be approximately 4.0 million tonnes and the annual capacity of the open-pit mine is approximately 13.0 million tonnes. Moolarben Coal Mine produces thermal coal.
The average thickness of the main coal seam of the open-pit mine of Moolarben Coal Mine is 5.5 to 11.66 meters. As of December 31, 2012, the mine’s JORC-compliant reserves were approximately 300.9 million tonnes. As of the same date, the mine’s marketable coal reserves were approximately 225.0 million tonnes. We use conventional truck shovel mining methods in the open-pit mine and expect to use longwall machines to extract coal in the underground mine project.
Moolarben Coal Mine has a coal handling preparation plant with a capacity of approximately 1,800 TPH, and utilizes conventional equipment including medium-heavy cyclones and flotation cells which are primarily manufactured in Australia. The operations at Moolarben Coal Mine are powered by electricity from local power grids. We transport thermal coal products from Moolarben Coal Mine to Newcastle Port via railway.
Gloucester Coal Mine
Gloucester Coal Mine is located in Gloucester basin in New South Wales, Australia and covers an area of 20.5 square kilometres. Gloucester Coal Mine is approximately 100 kilometers away from Newcastle Port. The construction of Gloucester Coal Mine started in 1998 and commercial production commenced in 1999.
Gloucester Coal Mine consists of two open-pit mines, Duralie and Stratford, which has an aggregate annual designed production capacity of 3.8 million tonnes and an aggregate annual designed preparation capacity of 3.8 million tonnes. As of December 31, 2012, Gloucester Coal Mine’s JORC-compliant reserves were approximately 69.4 million tonnes. As of the same date, the mine’s marketable coal reserves were approximately 40.0 million tonnes.
Duralie open-pit mine and Stratford open-pit mine own one coal preparation plan with an annual designed preparation capacity of 1.8 million tonnes, which was increased to 4.3 million tonnes in June 2011. We transport our coal products from Gloucester Coal Mine via railway.
Donaldson Coal Mine
Donaldson Coal Mine is located in Newcastle coal field in New South Wales, Australia and covers an area of 42.3 square kilometres. Donaldson Coal Mine is approximately 25 kilometers away from Newcastle Port. The construction of Donaldson Coal Mine started in 2001 and commercial production commenced in the same year.
Donaldson Coal Mine consists of one open-pit coal mine, Donaldson open-pit mine and two underground coal mines, Abel and Tasman underground mines, which has an aggregate annual designed production capacity of 3.0 million tonnes. As of December 31, 2012, Donaldson Coal Mine’s JORC-compliant reserves were approximately 148.3 million tonnes. As of the same date, the mine’s marketable coal reserves were approximately 90.5 million tonnes.
Our coal products at Donaldson Coal Mine are prepared by a coal preparation plant owned and operated by a third party with coal preparation capacity of 3.0 million tonnes per year. We transport our coal products from Donaldson Coal Mine via railway.
Middlemount Coal Mine
Middlemount Coal Mine is located at Bowen Basin in Queensland, Australia and covers an area of 27.7 square kilometres. The mine is approximately 300 kilometres away from Abbot Point port. The construction of Middlemount Coal Mine started in 2009 and commercial production commenced in 2011. Through Yancoal Australia, we own approximately 50% of the equity interest in the joint venture owns and operates Middlemount Coal Mine.
As of December 31, 2012, Middlemount Coal Mine’s JORC-compliant reserves were approximately 96 million tonnes. As of the same date, the mine’s marketable coal reserves were approximately 69.1 million tonnes. The mine has an annual designed production capacity of 5.4 million tonnes. We use conventional open-pit mining methods to extract coal at Middlemount open-pit mine Middlemount Coal Mine primarily produces coking coal and PCI coal. Middlemount Coal Mine has a coal preparation plant with an annual capacity of 5.25 million tonnes. The main pieces of equipment used in the coal preparation plant are screw machines with flotation devices. We transport our coal products from Middlemount Coal Mine via railway.
Coal Mines operated by Yancoal International
The following table sets forth information about our operational coal mines in Australia, which are directly or indirectly held by Yancoal International (Holding):
| Cameby Downs | Premier | Total | ||||
Background data: | ||||||
Commencement of construction | 2009 | 1996 | N/A | |||
Commencement of commercial production | 2010 | 1996 | N/A | |||
Coalfield area(1)(square kilometers) | 27.2 | 141.8 | 169.0 | |||
Reserve data: (millions of tonnes as of December 31, 2012) | ||||||
Recoverable reserves(2) | 434.0 | 156.2 | 590.2 | |||
Depth of mine(meters underground) | N/A | N/A | N/A | |||
Type of coal | thermal coal | thermal coal | N/A | |||
Leased/owned | owned | owned | N/A | |||
Assigned/unassigned(3) | assigned | assigned | N/A | |||
Average calorific value (Kcal/kg) | 6000 | 4776 | N/A | |||
Sulfur content (%) | 0.47 | 0.6 | N/A | |||
Production data:(million tonnes) | ||||||
Designed raw coal production capacity | 1.80 | 5.0 | 6.8 | |||
Designed coal preparation input washing capacity | 1.8 | N/A | 1.8 | |||
Raw coal production | ||||||
2011 | 0.8 | — | 0.8 | |||
2012 | 1.9 | 4.2 | 6.1 | |||
Cumulative raw coal production as of December 31, 2012 | 2.7 | 4.2 | 6.9 | |||
| (1) | The coalfield area refers to the area of current leased land for mining, excluding the area on which we own prospecting rights. The coalfield area of Harry-Brandt refers to the area on which we own prospecting rights. |
| (2) | The recoverable reserves of the above coal mines are based on the report prepared by the competent persons appointed by Yancoal Australia or Yancoal Resources and other companies which have been acquired by Yancoal Australia and such reserves refer to total proved and probable reserves that were prepared in accordance with the standards in the JORC Code. |
| (3) | “Assigned” refers to coal reserves which have been committed to a particular mining complex (mine shafts, mining equipment and plant facilities), and all coal which has been leased by the company to others. “Unassigned” refers to coal reserves which have not been committed, and which would require new mine shafts, mining equipment, or plant facilities before operations could begin on the property. |
Cameby Downs Coal Mine
Cameby Downs Coal Mine consists of an open-pit mine located near Chinchilla in Southwest Queensland. The mine covers an area of approximately 27.2 square kilometers. The construction of the mine commenced in 2009 and commercial production started in late 2010. Yancoal Australia owns 100% of Cameby Downs Coal Mine. Cameby Downs Mine produces thermal coal and the average thickness of Cameby Downs Coal Mine was 4 meters. As of December 31, 2012, Cameby Downs Coal Mine had JORC-compliant reserves of approximately 434.0 million tonnes. As of the same date, the mine’s marketable coal reserves were approximately 277.0 million tonnes.
The phase one stage of Cameby Downs Coal Mine has raw coal annual production capacity of 1.8 million tonnes and product capacity of approximately 1.4 million tonnes product coal. We intend to increase annual raw coal annual production capacity to approximately 16 million tonnes and annual commercial coal production capacity to approximately 11.4 million tonnes subject to positive feasibility studies and obtaining port allocation through the construction of the phase II at Cameby Downs Coal Mine in the future.
Cameby Downs Coal Mine has a coal handling preparation plant with an annual capacity of approximately 220 TPH, and utilizes medium-heavy cyclones and flotation cells which are primarily manufactured in Australia. The operations at the mine are powered by electricity from the local power grid. We transport coal products from Cameby Downs Coal Mine to Brisbane Port via railway.
Premier Coal Mine
Premier Coal Mine, located in Perth, is an open-pit coal mine covering an area of approximately 141.8 square kilometers. The construction of the mine began in 1996 and commercial production commenced in the same year. Yancoal International (Holding) indirectly wholly owns Premier Coal Mine. The annual production capacity of Premier Coal Mine is approximately 5.0 million tonnes. Premier Coal Mine primarily produces low ash and low sulfur sub-bituminous coal. As of December 31, 2012, Premier Coal Mine had JORC-compliant reserves of approximately 1.562 million tonnes. We utilize conventional truck shovel open-pit mining methods to mine the coal from a number of seams at the mine. The coal mined at Premier Coal Mine is crushed and sold without washing. As a result, the mine’s marketable coal were approximately 156.2 million tonnes as of December 31, 2012, the same amount as its JORC-compliant reserves.
The operations at Premier Coal Mine are powered by electricity from local power grids. We entered into a long-term coal sales agreement with Verve Energy, a power generator owned by the Western Australian Government. We transport coal products from Premier Coal Mine by conveyors to power stations and by railway to other customers in Australia.
Mining and Exploration Rights
Nantun, Xinglongzhuang, Baodian, Dongtan and Jining II
According to the approvals from the State-owned Asset Supervision Department and the Coal Industry Supervision Department obtained at the establishment of the Company, and the Mining Agreement entered into between the Yankuang Group and us in 1997 and its supplemental agreement, we undertook to make ten annual payments of approximately RMB13.0 million to the Yankuang Group commencing in 1997, as compensation for the depletion of coal resources at the Nantun, Xinglongzhuang, Baodian, Dongtan and Jining II coal mines. We fulfilled this obligation in 2007 after we made the final installment payment and we are not obligated to make further payment under this arrangement.
In September 2006, the State Council approved theImplementation Plan for the Compensation System Reform Testing in Relation to Deepening Coal Resources, jointly promulgated by the Ministry of Finance of the PRC, Ministry of Land and Resources of the PRC and the NDRC (the “Implementation Plan”). According to the Implementation Plan, enterprises that obtain mining rights as a result of state-funded exploration must pay mining right fees based on the valuation of its reserves. Our operations in Shandong Province are subject to this mining right fee. On August 3, 2012, Jining Municipal Land and Resources Bureau issued the Notice of payment for mining rights by Yanzhou Coal Mining Company Limited [JiGuotuzi(2012) No. 212], pursuant to which we are required to pay a consideration of RMB2,476.78 million for the mining rights of Nantun, Xinglongzhuang, Baodian, Dongtan and Jining II coal mines, RMB495.4 million of which was paid before the due date of September 30, 2012. The consideration was determined based on the assessment report for the consideration of mining rights of these five coal mines issued by independent third parties appointed by Jining Municipal Land and Resources Bureau and filed with Shandong Provincial Department of Land and Resources. For the year ended December 31, 2012, we paid mining rights compensation fees of approximately RMB495.4 million. We are required to pay an additional RMB396.3 million in 2013.
Jining III Coal Mine
Pursuant to the Jining III Coal Mine Acquisition Agreement dated August 4, 2000 that we entered into with the Yankuang Group, the consideration for the mining right of Jining III Coal Mine was approximately RMB132.5 million, which was to be paid to the Yankuang Group in ten equal interest-free annual installments commencing in 2001. We fully paid the consideration for the mining rights of Jining III Coal Mine in 2010.
Austar Coal Mine
We obtained an exploration license for Austar Coal Mine from the New South Wales Department of Primary Industries in 2005. Pursuant to the underlying Asset Sale Agreement, we paid A$32.0 million to the receivers of Gympie Gold for the mine after we obtained the exploration license to the new exploration site adjacent to the Austar Coal Mine in 2006.
Tianchi Coal Mine
We acquired Shanxi Nenghua for RMB748.3 million, of which RMB136.6 million was consideration for the mining rights of Tianchi Coal Mine.
Zhaolou Coal Mine
We purchased the mining rights of Zhaolou Coal Mine for a consideration of RMB747.3 million in 2008.
Anyuan Coal Mine
We acquired the entire equity interest in Anyuan Coal Mine for a consideration of approximately RMB143.5 million in November 2010. The fair market value of the mining rights for Anyuan Coal Mine was approximately RMB131.3 million as of October 31, 2010. As of the date of this annual report, we were in the process of obtaining of the approval, permit and registration of the acquisition of Anyuan Coal Mine, and have confirmed with the relevant mining authorities that our approval, permit and registration of Anyuan Coal Mine is pending regulatory review. Despite the outstanding approvals and lack of mining license, we have received confirmation from the relevant mining authorities to continue our coal mining operations at Anyuan Coal Mine. Until we receive such approvals, we are prohibited from transferring or disposing of this mine. As of the date of this annual report, we are not aware of any pending administrative action, fines or penalties for the continued operation of Anyuan Coal Mine.
Wenyu Coal Mine
In July 2011, Ordos Neng Hua acquired 80% of the equity interest in Inner Mongolia Xintai, which operates Wenyu Coal Mine, for a consideration of RMB2,801.6 million.
Zhuanlongwan Coalfield
Ordos Neng Hua won the bid for the mining rights of Zhuanlongwan coalfield of Dongsheng Coal Field in Inner Mongolia Autonomous Region for a consideration of RMB7,878.7 million on January 28, 2011. As of the date of this annual report, Ordos Neng Hua had paid the total consideration of RMB5,538.7 million and had RMB2,340.0 million pending. We obtained the approval from NDRC for the preliminary work of Zhuanlongwan Project in March 2013, and the approval, production permit and registration of the mining rights to Zhuanlongwan Project are still in progress.
Yangcun and Beisu Coal Mine
We acquired the entire assets of Beisu and Yangcun Coal Mines from Yancoal Group and Beisu Company in 2012 for a consideration of RMB824.1 million. According to an evaluation report issued by an independent evaluator, the fair market value of the mining rights of Beisu Coal Mine and Yangcun Coal Mine was RMB139.5 million and RMB343.2 million as of August 31, 2011.
Coal Mines Owned by Yancoal Resources
We acquired the entire equity interest in Felix, a wholly owned subsidiary of Yancoal Australia, for A$3,333 million in 2009. The fair market value of our attributable reserves and attributable resources was A$2,845.2 million as of December 23, 2009. The acquisition included all mining rights to the coal mines owned by Felix (now Yancoal Resources), environment protection licenses, exploration licenses and mining leases.
Yancoal Resources sold 51% of the equity interest in Minerva Coal Joint Venture to Sojitz Coal Resources Pty Ltd, an independent third party on December 30, 2010. The value of the equity interest sold by Yancoal Resources was estimated to be between approximately A$188.0 million to A$201.0 million, according to an evaluation report issued by an independent evaluator dated September 9, 2010.
In 2011, through Yancoal Resources, Yancoal Australia acquired 30% of the equity interest in the Ashton Coal Mine Joint Venture originally held by Austral-Asia Coal Holdings Pty Ltd., a wholly owned subsidiary of Singapore IMC Group, for a consideration of US$250 million. According to an evaluation report issued by an independent evaluator dated January 20, 2012, 30% of the equity interest Ashton Coal Mine Joint Venture was valued at approximately A$230.0 million. The remaining 10% interest is held by ICRA Ashton Pty Ltd., a wholly owned subsidiary of Itochu Coal Resources Australia Pty Ltd.
Cameby Downs Coal Mine
We acquired Cameby Downs Coal Mine and Syntech’s exploration tenements through the acquisition of the entire equity interest in Syntech Resources Pty Ltd. and Syntech Holdings II Pty Ltd., for a consideration of A$208.4 million on August 1, 2011. In addition to the Cameby Downs Coal Mine, Syntech Resources Pty Ltd. and Syntech Holdings II Pty Ltd. also have five exploration tenements that might be potentially developed. According to an evaluation report issued by an independent evaluator dated February 14, 2012, the fair market value of the reserves, resources and mining rights of the five exploration tenements was A$65.8 million as of August 1, 2011. Currently, the Syntech project is the phase I of Cameby Downs Coal Mine operation.
Premier Coal Mine and Wilga Exploration Area
We acquired the Premier Coal Mine and the Wilga Exploration Area through the acquisition of Premier Coal Limited (then called Wesfarmers Premier Coal Limited) and Premier Char Ltd. (then called Wesfarmers Char Pty Ltd.), for a consideration of A$313.5 million in September 2011. The fair market value of the reserves, resources and mining rights of the coal mines owned by Premier Coal Limited was A$49.9 million as of December 31, 2011, according to an evaluation report issued by an independent evaluator.
Coal Mines Owned by Gloucester
Yancoal Australia completed its merger with Gloucester in June 2012. According to an evaluation report issued by an independent evaluator, the fair market value of the reserves, resources and mining rights of the coal mines owned by Gloucester was A$1,216.9 million as of June 30, 2012.
Potash Mineral Exploration Permits in Canada
We acquired 11 potash mineral exploration permits from Devonian Potash Inc. and eight potash mineral exploration permits from North Atlantic Potash Inc. for a total consideration of US$260 million in September 2011. The 19 potash mineral exploration permits cover an aggregate area of approximately 5,363.84 square kilometers in Saskatchewan, Canada. According to the preliminary exploration report, we expect that the permitted area may have abundant potash resources. We intend to conduct further in-depth exploration work to produce formal estimates of potash resources in compliance with internationally recognized reporting standards.
Railway Assets
We own and operate a railway transportation network that connects our coal mines in Shandong to the national railway system and Zouxian Power Plant in Jining City of Shandong. As of the date of this annual report, our railway network spans a total length of approximately 204 kilometers. Our railway network provides us with substantial control over a major means of transportation for our key product, allowing us to benefit from the synergies from coal production, sales and transportation.
Methanol and Cogeneration Power Plants
Yulin Nenghua. Yulin Nenghua, located in Yunlin City of Shanxi, operates a 600,000-tonne methanol plant and a supporting power plant. The primary pieces of equipment at the methanol plant include boilers, steam turbines, air compressors and booster set, GEA air-cooler exchangers, gasifiers and gasification compressors, synthetic compressors, a methanol synthetic gas-cooled reactor, a methanol synthetic water-cooled reactor and propylene refrigeration compressors. Yulin Nenghua also operates a supporting power plant with an installed capacity of 60 MW for its methanol production.
Tianhao ChemicalsCoal Mines and Coal Production Facilities. Tianhao Chemicals
Nantun, Xinglongzhuang, Baodian, Dongtan, Jining II, Jining III, Beisu and Yangcun Coal Mines are all located in the southwestern part of Shandong Province. Except for Yangcun Coal Mine, all of these mines are connected by our railway network, which directly connect to our customers or the PRC national railway or highway systems. We acquired Jining II Coal Mine in 1998 and Jining III Coal Mine in 2001. We acquired Heze Nenghua, the operator of Tianchi Coal Mine in 2006 and subsequently the mining rights of Zhaolou Coal Mine through Heze Nenghua in 2008. Our wholly owned subsidiary, Ordos Neng Hua, acquired Anyuan Coal Mine in 2010 and acquired the mining rights of Zhuanlongwan coalfield through public bidding in 2011. In addition, Ordos Neng Hua acquired 80% of the equity interest in Inner Mongolia Xintai in 2011, which has operated Wenyu Coal Mine since July 2011.
We acquired Austar Coal Mine in Australia in 2004, and we acquired the entire equity interest in Yancoal Resources (formerly Felix) through Yancoal Australia in 2009, which operates Ashton Coal Mine, Yarrabee Coal Mine and Moolarben Coal Mine. We acquired an additional 30% of the equity interest in the Ashton Coal Mine Joint Venture and disposed of 51% of the equity interest in the Minerva Coal Mine Joint Venture in 2011. As of December 31, 2012, we held 90% of the equity interest in the Ashton Coal Mine Joint Venture. In August 2011, we acquired the entire equity interest of both Syntech Holdings Pty Ltd. and Syntech Holdings II Pty Ltd., which operate the Cameby Downs Coal Mine and have five exploration tenements that can be potentially developed. In September 2011, we acquired the entire equity interest of both Premier Coal, which operates the Premier Coal Mine and Wilga Exploration Area, and Premier Char. In May 2012, we purchased from Yankuang Group and Beisu Company all of the assets and liabilities of Beisu Coal Mine and Yangcun Coal Mine, including mining rights, building ownership certificates, mining and related equipment and other fixed assets. In addition, as a result of its merger with Gloucester in June 2012, Yancoal Australia is primarily responsiblethe largest listed Australian pure-play coal mining enterprise in terms of saleable coal production in 2011.
As of the date of this annual report, the following material approvals, permits and licenses need to be obtained or renewed for our coal mines or projects in China:
the permit for our acquisition of Anyuan Coal Mine is pending regulatory review and approval by the Inner Mongolia government authorities. In addition, we are in the process of renewing the working safety permit, mining permit and coal production permit for Anyuan Coal Mine, which we expect to complete by the second half of 2013;
we obtained the approval from the NDRC to conduct preliminary work on Shilawusu and Zhuanlongwan projects in December 2012 and March 2013, respectively;
Yingpanhao Project has been included into the NDRC’s twelfth five-year plan for the operationcoal mining industry in March 2012. We are in the process of obtaining permits for our commencement of construction on this project;
we are in the process of obtaining a mining permit for Wanfu Project;
we are undergoing transfer procedures for Yangcun and Beisu Coal Mines; and
we are in the process of renewing the water pollution discharge permit for Jining II and Jining III Coal Mines.
In addition to the above, a number of material Australian regulatory approvals, permits and licenses are pending, outstanding, have not been applied for as yet or have expired, including:
surface mining leases for the development of proposed additional stages of the 100,000 tonne methanolMoolarben Coal Mine, as well as agreements with affected landholders (including a competitor of Yancoal Australia), which are still in process; and
we have obtained the planning approval for the proposed additional “South East Open Cut” project using coke oven waste gasof the Ashton Coal Mine from the Planning Institution of Australia. We expect to have the hearing for the Environmental Impact Assessment in the second half of 2013.
We operate substantially all of our mines either directly or through our subsidiaries and we have contracted the mining operations at Anyuan, Wenyu and Cameby Downs Coal Mines and Duralie open-pit mine at Gloucester Coal Mine to third party contractors.
The map below shows the location of Nantun, Xinglongzhuang, Baodian, Dongtan, Jining II, Jining III Coal Mines and our railway system:
The map below shows the location of Tianchi Coal Mine:
The map below shows the location of Zhaolou Coal Mine:
The map below shows the location of Anyuan and Wenyu Coal Mines:
The map below shows the location of Beisu Coal Mine:
The map below shows the location of Yangcun Coal Mine:
The map below shows the location of Austar, Yarrabee, Ashton and Moolarben Coal Mines as well as developmental-stage projects Athena, Harrybrandt, Wilpeena and Wilga.
The map below shows the primary raw material. We reducelocation of Cameby Downs Coal Mine:
The map below shows the sulphur contained in coke oven waste gaslocation of Premier Coal Mine:
The map below shows the location of Gloucester, Donaldson and then convert the treated gas into synthesis gas. Middlemount Coal Mines and Monash Project:
The synthesis gas is further processed into crude methanol and then purified through distillation.Six Coal Mines
Materials, WaterThe following table sets forth information about Nantun, Xinglongzhuang, Baodian, Dongtan, Jining II, Jining III Coal Mines, which are directly owned and Energy Supplyoperated by the Company:
| Nantun | Xinglong- zhuang | Baodian | Dongtan | Jining II | Jining III | Total | ||||||||
Background data: | ||||||||||||||
Commencement of construction | 1966 | 1975 | 1977 | 1979 | 1989 | 1993 | N/A | |||||||
Commencement of commercial production | 1973 | 1981 | 1986 | 1989 | 1997 | 2000 | N/A | |||||||
Coalfield area (square kilometers) | 35.2 | 59.81 | 36.4 | 60.0 | 87.1 | 105.1 | 383.61 | |||||||
Reserve data:(1) (millions tonnes as of December 31, 2012) | ||||||||||||||
Total in-place proven and probable reserves(1) | 108.05 | 304.08 | 269.85 | 436.94 | 400.53 | 209.98 | 1.729.43 | |||||||
Mining recovery rate(2)(%) | 81.20 | 81.26 | 80.45 | 84.09 | 79.51 | 80.46 | N/A | |||||||
Coal preparation plant recovery rate (%)(3) | 74.31 | 86.82 | 72.51 | 46.99 | 72.71 | 62.65 | 65.37 | |||||||
Depth of mine(meters underground) | 397.0 | 429.2 | 474.7 | 710.0 | 593.0 | 556.0 | N/A | |||||||
Average thickness of main coal seam(meters) | 10.43 | 8.3 | 8.8 | 8.4 | 6.8 | 6.2 | N/A | |||||||
Type of coal | thermal coal | thermal coal | thermal coal | thermal coal | thermal coal | thermal coal | N/A | |||||||
Leased/owned | owned | owned | owned | owned | owned | owned | N/A | |||||||
Assigned/unassigned(4) | assigned | assigned | assigned | assigned | assigned | assigned | N/A | |||||||
Average calorific value (Kcal/kg) | 5290 | 5484 | 5507 | 5249 | 5158 | 5227 | N/A | |||||||
Sulfur content (%) | 0.91 | 0.51 | 0.55 | 0.53 | 0.56 | 0.59 | N/A | |||||||
Production data: (million tonnes) | ||||||||||||||
Designed raw coal production capacity | 2.4 | 3.0 | 3.0 | 4.0 | 4.0 | 5.0 | 21.4 | |||||||
Designed washing capacity | 1.8 | 3.0 | 3.0 | 4.0 | 3.0 | 5.0 | 19.8 | |||||||
Raw coal production | ||||||||||||||
1997-2005 | 37.9 | 56.1 | 50.2 | 62.5 | 35.3 | 37.5 | 279.5 | |||||||
2006 | 3.9 | 7.2 | 5.6 | 8.0 | 4.0 | 6.8 | 35.5 | |||||||
2007 | 3.9 | 6.8 | 5.8 | 7.6 | 3.4 | 5.3 | 32.8 | |||||||
2008 | 3.5 | 6.6 | 6.0 | 7.0 | 3.9 | 6.1 | 33.1 | |||||||
2009 | 3.8 | 6.6 | 5.7 | 7.5 | 3.6 | 6.2 | 33.4 | |||||||
2010 | 3.6 | 6.8 | 6.1 | 7.4 | 4.2 | 6.2 | 34.3 | |||||||
2011 | 3.3 | 6.8 | 6.1 | 7.3 | 4.4 | 6.0 | 34.0 | |||||||
2012 | 3.2 | 7.0 | 6.1 | 7.6 | 3.7 | 5.5 | 33.1 | |||||||
Cumulative raw coal production as of December 31, 2012 | 63.1 | 103.9 | 91.6 | 114.9 | 62.5 | 79.7 | 515.7 | |||||||
| (1) | The proven and probable reserves of the above coal mines are based on the report dated February 6, 1998 prepared by International Mining Consultants Limited, a UK-based company, in accordance with the standards in Industry Guide 7. |
Under Industry Guide 7, “proven reserves” are reserves for which (a) quantity is computed from dimensions revealed in outcrops, trenches, workings or drill holes, grade and/or quality are computed from the results of detailed sampling and (b) the sites for inspection, sampling and measurement are spaced so closely and the geologic character is so well defined that size, shape, depth and mineral content of reserves are well-established. “Probable reserves” are reserves for which quantity and grade and/or quality are computed from information similar to that used for proven reserves, but the sites for inspection, sampling, and measurement are further apart or are otherwise less adequately spaced. The degree of assurance of “probable reserves,” although lower than that for proven reserves, is high enough to assume continuity between points of observation.
The total proven and probable reserves as of the end of a year are derived by deducting the proven and probable reserves consumed in the coal production in the same year from the proven and probable reserves as of the end of the immediately preceding year.
| (2) | The mining recovery rate is the rate of the amount of coal recovered from a determined amount of proven and probable reserves, which is calculated by dividing the actual volume of coal recovered in a year by the volume of proven and probable reserves mined and consumed in the same year. |
| (3) | “Coal preparation plant recovery rate” refers to the wash plant recovery rate of raw coal used during the production of our coal products. |
| (4) | “Assigned” refers to coal reserves which have been committed to a particular mining complex (mine shafts, mining equipment, and plant facilities), and all coal which has been leased by the company to others. “Unassigned” refer to coal reserves which have not been committed, and which would require new mine shafts, mining equipment or plant facilities before operations could begin on the property. |
Nantun Coal Mine
Nantun is located in the southern portion of our coalfield, with a coalfield area of approximately 35.2 square kilometers. Nantun began commercial production in 1973 with a designed annual raw coal production capacity of 2.4 million tonnes of coal. The main coal seam of Nantun is divided into four leaves. The thickness of the upper leaf averages 5.35 and 3.21 meters and the thickness of the lower leaf averages 0.89 and 1.03 meters. As of December 31, 2012, the total in-place proven and probable reserves on the main coal layer were approximately 108.05 million tonnes.
We primarily use the fully mechanized sublevel caving mining method to extract coal. As of December 31, 2012, Nantun produced coal from three work faces. Nantun’s coal preparation plant produces mainly No. 2 Clean Coal and coke oven waste gasemploys movable-sieve jig machines and jig machines. Most of the equipment used in the Nantun coal preparation plant was manufactured in the PRC.
Xinglongzhuang Coal Mine
Xinglongzhuang is located in the northern portion of our coalfield, with coalfield area of approximately 59.8 square kilometers. Xinglongzhuang began commercial production in 1986 with a designed annual raw coal production capacity of 3.0 million tonnes. The main coal seam of Xinglongzhuang is concentrated in one leaf with an average thickness of 8.3 meters. As of December 31, 2012, the total in-place proven and probable reserves on the main coal layer were approximately 304.08 million tonnes.
We primarily use the fully mechanized sublevel caving method to extract coal from the coal seam of Xinglongzhuang Coal Mine. At this coal mine, we produced coal from two work faces as of December 31, 2012. The Xinglongzhuang coal preparation plant produces No. 1 and No. 2 Clean Coal and lump coal. The majority of the equipment in the Xinglongzhuang coal preparation plant, including its jig machines and movable-sieve jig machines, was manufactured in the PRC while a small portion of the equipment was imported.
Baodian Coal Mine
Baodian is located in the central western portion of our coalfield, with coalfield area of approximately 36.4 square kilometers. Baodian began commercial production in 1986 with a designed annual raw coal production capacity of 3.0 million tonnes. Certain sections of the main coal seam of Baodian are concentrated in one leaf, with an average thickness of 8.81 meters. The remaining sections are divided into two leaves with an average thickness of 5.74 meters for the primary materialsupper leaf and 3.38 meters for the lower leaf. As of December 31, 2012, the total in-place proven and probable reserves on the main coal layer were approximately 269.85 million tonnes.
We primarily use the fully mechanized sublevel caving method to extract coal. At this coal mine, we maintained two work faces as of December 31, 2012. The Baodian coal preparation plant produces No. 2 Clean Coal and lump coal. The majority of equipment in the Baodian coal preparation plant, including its slanted wheel, cyclones and jig machines, was manufactured in the PRC.
Dongtan Coal Mine
Dongtan is located in the central eastern portion of our methanol production. Production at Yulin Nenghuacoalfield, with coalfield area of approximately 60.0 square kilometers. Dongtan began commercial production in 1989 with a designed annual raw coal production capacity of 4.0 million tonnes. Certain sections of the main coal seam consist of one layer with an average thickness of 8.41 meters, and the remaining sections are divided into two layers, with an average thickness of 5.38 meters for the upper layer and 3.22 meters for the lower layer. As of December 31, 2012, the main coal layer held approximately 436.94 million tonnes of in-place proven and probable reserves.
We primarily use the fully mechanized sublevel caving method to extract coal. At this mine, we maintained two work faces as of December 31, 2012. The Dongtan coal preparation plant produces No. 2 and No. 3 Clean Coal and lump coal. The principal pieces of equipment in the Dongtan coal preparation plant, including its slanted wheel, cyclones and jig machines, were manufactured in the PRC.
Jining II Coal Mine
Jining II is reliantlocated in the northern portion of the Jining coalfield, with coalfield area of approximately 87.1 square kilometers. Jining II began commercial production in 1997 with a designed annual raw coal production capacity of 4.0 million tonnes. Certain sections of the main coal seam of Jining II are concentrated in one layer, with an average thickness of 6.78 meters. The remaining sections are divided into two layers, with an average thickness of 2.1 meters for the upper leaf and an average thickness of 4.68 meters for the lower leaf. As of December 31, 2012, the total in-place proven and probable reserves on the main coal layer were approximately 400.53 million tonnes.
We primarily use the fully mechanized sublevel caving method to extract coal. At this coal mine, we produced coal from two work faces as of December 31, 2012. The main equipment used in Jining II are movable-sieve jig machines and jig machines, most of which were manufactured in the PRC. The principal product of the coal preparation plant of Jining II is No. 2 Clean Coal.
Jining III Coal Mine
Jining III is located in the southern portion of the Jining coalfield and covers an area of 105.0 square kilometers. Jining III has a designed annual raw coal production capacity of 5 million tonnes. Certain sections of the main coal seam of Jining III are concentrated in one layer, with an average thickness of 6.2 meters. The remaining sections are divided into two layers, with an average thickness of 1.21 meters for the upper leaf and an average thickness of 4.9 meters for the lower leaf. As of December 31, 2012, the total in-place proven and probable reserves on the main coal layer were approximately 209.98 million tonnes.
We primarily used the fully mechanized sublevel caving method to extract coal from three work faces in Jining III Coal Mine as of December 31, 2012. The main pieces of equipment used in Jining III are slanted wheel, cyclones and movable-sieve jig machines, which were manufactured in the PRC. The principal products of the coal preparation plant of Jining III are No. 2 and No. 3 Clean Coal. In 2010, Jining III made technical improvements which provided it with washing capacity.
Beisu and Yangcun Coal Mines
The following table sets forth information about Beisu and Yangcun Coal Mines, which are directly owned and operated by the Company:
| Beisu | Yangcun | Total | ||||
Background data: | ||||||
Commencement of construction | 1972 | 1981 | N/A | |||
Commencement of commercial production | 1976 | 1988 | N/A | |||
Coalfield area(square kilometers) | 29.3 | 27.46 | 75.38 | |||
Reserve data: (as of December 31, 2012) | ||||||
Mining recovery rate (%)(1) | 87.7% | 83.3% | N/A | |||
Coal preparation plant recovery rate (%)(2) | N/A | N/A | N/A | |||
Depth of mine(meters underground) | 269.7 | 318.8 | N/A | |||
Average thickness of main coal seam(meters) | 1.89 | 10.53 | N/A | |||
Type of coal | thermal coal | thermal coal | N/A | |||
Leased/owned | owned | owned | N/A | |||
Assigned/unassigned(3) | assigned | assigned | N/A | |||
Average calorific value(Kcal/kg) | 5,302 | 5,215 | N/A | |||
Sulfur content (%) | 3.55 | 1.29 | N/A | |||
Production data:(million tonnes) | ||||||
Designed raw coal production capacity | 1.0 | 1.15 | 2.15 | |||
Designed coal preparation input washing capacity | — | — | — | |||
Raw coal production | ||||||
2011 | — | — | — | |||
2012 | 1.0 | 1.1 | 2.1 | |||
Cumulative raw coal production as of December 31, 2012 | 1.0 | 1.1 | 2.1 | |||
| (1) | The mining recovery rate is the rate of the amount of coal recovered from a determined amount of proven and probable reserves, which is calculated by dividing the actual volume of coal recovered in a year by the volume of proven and probable reserves mined and consumed in the same year. |
| (2) | “Coal preparation plant recovery rate” refers to the wash plant recovery rate of raw coal used during the production of our coal products. |
| (3) | “Assigned” reserves refer to coal reserves which have been committed to a particular mining complex (mine shafts, mining equipment and plant facilities), and all coal which has been leased by the company to others. “Unassigned” reserves refers to coal reserves which have not been committed, and which would require new mine shafts, mining equipment, or plant facilities before operations could begin on the property. |
Beisu Coal Mine
Beisu Coal Mine is located in the south portion of our coalfield, and covers an area of approximately 29.3 square kilometers. We acquired the entire assets of Beisu Coal Mine in May 2012.
Beisu Coal Mine commenced operations in 1976 with a designed annual raw coal production capacity of 0.75 million tonnes. The annual raw coal production capacity has been increased to 1.0 million tonnes since 2006. The main coal seam of Beisu is divided into two thin-seam leaves. The thickness of the upper leaf averages 0.9 meters and the thickness of the lower leaf averages 0.99 meters. We primarily used the thin coal seam blasting method and the fully mechanized system to extract coal from three work faces in Beisu Coal Mine as of December 31, 2012. Beisu Coal Mine primarily produces thermal coal, which it currently sourced from local coal mines because our adjoining Yushuwancoal. Beisu Coal Mine has a coal preparation plant. The main equipment used in the coal preparation plant is a waste discharge system, which was manufactured in China.
Yangcun Coal Mine
Yangcun Coal Mine is located in the north portion of our coalfield, and covers an area of approximately 27.46 square kilometers. We acquired the entire assets of Yangcun Coal Mine in May 2012.
Yangcun Coal Mine commenced operations in 1988 with a designed annual raw coal production capacity of 0.6 million tonnes. The annual raw coal production capacity has been increased to 1.15 million tonnes since 2006. The main coal seam of Yangcun is divided into three leaves. The thickness of the upper leaf averages 8.34 meters and the thickness of the lower leaves average 1.17 and 1.02 meters. We primarily used the fully mechanized sublevel caving method to extract coal from the upper leaf and the fully mechanized system to extract coal from the lower leaves. As of December 31, 2012, Yangcun Coal Mine has three work faces. Yangcun Coal Mine primarily produces thermal coal. Yangcun Coal Mine does not yethave any coal preparation plant.
Coal Mines operated by Shanxi Nenghua and Heze Nenghua
The following table sets forth information about Tianchi Coal Mine and Zhaolou Coal Mine in China that are operated by Shanxi Nenghua and Heze Nenghua:
| Tianchi | Zhaolou | Total | ||||
Background data: | ||||||
Commencement of construction(1) | 2004 | 2009 | N/A | |||
Commencement of commercial production(1) | 2004 | 2009 | N/A | |||
Coalfield area(square kilometers) | 18.7 | 143.4 | 162.1 | |||
Reserve data: (millions tonnes as of December 31, 2012) | ||||||
Recoverable reserves(2) | 25.7 | 102.2 | 127.9 | |||
Mining recovery rate(3)(%) | 80.4 | 87.4 | N/A | |||
Coal preparation plant recovery rate (%)(4) | N/A | 46.08 | N/A | |||
Depth of mine(meters underground) | 225 | 905 | N/A | |||
Average thickness of main coal seam(meters) | 4.6 | 5.2 | N/A | |||
Type of coal | thermal coal | 1/3 coking coal | N/A | |||
Leased/owned | owned | owned | N/A | |||
Assigned/unassigned(4) | assigned | assigned | N/A | |||
Average calorific value(Kcal/kg) | 4,803 | 5,806 | N/A | |||
Sulfur content (%) | 1.09 | 0.87 | N/A | |||
Production data:(million tonnes) | ||||||
Designed raw coal production capacity | 1.2 | 3.0 | 4.2 | |||
Designed coal preparation input washing capacity | — | 3.0 | 3.0 | |||
Raw coal production | ||||||
2006 | 0.1 | — | 0.1 | |||
2007 | 1.2 | — | 1.2 | |||
2008 | 1.1 | — | 1.1 | |||
2009 | 1.0 | 0.04 | 1.04 | |||
2010 | 1.5 | 1.6 | 3.1 | |||
2011 | 1.2 | 3.0 | 4.2 | |||
2012 | 1.4 | 2.7 | 4.1 | |||
Cumulative raw coal production as of December 31, 2012 | 7.5 | 7.3 | 14.8 | |||
| (1) | With respect to the Tianchi Coal Mine, the “commencement of construction” refers to capacity expansion and technology upgrade undertaken after our 2006 acquisition; the “commencement of commercial production” refers to the resumption of production after completion of the foregoing expansion and upgrade. |
| (2) | The recoverable reserves of the above coal mines are based on the report prepared by Minarco Asia Pacific Pty Limited in May 2006 in accordance with the standards in the JORC Code. |
“Recoverable reserves” generally refer to proved and probable reserves under the JORC Code as revised in 2004,. “Proved reserves” are the economically mineable part of a measured coal resource and “probable reserves” are the economically mineable part of an indicated, and in some circumstances, measured coal resource. Both “proved reserves” and “probable reserves” incorporate mining dilution and allow for mining losses and are based on an appropriate level of mine planning, mine design and scheduling.
| (3) | The mining recovery rate is the rate of the amount of coal recovered from a determined amount of proven and probable reserves, which is calculated by dividing the actual volume of coal recovered in a year by the volume of proven and probable reserves mined and consumed in the same year. |
| (4) | “Coal preparation plant recovery rate” refers to the wash plant recovery rate of raw coal used during the production of our coal products. |
| (5) | “Assigned” refer to coal reserves which have been committed to a particular mining complex (mine shafts, mining equipment and plant facilities), and all coal which has been leased by the company to others. “Unassigned” refers to coal reserves which has not been committed, and which would require new mine shafts, mining equipment, or plant facilities before operations could begin on the property. |
Tianchi Coal Mine
Tianchi Coal Mine is an underground mine located in Heshun County of Shanxi, with an area of approximately 18.7 square kilometers. Tianchi Coal Mine commenced commercial production in 2006 and the designed production capacity was increased to 1.2 million tonnes per annum in the same year. Tianchi Coal Mine is operated by inclined shaft development and primarily produces thermal coal. The average thickness of the target coal seam is 4.6 meters. As of December 31, 2012, the total recoverable reserves of Tianchi Coal Mine were approximately 25.7 million tonnes.
We primarily used the longwall caving mining method to extract coal from one work face at Tianchi Coal Mine as of December 31, 2012. The primary piece of equipment in this system is a slanted wheel, which was manufactured in China. The operations at Tianchi Coal Mine are powered by electricity from local power grids. We ship coal products from the Tianchi Coal Mine to Hebei and surrounding areas on the Yangshe Railway and the national railway network, as well as the highway network.
Zhaolou Coal Mine
Zhaolou Coal Mine is an underground longwall mine located in the central portion of Juye Coal Field in Shandong. Zhaolou Coal Mine covers an area of approximately 143.4 square kilometers, and is accessible by roadway and railway.
Zhaolou Coal Mine commenced commercial production in December 2009 and has a designed annual raw coal production capacity of 3.0 million tonnes. Zhaolou Coal Mine produces 1/3 coking coal. The average thickness of the main coal seam of Zhaolou Coal Mine is 5.2 meters. The total recoverable reserves of Zhaolou Coal Mine were approximately 102.2 million tonnes as of December 31, 2012, which was net of coal preparation and plant recovery losses.
We primarily used the longwall caving mining method to extract coal from the two work faces at Zhaolou Coal Mine as of December 31, 2012. The coal preparation plant at Zhaolou Coal Mine commenced commercial production in September 2009. The main equipment used in the coal preparation plant was a slanted wheel, cyclone machines and TBS separators, which were mainly produced in China. The main product of Zhaolou’s coal preparation plant is No. 2 Clean Coal. The operations at Zhaolou Coal Mine are powered by electricity from local power grids. We ship coal products to Shandong and Hebei Provinces and surrounding areas by truck.
Coal Mines operated by Ordos Neng Hua
The following table sets forth information about Anyuan Coal Mine and Wenyu Coal Mine in China that are operated by Ordos Neng Hua:
| Anyuan | Wenyu | Total | ||||
Background data: | ||||||
Commencement of construction | — | 1996 | N/A | |||
Commencement of commercial production | 2004 | 1997 | N/A | |||
Coalfield area(square kilometers) | 9.26 | 9.36 | 75.38 | |||
Reserve data: (as of December 31, 2012) | ||||||
Mining recovery rate (%)(1) | 88.4 | 88.7 | N/A | |||
Coal preparation plant recovery rate (%)(2) | N/A | N/A | N/A | |||
Depth of mine(meters underground) | 68 | 59 | N/A | |||
Average thickness of main coal seam(meters) | 2.8 | 3.9 | N/A | |||
Type of coal | thermal coal | thermal coal | N/A | |||
Leased/owned | owned | owned | N/A | |||
Assigned/unassigned(3) | assigned | assigned | N/A | |||
Average calorific value(Kcal/kg) | 5,309 | 2,237 | N/A | |||
Sulfur content (%) | 0.32 | 0.75 | N/A | |||
Production data:(million tonnes) | ||||||
Designed raw coal production capacity | 1.2 | 3.0 | 6.35 | |||
Designed coal preparation input washing capacity | — | — | — | |||
Raw coal production | �� | |||||
2011 | 2.3 | 2.1 | 4.4 | |||
2012 | 2.3 | 4.6 | 6.9 | |||
Cumulative raw coal production as of December 31, 2012 | 4.6 | 6.7 | 11.3 | |||
| (1) | The mining recovery rate is the rate of the amount of coal recovered from a determined amount of proven and probable reserves, which is calculated by dividing the actual volume of coal recovered in a year by the volume of proven and probable reserves mined and consumed in the same year. |
| (2) | “Coal preparation plant recovery rate” refers to the wash plant recovery rate of raw coal used during the production of our coal products. |
| (3) | “Assigned” reserves refer to coal reserves which have been committed to a particular mining complex (mine shafts, mining equipment and plant facilities), and all coal which has been leased by the company to others. “Unassigned” reserves refers to coal reserves which have not been committed, and which would require new mine shafts, mining equipment, or plant facilities before operations could begin on the property. |
Anyuan Coal Mine
Through Ordos Neng Hua, we wholly control Anyuan Coal Mine, which is located in Yijinhuoluoqi of Ordos City in Inner Mongolia Autonomous Region, and covers an area of approximately 9.3 square kilometers. Ordos Neng Hua commenced commercial production in 2011.
In 2011, we increased the annual production capacity of Anyuan Coal Mine from the designed annual production capacity of 600,000 tonnes to 1.2 million tonnes through reconstruction and expansion. Anyuan Coal Mine primarily produces thermal coal. The average thickness of the main coal seam of Anyuan Coal Mine is 2.8 meters. We principally extracted coal from one work face at Anyuan Coal Mine as of December 31, 2012. Anyuan Coal Mine has a coal separation system. Anyuan Coal Mine is located in close proximity to railway and road transportation. The provincial highway and Baoshen railway are located approximately six kilometers to the west of the coalfield.
Wenyu Coal Mine
Through our subsidiary, Inner Mongolia Xintai, we operate Wenyu Coal Mine, which is located in Ordos City in Inner Mongolia Autonomous Region, and covers an area of approximately 9.36 square kilometers.
The original designed annual raw coal production capacity of Wenyu Coal Mine was 1.1 million tonnes. We completed production capacity expansion from 1.1 million tonnes to 3.0 million tonnes upon approvals from the relevant administrative authority and commenced commercial production in 2011. The average thickness of the main seam of Wenyu Coal Mine is 4.0 meters. The type of coal is thermal coal. We principally extracted coal from two work faces at Wenyu Coal Mine as of December 31, 2012. Wenyu Coal Mine has a simplified coal separation system. Wenyu Coal Mine is located in close proximity to Baofu road, Anyuan Coal Mine and railway transportation.
Coal Mines operated by Yancoal Australia
The following table sets forth information about our operational coal mines in Australia, which are directly or indirectly held by Yancoal Australia:
| Austar | Yarrabee | Ashton | Moolarben | Gloucester Mine | Donaldson Mine | Middlemount(6) | Total | |||||||||
Background data: | ||||||||||||||||
Commencement of construction(1) | 1998 | 1981 | 2003 | 2009 | 1998 | 2001 | 2009 | N/A | ||||||||
Commencement of commercial production(1) | 2000 | 1982 | 2004 | 2010 | 1999 | 2001 | 2011 | N/A | ||||||||
Coalfield area(2)(square kilometers) | 63 | 62.7 | 19.2 | 17.4 | 20.5 | 42.3 | 27.7 | 252.8 | ||||||||
Reserve data: (millions of tonnes as of December 31, 2012) | ||||||||||||||||
Recoverable reserves(3) | 49.7 | 61.4 | 74.0 | 300.9 | 69.4 | 148.3 | 96.0 | 799.7 | ||||||||
Depth of mine(4) (meters underground) | 300-700 | N/A | 190-280 | N/A | N/A | 50-150 | N/A | N/A | ||||||||
Type of coal | semi-hard coking coal | PCI coal | semi-soft coking coal | thermal coal | semi-hard coking coal | semi-soft coking coal | Coking coal PCI coal | N/A | ||||||||
Leased/owned | owned | owned | owned | owned | owned | owned | owned | N/A | ||||||||
Assigned/unassigned(5) | assigned | assigned | assigned | assigned | assigned | assigned | assigned | N/A | ||||||||
Average calorific value (Kcal/kg) | 6196 | 7300 | 7100 | 6650 | 7550 | 8200 | 7300 | N/A | ||||||||
Sulfur content (%) | 1.75 | 0.7 | 0.65 | 0.5 | 1.05 | 0.90 | 0.5 | N/A | ||||||||
Production data:(million tonnes) | ||||||||||||||||
Designed raw coal production capacity | 3.6 | 3.0 | 5.2 | 16.0 | 3.8 | 3.0 | 5.25 | 34.6 | ||||||||
Designed coal preparation input washing capacity | 3.3 | 2.4 | 6.5 | 16.0 | 3.8 | 3.0 | 5.25 | 30.0 | ||||||||
Raw coal production | ||||||||||||||||
2006 | 0.4 | — | — | — | — | — | — | 0.4 | ||||||||
2007 | 1.6 | — | — | — | — | — | — | 1.6 | ||||||||
2008 | 1.9 | — | — | — | — | — | — | 1.9 | ||||||||
2009 | 1.9 | — | — | — | — | — | — | 1.9 | ||||||||
2010 | 1.7 | 2.3 | 2.7 | 3.9 | — | — | — | 10.6 | ||||||||
2011 | 1.9 | 3.1 | 1.7 | 5.6 | — | — | — | 12.3 | ||||||||
2012 | 1.7 | 3.2 | 2.3 | 7.2 | 1.8 | 2.0 | — | 18.2 | ||||||||
Cumulative raw coal production as of December 31, 2012 | 11.1 | 8.6 | 6.7 | 16.7 | 1.8 | 2.0 | — | 46.9 | ||||||||
| (1) | The Austar Coal Mine was closed in 2003 as the result of an underground fire. We acquired Austar Coal Mine in 2004 and implemented a production expansion and technology upgrade in 2005. Austar Coal Mine resumed part of its operations in October 2006. Each of the Ashton Coal Mine and Moolarben Coal Mine has an open-pit coal mine and an underground coal mine. The “commencement of commercial production” indicates the time when the open-pit mines, the earlier of the two types of mines, commenced commercial production. |
| (2) | The coalfield area refers to the area of current leased land for mining, excluding the area on which we own prospecting rights. The coalfield area of Harry-Brandt refers to the area on which we own prospecting rights. |
| (3) | The recoverable reserves of the above coal mines are based on the report prepared by the competent persons appointed by Yancoal Australia or Yancoal Resources and other companies which have been acquired by Yancoal Australia and such reserves refer to total proved and probable reserves that were prepared in accordance with the standards in the JORC Code. |
| (4) | Ashton Coal Mine has both open-pit and underground coal mines. The depth of mine indicates the depth of the underground mines. |
| (5) | “Assigned” refers to coal reserves which have been committed to a particular mining complex (mine shafts, mining equipment and plant facilities), and all coal which has been leased by the company to others. “Unassigned” refers to coal reserves which have not been committed, and which would require new mine shafts, mining equipment, or plant facilities before operations could begin on the property. |
| (6) | As Middlemount Coal Mine is owned and operated by a joint venture jointly controlled by Yancoal Australia and a third party, its production data and financial performance will not be consolidated in to our reports. |
Austar Coal Mine
Austar Coal Mine is an underground mine located in Hunter Valley, New South Wales, Australia and is accessible by railway. Austar Coal Mine covers an area of 63.0 square kilometers. Austar Coal Mine was constructed in 1998 and commenced commercial production in 2000.
In 2003, an underground fire occurred at Austar Coal Mine when it was still owned by Southland Coal Pty Limited, resulting in the closure of the mine. On December 24, 2004, we acquired the entire interest in the Austar Coal Mine for approximately A$32.0 million from Southland Coal Pty Limited, an independent third party. After we invested approximately A$230.3 million in the reconstruction, capacity expansion and technology upgrade of Austar Coal Mine in 2005, which included funding for equipment and machinery, the mine resumed commercial production of semi-hard coking coal in October 2006.
The average thickness of the main coal seam of Austar Coal Mine is 6.5 meters. As of December 31, 2012, the mine’s JORC-compliant reserves were approximately 49.7 million tonnes. As of the same date, the mine’s marketable coal reserves, representing beneficiated or otherwise enhanced coal products where modifications resulting from mining, dilution and processing have been registered. considered, were approximately 39.6 million tonnes.
We planprincipally use the fully mechanized longwall top coal caving mining method to sourceextract coal from the underground mine. The main equipment used in the coal handling preparation plant consists of coal crushing equipment, cyclones and other associated equipment which were generally manufactured in Australia. The operations at Austar Coal Mine are powered by electricity from local power grids. We transport coal products from Austar Coal Mine to Newcastle Port via railway.
Yarrabee Coal Mine
Yarrabee Coal Mine is an open-pit mine located in Bowen Basin, Queensland, Australia and is accessible by railway to the Gladstone Port. Yarrabee Coal Mine covers an area of 62.7 square kilometers. The construction of Yarrabee Coal Mine started in 1981 and commercial production commenced in 1982.
Through Yancoal Resources, Yancoal Australia wholly owns Yarrabee Coal Mine. Currently, the designed annual capacity of Yarrabee Coal Mine is approximately 3.2 million tonnes. Yarrabee Coal Mine mainly produces low volatility PCI coal.
The thickness of the main coal seam of Yarrabee Coal Mine ranges from 3.2 to 4 meters. As of December 31, 2012, the mine’s JORC-compliant reserves were approximately 61.4 million tonnes. As of the same date, the mine’s marketable coal reserves were approximately 49.4 million tonnes. We utilize conventional truck shovel and open-pit mining methods to extract coal at Yarrabee Coal Mine.
Yarrabee Coal Mine has a coal preparation plant. The main pieces of equipment used in the coal preparation plant are heavy medium cyclone machines and floating separation machines, which were generally manufactured in Australia. The operations at Yarrabee Coal Mine are powered by electricity from local power grids. We transport coal products from Yarrabee Coal Mine to Gladstone Port via railway.
Ashton Coal Mine
Ashton Coal Mine consists of an underground mine and an open-pit mine located in Hunter Valley, New South Wales, Australia and is accessible by railway to Newcastle Port. Ashton Coal Mine covers an area of approximately 19.2 square kilometers. The construction of the open-pit and underground mines of Ashton Coal Mine started in 2003 and commercial production commenced in 2004.
The designed annual capacity of Ashton Coal Mine is approximately 5.2 million tonnes of coal. Ashton Coal Mine mainly produces semi-soft coking coal.
The thickness of the main coal seams of the open-pit mine and the underground mine of Ashton Coal Mine ranges from 2.14 to 2.26 meters and 1.7 to 2.4 meters, respectively. As of December 31, 2012, the mine’s JORC-compliant reserves were approximately 74.0 million tonnes. As of the same date, the mine’s marketable coal reserves were approximately 44.5 million tonnes, according to our internal estimates. We principally use longwall operations to extract coal from the underground coal seam and use conventional truck shovel mining methods at the open-pit mine of Ashton Coal Mine.
The main pieces of equipment used in the coal preparation plant of Ashton Coal Mine are heavy-medium cyclone machines and floating separation machines, which were generally manufactured in Australia. The operations at Ashton Coal Mine are powered by electricity from local power grids. We transport coal products from Ashton Coal Mine to Newcastle Port via railway.
Moolarben Coal Mine
Moolarben Coal Mine consists of an open-pit mine and an underground development project and is located near Mudgee in central western New South Wales. It is connected by railway to Newcastle Port. Moolarben Coal Mine covers an area of 17.4 square kilometers. Construction of the open-pit mine commenced in 2009 with commercial production starting in mid-2010. The construction of the underground mine at Moolarben is expected to commence in the second half of 2013.
Yancoal Australia holds 80% of the equity interest in Moolarben Coal Mine through its subsidiary, Moolarben Coal Mines Pty Limited. The designed annual capacity of Moolarben Coal Mine is approximately 17.0 million tonnes, of which the annual capacity of the underground mine is expected to be approximately 4.0 million tonnes and the annual capacity of the open-pit mine is approximately 13.0 million tonnes. Moolarben Coal Mine produces thermal coal.
The average thickness of the main coal seam of the open-pit mine of Moolarben Coal Mine is 5.5 to 11.66 meters. As of December 31, 2012, the mine’s JORC-compliant reserves were approximately 300.9 million tonnes. As of the same date, the mine’s marketable coal reserves were approximately 225.0 million tonnes. We use conventional truck shovel mining methods in the open-pit mine and expect to use longwall machines to extract coal in the underground mine project.
Moolarben Coal Mine has a coal handling preparation plant with a capacity of approximately 1,800 TPH, and utilizes conventional equipment including medium-heavy cyclones and flotation cells which are primarily manufactured in Australia. The operations at Moolarben Coal Mine are powered by electricity from local power grids. We transport thermal coal internally once Yushuwanproducts from Moolarben Coal Mine commences operations. Yulin Nenghua sources waterto Newcastle Port via railway.
Gloucester Coal Mine
Gloucester Coal Mine is located in Gloucester basin in New South Wales, Australia and covers an area of 20.5 square kilometres. Gloucester Coal Mine is approximately 100 kilometers away from Newcastle Port. The construction of Gloucester Coal Mine started in 1998 and commercial production commenced in 1999.
Gloucester Coal Mine consists of two open-pit mines, Duralie and Stratford, which has an aggregate annual designed production capacity of 3.8 million tonnes and an aggregate annual designed preparation capacity of 3.8 million tonnes. As of December 31, 2012, Gloucester Coal Mine’s JORC-compliant reserves were approximately 69.4 million tonnes. As of the same date, the mine’s marketable coal reserves were approximately 40.0 million tonnes.
Duralie open-pit mine and Stratford open-pit mine own one coal preparation plan with an annual designed preparation capacity of 1.8 million tonnes, which was increased to 4.3 million tonnes in June 2011. We transport our coal products from Gloucester Coal Mine via railway.
Donaldson Coal Mine
Donaldson Coal Mine is located in Newcastle coal field in New South Wales, Australia and covers an area of 42.3 square kilometres. Donaldson Coal Mine is approximately 25 kilometers away from Newcastle Port. The construction of Donaldson Coal Mine started in 2001 and commercial production commenced in the same year.
Donaldson Coal Mine consists of one open-pit coal mine, Donaldson open-pit mine and two underground coal mines, Abel and Tasman underground mines, which has an aggregate annual designed production capacity of 3.0 million tonnes. As of December 31, 2012, Donaldson Coal Mine’s JORC-compliant reserves were approximately 148.3 million tonnes. As of the same date, the mine’s marketable coal reserves were approximately 90.5 million tonnes.
Our coal products at Donaldson Coal Mine are prepared by a coal preparation plant owned and operated by a third party with coal preparation capacity of 3.0 million tonnes per year. We transport our coal products from Donaldson Coal Mine via railway.
Middlemount Coal Mine
Middlemount Coal Mine is located at Bowen Basin in Queensland, Australia and covers an area of 27.7 square kilometres. The mine is approximately 300 kilometres away from Abbot Point port. The construction of Middlemount Coal Mine started in 2009 and commercial production commenced in 2011. Through Yancoal Australia, we own approximately 50% of the equity interest in the joint venture owns and operates Middlemount Coal Mine.
As of December 31, 2012, Middlemount Coal Mine’s JORC-compliant reserves were approximately 96 million tonnes. As of the same date, the mine’s marketable coal reserves were approximately 69.1 million tonnes. The mine has an annual designed production capacity of 5.4 million tonnes. We use conventional open-pit mining methods to extract coal at Middlemount open-pit mine Middlemount Coal Mine primarily produces coking coal and PCI coal. Middlemount Coal Mine has a coal preparation plant with an annual capacity of 5.25 million tonnes. The main pieces of equipment used in the coal preparation plant are screw machines with flotation devices. We transport our coal products from Middlemount Coal Mine via railway.
Coal Mines operated by Yancoal International
The following table sets forth information about our operational coal mines in Australia, which are directly or indirectly held by Yancoal International (Holding):
| Cameby Downs | Premier | Total | ||||
Background data: | ||||||
Commencement of construction | 2009 | 1996 | N/A | |||
Commencement of commercial production | 2010 | 1996 | N/A | |||
Coalfield area(1)(square kilometers) | 27.2 | 141.8 | 169.0 | |||
Reserve data: (millions of tonnes as of December 31, 2012) | ||||||
Recoverable reserves(2) | 434.0 | 156.2 | 590.2 | |||
Depth of mine(meters underground) | N/A | N/A | N/A | |||
Type of coal | thermal coal | thermal coal | N/A | |||
Leased/owned | owned | owned | N/A | |||
Assigned/unassigned(3) | assigned | assigned | N/A | |||
Average calorific value (Kcal/kg) | 6000 | 4776 | N/A | |||
Sulfur content (%) | 0.47 | 0.6 | N/A | |||
Production data:(million tonnes) | ||||||
Designed raw coal production capacity | 1.80 | 5.0 | 6.8 | |||
Designed coal preparation input washing capacity | 1.8 | N/A | 1.8 | |||
Raw coal production | ||||||
2011 | 0.8 | — | 0.8 | |||
2012 | 1.9 | 4.2 | 6.1 | |||
Cumulative raw coal production as of December 31, 2012 | 2.7 | 4.2 | 6.9 | |||
| (1) | The coalfield area refers to the area of current leased land for mining, excluding the area on which we own prospecting rights. The coalfield area of Harry-Brandt refers to the area on which we own prospecting rights. |
| (2) | The recoverable reserves of the above coal mines are based on the report prepared by the competent persons appointed by Yancoal Australia or Yancoal Resources and other companies which have been acquired by Yancoal Australia and such reserves refer to total proved and probable reserves that were prepared in accordance with the standards in the JORC Code. |
| (3) | “Assigned” refers to coal reserves which have been committed to a particular mining complex (mine shafts, mining equipment and plant facilities), and all coal which has been leased by the company to others. “Unassigned” refers to coal reserves which have not been committed, and which would require new mine shafts, mining equipment, or plant facilities before operations could begin on the property. |
Cameby Downs Coal Mine
Cameby Downs Coal Mine consists of an open-pit mine located near Chinchilla in Southwest Queensland. The mine covers an area of approximately 27.2 square kilometers. The construction of the mine commenced in 2009 and commercial production started in late 2010. Yancoal Australia owns 100% of Cameby Downs Coal Mine. Cameby Downs Mine produces thermal coal and the average thickness of Cameby Downs Coal Mine was 4 meters. As of December 31, 2012, Cameby Downs Coal Mine had JORC-compliant reserves of approximately 434.0 million tonnes. As of the same date, the mine’s marketable coal reserves were approximately 277.0 million tonnes.
The phase one stage of Cameby Downs Coal Mine has raw coal annual production capacity of 1.8 million tonnes and product capacity of approximately 1.4 million tonnes product coal. We intend to increase annual raw coal annual production capacity to approximately 16 million tonnes and annual commercial coal production capacity to approximately 11.4 million tonnes subject to positive feasibility studies and obtaining port allocation through the construction of the phase II at Cameby Downs Coal Mine in the future.
Cameby Downs Coal Mine has a coal handling preparation plant with an annual capacity of approximately 220 TPH, and utilizes medium-heavy cyclones and flotation cells which are primarily manufactured in Australia. The operations at the mine are powered by electricity from the local power grid. We transport coal products from Cameby Downs Coal Mine to Brisbane Port via railway.
Premier Coal Mine
Premier Coal Mine, located in Perth, is an open-pit coal mine covering an area of approximately 141.8 square kilometers. The construction of the mine began in 1996 and commercial production commenced in the same year. Yancoal International (Holding) indirectly wholly owns Premier Coal Mine. The annual production capacity of Premier Coal Mine is approximately 5.0 million tonnes. Premier Coal Mine primarily produces low ash and low sulfur sub-bituminous coal. As of December 31, 2012, Premier Coal Mine had JORC-compliant reserves of approximately 1.562 million tonnes. We utilize conventional truck shovel open-pit mining methods to mine the coal from a number of seams at the mine. The coal mined at Premier Coal Mine is crushed and sold without washing. As a result, the mine’s marketable coal were approximately 156.2 million tonnes as of December 31, 2012, the same amount as its JORC-compliant reserves.
The operations at Premier Coal Mine are powered by electricity from local reservoir.power grids. We entered into a long-term coal sales agreement with Verve Energy, a power generator owned by the Western Australian Government. We transport coal products from Premier Coal Mine by conveyors to power stations and by railway to other customers in Australia.
ProductionMining and Exploration Rights
Nantun, Xinglongzhuang, Baodian, Dongtan and Jining II
According to the approvals from the State-owned Asset Supervision Department and the Coal Industry Supervision Department obtained at Tianhao Chemicals is dependentthe establishment of the Company, and the Mining Agreement entered into between the Yankuang Group and us in 1997 and its supplemental agreement, we undertook to make ten annual payments of approximately RMB13.0 million to the Yankuang Group commencing in 1997, as compensation for the depletion of coal resources at the Nantun, Xinglongzhuang, Baodian, Dongtan and Jining II coal mines. We fulfilled this obligation in 2007 after we made the final installment payment and we are not obligated to make further payment under this arrangement.
In September 2006, the State Council approved theImplementation Plan for the Compensation System Reform Testing in Relation to Deepening Coal Resources, jointly promulgated by the Ministry of Finance of the PRC, Ministry of Land and Resources of the PRC and the NDRC (the “Implementation Plan”). According to the Implementation Plan, enterprises that obtain mining rights as a result of state-funded exploration must pay mining right fees based on receiving coke oven waste gasthe valuation of its reserves. Our operations in Shandong Province are subject to this mining right fee. On August 3, 2012, Jining Municipal Land and Resources Bureau issued the Notice of payment for mining rights by Yanzhou Coal Mining Company Limited [JiGuotuzi(2012) No. 212], pursuant to which we are required to pay a consideration of RMB2,476.78 million for the mining rights of Nantun, Xinglongzhuang, Baodian, Dongtan and Jining II coal mines, RMB495.4 million of which was paid before the due date of September 30, 2012. The consideration was determined based on the assessment report for the consideration of mining rights of these five coal mines issued by independent third parties appointed by Jining Municipal Land and Resources Bureau and filed with Shandong Provincial Department of Land and Resources. For the year ended December 31, 2012, we paid mining rights compensation fees of approximately RMB495.4 million. We are required to pay an additional RMB396.3 million in 2013.
Jining III Coal Mine
Pursuant to the Jining III Coal Mine Acquisition Agreement dated August 4, 2000 that we entered into with the Yankuang Group, the consideration for the mining right of Jining III Coal Mine was approximately RMB132.5 million, which was to be paid to the Yankuang Group in ten equal interest-free annual installments commencing in 2001. We fully paid the consideration for the mining rights of Jining III Coal Mine in 2010.
Austar Coal Mine
We obtained an exploration license for Austar Coal Mine from one supplier whose facility is connectedthe New South Wales Department of Primary Industries in 2005. Pursuant to Tianhao Chemicals’ plant through transmission pipelines. This supplierthe underlying Asset Sale Agreement, we paid A$32.0 million to the receivers of Gympie Gold for the mine after we obtained the exploration license to the new exploration site adjacent to the Austar Coal Mine in 2006.
Tianchi Coal Mine
We acquired Shanxi Nenghua for RMB748.3 million, of which RMB136.6 million was not able to provide sufficient coke oven waste gas, whichconsideration for the mining rights of Tianchi Coal Mine.
Zhaolou Coal Mine
We purchased the mining rights of Zhaolou Coal Mine for a consideration of RMB747.3 million in turn disrupted production at Tianhao Chemicals twice2008.
Anyuan Coal Mine
We acquired the entire equity interest in Anyuan Coal Mine for a consideration of approximately RMB143.5 million in November 2010. The fair market value of the mining rights for Anyuan Coal Mine was approximately RMB131.3 million as of October 31, 2010. As of the date of this annual report, we were in the process of obtaining of the approval, permit and registration of the acquisition of Anyuan Coal Mine, and have not been ableconfirmed with the relevant mining authorities that our approval, permit and registration of Anyuan Coal Mine is pending regulatory review. Despite the outstanding approvals and lack of mining license, we have received confirmation from the relevant mining authorities to find an alternative supplier.
Quality Control
We have implemented a series of quality control measures forcontinue our coal chemicalmining operations to ensure product quality and have obtained AAA measurement management system, ISO 9001 quality accreditation and ISO 14001 environmental management certification in November 2009. We perform regular inspections and maintenance on our methanol plants.
Tianhao Chemicals has implemented a series of management measures in 2010, covering various areas like evaluation on quality control, environmental protection and occupational health and safety. As of the dateat Anyuan Coal Mine. Until we receive such approvals, we are prohibited from transferring or disposing of this annual report, the relevant certification regarding the foregoing management systems was under process.
Safety Control
For our coal chemical operations, we have implemented safety control measures in compliance with the People’s Republic of China Production Safety Law, the People’s Republic of China Regulations on the Safety Administration of Dangerous Chemicals and other safety guidelines for chemical manufacturers.
Competition
We compete with domestic methanol manufacturers in Shanxi and Shaanxi Provinces and the Inner Mongolia Autonomous Region. We expect to benefit from economies of scale as Yulin Nenghua’s 600,000 tonne methanol project achieves optimal utilization of its facilities and we further expand our coal chemical operations with the construction of Ordos Neng Hua’s methanol plant.
Seasonality
Our coal chemical operations are not affected by seasonality.
Electric Power and Heat Supply Business
mine. As of the date of this annual report, we owned and operated eight power plants, which generate electricityare not aware of any pending administrative action, fines or penalties for internal use and external sales. the continued operation of Anyuan Coal Mine.
Wenyu Coal Mine
In addition, we have one power plant currently under construction. In 2010, we generated a total of 1,369.8 million kWh of electricity, of which we sold 526.6 million kWh externally and generated RMB185.6 million in revenue.
July 2011, Ordos Neng Hua Ju Energy operates coal-fired power plants whose main facilities consist of energy conversion CFB boilers and extraction and condensing steam turbines. The power plants at Hua Ju Energy have an aggregate installed capacity of 114 megawatts. In 2010, Hua Ju Energy generated 1,090.4 million kWh, of which 469.6 million kWh was sold externally.
The power plants at Yulin Nenghua and Tianhao Chemicals were established with the intention to satisfy the power demandacquired 80% of the methanol projects of these two entities and had an aggregate installed capacity of 84 megawatts as of the date of this annual report. With effect from January 1, 2010, the power plant at Tianhao Chemicals started to supply the electricity for our methanol projects directly. In 2010, the power plants operated by Yulin Nenghua and Tianhao Chemicals generated 212.6 million kWh and 66.86 kWh, respectively, ofequity interest in Inner Mongolia Xintai, which we made externals sale of 49.59 million kWh and 7.44 million kWh, respectively.
We commenced construction of the Zhaolouoperates Wenyu Coal Mine, power plants for Heze Nenghua Zhaoloua consideration of RMB2,801.6 million.
Zhuanlongwan Coalfield
Ordos Neng Hua won the bid for the mining rights of Zhuanlongwan coalfield of Dongsheng Coal MineField in March 2010. The integrated power plants have two phases with designed capacityInner Mongolia Autonomous Region for a consideration of 300,000 kWh for each phase.RMB7,878.7 million on January 28, 2011. As of the date of this annual report, onlyOrdos Neng Hua had paid the total consideration of RMB5,538.7 million and had RMB2,340.0 million pending. We obtained the approval from NDRC for the preliminary work of Zhuanlongwan Project in March 2013, and the approval, production permit and registration of the mining rights to Zhuanlongwan Project are still in progress.
Yangcun and Beisu Coal Mine
We acquired the entire assets of Beisu and Yangcun Coal Mines from Yancoal Group and Beisu Company in 2012 for a consideration of RMB824.1 million. According to an evaluation report issued by an independent evaluator, the fair market value of the mining rights of Beisu Coal Mine and Yangcun Coal Mine was RMB139.5 million and RMB343.2 million as of August 31, 2011.
Coal Mines Owned by Yancoal Resources
We acquired the entire equity interest in Felix, a wholly owned subsidiary of Yancoal Australia, for A$3,333 million in 2009. The fair market value of our attributable reserves and attributable resources was A$2,845.2 million as of December 23, 2009. The acquisition included all mining rights to the coal mines owned by Felix (now Yancoal Resources), environment protection licenses, exploration licenses and mining leases.
Yancoal Resources sold 51% of the equity interest in Minerva Coal Joint Venture to Sojitz Coal Resources Pty Ltd, an independent third party on December 30, 2010. The value of the equity interest sold by Yancoal Resources was estimated to be between approximately A$188.0 million to A$201.0 million, according to an evaluation report issued by an independent evaluator dated September 9, 2010.
In 2011, through Yancoal Resources, Yancoal Australia acquired 30% of the equity interest in the Ashton Coal Mine Joint Venture originally held by Austral-Asia Coal Holdings Pty Ltd., a wholly owned subsidiary of Singapore IMC Group, for a consideration of US$250 million. According to an evaluation report issued by an independent evaluator dated January 20, 2012, 30% of the equity interest Ashton Coal Mine Joint Venture was valued at approximately A$230.0 million. The remaining 10% interest is held by ICRA Ashton Pty Ltd., a wholly owned subsidiary of Itochu Coal Resources Australia Pty Ltd.
Cameby Downs Coal Mine
We acquired Cameby Downs Coal Mine and Syntech’s exploration tenements through the acquisition of the entire equity interest in Syntech Resources Pty Ltd. and Syntech Holdings II Pty Ltd., for a consideration of A$208.4 million on August 1, 2011. In addition to the Cameby Downs Coal Mine, Syntech Resources Pty Ltd. and Syntech Holdings II Pty Ltd. also have five exploration tenements that might be potentially developed. According to an evaluation report issued by an independent evaluator dated February 14, 2012, the fair market value of the reserves, resources and mining rights of the five exploration tenements was A$65.8 million as of August 1, 2011. Currently, the Syntech project is the phase I was under construction. For details about Zhaolouof Cameby Downs Coal Mine power plants, please see “— D. Property, Plantsoperation.
Premier Coal Mine and Equipment — Wilga Exploration Area
We acquired the Premier Coal Mine and the Wilga Exploration Area through the acquisition of Premier Coal Limited (then called Wesfarmers Premier Coal Limited) and Premier Char Ltd. (then called Wesfarmers Char Pty Ltd.), for a consideration of A$313.5 million in September 2011. The fair market value of the reserves, resources and mining rights of the coal mines owned by Premier Coal Limited was A$49.9 million as of December 31, 2011, according to an evaluation report issued by an independent evaluator.
Coal Mines Owned by Gloucester
Yancoal Australia completed its merger with Gloucester in June 2012. According to an evaluation report issued by an independent evaluator, the fair market value of the reserves, resources and mining rights of the coal mines owned by Gloucester was A$1,216.9 million as of June 30, 2012.
Potash Mineral Exploration Permits in Canada
We acquired 11 potash mineral exploration permits from Devonian Potash Inc. and eight potash mineral exploration permits from North Atlantic Potash Inc. for a total consideration of US$260 million in September 2011. The 19 potash mineral exploration permits cover an aggregate area of approximately 5,363.84 square kilometers in Saskatchewan, Canada. According to the preliminary exploration report, we expect that the permitted area may have abundant potash resources. We intend to conduct further in-depth exploration work to produce formal estimates of potash resources in compliance with internationally recognized reporting standards.
Railway Assets
We own and operate a railway transportation network that connects our coal mines in Shandong to the national railway system and Zouxian Power Plant in Jining City of Shandong. As of the date of this annual report, our railway network spans a total length of approximately 204 kilometers. Our railway network provides us with substantial control over a major means of transportation for our key product, allowing us to benefit from the synergies from coal production, sales and transportation.
Methanol and Cogeneration Power Plants — Zhaolou Coal Mine Power Plants”.
We commenced heat supply operations, which consist of the production and sale of heat supply following our acquisition of Hua Ju Energy. In 2010, Hua Ju Energy generated 1.27 million steam tonnes of heat energy. Although the substantial majority of heat energy produced by Hua Ju Energy is intended to be consumed internally by our coal mines, we generated net sales of RMB25.23 million from selling 0.19 million steam tonnes of heat externally.
Sales and Marketing
Although the majority of the electric power generated by our power plants is intended for our own use, in 2010 we sold 38.4% of the electric power we produced to other end-users through power grids. We consume most of the heat generated by our power plants and to a lesser extent, sell to Yankuang Group.
Pricing
The pricing and adjustments for the on-grid tariff are determined by the PRC government. The pricing of our heat products is determined in accordance with regulations set by price administration authorities.
Production Process
Yulin Nenghua.Nenghua We select, break, grind. Yulin Nenghua, located in Yunlin City of Shanxi, operates a 600,000-tonne methanol plant and transport coal to a boiler wheresupporting power plant. The primary pieces of equipment at the coal is burned to generate steam, which is converted bymethanol plant include boilers, steam turbines, into electricity.
Tianhao Chemical. Middling is carried by beltsair compressors and fuel feeding devices to fluidized-bed boiler, where the coal is burned to generate steam, which is converted by steam turbines into electricity. Tianhao Chemical owns twobooster set, GEA air-cooler exchangers, gasifiers and gasification compressors, synthetic compressors, a methanol synthetic gas-cooled reactor, a methanol synthetic water-cooled reactor and propylene refrigeration compressors. Yulin Nenghua also operates a supporting power plantsplant with an installed capacity of 12MW each to satisfy the electricity demand60 MW for its methanol production or even the electricity demand for the whole factory.production.
Hua Ju Energy. We recycle by-products of our coal mining operations, such as coal gangue and coal slurry to generate electricity. Coal gangue and coal slurry, through the conveyer belt and fuel feeding device, are fed to a CFB boiler where they are burned to generate steam, which is converted by steam turbines into electricity. The power plants of Hua Ju Energy are cogeneration systems that are able to produce heat simultaneously with power generation. Part of the steam produced in power generation is extracted from the steam turbines and via the heat supply system provided to the mining operations.
In both processes, we filter the exhaust gas that we produce and recycle the cinder for future use.
Materials, Water and Energy Supply
Our power plants are all coal-fired power plants. The power plants of Hua Ju Energy generate electricity by recycling coal gangue and coal slurry. Tianhao Chemicals and Yulin Nenghua currently source thermal coal from local coal mines.
Quality Control
Hua Ju Energy has obtained ISO 9001 quality accreditation and ISO 14001 environmental management certification since November 2003. Yulin Nenghua obtained AAA measurement management system, ISO 9001 quality accreditation and ISO 14001 environmental management certification in November 2009. Tianhao Chemicals implemented a series of internal evaluation systems and management measurement systems for quality control, environmental management and health and safety control in 2010. The management measurement system certification is being processed.
Safety Control
Safety measures for our electric power and heat supply operations were designed to meet the requirement of the Electricity Law and other related laws.
Seasonality
Our electric power operations are not affected by seasonality. Our heat supply operations are affected by seasonality and experience higher demand during winter.
Regulatory Oversight of Our Group
Coal Industry — PRC Regulatory Matters
To establish a coal mining enterprise under the Coal Law of the PRC (the “Coal Law”), the applicant must submit an application to the relevant department in charge of the coal industry. After obtaining approval to establish a coal mining enterprise, the applicant will be granted a mining permit by the Ministry of Land and Resources. Thereafter, the applicant must obtain a coal production permit before it commences coal production. Coal mining enterprises that have legally obtained coal production licenses will have the right to sell coal that they produce. For establishment of a coal trading enterprise, an applicant must apply for a different business license and may engage in coal trading only after it obtains a trading license from the administrative department of industry and commerce.
Mining activities in the PRC are also subject to the Mineral Resources Law of the People’s Republic of China (the “Mineral Resources Law”). The Mineral Resources Law regulates any matters relating to the planning or the exploration, exploitation and mining of mineral resources. According to the Mineral Resources Law, all mineral resources in China, including coal, are owned by the State. Any enterprise planning to engage in the exploration, development and mining of mineral resources must obtain exploration rights and mining rights before commencing the relevant activities. The transfer of exploration and exploitation rights shall be subject to governmental approval pursuant to the Coal Law, the Mineral Resources Law and other relevant regulations.
We are principally subject to supervision and regulation by the following agencies of the PRC government:
the State Council, the highest level of the executive branch, which is responsible for the examination and approval of major investment projects specified in the Catalogue of Investment Projects released by the PRC government in 2004 and as amended from time to time;
the NDRC, which formulates and implements major policies concerning China’s economic and social development, examines and approves investment projects exceeding certain capital expenditure amounts or in specified industry sectors, including the examination and approval of foreign investment projects and formulates industrial policies and investment guidelines for natural resource industries, such as the coal industry. In addition, the NDRC administers coal export activities and export quotas jointly with the Ministry of Commerce. The NDRC is also responsible for the evaluation and implementation of the pricing mechanism that links the prices of coal and power;
the Ministry of Land and Resources (“MLR”), which has the authority to grant land use licenses and mining right permits, approve the transfer and lease of mining rights, and review the transfer price of mining rights and reserve estimates;
the State Administration of Coal Mine Safety (“SACMS”), which is responsible for the implementation and supervision of the relevant safety laws and regulations applicable to coal mines and coal mining operations;
the Ministry of Railways (“MOR”), which supervises China’s railway operations and provides strategic development plans for railway transportation. The MOR, together with the NDRC, reviews all applications for railway construction plans, including railways designated or used for coal transportation; and
the State Environmental Protection Administration of China (“SEPA”), which supervises and controls environmental protection and monitors China’s environmental system at the national level.
The following is a summary of the principal laws, regulations, policies and administrative directives to which we are subject.
Pricing
Until 2002, the production and pricing of coal have generally been subject to close control and supervision by the PRC government, which centrally manages the production and pricing of coal. To transition from a planned economy to market economy practices, the PRC government eliminated the state guideline for coal prices on January 1, 2002 and aimed to establish a pricing mechanism to reflect market demand.
Under the Price Law of the People’s Republic of China, the PRC government reserves the right to intervene in price fluctuations of important commodities such as coal. The State Council and the provincial governments, autonomous regions and municipalities directly under the PRC government may adopt intervention measures, such as restricting margins or profits, and imposing price limits. Since 2002, NDRC has executed temporary measures several times to prevent and control unusual fluctuations in thermal coal prices.
To ensure the stable supply of thermal coal and reduce pricing pressure on electric power companies, NDRC issued Announcement No. 46 on June 19, 2008 to implement, from such date until December 31, 2008, temporary price caps on thermal coal. On December 3, 2008, NDRC issued the Notice Relating to the Good Preparation for Inter Provincial Coal Production Transportation Works (Fa Gai Yun Xing [2008] No. 3294), which announced the elimination of the price control measures implemented in June 2008. On December 30, 2008, NDRC issued an announcement (No. 67) to abolish the temporary price intervention measures on thermal coal, which became effective on January 1, 2009. On December 14, 2009, NDRC published the Guidance on the Improvement of Linking Up Coal Manufacture, Transportation and Demand, by allowing enterprises to choose the manner in which they transport coal. The Guidance reiterates the government’s support for the market orientation of the coal industry.
We sell our coal both on the spot market and under sales contracts and letters of intent. We set the purchase volume and schedule in a period of time (generally, within one year) in the sales contracts and letters of intent with our customers. The purchase price in the contract is set at the time of execution of contract, however, the purchase price in the letter of intent is set at the time of actual sales.
Fees and Taxes
The table below sets forth material taxes and fees that are imposed upon coal producers in China, as well as reserves which we are required to set aside.
|
|
| ||
| ||||
|
|
| ||
|
| |||
| ||||
Coal producers may be fined if they damage the environment, arable land, grasslands or forest areas. Under the Mineral Resources Law, if a mining enterprise’s mining activities result in damage to arable land, grasslands or forest areas, the mining enterprise must return the land to an arable state or plant trees or grass or take other restorative measures. The Mineral Resources Law and other applicable laws and regulations also state that anyone who causes others to suffer loss in terms of production or living standards is liable for the loss and must compensate the affected persons and remedy the situation.
Additionally, all coal producers are subject to PRC environmental protection laws and regulations which currently impose fees for the discharge of waste substances, require the payment of fines for serious pollution and provide for the discretion of the PRC government to close any facility which fails to comply with orders requiring it to cease or cure operations causing environmental damage.
Imports and Exports
According to the Foreign Trade Law, the Cargo Import and Export Ordinance and the Administrative Measures of Coal Export Quota, coal exports remain subject to State control and require governmental approval.
Our company has not been authorized as a PRC coal exporter. Our coal exports are conducted through two export agents, including China National Coal Industry Import and Export Corporation, Minmetals Trading Co., Ltd.
Pursuant to the Administrative Measures of Coal Export Quota, the NDRC and the Ministry of Commerce are responsible for determining China’s national coal export quota and allocating the quota among authorized coal exporters. Upon receiving a quota approval, authorized coal exporters may apply for coal export permits to the relevant authority designated by the MOFCOM. Authorized coal exporters are also required to report their monthly quota usage to the NDRC.
The regulations provide that quotas may be adjusted in the event of:
a major change in the international market;
a major change in domestic coal resources;
an imbalance in the usage of the coal export quota by an authorized coal exporter compared to its allocation of the coal export quota; and
other circumstances which require an adjustment to the coal export quotas.
The total national quotas approved for coal exports in 2009 and 2010 was 51.0 million and 25.5 million tonnes, respectively. The total national quota approved for coal export in 2011 is 38.0 million tonnes with the first 18.0 million tonnes’ quota already granted to exporters.
According to the Notice of the Customs Tariff Committee of the State Council on Revising the Tariff Rates on the Export of Aluminum Alloy, Coke and Coal (Shui Wei Hui 2008 No. 25), beginning August 20, 2008, the provisional tariff rate of coke, coking coal and soft coal will be 40%, 10%, and 10%, respectively. Export tariffs are generally passed to the purchaser. Therefore, changes in export tariffs do not directly affect us.
Domestic Trading of Coal
Pursuant to the Measures for the Regulation of Coal Operations promulgated by the NDRC on December 27, 2004, the State implemented a system to examine the qualifications of an entity to engage in coal operations, including the wholesale and retail of raw coal and processed coal products and the processing and distribution of coal for civilian use. Before an entity can engage in coal operations, it must obtain a coal operation qualification certificate. A coal production enterprise that deals in coal products produced and processed by a third party is required to obtain a coal operation qualification.
Environmental Protection
Pursuant to the Environmental Protection Law, the State Environmental Protection Administration is authorized to formulate national environmental quality and discharge standards and to monitor China’s environmental system at the national level to protect the environment. Environmental protection bureaus at the county level and above are responsible for environmental protection within their respective jurisdiction.
China has promulgated a series of laws and regulations. Through these laws and regulations, China has established national and local environmental protection legal frameworks and issued standards applicable to emission controls, discharges of wastes and pollutants to the environment, generation, handling, storage, transportation, treatment and disposal of waste materials by production facilities, land rehabilitation and reforestation.
The Environmental Protection Law requires any entity operating a facility that produces pollutants or may create a hazard to incorporate environmental protection measures into its operations and to establish an environmental protection responsibility system, which must adopt effective measures to control and properly dispose waste materials.
In the environmental impact statement of a construction project, the project operator must assess the pollution and environmental hazards the project is likely to produce and its impact on the ecosystem and measures for their prevention and control. The statement shall, after initial examination by the authorities in charge of the construction project, be submitted by a specified procedure to the competent department of environmental protection administration for approval. Facilities for the prevention and control of pollution must be designed, constructed and implemented simultaneously with the primary construction contemplated by a project. These facilities must be inspected by the competent environmental protection authority and determined to conform with specified requirements before they can be implemented.
Enterprises that discharge pollutants must report to and register with the relevant authorities in accordance with the provisions of a department of environmental protection administration under the State Council. Enterprises that discharge pollutants in excess of the prescribed national or local standards will be fined for excessive discharge according to State provisions and will be responsible for eliminating and controlling the pollution.
According to the Law on Prevention and Control of Water Pollution of the People’s Republic of China, and the Administrative Regulations on the Levy and Use of Discharge Fees, any new construction projects, which directly or indirectly discharge pollutants to water, such as coal mines and coking plants, must conduct an environmental impact assessment. Every new production facility must be equipped with waste water processing facilities which must be put in use together with the production facilities. Construction projects that discharge pollutants into water shall pay a pollutant discharge fee in accordance with state regulations.
Violators of the Environmental Protection Law and various environmental regulations may be subject to warnings, payment of damages and fines. Any entity undertaking construction work or manufacturing activities before the pollution and waste control and processing facilities are inspected and approved by the environmental protection department may be ordered to suspend production or operations and may be fined. The violators of relevant environment protection laws and regulations may be exposed to criminal liability if violations resulted in severe loss of property, personal injuries or death.
The rehabilitation of mining sites is another priority of the PRC government. Under the Law of Land Administration of the People’s Republic of China and the Land Rehabilitation Regulations, issued by the State Council in 1988, coal producers must undertake measures to restore a mining site to its original state within a prescribed time frame if their mining activities result in damage to arable land, grassland or forest. The rehabilitated land must meet rehabilitation standards, as required by law from time to time, and may only be subsequently used upon examination and approval by the land authorities. A coal producer’s failure to comply with this requirement or its failure to return the mining site to its original state will result in the imposition of fines, rehabilitation fees and/or rejection of applications for land use rights by the local bureau of land and resources.
In addition to the PRC environmental laws and regulations, China is a signatory to the 1992 United Nations Framework Convention on Climate Change and the 1998 Kyoto Protocol, which propose emission targets to reduce greenhouse gas emissions. The Kyoto Protocol came into force in 2005. At present, the Kyoto Protocol has not set any specific emission targets for certain countries, including China.
Mining safety
On June 7, 2005, the State Council promulgated Several Opinions on Promoting the Healthy Development of the Coal Industry (“Opinions”), announcing the PRC government’s policies with respect to the development and restructuring of the coal industry. The Opinions reiterated the PRC government’s policies with respect to the administration of coal reserves, enhancement of coal mine safety, encouragement of industry consolidation among coal producers, acceleration of the construction of large coal production bases, improvement of mining techniques and equipment for coal production and the organization and regulation of small coal mines.
According to the Measures for Implementing Work Safety Permits in Coal Mine Enterprises issued by the State Administration of Work Safety and the SACMS, a coal mine enterprise without a work safety permit may not engage in coal production activities. Coal mining enterprises and their mines that do not satisfy the safety conditions set forth in these documents, or those that violate the provisions of this document, will be punished accordingly. Coal mine enterprises that remain compliant with the requirements set in these documents may apply for administrative approval to extend the validity period of their Work Safety Permits.
The Special Regulations by the State Council on Preventing Work Safety Related Accidents in Coal Mines were promulgated and entered into effect on September 3, 2005. This regulation specifies that coal mine enterprises are responsible for preventing coal mine work safety-related accidents. If a coal mine has not obtained, in accordance with the law, a mining right permit, work safety permit, coal production permit or business license and if the mine manager has not obtained, in accordance with the law, a mine manager qualification certificate and a mine manager safety qualification certificate, the coal mine may not engage in production. Coal mining enterprises should establish a sound system for the detection, elimination, treatment and reporting of latent work safety-related dangers. If a major latent work safety-related danger as specified exists in a coal mine, the enterprise should immediately suspend production and eliminate the latent danger. Coal mining enterprises should provide their personnel working underground and their special operation personnel with safety education and training in accordance with relevant state regulations. The person in charge of a coal mine and the production and operation management personnel should go into mines and act as foremen on a rotating basis in accordance with state regulations, while a file recording their entry into the mine should be maintained.
In addition, the State Administration of Work Safety issued five sets of supplemental measures: (i) the Measures for Determining Major Latent Work Safety Related Dangers in Coal Mines (for Trial Implementation); (ii) the Implementing Measures for the Detection and Elimination of Latent Dangers in Coal Mines and the Rectification and Closure of Such Mines (for Trial Implementation); (iii) the Measures for the Supervision and Inspection of Coal Mine Safety Training (for Trial Implementation); (iv) the Guiding Opinions on Persons in Charge of Coal Mines and Production and Operation Management Personnel Going into Mines as Foremen; and (v) the Measures for Rewarding the Reporting of Major Latent Work Safety Related Dangers in, and Violations of the Law by, Coal Mines (for Trial Implementation).
Coal Industry — Australian Regulatory Matters
Our mining operations in Australia are regulated by Australian federal and state governments with respect to environmental issues such as water quality, air quality, dust impacts, noise impacts, planning issues (such as approvals to expand existing mines or to develop new mines), and health and safety issues. Industrial relations are regulated under both federal and state laws. Australian state governments also require coal companies to post deposits or give other security against land which is being used for mining and exploration, with those deposits being returned or security released after satisfactory reclamation is completed.
Environmental
Each state and territory in Australia has its own legal regime regarding environment and planning and there is a Commonwealth environment regime in respect of matters of national environmental significance. In addition, each state and territory also has a legal regime dealing with mining in particular. The mining legislation in each state and territory generally operates concurrently with environment and planning legislation. The mining legislation governs exploration and mining licenses, including the restoration of land following the completion of mining activities.
The particular provisions of the various state and territory environment and planning legal regimes vary depending upon the jurisdiction. Despite variation in details, each state and territory has a system involving broadly at least two major phases. First, obtaining major environment/planning developmental approval addressing planning and significant environmental issues; and second, obtaining pollution control approvals, regarding pollution control issues such as emissions to the atmosphere; emissions in waters; noise impacts, impacts from blasting; dust impacts; the generation, handling, storage and transportation of waste.
The Commonwealth environment regime will apply if matters of national environmental significance are likely to be significantly impacted. If so, Commonwealth approval will be required.
Occupational Health and Safety
The combined effect of various state and federal statutes requires an employer to ensure that persons employed in a mine are safe from injury by providing a safe working environment and systems of work; safety machinery; equipment, plant and substances; and appropriate information, instruction, training and supervision.
In recognition of the specialized nature of mining and mining activities, specific occupational health and safety obligations have been mandated under law and legislation that deals specifically with the coal mining industry. Mining employers, owners, directors and managers, persons in control of work places, mine managers, supervisors and employees are all subject to these duties. The Australian federal government is currently conducting a review of health and safety legislation with a view to harmonizing requirements across the country.
It is mandatory for an employer to have insurance coverage with respect to the compensation of injured workers. Similar coverage is in effect throughout Australia which is of a no fault nature and which provides for benefits up to a prescribed level. The specific benefits vary by jurisdiction, but generally include the payment of weekly compensation to an injured employee, together with payment of medical, hospital and related expenses. The injured employee may have a right to sue his or her employer for further damages if a case of negligence can be established (but on the condition that the injured employee waives his or her right to the insurance coverage).
Carbon Pollution Reduction Scheme
The Federal Labor government ratified the Kyoto Protocol in December 2007. Under the treaty, Australia has a target of restricting greenhouse gas emissions to 108% of 1990 levels during the 2008 to 2012 commitment period. The government has also committed to a 60% reduction in emissions by 2050, from 2000 levels. To assist in meeting these targets, the Australian Federal government has announced that it intends to establish a cap and emissions trading scheme by 2013, named the Carbon Pollution Reduction Scheme. This scheme will impose costs on greenhouse gas emissions that will affect our business. However, the Australian government is likely to provide some support for the coal industry for the first few years of the scheme. If the Carbon Pollution Reduction Scheme is implemented and we need to buy the credits for volume of energy greenhouse gas emissions, our revenue may decrease and our business may be adversely affected.
Foreign Investment
No specific restrictions apply in relation to foreign investment in Australia’s coal industry. However, under Australian law and the Australian government’s foreign investment policy, certain acquisitions must be notified to obtain the prior approval of the Treasurer before proceeding. These include acquisitions of substantial interests in an Australian business where the value of the business’ total assets is, or the proposal value is, above US$100.0 million. It also includes (a) proposals to establish new businesses involving a total investment of US$10.0 million or more; (b) offshore takeovers of a foreign company whose Australian subsidiaries or assets are valued at more than US$200.0 million and account for less than 50% of the target company’s global assets (different thresholds apply to U.S. investors); (c) acquisition of shares in a company or trust which holds more than 50% of its assets in Australian urban land (regardless of the value of that acquisition); and (d) all direct investments in an Australian foreign business by foreign governments or their agencies (irrespective of the size of that Australian business or value of that acquisition and made either directly or through a company that is owned 15% or more by a foreign government).
Power Generation Industry
The Electric Power Law and the Electric Power Regulatory Ordinance
The Electric Power Law of the People’s Republic of China (the “Electric Power Law”) sets out the regulatory framework of the power industry. The Electric Power Law encourages power plant operators to focus on environmental protection and adopt new technology to decrease waste discharge.
In 2005, the State Council promulgated the Electric Power Regulatory Ordinance. The Electric Power Regulatory Ordinance sets forth regulatory requirements for many aspects of the power industry, including, among others, the issuance of electric power business permit, the regulatory inspections of power generators and grid companies and the legal liabilities from violations of the regulatory requirements.
Approvals and Licenses for Power Plants
Applications for all new coal-fired power plants are required to be submitted to the NDRC for approval, as well as the State Council for significant power plant projects. According to the Provisions on the Administration of Electric Power Business Licenses, applicants are also required to obtain requisite permits, including an Electric Power Business for Power Generation and approvals related to plant site, land use rights, construction and the environment.
Pricing
Since 1996, the Electric Power Law has set forth general principles for determining power tariffs. The Interim Provisions for the Administration of Grid Power Price promulgated by NDRC states that tariffs are to be formulated to provide reasonable compensation for costs and a reasonable return on investment, to share expenses fairly and to promote the construction of power projects. With the exception of grid power prices set by governmental bids or power plans that produce alternative energy, grid power prices of new power plants within the same region should be uniform. The on-grid tariffs for planned output and excess output are subject to a review and approval process involving the NDRC and the provincial price bureaus. In 2004, the NDRC, with the approval of the State Council, issued a policy to link thermal coal and power prices. This policy allows on-grid tariffs to increase if the average price of coal increases by more than 5% within a six-month period.
Safety
In accordance with the Measures for Supervising the Safety Production of Electricity, issued by the SERC, power plants are responsible for maintaining their safety operations in accordance with requirements set by the regional grid in which they are located. Power plants are required to report to the SERC and relevant local government authorities worker fatalities or serious or extraordinary accidents.
Coal Chemical Processing Industry
The State announced in the Coal Law its encouragement and support for coal mining enterprises and other enterprises to produce both coal and electricity, coking coal and coal chemicals. The NDRC issued the Notice of Strengthening the Administration of Coal Chemical Processing Industry and Improving the Healthy Development of the Industry, which was aimed at strengthening the coal chemical processing industry through the promotion of transportation safety, risk prevention and management standardization. According to the Enterprise Income Tax Law and its implementation regulations, enterprises that produce products using resources encouraged by industrial policies of the State are eligible for preferential tax treatment. If an enterprise uses any of the materials that are listed in the Catalogue of Income Tax Preference for Enterprises of Comprehensive Utilization of Resources as a major raw material in its product, the total income derived from such product for tax purposes will be reduced by 90%. Coke oven waste gas, one of the primary raw materials at one of our methanol production facilities, is one of the materials listed in the catalogue.
As of December 31, 2010, our Company consisted of 18 departments, namely the Secretariat of the Board of Directors, Audit Department of the Board of Directors, Department of Coordination, Department of Human Resources, Department of Financial, Planning and Management Department, Information Management Department, Enterprise Development Department, Risk Management Department, General Control Center, Department of Production Technology, Department of Safety Inspection, Electrical Engineering and Power Department, Ventilation and Dust Elimination Department, Geological Survey Department, Office of Community Relationship, Technical Center and Overseas Management Department.
The diagram below sets forth our organizational structure as of December 31, 2010:
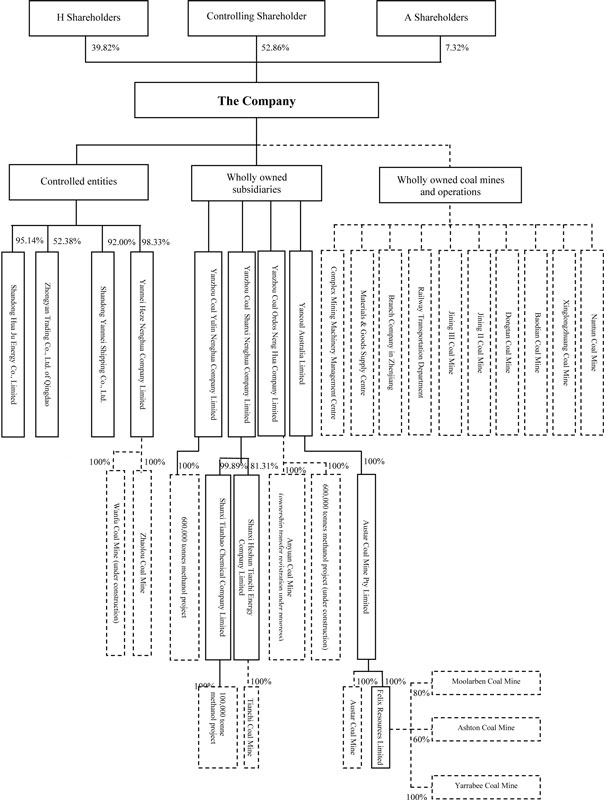
 shareholdings
 production units
Real Property and Leasehold Property
As of December 31, 2010, the net book value of our property, plant and equipment was RMB19,874.6 million. The properties for which we own land use rights in China occupy an area of approximately 7.2 million square meters, while the coalfields to which we possess mining rights in Australia occupy an area of approximately 1,035.7 million square meters. Under PRC law, our land use rights for properties in China are granted for 50 years commencing from the respective grant dates of such land use rights and are freely transferable. In addition, the land ownership rights held by Yancoal Australia are held in perpetuity pursuant to Australian law.
Coal Mines and Coal Production Facilities
The SixNantun, Xinglongzhuang, Baodian, Dongtan, Jining II, Jining III, Beisu and Yangcun Coal Mines currently operated by us are all located in the southwestern part of Shandong Province. AllExcept for Yangcun Coal Mine, all of these mines are connected by our railway network, which provides direct accessdirectly connect to our customers or indirectly through the PRC national railway or highway system. systems. We acquired Jining II Coal Mine in 1998 and Jining III Coal Mine in 2001. We acquired Heze Nenghua, the operator of Tianchi Coal Mine in 2006 and subsequently the mining rights of Zhaolou Coal Mine through Heze Nenghua in 2008. Our wholly owned subsidiary, Ordos Neng Hua, acquired Anyuan Coal Mine in 2010 and acquired the mining rights of Zhuanlongwan coalfield through public bidding in 2011. In addition, Ordos Neng Hua acquired 80% of the equity interest in Inner Mongolia Xintai in 2011, which has operated Wenyu Coal Mine since July 2011.
We acquired Austar Coal Mine in Australia in 2004, and subsequently acquired Shanxi Nenghua, which operates Tianchi Coal Mine, in 2006. As of the date of the annual report, we owned 98.33% of the equity interests of Heze Nenghua.
In December 2009, we acquired the entire equity interest in FelixYancoal Resources (formerly Felix) through Yancoal Australia. Felix is a company incorporatedAustralia in Australia whose principal activities include the mining, sales and exploration of coal. The major coal assets currently owned by Felix are located in New South Wales and Queensland. As of the date of this annual report, Felix had an ownership interest in the following operational coal mines:2009, which operates Ashton Coal Mine (consisting of an underground coal mine and an open-pit coal mine), Minerva Coal Mine, Yarrabee Coal Mine and Moolarben Coal Mine (consistingMine. We acquired an additional 30% of an underground coal mine and an open-pit coal mine). Felix also holds ownership interests in three exploratory mine projects and a 15.4% equity interest in Newcastle Coal Infrastructure Group, a joint venture that is responsible for constructing and operating the third export terminal at Newcastle Port. Pursuant to approval granted the seventeenth meeting of the fourth session of the Board held on December 30, 2010, we acquired another 30% equity interest in the Ashton Coal Mine Joint Venture and disposed of a 51% of the equity interest in the Minerva Coal Mine Joint Venture.Venture in 2011. As of the date of the annual report,December 31, 2012, we held 90% of the equity interestsinterest in the Ashton Coal Mine Joint Venture in aggregateVenture. In August 2011, we acquired the entire equity interest of both Syntech Holdings Pty Ltd. and held no interest inSyntech Holdings II Pty Ltd., which operate the MinervaCameby Downs Coal Mine Joint Venture.
Our wholly-owned subsidiary, Ordos Neng Hua,and have five exploration tenements that can be potentially developed. In September 2011, we acquired Anyuanthe entire equity interest of both Premier Coal, which operates the Premier Coal Mine and Wilga Exploration Area, and Premier Char. In May 2012, we purchased from Yankuang Group and Beisu Company all of the assets and liabilities of Beisu Coal Mine and Yangcun Coal Mine, including mining rights, building ownership certificates, mining and related equipment and other fixed assets. In addition, as a result of its merger with Gloucester in December 2010. June 2012, Yancoal Australia is the largest listed Australian pure-play coal mining enterprise in terms of saleable coal production in 2011.
As of the date of thethis annual report, the following material approvals, permits and licenses need to be obtained or renewed for our coal mines or projects in China:
the permit for our acquisition of Anyuan Coal Mine is pending regulatory review and approval by the Inner Mongolia government authorities. In addition, we wereare in the process of transferringrenewing the relevant certificatesworking safety permit, mining permit and registrations ofcoal production permit for Anyuan Coal Mine.Mine, which we expect to complete by the second half of 2013;
we obtained the approval from the NDRC to conduct preliminary work on Shilawusu and Zhuanlongwan projects in December 2012 and March 2013, respectively;
Yingpanhao Project has been included into the NDRC’s twelfth five-year plan for the coal mining industry in March 2012. We are in the process of obtaining permits for our commencement of construction on this project;
we are in the process of obtaining a mining permit for Wanfu Project;
we are undergoing transfer procedures for Yangcun and Beisu Coal Mines; and
we are in the process of renewing the water pollution discharge permit for Jining II and Jining III Coal Mines.
In addition to the above, a number of material Australian regulatory approvals, permits and licenses are pending, outstanding, have not been applied for as yet or have expired, including:
surface mining leases for the development of proposed additional stages of the Moolarben Coal Mine, as well as agreements with affected landholders (including a competitor of Yancoal Australia), which are still in process; and
we have obtained the planning approval for the proposed additional “South East Open Cut” project of the Ashton Coal Mine from the Planning Institution of Australia. We expect to have the hearing for the Environmental Impact Assessment in the second half of 2013.
We operate substantially all of our mines either directly or through our subsidiaries and we have contracted the mining operations at Anyuan, Wenyu and Cameby Downs Coal Mines and Duralie open-pit mine at Gloucester Coal Mine to third party contractors.
The map below shows the location of the SixNantun, Xinglongzhuang, Baodian, Dongtan, Jining II, Jining III Coal Mines in Shandong Province and our railway system:
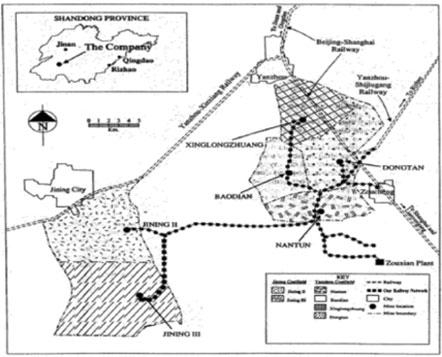
The map below shows the location of Tianchi Coal Mine:

The map below shows the location of Zhaolou Coal Mine:
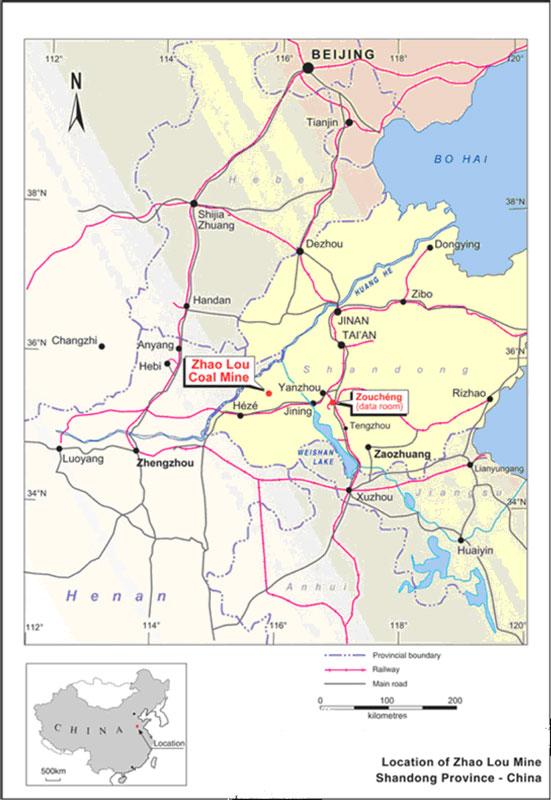
The map below shows the location of Anyuan and Wenyu Coal Mines:
The map below shows the location of Beisu Coal Mine:
The map below shows the location of Yangcun Coal Mine:
The map below shows the location of Austar, Yarrabee, Ashton and Moolarben Coal MineMines as well as developmental-stage projects Athena, Harrybrandt, Wilpeena and coal mines owned by Felix:Wilga.
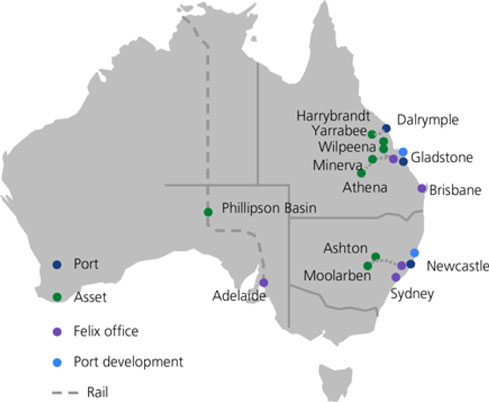
The map below shows the location of AnyuanCameby Downs Coal Mine owned by Ordos Neng Hua:Mine:
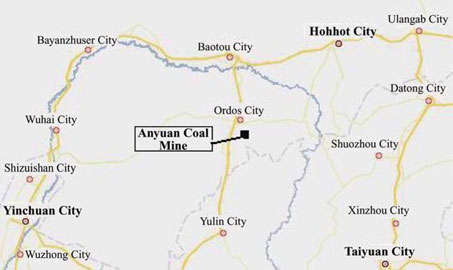
The map below shows the location of Premier Coal Mine:
The map below shows the location of Gloucester, Donaldson and Middlemount Coal Mines and Monash Project:
The Six Coal Mines
The following table sets forth information about each of the SixNantun, Xinglongzhuang, Baodian, Dongtan, Jining II, Jining III Coal Mines, which are directly owned and operated by the Company:
| Nantun | Xinglong- zhuang | Baodian | Dongtan | Jining II | Jining III | Total | Nantun | Xinglong- zhuang | Baodian | Dongtan | Jining II | Jining III | Total | |||||||||||||||||||||||||||||
Background data: | ||||||||||||||||||||||||||||||||||||||||||
Commencement of construction | 1966 | 1975 | 1977 | 1979 | 1989 | 1993 | N/A | 1966 | 1975 | 1977 | 1979 | 1989 | 1993 | N/A | ||||||||||||||||||||||||||||
Commencement of commercial production | 1973 | 1981 | 1986 | 1989 | 1997 | 2000 | N/A | 1973 | 1981 | 1986 | 1989 | 1997 | 2000 | N/A | ||||||||||||||||||||||||||||
Coalfield area (square kilometers) | 35.2 | 59.81 | 36.4 | 60.0 | 87.1 | 105.1 | 383.61 | 35.2 | 59.81 | 36.4 | 60.0 | 87.1 | 105.1 | 383.61 | ||||||||||||||||||||||||||||
Reserve data:(1) (millions tonnes as of December 31, 2010) | ||||||||||||||||||||||||||||||||||||||||||
Reserve data:(1) (millions tonnes as of December 31, 2012) | ||||||||||||||||||||||||||||||||||||||||||
Total in-place proven and probable reserves(1) | 114.74 | 319.13 | 282.41 | 450.57 | 408.87 | 221.60 | 1,797.32 | 108.05 | 304.08 | 269.85 | 436.94 | 400.53 | 209.98 | 1.729.43 | ||||||||||||||||||||||||||||
Mining recovery rate (%) | 80.39 | 80.50 | 80.99 | 83.78 | 71.12 | 80.49 | N/A | |||||||||||||||||||||||||||||||||||
Mining recovery rate(2)(%) | 81.20 | 81.26 | 80.45 | 84.09 | 79.51 | 80.46 | N/A | |||||||||||||||||||||||||||||||||||
Coal preparation plant recovery rate (%) | 67.59 | 87.40 | 62.12 | 60.96 | 69.43 | 62.55 | 69.52 | 74.31 | 86.82 | 72.51 | 46.99 | 72.71 | 62.65 | 65.37 | ||||||||||||||||||||||||||||
Depth of mine(meters underground) | 397.0 | 429.2 | 474.7 | 710.0 | 593.0 | 556.0 | N/A | 397.0 | 429.2 | 474.7 | 710.0 | 593.0 | 556.0 | N/A | ||||||||||||||||||||||||||||
Average thickness of main coal seam(meters) | 8.60 | 8.29 | 8.81 | 8.41 | 6.78 | 6.20 | N/A | 10.43 | 8.3 | 8.8 | 8.4 | 6.8 | 6.2 | N/A | ||||||||||||||||||||||||||||
Type of coal | thermal coal | thermal coal | thermal coal | thermal coal | thermal coal | thermal coal | N/A | thermal coal | thermal coal | thermal coal | thermal coal | thermal coal | thermal coal | N/A | ||||||||||||||||||||||||||||
Leased/owned | owned | owned | owned | owned | owned | owned | N/A | owned | owned | owned | owned | owned | owned | N/A | ||||||||||||||||||||||||||||
Assigned/unassigned | assigned | assigned | assigned | assigned | assigned | assigned | N/A | assigned | assigned | assigned | assigned | assigned | assigned | N/A | ||||||||||||||||||||||||||||
Average calorific value(Kcal/kg) | 5,572 | 5,881 | 5,890 | 5,586 | 5,467 | 5,412 | N/A | 5290 | 5484 | 5507 | 5249 | 5158 | 5227 | N/A | ||||||||||||||||||||||||||||
Sulfur content (%) | 0.60 | 0.47 | 0.52 | 0.60 | 0.56 | 0.52 | N/A | 0.91 | 0.51 | 0.55 | 0.53 | 0.56 | 0.59 | N/A | ||||||||||||||||||||||||||||
Production data:(million tonnes) | ||||||||||||||||||||||||||||||||||||||||||
Designed raw coal production capacity | 2.4 | 3.0 | 3.0 | 4.0 | 4.0 | 5.0 | 21.4 | 2.4 | 3.0 | 3.0 | 4.0 | 4.0 | 5.0 | 21.4 | ||||||||||||||||||||||||||||
Designed washing capacity | 1.8 | 3.0 | 3.0 | 4.0 | 3.0 | 5.0 | 19.8 | 1.8 | 3.0 | 3.0 | 4.0 | 3.0 | 5.0 | 19.8 | ||||||||||||||||||||||||||||
Raw coal production | ||||||||||||||||||||||||||||||||||||||||||
2000 | 4.5 | 6.2 | 5.3 | 6.7 | 4.8 | — | 27.5 | |||||||||||||||||||||||||||||||||||
2001 | 4.9 | 6.6 | 6.2 | 7.1 | 4.1 | 5.1 | 34.0 | |||||||||||||||||||||||||||||||||||
2002 | 3.6 | 7.1 | 6.4 | 8.1 | 5.2 | 8.0 | 38.4 | |||||||||||||||||||||||||||||||||||
2003 | 4.7 | 7.0 | 7.3 | 8.2 | 6.0 | 10.1 | 43.3 | |||||||||||||||||||||||||||||||||||
2004 | 4.1 | 7.4 | 7.0 | 8.5 | 4.9 | 7.3 | 39.2 | |||||||||||||||||||||||||||||||||||
2005 | 4.0 | 6.6 | 5.0 | 7.5 | 4.5 | 7.0 | 34.6 | |||||||||||||||||||||||||||||||||||
1997-2005 | 37.9 | 56.1 | 50.2 | 62.5 | 35.3 | 37.5 | 279.5 | |||||||||||||||||||||||||||||||||||
2006 | 3.9 | 7.2 | 5.6 | 8.0 | 4.0 | 6.8 | 35.5 | 3.9 | 7.2 | 5.6 | 8.0 | 4.0 | 6.8 | 35.5 | ||||||||||||||||||||||||||||
2007 | 3.9 | 6.8 | 5.8 | 7.6 | 3.4 | 5.3 | 32.8 | 3.9 | 6.8 | 5.8 | 7.6 | 3.4 | 5.3 | 32.8 | ||||||||||||||||||||||||||||
2008 | 3.5 | 6.6 | 6.0 | 7.0 | 3.9 | 6.1 | 33.1 | 3.5 | 6.6 | 6.0 | 7.0 | 3.9 | 6.1 | 33.1 | ||||||||||||||||||||||||||||
2009 | 3.8 | 6.6 | 5.7 | 7.5 | 3.6 | 6.2 | 33.4 | 3.8 | 6.6 | 5.7 | 7.5 | 3.6 | 6.2 | 33.4 | ||||||||||||||||||||||||||||
2010 | 3.6 | 6.8 | 6.1 | 7.4 | 4.2 | 6.2 | 34.3 | 3.6 | 6.8 | 6.1 | 7.4 | 4.2 | 6.2 | 34.3 | ||||||||||||||||||||||||||||
Cumulative raw coal production as of December 31, 2010 | 67.1 | 101.8 | 90.4 | 112.2 | 55.0 | 68.1 | 494.6 | |||||||||||||||||||||||||||||||||||
2011 | 3.3 | 6.8 | 6.1 | 7.3 | 4.4 | 6.0 | 34.0 | |||||||||||||||||||||||||||||||||||
2012 | 3.2 | 7.0 | 6.1 | 7.6 | 3.7 | 5.5 | 33.1 | |||||||||||||||||||||||||||||||||||
Cumulative raw coal production as of December 31, 2012 | 63.1 | 103.9 | 91.6 | 114.9 | 62.5 | 79.7 | 515.7 | |||||||||||||||||||||||||||||||||||
| (1) | The proven and probable reserves of the above |
Under Industry Guide 7, “proven reserves” are reserves for which (a) quantity is computed from dimensions revealed in outcrops, trenches, workings or drill holes, grade and/or quality are computed from the results of detailed sampling and (b) the sites for inspection, sampling and measurement are spaced so closely and the geologic character is so well defined that size, shape, depth and mineral content of reserves are well-established. “Probable reserves” are reserves for which quantity and grade and/or quality are computed from information similar to that used for proven reserves, but the sites for inspection, sampling, and measurement are further apart or are otherwise less adequately spaced. The degree of assurance of “probable reserves,” although lower than that for proven reserves, is high enough to assume continuity between points of observation.
The total proven and probable reserves as of the end of a year are derived by deducting the proven and probable reserves consumed in the coal production in the same year from the proven and probable reserves as of the end of the immediately preceding year.
| (2) | The mining recovery rate is the rate of the amount of coal recovered from a determined amount of proven and probable reserves, which is calculated by dividing the |
| “Coal preparation plant recovery |
| “Assigned” |
Nantun Coal Mine.
Nantun is located in the southern portion of our coalfield, with a coalfield area of approximately 35.2 square kilometers. Nantun began commercial production initially in 1973 with a designed annual raw coal production capacity of 2.4 million tonnes of coal. The main coal seam of Nantun is divided into twofour leaves. The thickness of the upper leaf averages 5.35 and 3.21 meters and the thickness of the lower leaf averages 3.210.89 and 1.03 meters. As of December 31, 2010,2012, the total in-place proven and probable reserves on the main coal layer were approximately 114.7108.05 million tonnes. At this mine, we generally
We primarily use the fully-mechanizedfully mechanized sublevel caving mining method to extract coal from the upper layer of the coal seam and use a fully-mechanized longwall system to mine the lower layer of the coal seam.coal. As of December 31, 2010,2012, Nantun produced coal from three work-faces.
work faces. Nantun’s coal preparation plant produces mainly No. 2 Clean Coal and employs movable-sieve jig machines and jig machines. Most of the equipment used in the Nantun coal preparation plant was manufactured in the PRC.
Xinglongzhuang Coal Mine.
Xinglongzhuang is located in the northern portion of our coalfield, with coalfield area of approximately 59.8 square kilometers. Xinglongzhuang began commercial production initially in 1986 with a designed annual raw coal production capacity of 3.0 million tonnes of coal.tonnes. The main coal seam of Xinglongzhuang is concentrated in one leaf with an average thickness of 8.3 meters. As of December 31, 2010,2012, the total in-place proven and probable reserves on the main coal layer were approximately 319.1304.08 million tonnes. At this mine, we principally
We primarily use the fully-mechanizedfully mechanized sublevel caving method to extract coal from the coal seam of Xinglongzhuang Coal Mine. XinglongzhuangAt this coal mine, we produced coal from two work-faceswork faces as of December 31, 2010.
2012. The Xinglongzhuang coal preparation plant produces No. 1 and No. 2 Clean Coal and blocklump coal. The majority of the equipment in the Xinglongzhuang coal preparation plant, including its jig machines and movable-sieve jig machines, werewas manufactured in the PRC while a small portion of the equipment was imported.
Baodian Coal Mine.
Baodian is located in the central western portion of our coalfield, with coalfield area of approximately 36.4 square kilometers. Baodian began commercial production initially in 1986 with a designed annual raw coal production capacity of 3.0 million tonnes of coal.tonnes. Certain sections of the main coal seam of Baodian are concentrated in one leaf, with an average thickness of 8.81 meters. The remaining sections are divided into two leaves with an average thickness of 5.74 meters for the upper leaf and 3.38 meters for the lower leaf. As of December 31, 2010,2012, the total in-place proven and probable reserves on the main coal layer were approximately 282.4269.85 million tonnes. At this mine, we generally
We primarily use the fully-mechanizedfully mechanized sublevel caving method to extract coal. At this coal from the upper layer of the coal seam and use mechanized longwall faces to mine, the lower layer of the coal seam. Baodian Coal Minewe maintained two work-facework faces as of December 31, 2010.
2012. The Baodian coal preparation plant produces No. 2 Clean Coal and blocklump coal. The majority of equipment in the Baodian coal preparation plant, including its slanted wheel, cyclones and jig machines, werewas manufactured in the PRC.
Dongtan Coal Mine.
Dongtan is located in the central eastern portion of our coalfield, with coalfield area of approximately 60.0square60.0 square kilometers. BaodianDongtan began commercial production initially in 1989 with a designed annual raw coal production capacity of 4.0 million tonnes of coal.tonnes. Certain sections of the main coal seam consist of one layer with an average thickness of 8.41 meters, and the remaining sections are divided into two layers, with an average thickness of 5.38 meters for the upper layer and 3.22 meters for the lower layer. As of December 31, 2010,2012, the main coal layer held approximately 450.6436.94 million tonnes of in-place proven and probable reserves. At this mine, we generally
We primarily use the fully-mechanizedfully mechanized sublevel caving method to extract coal from the sections of the coal seam with one layer of coal and the upper layer in the sections with two layers of coal. Dongtan Coal MineAt this mine, we maintained two work-faceswork faces as of December 31, 2010.
2012. The BaodianDongtan coal preparation plant produces No. 2 and No. 3 Clean Coal and blocklump coal. The principal pieces of equipment in the BaodianDongtan coal preparation plant, including its slanted wheel, cyclones and jig machines, were manufactured in the PRC.
Jining II Coal Mine.
Jining II is located in the northern portion of the Jining coalfield, with coalfield area of approximately 87.1 square kilometers. BaodianJining II began commercial production initially in 1997 with a designed annual raw coal production capacity of 4.0 million tonnes of coal.tonnes. Certain sections of the main coal seam of Jining II are concentrated in one layer, with an average thickness of 6.78 meters. The remaining sections are divided into two layers, with an average thickness of 2.1 meters for the upper leaf and an average thickness of 4.68 meters for the lower leaf. As of December 31, 2010,2012, the total in-place proven and probable reserves on the main coal layer were approximately 408.9400.53 million tonnes.
We primarily use the fully mechanized sublevel caving method to extract coal. At this coal mine, we use mainly the fully-mechanized sublevel caving method to extract coal from the upper layer of the coal seam and use mechanized longwall faces to mine the lower layer of the coal seam. Jining II Coal Mine produced coal from three work-facestwo work faces as of December 31, 2010.
2012. The main equipment used in Jining II isare movable-sieve jig machines and jig machines, most of which arewere manufactured in the PRC. The principal productsproduct of the coal preparation plant of Jining II areis No. 2 Clean Coal.
Jining III Coal Mine.
Jining III is located in the southern portion of the Jining coalfield and covers an area of 105.0 square kilometers. Jining III hadhas a designed annual raw coal production capacity of 5 million tonnes in 2000. The average thicknesstonnes. Certain sections of the main coal seam of Jining III isare concentrated in one layer, with an average thickness of 6.2 meters. The remaining sections are divided into two layers, with an average thickness of 1.21 meters for the upper leaf and an average thickness of 4.9 meters for the lower leaf. As of December 31, 2010,2012, the total in-place proven and probable reserves on the main coal layer were approximately 221.6209.98 million tonnes. The average thickness of
We primarily used the main coal seam of Jining III is 6.2 meters. We mainly rely on the fully-mechanizedfully mechanized sublevel caving method to extract coal from two work-facesthree work faces in Jining III Coal Mine as of December 31, 2010.
2012. The main pieces of equipment used in Jining III are slanted wheel, cyclones and movable-sieve jig machines, which were manufactured in the PRC. The principal products of the coal preparation plant of Jining III are No. 2 and No. 3 Clean Coal. In 2010, Jining III implementedmade technical improvements which provided it with washing capacity.
Beisu and Yangcun Coal Mines
The following table sets forth information about Beisu and Yangcun Coal Mines, which are directly owned and operated by the Company:
| Beisu | Yangcun | Total | ||||
Background data: | ||||||
Commencement of construction | 1972 | 1981 | N/A | |||
Commencement of commercial production | 1976 | 1988 | N/A | |||
Coalfield area(square kilometers) | 29.3 | 27.46 | 75.38 | |||
Reserve data: (as of December 31, 2012) | ||||||
Mining recovery rate (%)(1) | 87.7% | 83.3% | N/A | |||
Coal preparation plant recovery rate (%)(2) | N/A | N/A | N/A | |||
Depth of mine(meters underground) | 269.7 | 318.8 | N/A | |||
Average thickness of main coal seam(meters) | 1.89 | 10.53 | N/A | |||
Type of coal | thermal coal | thermal coal | N/A | |||
Leased/owned | owned | owned | N/A | |||
Assigned/unassigned(3) | assigned | assigned | N/A | |||
Average calorific value(Kcal/kg) | 5,302 | 5,215 | N/A | |||
Sulfur content (%) | 3.55 | 1.29 | N/A | |||
Production data:(million tonnes) | ||||||
Designed raw coal production capacity | 1.0 | 1.15 | 2.15 | |||
Designed coal preparation input washing capacity | — | — | — | |||
Raw coal production | ||||||
2011 | — | — | — | |||
2012 | 1.0 | 1.1 | 2.1 | |||
Cumulative raw coal production as of December 31, 2012 | 1.0 | 1.1 | 2.1 | |||
| (1) | The mining recovery rate is the rate of the amount of coal recovered from a determined amount of proven and probable reserves, which is calculated by dividing the actual volume of coal recovered in a year by the volume of proven and probable reserves mined and consumed in the same year. |
| (2) | “Coal preparation plant recovery rate” refers to the wash plant recovery rate of raw coal used during the production of our coal products. |
| (3) | “Assigned” reserves refer to coal reserves which have been committed to a particular mining complex (mine shafts, mining equipment and plant facilities), and all coal which has been leased by the company to others. “Unassigned” reserves refers to coal reserves which have not been committed, and which would require new mine shafts, mining equipment, or plant facilities before operations could begin on the property. |
Beisu Coal Mine
Beisu Coal Mine is located in the south portion of our coalfield, and covers an area of approximately 29.3 square kilometers. We acquired the entire assets of Beisu Coal Mine in May 2012.
Beisu Coal Mine commenced operations in 1976 with a designed annual raw coal production capacity through technical improvement.of 0.75 million tonnes. The annual raw coal production capacity has been increased to 1.0 million tonnes since 2006. The main coal seam of Beisu is divided into two thin-seam leaves. The thickness of the upper leaf averages 0.9 meters and the thickness of the lower leaf averages 0.99 meters. We primarily used the thin coal seam blasting method and the fully mechanized system to extract coal from three work faces in Beisu Coal Mine as of December 31, 2012. Beisu Coal Mine primarily produces thermal coal. Beisu Coal Mine has a coal preparation plant. The main equipment used in the coal preparation plant is a waste discharge system, which was manufactured in China.
Yangcun Coal Mine
Yangcun Coal Mine is located in the north portion of our coalfield, and covers an area of approximately 27.46 square kilometers. We acquired the entire assets of Yangcun Coal Mine in May 2012.
Yangcun Coal Mine commenced operations in 1988 with a designed annual raw coal production capacity of 0.6 million tonnes. The annual raw coal production capacity has been increased to 1.15 million tonnes since 2006. The main coal seam of Yangcun is divided into three leaves. The thickness of the upper leaf averages 8.34 meters and the thickness of the lower leaves average 1.17 and 1.02 meters. We primarily used the fully mechanized sublevel caving method to extract coal from the upper leaf and the fully mechanized system to extract coal from the lower leaves. As of December 31, 2012, Yangcun Coal Mine has three work faces. Yangcun Coal Mine primarily produces thermal coal. Yangcun Coal Mine does not have any coal preparation plant.
Coal Mines operated by Shanxi Nenghua and Heze Nenghua
The following table sets forth information about Tianchi Coal Mine and Zhaolou Coal Mine our coal mines in China that are operated by subsidiaries of the Company:Shanxi Nenghua and Heze Nenghua:
| Tianchi | Zhaolou | Total | ||||||||||||||||
| Tianchi | Zhaolou | Total | ||||||||||||||||
Background data: | ||||||||||||||||||
Commencement of construction(1) | 2004 | 2004 | N/A | 2004 | 2009 | N/A | ||||||||||||
Commencement of commercial production(1) | 2006 | 2009 | N/A | 2004 | 2009 | N/A | ||||||||||||
Coalfield area(square kilometers) | 20.0 | 143.36 | 163.36 | 18.7 | 143.4 | 162.1 | ||||||||||||
Reserve data: (millions tonnes as of December 31, 2010) | ||||||||||||||||||
Reserve data: (millions tonnes as of December 31, 2012) | ||||||||||||||||||
Recoverable reserves(2) | 26.71 | 105.00 | 131.71 | 25.7 | 102.2 | 127.9 | ||||||||||||
Mining recovery rate (%) | 80.04 | 78.71 | N/A | |||||||||||||||
Mining recovery rate(3)(%) | 80.4 | 87.4 | N/A | |||||||||||||||
Coal preparation plant recovery rate (%)(3) | N/A | 69.18 | N/A | |||||||||||||||
Coal preparation plant recovery rate (%)(4) | N/A | 46.08 | N/A | |||||||||||||||
Depth of mine(meters underground) | 225 | 905 | N/A | 225 | 905 | N/A | ||||||||||||
Average thickness of main coal seam(meters) | 4.56 | 5.15 | N/A | 4.6 | 5.2 | N/A | ||||||||||||
Type of coal | thermal | 1/3 coking coal | N/A | thermal coal | 1/3 coking coal | N/A | ||||||||||||
Leased/owned | owned | owned | N/A | owned | owned | N/A | ||||||||||||
Assigned/unassigned (4) | assigned | assigned | N/A | assigned | assigned | N/A | ||||||||||||
Average calorific value(Kcal/kg) | 5,177 | 6,937 | N/A | 4,803 | 5,806 | N/A | ||||||||||||
Sulfur content (%) | 0.90 | 0.53 | N/A | 1.09 | 0.87 | N/A | ||||||||||||
Production data:(million tonnes) | ||||||||||||||||||
Production data:(million tonnes) | ||||||||||||||||||
Designed raw coal production capacity | 1.2 | 3.0 | 4.2 | 1.2 | 3.0 | 4.2 | ||||||||||||
Designed coal preparation input washing capacity | — | 3.0 | 3.0 | — | 3.0 | 3.0 | ||||||||||||
Raw coal production | ||||||||||||||||||
2006 | 0.1 | — | 0.1 | 0.1 | — | 0.1 | ||||||||||||
2007 | 1.2 | — | 1.2 | 1.2 | — | 1.2 | ||||||||||||
2008 | 1.1 | — | 1.1 | 1.1 | — | 1.1 | ||||||||||||
2009 | 1.0 | 0.04 | 1.04 | 1.0 | 0.04 | 1.04 | ||||||||||||
2010 | 1.5 | 1.6 | 3.1 | 1.5 | 1.6 | 3.1 | ||||||||||||
Cumulative raw coal production as of December 31, 2010 | 4.9 | 1.64 | 6.54 | |||||||||||||||
2011 | 1.2 | 3.0 | 4.2 | |||||||||||||||
2012 | 1.4 | 2.7 | 4.1 | |||||||||||||||
Cumulative raw coal production as of December 31, 2012 | 7.5 | 7.3 | 14.8 | |||||||||||||||
| (1) | With respect to the Tianchi Coal Mine, the “commencement of construction” refers to capacity expansion and technology upgrade undertaken after our 2006 acquisition; the “commencement of commercial production” refers to the resumption of production after completion of the foregoing expansion and upgrade. |
| (2) |
“Recoverable reserves” generally refer to proved and probable reserves under the JORC Code as revised in 2004,. “Proved reserves” are the economically mineable part of a measured coal resource and “probable reserves” are the economically mineable part of an indicated, and in some circumstances, measured coal resource. Both “proved reserves” and “probable reserves” incorporate mining dilution and allow for mining losses and are based on an appropriate level of mine planning, mine design and scheduling.
| (3) | The mining recovery rate is the rate of the amount of coal recovered from a determined amount of proven and probable reserves, |
| “Coal preparation plant recovery rate” refers to the wash plant recovery rate of raw coal used during the production of our coal products. |
| “Assigned” |
Tianchi Coal Mine.
Tianchi Coal Mine is an underground mine located in Heshun County of Shanxi, Province, with an area of approximately 2018.7 square kilometers. Tianchi Coal Mine commenced commercial production in 2006 and the designed production capacity of Tianchi Coal Mine was increased to 1.2 million tonnes per annum in the same year.
Tianchi Coal Mine is operated by inclined shaft development and itprimarily produces mostly thermal coal. The average thickness of thisthe target coal seam is 4.564.6 meters. As of December 31, 2010,2012, the total recoverable reserves of Tianchi Coal Mine were approximately 26.7125.7 million tonnes.
We principallyprimarily used the longwall caving mining method to extract coal from one work-facework face at Tianchi Coal Mine as of December 31, 2010.
2012. The primary piece of equipment in this system is a slanted wheel, which iswas manufactured in China. Tianchi Coal Mine primarily produces thermal coal and block coal.
We do not employ mining contractors at Tianchi Coal Mine. The operations at Tianchi Coal Mine are powered by electricity from local power grids. We ship coal products from the Tianchi Coal Mine to Hebei Province and surrounding areas on the Yangshe Railway and the national railway network, as well as the highway network.
Zhaolou Coal Mine.
Zhaolou Coal Mine is an underground longwall mine located in the central portion of Juye Coal Field in Shandong Province.Shandong. Zhaolou Coal Mine covers an area of approximately 143.4 square kilometers, and is accessible by roadway and railway.
Zhaolou Coal Mine commenced commercial production in December 2009 and has a designed annual raw coal production capacity of three3.0 million tonnes. Zhaolou Coal Mine produces 1/3 coking coal. The average thickness of the main coal seam of Zhaolou Coal Mine is 5.155.2 meters. The total recoverable reserves of Zhaolou Coal Mine were approximately 105.0102.2 million tonnes as of December 31, 2010. 2012, which was net of coal preparation and plant recovery losses.
We principallyprimarily used the longwall caving mining method to extract coal from the one work-facetwo work faces at Zhaolou Coal Mine as of December 31, 2010.
2012. The coal preparation plant at Zhaolou Coal Mine commenced commercial production in September 2009. The main equipment used in the coal preparation plant arewas a slanted wheel, cyclone machines and TBS separators, which arewere mainly produced in China. The main product of Zhaolou’s coal preparation plant is No. 2 Clean Coal.
We do not employ mining contractors at Zhaolou Coal Mine. The operations at Zhaolou Coal Mine are powered by electricity from local power grids. We ship coal products to Shandong and Hebei ProvinceProvinces and surrounding areas by trucks.truck.
Anyuan Coal Mine.Mines operated by Ordos Neng Hua
The following table sets forth information about Anyuan Coal Mine and Wenyu Coal Mine in China that are operated by Ordos Neng Hua:
| Anyuan | Wenyu | Total | ||||
Background data: | ||||||
Commencement of construction | — | 1996 | N/A | |||
Commencement of commercial production | 2004 | 1997 | N/A | |||
Coalfield area(square kilometers) | 9.26 | 9.36 | 75.38 | |||
Reserve data: (as of December 31, 2012) | ||||||
Mining recovery rate (%)(1) | 88.4 | 88.7 | N/A | |||
Coal preparation plant recovery rate (%)(2) | N/A | N/A | N/A | |||
Depth of mine(meters underground) | 68 | 59 | N/A | |||
Average thickness of main coal seam(meters) | 2.8 | 3.9 | N/A | |||
Type of coal | thermal coal | thermal coal | N/A | |||
Leased/owned | owned | owned | N/A | |||
Assigned/unassigned(3) | assigned | assigned | N/A | |||
Average calorific value(Kcal/kg) | 5,309 | 2,237 | N/A | |||
Sulfur content (%) | 0.32 | 0.75 | N/A | |||
Production data:(million tonnes) | ||||||
Designed raw coal production capacity | 1.2 | 3.0 | 6.35 | |||
Designed coal preparation input washing capacity | — | — | — | |||
Raw coal production | �� | |||||
2011 | 2.3 | 2.1 | 4.4 | |||
2012 | 2.3 | 4.6 | 6.9 | |||
Cumulative raw coal production as of December 31, 2012 | 4.6 | 6.7 | 11.3 | |||
| (1) | The mining recovery rate is the rate of the amount of coal recovered from a determined amount of proven and probable reserves, which is calculated by dividing the actual volume of coal recovered in a year by the volume of proven and probable reserves mined and consumed in the same year. |
| (2) | “Coal preparation plant recovery rate” refers to the wash plant recovery rate of raw coal used during the production of our coal products. |
| (3) | “Assigned” reserves refer to coal reserves which have been committed to a particular mining complex (mine shafts, mining equipment and plant facilities), and all coal which has been leased by the company to others. “Unassigned” reserves refers to coal reserves which have not been committed, and which would require new mine shafts, mining equipment, or plant facilities before operations could begin on the property. |
Anyuan Coal Mine
Through Ordos Neng Hua, we wholly control Anyuan Coal Mine, which is an underground longwall mine located in Yijinhuoluoqi of Ordos City in Inner Mongolia. Anyuan Coal MineMongolia Autonomous Region, and covers an area of approximately 9.26 km2 with9.3 square kilometers. Ordos Neng Hua commenced commercial production in 2011.
In 2011, we increased the annual production capacity of Anyuan Coal Mine from the designed annual production capacity of 600,000 tonnes to 1.2 million tonnes through reconstruction and expansion. Anyuan Coal Mine primarily produces thermal coal. The average thickness of the main coal reservesseam of Anyuan Coal Mine is 2.8 meters. We principally extracted coal from one work face at Anyuan Coal Mine as of December 31, 2012. Anyuan Coal Mine has a coal separation system. Anyuan Coal Mine is located in close proximity to railway and road transportation. The provincial highway and Baoshen railway are located approximately six kilometers to the west of the coalfield.
Wenyu Coal Mine
Through our subsidiary, Inner Mongolia Xintai, we operate Wenyu Coal Mine, which is located in Ordos City in Inner Mongolia Autonomous Region, and covers an area of approximately 41.8 million tonnes and recoverable coal reserves of approximately 24.6 million tonnes. 9.36 square kilometers.
The original designed annual raw coal production capacity of Wenyu Coal Mine was 1.1 million tonnes. We completed production capacity expansion from 1.1 million tonnes to 3.0 million tonnes upon approvals from the relevant administrative authority and commenced commercial production in 2011. The average thickness of the main seam of Wenyu Coal Mine is 4.0 meters. The type of coal is thermal coal. We principally extracted coal from two work faces at Wenyu Coal Mine as of December 31, 2012. Wenyu Coal Mine has a simplified coal separation system. Wenyu Coal Mine is located in close proximity to Baofu road, Anyuan Coal Mine was 600,000 tonnes. As of the date of the annual report, we received approval from Inner Mongolia and railway transportation.
Coal Administrative Bureau to increase the annual production capacity of Anyuan Coal Mine to 1.2 million tonnes and we were still in the process of completing the relevant administration procedures.
The transportation condition of Anyuan Coal Mine is convenient. The 213 provincial traffic way and Baoshen railway are six kilometers away in the west of the coal field. There is a road for coal transportation from east to west across the central coal field.
We acquired 100% of the equity interests of the Anyuan Coal Mine pursuant to the approval granted at the general manager working meeting held on November 12, 2010. Anyuan Coal Mine was taken overMines operated by Ordos Neng Hua on December 1, 2010. As of the date of the annual report, we were in the process of transferring the relevant certificates and registrations of Anyuan Coal Mine.Yancoal Australia
The following table sets forth information about our operational and exploratory coal mines in Australia, which are held directly or indirectly held by Yancoal Australia:
| Austar | Yarrabee | Minerva | Ashton | Moolarben | Athena | Harry- brandt | Wilpeena | Total | Austar | Yarrabee | Ashton | Moolarben | Gloucester Mine | Donaldson Mine | Middlemount(6) | Total | ||||||||||||||||||||||||||||||||||||
Background data: | ||||||||||||||||||||||||||||||||||||||||||||||||||||
Commencement of construction(1) | 1998 | 1981 | 2004 | 2003 | 2009 | N/A | N/A | N/A | N/A | 1998 | 1981 | 2003 | 2009 | 1998 | 2001 | 2009 | N/A | |||||||||||||||||||||||||||||||||||
Commencement of commercial production(1) | 2000 | 1982 | 2005 | 2004 | 2010 | N/A | N/A | N/A | N/A | 2000 | 1982 | 2004 | 2010 | 1999 | 2001 | 2011 | N/A | |||||||||||||||||||||||||||||||||||
Coalfield area(2)(square kilometers) | 63 | 62.71 | 15.6 | 19.21 | 17.4 | 782.73 | 40.4 | 34.65 | 1,035.7 | |||||||||||||||||||||||||||||||||||||||||||
Reserve data: (millions tonnes as of December 31, 2010) | ||||||||||||||||||||||||||||||||||||||||||||||||||||
Resources | 167 | 171.16 | 76.04 | 437.27 | 701.3 | 53.7 | 97.2 | 27.2 | 1,730.87 | |||||||||||||||||||||||||||||||||||||||||||
Coalfield area(2)(square kilometers) | 63 | 62.7 | 19.2 | 17.4 | 20.5 | 42.3 | 27.7 | 252.8 | ||||||||||||||||||||||||||||||||||||||||||||
Reserve data: (millions of tonnes as of December 31, 2012) | ||||||||||||||||||||||||||||||||||||||||||||||||||||
Recoverable reserves(3) | 50.9 | 60.29 | 23.61 | 60.8 | 351.7 | N/A | N/A | N/A | 547.3 | 49.7 | 61.4 | 74.0 | 300.9 | 69.4 | 148.3 | 96.0 | 799.7 | |||||||||||||||||||||||||||||||||||
Depth of mine(4) (meters underground) | 300 | N/A | N/A | 190-280 | N/A | N/A | N/A | N/A | N/A | 300-700 | N/A | 190-280 | N/A | N/A | 50-150 | N/A | N/A | |||||||||||||||||||||||||||||||||||
Type of coal | | semi-hard coking coal | | PCI coal | thermal coal | | semi-soft coking coal | | thermal coal | thermal coal | | anthracite coal | | PCI coal | N/A | semi-hard coking coal | PCI coal | semi-soft coking coal | thermal coal | semi-hard coking coal | semi-soft coking coal | Coking coal PCI coal | N/A | |||||||||||||||||||||||||||||
Leased/owned | owned | owned | owned | owned | owned | owned | owned | owned | N/A | owned | owned | owned | owned | owned | owned | owned | N/A | |||||||||||||||||||||||||||||||||||
Assigned/unassigned(5) | assigned | assigned | assigned | assigned | assigned | assigned | assigned | N/A | ||||||||||||||||||||||||||||||||||||||||||||
Average calorific value (Kcal/kg) | 6196 | 7300 | 7100 | 6650 | 7550 | 8200 | 7300 | N/A | ||||||||||||||||||||||||||||||||||||||||||||
Sulfur content (%) | 1.75 | 0.7 | 0.65 | 0.5 | 1.05 | 0.90 | 0.5 | N/A | ||||||||||||||||||||||||||||||||||||||||||||
Production data:(million tonnes) | ||||||||||||||||||||||||||||||||||||||||||||||||||||
Designed raw coal production capacity | 3.6 | 3.0 | 5.2 | 16.0 | 3.8 | 3.0 | 5.25 | 34.6 | ||||||||||||||||||||||||||||||||||||||||||||
Designed coal preparation input washing capacity | 3.3 | 2.4 | 6.5 | 16.0 | 3.8 | 3.0 | 5.25 | 30.0 | ||||||||||||||||||||||||||||||||||||||||||||
Raw coal production | ||||||||||||||||||||||||||||||||||||||||||||||||||||
2006 | 0.4 | — | — | — | — | — | — | 0.4 | ||||||||||||||||||||||||||||||||||||||||||||
2007 | 1.6 | — | — | — | — | — | — | 1.6 | ||||||||||||||||||||||||||||||||||||||||||||
2008 | 1.9 | — | — | — | — | — | — | 1.9 | ||||||||||||||||||||||||||||||||||||||||||||
2009 | 1.9 | — | — | — | — | — | — | 1.9 | ||||||||||||||||||||||||||||||||||||||||||||
2010 | 1.7 | 2.3 | 2.7 | 3.9 | — | — | — | 10.6 | ||||||||||||||||||||||||||||||||||||||||||||
2011 | 1.9 | 3.1 | 1.7 | 5.6 | — | — | — | 12.3 | ||||||||||||||||||||||||||||||||||||||||||||
2012 | 1.7 | 3.2 | 2.3 | 7.2 | 1.8 | 2.0 | — | 18.2 | ||||||||||||||||||||||||||||||||||||||||||||
Cumulative raw coal production as of December 31, 2012 | 11.1 | 8.6 | 6.7 | 16.7 | 1.8 | 2.0 | — | 46.9 | ||||||||||||||||||||||||||||||||||||||||||||
Assigned/unassigned (5) Average calorific value (Kcal/kg) Sulfur content (%) Production data:(million tonnes) Designed raw coal production capacity Designed coal preparation input washing capacity Raw coal production 2006 2007 2008 2009 2010 Cumulative raw coal production as of December 31, 2010 assigned assigned assigned assigned assigned unassigned unassigned unassigned N/A 6,196 7,300 6,500 7,100 6,650 N/A N/A N/A N/A 1.30 0.70 0.60 0.65 0.50 N/A N/A N/A N/A 3.6 3.2 2.8 5.2 16.0 N/A N/A N/A 30.6 3.3 2.4 N/A 6.5 16.0 N/A N/A N/A 28.2 0.4 — — — — — — — 0.4 1.6 — — — — — — — 1.6 1.9 — — — — — — — 1.9 1.9 — — — — — — — 1.9 1.7 2.3 1.4 2.7 3.9 — — — 12.0 7.5 2.3 1.4 2.7 3.9 — — — 17.8
| (1) | The Austar Coal Mine was closed in 2003 as the result of an underground fire. We acquired Austar Coal Mine in 2004 and implemented a production expansion and technology upgrade in 2005. Austar Coal Mine resumed part |
| (2) | The coalfield area refers to the area of current leased land for mining, excluding the area on which we own |
| (3) |
| (4) | Ashton Coal Mine |
| (5) | “Assigned” |
| (6) | As Middlemount Coal Mine is owned and operated by a joint venture jointly controlled by Yancoal Australia and a third party, its production data and financial performance will not be consolidated in to our reports. |
Austar Coal Mine.Mine
Austar Coal Mine is an underground mine located in Hunter Valley, New South Wales, Australia and is accessible by railway. Austar Coal Mine covers an area of 63.0 square kilometers. Austar Coal Mine was constructed in 1998 and commenced commercial production in 2000.
In 2003, an underground fire occurred at Austar Coal Mine when it was still owned by Southland Coal Pty Limited, resulting in the closure of the mine. On December 24, 2004, we acquired the entire interest in the Austar Coal Mine for approximately A$32.0 million from Southland Coal Pty Limited, an independent third party.
We After we invested approximately A$230.3 million in the reconstruction, capacity expansion and technology upgrade of Austar Coal Mine in 2005, which included funding for equipment and machinery. After we completed the foregoing investment in Austar Coal Mine,machinery, the mine resumed commercial production of semi-hard coking coal in October 2006.
Austar Coal Mine produces semi-hard coking coal. The average thickness of the main coal seam of Austar Coal Mine is 5.306.5 meters. As of December 31, 2010,2012, the mine’s total recoverableJORC-compliant reserves were approximately 50.949.7 million tonnes. As of the same date, the mine’s marketable coal reserves, representing beneficiated or otherwise enhanced coal products where modifications resulting from mining, dilution and processing have been considered, were approximately 39.6 million tonnes.
We principally use the fully-mechanizedfully mechanized longwall top coal caving mining method to extract coal from one work-face.
the underground mine. The main equipment used in Austar Coal Mine is the heavy-medium cyclone machine. These heavy-medium cyclone machines arecoal handling preparation plant consists of coal crushing equipment, cyclones and other associated equipment which were generally manufactured in Australia.
We have not contracted the mining operations at Austar to a third-party mining contractor. The operations at Austar Coal Mine are powered by electricity from local power grids. We ship thetransport coal products from the Austar Coal Mine to Newcastle Port via railway.
Yarrabee Coal Mine.Mine
Yarrabee Coal Mine is an open pitopen-pit mine located in Bowen Basin, Queensland, Australia and is accessible by railway.railway to the Gladstone Port. Yarrabee Coal Mine covers an area of 62.7 square kilometers. The construction of Yarrabee Coal Mine started in 1981 and it commenced commercial production commenced in 1982.
FelixThrough Yancoal Resources, Yancoal Australia wholly owns Yarrabee Coal Mine. Currently, the designed annual capacity of Yarrabee Coal Mine is approximately 3.2 million tonnes. Yarrabee Coal Mine mainly produces PCI. low volatility PCI coal.
The average thickness of the main coal seam of Yarrabee Coal Mine isranges from 3.2 to 4 meters. As of December 31, 2010,2012, the mine’s total recoverableJORC-compliant reserves were approximately 60.2961.4 million tonnes. As of the same date, the mine’s marketable coal reserves were approximately 49.4 million tonnes. We use shearersutilize conventional truck shovel and open-pit mining methods to conduct surface miningextract coal at Yarrabee Coal Mines.Mine.
Yarrabee Coal Mine has a coal preparation plant. The main pieces of equipment used in the coal preparation plant are heavy-mediumheavy medium cyclone machines and floating separation machines, which arewere generally manufactured in Australia.
We have not contracted the mining operations at Yarrabee Coal Mine to third-party mining contractors. The operations at Yarrabee Coal Mine are powered by electricity from local power grids. We ship thetransport coal products from the Yarrabee Coal Mine to Gladstone Port via railway.
Minerva Coal Mine.Minerva Coal Mine is an open pit mine located in Bowen Basin, Queensland, Australia and is accessible by railway. Minerva Coal Mine covers an area of approximately 15.6 square kilometers. The construction of Minerva Coal Mine started in 2004 and it commenced commercial production in 2005.
Felix holds 51% of the equity interests in Minerva Coal Mine through Proserpina Coal Pty Ltd. The designed annual capacity of Minerva Coal Mine is 2.8 million tonnes. Minerva Coal Mine mainly produces thermal coal. The average thickness of the main coal seam of Minerva Coal Mine is 0.6 to 3.2 meters. As of December 31, 2010, the mine’s total recoverable reserves were approximately 23.6 million tonnes. Pursuant to approval granted at the seventeenth meeting of the fourth session of the Board held on December 30, 2010, we disposed of 51% of the equity interests in Minerva Coal Mine Joint Venture. As of the date of the annual report, we no longer held any interest in Minerva Coal Mine.
Ashton Coal Mine.Mine
Ashton Coal Mine has bothconsists of an underground mine and an open pitopen-pit mine located in Hunter Valley, New South Wales, Australia and is accessible by railway.railway to Newcastle Port. Ashton Coal Mine covers an area of approximately 19.2 square kilometers. The construction of the open-pit and underground mines of Ashton Coal Mine started in 2003 and their commercial production commenced in 2004.
Pursuant to approval granted at the seventeenth meeting of the fourth session of the Board held on December 30, 2010, we commenced the process of acquiring 30% of the equity interests in the Ashton Coal Mine Joint Venture originally held by Austral-Asia Coal Holdings Pty Ltd, a wholly-owned subsidiary of Singapore IMC Group, for a consideration of US$250 million. Upon completion of this acquisition in May 2011, our equity interests in the Ashton Coal Mine Joint Venture increased to 90% from 60%. The designed annual capacity of Ashton Coal Mine is approximately 5.2 million tonnes.tonnes of coal. Ashton Coal Mine mainly produces semi-soft coking coal.
The average thickness of the main coal seamseams of the open-pit mine and the underground mine of Ashton Coal Mine areranges from 2.14 to 2.26 meters and 1.7 to 2.4 meters, respectively. As of December 31, 2010,2012, the mine’s total recoverableJORC-compliant reserves were approximately 60.874.0 million tonnes. As of the same date, the mine’s marketable coal reserves were approximately 44.5 million tonnes, according to our internal estimates. We principally use the longwall operationoperations to extract coal from the underground coal seam and shearers to conduct surfaceuse conventional truck shovel mining methods at the open-pit mine of Ashton Coal Mine.
The main pieces of equipment used in the coal preparation plant of Ashton Coal Mine are heavy-medium cyclone machines and floating separation machines, which arewere generally manufactured in Australia. We have not contracted the mining operations at Ashton Coal Mine to a third-party mining contractor. The operations at Ashton Coal Mine are powered by electricity from local power grids. We ship thetransport coal products from the Ashton Coal Mine to Newcastle Port via railway.
Moolarben Coal Mine.Mine
Moolarben Coal Mine has bothconsists of an undergroundopen-pit mine and an open pit mineunderground development project and is located near Mudgee in Hunter Valley,central western New South Wales, Australia andWales. It is accessibleconnected by railway.railway to Newcastle Port. Moolarben Coal Mine covers an area of 17.4 square kilometers. TheConstruction of the open-pit mine of Moolarben Coal Mine was constructedcommenced in 2009 and commencedwith commercial production starting in May 2010, while themid-2010. The construction of the underground mine at Moolarben is expected to commence in the second half of Moolarben Coal Mine will be completed in 2012 and commence commercial production in 2013.
FelixYancoal Australia holds 80% of the equity interest in Moolarben Coal Mine through its subsidiary, Moolarben Coal Mines Pty Limited. The designed annual capacity of Moolarben Coal Mine is 16.0approximately 17.0 million tonnes, of which the annual capacity of the underground mine is expected to be approximately 4.0 million tonnes and the annual capacity of the open-pit mine is 12.0approximately 13.0 million tonnes. Moolarben Coal Mine mainly produces thermal coal.
The average thickness of the main coal seam of the open-pit mine of Moolarben Coal Mine is 5.5 to 11.66 meters. As of December 31, 2010,2012, the mine’s total recoverableJORC-compliant reserves were approximately 351.7300.9 million tonnes. As of the same date, the mine’s marketable coal reserves were approximately 225.0 million tonnes. We principally use conventional truck shovel mining methods in the open-pit mine and expect to use longwall operationmachines to extract coal fromin the underground coal seam and shearers to conduct surface mining at the open-pit mine of Moolarben Coal Mine.project.
Moolarben Coal Mine has a coal preparation plant. The main pieces of equipment used in the coalhandling preparation plant are heavy-medium cyclone machineswith a capacity of approximately 1,800 TPH, and floating separation machines,utilizes conventional equipment including medium-heavy cyclones and flotation cells which are primarily manufactured in Australia.
We have not contracted the mining operations at Moolarben Coal Mine to a third-party mining contractor. The operations at Moolarben Coal Mine are powered by electricity from local power grids. We ship thetransport thermal coal products from the Moolarben Coal Mine to Newcastle Port via railway.
Gloucester Coal Mine
Gloucester Coal Mine is located in Gloucester basin in New South Wales, Australia and covers an area of 20.5 square kilometres. Gloucester Coal Mine is approximately 100 kilometers away from Newcastle Port. The construction of Gloucester Coal Mine started in 1998 and commercial production commenced in 1999.
Gloucester Coal Mine consists of two open-pit mines, Duralie and Stratford, which has an aggregate annual designed production capacity of 3.8 million tonnes and an aggregate annual designed preparation capacity of 3.8 million tonnes. As of December 31, 2012, Gloucester Coal Mine’s JORC-compliant reserves were approximately 69.4 million tonnes. As of the same date, the mine’s marketable coal reserves were approximately 40.0 million tonnes.
Duralie open-pit mine and Stratford open-pit mine own one coal preparation plan with an annual designed preparation capacity of 1.8 million tonnes, which was increased to 4.3 million tonnes in June 2011. We transport our coal products from Gloucester Coal Mine via railway.
Donaldson Coal Mine
Donaldson Coal Mine is located in Newcastle coal field in New South Wales, Australia and covers an area of 42.3 square kilometres. Donaldson Coal Mine is approximately 25 kilometers away from Newcastle Port. The construction of Donaldson Coal Mine started in 2001 and commercial production commenced in the same year.
Donaldson Coal Mine consists of one open-pit coal mine, Donaldson open-pit mine and two underground coal mines, Abel and Tasman underground mines, which has an aggregate annual designed production capacity of 3.0 million tonnes. As of December 31, 2012, Donaldson Coal Mine’s JORC-compliant reserves were approximately 148.3 million tonnes. As of the same date, the mine’s marketable coal reserves were approximately 90.5 million tonnes.
Our coal products at Donaldson Coal Mine are prepared by a coal preparation plant owned and operated by a third party with coal preparation capacity of 3.0 million tonnes per year. We transport our coal products from Donaldson Coal Mine via railway.
Middlemount Coal Mine
Middlemount Coal Mine is located at Bowen Basin in Queensland, Australia and covers an area of 27.7 square kilometres. The mine is approximately 300 kilometres away from Abbot Point port. The construction of Middlemount Coal Mine started in 2009 and commercial production commenced in 2011. Through Yancoal Australia, we own approximately 50% of the equity interest in the joint venture owns and operates Middlemount Coal Mine.
As of December 31, 2012, Middlemount Coal Mine’s JORC-compliant reserves were approximately 96 million tonnes. As of the same date, the mine’s marketable coal reserves were approximately 69.1 million tonnes. The mine has an annual designed production capacity of 5.4 million tonnes. We use conventional open-pit mining methods to extract coal at Middlemount open-pit mine Middlemount Coal Mine primarily produces coking coal and PCI coal. Middlemount Coal Mine has a coal preparation plant with an annual capacity of 5.25 million tonnes. The main pieces of equipment used in the coal preparation plant are screw machines with flotation devices. We transport our coal products from Middlemount Coal Mine via railway.
Coal Mines operated by Yancoal International
The following table sets forth information about our operational coal mines in Australia, which are directly or indirectly held by Yancoal International (Holding):
| Cameby Downs | Premier | Total | ||||
Background data: | ||||||
Commencement of construction | 2009 | 1996 | N/A | |||
Commencement of commercial production | 2010 | 1996 | N/A | |||
Coalfield area(1)(square kilometers) | 27.2 | 141.8 | 169.0 | |||
Reserve data: (millions of tonnes as of December 31, 2012) | ||||||
Recoverable reserves(2) | 434.0 | 156.2 | 590.2 | |||
Depth of mine(meters underground) | N/A | N/A | N/A | |||
Type of coal | thermal coal | thermal coal | N/A | |||
Leased/owned | owned | owned | N/A | |||
Assigned/unassigned(3) | assigned | assigned | N/A | |||
Average calorific value (Kcal/kg) | 6000 | 4776 | N/A | |||
Sulfur content (%) | 0.47 | 0.6 | N/A | |||
Production data:(million tonnes) | ||||||
Designed raw coal production capacity | 1.80 | 5.0 | 6.8 | |||
Designed coal preparation input washing capacity | 1.8 | N/A | 1.8 | |||
Raw coal production | ||||||
2011 | 0.8 | — | 0.8 | |||
2012 | 1.9 | 4.2 | 6.1 | |||
Cumulative raw coal production as of December 31, 2012 | 2.7 | 4.2 | 6.9 | |||
| (1) | The coalfield area refers to the area of current leased land for mining, excluding the area on which we own prospecting rights. The coalfield area of Harry-Brandt refers to the area on which we own prospecting rights. |
| (2) | The recoverable reserves of the above coal mines are based on the report prepared by the competent persons appointed by Yancoal Australia or Yancoal Resources and other companies which have been acquired by Yancoal Australia and such reserves refer to total proved and probable reserves that were prepared in accordance with the standards in the JORC Code. |
| (3) | “Assigned” refers to coal reserves which have been committed to a particular mining complex (mine shafts, mining equipment and plant facilities), and all coal which has been leased by the company to others. “Unassigned” refers to coal reserves which have not been committed, and which would require new mine shafts, mining equipment, or plant facilities before operations could begin on the property. |
Cameby Downs Coal Mine
Cameby Downs Coal Mine consists of an open-pit mine located near Chinchilla in Southwest Queensland. The mine covers an area of approximately 27.2 square kilometers. The construction of the mine commenced in 2009 and commercial production started in late 2010. Yancoal Australia owns 100% of Cameby Downs Coal Mine. Cameby Downs Mine produces thermal coal and the average thickness of Cameby Downs Coal Mine was 4 meters. As of December 31, 2012, Cameby Downs Coal Mine had JORC-compliant reserves of approximately 434.0 million tonnes. As of the same date, the mine’s marketable coal reserves were approximately 277.0 million tonnes.
The phase one stage of Cameby Downs Coal Mine has raw coal annual production capacity of 1.8 million tonnes and product capacity of approximately 1.4 million tonnes product coal. We intend to increase annual raw coal annual production capacity to approximately 16 million tonnes and annual commercial coal production capacity to approximately 11.4 million tonnes subject to positive feasibility studies and obtaining port allocation through the construction of the phase II at Cameby Downs Coal Mine in the future.
Cameby Downs Coal Mine has a coal handling preparation plant with an annual capacity of approximately 220 TPH, and utilizes medium-heavy cyclones and flotation cells which are primarily manufactured in Australia. The operations at the mine are powered by electricity from the local power grid. We transport coal products from Cameby Downs Coal Mine to Brisbane Port via railway.
Premier Coal Mine
Premier Coal Mine, located in Perth, is an open-pit coal mine covering an area of approximately 141.8 square kilometers. The construction of the mine began in 1996 and commercial production commenced in the same year. Yancoal International (Holding) indirectly wholly owns Premier Coal Mine. The annual production capacity of Premier Coal Mine is approximately 5.0 million tonnes. Premier Coal Mine primarily produces low ash and low sulfur sub-bituminous coal. As of December 31, 2012, Premier Coal Mine had JORC-compliant reserves of approximately 1.562 million tonnes. We utilize conventional truck shovel open-pit mining methods to mine the coal from a number of seams at the mine. The coal mined at Premier Coal Mine is crushed and sold without washing. As a result, the mine’s marketable coal were approximately 156.2 million tonnes as of December 31, 2012, the same amount as its JORC-compliant reserves.
The operations at Premier Coal Mine are powered by electricity from local power grids. We entered into a long-term coal sales agreement with Verve Energy, a power generator owned by the Western Australian Government. We transport coal products from Premier Coal Mine by conveyors to power stations and by railway to other customers in Australia.
Mining and Exploration Rights
Mining Rights for Nantun, Xinglongzhuang, Baodian, Dongtan and Jining II
According to the approvalapprovals from the State-owned Asset Supervision Department and the Coal Industry Supervision Department that was obtained at the establishment of the Company, and the Mining Agreement entered into withbetween the Yankuang Group and us in 1997 and its supplemental agreement, we undertook to make ten annual payments of approximately RMB13.0 million to the Yankuang Group beginningcommencing in 1997, as compensation for the depletion of the coal resources at the coal mines at Nantun, Xinglongzhuang, Baodian, Dongtan and Jining II. IfII coal mines. We fulfilled this obligation in 2007 after we made the State implements new regulations after the initial ten years, the compensation would be adjusted accordingly. By 2007,final installment payment and we had made total payments of RMB130.0 million.are not obligated to make further payment under this arrangement.
In September 2006, the State Council approved theImplementation Plan for the Compensation System Reform Testing in relationRelation to Deepening Coal Resources as, jointly promulgated by the Ministry of Finance Department,of the PRC, Ministry of Land and Resources of the PRC and the NDRC.NDRC (the “Implementation Plan”). According to the implementation plan,Implementation Plan, enterprises that obtain mining rights as a result of state-funded exploration must pay mining right fees based on the valuation of the remainingits reserves. Our operations in Shandong Province isare subject to this mining right fee. AsOn August 3, 2012, Jining Municipal Land and Resources Bureau issued the Notice of the date of this annual report, there remains uncertainty on the detailed rules of the implementation plan regarding the use ofpayment for mining rights in Shandong Province. Since 2008,by Yanzhou Coal Mining Company Limited [JiGuotuzi(2012) No. 212], pursuant to which we have made provisionsare required to pay a consideration of RMB5.0 per tonne of coal extracted to cover any resource compensation fees that may arise fromRMB2,476.78 million for the mining rights of the five foregoingNantun, Xinglongzhuang, Baodian, Dongtan and Jining II coal mines, in anticipationRMB495.4 million of which was paid before the due date of September 30, 2012. The consideration was determined based on the assessment report for the consideration of mining rights of these five coal mines issued by independent third parties appointed by Jining Municipal Land and Resources Bureau and filed with Shandong Province’s implementationProvincial Department of detailed rules for resource compensation fees.Land and Resources. For the year ended December 31, 2010, our provisions for resource2012, we paid mining rights compensation fees for the five mines wereof approximately RMB140.7RMB495.4 million. We are required to pay an additional RMB396.3 million in 2013.
Jining III Coal Mine
Pursuant to the Jining III Coal Mine Acquisition Agreement dated August 4, 2000 that we entered into with the Yankuang Group, the consideration for the mining right of Jining III Coal Mine iswas approximately RMB132.5 million, which willwas to be paid to the Yankuang Group in ten equal interest-free annual installments commencing fromin 2001. During 2010, weWe fully paid RMB13.2 million to Yankuang Group. As of December 31, 2010, we had paid an aggregate of RMB132.5 million in fullthe consideration for the mining rights of Jining III Coal Mine.Mine in 2010.
Austar Coal Mine
We obtained an exploration license for Austar Coal Mine from the NSWNew South Wales Department of Primary Industries in 2005. Pursuant to the underlying Asset Sale Agreement, we are obligatedpaid A$32.0 million to pay A$4.0 millionthe receivers of Gympie Gold for the mine after obtainingwe obtained the exploration license to the new exploration site adjacent to the Austar Coal Mine.Mine in 2006.
Tianchi Coal Mine
We acquired Shanxi Nenghua for RMB748.3 million, of which RMB136.6 million was consideration for the mining rightrights of Tianchi Coal Mine.
Zhaolou Coal Mine
We purchased the mining rights of Zhaolou Coal Mine for a consideration of RMB747.3 million in 2008.
Anyuan Coal MinesMine
We acquired the entire equity interest in Anyuan Coal MinesMine for thea consideration of approximately RMB143.5 million upon approval at the general manager working meeting held onin November 12, 2010. The evaluationfair market value of the mining rightrights for Anyuan Coal Mine iswas approximately RMB131.3 million.
Zhuan Longwanmillion as of October 31, 2010. As of the date of this annual report, we were in the process of obtaining of the approval, permit and registration of the acquisition of Anyuan Coal Mine, Field
Pursuantand have confirmed with the relevant mining authorities that our approval, permit and registration of Anyuan Coal Mine is pending regulatory review. Despite the outstanding approvals and lack of mining license, we have received confirmation from the relevant mining authorities to approval grantedcontinue our coal mining operations at the nineteenth meetingAnyuan Coal Mine. Until we receive such approvals, we are prohibited from transferring or disposing of this mine. As of the fourth sessiondate of this annual report, we are not aware of any pending administrative action, fines or penalties for the Board held on January 28,continued operation of Anyuan Coal Mine.
Wenyu Coal Mine
In July 2011, Ordos Neng Hua successfullyacquired 80% of the equity interest in Inner Mongolia Xintai, which operates Wenyu Coal Mine, for a consideration of RMB2,801.6 million.
Zhuanlongwan Coalfield
Ordos Neng Hua won the bid for the mining rights of Zhuan Longwan coal mine fieldZhuanlongwan coalfield of Dongsheng Coal Field in Inner Mongolia Autonomous Region for a consideration of RMB7,800 million.RMB7,878.7 million on January 28, 2011. As of the date of this annual report, Ordos Neng Hua had paid the first installmenttotal consideration of RMB3,120RMB5,538.7 million (representing 40%and had RMB2,340.0 million pending. We obtained the approval from NDRC for the preliminary work of Zhuanlongwan Project in March 2013, and the approval, production permit and registration of the total consideration) on February 25, 2011. Ordos Neng Hua is obligatedmining rights to payZhuanlongwan Project are still in progress.
Yangcun and Beisu Coal Mine
We acquired the second installmententire assets of RMB2,340 million (representing 30%Beisu and Yangcun Coal Mines from Yancoal Group and Beisu Company in 2012 for a consideration of RMB824.1 million. According to an evaluation report issued by an independent evaluator, the fair market value of the total consideration) in fullmining rights of Beisu Coal Mine and Yangcun Coal Mine was RMB139.5 million and RMB343.2 million as of August 31, 2011.
Coal Mines Owned by November 30, 2011 and the third installment of RMB2,340 million (representing 30% of the total consideration) in full by November 30, 2012.
Felix Coal MinesYancoal Resources
We acquired the entire equity interest in Felix, a wholly owned subsidiary of Yancoal Australia, for A$3,333 million in 2009. The fair market value of our attributable reserves and attributable resources was A$2,845.2 million.million as of December 23, 2009. The acquisition included all mining rights to the coal mines owned by Felix (now Yancoal Resources), environment protection licenses, exploration licenses and mining leases.
Pursuant to approval granted at the seventeenth meetingYancoal Resources sold 51% of the fourth session of the Board held on December 30, 2010, Felix, a wholly-owned subsidiary of Yancoal Australia sold its 51% equity interestsinterest in Minerva Coal Mine Joint Venture to Sojitz Coal Resources Pty Ltd, an independent third party.party on December 30, 2010. The value of the 51% equity interest in this join venture issold by Yancoal Resources was estimated to be between approximately A$188.0 million to A$201.0 million, according to an evaluation report issued by an independent evaluator dated September 9, 2010.
In 2011, through Yancoal Resources, Yancoal Australia acquired 30% of the equity interest in the Ashton Coal Mine Joint Venture originally held by Austral-Asia Coal Holdings Pty Ltd., a wholly owned subsidiary of Singapore IMC Group, for a consideration of US$250 million. According to an evaluation report issued by an independent evaluator dated January 20, 2012, 30% of the equity interest Ashton Coal Mine Joint Venture was valued at approximately A$230.0 million. The remaining 10% interest is held by ICRA Ashton Pty Ltd., a wholly owned subsidiary of Itochu Coal Resources Australia Pty Ltd.
Cameby Downs Coal Mine
We acquired Cameby Downs Coal Mine and Syntech’s exploration tenements through the acquisition of the entire equity interest in Syntech Resources Pty Ltd. and Syntech Holdings II Pty Ltd., for a consideration of A$208.4 million on August 1, 2011. In addition to the Cameby Downs Coal Mine, Syntech Resources Pty Ltd. and Syntech Holdings II Pty Ltd. also have five exploration tenements that might be potentially developed. According to an evaluation report issued by an independent evaluator dated February 14, 2012, the fair market value of the reserves, resources and mining rights of the five exploration tenements was A$65.8 million as of August 1, 2011. Currently, the Syntech project is the phase I of Cameby Downs Coal Mine operation.
Premier Coal Mine and Wilga Exploration Area
We acquired the Premier Coal Mine and the Wilga Exploration Area through the acquisition of Premier Coal Limited (then called Wesfarmers Premier Coal Limited) and Premier Char Ltd. (then called Wesfarmers Char Pty Ltd.), for a consideration of A$313.5 million in September 2011. The fair market value of the reserves, resources and mining rights of the coal mines owned by Premier Coal Limited was A$49.9 million as of December 31, 2011, according to an evaluation report issued by an independent evaluator.
Coal Mines Owned by Gloucester
Yancoal Australia completed its merger with Gloucester in June 2012. According to an evaluation report issued by an independent evaluator, the fair market value of the reserves, resources and mining rights of the coal mines owned by Gloucester was A$1,216.9 million as of June 30, 2012.
Potash Mineral Exploration Permits in Canada
We acquired 11 potash mineral exploration permits from Devonian Potash Inc. and eight potash mineral exploration permits from North Atlantic Potash Inc. for a total consideration of US$260 million in September 2011. The 19 potash mineral exploration permits cover an aggregate area of approximately 5,363.84 square kilometers in Saskatchewan, Canada. According to the preliminary exploration report, we expect that the permitted area may have abundant potash resources. We intend to conduct further in-depth exploration work to produce formal estimates of potash resources in compliance with internationally recognized reporting standards.
Railway Assets
The assets in ourWe own and operate a railway transportation business consist of 13 diesel locomotives, 18 steam locomotives, 362 rail cars, and approximately 204 kilometers of railway tracks constructed for coal transportationnetwork that connect most ofconnects our coal mines with Yankuang Groupin Shandong to the national railway system and Zouxian Power Plant which is located in Jining City Shandong Province. Theof Shandong. As of the date of this annual report, our railway network also connects twospans a total length of approximately 204 kilometers. Our railway network provides us with substantial control over a major national railways, namely,means of transportation for our key product, allowing us to benefit from the Beijing-Shanghai Railwaysynergies from coal production, sales and Yanzhou-Shijiugang Railway. As of December 31, 2010, our railway transportation business had approximately 3,838 employees.transportation.
Methanol and Cogeneration Power Plants
Yulin Nenghua. Yulin Nenghua, located in Yunlin City of Shanxi, Province, is primarily responsible for the operation ofoperates a 600,000-tonne methanol plant and a supporting power plant with an installed capacity of 60 megawatts.plant. The primary pieces of equipment at the methanol plant include boilers, steam turbines, air compressors and booster set, GEA air-cooler exchangers, gasifiers and gasification compressors, synthetic compressors, a methanol synthetic gas coldgas-cooled reactor, a methanol synthetic water coldwater-cooled reactor and propylene refrigeration compressors. Yulin Nenghua also operates a supporting power plant with an installed capacity of 60 MW for its methanol production.
Tianhao Chemicals. Tianhao Chemicals, located in Xiaoyi City of Shanxi, Province, is primarily responsible for the operation ofoperates a 100,000-tonne methanol plant and a supporting power plant. The primary pieces of equipment inat the methanol plant include low pressure wet type spiral gas cabinets, coke oven gas compressors, reformers and converters. At the 2012 first extraordinary general meeting of Tianhao Chemicals, the shareholders approved public sale of the methanol assets. According to Shandong Zhongxin Assets Appraisal Co., Ltd., the valuation of Tianhao Chemicals’ assets was RMB268 million as of April 30, 2012. The transaction is currently under the selling procedure on the Shandong Property Right Exchange Center. Tianhao Chemicals also operates a supporting power plant with an installed capacity of 24 MW for its methanol production.
Hua Ju Energy. Hua Ju Energy is headquartered in Zoucheng City, Shandong Province.Shandong. Hua Ju Energy owns and operates six cogeneration power plants, each of which is able to supply electric power and heat to our coal minemines in its proximity. The power plants consist of the Nantun power plant, Xinglongzhuang power plant, Baodian power plant, Dongtan power plant, Jining II power plant and Jidongxincun power plant. The aggregate installed capacity of these six power plants is 144 megawattsMW and the annual power generation capacity and heat supply capacity are 1.0 to 1.1 billion kilowatt-hoursKWh and 1.0 to 1.2 million steam tonnes, respectively. The main pieces of equipment used at Hua Ju Energy includesinclude energy conversion CFB boilers and extraction and condensing steam turbines.
Zhaolou Coal Mine Power Plants.Plants.Zhaolou Coal Mine power plants are theintended to be integrated power plants for Heze Nenghua Zhaolou Coal Mine, located in Heze cityCity of Shandong Province.Shandong. The power plants haveare being constructed in two phases with designed capacity of 300,000 kWh300 MW for each phase. We commenced construction of phase I of the power plants in March 2010, which utilize a power generator of 300,000 kWh300 MW and a circulating fluidized bedfluidized-bed boiler with capacity of 1,025 tonnes per hour.hour in March 2010. The main pieces of equipment used at Zhaolou Coal Mine power plants include extraction and condensing steam turbines, water hydrogen generators and CFB boilers.
| ITEM 4A. | UNRESOLVED STAFF COMMENTS |
There are no unresolved staff comments from the Securities and Exchange Commission.
| ITEM 5. | OPERATING AND FINANCIAL REVIEW AND PROSPECTS |
The following discussion and analysis should be read in conjunction with the information set forth in our consolidated financial statements, together with the related notes, included in this annual report.
| A. | Operating Results |
During the period covered by this annual report, our five business segments consist of:of our:
coal business;
railway transportation business;
coal chemical business;
electric power business; and
heat supply business.
Overview
Coal Business
We are one of the primary coal producers in China and Australia. We primarily engagedengage in the productionmining, washing, processing and distribution of coal which involves the mining, preparation and processingthrough railway transportation. We offer a wide variety of coal. Historically, our coal operations were primarily based in the PRC, but we have rapidly expanded our Australian coal operations since the fourth quarter of 2009. Our high quality coal products primarily include steamincluding thermal coal, semi-hard coking coal, semi-soft coking coal, PCI coal and mixed coal products which is used by power plants, and coking and pulverized coal, which is used at metallurgical mills for blast furnace injections. Our domestic customers are predominatelysold to power plants, metallurgical mills, and chemical manufacturers locatedand fuel trading companies in the economically more developed region of Eastern China. We also export a portion of our coal from our Australian operations to international customers located inChina and multiple other countries, including Japan, South Korea and other countries.
In 2010,Australia. Since 2004, we produced approximately 49.4 million tonnes of raw coal and sold approximately 49.6 million tonneshave expanded our operations to include railway transportation, production of coal which included approximately 5.4 millions tonneschemicals, the generation of coal that was purchased externally from third parties for trading. In 2008, 2009electricity and 2010, our sales income of coal was approximately RMB24,933.3 million, RMB19,947.7 millionheat and RMB32,590.9 million, respectively, representing approximately 98.6%, 96.5% and 96.0% respectively of our total sales income. Domestic sales income of coal (excluding coal purchased externally) accounted for 83.8%, 85.9% and 66.9% and overseas sales income of coal conducted by Yancoal Australia or through export agents in China accounted for 7.3%, 6.0%, and 18.3% of our total sales income of coal during 2008, 2009 and 2010, respectively. In 2010, our inter-segment coal sales amounted to RMB339.4 million, which primarily consisted of sales to our power plants. For more information on our segment revenues, inter-segment eliminations and segment balance sheet items, see Note 6 to our financial statements.the potash exploration business.
Our invoiced amount of coal sold includes returns, discounts, sales relatedsales-related taxes, port fees and other fees and, in certain cases, transportation costs payable by customers. Gross sales, or sales income as used elsewhere in this annual report, of coal equals the invoiced amount of coal sold less returns and discounts. Sales taxesIn 2012, we produced approximately 67.8 million tonnes of raw coal and other fees consist primarilysold approximately 94.1 million tonnes of business tax paid at 5%coal, which included approximately 32.2 million tonnes of our revenuecoal that was purchased externally from third parties for trading. In 2010, 2011 and city construction tax and education surcharge calculated at 7% and 3%, respectively, on the total amount of our VAT payable and business tax payable. We also pay a local resource tax based on our coal consumption at the rate of RMB3.6 per tonne in Shandong Province and RMB3.2 per tonne in Shanxi Province to the local tax bureau. For more information on2012 our sales income of coal see Note 7 towas approximately RMB32,590.9 million, RMB45,181.2 million and RMB56,200.6 million, respectively, which represented approximately 96.0%, 96.0% and 96.7%, respectively, of our financial statements.total sales income. Domestic sales income of coal accounted for 83.9%, 80.7% and 82.9% and overseas sales income of coal accounted for 16.1%, 19.3% and 17.1% of our total sales income of coal during 2010, 2011 and 2012, respectively.
Railway Transportation Business
We own a railway network spanning over 200 kilometers, which we use primarily to transport coal, as well as other goods upon the request of our railway transportation customers. To facilitate our production and sales of coal, we provide railway transportation services to our coal customers and the Yankuang Group. The annual transport volume on our railway network has remained steady in recent years. In 2010,2012, we transported a total of approximately 19.717.5 million tonnes of goods on our railway network, compared to approximately 19.918.1 million tonnes in 20092011 and approximately 19.219.7 million tonnes in 2008.2010.
We derive income from our railway transportation services income fromthrough the delivery of (i) coal purchased from us on an ex-mine basis, an arrangement where customers separately bear the cost of transporting the coal they purchase to a designated location, and (ii) goods other than coal that we deliver on behalf of customers who engage us exclusively for our railway transportation services. In 2010,2012, income from our railway transportation services totaled approximately RMB513.3 million, of which inter-segment sales to our coal mining segment amounted to approximately RMB36.1RMB464.1 million.
Coal Chemical Business
Our coal chemical operations consist primarily of the production and sale of methanol. Prior to April 2012, we had two subsidiaries engaged in methanol operations: Yulin Nenghua and Shanxi Nenghua. Shanxi Nenghua ceased production in April 2012 due to a shortage in supply of raw materials. Yulin Nenghua’s 600,000-tonne methanol plant, which has a production capacity of 600,000 tonnes per annum, commenced commercial operations in August 2009. In 2010, Yulin Nenghua produced 311,000 tonnes and sold 319,000 tonnes of methanol including(including inventory from the prior year,year), generating sales income1 of approximately RMB523.5 million.
Production at In 2011, Yulin Nenghua and Shanxi Nenghua (through its wholly owned subsidiary Tianhao Chemicals’ 100,000-tonne methanol plant was adversely affected by the insufficient supplyChemicals) produced a total of coke oven waste gas, a key raw material that is supplied via transmission pipelines connected to the plant by its exclusive third-party supplier, which continued up to the date of the annual report. In 2010, Tianhao Chemicals produced 56,000approximately 532,000 tonnes and sold 57,000529,000 tonnes of methanol, including inventory from the prior year, generating sales income of RMB105.8approximately RMB1,059.3 million. In 2012, Yulin Nenghua and Shanxi Nenghua produced a total of approximately 572,000 tonnes and sold 574,000 tonnes of methanol, generating sales income of approximately RMB1,118.0 million. In addition, Ordos Neng Hua is constructing a 600,000-tonne methanol project in Ordos City in the Inner Mongolia Autonomous Region which will have a production capacity of 600,000 tonnes per annum, which we expect to become operational in the second half of 2013.
Electric Power Business
We own and operate eightseven power plants, with total net installed capacity of 218 MW, which generate electric power primarily for internal use and, to a lesser extent, external sales. The six cogeneration power plants operated by Hua Ju Energy are able to generate both electric power and heat. In 2010, Hua Ju Energy, Yulin Nenghua andWe ceased production at the power plant operated by Shanxi Nenghua on January 1, 2012 due to high fuel costs. We are in the process of disposing this power plant together with Tianhao Chemical’s methanol assets. In 2012, we generated a total of approximately 1,369.81,155.2 million kWh of electricity of which,and sold approximately 526.6856.4 million kWh was sold externally. In 2010, our electric power business generatedof electricity, generating approximately RMB185.5RMB323.6 million in revenue.
Heat Supply Business
In 2010, Hua Ju Energy2012, we produced approximately 1.271.4 million steam tonnes of heat of which weand sold approximately 0.19230,000 steam tonnes of heat, generating sales revenue of RMB25.2approximately RMB39.9 million.
Factors Affecting Our Results of Operations
Our results of operations and financial condition are affected by a number of factors, many of which are beyond our control, including those set forth below:
Conditions and regulations affecting the coal mining industry
Our coal mining operations in the PRC are subject to various PRC laws and regulations, including developmental, environmental and health and safety laws and regulations, and various national and local policies, which could facilitate our acquisition activities and the overall growth of our business and operations, industry consolidation could result in larger coal mining enterprises that compete against us.
Our mining operations in Australia are regulated by Australian federal and state governments with respect to environmental issues such as water quality, air quality, dust impact, noise impact, planning issues (such as approvals to expand existing mines, develop new mines or change mining methods), and health and safety issues. Future changes to, and our continuing compliance with, these regulations may have a material effect on our business and results of operations. See “Item 3. Key Information — D. Risk Factors — Risks Relating to Our Business and Industry – Our coal operations are extensively regulated by the PRC and Australian government, and government regulations may limit our activities and adversely affect our business, results of operations and financial condition.”
Demand for coal
Given the nature of our operations, the demand for coal will continue to have a significant effect on our results of operations. Global coal demand correlates strongly with the global economy and, as such, any downturn or prolonged depression of economic activity may have an adverse effect on demand for coal. Coal demand is also affected by a variety of factors beyond our control, such as the availability and prices of alternative energy sources to coal, international shipping costs and costs of conducting coal mining operations.
Acquisition and expansion
Our business expansion plans are primarily dependent on successfully acquiring companies that can grow or diversify our existing operations. Recently, our acquisitions have included equity interests in coal mines in Australia and potash mineral exploration permits in Canada. Our coal reserves, future production capacity and, consequently, our revenues and results of operations, will depend on the success of acquired mining operations. Our business and results of operations could be affected if we are unable to successfully integrate our acquisitions or achieve anticipated additional revenue and earnings.
Exchange rate fluctuations
Assets, liabilities and the fair value of financial instruments and balances that we incur, create or acquire in the process of our international operations and which are denominated in currencies other than RMB, or in currencies other than the functional currencies of the relevant business units, may fluctuate substantially depending on changes in currency exchange rates. See “Item 3. Key Information — D. Risk Factors — Risks Relating to Our Business and Industry – Our business, results of operations and financial condition depend in part on our ability to continue acquiring or developing suitable coal reserves” and “Item 11. Quantitative and Qualitative Disclosures of Market Risk – Foreign Currency Exchange Rate Risk.”
Product mix
Our products, which include thermal coal, semi-hard coking coal, semi-soft coking coal, PCI coal and 1/3 coking coal, generally have different prices and gross margins. For example, our No. 1 clean coal has historically had a higher gross margin than our other products and, as such, an increased proportion of sales income generated from No. 1 clean coal would result in higher gross profits. Conversely, if the sales volume of lower gross margin coal products, such as thermal coal, increased in comparison to higher margin coal products, then we would have lower gross profits despite an increase in sales volume. In addition, the future launch of new products will also affect our product mix and, consequently, our revenues, gross margins and results of operations.
Production capacity
Our results of operations and future growth prospects are affected by our coal production capacity. Our production capacity and production volume may be affected by the macroeconomy and customer demand. Our production capacity and volume will also depend on our ability to obtain necessary capital and required approvals and permits, as well as production capacity, customer demand and general economic factors. We will continue to focus on increasing our production capacity by developing our existing projects and domestic and international acquisitions. Increasing our production capacity also increases costs, expenses and capital expenditures.
Coal prices
The selling prices of our coal products are influenced by price fluctuations in the PRC domestic market and the global market. In addition, potential reduction in the production in high cost coal producing regions are expected to provide support for coal price going forward. In the long run, coal prices are expected to increase as a result of growing demand for coal to fuel industrialization and urbanization and steady production increase due to higher royalties and environmental and social related costs.
Cost of sales
Our results of operations are affected by our cost of sales, which mainly comprises wages and employee benefits, purchases of coal from third parties for trading purposes, materials, land subsidence, restoration, rehabilitation and environmental costs, depreciation and amortization expenses and business tax and surcharges associated with our coal business and railway transportation business. Key factors impacting these costs include variations in production volume, the cost of power, fuel and labor, the application of advanced mining technologies, changes in railway fees and port fees, and contractual terms of our coal products.
Transportation volume and cost
We primarily use railways and highways and, to a lesser extent, domestic and international shipping lanes, to transport coal. We primarily rely on the national railway system in the PRC and railway systems operated by third parties in Australia to transport our coal. In addition, we also utilize our private railway network to transport other goods upon the request of our railway transportation customers. We also transport coal on the national railway system to ports, from which we ship coal to our customers. Railway, waterway and roadway transportation costs are charged by carriers who deliver our coal products to our customers. Our revenue and results of operations may be affected by fluctuations in the transportation volume and capacity of national and state railway systems and of our own railway assets, as well as fluctuations in the costs associated with transporting coal to our customers.
Coal resources and reserves
Coal resources and reserves data is a key element in our decision-making process. All coal reserves data are estimates, which are revised when additional information becomes available (for example, when additional coal mines commence operations or when actual coal production or extraction commences). If the amount or quality of coal mined differs from the reserve estimates, we may have to further process or wash the coal mined in order to produce coal of a saleable quality. See “Item 3. Key Information — D. Risk Factors — Risks Relating to Our Business and Industry — The coal reserve data in this annual report are only estimates, which may differ materially from actual reserve amounts.”
Results of Operations
The following table sets forth our income statement and the percentage of each line item to our total revenue for the periods indicated :indicated:
| 2008 | 2009 | 2010 | 2010 | 2011 | 2012 | |||||||||||||||||||||||||||||||||||||||||||
| RMB (million) | % | RMB (million) | % | RMB (million) | % | RMB (million) | % | RMB (million) | % | RMB (million) | % | |||||||||||||||||||||||||||||||||||||
Total revenue | 25,287.4 | 100.0 | 20,677.1 | 100.0 | 33,944.3 | 100.0 | 33,944.3 | 100.0 | 47,065.8 | 100.0 | 58,146.2 | 100.0 | ||||||||||||||||||||||||||||||||||||
Gross sales of coal | 24,933.3 | 98.6 | 19,947.7 | 96.5 | 32,590.9 | 96.0 | 32,590.9 | 96.0 | 45,181.2 | 96.0 | 56,200.6 | 96.7 | ||||||||||||||||||||||||||||||||||||
Railway transportation service income | 255 | 1.0 | 266 | 1.3 | 513.3 | 1.5 | 513.3 | 1.5 | 476.9 | 1.0 | 464.1 | 0.8 | ||||||||||||||||||||||||||||||||||||
Gross sales of electric power | 59.8 | 0.2 | 187.5 | 0.9 | 185.6 | 0.5 | 185.6 | 0.5 | 328.0 | 0.7 | 323.6 | 0.6 | ||||||||||||||||||||||||||||||||||||
Gross sales of methanol | 38.6 | 0.2 | 258.9 | 1.3 | 629.3 | 1.9 | 629.3 | 1.9 | 1,059.3 | 2.3 | 1,118.0 | 1.9 | ||||||||||||||||||||||||||||||||||||
Gross sale of heat supply | — | — | 15.6 | 0.1 | 25.2 | 0.1 | 25.2 | 0.1 | 20.5 | 0.0 | 39.9 | 0.1 | ||||||||||||||||||||||||||||||||||||
Transportation costs of coal | (508.7 | ) | (2.0 | ) | (403.3 | ) | (2.0 | ) | (1,160.5 | ) | (3.4 | ) | (1,160.5 | ) | (3.4 | ) | (1,248.3 | ) | (2.7 | ) | (2,104.2 | ) | (3.6 | ) | ||||||||||||||||||||||||
Cost of sales and service provided | (12,201.1 | ) | (48.2 | ) | (10,590.0 | ) | (51.2 | ) | (16,801.3 | ) | (49.5 | ) | (16,801.3 | ) | (49.5 | ) | (25,725.3 | ) | (54.7 | ) | (41,961.5 | ) | (72.2 | ) | ||||||||||||||||||||||||
Cost of electric power | (88.3 | ) | (0.3 | ) | (190.8 | ) | (0.9 | ) | (195.5 | ) | (0.6 | ) | (195.5 | ) | (0.6 | ) | (362.5 | ) | (0.8 | ) | (330.8 | ) | (0.6 | ) | ||||||||||||||||||||||||
Cost of methanol | (37.8 | ) | (0.1 | ) | (352.9 | ) | (1.7 | ) | (716.8 | ) | (2.1 | ) | (716.8 | ) | (2.1 | ) | (930.2 | ) | (2.0 | ) | (911.2 | ) | (1.6 | ) | ||||||||||||||||||||||||
Cost of heat supply | — | — | (9.7 | ) | 0.0 | (12 | ) | 0.0 | (12.5 | ) | 0.0 | (13.8 | ) | 0.0 | (25.1 | ) | 0.0 | |||||||||||||||||||||||||||||||
|
|
|
|
|
| |||||||||||||||||||||||||||||||||||||||||||
Gross profit | 12,451 | 49.2 | 9,130.4 | 44.2 | 15,057.6 | 44.4 | 15,057.6 | 44.4 | 18,785.8 | 39.9 | 12,813.3 | 22.0 | ||||||||||||||||||||||||||||||||||||
Selling, general and administrative expenses | (3,832.0 | ) | (15.2 | ) | (3,820.3 | ) | (18.5 | ) | (5,093.9 | ) | (15.0 | ) | (5,093.4 | ) | (15.0 | ) | (6,570.2 | ) | (13.9 | ) | (7,987.6 | ) | (13.7 | ) | ||||||||||||||||||||||||
Share of income (loss) of an associate | (67.4 | ) | (0.3 | ) | 109.8 | 0.5 | 8.9 | 0.0 | ||||||||||||||||||||||||||||||||||||||||
Share of profit of associates | 8.9 | 0.0 | 68.9 | 0.1 | 142.0 | 0.2 | ||||||||||||||||||||||||||||||||||||||||||
Share of loss of jointly controlled entities | (0.5 | ) | 0.0 | — | 0.0 | (103.2 | ) | 0.2 | ||||||||||||||||||||||||||||||||||||||||
Other income | 351 | 1.4 | 311.0 | 1.5 | 3,108.0 | 9.2 | 3,108.1 | 9.2 | 1,075.8 | 2.3 | 2,930.4 | 5.0 | ||||||||||||||||||||||||||||||||||||
Interest expense | (38.4 | ) | (0.2 | ) | (45.1 | ) | (0.2 | ) | (603.3 | ) | (1.8 | ) | (603.3 | ) | (1.8 | ) | (839.3 | ) | (1.8 | ) | (1,448.7 | ) | (2.5 | ) | ||||||||||||||||||||||||
|
|
|
|
|
| |||||||||||||||||||||||||||||||||||||||||||
Profit before income taxes | 8,865.2 | 35.1 | 5,685.8 | 27.5 | 12,477.3 | 36.8 | 12,477.3 | 36.8 | 12,521.0 | 26.6 | 6,346.2 | 10.9 | ||||||||||||||||||||||||||||||||||||
Income taxes | (2,385.6 | ) | (9.4 | ) | (1,553.3 | ) | (7.5 | ) | (3,171.0 | ) | (9.3 | ) | (3,171.0 | ) | (9.3 | ) | (3,545.4 | ) | (7.5 | ) | (123.9 | ) | (0.2 | ) | ||||||||||||||||||||||||
|
|
|
|
|
| |||||||||||||||||||||||||||||||||||||||||||
Profit for the year | 6,479.6 | 25.6 | 4,132 | 20.0 | 9,306.3 | 27.4 | 9,306.3 | 27.4 | 8,975.6 | 19.1 | 6,222.2 | 10.7 | ||||||||||||||||||||||||||||||||||||
|
|
|
|
|
| |||||||||||||||||||||||||||||||||||||||||||
Attributable to: | ||||||||||||||||||||||||||||||||||||||||||||||||
Equity holders of the Company | 6,488.9 | 25.7 | 4,117.3 | 19.9 | 9,281.4 | 27.3 | 9,281.4 | 27.3 | 8,928.1 | 19.0 | 6,219.0 | 10.7 | ||||||||||||||||||||||||||||||||||||
Non-controlling interests | (9.3 | ) | (0.1 | ) | 15.2 | 0.1 | 24.9 | 0.1 | 24.9 | 0.1 | 47.5 | 0.1 | 3.3 | 0.0 | ||||||||||||||||||||||||||||||||||
|
Year Ended December 31, 20102012 Compared with Year Ended December 31, 20092011
Total revenue
Our total revenue in 20102012 increased RMB13,267.2by RMB11,080.4 million, or 64.2%23.5%, from RMB47,065.8 million to approximately RMB33,944.3RMB58,146.2 million. Our gross sales of coal, which accounted for 96.0%96.7% of our total revenue in 2010,2012, increased RMB12,643.2by RMB11,019.4 million, or 63.4%24.4%, to approximately RMB32,590.9RMB56,200.6 million in 2010. The2012. This reflected an increase in grosscoal sales volume of coal was29.9 million tonnes, or 46.5%, primarily due to an increase in the sales volume of externally purchased coal, an increase in the sales volume of coal in Australia and an increase in the sales volume of coal by Ordos Nenghua, partially offset by a decrease in the average selling price and the sales volume of our coal products driven by rapidly growing market demand in 2010. In 2010, our average selling price of coal products increased approximately RMB134.3RMB108.4 per tonne, to RMB663.5or 15.3%, from RMB707.7 per tonne representing a 25.4% increase from 2009. Our sales volumein 2011 to RMB599.3 per tonne in 2012, as the result of the weak demand for coal products increased 30.5% from approximately 38.0 million tonnes in 2009 to 49.6 million tonnes in 2010.caused by the global economic slowdown.
In 2010,2012, the transportation volume of our railway assets was approximately 19.717.5 million tonnes, representing a decrease of approximately 0.160.6 million tonnes, or 0.8%3.2%, from 2009, primarily caused by the decrease in our internal transportation volume where we bear the transportation costs by ourselves, and partly offset by an approximate 0.98 million tonnes increase in the volume of goodscompared to which our customers bear the transportation fees, or external transportation volume.2011. Our railway transportation services income (income from transported volume settled on the basis of off-mineex-mine prices and special purpose railway transportation fees borne by customers) wasdecreased by RMB12.8 million, or 2.7%, from approximately RMB513.3RMB476.9 million in 2010, representing an increase of RMB246.0 million, or 92.0%, from that in 2009, primarily due2011 to an increase in the standard transportation fee from RMB0.32 per tonne kilometer to RMB0.57 per tonne kilometer, which became effective from January 1, 2010. The increase in the railway transportation services income was also attributable to an increase of 0.98 million tonnes, or 5.7%, in 2010 in the volume of goods to which our customers bear the transportation fees.
We ramped up production in our coal chemical operations and generated gross sales of methanol of approximately RMB629.3RMB464.1 million in 2010, representing an increase of approximately RMB370.4 million, or 143.1%, from RMB258.9 million in 2009. The increase in gross sales of methanol was mainly attributable to the increased production at Yulin Nenghua’s methanol plant, which completed its first full year of operations in 2010.
In 2010, our2012. Our gross sales of electric power amounteddecreased by RMB4.4 million, or 1.3%, from approximately RMB328.0 million 2011 to RMB323.6 million in 2012. This decrease was due to decreased power generation and sales of electric power in 2012, in part due to the high cost of fuel as a result of which we shut down power generation operations at Shanxi Nenghua beginning January 1, 2012. Our gross sales of methanol increased by RMB58.7 million, or 5.5%, from approximately RMB1,059.3 million in 2011 to approximately RMB185.5RMB1,118.0 million representing a slight decrease of approximately RMB2.0 million, or 1.1%, from 2009.in 2012. This increase was primarily due to the increased production and sales volumes by Yulin Nenghua. Our gross sales of heat supply increased by RMB19.4 million, or 94.6%, from approximately RMB20.5 million in 2011 to approximately RMB25.2RMB39.9 million representing anin 2012. This increase was primarily due to our provision of approximately RMB9.6 million, or 61.3%, from 2009, mainly attributableheat supply to an increase in the sales volume.more customers for a longer duration as compared with 2011.
Transportation costs of coal
Transportation costs of coal primarily consist of railway, waterway and roadway transportation costs charged by carriers whothat deliver our coal products to our customers. Our coal transportation costs increased by RMB757.2RMB855.9 million, or 187.8%68.6%, from approximately RMB1,248.3 million in 2011 to approximately RMB1,160.5RMB2,104.2 million in 2010. The increase was2012, primarily due to our acquisitionthe increase in the sales volume of Felix.coal. Coal transportation costs in 2012 consisted of transportation costs of approximately RMB281.8 million for coal sold in the PRC and approximately RMB1,822.4 million for coal sold outside of the PRC.
Cost of sales and services provided
Our cost of sales and railway transportation services provided consists of the costs of our coal business and railway transportation business, which primarily consist of wages and employee benefits, purchases of coal from third parties for trading purposes, materials, land subsidence, restoration, rehabilitation and environmental costs, depreciation and amortization expenses and business tax and surcharges. In 2010, our totalOur cost of sales and services provided increased RMB6,211.3by RMB16,236.2 million, or 58.7%63.1%, from approximately RMB25,725.3 million in 2011 to approximately RMB16,801.3 million.
The increase wasRMB41,961.5 million in 2012, primarily due to a RMB2,878.1an increase of approximately RMB11,974.0 million increase in the cost of traded coal as a result of the increase in the volume and pricevolumes of coal we purchased from third parties for trading purposes. Costpurposes, as well as an increase of sales and service provided also increased due to a RMB1,413.4approximately RMB1,435.9 million increase in wages and employee benefits in line with theas a result of an increase in our employee headcount, and partly offset by a RMB192.8 million decrease in land subsidence, restoration, rehabilitation and environmental costs.headcount.
Cost of electric power
Our cost of electric power operations primarily consists of raw material and labor costs incurred to generate electric power. Our cost of electric power increaseddecreased by RMB4.7RMB31.7 million, or 8.7%, from approximately RMB362.5 million in 2011 to approximately RMB195.5RMB330.8 million in 2010, from approximately RMB190.8 million in 2009.2012, primarily due to decreased power generation at the power plants operated by Hua Ju Energy and Yulin Nenghua, as well as the closure of Shanxi Nenghua’s power plant due to high fuel costs.
Cost of methanol
Our cost of methanol primarily consists of raw materials, labor costs, depreciation and other manufacturing overhead. Our production costs increased significantlycost of methanol decreased by RMB19.0 million, or 2.0%, from approximately RMB352.9RMB930.2 million in 20092011 to approximately RMB716.8RMB911.2 million in 2010, mainly attributable2012 primarily because the methanol project at Shanxi Nenghua ceased production due to the increased production at Yulin Nenghua’s methanol plant, which completed its first full yeara shortage of operationsraw materials in 2010.April 2012.
Cost of heat supply
The costs in our heating businessOur cost of heat supply primarily consistconsists of raw materials and labor. We incurred approximately RMB12.5 millionlabor in costs for our heat supply businessbusiness. Our cost of heat supply increased by RMB11.3 million, or 81.9%, from approximately RMB13.8 million in 2010, representing2011 to approximately RMB25.1 million in 2012, primarily due to an increase of approximately RMB2.8 million compared to approximately RMB9.7 million60,000 steam tonne in 2009, reflecting the significant growth in our production volume of 50,000 steam tonnes.heat supply sold.
Selling, general and administrative expenses
Our selling, general and administrative expenses were approximately RMB5,093.9 million in 2010, representing an increase of RMB1,273.7increased by RMB1,417.4 million, or 33.3%21.6%, from approximately RMB3,820.2RMB6,570.2 million in 2009. Our selling, general and administrative expenses increased2011 to approximately RMB7,987.6 million 2012, primarily due to a RMB687.3increases in impairment losses on intangible assets, goodwill and inventories of approximately RMB575.7 million, increaseand RMB214.1 million in distribution charges mainly caused by the increase of our operations in Australia after the acquisition of Felix. The increase in our selling, general and administrative expenses was also attributable to the increase in depreciation, repair and maintenance expenses and utilities relating to administrative buildings.charges.
Share of income of an associateassociates
Our share of income from associates increased by RMB73.0 million, or 106.0%, from approximately RMB68.9 million in 2011 to RMB142.0 million in 2012, due to an increase in our investment inincome of RMB82.6 million from Huadian Zouxian Power Generation Company Limited and Yankuang Group Finance Company Limited was approximately RMB8.9 million in 2010, compared to RMB109.8 million in 2009. This decrease was primarily a result of the decreased income of Huadian Zouxian Power Generation Company Limited due to increased thermal coal prices in 2010.(“Huandian Zouxian”).
Other income
Our other income increased significantly by RMB2,797.1RMB1,854.7 million, or 172.4%, from RMB311.0approximately RMB1,075.8 million in 20092011 to RMB3,108.1approximately RMB2,930.4 million in 2010. Our increase in other income in 2010 was primarily attributable to an exchange gain of RMB2,688.2 million mainly resulting from the appreciation of the Australian dollar against the U.S. dollar.
Interest expenses
Our interest expenses increased significantly by RMB558.2 million, from approximately RMB45.1 million in 2009 to approximately RMB603.3 million in 2010.2012. This increase was primarily due to a gain in bargain purchase in the sum of RMB1,269.3 million arising from our acquisition of Gloucester, resulting from a decrease in the market capitalization and market price of the consideration shares, as well as an increase of RMB364.6 million in bank deposit interest and exchange gains of RMB195.6 million from Yancoal Australia.
Interest expenses
Our interest expenses increased by RMB609.4 million, or 72.6%, from approximately RMB839.3 million in 2011 to RMB1,448.7 million in 2012, mainly due to the issuance of corporate bonds in the amount of US$1.0 billion and an increase in interest expenses on bank borrowings wholly repayable within five yearsloans in 2012.
Profit before income tax
As a result of the foregoing, our profit before income taxes decreased by approximately RMB6,174.8 million, or 49.3%, from approximately RMB18.8RMB12,521.0 million in 20092011 to RMB6,346.2 million in 2012.
Income tax expenses
Our income tax decreased by RMB3,421.4 million, or 96.5%, from approximately RMB3,545.4 million in 2011to approximately RMB123.9 million in 2012, primarily due to a decrease in current income tax expenses of RMB1,725.2 million and a decrease in the income tax expenses in our Australian subsidiaries of RMB1,085.2 million caused by an increase in its deferred tax assets related to the implementation of MRRT.
Profit for the year
As a result, our profit for the year decreased by RMB2,753.4 million, or 30.7%, from approximately RMB8,975.6 million in 2011 to approximately RMB594.6RMB6,222.2 million in 2012. The profit attributable to equity holders of the Company decreased by RMB2.709.1 million, or 30.3%, from RMB8,928.1 million in 2011 to approximately RMB6,219.0 million in 2012.
Year Ended December 31, 2011 Compared with Year Ended December 31, 2010
Total revenue
Our total revenue increased RMB13,121.5 million, or 38.7%, from approximately RMB33,944.3 million in 2010 to approximately RMB47,065.8 million in 2011. Our gross sales of coal, which accounted for 96.0% of our total revenue in 2011, increased by RMB12,590.3 million, or 38.6%, to approximately RMB45,181.2 million in 2011. The increase in gross sales of coal was primarily due to changes in our product mix, increased domestic and global demand and an increase in our average selling price. In 2011, our average selling price of coal products increased approximately RMB44.2 per tonne to RMB707.7 per tonne, a 6.7% increase from 2010. Our sales volume of coal products increased 29.5% from approximately 49.6 million tonnes in 2010 to 64.3 million tonnes in 2011.
In 2011, the transportation volume of our railway assets was approximately 18.1 million tonnes, representing a decrease of approximately 1.7 million tonnes, or 8%, from 2010, primarily due to lower demand by customers for goods to be transported on our railways. Accordingly, our railway transportation services income (income from transported volume settled on the basis of ex-mine prices and special purpose railway transportation fees borne by customers) decreased by RMB36.4 million, or 7.1%, from approximately RMB513.4 million in 2010 to approximately RMB476.9 million in 2011.
Our gross sales of methanol increased by approximately RMB430.0 million, or 68.3%, from RMB629.3 million in 2010 to approximately RMB1,059.3 million in 2011. The increase in gross sales of methanol was mainly attributable to an increase in sales volumes of methanol. Our gross sales of electric power increased by approximately RMB142.4 million, or 76.8%, from approximately RMB185.6 million in 2010 to approximately RMB328.0 million in 2011. Our gross sales of heat supply decreased by RMB4.8 million, or 18.9%, from approximately RMB25.2 million in 2010 to approximately RMB20.5 million in 2011, due primarily to increased consumption of heat supply by our own coal mines.
Transportation costs of coal
Our coal transportation costs increased by RMB87.8 million, or 7.6%, from approximately RMB1,160.5 million in 2010, to approximately RMB1,248.3 million in 2011, which included transportation costs for our coal sold in the PRC of approximately RMB575.2RMB311.7 million and for coal sold outside the PRC of interest expense in relationapproximately RMB936.6 million. This increase was primarily due to the bank loansour acquisition of Yancoal AustraliaResources and the related increase in relationsales volumes.
Cost of sales and services provided
Our total cost of sales and services provided increased by RMB8,924.0 million, or 53.1%, from RMB16,801.3 million in 2010 to the acquisitionapproximately RMB25,725.3 million in 2011, primarily due to increased sales volumes of Felixcoal. The increased sales volumes resulted in late 2009.an increase of RMB5,593.3 million in purchases of coal from third parties for trading purposes, an increase of RMB1,151.1 million in wages and employee benefits and an increase of RMB523.5 million in costs for materials. The increase was also due to a RMB366.9 million increase in interestannual fees and amortization of mining rights, an increase of RMB297.3 million increase in electricity costs and an RMB808.8 million in other costs of sales and services.
Cost of electric power
Our cost of electric power increased by RMB166.9 million from approximately RMB195.5 million in 2010, to approximately RMB362.5 million in 2011, primarily due to an increase in electric power sold, as Hua Ju Energy sold the excess power it generated. Hua Ju Energy sold approximately 895.5 million kWh of electric power in 2011 compared to 468.6 million kWh of electric power in 2010.
Cost of methanol
Our production costs increased from approximately RMB716.8 million in 2010 to approximately RMB930.2 million in 2011, primarily due to an increase in the volume of methanol sold from approximately 376,000 tonnes in 2010 to 529,000 tonnes in 2011 reflecting increased customer demand.
Cost of heat supply
Our cost of heat supply increased by RMB1.3 million, from approximately RMB12.5 million in 2010 to approximately RMB13.8 million in 2011, primarily due to increases in coal prices and wages, as well as a slight increase in production volume from 1.27 million steam tonnes to 1.28 million steam tonnes.
Selling, general and administrative expenses
Our selling, general and administrative expenses increased by RMB1,476.8 million, or 29.0%, from approximately RMB5,093.4 million in 2010 to approximately RMB6,570.2 million in 2011. This increase in primarily attributable to increased selling, general and administrative expenses for Yancoal Australia primarily reflecting increased sales volumes. The increase was also due to increased selling, general and administrative expenses for Ordos Neng Hua, primarily reflecting increased sales volumes and expanded operations. In addition, the increase also reflected a RMB184.4 million increase in impairment loss on Tianhao Chemicals’ property, plant and equipment.
Share of income of associates
Our share of income from associates, increased by RMB60.1 million, or 677.2%, from RMB8.9 million in 2010 to approximately RMB68.9 million in 2011, primarily due to increases in investment income of RMB19.0 million and RMB41.0 million from Huadian Zouxian and Yankuang Finance, respectively.
Other income
Our other income decreased by RMB2,032.3 million, or 65.4%, from approximately RMB3,108.1 million in 2010 to approximately RMB1,075.8 million in 2011, primarily due to a decrease in foreign exchange gains of RMB2,146.9 million. The decrease in foreign exchange gains was due primarily to Yancoal Australia’s decrease in foreign exchange gains from RMB2,688.2 million in 2010 to RMB504.4 million in 2011 relating to its foreign exchange hedging contracts to manage foreign currency risk arising from its expected revenue in foreign currencies. The decrease was partially offset by a decreasean increase of approximately RMB11.0RMB170.5 million in interest income, due primarily to an increase in bank deposits as compared to the bills receivable discounted without recourseprior year.
Interest expenses
Our interest expenses increased by RMB236.0 million, from approximately RMB603.3 million in 2010.2010 to approximately RMB839.3 million in 2011, primarily due to an increase in our bank borrowings and financing costs in connection with the acquisition of mining rights of Zhuanlongwan Project.
Profit before income tax
As a result of the foregoing, our profit before income taxes increased by approximately RMB6,791.5RMB43.7 million, or 119.4%0.4%, from approximately RMB5,685.8 million in 2009 to approximately RMB12,477.3 million in 2010.2010 to approximately RMB12,521.0 million in 2011.
Income tax expenses
Our income tax expenses increased by RMB1,617.7RMB374.3 million, or 104.2%11.8%, tofrom approximately RMB3,171.0 million in 2010. The increase2010, to approximately RMB3,545.4 million in 2011, primarily reflecteddue to an increase in our taxable income.
Profit for the year
As a result, our profit for the year increaseddecreased by RMB5,173.8RMB330.7 million, or 125.2%3.6%, from approximately RMB4,132.5 million in 2009 to approximately RMB9,306.3 million in 2010. The profit attributable2010 to equity holders of the Company increased by RMB5,164.1 million, or 125.4%, from approximately RMB4,117.3RMB8,975.6 million in 2009 to approximately RMB9,281.4 million in 2010.
Year Ended December 31, 2009 Compared with Year Ended December 31, 2008
Total revenue
Our total revenue in 2009 decreased RMB4,610.3 million, or 18.2%, to approximately RMB20,677.1 million. Our gross sales of coal, which accounted for 96.5% of our revenue in 2009, decreased RMB4,985.6 million, or 20.0%, to approximately RMB19,947.7 million in 2009. The decrease in gross sales of coal was primarily due to a decrease in the average selling price of our coal products partly offset by a slight increase in sales volume. The average price of our Company’s coal products decreased 20.3% in 2009 compared with our average price in 2008 as a result of weak market conditions in China and worldwide. Our gross sales of coal decreased approximately RMB4,985.5 million, from approximately RMB24,933.3 million in 2008 to approximately RMB19,947.8 million in 2009 primarily due to the decrease in average selling price of coal in 2009. Our sales volume of coal products increased 1.2% from approximately 37.6 million tonnes in 2008 to approximately 38.0 million tonnes in 2009.
Our railway transportation services income was approximately RMB267.3 million in 2009, representing an increase of RMB11.6 million, or 4.5%, reflecting a 0.7 million tonne, or 3.7%, increase in the volume of goods transported.
We ramped up production significantly in our coal chemical operations and electric power and generated approximately RMB258.9 million and approximately RMB187.5 million from these businesses, respectively, in 2009. The increase in coal chemical sales was attributable to Yulin Nenghua’s methanol plant, which commenced production in August 2009 and generated sales income1 of approximately RMB239.6 million. The acquisition of Hua Ju Energy significantly increased our external sales of electricity, which generated revenue of approximately RMB152.1 million in 2009. We also began the production and sale of heat supply in 2009 and generated revenue of approximately 15.6 million from this new business in the same year.
Transportation costs of coal
Transportation costs of coal primarily consist of railway, waterway and roadway transportation costs charged by carriers who deliver our coal products to our customers. Our transportation costs of coal decreased RMB105.4 million, or 20.7%, to RMB403.3 million in 2009. The decrease was primarily due to a decrease in the volume of coal that was shipped through ports to domestic and overseas customers, both of which involve the incurrence of port fees and railway transportation costs for using the PRC national railway network to deliver coal to ports.
Cost of sales and services provided
Our cost of sales and railway transportation services provided consists of the costs of our coal business and railway transportation business, which primarily consist of wages and employee benefits, purchases of coal from third parties for trading purposes, materials, land subsidence, restoration, rehabilitation and environmental costs, depreciation and amortization expenses and business tax and surcharges. In 2009, our total cost of sales and services provided decreased RMB1,611.1 million, or 13.2%, to approximately RMB10,590.0 million.
The decrease was primarily due to a decrease in land subsidence, restoration, rehabilitation and environmental costs of RMB1,541.4 million and a RMB732.8 million decrease in the amount of coal that we purchased for trading purposes, partly offset by a RMB656.8 million increase in wages and employee benefits and a RMB379.0 million increase in depreciation expenses, which is in line with our increase in plant, property and equipment.
Cost of electric power
Our cost of electric power operations primarily consists of raw material and labor costs. The year 2009 marked the first full year of operations of our electric power business, which commenced operations in September 2008. Our cost of power generation increased significantly from approximately RMB88.3 million in 2008 to approximately RMB190.8 million in 2009, primarily due to costs of RMB121.5 million associated with Hua Ju Energy’s external sales of electric power.
Cost of methanol
Our cost of methanol primarily consists of raw materials, labor costs and other manufacturing overhead. We commenced production at a 600,000-tonne methanol plant in August 2009, which increased our production capacity and volume significantly. Our cost of methanol production increased more than eightfold from approximately RMB37.8 million in 2008 to approximately RMB352.9 million in 2009, reflecting the significant growth in our production volume.
Cost of heat supply
The primary costs in our heating business consist of raw materials and labor. We incurred RMB9.7 million in costs for our heat supply business.
Selling, general and administrative expenses
Our selling, general and administrative expenses were approximately RMB3,820.2 million in 2009, representing a decrease of RMB11.8 million, or 0.3%, from approximately RMB3,832.0 million in 2008. Our selling, general and administrative expenses were reduced because we did not have any foreign exchange losses in 2009, the effects of which were offset by (i) an increase in property management fees of RMB91.7 million, (ii) an increase in depreciation of RMB53.9 million and (iii) an increase in repair and maintenance of RMB49.5 million.
Share of income of an associate
Our share of income from our investment in Huadian Zouxian Power Generation Company Limited was approximately RMB109.8 million in 2009, compared with our share of loss of approximately RMB67.4 million in 2008. Our associated company’s profitability was primarily the result of a decrease in steam coal prices in 2009.
Other income
Our other income decreased by RMB40.5 million, or 11.5%, to approximately RMB311.0 million in 2009. In 2008, we had a one-off recovery of approximately RMB132.2 million in interest income from a legal proceeding. Our decrease in other income in 2009 was partly offset by an increase in interest income from bank deposits of approximately RMB44.6 million and an increase in government grants of approximately RMB26.3 million.
Interest expenses
Our interest expenses increased by RMB6.8 million, or 17.4%, from approximately RMB38.4 million in 2008 to approximately RMB45.1 million in 2009. The increase was primarily due to an increase in interest expenses of approximately RMB13.6 million on discounted bills receivable and a decrease in interest expenses of approximately RMB6.2 million on bank borrowings.
Profit before income tax
As a result of the foregoing, our profit before income taxes decreased by RMB3,179.4 million, or 35.9%, from approximately RMB8,865.2 million in 2008 to approximately RMB5,685.8 million in 2009.
Income tax expenses
Our income tax expenses decreased by RMB832.3 million, or 34.9%, to approximately RMB1,553.3 million in 2009. The decrease primarily reflected a decrease in our taxable income.
Profit for the year
As a result, our profit for the year decreased by RMB2,347.1 million, or 36.2%, from approximately RMB6,479.6 million in 2008 to approximately RMB4,132.5 million in 2009.2011. The profit attributable to equity holders of the Company decreased by RMB2,371.6RMB353.3 million, or 36.5%3.8%, from approximately RMB6,488.9RMB9,281.4 million in 20082010 to approximately RMB4,117.3RMB8,928.1 million in 2009.2011.
Segment Information
The following table sets forth a breakdown of our total consolidated gross revenues for each of the years indicated and the percentage contribution of each segment to our total gross revenues:
| 2010 | 2011 | 2012 | ||||||||||||||||||||||
| RMB | % | RMB | % | RMB | % | |||||||||||||||||||
| (in millions, except for percentages) | ||||||||||||||||||||||||
Mining revenue | 32,930.3 | 97.0 | 45,468.5 | 96.6 | 56,419.8 | 97.0 | ||||||||||||||||||
Coal railway transportation revenue | 549.3 | 1.6 | 528.6 | 1.1 | 496.6 | 0.9 | ||||||||||||||||||
Methanol, electricity and heat supply revenue | 1,295.3 | 3.8 | 1,664.1 | 3.5 | 1,765.9 | 3.0 | ||||||||||||||||||
Unallocated and eliminations | (830.7 | ) | (2.4 | ) | (595.3 | ) | (1.3 | ) | (536.2 | ) | (0.9 | ) | ||||||||||||
|
|
|
|
|
|
|
|
|
|
|
| |||||||||||||
Gross revenue | 33,944.3 | 100.0 | 47,065.8 | 100.0 | 58,146.2 | 100.0 | ||||||||||||||||||
|
|
|
|
|
|
|
|
|
|
|
| |||||||||||||
We are mainly engaged in the mining, washing, processing and railway distribution of coal. For the year ended December 31, 2012, we derived our revenue mainly derived from coal sales in the PRC.
| B. | Liquidity and Capital Resources |
Our principal sources of liquidity in 20102012 were proceeds from bank borrowings, the RMB-denominated corporate bonds we issued in 2012 (the “RMB Bond Offering”) and the US$-denominated corporate bonds we issued in 2012 (the “US$ Bond Offering”) and the cash generated from our operating activities. In 2010,2012, we primarily utilized cash to fund the acquisition of Haosheng Company and Anyuan coal mine, investment in Yankuang Group Finance Company Limited, the payment ofpay our operating expenses, purchase of property, machinery and equipment, finance acquisitions and pay dividends to Shareholders.
Our primary sources of cash in 2010 and 2011 were cash flows from operating activities and bank borrowings. We used cash primarily to finance working capital, fund payments of interest and principal due on our indebtedness, finance acquisitions and fund capital expenditures and the growth and expansion of our facilities and operations.
Taking into account our cash and cash equivalents on hand, our available credit facilities, cash generated from our future operations and the proceeds from our RMB Bond Offering and US$ Bond Offering, we believe we have sufficient working capital to meet our financial requirements for at least the next 12 months from the date of this annual report. As of December 31, 2012, we had cash and cash equivalents of approximately RMB12,717.4 million.
We conduct our operations directly and through our operating subsidiaries, some of which we do not wholly own, are joint ventures or are public companies. Therefore, we may not be able in all circumstances to allocate our free cash flow as we would like among our subsidiaries. In addition, PRC law restricts the ability of our subsidiaries to transfer funds to us in the form of cash dividends, loans or advances. PRC regulations currently permit payment of dividends by PRC companies only out of accumulated profits as determined in accordance with PRC accounting standards and regulations. In addition, under current PRC laws, regulations and accounting standards, each subsidiary is required to allocate at least 10% of its after-tax profit based on PRC accounting standards to its statutory common reserve fund each year until the Shareholders.cumulative amount of these reserves reaches 50% of its registered capital. These reserves are not distributable as cash dividends. As of December 31, 2012, the required deductions attributable to these statutory common reserve funds amounted to approximately RMB4,975.4 million.
Furthermore, under SAFE regulations, Renminbi is not convertible into foreign currencies for capital account items, such as loans, repatriation of investments and investments outside of China, unless the prior SAFE approval is obtained and prior registration with the SAFE is made. These restrictions have not historically had, and are not expected in the future to have, a material impact on our ability to meet our financial requirements.
Cash Flows
The following table sets forth a summary of our cash flowflows for the periods indicated:
| Year Ended December 31, | Year Ended December 31, | |||||||||||||||||||||||
| 2008 | 2009 | 2010 | 2010 | 2011 | 2012 | |||||||||||||||||||
| (RMB’000) | (RMB’000) | |||||||||||||||||||||||
Net cash from operating activities | 7,095,477 | 6,520,131 | 5,399,804 | 5,399.8 | 17,977.3 | 6,503.6 | ||||||||||||||||||
Net cash used in investing activities | (2,091,489 | ) | (24,842,938 | ) | (5,884,355 | ) | (5,884.4 | ) | (25,611.0 | ) | (3,187.4 | ) | ||||||||||||
Net cash from (used in) financing activities | (921,668 | ) | 18,503,741 | (1,360,523 | ) | (1,360.5 | ) | 9,441.0 | 1,145.1 | |||||||||||||||
Net increase/ (decrease) in cash and cash equivalents | 4,082,320 | 180,934 | (1,845,074 | ) | (1,845.1 | ) | 1,807.3 | 4,461.4 | ||||||||||||||||
Cash and cash equivalents as of end of year | 8,439,578 | 8,522,399 | 6,771,314 | 6,771.3 | 8,145.3 | 12,717.4 | ||||||||||||||||||
Cash Flow From Operating Activitiesflow from operating activities
Net cash from operating activities represents cash generated from operations after income taxes, interest and dividend income. Cash generated from operations consisted of profit before income taxes adjusted for certain non-cashnoncash items, including depreciation, certain interest expenses and income, amortization and our share of investment in an associate company and cash generated from other activities.
Net cash from operating activities was approximately RMB6,503.6 million in 2012, and included profit before income taxes of approximately RMB6,346.2 million, adjustments for non-cash items of approximately RMB2,941.9 million, and positive changes in working capital of approximately RMB531.4 million. Adjustments for non-cash items primarily consisted of (i) depreciation of property, plant and equipment of approximately RMB2,819.4 million; (ii) interest expenses of approximately RMB1,448.7 million; and (iii) amortization of intangible assets of approximately RMB1,177.6 million. Positive changes in working capital primarily consisted of (i) an increase in bills and accounts receivables of approximately RMB93.4 million; (ii) an increase in bills and accounts payables of approximately RMB246.1 million; (iii) an increase in land subsidence, restoration, rehabilitation and environmental costs of approximately RMB484.7 million; and (iv) an increase in other payables and accruals of approximately RMB412.7 million, partially offset by a decrease in prepayments and other current assets of approximately RMB186.1 million.
Net cash from operating activities was approximately RMB17,977.3 million in 2011, and included profit before income taxes of approximately RMB12,521.0 million, adjustments for non-cash items of approximately RMB4,053.8 million, and positive changes in working capital of approximately RMB3,820.8 million. Adjustments for non-cash items primarily consisted of (i) depreciation of property, plant and equipment of approximately RMB2,266.0 million; (ii) interest expenses of approximately RMB839.3 million; and (iii) amortization of intangible assets of approximately RMB720.0 million. Positive changes in working capital primarily consisted of (i) a decrease in bills and accounts receivables of approximately RMB2,800.2 million; (ii) an increase in bills and accounts payables of approximately RMB623.9 million; (iii) an increase in land subsidence, restoration, rehabilitation and environmental costs of approximately RMB556.7 million; and (iv) an increase in other payables and accruals of approximately RMB531.3 million, partially offset by an increase in prepayments and other current assets of approximately RMB870.5 million.
Net cash from operating activities was approximately RMB5,399.8 million in 2010, and consisted ofincluded profit before income taxes of approximately RMB12,477.3 million, and adjustments for non-cash items of approximately RMB1,018.2 million, offset byand negative adjustments tochanges in working capital and other activities of approximately RMB5,646.5 million. Positive adjustmentAdjustments for non-cash items primarily consisted of (i) depreciation of property, plant and equipment of approximately RMB2,426.6 million; and (ii) interest expenses of approximately RMB603.3 million, partially offset by net unrealized foreign exchange gains of approximately RMB2,180.3 million and interest income of approximately RMB187.2 million. Negative changes in working capital activities primarily consisted of (i) an increase in bills and accounts receivablereceivables of approximately RMB5,286.1 million andmillion; (ii) an increase in inventories of approximately RMB728.0 million. These decreases were partially offset by (i) an increase in movement in land subsidence, restoration, rehabilitationmillion; and environmental cost of approximately RMB838.5 million and (ii) an increase in movement in overburden cost of approximately RMB224.5 million.
Net cash from operating activities was approximately RMB6,520.1 million in 2009 and consisted of profit before income taxes of approximately RMB5,685.8 million, adjustments for non-cash items of approximately RMB1,652.3 million and positive adjustments to working capital and other activities of approximately RMB620.8 million. Positive adjustment for non-cash items primarily consisted of depreciation of property, plant and equipment of approximately RMB1,793.3 million, partially offset by interest income of approximately RMB187.6 million and our share of income of an associate of approximately RMB109.8 million. Positive changes in working capital activities primarily consisted of (i) an increase in movement in land subsidence, restoration, rehabilitation and environmental cost of approximately RMB1,109.7 million and (ii) an increase in other payables and accrued expenses of approximately RMB622.1 million. These increases were partially offset by an increase in bills and accounts receivable of approximately RMB1,416.6 million due to an increase in coal purchases settled through acceptance bills.
Net cash from operating activities was approximately RMB7,095.5 million in 2008 and consisted of profit before income taxes of approximately RMB8,865.2 million, adjustments for non-cash items of approximately RMB1,285.3 million, offset by negative adjustments to working capital and other activities of approximately RMB1,093.9 million. Positive adjustments for non-cash items primarily consisted of depreciation of property, plant and equipment of approximately RMB1,140.8 million, partially offset by interest income of approximately RMB275.2 million. Negative changes in working capital activities primarily consisted of (i)(iii) an increase in prepayments and other current assets of approximately RMB1,242.0RMB694.7 million, (ii) an increase in inventories of approximately RMB405.2 million, and (iii) an increase in bills and accounts receivable of approximately RMB217.0 million. These decreases were partially offset by an increase in movement in land subsidence, restoration, rehabilitation and environmental costcosts of approximately RMB431.3 million and an increase in bills and account payable of approximately RMB263.8RMB838.5 million.
Cash Flows Usedflows used from investing activities
Net cash used in Investing Activitiesinvesting activities was approximately RMB3,187.4 million in 2012, and primarily consisted of purchase of property, plant and equipment of approximately RMB6,230.4 million and purchase of intangible assets of approximately RMB1,330.1 million, which were partially offset by a decrease in term deposits of approximately RMB6,356.3 million.
Net cash used in investing activities was approximately RMB25,611.0 million in 2011, and primarily consisted of (i) acquisition of assets and equity of approximately RMB9,620.0 million; (ii) purchase of property, plant and equipment of approximately RMB8,619.5 million; and (iii) increase in term deposits of approximately RMB6,975.5 million.
Net cash used in investing activities was approximately RMB5,884.4 million in 2010. Net cash used in investing activities2010, and primarily consisted of (i) our payment of approximately RMB2,045.8 million and approximately RMB1,080.0 million as partial payments for our acquisition of Haosheng Company and Anyuan Coal Mine, respectively; (ii) our purchase of property, plant and equipment of approximately RMB3,576.1 million,million; (iii) an increase in restricted cash of approximately RMB874.6 million,million; and (iv) our investment of approximately RMB125.0 million to establish Yankuang Group Finance, Company Limited, partially offset by equity transfer income of approximately RMB1,147.8 million from the disposal of Minerva Coal Mine.
Cash flows from (used in) financing activities
Net cash used in investingfrom financing activities was approximately RMB24,842.9RMB1,145.1 million in 2009. Net cash used in investing activities2012, and primarily consisted of (i) our acquisition of Felix for cashbank borrowings of approximately RMB19,558.5RMB12,281.5 million (ii) capital expendituresand the aggregate net proceeds from the RMB Bond Offering and the US$ Bond Offering of approximately RMB2,133.7RMB11,262.9 million, in property, plant and equipment, (iii) an increase in term depositswhich were partially offset by repayment of bank borrowings of approximately RMB1,971.4RMB17,338.1 million, dividends paid of approximately RMB2,803.5 million and (iv) our purchaserepayment of equity interest in Hua Ju Energy forother borrowings of approximately RMB761.7RMB2,225.7 million.
Net cash used in investingfrom financing activities was approximately RMB2,091.5RMB9,441.0 million in 2008. Net cash used in investing activities2011, and primarily consisted of capital expendituresbank borrowings of approximately RMB2,027.0RMB16,712.3 million, for property, plant and equipment and approximately RMB747.3 million for our acquisition of mining rights in Zhaolou Coal Mine. Cash used in investing activities was partially offset by a decrease in other loan receivables(i) dividend payments of approximately RMB640.0 million resulting from our recoveryRMB2,901.9 million; and (ii) the repayment of the principal amount of the entrusted loan that was in default and a decrease in term depositsbank borrowings of approximately RMB141.6RMB4,367.1 million.
Cash Flows From (Used in) Financing Activities
Net cash used in financing activities in 2010 was approximately RMB1,360.5 million in 2010, and primarily consisted of (i) cash dividend paymentpayments of approximately RMB1,229.6 million and (ii) repayments of bank borrowings of approximately RMB655.5 million, partially offset by bank borrowings of approximately RMB1,111.0 million.
Net cashInventories
Our inventories comprise methanol, auxiliary materials, spare parts and small tools used in the construction of mining structures and coal products in our stockpiles. The following table sets forth our inventories as of the dates indicated:
| As of December 31, | ||||||||||||
| 2010 | 2011 | 2012 | ||||||||||
| (RMB in millions) | ||||||||||||
Methanol | 10.3 | 11.8 | 9.5 | |||||||||
Auxiliary materials, spare parts and small tools | 372.0 | 414.5 | 507.6 | |||||||||
Coal products | 1,263.8 | 965.0 | 1,048.5 | |||||||||
|
|
|
|
|
| |||||||
Total | 1,646.1 | 1,391.2 | 1,565.5 | |||||||||
|
|
|
|
|
| |||||||
Our inventories decreased from financing activitiesapproximately RMB1,646.1 million as of December 31, 2010 to RMB1,391.2 million as of December 31, 2011, primarily due to a decrease in 2009 wasour inventory of coal products, despite a slight increase in our inventories of methanol, auxiliary materials, spare parts and small tools. Our inventories increased from approximately RMB18,503.7RMB1,391.2 million as of December 31, 2011 to RMB1,565.5 million as of December 31, 2012, primarily due to increases in our inventory of auxiliary materials, spare parts and small tools and coal products.
Bills and Accounts Receivables
Bills and accounts receivables represent unconditional written orders issued by, or negotiated from, our customers for completed sales orders which allow us to collect certain specified amounts from banks or other parties. These bills are non-interest-bearing and generally have a maturity of six months. The following table sets forth our bills and accounts receivables as of the dates indicated:
| As of December 31, | ||||||||||||
| 2010 | 2011 | 2012 | ||||||||||
| (RMB in millions) | ||||||||||||
Accounts receivable | 493.1 | 818.0 | 928.9 | |||||||||
Less: Impairment loss | (5.4 | ) | (4.2 | ) | (2.5 | ) | ||||||
|
|
|
|
|
| |||||||
| 487.7 | 813.8 | 926.4 | ||||||||||
Total bills receivable | 9,529.6 | 6,498.3 | 6,533.2 | |||||||||
|
|
|
|
|
| |||||||
Total bills and accounts receivable, net | 10,017.3 | 7,312.1 | 7,459.6 | |||||||||
|
|
|
|
|
| |||||||
Our bills and accounts receivable decreased from approximately RMB10,017.3 million as of December 31, 2010 to RMB7,312.1 million as of December 31, 2011, primarily due to a decrease in bills receivable for coal sales on credit terms. Our bills and accounts receivable increased from approximately RMB7,312.1 million as of December 31, 2011 to RMB7,459.6 million as of December 31, 2012. We allow a range of credit periods to our trade customers which take into account the credit rating of our customers. Our credit periods do not exceed 180 days.
The following table sets forth an aging analysis of our bills and accounts receivables based on the applicable invoice dates:
| As of December 31, | ||||||||||||
| 2010 | 2011 | 2012 | ||||||||||
| (RMB in millions) | ||||||||||||
0 - 90 days | 4,738.9 | 4,037.9 | 3,423.0 | |||||||||
91 - 180 days | 5,278.3 | 3,274.2 | 3,954.4 | |||||||||
181 - 365 days | — | — | 80.8 | |||||||||
Over 1 year | — | — | 1.4 | |||||||||
|
|
|
|
|
| |||||||
Total | 10,017.3 | 7,312.1 | 7,459.6 | |||||||||
|
|
|
|
|
| |||||||
Before accepting any new customer, we assess the potential customer’s credit quality and define credit limits by customer. Limits attributed to customers are reviewed once a year. In 2010, 2011 and 2012, we did not have any significant trade receivables that were past due but not yet impaired as of the balance sheet dates above. We do not hold any collateral over these balances. The average ages of these receivables were 93 days, 86 days and 96 days for 2010, 2011 and 2012, respectively. Our management closely monitors the credit quality of accounts receivables and considers the balances that are neither past due nor impaired to be of good credit quality.
We have provided fully for all accounts receivables over three years because our experience is such that receivables that are past due beyond three years are generally not recoverable. Receivables aged over four years are considered irrecoverable by management and are written off. We wrote off our receivables of approximately RMB3.3 million in 2012, respectively. We did not write off any of our receivables in 2010 and 2011. The following table sets forth an analysis of our impairment losses on bills and accounts receivables:
| 2010 | 2011 | 2012 | ||||||||||
| (RMB in millions) | ||||||||||||
Balance at January 1 | 4.5 | 5.4 | 4.1 | |||||||||
Provided for the year | 0.9 | — | 0.005 | |||||||||
Written off recognized | — | — | — | |||||||||
Reversal | — | (1.3 | ) | (1.6 | ) | |||||||
|
|
|
|
|
| |||||||
Balance at December 31 | 5.4 | 4.1 | 2.5 | |||||||||
|
|
|
|
|
| |||||||
Our allowance for doubtful debts in 2010, 2011 and 2012 were approximately RMB5.4 million, RMB4.1 million and RMB2.5 million, respectively, for individually impaired trade receivables, which were primarily consistedreceivables from corporate customers in the PRC and considered irrecoverable by management after considering the credit quality of bank borrowingsthose individual customers, the ongoing relationship with us and the aging of these receivables. The recognized impairment represents the difference between the carrying amount of these trade receivables and the present value of the amounts. We do not hold any collateral over these balances.
Prepayments and Other Receivables
The following table sets forth our prepayments and other receivables as of the dates indicated:
| As of December 31, | ||||||||||||
| 2010 | 2011 | 2012 | ||||||||||
| (RMB in millions) | ||||||||||||
Advances to suppliers | 243.2 | 738.4 | 729.2 | |||||||||
Deposit for environment protection | 254.2 | 651.7 | 813.2 | |||||||||
Prepaid relocation costs of inhabitants | 1,709.9 | 1,714.5 | 1,877.9 | |||||||||
Others | 406.4 | 520.3 | 776.7 | |||||||||
|
|
|
|
|
| |||||||
Total | 2,613.7 | 3,624.8 | 4,197.0 | |||||||||
|
|
|
|
|
| |||||||
Our prepayments and other receivables increased from approximately RMB2,613.7 million as of December 31, 2010 to RMB3,624.8 million as of December 31, 2011, primarily due to equipment purchases made by Ordos Neng Hua, Yancoal Australia and Heze Neng Hua. Our prepayments and other receivables increased from approximately RMB3,624.8 million as of December 31, 2011 to RMB4,197.0 million as of December 31, 2012, primarily due to tax expenses of approximately RMB20,757.7RMB178 million thatpayable by our subsidiaries and a resettlement compensation of RMB59 million payable by the previous owner of Wenyu Coal Mine.
As of December 31, 2010, 2011 and 2012, we obtained to fund the acquisition of Felix, partially offset by cash dividend paymentshad impairment losses of approximately RMB1,967.4 million.RMB16.1 million, RMB17.2 million and RMB25.3 million, respectively, on our prepayments and other receivables. We did not write off any impairment losses on our prepayments and other receivables in 2010, 2011 and 2012.
Net cash usedWe have provided fully for all receivables over three years because our experience is such that receivables that are past due beyond three years are generally not recoverable. We set aside full provisions for receivables that are past due beyond three years. Receivables are written off if aged over four years and considered irrecoverable by management after considering the credit quality of the individual party and the nature of the amount overdue.
Bills and Accounts Payables
Our bills and accounts payable are primarily related to purchases from our suppliers and payables to export agents. The following table sets forth our bills and accounts payables as of the dates indicated:
| As of December 31, | ||||||||||||
| 2010 | 2011 | 2012 | ||||||||||
| (RMB in millions) | ||||||||||||
Accounts payable | 1,428.0 | 2,003.6 | 2,906.6 | |||||||||
Bills payable | 126.5 | 237.2 | 3,905.1 | |||||||||
|
|
|
|
|
| |||||||
Total | 1,554.4 | 2,240.8 | 6,811.8 | |||||||||
|
|
|
|
|
| |||||||
Our bills and accounts payable increased from approximately RMB1,554.4 million as of December 31, 2010 to RMB2,240.8 million as of December 31, 2011, primarily due to an increase in financing activitiesaccounts payable of Yancoal Australia due to its acquisitions and related increase in 2008 wasoperational costs during the year. Our bills and accounts payable increased from approximately RMB921.7RMB2,240.8 million reflectingas of December 31, 2011 to RMB6,811.8 million as of December 31, 2012, primarily dividend paymentsdue to an increase in bills payable related to a capital return of approximately RMB836.1RMB3,836.6 million to former Gloucester shareholders.
The following table sets forth an aging analysis of our bills and accounts payables based on the repaymentapplicable invoice dates as of bank borrowings of approximately RMB72.0 million.the dates indicated:
| As of December 31, | ||||||||||||
| 2010 | 2011 | 2012 | ||||||||||
| (RMB in millions) | ||||||||||||
1 - 90 days | 1,321.1 | 1,790.7 | 6,384.2 | |||||||||
91 - 180 days | 78.6 | 257.4 | 224.5 | |||||||||
181 - 365 days | 23.6 | 60.9 | 68.6 | |||||||||
Over 1 year | 131.0 | 131.8 | 134.4 | |||||||||
|
|
|
|
|
| |||||||
Total | 1,554.4 | 2,240.8 | 6,811.8 | |||||||||
|
|
|
|
|
| |||||||
The average credit period for accounts payable and bills payable is 90 days. We have financial risk management policies in place to ensure that all payables are settled within the applicable credit timeframe.
Other Payables and Accrued Expenses
The following table sets forth our other payables and accrued expenses as of the dates indicated:
| As of December 31, | ||||||||||||
| 2010 | 2011 | 2012 | ||||||||||
| (RMB in millions) | ||||||||||||
Customers’ deposit | 1,378.8 | 1,523.6 | 1,368.7 | |||||||||
Accrued wages | 823.7 | 1,047.1 | 1,084.2 | |||||||||
Other taxes payable | 280.0 | 431.7 | 204.1 | |||||||||
Payables in respect of purchases of property, plant and equipment and construction materials | 324.1 | 2,733.7 | 3,662.8 | |||||||||
Accrued freight charges | 5.5 | 3.9 | 9.4 | |||||||||
Accrued repairs and maintenance | 24.2 | 35.0 | 51.2 | |||||||||
Accrued utility expenses | 8.5 | — | — | |||||||||
Staff welfare payable | 96.5 | 94.1 | 187.6 | |||||||||
Withholding tax payable | 0.3 | 0.6 | 7.3 | |||||||||
Deposits received from employees | 9.9 | 12.8 | 24.7 | |||||||||
Coal price adjustment fund | 36.0 | 47.1 | 52.0 | |||||||||
Accrued land subsidence, restoration, rehabilitation and environmental costs | 0.7 | 0.5 | 1.4 | |||||||||
Payable on compensation fee of mining rights | 412.9 | 552.7 | — | |||||||||
Interest payable | 12.7 | 243.4 | 395.8 | |||||||||
Others | 407.1 | 618.5 | 1,964.5 | |||||||||
|
|
|
|
|
| |||||||
Total | 3,821.0 | 7,344.8 | 9,013.8 | |||||||||
|
|
|
|
|
| |||||||
Our other payables and accrued expenses increased from approximately RMB3,821.0 million as of December 31, 2010 to RMB7,344.8 million as of December 31, 2011, primarily due to increase in wages payable, interest payable, advances from customers, other tax payables and mining rights fees. Our other payables and accrued expenses increased from approximately RMB7,344.8 million as of December 31, 2011 to RMB9,013.8 million as of December 31, 2012, primarily due to an resources compensation disbursement of RMB443 million payable to Yankuang Group and a deferred income liability of RMB298 million as the result of the merger with Gloucester.
Working Capital and Liabilities
We have historically maintained sufficient working capital for our operations. Our principal source of cash in 20102012 was bank borrowings and cash generated from operating activities.activities, the RMB Bond Offering, the US$ Bond Offering and bank borrowings.
As of December 31, 2010,2012, we recorded net current assets of approximately RMB14,147.5RMB1,659.7 million. Our current assets increaseddecreased by RMB4,280.4RMB148.7 million, from RMB30,431.1 million as of December 31, 2011 to RMB30,282.4 million as of December 31, 2012, primarily as a result of a RMB5,293.4 million, or 112.1%,decrease in term deposits of approximately RMB6,356.3 million. The decrease was partially offset by an increase in billsbank balances and accounts receivablecash of approximately RMB4,572.1 million and a RMB759.8 millionan increase in inventories.prepayments and other receivables of approximately RMB572.1 million. Our current liabilities decreased by RMB276.5RMB6,098.8 million, from approximately RMB10,410.4RMB34,721.5 million in 2009as of December 31, 2011 to approximately RMB10,133.9RMB28,622.7 million in 2010. The decrease in current liabilities wasas of December 31, 2012, primarily due to thea decrease in borrowings due within one year of RMB983.2approximately RMB11,875.9 million. The decrease was partially offset by an increase in bills and accounts payables of approximately RMB4,570.9 million and the decreasean increase in other payables and accrued expenses of RMB620.9approximately RMB1,669.0 million. The change in net current assets was primarily due to the increase in sales and profits during the year.
As of December 31, 20102011 and 2009,2012, we had cash and cash equivalents of approximately RMB6,771.3RMB8,145.3 million and RMB8,522.4RMB12,717.4 million, respectively. Our cash and cash equivalents primarily consist of cash on hand and demand deposits with original maturities of three months or less that are placed with banks and other financial institutions. As of December 31, 2010, our total cash and cash equivalents denominated in Renminbi amounted to approximately RMB5,122.2 million and our total cash and cash equivalents denominated in U.S. dollars, Hong Kong dollars, Australian dollars, Pound Sterling and Euro amounted to approximately RMB1,649.1 million.
We have, and in the future may continue to have, substantial debts. As of December 31, 2010, our long-term debt to equity ratio was 59.8%. The interest expenses associated with these debts may impair our future profitability. We expect that cash from operations and borrowings will be sufficient to meet our operating cash flow requirements for at least the next twelve months, although certain events that materially and adversely affect our operating results may also have a negative impact on our liquidity. In addition, we cannot assure you that financing will be available in the amounts we need or on terms acceptable to us, if at all.
As of December 31, 2010, our2011 and 2012, we had outstanding bank borrowings increased toof approximately RMB23,015.8RMB34,457.8 million from approximately RMB22,509.8and RMB40,996.4 million, as of December 31, 2009.respectively. The following table sets forth the maturity profile of our bank borrowings as of the dates indicated:
| As of December 31, | As of December 31, | |||||||||||||||
| 2009 | 2010 | 2011 | 2012 | |||||||||||||
| (RMB in thousands) | (RMB in millions) | |||||||||||||||
Less than one year | 1,598,113 | 614,925 | 19,588.5 | 7,712.6 | ||||||||||||
One to three years | 8,347,091 | 14,735,445 | 13,598.3 | 2,079.9 | ||||||||||||
Three to five years | 12,498,637 | 7,621,388 | 1,249.0 | 7,593.1 | ||||||||||||
More than five years | 66,000 | 44,000 | 22.0 | 23,610.8 | ||||||||||||
|
| |||||||||||||||
Total | 22,509,841 | 23,015,758 | 34,457.8 | 40,966.4 | ||||||||||||
|
| |||||||||||||||
As of December 31, 2010,2012, the interest rates relating to our bank borrowings ranged from 1.05%1.06% to 7.6%7.74% per annum. The interest rates for these bank borrowings are variable rates that are subject to adjustment based on the interest ratesrate set by the PBOC, LIBOR or BBSY. As of December 31, 2010,2012, all of our bank loans carry variable interest rates. As of the date of this annual report, our bank borrowings were denominated in Renminbi and U.S. dollars. As of December 31, 2010,2012, our total bank loans denominated in Renminbi amounted to approximately RMB154RMB13,493.5 million, while our total bank loans denominated in U.S. dollars andamounted to approximately US$4,162.0 million, our total bank loans denominated in Australian dollars amounted to approximately US$3,040A$35.6 million and A$284our total bank loans denominated in Euro amounted to approximately €130.2 million respectively. See Note 35 to37 of the consolidated financial statements for more information on our borrowings. The interest expenses and exchange rate fluctuations associated with our bank borrowings may impair our future profitability.
We have, and in the future may continue to have, substantial debt. As of December 31, 2012, our long-term debt to equity ratio was 67.8%. The interest expenses associated with these debts may impair our future profitability.
Capital Expenditures
Our principal capital expenditures, which was incurred for the purchase and construction of property, plant and equipment, decreased by RMB2,825.7RMB6,604.1 million, or 44.2%49.9%, from approximately RMB6,387.8RMB13,227.7 million in 20092011 to approximately RMB3,562.1RMB6,623.6 million in 2010.2012. The decrease werewas primarily due to a decrease of RMB1,628.2 million in the capital expenditureexpenditures of Ordos Neng Hua of approximately RMB6,418.5 million and a decrease in the capital expenditures of Yancoal International (Holding) of approximately RMB1,200.8 million. The decrease was partially offset by an increase in the capital expenditures of Heze Nenghua of approximately RMB335 million and an increase in the capital expenditures of Yancoal Australia for the purchases of property, plant and equipment, a decreased of RMB789.8 million the capital expenditure of Hua Ju Energy for the purchases of property, plant and equipment and a decrease of RMB390.3 million in capital expenditure of Heze Nenghua for the purchases of property, plant and equipment.approximately RMB615.7 million.
Our estimated capital expenditureexpenditures for 2011 is RMB5,103.12013 are in the amount of RMB12,004.6 million. The table below sets forth our estimated capital expenditure for 2011 and capital expenditure we incurred in 2010.
Companies | Estimated capital expenditure for 2011 | Capital expenditure incurred in 2010 | ||||||
| (RMB in millions) | ||||||||
The Company | 1,200.4 | 1,210.4 | ||||||
Shanxi Nenghua | 38.1 | 14.5 | ||||||
Yancoal Australia | 1,636.8 | 2,093.5 | ||||||
Yulin Nenghua | 44.9 | 59.4 | ||||||
Heze Nenghua | 720.5 | 134.8 | ||||||
Huaju Energy | 67.7 | 41.6 | ||||||
Ordos Neng Hua | 1,353.5 | 7.9 | ||||||
Haosheng Company | 41.2 | — | ||||||
Total | 5,103.1 | 3,562.1 | ||||||
We plan to finance our capital commitments primarily through a combination of funds generated from operations, bank loansborrowings and other external financing arrangements. Currently,the proceeds of the offerings of corporate bonds. The following table sets forth our estimated capital expenditures for 2013 and actual capital expenditures we have sufficient cash and financing channels from commercial banks, which we expect are sufficient to satisfy the capital demand for operation and development.incurred in 2012.
Companies | Estimated capital expenditure for 2013 | Capital expenditure incurred in 2012 | ||||||
| (RMB in millions) | ||||||||
The Company | 2,086.9 | 1,355.4 | ||||||
Shanxi Nenghua | 41.6 | 16.5 | ||||||
Yulin Nenghua | 27.9 | 23.9 | ||||||
Heze Nenghua | 1,540.3 | 560.8 | ||||||
Huaju Energy | 44.8 | 35.1 | ||||||
Ordos Neng Hua | 3,418.2 | 2,026.1 | ||||||
Haosheng Company | 672.8 | — | ||||||
Yancoal Australia | 3,233.9 | 2,161.4 | ||||||
Yancoal International (Holding) | 938.2 | 444.4 | ||||||
|
|
|
| |||||
Total | 12,004.6 | 6,623.6 | ||||||
|
|
|
| |||||
| C. | Research and Development, Patents and Licenses, Etc. |
One of our core strategies is to maintain our competitiveness and increase the efficiency of our mining operations through technology and innovation. In line with our development strategy with a focus on technology innovation, we have established a multi-layermultilayer system consistsfor integrating new technology into our operations consisting of various entities, including a technology committee, a professional committee, a technology center, as well as relationships with external institutions or organizations with specialized technology development capacities. We completed 81 technology projects, obtained 24 patentshave accumulated extensive experience and wereexpertise in coal mining and coal processing procedures, particularly with respect to the underground raw coal mining technology. For example, our independently developed longwall top caving mining method has been adopted by various international coal mining enterprises such as DBT and has been awarded 78 technology advance prizes in 2010. At the same time, we focused on strengthening our environmental protection capabilities and improving our energy conservation technologies. As a result, we won the State Scientific and Technological Progress Award (Second Class) by the National Office for our “ResearchScience and DevelopmentTechnology Awards of the Fully Mechanized Top Coal Caving Mining TechnologyPRC in 2009. In 2012, we completed 140 technology improvement projects, obtained 47 patents and Equipmentreceived 30 technological awards, which have enhanced our coal mining and its Domestic and International Applications”.related business operations. Our expenditures for research and development were RMB106.5RMB70.6 million, RMB46.3RMB119.2 million and RMB70.6RMB301.6 million in 2008, 20092010, 2011 and 2010,2012, respectively, accounting for 0.4%0.2%, 0.2% and 0.2%0.5%, respectively, of our total revenuesales income for the same periods.
Our mining technology research and development efforts on mining technology have contributed to increases in our production. Our predecessor first adopted the longwall top caving mining method in 1992. Thereafter, our research and development personnel concentratedSince then, we have focused on modifying and updating this method, taking into account the distinct geological conditions of our mining operations with the goal of maximizing production. Largely because ofoperations. Due to our research and development personnel’s efforts, we have been able to:have:
increaseincreased our production efficiency by utilizing improved mining extracting equipment with improved technology;extraction equipment;
extendextended the length of certain longwall work-facescoal mine faces to approximately 300 meters, thereby reducingwhich reduced our costs for tunneling, support equipment and supports;related costs;
reducereduced the number of coal pillars required to support mining areas, and enhancethereby enhancing our recovery rate for coal mining and thereby increase our coal production;recovery;
improve the roof support and auxiliary coal transportation systems ofpatented our mining systems to reduce costs;
|
patent our industry-leadingadvanced technology for longwall top caving mining in the PRC, Australia and South Africa. We believe the use of our longwall caving extraction technology reduces the per tonneper-tonne production cost of our operations;
|
conducted research projects that contributed to the development and export of the technology for advanced two-pillar hydraulic roof supports for the top coal caving process; Bucyrus International, Inc., the largest coal mining equipment supplier worldwide, signed a technology license agreement to manufacture and use the longwall top caving coal mining equipment in Australia;
|
cooperated with Peabody to trial and commercialize longwall top caving coal mining equipment; and
|
implemented various innovative projects to improve equipment installation, safety, energy conservation and environmental protection measures in our coal mining operations.
We intend to further strengthenfocus our competitive advantage in core technologies with a focusfuture research and development efforts on upgrading and improving our longwall caving extraction technology, fully-mechanizedfully mechanized caving operations and related equipment as well asand mining methods for medium and thick coal seams.
| D. | Trend Information |
Integration of Felix
The acquisition of Felix is a key component of our growth and international expansion strategy. Following the integration of Felix’s business and assets with our pre-existing Australian operations, we intend to ramp up production at our Australian operations. Going forward, our Australian operations are expected to make substantial contributions to our total production volume and results of operations. Our ability to achieve our sales goals for our Australian operations will largely depend on our degree of success in realizing the anticipated benefits and synergies of the Felix acquisition. In 2010, we acquired 30% of the equity interests held by Austral-Asia Coal Holdings Pty Ltd, a wholly-owned subsidiary of Singapore IMC Group, in the Ashton Coal Mine Joint Venture. As of the date of this annual report, Felix’s control in the Ashton Coal Mine Joint Venture increased from 60% to 90%. In addition, we disposed of our 51% equity interest in the Minerva Coal Mine Joint Venture in 2010 that was originally held through Felix, and, since completion of the disposal, no longer have any interests in the Minerva Coal Mine Joint Venture.
Development in Ordos City of Inner Mongolia
We established Ordos Neng Hua on December 18, 2009 as our wholly-owned subsidiary in Inner Mongolia Autonomous Region. Ordos Neng Hua will act as our investment management platform for coal mining, coal chemicals and a coal power project in Inner Mongolia. Our ability to achieve our sales goals for our operations in Inner Mongolia will largely depend on our degree of success in realizing the anticipated benefits and synergies of our investment in Inner Mongolia through Ordos Neng Hua. In 2010, we successfully completed the acquisition of 100% equity interests in a 600,000-tonne methanol project, the acquisition of a 51% equity interest in Haosheng Company, the acquisition of the entire assets of Anyuan Coal Mine and obtaining the mining rights of Zhuan Longean Coal mine field through public competitive bidding.
Outlook for the Coal Market
Benefiting from the recoveringThe global economy, demand for coal in 2011economic recovery is expected to continue to increase whilebe slow in 2013. We expect the demand and supply of coal in both the domestic or international market may become moderately tight. In line with the objectives set forth in China’s “Twelfth Five-Year Plan” issued in 2011, the domestic economy is expected to continue to grow. Growth in the domestic economy is expected to drive growth of major coal consumption industries, which in turn is expected to increaseand domestic coal demand at a stable pace. However, the increase of coal supply in China will be restricted by the further consolidation of the domestic coal industry guided by the national policy to control the increase of overall national coal production capacity and production volume, through various measures, including the elimination of outdated production capacity and closing of small-sized coal mines. In addition, although rapid development of coal resources in Western China will increase the supply of coal in this region, because the major domestic coal consumers are in Eastern China, the effective supply of coal is expected to remain restricted. As a result of the foregoing factors affecting supply and demand, coal prices in China are expected to increase, but to continuemarkets to be subjectrelatively balanced. The PRC government has continued to fluctuations.
The coal supply infocus on proactive macroeconomic control policies, expanding domestic demand, restructuring the international market is also expected to be tight in 2011 as well,PRC economy and implementing urbanization reforms, as a result of which, we expect the limited increase of production volume in major coal exporting countries. For example, coal production and rail transportation in Australia will be negatively impacted due to the continuing effects of the largest flood in Australia in decades, while exports from South Africa, Indonesia and Russia are not expected to make up for this shortfall due to inadequate infrastructure in these countries, such as railways and ports. Increase of coal prices is expected to be primarily supported by demand from China and India, as well as from Japan. Although demand for coal in Japan was adversely affected by the major earthquake and tsunami experienced in Northeast Japan, demand for coal in Japan is expected to increase once it recovers from the effects of these events and commences reconstruction of its infrastructure in affected areas.
will increase. Our average selling price of coal is expected to increasefluctuate slightly in 20112013 compared with 2010.2012. As of the date of this annual report, the Company hasMarch 31, 2013, we have entered into sales contracts anddomestic letters of intent forto sell a total of approximately 32.433.5 million tonnes of domestic coalcoal. The sales which included sales contracts forprice under the letters of intent will be determined at the time of sale. In addition, as of March 31, 2013, Yancoal Australia and Yancoal International have entered into agreements to sell an aggregate approximately 9.016.31 million tonnes of coal with an average tax-inclusive price that represented an increasein the first quarter of 1.2% compared with our average selling price in 2010. The2013 at a tax-exclusive price of US$102.7 per tonne, which was lower than the remaining coal to be sold pursuant to the letters of intent with the amount of approximately 23.4 tonnes will be based on prevailing market prices at the time of sale.
Our average selling price of coal produced by Yancoal Australia is expectedUS$133.7 per tonne in the first quarter of 2012. We intend to increase significantly in 2011 as compared with 2010. Yancoal Australia has entered into sales contracts for 2.66sell approximately 89.9 million tonnes of coal sales from January 2011 to March 2011, with an average selling price of US$133.4 per tonne. Our coal sales target for 2011 is 54 million tonnes.in 2013.
Outlook for the PRC Methanol Market
In 2011,2013, we expect that supply will continue to exceed demand in the domestic methanol market, making material increases in methanol prices unlikely. The gradual increase in production capacities of the newly built and existing domestic methanol facilities coupled with an increase in the imports of low cost foreign prime methanol, will further increase the domestic supply of methanol.market. The demand for methanol remains weak due to overproduction of downstream products such as methanol, dimethylethergovernmental control policies with respect to the property market and acetic acid. However, methanol supplyanti-dumping and demand factors are expected to become more balanced withcountervailing trade sanctions in the accelerated elimination of outdated production capacity and promotion of methanol fuel for vehicles, together with the antidumping measures imposed on methanol imports by certain countries. On the other hand, increases in prices of raw materials, including coal and natural gas, electricity and transportation costs will stimulate increases in methanol prices. Our methanol sales target for 2011 is 610,000 tonnes.
| E. | Off-balance Sheet Arrangements |
As of December 31, 2010,2012, other than the capital expenditure commitments discussed in “B. Liquidity and Capital Resources” above, and contractual obligations discusseddisclosed in “F. Contractual Obligations” below,this annual report, we did not have any off-balance sheet arrangements.
| F. | Tabular Disclosure of Contractual Obligations |
The following table sets forth our contractual obligations and commercial commitments as of December 31, 2010:2012:
| Payments Due by Period | ||||||||||||||||||||
| Total | Less than one Year | One to three years | Three to five years | More than five years | ||||||||||||||||
| (RMB’000) | ||||||||||||||||||||
Contractual Obligations | ||||||||||||||||||||
Unsecured bank borrowings(1) | 946,240 | 156,278 | 701,962 | 44,000 | 44,000 | |||||||||||||||
Secured bank borrowings(1) | 21,247,514 | 375,978 | 13,851,694 | 7,019,842 | — | |||||||||||||||
Finance leases(2) | 822,004 | 82,669 | 181,789 | 557,546 | — | |||||||||||||||
Capital commitments for the acquisition of assets(3) | 1,021,911 | 1,021,911 | — | — | — | |||||||||||||||
Amounts due to Controlling Shareholder and its subsidiaries(4) | 438,783 | 438,783 | — | — | — | |||||||||||||||
Total | 24,476,452 | 2,075,619 | 14,735,445 | 7,621,388 | 44,000 | |||||||||||||||
Note:
We established Ordos Neng Hua on December 18, 2009 as our wholly-owned subsidiary in Inner Mongolia Autonomous Region. As of December 31, 2010, we have made deposits of RMB2,045.8 million and RMB1,080 million for the acquisitions of equity interests in Haosheng Company and assets of Anyuan Coal Mine, respectively. We established Yushuwan Coal Mine Company jointly with Chia Tai Energy & Chemicals Company Limited and Yushen Coal Company Limited in 2006. We are obligated to invest approximately RMB196.8 million for 41% of the equity interests in Yushuwan Coal Mine Company. As of December 31, 2010, we have made a deposit of approximately RMB117.93 million and are obligated to further invest approximately RMB78.87 million.
| Payments Due by Period | ||||||||||||||||||||
| Total | Less than one Year | One to three years | Three to five years | More than five years | ||||||||||||||||
| (RMB in millions) | ||||||||||||||||||||
Contractual Obligations | ||||||||||||||||||||
Unsecured bank borrowings | 8,900.1 | 5.024.5 | 1,076.0 | 2,799.6 | — | |||||||||||||||
Secured bank borrowings | 18,625.7 | 657.9 | 910.0 | 880.8 | 16,177.0 | |||||||||||||||
Finance leases | 232.7 | 30.2 | 93.9 | 93.9 | 14.7 | |||||||||||||||
Guaranteed notes | 11,237.8 | — | — | 3,818.8 | 7,419.1 | |||||||||||||||
Capital commitments for the acquisition of assets | 2,937.1 | 2.871.8 | 65.3 | — | — | |||||||||||||||
Amounts due to Controlling Shareholder and its subsidiaries | 93.7 | 93.7 | — | — | — | |||||||||||||||
|
|
|
|
|
|
|
|
|
| |||||||||||
Total | 42,027.1 | 8,678.1 | 2,145.2 | 7,593.1 | 23,610.8 | |||||||||||||||
|
|
|
|
|
|
|
|
|
| |||||||||||
The following table sets forth our consolidated interest-bearing borrowings as of December 31, 20092011 and 2010:2012:
| As of December 31, | As of December 31, | |||||||||||||||
| 2009 | 2010 | 2011 | 2012 | |||||||||||||
| (RMB’000) | (RMB in millions) | |||||||||||||||
Secured bank borrowings | 21,677,138 | 21,247,514 | 19,154.7 | 18,625.7 | ||||||||||||
Unsecured bank borrowings | 176,000 | 946,240 | 15,303.1 | 8,900.1 | ||||||||||||
|
| |||||||||||||||
Total | 21,753,138 | 22,193,754 | 34,457.8 | 27,525.9 | ||||||||||||
|
| |||||||||||||||
Secured Bank Borrowings
As of December 31, 2010, the balance of our2012, we had secured bank loans amounted tooutstanding of approximately RMB21.2 billionRMB18,625.7 million (approximately US$3.0 billion)2,989.6 million), which primarily consistconsisted of our secured bank borrowings obtained for financing the acquisition of Felix in 2009 which amounted to approximately RMB20.1 billion, whichFelix. The borrowings are guaranteed by us,the Company and counter-guaranteed by our Controlling Shareholder. The borrowings are secured by a counter guarantee by Yankuang Group and secured byportion of our term deposit, and three short-term loans in the amountdeposits. As of December 31, 2012, we had term deposits of approximately A$24.0RMB66.4 million (equivalentthat secured bank borrowings.
Borrowings of RMB12,148.5 million (US$1,930.0 million) carried interest at three-month LIBOR plus a margin of 0.75% (approximately 1.06%) and borrowings of RMB283.3 million (US$45.0 million) carried interest at three-month LIBOR plus a margin of 0.8% (approximately 1.11%). The borrowings of approximately RMB6,072.1 million (approximately US$964.7 million) carried interest at three-month LIBOR plus 2.8% (approximately 3.11%). Other borrowings incurred in connection with our acquisition of Gloucester, amounting to approximately RMB161.1RMB121.8 million, (approximately US$19.4 million) obtained by Yancoal Australia in 2010 for its general business operations, which were secured by, among other things, property, plant and equipment.carried interest at 5.68%. For more information on our secured borrowings, please see Note 3537 to the consolidated financial statements.
Unsecured Bank Borrowings
Our RMB946.2 million balance ofWe had unsecured bank loansborrowings of RMB8,900.1 million as of December 31, 2010 primarily representing the balance of2012, including a borrowingloan in the amount of RMB154.0 million, obtained by Tianchi Energy,RMB1.3 billion (US$203 million), carrying interest at LIBOR plus a subsidiarymargin of Shanxi Nenghua and the balance of a borrowing in the amount of RMB792.2 million (A$118.0 million)1.7% per annum, obtained by Yancoal Australia.International to replace the other loans for the acquisition of potash exploration permits in Canada. For more information about our unsecured borrowings, please see Note 3537 to the consolidated financial statements.
Bond Offerings
Tianchi Energy entered into a long-term loan agreement with the State Development Bank of China in 2006 to borrow RMB220.0 million. The loan is repayable by 20 installments over a period of 117 months, with the first installment due in May 2008. The initial interest rateRMB Bond Offering
See “Item 4. Information on the loans was 6.12% per annum, which is subject to adjustments basedCompany – A. History and Development of our Company – Bond Offerings – the RMB Bond Offering.”
The US$ Bond Offering
See “Item 4. Information on interest rates set by the PBOC. The amount is guaranteed byCompany – A. History and Development of our Company – Bond Offerings – the Yankuang Group.
The balance of unsecured bank loan as of December 31, 2010 was also due to the balance of the borrowing in the amount of approximately RMB792.2 million (approximately A$118.0 million) obtained by Yancoal Australia, carried annual interest at three-month BBSY plus a margin of 1.5% (approximately 6.3%).
For more information on our unsecured borrowings, please see Note 35 to financial statements.US$ Bond Offering.”
Amounts due to Controlling Shareholder and its Subsidiaries
We acquired Jining III Coal Mine on January 1, 2001 pursuant to the Acquisition Agreement of Jining III Coal Mine, which we entered into with the Controlling Shareholder on August 4, 2000. Pursuant to the Jining III Acquisition Agreement, we agreed to purchase the mining rights of Jining III for approximately RMB132.5 million. This amount is to be paid to the Controlling Shareholder in ten interest-free equal annual installments beginning 2001. In 2010, we paid approximately RMB13.2 million to the Controlling Shareholder for the mining rights of Jining III Coal Mine.
The amounts due to the Controlling Shareholder and its subsidiary companies do not bear any interest and are unsecured. The following table sets forth the amounts due to the Controlling Shareholder and its subsidiary companies as of December 31, 20092011 and 2010.2012.
| As of December 31, | As of December 31, | |||||||||||||||
| 2009 | 2010 | 2011 | 2012 | |||||||||||||
| (RMB’000) | (RMB’000) | |||||||||||||||
Term for Repayment | ||||||||||||||||
Within one year | 757,882 | 438,783 | 1,155,168 | 1,767,998 | ||||||||||||
More than one year, but not exceeding two years | — | — | — | — | ||||||||||||
|
| |||||||||||||||
Total due | 757,882 | 438,783 | 1,155,168 | 1,767,998 | ||||||||||||
Less: amounts due within one year | (757,882 | ) | (438,783 | ) | (1,155,168 | ) | (1,767,998 | ) | ||||||||
Amounts will due over one year | — | — | — | — | ||||||||||||
As of December 31, 2012, neither the Controlling Shareholder nor its subsidiaries had used our funds for non-operational matters.
Critical Accounting Policies
We prepare our consolidated financial statements in accordance with IFRS.IFRS as issued by the IASB. The preparation of these financial statements requires us to make estimates and assumptions about the carrying amounts of items in the financial statements that cannot be measured accurately. These judgments, estimates and assumptions are based on the historical experience of our management as well as other relevant factors. Actual results may differ from these estimates. We review the foregoing judgments, estimates and assumptions regularly on a going concern basis. Revisions to accounting estimates are recognized in the period in which the estimate is revised if the revision affects only that period or in the period of the revision and future periods if the revision affects both current and future periods.
The following are the critical estimates that we have made in the process of applying the accounting policies and that have the most significant effect on the amounts recognized in financial statements.
Depreciation
The cost of mining structures is depreciated using the units of production method based on the estimated production volume for which the structure was designed. Management exercises its judgment in estimating the useful lives of the depreciable assets and the production volume of each mine. The estimated coal production volume of each mine is updated on a regular basis and takes into account recent production and technical information of each mine. These changes are considered changes in estimateestimates for accounting purposes and are reflected on a prospective basis in related depreciation rates. Estimates of the production volumes are inherently imprecise and represent only approximate amounts because of the subjective judgments involved in developing such information.
Amortization of Assetsassets
CoalMining reserves, coalmining resources and rail access rights are amortized on a straight linestraight-line basis or unit of production basis over the shorter of their useful lives and the contractual period. The expensing of overburden removal costs is based on saleable coal production over the estimated economically recoverable reserves. The useful lives are estimated on the basis of the total proven and probable reserves of a coal mine. Proven and probable coal reserve estimates are updated on a regular basis and take into account each mine’s recent production and technical information.
Provision for Land Subsidence, Restoration, Rehabilitationland subsidence, restoration, rehabilitation and Environmental Costsenvironmental costs
The provision for land subsidence, restoration, rehabilitation and environmental costs is reviewed regularly to verify that it properly reflects the remaining obligation arising from the current and past mining activities. Provisions for land subsidence, restoration, rehabilitation and environmental costs are determined by our management based on past experience, its estimate of the current and future costs and predictions for government policies.
Impairment of Goodwillgoodwill
Determining whether goodwill is impaired requires an estimation of the value in use of the cash-generating units to which goodwill has been allocated. The determination of value in use requires the Companyus to estimate the future cash flows expected to arise from the cash-generatingcash generating unit and a suitable discount rate in order to calculate the present value. As of December 31, 2010,2012, the carrying amount of goodwill was approximately RMB1,196.6RMB2,573.8 million. During the year ended December 31, 2012, we recognized impairment loss on goodwill of RMB17.6 million. Cash flow projections during the budget period for each of the above units are based on the budgeted revenue and expected gross margins during the budget period and the raw materials price inflation during the budget period. Expected cash inflows/outflows have been determined based on past performance and management’s market development expectations. There is no material uncertainty regarding the carrying value
Estimated impairment of goodwill due to the profitability of the underlying reporting units.
Estimated Impairment of Property, Plantproperty, plant and Equipmentequipment
When there are indications of impairment, the Company takeswe take into consideration the estimate of future cash flows. The amount of the impairment loss is measured as the difference between the asset’s carrying amount and the present value of estimated future cash flows. When actual future cash flows are less than expected, a material impairment loss may arise. In estimating the future cash flows, management takes into account the recent production and technical advancements. As price and cost levels change from year to year, the estimate of future cash flows also changes. Notwithstanding that management has considered all the available information in making their impairment assessment, inherent uncertainty exists as to the conditions of mines and the environment, and actual write-offs may be higher than the estimated amounts. As of December 31, 2010,2012, the carrying amount of property, plant and equipment was approximately RMB19,874.6RMB39,503.1 million. In 2010, RMB1.5 million of construction in progressDuring the year ended December 31, 2012, no property, plant and equipment was written off as expenses. In addition, we recognized impairment loss on property, plant and equipment of RMB226.9 million during the year ended December 31, 2012.
In the process of applying our accounting policies, management has made the following accounting judgments:
Acquisitions
During the year, we acquired several subsidiaries or business as set out in Notes 45 and 46 to the consolidated financial statements included in this annual report. We determined whether acquisitions were to be accounted for as an acquisition of business or an acquisition of assets based on factors including (i) whether the acquiree has relevant input, process or output and (ii) whether the acquiree has planned principal activities or is pursuing a plan to produce output and has access to a customer base.
In addition, management also made judgments in determining whether we would register the transfer of certain operating licenses immediately upon the payment of consideration.
Recent Changes in Accounting Pronouncements
In the current year, we have applied, for the first time, a number of new standards and interpretations, amended and revised standards and interpretations (“new IFRSs”) issued by the IASB and the International Financial Reporting Interpretations Committee (the “IFRIC”) of the IASB which are effective for our fiscal year beginning January 1, 2010:2012:
IFRSs 7 (Amendments) | ||
The adoption of the New IFRS had no material effect on how the results and the financial position for the current or prior accounting years have been prepared. Accordingly, no prior period adjustment is required.
We have not applied the following new and revised standards, amendments or interpretations that have been issued but are not effective as of the date of this annual report:
IFRSs (Amendments) | Annual Improvements to IFRSs | |
IFRS 7 (Amendments) | Disclosures – | |
IFRS 9 | Financial Instruments | |
IFRS 10 | Consolidated Financial Statements | |
IFRS 11 | Joint Arrangements | |
IFRS 12 | ||
IFRS 10, IFRS 11 and IFRS 12 (Amendments) | Consolidated Financial Statements, Joint Arrangements and Disclosure of Interests in Other Entities: Transition Guidance1 | |
IFRS 13 | Fair Value Measurement | |
IAS | ||
IAS 19 (Revised) | Employee Benefits1 | |
IAS 28 | Investments in Associates and Joint Ventures | |
IAS | ||
IFRIC 20 | Stripping Costs in the Production Phase of a Surface Mine1 |
| (1) | Effective for annual periods beginning on or after |
| (2) | Effective for annual periods beginning on or after |
| (3) | Effective for annual periods beginning on or after |
| (4) | Effective for annual periods beginning on or after January 1, |
Under IFRS 9, Financial Instruments introduces new requirements for the classification and measurement of financial assets and will be effective from January 1, 2013, with earlier application permitted. The standard requires all recognized financial assets that are within the scope of IAS 39 Financial Instruments: Recognition and Measurement to beare subsequently measured at either amortized cost or fair value. Specifically, debt investments that (i) are held within a business model whose objective is to collect the contractual cash flows, and (ii)that have contractual cash flows that are solely payments of principal and interest on the principal outstanding are generally measured at amortized cost.cost at the end of subsequent accounting periods. All other debt investments and equity investments are measured at their fair value.values at the end of subsequent accounting periods.
In relation to financial liabilities, the significant change relates to financial liabilities that are designated as at fair value through profit or loss. Specifically, under IFRS 9, for financial liabilities that are designated as at fair value through profit or loss, the amount of change in the fair value of the financial liability that is attributable to changes in the credit risk of that liability is presented in other comprehensive income, unless the presentation of the effects of changes in the liability’s credit risk in other comprehensive income would create or enlarge an accounting mismatch in profit or loss. Changes in fair value attributable to a financial liability’s credit risk are not subsequently reclassified to profit or loss. Previously, under IAS 39, the entire amount of the change in the fair value of the financial liability designated as at fair value through profit or loss was presented in profit or loss.
IFRS 10 replaces the consolidation guidance in IAS 27 Consolidated and Separate Financial Statements and SIC-12 Consolidation — Special Purpose Entities by introducing a single consolidation model for all entities based on control, irrespective of the nature of the investee (i.e., whether an entity is controlled throughby voting rights of investors or throughby other contractual arrangements as is common in special purpose entities). Under IFRS 10, control is based on whether an investor has 1)(1) power over the investee; 2)(2) exposure, or rights, to variable returns from its involvement with the investee; and 3)(3) the ability to use its power over the investee to affect the amount of the returns.
IFRS 11 introduces new accounting requirements for joint arrangements, replacing IAS 31 Interests in Joint Ventures. The option to apply the proportional consolidation method when accounting for jointly controlled entities ishas been removed. Additionally, IFRS 11 eliminates jointly controlled assets to now only differentiate between joint operations and joint ventures. A joint operation is a joint arrangement whereby the parties that have joint control have rights to the assets and obligations for the liabilities. A joint venture is a joint arrangement whereby the parties that have joint control have rights to the net assets.
IFRS 12 requires enhanced disclosures about both consolidated entities and unconsolidated entities in which an entity has involvement. The objective of IFRS 12 is to require information so that financial statement users may evaluate the basis of control, any restrictions on consolidated assets and liabilities, risk exposures arising from involvements with unconsolidated structured entities and non-controlling interest holders’ involvement in the activities of consolidated entities.
IFRS 13 applies when another IFRS requires or permits fair value measurements or disclosures about fair value measurements (and measurements such as fair value less costs to sell, based on fair value or disclosures about those measurements), except for certain exemptions. IFRS 13 requires the disclosures of fair values through a ‘fair value hierarchy’. The hierarchy categorisescategorizes the inputs used in valuation techniques into three levels. The hierarchy gives the highest priority to (unadjusted) quoted prices in active markets for identical assets or liabilities and the lowest priority to unobservable inputs. If the inputs used to measure fair value are categorisedcategorized into different levels of the fair value hierarchy, the fair value measurement is categorised in its entirety in the level ofcategorized entirely at the lowest level input that is significant to the entire measurementmeasurement.
The requirements relatingIAS 1 (Amendments) retain the option to present profit or loss and other comprehensive income in either a single statement or in two separate financial statements are unchanged and are includedbut consecutive statements. However, IAS 1 (Amendments) requires additional disclosures to be made in the amendedother comprehensive income section such that items of other comprehensive income are grouped into two categories: (1) items that will not be reclassified subsequently to profit or loss; and (2) items that may be reclassified subsequently to profit or loss when specific conditions are met. Income tax on items of other comprehensive income is required to be allocated on the same basis. IAS 27.1 (Amendments) are effective for annual periods beginning on or after July 1, 2012. The presentation of items of other portionscomprehensive income will be modified accordingly when the amendments are applied in the future accounting periods.
IFRIC 20 Stripping Costs in the Production Phase of a Surface Mine applies to waste removal costs that are incurred in surface mining activity during the production phase of the mine (“production stripping costs”). Under this Interpretation, the costs from this waste removal activity (“stripping”) which provide improved access to ore are recognized as a non-current asset (“stripping activity asset”) when certain criteria are met, whereas the costs of stripping activities where the benefit is realized in the form of inventory produced are accounted for in accordance with IAS 272 Inventories. The stripping activity asset is accounted for as an addition to, or as an enhancement of, an existing asset and classified as tangible or intangible according to the nature of the existing asset of which it forms part. When the costs of the stripping activity asset and the inventory produced are replacednot separately identifiable, production stripping costs are allocated between the inventory produced and the stripping activity asset by IFRS 10.
IAS 28using an allocation basis that is amended for conforming changes based on a relevant production measure. IFRIC 20 is effective for annual periods beginning on or after January 1, 2013. Under the issuanceexisting policy, the Company separately present the stripping costs on the balance sheet. Upon the subsequent adoption of IFRS 10, IFRS 11 and IFRS 12.the Interpretation, the presentation on the balance sheet will be amended accordingly.
IAS 24 (Revised) clarifies and simplifies the definition of related party. It introduces certain exemptions on disclosure requirements in respect of transactions between government-related entities and government, and other government related entities.
Except for the abovementioned standards or interpretations, the Directors are evaluatingdirectors expect that the impact of application of other standards or interpretations will have no material impact on the Group’s future results and financial statements.
| G. | Safe Harbor |
See the section headed “Cautionary Statement Regarding Forward-Looking Statements”.
| ITEM 6. | DIRECTORS, SUPERVISORS, SENIOR MANAGEMENT AND EMPLOYEES |
| A. | Directors, Supervisors and Senior Management |
The following table sets forth selected information concerning our board of directors (“Board of Directors” or “Board”), board of supervisors and executive officers as of the date of this annual report. As of the date of this annual report, our Board of Directors consists of 11 directors, including one chairman, one vice chairmen,chairman, four independent directors and one employee director. All Directors serve three-year terms beginning their respective election date until the election of their respective successor.
As more than 50% of our voting power is held by the Controlling Shareholder, we are not required to have a majority of our Board be comprised of independent directors in reliance on the exemption provided under Section 303A of the NYSE Listing Rules.
The following table sets forth information on our directors, supervisors and executive officers:
Name | Age | Position at the Company | Date Term of Office Expires1 | |||
Directors | ||||||
LI Weimin | Chairman of the Board of Directors | May 2014 | ||||
WANG Xin | Vice Chairman of the Board of Directors | May 2014 | ||||
ZHANG Yingmin | Director, General Manager | May 2014 | ||||
|
|
|
| |||
SHI Xuerang | Director | May 2014 | ||||
WU Yuxiang | Director and Chief Finance Officer | May 2014 | ||||
ZHANG Baocai | Director, Deputy General Manager and Secretary of the Board of Directors | May 2014 | ||||
DONG Yunqing | Employee Director | May 2014 | ||||
Independent Non-executive Directors | ||||||
WANG Xianzheng | Independent Non-executive Director | May 2014 | ||||
CHENG Faguang | Independent Non-executive Director | May 2014 | ||||
WANG Xiaojun | Independent Non-executive Director | May 2014 | ||||
XUE Youzhi | Independent Non-executive Director | May 2014 | ||||
Supervisors | ||||||
SONG Guo | Chairman of Supervisory Committee | May 2014 | ||||
ZHOU Shoucheng | Deputy Chairman of Supervisory Committee | May 2014 | ||||
ZHANG Shengdong | Supervisor | May 2014 | ||||
ZHEN Ailan | Supervisor | May 2014 | ||||
WEI Huanmin | Employee Supervisor | May 2014 | ||||
XU Bentai | Employee Supervisor | May 2014 | ||||
Name | Age | Position at the Company | Date Term of Office Expires1 | |||
Other Management Team | ||||||
| ||||||
HE Ye | Deputy General Manager | May 2014 | ||||
LAI Cunliang | Deputy General Manager | May 2014 | ||||
TIAN Fengze | Deputy General Manager | May 2014 | ||||
SHI Chengzhong | Deputy General Manager | May 2014 | ||||
LIU Chun | 51 | Deputy General Manager | May 2014 | |||
NI Xinghua | Chief Engineer | May 2014 |
| (1) | The expiration of the term of office is generally the date of the shareholders’ meeting when a new session of the Board will be elected. Executives who retire in the interim are replaced at the next Board meeting. |
Executive Directors
LI Weimin, a researcher in engineering technique applications with a doctorate degree in mining engineering and holder of an EMBA degree. Mr. Lidegree, was appointed as chairmanChairman of our Board of Directors on December 30, 2010. Mr. Li joined the predecessor of the Company in 1982. In November 2002, Mr. Li was appointed as the managerManager of the Jining III Coal Mine. In August 2006, Mr. Li was appointed as the deputy chief engineerDeputy Chief Engineer and the deputy headDeputy Head of the Safety and Supervision Bureau of the Yankuang Group. In December 2007, Mr. Li was promoted to the headHead of the Safety and Supervision Bureau of the Yankuang Group. In May 2009, Mr. Li was appointed as the deputy general managerDeputy General Manager of the Yankuang Group. Mr. Li was appointed as the general managerGeneral Manager of the Company in July 2009 and was subsequently appointed as the vice chairmanVice Chairman of the Company in February 2010. On December 15, 2010, Mr. Li was appointed as a Director, the general managerGeneral Manager and the deputy secretaryDeputy Secretary of the party committeeParty Committee of the Yankuang Group. He is a graduate of China University of Mining and the Technology and Nankai University.
WANG Xin, a researcher in applied engineering technique applicationtechniques with a doctorate degree in engineering technology and an EMBA degree, is the vice chairmanVice Chairman of our Board.Board of Directors. Mr. Wang is actively involved in the Yankuang Group and serves as the chairmanChairman of the boardBoard and the party committee secretaryParty Committee Secretary for the Yankuang Group. Mr. Wang joined the Company’s predecessor in 1982 and became a vice general managerVice General Manager of the Yankuang Group in 2000. He was appointed a board director and vice general managerVice General Manager of the Yankuang Group in 2002 and was promoted to the vice chairmanVice Chairman of the board of directors and the general managerGeneral Manager of the Yankuang Group in 2003. Since 2007, he has been the party committee deputy secretaryParty Committee Deputy Secretary of the Yankuang Group. On December 30, 2010, Mr. Wang was appointed as the vice chairmanVice Chairman of the Board.Board of Directors. He is a graduate of China University of Mining and Technology and Nankai University.
ZHANG Yingmin, a researcher in applied engineering technology applicationtechniques with an EMBA degree, is the General Manager of the Company and a directorDirector of the Yankuang Group. Mr. Zhang joined the Company’s predecessor in 1971, appointed as the directorDirector of the divisionDivision of production technologyProduction Technology of the Yankuang Group in 1996 and became the head of Baodian Coal Mine in 2000. He was also appointed deputy general managerDeputy General Manager of the Yankuang Group in 2003 and the chiefChief of the safety supervision bureauSafety Supervision Bureau of the Company from 2004 to 2007. Mr. Zhang was appointed as the general managerGeneral Manager of the Company in 2011. Mr. ZhangHe is a graduate of Nankai University.
SHI Xuerang, a senior engineer with an EMBA degree, is a Director of our Board of Directors and deputy general managerDeputy General Manager of the Yankuang Group. From 2001 to 2003, Mr. Shi acted as the deputy general managerDeputy General Manager of the Xinwen Coal Mining Group Company Limited. He joined the Yankuang Group as a deputy general managerDeputy General Manager in 2003 and was appointed a Director of the Company in 2005. He is a graduate of Nankai University.
WU Yuxiang, a senior accountant with a mastermaster’s degree in accounting, has served as a Director and the chief financial officerChief Financial Officer of the Company since 2002. Mr. Wu joined the Company’s predecessor in 1981 and was appointed as the Company’s managerManager of the finance departmentFinance Department in 1997. He is a graduate of the Party School of Shandong Provincial Communist Committee.
ZHANG Baocai, a senior accountant with an EMBA degree, is a Director, deputy general managerDeputy General Manager and the board secretaryBoard Secretary of the Company. Mr. Zhang joined the Company’s predecessor in 1989 and was appointed as the head of the planningPlanning and finance departmentFinance Department of the Company in 2002. He was appointed as a Director and the board secretaryBoard Secretary of the Company in 2006 and a deputy general mangerDeputy General Manager of the Company in 2011. Mr. ZhangHe is a graduate of Nankai University.
DONG Yunqing, a professor-levelprofessional-level senior administrative officer, has served as a Director and the chairmanChairman of the labor union of the Company since 2002. Mr. Dong joined the Company’s predecessor in 1981 and was the vice chairmanVice Chairman of the labor union of Yankuang Group from 1996 to 2002. Mr. Dong was appointed as a Director and the chairmanChairman of the labor union of the Company in 2002. He is a graduate of the Central Communist Party School Correspondence Institute.
Independent Non-executive Directors
WANG Xianzheng, a professor-levelprofessional-level senior engineer with a university education, is currently a president of the China Coal Industry Association and a member of the sixteenth session of China Central Discipline Inspection Committee.Association. Mr. Wang was appointed as a vice ministerVice Minister of the Ministry of Coal Industry and a party member from April 1995 to March 1998. He was appointed as the deputy headDeputy Head of the State Coal Industry Bureau, deputy headDeputy Head and a party member of the State Administration of Coal Mine SafetySACMS from March 1998 to August 2000. Mr. Wang was the vice governorVice Governor of Shanxi provinceProvince from August 2000 to May 2002 and became a standing member of the provincial committeeProvincial Committee in October 2001. From May 2002 to February 2005, he was appointed as the headHead and the party committee secretaryParty Committee Secretary of the State Administration Bureau of Work Safety (the State Administration of Coal Mine Safety).SACMS. From February 2005 to May 2008, Mr. Wang was appointed as the deputy headDeputy Head and vice secretaryVice Secretary to the party committeeParty Committee of the State Administration of Work Safety. Mr. Wang has been the presidentPresident of the China Coal industry Association since January 2007. Mr. Wang is also an independent director of Beijing Haohua Energy Resource Company Ltd. He is a graduate of Fuxin School of Mining.
CHENG Faguang, is a senior accountant with a post-graduate education. Mr. Cheng was appointed as the vice governorVice Governor of the people’s governmentPeople’s Government of Ningxia Hui Autonomous Region from May 1988 to May 1992. He was a standing member and the execuitive vice governorExecutive Vice Governor of the party committeeParty Committee of Ningxia Hui Autonomous Region from May 1992 to March 1994. Mr. Cheng was appointed as the chairman, presidentChairman, President and secretarySecretary to the party committeeParty Committee of China Haohua Chemical (Group) Corporation, which was under the Ministry of Chemical Industry from March 1994 to May 1996. From May 1996 to May 2003, Mr. Cheng was the deputy headDeputy Head and a party member of the State Administration of Taxation.SAT. He was a member of the Financial and Economic Affairs Committee of the tenth National People’s Congress from March 2003 to March 2008. He is a graduate of the Central University of Finance and Economics.
WANG Xiaojun, a solicitor admitted in the PRC, Hong Kong and England and Wales, and Hong Kong, is a holder of a master’s degree in law and is a partner of Jun He Law Offices. He was admitted in the PRC, Hong Kong and England and Wales in 1988, 1995 and 1996, respectively. Mr. Wang has worked as a legal adviser in the Hong Kong Stock ExchangeHKSE and Richards Butler. He was an independent non-executiveIndependent Non-executive Director of the Company from 2002 to 2008. Meanwhile, Mr. Wang is also an independent non-executive director of the Guangzhou Shipyard International Company Limited, Zijin Mining Group Company Limited and Norinco International Cooperation Ltd and Euro-Asia Agricultural (Holdings) Company Limited.Ltd. He is a graduate of the People’s University of China and the Graduate School of the Chinese Academy of Social Sciences.
XUEXUE Youzhi, holder of a mastermaster’s degree in corporate management, a doctor’sdoctorate degree in economics and a doctor’spost-doctoral’s degree in business management, , is currently the vice president,Vice President, a professor and a doctoral tutor in the School of Business of Nankai University. Mr. Xue has extensive experience in economics management and completed various of projects supported by the National Social Science Fundation.Foundation. Mr. Xue became the vice deanVice Dean of the School of Business of Nankai University in 2005. Meanwhile, he is also an independent non-executive director of Xinjiang Tianshan Livestock Technology Company Limited. He is a graduate of Jilin University.
Supervisors
SONG Guo, a professor-levelprofessional-level senior administrative officer with an EMBA degree, is the chairmanChairman of the supervisory committeeSupervisory Committee of the Company and a deputy secretaryDeputy Secretary of the party committeeParty Committee of the Yankuang Group. In 2002, Mr. Song was the officer-in-chargeOfficer-in-charge of the officeOffice of Coal Management Bureau of Shandong Province. He joined the Yankuang Group in 2003 and served as the secretarySecretary of the disciplinary inspection committeeDisciplinary Inspection Committee from 2003 to 2007. He was appointed as a deputy secretaryDeputy Secretary of the party committeeParty Committee of the Yankuang Group in 2004 and the vice chairmanVice Chairman of the supervisory committeeSupervisory Committee of the Company in 2005. In 2008, Mr. Song became the chairmanChairman of the supervisory committeeSupervisory Committee of the Company. He is a graduate of Nankai University.
ZHOU Shoucheng, a professor-levelprofessional-level senior administrative officer with a master’s degree, was appointed the vice chairmanVice Chairman of the supervisory committeeSupervisory Committee of the Company in 2008 and has served as the secretarySecretary of the disciplinary inspection committeeDisciplinary Inspection Committee and the chairmanChairman of the labor union of the Yankuang Group since 2007. Mr. Zhou joined the predecessor of the Company in 1979 and has held the posts of the secretarySecretary of the Youth League committee of Yankuang Group, the secretarySecretary of the party committeeParty Committee of Beisu Coal Mine and the secretarySecretary of the party committee and the vice managerParty Committee of Xinglongzhuang Coal Mine successively from 19841985 to 2002. He was the chairmanChairman of the labor union of the Yankuang Group from 2002 to 2007. Mr. ZhouHe is a graduate of the Central Communist Party School Correspondence Institute.
ZHANG Shengdong, a senior accountant, has been a supervisor of the Company since 2002.He2002. He is also the assistantAssistant to the general manager,General Manager, the deputy chief accountantDeputy Chief Accountant and the headHead of the finance departmentFinance Department of the Yankuang Group. Mr. Zhang joined the Company’s predecessor in 1981 and became the headHead of the finance departmentFinance Department of the Yankuang Group in 2002.1999. He also became the deputy chief accountantDeputy Chief Accountant of the Yankuang Group, a supervisor of the Company, the headHead of the finance company preparatory officeFinance Company Preparatory Office of the Yankuang Group in 2002. Mr. Zhang was appointed as the assistantAssistant to the general managerGeneral Manager of Yankuang Group in 2008. He is a graduate of China University of Mining and Technology.
ZHEN Ailan, a senior accountant and senior auditor, was appointed a supervisorSupervisor of the Company in 2008. She has served as the deputy directorDeputy Director of the audit departmentAudit Department of the Yankuang Group since 2005. After joining the Company’s predecessor in 1980, she was appointed to the deputy chiefDeputy Chief of the audit divisionAudit Division of the Yankuang Group in 2002 and subsequently promoted to the deputy directorDeputy Director of the audit departmentAudit Department in 2005. In 2008, Ms. Zhen became a Supervisor of the Company. Ms. ZhenShe was appointed as the Head of the Auditing Department in 2012. She is a graduate of Northeastern University of Finance and Economics.
WEI Huanmin, a professional levelprofessional-level senior administrative officer, was appointed the supervisorSupervisor and the secretarySecretary of the disciplinary inspection committeeDisciplinary Inspection Committee of the Company in 2008 and 2006, respectively. Mr. Wei joined the Company’s predecessor in 1984, and served as the Company’s deputy secretaryDeputy Secretary of the disciplinary inspection committeeDisciplinary Inspection Committee and the chiefChief of the divisionDivision of inspectionInspection from 2002 to 2006, when he was promoted to the secretarySecretary of the disciplinary inspection committee.Disciplinary Inspection Committee. In 2008, Mr. Wei became an Employee Supervisor of the Company. Mr. WeiHe is a graduate of the Central Communist Party School Correspondence Institute.
XU Bentai, a professional levelprofessional-level senior administrative officer with a master’s degree, has been the employee supervisor of the Company since 2002 and the chairmanChairman of the labor union of Jining III Coal Mine since 1999. Mr. Xu joined the Company’s predecessor in 1978 and became an employee supervisorSupervisor of the Company in 2002. Mr. XuHe is a graduate of the Party School of Shandong Provincial Communist Committee.
Other Executive Officers
JIN Tai, a researcher in engineering technique application with a master’s degree, has served as a deputy general manager of the Company since 2004. Mr. Jin joined the Company’s predecessor in 1968, and became the deputy general manager of Yankuang Group in 2000. He became the head of Xinglongzhuang Coal Mine in 1998. Mr. Tai is a graduate of China University of Mining and Technology.
HE Ye, a researcher in engineering technology application, with a doctorate degree in engineering, has served as a deputy general managerDeputy General Manager of the Company since 2004. Mr. He joined the Company’s predecessor in 1993 and became the headHead of Jining II Coal Mine in 1999. In 2002, he was appointed the executive deputy general managerExecutive Deputy General Manager of an industrial company that is a subsidiary of Yankuang Group in 2002. Mr. He is a graduate of China University of Mining and Technology.
LAI Cunliang, a senior engineer with a master’sdoctor’s degree in mining engineering and an EMBA degree, has served as a deputy general managerDeputy General Manager of the Company since 2005. Mr. Lai joined the Company’s predecessor in 1980 and became the headHead of Xinglongzhuang Coal Mine in 2000. He has been a director and the general manager of Yancoal Australia since 2004. Mr. Lai became a deputy general managerDeputy General Manager of the Company in 2005 and became an executive director of Yancoal Australia in 2009.2005. He is a graduate of China University of Mining and TechnologyCoal Science Research Institute and Nankai University.
TIAN Fengze, a senior economist with a master’s degree, has served as a deputy general managerDeputy General Manager of the Company since 2002. Mr. Tian joined the Company’s predecessor in 1976 and became the headHead of Beisu Coal Mine in 1991. Mr. TianHe is a graduate of Party School of Shandong Provincial Communist Committee.
SHI Chengzhong, a researcher in engineering technique application with an EMBA degree and a master’s degree in mining engineer, has served as a deputy general managerDeputy General Manager of the Company since 2002. Mr. Shi joined the Company’s predecessor in 1983 and became a deputy chief engineerDeputy Chief Engineer of the Yankuang Group in 2000. Mr. ShiHe is a graduate of Northeastern University and Nankai University.
LIU Chun, a senior engineer with an EMBA degree, has served as a Deputy General Manager of the Company since 2011. Mr. Liu joined the Company’s predecessor in 1983 and served as Head of the Coal Sales and Transportation Department of the Company in 2002. He is graduated from Nankai University.
NI Xinghua, a researcher in engineering technique application with a master’s degree, has been the chief engineerChief Engineer of the Company since 2002. Mr. Ni joined the Company’s predecessor in 1975 and became a deputy chief engineerDeputy Chief Engineer of the Yankuang Group in 2000. Mr. NiHe is a graduate of Tianjin University.
Appointment, Resignation or Election of Directors, ChairmanSupervisors and Vice Chairman of the Board
At the first extraordinary general meeting of 2010 of the Company and the thirteenth meeting of the fourth session of the Board held on February 26, 2010, Mr. Li Weimin was elected as director and vice chairman of the fourth session of the Board.
At the seventeenth meeting of the fourth session of the Board held on December 30, 2010, Mr. Li Weimin and Mr. Wang Xin were elected as the chairman and the vice chairman of the fourth session of the Board, respectively.
At the 2010 Annual General Meeting held on May 20, 2011, Mr. Li Weimin, Mr. Wang Xin, Mr. Shi Xuerang, Mr. Wu Yuxiang and Mr. Zhang Baocai were re-elected as directors of the fifth session of the Board upon their retirement by rotation at the conclusion of 2010 Annual General Meeting. Mr. Zhang Yingmin was elected as a director of the fifth session of the Board at the 2010 Annual General Meeting held on May 20, 2011.
Mr. Dong Yunqing was re-elected as the employee director of the fifth session of the Board by the employees of the Company.
Mr. Wang Xianzheng, Mr. Cheng Faguang, Mr. Wang Xiaojun and Mr. Xue Youzhi were elected as independent non-executive directors of the fifth session of the Board at the 2010 Annual General Meeting held on May 20, 2011.
At the first meeting of the fifth session of the Board held on May 20, 2011, Mr. Li Weimin and Mr. Wang Xin were elected as the chairman and the vice chairman of the fifth session of the Board, respectively.
Resignation and Retirement of Directors
Mr. Geng Jiahuai, the former Vice Chairman of the Board and Director of the Company submitted his resignation report to the Board on December 30, 2010, effective immediately.
Mr. Chen Changchun, the former Director of the Board, submitted his resignation report to the Board on March 9, 2011, effective immediately.
Mr. Wang Xinkun retired as director of the Board by rotation at the conclusion of 2010 Annual General Meeting. Mr. Pu Hongjiu, Mr. Zhai Xigui, Mr. Li Weian and Mr. Wang Junyan retired as independent non-executive directors by rotation at the conclusion of 2010 Annual General Meeting.
Appointment of Supervisors, Chairman and Deputy Chairman of the Supervisory Committee
At the 2010 Annual General Meeting held on May 20, 2011, Mr. Song Guo, Mr. Zhou Shoucheng, Mr. Zhang Shengdong and Ms. Zhen Ailan were elected as the non-worker representative supervisors of the fifth session of the supervisory committee of the Company.
Mr. Wei Huanmin and Mr. Xu Bentai were elected as the worker representative supervisors of the fifth session of the supervisory committee by the employees of the Company.
At the first meeting of the fifth session of the supervisory committee held on May 20, 2011, Mr. Song Guo and
Mr. Zhou Shoucheng were elected as the chairman and the deputy chairman of the fifth session of the supervisory committee.
Change of the Senior Management
Mr. Qu Tianzhi, former vice general managerThere was no appointment, resignation or election of Directors, Supervisors or senior management during the Company resigned from his position on August 27, 2010 as a result of a change of employment.
At the twentieth meeting of the fourth session of the Board held on March 25, 2011, Mr. Zhang Yingmin was appointed as the general manager of the Company and Mr. Zhang Baocai was appointed a deputy general manager of the Company.
At the first meeting of the fifth session of the Board held on May 20, 2011, Mr. Zhang Yingmin was appointed as the general manager of the Company and Mr. Jin Tai, Mr. Heye, Mr. Lai Cunliang, Mr. Tian Fengze, Mr. Zhang Baocai and Mr. Shi Chengzhong were appointed as deputy general managers. Mr. Wu Yuxiang was appointed as chief financial officer and Mr. Ni Xinghua was appointed as chief engineer at the same meeting.year ended December 31, 2012.
| B. | Compensation |
Four DirectorsThree directors, namely LI Weimin, WANG Xin and SHI Xuerang, as well as four supervisors, SONG Guo, ZHOU Shoucheng, ZHANG Shengdong and ZHEN Ailan, receive salaries from our Controlling Shareholder, while the rest of our Directors,directors, supervisors and executive officers who are our employees receive compensation in the form of salaries, housing allowances and other allowances and benefits, including pension contributions. The aggregate amount of cash remuneration paid by us in 2010 to Directors,directors, supervisors and executive officers for the years 2010, 2011 and 2012 was approximately RMB5.8 million, RMB6.2 million and RMB7.4 million (tax inclusive). In addition, Directors and supervisors receive other benefits, such as subsidized or free health insurance and transportation, which are customarily provided by PRC enterprises to their senior-level employees., respectively. We did not pay any discretionary bonus during the reporting period of this annual report to our Directors,directors, supervisors or executive officers. Details of each of the Directors’directors’ and supervisors’ salaries and benefits provided by our Company are as follows:
| For the Year Ended December 31, 2010 | ||||||||||||||||
| Fees | Salaries, allowance and other benefits in kind | Retirement benefit plan contributions | Total | |||||||||||||
| RMB’000 | RMB’000 | RMB’000 | RMB’000 | |||||||||||||
Independent Non-Executive Directors | ||||||||||||||||
Pu Hongjiu | 113 | — | — | 113 | ||||||||||||
Zhai Xigui | 113 | — | — | 113 | ||||||||||||
Li Weian | 113 | — | — | 113 | ||||||||||||
Wang Junyan | 113 | — | — | 113 | ||||||||||||
| 452 | — | — | 452 | |||||||||||||
Directors | ||||||||||||||||
Wang Xin | — | — | — | — | ||||||||||||
Geng Jiahuai | — | — | — | — | ||||||||||||
LI Weimin | — | 188 | 38 | 226 | ||||||||||||
Shi Xuerang | — | — | — | — | ||||||||||||
Chen Changchun | — | — | — | — | ||||||||||||
Wu Yuxiang | — | 269 | 54 | 323 | ||||||||||||
Wang Xinkun | — | 343 | 69 | 412 | ||||||||||||
Zhang Baocai | — | 312 | 62 | 374 | ||||||||||||
Dong Yunqing | — | 309 | 62 | 371 | ||||||||||||
| — | 1,421 | 285 | 1,706 | |||||||||||||
| For the Year Ended December 31, 2012 | ||||||||||||||||
| Fees | Salaries, allowance and other benefits in kind | Retirement benefit plan contributions | Total | |||||||||||||
| RMB’000 | RMB’000 | RMB’000 | RMB’000 | |||||||||||||
Independent Non-Executive Directors | ||||||||||||||||
WANG Xianzheng | 130 | — | — | 130 | ||||||||||||
CHENG Faguang | 130 | — | — | 130 | ||||||||||||
WANG Xiaojun | 130 | — | — | 130 | ||||||||||||
XUE Youzhi | 130 | — | — | 130 | ||||||||||||
|
|
|
|
|
|
|
| |||||||||
| 520 | — | — | 520 | |||||||||||||
|
|
|
|
|
|
|
| |||||||||
Directors | ||||||||||||||||
LI Weimin | — | — | — | — | ||||||||||||
WANG Xin | — | — | — | — | ||||||||||||
ZHANG Yingmin | — | 728 | 146 | 874 | ||||||||||||
SHI Xuerang | — | — | — | — | ||||||||||||
WU Yuxiang | — | 505 | 101 | 606 | ||||||||||||
ZHANG Baocai | — | 517 | 103 | 620 | ||||||||||||
DONG Yunqing | — | 520 | 104 | 624 | ||||||||||||
|
|
|
|
|
|
|
| |||||||||
| — | 2,270 | 454 | 2,724 | |||||||||||||
|
|
|
|
|
|
|
| |||||||||
Supervisors Song Guo Zhang Shengdong Zhou Shoucheng Zhen Ailan Wei Huanmin Xu Bentai Other Members of Management Jin Tai Zhang Yingmin He Ye Tian Fengze Shi Chengzhong Qu Tianzhi Lai Cunliang Ni Xinghua Total Supervisors SONG Guo ZHOU Shoucheng ZHANG Shengdong ZHEN Ailan WEI Huanmin XU Bentai Other Members of Management HE Ye LAI Cunliang TIAN Fengze SHI Chengzhong LIU Chun NI Xinghua Total For the Year Ended December 31, 2010 Fees Salaries,
allowances and
other benefits
in kind Retirement
benefit plan
contributions Total RMB’000 RMB’000 RMB’000 RMB’000 — — — — — — — — — — — — — — — — — 305 61 366 — 346 69 415 — 651 130 781 — 189 38 227 — 189 38 227 — 188 38 226 — 291 58 349 — 342 68 410 — 285 57 342 — 664 — 664 — 328 66 394 — 2,476 363 2,839 452 4,548 778 5,778 For the Year Ended December 31, 2012 Fees Salaries,
allowance and
other benefits
in kind Retirement
benefit plan
contributions Total RMB’000 RMB’000 RMB’000 RMB’000 — — — — — — — — — — — — — — — — — 516 103 619 — 506 101 607 — 1,022 204 1,226 — 564 113 677 — 720 144 864 — 529 106 635 — 543 109 652 — 553 111 664 — 690 — 690 — 3,599 583 4,182 520 6,891 1,241 8,652
| C. | Board Practices |
Board of Directors
Directors are elected to serve three year terms. We have adopted cumulative voting for the election of a new Board of Directors.
Pursuant to our Articles of Association, the Board of Directors is accountable to shareholders in general meeting and exercises the following functions and powers:
| (i) | convening shareholders’ meetings and reporting on the work of the Board of Directors at general meetings; |
| (ii) | implementing resolutions passed by the shareholders at general meetings; |
| (iii) | determining our business plans and investment proposals; |
| (iv) | formulating our annual preliminary and final budgets; |
| (v) | formulating our profit distribution and loss recovery proposals; |
| (vi) | formulating proposals for the increase or reduction of our registered capital and the issuance of our debentures or other forms of securities; |
| (vii) | drawing up plans for material acquisitions, repurchases of shares of the Company, mergers, divisions, dissolutions or changes of corporate structure; |
| (viii) | deciding our internal management structure; |
| (ix) | appointing or removing our general manager and secretary of the board and appointing or removing the deputy general manager(s) and other senior officers (including the financial controller(s) of the Company) based on the recommendations of the general manager, to decide on their remuneration and matters relating to awards and penalty; |
| (x) | formulating our basic management system; |
| (xi) | formulating proposals for any amendment of the Articles of Association; |
| (xii) | deciding on our business involving overseas investments, acquisitions and disposals of assets, mortgages of assets and other guarantees, entrusted assets management and connected transactions within the authority conferred by the general meeting; |
| (xiii) | managing the disclosure of information relating to the Company; |
| (xiv) | making recommendations on the appointment or replacement of the Company’s independent auditors to shareholders at shareholders’ general meetings; |
| (xv) | reviewing management’s performance based on the working report submitted by management; |
| (xvi) | approving an aggregate amount of provision for impairment of assets not more than 10% of our latest audited consolidated net asset value, clearing an amount of provision for impairment of assets not more than 5% of our latest audited consolidated net asset value, and executing and clearing any provision of impairment of assets involving connected transactions in compliance with relevant connected transaction regulations; and |
| (xvii) | being responsible for matters with respect to the Company’s corporate governance, including (i) developing and reviewing the Company’s policies and practices on corporate governance; (ii) reviewing and monitoring the training and continuous professional development of Directors and senior management; (iii) reviewing and monitoring the Company’s policies and practices on the compliance with legal and regulatory requirements; (iv) developing, reviewing and monitoring the code of conduct and compliance manual (if any) applicable to employees and directors; and (v) reviewing the Company’s compliance with the code of the stock exchange on which the Company’s securities are listed and the disclosure in the corporate governance report. |
| (xviii) | exercising any other powers specified by the law, administrative regulations, departmental rules, the Articles of Association and conferred by shareholders at a general meeting. |
Except for matters specified in (vi), (vii) and (xi), which require the affirmative vote of more than two-thirds of all of the Directors, resolutions in respect of the above listed matters can be approved by a simple majority of the Directors.
The Board of Directors makes decisions on the company’s scope of authority and inspection and decision making procedures with respect to company matters relating to foreign investment, asset sales and purchases, mortgages, guarantee provisions, entrusted asset management and connected transactions and, if a major investment involved, should appoint experts and professionals to make an assessment and submit such assessment to the shareholders’ meeting for approval.
With the approval of over two-thirds of all Directors, the Board of Directors may make decisions on the following matters:
| (1) | transactions falling within the strictest of the following limits with respect to asset sales and purchases, foreign investment (including entrusted financial management and entrusted loans), financial assistance provisions, leasing of assets as lessor or lessee, restructuring of claims or debts, giving or receiving assets as a gift, entrusted or trusted asset or business management, license agreements, and research and development projects: |
| a. | the total assets value (where book value and assessed value are available, whichever is higher) involved in a single transaction with amount more than 10% and below 50% of the Company’s latest audited total asset value prepared in accordance with the PRC GAAP; or more than 5% and less than 25% of the Company’s latest published total assets value prepared in accordance with the IFRS; |
| b. | a single investment of which the completion consideration (including liabilities and expenses) accounts for more than 10% and less than 50% of the Company’s latest audited net asset value prepared in accordance with the PRC GAAP; or more than 5% and less than 25% of the total market |
| c. | the latest annual income from principal operations of the subject of a single transaction which accounted for more than 10% and less than 50% of the Company’s latest audited income from principal operations for the latest financial year prepared in accordance with the PRC GAAP; or more than 5% and less than 25% of the Company’s latest audited income from principal operations for the latest financial year prepared in accordance with the IFRS; and |
| d. | the latest annual net profit of the subject of a single transaction which accounted for more than 10% and less than 50% of the Company’s latest audited net profit for the latest financial year prepared in accordance with the PRC GAAP; or more than 5% and less than 25% of the Company’s latest audited net profit for the latest financial year prepared in accordance with the IFRS. |
The above transactions that involve a public offer of securities, which requires the approval of the China Securities Regulatory Commission, shall be subject to a vote at the shareholders’ general meeting;
| (2) | a single loan representing more than 10% and less than 25% of the Company’s most recently audited net asset value if the debt ratio to the Company’s assets remains under 80% after such financing; |
| (3) | mortgages or pledges of assets so long as the cumulative outstanding amount is less than 30% of the Company’s most recently audited net asset value; |
| (4) | external guarantees that do not require the approval of the shareholders pursuant to the Articles of Association; and |
| (5) | connected transactions, which must be conducted in accordance with the relevant regulations of competent securities authorities and the listing rules of applicable stock exchanges. |
The transactions referred to in item (1) above that involve the provision of financial assistance and entrusted financial management are calculated on an accrued basis for twelve consecutive months according to the transaction categories and applicable approval limit proportion of the Board of Directors. When the Company conducts transactions other than those involving the provision of financial assistance and entrusted financial management, applicablerelevant approval limit proportionrequirements of the Board of Directors regarding each transaction which is under the same category shall be calculated on the principle of accrued basis for twelve consecutive months. Transactions already approved by the Company in accordance with the principle of accrued basis shall not be included in the scope of accrual calculation.
Provisions of regulatory authorities that the Company is subject to within and outside the PRC that are of a stricter standard than these Articles of Association shall apply accordingly.
In addition to obligations imposed by laws, administrative regulations or the listing rules of the stock exchanges on which our Shares are listed, the Articles of Association place on each Director, supervisor, general manager, deputy general manager and any other senior officer the following duties to each shareholder, in the exercise of his or her functions and powers:
to act honestly in our best interests;
not to expropriate our property in any way, including (without limitation) usurpation of opportunities which benefit us; and
not to expropriate the individual rights of shareholders, including (without limitation) rights to distributions and voting rights, save and except pursuant to our restructuring which has been submitted to the shareholders for their approval in accordance with the Articles of Association.
The Articles of Association further place on each Director, supervisor, general manager, deputy general manager and senior officer:
a duty to exercise the care, diligence and skill that a reasonably prudent person would exercise in comparable circumstances in the discharge of his or her duties;
a fiduciary obligation not to have interests that conflict with the Company’s;
a duty not to direct a person or entity related or connected to the Director, supervisor, general manager, deputy general manager or senior officer in certain relationships enumerated in the Articles of Association to act in a manner which such person is prohibited from doing; and
a duty not to cause us to exceed the scope of business stipulated in our business license.
The shareholders in a general meeting may by ordinary resolution remove any Director or supervisor before the expiration of his or her term of office if such Director fails to perform any of the Director’s duties. A senior officer of the Company may be removed by the Board if he or she fails to perform his or her duty.
Directors’ Decision-making Risk Fund
Upon approval by our shareholders at the 2004 annual shareholders’ general meeting, we established a Directors’ Decision-makingDecision making Risk Fund (“Risk Fund”) to compensate our Directors, supervisors, executive officers and other applicable personnel for personal economic losses resulting from their performance of duties in accordance with the laws, regulations or our Articles of Association or while attempting to procure legitimate benefits for our Company.
Directors, Supervisors and Management’s Indemnification
Upon approval at the 20092011 general meeting that was held on June 25, 2010,22, 2012, we continued to purchase liability insurance for our Directors, supervisors and senior officers with coverage of up to US$15 million.
Audit Committee of the Board of Directors
Upon approval at the first meeting of the fifth session of the Board of Directors held on May 20, 2011, the Company set up our audit committee of the fifth session of the Board. The audit committee comprises four independent non-executive Directors, namely Mr. Cheng Faguang, Mr. Wang Xianzheng, Mr. Wang Xiaojun, Mr. Xue Youzhi, and one non-executive Directors, Mr. Dong Yunqing. Mr. Cheng Faguang serves as the ChairmanBoard of the audit committee.
Directors. The audit committee is mainly responsible for ensuring the independence of the company’sCompany’s independent auditors to maintain the integrity of audits, ensuring the efficiency of audit procedures, proposing the appointment or replacement of independent audit agencies;auditors; reviewing the accounting policies of the Company, the disclosure of the financial information and the procedures for preparing financial reports; and reviewing the Company’s internal control and risk management systems. The audit committee comprises four independent non-executive directors, namely Mr. CHENG Faguang, Mr. WANG Xianzheng, Mr. WANG Xiaojun, Mr. XUE Youzhi, and one non-executive director, Mr. DONG Yunqing. Mr. CHENG Faguang serves as the Chairman of the audit committee.
The details of the responsibilities of the audit committee can be found on our Company’s website. We also filed the responsibilities of the audit committee with the SSE, the Hong Kong Stock Exchange and the SEC.
The members of the audit committee of our Board of Directors are:
Name | Age | Position | Ownership of Shares | |||||
| CHENG Faguang | 68 | Independent non-executive director, Chairman of the Audit Committee | 0 | |||||
| WANG Xianzheng | 64 | Independent non-executive director | 0 | |||||
| WANG Xiaojun | 57 | Independent non-executive director | 0 | |||||
Name | Age | Position | Ownership of Shares | |||||
| CHENG Faguang | 70 | Independent non-executive director, Chairman of the Audit Committee | — | |||||
| WANG Xianzheng | 66 | Independent non-executive director | — | |||||
| WANG Xiaojun | 58 | Independent non-executive director | — | |||||
| XUE Youzhi | 48 | Independent non-executive director | — | |||||
| DONG Yunqing | 57 | Employee director | — | |||||
In 2012 and up to March 31, 2013, the audit committee held four meetings: on March 21, 2012, August 24, 2012, January 8, 2013 and January 8, 2013.
Name Position XUE Youzhi Age Ownership
of Shares 46 Independent non-executive director 0 DONG Yunqing 55 Employee director 0
As a foreign private issuer, we rely on the exemption under Section 303A.00 of the NYSE Listed Company Manual as well as affiliated director and employee director exemptions as provided under Rule 10A-3 of the Exchange Act to be in compliance with the audit committee standards set out in Section 303A.06 of the NYSE Listed Company Manual. See “Item 16D. Exemptions from the Listing Standards For Audit Committees”.Committees.”
CompensationRemuneration Committee
The CompensationRemuneration Committee of the fifth session of the Board of Directors was set up following approval from the Board of Directors at the first meeting of the fifth session of the Board of Directors held on May 20, 2011. Our compensation committee consists of three members: two independent non-executive directors, namely Mr. Xue Youzhi and Mr. Wang Xiaojun, and one non-executive director, namely Mr. Dong Yunqing. Mr. Xue Youzhi was elected to serve as the chairman of the compensation committee. The primary duties of our compensation committeeRemuneration Committee as set out in the committee charter include drafting and establishing a compensation policy for our Directors,directors, supervisors, and the senior officers and making recommendations on the compensation for our Directors,directors, supervisors and senior officers. Further details on the responsibilities of the compensation committeeRemuneration Committee can be found on our website. We also filed the responsibilities of the compensation committee with the SSE, the Hong Kong Stock Exchange and the SEC.
The remuneration committee is comprised of three members: two independent non-executive directors, namely Mr. XUE Youzhi and Mr. WANG Xiaojun, and one non-executive director, namely Mr. DONG Yunqing. Mr. XUE Youzhi was elected to serve as the Chairman of the Remuneration Committee.
Nomination Committee
Pursuant to approval granted at the first meeting of the fifth session of the Board of Directors held on May 20, 2011, we established the Nomination Committee of the first session of the Board (the “Nomination Committee”). The Nomination Committee consists of three Directors, namely Mr. Li Weimin, Mr. Wang Xiaojun and Mr. Cheng Faguang. Mr. Wang Xiaojun serves as the chairman of the Nomination Committee.Directors. The main duties of the Nomination Committee include (i) considering and formulating the selection criteria and procedures for directors and managers and making recommendations; (ii) extensively searching for suitable candidates of directors and managers for the Company and making recommendations to the Board;Board of Directors; (iii) reviewing the candidates for directors and managers for recommendation to the Board of Directors regarding proposed appointments and succession of directors and managers for recommendation to the Board;Board of Directors; and (iv) assessing the independence of independent non-executive directors. Further details on the responsibilities of the nomination committee can be found on our website. We also filed the responsibilities of the nomination committee with the SSE, the Hong Kong Stock Exchange and the SEC.
The Nomination Committee is comprised of three directors, namely Mr. LI Weimin, Mr. WANG Xiaojun and Mr. CHENG Faguang. Mr. WANG Xiaojun serves as the Chairman of the Nomination Committee.
In 2012 and up to March 31, 2013, the Nomination Committee held one meeting on December 18, 2012.
Strategy and Development Committee
Pursuant to approval granted at the first meeting of the fifth session of the Board of Directors held on May 20, 2011, we established the Strategy and Development Committee of the fifth session of the Board (the “Strategy and Development Committee”). The Strategy and Development Committee consists of five Directors, namely Mr. Li Weimin, Mr. Wang Xin, Mr. Zhang Baocai and Mr. Xue Youzhi. Mr. Li Weimin serves as the chairman.Board. The main duties of the Strategy and Development Committee include: (i) conducting studies and making proposals regarding the long-term development strategy and significant investment decisions of the Company; (ii) conducting studies and making proposals regarding the annual strategic development and operating plans; (iii) supervising the implementation of the Company’s strategic and operating plans; and (iv) conducting studies and making proposals regarding other significant issues impacting the development of the Company. The Strategy and Development Committee consists of five directors, namely Mr. LI Weimin, Mr. WANG Xin, Mr. ZHANG Baocai and Mr. XUE Youzhi. Mr. LI Weimin serves as the Chairman.
In 2012 and up to March 31, 2013, the Strategy and Development Committee held one meeting on December 16, 2012.
Supervisory Committee
Our supervisory committee consists of six members, two of whom are employee representatives. Supervisors serve a term of three years and attend Boardboard meetings. The supervisory committeeSupervisory Committee is accountable to shareholders and exercises the following duties in accordance with the applicable laws:
reviewreviewing our periodic reports as prepared by the Board of Directors and provideproviding written comments;
reviewreviewing our financial position;
supervisesupervising the Directorsdirectors and senior officers and to proposeproposing a removal of a Directordirector or a senior officer who has contravened any law, administrative regulation, theseour Articles of Association or resolutions passed at a shareholders’ general meeting;
demanddemanding any Directordirector or any senior officer who acts in a manner which is harmful to our interest to rectify such behavior;
verifyverifying financial information such as financial reports, business reports and profit distribution plans to be submitted by the Board of Directors to shareholders’Shareholders’ general meetings and authorise,authorizing, in the Company’s name, publicly certified and practisingpracticing accountants to assist in the re-examinationreexamination of such information should any doubt arise in respect thereof;
proposeproposing the convening of shareholders’Shareholders’ extraordinary general meetings and extraordinary board meetings. Where the Boardboard of Directorsdirectors fails to convene or hold the general meeting of shareholders in accordance with the provisions of the Company Law to conveneof the PRC, convening and holdconducting the shareholders’ general meeting;
makemaking proposals at the shareholders’Shareholders’ general meetings;
representrepresenting the Company in proceedings against a Directordirector or senior officers in accordance with section 152 of the Company Law;Law of the PRC;
conduct investigationconducting investigations of any identified irregularities in the Company’s operations; and
performing other functions and powers specified in our Articlesarticles of Association.association.
Our supervisory committee consists of six members, namely Mr. SONG Guo, Mr. ZHOU Shoucheng, Mr. ZHANG Shengdong, Ms. ZHEN Ailan, Mr. WEI Huanmin and Mr. XU Bentai. Mr. SONG Guo serves as the chairman of the supervisory committee and Mr. ZHOU Shoucheng serves as the deputy chairman of the supervisory committee.
Corporate Governance
As of December 31, 20102012, the Yankuang Group held 2,600,000,000 Shares, representing 52.86% of our total shares onas of the same day.date. As the Yankuang Group holds more than 50% of our voting power, we are a “controlled company” under Section 303A.00 of the NYSE Listed Company Manual. As a result, we are not required to establish a Nomination Committee or Corporate Governance Committee under Sections 303A.04 and 303A.05 of the NYSE listing rules andrules. Although we have established a Nomination Committee, we have not done so.established a Corporate Governance Committee. For details related to our corporate governance, policies, please refer to “Item 16G — Corporate Governance”.
Arrangement to Purchase Equity or Debt Securities and Other Arrangements
At no time during the year ended December 31, 20102012 were we, our Controlling Shareholder or any of the Yankuang Group’s subsidiaries a party to any arrangement that enabled our Directors or supervisors to acquire benefits through the acquisition of any securities, including our equity or debt securities, with the exception of the A Shares issued to certain of our Directors, supervisors and senior management.
There is no arrangement or understanding between any Director and any major shareholder, customer or supplier in connection with the selection of such Director.
Service Contracts of Directors and Supervisors
Each of our Directorsdirectors and supervisors has entered into a service contract with us. Under those contracts, the salaries and discretionary year-end bonuses paid to the Directorsdirectors and supervisors, are proposed by the Board of Directors and approved by our shareholders at general meetings. The discretionary year-end bonuses paid to our Directorsdirectors and other employees (including, but not limited to, our supervisors and senior officers) in any given year may not, in aggregate, exceed 1% of our net profit (after taxation and extraordinary losses, but before extraordinary gains) for that year.
No Directordirector or supervisor has entered into any service contract with our Company which cannot be terminated by us within one year without payment other than statutory compensation.statutorily mandated payments.
| D. | Employees |
General
The table below sets forth the number of our employees by function as of the periodsdates indicated:
| As of December 31, | As of May 31, | As of December 31, | ||||||||||||||||||||||
| 2008 | 2009 | 2011 | 2010 | 2011 | 2012 | |||||||||||||||||||
Coal production employees | 32,297 | 34,516 | 36,364 | 36,411 | 39,008 | 42,991 | ||||||||||||||||||
Engineers and technicians | 1,662 | 1,816 | 1,873 | 1,875 | 2,009 | 4,665 | ||||||||||||||||||
Management and administrative personnel | 2,895 | 3,595 | 4,036 | 4,059 | 4,348 | 5,676 | ||||||||||||||||||
Support staff | 10,535 | 9,706 | 10,010 | 10,023 | 10,738 | 16,049 | ||||||||||||||||||
|
|
| ||||||||||||||||||||||
Total | 47,389 | 49,633 | 52,283 | 52,368 | 56,103 | 69,381 | ||||||||||||||||||
|
|
| ||||||||||||||||||||||
The table below sets forth a breakdown of our employees by location as of MayDecember 31, 2011:2012:
Location | Employees | % of Total | ||||||
PRC | ||||||||
Shandong | 50,634 | 96.85 | % | |||||
Shaanxi | 183 | 0.35 | % | |||||
Shanxi | 293 | 0.56 | % | |||||
Inner Mongolia | 58 | 0.11 | % | |||||
Australia | 1,115 | 2.13 | % | |||||
Total | 52,283 | 100 | % | |||||
The total remuneration of our employees includes wages and allowances. We paid our employees an aggregate of approximately RMB2,448.8 million, RMB2,985,5 million and 4,086.8 million in wages and allowances in the years ended December 31, 2008, 2009 and 2010, respectively. The compensation of an employee directly involved in underground mining is based on the employee’s productivity, as well as the productivity of the employee’s mining team. Our employees and their families also receive certain social welfare benefits and education and health services indirectly through the Yankuang Group. These benefits are provided in some cases by the Yankuang Group as required by PRC laws, rules and regulations. We, in turn, pay the Yankuang Group for such benefits.
According to the Provision of Insurance Fund Administrative Services Agreement and the annual caps from 2009 to 2011, the Yankuang Group will provide free management services for the contributions that we make to an endowment insurance fund, basic medical insurance fund, supplementary medical insurance fund, unemployment insurance fund and maternity insurance fund for our employees. We paid an aggregate of approximately RMB1,045.3 million to the above listed insurance funds in 2010.
In 2008, 2009 and 2010, we paid pension contributions for our Directors, supervisors, executive officers and senior management of approximately RMB509,000, RMB550,000 and RMB778,000, respectively. In addition, each of our employees currently pays a percentage of his or her salary as an additional pension contribution. Upon retirement, our employees are entitled to pension payments under the pension plan.
Location | Employees | % of Total | ||||||
PRC | ||||||||
Shandong | 64,027 | 92.28 | % | |||||
Shaanxi | 760 | 1.10 | % | |||||
Shanxi | 1,263 | 1.82 | % | |||||
Inner Mongolia | 669 | 0.96 | % | |||||
Australia | 2,656 | 3.83 | % | |||||
Canada | 6 | 0.01 | % | |||||
|
|
|
| |||||
Total | 69,381 | 100 | % | |||||
|
|
|
| |||||
As of the date of this annual report, all of our employees are employed under employment contracts which specify the employee’s position, responsibilities, remuneration and permissible grounds for termination. We have a labor union that protects employees’ rights, aims to assist in the achievement of our economic objectives, encourages employee participation in management decisions and assists in mediating disputes between union members and us. Each of our operating units has a labor union. We have not experienced any strikes or other labor disturbances that hashave interfered with our operations, and we believe that we maintain strong relationships with our employees.
Domestic Employees
The total remuneration of our domestic employees includes wages and allowances. The compensation of a domestic employee directly involved in underground mining is based on the employee’s productivity, as well as the productivity of the employee’s mining team. Our domestic employees and their families also receive certain social welfare benefits and logistics services indirectly through the Yankuang Group. These benefits are provided in some cases by the Yankuang Group as required by PRC laws, rules and regulations. We, in turn, pay the Yankuang Group for such benefits.
According to the Provision of Insurance Fund Administrative Services Agreement and the annual caps from 2012 to 2014, the Yankuang Group will provide free management services for the contributions that we make to an endowment insurance fund, basic medical insurance fund, supplementary medical insurance fund, unemployment insurance fund and maternity insurance fund for our employees. We paid an aggregate of approximately RMB1,408.1 million to the above listed insurance funds in 2012.
In 2010, 2011 and 2012, we paid pension contributions for our directors, supervisors, executive officers and senior management of approximately RMB778,000, RMB834,000 and RMB1,241,000, respectively. In addition, each of our domestic employees currently pays a percentage of his or her salary as an additional pension contribution. Upon retirement, our domestic employees are entitled to pension payments under the pension plan.
All domestic employees who are unable to work due to illness or disability are entitled to certain benefits during the period of their absence from the work. In addition, the PRC government requires us to provide casualty and life insurance for each domestic employee who works underground in mining sites through work injury funds. We contribute an amount to the work injury fund equivalent to 2% of each employee’s total remuneration the prior year.
Medical Insurance Planinsurance plan
In accordance with the relevant regulations of the Shandong Provincial People’s government,Government, since 2002, we have established a basic medical insurance plan for domestic employees, which comprises basic medical insurance and supplementary medical insurance plans.
In 2010, weWe set aside 6% and 4% of the total wages of each employee to a basic medical insurance fund and a supplementary medical insurance, respectively. Production personnel’s supplementary medical insurance was recorded in our statement of income as “Wages and Employee Benefits” under “Cost of Sale and Service Provided”,Provided,” while management and administrative personnel’s supplementary medical insurance was recorded under “Selling, General and Administrative Expenses”.Expenses.”
Housing Planplan
Under the Labor and Service Supply Agreement, the Controlling ShareholderYankuang Group is partly responsible for providing housing accommodations to our domestic employees. We and the Controlling ShareholderYankuang Group share the incidental expenses relating to the provision of housing accommodation on a pro rata basis based onupon our respective number of employees and other negotiations. Such expenses amounted to approximately RMB86.2RMB140.0 million, RMB140.0 million and RMB140.0RMB137.2 million for 2008, 20092010, 2011 and 2010,2012, respectively.
Beginning inSince 2002, we have paid each of our domestic employees a housing allowance, which is calculated based on a fixed percentage of each domestic employee’s wage, to assist domestic employees in their purchase of residential housing. In 2008, 20092010, 2011 and 2010,2012, we paid an aggregate of approximately RMB193.6RMB247.7 million, RMB238.5RMB291.8 million and RMB247.7RMB522.0 million, respectively, for our domestic employees’ housing allowances.
Australian Employees
Pursuant to applicable Australian laws and regulations, we provide our Australian employees a base salary and also make contributions to our Australian employees’ benefits fund. Upon retirement, our Australian employees are entitled to receive payments from the benefits fund. In addition, we maintain commercial medical insurance policies for our Australian employees to cover their medical and additional expenses.
| E. | Share Ownership |
No Director,director, supervisor or member of senior management who received compensation as described in subsection B above owns more than one percent1% of our outstanding Shares.shares. We have not entered into any arrangement that enables any of our directors, supervisors or other executive officers to purchase securities issued by us or other institutions. See “Item 6. Directors, Supervisors, Senior Management and Employees — A. Directors, Supervisors and Senior Management”.
We have not grantedhad and have no plan to grant options for our Shares or other equity-linked securities to our employees. We have not had and have no plan to implement any share bonus scheme for employees.
| ITEM 7. | MAJOR SHAREHOLDERS AND RELATED PARTY TRANSACTIONS |
| A. | Major Shareholders |
As of December 31, 2010,2012, the Yankuang Group owned 52.86% of our share capital. As a majority shareholder, the Yankuang Group is able to make most of the decisions reserved for shareholders.
The following table sets forth certain information regarding ownership of our capital stock as of December 31, 20102012 by all persons who are known by us to own beneficially more than 5% of our capital stock.
Title of Class | Identity of Person or Group | Shares Owned as of December 31, 2010 | Percentage of Shares as of December 31, 2010 | |||||||
Ordinary Shares in the form of legal person shares | Yankuang Group | 2,600,000,000 | 52.86 | % | ||||||
Ordinary Shares in the form of H Shares | HKSCC Nominee Limited(1) | 1,951,633,946 | 39.68 | % | ||||||
Shareholder | Shares Owned | Percentage | ||||||
| Yankuang Group(1)(2) | 2,600,000,000 | 52.86 | % | |||||
| HKSCC Nominee Limited(3)(4) | 1,952,947,945 | 39.71 | % | |||||
| (1) | Ordinary Shares in the form of legal person shares. |
| (2) | Yankuang Group is 100% held by SASAC of the Shandong Provincial Government. |
| (3) | Ordinary Shares in the form of H Shares. |
| (4) | As the nominee of the clearing and settlement agent for our H Shares, HKSCC Nominee Limited is the record holder of our H Shares. |
The following table sets forth the substantial shareholders ofshareholders’ interests and short positions in our H Sharesshares as of December 31, 2010.2012.
Name of substantial shareholders | Class | Number of shares held (shares) | Capacity | Type of | Percentage in the relevant class of share capital of the Company | Percentage in total share capital of the Company | Class of shares | Number of shares held (shares) | Capacity | Nature of interest | Percentage in the relevant class of share capital of the Company | Percentage in total share capital of the Company | ||||||||||||||||||||||||||||
Yankuang Group | | A Share (state- owned legal person shares) | | 2,600,000,000 | Beneficial owner | long position | 87.84% | 52.86% | ||||||||||||||||||||||||||||||||
Templeton Asset Management Ltd. | H Share | 274,390,032 | Investment manager | long position | 14.01% | 5.58% | ||||||||||||||||||||||||||||||||||
JP Morgan Chase & Co. | H Share |
| 274,853,588
4,139,412
95,507,480 | (L)
(S)
(P) (2) | Beneficial owner,
Investment manager and custodian corporation / Approved lending agency | Corporate |
| 14.03
0.21
4.88 | %(L)
%(S)
%(P) |
| 5.59
0.08
1.94 | %(L)
%(S)
%(P) | H Share | 33,171,560 | Beneficial owner | long position | 1.69% | 0.67% | ||||||||||||||||||||||
Templeton Asset Management Ltd. | H Share | 235,912,000 | (L) | Investment manager | Corporate | 12.05 | %(L) | 4.80 | %(L) | |||||||||||||||||||||||||||||||
JP Morgan Chase & Co. | H Share | 607,468 | Investment manager | long position | 0.03% | 0.01% | ||||||||||||||||||||||||||||||||||
| 164,861,941 | Custodian corporation / approved lending agency | long position | 8.42% | 3.35% | ||||||||||||||||||||||||||||||||||||
| 14,718,493 | Beneficial owner | short position | 0.75% | 0.30% | ||||||||||||||||||||||||||||||||||||
| 159,048,564 | Interest of controlled corporations | long position | 8.12% | 3.23% | ||||||||||||||||||||||||||||||||||||
BlackRock, Inc | H Share | 23,698,911 | short position | 1.21% | 0.48% | |||||||||||||||||||||||||||||||||||
| H Share | 117,641,207 | (L) | Investment manager | Corporate | 6.00 | %(L) | 2.39 | %(L) | 117,641,207 | Investment manager | long position | 6.00% | 2.39% | |||||||||||||||||||||||||||
Deutsche Bank Aktiengesellschaft | H Share | 45,754,984 | Beneficial owner | long position | 2.34% | 0.93% | ||||||||||||||||||||||||||||||||||
| 976,930 | Investment manager | long position | 0.05% | 0.02% | ||||||||||||||||||||||||||||||||||||
| 54,793,279 | Person having a security interest in shares | long position | 2.80% | 1.11% | ||||||||||||||||||||||||||||||||||||
| 3,645,400 | Custodian corporation / approved lending agency | long position | 0.18% | 0.07% | ||||||||||||||||||||||||||||||||||||
| 27,049,842 | Beneficial owner | short position | 1.38% | 0.55% | ||||||||||||||||||||||||||||||||||||
| 53,320,179 | Person having a security interest in shares | short position | 2.72% | 1.08% | ||||||||||||||||||||||||||||||||||||
| (1) | The |
| (2) |
Except as described in the table above, we are not aware of any holder of more than 5% of any class of our shares. Our major shareholders do not have voting rights different from those of other shareholders. All of our ordinary shareholders enjoy equal voting rights for each share that they hold.
To our knowledge, other than the Yankuang Group, which ownsowned 52.86% of our Shares,shares as of December 31, 2012, we are not owned or controlled, directly or indirectly, by any other corporation, government, or other natural or legal person or persons, jointly or severally. We are not aware of any arrangement which may at a subsequent date result in a change of control over us.
| B. | Related Party Transactions |
Our connected transactions (as defined under the Hong Kong Listing Rules) were mainly made with the Controlling Shareholder (including its subsidiaries) for the provision of materials and services, giving rise to the continuing connected transactions (as defined under the Hong Kong Listing Rules) described below, and asset purchase transactions.
Continuing Connected Transactions
Upon our restructuring for listing, the Controlling Shareholder, the Yankuang Group, injected its major assets and business relating to coal production and operations into the Company, while the Yankuang Group continues to provide products, materials, services and logistics support services to the Company through its remaining businesses and utilizing its remaining assets. In addition, Yankuang Finance, a joint venture established by the Yankuang Group, China Credit Trust Co., LtdLtd. and the Company, started to provide financial services after its commencement of operation in November 2010. As both the Yankuang Group and the Company are located in Zoucheng City of Shandong Province, we are able to obtain a steady supply of materials, ancillary support services, financial and other services from the Yankuang Group, which may minimize the operational risks, financing costs and financing risks and in turn have a positive impact on our results of operations. In addition, the Yankuang Group purchases products and materials from us at market price, which may secure part of our sales market. Therefore, the continuing connected transactions are necessary and will continue.
Pursuant to approval granted at the second extraordinary generaleighth meeting of the fifth session of the Board of Directors of the Company held on DecemberMarch 23, 2008,2012, the Company entered into five continuing connected transaction agreements with the Yankuang Group, namely the Materials Supply Agreement, Supplymaterials supply agreement, supply of Laborlabor and Services Agreement, Pension Fund Management Agreement, Coal Productsservices agreement, pension fund management agreement, coal products and Materials Supply Agreementmaterials supply agreement and Electricityelectricity and Heat Energy Supply Agreement,heat energy supply agreement, together with the respective annual caps for such transactions from 20092012 to 2011,2014, in the ordinary course of business. The above agreements were approved at the annual general meeting held on June 22, 2012. We determineddetermine the prices of these transactions primarily based on government pricing. If therepricing, or where is no government pricing then theis applicable, market price applies. If there ispricing. Where no government pricing or market price is applicable, then we determine prices based on actual cost. The supply fees can be settled in one lump sum or by installments. The supply fees for continuing connected transactions within the same calendar month shall beare settled in the following month, except those transactions which are not yet completed or those amounts which are in dispute.
Pursuant to approval granted at the fourteenththird meeting of the fourthfifth session of the Board of Directors of the Company held on April 23, 2010,August 19, 2011, we entered into the Financial Services Agreementtwo financial services agreements with Yankuang Finance. Pursuant to the agreement,agreements, Yankuang Finance will provideprovides us with financial services including deposit services, borrowing services and settlement services. The agreementtwo agreements also fixed the proposed annual caps for the transactions from 20102011 to 2011.2012, respectively. Yankuang Finance has agreed to charge us at the same or a more favorable price for its financial services, compared with those charged by the major commercial banks in the PRC for the same kind of financial services. Fund risk control measures were also taken to safeguard the security of the fund. In connection with our entry into these financial services agreement, we terminate the previous Financial Services Agreement between our Company and Yankuang Finance dated January 7, 2011 was also terminated.
The continuing connected transactions between our Company and the Controlling Shareholder for the year 20102011 and 2012 included the following:
Continuing Connected Transaction of Supply of Products and Services under the Materials Supply Agreement, Supply of Labor and Services Agreement, Coal Products and Materials Supply Agreement and Electricity and Heat Energy Supply Agreement
DetailsThe following table sets forth the amounts of arrangement to supply productsgoods and services sold and purchased between our Company and Yankuang Group in 2010 are shown inpursuant to the following table.Materials Supply Agreement, the Supply of Labor and Services Agreement, the Coal Products and Materials Supply Agreement and the Electricity and Heat Energy Supply Agreement for 2011 and 2012.
| For the Year Ended December 31, | For the Year Ended December 31, | |||||||||||||||||||||||||||||||
| 2009 | 2010 | 2011 | 2012 | |||||||||||||||||||||||||||||
| Amount (RMB’000) | % of operating income | Amount (RMB’000) | % of operating income | Amount (RMB’000) | % of operating income | Amount (RMB’000) | % of operating income | |||||||||||||||||||||||||
Sales of goods and rendering of services by the Group to the Controlling Shareholder | 2,608,082 | 12.13 | 3,361,680 | 9.65 | 2,755,278 | 5.53 | 3,803,283 | 6.37 | ||||||||||||||||||||||||
Sales of goods and rendering of services by the Controlling Shareholder to the Group | 2,144,198 | 9.97 | 2,258,967 | 6.48 | 2,717,912 | 5.46 | 3,476,245 | 5.83 | ||||||||||||||||||||||||
Note:The listed figures are under PRC CASs.
The table below shows the effect on profits from sales of coal by the Group to the Controlling Shareholder in 2010:2012:
| Sales income (RMB’000) | Operation cost (RMB’000) | Gross profit (RMB’000) | ||||||||||
Coal sold to the Controlling Shareholder | 2,672,424 | 1,295,783 | 1,376,641 | |||||||||
| Sales income (RMB’000) | Operation cost (RMB’000) | Gross profit (RMB’000) | ||||||||||
Coal sold to the Controlling Shareholder | 3,162,122 | 2,283,135 | 878,986 | |||||||||
Note: The listed figures are under PRC CASs.
Continuing Connected Transaction ofunder the Pension Fund Management Agreement
Pursuant to approval granted at the second 2008 extraordinary shareholders’2011 annual general meeting and according to the Pension Fund Management Agreement and the annual transaction caps thereunder from 20092012 to 2011,2014, the Yankuang Group will provideprovided free management services for contributions that we make to the endowment insurance fund, basic medical insurance fund, supplementary medical insurance fund, unemployment insurance fund and maternity insurance fund.
We contributed an aggregate of approximately RMB1,045.3RMB1,239.6 million and RMB1,408.1 million to the foregoing insurance funds in 2010.2011 and 2012, respectively.
Continuing Connected Transaction ofunder the Financial Services Agreement
Pursuant to approval granted at the fourteenththird meeting of the fourthfifth session of the Board of Directors of the Company held on April 23, 2010,August 19, 2011, we entered into the Financial Services Agreement with Yankuang Finance on January 7,August 19, 2011, which sets forth the annual caps for such transactions in 20102011 and 20112012 as follows:
the maximum daily balance (including accrued interests) on our settlement account in Yankuang Finance is RMB1,400 million;RMB1.82 billion;
the credit facility limit for each of 20102011 and 20112012 is RMB1,000 million;RMB1.6 billion; and
the total fees for the discounted note services and other financial services is RMB28.54 million, in which the annual cap for discounted note service fees is RMB20.94 million.
As of December 31, 2010,2012, the balance of our deposit balance indeposits with Yankuang Finance was RMB1,400RMB1,719.6 million, representing 15.9%10.7% of our total bank depositdeposits as of December 31, 2010.2012. In 2012, we paid financial service fees of RMB1.41 million to Yankuang Finance.
Details of the annual transaction cap for 2010, 2011 and 2012 and the actual transaction amounts in 2010, 2011 and 2012 for the above continuing connected transactions are shown in the following table.
Connected Transactions | Agreement | Annual cap for 2010 (RMB’000) | Transaction amount for 2010 (RMB’000) | Agreement | Annual cap for 2012 (RMB’000) | Transaction amount for 2012 (RMB’000) | ||||||||||||||
Materials and facilities provided by Yankuang Group | Materials Supply Agreement | 660,000 | 421,606 | Materials Supply Agreement | 2,467,930 | 1,552,758 | ||||||||||||||
Labor and services provided by Yankuang Group | Supply of Labor and Services Agreement | 2,356,820 | 1,837,361 | Supply of Labor and Services Agreement | 2,351,420 | 1,923,486 | ||||||||||||||
Pension fund management provided by Yankuang Group | Pension Fund Management Agreement | 1,209,600 | 1,045,296 | Pension Fund Management Agreement | 1,442,100 | 1,408,065 | ||||||||||||||
Coal and material provided to Yankuang Group | Coal Products and Materials Supply Agreement | 4,070,000 | 3,126,678 | |||||||||||||||||
Sale of products, material and equipment lease provided to Yankuang Group | Products, Material and Equipment Lease Supply Agreement | 4,163,900 | 3,635,988 | |||||||||||||||||
Electricity and heat provided to Yankuang Group | Electricity and Heat Energy Supply Agreement | 334,000 | 235,002 | Electricity and Heat Energy Supply Agreement | 268,800 | 167,295 | ||||||||||||||
Financial services provided by Yankuang Finance | Financial service agreement | Financial service agreement | ||||||||||||||||||
deposit balance | 1,400,000 | 1,400,000 | 1,820,000 | 1,719,621 | ||||||||||||||||
credit facility | 1,000,000 | 0 | 1,600,000 | 0 | ||||||||||||||||
financial service fee | 28,540 | 0 | 28,540 | 1,411 | ||||||||||||||||
The table below sets forth the continuing connected transactions that we conducted with Yankuang Group or its subsidiarysubsidiaries during the periods indicated:
| Year Ended December 31, | ||||||||||||
| 2008 | 2009 | 2010 | ||||||||||
| (RMB’000) | ||||||||||||
Sales Income | ||||||||||||
Sales of coal | 1,384,415 | 2,086,542 | 2,672,424 | |||||||||
Sales of auxiliary materials | 550,986 | 317,479 | 454,254 | |||||||||
Sales of heat and electricity | — | 204,061 | 235,002 | |||||||||
Total | 1,935,401 | 2,608,082 | 3,361,680 | |||||||||
Expenditure | ||||||||||||
Utilities and facilities | 376,288 | 39,069 | 34,006 | |||||||||
Annual fee for mining rights | — | — | — | |||||||||
Purchases of supply materials and equipment | 471,768 | 598,498 | 421,606 | |||||||||
Repair and maintenance services | 253,864 | 388,917 | 262,478 | |||||||||
Social welfare and support services | 255,265 | 769,561 | 794,621 | |||||||||
Technical support and training | 20,000 | 26,000 | 26,000 | |||||||||
Road transportation services | 86,671 | 79,560 | 64,945 | |||||||||
Construction services | 294,938 | 242,593 | 655,311 | |||||||||
Total | 1,758,794 | 2,144,198 | 2,258,967 | |||||||||
| Year Ended December 31, | ||||||||||||
| 2010 | 2011 | 2012 | ||||||||||
| (RMB’000) | ||||||||||||
Sales Income | ||||||||||||
Sales of coal | 2,672,424 | 2,088,794 | 3,162,122 | |||||||||
Sales of auxiliary materials | 454,254 | 485,676 | 425,957 | |||||||||
Sales of heat and electricity | 235,002 | 180,808 | 167,295 | |||||||||
Sales of methanol | — | — | 47,909 | |||||||||
|
|
|
|
|
| |||||||
Total | 3,361,680 | 2,755,278 | 3,803,283 | |||||||||
Expenditure | ||||||||||||
Utilities and facilities | 34,006 | 31,646 | 35,906 | |||||||||
Purchases of supply materials and equipment | 421,606 | 696,802 | 1,552,758 | |||||||||
Repair and maintenance services | 262,478 | 323,550 | 327,600 | |||||||||
Social welfare and support services | 794,621 | 848,121 | 802,540 | |||||||||
Technical support and training | 26,000 | 26,000 | — | |||||||||
Road transportation services | 64,945 | 73,638 | 67,654 | |||||||||
Construction services | 655,311 | 718,155 | 689,787 | |||||||||
|
|
|
|
|
| |||||||
Total | 2,258,967 | 2,717,912 | 3,476,245 | |||||||||
Opinions of the Independent Non-executive Directors
OurThe Company’s independent non-executive Directors have reviewed theour continuing connected transactions that took place in 2010with the Controlling Shareholder for the year 2012 and confirmedconfirm that all such connected transactions have been: (i) entered into by us in theour ordinary and usual course of our business,business; (ii) conducted either on normal commercial terms, or where there are not sufficient comparable transactions to judge whether they are on normal commercial terms, on terms no less favorable to us than terms available to or from independent third parties,parties; and (iii) entered into in accordance with the relevant agreement governing themagreement on terms that are fair and reasonable and in the interests of the Shareholders as a whole. The independent Directorsdirectors also determinedconfirmed that the valuetransaction amount of each of the above continuing connected transactions in respect of the supply of materials and services stated under “Continuing Connected Transaction of Supply of Products and Services” above did not exceed thetheir respective annual capcaps for 20102012 as approved by independent shareholders and the Board.board of directors.
Opinion of the Auditors
Pursuant to Rule 14A.38 of the Hong Kong Listing Rules, the Directors have engaged the auditors of the Company to perform certain procedures required by the Hong Kong Listing Rules in respect of the continuing connected transactions of the Group. The auditors have reported to the Directors that the above continuing connected transactions: (1) have received the approval of the Board; (2) are in accordance with the pricing policies of the Company; (3) have been entered into in accordance with the relevant agreement governing the transactions; and (4) have not exceeded the relevant annual caps.
Acquisition from Connected Parties
Installation Payment for the Mining RightsAcquisition of Jining III Coal Mine
Pursuant to the Jining III Coal Mine Acquisition Agreement entered into between the Company and the Yankuang Group in 2000, we agreed to purchase the mining rights of Jining III Coal Mine for approximately RMB132.5 million. Payment was to be made in ten interest-free annual installments beginning in 2001. Accordingly, we paid a total of RMB13.248 million for the mining rights to the Yankuang Group in 2010. As of December 31, 2010, the total of RMB132.5 million for the mining rights of Jining III Coal Mine was paid in full.
External Connected Transactions Entered Into Jointly by Us and Related Parties
Investment in Yankuang Finance amongMines From Yankuang Group
Pursuant to approval granted at the thirteenth meetingSee “Item 4. Information of the third session of the Board held on August 3, 2007, we established Yankuang Finance jointly with the Yankuang Group and China Credit Trust Co., Ltd. The registered capital of Yankuang Finance is RMB500.0 million, of which we have contributed RMB125.0 million in cash, representing an equity interest of 25%. Yankuang Finance commenced its operations on November 1, 2010. Yankuang Finance provides financial services such as accepting deposits from members, inter-bank borrowings and making the bill acceptance and discount for its members.
Establishment of Future Energy
For details of our establishment of Future Energy, please see “Item 4 Information on the Company — A. History and Development of our Company — EstablishmentAcquisition of Shaanxi Future Energy Chemical Corp. Ltd”.Coal Mines From Yankuang Group.”
Debt and debt obligations due betweenDebt Obligations Between the Controlling Shareholder and usOur Company
The table below sets forth theour balances due from/to the Controlling Shareholder between the Controlling Shareholder and us in 2010.Shareholder.
| Payable to related parties | Receivable from related parties | |||||||||||||||||||||||||||||||||||||||
Related Parties | Receivable from related parties | Payable to related parties | ||||||||||||||||||||||||||||||||||||||
| Amount involved | Remaining | Amount involved | Remaining | Balance at the beginning | Amount occurred | Closing balance | Balance at the beginning | Amount occurred | Closing balance | |||||||||||||||||||||||||||||||
| (RMB’000) | (RMB’000) | |||||||||||||||||||||||||||||||||||||||
Yankuang Group | 3,595,591 | 924,623 | 3,502,519 | 1,363,406 | 2,595,569 | 9,934,751 | 2,868,744 | 1,155,168 | 2,210,139 | 1,767,998 | ||||||||||||||||||||||||||||||
Amounts due to the Controlling Shareholder and Its Subsidiaries
For the details of the amounts due to the Controlling Shareholder and its subsidiaries, please refer to “Item 5 — Operating and Financial Review and Prospects — F. Contractual Obligations — Amounts due to the Controlling Shareholder and Its Subsidiaries”.
Up toSubsidiaries.” As of December 31, 2010,2012, the Controlling Shareholder or its subsidiaries had not used our funds for nonoperational matters.
Transactions/Transactions / Balances with Other State-owned Entities in the PRC
We operate in an economic environment currently predominated by entities directly or indirectly owned or controlled by the PRC government (“state-owned entities”). In addition, our Controlling Shareholder is also a state-owned entity. Apart from the transactions with the Controlling Shareholder and its subsidiaries and other disclosure disclosed above, we also conduct business with other state-owned entities. Our Directors consider those state-owned entities as independent third parties so far as our business transactions with them are concerned.
Material transactions with other state-owned entities are as follows:
| Year Ended December 31, | Year Ended December 31, | |||||||||||||||||||||||
| 2008 | 2009 | 2010 | 2010 | 2011 | 2012 | |||||||||||||||||||
| (RMB’000) | (RMB’000) | |||||||||||||||||||||||
Trade sales | 10,253,998 | 6,970,855 | 9,823,814 | 9,823,814 | 8,487,421 | 10,503,203 | ||||||||||||||||||
Trade purchases | 1,328,958 | 1,191,783 | 1,581,427 | 1,581,427 | 2,597,741 | 4,500,994 | ||||||||||||||||||
Material balances with other state-owned entities are as follows:
| As of December 31, | As of December 31, | |||||||||||||||
| 2009 | 2010 | 2011 | 2012 | |||||||||||||
| (RMB’000) | (RMB’000) | |||||||||||||||
Amounts due from other state-owned entities | 1,101,535 | 1,320,801 | 681,413 | 1,361,139 | ||||||||||||
Amounts due to other state-owned entities | 359,726 | 443,403 | 580,726 | 592,267 | ||||||||||||
In addition, we have entered into various transactions, including deposit placements, borrowings and other general banking facilities, with certain banks and financial institutions that are state-owned entities in the ordinary course of business. In view of the nature of those banking transactions, our Directors are of the opinion that separate disclosures are not be necessary.
Except as disclosed above, our Directors are of the opinion that transactions with other state-owned entities are not significant to our operations.
Interest of Management in Certain Transactions
None of the Directors or supervisors or executive officers had, either directly or indirectly, any material interest in any significant material contract to which we were a party during the year ended December 31, 2010.2012.
| C. | Interests of Experts and Counsel |
Not applicable.
| ITEM 8. | FINANCIAL INFORMATION |
| A. | Consolidated Statements and Other Financial Information |
Financial Statements
You should read “Item 18. Financial Statements” for information regarding our audited consolidated financial statements and other financial information.
Significant Legal Proceedings and Arbitration
We were not involved in any other significant litigation or arbitration during the reporting period other than as disclosed in this report.
Dividend Policy
Pursuant to approval granted at the 2008 annual general meeting for the year 2009 held on June 25, 2010,26, 2009 and the 2011 annual general meeting held on June 22, 2012, the Company amended the terms of the Articles of Association relating to profit distribution.
According to our Articles of Associations,Association, we shall maintain the continuance and stability of our profit distribution policy. We pay final dividends once a year. Shareholders shall, by way of an ordinary resolution, authorize our Board of Directors to declare and pay dividends, and we distribute interim dividends pursuant to the approval of the board and shareholders. We may distribute dividends in the form of cash, shares or a combination of both cash and shares. Upon approvals of the Board and the Shareholders’ meeting, we distribute final dividends once a year and may distribute interim dividends. Each cash dividend distribution shall have a time interval of more than six months. Cash dividends shall account for approximately 35% of the net profit of the fiscal year after the deduction of the statutory common reserve.reserve, unless if such distribution will adversely affect our sustainable development or we have contemplated substantial investment or have substantial cash requirements. Pursuant to our Articles of Association, our after-tax profit shall be allocated in the following order: (1) compensation of losses (if our statutory common reserve fund is not sufficient to compensate our losses from the previous year, we will utilize our after tax profit to compensate our losses before making any provision for the statutory common reserve fund) (2) allocation to the statutory common reserve fund; (3) allocation to the discretionary common reserve fund upon approval by a resolution of a shareholders’ general meeting; and (4) dividend payments for ordinary shares.
The Company’s dividend distribution plan was approved at the 2011 annual general meeting on June 22, 2012 to distribute cash dividends of RMB0.57 per share (tax inclusive) for 2011. As of the date of this annual report, the 2011 dividends have been distributed to the Shareholders.
| B. | Significant Changes |
We have not experienced any significant changes since the date of the consolidated financial statements in this annual report.
| ITEM 9. | THE OFFER AND LISTING |
| A. | Offer and Listing Details |
The following tables set forth a summary of the issuance of our Shares:
| H Shares | A Shares | |||||||||||||||||||
| Initial offering | Second offering | Third offering | Initial offering | Second offering | ||||||||||||||||
Time of issuance | March 1998 | May 2001 | July 2004 | June 1998 | January 2001 | |||||||||||||||
Issue amount | 850,000,000 | 170,000,000 | 204,000,000 | 80,000,000 | 100,000,000 | |||||||||||||||
As of December 31, 2010,2012, our share capital structure was as follows:
Type | Number of shares | Percentage of total shares | Number of shares | Percentage to total shares | ||||||||||||
Listed shares with restricted trading condition | 2,600,021,800 | 52.8632 | % | 2,600,021,800 | 52.8632 | % | ||||||||||
Promoter Shares | 2,600,000,000 | 52.8627 | % | |||||||||||||
Shares held by state-owned legal person | 2,600,000,000 | 52.8627 | % | |||||||||||||
A Shares held by our Directors, supervisors and executive officers | 21,800 | 0.0005 | % | 21,800 | 0.0005 | % | ||||||||||
Listed shares without trading condition | 2,318,378,200 | 47.1368 | % | |||||||||||||
Listed shares without trading moratorium | 2,318,378,200 | 47.1368 | % | |||||||||||||
A Shares | 359,978,200 | 7.3190 | % | 359,978,200 | 7.3190 | % | ||||||||||
H Shares | 1,958,400,000 | 39.8178 | % | 1,958,400,000 | 39.8178 | % | ||||||||||
|
| |||||||||||||||
Total | 4,918,400,000 | 100.0 | % | 4,918,400,000 | 100.0 | % | ||||||||||
As of December 31, 2010,2012, we had 2,600,021,800 listed sharesShares that were subject to trading restrictions, substantially all of which are held by our Controlling Shareholder on behalf of the State and the remainder by our Directors, supervisors and executive officers.
In 2010, the change of2012, our listed Shares subject to trading restrictions wasdid not change. The following table sets forth information on Shares subject to trading restrictions as follows:of December 31, 2012.
Shareholders | Shares subject to trading restrictions as of January 1, 2010 (shares) | Shares released from trading restrictions in 2010 (shares) | Increase in Shares subject to trading restrictions in 2010 (shares) | Shares subject to trading restrictions as of December 31, 2010 (share) | Basis for imposition of or release from trading restriction | |||||||||||||
Yankuang Group | 2,600,000,000 | 0 | 0 | 2,600,000,000 | Share reform plan(1) | |||||||||||||
Yang Deyu | 20,000 | 20,000 | 0 | 0 | Mr. Yang Deyu resigned from his position as a Director and Vice Chairman of the Company on December 31, 2009. | |||||||||||||
Wu Yuxiang | 20,000 | 0 | 0 | 20,000 | Share held by Directors, Supervisors and senior management | |||||||||||||
Song Guo | 1,800 | 0 | 0 | 1,800 | ||||||||||||||
Total | 2,600,041,800 | 20,000 | 0 | 2,600,021,800 | — | |||||||||||||
Shareholders Undertaking Yankuang Group WU Yuxiang SONG Guo Total Shares subject
to trading
restrictions
(shares) Listing and trading
date Additional tradable
shares
(shares) 2,600,000,000 — 0 Undertakings made by Yankuang Group in Yanzhou Coal’s share split have been performed. Yankuang Group may proceed with the transaction after filing its application and obtaining the relevant approval from the relevant authorities. 20,000
In accordance with the relevant laws, Directors, Supervisors and senior
management can only sell up to 25% of the total number of shares held
by them during each year of their employment. If the above persons sold
any shares held by them within six months after the purchase, or made
any purchase within six months after disposal, any gain from such
transactions will be attributable to the Company. 1,800 2,600,021,800
Capitalization of Capital Reserve and Our Capital Structure:
Our total sharesShares and shareholding structure remained the same in 2010, however, our shareholding structure changed as follows, resulting from the release of the restriction on restricted shares held by certain individuals:2012.
| Number of Shares as of January 1, 2010 | Increase/decrease in shares during the year | Number of Shares as of December 31, 2010 | ||||||||||
Restricted Shares | 2,600,041,800 | (20,000 | ) | 2,600,021,800 | ||||||||
Promoter Shares | 2,600,000,000 | — | 2,600,000,000 | |||||||||
A Shares held by our Directors, supervisors and executive officers | 41,800 | (20,000 | ) | 21,800 | ||||||||
Unrestricted Shares | 2,318,358,200 | 20,000 | 2,318,378,200 | |||||||||
A Shares | 359,958,200 | 20,000 | 359,978,200 | |||||||||
H Shares | 1,958,400,000 | — | 1,958,400,000 | |||||||||
Total | 4,918,400,000 | — | 4,918,400,000 | |||||||||
The table below sets forth certain market information relating to the H Shares, ADSs and A Shares for the periods indicated:
| Price per H Share (HK$) | Price per ADS (US$) | Price per A Share (RMB) | Price per H Share(HK$) | Price per ADS(US$) | Price per A Share(RMB) | |||||||||||||||||||||||||||||||||||||||||||
| High | Low | High | Low | High | Low | High | Low | High | Low | High | Low | |||||||||||||||||||||||||||||||||||||
Annual highs and lows | ||||||||||||||||||||||||||||||||||||||||||||||||
2006 | 7.50 | 4.58 | 9.76 | 5.86 | 8.90 | 5.70 | ||||||||||||||||||||||||||||||||||||||||||
2007 | 17.82 | 6.28 | 23.35 | 8.01 | 27.68 | 7.07 | ||||||||||||||||||||||||||||||||||||||||||
2008 | 17.94 | 2.98 | 22.90 | 4.04 | 26.99 | 7.60 | 17.94 | 2.98 | 22.90 | 4.04 | 26.99 | 7.60 | ||||||||||||||||||||||||||||||||||||
2009 | 17.34 | 4.00 | 22.32 | 5.11 | 26.15 | 8.40 | 17.34 | 4.00 | 22.32 | 5.11 | 26.15 | 8.40 | ||||||||||||||||||||||||||||||||||||
2010 | 25.25 | 14.00 | 32.26 | 18.29 | 33.65 | 14.88 | 25.25 | 14.00 | 32.26 | 18.29 | 33.65 | 14.88 | ||||||||||||||||||||||||||||||||||||
2011 | 32.95 | 13.72 | 41.89 | 17.49 | 39.50 | 20.38 | ||||||||||||||||||||||||||||||||||||||||||
2012 | 20.15 | 9.92 | 25.81 | 12.64 | 26.54 | 15.08 | ||||||||||||||||||||||||||||||||||||||||||
Quarterly highs and lows | ||||||||||||||||||||||||||||||||||||||||||||||||
2008 | ||||||||||||||||||||||||||||||||||||||||||||||||
First quarter | 16.80 | 8.96 | 21.3 | 11.5 | 24.68 | 17.32 | ||||||||||||||||||||||||||||||||||||||||||
Second quarter | 17.94 | 10.80 | 22.9 | 14.38 | 26.99 | 13.75 | ||||||||||||||||||||||||||||||||||||||||||
Third quarter | 15.82 | 7.50 | 20.24 | 9.99 | 22.09 | 9.50 | ||||||||||||||||||||||||||||||||||||||||||
Fourth quarter | 8.47 | 2.98 | 10.72 | 4.04 | 12.29 | 7.60 | ||||||||||||||||||||||||||||||||||||||||||
2009 | ||||||||||||||||||||||||||||||||||||||||||||||||
First quarter | 7.10 | 4.00 | 9.08 | 5.11 | 13.35 | 8.40 | ||||||||||||||||||||||||||||||||||||||||||
Second quarter | 11.70 | 5.55 | 15.00 | 7.33 | 16.81 | 12.60 | ||||||||||||||||||||||||||||||||||||||||||
Third quarter | 13.00 | 9.20 | 16.81 | 11.68 | 23.70 | 14.60 | ||||||||||||||||||||||||||||||||||||||||||
Fourth quarter | 17.34 | 10.48 | 22.32 | 13.52 | 26.15 | 16.95 | ||||||||||||||||||||||||||||||||||||||||||
2010 | ||||||||||||||||||||||||||||||||||||||||||||||||
First quarter | 20.75 | 14.00 | 25.65 | 18.39 | 25.66 | 18.47 | 20.75 | 14.00 | 25.65 | 18.39 | 25.66 | 18.47 | ||||||||||||||||||||||||||||||||||||
Second quarter | 22.40 | 14.50 | 28.72 | 18.50 | 23.76 | 16.27 | 22.40 | 14.50 | 28.72 | 18.50 | 23.76 | 16.27 | ||||||||||||||||||||||||||||||||||||
Third quarter | 19.18 | 14.50 | 24.71 | 18.29 | 19.50 | 14.88 | 19.18 | 14.50 | 24.71 | 18.29 | 19.50 | 14.88 | ||||||||||||||||||||||||||||||||||||
Fourth quarter | 25.25 | 19.40 | 32.26 | 24.54 | 33.65 | 18.98 | 25.25 | 19.40 | 32.26 | 24.54 | 33.65 | 18.98 | ||||||||||||||||||||||||||||||||||||
Monthly highs and lows | ||||||||||||||||||||||||||||||||||||||||||||||||
2010 | ||||||||||||||||||||||||||||||||||||||||||||||||
December | 23.80 | 20.90 | 30.72 | 27.46 | 30.74 | 25.77 | ||||||||||||||||||||||||||||||||||||||||||
2011 | ||||||||||||||||||||||||||||||||||||||||||||||||
January | 26.20 | 22.20 | 33.13 | 28.69 | 30.00 | 23.29 | ||||||||||||||||||||||||||||||||||||||||||
February | 23.65 | 21.05 | 30.30 | 27.67 | 28.96 | 24.37 | ||||||||||||||||||||||||||||||||||||||||||
March | 29.25 | 23.00 | 36.71 | 29.34 | 36.45 | 27.40 | ||||||||||||||||||||||||||||||||||||||||||
April | 32.00 | 28.05 | 39.80 | 35.92 | 39.50 | 33.28 | ||||||||||||||||||||||||||||||||||||||||||
May | 32.95 | 27.55 | 41.89 | 35.41 | 35.75 | 29.92 | ||||||||||||||||||||||||||||||||||||||||||
June (through June 17, 2011) | 32.85 | 28.50 | 41.62 | 36.58 | 34.80 | 31.24 | ||||||||||||||||||||||||||||||||||||||||||
First quarter | 29.25 | 21.05 | 36.71 | 27.67 | 36.45 | 23.29 | ||||||||||||||||||||||||||||||||||||||||||
Second quarter | 32.95 | 27.55 | 41.89 | 35.41 | 39.50 | 29.92 | ||||||||||||||||||||||||||||||||||||||||||
Third quarter | 31.20 | 16.02 | 41.62 | 20.75 | 36.98 | 26.50 | ||||||||||||||||||||||||||||||||||||||||||
Fourth quarter | 22.60 | 13.72 | 28.22 | 17.49 | 30.44 | 20.38 | ||||||||||||||||||||||||||||||||||||||||||
2012 First quarter Second quarter Third quarter Fourth quarter Monthly highs and lows 2012 October November December 2013 January February March April (through April 23, 2013) Price per H Share
(HK$) Price per ADS
(US$) Price per A Share
(RMB) High Low High Low High Low 20.15 15.72 25.81 20.56 26.54 20.61 17.48 11.60 22.32 14.68 25.66 18.38 13.78 9.92 17.57 12.64 19.76 16.91 13.16 11.00 17.11 14.16 19.30 15.08 13.16 11.00 16.98 14.16 19.30 17.38 12.48 11.10 16.07 14.25 18.59 15.96 13.04 11.54 17.11 14.97 18.48 15.08 14.48 12.90 18.57 16.77 18.99 17.40 13.54 11.28 17.40 14.49 20.18 17.08 12.00 10.32 15.34 13.53 19.51 16.47 10.56 8.56 13.77 10.93 17.25 15.5
As of December 31, 2010,2012, a total of 1,958,400,000 H Shares were outstanding, of which approximately 197,441,580129,153,800 H sharesShares or 10.08%6.6% of the outstanding H Shares, were held in the form of 19,744,15812,915,380 ADSs. The outstanding ADSs were held collectively by 111105 holders of record as of MayMarch 31, 2011.2013.
Repurchase, Sale or Redemption of H shares
The shareholders at the 20102012 first A shareholders’ meeting and the 20102012 first H shareholders’ meeting, and the 2011 Annual General Meeting, each of which was held on June 25, 2010, and 2010 Annual General Meeting, held on May 20, 2011,22, 2012, resolved and granted the Board of Directors a general mandate to (i) repurchase H Shares up to 10% of the outstanding H Shares as of the date of the resolutions’ passage; and (ii) issue additional H shares up to 20% of the outstanding H Shares as of the date of the resolutions’ passage. During the mandate period, the Board of Directors may exercise the mandate based on our interests and market conditions, subject to the approvals of the relevant regulatory authorities and in compliance with laws, regulations and the Articles of Association. As of the date of this annual report, the general mandate to repurchase H Shares or issue additional H Shares has not been exercised.
| B. | Plan of Distribution |
Not applicable.
| C. | Markets |
Our A Shares are listed on the Shanghai Stock Exchange under the approval of the China Securities Regulatory Commission. The principal trading market for the H Shares is the Hong Kong Stock Exchange. The ADSs have been issued by The Bank of New York Mellon, acting as Depositary Bank, and are listed on the New York Stock Exchange under the symbol “YZC”. For market price information on the exchanges on which our securities are listed, see “– A. Offer and Listing Details”.
| D. | Selling Shareholders |
Not applicable.
| E. | Dilution |
Not applicable.
| F. | Expenses of the Issue |
Not applicable.
| ITEM 10. | ADDITIONAL INFORMATION |
| A. | Share Capital |
Not applicable.
| B. | Memorandum and Articles of Association |
Since the effective date of our Articles of Association, the PRC government and other regulatory authorities have promulgated various rules, regulations and opinions which include the Securities Laws of the PRC, the General Meeting Opinions, and the Guide for Articles of Association of Listed Companies. As a listed company, we are required to incorporate these rules, regulations and opinions into our Articles of Association as appropriate.
Selected Summary of our Articles of Association
A copy of the English translation of our Articles of Association was filed with the Commission as an exhibit to our registration statement on Form F-1 under the Securities Act in connection with the global offering of our H Shares and related American Depositary Shares in 1997. The following table sets forth the dates our Articles of Association were amended or filed with the Commission, or both:
| Date of Amendment to the Articles of Association | Filing | |
| April 22, 2002 | Appendix to 2001 20-F | |
| June 25, 2004 | Appendix to 2003 20-F | |
| July 8, 2004 | Appendix to 2004 20-F | |
June 28, 2005 | ||
| August 22, 2005 | Appendix to 2005 20-F | |
| June 28, 2006 | Appendix to 2006 20-F | |
| November 10, 2006 | ||
| June 15, 2007 | Appendix to 2007 20-F | |
| January 30, 2008 | ||
| December 23, 2008 | Appendix to 2008 20-F | |
| June 26, 2009 | Appendix to 2010 20-F | |
| June 25, 2010 | ||
February 18, 2011 | ||
| May 20, 2011 | ||
| April 23, 2012 | Appendix to 2011 20-F |
Objects and Purposes
We are a joint stock limited company established in accordance with the “Company Law”, “State Council’s Special Regulations Regarding the Issue of Shares Overseas and the Listing of Shares Overseas by Companies Limited by Share” and other relevant laws and administrative regulations of the State. We were established by way of promotion with the approval of the former State Commission for Restructuring the Economic System on September 24, 1997, as evidenced by approval document Ti Gai Sheng (1997) No. 154 of 1997. We were registered with and have obtained a business license from Shandong Provincial Administration Bureau of Industry and Commerce on September 25, 1997. Our business license number is: 370000400001016.
Our scope of business includes: selection and sale of coal (among others, the export of coal should be made through companies with coal export rights according to existing state regulations); transportation of goods through self-owned railways within the mining areas; transportation of goods through highways; operation of ports; manufacture, sale, lease and repair of relevant mining equipment; production and sale of other mining materials; sale and lease of electronic equipment and sale of parts; sale of metallic materials, electronic products, construction materials, timber, rubber products and methanol; provision of mining, science and technological services; property development within the mining areas, property leasing and provision of services such as dining and accommodation; production and sale of coal residual stones as construction materials; sale of coking coal and iron ore; import and export of goods and technology; warehousing; and automotive repairs.
Board of Directors
The Board of Directors is accountable to shareholders and exercises the powers granted to it by the Articles of Association.
Directors who are not employee representatives are elected or removed at shareholders’ general meetings. Employee directors are elected in staff representative meetings or by other democratic methods. All Directors are elected for a term of three years, which can be renewed by re-election at the expiry of the term, unless an Director is removed for cause during his term.
We have established a system of independent Directors and currently have four independent Directors. Independent Directors do not hold any positions in the Company other than their role as directors and do not maintain with us or our substantial shareholders a connection which may hamper their independent and objective judgment. In addition to the powers granted to Directors by the Company Law and other relevant laws, regulations and the Articles of Association, independent Directors have the following powers:
| (i) | a majority of the independent Directors must agree to the engagement of substantial connected transactions, as determined in accordance with the standards promulgated from time to time by the regulatory organizations of the place where the Company’s shares are listed, and the appointment of accounting firm(s) before submitting such decisions to the Board of Directors; |
| (ii) | a majority of the independent Directors may call an extraordinary general meeting for the Board of Directors, propose a board meeting, and publicly collect proxy votes from shareholders before shareholders’ general meetings; and |
| (iii) | with the consent of a majority of the independent Directors, the independent Directors may independently engage external auditors and consultants to provide audit and consultation for specific Company matters, with the Company bearing the associated costs. |
If the above recommendations are not accepted or the above powers cannot be exercised ordinarily, the Company shall disclose the circumstances accordingly.
Where a Director, , supervisor or senior officer of the Company is in any way, directly or indirectly, materially interested in a contract, transaction or arrangement or proposed contract, transaction or arrangement with the Company (other than his contract of service with the Company), he shall declare the nature and extent of his interests to the Board of Directors at the earliest opportunity, whether or not the contract, transaction or arrangement or proposal therefortherefore is otherwise subject to the approval of the board of directors. Unless the interested director, supervisor or senior officer discloses his interests in accordance with the preceding sub-paragraph of this Article and the contract, transaction or arrangement is approved by the board of directors at a meeting in which the interested director, supervisor or senior officer is not counted as part of the quorum and refrains from voting, a contract, transaction or arrangement in which that Director, supervisor or senior officer is materially interested is voidable at the instance of the Company except as against a bona fide party thereto who did not have notice of the breach of duty by the interested director, supervisor or senior officer.
Similarly, our Articles provide that when passing a resolution in relation to a connected transaction, or where any Director or any of its associates (as defined under the Listing Rules of the Stock Exchange of Hong Kong) is connected with such resolution, such connected director must recuse himself from the Board meeting, not have any voting rights in respect thereof, not exercise any voting right on behalf of other directors and not be counted as part of the quorum of the Board of Directors’ meeting. Such board meeting can be convened where not less than half of the disinterested directors of the Company attend the meeting and any such resolutions shall be passed by at least half of the disinterested directors of the Company. If less than three non-connected Directors attend the Board of Directors’ meeting, the connected transaction shall be submitted as a resolution at a shareholders’ general meeting of the Company.
Pursuant to our Articles of Association, with the approval of over two-thirds of all Directors, the Board of Directors may exercise its borrowing powers subject to the following guidelines:
| (1) | a single loan of more than 10% and less than 25% of the Company’s latest audited net asset value so long as the debt ratio to the Company’s assets remains under 80% after such financing; and |
| (2) | mortgages or pledges of assets the cumulative outstanding amount of which is less than 30% of the Company’s latest audited net asset value. |
Remuneration of Directors are determined by resolution of the shareholders. The Articles of Association do not impose a mandatory retirement age or share ownership qualification on Directors.
Description of the Shares and Shareholder Rights
As of December 31, 2010,2012, our share capital structure consists of 4,918,400,000 ordinary shares, comprising
| (1) | 2,960,000,000 domestic shares, which represent 60.18% of our share capital, of which: |
| a. | 2,600,000,000 shares, which represent 52.86% of our share capital, were held by the promoter, Yankuang Group Corporation Limited, and |
| b. | 360,000,000 shares, which represent 7.32% of our share capital, were held by other shareholders; and |
| (2) | 1,958,400,000 foreign H shares, which represent 39.82% of our share capital, were held by the H Shares shareholders. |
Holders of our ordinary Shares are entitled to share in the Company’s profits, dividends and other distributions in proportion to the number of Shares held and are not liable for making any further contribution other than the subscription amount. Our ordinary shareholders enjoy the following rights:
| (i) | the right to receive dividends and other distributions in proportion to the number of shares held; |
| (ii) | the right to demand the convening of a shareholders’ meeting, convene a shareholders’ meeting, attend or appoint a proxy to attend shareholders’ meetings and to vote thereat; |
| (iii) | the right of supervisory management over our business operations and the right to present proposals or to raise queries; |
| (iv) | the right to transfer, grant or pledge shares so held in accordance with laws, administrative regulations and provisions of our Articles of Association; |
| (v) | the right to obtain relevant information in accordance with the provisions of our Articles of Association; |
| (vi) | in the event of our termination or liquidation, the right to participate in the distribution of our surplus assets in accordance with the number of shares held; |
| (vii) | for shareholders who disagree with the resolutions for the merger and separation of the Company made in a general meeting, the right to demand the Company to purchase their shares; and |
| (viii) | other rights conferred by laws, administrative regulations and our Articles of Association. |
Voting Rights
Shareholders (including proxies), when voting at a shareholders’ general meeting, may exercise such voting rights as are attached to the number of voting shares which they hold. Each shareShare represents one vote. Shares held by the Company do not have voting rights and these shares will not count as the total number of shares entitled to vote. Resolutions at shareholders’ general meetings shall be divided into ordinary resolutions and special resolutions. An ordinary resolution must be passed by votes representing more than half of the voting rights represented by the shareholders (including proxies) present at the meeting. A special resolution must be passed by votes representing more than two-thirds of the voting rights represented by the shareholders (including proxies) present at the meeting.
Other than the obligations provided by the laws, administrative legislations and the listing rules of the stock exchange on which the Company’s shares are listed, our Controlling Shareholder (as defined in the Articles) shall not exercise its voting rights to approve the following matters which will be prejudicial to the interests of all or some of the other shareholders.
| (i) | to relieve a director or supervisor of his duty to act honestly in the best interests of the Company; |
| (ii) | to approve the expropriation by a Director or supervisor (for his own benefit or for the benefit of another person) of the Company’s assets in any way, including (without limitation) opportunities which are beneficial to the Company; and |
| (iii) | to approve the expropriation by a |
Sources of Shareholders’ Rights
The rights and obligations of holders of H Shares and other provisions relating to shareholder protection are principally provided in the Articles of Association and the PRC Company Law. The Articles of Association incorporate mandatory provisions in accordance with the Mandatory Provisions for the Articles of Association of Companies Listed Overseas promulgated by the State Council Securities Commission and the State Restructuring Commission on August 27, 1994 (the “Mandatory Provisions”). We are further subject to management ordinances applicable to the listed companies in Hong Kong SAR and the United States, as our H Shares are listed on the Hong Kong Stock Exchange and the New York Stock Exchange (in the form of ADSs).
In addition, for so long as the H Shares are listed on the Hong Kong Stock Exchange, we are subject to the Rules Governing the Listing of Securities on The Stock Exchange of Hong Kong Limited (the “HKSE Rules”), the Securities and Futures Ordinance of Hong Kong (the “SFO”) and the Hong Kong Code on Takeovers and Mergers and Share Repurchases. The Listing Agreement between us and the Hong Kong Stock Exchange further provides that we may not permit amendments to certain sections of the Articles of Association subject to the Mandatory Provisions. These sections include provisions relating to (i) varying the rights of existing classes of shares; (ii) voting rights; (iii) the power of us to purchase our own shares; (iv) rights of minority shareholders; and (v) procedures upon liquidation. In addition, certain amendments to the Articles of Association require the approval and assent of relevant PRC authorities.
MergerMergers and AcquisitionAcquisitions
In the event of the merger or division of our Company, a plan must be presented by our Board of Directors and approved in accordance with the procedures stipulated in our Articles of Association. Shareholders who object to the plan of merger or division will have the right to demand us or the shareholders who consent to the plan of merger or division to acquire their shares at fair market price. A resolution proposing a merger or division by our company constitutes a special document, which will be available for inspection by our shareholders.
Redemption Provisions
In accordance with the procedures set out in the Articles of Association and upon obtaining approval from relevant government authorities, we may repurchase our issued Shares under the following circumstances:
| (i) | canceling Shares to reduce our capital; |
| (ii) | merger with another company that holds Shares of our Company; |
| (iii) | granting employee incentive Shares; |
| (iv) | purchasing the shares of dissenting shareholders; and |
| (v) | other circumstances permitted by relevant laws and administrative regulations. |
Apart from the above, the Company is not allowed to engage in trading of its own shares.
We may repurchase shares in one of the following ways, with the approval of the relevant government authorities:
| (i) | by making a general offer to repurchase shares of all our shareholders on a pro rata basis; |
| (ii) | by repurchasing shares through a public dealing on a stock exchange; |
| (iii) | by repurchasing shares outside of the stock exchange by means of an off-market agreement; or |
| (iv) | by other means as authorized by the competent securities authorities under the State Council. |
Variation of Rights
The rights attached to any class of shares may not be varied or abrogated except with the approval of a special resolution by all shareholders at a general meeting, along with a special resolution of the holders of the affected class of shares at a separate meeting in accordance with the Articles of Association.
Shareholders’ Meetings and Notices
Shareholders’ general meetings are divided into annual general meetings and extraordinary general meetings. Shareholders’ general meetings shall be convened by the Board of Directors. Annual general meetings are held once every year and within six months from the end of the preceding financial year. The Board of Directors shallis required to convene an extraordinary general meeting within two months of the occurrence of any one of the following events:
| (i) | where the number of Directors is less than the number stipulated in the Company Law or two-thirds of the number specified in our Articles of Association or is less than eight (8); |
| (ii) | where our unrecovered losses amount to one-third of the total amount of our share capital; |
| (iii) | where shareholder(s) singly or jointly holding 10% or more of our issued and outstanding voting shares request(s) in writing for the convening of an extraordinary general meeting. Within 10 days of receiving such proposal, the Board shall provide its written decision as to whether it agrees to convene such general meeting in accordance with the laws, administrative regulations and the Articles of Association.; |
| (iv) | whenever the Board of Directors deems necessary or the supervisory committee so requests; |
| (v) | other cases as provided in laws, administrative regulations and the Articles of Association; or |
| (vi) | whenever more than a half of the independent Directors so request. |
When we convene a shareholders’ general meeting, written notice of the meeting shall be given 45 days before the date of the meeting (when calculating the 45 day period, the date on which the meeting is held shall not be included) to notify all of the shareholders whose names appear in the share register of the matters to be considered and the date and place of the meeting, along with the matters to be resolved in the meeting. Shareholders who intend to attend the meeting shall deliver to us their written reply concerning their attendance at such meeting 20 days before the date of the meeting. When we convene an annual general meeting, a shareholder singly or shareholders jointly holding 5% or more of the voting shares of the Company may propose new motions in writing, and we shall include in the agenda those motions which are within the authority of the shareholders’ general meeting.
When we convene a shareholders’ general meeting, the Board of Directors, the supervisory committee and shareholder(s) individually and jointly holding more than 5% of our shares have the right to propose resolutions to the Company. Shareholder(s) individually and jointly holding more than 5% of our shares may propose special resolutions in writing to the convenor 20 days before the shareholders’ general meeting is convened. The convenor shall issue a supplementary notice of the general meeting within two days after receiving the resolutions to announce the contents of the resolutions. Apart from the above, no amendment to the resolutions as set out in the notice of general meeting or proposal of new resolutions shall be made after the convenor has issued the notice of general meeting. The resolutions not set out in the notice of general meeting or that fail to comply with the Articles of Association shall be not voted and resolved in the shareholders’ general meeting.
Limitations on Voting and Shareholding
Holders of H Shares and Domestic Shares, with minor exceptions, are entitled to the same economic and voting rights. Consistent with PRC law, the Articles of Association provide that the H Shares can only be traded by investors of Taiwan, Hong Kong, Macau and any country other than the PRC, while A Shares may be traded only by PRC investors and qualified foreign institutional investors. State-owned legal person shares can not be traded unless the approval from the relevant government authorities.
Ownership Threshold
There are no ownership thresholds above which shareholder ownership is required to be disclosed.
Changes in Registered Capital
Pursuant to the Article of Association, any increase or reduction in share capital must be resolved by a special resolution at a shareholders general meeting.
Recent Amendments to the Articles of Association
During the reporting period of this annual report, we made a number of amendments to our Articles of Association. At our 2009 annual general meeting on June 25, 2010, our shareholders approved an amendment to our scope of business stated in our Articles of Association to include the “sale of coking coal and iron ore; import and export of goods and technology; warehousing; and automotive repairs.” At the firstsecond extraordinary general meeting for the year 20112012 held on February 18, 2011,April 23, 2012, our shareholders approved amendments to our Articles of Association regarding the convening of an extraordinary general meeting, the attendance of shareholders’ general meeting, the power of the BoardBoard’s responsibilities in corporate governance and the powermanagement of the general manager. At the 2010 annual general meeting held on May 20, 2011, our shareholders approved amendments to our Articles of Association regarding the structure of the Board and the convening of an extraordinary general meeting.
| C. | Material Contracts |
Share Transfer Agreement of Inner Mongolia Haosheng Coal Mining Company Limited betweenAmendment Deed to the Company, Jinchengtai, Huayi, Jiutai Technology and JiutaimanlaiMerger Proposal Deed
On September 6, 2010, entered into the Share Transfer Agreement with Jinchengtai, Huayi, Jiutai TechnologyIn March 2012, we and Jiutaimanlai . Pursuant to the Share Transfer Agreement, the Company proposed an acquisition 23.08% of equity interests held by Jinchengtai, 15.51% of equity interests held by Huayi and 12.41% of equity interests held by Jiutai Technology in Haosheng Company for the consideration of approximately RMB3,009.1 million, RMB2,022.3 million and RMB1,617.8 million, respectively. Upon completion of the Acquisition, the Company will hold a 51% equity interest in Haosheng Company. Pursuant to the Equity Transfer Agreement, the Company and other shareholders of Haosheng Company will inject further capital into Haosheng Company on a pro-rata basis so as to increase the registered capital from RMB50 million to RMB150 million within one month after the transfer registration is completed.
Disposal of equity interests in Minerva Coal Mine Joint Venture in Australia
On December 20, 2010, Felix, a wholly-ownedour subsidiary of Yancoal Australia entered into an amendment to the Minerva Joint Venture Interest Sale Agreementmerger proposal deed with Sojitz Coal Resources Pty Ltd, a wholly-owned subsdiary of Sojitz Corporation in Australia, to dispose of its 51% equity interest in the Minerva Coal Mine Joint Venture for a consideration of A$201 million. Upon completion of the disposal, we have no interest in the Minerva Mine Coal Joint Venture.
Financial Services Agreement with Yankuang Finance
On January 7, 2011,Gloucester which we entered into in December 2011. The merger proposal deed and the Financial Services Agreement with Yankuang Finance. Under the Financial Service Agreement, Yankuang Finance agreed to provide deposit services, loan services and miscellaneous financial services to us with transaction caps for 2010 and 2011. Pursuantamendment deed to the agreement,merger proposal deed were filed as Exhibit 4.6 and Exhibit 4.7 to the fees charged to us by Yankuang FinanceForm 20-F for the financial services shall be in accordance with the relevant benchmark rates determined by the PBOC or the CBRC (if any), which shall not exceed those charged by the major commercial banks in the PRC for provision of same kind of financial services. The agreement also provided both parties’ risk control measures on funds to secure the safety of funds.
Deal Conclusion Letter for successful bidding of the mining rights of Zhuan Longwan Coal Mine
On January 28,year ended December 31, 2011 Ordos Neng Hua made a successful bid for the mining rights of Zhuan Longwan Coal Mine for consideration of RMB7,800 million. Ordos Neng Hua entered into the Deal Conclusion Letter with the Department of Land and Resources of the Inner Mongolia Autonomous Region (on behalf of the Ministry of Land and Resources), confirming the successful bid for the mining rights of Zhuan Longwan Coal Mine on the same day.
Ashton Coal Joint Venture Sale Deed between White Mining (NSW) Pty Limited and Austral-Asia Coal Holdings Pty Ltd
On February 1, 2011, White Mining (NSW) Pty Limited, a wholly-owned subsidiary of Yancoal Australia, entered into the Ashton Coal Joint Venture Sale Deed with Austral-Asia Coal Holdings Pty Ltd, a wholly-owned subsidiary of Singapore IMC Group, to acquire 30% of the equity interests in the Ashton Coal Mine Joint Venture for consideration of US$250 million. As of the date of this annual report, we held 90% of the equity interests in the Ashton Coal Mine Joint Venture.
Joint Venture Agreement to Establish Future Energy
On February 25, 2011, we entered into the Joint Venture Agreement with the Yankuang Group and Shaanxi Yanchang Petroleum (Group) Corp. Ltd to establish Future Energy. Pursuant to the Joint Venture Agreement, the registered capital of Future Energy is RMB5,400 million, in which we will contribute RMB1,350 million in cash, representing an equity interest of 25%. Future Energy will mainly engage in investment and participation in the coal liquefaction project in Shaanxi Province as well as the preparation for development of ancillary coal mines.filed with SEC on April 27, 2012.
| D. | Exchange Controls |
Our Articles of Association require that we pay dividends and other distributions to holders of Foreign-Invested Shares in accordance with relevant foreign exchange control regulations. If there is no applicable regulation, the exchange rate that we use to convert dividends and distributions to foreign currencies will be the average exchange rate of Renminbi to the relevant foreign currency announced by the Bank of China five business days prior to the announcement of the dividend or distribution.
The Renminbi currently is not a freely convertible currency. The PRC State Administration of Foreign Exchange (“SAFE”),SAFE, under the authority of the PBOC, controls the conversion of Renminbi into foreign currency. Under existing foreign exchange regulations, unless otherwise approved by the SAFE or exempted by relevant regulations, PRC enterprises must price and sell their goods and services in the PRC in Renminbi.
Since August 1, 2008, all foreign exchange income generated from current account transactions of PRC enterprises (including foreign-invested enterprises) may be retained by enterprises themselves or be sold to the financial institutions operating the foreign exchange settlement or sale business in accordance with relevant regulations. Foreign exchange income from loans issued by organizations outside the territory or from the issuance of bonds and shares (for example foreign exchange income received by our Company from the sale of shares overseas) is also not required to be sold to financial institutions operating the foreign exchange settlement or sale business, but may be deposited in foreign exchange accounts at the financial institutions operating foreign exchange businesses.
PRC enterprises (including foreign-invested enterprises) which require foreign exchange for transactions relating to current account items may, without the approval of SAFE, effect payment from their foreign exchange accounts at financial institutions operating foreign exchange businesses, with valid receipts and proof. Upon a board approval, foreign-invested and PRC enterprises that need foreign currency to distribute profits to their shareholders, such as our Company, may make distributions from their foreign exchange accounts or convert RMB into foreign currencies at foreign exchange businesses.
The conversion of foreign exchange with respect to capital account items, like direct investment and capital contribution, is subject to registration formalities at the foreign exchange administrative department of the State Council.
We have established a limited independent foreign currency account since 2001. The primary source of our foreign currency is revenues denominated in U.S. dollars from coal sales. We use foreign currency primarily to settle equipment and machinery purchases and pay cash dividends on our H Shares (in HK dollars). We have not experienced any shortage of foreign currency. In addition, we can exchange Renminbi for additional foreign currency from designated banks for current account transactions by presenting relevant documents to evidence foreign currency requirements in accordance with relevant regulations.
| E. | Taxation |
The following summary of certain tax provisions does not address all of the tax considerations that may be relevant to each investor and is based on the tax laws, notices and treaties of the relevant jurisdictions as of the date of this annual report, all of which are subject to amendments or changes in interpretation, possibly with retroactive effect. This discussion does not deal with all possible tax consequences relating to an investment in the H Shares or ADSs. In particular, the tax consequences under state, local and other laws are not discussed. This discussion does not constitute legal or tax advice. Accordingly, potential investors are strongly urged to consult their own tax adviser to determine the tax consequences of their investment.
The People’s Republic of China
The following discussion summarizes the material PRC tax provisions relating to the ownership and disposition of H Shares or ADSs held by investors as capital assets.
Taxation on Dividends
Individual Investorsinvestors. Under the Individual Income Tax Law of the PRC of 1993, as amended on December 29, 2007,June 30, 2011, and other applicable tax laws and regulations, dividends paid by Chinese companies to individuals are generally subject to a PRC withholding tax of 20%. Foreign persons are generally subject to a 20% withholding tax on the dividends received from Chinese companies, unless they are subject to tax relief under applicable taxation arrangement. Pursuant toThe SAT issued the CircularNotice on the QuestionsIssues Concerning the Collection and Administration of Individual Income Tax onFollowing the Profits for the TransferRepeal of Shares (Equity Interests)Circular 45, under which both Hong Kong residents and Dividend Received by Foreign Invested Enterprises, Foreign Enterprises and Individual Foreigners issued by the State Administration of Taxation on July 21, 1993 (the “Circular”), dividends paid byMacau residents will generally be subject to a Chinese company to foreign persons with respect to H shares are exempt from PRC withholding taxes. On January 4, 2011, the State Administration of Taxation issued the Announcement on the List of Tax Regulations Fully or Partially Invalidated and Repealed, pursuant to which, the Circular was repealed and no longer valid. Therefore, based on our understanding, for the Company’s individual H shareholders whose names appear on the register of members of H shares of the Company, the exemption from PRC individual income tax under the Circular is no longer applicable when the Company distributes final dividend for the year ended December 31, 2010 (the “2010Final Dividend”). However, the rate of the withholding tax may be adjusted in accordance with the tax treaties or arrangements applicable to the Individual H Shareholders, pending on the further confirmation from the relevant PRC tax authorities. Therefore, a 20% tax will be withheld for the time being on 2010 Final Dividends to be paid to non-PRC individual holders of H Shares or ADSs pending on the further confirmation from relevant PRC tax authorities. We reported the change of policy in dividend withholding tax on Form 6-K filed withof 10% pursuant to the SEC on June 24, 2011. To date,arrangement for the relevant tax authorities have not issued any implementation rules regardingavoidance of double taxation signed between the collection of the withholding taxPRC and Hong Kong.
Enterprises. According to the Enterprise Income TaxEIT Law of the People’s Republic of China effective January 1, 2008, the relevant regulations in the Implementing Regulations for the Law of the People’s Republic of China on Enterprise Income Tax (collectively, the “EIT Law”) and the Notice of the State Administration of Taxation on the Issues Concerning Withholding the Enterprise Income Tax on the Dividends Paid by Chinese Resident Enterprises to H Share Holders Which are Overseas Non-resident Enterprises (Guoshuihan [2008]No.897) promulgated on November 6, 2008, where a Chinese resident enterprise pays dividends for the year of 2008 or any year thereafter to its H shareholders that are overseas non-resident enterprises, it shall withhold the enterprise income tax thereon at the uniform rate of 10%. After receiving dividends, a non-resident enterprise shareholder may submit an application to the competent tax authority to claim any treatment under a relevant tax agreement (arrangement).
Tax Treaties
Non-PRC shareholders who are residents or citizens of countries that have entered into treaties to avoid double-taxation with China may be entitled to a reduction in the withholding tax imposed on the payment of dividends. China currently has such treaties with a number of countries, including:
the United States;
Australia;
Canada;
France;
Germany;
Japan;
Malaysia;
the Netherlands;
Singapore; and
the United Kingdom.
Under each one of these treaties, the withholding tax imposed by China’s tax authorities is generally reduced. For example, under the treaty between China and the United States, China may tax dividends paid by us to an eligible U.S. holder up to a maximum of 10% of the gross amount of the dividend. For the purposes of this discussion, an eligible U.S. holder is a person who, by reason of domicile, residence, place or head office, place of incorporation or any other criterion of similar nature is subject to taxation in the United States.
Taxation on Capital Gains
According to the EIT Law, capital gains realized by foreign enterprises which have no establishment or residence in China or whose capital gains from China do not relate to their establishment or residence in China are generally subject to capital gains tax at the rate of 10%.
According to the Interim Measures for Administration of Withholding at Source of Income Tax of Non-resident Enterprise,Enterprises, which was promulgated by the State Administration of TaxationSAT on January 9, 2009, when two non-resident enterprises enter into an equity assignment transaction to transfer the equity of a Chinese enterprise outside the territory of China, the assigning non-resident enterprise shall pay taxes to the competent tax authority in the place where the Chinese enterprise whose equity has been transferred is located. In addition, the Chinese enterprise whose equity is being assigned shall assist the tax authority in the collection of applicable taxes for the transaction.
With respect to individual holders of H Shares, the Provisions for Implementing the Individual Income Tax Law of China, as amended, provides that the levy of individual income tax on the gains realized on the sale of shares will be regulated and separate rules towill be drafted by the Ministryfinancial division of Finance.the State Council and subject to the approval from the State Council. However, to date, no such implementing measures have been promulgated by the Ministry of Finance, and no individual income tax on gains realized on sales of shares has been levied. On June 20, 1994, February 9, 1996 and March 30, 1998, the Ministry of Finance and the State Administration of TaxationSAT issued notices providing that gains realized by individuals were temporarily exempt from individual income tax. If such exemption becomes inapplicable or is not renewed, a non-PRC enterprise shareholder might be subject to a 20% tax on capital gains under the Individual Income Tax Law of the PRC and its amendments.
Additional ChinaPRC Tax Considerations
Under the Provisional Regulations of the PRC Concerning the Stamp Duty, Chinese stamp duty is not imposed on the transfer of shares, such as the H Shares or ADSs, of Chinese publicly traded companies by non-Chinese investors that take place outside of China.
United States Federal Income Taxation
Investors are strongly urged to consult their own tax advisors to determine the particular United States federal, state, local, treaty and foreign tax consequences ofrelated to purchasing, owning or disposing of the H Shares or ADSs.
The following is a general discussion of materialsummary describes the principal United States federal income tax consequences related toof purchasing, owning and disposing of the H Shares or ADSs if you are aADSs. This summary only applies to U.S. holder,holders, as defined below, who holdshold the H Shares or ADSs as capital assets within the meaning of Section 1221 of the Internal Revenue Code of 1986 as amended (the “Code”). This discussion does not address all of the U.S. federal income tax consequences relating to the ownership and disposition of the H Shares or ADSs, and does not take into account U.S. holders who may be subject to special rules including:
tax-exempt entities;
partnerships or other entities treated as partnerships for United States federal income tax purposes;
banks, financial institutions, and insurance companies;
real estate investment trusts, regulated investment companies and grantor trusts;
dealers or traders in securities, commodities or currencies;
U.S. holders liable for alternative minimum tax;
U.S. holders that own, actually or constructively, 10% or more of our voting stock;
persons who receive the H Shares or ADSs as compensation for services;
U.S. holders that hold the H Shares or ADSs as part of a straddle or a hedging or a conversion transaction;
“dual resident” corporations;
persons that generally mark their securities to market for US federal income tax purposes;
U.S. citizens or tax residents who are residents of the People’s Republic of China;
U.S. citizens or tax residents who are who are subject to Hong Kong profits tax;
certain U.S. expatriates; or
U.S. holders whose functional currency is not the U.S. dollar.
Moreover, this description does not address United States federal estate, gift or alternative minimum taxes or any state or local tax consequences of the purchase, ownership and disposition of the H Shares or ADSs. Each U.S. holder should consult its tax advisor with respect to the U.S. federal, state, local and foreign tax consequences of acquiring, owning and disposing of H Shares and ADSs.
This discussion is based on the Code, its legislative history, final, temporary and proposed United States Treasury regulations promulgated thereunder, published rulings and court decisions as in effect on the date hereof, all of which are subject to change, or changes in interpretation, possibly with retroactive effect. In addition, this discussion is based in part upon representations of the depositary and the assumption that each obligation in the deposit agreement and any related agreements will be performed according to its terms.
You are a “U.S. holder” if you are a beneficial owner of H Shares or ADSs and are:
an individual citizen or resident of the United States for United States federal income tax purposes;
a corporation, or other entity treated as a corporation for United States federal income tax purposes, created or organized under the laws of the United States or any political subdivision thereof;
an estate the income of which is subject to United States federal income tax without regard to its source; or
a trust:
subject to the primary supervision of a United States court and the control of one or more United States persons; or
that has elected to be treated as a United States person under applicable United States Treasury regulations.
If a partnership (including any entity treated as a partnership for United States federal tax purposes) is a beneficial owner ofholds the H Shares or ADSs, the tax treatment of the partnership and a partner in such partnership will generally depend upon the status of the partner and the activities of the partnership. If an investor is a partner in a partnership that holds H Shares or ADSs, such investor should consult its tax advisor. We urge you to consult your tax advisors regarding the United States federal, state, local and non-United States tax consequences of the purchase, ownership and disposition of the H Shares or ADSs.
In general, if you hold ADSs, you will be treated as the owner of the H Shares represented by the ADSs. Exchanges of H shares for ADSs, and ADSs for H shares, generally will not be subject to United States federal income tax.
INVESTORS SHOULD CONSULT THEIR TAX ADVISORS AS TO THE PARTICULAR TAX CONSIDERATIONS APPLICABLE TO THEM RELATING TO THE OWNERSHIP AND DISPOSITION OF THE H SHARES OR ADSs, INCLUDING THE APPLICABILITY OF U.S. FEDERAL, STATE AND LOCAL TAX LAWS OR NON-U.S. TAX LAWS, ANY CHANGES IN APPLICABLE TAX LAWS AND ANY PENDING OR PROPOSED LEGISLATION OR REGULATIONS.
Distributions on the H Shares or ADSs
Subject to the discussions below under “ — Passive Foreign Investment Company,” the gross amount of any distribution (without reduction for any PRC tax withheld) we make on the H Shares or ADSs out of our current or accumulated earnings and profits (as determined for United States federal income tax purposes) will be includible in your gross income as ordinary dividend income when the distribution is actually or constructively received by you, or by the depositary in the case of ADSs. Distributions that exceed our current and accumulated earnings and profits will be treated as a return of capital to you to the extent of your basis in the H Shares or ADSs and thereafter as capital gain. We, however, mayyou. Because we do not calculate earnings and profits in accordance with U.S. tax principles. In that case,principles, all distributions by us to U.S. Holders will generally be treated as dividends. Any dividend will not be eligible for the dividends-received deduction generally allowed to certain United States corporations in respect of dividends received from United States corporations. The amount of any distribution of property other than cash will be the fair market value of such property on the date of such distribution.
Subject to certain exceptions for short-term and hedged positions, theThe U.S. dollar amount of dividends received by an individual, trust or estate in a taxable year prior to January 1, 2011 with respect to the H Shares or ADSscertain non-corporate U.S. holders will be subject to taxation at a maximum rate of 15%20% if the dividends are “qualified dividends.” Dividends paid on H Shares or ADSs will be treated as qualified dividends if (a) certain holding period requirements are satisfied, (b) either (i) we are eligible for the benefits of a comprehensive income tax treaty with the United States that the Internal Revenue Service, or IRS, has approved for the purposes of the qualified dividend rules, or (ii) the dividends are with respect to ADSs readily tradable on a U.S. securities market, and (c) provided that we wereare not, in the year prior to the year in which the dividend was paid, and are not, in the year in which the dividend is paid, a passive foreign investment company, or PFIC. The Agreement Between the Government of the United States of America and the Government of the People’s Republic of China for the Avoidance of Double Taxation and the Prevention of Tax Evasion with Respect to Taxes on Income PFIC rules (the “Treaty”) has been approved for the purposes of the qualified dividend rules, and we expect to qualify for benefits under the Treaty.rules. We are considered a qualified foreign corporation with respect to the ADSs because our ADSs are listed on the New York Stock Exchange.
The Relevant U.S. Treasury has announced its intention to promulgate rules pursuant to which holders of common stock and intermediaries through whom such stock is held will be permitted to rely on certifications from issuers to establish that dividends are treated as qualified dividends. Because such procedures have not yet been issued, it is not clear whether we will be able to comply with them. Holders of H Shares or ADSs should consult their own tax advisersadvisors regarding the availability ofwhether such dividends will qualify for the reduced dividend tax rate in light of their own particular circumstances.provided by the “qualified dividend” rules.
If we make a distribution paid in HK dollars, you will be considered to receive the U.S. dollar value of the distribution determined at the spot HK dollar/U.S. dollar exchange rate on the date such distribution is received actually or constructively by you, or by the depositary, regardless of whether you or the depositary convert the distribution into U.S. dollars. Any gain or loss resulting from currency exchange fluctuations during the period from the date the dividend payment is includible in your incomereceived to the date you or the depositary convert the distribution into U.S. dollars will be treated as U.S. source ordinary income or loss fromloss.
Dividends received by a U.S. sources.
Dividends paid by usholder generally will constitute income from sources outside the United States for U.S. foreign tax credit limitation purposes and will be categorized as “passive income” or, in the case of certain U.S. Holders as “general category income” for U.S. foreign tax credit purposes. We may be required to withhold PRC income tax on dividends paid to U.S. Holders on the H Shares or ADSs. Subject to various limitations, any PRC tax withheld from distributions in accordance with the Treaty may be deductible or creditable against your United States federal income tax liability.
In the event we are required to withhold PRC income tax on dividends paid to U.S. Holders on the H Shares or ADSs (see discussion under “Taxation – The People’s Republic of China”), you may be able to claim a reduced 10% rate of PRC withholding tax if you are eligible for the benefits under the Treaty. You should consult your own tax advisor about the eligibility for reduction of PRC withholding tax.
You may not be able to claim a foreign tax credit (and instead may qualify to claim a deduction) for non-United States taxes imposed on dividends paid on the H Shares or ADSs if you (i) have held the H Shares or ADSs for less than a specified minimum period during which you are not protected from risk of loss with respect to such shares, or (ii) are obligated to make payments related to the dividends (for example, pursuant to a short sale). The rules relating to the U.S. foreign tax credit are complex. U.S. Holders should consult their own tax advisors regarding the effect of these rules in their particular circumstance.
Sale, Exchange or Other Disposition
Subject to the discussions below under “ — Passive Foreign Investment Company,” upon a sale, exchange or other disposition of the H Shares or ADSs, you will generally recognize capital gain or loss for United States federal income tax purposes in an amount equal to the difference between the U.S. dollar value of the amount realized and your tax basis, determined in U.S. dollars, in such H Shares or ADSs. Any gain or loss will generally be treated as United States source gain or loss for foreign tax credit limitation purposes and as a result ofunder the U.S. foreign tax credit limitation, foreign taxes, if any, imposed upon capital gains in respect of H Shares or ADSs may not be currently creditable.Code. Under the Treaty, if any PRC tax was to be imposed on any gain from the disposition of H Shares or ADSs, the gain may be treated as PRC-source income. U.S. Holders maybe able to credit such taxes against their U.S. federal income tax liability under the U.S. foreign tax credit limitations of the Code since such gain generally would be “resourced” under Article 22(3) of the Treaty as foreign source income for U.S. foreign tax credit purposes. U.S. holders are urged to consult their tax advisors regarding the tax consequences if a foreign withholding tax is imposed on a disposition of H Shares or ADSs, including the availabilityinteraction of the foreign tax credit under their particular circumstances.rules and Treaty “resourcing” rule.
If you are paid in a currency other than U.S. dollars, any gain or loss resulting from currency exchange fluctuations during the period from the date of the payment resulting from sale, exchange or other disposition is made to the date you convert the payment into U.S. dollars will be treated as United States source ordinary income or loss.
Medicare Tax on Unearned Income
Newly enacted legislation requires certain U.S. Holders that are individuals, estates or trusts to pay an additional 3.8% tax on, among other things, dividends on and capital gains from the sale or other disposition of stock for taxable years beginning after December 31, 2012. U.S. Holders that are individuals, estates or trusts should consult their tax advisors regarding the effect, if any, of this legislation on their ownership and disposition of our common stock.
Passive Foreign Investment Company
In general, a foreignA non-U.S. corporation is a PFIC for any taxable year in which, after applying relevant look-through rules with respect to the income and assets of subsidiaries:
75% or more of its gross income consists of passive income, such as dividends, interest, rents, royalties, and gains from the sale of assets that give rise to such income; or
50% or more of the average quarterly value of its assets consists of assets that produce, or are held for the production of, passive income.
“Passive income” for this purpose includes, for example, dividends, interest, royalties, rents and gains from commodities and securities transactions. Passive income does not include rents and royalties derived from the active conduct of a trade or business. If the stock of a non-U.S. corporation is publicly traded for the taxable year, the asset test is applied using the fair market value of the assets for purposes of measuring such corporation’s assets. If we own at least 25% (by value) of the stock of another corporation, we will be treated, for purposes of the PFIC tests, as owning our proportionate share of the other corporation’s assets and receiving our proportionate share of the other corporation’s income.income for purposes of the PFIC income and asset tests.
Based on the current and anticipated composition of our assets and income and current expectations regarding the price of the H Shares and ADSs, we believe that we should not be treated as a PFIC for U.S. federal income tax purposes with respect to our 20092012 taxable year and we do not intend onto become or anticipate becoming a PFIC for any future taxable year. TheHowever, the determination of PFIC status is a factual determination that must be made annually at the close of each taxable year and therefore, there can be no certainty as to our status in this regard for the current or any future taxable year ending December 31, 2010 until the close of the 2010 taxable year.years. Changes in the nature of our income or assets or a decrease in the trading price of the H Shares or ADSs may cause us to be considered a PFIC in the current or any subsequent year. If we were a PFIC in any year during a U.S. holder’s holding period for the H Shares or ADSs, we would ordinarily continue to be treated as a PFIC for each subsequent year during which the U.S. holder owned the shares.
If we were a PFIC in any taxable year that you held the H Shares or ADSs, you generally would be subject to special rules with respect to “excess distributions” made by us on the H Shares or ADSs and with respect to gain from your disposition of the H Shares or ADSs. An “excess distribution” generally is defined as the excess of the distributions you receive with respect to the H Shares or ADSs in any taxable year over 125% of the average annual distributions you have received from us during the shorter of the three preceding years, or your holding period for the H Shares or ADSs. Generally, you would be required to allocate any excess distribution or gain from the disposition of the H Shares or ADSs ratably over your holding period for the H Shares or ADSs. The portion of the excess distribution or gain allocated to a prior taxable year, other than a year prior to the first year in which we became a PFIC, would be taxed at the highest United States federal income tax rate on ordinary income in effect for such taxable year, and you would be subject to an interest charge on the resulting tax liability, determined as if the tax liability had been due with respect to such particular taxable years. The portion of the excess distribution or gain that is not allocated to prior taxable years, together with the portion allocated to the years prior to the first year in which we became a PFIC, would be included in your gross income for the taxable year of the excess distribution or disposition and taxed as ordinary income.
These adverse tax consequences may be avoidedmitigated if the U.S. Holder is eligible and does elect to annually mark-to-market the H Shares or ADSs. If a U.S. Holder makes a mark-to-market election, such holder will generally include as ordinary income the excess, if any, of the fair market value of the H Shares or ADSs at the end of each taxable year over their adjusted basis, and will be permitted an ordinary loss in respect of the excess, if any, of the adjusted basis of the H Shares or ADSs over their fair market value at the end of the taxable year (but only to the extent of the net amount of previously included in income as a result of the mark-to-market election). Any gain recognized on the sale or other disposition of the H Shares or ADSs will be treated as ordinary income. The mark-to-market election is available only for “marketable stock,” which is stock that is traded in other than de minimis quantities on at least 15 days during each calendar quarter on a qualified exchange or other market, as defined in the applicable Treasury regulations. The H Shares or ADSs may qualify as “marketable stock” because the ADSs are listed on the New York Stock Exchange.
A U.S. Holder’s adjusted tax basis in the H Shares or ADSs will be increased by the amount of any income inclusion and decreased by the amount of any deductions under the mark-to-market rules. If a U.S. Holder makes a mark-to-market election it will be effective for the taxable year for which the election is made and all subsequent taxable years unless the H Shares or ADSs are no longer regularly traded on a qualified exchange or the IRS consents to the revocation of the election. U.S. Holders are urged to consult their tax advisors about the availability of the mark-to-market election, and whether making the election would be advisable in their particular circumstances.
Alternatively, a timely election to treat us as a qualified electing fund would avoid the foregoing rules with respect to excess distributions and dispositions. You should be aware, however, that if we become a PFIC, we do not intend to satisfy the record keeping requirements that would permit you to make a qualified electing fund election.
If you own the H Shares or ADSs during any year that we are a PFIC, you must file IRS Form 8621. The reduced tax rate for dividend income, as discussed above under “ —“— Distributions on the H Shares or ADSs,” is not applicable to a dividend paid by us if we are a PFIC for either ourthe taxable year in which the dividend is paid or the preceding year. We encourage you to consult your own tax advisor concerning the United States federal income tax consequences of holding the H Shares or ADSs that would arise if we were considered a PFIC.
Backup Withholding and Information Reporting
In general, information reporting requirements will apply to dividends in respect of the H Shares or ADSs or the proceeds of the sale, exchange, or redemption of the H Shares or ADSs paid within the United States, and in some cases, outside of the United States, other than to various exempt recipients, including corporations. In addition, you may, under some circumstances, be subject to “backup withholding” with respect to dividends paid on the H Shares or ADSs or the proceeds of any sale, exchange or transfer of the H Shares or ADSs, unless you:
are a corporation or fall within various other exempt categories, and, when required, demonstrate this fact; or
provide a correct taxpayer identification number on a properly completed IRS Form W-9 or a substitute form, certifying that you are exempt from backup withholding and otherwise comply with applicable requirements of the backup withholding rules.
Any amount withheld under the backup withholding rules generally will be creditable against your United States federal income tax liability provided that you furnish the required information to the IRS in a timely manner. If you do not provide a correct taxpayer identification number you may be subject to penalties imposed by the IRS. Investors should consult their own tax advisors as to their qualifications for an exemption from backup withholding and the procedures for obtaining this exemption.
New Legislation
Newly enacted legislation requires certain U.S. holders that are individuals, estates or trusts to pay up to an additional 3.8% tax on, among other things, dividends on and capital gains from the sale or other disposition of stock for taxable years beginning after December 31, 2012. U.S. holders that are individuals, estates or trusts should consult their tax advisors regarding the effect, if any, of this legislation on their ownership and disposition of our common stock. In addition, for taxable years beginning after March 18, 2010, new legislation requires certain U.S. holders that hold certain foreign financial assets to report information relating to such assets subject to certain exceptions. Persons who are required to report specified foreign financial assets and fail to do so may be subject to substantial penalties. Each U.S. holder should consult its tax advisor regarding the effect, if any, of this legislation on its ownership and disposition of H Shares or ADSs.
Hong Kong Taxation
The following discussion summarizes the material Hong Kong tax provisions relating to the ownership of H shares or ADSs held by you.
Dividends
Under current Hong Kong Inland Revenue Department practice, no Hong Kong tax is payable by the recipient in respect of dividends paid by us.
Taxation of Capital Gains
No Hong Kong tax is imposed on capital gains arising from the sale of property (such as H shares) acquired and held as investment assets. However, if a person carries on a trade, profession or business in Hong Kong (e.g., trading and dealing in securities) and derives trading gains from that trade, profession or business in or from Hong Kong, Hong Kong profits tax will be payable. Gains from purchases and sales of H shares effected on or off the Hong Kong Stock Exchange are considered to derive from or arise in Hong Kong for this purpose. Hong Kong profits tax is currently charged at the rate of 16.5% for corporations and at the rate of 15% for individuals.
No Hong Kong tax liability will arise on capital or trading gains arising from the sale of ADSs where the purchase and sale is effected outside Hong Kong, e.g., on the NYSE.
Hong Kong Stamp Duty
Hong Kong stamp duty is payable by each of the seller and the purchaser for every sold note and every bought note created for every sale and purchase of the H shares. Stamp duty is charged at the total rate of 0.2% of the higher of the consideration for the sale and purchase or the value of the H shares transferred (the buyer and seller each paying half of such stamp duty). In addition, a fixed duty of HK$5 is currently payable on an instrument of transfer of H shares. If one of the parties to a sale is a non-resident of Hong Kong and does not pay the required stamp duty, the stamp duty not paid will be assessed on the instrument of transfer (if any), and the transferee will be liable for payment of such stamp duty.
If the withdrawal of H shares when ADSs are surrendered or the issuance of ADSs when H shares are deposited results in a change of beneficial ownership in the H shares under Hong Kong law, Hong Kong stamp duty at the rate described above for sale and purchase transaction will apply. The issuance of ADSs for deposited H shares issued directly to the depositary or for the account of the depositary should not lead to a Hong Kong stamp duty liability. Holders of the ADSs are not liable for the Hong Kong stamp duty on transfers of ADSs outside of Hong Kong so long as the transfers do not result in a change of beneficial interest in the H shares under Hong Kong law.
| F. | Dividends and Paying Agents |
Not applicable.
| G. | Statement by Experts |
Not applicable.
| H. | Documents on Display |
In accordance with the Exchange Act, we must file reports, including this annual report, and other information with the Commission. The reports and other information we have filed under the Exchange Act and the registration statement on Form F-1 and exhibits thereto we have previously filed with the Commission may be inspected and copied by the public at the public reference facilities maintained by the Commission at 100 F Street NE, Washington D.C. 20549, U.S.A. and will also be available for inspection and copying at the regional offices of the Commission located at Seven World Trade Center, 13th Floor, New York, New York 10048, U.S.A. and at Northwest Atrium Center, 500 Madison Street (Suite 1400), Chicago, Illinois 60661, U.S.A. Copies of such material may also be obtained from the Public Reference Section of the Commission at 100 F Street NE, Washington D.C. 20549, U.S.A. at prescribed rates. Our annual reports and other information filed with the Commission are also available at the Commission’s website at www.sec.gov. Such reports and other information may also be inspected at the office of the New York Stock Exchange, 11 Wall Street, New York, New York 10005, U.S.A.
| I. | Subsidiaries |
As of December 31, 2010,2012, we owned the following significant subsidiaries:
Name of subsidiary | Country of incorporation/ registration | Issued and fully paid capital/ registered capital | Proportion of registered capital/issued share capital held by us | Proportion of voting power held | Principal activities | |||||||||||||||||
| Directly | Indirectly | |||||||||||||||||||||
Yancoal Australia Limited | Australia | A$64,000,000 | 100 | % | — | 100 | % | Management of investment project in Australia | ||||||||||||||
Austar Coal Mine Pty Limited | Australia | A$64,000,000 | — | 100 | % | 100 | % | Coal production, processing, washing and separation and sales | ||||||||||||||
Felix Resources Limited | Australia | A$446,408,871 | — | 100 | % | 100 | % | Coal mining, sales and exploration | ||||||||||||||
Qingdao Free Trade Zone Zhongyan Trade Co., Ltd. | PRC | RMB2,100,000 | 52.38 | % | — | 52.38 | % | International trade, processing and arranging, product exhibition, inter-trade among enterprises in the district and storage | ||||||||||||||
Shandong Hua Ju Energy Co., Limited | PRC | RMB288,589,774 | 95.14 | % | — | 95.14 | % | Power and heat supply | ||||||||||||||
Shandong Yanmei Shipping Co., Ltd. | PRC | RMB5,500,000 | 92 | % | — | 92 | % | Watercourse transportation services and the sales of coal and others | ||||||||||||||
Yanzhou Coal Shanxi Nenghua Company Limited | PRC | RMB600,000,000 | 100 | % | — | 100 | % | Management of investment project in Shanxi province | ||||||||||||||
Shanxi Heshun Tianchi Energy Company Limited | PRC | RMB90,000,000 | — | 81.31 | % | 81.31 | % | Coal mining business | ||||||||||||||
Shanxi Tianhao Chemicals Company Limited | PRC | RMB150,000,000 | — | 99.89 | % | 99.89 | % | Operation of methanol project | ||||||||||||||
Yanmei Heze Nenghua Company Limited | PRC | RMB1,500,000,000 | 98.33 | % | — | 98.33 | % | Coal resources exploration and mining in Juye coal field | ||||||||||||||
Yanzhou Coal Ordos Neng Hua Company Limited | PRC | RMB500,000,000 | 100 | % | — | 100 | % | Coal resources exploration in Inner Mongolia and construction of a 600,000-tonne methanol project | ||||||||||||||
Yanzhou Coal Yulin Nenghua Company Limited | PRC | RMB1,400,000,000 | 100 | % | — | 100 | % | Construction and operation of a 600,000-tonne methanol project | ||||||||||||||
Inner Mongolia Haosheng Coal Mining Company Limited | PRC | RMB150,000,000 | 51 | % | — | 51 | % | Project application and mining rights approvals of Shilawusu Coal Field | ||||||||||||||
Name of subsidiary | Country of incorporation/ registration | Issued and fully paid capital/ registered capital | Proportion of registered capital/issued share capital held by us | Proportion of voting power held | Principal activities | |||||||||||||||||
| Directly | Indirectly | |||||||||||||||||||||
Moolarben Coal Mines Pty Limited | Australia | A$1 | — | 100 | % | 100 | % | Coal business development | ||||||||||||||
White Mining (NSW) Pty Limited | Australia | A$10 | — | 100 | % | 100 | % | Coal mining and sales | ||||||||||||||
Yancoal Australia Limited | Australia | A$656,700,717 | 78 | % | — | 78 | % | Investment holding | ||||||||||||||
Yanzhou Coal Ordos Neng Hua Company Limited | PRC | RMB3,100,000,000 | 100 | % | — | 100 | % | Coal resources exploration in Inner Mongolia and construction of 600,000-tonne methanol project | ||||||||||||||
Yancoal Resources Limited | Australia | A$446,410,000 | — | 100 | % | 100 | % | Coal mining, sales and exploration | ||||||||||||||
Austar Coal Mine Pty Limited | Australia | A$64,000,000 | — | 100 | % | 100 | % | Coal mining and sales | ||||||||||||||
Syntech Resources P/L | Australia | A$1,251,431 | — | 100 | % | 100 | % | Coal mining and sales | ||||||||||||||
For details of our shareholding in other direct and indirect subsdiaries,subsidiaries, please see “Item 4 Information on the Company — C. Organizational Structure”.
| ITEM 11. | QUANTITATIVE AND QUALITATIVE DISCLOSURES ABOUT MARKET RISKS |
Market risk represents the potential for loss due to adverse changes in the fair value of financial instruments. As a global concern, we are exposed to adverse developments in commodity prices, interest rates, foreign currency exchange rates, interest ratesequity prices and commodity price risk.inflation. These exposures may change over time as our business develops and could have a material adverse impact on our financial results.
Commodity Price Risk
Price fluctuations may directly affect our operating and financial performance. We have historically experienced substantial price fluctuations and believe these fluctuations will continue. We primarily face risk relating to coal price fluctuations, and to a lesser extent methanol price fluctuations. For the years ended December 31, 2010, 2011 and 2012, the average selling price of our coal products in the PRC was RMB663.5, RMB707.7 and RMB599.3 per tonne, respectively. The periodic fluctuation in coal prices was caused by factors such as general economic conditions, supply and demand and the level of global inventories. The average selling price of our coal fluctuated in the past three years and it may continue to fluctuate as a result of pricing guidelines announced by the government authorities from time to time, temporary price controls, general economic conditions, supply and demand and the level of global inventories, which may, in turn, adversely affect our results of operations and financial condition.
We expect the production capacities of new domestic methanol facilities to increase, which may cause the supply of methanol to exceed demand. Methanol prices may decrease as a result of this overproduction, uncertain demand and an increase in imported methanol. However, methanol prices may also increase due to any increases in the prices of coal, natural gas, electricity and transportation, and the promotion of ethanol gasoline for motor vehicles by the PRC government.
Interest Rate Risk.
We are exposed to interest rate risk caused by interest rate changes on our liabilities, in particular our long-term liabilities. We are also exposed to cash flow interest rate risk in relation to variable rateour bank borrowings and our other indebtedness, as well as our variable-rate bank balances, term deposits and restricted cash and bank borrowings in Renminbi.held with banks. Our cash flow interest rate risk is mainly concentrated onprimarily arises due to fluctuations ofin the PBOC benchmark lending interest rate in relation to our RMB denominatedRMB-denominated borrowings and fluctuations ofin LIBOR in relation to our U.S. dollar-denominated borrowings and fluctuations of the Australian BBSY in relation to our Australian dollar-denominated borrowings. We undertake debt obligations to fund our ordinary expenses, including capital expenditures and working capital needs. Upward fluctuations in interest rates increase the cost of new debt and the interest cost of outstanding variable rate liabilities. Interest rate fluctuations can also lead to significant fluctuations in the fair values of our debt obligations. Our Australian subsidiaries also
The Company monitors its interest rate exposure and has entered into contracts with three banks to hedge a proportion of borrowings issued at variable interest rates through the use of floating-to-fixed interest rate swap contracts. As of December 31, 2010,2012, the outstanding notional amount of these interest rate swap contracts was approximately RMB1,503RMB6,285 million maturing(US$1,000 million). These interest rate swap contracts mature within threefour years at an assessmentfrom the date of the contract and have a hedge period of three months with fixed rates of approximately 2.75%, 2.42% and 2.41% and a floating rate of LIBOR + 0.75% for the three contracts, respectively. The noncurrent portion of the derivatives is not material and fixed rate of approximately 5.09% and 5.8312%, respectively.is included in the current portion.
Our exposuresAs of December 31, 2012, our Australian subsidiaries had not entered into any contracts with banks to hedge a portion of borrowings issued at variable interest rates through the use of floating-to-fixed interest rate risk on our financial assets and liabilities, as well as our sensitivity to interest rate fluctuation are not significant. swap contracts.
We have prepared a sensitivity analysis to assess the impact of interest rate fluctuations on our 20102012 operating results, assuming the financial instruments outstanding at the end of the reporting period were outstanding for the whole year and all the variables were held constant, including the interest rate fluctuationfluctuations of the abovementioned PBOC rate and LIBOR and Australian BBSY rate.discussed above. Based on this analysis, we estimate that an increase in the interest raterates of 1% would have decreased our reported net income attributable to our equity holders for 20102012 by approximately RMB71.95RMB176.7 million.
Foreign Currency Exchange Rate Risk.
We mainly face foreign currency exchange rate risks relating to RMB fluctuations and risks stemming from exchange rate fluctuations between the Australian dollar and U.S. dollar. China has adopted a managed floating exchange rate system to allow the value of the Renminbi to fluctuate within a regulated band based on market supply and demand with reference to a basket of currencies. Exchange rate fluctuations may adversely affect the value of our net assets, earnings and any declared dividends when translated or converted into U.S. dollars or Hong Kong dollars.
RMB fluctuations mainly affect our (a)(i) income from coal exports, which must be converted into RMB since our coal exports are denominated in U.S. dollars; (b)(ii) conversion of foreign currency deposits and loans; (c)(iii) exposure to the foreign currency loans we granted to our foreign operations; and (d)(iv) costs of imported equipment and fittings.
The sales and costs of each entity in our Company are generally denominated in the functional currency of the relevant entity. Accordingly, we are not exposed to significant foreign currency risk.
risk attributable to operations. However, our results have been significantly affected by volatility in exchange rates affecting the fair value of our foreign currency-denominated bank borrowings, giving rise to substantial exchange gains and losses. The table below sets forth the foreign currency denominatedcurrency-denominated assets and liabilities of the Company and its subsidiariesSubsidiaries that are in currencies other than the functional currency of the entity that carries such assets or liabilities on its balance sheet as of December 31, 2010.2012.
| Liabilities | Assets | |||||||||||||||
| 2010 | 2009 | 2010 | 2009 | |||||||||||||
| (foreign currencies converted into and dominated in thousands of RMB) | ||||||||||||||||
United States dollars (US$) | 20,516,314 | 20,757,943 | 902,402 | 1,311,500 | ||||||||||||
Euro (“EUR”) | — | — | 222 | 3,611 | ||||||||||||
Hong Kong dollar (HK$) | — | — | 6,062 | 7,309 | ||||||||||||
Notional amounts to sell US$ foreign exchange contracts used for hedging | — | — | 4,169,000 | 1,143,416 | ||||||||||||
Notional amounts of buy US$ foreign exchange contracts used for hedging | 79,000 | 73,713 | — | — | ||||||||||||
Notional amounts of buy Euro foreign exchange contracts used for hedging | — | 26,541 | — | — | ||||||||||||
Notional amounts of buy Yen foreign exchange contracts used for hedging | 9,000 | 71,511 | — | — | ||||||||||||
| Liabilities | Assets | |||||||||||||||
| 2012 | 2011 | 2012 | 2011 | |||||||||||||
| (foreign currencies converted and denominated in RMB millions) | ||||||||||||||||
United States Dollars (US$) | 18,294.7 | 19,309.8 | 2.267.9 | 1,025.7 | ||||||||||||
Euro (“EUR”) | 1,083.9 | — | 0.1 | 0.2 | ||||||||||||
Hong Kong Dollar (HK$) | — | — | 0.06 | 0.5 | ||||||||||||
Notional amounts to sell US$ foreign exchange contracts used for hedging | 1,599.7 | 1,996.3 | 4.536.7 | 2,836.0 | ||||||||||||
Notional amounts of buy EUR foreign exchange contracts used for hedging | — | — | 165.7 | — | ||||||||||||
Notional amounts of buy British pound foreign exchange contracts used for hedging | — | — | 2.9 | — | ||||||||||||
Except as disclosed in our financial statements and as described below, we do not have a foreign currency hedging policy. However, our management monitors our foreign exchange exposure and will consider hedging significant currency exposure if the need arises.
We have prepared a sensitivity analysis to assess the impact of exchange rate fluctuations on our operating results based on a 5% increase or decrease in the exchange rates for the U.S. dollar or Hong Kong dollar against the Renminbi. The sensitivity analysis includes only outstanding monetary items denominated in foreign currencies and adjusts the translation of these monetary items as of the end of the indicated year for a five percent5% change in the exchange rates for the relevant currencies. The sensitivity analysis also assesses the impact of a 5% increase or decrease in the exchange rate for the Australian dollar against the U.S. dollar, which would affect loans to foreign operations within our Company that are denominated in a currency other than the functional currency of the lender or the borrower.
The following table sets forth our sensitivity to a 5% increase and decrease in the RMB against relevant foreign currencies. Five percentanalysis represents management’s assessment of reasonably possible changes in foreign exchange rates over the period until the next annual balance sheet date. The sensitivity analysisIt includes only outstanding foreign currency denominatedcurrency-denominated monetary items and adjusts their translation at the year end for a 5% change in foreign currency rates and also assumes all other risk variables remained constant. The sensitivity analysis includes loans to foreign operations within the GroupCompany where the denomination of the loan is in a currency other than the functional currency of the lender or the borrower.
The following table sets forth the sensitivity analysis of the relevant foreign currencies of the periods indicated:
| US$(1) | HK$(1) | |||||||||||||||
| 2010 | 2009 | 2010 | 2009 | |||||||||||||
| (RMB’000) | ||||||||||||||||
Increase (decrease) to profit and loss | ||||||||||||||||
- if RMB weakens against respective foreign currency | 35,312 | 49,390 | 227 | 274 | ||||||||||||
- if RMB strengthens against respective foreign currency | (35,312 | ) | (49,390 | ) | (227 | ) | (274 | ) | ||||||||
| US$(2) | ||||||||
| 2010 | 2009 | |||||||
| (RMB’000) | (RMB’000) | |||||||
Increase (decrease) to profit and loss | ||||||||
-if A$ weakens against respective foreign currency | (718,045 | ) | (739,749 | ) | ||||
-if A$ strengthens against respective foreign currency | 718,045 | 739,749 | ||||||
Increase (decrease) to profit attributable to the equity holders of the Company | ||||||||
-if A$ weakens against respective foreign currency | (725,998 | ) | (740,615 | ) | ||||
-if A$ strengthens against respective foreign currency | 725,998 | 740,615 | ||||||
| US$(1) | HK$(1) | |||||||||||||||
| 2012 | 2011 | 2012 | 2011 | |||||||||||||
| (RMB in millions) | ||||||||||||||||
Increase (decrease) to profit and loss | ||||||||||||||||
- if RMB weakens against respective foreign currency | 218.2 | 14.3 | 0.002 | 0.02 | ||||||||||||
- if RMB strengthens against respective foreign currency | (218.2 | ) | (14.3 | ) | (0.002 | ) | (0.02 | ) | ||||||||
| US$(2) | ||||||||
| 2012 | 2011 | |||||||
(RMB in millions) | ||||||||
Increase (decrease) to profit and loss | ||||||||
- if AUD weakens against respective foreign currency | (758.9 | ) | (873.6 | ) | ||||
- if AUD strengthens against respective foreign currency | 758.9 | 873.6 | ||||||
Increase (decrease) to profit attributable to the equity holders of the Company | ||||||||
- if AUD weakens against respective foreign currency | (538.2 | ) | (680.6 | ) | ||||
- if AUD strengthens against respective foreign currency | 538.2 | 680.6 | ||||||
| (1) |
| (2) |
During the year ended December 31, 2010,2012, our subsidiaries in Australia entered into forward foreign exchange contracts to sell or purchase specified amounts of foreign currencies in the future at stipulated exchange rates. The objective of entering into the forward foreign exchange contracts is to reduce the foreign exchange rate relatedrate-related volatility of revenue streams and capital expenditures and thereby assist in our risk management. These contracts are to sell or purchase U.S. dollars with Australian dollars. The outstanding contracts to sell United StatesU.S. dollars hedge highly probable forecasted sales of coal, whereascoal. Cash flows and any impact to profit or loss arising from all the outstandingforeign exchange contracts are expected to buy United States dollars and Yen contracts relate tooccur within one year from the purchase of mining equipment.balance sheet date.
As of December 31, 2010,2012, the outstanding notional amount to sell United States dollars (sell United StatesU.S. dollars and buy Australian dollars)dollars was approximately RMB4,169RMB5,390 million and RMB746 million, respectively, all maturing within one year with forward rates ranging approximately from US$1.00 = A$0.83690.9755 to US$1.00 = A$0.9887.1.0013 and floor price and ceiling price of US$1.00 = A$0.934 and US$1.00 = A$1.055, respectively.
As of December 31, 2010,2012, the outstanding notional amount to sell Australian dollars and buy United StatesEuro was approximately RMB51 million, maturing within one year with a forward rate at A$1.00 = €0.99926.
As of December 31, 2012, the outstanding notional amount to sell Australian dollars (buyand buy British Pounds was approximately RMB3 million, maturing within one year with forward rate at A$1.00 = £0.99948.
As of December 31, 2012, the outstanding notional amount to sell United States dollars and sell Australian dollars) and buy Yen (buy Yen and sell Australian dollars)Euro was approximately RMB79RMB114 million nil and RMB9 million respectively, all maturing within one year with forward rates of approximatelyranging from US$1.00 = A$0.8811 and floor price and ceiling price of A$€1.00013 to US$1.00 = 63.5 Yen and A$1.00 = 65 Yen, respectively.
Our Australian subsidiaries also entered into contracts with banks to hedge a proportion of borrowings issued at variable interest rates through the use of floating-to-fixed interest rate swap contracts. As at December 31, 2010, the outstanding notional amount was approximately RMB1,503 million, maturing within three years at a hedge period of 3 months with floating rate and fixed rate of approximately 5.09% and 5.8312%, respectively.
The Company also entered into contracts with three banks to hedge a proportion of borrowings issued at variable interest rates through the use of floating-to-fixed interest rate swap contracts. As of December 31, 2010, the outstanding notional amount was approximately RMB9,934 million (US$1,500 million), maturing within four years at a hedge period of three months with floating rate as LIBOR + 0.75% and fixed rate of approximately 2.75%, 2.42% and 2.41% for the three contracts respectively. The non-current portion of the derivatives is not material and is included in current portion.
For the year ended December 31, 2009, no ineffective hedging portion has been included in the consolidated income statement. The effective hedging portion was recognized as current portion of derivative financial instruments in the consolidated balance sheet. For the year ended December 31, 2010, the ineffective hedging portion of the changes in fair values of the forward foreign exchange contracts of approximately RMB10 million was recognized as selling, general and administrative expenses in the consolidated income statement.€1.00031.
Commodity Price Risk. Price fluctuations may directly affect our operating and financial performance. We have historically experienced substantial price fluctuations and believe these fluctuations will continue. We primarily face risk relating to coal price fluctuations, as well as methanol price fluctuations. The periodic fluctuation in coal prices was caused by factors such as changes in macroeconomic policies, downstream demand and industrial competition. Although the average selling price of our coal product increased in 2010, the price may decrease again as a result of the adoption of macroeconomic measures, governmental control and changes in the global coal market, which may in turn adversely affect our results of operations and financial condition. For the years ended December 31, 2008, 2009 and 2010, the average coal selling price was RMB663.9, RMB529.2 and RMB663.5 per tonne.
Our profitability in our methanol business was generally weak during 2010 as a result of overproduction, weak demand and negative impact brought by increased imports of methanol. We expect that methanol supply will continue to exceed market demand, which may lead to continued weak market prices. Methanol prices may also increase due to the increase in the prices of coal, natural gas, electricity and transportation, the promotion of ethanol gasoline for motor vehicles by the government and the industrial reform to be launched. However, we cannot assure you that methanol prices will not keep decreasing as the result of overproduction, uncertain demand and the increase in import methanol. All the risks mentioned above may adversely affect our results of operations.
Equity Price Risk.
In addition to financial instruments, we are exposed to equity price risk because we hold investments in listed equity securities. We currently do not have any arrangements to hedge the price risk exposure of our investment in equity securities. We have conducted a sensitivity analysis and determined that our exposure to equity price risk stemming from our investment in listed equity securities is not significant.
Inflation Risk
The recent global economic slowdown and turmoil in the global financial markets that began in the second half of 2008 have had a negative impact on the PRC economy, including increases in the inflation rate as measured by the consumer price index. According to the National Bureau of Statistics of the PRC, the change in the Consumer Price Index in China was 3.3%, 5.4% and 2.6% in 2010, 2011 and 2012, respectively. Inflation generally results in an increase of fuel prices, which is a component of our cost of sales. An increase in the price of fuel could lead to a corresponding increase in the cost of our coal production and have a material adverse effect on our business and results of operations.
Liquidity Risk
We are exposed to liquidity risks related to meeting our financial obligations as they fall due. To mitigate this risk, we monitor and maintain a level of cash and cash equivalents deemed adequate by our management to finance our operations. Our management also monitors the utilization of bank borrowings and ensures compliance with loan covenants to ensure that we are able to meet our short-term and long-term liquidity requirements.
| ITEM 12. | DESCRIPTION OF SECURITIES OTHER THAN EQUITY SECURITIES |
| A. | Debt Securities |
Not applicable.
| B. | Warrants and Rights |
Not applicable.
| C. | Other Securities |
Not applicable.
| D. | American Depositary Shares |
The following table summarizes the fees and charges that a holder of our ADSs may have to pay, directly or indirectly, in connection with the ownership of our American Depositary Receipts.
| Persons depositing or withdrawing shares must pay: | For: | |
| $5.00 (or less) per 100 ADSs (or portion of 100 ADSs) | • Issuance of ADSs, including issuances resulting from a distribution of shares or rights or other property | |
• Cancellation of ADSs for the purpose of withdrawal, including if the deposit agreement terminates | ||
| A fee equivalent to the fee that would be payable if securities distributed to you had been shares and the shares had been deposited for issuance of ADSs | • Distribution of securities to holders of deposited securities that are distributed by the depositary to ADS registered holders | |
| Registration or transfer fees | • Transfer and registration of shares on our share register to or from the name of the depositary or its agent when you deposit or withdraw shares | |
| Expenses of the depositary | • Cable, telex and facsimile transmissions (when expressly provided in the deposit agreement) | |
• Converting foreign currency to U.S. dollars | ||
| Taxes and other governmental charges the depositary or the custodian have to pay on any ADS or share underlying an ADS, for example, stock transfer taxes, stamp duty or withholding taxes | • As necessary | |
| Any charges incurred by the depositary or its agents for servicing the deposited securities | • As necessary | |
The Bank of New York Mellon, as depositary, has agreed to waive certain standard fees related to the administration of our ADR program and investor relationship programs. From January 1, 20102012 to December 31 2010,2012, the total amount of the fees that were waived was approximately US$139,000.131,916.11.
PART II
| ITEM 13. | DEFAULTS, DIVIDEND ARREARAGES AND DELINQUENCIES |
As of December 31, 2010,2012, we were not in default, in arrears or otherwise delinquent in the payment of principal or interest of any indebtedness or dividends.
| ITEM 14. | MATERIAL MODIFICATIONS TO THE RIGHTS OF SECURITY HOLDERS AND USE OF PROCEEDS |
None.
| ITEM 15. | CONTROLS AND PROCEDURES |
Evaluation of Disclosure Controls and Procedures
Under the supervision and with the participation of our general manager and chief financial officer, our management evaluated of the effectiveness of our disclosure controls and procedures (as such term is defined in Rules 13a-15(e) and 15d-15(e) of the Exchange Act, as amended) as of December 31, 2010.2012. Based on the evaluation described below, our general manager and chief financial officer concluded that, as of that date, our disclosure controls and procedures were effective.
Management’s Report on Internal Control over Financial Reporting
Management is responsible for establishing and maintaining adequate internal control over financial reporting. Our internal control framework was designed to provide reasonable assurance regarding the reliability of financial reporting and the preparation of our consolidated financial statements for external purposes in accordance with generally accepted accounting principles.
Management conducted an evaluation of the effectiveness of our internal control over financial reporting using the criteria issued by the Committee of Sponsoring Organizations of the Treadway Commission (COSO) inInternal Control - Control—IntegratedFramework. Management’s assessment of the control over financial reporting excluded Gloucester Coal Limited and its subsidiaries which was acquired on June 27, 2012. This acquisition constitutes 9% and 3% of total assets and revenue, respectively, of the consolidated financial statements of Yanzhou Coal Mining Company Limited as of and for the year ended December 31, 2012. Management concluded that it was not possible to conduct an assessment on the effectiveness of the internal control over financial reporting of Gloucester Coal Limited and its subsidiaries in the period between June 27, 2012 and the date of management’s assessment. Under guidelines established by the Securities and Exchange Commission, companies are allowed to exclude the newly acquired business from their assessment of internal control over financial reporting during the first year of an acquisition while integrating the acquired companies. Based on this evaluation,assessment, management concluded that, ouras of December 31, 2012, the Company’s internal control over financial reporting was effective to provide reasonable assurance that the desired control objectives were achieved as of December 31, 2010.based on those criteria.
The effectiveness of our internal control over financial reporting as of December 31, 20102012 has been audited by Grant Thornton, our independent registered public accounting firm, as stated in their report which is included herein.
Limitations on Effectiveness of Controls and Procedures
Our internal control over financial reporting includes policies and procedures that (1) pertain to the maintenance of records that accurately and fairly reflect the transactions and dispositions of a company’s assets, (2) provide reasonable assurance that transactions are recorded as necessary to permit preparation of financial statements in accordance with generally accepted accounting principles, and that receipts and expenditures are being made only in accordance with authorizations of our management and directors, and (3) provide reasonable assurance regarding the prevention or timely detection of unauthorized acquisition, use, or disposition of our assets that could have a material effect on the financial statements. Because of its inherent limitations, internal control over financial reporting may not be able to prevent or detect misstatements on a timely basis, which may be a product of collusion, failure to abide by controls, error or fraud. In addition, projections of the internal control’s effectiveness to future periods are subject to the risk that the control may become inadequate because of changes in conditions, or that the degree of compliance with the internal control policies or procedures may deteriorate.
Changes in Internal Control over Financial Reporting
During the period covered by this annual report, there have been no changes in our internal control over financial reporting that have materially affected, or are reasonably likely to materially affect, our internal control over financial reporting.
| ITEM 16A. | AUDIT COMMITTEE FINANCIAL EXPERT |
Our audit committee consists of Mr. ChengCHENG Faguang, Mr. WangWANG Xianzheng, Mr. WangWANG Xiaojun, Mr. XueXUE Yonzhi and Mr. DongDONG Yunqing. Our Board of Directors has determined that Mr. ChengCHENG Faguang meets the independence requirement of Section 303A.02 of the NYSE Listed Company Manual and qualifies as an audit committee financial expert as the term is defined in the rules and regulations established by the SEC.
| ITEM 16B. | CODE OF ETHICS |
We have adopted a code of ethics that applies to our chairman, vice chairman, chief executive officer, chief financial officer, board secretary, chief engineer, controller and the managers of our finance and audit departments. Our code of ethics is posted on our website atwww.yanzhoucoal.com.cn. www.yanzhoucoal.com.cn. No amendments to, or waivers from, our code of ethics have been made. A copy of our code of ethics is available to any shareholder, without charge, upon written request to the address on the cover of this annual report.
| ITEM 16C. | PRINCIPAL ACCOUNTANT FEES AND SERVICES |
Upon approval at the 2011 Annual General Meeting held on June 25, 2010,22, 2012, Grant Thornton firms (i.e. Grant Thornton and Grant Thornton Hong KongKong) and ShineWing Certified Public Accountants were appointed as our international and domestic auditors, respectively, for the year ended December 31, 2010. Upon approval at the extraordinary general meeting held on February 18, 2011,2012. Grant Thornton and Grant Thornton Jingdu Tianhua were appointed as the international auditors of the Company and its subsidiaries and should hold this office until the conclusion of the 2010 annual general meeting of the Company. Grant Thornton Jingdu TianhuaHong Kong and Grant Thornton audit the financial statements of the Company with respect to the listing of the H shares on the Hong Kong Stock Exchange and reporting requirements of the Hong Kong Stock Exchange and the listing of the ADSs on the NYSE and reporting requirements of the SEC and the NYSE, respectively. Grant Thornton is therefore the principal auditor for the purpose of this filing.
Audit Fees
Audit fees primarily consist of fees for the audits of the consolidated financial statements prepared under IFRS and PRC GAAP and the statutory financial statements of our subsidiaries for the relevant year, the review of interim consolidated financial statements and the audit of our internal control over financial reporting as required by the Sarbanes-Oxley Act. Service fees denominated in Australian dollars were incurred for the audit of Yancoal Australia’s financial statements and internal control.
The following table sets forth the aggregate audit fees of our principal accountants for periods indicated:
| Audit Fees | ||||||||
| (RMB) | (A$) | |||||||
2009 | 6,960,000 | 610,000 | ||||||
2010 | 7,300,000 | 800,000 | ||||||
| Audit Fees | ||||||||
| (RMB) | (AUD) | |||||||
2011 | 7,300,000 | 800,000 | ||||||
2012 | 7,300,000 | 1,350,000 | ||||||
In addition, we also paid RMB500,000 to our principal accountants as internal control assessment fees in 2012 for services provided in evaluating the internal control system of the Company.
Audit-related Fees, Tax Fees, All Other Fees
In 2009,2012, we paid our principal accountants a consultation feefees of approximately A$150,000 in relation to the acquisition of Felix.RMB1,500,000 for our US$ Bond Offering. We did not incur other audit-related fees, tax fees or other fees for professional service rendered by our principal accountants during the last two fiscal years.
Audit Committee Pre-Approval Policies and Procedures
The audit committee of our Board of Directors is responsible for, among other things, the recommendation or termination of external auditors subject to the requirements of applicable domestic and overseas listing rules and regulations. Before our principal accountants were engaged by the Company or our subsidiaries to render audit or non-audit services, their respective engagements were approved by our audit committee. All of the audit services provided by Grant Thornton (SEC principal auditor), Grant Thornton Jingdu TianhuaHong Kong (Hong Kong H Share auditor) and ShineWing Certified Public Accountants (China domestic statutory auditor) in 20102012 were pre-approved by our audit committee.
| ITEM 16D. | EXEMPTIONS FROM THE LISTING STANDARDS FOR AUDIT COMMITTEES |
Our audit committee consists of four independent non-executive directors, Mr. ChengCHENG Faguang, Mr. WangWANG Xianzheng, Mr. WangWANG Xiaojun, Mr. XueXUE Yonzhi and one employee director, Mr. DongDONG Yunqing. As a foreign private issuer, we rely on the exemption under Section 303A.06 of the NYSE Listed Company Manual, as well as exemptions for affiliated directors and employee directors as provided under Rule 10A-3 of the Exchange Act, to remain compliant with the audit committee standards set out in Section 303A.06 of the NYSE Listed Company Manual.
Our connected directors do not accept any consulting fees or other compensation from our Group or any subsdiarysubsidiary of our Group, directly or indirectly, except for serving as members of our Board and Audit Committee, which meets the independence requirements under Rule 10A-3(1)(ii)(A) of the Exchange Act.
The employee director qualifies for the exemption under Rule 10A-3(b)(1)(iv)(C) of the Exchange Act because he is not our executive officer and was elected to the Board of Directors of the Company pursuant to theAdvisory Opinion Regarding the Establishment of Sound Corporate Governance for Company Employee Directors and Employee Supervisors, which was promulgated by the Shandong Economic and Trade Commission. Rule 10A-3(b)(1)(iv)(C) of the Exchange Act provides an exemption to the independence requirement and permits an employee director of a foreign private issuer who is a non-executive officer who is elected or named to the foreign private issuer’s board of directors or audit committee pursuant to the issuer’s governing law or documents, an employee collective bargaining or similar agreement or other home country legal or listing requirements. The employee director is neither a voting member nor the chairman of the audit committee.
| ITEM 16E. | PURCHASES OF EQUITY SECURITIES BY THE ISSUER AND AFFILIATED PURCHASERS |
Not applicable.
| ITEM 16F. | CHANGE IN REGISTRANT’S CERTIFYING ACCOUNTANT |
At the 2009 annual general meeting of the Company held on June 25, 2010, the shareholders of our Company approved the appointment of Grant Thornton Hong Kong as the Company’s international auditor for the year ended December 31, 2010. On November 26, 2010, it was announced that BDO and Grant Thomton Hong Kong had concluded an agreement to merge their businesses and practice in the name of BDO Limited. As a consequence of this merger, the Grant Thomton Hong Kong entity changed its name to JBPB & Co on December 10, 2010 and ceased trading. It was noted that Grant Thomton Hong Kong had ceased to be a member firm of Grant Thomton International with effect from November 23, 2010. The audit committee of our Board recommended the appointment of Grant Thornton (for the purpose of reporting to the United States Securities and Exchange Commission) and Grant Thornton Jingdu Tianhua (for the purpose of the Hong Kong H Share listing) as the international auditors to replace JBPB on December 24, 2010, which was approved by the Board on December 30, 2010. Subsequently JBPB tendered its letter of resignation, and the appointment of Grant Thornton and Grant Thornton Jingdu Tianhua as our international auditors was approved at the extraordinary general meeting held on February 18, 2011. We reported the change in our independent registered public accounting firm on Form 6-K filed with the SEC on January 3, 2011.
JBPB’s report on the Company’s consolidated financial statements as of and for the two fiscal years ended December 31, 2009 did not contain an adverse opinion or disclaimer of opinion, nor were such reports qualified or modified as to uncertainty, audit scope, or accounting principles.JBPB’s audit report on the Company’s effectiveness of internal control over financial reporting as of December 31, 2008 contained an adverse opinion because of a material weakness. We reported the identification of the material weakness and our remediation and changes in internal control on Form 20-F filed with the SEC on June 25, 2009.
During JBPB’s tenure as the independent auditor, we did not have any disagreements with JBPB on any matter of accounting principles or practices, financial statement disclosure, or auditing scope or procedure, which disagreements, if not resolved to the satisfaction of JBPB, would have caused them to make reference to the subject matter of the disagreements in their report on the consolidated financial statements for such year and for such period.
During JBPB’s tenure as the independent auditor, save as disclosed above, there were no “reportable events” (hereinafter defined) requiring disclosure pursuant to Item 16F(a)(1)(v) of Form 20-F. As used herein, the term “reportable event” means any of the items listed in paragraphs (a)(1)(v)(A)-(D) of Item 16F of Form 20-F.
We provided a copy of this disclosure to JBPB and requested that JBPB furnish a letter addressed to the SEC stating whether it agrees with the above statements, and if not, stating the respects in which it does not agree. A copy of the letter from JBPB addressed to the SEC, dated June 24, 2011, is filed as Exhibit 15.3.
On December 30, 2010, the Board appoved the proposal to appoint Grant Thornton and Grant Thornton Jingdu Tianhua as the independent registered public accounting firms of the Company and should hold office until the conclusion of the 2010 annual general meeting of the Company. On February 18, 2011, the appointment of Grant Thornton and Grant Thornton Jingdu Tianhua as our independent registered public accounting firms was approved at the extraordinary general meeting. Grant Thorton Jingdu Tianhua and Grant Thorton audit the financial statements of the Company with respect to the listing of the H Shares on the Hong Kong Stock Exchange and reporting requirements of the Hong Kong Stock Exchange and the listing of the ADSs on the NYSE and reporting requirements of the SEC and the NYSE, respectively.During the fiscal year ended December 31, 2009 and through February 18, 2011, neither we nor anyone on our behalf consulted Grant Thornton or Grant Thornton Jingdu Tianhua regarding either (i) the application of accounting principles to a specified transaction, either completed or proposed, or the type of audit opinion that might be rendered on our consolidated financial statements. Also, we have not obtained any written report or oral advice that Grant Thornton and Grant Thornton Jingdu Tianhua concluded was an important factor considered by us in reaching a decision as to the accounting, auditing or financial reporting issue, or (ii) any matter that was either the subject of a “disagreement”, as that term is defined in Item 16F(a)(1)(v) of Form 20-F and related instructions to Item 16-F of Form 20-F, with Grant Thornton and Grant Thornton Jingdu Tianhua or a “reportable event”, as that term is described in Item 16F(a)(1)(v) of Form 20F).Not applicable.
| ITEM 16G. | CORPORATE GOVERNANCE |
The NYSE imposes a series of corporate governance listing standards for companies listed on the NYSE in Section 303A of the NYSE Listed Company Manual. However, the NYSE allows foreign private issuers, subject to certain limitations and conditions, to follow “home country” practice in lieu of certain provisions of Section 303A. To qualify for this exemption, a foreign private issuer must disclose the significant manners in which its corporate governance practices differ from those generally required under NYSE listing standards.
As of the date of this annual report, 52.86% of ourthe voting rights in the Company are held by our controlling shareholder, the Yankuang Group. We therefore are not required to comply with the majority of independent directors requirement of Section 303A.01 when forming our board of directors. Moreover, we are not required to form a nominating, corporate governance and compensation committee composed entirely of independent directors under the requirements of Sections 303A.04 and 303A.05.
We have established an audit committee pursuant to Section 303A.06 of the NYSE Listed Company Manual. We rely on the exemption under Section 303A.00 for foreign private issuers, as well as the exemption for employee directors provided under Rule 10A-3 of the Exchange Act to comply with the audit committee requirements set out in the NYSE Listed Company Manual.
As a foreign private issuer, we are subject to more than one set of corporate governance requirements, including those applicable in our home country. In the table below, we set out material differences between our corporate governance practices and the NYSE’s corporate governance requirements:
NYSE Listed Company Manual Requirements on Corporate Governance | Our Practice | |||
| Non-executive directors must meet at regularly scheduled executive sessions without management | Section 303A.03 requires non-executive directors of each listed company to meet at regularly scheduled executive sessions without management participation. | There is no identical corporate governance requirement in the PRC. We have established a reporting system to the Board to ensure that the Directors stay informed of our business and operations. We believe that convening board meetings on a | ||
| Corporate Governance Guidelines | Section 303A.09 requires a listed company to adopt and disclose corporate governance guidelines. In addition, Section 303A.09 lists out matters that must be addressed in the guidelines:
• director qualification standards;
• director responsibilities;
• communications between directors and the management and independent advisors;
• director compensation;
• director orientation and continuing education;
• management succession; and
• annual performance evaluation of the board. | Although we have not adopted a separate set of corporate governance guidelines encompassing all the corporate governance matters required by the NYSE, we formulated the Rules of Procedures for the Shareholders’ Meetings, Rules of Procedures for the Board Meetings, Rules of Procedures for the Supervisory Committee, Rules for the Work of the Independent Non-Executive Directors, Rules for Disclosure of Information, Rules for the Approval and the Disclosure of the Connected Transactions of the Company, and other corporate governance documentation in accordance with the regulations and requirements of listing in China.
We believe that collectively, the foregoing rules and measures adequately address the corporate governance requirements of the NYSE and provide a comprehensive and detailed set of corporate governance requirements that promote the effective operation of the Company. This enables the promotion of the standard operation of the Company. | ||
NYSE Listed Company Manual Requirements on Corporate Governance | Our Practice | |||
| Code of Business Conduct and Ethics | Section 303A.10 requires a listed company to adopt and disclose a code of business conduct and ethics for directors, officers and employees, and promptly disclose any waivers from the code for directors or executive officers. The following topics must be addressed in a code of business conduct and ethics:
• conflicts of interest;
• corporate opportunities;
• confidentiality;
• fair dealing;
• protection and proper use of company assets;
• compliance with laws, rules and regulations (including insider trading laws); and
• encouraging the reporting of any illegal or unethical behavior. | We have adopted a code of ethics, which is published on our website, in compliance with PRC laws and regulations as well as the rules of relevant stock exchanges. Although our current code of ethics as adopted does not completely conform to the NYSE rules, we believe that the existing code of ethics adequately protects the interests of the Company and Shareholders. |
| ITEM 16H. | MINING SAFETY DISCLOSURE |
As of the date of this annual report, the Company did not own or operate any mine in the United States. For details of the mining safety control of our coal mines in China and Australia, see “Item 4. Information on the Company — B. Business Overview — Coal Business — Safety Control.”
PART III
| ITEM 17. | FINANCIAL STATEMENTS |
We have elected to provide the financial statements and related information specified in Item 18 in lieu of Item 17.
| ITEM 18. | FINANCIAL STATEMENTS |
Our consolidated financial statements are included at the end of this annual report on Form 20-F.
| ITEM 19. | EXHIBITS |
Documents filed as exhibits to this annual report:
Exhibit Number | Description | |
| 8.1 | List of subsidiaries of Yanzhou Coal Mining Company Limited | |
| 12.1 | Certification of general manager pursuant to Rule 13a-14 or 15d-14 promulgated under the U.S. Securities Act of 1934 | |
| 12.2 | Certification of chief financial officer pursuant to Rule 13a-14 or 15d-14 promulgated under the U.S. Securities Act of 1934 | |
| 13.1 | Certification of general manager pursuant to 18 U.S.C. Section 1350, as enacted pursuant to Section 906 of the U.S. Sarbanes-Oxley Act of 2002 | |
| 13.2 | Certification of chief financial officer pursuant to 18 U.S.C. Section 1350, as enacted pursuant to Section 906 of the U.S. Sarbanes-Oxley Act of 2002 | |
| ||
The registrant hereby certifies that it meets all the requirements for filing on Form 20-F and that it has duly caused and authorized the undersigned to sign this annual report on its behalf.
| YANZHOU COAL MINING COMPANY LIMITED | ||||
| (Registrant) | ||||
| Date: | By: | / | ||
| Name: | Zhang Yingmin | |||
| Title: | General Manager | |||
YANZHOU COAL MINING COMPANY LIMITED
CONSOLIDATED FINANCIAL STATEMENTS
FOR THE YEARS ENDED DECEMBER 31, 2010, 20092012, 2011 AND 20082010
AND REPORTS OF INDEPENDENT REGISTERED PUBLIC ACCOUNTING FIRM
CONTENTS | PAGE(S) | |
REPORT OF INDEPENDENT REGISTERED PUBLIC ACCOUNTING FIRM
TO THE BOARD OF DIRECTORS AND SHAREHOLDERS OF
YANZHOU COAL MINING COMPANY LIMITED
(A joint stock company with limited liability established in the People’s Republic of China)
We have audited the accompanying consolidated balance sheetsheets of Yanzhou Coal Mining Company Limited (the “Company”) and its subsidiaries (the(collectively, the “Group”) as of December 31, 2010,2012 and 2011, and the related consolidated income statement,statements, statements of comprehensive income, changes in equity, and cash flows for each of the year then ended.three years in the period ended December 31, 2012. These consolidated financial statements are the responsibility of the Company’s management. Our responsibility is to express an opinion on these consolidated financial statements based on our audit.audits.
We conducted our auditaudits in accordance with the standards of the Public Company Accounting Oversight Board (United States). Those standards require that we plan and perform the audit to obtain reasonable assurance about whether the financial statements are free of material misstatement. An audit includes examining, on a test basis, evidence supporting the amounts and disclosures in the financial statements. An audit also includes assessing the accounting principles used and significant estimates made by management, as well as evaluating the overall financial statement presentation. We believe that our audit providesaudits provide a reasonable basis for our opinion.
In our opinion, the consolidated financial statements referred to above present fairly, in all material respects, the financial position of the Group as of December 31, 2010,2012 and 2011, and the results of its operations and its cash flows for each of the year thenthree years in the period ended December 31, 2012, in conformity with International Financial Reporting Standards as issued by the International Accounting Standards Board.
We also have audited, in accordance with the standards of the Public Company Accounting Oversight Board (United States), the Group’s internal control over financial reporting as of December 31, 2010,2012, based on the criteria established inInternal Control—Integrated Frameworkissued by the Committee of Sponsoring Organizations of the Treadway Commission (“COSO”), and our report dated June 24, 2011April 29, 2013 expressed an unqualified opinion on the effectiveness of the Group’s internal control over financial reporting.
/s/ Grant Thornton
Beijing, People’s Republic of China
April 29, 2013
REPORT OF INDEPENDENT REGISTERED PUBLIC ACCOUNTING FIRM
TO THE BOARD OF DIRECTORS AND SHAREHOLDERS OF
YANZHOU COAL MINING COMPANY LIMITED
(A joint stock company with limited liability established in the People’s Republic of China)
We have audited the internal control over financial reporting of Yanzhou Coal Mining Company Limited (the “Company”) and its subsidiaries (the(collectively, the “Group”) as of December 31, 2010,2012, based on criteria established in Internal Control — Integrated Framework issued by the Committee of Sponsoring Organizations of the Treadway Commission.Commission (“COSO”). The Company’s management is responsible for maintaining effective internal control over financial reporting and for its assessment of the effectiveness of internal control over financial reporting, included in the Management’s Report on Internal Control over Financial Reporting disclosed in Item 15 of the Form 20-F (“Management’s Report”).Reporting. Our responsibility is to express an opinion on the Group’s internal control over financial reporting based on our audit. As indicated in Management’s Report on Internal Control Over Financial Reporting, Gloucester Coal Limited was acquired during the year ended December 31, 2012, and management’s assertion on the effectiveness of the Group’s internal control over financial reporting excluded internal control over financial reporting of Gloucester Coal Limited, whose consolidated financial statements reflect total assets and revenues constituting 9 percent and 3 percent, respectively, of the related consolidated financial statement amounts as of and for the year ended December 31, 2012. Our audit of, and the opinion on, the Company’s internal control over financial reporting also excludes internal control over financial reporting of Gloucester Coal Limited.
We conducted our audit in accordance with the standards of the Public Company Accounting Oversight Board (United States). Those standards require that we plan and perform the audit to obtain reasonable assurance about whether effective internal control over financial reporting was maintained in all material respects. Our audit included obtaining an understanding of internal control over financial reporting, assessing the risk that a material weakness exists, testing and evaluating the design and operating effectiveness of internal control based on the assessed risk, and performing such other procedures as we considered necessary in the circumstances. We believe that our audit provides a reasonable basis for our opinion.
A company’s internal control over financial reporting is a process designed to provide reasonable assurance regarding the reliability of financial reporting and the preparation of financial statements for external purposes in accordance with generally accepted accounting principles. A company’s internal control over financial reporting includes those policies and procedures that (1) pertain to the maintenance of records that, in reasonable detail, accurately and fairly reflect the transactions and dispositions of the assets of the company; (2) provide reasonable assurance that transactions are recorded as necessary to permit preparation of financial statements in accordance with generally accepted accounting principles, and that receipts and expenditures of the company are being made only in accordance with authorizations of management and directors of the company; and (3) provide reasonable assurance regarding prevention or timely detection of unauthorized acquisition, use, or disposition of the company’s assets that could have a material effect on the financial statements.
Because of its inherent limitations, internal control over financial reporting may not prevent or detect misstatements. Also, projections of any evaluation of the effectiveness to future periods are subject to the risk that the controls may become inadequate because of changes in conditions, or that the degree of compliance with the policies or procedures may deteriorate.
In our opinion, the Group maintained, in all material respects, effective internal control over financial reporting as of December 31, 2010,2012, based on the criteria established inInternal Control — Integrated Framework issued by the Committee of Sponsoring Organizations of the Treadway Commission.COSO.
We also have audited, in accordance with the standards of the Public Company Accounting Oversight Board (United States), the consolidated financial statements of the Group as of and for the year ended December 31, 2010 of the Group2012, and our report dated June 24, 2011April 29, 2013 expressed an unqualified opinion on those financial statements.
|
REPORT OF INDEPENDENT REGISTERED PUBLIC ACCOUNTING FIRM
To the Board of Directors and Shareholders of
Yanzhou Coal Mining Company Limited
We have audited the accompanying consolidated balance sheets of Yanzhou Coal Mining Company Limited and its subsidiaries (the “Group”) as of December 31, 2009 and the related consolidated income statements, statements of comprehensive income, changes in equity and cash flows for the years ended December 31, 2009 and December 31, 2008. These consolidated financial statements are the responsibility of the Company’s management. Our responsibility is to express an opinion on these consolidated financial statements based on our audits.
We conducted our audits in accordance with the standards of the Public Company Accounting Oversight Board (United States). Those standards require that we plan and perform the audits to obtain reasonable assurance about whether the financial statements are free of material misstatement. An audit includes examining, on a test basis, evidence supporting the amounts and disclosures in the financial statements. An audit also includes assessing the accounting principles used and significant estimates made by management, as well as evaluating the overall financial statement presentation. We believe that our audits provide a reasonable basis for our opinion.
In our opinion, the consolidated financial statements referred to above present fairly, in all material respects, the financial position of the Group as of December 31, 2009 and the results of its operations and its cash flows for the years ended December 31, 2009 and December 31, 2008 in conformity with International Financial Reporting Standards as issued by the International Accounting Standards Board.
/s/ JBPB & Co. (formerly known as GRANT THORNTON)Grant Thornton
Hong KongBeijing, People’s Republic of China
JuneApril 29, 20102013
YANZHOU COAL MINING COMPANY LIMITED
CONSOLIDATED INCOME STATEMENTS
| Year ended December 31, | Year ended December 31, | |||||||||||||||||||||||||||||||
| NOTES | 2010 | 2009 | 2008 | NOTES | 2012 | 2011 | 2010 | |||||||||||||||||||||||||
| RMB’000 | RMB’000 | RMB’000 | RMB’000 | RMB’000 | RMB’000 | |||||||||||||||||||||||||||
GROSS SALES OF COAL | 7 | 32,590,911 | 19,947,748 | 24,933,349 | 7 | 56,200,600 | 45,181,229 | 32,590,911 | ||||||||||||||||||||||||
RAILWAY TRANSPORTATION SERVICE INCOME | 513,282 | 267,345 | 255,713 | 464,068 | 476,852 | 513,282 | ||||||||||||||||||||||||||
GROSS SALES OF ELECTRICITY POWER | 185,542 | 187,540 | 59,811 | 323,646 | 327,969 | 185,542 | ||||||||||||||||||||||||||
GROSS SALES OF METHANOL | 629,290 | 258,867 | 38,550 | 1,117,952 | 1,059,323 | 629,290 | ||||||||||||||||||||||||||
GROSS SALES OF HEAT SUPPLY | 25,227 | 15,638 | — | 39,918 | 20,467 | 25,227 | ||||||||||||||||||||||||||
|
|
| ||||||||||||||||||||||||||||||
TOTAL REVENUE | 33,944,252 | 20,677,138 | 25,287,423 | 58,146,184 | 47,065,840 | 33,944,252 | ||||||||||||||||||||||||||
TRANSPORTATION COSTS OF COAL | 7 | (1,160,470 | ) | (403,311 | ) | (508,712 | ) | 7 | (2,104,225 | ) | (1,248,268 | ) | (1,160,470 | ) | ||||||||||||||||||
COST OF SALES AND SERVICE PROVIDED | 8 | (16,801,323 | ) | (10,589,991 | ) | (12,201,131 | ) | 8 | (41,961,540 | ) | (25,725,294 | ) | (16,801,323 | ) | ||||||||||||||||||
COST OF ELECTRICITY POWER | (195,536 | ) | (190,802 | ) | (88,253 | ) | (330,803 | ) | (362,472 | ) | (195,536 | ) | ||||||||||||||||||||
COST OF METHANOL | (716,802 | ) | (352,943 | ) | (37,834 | ) | (911,203 | ) | (930,239 | ) | (716,802 | ) | ||||||||||||||||||||
COST OF HEAT SUPPLY | (12,490 | ) | (9,734 | ) | — | (25,130 | ) | (13,777 | ) | (12,490 | ) | |||||||||||||||||||||
|
|
| ||||||||||||||||||||||||||||||
GROSS PROFIT | 15,057,631 | 9,130,357 | 12,451,493 | 12,813,283 | 18,785,790 | 15,057,631 | ||||||||||||||||||||||||||
SELLING, GENERAL AND ADMINISTRATIVE EXPENSES | 9 | (5,093,904 | ) | (3,820,241 | ) | (3,832,031 | ) | 9 | (7,987,636 | ) | (6,570,203 | ) | (5,093,442 | ) | ||||||||||||||||||
SHARE OF INCOME (LOSS) OF ASSOCIATES | 28 | 8,870 | 109,786 | (67,367 | ) | |||||||||||||||||||||||||||
SHARE OF PROFIT OF ASSOCIATES | 29 | 141,986 | 68,939 | 8,870 | ||||||||||||||||||||||||||||
SHARE OF LOSS OF JOINTLY CONTROLLED ENTITIES | 32 | (103,217 | ) | — | (462 | ) | ||||||||||||||||||||||||||
OTHER INCOME | 10 | 3,108,081 | 311,019 | 351,493 | 10 | 2,930,445 | 1,075,765 | 3,108,081 | ||||||||||||||||||||||||
INTEREST EXPENSE | 11 | (603,343 | ) | (45,115 | ) | (38,360 | ) | |||||||||||||||||||||||||
INTEREST EXPENSES | 11 | (1,448,679 | ) | (839,305 | ) | (603,343 | ) | |||||||||||||||||||||||||
|
|
| ||||||||||||||||||||||||||||||
PROFIT BEFORE INCOME TAXES | 12,477,335 | 5,685,806 | 8,865,228 | 13 | 6,346,182 | 12,520,986 | 12,477,335 | |||||||||||||||||||||||||
INCOME TAXES | 12 | (3,171,043 | ) | (1,553,312 | ) | (2,385,617 | ) | 12 | (123,937 | ) | (3,545,379 | ) | (3,171,043 | ) | ||||||||||||||||||
|
|
| ||||||||||||||||||||||||||||||
PROFIT FOR THE YEAR | 13 | 9,306,292 | 4,132,494 | 6,479,611 | 6,222,245 | 8,975,607 | 9,306,292 | |||||||||||||||||||||||||
|
|
| ||||||||||||||||||||||||||||||
ATTRIBUTABLE TO: | ||||||||||||||||||||||||||||||||
EQUITY HOLDERS OF THE COMPANY | 9,281,386 | 4,117,322 | 6,488,908 | |||||||||||||||||||||||||||||
NON-CONTROLLING INTERESTS | 24,906 | 15,172 | (9,297 | ) | ||||||||||||||||||||||||||||
Attributable to: | ||||||||||||||||||||||||||||||||
Equity holders of the Company | 6,218,969 | 8,928,102 | 9,281,386 | |||||||||||||||||||||||||||||
Non-controlling interests | 3,276 | 47,505 | 24,906 | |||||||||||||||||||||||||||||
|
|
| ||||||||||||||||||||||||||||||
| 9,306,292 | 4,132,494 | 6,479,611 | 6,222,245 | 8,975,607 | 9,306,292 | |||||||||||||||||||||||||||
|
|
| ||||||||||||||||||||||||||||||
EARNINGS PER SHARE, BASIC | 16 | RMB 1.89 | RMB 0.84 | RMB 1.32 | ||||||||||||||||||||||||||||
EARNINGS PER SHARE, BASIC AND DILUTED | 16 | RMB 1.26 | RMB 1.82 | RMB 1.89 | ||||||||||||||||||||||||||||
|
|
| ||||||||||||||||||||||||||||||
EARNINGS PER ADS, BASIC | 16 | RMB 18.87 | RMB 8.37 | RMB 13.19 | ||||||||||||||||||||||||||||
EARNINGS PER ADS, BASIC AND DILUTED | 16 | RMB 12.64 | RMB 18.15 | RMB 18.87 | ||||||||||||||||||||||||||||
|
|
| ||||||||||||||||||||||||||||||
YANZHOU COAL MINING COMPANY LIMITED
CONSOLIDATED STATEMENTS OF COMPREHENSIVE INCOME
| Year ended December 31, | Year ended December 31, | |||||||||||||||||||||||
| 2010 | 2009 | 2008 | 2012 | 2011 | 2010 | |||||||||||||||||||
| RMB’000 | RMB’000 | RMB’000 | RMB’000 | RMB’000 | RMB’000 | |||||||||||||||||||
Profit for the year | 9,306,292 | 4,132,494 | 6,479,611 | 6,222,245 | 8,975,607 | 9,306,292 | ||||||||||||||||||
Other comprehensive income (after income tax): | ||||||||||||||||||||||||
Available-for-sales investments: | ||||||||||||||||||||||||
Change in fair value | (87,270 | ) | 125,225 | (269,639 | ) | (5,923 | ) | (20,763 | ) | (87,270 | ) | |||||||||||||
Deferred taxes | 21,818 | (31,306 | ) | 67,409 | 1,481 | 5,190 | 21,818 | |||||||||||||||||
|
|
| ||||||||||||||||||||||
| (65,452 | ) | 93,919 | (202,230 | ) | (4,442 | ) | (15,573 | ) | (65,452 | ) | ||||||||||||||
Cash flow hedges: | ||||||||||||||||||||||||
Cash flow hedge reserve recognized | 54,532 | 12,280 | (20,567 | ) | ||||||||||||||||||||
Cash flow hedge amounts recognized in other comprehensive income | 110,196 | (213,459 | ) | 54,532 | ||||||||||||||||||||
Reclassification adjustments for amounts transferred to income statement (included in selling, general and administrative expenses) | (6,576 | ) | 18,118 | — | (26,501 | ) | 12,627 | (6,576 | ) | |||||||||||||||
Deferred taxes | (24,350 | ) | (11,780 | ) | 8,831 | (28,641 | ) | 62,073 | (24,350 | ) | ||||||||||||||
|
|
| ||||||||||||||||||||||
| 23,606 | 18,618 | (11,736 | ) | 55,054 | (138,759 | ) | 23,606 | |||||||||||||||||
Share of other comprehensive income of associates | 1,107 | — | — | 90 | — | 1,107 | ||||||||||||||||||
Exchange difference arising on translation of foreign operations | 173,415 | 134,184 | (101,227 | ) | 297,721 | (569,310 | ) | 173,415 | ||||||||||||||||
|
|
| ||||||||||||||||||||||
Other comprehensive income (loss) for the year | 132,676 | 246,721 | (315,193 | ) | 348,423 | (723,642 | ) | 132,676 | ||||||||||||||||
|
|
| ||||||||||||||||||||||
Total comprehensive income for the year | 9,438,968 | 4,379,215 | 6,164,418 | 6,570,668 | 8,251,965 | 9,438,968 | ||||||||||||||||||
|
|
| ||||||||||||||||||||||
Attributable to: | ||||||||||||||||||||||||
Equity holders of the Company | 9,414,110 | 4,364,043 | 6,173,715 | 6,567,392 | 8,204,460 | 9,414,110 | ||||||||||||||||||
Non-controlling interests | 24,858 | 15,172 | (9,297 | ) | 3,276 | 47,505 | 24,858 | |||||||||||||||||
|
|
| ||||||||||||||||||||||
| 9,438,968 | 4,379,215 | 6,164,418 | 6,570,668 | 8,251,965 | 9,438,968 | |||||||||||||||||||
|
|
| ||||||||||||||||||||||
YANZHOU COAL MINING COMPANY LIMITED
CONSOLIDATED BALANCE SHEETS
| At December 31, | ||||||||||||
| NOTES | 2010 | 2009 | ||||||||||
| RMB’000 | RMB’000 | |||||||||||
ASSETS | ||||||||||||
CURRENT ASSETS | ||||||||||||
Bank balances and cash | 17 | 6,771,314 | 8,522,399 | |||||||||
Term deposits | 17 | 2,567,722 | 3,216,697 | |||||||||
Restricted cash | 17 | 85,188 | 315,045 | |||||||||
Bills and accounts receivable | 18 | 10,017,260 | 4,723,922 | |||||||||
Inventories | 19 | 1,646,116 | 886,360 | |||||||||
Prepayments and other receivables | 20 | 2,613,686 | 1,868,229 | |||||||||
Prepaid lease payments | 21 | 18,280 | 17,121 | |||||||||
Prepayment for resources compensation fees | 22 | 3,948 | 2,761 | |||||||||
Derivative financial instruments | 36 | 239,476 | 37,760 | |||||||||
Tax recoverable | 169,013 | 59,978 | ||||||||||
Overburden in advance | 25 | 149,351 | 350,676 | |||||||||
TOTAL CURRENT ASSETS | 24,281,354 | 20,000,948 | ||||||||||
NON-CURRENT ASSETS | ||||||||||||
Intangible assets | 23 | 19,633,164 | 18,866,674 | |||||||||
Prepaid lease payments | 21 | 728,082 | 691,339 | |||||||||
Prepayment for resources compensation fees | 22 | 8,072 | 13,208 | |||||||||
Property, plant and equipment | 24 | 19,874,615 | 18,877,134 | |||||||||
Goodwill | 26 | 1,196,586 | 1,305,345 | |||||||||
Investments in securities | 27 | 224,442 | 295,295 | |||||||||
Interests in associates | 28 | 1,074,958 | 939,981 | |||||||||
Interests in jointly controlled entities | 30 | 751 | 1,257 | |||||||||
Restricted cash | 17 | 1,365,995 | 238,730 | |||||||||
Deposits made on investments | 29 | 3,243,679 | 175,021 | |||||||||
Deferred tax assets | 38 | 1,124,166 | 1,027,659 | |||||||||
TOTAL NON-CURRENT ASSETS | 48,474,510 | 42,431,643 | ||||||||||
TOTAL ASSETS | 72,755,864 | 62,432,591 | ||||||||||
LIABILITIES AND SHAREHOLDERS' EQUITY | ||||||||||||
CURRENT LIABILITIES | ||||||||||||
Bills and accounts payable | 32 | 1,554,444 | 1,366,976 | |||||||||
Other payables and accrued expenses | 33 | 3,820,971 | 4,441,834 | |||||||||
Provision for land subsidence, restoration, rehabilitation and environmental costs | 34 | 2,300,637 | 1,564,106 | |||||||||
Amounts due to Parent Company and its subsidiary companies | 46 | 438,783 | 757,882 | |||||||||
Borrowings - due within one year | 35 | 614,925 | 1,598,113 | |||||||||
Current portion of long term payable - due within one year | 37 | 6,536 | 5,967 | |||||||||
Derivative financial instruments | 36 | 166,178 | 28,333 | |||||||||
Tax payable | 1,231,388 | 647,190 | ||||||||||
TOTAL CURRENT LIABILITIES | 10,133,862 | 10,410,401 | ||||||||||
NON-CURRENT LIABILITIES | ||||||||||||
Borrowings - due after one year | 35 | 22,400,833 | 20,911,728 | |||||||||
Deferred tax liability | 38 | 2,601,207 | 1,785,087 | |||||||||
Provision for land subsidence, restoration, rehabilitation and environmental costs | 34 | 152,594 | 44,702 | |||||||||
Non-current portion of long term payable - due after one year | 37 | 28,917 | 26,380 | |||||||||
TOTAL NON-CURRENT LIABILITIES | 25,183,551 | 22,767,897 | ||||||||||
TOTAL LIABILITIES | 35,317,413 | 33,178,298 | ||||||||||
Capital and reserves | 39 | |||||||||||
Share capital | 4,918,400 | 4,918,400 | ||||||||||
Reserves | 32,413,486 | 24,233,407 | ||||||||||
Equity attributable to equity holders of the Company | 37,331,886 | 29,151,807 | ||||||||||
Non-controlling interests | 106,565 | 102,486 | ||||||||||
TOTAL EQUITY | 37,438,451 | 29,254,293 | ||||||||||
TOTAL LIABILITIES AND EQUITY | 72,755,864 | 62,432,591 | ||||||||||
| At December 31, | ||||||||||||
| NOTES | 2012 | 2011 | ||||||||||
| RMB’000 | RMB’000 | |||||||||||
ASSETS | ||||||||||||
CURRENT ASSETS | ||||||||||||
Bank balances and cash | 17 | 12,717,358 | 8,145,297 | |||||||||
Term deposits | 17 | 3,186,957 | 9,543,214 | |||||||||
Restricted cash | 17 | 190,090 | 21,076 | |||||||||
Bills and accounts receivable | 18 | 7,459,603 | 7,312,074 | |||||||||
Royalty receivable | 19 | 114,798 | — | |||||||||
Inventories | 20 | 1,565,531 | 1,391,247 | |||||||||
Prepayments and other receivables | 21 | 4,196,999 | 3,624,879 | |||||||||
Prepaid lease payments | 22 | 18,418 | 18,975 | |||||||||
Prepayment for resources compensation fees | 23 | — | 3,356 | |||||||||
Derivative financial instruments | 38 | 90,731 | 104,910 | |||||||||
Tax recoverable | 293,006 | 4,637 | ||||||||||
Overburden in advance | 26 | 448,889 | 261,441 | |||||||||
|
|
|
| |||||||||
TOTAL CURRENT ASSETS | 30,282,380 | 30,431,106 | ||||||||||
NON-CURRENT ASSETS | ||||||||||||
Intangible assets | 24 | 33,634,245 | 26,205,619 | |||||||||
Prepaid lease payments | 22 | 695,675 | 713,425 | |||||||||
Prepayment for resources compensation fees | 23 | — | 5,309 | |||||||||
Property, plant and equipment | 25 | 39,503,103 | 31,273,824 | |||||||||
Goodwill | 27 | 2,573,811 | 1,866,037 | |||||||||
Investments in securities | 28 | 207,076 | 372,800 | |||||||||
Interests in associates | 29 | 2,624,276 | 1,683,897 | |||||||||
Interests in jointly controlled entities | 32 | 1,086,985 | 19,453 | |||||||||
Restricted cash | 17 | — | 387,066 | |||||||||
Long term receivables | 30 | 2,001,458 | 300,083 | |||||||||
Royalty receivable | 19 | 1,234,649 | — | |||||||||
Deposits made on investments | 31 | 3,253,381 | 2,557,807 | |||||||||
Deferred tax assets | 41 | 5,605,284 | 1,335,165 | |||||||||
|
|
|
| |||||||||
TOTAL NON-CURRENT ASSETS | 92,419,943 | 66,720,485 | ||||||||||
|
|
|
| |||||||||
TOTAL ASSETS | 122,702,323 | 97,151,591 | ||||||||||
|
|
|
| |||||||||
LIABILITIES AND SHAREHOLDERS’ EQUITY | ||||||||||||
CURRENT LIABILITIES | ||||||||||||
Bills and accounts payable | 34 | 6,811,760 | 2,240,844 | |||||||||
Other payables and accrued expenses | 35 | 9,013,797 | 7,344,815 | |||||||||
Provision for land subsidence, restoration, rehabilitation and environmental costs | 36 | 3,291,857 | 2,856,229 | |||||||||
Amount due to Parent Company and its subsidiary companies | 93,712 | 352,625 | ||||||||||
Borrowings - due within one year | 37 | 7,712,592 | 19,588,496 | |||||||||
Long term payable and provision - due within one year | 40 | 399,553 | 3,205 | |||||||||
Derivative financial instruments | 38 | 128,077 | 222,089 | |||||||||
Tax payable | 1,171,341 | 2,113,168 | ||||||||||
|
|
|
| |||||||||
TOTAL CURRENT LIABILITIES | 28,622,689 | 34,721,471 | ||||||||||
NON-CURRENT LIABILITIES | ||||||||||||
Borrowings - due after one year | 37 | 33,283,790 | 14,869,324 | |||||||||
Deferred tax liability | 41 | 7,730,127 | 3,895,304 | |||||||||
Provision for land subsidence, restoration, rehabilitation and environmental costs | 36 | 478,409 | 325,414 | |||||||||
Contingent value rights shares liabilities | 39 | 1,432,188 | — | |||||||||
Long term payable and provision - due after one year | 40 | 2,063,922 | 15,028 | |||||||||
|
|
|
| |||||||||
TOTAL NON-CURRENT LIABILITIES | 44,988,436 | 19,105,070 | ||||||||||
|
|
|
| |||||||||
TOTAL LIABILITIES | 73,611,125 | 53,826,541 | ||||||||||
Capital and reserves | ||||||||||||
Share capital | 42 | 4,918,400 | 4,918,400 | |||||||||
Reserves | 40,907,956 | 37,716,090 | ||||||||||
|
|
|
| |||||||||
Equity attributable to equity holders of the Company | 45,826,356 | 42,634,490 | ||||||||||
Non-controlling interests | 3,264,842 | 690,560 | ||||||||||
|
|
|
| |||||||||
TOTAL EQUITY | 49,091,198 | 43,325,050 | ||||||||||
|
|
|
| |||||||||
TOTAL LIABILITIES AND EQUITY | 122,702,323 | 97,151,591 | ||||||||||
|
|
|
| |||||||||
YANZHOU COAL MINING COMPANY LIMITED
CONSOLIDATED STATEMENTS OF CHANGES IN EQUITY
| Share capital | Share premium | Future development fund | Statutory common reserve fund | Translation reserve | Investment revaluation reserve | Cash flow hedge reserve | Retained earnings | Attributable to equity holders of the Company | Non-controlling interests | Total | Share capital | Share premium | Future development fund | Statutory common reserve fund | Translation reserve | Investment revaluation reserve | Cash flow hedge reserve | Retained earnings | Attributable to equity holders of the Company | Non- controlling interests | Total | |||||||||||||||||||||||||||||||||||||||||||||||||||||||||||||||||||
| RMB’000 | RMB’000 | RMB’000 | RMB’000 | RMB’000 | RMB’000 | RMB’000 | RMB’000 | RMB’000 | RMB’000 | RMB’000 | RMB’000 | RMB’000 | RMB’000 | RMB’000 | RMB’000 | RMB’000 | RMB’000 | RMB’000 | RMB’000 | RMB’000 | RMB’000 | |||||||||||||||||||||||||||||||||||||||||||||||||||||||||||||||||||
| (note 39) | (note 39) | (note 39) | (note 42) | (note 42) | (note 42) | (note 42) | ||||||||||||||||||||||||||||||||||||||||||||||||||||||||||||||||||||||||||||||||||
Balance at January 1, 2008 | 4,918,400 | 2,981,002 | 2,587,105 | 2,037,940 | (13,942 | ) | 260,179 | — | 8,646,853 | 21,417,537 | 71,075 | 21,488,612 | ||||||||||||||||||||||||||||||||||||||||||||||||||||||||||||||||||||||||||||
Profit for the year | — | — | — | — | — | — | — | 6,488,908 | 6,488,908 | (9,297 | ) | 6,479,611 | ||||||||||||||||||||||||||||||||||||||||||||||||||||||||||||||||||||||||||||
Other comprehensive income : | ||||||||||||||||||||||||||||||||||||||||||||||||||||||||||||||||||||||||||||||||||||||||
- Fair value change of available-for-sale investments | — | — | — | — | — | (202,230 | ) | — | — | (202,230 | ) | — | (202,230 | ) | ||||||||||||||||||||||||||||||||||||||||||||||||||||||||||||||||||||||||||
- Cash flow hedge reserve recognized | — | — | — | — | — | — | (11,736 | ) | — | (11,736 | ) | — | (11,736 | ) | ||||||||||||||||||||||||||||||||||||||||||||||||||||||||||||||||||||||||||
- Exchange difference arising on translation of foreign operations | — | — | — | — | (101,227 | ) | — | — | — | (101,227 | ) | — | (101,227 | ) | ||||||||||||||||||||||||||||||||||||||||||||||||||||||||||||||||||||||||||
Total comprehensive income for the year | — | — | — | — | (101,227 | ) | (202,230 | ) | (11,736 | ) | 6,488,908 | 6,173,715 | (9,297 | ) | 6,164,418 | |||||||||||||||||||||||||||||||||||||||||||||||||||||||||||||||||||||||||
Transactions with owners | ||||||||||||||||||||||||||||||||||||||||||||||||||||||||||||||||||||||||||||||||||||||||
-Dividends | — | — | — | — | — | — | — | (836,128 | ) | (836,128 | ) | (292 | ) | (836,420 | ) | |||||||||||||||||||||||||||||||||||||||||||||||||||||||||||||||||||||||||
- Appropriations to reserves | — | — | 382,219 | 785,235 | — | — | — | (1,167,454 | ) | — | — | — | ||||||||||||||||||||||||||||||||||||||||||||||||||||||||||||||||||||||||||||
Total transactions with owners | — | — | 382,219 | 785,235 | — | — | — | (2,003,582 | ) | (836,128 | ) | (292 | ) | (836,420 | ) | |||||||||||||||||||||||||||||||||||||||||||||||||||||||||||||||||||||||||
Balance at December 31, 2008 | 4,918,400 | 2,981,002 | 2,969,324 | 2,823,175 | (115,169 | ) | 57,949 | (11,736 | ) | 13,132,179 | 26,755,124 | 61,486 | 26,816,610 | |||||||||||||||||||||||||||||||||||||||||||||||||||||||||||||||||||||||||||
Balance at January 1, 2009 | 4,918,400 | 2,981,002 | 2,969,324 | 2,823,175 | (115,169 | ) | 57,949 | (11,736 | ) | 13,132,179 | 26,755,124 | 61,486 | 26,816,610 | |||||||||||||||||||||||||||||||||||||||||||||||||||||||||||||||||||||||||||
Profit for the year | — | — | — | — | — | — | — | 4,117,322 | 4,117,322 | 15,172 | 4,132,494 | |||||||||||||||||||||||||||||||||||||||||||||||||||||||||||||||||||||||||||||
Other comprehensive income : | ||||||||||||||||||||||||||||||||||||||||||||||||||||||||||||||||||||||||||||||||||||||||
- Fair value change of available-for-sale investments | — | — | — | — | — | 93,919 | — | — | 93,919 | — | 93,919 | |||||||||||||||||||||||||||||||||||||||||||||||||||||||||||||||||||||||||||||
- Cash flow hedge reserve recognized | — | — | — | — | — | — | 18,618 | — | 18,618 | — | 18,618 | |||||||||||||||||||||||||||||||||||||||||||||||||||||||||||||||||||||||||||||
- Exchange difference arising on translation of foreign operations | — | — | — | — | 134,184 | — | — | — | 134,184 | — | 134,184 | |||||||||||||||||||||||||||||||||||||||||||||||||||||||||||||||||||||||||||||
Total comprehensive income for the year | — | — | — | — | 134,184 | 93,919 | 18,618 | 4,117,322 | 4,364,043 | 15,172 | 4,379,215 | |||||||||||||||||||||||||||||||||||||||||||||||||||||||||||||||||||||||||||||
Transactions with owners | ||||||||||||||||||||||||||||||||||||||||||||||||||||||||||||||||||||||||||||||||||||||||
- Appropriations to reserves | — | — | 292,550 | 381,280 | — | — | — | (673,830 | ) | — | — | — | ||||||||||||||||||||||||||||||||||||||||||||||||||||||||||||||||||||||||||||
- Dividends | — | — | — | — | — | — | — | (1,967,360 | ) | (1,967,360 | ) | (466 | ) | (1,967,826 | ) | |||||||||||||||||||||||||||||||||||||||||||||||||||||||||||||||||||||||||
- Acquisition of non-controlling interests | — | — | — | — | — | — | — | — | — | (134,820 | ) | (134,820 | ) | |||||||||||||||||||||||||||||||||||||||||||||||||||||||||||||||||||||||||||
- Acquisition of subsidiaries | — | — | — | — | — | — | — | — | — | 161,114 | 161,114 | |||||||||||||||||||||||||||||||||||||||||||||||||||||||||||||||||||||||||||||
Total transactions with owners | — | — | 292,550 | 381,280 | — | — | — | (2,641,190 | ) | (1,967,360 | ) | 25,828 | (1,941,532 | ) | ||||||||||||||||||||||||||||||||||||||||||||||||||||||||||||||||||||||||||
Balance at December 31, 2009 | 4,918,400 | 2,981,002 | 3,261,874 | 3,204,455 | 19,015 | 151,868 | 6,882 | 14,608,311 | 29,151,807 | 102,486 | 29,254,293 | |||||||||||||||||||||||||||||||||||||||||||||||||||||||||||||||||||||||||||||
Balance at January 1, 2010 | 4,918,400 | 2,981,002 | 3,261,874 | 3,204,455 | 19,015 | 151,868 | 6,882 | 14,608,311 | 29,151,807 | 102,486 | 29,254,293 | 4,918,400 | 2,981,002 | 3,261,874 | 3,204,455 | 19,015 | 151,868 | 6,882 | 14,608,311 | 29,151,807 | 102,486 | 29,254,293 | ||||||||||||||||||||||||||||||||||||||||||||||||||||||||||||||||||
Profit for the year | — | — | — | — | — | — | — | 9,281,386 | 9,281,386 | 24,906 | 9,306,292 | — | — | — | — | — | — | — | 9,281,386 | 9,281,386 | 24,906 | 9,306,292 | ||||||||||||||||||||||||||||||||||||||||||||||||||||||||||||||||||
Other comprehensive income : | ||||||||||||||||||||||||||||||||||||||||||||||||||||||||||||||||||||||||||||||||||||||||
- Fair value change of available-for-sale investments | — | — | — | — | — | (65,452 | ) | — | — | (65,452 | ) | — | (65,452 | ) | — | — | — | — | — | (65,452 | ) | — | — | (65,452 | ) | — | (65,452 | ) | ||||||||||||||||||||||||||||||||||||||||||||||||||||||||||||
- Cash flow hedge reserve recognized | — | — | — | — | — | — | 23,606 | — | 23,606 | — | 23,606 | — | — | — | — | — | — | 23,606 | — | 23,606 | — | 23,606 | ||||||||||||||||||||||||||||||||||||||||||||||||||||||||||||||||||
- Exchange difference arising on translation of foreign operations | — | — | — | — | 173,463 | — | — | — | 173,463 | (48 | ) | 173,415 | — | — | — | — | 173,463 | — | — | — | 173,463 | (48 | ) | 173,415 | ||||||||||||||||||||||||||||||||||||||||||||||||||||||||||||||||
- Share of other comprehensive income of associates | — | — | — | — | — | 1,107 | — | — | 1,107 | — | 1,107 | — | — | — | — | — | 1,107 | — | — | 1,107 | — | 1,107 | ||||||||||||||||||||||||||||||||||||||||||||||||||||||||||||||||||
|
|
|
|
|
|
|
|
|
|
| ||||||||||||||||||||||||||||||||||||||||||||||||||||||||||||||||||||||||||||||
Total comprehensive income for the year | — | — | — | — | 173,463 | (64,345 | ) | 23,606 | 9,281,386 | 9,414,110 | 24,858 | 9,438,968 | — | — | — | — | 173,463 | (64,345 | ) | 23,606 | 9,281,386 | 9,414,110 | 24,858 | 9,438,968 | ||||||||||||||||||||||||||||||||||||||||||||||||||||||||||||||||
Transactions with owners | ||||||||||||||||||||||||||||||||||||||||||||||||||||||||||||||||||||||||||||||||||||||||
- Disposal of a joint venture and subsidiaries | — | — | — | — | — | — | — | — | — | (23,325 | ) | (23,325 | ) | — | — | — | — | — | — | — | — | — | (23,325 | ) | (23,325 | ) | ||||||||||||||||||||||||||||||||||||||||||||||||||||||||||||||
- Appropriations to reserves | — | — | 398,750 | 665,965 | — | — | — | (1,064,715 | ) | — | — | — | — | — | 398,750 | 665,965 | — | — | — | (1,064,715 | ) | — | — | — | ||||||||||||||||||||||||||||||||||||||||||||||||||||||||||||||||
- Dividends | — | — | — | — | — | — | — | (1,229,600 | ) | (1,229,600 | ) | (1,871 | ) | (1,231,471 | ) | — | — | — | — | — | — | — | (1,229,600 | ) | (1,229,600 | ) | (1,871 | ) | (1,231,471 | ) | ||||||||||||||||||||||||||||||||||||||||||||||||||||||||||
- Acquisition of non-controlling interests | — | — | — | — | — | — | — | (4,431 | ) | (4,431 | ) | 4,417 | (14 | ) | — | — | — | — | — | — | — | (4,431 | ) | (4,431 | ) | 4,417 | (14 | ) | ||||||||||||||||||||||||||||||||||||||||||||||||||||||||||||
|
|
|
|
|
|
|
|
|
|
| ||||||||||||||||||||||||||||||||||||||||||||||||||||||||||||||||||||||||||||||
Total transactions with owners | — | — | 398,750 | 665,965 | — | — | — | (2,298,746 | ) | (1,234,031 | ) | (20,779 | ) | (1,254,810 | ) | — | — | 398,750 | 665,965 | — | — | — | (2,298,746 | ) | (1,234,031 | ) | (20,779 | ) | (1,254,810 | ) | ||||||||||||||||||||||||||||||||||||||||||||||||||||||||||
|
|
|
|
|
|
|
|
|
|
| ||||||||||||||||||||||||||||||||||||||||||||||||||||||||||||||||||||||||||||||
Balance at December 31, 2010 | 4,918,400 | 2,981,002 | 3,660,624 | 3,870,420 | 192,478 | 87,523 | 30,488 | 21,590,951 | 37,331,886 | 106,565 | 37,438,451 | 4,918,400 | 2,981,002 | 3,660,624 | 3,870,420 | 192,478 | 87,523 | 30,488 | 21,590,951 | 37,331,886 | 106,565 | 37,438,451 | ||||||||||||||||||||||||||||||||||||||||||||||||||||||||||||||||||
|
|
|
|
|
|
|
|
|
|
| ||||||||||||||||||||||||||||||||||||||||||||||||||||||||||||||||||||||||||||||
Balance at January 1, 2011 | 4,918,400 | 2,981,002 | 3,660,624 | 3,870,420 | 192,478 | 87,523 | 30,488 | 21,590,951 | 37,331,886 | 106,565 | 37,438,451 | |||||||||||||||||||||||||||||||||||||||||||||||||||||||||||||||||||||||||||||
Profit for the year | — | — | — | — | — | — | — | 8,928,102 | 8,928,102 | 47,505 | 8,975,607 | |||||||||||||||||||||||||||||||||||||||||||||||||||||||||||||||||||||||||||||
Other comprehensive income : | ||||||||||||||||||||||||||||||||||||||||||||||||||||||||||||||||||||||||||||||||||||||||
- Fair value change of available-for-sale investments | — | — | — | — | — | (15,573 | ) | — | — | (15,573 | ) | — | (15,573 | ) | ||||||||||||||||||||||||||||||||||||||||||||||||||||||||||||||||||||||||||
- Cash flow hedge reserve recognized | — | — | — | — | — | — | (138,759 | ) | — | (138,759 | ) | — | (138,759 | ) | ||||||||||||||||||||||||||||||||||||||||||||||||||||||||||||||||||||||||||
- Exchange difference arising on translation of foreign operations | — | — | — | — | (569,310 | ) | — | — | — | (569,310 | ) | — | (569,310 | ) | ||||||||||||||||||||||||||||||||||||||||||||||||||||||||||||||||||||||||||
|
|
|
|
|
|
|
|
|
|
| ||||||||||||||||||||||||||||||||||||||||||||||||||||||||||||||||||||||||||||||
Total comprehensive income for the year | — | — | — | — | (569,310 | ) | (15,573 | ) | (138,759 | ) | 8,928,102 | 8,204,460 | 47,505 | 8,251,965 | ||||||||||||||||||||||||||||||||||||||||||||||||||||||||||||||||||||||||||
Transactions with owners | ||||||||||||||||||||||||||||||||||||||||||||||||||||||||||||||||||||||||||||||||||||||||
- Appropriations to reserves | — | — | 490,161 | 681,340 | — | — | — | (1,171,501 | ) | — | — | — | ||||||||||||||||||||||||||||||||||||||||||||||||||||||||||||||||||||||||||||
- Dividends | — | — | — | — | — | — | — | (2,901,856 | ) | (2,901,856 | ) | (440 | ) | (2,902,296 | ) | |||||||||||||||||||||||||||||||||||||||||||||||||||||||||||||||||||||||||
- Acquisition of a subsidiary | — | — | — | — | — | — | — | — | — | 536,930 | 536,930 | |||||||||||||||||||||||||||||||||||||||||||||||||||||||||||||||||||||||||||||
|
|
|
|
|
|
|
|
|
|
| ||||||||||||||||||||||||||||||||||||||||||||||||||||||||||||||||||||||||||||||
Total transactions with owners | — | — | 490,161 | 681,340 | — | — | — | (4,073,357 | ) | (2,901,856 | ) | 536,490 | (2,365,366 | ) | ||||||||||||||||||||||||||||||||||||||||||||||||||||||||||||||||||||||||||
|
|
|
|
|
|
|
|
|
|
| ||||||||||||||||||||||||||||||||||||||||||||||||||||||||||||||||||||||||||||||
Balance at December 31, 2011 | 4,918,400 | 2,981,002 | 4,150,785 | 4,551,760 | (376,832 | ) | 71,950 | (108,271 | ) | 26,445,696 | 42,634,490 | 690,560 | 43,325,050 | |||||||||||||||||||||||||||||||||||||||||||||||||||||||||||||||||||||||||||
|
|
|
|
|
|
|
|
|
|
| ||||||||||||||||||||||||||||||||||||||||||||||||||||||||||||||||||||||||||||||
Balance at January 1, 2012 | 4,918,400 | 2,981,002 | 4,150,785 | 4,551,760 | (376,832 | ) | 71,950 | (108,271 | ) | 26,445,696 | 42,634,490 | 690,560 | 43,325,050 | |||||||||||||||||||||||||||||||||||||||||||||||||||||||||||||||||||||||||||
Profit for the year | — | — | — | — | — | — | — | 6,218,969 | 6,218,969 | 3,276 | 6,222,245 | |||||||||||||||||||||||||||||||||||||||||||||||||||||||||||||||||||||||||||||
Other comprehensive income : | ||||||||||||||||||||||||||||||||||||||||||||||||||||||||||||||||||||||||||||||||||||||||
- Fair value change of available-for-sale investments | — | — | — | — | — | (4,442 | ) | — | — | (4,442 | ) | — | (4,442 | ) | ||||||||||||||||||||||||||||||||||||||||||||||||||||||||||||||||||||||||||
- Cash flow hedge reserve recognized | — | — | — | — | — | — | 55,054 | — | 55,054 | — | 55,054 | |||||||||||||||||||||||||||||||||||||||||||||||||||||||||||||||||||||||||||||
- Exchange difference arising on translation of foreign operations | — | — | — | — | 297,721 | — | — | — | 297,721 | — | 297,721 | |||||||||||||||||||||||||||||||||||||||||||||||||||||||||||||||||||||||||||||
- Share of other comprehensive income of associates | — | — | — | — | — | 90 | — | — | 90 | — | 90 | |||||||||||||||||||||||||||||||||||||||||||||||||||||||||||||||||||||||||||||
|
|
|
|
|
|
|
|
|
|
| ||||||||||||||||||||||||||||||||||||||||||||||||||||||||||||||||||||||||||||||
Total comprehensive income for the year | — | — | — | — | 297,721 | (4,352 | ) | 55,054 | 6,218,969 | 6,567,392 | 3,276 | 6,570,668 | ||||||||||||||||||||||||||||||||||||||||||||||||||||||||||||||||||||||||||||
Transactions with owners | ||||||||||||||||||||||||||||||||||||||||||||||||||||||||||||||||||||||||||||||||||||||||
- Appropriations to reserves | — | — | 645,219 | 423,618 | — | — | — | (1,068,837 | ) | — | — | — | ||||||||||||||||||||||||||||||||||||||||||||||||||||||||||||||||||||||||||||
- Dividends | — | — | — | — | — | — | — | (2,803,488 | ) | (2,803,488 | ) | (47,095 | ) | (2,850,583 | ) | |||||||||||||||||||||||||||||||||||||||||||||||||||||||||||||||||||||||||
- Contribution from non-controlling interests | — | — | — | — | — | — | — | — | — | 49,000 | 49,000 | |||||||||||||||||||||||||||||||||||||||||||||||||||||||||||||||||||||||||||||
- Disposal of partial interests in Yancoal Australia | — | — | — | — | — | — | — | (430,971 | ) | (430,971 | ) | 2,569,101 | 2,138,130 | |||||||||||||||||||||||||||||||||||||||||||||||||||||||||||||||||||||||||||
- Deferred Tax arising from the restructuring of Australian subsidiaries | — | — | — | — | — | — | — | (141,067 | ) | (141,067 | ) | — | (141,067 | ) | ||||||||||||||||||||||||||||||||||||||||||||||||||||||||||||||||||||||||||
|
|
|
|
|
|
|
|
|
|
| ||||||||||||||||||||||||||||||||||||||||||||||||||||||||||||||||||||||||||||||
Total transactions with owners | — | — | 645,219 | 423,618 | — | — | — | (4,444,363 | ) | (3,375,526 | ) | 2,571,006 | (804,520 | ) | ||||||||||||||||||||||||||||||||||||||||||||||||||||||||||||||||||||||||||
|
|
|
|
|
|
|
|
|
|
| ||||||||||||||||||||||||||||||||||||||||||||||||||||||||||||||||||||||||||||||
Balance at December 31, 2012 | 4,918,400 | 2,981,002 | 4,796,004 | 4,975,378 | (79,111 | ) | 67,598 | (53,217 | ) | 28,220,302 | 45,826,356 | 3,264,842 | 49,091,198 | |||||||||||||||||||||||||||||||||||||||||||||||||||||||||||||||||||||||||||
|
|
|
|
|
|
|
|
|
|
| ||||||||||||||||||||||||||||||||||||||||||||||||||||||||||||||||||||||||||||||
YANZHOU COAL MINING COMPANY LIMITED
CONSOLIDATED STATEMENTS OF CASH FLOWS
| Year ended December 31, | Year ended December 31, | |||||||||||||||||||||||||||||
| NOTES | 2010 | 2009 | 2008 | NOTES | 2012 | 2011 | 2010 | |||||||||||||||||||||||
| RMB’000 | RMB’000 | RMB’000 | RMB’000 | RMB’000 | RMB’000 | |||||||||||||||||||||||||
OPERATING ACTIVITIES | ||||||||||||||||||||||||||||||
Profit before income taxes | 12,477,335 | 5,685,806 | 8,865,228 | 6,346,182 | 12,520,986 | 12,477,335 | ||||||||||||||||||||||||
Adjustments for: | ||||||||||||||||||||||||||||||
Interest expenses | 603,343 | 45,115 | 38,360 | 1,448,679 | 839,305 | 603,343 | ||||||||||||||||||||||||
Interest income | (187,189 | ) | (187,604 | ) | (275,220 | ) | (722,336 | ) | (357,708 | ) | (187,189 | ) | ||||||||||||||||||
Dividend income | (4,504 | ) | (2,288 | ) | (7,401 | ) | (3,702 | ) | (2,433 | ) | (4,504 | ) | ||||||||||||||||||
Net unrealized foreign exchange losses | (2,180,277 | ) | 37,676 | 284,278 | ||||||||||||||||||||||||||
Net unrealized foreign exchange (gain) losses | (1,366,698 | ) | 244,655 | (2,180,277 | ) | |||||||||||||||||||||||||
Depreciation of property, plant and equipment | 2,426,626 | 1,793,278 | 1,140,809 | 2,819,404 | 2,266,017 | 2,426,626 | ||||||||||||||||||||||||
Release of prepaid lease payments | 17,958 | 17,027 | 15,109 | 18,363 | 19,018 | 17,958 | ||||||||||||||||||||||||
Amortization of prepayment for resources compensation fees | 3,949 | 2,761 | 2,998 | — | 3,355 | 3,949 | ||||||||||||||||||||||||
Bargain purchase | (1,269,269 | ) | — | — | ||||||||||||||||||||||||||
Amortization of intangible assets | 349,655 | 44,278 | 35,652 | 1,177,595 | 720,008 | 349,655 | ||||||||||||||||||||||||
Reversal of impairment loss on accounts receivable and other receivables | (4,923 | ) | (13,634 | ) | (4,369 | ) | ||||||||||||||||||||||||
Provision for inventory | 4,411 | — | — | |||||||||||||||||||||||||||
Provision (reversal) of impairment loss on accounts receivable and other receivables | 6,452 | (101 | ) | (4,923 | ) | |||||||||||||||||||||||||
Impairment loss on inventories | 140,883 | — | 4,411 | |||||||||||||||||||||||||||
Impairment loss on property, plant and equipment | 97,559 | — | — | 226,925 | 281,994 | 97,559 | ||||||||||||||||||||||||
Share of (income) loss of associates | (8,870 | ) | (109,786 | ) | 67,367 | |||||||||||||||||||||||||
Impairment loss on intangibles assets | 417,214 | — | — | |||||||||||||||||||||||||||
Impairment loss on goodwill | 17,625 | — | — | |||||||||||||||||||||||||||
Share of loss of jointly controlled entities | 103,217 | — | — | |||||||||||||||||||||||||||
Share of income of associates | (141,986 | ) | (68,939 | ) | (8,870 | ) | ||||||||||||||||||||||||
Gain on disposal of a joint venture and subsidiaries | (117,928 | ) | — | — | — | — | (117,928 | ) | ||||||||||||||||||||||
Loss (Gain) on disposal of property, plant and equipment | 16,937 | 11,252 | (12,317 | ) | ||||||||||||||||||||||||||
Loss on fair value change of contingent value rights shares liabilities | 79,423 | — | — | |||||||||||||||||||||||||||
(Gain) loss on disposal of property, plant and equipment | (9,862 | ) | 108,627 | 16,937 | ||||||||||||||||||||||||||
Written off of property, plant and equipment | 1,491 | 14,199 | — | — | — | 1,491 | ||||||||||||||||||||||||
|
|
| ||||||||||||||||||||||||||||
Operating cash flows before movements in working capital | 13,495,573 | 7,338,080 | 10,150,494 | 9,288,109 | 16,574,784 | 13,495,573 | ||||||||||||||||||||||||
Increase in bills and accounts receivable | (5,286,147 | ) | (1,416,577 | ) | (217,012 | ) | ||||||||||||||||||||||||
(Increase) decrease in bills and accounts receivable | (93,403 | ) | 2,800,237 | (5,286,147 | ) | |||||||||||||||||||||||||
(Increase) decrease in inventories | (728,026 | ) | 228,862 | (405,200 | ) | (58,993 | ) | 403,324 | (728,026 | ) | ||||||||||||||||||||
Movement in land subsidence, restoration, rehabilitation and environmental cost | 838,510 | 1,109,659 | 431,344 | 484,739 | 556,706 | 838,510 | ||||||||||||||||||||||||
Movement in overburden cost | 224,546 | — | — | (180,497 | ) | (121,690 | ) | 224,546 | ||||||||||||||||||||||
(Increase) decrease in prepayments and other current assets | (694,726 | ) | 20,193 | (1,242,027 | ) | |||||||||||||||||||||||||
Increase in prepayments and other current assets | (186,137 | ) | (870,492 | ) | (694,726 | ) | ||||||||||||||||||||||||
Increase (decrease) in bills and accounts payable | 158,859 | (4,964 | ) | 263,755 | 246,081 | 537,775 | (160,240 | ) | ||||||||||||||||||||||
Increase in other payables and accrued expenses | 153,893 | 622,093 | 34,481 | 412,693 | 531,298 | 153,893 | ||||||||||||||||||||||||
Increase in long-term payables | 5,654 | 3,980 | — | |||||||||||||||||||||||||||
(Decrease) increase in amounts due to Parent Company and its subsidiary companies | (319,099 | ) | 57,549 | 40,749 | ||||||||||||||||||||||||||
(Decrease) increase in long-term payable and provision | (93,090 | ) | (16,327 | ) | 5,654 | |||||||||||||||||||||||||
|
|
| ||||||||||||||||||||||||||||
Cash generated from operations | 7,849,037 | 7,958,875 | 9,056,584 | 9,819,502 | 20,395,615 | 7,849,037 | ||||||||||||||||||||||||
Income taxes paid | (2,038,697 | ) | (1,596,774 | ) | (2,207,217 | ) | (2,684,720 | ) | (2,155,602 | ) | (2,038,697 | ) | ||||||||||||||||||
Interest paid | (602,743 | ) | (28,501 | ) | (36,511 | ) | (1,296,338 | ) | (608,601 | ) | (602,743 | ) | ||||||||||||||||||
Interest income received | 187,561 | 184,243 | 275,220 | |||||||||||||||||||||||||||
Dividend income received | 4,646 | 2,288 | 7,401 | |||||||||||||||||||||||||||
Interest received | 645,840 | 343,431 | 187,561 | |||||||||||||||||||||||||||
Dividend received | 3,702 | 2,433 | 4,646 | |||||||||||||||||||||||||||
Dividend received from an associate | 15,624 | — | — | |||||||||||||||||||||||||||
|
|
| ||||||||||||||||||||||||||||
NET CASH FROM OPERATING ACTIVITIES | 5,399,804 | 6,520,131 | 7,095,477 | 6,503,610 | 17,977,276 | 5,399,804 | ||||||||||||||||||||||||
|
|
| ||||||||||||||||||||||||||||
YANZHOU COAL MINING COMPANY LIMITED
CONSOLIDATED STATEMENTS OF CASH FLOWS—Continued
| Year ended December 31, | Year ended December 31, | |||||||||||||||||||||||||||||||
| NOTES | 2010 | 2009 | 2008 | NOTES | 2012 | 2011 | 2010 | |||||||||||||||||||||||||
| RMB’000 | RMB’000 | RMB’000 | RMB’000 | RMB’000 | RMB’000 | |||||||||||||||||||||||||||
INVESTING ACTIVITIES | ||||||||||||||||||||||||||||||||
Decrease (increase) in term deposits | 648,975 | (1,971,371 | ) | 141,599 | 6,356,257 | (6,975,492 | ) | 648,975 | ||||||||||||||||||||||||
Purchase of property, plant and equipment | (3,576,136 | ) | (2,133,726 | ) | (2,027,030 | ) | (6,230,426 | ) | (8,619,515 | ) | (3,576,136 | ) | ||||||||||||||||||||
Decrease in other loans receivable | — | — | 640,000 | |||||||||||||||||||||||||||||
Increase in restricted cash | (874,643 | ) | (432,492 | ) | (50,412 | ) | ||||||||||||||||||||||||||
Increase in deposit made on investment | (3,125,753 | ) | (57,095 | ) | — | |||||||||||||||||||||||||||
Decrease (increase) in restricted cash | 223,525 | 1,002,057 | (874,643 | ) | ||||||||||||||||||||||||||||
Increase in long term receivables | (349,217 | ) | (300,083 | ) | — | |||||||||||||||||||||||||||
Increase in deposit made on investments | (695,574 | ) | (394,128 | ) | (3,125,753 | ) | ||||||||||||||||||||||||||
Proceeds on disposal of property, plant and equipment | 205,446 | 79,626 | 19,829 | 226,876 | 57,956 | 205,446 | ||||||||||||||||||||||||||
Acquisition of non-controlling interests of Shanxi Tianhao | (14 | ) | — | — | — | — | (14 | ) | ||||||||||||||||||||||||
Acquisition of Beisu and Yangcun | 45 | (816,011 | ) | — | — | |||||||||||||||||||||||||||
Acquisition of Gloucester | 46 | 237,315 | — | — | ||||||||||||||||||||||||||||
Acquisition of three subsidiaries | 44 | (133,000 | ) | — | — | 47 | — | — | (133,000 | ) | ||||||||||||||||||||||
Acquisition of Hua Ju Energy | 42 | — | (761,683 | ) | — | |||||||||||||||||||||||||||
Acquisition of Felix | 43 | — | (19,558,544 | ) | — | |||||||||||||||||||||||||||
Acquisition of mining rights in Zhaolou | — | — | (747,339 | ) | ||||||||||||||||||||||||||||
Proceeds on disposal of a joint venture and subsidiaries | 45 | 1,147,821 | — | — | ||||||||||||||||||||||||||||
Investments in securities | (16,257 | ) | — | — | — | (169,121 | ) | (16,257 | ) | |||||||||||||||||||||||
Investments in associates | (125,000 | ) | — | — | (810,000 | ) | (540,000 | ) | (125,000 | ) | ||||||||||||||||||||||
Acquisition of An Yuan Coal Mine | 48 | — | (355,000 | ) | — | |||||||||||||||||||||||||||
Acquisition of additional interests in a joint venture | 49 | — | (1,494,767 | ) | — | |||||||||||||||||||||||||||
Acquisition of Syntech | 50 | — | (1,316,174 | ) | — | |||||||||||||||||||||||||||
Acquisition of Premier Coal and Wesfarmers Char | 51 | — | (2,057,276 | ) | — | |||||||||||||||||||||||||||
Acquisition of Xintai | 52 | — | (2,751,557 | ) | — | |||||||||||||||||||||||||||
Proceeds on disposal of a joint venture and subsidiaries | 53 | — | — | 1,147,821 | ||||||||||||||||||||||||||||
Acquisition of potash mineral exploration permits | — | (1,645,227 | ) | — | ||||||||||||||||||||||||||||
Purchase of intangible assets | (35,352 | ) | (233 | ) | — | (1,330,117 | ) | (52,648 | ) | (35,352 | ) | |||||||||||||||||||||
Purchase of land use right | (442 | ) | (7,420 | ) | (68,136 | ) | ||||||||||||||||||||||||||
Purchase of land use rights | — | — | (442 | ) | ||||||||||||||||||||||||||||
|
|
| ||||||||||||||||||||||||||||||
| NET CASH USED IN INVESTING ACTIVITIES | (5,884,355 | ) | (24,842,938 | ) | (2,091,489 | ) | (3,187,372 | ) | (25,610,975 | ) | (5,884,355 | ) | ||||||||||||||||||||
|
|
| ||||||||||||||||||||||||||||||
| FINANCING ACTIVITIES | ||||||||||||||||||||||||||||||||
Dividend paid | (1,229,600 | ) | (1,967,360 | ) | (836,128 | ) | ||||||||||||||||||||||||||
Dividends paid | (2,803,488 | ) | (2,901,856 | ) | (1,229,600 | ) | ||||||||||||||||||||||||||
Proceeds from bank borrowings | 1,110,954 | 20,840,505 | — | 12,281,525 | 16,712,320 | 1,110,954 | ||||||||||||||||||||||||||
Repayments of bank borrowings | (655,528 | ) | (188,705 | ) | (72,000 | ) | ||||||||||||||||||||||||||
Repayments of other borrowings | (584,478 | ) | — | — | ||||||||||||||||||||||||||||
Repayment to Parent Company and its subsidiary companies in respect of consideration for acquisition of Jining III | — | (13,248 | ) | (13,248 | ) | |||||||||||||||||||||||||||
Dividend paid to non-controlling interests of a subsidiary | (1,871 | ) | (201 | ) | (292 | ) | ||||||||||||||||||||||||||
Dividend paid to the former shareholders of Hua Ju Energy | — | (47,250 | ) | — | ||||||||||||||||||||||||||||
Repayment of borrowings to Parent Company | — | (120,000 | ) | — | ||||||||||||||||||||||||||||
Repayment of bank borrowings | (17,338,107 | ) | (4,367,079 | ) | (655,528 | ) | ||||||||||||||||||||||||||
Repayment of other borrowings | (2,225,731 | ) | — | (584,478 | ) | |||||||||||||||||||||||||||
Expenses arising from acquisition of Gloucester | (33,867 | ) | — | — | ||||||||||||||||||||||||||||
Proceeds from issuance of guaranteed notes | 11,262,900 | — | — | |||||||||||||||||||||||||||||
Dividends paid to non-controlling interests of a subsidiary | (47,095 | ) | (2,408 | ) | (1,871 | ) | ||||||||||||||||||||||||||
Contribution from non-controlling interests | 49,000 | — | — | |||||||||||||||||||||||||||||
|
|
| ||||||||||||||||||||||||||||||
NET CASH (USED IN) FROM FINANCING ACTIVITIES | (1,360,523 | ) | 18,503,741 | (921,668 | ) | |||||||||||||||||||||||||||
NET CASH FROM (USED IN) FINANCING ACTIVITIES | 1,145,137 | 9,440,977 | (1,360,523 | ) | ||||||||||||||||||||||||||||
|
|
| ||||||||||||||||||||||||||||||
NET (DECREASE) INCREASE IN CASH AND CASH EQUIVALENTS | (1,845,074 | ) | 180,934 | 4,082,320 | ||||||||||||||||||||||||||||
NET INCREASE (DECREASE) IN CASH AND CASH EQUIVALENTS | 4,461,375 | 1,807,278 | (1,845,074 | ) | ||||||||||||||||||||||||||||
CASH AND CASH EQUIVALENTS, AT JANUARY 1 | 8,522,399 | 8,439,578 | 4,424,561 | 8,145,297 | 6,771,314 | 8,522,399 | ||||||||||||||||||||||||||
EFFECT OF FOREIGN EXCHANGE RATE CHANGES | 93,989 | (98,113 | ) | (67,303 | ) | 110,686 | (433,295 | ) | 93,989 | |||||||||||||||||||||||
|
|
| ||||||||||||||||||||||||||||||
CASH AND CASH EQUIVALENTS, AT DECEMBER 31, REPRESENTED BY BANK BALANCES AND CASH | 6,771,314 | 8,522,399 | 8,439,578 | 12,717,358 | 8,145,297 | 6,771,314 | ||||||||||||||||||||||||||
|
|
| ||||||||||||||||||||||||||||||
YANZHOU COAL MINING COMPANY LIMITED
NOTES TO THE CONSOLIDATED FINANCIAL STATEMENTS
1. GENERAL
Organization and principal activities
Yanzhou Coal Mining Company Limited (the “Company”) is established as a joint stock company with limited liability in the People’s Republic of China (the “PRC”). In April 2001, the status of the Company was changed to that of a sino-foreignSino-foreign joint stock limited company. The Company’s A shares are listed on the Shanghai SecuritiesStock Exchange (“SSE”), its H shares are listed on The Stock Exchange of Hong Kong (the “SEHK”), and its American Depositary Shares (“ADS”, one ADS represents 10 H shares) are listed on the New York Stock Exchange, Inc. The address of the registered office and principal place of business of the Company is 298 Fushan South Road, Zoucheng, Shandong Province, PRC.
The Company operates sixeight coal mines, namely the Xinglongzhuang coal mine, Baodian coal mine, Nantun coal mine, Dongtan coal mine, Jining II coal mine (“Jining II”) and, Jining III coal mine (“Jining III”), Beisu coal mine (“Beisu”) and Yangcun coal mine (“Yangcun”) as well as a regional rail network that links these mines with the national rail network. The Company”sCompany’s parent and ultimate holding company is Yankuang Group Corporation Limited (the “Parent Company”), a state-owned enterprise in the PRC.
The principal activities of the Company’s associateassociates, joint controlled entities and joint ventures are set out in notes 28, 3029, 32 and 3133 respectively.
As at December 31, 2010,2012, the Group has ahad net current assets of RMB14,147,492,000 (2009: RMB9,590,547,000)RMB1,659,691,000 (2011: net current liabilities of RMB4,290,365,000) and total assets less current liabilities of RMB62,622,002,000 (2009: RMB52,022,190,000)RMB94,079,634,000 (2011: RMB62,430,120,000).
Acquisitions and establishment of major subsidiaries
In 2006, the Company acquired a 98% equity interest in Yankuang Shanxi Neng Hua Company Limited (“Shanxi Neng Hua”) and its subsidiaries (collectively referred as the “Shanxi Group”) from the Parent Company at cash consideration of RMB733,346,000. In 2007, the Company further acquired the remaining 2% equity interest in Shanxi Neng Hua from a subsidiary of the Parent Company at cash consideration of RMB14,965,000. The principal activities of Shanxi Group are to invest in heat and electricity, manufacture and sale of mining machinery and engine products, coal mining and the development of integrated coal technology.
YANZHOU COAL MINING COMPANY LIMITED
NOTES TO THE CONSOLIDATED FINANCIAL STATEMENTS—(Continued)
1. GENERAL—Continued
Acquisitions and establishment of major subsidiaries—Continued
Shanxi Neng Hua is an investment holding company, which holds 81.31% equity interest in Shanxi Heshun Tianchi Energy Company Limited (“Shanxi Tianchi”) and approximately 99.85% equity interest in Shanxi Tianhao Chemical Company Limited (“Shanxi Tianhao”). In the current year,2010, Shanxi Neng Hua acquired approximateapproximately 0.04% equity interest of Shanxi Tianhao at cash consideration of RMB14,000. The principal activities of Shanxi Tianchi are to exploit and sale of coal from Tianchi Coal Mine, the principal asset of Shanxi Tianchi. Shanxi Tianchi has completed the construction of Tianchi Coal Mine and commenced production by the end of 2006. Shanxi Tianhao is established to engage in the production of methanol and other chemical products, coke production, exploration and sales. The construction of the methanol facilities by Shanxi Tianhao commenced in March 2006 and it has commenced production in 2008. In 2007, the Company further acquired the remaining 2% equity interest in Shanxi Neng Hua from a subsidiary of the Parent Company at cash consideration of RMB14,965,000.
YANZHOU COAL MINING COMPANY LIMITED
NOTES TO THE CONSOLIDATED FINANCIAL STATEMENTS—(Continued)
1. GENERAL—Continued
In 2004, the Company acquired a 95.67% equity interest in Yanmei Heze Company Limited (“Heze”) from the Parent Company at cash consideration of RMB584,008,000. The principal activities of Heze are to conduct the initial preparationexploit and sale of the coal mines at thein Juye coalfield which includes obtaining the approvals for the coal mine projects, applying rights to explore for coal and preparing the construction work of the coal mines.field. The equity interests held by the Company increased to 96.67% after the increase of the registered capital of Heze in 2007. The equity interests held by the Company increased to 98.33% after the increase of the registered capital of RMB1.5 billion in the current year.2010.
The Company originally held a 97% equity interest in Yanzhou Coal Yulin Power Chemical Co., Ltd. (“Yulin”). In 2008, theThe Company acquired the remaining 3% equity interest in Yulin. Moreover, the Companyand made further investment of RMB600,000,000 in Yulin in 2008.
In February 2009, the Company acquired a 74% equity interest in Shandong Hua Ju Energy Company Limited (“Hua Ju Energy”) from the Parent Company at a consideration of RMB593,243,000. Hua Ju Energy is a joint stock limited company established in the PRC with the principal business of the supply of electricity and heat by utilizing coal gangue and coal slurry produced from coal mining process. In July 2009, the Company entered into acquisition agreements with three shareholders of Hua Ju Energy, pursuant to which, the Company agreed to acquire 21.14% equity interest in Hua Ju Energy at a consideration of RMB173,007,000.
In 2009, the Company entered into a binding scheme implementation agreement with Felix Resources Limited (“Felix”), a corporation incorporated in Australia with shares listed on the Australian Securities Exchange (“ASX”), to acquire all the shares of Felix in cash of approximately AUD3,333 million. The principal activities of Felix are exploring and extracting coal resources, operating, identifying, acquiring and developing resource related projects that primarily focus on coal in Australia. This acquisition was completed in 2009. In 2011, Felix Resources Limited was renamed as Yancoal Resources Limited (“Yancoal Resources”).
In 2009, the Company invested RMB500 million to set up a wholly ownedwholly-owned subsidiary located in Inner Mongolia, Yanzhou Coal Ordos Neng Hua Company Limited (“Ordos”). Ordos is a limited liability company incorporated in the PRC with the objectives of production and sale of methanol and other chemical products. AsIn 2011, the Company invested additional equity in the registered capital of Ordos of RMB2.6 billion. The Company also acquired Yiginhuoluo Qi Nalin Tao Hai Town An Yuan Coal Mine (“An Yuan Coal Mine”) at December 31, 2010, Ordos has not yet commenced any constructiona consideration of RMB1,435,000,000.
YANZHOU COAL MINING COMPANY LIMITED
NOTES TO THE CONSOLIDATED FINANCIAL STATEMENTS—(Continued)
1. GENERAL—Continued
Acquisitions and production projects.establishment of major subsidiaries—Continued
During
In 2010, the Company acquired 100% equity interest of Inner Mongolia Yize Mining Investment Co., Ltd (“Yize”) and other two companies withat a consideration of RMB190,095,000. The main purpose of this acquisition is to facilitate the business of methanol and other chemical products in Inner Mongolia Autonomous Region. As
In 2011, Ordos acquired 80% equity interest of Inner Mongolia Xintai Coal Mining Company Limited (“Xintai”) at a consideration of RMB2,801,557,000 from an independent third party. Xintai owns and operates Wenyu Coal Mine in Inner Mongolia. The principal activities of Xintai are coal production and coal sales.
In 2011, the Company acquired 100% equity interests in Syntech Holdings Pty Ltd and Syntech Holdings II Pty Ltd (collectively “Syntech”) at a cash consideration of AUD208,480,000. The principal activities of Syntech include exploration, production, sorting and processing of coal. The acquisition was completed on August 1, 2011.
The Company entered into a sales and purchases agreement on September 27, 2011 to acquire 100% equity interests in both Wesfarmers Premier Coal Limited (“Premier Coal”) and Wesfarmers Char Pty Ltd (“Wesfarmers Char”) at a consideration of AUD313,533,000. The acquisition was completed on December 31, 2010,30, 2011. Premier Coal is mainly engaged in the three newlyexploration, production and processing of coal. Wesfarmers Char is mainly engaged in the research and development of the technology and procedures in relation to processing coal char from low rank coals.
In 2011, the Company invested USD2.8 million to set up a wholly-owned subsidiary, Yancoal International (Holding) Co., Limited (“Yancoal International”). Yancoal International was established in Hong Kong to act as a platform for overseas assets and business management. Yancoal International has four subsidiaries, namely Yancoal International Trading Co., Limited, Yancoal International Technology Development Co., Limited, Yancoal International Resources Development Co., Limited and Yancoal Luxembourg Energy Holding Co., Limited (“Yancoal Luxembourg”). Yancoal Luxembourg established a wholly-owned subsidiary, Yancoal Canada Resources Co., Ltd (“Yancoal Canada”) with USD290 million as investment. The Company acquired, companies have not commenced any constructionat a total consideration of USD260 million, 19 potash mineral exploration permits in the Province of Saskatchewan, Canada through Yancoal Canada. The permit transfer registrations were completed on September 30, 2011.
On December 22, 2011 and production projects.March 5, 2012, the Company, Yancoal Australia Limited (“Yancoal Australia”) and Gloucester Coal Limited (“Gloucester”), a corporation incorporated in Australia whose shares are listed on the ASX, entered into the merger proposal deed in respect of a proposal for the merger of Yancoal Australia and Gloucester. Yancoal Australia acquired the entire issued share capital of Gloucester at a consideration of a combination of 218,727,665 ordinary shares of Yancoal Australia and 87,645,184 contingent value rights shares (“CVR shares”). Following the completion of the merger, Yancoal Australia is separately listed on the ASX, replacing the listing position of Gloucester. The merger was completed on June 27, 2012. The ordinary shares and CVR shares of Yancoal Australia was listed on the ASX on June 28, 2012. On June 22, 2012, according to the merger agreement, the equity interest in Syntech and Premier Coal held by Yancoal Australia has been transferred to Yancoal International.
YANZHOU COAL MINING COMPANY LIMITED
NOTES TO THE CONSOLIDATED FINANCIAL STATEMENTS—(Continued)
1. GENERAL—Continued
Acquisitions and establishment of major subsidiaries—Continued
On April 23, 2012, the Company entered into an assets transfer agreement with the Parent Company and its subsidiary to purchase the target assets from the Parent Company and its subsidiary at a consideration of RMB824,142,000 to acquire all the assets and liabilities of Beisu and Yangcun and their equity investments in Zoucheng Yankuang Beisheng Industry & Trading Co., Ltd (“Beisheng Industry and Trade”), Shandong Shengyang Wood Co., Ltd (“Shengyang Wood”) and Jining Jiemei New Wall Materials Co., Ltd (“Jiemei Wall Materials”). Beisu and Yangcun mainly engaged in the production and exploration of PCI coal and thermal coal. The acquisition was completed on May 31, 2012.
During the year, the Company entered into an agreement for investment in Shandong Coal Trading Centre Co., Limited (“Trading Centre”) with two third parties. The Company contribute RMB51,000,000 which represents 51% of the equity interest in Trading Centre. The principal activities of Trading Centre is to provide coal trading and relevant advisory services. Trading Centre has not yet commenced any business.
2. BASIS OF PRESENTATIONPREPARATION
The accompanying consolidated financial statements have been prepared in accordance with International Financial Reporting Standards (“IFRS”) as issued by the International Accounting Standards Board. The consolidated financial statements were approved and authorized for issue by the Board of Directors on June 24, 2011.April 29, 2013.
The consolidated financial statements are presented in Renminbi (“RMB”), which is also the functional currency of the Company.
Changes in accounting estimates
In the current year, the unit-of-production method is applied for the amortization of coal reserves located in China. In the previous years, these assets were amortized on a straight-line basis. The directors of the Company consider that the unit-of-production method can better reflect the expected pattern of consumption of economic benefits of such assets. Changes of accounting estimates have no material impact on the consolidated financial statements.
Comparative figures
Business taxes and surcharges have been reclassified from as a deduction of each categories of revenue to each corresponding costs of these revenue to provide a more appropriate presentation. Therefore, for the years ended December 31, 2009 and December 31, 2008, subtotals of income and corresponding costs increased by RMB423,776,000 and RMB384,342,000 respectively. The reclassification has no impact to the overall results of the Group. The reclassification does not result in any changes to the consolidated balance sheets as at December 31, 2009 and December 31, 2008 and therefore they are not presented in the consolidated financial statements.
YANZHOU COAL MINING COMPANY LIMITED
NOTES TO THE CONSOLIDATED FINANCIAL STATEMENTS—(Continued)
3. ADOPTION OF NEW AND REVISED INTERNATIONAL FINANCIAL REPORTING STANDARDS
In the current year, the Group has applied, for the first time a number of new standards and interpretations, and amended andthe following revised standards and interpretationsstandard (“new IFRSs”) applicable to the Group issued by the International Accounting Standards Board (the “IASB”) and the International Financial Reporting Interpretations Committee (the IFRIC) of IASB, which are effective for the Group’s financial year beginning from January 1, 2010.2012.
Except for those new accounting policies effective for the financial year beginning January 1, 2010 as applied in these financial statements of the Group, theThe accounting policies adopted for the current year are the same as those adopted for the Group’s financial statements for the year ended December 31, 2009. 2011.
The effectsadoption of the new IFRSs which have a significant impact on the financial statements of the Group, are as follow:
IFRS 3 (Revised) - Business Combinations
The IFRS3 (Revised) introduced major changes to the accounting requirements for business combinations. It retains the major features of the purchase method of accounting, now referred to as the acquisition method. The most significant changes in IFRS3 (Revised) that had an impact on the Group’s acquisitions in 2010 are as follows: The assets acquired and liabilities assumed are generally measured at their acquisition-date fair values. Any contingent consideration is measured at fair value at the acquisition date. If the contingent consideration arrangement gives rise to a financial liability, any subsequent changes are generally recognized in profit or loss. Acquisition-related costs of the combination are recorded as an expense in the income statement. Prior to January 1, 2010, the costs were accounted for as part of the cost of the acquisition. As the Group did not have a material business combination in the current year, the adoption of IFRS 3 (Revised) did not have anyno material impact on the current yearresults or financial statements. IFRS 3 (Revised) is adopted prospectively.
IAS 27 (Revised) Consolidated and Separate Financial Statements
IAS 27 (Revised) introduced changes to the accounting requirements for transactions with non-controlling interests and the lossposition of control of a subsidiary. IAS 27 (Revised) requires the changes in the Group’s ownership interests in subsidiaries that do not result in the Group losing control over the subsidiaries are accounted for as equity transactions. The carrying amounts of the Group’s interests and the non-controlling interests are adjusted to reflect the changes in their relative interests in the subsidiaries. Any difference between the amount by which the non-controlling interests are adjusted and the fair value of the consideration paid or received is recognized directly in equity and attributed to owners of the Company. Prior to January 1, 2010, goodwill arising on acquisition of additional interest in subsidiary represented the excess of the cost of acquisition over the carrying value of the net assets attributable to the additional interest in the subsidiary. IAS 27 (Revised) is adopted prospectively.
The adoption of IAS 27 (Revised) did not have material impact in the current year financial statements.or prior accounting year. Accordingly, no prior period adjustment has been required.
YANZHOU COAL MINING COMPANY LIMITED
NOTES TO THE CONSOLIDATED FINANCIAL STATEMENTS—(Continued)
3. ADOPTION OF NEW AND REVISED INTERNATIONAL FINANCIAL REPORTING STANDARDS—Continued
Improvements to IFRSs 2009
The Improvements to IFRSs 2009 (“2009 Improvements”) made several minor amendments to IFRSs. The only amendment relevant to the Group relates to IAS 17 Leases. Prior to this amendment, IAS 17 generally required a lease of land to be classified as an operating lease. The amendment requires that leases of land are classified as finance or operating applying the general principles of IAS 17. The Group has reassessed the classification of the land elements of its unexpired leases and has determined that none of its leases require reclassification.
The adoption of the new IFRSs had no material effect on how the financial statements for the current or prior accounting years have been prepared. Accordingly, no prior year adjustment has been required.
The Group has not early applied the following new and revised standards, amendments or interpretations that have been issued but are not yet effective.
IFRSs (Amendments) | ||
IFRS 7 (Amendments) | Disclosures – | |
IFRS 9 | Financial Instruments | |
IFRS 10 | Consolidated Financial Statements | |
IFRS 11 | Joint Arrangements | |
IFRS 12 | ||
IFRS 10, IFRS 11 and IFRS 12 (Amendments) | Consolidated Financial Statements, Joint Arrangements and Disclosure of Interests in Other Entities: Transition Guidance1 | |
IFRS 13 | Fair Value Measurement1 | |
IAS 1 (Amendments) | Presentation of Items of Other Comprehensive Income3 | |
IAS | ||
IAS 28 | Investments in Associates and Joint Ventures | |
IAS | ||
IFRIC 20 | Stripping Costs in the Production Phase of a Surface Mine1 |
| 1 | Effective for annual periods beginning on or after |
| 2 | Effective for annual periods beginning on or after |
| 3 | Effective for annual periods beginning on or after |
| 4 | Effective for annual periods beginning on or after January 1, |
IFRS 9 Financial instruments
Under IFRS 9, all recognized financial assets that are within the scope of IAS 39Financial Instruments: Recognition and Measurement are subsequently measured at either amortizedamortised cost or fair value. Specifically, debt investments that are held within a business model whose objective is to collect the contractual cash flows, and that have contractual cash flows that are solely payments of principal and interest on the principal outstanding are generally measured at amortizedamortised cost at the end of subsequent accounting periods. All other debt investments and equity investments are measured at their fair values at the end of subsequent accounting periods
YANZHOU COAL MINING COMPANY LIMITED
NOTES TO THE CONSOLIDATED FINANCIAL STATEMENTS—(Continued)
3. ADOPTION OF NEW AND REVISED INTERNATIONAL FINANCIAL REPORTING STANDARDS—Continued
IFRS 9 Financial instruments—Continued
periods.
In relation to financial liabilities, the significant change relates to financial liabilities that are designated as at fair value through profit or loss. Specifically, under IFRS 9, for financial liabilities that are designated as at fair value through profit or loss, the amount of change in the fair value of the financial liability that is attributable to changes in the credit risk of that liability is presented in other comprehensive income, unless the presentation of the effects of changes in the liability’s credit risk in other comprehensive income would create or enlarge an accounting mismatch in profit or loss. Changes in fair value attributable to a financial liability’s credit risk are not subsequently reclassified to profit or loss. Previously, under IAS 39, the entire amount of the change in the fair value of the financial liability designated as at fair value through profit or loss was presented in profit or loss.
YANZHOU COAL MINING COMPANY LIMITED
NOTES TO THE CONSOLIDATED FINANCIAL STATEMENTS—(Continued)
3. ADOPTION OF NEW AND REVISED INTERNATIONAL FINANCIAL REPORTING STANDARDS—Continued
IFRS 10 Consolidated Financial Statements
IFRS 10 replaces the consolidation guidance in IAS 27Consolidated and Separate Financial Statements and SIC-12Consolidation — Consolidation—Special Purpose Entities by introducing a single consolidation model for all entities based on control, irrespective of the nature of the investee (i.e., whether an entity is controlled through voting rights of investors or through other contractual arrangements as is common in special purpose entities). Under IFRS 10, control is based on whether an investor has 1) power over the investee; 2) exposure, or rights, to variable returns from its involvement with the investee; and 3) the ability to use its power over the investee to affect the amount of the returns.
IFRS 11 Joint Arrangements
IFRS 11 introduces new accounting requirements for joint arrangements, replacing IAS 31Interests in Joint Ventures.Ventures. The option to apply the proportional consolidation method when accounting for jointly controlled entities is removed. Additionally, IFRS 11 eliminates jointly controlled assets to now only differentiate between joint operations and joint ventures. A joint operation is a joint arrangement whereby the parties that have joint control have rights to the assets and obligations for the liabilities. A joint venture is a joint arrangement whereby the parties that have joint control have rights to the net assets.
IFRS 12 Disclosures of Involvement with Other Entities
IFRS 12 requires enhanced disclosures about both consolidated entities and unconsolidated entities in which an entity has involvement. The objective of IFRS 12 is to require information so that financial statement users may evaluate the basis of control, any restrictions on consolidated assets and liabilities, risk exposures arising from involvements with unconsolidated structured entities and non-controlling interest holders’ involvement in the activities of consolidated entities.
YANZHOU COAL MINING COMPANY LIMITED
NOTES TO THE CONSOLIDATED FINANCIAL STATEMENTS—(Continued)
3. ADOPTION OF NEW AND REVISED INTERNATIONAL FINANCIAL REPORTING STANDARDS—Continued
IFRS 13 Fair Value Measurement
IFRS 13 applies when another IFRS requires or permits fair value measurements or disclosures about fair value measurements (and measurements, such as fair value less costs to sell, based on fair value or disclosures about those measurements), except for certain exemptions. IFRS 13 requires the disclosures of fair values through a ‘fair value hierarchy’. The hierarchy categorisescategorizes the inputs used in valuation techniques into three levels. The hierarchy gives the highest priority to (unadjusted) quoted prices in active markets for identical assets or liabilities and the lowest priority to unobservable inputs. If the inputs used to measure fair value are categorisedcategorized into different levels of the fair value hierarchy, the fair value measurement is categorisedcategorized in its entirety in the level of the lowest level input that is significant to the entire measurementmeasurement.
YANZHOU COAL MINING COMPANY LIMITED
NOTES TO THE CONSOLIDATED FINANCIAL STATEMENTS—(Continued)
3. ADOPTION OF NEW AND REVISED INTERNATIONAL FINANCIAL REPORTING STANDARDS—Continued
IAS 27 Separate Financial Statements (2011)1 (Amendments) Presentation of Items of Other Comprehensive Income
The requirements relatingIAS 1 (Amendments) retain the option to present profit or loss and other comprehensive income in either a single statement or in two separate financial statements are unchanged and are includedbut consecutive statements. However, IAS 1 (Amendments) require additional disclosures to be made in the amendedother comprehensive income section such that items of other comprehensive income are grouped into two categories: (a) items that will not be reclassified subsequently to profit or loss; and (b) items that may be reclassified subsequently to profit or loss when specific conditions are met. Income tax on items of other comprehensive income is required to be allocated on the same basis. IAS 27.1 (Amendments) are effective for annual periods beginning on or after July 1, 2012. The presentation of items of other portions of IAS 27comprehensive income will be modified accordingly when the amendments are replaced by IFRS 10.applied in the future accounting periods.
IAS 28 InvestmentsIFRIC 20 Stripping Costs in Associates and Joint Ventures (2011)the Production Phase of a Surface Mine
IFRIC 20 Stripping Costs in the Production Phase of a Surface Mine applies to waste removal costs that are incurred in surface mining activity during the production phase of the mine (“production stripping costs”). Under the Interpretation, the costs from this waste removal activity (“stripping”) which provide improved access to ore are recognized as a non-current asset (“stripping activity asset”) when certain criteria are met, whereas the costs of stripping activities where the benefit is realised in the form of inventory produced are accounted for in accordance with IAS 282 Inventories. The stripping activity asset is amendedaccounted for conforming changesas an addition to, or as an enhancement of, an existing asset and classified as tangible or intangible according to the nature of the existing asset of which it forms part. When the costs of the stripping activity asset and the inventory produced are not separately identifiable, production stripping costs are allocated between the inventory produced and the stripping activity asset by using an allocation basis that is based on the issuance of IFRS 10, IFRS 11 and IFRS 12.
IAS 24 Related Party Disclosures (Revised)
The revised standarda relevant production measure. IFRIC 20 is applicableeffective for annual periods beginning on or after January 1, 2011. The revised standard clarifies and simplifies2013. Under the definitionexisting policy, the Company separately present the striping costs on the balance sheet. Upon the subsequent adoption of a related party and it introduces certain exemptionsthe Interpretation, the presentation on disclosure requirements in respect of transactions between government-related entities and government, and other government-related entities.the balance sheet will be amended accordingly.
The directors are evaluatingconsidered that except for the abovementioned standards or interpretations, the application of other standards or interpretations will have no material impact ofto the above mentioned standards on the Group's future results andGroup’s financial statements.
No significant impact is anticipated on adoption of the 2010 improvements and IFRS 7 improvements.
YANZHOU COAL MINING COMPANY LIMITED
NOTES TO THE CONSOLIDATED FINANCIAL STATEMENTS—(Continued)
4. SIGNIFICANT ACCOUNTING POLICIES
The consolidated financial statements have been prepared on the historical cost basis except for certain financial instruments, which are stated at fair value. The principal accounting policies are set out below.
Basis of consolidation
The consolidated financial statements incorporate the financial statements of the Company and all entities controlled by the Company (its subsidiaries)(including special purpose entities). Control is achieved where the Company has the power to govern the financial and operating policies of an entity so as to obtain benefits from its activities.
Income and expenses of subsidiaries acquired or disposed of during the year are included in the consolidated income statement from the effective date of acquisition or up to the effective date of disposal, as appropriate. Total comprehensive income of subsidiaries is attributed to the owners of the Company and to the non-controlling interests even if itsthis results in the non-controlling interests havehaving a deficit balance.
Where necessary, adjustments are made to the financial statements of subsidiaries to bring their accounting policies intoin line with those used by other members of the Group.
All intra-group transactions, balances, income and expenses are eliminated on consolidation.
Changes in the Group’s ownership interests in subsidiaries that do not result in the Group losing control over the subsidiaries are accounted for as equity transactions. The carrying amounts of the Group’s interests and the non-controlling interests are adjusted to reflect the changes in relative interests in the subsidiaries. Any difference between the amount by which the non-controlling interests are adjusted and the fair value of the consideration paid or received is recognized directly in equity and attributed to owners of the Company.
Business combination
Acquisitions of subsidiaries and businesses are accounted for using the acquisition method. The consideration for each acquisitiontransferred in a business combination is measured at fair value, which is calculated as the aggregatesum of the acquisition-date fair values (at the date of exchange) of assets given,transferred by the Group, liabilities incurred or assumed,by the Group to former owners of the acquiree and the equity instrumentsinterests issued by the Group in exchange for control of the acquiree. Acquisition-related costs are recognized in profit or loss as incurred.
Identifiable assets acquired and liabilities and contingent liabilities assumed in a business combination are measured initially at their fair values at the acquisition date. Subsequent adjustments to the consideration are recognized against the cost of acquisition within the measurement period which does not exceed one year from the acquisition date. Subsequent accounting for changes in fair values of the contingent consideration that do not qualify as measurement period adjustments is included in the income statement or within equity for contingent consideration classified as an asset/liability and equity respectively.
YANZHOU COAL MINING COMPANY LIMITED
NOTES TO THE CONSOLIDATED FINANCIAL STATEMENTS—(Continued)
4. SIGNIFICANT ACCOUNTING POLICIES—Continued
Business combination—Continued
Goodwill is measured as the excess of the sum of the consideration transferred, the amount of any non-controlling interests in the acquiree, and the fair value of the acquirer’s previously held equity interest in the acquiree (if any) over the net of the acquisition–date amounts of the identifiable assets acquired and liabilities assumed. If, after assessment, the net of the acquisition-date amounts of the identifiable assets acquired and the liabilities assumedassumed. If, after assessment, the Group’s interest in the fair value of the acquiree’s identifiable net assets exceeds the sum of the consideration transferred, the amount of any non-controlling interests in the acquiree and the fair value onof the acquirer’s previously held interest in the acquiree (if any), the excess is recognized immediately in profit or loss as a bargain purchase gain.
YANZHOU COAL MINING COMPANY LIMITED
NOTES TO THE CONSOLIDATED FINANCIAL STATEMENTS—(Continued)
4. SIGNIFICANT ACCOUNTING POLICIES—Continued
Business combination—Continued
Non-controlling interests that are present ownership interests and entitle their holders to a proportionate share of the entity’s net assets in the event of liquidation may be initially measured either at fair value or at the non-controlling interests’ proportionate share of the recognized amounts of the acquiree’s identifiable net assets. The choice of measurement basis is made on a transaction-by-transaction basis. The Group applies the non-controlling interests’ proportionate share of the recognized amounts of the acquiree’s identifiable net assets to account for all its acquisitions.
Interests in associates
An associate is an entity over which the Group has significant influence and that is neither a subsidiary nor an interest in a joint venture. Significant influence is the power to participate in the financial and operating policy decisions of the investee but is not control or joint control over those policies.
The results and assets and liabilities of associates are incorporated in these consolidated financial statements using the equity method of accounting.method. Under the equity method, investments in associates are carried in the consolidated balance sheet at cost asand adjusted for post-acquisition changes in the Group’s share of net assets of the associates, less any identified impairment loss. When the Group'sGroup’s share of losses of an associate equals or exceeds its interest in that associate (which includes any long-term interests that, in substance, form part of the Group’s net investment in the associate), the Group discontinues recognizing its share of further losses. An additionalAdditional share of losses is provided for and a liability is recognized only to the extent that the Group has incurred legal or constructive obligations or made payments on behalf of that associate. If the associate subsequently reports profits, the Group resumes recognizing its share of those profits only after its share of the profits exceeds the accumulated share of losses that has previously not been recognized.
Any excess of the cost of acquisition over the Group’s share of the net fair value of the identifiable assets, liabilities and contingent liabilities of the associate recognized at the date of acquisition is recognized as goodwill. The goodwill is included within the carrying amount of the investment and is assessed for impairment as part of the investment. Any excess of the Group’s share of the net fair value of the identifiable assets, liabilities and contingent liabilities over the cost of acquisition, after reassessment, is recognized immediately in profit or loss.
YANZHOU COAL MINING COMPANY LIMITED
NOTES TO THE CONSOLIDATED FINANCIAL STATEMENTS—(Continued)
4. SIGNIFICANT ACCOUNTING POLICIES—Continued
Interests in associates—Continued
The requirements of IAS 39 are applied to determine whether it is necessary to recognize any impairment loss with respect to the Group’s investment in an associate.associates. When necessary, the entire carrying amount of the investment (including goodwill) is tested for impairment in accordance with IAS 36 Impairment of Assets as a single asset by comparing its recoverable amount (higher of value in use and fair value less costs to sell) with its carrying amount,amount. Any impairment loss recognized forms part of the carrying amount of the investment. Anyinvestment and the reversal of that impairment loss is recognized in accordance with IAS 36 to the extent that the recoverable amount of the investment subsequently increases.
Where a group entity transacts with an associate of the Group, profits and losses are eliminated to the extent of the Group’s interest in the relevant associate.
YANZHOU COAL MINING COMPANY LIMITED
NOTES TO THE CONSOLIDATED FINANCIAL STATEMENTS—(Continued)
4. SIGNIFICANT ACCOUNTING POLICIES—Continued
Interests in joint ventures
A joint venture is a contractual arrangement whereby the Group and other parties undertake an economic activity that is subject to joint control (i.e. when the strategic financial and operating policy decisions relating to the activities of the joint venture require the unanimous consent of the parties sharing control).
When a group entity undertakes its activities under joint venture arrangements directly, the Group’s share of jointly controlled assets and any liabilities incurred jointly with other venturers are recognized in the financial statements of the relevant entity and classified according to their nature. Liabilities and expenses incurred directly in respect of interests in jointly controlled assets are accounted for on an accrual basis. Income from the sale or use of the Group’s share of the output of jointly controlled assets, and its share of joint venture expenses, are recognized when it is probable that the economic benefits associated with the transactions will flow to/from the Group and their amount can be measured reliably.
Joint venture arrangements that involve the establishment of a separate entity in which each venturer has an interest are referred to as jointly controlled entities. The Group reports its interests in jointly controlled entities using the equity method of accounting and the details of equity method of accounting have been set out in the accounting policy for interests in associates. When a group entity transacts with a jointly controlled entity of the Group, unrealized profits and losses are eliminated to the extent of the Group’s interest in the joint venture.
The Group’s share using proportionate consolidation of the assets, liabilities, revenue and expenses of other joint ventures (no separate entity has been established) are included in the appropriate items of the financial statements.
YANZHOU COAL MINING COMPANY LIMITED
NOTES TO THE CONSOLIDATED FINANCIAL STATEMENTS—(Continued)
4. SIGNIFICANT ACCOUNTING POLICIES—Continued
Revenue recognition
Revenue is measured at the fair value of the consideration received or receivable and represents amounts receivable for goods sold and services provided in the normal coursescourse of business, net of discounts and sales related taxes. Provided it is probable that the economic benefits will flow to the Group and the revenue and costs, if applicable, can be measured reliably, revenue is recognized in profit or loss as follows:
Sales of goods (including coal and methanol) are recognized upon transfer of the significant risks and rewards of ownership to the customer. This is usually taken asat the time when the goods are delivered and the customer has accepted the goods.
Service income such as coal railway transportation and electricity and heat supply is recognized when services are provided.
Interest income from a financial asset is accrued on a time basis, by reference to the principal outstanding and at the effective interest rate applicable, which is the rate that exactly discounts the estimated future cash receipts through the expected life of the financial assets to that asset’s net carrying amount.
Dividend income from investments is recognized when the shareholders’ rights to receive payments have been established.
YANZHOU COAL MINING COMPANY LIMITED
NOTES TO THE CONSOLIDATED FINANCIAL STATEMENTS—(Continued)
4. SIGNIFICANT ACCOUNTING POLICIES—Continued
Intangible assets (other than goodwill)
Intangible assets acquired separately
Intangible assets acquired separately are carried at cost less accumulated amortization and accumulated impairment losses. Amortization is recognized over their estimated useful lives. The estimated useful life and amortization method are reviewed at the end of each annual reporting period, with the effect of any changes in estimate being accounted for on a prospective basis.
Internally-generated intangible assets – research and development expenditure
Expenditure on research activities is recognized as an expense in the period in which it is incurred.
An internally-generated intangible asset arising from development expenditure is recognized only if it is anticipated that the development costs incurred on a clearly-defined project will be recovered through future commercial activity. The resultant asset is amortized on a straight line basis over its useful life. Expenditure incurred on projects to develop new products is capitalized only when the Group can demonstrate the technical feasibility of completing the intangible asset so that it will be available for use or sale, its intention to complete and its ability to use or sell the asset, how the asset will generate future economic benefits, the availability of resources to complete the project and the ability to measure reliably the expenditure during the development.
Intangible assets acquired in a business combination
Intangible assets acquired in a business combination and recognized separately from goodwill are initially recognized at their fair value at the acquisition date (which is regarded as their cost).
YANZHOU COAL MINING COMPANY LIMITED
NOTES TO THE CONSOLIDATED FINANCIAL STATEMENTS—(Continued)
4. SIGNIFICANT ACCOUNTING POLICIES—Continued
Intangible assets acquired in a business combination—Continued
Subsequent to initial recognition, intangible assets acquired in a business combination are reported at cost less accumulated amortization and accumulated impairment losses, on the same basis as intangible assets that are acquired separately.
(i) CoalMining reserves
CoalMining reserves represent the portion of total proven and probable reserves in the coal mine of a mining right. CoalMining reserves are amortized over the life of the mine on a unit of production basis of the estimated total proven and probable reserves or the Australia Joint Ore Reserves Committee (“JORC”) reserves for the Group’s subsidiaries in Australia. Changes in the annual amortization rate resulting from changes in the remaining reserves are applied on a prospective basis from the commencement of the next financial year.
YANZHOU COAL MINING COMPANY LIMITED
NOTES TO THE CONSOLIDATED FINANCIAL STATEMENTS—(Continued)
4. SIGNIFICANT ACCOUNTING POLICIES—Continued
Intangible assets (other than goodwill)—Continued
(ii) CoalMining resources
CoalMining resources represent the fair value of economically recoverable reserves (excluding the portion of total proven and probable reserves of coal mines of a mining right i.e. does not include the above coalmining reserves) of coal mines of a mining right (Details are set out in the accounting policy of exploration and evaluation expenditure). When production commences, the coalmining resources for the relevant areas of interest are amortized over the life of the area according to the rate of depletion of the economically recoverable reserves.
(iii) Rail access rights
Rail access rights are amortized on a straight line basis or on a unit of production basis under agreement over the life of the mine.
Exploration and evaluation expenditure
Exploration and evaluation expenditure incurred is accumulated in respect of each separately identifiable area of interest which is at individual mine level. These costs are only carried forward where the right of tenure for the area of interest is current and to the extent that they are expected to be recouped through successful development and commercial exploitation, or alternatively, sale of the area, or where activities in the area have not yet reached a stage which permits reasonable assessment of the existence of economically recoverable reserves and active and significant operations in, or in relation to, the area of interest are continuing.
The carrying amount of exploration and evaluation assets is assessed for impairment when facts or circumstances suggest the carrying amount of the assets may exceed their recoverable amount.
A regular review is undertaken of each area of interest to determine the appropriateness of continuing to carry forward costs in relation to that area of interest. Accumulated costs in relation to an abandoned area are written-off in full in the period in which the decision to abandon the area is made.
When production commences, the accumulated costs for the relevant area of interest are amortized over the life of the area according to the rate of depletion of the economically recoverable reserves.
YANZHOU COAL MINING COMPANY LIMITED
NOTES TO THE CONSOLIDATED FINANCIAL STATEMENTS—(Continued)
4. SIGNIFICANT ACCOUNTING POLICIES—Continued
Exploration and evaluation expenditure—Continued
Capitalized exploration and evaluation expenditure considered to be tangible is recorded as a component of property, plant and equipment. Otherwise, it is recorded as an intangible asset.
Exploration and evaluation expenditure acquired in a business combination are recognized at their fair value at the acquisition date (the fair value of potential economically recoverable reserves at the acquisition date which is shown as “coal“Mining resources”)
YANZHOU COAL MINING COMPANY LIMITED
NOTES TO THE CONSOLIDATED FINANCIAL STATEMENTS—(Continued)
4. SIGNIFICANT ACCOUNTING POLICIES—Continued
Prepaid lease payments
Prepaid lease payments represent land use rights under operating lease arrangement and are stated at cost less accumulated amortization and accumulated impairment losses.
Property, plant and equipment
Property, plant and equipment, other than construction in progress and freehold land, are stated at cost less subsequent accumulated depreciation and accumulated impairment losses.
Depreciation is charged so as to write off the cost of items of property, plant and equipment, other than construction in progress and freehold land, over their estimated useful lives and after taking into account their estimated residual value, using the straight line method or unit of production method.
Construction in progress represents property, plant and equipment under construction for production or for its own use purposes. Construction in progress is carried at cost less any impairment loss. Construction in progress is classified to the appropriate category of property, plant and equipment when completed and ready for intended use. Depreciation commences when the assets are ready for their intended use.
Any gain or loss arising on the disposal of an item of property, plant and equipment is determined as the difference between the sales proceeds and the carrying amount of the asset and is recognized in the consolidated income statement.
Impairment other than goodwill
At each balance sheet date, the Group reviews the carrying amounts of its tangible assets and intangible assets with finite useful life to determine whether there is any indication that those assets have suffered an impairment loss. If any such indication exists, the recoverable amount of the asset (determined at the higher of its fair value less costs to sell and its value in use) is estimated in order to determine the extent of the impairment loss (if any). Intangible assets with an indefinite useful life will be tested for impairment annually.
Recoverable amount is the higher of fair value less costs to sell and value in use. In assessing value in use, the estimated future cash flows are discounted to their present value using a pre-tax discount rate that reflects current market assessments of the time value of money and the risks specific to the asset.
If the recoverable amount of an asset (or cash-generating unit) is estimated to be less than its carrying amount, the carrying amount of the asset (cash-generating unit) is reduced to its recoverable amount. Impairment loss is recognized as an expense immediately.
YANZHOU COAL MINING COMPANY LIMITED
NOTES TO THE CONSOLIDATED FINANCIAL STATEMENTS—(Continued)
4. SIGNIFICANT ACCOUNTING POLICIES—Continued
Impairment other than goodwill—Continued
Where an impairment loss subsequently reverses, the carrying amount of the asset (cash-generating unit) is increased to the revised estimate of its recoverable amount, but such that the increased carrying amount does not exceed the carrying amount that would have been determined had no impairment loss been recognized for the asset (cash-generating unit) in prior years. A reversal of an impairment loss is recognized as an income immediately.
YANZHOU COAL MINING COMPANY LIMITED
NOTES TO THE CONSOLIDATED FINANCIAL STATEMENTS—(Continued)
4. SIGNIFICANT ACCOUNTING POLICIES—Continued
Goodwill
Goodwill arising on acquisitions prior to January 1, 2005 (transition to new IFRS)
Goodwill arising on an acquisition of net assets and operations of another entity for which the agreement date is before January 1, 2005 represents the excess of the cost of acquisition over the Group’s interest in the fair value of the identifiable assets and liabilities of the relevant acquiree at the date of acquisition.
For previously capitalized goodwill arising on acquisitions of net assets and operations of another entity after January 1, 2001, theThe Group has discontinued amortization from January 1, 2005 onwards, and such goodwill is tested for impairment annually, and whenever there is an indication that the cash-generating unit to which the goodwill relates may be impaired (see the accounting policy below).
Goodwill arising on acquisitions on or after January 1, 2005
Goodwill arising on an acquisition of a business for which the agreement date is on or after January 1, 2005 represents the excess of the cost of acquisition over the Group’s interest in the fair value of the identifiable assets, liabilities and contingent liabilities of the relevant business at the date of acquisition. Such goodwill is carried at cost less any accumulated impairment losses.
Goodwill is presented separately in the consolidated balance sheet.
For the purposes of impairment testing, goodwill is allocated to each of the Group’s cash-generating units expected to benefit from the synergies of the acquisition. Cash-generating units to which goodwill has been allocated are tested for impairment annually, or more frequently when there is an indication that the unit may be impaired. If the recoverable amount of the cash-generating unit is less than the carrying amount of the unit, the impairment loss is allocated to reduce the carrying amount of any goodwill allocated to the unit first and then to the other assets of the unit pro-rata on the basis of the carrying amount of each asset in the unit. Any impairment is recognized immediately in the consolidated income statement and is not subsequently reversed.
On disposal of the relevant cash-generating unit, the attributable amount of goodwill is included in the determination of the gain or loss on disposal.
YANZHOU COAL MINING COMPANY LIMITED
NOTES TO THE CONSOLIDATED FINANCIAL STATEMENTS—(Continued)
4. SIGNIFICANT ACCOUNTING POLICIES—Continued
Cash and cash equivalents
Cash and cash equivalents include cash at bank and in hand, demand deposits with banks and other financial institution and short term highly liquid investments with original maturities of three months or less that are readily convertible into known amounts of cash and which are subject to an insignificant risk of changes in value. For the preparation of consolidated cash flow statement, cash and cash equivalents include bank overdrafts which are repayable on demand and form an integral part of the Group’s cash management.
Inventories
Inventories of coal and methanol are stated at the lower of cost and net realizable value. Cost, which comprises direct materials and, where applicable, direct lab ourlabour and overheads that have been incurred in bringing the inventories to their present location and condition, is calculated using the weighted average method. Net realizable value represents the estimated selling price less all further costs to completion and costs to be incurred in selling, marketing and distribution.
Inventories of auxiliary materials, spare parts and small tools expected to be used in production are stated at weighted average cost less allowance, if necessary, for obsolescence.
Overburden in advance
Overburden in advance comprises the accumulation of expenses incurred to enable access to the coal seams, and includes direct removal costs, machinery and plant running costs. The deferred costs are then charged to the consolidated income statement in subsequent periods on the basis of run-of-mine (“ROM”) coal tonnes mined. This is calculated by multiplying the ROM coal tonnes mined during the period by the weighted average cost to remove a bank cubic met remetre (“BCM”) of waste by the stripping ratio (ratio of waste removed in BCMs to ROM coal tonnes mined). The stripping ratio of the Company'sCompany’s Australian subsidiaries is based on the JORC reserves of each mine.
Taxation
Income tax expense represents the sum of the tax currently payable and deferred tax.
The tax currently payable is based on taxable profit for the year. Taxable profit differs from profit as reported in the consolidated income statement because it excludes items of income or expense that are taxable or deductible in other years and it further excludes items that are never taxable or deductible. The Group’s liability for current tax is calculated using tax rates that have been enacted or substantively enacted by the balance sheet date.
Deferred tax is recognized on differences between the carrying amounts of assets and liabilities in the consolidated financial statements and the corresponding tax bases used in the computation of taxable profit, and are accounted for using the balance sheet liability method. Deferred tax liabilities are generally recognized for all taxable temporary differences, and deferred tax assets are recognized to the extent that it is probable that taxable profits will be available against which deductible temporary differences can be utilized. Such assets and liabilities are not recognized if the temporary difference arises from goodwill or from the initial recognition (other than in a business combination) of other assets and liabilities in a transaction that affects neither the taxable profit nor the accounting profit.
YANZHOU COAL MINING COMPANY LIMITED
NOTES TO THE CONSOLIDATED FINANCIAL STATEMENTS—(Continued)
4. SIGNIFICANT ACCOUNTING POLICIES—Continued
Taxation—Continued
Deferred tax liabilities are recognized for taxable temporary differences arising on investments in subsidiaries, interest in associates and joint ventures, except where the Group is able to control the reversal of the temporary difference and it is probable that the temporary difference will not reverse in the foreseeable future.
The carrying amount of deferred tax assets is reviewed at each balance sheet date and reduced to the extent that it is no longer probable that sufficient taxable profit will be available to allow all or part of the asset to be recovered.
YANZHOU COAL MINING COMPANY LIMITED
NOTES TO THE CONSOLIDATED FINANCIAL STATEMENTS—(Continued)
4. SIGNIFICANT ACCOUNTING POLICIES—Continued
Taxation—Continued
Deferred tax is calculated at the tax rates that are expected to apply in the period when the liability is settled or the asset realised. Deferred tax is charged or credited in the consolidated income statement, except when it relates to items that are recognized in other comprehensive income or directly in equity, in which case the deferred tax is also recognized in other comprehensive income or directly in equity respectively.
Deferred tax assets and liabilities are offset when they relate to income taxes levied by the same taxation authority and the Group intends to settle its current tax assets and liabilities on a net basis.
Felix and itsThe Company’s wholly-owned Australian subsidiaries have formed an income tax consolidated group under the tax consolidation regime. Each entity in the tax consolidated group recognizes its own deferred tax assets and liabilities, except where the deferred tax assets relate to unused tax losses and credits, in which case Felixthe Australian subsidiaries recognizes the assets. Felix group hasAustralian subsidiaries have entered into a tax sharing agreement whereby each company in the Felix groupof Australian subsidiaries contributes to the income tax payable in proportion to their contribution to the profit before tax of the tax consolidated group. The tax consolidated group has also entered into a tax funding agreement whereby each entity in the FelixAustralian subsidiaries group can recognize their balance of the current tax assets and liabilities through inter-entity accounts.
Land subsidence, restoration, rehabilitation and environmental costs
One consequence of coal mining is land subsidence caused by the resettlement of the land above the underground mining sites. Depending on the circumstances, the Group may relocate inhabitants from the land above the underground mining sites prior to mining those sites or the Group may compensate the inhabitants for losses or damages from land subsidence after the underground sites have been mined. The Group may also be required to make payments for restoration, rehabilitation or environmental protection of the land after the underground sites have been mined.
An estimate of such costs is recognized in the period in which the obligation is identified and is charged as an expense in proportion to the coal extracted. At each balance sheet date, the Group adjusts the estimated costs in accordance with the actual land subsidence status. The provision is also adjusted for changes in estimates. Those adjustments are accounted for as a change in the corresponding capitalizedcapitalised cost, except where a reduction in the provision is greater than the undepreciated capitalizedcapitalised cost of any related assets, in which case the capitalizedcapitalised cost is reduced to nil and remaining adjustment is recognized in the income statement. Changes to the capitalizedcapitalised cost result in an adjustment to future depreciation and financial charges.
YANZHOU COAL MINING COMPANY LIMITED
NOTES TO THE CONSOLIDATED FINANCIAL STATEMENTS—(Continued)
4. SIGNIFICANT ACCOUNTING POLICIES—Continued
Leasing
Leases are classified as finance leases whenever the terms of the lease transfer substantially all the risks and rewards of ownership to the lessee. All other leases are classified as operating leases.
Where the Group acquires the use of assets under finance leases, the amounts representing the fair value of the leased asset, or, if lower, the present values of the minimum lease payments of such assets are included in property, plant and equipment and the corresponding liabilities, net of finance charges, are recorded as an obligation under finance leases.
YANZHOU COAL MINING COMPANY LIMITED
NOTES TO THE CONSOLIDATED FINANCIAL STATEMENTS—(Continued)
4. SIGNIFICANT ACCOUNTING POLICIES—Continued
Leasing—Continued
Each lease payment is allocated between liability and finance charges so as to achieve a constant rate of interest on the remaining balance of the liability. The finance lease liabilities are included in current and non-current borrowings. The finance charges are expensed in the income statement over the lease periods so as to produce a constant periodic rate of interest on the remaining balance of the liability for each period. The assets accounted for as finance leases are depreciated over the shorter of their estimated useful lives or the lease periods.
Operating lease payments are recognized as an expense on a straight-line basis over the lease term. Contingent rentals arising under operating leases are recognized as an expense in the period in which they are incurred.
Provisions and contingent liabilities
Provisions are recognized when the Group has a present obligation (legal or constructive) as a result of a past event, and it is probable that an outflow of economic benefits will be required to settle the obligation and a reliable estimate of the amount of the obligation can be made. Where the time value of money is material, provisions are stated at the present value of the expenditure expected to settle the obligation.
All provisions are reviewed at each reportingbalance sheet date and adjusted to reflect the current best estimate.
Where it is not probable that an outflow of economic benefits will be required, or the amount cannot be estimated reliably, the obligation is disclosed as a contingent liability, unless the probability of outflow of economic benefits is remote. Possible obligations, whose existence will only be confirmed by the occurrence or non-occurrence of one or more future uncertain events not wholly within the control of the Group are also disclosed as contingent liabilities unless the probability of outflow of economic benefits is remote.
YANZHOU COAL MINING COMPANY LIMITED
NOTES TO THE CONSOLIDATED FINANCIAL STATEMENTS—(Continued)
4. SIGNIFICANT ACCOUNTING POLICIES—Continued
Borrowing costs
Borrowing costs directly attributable to the acquisition, construction or production of qualifying assets, which are assets that necessarily take a substantial period of time to get ready for their intended use or sale, are capitalized as part of the cost of those assets. Investment income earned on the temporary investment of specific borrowings pending their expenditure on qualifying assets is deducted from the borrowing costs eligible for capitalization. Capitalization of borrowing costs is suspended or ceases when substantially all the activities necessary to prepare the qualifying asset for its intended use or sale are interrupted or complete.
All other borrowings costs are recognized as expenses in the period in which they are incurred.
Foreign currencies
In preparing the financial statements of each individual group entity, transactions in currencies other than the functional currency of that entity (foreign currencies) are recorded in the respective functional currency (i.e., the currency of the primary environment in which the entity operates) at the rates of exchanges prevailing on the dates of the transactions. At each balance sheet date, monetary items denominated in foreign currencies are retranslated at the rates prevailing on the balance sheet date. Non-monetary items carried at fair value that are denominated in foreign currencies are translated at the rates prevailing on the date when the fair value was determined. Non-monetary items that are measured in terms of historical cost in a foreign currency are not retranslated.
Exchange differences arising on the settlement of monetary items, and on the translation of monetary items, are recognized in profit or loss in the period in which they arise.
For the purposes of presenting the consolidated financial statements, the assets and liabilities of the Group’s foreign operations are translated into the presentation currency of the Company (i.e. Renminbi) at the rate of exchange prevailing at the balance sheet date, and their income and expenses are translated at the average exchange rates for the year, unless exchange rates fluctuate significantly during the period, in which case, the exchange rates prevailing at the dates of transactions are used. Exchange differences arising, if any, are recognized in other comprehensive income and accumulated in equity (attributed to non-controlling interests as appropriate). Such exchange differences are recognized in profit or loss in the period in which the foreign operation is disposed of.
YANZHOU COAL MINING COMPANY LIMITED
NOTES TO THE CONSOLIDATED FINANCIAL STATEMENTS—(Continued)
4. SIGNIFICANT ACCOUNTING POLICIES—Continued
Government grants
Government grants are recognized as income over the periods necessary to match them with the related costs. If the grants do not relate to any specific expenditure incurred by the Group, they are reported separately as other income. If the grants subsidize an expense incurred by the Group, they are deducted in reporting the related expense. Grants relating to depreciable assets are presented as a deduction from the cost of the relevant asset.
YANZHOU COAL MINING COMPANY LIMITED
NOTES TO THE CONSOLIDATED FINANCIAL STATEMENTS—(Continued)
4. SIGNIFICANT ACCOUNTING POLICIES—Continued
Annual leave, sick leave and long service leave
Benefits accruing to employees in respect of wages and salaries, annual leave and sick leave are included in trade and other payables. Related on-costs are also included in trade and other payables as other creditors. Long service leave is provided for when it is probable that settlement will be required and it is capable of being measured reliably.
Employee benefits expected to be settled within 12 months are measured using the remuneration rate expected to apply at the time of settlement. Provisions made in respect of employee benefits which are not expected to be settled within 12 months are measured as the present value of the estimated future cash outflows to be made by the Group in respect of services provided by employees up to the reportingbalance sheet date.
Retirement benefit costs
Payments to defined contribution retirement benefit plans are charged as expenses when the employees render the services entitling them to the contributions.
Financial instruments
Financial assets and financial liabilities are recognized when the Group becomes a party to the contractual provisions of the instrument. Financial assets and financial liabilities are initially measured at fair value. Transaction costs that are directly attributable to the acquisition or issue of financial assets and financial liabilities (other than financial assets and financial liabilities at fair value through profit or loss) are added to or deducted from the fair value of the financial assets or financial liabilities, as appropriate, on initial recognition. Transaction costs directly attributable to the acquisition of financial assets or financial liabilities at fair value through profit or loss are recognized immediately in profit or loss.
Financial assets
The Group’s financial assets are classified into loans and receivables, financial assets at fair value through profit or loss and available-for-sale financial assets. All regular way purchases or sales of financial assets are recognized and derecognized on a trade date basis. Regular way purchases or sales are purchases or sales of financial assets that require delivery of assets within the time frame established by regulation or convention in the marketplace. The accounting policies adopted in respect of financial assets are set out below.
Loans and receivables
Loans and receivables are non-derivative financial assets with fixed or determinable payments that are not quoted in an active market. Loans and receivables (including bank balances and cash, term deposits, restricted cash, bills and accounts receivable, other current assets and long-term receivables) are subsequently measured at amortized cost using the effective interest method, less any identified impairment loss.
YANZHOU COAL MINING COMPANY LIMITED
NOTES TO THE CONSOLIDATED FINANCIAL STATEMENTS—(Continued)
4. SIGNIFICANT ACCOUNTING POLICIES—Continued
Financial instruments—Continued
Financial assets—assets—Continued
Loan and receivables
Loans and receivables are non-derivative financialFinancial assets with fixed or determinable payments that are not quoted in an active market. Loan and receivables (including bank balances and cash, term deposits, restricted cash, bills and accounts receivable and other receivables) are initially measured at fair value through profit or loss
Financial assets at fair value through profit or loss included financial assets held for trading and subsequently measuredfinancial assets designated as fair value through profit or loss upon initial recognition. Financial assets are classified as held for trading if it is acquired principally for the purpose of selling or repurchasing it in the near term or on initial recognition it is part of a portfolio of identified financial instruments that are managed together and for which there is evidence of a recent actual patter of short-term profit-taking.
Royalty receivable is remeasured based on sales volume, price changes, foreign currency exchange rates and expected future cash flows at amortized cost usingeach balance sheet date. The gain or loss arising from the effectivechange in fair value of royalty receivable is recognized in profit or loss. Royalty receivable is reduced by cash receipts and decreases with time. Since the contract is long term, the unwinding discount (to reflect time value of money) is recognized in interest method, less any identified impairment loss.income.
Available-for-sale financial assets
Available-for-sale financial assets are non-derivatives that are either designated or not classified as financial assets at fair value through profit or loss, loans and receivables or held-to-maturity investments.
At each balance sheet date subsequent to initial recognition, available-for-sale financial assets are measured at fair value. Changes in fair value are recognized initially in other comprehensive income and accumulated in equity, until the financial asset is disposed of or is determined to be impaired, at which time, the cumulative gain or loss previously recognized in equity is removed from equity and recognized in profit or loss (see accounting policy on impairment loss on financial assets below).
Available-for-sale equity investments that do not have a quoted market price in an active market and whose fair value cannot be reliably measured are measured at cost less any identified impairment losses at each balance sheet date subsequent to initial recognition (see accounting policy on impairment loss on financial assets below).
Impairment of financial assets
Financial assets are assessed for indicators of impairment at each balance sheet date. Financial assets are impaired where there is objective evidence that, as a result of one or more events that occurred after the initial recognition of the financial asset, the estimated future cash flows of the financial assets have been impacted.
For an available-for sale equity investment, a significant or prolonged decline in the fair value of that investment below its cost is considered to be objective evidence of impairment.
YANZHOU COAL MINING COMPANY LIMITED
NOTES TO THE CONSOLIDATED FINANCIAL STATEMENTS—(Continued)
4. SIGNIFICANT ACCOUNTING POLICIES—Continued
Financial instruments—Continued
Financial assets—Continued
Impairment of financial assets—Continued
For all other financial assets, objective evidence of impairment could include:
significant financial difficulty of the issuer or counterparty; or
default or delinquency in interest or principal payments; or
it becoming probable that the borrower will enter bankruptcy or financial re-organization.
For certain categories of financial asset, such as trade and bills receivables, assets that are assessed not to be impaired individually are subsequently assessed for impairment on a collective basis. Objective evidence of impairment for a portfolio of receivables could include the Group’s past experience of collecting payments and changes in national or local economic conditions that correlate with default on receivables.
YANZHOU COAL MINING COMPANY LIMITED
NOTES TO THE CONSOLIDATED FINANCIAL STATEMENTS—(Continued)
4. SIGNIFICANT ACCOUNTING POLICIES—Continued
Financial instruments—Continued
Financial assets—Continued
Impairment of financial assets—Continued
For financial assets carried at amortized cost, an impairment loss is recognized in profit or loss when there is objective evidence that the asset is impaired, and is measured as the difference between the asset’s carrying amount and the present value of the estimated future cash flows discounted at the original effective interest rate.
For financial assetsavailable-for-sale equity investments carried at cost, the amount of the impairment loss is measured as the difference between the asset’s carrying amount and the present value of the estimated future cash flows discounted at the current market rate of return for a similar financial asset. Such impairment loss will not be reversed in subsequent periods.
The carrying amount of the financial asset is reduced by the impairment loss directly for all financial assets with the exception of trade and bills receivables and other receivables, where the carrying amounts are reduced through the use of an allowance account. Changes in the carrying amount of the allowance account are recognized in profit or loss. When a trade and bills receivables and other receivables are considered uncollectible, it is written off against the allowance account. Subsequent recoveries of amounts previously written off are credited to profit or loss.
For financial assets measured at amortized cost, if, in a subsequent period, the amount of impairment loss decreases and the decrease can be related objectively to an event occurring after the impairment losses was recognized, the previously recognized impairment loss is reversed through profit or loss to the extent that the carrying amount of the asset at the date the impairment is reversed does not exceed what the amortized cost would have been had the impairment not been recognized.
Impairment losses on available-for-sale equity investments will not be reversed in profit or loss in subsequent periods. Any increase in fair value subsequent to impairment loss is recognized initially in other comprehensive income and accumulated in equity.
YANZHOU COAL MINING COMPANY LIMITED
NOTES TO THE CONSOLIDATED FINANCIAL STATEMENTS—(Continued)
4. SIGNIFICANT ACCOUNTING POLICIES—Continued
Financial instruments—Continued
Financial liabilities and equity
Financial liabilities and equity instruments issued by the Group are classified according to the substance of the contractual arrangements entered into and the definitions of a financial liability and an equity instrument.
An equity instrument is any contract that evidences a residual interest in the assets of the Group after deducting all of its liabilities.
YANZHOU COAL MINING COMPANY LIMITED
NOTES TO THE CONSOLIDATED FINANCIAL STATEMENTS—(Continued)
4. SIGNIFICANT ACCOUNTING POLICIES—Continued
Financial instruments—Continued
Financial liabilities and equity—Continued
Financial liabilities
The Group’s financial liabilities including bills and accounts payable and bills,payables, other payables, amounts due to Parent Company and its subsidiary companies, finance lease liabilities, guaranteed notes and bank and other borrowings are subsequently measured at amortized cost, using the effective interest method.method and financial liabilities at fair value through profit or loss.
Financial liabilities at fair value through profit or loss
Financial liabilities at fair value through profit or loss include financial liabilities held for trading and financial liabilities designated at initial recognition as at fair value through profit and loss. Financial liabilities are classified as held for trading if they are acquired for the purpose of selling in the near term.
Equity instruments
Equity instruments issued by the Company are recorded at the proceeds received, net of direct issue costs.
Derecognition
Financial assets are derecognized when the rights to receive cash flows from the assets expire or, the financial assets are transferred and the Group has transferred substantially all the risks and rewards of ownership of the financial assets. On derecognition of a financial asset, the difference between the asset’s carrying amount and the sum of the consideration received and receivable and the cumulative gain or loss that had been recognized directly in equity is recognized in profit or loss.
Financial liabilities are derecognized when the obligation specified in the relevant contract is discharged, cancelled or expires.expired. The difference between the carrying amount of the financial liability derecognized and the consideration paid and payable is recognized in profit or loss.
Accounting for derivative financial instruments and hedging activities
Derivatives are initially recognized at fair value at the date a derivative contract is entered into and are subsequently re-measured at their fair value. The method of recognizing the resulting gain or loss depends on whether the derivative is designated as a hedging instrument, and if so, the nature of the item being hedged. The Group designates certain derivatives as either: (i) hedges of the fair value of recognized assets or liabilities (fair value hedge); and (ii) hedges of highly probable forecast transactions (cash flow hedge).
YANZHOU COAL MINING COMPANY LIMITED
NOTES TO THE CONSOLIDATED FINANCIAL STATEMENTS—(Continued)
4. SIGNIFICANT ACCOUNTING POLICIES—Continued
Financial instruments—Continued
Financial liabilities and equity—Continued
Accounting for derivative financial instruments and hedging activities—Continued
The Group documents at the inception of the transaction the relationship between hedging instruments and hedged items, as well as its risk management objectives and strategy for undertaking various hedging transactions. The Group also documents its assessment, both at the inception of the hedge and on an ongoing basis, of whether the derivatives that are used in hedging transactions are highly effective in offsetting changes in fair values or cash flows of the hedged items.
The fair values of various derivative instruments used for hedging purposes are disclosed in note 36.38. The full fair value of a hedging derivative is classified as a non-current asset or liability when the remaining maturity of the hedged item is more than 12 months and as a current asset or liability when the remaining maturity of the hedged item is less than 12 months.
YANZHOU COAL MINING COMPANY LIMITED
NOTES TO THE CONSOLIDATED FINANCIAL STATEMENTS—(Continued)
4. SIGNIFICANT ACCOUNTING POLICIES—Continued
Financial instruments—Continued
Accounting for derivative financial instruments and hedging activities—Continued
(i) Fair value hedge
Changes in the fair value of derivatives that are designated and qualify as fair value hedges are recognized initially in consolidated income statement immediately, together with any changes in the fair value of the hedged asset or liability that are attributable to the hedged risk. To the extent that the derivative is not effective as a hedge, gains and losses are recognized in the consolidated income statement as gains or losses on derivative instruments.
(ii) Cash flow hedge
The effective portion of changes in the fair value of derivatives that are designated and qualify as cash flow hedges are recognized initially in other comprehensive income and accumulated in equity. The gain or loss relating to the ineffective portion is recognized immediately in the consolidated income statement.profit and loss. Amounts accumulated in equity are recognized in the consolidated income statementprofit and loss as the underlying hedged items are recognized.
Amounts previously recognized in other comprehensive income and accumulated in equity are reclassified to profit or loss in the periods when the hedged item is recognized in profit or loss.
When a hedging instrument expires or is sold, or when a hedge no longer meets the criteria for hedge accounting, any cumulative gain or loss existing in equity at that time remains in equity and is recognized when the forecast transaction is ultimately recognized in the consolidated income statement.profit and loss. When a forecast transaction is no longer expected to occur, the cumulative gain or loss that was reported in equity is immediately transferred to the consolidated income statement.profit and loss.
(iii)(ii) Derivatives that do not qualify for hedge accounting and those not designated as hedging instruments
Changes in the fair value of any derivative instruments that do not qualify for hedge accounting and those not designated as hedges are recognized immediately in the consolidated income statement.profit and loss.
YANZHOU COAL MINING COMPANY LIMITED
NOTES TO THE CONSOLIDATED FINANCIAL STATEMENTS—(Continued)
4. SIGNIFICANT ACCOUNTING POLICIES—Continued
Related Parties
For the purposes of these financial statements, a party is considered to be related to the Group if:
| (a) | A person, or a close member of that person’s family, is related to the group if that person: |
| (1) | has control or joint control over the |
| (2) | has |
| (3) | is a member of the |
Close members of the family of a person are those family members who may be expected to influence, or be influenced by, that person in their dealings with the entity.
| (b) | An entity is related to |
| (1) | The entity and the |
| (2) | One entity is an associate or joint venture of the other entity (or an associate or joint venture of a member of a group of which the other entity is a member); |
| (3) | Both entities are joint ventures of the same third party; |
| (4) | One entity is a joint venture of a third entity and the other entity is an associate of the |
| The entity |
| (6) | The entity is controlled or jointly controlled by a person identified in (a); or |
| (7) | A person identified in (a)(1) has significant influence over the entity or is a |
YANZHOU COAL MINING COMPANY LIMITED
NOTES TO THE CONSOLIDATED FINANCIAL STATEMENTS—(Continued)
5. ACCOUNTING JUDGEMENTS AND KEY SOURCES OF ESTIMATION UNCERTAINTY
In the application of the Group’s accounting policies, which are described in note 4, management is required to make judgements, estimates and assumptions about the carrying amounts of assets and liabilities that are not readily apparent from other sources. The estimates and associated assumptions are based on historical experience and other factors that are considered to be relevant. Actual results may differ from these estimates.
The estimates and underlying assumptions are reviewed on an ongoing basis. Revisions to accounting estimates are recognized in the period in which the estimate is revised if the revision affects only that period, or in the period of the revision and future periods if the revision affects both current and future periods.
Depreciation of property, plant and equipment
The cost of mining structures is depreciated using the unit of production method based on the estimated production volume for which the structure was designed. The management exercises their judgment in estimating the useful lives of the depreciable assets and the production volume of the mine. The estimated coal production volumes are updated at regular intervals and have taken into account recent production and technical information about each mine. These changes are considered a change in estimate for accounting purposes and are reflected on a prospective basis in related depreciation rates. Estimates of the production volume are inherently imprecise and represent only approximate amounts because of the subjective judgements involved in developing such information.
Amortization of assets
CoalMining reserves, coalmining resources and rail access rights are amortized on a straight line basis or unit of production basis over the shorter of their useful lives and the contractual period. The expensing of overburden removal costs is based on saleable coal production over estimated economically recoverable reserves. The useful lives are estimated on the basis of the total proven and probable reserves of the coal mine. Proven and probable coalmining reserve estimates are updated at regular intervals and have taken into account recent production and technical information about each mine.
Provision for land subsidence, restoration, rehabilitation and environmental costs
The provision is reviewed regularly to verify that it properly reflects the remaining obligation arising from the current and past mining activities. Provision for land subsidence, restoration, rehabilitation and environmental costs are determined by the management based on their best estimates of the current and future costs, latest government policies and past experiences.
Impairment of goodwill
Determining whether goodwill is impaired requires an estimation of the value in use of the cash-generating units to which goodwill has been allocated. The value in use calculation requires the Group to estimate the future cash flows expected to arise from the cash-generating unit and a suitable discount rate in order to calculate the present value. As at December 31, 2010,2012, the carrying amount of goodwill is RMB1,196,586,000 (2009: RMB1,305,345,000)RMB2,573,811,000 (2011: RMB1,866,037,000). During the year ended December 31, 2012, impairment loss on goodwill of RMB17,625,000 (2011: nil; 2010: nil) was recognised by the Group and details are set out in note 27.
YANZHOU COAL MINING COMPANY LIMITED
NOTES TO THE CONSOLIDATED FINANCIAL STATEMENTS—(Continued)
5. ACCOUNTING JUDGEMENTS AND KEY SOURCES OF ESTIMATION UNCERTAINTY—Continued
Impairment of goodwill—Continued
Cash flow projections during the budget period for each of the above units are based on the budgeted revenue and expected gross margins during the budget period and the raw materials price inflation during the budget period. Expected cash inflows/outflows have been determined based on past performance and management’s expectations for the market development.
YANZHOU COAL MINING COMPANY LIMITED
NOTES TO THE CONSOLIDATED FINANCIAL STATEMENTS—(Continued)
5. KEY SOURCES OF ESTIMATION UNCERTAINTY—Continued
Estimated impairment of property, plant and equipment
When there is an impairment indicator, the Group takes into consideration the estimation of future cash flows. The amount of the impairment loss is measured as the difference between the asset’s carrying amount and the present value of estimated future cash flows. Where the actual future cash flows are less than expected, a material impairment loss may arise. In estimating the future cash flows, the management have taken into account the recent production and technical advancement. As prices and cost levels change from year to year, the estimate of the future cash flow also changes. Notwithstanding the management has used all the available information to make their impairment assessment, inherent uncertainty exists on conditions of the mine and of the environment and actual written off may be higher than the amount estimated. As at December 31, 2010,2012, the carrying amounts of property, plant and equipment is approximately RMB19,874,615,000 (2009: RMB18,877,134,000)RMB39,503,103,000 (2011: RMB31,273,824,000). During the year ended December 31, 2010, RMB1,491,0002012, no property, plant and equipment was written off as expenses (2009: RMB14,199,000; 2008: nil)(2011: nil; 2010: RMB1,491,000). In addition, during the year ended December 31, 2010,2012, impairment loss on property, plant and equipment of RMB97,559,000RMB226,925,000 (2011: RMB281,994,000; 2010: RMB97,559,000) was recognized (2009: nil) by the Group and details of this impairment are set out in note 24.25.
In the process of applying the Group’s accounting policies, management has made the following accounting judgements:
Acquisitions
During the year, the Group acquired several subsidiaries and businesses as set out in notes 45 and 46. The Group determined whether the acquisitions are to be accounted for as acquisition of businesses or as acquisition of assets by reference to a number of factors including (i) whether the acquiree has relevant input, process or output; (ii) whether the acquire has planned principal activities or is pursuing a plan to produce output and will be able to obtain access to customers.
In addition, the management also made judgement to determine if the Group has taken control over the subsidiaries or assets acquired as from time to time, the registration of transfer of certain operating licences may not be changed immediately upon the payment of consideration.
YANZHOU COAL MINING COMPANY LIMITED
NOTES TO THE CONSOLIDATED FINANCIAL STATEMENTS—(Continued)
6. SEGMENT INFORMATION
The Group is engaged primarily in the coal mining business. The Group is also engaged in the coal railway transportation business. The Company does not currently have direct export rights in the PRC and all of its export sales is made through China National Coal Industry Import and Export Corporation (“National Coal Corporation”), Minmetals Trading Co., Ltd. (“Minmetals Trading”) or Shanxi Coal Imp. & Exp. Group Corp. (“Shanxi Coal Corporation”). The exploitation right of the Group’s foreign subsidiaries is not restricted. The final customer destination of the Company’s export sales is determined by the Company, National Coal Corporation, Minmetals Trading or Shanxi Coal Corporation. Certain of the Company’s subsidiaries and associates are engaged in trading and processing of mining machinery and the transportation business via rivers and lakes and financial services in the PRC. No separate segment information about these businesses is presented in these financial statements as the underlying gross sales, results and assets of these businesses, which are currently included in the coal mining business segment, are insignificant to the Group. Certain of the Company’s subsidiaries are engaged in production of methanol and other chemical products, and invest in heat and electricity.
Gross revenue disclosed below is same as the turnover.
For management purposes, the Group is currently organized into three operating divisions - coal mining, coal railway transportation and methanol, electricity and heat supply. These divisions are the basis on which the Group reports its segment information.
Principal activities are as follows:
Mining | - | Underground and open-cut mining, preparation and sales of coal and potash mineral exploration | ||||
Coal railway transportation | - | Provision of railway transportation services | ||||
Methanol, electricity and heat supply | - | Production and sales of methanol and electricity and related heat supply services |
YANZHOU COAL MINING COMPANY LIMITED
NOTES TO THE CONSOLIDATED FINANCIAL STATEMENTS—(Continued)
6. SEGMENT INFORMATION—Continued
The accounting policies of the reportable segments are the same as the Group’s accounting policies described in note 4. Segment profitresults represents the profit earned byresults of each segment without allocation of corporate expenses and directors’ emoluments, results of associates, interest income, interest expenses and income tax expenses. This is the measure reported to the chief operating decision maker for the purposes of resourceresources allocation and assessment of segment performance.
Segment information about these businesses is presented below:
INCOME STATEMENT
| For the year ended December 31, 2010 | For the year ended December 31, 2012 | |||||||||||||||||||||||||||||||||||||||||||
| Coal mining | Coal railway transportation | Methanol, electricity and heat supply | Unallocated | Eliminations | Consolidated | Mining | Coal railway transportation | Methanol, electricity and heat supply | Eliminations | Consolidated | ||||||||||||||||||||||||||||||||||
| RMB’000 | RMB’000 | RMB’000 | RMB’000 | RMB’000 | RMB’000 | RMB’000 | RMB’000 | RMB’000 | RMB’000 | RMB’000 | ||||||||||||||||||||||||||||||||||
GROSS REVENUE | ||||||||||||||||||||||||||||||||||||||||||||
External | 32,590,911 | 513,282 | 840,059 | — | — | 33,944,252 | 56,200,600 | 464,068 | 1,481,516 | — | 58,146,184 | |||||||||||||||||||||||||||||||||
Inter-segment | 339,355 | 36,051 | 455,259 | — | (830,665 | ) | — | 219,230 | 32,560 | 284,425 | (536,215 | ) | — | |||||||||||||||||||||||||||||||
|
|
|
|
| ||||||||||||||||||||||||||||||||||||||||
Total | 32,930,266 | 549,333 | 1,295,318 | — | (830,665 | ) | 33,944,252 | 56,419,830 | 496,628 | 1,765,941 | (536,215 | ) | 58,146,184 | |||||||||||||||||||||||||||||||
|
|
|
|
| ||||||||||||||||||||||||||||||||||||||||
Inter-segment revenue is charged at prices pre-determined by the relevant governmental authority.
| For the year ended December 31, 2010 | For the year ended December 31, 2012 | |||||||||||||||||||||||||||||||||||||||
| Coal mining | Coal railway transportation | Methanol, electricity and heat supply | Eliminations | Consolidated | Mining | Coal railway transportation | Methanol, electricity and heat supply | Eliminations | Consolidated | |||||||||||||||||||||||||||||||
| RMB’000 | RMB’000 | RMB’000 | RMB’000 | RMB’000 | RMB’000 | RMB’000 | RMB’000 | RMB’000 | RMB’000 | |||||||||||||||||||||||||||||||
RESULT | ||||||||||||||||||||||||||||||||||||||||
Segment results | 11,096,252 | 51,554 | (459,610 | ) | — | 10,688,196 | 7,168,026 | (52,848 | ) | 91,420 | — | 7,206,598 | ||||||||||||||||||||||||||||
|
|
|
|
| ||||||||||||||||||||||||||||||||||||
Unallocated corporate expenses | (473,502 | ) | (2,159,979 | ) | ||||||||||||||||||||||||||||||||||||
Unallocated corporate income | 2,669,925 | 1,987,137 | ||||||||||||||||||||||||||||||||||||||
Interest income | 187,189 | 722,336 | ||||||||||||||||||||||||||||||||||||||
Share of profit of associates | 2,102 | — | 6,768 | — | 8,870 | 33,552 | — | 108,434 | — | 141,986 | ||||||||||||||||||||||||||||||
Share of loss of jointly controlled entities | (103,217 | ) | — | — | — | (103,217 | ) | |||||||||||||||||||||||||||||||||
Interest expenses | (603,343 | ) | (1,448,679 | ) | ||||||||||||||||||||||||||||||||||||
| ||||||||||||||||||||||||||||||||||||||||
Profit before income taxes | 12,477,335 | 6,346,182 | ||||||||||||||||||||||||||||||||||||||
Income taxes | (3,171,043 | ) | (123,937 | ) | ||||||||||||||||||||||||||||||||||||
| ||||||||||||||||||||||||||||||||||||||||
Profit for the year | 9,306,292 | 6,222,245 | ||||||||||||||||||||||||||||||||||||||
| ||||||||||||||||||||||||||||||||||||||||
YANZHOU COAL MINING COMPANY LIMITED
NOTES TO THE CONSOLIDATED FINANCIAL STATEMENTS—(Continued)
6. SEGMENT INFORMATION—Continued
BALANCE SHEET
| At December 31, 2010 | At December 31, 2012 | |||||||||||||||||||||||||||||||
| Coal mining | Coal railway transportation | Methanol, electricity and heat supply | Consolidated | Mining | Coal railway transportation | Methanol, electricity and heat supply | Consolidated | |||||||||||||||||||||||||
| RMB’000 | RMB’000 | RMB’000 | RMB’000 | RMB’000 | RMB’000 | RMB’000 | RMB’000 | |||||||||||||||||||||||||
ASSETS | ||||||||||||||||||||||||||||||||
Segment assets | 57,600,041 | 637,184 | 5,083,532 | 63,320,757 | 98,803,732 | 558,152 | 5,300,584 | 104,662,468 | ||||||||||||||||||||||||
|
|
|
| |||||||||||||||||||||||||||||
Interests in associates | 127,102 | — | 947,856 | 1,074,958 | 192,081 | — | 2,432,195 | 2,624,276 | ||||||||||||||||||||||||
Interests in jointly controlled entities | 751 | — | — | 751 | 1,086,985 | — | — | 1,086,985 | ||||||||||||||||||||||||
Unallocated corporate assets | 8,359,398 | 14,328,594 | ||||||||||||||||||||||||||||||
| ||||||||||||||||||||||||||||||||
| 72,755,864 | 122,702,323 | |||||||||||||||||||||||||||||||
| ||||||||||||||||||||||||||||||||
LIABILITIES | ||||||||||||||||||||||||||||||||
Segment liabilities | 5,170,012 | 38,782 | 2,653,337 | 7,862,131 | 30,823,224 | 66,649 | 4,326,014 | 35,215,887 | ||||||||||||||||||||||||
Unallocated corporate liabilities | 27,455,282 | 38,395,238 | ||||||||||||||||||||||||||||||
| ||||||||||||||||||||||||||||||||
| 35,317,413 | 73,611,125 | |||||||||||||||||||||||||||||||
| ||||||||||||||||||||||||||||||||
OTHER INFORMATION
| For the year ended December 31, 2010 | For the year ended December 31, 2012 | |||||||||||||||||||||||||||||||||||||||||||
| Coal mining | Coal railway transportation | Methanol, electricity and heat supply | Unallocated | Corporate | Consolidated | Mining | Coal railway transportation | Methanol, electricity and heat supply | Corporate | Consolidated | ||||||||||||||||||||||||||||||||||
| RMB’000 | RMB’000 | RMB’000 | RMB’000 | RMB’000 | RMB’000 | RMB’000 | RMB’000 | RMB’000 | RMB’000 | RMB’000 | ||||||||||||||||||||||||||||||||||
Capital additions (note 1) | 3,297,996 | 34,498 | 452,838 | — | 2 | 3,785,334 | 19,170,069 | 33,835 | 1,605,265 | 70 | 20,809,239 | |||||||||||||||||||||||||||||||||
Investments in associates | 125,000 | — | — | — | — | 125,000 | 3,927 | — | 810,000 | — | 813,927 | |||||||||||||||||||||||||||||||||
Amortization of intangible assets | 341,003 | 5,014 | 3,638 | — | — | 349,655 | 1,175,548 | — | 2,047 | — | 1,177,595 | |||||||||||||||||||||||||||||||||
Release of prepaid lease payments | 9,760 | 5,372 | 2,826 | — | — | 17,958 | 9,778 | 5,372 | 3,213 | — | 18,363 | |||||||||||||||||||||||||||||||||
Provision for inventories | — | — | 4,411 | — | — | 4,411 | ||||||||||||||||||||||||||||||||||||||
Impairment loss on property, plant and equipment | — | — | 97,559 | — | — | 97,559 | 226,925 | — | — | — | 226,925 | |||||||||||||||||||||||||||||||||
Impairment loss on intangible assets | 417,214 | — | — | — | 417,214 | |||||||||||||||||||||||||||||||||||||||
Write-off on inventories | 140,883 | — | — | — | 140,883 | |||||||||||||||||||||||||||||||||||||||
Impairment loss on goodwill | 17,625 | — | — | — | 17,625 | |||||||||||||||||||||||||||||||||||||||
Depreciation of property, plant and equipment | 1,796,579 | 77,399 | 442,427 | — | 3,042 | 2,319,447 | 2,293,828 | 78,668 | 443,746 | 3,162 | 2,819,404 | |||||||||||||||||||||||||||||||||
Written off of property, plant and equipment | — | — | 1,491 | — | — | 1,491 | ||||||||||||||||||||||||||||||||||||||
Impairment losses reversed on accounts receivable and other receivables | (6,828 | ) | — | 1,905 | — | — | (4,923 | ) | ||||||||||||||||||||||||||||||||||||
Gain on disposal of a joint venture and subsidiaries | 117,928 | — | — | — | — | 117,928 | ||||||||||||||||||||||||||||||||||||||
Impairment losses (reversed) charged on accounts receivable and other receivables | 7,270 | — | (818 | ) | — | 6,452 | ||||||||||||||||||||||||||||||||||||||
|
|
|
|
| ||||||||||||||||||||||||||||||||||||||||
| Note 1: | Capital additions include those arising from the acquisition of |
YANZHOU COAL MINING COMPANY LIMITED
NOTES TO THE CONSOLIDATED FINANCIAL STATEMENTS—(Continued)
6. SEGMENT INFORMATION—Continued
INCOME STATEMENT
| For the year ended December 31, 2009 | For the year ended December 31, 2011 | |||||||||||||||||||||||||||||||||||||||||||
| Coal mining | Coal railway transportation | Methanol, electricity and heat supply | Unallocated | Eliminations | Consolidated | Mining | Coal railway transportation | Methanol, electricity and heat supply | Eliminations | Consolidated | ||||||||||||||||||||||||||||||||||
| RMB’000 | RMB’000 | RMB’000 | RMB’000 | RMB’000 | RMB’000 | RMB’000 | RMB’000 | RMB’000 | RMB’000 | RMB’000 | ||||||||||||||||||||||||||||||||||
GROSS REVENUE | ||||||||||||||||||||||||||||||||||||||||||||
External | 19,947,748 | 267,345 | 462,045 | — | — | 20,677,138 | 45,181,229 | 476,852 | 1,407,759 | — | 47,065,840 | |||||||||||||||||||||||||||||||||
Inter-segment | 169,153 | 61,507 | 474,946 | — | (705,606 | ) | — | 287,280 | 51,705 | 256,364 | (595,349 | ) | — | |||||||||||||||||||||||||||||||
|
|
|
|
| ||||||||||||||||||||||||||||||||||||||||
Total | 20,116,901 | 328,852 | 936,991 | — | (705,606 | ) | 20,677,138 | 45,468,509 | 528,557 | 1,664,123 | (595,349 | ) | 47,065,840 | |||||||||||||||||||||||||||||||
|
|
|
|
| ||||||||||||||||||||||||||||||||||||||||
Inter-segment revenue is charged at prices pre-determined by the relevant governmental authority.
| For the year ended December 31, 2009 | For the year ended December 31, 2011 | |||||||||||||||||||||||||||||||||||||||
| Coal mining | Coal railway transportation | Methanol, electricity and heat supply | Eliminations | Consolidated | Mining | Coal railway transportation | Methanol, electricity and heat supply | Eliminations | Consolidated | |||||||||||||||||||||||||||||||
| RMB’000 | RMB’000 | RMB’000 | RMB’000 | RMB’000 | RMB’000 | RMB’000 | RMB’000 | RMB’000 | RMB’000 | |||||||||||||||||||||||||||||||
RESULT | ||||||||||||||||||||||||||||||||||||||||
Segment results | 6,353,496 | (171,712 | ) | (277,320 | ) | — | 5,904,464 | 13,476,481 | 479 | (365,011 | ) | — | 13,111,949 | |||||||||||||||||||||||||||
|
|
|
|
| ||||||||||||||||||||||||||||||||||||
Unallocated corporate expenses | (473,221 | ) | (699,291 | ) | ||||||||||||||||||||||||||||||||||||
Unallocated corporate income | 2,288 | 520,986 | ||||||||||||||||||||||||||||||||||||||
Interest income | 187,604 | 357,708 | ||||||||||||||||||||||||||||||||||||||
Share of profit of an associate | — | — | 109,786 | — | 109,786 | |||||||||||||||||||||||||||||||||||
Share of profit of associates | 43,124 | — | 25,815 | — | 68,939 | |||||||||||||||||||||||||||||||||||
Interest expenses | (45,115 | ) | (839,305 | ) | ||||||||||||||||||||||||||||||||||||
| ||||||||||||||||||||||||||||||||||||||||
Profit before income taxes | 5,685,806 | 12,520,986 | ||||||||||||||||||||||||||||||||||||||
Income taxes | (1,553,312 | ) | (3,545,379 | ) | ||||||||||||||||||||||||||||||||||||
| ||||||||||||||||||||||||||||||||||||||||
Profit for the year | 4,132,494 | 8,975,607 | ||||||||||||||||||||||||||||||||||||||
| ||||||||||||||||||||||||||||||||||||||||
YANZHOU COAL MINING COMPANY LIMITED
NOTES TO THE CONSOLIDATED FINANCIAL STATEMENTS—(Continued)
6. SEGMENT INFORMATION—Continued
BALANCE SHEET
| At December 31, 2009 | At December 31, 2011 | |||||||||||||||||||||||||||||||
| Coal mining | Coal railway transportation | Methanol, electricity and heat supply | Consolidated | Mining | Coal railway transportation | Methanol, electricity and heat supply | Consolidated | |||||||||||||||||||||||||
| RMB’000 | RMB’000 | RMB’000 | RMB’000 | RMB’000 | RMB’000 | RMB’000 | RMB’000 | |||||||||||||||||||||||||
ASSETS | ||||||||||||||||||||||||||||||||
Segment assets | 46,812,323 | 690,172 | 4,105,745 | 51,608,240 | 80,411,147 | 604,824 | 4,474,098 | 85,490,069 | ||||||||||||||||||||||||
|
|
|
| |||||||||||||||||||||||||||||
Interest in an associate | — | — | 939,981 | 939,981 | ||||||||||||||||||||||||||||
Interests in associates | 170,226 | — | 1,513,671 | 1,683,897 | ||||||||||||||||||||||||||||
Interests in jointly controlled entities | 1,257 | — | — | 1,257 | 19,453 | — | — | 19,453 | ||||||||||||||||||||||||
Unallocated corporate assets | 9,883,113 | 9,958,172 | ||||||||||||||||||||||||||||||
| ||||||||||||||||||||||||||||||||
| 62,432,591 | 97,151,591 | |||||||||||||||||||||||||||||||
| ||||||||||||||||||||||||||||||||
LIABILITIES | ||||||||||||||||||||||||||||||||
Segment liabilities | 5,358,455 | 85,695 | 2,005,549 | 7,449,699 | 23,026,520 | 72,476 | 2,857,624 | 25,956,620 | ||||||||||||||||||||||||
|
|
|
| |||||||||||||||||||||||||||||
Unallocated corporate liabilities | 25,728,599 | 27,869,921 | ||||||||||||||||||||||||||||||
| ||||||||||||||||||||||||||||||||
| 33,178,298 | 53,826,541 | |||||||||||||||||||||||||||||||
| ||||||||||||||||||||||||||||||||
OTHER INFORMATION
| For the year ended December 31, 2009 | For the year ended December 31, 2011 | |||||||||||||||||||||||||||||||||||||||||||||||
| Coal mining | Coal railway transportation | Methanol, electricity and heat supply | Unallocated | Corporate | Consolidated | Mining | Coal railway transportation | Methanol, electricity and heat supply | Unallocated | Corporate | Consolidated | |||||||||||||||||||||||||||||||||||||
| RMB’000 | RMB’000 | RMB’000 | RMB’000 | RMB’000 | RMB’000 | RMB’000 | RMB’000 | RMB’000 | RMB’000 | RMB’000 | RMB’000 | |||||||||||||||||||||||||||||||||||||
Capital additions (note 1) | 24,086,467 | 11,401 | 1,219,970 | — | 6,954 | 25,324,792 | 22,736,499 | 40,890 | 555,250 | — | 3,790 | 23,336,429 | ||||||||||||||||||||||||||||||||||||
Investments in jointly controlled entities | 1,257 | — | — | — | — | 1,257 | ||||||||||||||||||||||||||||||||||||||||||
Investments in associates | 540,000 | — | — | — | — | 540,000 | ||||||||||||||||||||||||||||||||||||||||||
Amortization of intangible assets | 44,274 | — | 4 | — | — | 44,278 | 717,709 | 252 | 2,047 | — | — | 720,008 | ||||||||||||||||||||||||||||||||||||
Release of prepaid lease payments | 9,606 | 5,372 | 2,049 | — | — | 17,027 | 10,432 | 5,372 | 3,214 | — | — | 19,018 | ||||||||||||||||||||||||||||||||||||
Impairment loss on property, plant and equipment | — | — | 281,994 | — | — | 281,994 | ||||||||||||||||||||||||||||||||||||||||||
Depreciation of property, plant and equipment | 1,409,507 | 86,251 | 295,321 | — | 2,199 | 1,793,278 | 1,711,257 | 73,885 | 477,872 | — | 3,003 | 2,266,017 | ||||||||||||||||||||||||||||||||||||
Written off of property, plant and equipment | 13,609 | — | 590 | — | — | 14,199 | ||||||||||||||||||||||||||||||||||||||||||
Impairment losses reversed on accounts receivable and other receivables | (14,222 | ) | — | 588 | — | — | (13,634 | ) | ||||||||||||||||||||||||||||||||||||||||
Impairment losses (reversed) charged on accounts receivable and other receivables | (789 | ) | — | 688 | — | — | (101 | ) | ||||||||||||||||||||||||||||||||||||||||
|
|
|
|
|
| |||||||||||||||||||||||||||||||||||||||||||
| Note 1: | Capital additions include | |
YANZHOU COAL MINING COMPANY LIMITED
NOTES TO THE CONSOLIDATED FINANCIAL STATEMENTS—(Continued)
6. SEGMENT INFORMATION—Continued
INCOME STATEMENT
| For the year ended December 31, 2008 | For the year ended December 31, 2010 | |||||||||||||||||||||||||||||||||||||||||||
| Coal mining | Coal railway transportation | Methanol, electricity and heat supply | Unallocated | Eliminations | Consolidated | Mining | Coal railway transportation | Methanol, electricity and heat supply | Eliminations | Consolidated | ||||||||||||||||||||||||||||||||||
| RMB’000 | RMB’000 | RMB’000 | RMB’000 | RMB’000 | RMB’000 | RMB’000 | RMB’000 | RMB’000 | RMB’000 | RMB’000 | ||||||||||||||||||||||||||||||||||
GROSS REVENUE | ||||||||||||||||||||||||||||||||||||||||||||
External | 24,933,349 | 255,713 | 98,361 | — | — | 25,287,423 | 32,590,911 | 513,282 | 840,059 | — | 33,944,252 | |||||||||||||||||||||||||||||||||
Inter-segment | 131,655 | 88,458 | — | — | (220,113 | ) | — | 339,355 | 36,051 | 455,259 | (830,665 | ) | — | |||||||||||||||||||||||||||||||
|
|
|
|
| ||||||||||||||||||||||||||||||||||||||||
Total | 25,065,004 | 344,171 | 98,361 | — | (220,113 | ) | 25,287,423 | 32,930,266 | 549,333 | 1,295,318 | (830,665 | ) | 33,944,252 | |||||||||||||||||||||||||||||||
|
|
|
|
| ||||||||||||||||||||||||||||||||||||||||
Inter-segment revenue is charged at prices pre-determined by the relevant governmental authority.
| For the year ended December 31, 2008 | For the year ended December 31, 2010 | |||||||||||||||||||||||||||||||||||||||
| Coal mining | Coal railway transportation | Methanol, electricity and heat supply | Eliminations | Consolidated | Mining | Coal railway transportation | Methanol, electricity and heat supply | Eliminations | Consolidated | |||||||||||||||||||||||||||||||
| RMB’000 | RMB’000 | RMB’000 | RMB’000 | RMB’000 | RMB’000 | RMB’000 | RMB’000 | RMB’000 | RMB’000 | |||||||||||||||||||||||||||||||
RESULT | ||||||||||||||||||||||||||||||||||||||||
Segment results | 9,678,304 | (91,781 | ) | (185,116 | ) | — | 9,401,407 | 11,096,252 | 51,554 | (459,610 | ) | — | 10,688,196 | |||||||||||||||||||||||||||
|
|
|
|
| ||||||||||||||||||||||||||||||||||||
Unallocated corporate expenses | (580,843 | ) | (473,502 | ) | ||||||||||||||||||||||||||||||||||||
Unallocated corporate income | 7,401 | 2,669,925 | ||||||||||||||||||||||||||||||||||||||
Interest income | 142,990 | 187,189 | ||||||||||||||||||||||||||||||||||||||
Share of loss of an associate | — | — | (67,367 | ) | — | (67,367 | ) | |||||||||||||||||||||||||||||||||
Share of profit of associates | 2,102 | — | 6,768 | — | 8,870 | |||||||||||||||||||||||||||||||||||
Interest expenses | (38,360 | ) | (603,343 | ) | ||||||||||||||||||||||||||||||||||||
| ||||||||||||||||||||||||||||||||||||||||
Profit before income taxes | 8,865,228 | 12,477,335 | ||||||||||||||||||||||||||||||||||||||
Income taxes | (2,385,617 | ) | (3,171,043 | ) | ||||||||||||||||||||||||||||||||||||
| ||||||||||||||||||||||||||||||||||||||||
Profit for the year | 6,479,611 | 9,306,292 | ||||||||||||||||||||||||||||||||||||||
| ||||||||||||||||||||||||||||||||||||||||
YANZHOU COAL MINING COMPANY LIMITED
NOTES TO THE CONSOLIDATED FINANCIAL STATEMENTS—(Continued)
6. SEGMENT INFORMATION—Continued
BALANCE SHEET
| At December 31, 2010 | ||||||||||||||||
| Mining | Coal railway transportation | Methanol, electricity and heat supply | Consolidated | |||||||||||||
| RMB’000 | RMB’000 | RMB’000 | RMB’000 | |||||||||||||
ASSETS | ||||||||||||||||
Segment assets | 57,600,041 | 637,184 | 5,083,532 | 63,320,757 | ||||||||||||
|
|
|
|
|
|
|
| |||||||||
Interest in an associate | 127,102 | — | 947,856 | 1,074,958 | ||||||||||||
Interests in jointly controlled entities | 751 | — | — | 751 | ||||||||||||
Unallocated corporate assets | 8,359,398 | |||||||||||||||
|
| |||||||||||||||
| 72,755,864 | ||||||||||||||||
|
| |||||||||||||||
LIABILITIES | ||||||||||||||||
Segment liabilities | 5,170,012 | 38,782 | 2,653,337 | 7,862,131 | ||||||||||||
|
|
|
|
|
|
|
| |||||||||
Unallocated corporate liabilities | 27,455,282 | |||||||||||||||
|
| |||||||||||||||
| 35,317,413 | ||||||||||||||||
|
| |||||||||||||||
OTHER INFORMATION
| For the year ended December 31, 2008 | For the year ended December 31, 2010 | |||||||||||||||||||||||||||||||||||||||||||||||
| Coal mining | Coal railway transportation | Methanol, electricity and heat supply | Unallocated | Corporate | Consolidated | Mining | Coal railway transportation | Methanol, electricity and heat supply | Unallocated | Corporate | Consolidated | |||||||||||||||||||||||||||||||||||||
| RMB’000 | RMB’000 | RMB’000 | RMB’000 | RMB’000 | RMB’000 | RMB’000 | RMB’000 | RMB’000 | RMB’000 | RMB’000 | RMB’000 | |||||||||||||||||||||||||||||||||||||
Capital additions | 1,925,294 | 29,234 | 925,084 | — | 2,105 | 2,881,717 | ||||||||||||||||||||||||||||||||||||||||||
Capital additions (note 1) | 3,297,996 | 34,498 | 452,838 | — | 2 | 3,785,334 | ||||||||||||||||||||||||||||||||||||||||||
Investments in associates | 125,000 | — | — | — | — | 125,000 | ||||||||||||||||||||||||||||||||||||||||||
Amortization of intangible assets | 35,652 | — | — | — | — | 35,652 | 341,003 | 5,014 | 3,638 | — | — | 349,655 | ||||||||||||||||||||||||||||||||||||
Release of prepaid lease payments | 9,379 | 5,372 | 358 | — | — | 15,109 | 9,760 | 5,372 | 2,826 | — | — | 17,958 | ||||||||||||||||||||||||||||||||||||
Provision for inventories | — | — | 4,411 | — | — | 4,411 | ||||||||||||||||||||||||||||||||||||||||||
Impairment loss on property, plant and equipment | — | — | 97,559 | — | — | 97,559 | ||||||||||||||||||||||||||||||||||||||||||
Depreciation of property, plant and equipment | 1,009,365 | 79,912 | 49,159 | — | 2,373 | 1,140,809 | 1,903,758 | 77,399 | 442,427 | — | 3,042 | 2,426,626 | ||||||||||||||||||||||||||||||||||||
Gain on disposal of property, plant and equipment | (12,317 | ) | — | — | — | — | (12,317 | ) | ||||||||||||||||||||||||||||||||||||||||
Impairment losses reversed on accounts receivable and other receivables | (4,369 | ) | — | — | — | — | (4,369 | ) | ||||||||||||||||||||||||||||||||||||||||
Written off of property, plant and equipment | — | — | 1,491 | — | — | 1,491 | ||||||||||||||||||||||||||||||||||||||||||
Impairment losses (reversed) charged on accounts receivable and other receivables | (6,828 | ) | — | 1,905 | — | — | (4,923 | ) | ||||||||||||||||||||||||||||||||||||||||
Gain on disposal of a joint venture and subsidiaries | 117,928 | — | — | — | — | 117,928 | ||||||||||||||||||||||||||||||||||||||||||
|
|
|
|
|
| |||||||||||||||||||||||||||||||||||||||||||
| Note 1: | Capital additions include those arising from the acquisition of three subsidiaries during the year. |
YANZHOU COAL MINING COMPANY LIMITED
NOTES TO THE CONSOLIDATED FINANCIAL STATEMENTS—(Continued)
6. SEGMENT INFORMATION—Continued
GEOGRAPHICAL INFORMATION
The following table sets out the geographical information. The geographical location of sales to external customers is based on the location at which the services were provided or the goods delivered. The geographical location of the specified non-current assets is based on the physical location of the asset, in the case of property, plant and equipment, the location of the operation to which they are allocated, in the case of intangible assets and goodwill, and the location of operations, in the case of interests in associates and jointly controlled entities.
The geographical information of revenue are as follows:
| Revenue from external customers | ||||||||||||
| For the year ended December 31, | ||||||||||||
| 2012 | 2011 | 2010 | ||||||||||
| RMB’000 | RMB’000 | RMB’000 | ||||||||||
The PRC (place of domicile) | 48,518,837 | 38,301,175 | 28,633,685 | |||||||||
Australia | 2,297,615 | 255,206 | 115,227 | |||||||||
Others | 7,329,732 | 8,509,459 | 5,195,340 | |||||||||
|
|
|
|
|
| |||||||
Total | 58,146,184 | 47,065,840 | 33,944,252 | |||||||||
|
|
|
|
|
| |||||||
The geographical information of specified non-current assets are as follows:
| Specified non-current assets | ||||||||||||
| At December 31, | ||||||||||||
| 2012 | 2011 | 2010 | ||||||||||
| RMB’000 | RMB’000 | RMB’000 | ||||||||||
The PRC (place of domicile) | 36,991,705 | 31,130,104 | 17,412,174 | |||||||||
Australia | 41,293,671 | 28,986,924 | 25,095,982 | |||||||||
Canada | 1,832,719 | 1,645,227 | — | |||||||||
|
|
|
|
|
| |||||||
Total non-current assets | 80,118,095 | 61,762,255 | 42,508,156 | |||||||||
|
|
|
|
|
| |||||||
For the year ended December 31, 2012, the revenue from mining segment amounted to RMB56,200,600,000 (2011: RMB45,181,229,000; 2010: RMB32,590,911,000) which including sales to the Group’s largest customer located in the PRC of approximately RMB3,651,630,000 (2011: RMB3,854,540,000; 2010: RMB4,443,729,000). As at December 31, 2012, accounts receivable from this customer accounted for approximately 0% (2011: 0%; 2010: 0%) of the Group’s total accounts receivable.
7. NET SALES OF COAL
| Year ended December 31, | ||||||||||||
| 2012 | 2011 | 2010 | ||||||||||
| RMB’000 | RMB’000 | RMB’000 | ||||||||||
Coal sold in the PRC, gross | 46,573,253 | 36,416,565 | 27,280,344 | |||||||||
Less: Transportation costs | (281,816 | ) | (311,708 | ) | (316,452 | ) | ||||||
|
|
|
|
|
| |||||||
Coal sold in the PRC, net | 46,291,437 | 36,104,857 | 26,963,892 | |||||||||
|
|
|
|
|
| |||||||
Coal sold outside the PRC, gross | 9,627,347 | 8,764,664 | 5,310,567 | |||||||||
Less: Transportation costs | (1,822,409 | ) | (936,560 | ) | (844,018 | ) | ||||||
|
|
|
|
|
| |||||||
Coal sold outside the PRC, net | 7,804,938 | 7,828,104 | 4,466,549 | |||||||||
|
|
|
|
|
| |||||||
Net sales of coal | 54,096,375 | 43,932,961 | 31,430,441 | |||||||||
|
|
|
|
|
| |||||||
YANZHOU COAL MINING COMPANY LIMITED
NOTES TO THE CONSOLIDATED FINANCIAL STATEMENTS—(Continued)
6. SEGMENT INFORMATION—Continued
The geographical information of sales are as follows:
| Revenue from external customers | ||||||||||||
| For the year ended December 31, | ||||||||||||
| 2010 | 2009 | 2008 | ||||||||||
| RMB’000 | RMB’000 | RMB’000 | ||||||||||
The PRC (place of domicile) | 28,633,685 | 19,633,977 | 23,418,886 | |||||||||
Australia | 115,227 | 45,121 | 16,346 | |||||||||
Others | 5,195,340 | 998,040 | 1,852,191 | |||||||||
Total | 33,944,252 | 20,677,138 | 25,287,423 | |||||||||
The geographical information of specified non-current assets are as follows:
| Specified non-current assets | ||||||||
| At December 31, | ||||||||
| 2010 | 2009 | |||||||
| RMB’000 | RMB’000 | |||||||
The PRC (place of domicile) | 17,412,174 | 17,347,369 | ||||||
Australia | 25,095,982 | 23,334,361 | ||||||
Total non-current assets | 42,508,156 | 40,681,730 | ||||||
For the year ended December 31, 2010, the revenue from coal mining segment amounted to RMB32,590,911,000 (2009: RMB19,947,748,000; 2008: RMB24,933,349,000) which including sales to the Group’s largest customer located in the PRC of approximately RMB4,443,729,000 (2009: RMB3,122,684,000; 2008: RMB4,413,948,000). As at December 31, 2010, accounts receivable from this customer accounted for approximately 0% (2009: 0%) of the Group’s total accounts receivable. Other than this customer, there is no other customer whose sales accounted for 10% or more of the Group’s total revenue.
7. NET SALES OF COALCOAL—Continued
| Year ended December 31, | ||||||||||||
| 2010 | 2009 | 2008 | ||||||||||
| RMB’000 | RMB’000 | RMB’000 | ||||||||||
Coal sold in the PRC, gross | 27,280,344 | 18,903,375 | 23,033,777 | |||||||||
Less: Transportation costs | 316,452 | 305,110 | 356,517 | |||||||||
Coal sold in the PRC, net | 26,963,892 | 18,598,265 | 22,677,260 | |||||||||
Coal sold outside the PRC, gross | 5,310,567 | 1,044,373 | 1,899,572 | |||||||||
Less: Transportation costs | 844,018 | 98,201 | 152,195 | |||||||||
Coal sold outside the PRC, net | 4,466,549 | 946,172 | 1,747,377 | |||||||||
Net sales of coal | 31,430,441 | 19,544,437 | 24,424,637 | |||||||||
Net sales of coal represent the invoiced value of coal sold and are net of returns, discounts and transportation costs if the invoiced value includes transportation costs to the customers.
YANZHOU COAL MINING COMPANY LIMITED
NOTES TO THE CONSOLIDATED FINANCIAL STATEMENTS—(Continued)
8. COST OF SALES AND SERVICE PROVIDED
| Year ended December 31, | Year ended December 31, | |||||||||||||||||||||||
| 2010 | 2009 | 2008 | 2012 | 2011 | 2010 | |||||||||||||||||||
| RMB’000 | RMB’000 | RMB’000 | RMB’000 | RMB’000 | RMB’000 | |||||||||||||||||||
Materials | 2,017,681 | 1,482,653 | 1,616,865 | 3,162,130 | 2,541,192 | 2,017,681 | ||||||||||||||||||
Wages and employee benefits | 4,695,000 | 3,281,578 | 2,624,821 | 7,282,018 | 5,846,108 | 4,695,000 | ||||||||||||||||||
Electricity | 223,639 | 500,518 | 346,401 | 699,648 | 520,890 | 223,639 | ||||||||||||||||||
Depreciation | 1,462,706 | 1,286,265 | 907,218 | 2,057,092 | 1,398,711 | 1,462,706 | ||||||||||||||||||
Land subsidence, restoration, rehabilitation and environmental costs | 1,545,302 | 1,738,103 | 3,279,503 | 1,781,267 | 1,720,740 | 1,545,302 | ||||||||||||||||||
Annual fee and amortization of mining rights (note 23) | 481,711 | 181,344 | 170,793 | |||||||||||||||||||||
Environmental management expenses | 129,235 | — | — | |||||||||||||||||||||
Annual fee and amortization of mining rights (note 24) | 1,305,410 | 848,615 | 481,711 | |||||||||||||||||||||
Transportation costs | 76,171 | 86,618 | 131,301 | 80,093 | 73,560 | 76,171 | ||||||||||||||||||
Cost of traded coal | 3,955,603 | 1,077,538 | 1,810,342 | 21,522,897 | 9,548,869 | 3,955,603 | ||||||||||||||||||
Business tax and surcharges | 505,491 | 419,459 | 388,878 | 599,784 | 579,782 | 505,491 | ||||||||||||||||||
Others | 1,838,019 | 535,915 | 925,009 | 3,341,966 | 2,646,827 | 1,838,019 | ||||||||||||||||||
|
|
| ||||||||||||||||||||||
| 16,801,323 | 10,589,991 | 12,201,131 | 41,961,540 | 25,725,294 | 16,801,323 | |||||||||||||||||||
|
|
| ||||||||||||||||||||||
9. SELLING, GENERAL AND ADMINISTRATIVE EXPENSES
| Year ended December 31, | Year ended December 31, | |||||||||||||||||||||||
| 2010 | 2009 | 2008 | 2012 | 2011 | 2010 | |||||||||||||||||||
| RMB’000 | RMB’000 | RMB’000 | RMB’000 | RMB’000 | RMB’000 | |||||||||||||||||||
Wages and employee benefits | 1,347,221 | 1,402,920 | 1,374,698 | 1,749,759 | 1,703,713 | 1,347,221 | ||||||||||||||||||
Additional medical insurance | 67,420 | 20,919 | 53,068 | 80,855 | 78,285 | 67,420 | ||||||||||||||||||
Staff training costs | 65,097 | 35,398 | 24,412 | 7,630 | 53,682 | 65,097 | ||||||||||||||||||
Depreciation | 298,895 | 168,334 | 114,451 | 343,133 | 230,542 | 298,895 | ||||||||||||||||||
Distribution charges | 835,900 | 148,580 | 103,209 | 1,292,216 | 1,078,107 | 835,900 | ||||||||||||||||||
Resource compensation fees (note) | 226,578 | 177,842 | 159,938 | 248,377 | 263,238 | 226,578 | ||||||||||||||||||
Repairs and maintenance | 614,173 | 474,233 | 424,751 | 693,380 | 609,211 | 614,173 | ||||||||||||||||||
Research and development | 70,606 | 46,321 | 106,516 | 62,406 | 119,234 | 70,606 | ||||||||||||||||||
Freight charges | 24,540 | 28,556 | 20,247 | 34,800 | 29,246 | 24,540 | ||||||||||||||||||
Property, plant and equipment written off | 1,491 | 14,199 | — | — | — | 1,491 | ||||||||||||||||||
Impairment loss on property, plant and equipment | 97,559 | — | — | 226,925 | 281,994 | 97,559 | ||||||||||||||||||
Loss on disposal of property, plant and equipment | 16,937 | 11,252 | — | — | 108,627 | 16,937 | ||||||||||||||||||
Provision for bad debt | 10,627 | 1,195 | 1,905 | |||||||||||||||||||||
Impairment loss on intangible assets | 417,214 | — | — | |||||||||||||||||||||
Impairment loss on goodwill | 17,625 | — | — | |||||||||||||||||||||
Impairment loss on inventories | 140,883 | — | 4,411 | |||||||||||||||||||||
Legal and professional fees | 71,152 | 88,320 | 76,328 | 269,155 | 94,148 | 71,152 | ||||||||||||||||||
Social welfare and insurance | 135,341 | 101,693 | 138,264 | 207,150 | 173,349 | 135,341 | ||||||||||||||||||
Utilities relating to administrative buildings | 368,063 | 239,439 | 147,737 | 139,942 | 175,209 | 368,063 | ||||||||||||||||||
Environmental protection | 110,254 | 82,426 | 48,028 | 46,022 | 83,690 | 110,254 | ||||||||||||||||||
Travelling, entertainment and promotion | 98,709 | 79,734 | 80,109 | 169,062 | 188,087 | 98,709 | ||||||||||||||||||
Foreign exchange losses | — | — | 328,858 | |||||||||||||||||||||
Coal price adjustment fund | 289,652 | 266,876 | 264,815 | 403,632 | 367,038 | 289,652 | ||||||||||||||||||
Bonus payments | — | 67,842 | 49,977 | 11,050 | 6,409 | — | ||||||||||||||||||
Other sundry taxes | 397,853 | 253,583 | 102,810 | |||||||||||||||||||||
Others | 354,316 | 365,357 | 316,625 | 1,017,940 | 671,616 | 244,728 | ||||||||||||||||||
|
|
| ||||||||||||||||||||||
| 5,093,904 | 3,820,241 | 3,832,031 | 7,987,636 | 6,570,203 | 5,093,442 | |||||||||||||||||||
|
|
| ||||||||||||||||||||||
| Note: | In accordance with the relevant regulations, the Group pays resource compensation fees (effectively a government levy) to the Ministry of Geology and Mineral Resources at the rate of 1% on the sales value of raw coal. |
YANZHOU COAL MINING COMPANY LIMITED
NOTES TO THE CONSOLIDATED FINANCIAL STATEMENTS—(Continued)
10. OTHER INCOME
| Year ended December 31, | Year ended December 31, | |||||||||||||||||||||||
| 2010 | 2009 | 2008 | 2012 | 2011 | 2010 | |||||||||||||||||||
| RMB’000 | RMB’000 | RMB’000 | RMB’000 | RMB’000 | RMB’000 | |||||||||||||||||||
Dividend income | 4,504 | 2,288 | 7,401 | 3,702 | 2,433 | 4,504 | ||||||||||||||||||
Gain on sales of auxiliary materials | 22,820 | 25,769 | 37,762 | 32,300 | 20,751 | 22,820 | ||||||||||||||||||
Government grants | 43,273 | 29,839 | 3,500 | 72,867 | 29,431 | 43,273 | ||||||||||||||||||
Interest income from bank deposits | 187,189 | 187,604 | 142,990 | |||||||||||||||||||||
Interest income from entrusted loan | — | — | 132,230 | |||||||||||||||||||||
Interest income | 722,336 | 357,708 | 187,189 | |||||||||||||||||||||
Exchange gain, net | 2,665,421 | 46,151 | — | 714,166 | 518,553 | 2,665,421 | ||||||||||||||||||
Gain on disposal of a joint venture and subsidiaries | 117,928 | — | — | — | — | 117,928 | ||||||||||||||||||
Bargain purchase (note 46) | 1,269,269 | — | — | |||||||||||||||||||||
Others | 66,946 | 19,368 | 27,610 | 115,805 | 146,889 | 66,946 | ||||||||||||||||||
|
|
| ||||||||||||||||||||||
| 3,108,081 | 311,019 | 351,493 | 2,930,445 | 1,075,765 | 3,108,081 | |||||||||||||||||||
|
|
| ||||||||||||||||||||||
The above dividend income is from listed investments.
11. INTEREST EXPENSEEXPENSES
| Year ended December 31, | Year ended December 31, | |||||||||||||||||||||||
| 2010 | 2009 | 2008 | 2012 | 2011 | 2010 | |||||||||||||||||||
| RMB’000 | RMB’000 | RMB’000 | RMB’000 | RMB’000 | RMB’000 | |||||||||||||||||||
Interest expenses on: | ||||||||||||||||||||||||
- bank borrowings wholly repayable within 5 years | 594,679 | 18,838 | 20,537 | |||||||||||||||||||||
- bank borrowings not wholly repayable within 5 years | 5,369 | 11,396 | 15,899 | |||||||||||||||||||||
- bank and other borrowings wholly repayable within 5 years | 1,453,459 | 804,700 | 594,679 | |||||||||||||||||||||
- bank and other borrowings not wholly repayable within 5 years | 88,550 | 9,675 | 5,369 | |||||||||||||||||||||
- bills receivable discounted without recourse | 2,695 | 13,665 | 75 | 2,367 | 24,930 | 2,695 | ||||||||||||||||||
Deemed interest expenses in respect of acquisition of Jining III | 600 | 1,216 | 1,849 | — | — | 600 | ||||||||||||||||||
|
|
| ||||||||||||||||||||||
| 603,343 | 45,115 | 38,360 | 1,544,376 | 839,305 | 603,343 | |||||||||||||||||||
Less: interest expenses capitalized into construction in progress | (95,697 | ) | — | — | ||||||||||||||||||||
|
|
| ||||||||||||||||||||||
| 1,448,679 | 839,305 | 603,343 | ||||||||||||||||||||||
|
|
| ||||||||||||||||||||||
12. INCOME TAXES
| Year ended December 31, | Year ended December 31, | |||||||||||||||||||||||
| 2010 | 2009 | 2008 | 2012 | 2011 | 2010 | |||||||||||||||||||
| RMB’000 | RMB’000 | RMB’000 | RMB’000 | RMB’000 | RMB’000 | |||||||||||||||||||
Income taxes: | ||||||||||||||||||||||||
Current taxes | 2,467,741 | 1,771,674 | 2,351,759 | 1,328,624 | 3,176,627 | 2,467,741 | ||||||||||||||||||
Under provision in prior years | 10,085 | 42,221 | 265,390 | 142,957 | 20,174 | 10,085 | ||||||||||||||||||
|
|
| ||||||||||||||||||||||
| 2,477,826 | 1,813,895 | 2,617,149 | 1,471,581 | 3,196,801 | 2,477,826 | |||||||||||||||||||
Deferred tax charge (note 38) | 693,217 | (260,583 | ) | (231,532 | ) | |||||||||||||||||||
Deferred taxes (note 41) | ||||||||||||||||||||||||
Australian Minerals Resources Rent Tax | (1,550,277 | ) | — | — | ||||||||||||||||||||
Others | 202,633 | 348,578 | 693,217 | |||||||||||||||||||||
|
|
| ||||||||||||||||||||||
| 3,171,043 | 1,553,312 | 2,385,617 | 123,937 | 3,545,379 | 3,171,043 | |||||||||||||||||||
|
|
| ||||||||||||||||||||||
The Company and its subsidiaries in the PRC are subject to a standard income tax rate of 25% on its taxable income (2009:(2011: 25%; 2008:2010: 25%).
Taxation arising in other jurisdictions is calculated at the rates prevailing in the relevant jurisdictions.
YANZHOU COAL MINING COMPANY LIMITED
NOTES TO THE CONSOLIDATED FINANCIAL STATEMENTS—(Continued)
12. INCOME TAXES—Continued
The Australian Minerals Resources Rent Tax (“MRRT”) legislation was enacted on March 19, 2012 and effective from July 1, 2012. According to the relevant provisions of the MRRT laws, subsidiaries in Australia are required to determine the starting base allowance on the balance sheet. Book value or market value approach can be selected in calculating the starting base and subsequently amortize within the prescribed useful life.
Market value approach was selected for mines in Australia. Under the market value approach, base value is determined based on market value of the coal mines on May 1, 2010 and amortize base on the shorter of the life of mining project, mining rights and mining production. During the year, additional deferred tax has been recognised.
The total charge for the year can be reconciled to the profit per the consolidated income statement as follows:
| Year ended December 31, | Year ended December 31, | |||||||||||||||||||||||
| 2010 | 2009 | 2008 | 2012 | 2011 | 2010 | |||||||||||||||||||
| RMB’000 | RMB’000 | RMB’000 | RMB’000 | RMB’000 | RMB’000 | |||||||||||||||||||
Standard income tax rate in the PRC | 25 | % | 25 | % | 25 | % | 25 | % | 25 | % | 25 | % | ||||||||||||
Standard income tax rate applied to income before income taxes | 3,119,333 | 1,421,452 | 2,216,307 | 1,586,546 | 3,130,247 | 3,119,333 | ||||||||||||||||||
Reconciling items: | ||||||||||||||||||||||||
Tax effect of future development fund deductible for tax purposes | (18,601 | ) | (20,436 | ) | — | — | — | (18,601 | ) | |||||||||||||||
Deemed interest not deductible for tax purposes | 150 | 304 | 462 | — | — | 150 | ||||||||||||||||||
Effect of income exempt from taxation | (242,252 | ) | (64,170 | ) | (74,491 | ) | ||||||||||||||||||
Reversal of impairment loss on doubtful debts not subject to tax | — | — | (11,398 | ) | ||||||||||||||||||||
Effect of (income) expense exempt from taxation | (668,039 | ) | 33,520 | (242,252 | ) | |||||||||||||||||||
Deemed interest income from subsidiaries subject to tax | 18,571 | 31,134 | 40,213 | 142,361 | 63,058 | 18,571 | ||||||||||||||||||
Tax effect of tax losses not recognized | 150,590 | 135,268 | 28 | 202,744 | 217,791 | 150,590 | ||||||||||||||||||
Under provision in prior years | 10,085 | 42,221 | 265,390 | 142,957 | 20,174 | 10,085 | ||||||||||||||||||
MRRT benefit | (1,085,194 | ) | — | — | ||||||||||||||||||||
Utilization of unrecognized tax losses in prior years | — | — | (51,600 | ) | (20,700 | ) | (83,336 | ) | — | |||||||||||||||
Effect of tax rate differences in other taxation jurisdictions | 135,942 | 1,504 | — | 36,564 | 164,297 | 135,942 | ||||||||||||||||||
Others | (2,775 | ) | 6,035 | 706 | (213,302 | ) | (372 | ) | (2,775 | ) | ||||||||||||||
|
|
| ||||||||||||||||||||||
Income taxes | 3,171,043 | 1,553,312 | 2,385,617 | 123,937 | 3,545,379 | 3,171,043 | ||||||||||||||||||
|
|
| ||||||||||||||||||||||
Effective income tax rate | 25 | % | 27 | % | 27 | % | 2 | % | 28 | % | 25 | % | ||||||||||||
|
|
| ||||||||||||||||||||||
YANZHOU COAL MINING COMPANY LIMITED
NOTES TO THE CONSOLIDATED FINANCIAL STATEMENTS—(Continued)
13. PROFIT FOR THE YEARBEFORE INCOME TAX
| Year ended December 31, | Year ended December 31, | |||||||||||||||||||||||
| 2010 | 2009 | 2008 | 2012 | 2011 | 2010 | |||||||||||||||||||
| RMB’000 | RMB’000 | RMB’000 | RMB’000 | RMB’000 | RMB’000 | |||||||||||||||||||
Profit for the year has been arrived at after charging: | ||||||||||||||||||||||||
Profit before income tax has been arrived at after charging: | ||||||||||||||||||||||||
Amortization of intangible assets | 349,655 | 44,278 | 35,652 | 1,177,595 | 720,008 | 349,655 | ||||||||||||||||||
Depreciation of property, plant and equipment | 2,319,447 | 1,793,278 | 1,140,809 | |||||||||||||||||||||
- under finance leases | 8,180 | — | — | |||||||||||||||||||||
- self-owned | 2,811,224 | 2,266,017 | 2,426,626 | |||||||||||||||||||||
|
|
| ||||||||||||||||||||||
Total depreciation and amortization | 2,669,102 | 1,837,556 | 1,176,461 | 3,996,999 | 2,986,025 | 2,776,281 | ||||||||||||||||||
|
|
| ||||||||||||||||||||||
Release of prepaid lease payments | 17,958 | 17,027 | 15,109 | 18,363 | 19,018 | 17,958 | ||||||||||||||||||
Impairment loss recognised in respect of: | ||||||||||||||||||||||||
- Property, plant and equipment | 226,925 | 281,994 | 97,559 | |||||||||||||||||||||
- Intangible assets | 417,214 | — | — | |||||||||||||||||||||
- Goodwill | 17,625 | — | — | |||||||||||||||||||||
- Inventories | 140,883 | — | 4,411 | |||||||||||||||||||||
Auditors’ remuneration | 16,763 | 12,401 | 10,157 | 19,916 | 18,112 | 16,763 | ||||||||||||||||||
Staff costs, including directors’ and supervisors’ emoluments | 5,988,821 | 4,897,951 | 4,358,556 | 10,022,134 | 8,222,047 | 5,988,821 | ||||||||||||||||||
Retirement benefit scheme contributions (included in staff costs above) | 785,051 | 1,092,817 | 867,808 | 3,657,504 | 1,699,443 | 785,051 | ||||||||||||||||||
Cost of inventories | 16,167,748 | 9,219,686 | 11,986,520 | 25,425,263 | 12,723,350 | 16,167,748 | ||||||||||||||||||
Including: provision for inventories | 4,411 | — | — | |||||||||||||||||||||
Exchange loss, net and crediting: | — | — | 328,858 | |||||||||||||||||||||
Research and development costs | 62,406 | 119,234 | 70,606 | |||||||||||||||||||||
Operating lease charges in respect of leased premises | 72,400 | 31,960 | 18,287 | |||||||||||||||||||||
and crediting: | ||||||||||||||||||||||||
(Gain) Loss on disposal of property, plant and equipment | (9,862 | ) | 108,627 | 16,937 | ||||||||||||||||||||
Exchange gains, net | (2,665,421 | ) | (46,151 | ) | — | (714,166 | ) | (518,553 | ) | (2,665,421 | ) | |||||||||||||
Gain on disposal of property, plant and equipment | — | — | (12,317 | ) | ||||||||||||||||||||
Reversal of impairment loss on accounts receivable and other receivables | (4,923 | ) | (13,634 | ) | (4,369 | ) | ||||||||||||||||||
Provision (reversal) of impairment loss on accounts receivable and other receivables | 6,452 | (101 | ) | (4,923 | ) | |||||||||||||||||||
|
|
| ||||||||||||||||||||||
YANZHOU COAL MINING COMPANY LIMITED
NOTES TO THE CONSOLIDATED FINANCIAL STATEMENTS—(Continued)
14. DIRECTORS’ AND SUPERVISORS’ REMUNERATION AND FIVE HIGHEST PAID INDIVIDUALS
(a) Directors’ and supervisors’ emoluments
Details of the directors’ and supervisors’ emoluments are as follows:
| For the year ended December 31, 2010 | For the year ended December 31, 2012 | |||||||||||||||||||||||||||||||
| Fees | Salaries, allowance and other benefits in kind | Retirement benefit scheme contributions | Total | Fees | Salaries, allowance and other benefits in kind | Retirement benefit scheme contributions | Total | |||||||||||||||||||||||||
| RMB’000 | RMB’000 | RMB’000 | RMB’000 | RMB’000 | RMB’000 | RMB’000 | RMB’000 | |||||||||||||||||||||||||
Independent non-executive directors | ||||||||||||||||||||||||||||||||
Pu Hongjiu | 113 | — | — | 113 | ||||||||||||||||||||||||||||
Zhai Xigui | 113 | — | — | 113 | ||||||||||||||||||||||||||||
Li Weian | 113 | — | — | 113 | ||||||||||||||||||||||||||||
Wang Junyan | 113 | — | — | 113 | ||||||||||||||||||||||||||||
Wang Xiaojun | 130 | — | — | 130 | ||||||||||||||||||||||||||||
Wang Xianzheng | 130 | — | — | 130 | ||||||||||||||||||||||||||||
Cheng Faguang | 130 | — | — | 130 | ||||||||||||||||||||||||||||
Xue Youzhi | 130 | — | — | 130 | ||||||||||||||||||||||||||||
|
|
|
| |||||||||||||||||||||||||||||
| 452 | — | — | 452 | 520 | — | — | 520 | |||||||||||||||||||||||||
|
|
|
| |||||||||||||||||||||||||||||
Executive directors | ||||||||||||||||||||||||||||||||
Wang Xin | — | — | — | — | — | — | — | — | ||||||||||||||||||||||||
Geng Jiahuai | — | — | — | — | ||||||||||||||||||||||||||||
Zhang Yingmin | — | 728 | 146 | 874 | ||||||||||||||||||||||||||||
Li Weimin | — | 188 | 38 | 226 | — | — | — | — | ||||||||||||||||||||||||
Shi Xuerang | — | — | — | — | — | — | — | — | ||||||||||||||||||||||||
Chen Changchun | — | — | — | — | ||||||||||||||||||||||||||||
Wu Yuxiang | — | 269 | 54 | 323 | — | 505 | 101 | 606 | ||||||||||||||||||||||||
Wang Xinkun | — | 343 | 69 | 412 | ||||||||||||||||||||||||||||
Zhang Baocai | — | 312 | 62 | 374 | — | 517 | 103 | 620 | ||||||||||||||||||||||||
Dong Yunqing | — | 309 | 62 | 371 | — | 520 | 104 | 624 | ||||||||||||||||||||||||
|
|
|
| |||||||||||||||||||||||||||||
| — | 1,421 | 285 | 1,706 | — | 2,270 | 454 | 2,724 | |||||||||||||||||||||||||
|
|
|
| |||||||||||||||||||||||||||||
Supervisors | ||||||||||||||||||||||||||||||||
Song Guo | — | — | — | — | — | — | — | — | ||||||||||||||||||||||||
Zhang Shengdong | — | — | — | — | — | — | — | — | ||||||||||||||||||||||||
Zhou Shoucheng | — | — | — | — | — | — | — | — | ||||||||||||||||||||||||
Zhen Ailan | — | — | — | — | — | — | — | — | ||||||||||||||||||||||||
Wei Huanmin | — | 305 | 61 | 366 | — | 516 | 103 | 619 | ||||||||||||||||||||||||
Xu Bentai | — | 346 | 69 | 415 | — | 506 | 101 | 607 | ||||||||||||||||||||||||
|
|
|
| |||||||||||||||||||||||||||||
| — | 651 | 130 | 781 | — | 1,022 | 204 | 1,226 | |||||||||||||||||||||||||
|
|
|
| |||||||||||||||||||||||||||||
Other management team | ||||||||||||||||||||||||||||||||
Jin Tai | — | 189 | 38 | 227 | ||||||||||||||||||||||||||||
Zhang Yingmin | — | 189 | 38 | 227 | ||||||||||||||||||||||||||||
Liu Chun | — | 564 | 113 | 677 | ||||||||||||||||||||||||||||
He Ye | — | 188 | 38 | 226 | — | 720 | 144 | 864 | ||||||||||||||||||||||||
Tian Fengze | — | 291 | 58 | 349 | — | 529 | 106 | 635 | ||||||||||||||||||||||||
Shi Chenzhong | — | 342 | 68 | 410 | ||||||||||||||||||||||||||||
Qu Tianzhi | — | 285 | 57 | 342 | ||||||||||||||||||||||||||||
Shi Chengzhong | — | 543 | 109 | 652 | ||||||||||||||||||||||||||||
Ni Xinghua | — | 328 | 66 | 394 | — | 553 | 111 | 664 | ||||||||||||||||||||||||
Lai Cunliang | — | 664 | — | 664 | — | 690 | — | 690 | ||||||||||||||||||||||||
|
|
|
| |||||||||||||||||||||||||||||
| — | 2,476 | 363 | 2,839 | — | 3,599 | 583 | 4,182 | |||||||||||||||||||||||||
|
|
|
| |||||||||||||||||||||||||||||
YANZHOU COAL MINING COMPANY LIMITED
NOTES TO THE CONSOLIDATED FINANCIAL STATEMENTS—(Continued)
14. DIRECTORS’ AND SUPERVISORS’ REMUNERATION AND FIVE HIGHEST PAID INDIVIDUALS—Continued
(a) Directors’ and supervisors’ emoluments—Continued
Details of the directors’ and supervisors’ emoluments are as follows:
| For the year ended December 31, 2009 | For the year ended December 31, 2011 | |||||||||||||||||||||||||||||||
| Fees | Salaries, allowance and other benefits in kind | Retirement benefit scheme contributions | Total | Fees | Salaries, allowance and other benefits in kind | Retirement benefit scheme contributions | Total | |||||||||||||||||||||||||
| RMB’000 | RMB’000 | RMB’000 | RMB’000 | RMB’000 | RMB’000 | RMB’000 | RMB’000 | |||||||||||||||||||||||||
Independent non-executive directors | ||||||||||||||||||||||||||||||||
Pu Hongjiu | 109 | — | — | 109 | 49 | — | — | 49 | ||||||||||||||||||||||||
Zhai Xigui | 109 | — | — | 109 | ||||||||||||||||||||||||||||
Di Xigui | 49 | — | — | 49 | ||||||||||||||||||||||||||||
Li Weian | 109 | — | — | 109 | 49 | — | — | 49 | ||||||||||||||||||||||||
Wang Junyan | 109 | — | — | 109 | 49 | — | — | 49 | ||||||||||||||||||||||||
Wang Xiaojun | 72 | — | — | 72 | ||||||||||||||||||||||||||||
Wang Xianzheng | 72 | — | — | 72 | ||||||||||||||||||||||||||||
Cheng Faguang | 72 | — | — | 72 | ||||||||||||||||||||||||||||
Xue Youzhi | 72 | — | — | 72 | ||||||||||||||||||||||||||||
|
|
|
| |||||||||||||||||||||||||||||
| 436 | — | — | 436 | 484 | — | — | 484 | |||||||||||||||||||||||||
|
|
|
| |||||||||||||||||||||||||||||
Executive directors | ||||||||||||||||||||||||||||||||
Wang Xin | — | — | — | — | — | — | — | — | ||||||||||||||||||||||||
Geng Jiahuai | — | — | — | — | ||||||||||||||||||||||||||||
Yang Deyu | — | 148 | 29 | 177 | ||||||||||||||||||||||||||||
Zhang Yingmin | — | 169 | 34 | 203 | ||||||||||||||||||||||||||||
Li Weimin | — | — | — | — | ||||||||||||||||||||||||||||
Shi Xuerang | — | — | — | — | — | — | — | — | ||||||||||||||||||||||||
Chen Changchun | — | — | — | — | — | — | — | — | ||||||||||||||||||||||||
Wu Yuxiang | — | 220 | 44 | 264 | — | 381 | 76 | 457 | ||||||||||||||||||||||||
Wang Xinkun | — | 250 | 50 | 300 | — | 329 | 66 | 395 | ||||||||||||||||||||||||
Zhang Baocai | — | 220 | 44 | 264 | — | 390 | 78 | 468 | ||||||||||||||||||||||||
Dong Yunqing | — | 220 | 44 | 264 | — | 396 | 79 | 475 | ||||||||||||||||||||||||
|
|
|
| |||||||||||||||||||||||||||||
| — | 1,058 | 211 | 1,269 | — | 1,665 | 333 | 1,998 | |||||||||||||||||||||||||
|
|
|
| |||||||||||||||||||||||||||||
Supervisors | ||||||||||||||||||||||||||||||||
Song Guo | — | — | — | — | — | — | — | — | ||||||||||||||||||||||||
Zhang Shengdong | — | — | — | — | — | — | — | — | ||||||||||||||||||||||||
Zhou Shoucheng | — | — | — | — | — | — | — | — | ||||||||||||||||||||||||
Zhen Ailan | — | — | — | — | — | — | — | — | ||||||||||||||||||||||||
Wei Huanmin | — | 220 | 44 | 264 | — | 390 | 78 | 468 | ||||||||||||||||||||||||
Xu Bentai | — | 259 | 52 | 311 | — | 430 | 86 | 516 | ||||||||||||||||||||||||
|
|
|
| |||||||||||||||||||||||||||||
| — | 479 | 96 | 575 | — | 820 | 164 | 984 | |||||||||||||||||||||||||
|
|
|
| |||||||||||||||||||||||||||||
Other management team | ||||||||||||||||||||||||||||||||
Li Weimin | — | 61 | 12 | 73 | ||||||||||||||||||||||||||||
Jin Tai | — | 61 | 13 | 74 | — | 169 | 34 | 203 | ||||||||||||||||||||||||
Zhang Yingmin | — | 61 | 12 | 73 | ||||||||||||||||||||||||||||
Liu Chun | — | 13 | 3 | 16 | ||||||||||||||||||||||||||||
He Ye | — | 61 | 12 | 73 | — | 169 | 34 | 203 | ||||||||||||||||||||||||
Tian Fengze | — | 221 | 44 | 265 | — | 428 | 86 | 514 | ||||||||||||||||||||||||
Shi Chenzhong | — | 250 | 50 | 300 | ||||||||||||||||||||||||||||
Qu Tianzhi | — | 250 | 50 | 300 | ||||||||||||||||||||||||||||
Shi Chengzhong | — | 462 | 92 | 554 | ||||||||||||||||||||||||||||
Ni Xinghua | — | 250 | 50 | 300 | — | 438 | 88 | 526 | ||||||||||||||||||||||||
Lai Cunliang | — | 540 | — | 540 | — | 700 | — | 700 | ||||||||||||||||||||||||
|
|
|
| |||||||||||||||||||||||||||||
| — | 1,755 | 243 | 1,998 | — | 2,379 | 337 | 2,716 | |||||||||||||||||||||||||
|
|
|
| |||||||||||||||||||||||||||||
YANZHOU COAL MINING COMPANY LIMITED
NOTES TO THE CONSOLIDATED FINANCIAL STATEMENTS—(Continued)
14. DIRECTORS’ AND SUPERVISORS’ REMUNERATION AND FIVE HIGHEST PAID INDIVIDUALS—Continued
(a) Directors’ and supervisors’ emoluments—Continued
Details of the directors’ and supervisors’ emoluments are as follows:
| For the year ended December 31, 2008 | For the year ended December 31, 2010 | |||||||||||||||||||||||||||||||
| Fees | Salaries, allowance and other benefits in kind | Retirement benefit scheme contributions | Total | Fees | Salaries, allowance and other benefits in kind | Retirement benefit scheme contributions | Total | |||||||||||||||||||||||||
| RMB’000 | RMB’000 | RMB’000 | RMB’000 | RMB’000 | RMB’000 | RMB’000 | RMB’000 | |||||||||||||||||||||||||
Independent non-executive directors | ||||||||||||||||||||||||||||||||
Pu Hongjiu | 104 | — | — | 104 | 113 | — | — | 113 | ||||||||||||||||||||||||
Cui Jianmin | 50 | — | — | 50 | ||||||||||||||||||||||||||||
Wang Xiaojun | 60 | — | — | 60 | ||||||||||||||||||||||||||||
Wang Quanxi | 50 | — | — | 50 | ||||||||||||||||||||||||||||
Zhai Xigui | 54 | — | — | 54 | 113 | — | — | 113 | ||||||||||||||||||||||||
Li Weian | 54 | — | — | 54 | 113 | — | — | 113 | ||||||||||||||||||||||||
Wang Junyan | 54 | — | — | 54 | 113 | — | — | 113 | ||||||||||||||||||||||||
|
|
|
| |||||||||||||||||||||||||||||
| 426 | — | — | 426 | 452 | — | — | 452 | |||||||||||||||||||||||||
|
|
|
| |||||||||||||||||||||||||||||
Executive directors | ||||||||||||||||||||||||||||||||
Wang Xin | — | — | — | — | — | — | — | — | ||||||||||||||||||||||||
Geng Jiahuai | — | — | — | — | — | — | — | — | ||||||||||||||||||||||||
Yang Deyu | — | — | — | — | ||||||||||||||||||||||||||||
Li Weimin | — | 188 | 38 | 226 | ||||||||||||||||||||||||||||
Shi Xuerang | — | — | — | — | — | — | — | — | ||||||||||||||||||||||||
Chen Changchun | — | — | — | — | — | — | — | — | ||||||||||||||||||||||||
Wu Yuxiang | — | 192 | 38 | 230 | — | 269 | 54 | 323 | ||||||||||||||||||||||||
Wang Xinkun | — | 218 | 44 | 262 | — | 343 | 69 | 412 | ||||||||||||||||||||||||
Zhang Baocai | — | 191 | 38 | 229 | — | 312 | 62 | 374 | ||||||||||||||||||||||||
Dong Yunqing | — | 192 | 38 | 230 | — | 309 | 62 | 371 | ||||||||||||||||||||||||
|
|
|
| |||||||||||||||||||||||||||||
| — | 793 | 158 | 951 | — | 1,421 | 285 | 1,706 | |||||||||||||||||||||||||
|
|
|
| |||||||||||||||||||||||||||||
Supervisors | ||||||||||||||||||||||||||||||||
Meng Xianchang | — | — | — | — | ||||||||||||||||||||||||||||
Song Guo | — | — | — | — | — | — | — | — | ||||||||||||||||||||||||
Zhang Shengdong | — | — | — | — | — | — | — | — | ||||||||||||||||||||||||
Liu Weixin | — | — | — | — | ||||||||||||||||||||||||||||
Zhou Shoucheng | — | — | — | — | — | — | — | — | ||||||||||||||||||||||||
Zhen Ailan | — | — | — | — | — | — | — | — | ||||||||||||||||||||||||
Wei Huanmin | — | 192 | 38 | 230 | — | 305 | 61 | 366 | ||||||||||||||||||||||||
Xu Bentai | — | 207 | 41 | 248 | — | 346 | 69 | 415 | ||||||||||||||||||||||||
|
|
|
| |||||||||||||||||||||||||||||
| — | 399 | 79 | 478 | — | 651 | 130 | 781 | |||||||||||||||||||||||||
|
|
|
| |||||||||||||||||||||||||||||
Other management team | ||||||||||||||||||||||||||||||||
Jin Tai | — | — | — | — | — | 189 | 38 | 227 | ||||||||||||||||||||||||
Zhang Yingmin | — | — | — | — | — | 189 | 38 | 227 | ||||||||||||||||||||||||
He Ye | — | — | — | — | — | 188 | 38 | 226 | ||||||||||||||||||||||||
Tian Fengze | — | 192 | 38 | 230 | — | 291 | 58 | 349 | ||||||||||||||||||||||||
Shi Chenzhong | — | 218 | 44 | 262 | — | 342 | 68 | 410 | ||||||||||||||||||||||||
Qu Tianzhi | — | 218 | 44 | 262 | — | 285 | 57 | 342 | ||||||||||||||||||||||||
Ni Xinghua | — | 218 | 44 | 262 | — | 328 | 66 | 394 | ||||||||||||||||||||||||
Lai Cunliang | — | 508 | 102 | 610 | — | 664 | — | 664 | ||||||||||||||||||||||||
|
|
|
| |||||||||||||||||||||||||||||
| — | 1,354 | 272 | 1,626 | — | 2,476 | 363 | 2,839 | |||||||||||||||||||||||||
|
|
|
| |||||||||||||||||||||||||||||
No directors waived any of their emoluments in each of the year ended December 31, 2010, 20092012, 2011 and 2008.2010.
YANZHOU COAL MINING COMPANY LIMITED
NOTES TO THE CONSOLIDATED FINANCIAL STATEMENTS—(Continued)
14. DIRECTORS’ AND SUPERVISORS’ REMUNERATION AND FIVE HIGHEST PAID INDIVIDUALS—Continued
(b) Employees’ emoluments
The five highest paid individuals in the Group included no director for the year ended December 31, 2010 (2009:2012 (2011: nil; 2008:2010: nil). The emoluments of the five highest paid individuals (2009:(2011: five; 2008:2010: five) were stated as follows:
| Year ended December 31, | Year ended December 31, | |||||||||||||||||||||||
| 2010 | 2009 | 2008 | 2012 | 2011 | 2010 | |||||||||||||||||||
| RMB’000 | RMB’000 | RMB’000 | RMB’000 | RMB’000 | RMB’000 | |||||||||||||||||||
Salaries, allowance and other benefits in kind | 4,411 | 6,380 | 6,787 | 18,877 | 19,282 | 4,411 | ||||||||||||||||||
Retirement benefit scheme contributions | 228 | 574 | 611 | 538 | 74 | 228 | ||||||||||||||||||
Discretionary bonuses | 28 | 228 | 242 | 5,827 | 1,725 | 28 | ||||||||||||||||||
|
|
| ||||||||||||||||||||||
| 4,667 | 7,182 | 7,640 | 25,242 | 21,081 | 4,667 | |||||||||||||||||||
|
|
| ||||||||||||||||||||||
Their emoluments were within the following bands:
| Year ended December 31, | Year ended December 31, | |||||||||||||||||||||||
| 2010 | 2009 | 2008 | 2012 | 2011 | 2010 | |||||||||||||||||||
| No. of employees | No. of employees | No. of employees | No. of employees | No. of employees | No. of employees | |||||||||||||||||||
Nil to HK$1,000,000 | 3 | — | — | — | — | 3 | ||||||||||||||||||
HK$1,000,001 to HK$1,500,000 | 1 | 3 | 3 | — | — | 1 | ||||||||||||||||||
HK$1,500,001 to HK$2,000,000 | 1 | 1 | 1 | — | — | 1 | ||||||||||||||||||
HK$2,000,001 to HK$2,500,000 | — | 1 | 1 | |||||||||||||||||||||
HK$3,500,001 to HK$4,000,000 | 2 | 1 | — | |||||||||||||||||||||
HK$4,000,001 to HK$4,500,000 | — | 2 | — | |||||||||||||||||||||
HK$4,500,001 to HK$5,000,000 | 1 | — | — | |||||||||||||||||||||
HK$5,000,001 to HK$5,500,000 | — | 1 | — | |||||||||||||||||||||
HK$5,500,001 to HK$6,000,000 | 1 | — | — | |||||||||||||||||||||
HK$8,000,001 to HK$8,500,000 | — | 1 | — | |||||||||||||||||||||
HK$12,000,001 to HK$12,500,000 | 1 | — | — | |||||||||||||||||||||
|
|
| ||||||||||||||||||||||
15. DIVIDEND RECOGNIZED AS DISTRIBUTION DURING THE YEAR
| Year ended December 31, | ||||||||||||
| 2010 | 2009 | 2008 | ||||||||||
| RMB’000 | RMB’000 | RMB’000 | ||||||||||
2009 final dividend, RMB0.250 per share (2009: 2008 final dividend RMB0.400; 2008: 2007 final dividend RMB0.170) | 1,229,600 | 1,967,360 | 836,128 | |||||||||
| Year ended December 31, | ||||||||||||
| 2012 | 2011 | 2010 | ||||||||||
| RMB’000 | RMB’000 | RMB’000 | ||||||||||
2011 final dividend, RMB 0.570 per share (2011: 2010 final dividend RMB0.590 per share; 2010: 2009 final dividend RMB0.250 per share) | 2,803,488 | 2,901,856 | 1,229,600 | |||||||||
|
|
|
|
|
| |||||||
YANZHOU COAL MINING COMPANY LIMITED
NOTES TO THE CONSOLIDATED FINANCIAL STATEMENTS—(Continued)
15. DIVIDENDS RECOGNIZED AS DISTRIBUTION DURING THE YEAR—Continued
In the annual general meeting held on June 27, 2008,25, 2010, a final dividend of RMB0.250 per share in respect of the year ended December 31, 20072009 was approved by the shareholders and paid to the shareholders of the Company.
In the annual general meeting held on May 20, 2011, a final dividend of RMB0.590 per share in respect of the year ended December 31, 2010 was approved by the shareholders and paid to the shareholders of the Company.
In the annual general meeting held on June 26, 2009,22, 2012, a final dividend in of RMB0.570 per share in respect of the year ended December 31, 2008 was approved by the shareholders and paid to the shareholders of the Company.
In the annual general meeting held on June 25, 2010, a final dividend in respect of the year ended December 31, 20092011 was approved by the shareholders and paid to the shareholders of the Company.
The board of directors proposes to declare a final dividend of approximately RMB2,901,856,000RMB1,770,624,000 calculated based on a total number of 4,918,400,000 shares issued at RMB1 each, at RMB0.59 per share,RMB0.360, in respect of the year ended December 31, 2010.2012. The declaration and payment of the final dividend needs to be approved by the shareholders of the Company by way of an ordinary resolution in accordance with the requirements of the Company’s Articles of Association. A shareholders’ general meeting will be held for the purpose of considering and, if thought fit, approving this ordinary resolution.
16. EARNINGS PER SHARE AND PER ADS
The calculation of the earnings per share attributable to the equity holders of the Company for the years ended December 31, 2010, 20092012, 2011 and 20082010 is based on the profit attributable to the equity holders of the Company for the year of RMB9,281,386,000, RMB4,117,322,000RMB6,218,969,000, RMB8,928,102,000 and RMB6,488,908,000RMB9,281,386,000 and on the 4,918,400,000 shares in issue, during each of the three years.
The earnings per ADS have been calculated based on the profit for the relevant periods and on one ADS, being equivalent to 10 H shares. The equivalent H shares to one ADS have been changed from 50 to 10 H shares from June 27, 2008. The new ADS were distributed to ADS holders on July 3, 2008.
No diluted earnings per share has been presented as there are no dilutive potential shares in issue during the years ended December 31, 2010, 20092012, 2011 and 2008.2010.
17. BANK BALANCES AND CASH/TERM DEPOSITS AND RESTRICTED CASH
Bank balances carry interest at market rates which ranged from 0.36%0.35% to 4.75% (2009:3.35% (2011: from 0.36%0.50% to 3.75%4.25%) per annum.
At the balance sheet dates,date, the short-term restricted cash of the PRC subsidiaries represents deposits paid for safety work as required by the State Administrative of work safety, which carry interest at market rates of 0.36% - 4.53 % per annum (2009: 0.36%-3.47%0.01%-5.75% (2011: 0.5%-3.95%), represents the bank deposits pledged to certain banks to secure banking facilities granted to the Group. The long-term amountremaining portion represents the bank deposits placed as guarantee for the future paymentspayment of rehabilitation costsland subsidence as required by the Australian government, and as guarantee for borrowings. The long-term depositswhich carry interest at average rate of 5.20% (2009: of 2.58% (2011:4.41%) per annum..
The termTerm deposits was pledged to certain banks as security for loans and banking facilities granted to the Group, which carry fixed interest rate of 2.25% to 4.80% (2009: 1.17% to 4.53%ranging from 2.60%-4.75% (2011: 3.10%-6.20%) per annum..
YANZHOU COAL MINING COMPANY LIMITED
NOTES TO THE CONSOLIDATED FINANCIAL STATEMENTS—(Continued)
18. BILLS AND ACCOUNTS RECEIVABLE
| At December 31, | ||||||||
| 2010 | 2009 | |||||||
| RMB’000 | RMB’000 | |||||||
Accounts receivable | ||||||||
- From third parties | 439,646 | 357,282 | ||||||
- From a jointly controlled entity | 53,450 | 81,329 | ||||||
Total accounts receivable | 493,096 | 438,611 | ||||||
Less: Impairment loss | (5,406 | ) | (4,542 | ) | ||||
| 487,690 | 434,069 | |||||||
Total bills receivable | 9,529,570 | 4,289,853 | ||||||
Total bills and accounts receivable, net | 10,017,260 | 4,723,922 | ||||||
| At December 31, | ||||||||
| 2012 | 2011 | |||||||
| RMB’000 | RMB’000 | |||||||
Accounts receivable | 928,935 | 817,952 | ||||||
Less: Impairment loss | (2,532 | ) | (4,143 | ) | ||||
|
|
|
| |||||
| 926,403 | 813,809 | |||||||
Bills receivables | 6,533,200 | 6,498,265 | ||||||
|
|
|
| |||||
Total bills and accounts receivable, net | 7,459,603 | 7,312,074 | ||||||
|
|
|
| |||||
Bills receivable represents unconditional orders in writing issued by or negotiated from customers of the Group for completed sale orders which entitle the Group to collect a sum of money from banks or other parties. The bills are non-interest bearing and have a maturity of six months.
According to the credit rating of different customers, the Group allows a range of credit periods to its trade customers not exceeding 180 days.
The following is an aged analysis of bills and accounts receivable based on the invoice dates at the balance sheet dates:
| At December 31, | At December 31, | |||||||||||||||
| 2010 | 2009 | 2012 | 2011 | |||||||||||||
| RMB’000 | RMB’000 | RMB’000 | RMB’000 | |||||||||||||
1 - 90 days | 4,738,930 | 2,592,713 | 3,423,025 | 4,037,903 | ||||||||||||
91 - 180 days | 5,278,330 | 2,131,209 | 3,954,398 | 3,274,171 | ||||||||||||
181 - 365 days | 80,812 | — | ||||||||||||||
Over 1 year | 1,368 | — | ||||||||||||||
|
| |||||||||||||||
| 10,017,260 | 4,723,922 | 7,459,603 | 7,312,074 | |||||||||||||
|
| |||||||||||||||
Before accepting any new customer, the Group assesses the potential customer’s credit quality and defines credit limits by customer. Limits attributed to customers are reviewed once a year.
There are no significant trade receivables which are past due but not yet impaired on both balance sheet dates. The Group does not hold any collateral over these balances. The average age of these receivables is 9396 days (2009: 88(2011: 86 days). The management closely monitors the credit quality of accounts receivable and consider the balance that are neither past due nor impaired are of good credit quality.
The Group has provided fully for all receivables over 3 years because historical experience is such that receivables that are past due beyond 3 years are generally not recoverable. For receivable aged over 4 years and considered irrecoverable by the management will be written off.
YANZHOU COAL MINING COMPANY LIMITED
NOTES TO THE CONSOLIDATED FINANCIAL STATEMENTS—(Continued)
18. BILLS AND ACCOUNTS RECEIVABLE—Continued
An analysis of the impairment loss on bills and accounts receivable isfor 2012 and 2011 are as follows:
| At December 31, | ||||||||||||||||
| 2010 | 2009 | 2012 | 2011 | |||||||||||||
| RMB’000 | RMB’000 | RMB’000 | RMB’000 | |||||||||||||
Balance at January 1 | 4,542 | 29,509 | 4,143 | 5,406 | ||||||||||||
Provided for the year | 895 | 335 | 5 | — | ||||||||||||
Written off recognized | — | (5,797 | ) | |||||||||||||
Reversal | (31 | ) | (19,505 | ) | (1,616 | ) | (1,263 | ) | ||||||||
|
| |||||||||||||||
Balance at December 31 | 5,406 | 4,542 | 2,532 | 4,143 | ||||||||||||
|
| |||||||||||||||
Included in the allowance for doubtful debts is an allowance of RMB5.4RMB2.5 million (2009: RMB 4.5(2011: RMB4.1 million) for individually impaired trade receivables, which are mainly due from corporate customers in the PRC and considered irrecoverable by the management after consideration on the credit quality of those individual customers, the ongoing relationship with the Group and the aging of these receivables. The impairment recognized represents the difference between the carrying amount of these trade receivables and the present value of the amounts. The Group does not hold any collateral over these balances.
19. INVENTORIESROYALTY RECEIVEABLE
| At December 31, | ||||||||
| 2010 | 2009 | |||||||
| RMB’000 | RMB’000 | |||||||
COST | ||||||||
Methanol | 10,279 | 27,320 | ||||||
Auxiliary materials, spare parts and small tools | 372,046 | 288,550 | ||||||
Coal products | 1,263,791 | 570,490 | ||||||
| 1,646,116 | 886,360 | |||||||
| 2012 | 2011 | |||||||
| RMB’000 | RMB’000 | |||||||
As at January 1 | — | — | ||||||
Acquisition of Gloucester | 1,290,015 | — | ||||||
Cash received | (27,924 | ) | — | |||||
Unwinding discount | 72,353 | — | ||||||
Exchange re-alignment | 38,596 | — | ||||||
Change in fair value | (23,593 | ) | — | |||||
|
|
|
| |||||
As at December 31 | 1,349,447 | — | ||||||
|
|
|
| |||||
Current portion | 114,798 | — | ||||||
Non- current portion | 1,234,649 | — | ||||||
|
|
|
| |||||
| �� | 1,349,447 | — | ||||||
|
|
|
| |||||
A right to receive a royalty of 4% of Free on Board trimmed sales from Middlemount mine operated by Middlemount Joint Venture was acquired as part of the acquisition of Gloucester. This financial assets has been determined to have a finite life being the life of the Middlemount and is measured at fair value basis.
The royalty receivable is measured based on management expectations of the future cash flows with the re-measurement recorded in the income statement at each balance sheet date. The amount expected to be received in the next 12 month will be disclosed as current receivable and the discounted expected future cash flow beyond 12 months will be disclosed as a non-current receivable. Unwinding discount is included in interest income (note 10).
YANZHOU COAL MINING COMPANY LIMITED
NOTES TO THE CONSOLIDATED FINANCIAL STATEMENTS—(Continued)
20. INVENTORIES
| At December 31, | ||||||||
| 2012 | 2011 | |||||||
| RMB’000 | RMB’000 | |||||||
COST | ||||||||
Methanol | 9,470 | 11,786 | ||||||
Auxiliary materials, spare parts and small tools | 507,605 | 414,475 | ||||||
Coal products | 1,048,456 | 964,986 | ||||||
|
|
|
| |||||
| 1,565,531 | 1,391,247 | |||||||
|
|
|
| |||||
21. PREPAYMENTS AND OTHER RECEIVABLES
| At December 31, | At December 31, | |||||||||||||||
| 2010 | 2009 | 2012 | 2011 | |||||||||||||
| RMB’000 | RMB’000 | RMB’000 | RMB’000 | |||||||||||||
Advances to suppliers | 243,210 | 75,623 | 729,216 | 738,395 | ||||||||||||
Prepaid freight charges and related handling charges | — | 5,232 | ||||||||||||||
Due from a jointly controlled entity (note) | 115,480 | 66,321 | ||||||||||||||
Deposit for environment protection | 254,193 | 226,252 | 813,212 | 651,699 | ||||||||||||
Prepaid relocation costs of inhabitants | 1,709,872 | 1,288,453 | 1,877,911 | 1,714,506 | ||||||||||||
Others | 290,931 | 206,348 | 776,660 | 520,279 | ||||||||||||
|
| |||||||||||||||
| 2,613,686 | 1,868,229 | 4,196,999 | 3,624,879 | |||||||||||||
|
| |||||||||||||||
Included in the above balances as of December 31, 20102012 is an impairment loss of RMB16,067,000 (2009: RMB21,854,000)RMB 25,292,000 (2011: RMB17,229,000). During the yearyears ended December 31, 2009, the Group wrote off2012 and 2011, there were no impairment loss of RMB536,000.written off.
The Group has provided fully for all receivables over 3 years because historical experience is such that receivables that are past due beyond 3 years are generally not recoverable. Receivable will be written off, if aged over 4 years and considered irrecoverable by the management after considering the credit quality of the individual party and the nature of the amount overdue.
Note: The amount due from a jointly controlled entity is unsecured, interest-free and has no fixed repayment term.
21.22. PREPAID LEASE PAYMENTS
| At December 31, | At December 31, | |||||||||||||||
| 2010 | 2009 | 2012 | 2011 | |||||||||||||
| RMB’000 | RMB’000 | RMB’000 | RMB’000 | |||||||||||||
Current portion | 18,280 | 17,121 | 18,418 | 18,975 | ||||||||||||
Non-current portion | 728,082 | 691,339 | 695,675 | 713,425 | ||||||||||||
|
| |||||||||||||||
| 746,362 | 708,460 | 714,093 | 732,400 | |||||||||||||
|
| |||||||||||||||
The amounts represent prepaid lease payments for land use rights which are situated in the PRC and have a term of 45 to 50 years from the date of grant of land use rights certificates.
22.YANZHOU COAL MINING COMPANY LIMITED
NOTES TO THE CONSOLIDATED FINANCIAL STATEMENTS—(Continued)
23. PREPAYMENT FOR RESOURCES COMPENSATION FEES
In accordance with the relevant regulations, the Shanxi Group is required to pay resources compensation fees to the Heshun Municipal Coal Industry Bureau at a rate of RMB2.70 per tonne of raw coal mined. During the year 2006, Shanxi Group was requested by the relevant government to prepay the fees based on production volume of 10 million tonnes. At the balance sheet date, the amount represented the prepayment for resources compensation fees not yet utilized.
During the year, the government authority completed the assessment of Shanxi mining right. The current portion representsShanxi Group in aggregate have to pay compensation fees of RMB218,493,000, thereafter and no longer required to pay the amountresources compensation fees to be utilized in the coming year which is estimated based on expected production volume.relevant government authority.
24. INTANGIBLE ASSETS
| Mining reserves | Mining resources | Potash mineral exploration permit | Technology | Rail access rights | Water Licenses | Others | Total | |||||||||||||||||||||||||
| RMB’000 | RMB’000 | RMB’000 | RMB’000 | RMB’000 | RMB’000 | RMB’000 | RMB’000 | |||||||||||||||||||||||||
COST | ||||||||||||||||||||||||||||||||
At January 1, 2011 | 15,834,711 | 3,905,285 | — | 167,848 | 3,565 | 132,620 | 19,944 | 20,063,973 | ||||||||||||||||||||||||
Exchange re-alignment | (705,304 | ) | (189,370 | ) | — | (7,615 | ) | (80 | ) | (366 | ) | (636 | ) | (903,371 | ) | |||||||||||||||||
Acquisition of additional interests in joint venture | 887,022 | 97,111 | — | — | — | — | 77 | 984,210 | ||||||||||||||||||||||||
Acquisition of Syntech | 228,334 | 164,040 | — | — | — | — | — | 392,374 | ||||||||||||||||||||||||
Acquisition of Premier Coal and Wesfarmers Char | 276,890 | 234,296 | — | — | — | — | — | 511,186 | ||||||||||||||||||||||||
Acquisition of An Yuan Coal Mine | 1,258,433 | — | — | — | — | — | — | 1,258,433 | ||||||||||||||||||||||||
Acquisition of Xintai | 3,333,970 | — | — | — | — | — | — | 3,333,970 | ||||||||||||||||||||||||
Acquisition of potash mineral exploration permits | — | — | 1,645,227 | — | — | — | — | 1,645,227 | ||||||||||||||||||||||||
Additions for the year | 1,825 | 47,201 | — | — | — | — | 3,622 | 52,648 | ||||||||||||||||||||||||
Disposals for the year | — | — | — | — | (3,485 | ) | — | (177 | ) | (3,662 | ) | |||||||||||||||||||||
Transfer | 17,335 | (17,335 | ) | — | — | — | — | — | — | |||||||||||||||||||||||
|
|
|
|
|
|
|
|
|
|
|
|
|
|
|
| |||||||||||||||||
At December 31, 2011 and at January 1, 2012 | 21,133,216 | 4,241,228 | 1,645,227 | 160,233 | — | 132,254 | 22,830 | 27,334,988 | ||||||||||||||||||||||||
Exchange re-alignment | 75,849 | 29,593 | 55,797 | 3,175 | — | 153 | 22,600 | 187,167 | ||||||||||||||||||||||||
Acquisition of Beisu and Yangcun | 464,600 | — | — | — | — | — | — | 464,600 | ||||||||||||||||||||||||
Acquisition of Gloucester | 3,028,962 | 2,589,405 | — | — | — | — | 933 | 5,619,300 | ||||||||||||||||||||||||
Additions for the year | 1,871,472 | 792,402 | — | — | — | — | 103,646 | 2,767,520 | ||||||||||||||||||||||||
Reclassification | — | 35,798 | (35,798 | ) | — | — | — | — | — | |||||||||||||||||||||||
Transfer | 2,388,671 | (2,388,671 | ) | — | — | — | — | — | �� | — | ||||||||||||||||||||||
|
|
|
|
|
|
|
|
|
|
|
|
|
|
|
| |||||||||||||||||
At December 31, 2012 | 28,962,770 | 5,299,755 | 1,665,226 | 163,408 | — | 132,407 | 150,009 | 36,373,575 | ||||||||||||||||||||||||
|
|
|
|
|
|
|
|
|
|
|
|
|
|
|
| |||||||||||||||||
AMORTIZATION | ||||||||||||||||||||||||||||||||
At January 1, 2011 | 426,884 | — | — | — | 252 | — | 3,673 | 430,809 | ||||||||||||||||||||||||
Exchange re-alignment | (20,393 | ) | — | — | — | (6 | ) | — | (304 | ) | (20,703 | ) | ||||||||||||||||||||
Provided for the year | 708,848 | — | — | — | 324 | — | 10,836 | 720,008 | ||||||||||||||||||||||||
Eliminated on disposals | — | — | — | — | (570 | ) | — | (175 | ) | (745 | ) | |||||||||||||||||||||
|
|
|
|
|
|
|
|
|
|
|
|
|
|
|
| |||||||||||||||||
At December 31, 2011 and at January 1, 2012 | 1,115,339 | — | — | — | — | — | 14,030 | 1,129,369 | ||||||||||||||||||||||||
Exchange re-alignment | 12,824 | 1,425 | — | — | — | — | 903 | 15,152 | ||||||||||||||||||||||||
Provided for the year | 1,161,176 | — | — | — | — | — | 16,419 | 1,177,595 | ||||||||||||||||||||||||
Impairment loss | 255,231 | 161,983 | — | — | — | — | — | 417,214 | ||||||||||||||||||||||||
|
|
|
|
|
|
|
|
|
|
|
|
|
|
|
| |||||||||||||||||
At December 31, 2012 | 2,544,570 | 163,408 | — | — | — | — | 31,352 | 2,739,330 | ||||||||||||||||||||||||
|
|
|
|
|
|
|
|
|
|
|
|
|
|
|
| |||||||||||||||||
CARRYING VALUE | ||||||||||||||||||||||||||||||||
At December 31, 2012 | 26,418,200 | 5,136,347 | 1,665,226 | 163,408 | — | 132,407 | 118,657 | 33,634,245 | ||||||||||||||||||||||||
|
|
|
|
|
|
|
|
|
|
|
|
|
|
|
| |||||||||||||||||
At December 31, 2011 | 20,017,877 | 4,241,228 | 1,645,227 | 160,233 | — | 132,254 | 8,800 | 26,205,619 | ||||||||||||||||||||||||
|
|
|
|
|
|
|
|
|
|
|
|
|
|
|
| |||||||||||||||||
YANZHOU COAL MINING COMPANY LIMITED
NOTES TO THE CONSOLIDATED FINANCIAL STATEMENTS—(Continued)
23.24. INTANGIBLE ASSETSASSETS—Continued
| Coal reserves | Coal resources | Technology | Rail access rights | Water Licenses | Others | Total | ||||||||||||||||||||||
| RMB’000 | RMB’000 | RMB’000 | RMB’000 | RMB’000 | RMB’000 | RMB’000 | ||||||||||||||||||||||
COST | ||||||||||||||||||||||||||||
At January 1, 2009 | 1,133,680 | — | — | — | — | — | 1,133,680 | |||||||||||||||||||||
Exchange re-alignment | 25,998 | — | — | — | — | — | 25,998 | |||||||||||||||||||||
Additions for the year | — | — | — | — | — | 233 | 233 | |||||||||||||||||||||
Acquisition of Felix | 13,782,538 | 3,859,559 | 153,235 | 41,523 | 7,356 | 3,812 | 17,848,023 | |||||||||||||||||||||
At December 31, 2009 and at January 1, 2010 | 14,942,216 | 3,859,559 | 153,235 | 41,523 | 7,356 | 4,045 | 19,007,934 | |||||||||||||||||||||
Exchange re-alignment | 1,224,643 | 354,020 | 14,613 | 2,135 | 699 | 713 | 1,596,823 | |||||||||||||||||||||
Acquisition of Yize | — | — | — | — | 124,565 | 7,420 | 131,985 | |||||||||||||||||||||
Additions for the year | — | 25,921 | — | 1,317 | — | 8,114 | 35,352 | |||||||||||||||||||||
Transfer | 206,922 | (206,922 | ) | — | — | — | — | — | ||||||||||||||||||||
Disposal of a joint venture and subsidiaries | (539,070 | ) | (127,293 | ) | — | (41,410 | ) | — | (348 | ) | (708,121 | ) | ||||||||||||||||
At December 31, 2010 | 15,834,711 | 3,905,285 | 167,848 | 3,565 | 132,620 | 19,944 | 20,063,973 | |||||||||||||||||||||
AMORTIZATION | ||||||||||||||||||||||||||||
At January 1, 2009 | 93,973 | — | — | — | — | — | 93,973 | |||||||||||||||||||||
Exchange re-alignment | 3,009 | — | — | — | — | — | 3,009 | |||||||||||||||||||||
Provided for the year | 44,274 | — | — | — | — | 4 | 44,278 | |||||||||||||||||||||
At December 31, 2009 and at January 1, 2010 | 141,256 | — | — | — | — | 4 | 141,260 | |||||||||||||||||||||
Exchange re-alignment | 8,601 | — | — | 11 | — | 100 | 8,712 | |||||||||||||||||||||
Provided for the year | 341,003 | — | — | 5,014 | — | 3,638 | 349,655 | |||||||||||||||||||||
Disposal of a joint venture and subsidiaries | (63,976 | ) | — | — | (4,773 | ) | — | (69 | ) | (68,818 | ) | |||||||||||||||||
At December 31, 2010 | 426,884 | — | — | 252 | — | 3,673 | 430,809 | |||||||||||||||||||||
CARRYING VALUES | ||||||||||||||||||||||||||||
At December 31, 2010 | 15,407,827 | 3,905,285 | 167,848 | 3,313 | 132,620 | 16,271 | 19,633,164 | |||||||||||||||||||||
At December 31, 2009 | 14,800,960 | 3,859,559 | 153,235 | 41,523 | 7,356 | 4,041 | 18,866,674 | |||||||||||||||||||||
The Parent Company and the Company have entered into a mining rights agreement pursuant to which the Company has agreed to pay to the Parent Company, effective from September 25, 1997, an annual fee of RMB12,980,000 as compensation for the Parent Company’s agreement to give up the mining rights associated with the Xinglongzhuang coal mine, Baodian coal mine, Nantun coal mine, Dongtan coal mine and Jining II. The annual fee is subject to change after a ten-year period. Up to the date of these financial statements, compensationCompensation fee of RMB5 per tonne of raw coal mined amounting to RMB140,708,000 (2009: RMB137,070,000)RMB145,235,000 (2011: RMB139,767,000) for the year has been preliminary agreed. Theagreed and the revised compensation fees are to be settled with governmentalthe government authority directly. The actual amount ofDuring the year, the government authority finalized its assessment on the mining compensation fee payable each yearand the Company is stillrequired to be confirmed bypay RMB2,476,780,000 for acquiring the governmental authority.
YANZHOU COAL MINING COMPANY LIMITED
NOTES TO THE CONSOLIDATED FINANCIAL STATEMENTS—(Continued)
23. INTANGIBLE ASSETS—Continued
aforesaid mining right, net off of the compensation fees paid and hence, RMB1,778,832,000 is recognised in mining reserves.
The other mining rights (coal(mining reserves) are amortized based on the following basis:unit of production method.
| ||
| ||
| ||
| ||
| ||
| ||
| ||
|
Rail access rights are amortized on a straight line basis or unit of production basis over the life of the mine.
The potash mineral exploration permit is reclassified to mineral resources according to its progress of exploration. Technology has not yet reached the stage of commercial application and therefore is not amortized.
Water licenses are amortized over the life of coal mine. The mining activities of the relevant locations have not yet been started and therefore,the connections to water sources have not been completed. Therefore, no amortization was provided.
Other intangible assets namelymainly represent computer software which is amortized on a straight line basis of 2.5 to 5 years over the useful life.
Amortization expense of the mining rights for the year of RMB341,003,000 (2009: RMB44,278,000)RMB1,161,176,000 (2011: RMB708,848,000) has been included in cost of sales and service provided. Amortization expense of other intangible assets for the year of RMB8,652,000RMB16,419,000 (2011: RMB11,160,000) has been included in selling, general and administrative expenses.
At December 31, 2010,2012, intangible assets with a carrying amount of approximately RMB18,297,975,000 (2009: RMB4,288,410,000)RMB1,960,908,000 (2011: RMB2,095,988,000) have been pledged to secure the Group’s borrowings of the Company’s subsidiaries (Note 35)(note 37).
YANZHOU COAL MINING COMPANY LIMITED
NOTES TO THE CONSOLIDATED FINANCIAL STATEMENTS—(Continued)
24.25. PROPERTY, PLANT AND EQUIPMENT
| Freehold land in Australia | Buildings | Harbor works and crafts | Railway structures | Mining structures | Plant, machinery and equipment | Transportation equipment | Construction in progress | Total | Freehold land in Australia | Buildings | Harbor works and crafts | Railway structures | Mining structures | Plant, machinery and equipment | Transportation equipment | Construction in progress | Total | |||||||||||||||||||||||||||||||||||||||||||||||||||||||
| RMB’000 | RMB’000 | RMB’000 | RMB’000 | RMB’000 | RMB’000 | RMB’000 | RMB’000 | RMB’000 | RMB’000 | RMB’000 | RMB’000 | RMB’000 | RMB’000 | RMB’000 | RMB’000 | RMB’000 | RMB’000 | |||||||||||||||||||||||||||||||||||||||||||||||||||||||
COST | ||||||||||||||||||||||||||||||||||||||||||||||||||||||||||||||||||||||||
At January 1, 2009 | 42,279 | 3,005,627 | 255,805 | 868,967 | 3,698,573 | 10,492,130 | 377,625 | 4,827,451 | 23,568,457 | |||||||||||||||||||||||||||||||||||||||||||||||||||||||||||||||
At January 1, 2011 | 292,808 | 3,941,298 | 253,678 | 1,414,596 | 5,712,927 | 20,091,382 | 388,931 | 930,600 | 33,026,220 | |||||||||||||||||||||||||||||||||||||||||||||||||||||||||||||||
Exchange re-alignment | 14,037 | 2,933 | — | — | — | 261,896 | 60 | 42,608 | 321,534 | (15,704 | ) | (13,900 | ) | — | — | (63,626 | ) | (273,697 | ) | — | (34,671 | ) | (401,598 | ) | ||||||||||||||||||||||||||||||||||||||||||||||||
Acquisition of Hua Ju Energy | — | 290,362 | — | — | — | 434,929 | 4,050 | 25,872 | 755,213 | |||||||||||||||||||||||||||||||||||||||||||||||||||||||||||||||
Acquisition of Felix | 223,963 | 35,403 | — | — | 486,736 | 1,882,269 | — | 918,536 | 3,546,907 | |||||||||||||||||||||||||||||||||||||||||||||||||||||||||||||||
Acquisition of additional interests in joint venture | — | 6,188 | — | — | 86,838 | 262,050 | — | 57,044 | 412,120 | |||||||||||||||||||||||||||||||||||||||||||||||||||||||||||||||
Acquisition of Syntech | 27,723 | — | — | — | 189,139 | 638,413 | — | 70,256 | 925,531 | |||||||||||||||||||||||||||||||||||||||||||||||||||||||||||||||
Acquisition of Premier Coal and Wesfarmers Char | 51,459 | 211,047 | — | — | 260,069 | 1,121,542 | — | 104,497 | 1,748,614 | |||||||||||||||||||||||||||||||||||||||||||||||||||||||||||||||
Acquisition of An Yuan Coal Mine | — | 47,524 | — | — | 112,016 | 16,429 | 98 | — | 176,067 | |||||||||||||||||||||||||||||||||||||||||||||||||||||||||||||||
Acquisition of Xintai | — | — | — | — | — | 167,976 | — | — | 167,976 | |||||||||||||||||||||||||||||||||||||||||||||||||||||||||||||||
Additions | 9,656 | 1,084 | — | — | — | 163,300 | 6,981 | 1,904,628 | 2,085,649 | 23,155 | 9,884 | — | — | 23,389 | 94,501 | 4,842 | 10,873,321 | 11,029,092 | ||||||||||||||||||||||||||||||||||||||||||||||||||||||
Transfers | 577 | 481,045 | — | 480,557 | 994,476 | 4,553,842 | 21,366 | (6,531,863 | ) | — | 3,330 | 94,505 | — | 158,156 | 263,351 | 1,595,832 | 58,712 | (2,173,886 | ) | — | ||||||||||||||||||||||||||||||||||||||||||||||||||||
Written off | — | — | — | — | — | — | — | (14,199 | ) | (14,199 | ) | |||||||||||||||||||||||||||||||||||||||||||||||||||||||||||||
Disposals | — | (39,410 | ) | (2,127 | ) | (2,936 | ) | — | (359,180 | ) | (36,637 | ) | — | (440,290 | ) | (1,413 | ) | (7,983 | ) | — | (23,789 | ) | (204,616 | ) | (1,283,471 | ) | (26,522 | ) | — | (1,547,794 | ) | |||||||||||||||||||||||||||||||||||||||||
|
|
|
|
|
|
|
|
| ||||||||||||||||||||||||||||||||||||||||||||||||||||||||||||||||
At December 31, 2009 and January 1, 2010 | 290,512 | 3,777,044 | 253,678 | 1,346,588 | 5,179,785 | 17,429,186 | 373,445 | 1,173,033 | 29,823,271 | |||||||||||||||||||||||||||||||||||||||||||||||||||||||||||||||
At December 31, 2011 and January 1, 2012 | 381,358 | 4,288,563 | 253,678 | 1,548,963 | 6,379,487 | 22,430,957 | 426,061 | 9,827,161 | 45,536,228 | |||||||||||||||||||||||||||||||||||||||||||||||||||||||||||||||
Exchange re-alignment | �� | 26,598 | 10,471 | — | — | 67,144 | 357,436 | 25 | 77,736 | 539,410 | 28,421 | 9,727 | — | — | 68,921 | 195,142 | — | 60,527 | 362,738 | |||||||||||||||||||||||||||||||||||||||||||||||||||||
Acquisition of Yize | — | 4,670 | — | — | — | 8 | 73 | — | 4,751 | |||||||||||||||||||||||||||||||||||||||||||||||||||||||||||||||
Acquisition of Beisu and Yangcun | — | 87,902 | — | 39,841 | 1,875 | 147,387 | 3,116 | 5,394 | 285,515 | |||||||||||||||||||||||||||||||||||||||||||||||||||||||||||||||
Acquisition of Gloucester | 681,230 | 11,749 | — | — | 1,100,283 | 1,580,100 | — | 351,124 | 3,724,486 | |||||||||||||||||||||||||||||||||||||||||||||||||||||||||||||||
Additions | 41,764 | 77,300 | — | — | 281,451 | 94,707 | 2,337 | 3,059,827 | 3,557,386 | 54,053 | 66,109 | — | 34,515 | 373,801 | 649,199 | 318 | 5,981,503 | 7,159,498 | ||||||||||||||||||||||||||||||||||||||||||||||||||||||
Transfers | 10 | 89,868 | — | 95,596 | 271,913 | 2,897,788 | 23,330 | (3,378,505 | ) | — | 10,496 | 215,186 | — | 106,086 | 101,012 | 1,543,579 | 40,708 | (2,017,067 | ) | — | ||||||||||||||||||||||||||||||||||||||||||||||||||||
Written off | — | — | — | — | — | — | — | (1,491 | ) | (1,491 | ) | |||||||||||||||||||||||||||||||||||||||||||||||||||||||||||||
Reclassification | — | — | — | — | (136,413 | ) | 136,413 | — | — | — | ||||||||||||||||||||||||||||||||||||||||||||||||||||||||||||||
Disposals | — | (18,055 | ) | — | (27,588 | ) | — | (514,073 | ) | (10,279 | ) | — | (569,995 | ) | — | (25,473 | ) | — | (35,563 | ) | (31,228 | ) | (1,051,496 | ) | (13,766 | ) | — | (1,157,526 | ) | |||||||||||||||||||||||||||||||||||||||||||
Disposal of a joint venture and subsidiaries | (66,076 | ) | — | — | — | (87,366 | ) | (173,670 | ) | — | — | (327,112 | ) | |||||||||||||||||||||||||||||||||||||||||||||||||||||||||||
|
|
|
|
|
|
|
|
| ||||||||||||||||||||||||||||||||||||||||||||||||||||||||||||||||
At December 31, 2010 | 292,808 | 3,941,298 | 253,678 | 1,414,596 | 5,712,927 | 20,091,382 | 388,931 | 930,600 | 33,026,220 | |||||||||||||||||||||||||||||||||||||||||||||||||||||||||||||||
At December 31, 2012 | 1,155,558 | 4,653,763 | 253,678 | 1,693,842 | 7,857,738 | 25,631,281 | 456,437 | 14,208,642 | 55,910,939 | |||||||||||||||||||||||||||||||||||||||||||||||||||||||||||||||
|
|
|
|
|
|
|
|
| ||||||||||||||||||||||||||||||||||||||||||||||||||||||||||||||||
ACCUMULATED DEPRECIATION AND IMPAIRMENT | ||||||||||||||||||||||||||||||||||||||||||||||||||||||||||||||||||||||||
At January 1, 2009 | — | 1,318,920 | 66,930 | 385,292 | 1,800,077 | 5,607,220 | 240,572 | — | 9,419,011 | |||||||||||||||||||||||||||||||||||||||||||||||||||||||||||||||
Exchange re-alignment | — | 936 | — | — | — | 82,274 | 50 | — | 83,260 | |||||||||||||||||||||||||||||||||||||||||||||||||||||||||||||||
Provided for the year | — | 220,440 | 12,010 | 35,765 | 86,087 | 1,399,981 | 38,995 | — | 1,793,278 | |||||||||||||||||||||||||||||||||||||||||||||||||||||||||||||||
Eliminated on disposals | — | (9,783 | ) | (1,473 | ) | (2,226 | ) | — | (302,184 | ) | (33,746 | ) | — | (349,412 | ) | |||||||||||||||||||||||||||||||||||||||||||||||||||||||||
At December 31, 2009 and January 1, 2010 | — | 1,530,513 | 77,467 | 418,831 | 1,886,164 | 6,787,291 | 245,871 | — | 10,946,137 | |||||||||||||||||||||||||||||||||||||||||||||||||||||||||||||||
At January 1, 2011 | — | 1,651,777 | 83,286 | 583,354 | 2,155,130 | 8,403,696 | 274,362 | — | 13,151,605 | |||||||||||||||||||||||||||||||||||||||||||||||||||||||||||||||
Exchange re-alignment | — | 890 | — | — | 7,470 | 56,790 | 20 | — | 65,170 | — | (925 | ) | — | — | (8,856 | ) | (46,220 | ) | — | — | (56,001 | ) | ||||||||||||||||||||||||||||||||||||||||||||||||||
Provided for the year | — | 109,779 | 5,819 | 165,254 | 271,295 | 1,836,394 | 38,085 | — | 2,426,626 | — | 109,558 | 5,702 | 300,136 | 179,661 | 1,634,746 | 36,214 | — | 2,266,017 | ||||||||||||||||||||||||||||||||||||||||||||||||||||||
Impairment loss | — | 15,356 | — | 4,127 | — | 78,076 | — | — | 97,559 | — | 49,826 | — | 20,271 | — | 211,682 | 215 | — | 281,994 | ||||||||||||||||||||||||||||||||||||||||||||||||||||||
Eliminated on disposals | — | (4,761 | ) | — | (4,858 | ) | — | (328,379 | ) | (9,614 | ) | — | (347,612 | ) | — | (5,140 | ) | — | (23,199 | ) | (54,358 | ) | (1,273,354 | ) | (25,160 | ) | — | (1,381,211 | ) | |||||||||||||||||||||||||||||||||||||||||||
Disposal a of a joint venture and subsidiaries | — | — | — | — | (9,799 | ) | (26,476 | ) | — | — | (36,275 | ) | ||||||||||||||||||||||||||||||||||||||||||||||||||||||||||||
|
|
|
|
|
|
|
|
| ||||||||||||||||||||||||||||||||||||||||||||||||||||||||||||||||
At December 31, 2010 | — | 1,651,777 | 83,286 | 583,354 | 2,155,130 | 8,403,696 | 274,362 | — | 13,151,605 | |||||||||||||||||||||||||||||||||||||||||||||||||||||||||||||||
At December 31, 2011 and January 1, 2012 | — | 1,805,096 | 88,988 | 880,562 | 2,271,577 | 8,930,550 | 285,631 | — | 14,262,404 | |||||||||||||||||||||||||||||||||||||||||||||||||||||||||||||||
Exchange re-alignment | — | 721 | — | — | 8,026 | 30,868 | — | — | 39,615 | |||||||||||||||||||||||||||||||||||||||||||||||||||||||||||||||
Provided for the year | — | 146,857 | — | 163,323 | 335,878 | 2,134,734 | 38,612 | — | 2,819,404 | |||||||||||||||||||||||||||||||||||||||||||||||||||||||||||||||
Impairment loss | — | — | — | — | 226,925 | — | — | — | 226,925 | |||||||||||||||||||||||||||||||||||||||||||||||||||||||||||||||
Eliminated on disposals | — | (4,762 | ) | (6,565 | ) | (5,564 | ) | (916,065 | ) | (7,556 | ) | — | (940,512 | ) | ||||||||||||||||||||||||||||||||||||||||||||||||||||||||||
|
|
|
|
|
|
|
|
| ||||||||||||||||||||||||||||||||||||||||||||||||||||||||||||||||
CARRYING VALUES | ||||||||||||||||||||||||||||||||||||||||||||||||||||||||||||||||||||||||
At December 31, 2010 | 292,808 | 2,289,521 | 170,392 | 831,242 | 3,557,797 | 11,687,686 | 114,569 | 930,600 | 19,874,615 | |||||||||||||||||||||||||||||||||||||||||||||||||||||||||||||||
At December 31, 2012 | — | 1,947,912 | 88,988 | 1,037,320 | 2,836,842 | 10,180,087 | 316,687 | — | 16,407,836 | |||||||||||||||||||||||||||||||||||||||||||||||||||||||||||||||
|
|
|
|
|
|
|
|
| ||||||||||||||||||||||||||||||||||||||||||||||||||||||||||||||||
At December 31, 2009 | 290,512 | 2,246,531 | 176,211 | 927,757 | 3,293,621 | 10,641,895 | 127,574 | 1,173,033 | 18,877,134 | |||||||||||||||||||||||||||||||||||||||||||||||||||||||||||||||
CARRYING VALUE | ||||||||||||||||||||||||||||||||||||||||||||||||||||||||||||||||||||||||
At December 31, 2012 | 1,155,558 | 2,705,851 | 164,690 | 656,522 | 5,020,896 | 15,451,194 | 139,750 | 14,208,642 | 39,503,103 | |||||||||||||||||||||||||||||||||||||||||||||||||||||||||||||||
|
|
|
|
|
|
|
|
| ||||||||||||||||||||||||||||||||||||||||||||||||||||||||||||||||
At December 31, 2011 | 381,358 | 2,483,467 | 164,690 | 668,401 | 4,107,910 | 13,500,407 | 140,430 | 9,827,161 | 31,273,824 | |||||||||||||||||||||||||||||||||||||||||||||||||||||||||||||||
|
|
|
|
|
|
|
|
| ||||||||||||||||||||||||||||||||||||||||||||||||||||||||||||||||
YANZHOU COAL MINING COMPANY LIMITED
NOTES TO THE CONSOLIDATED FINANCIAL STATEMENTS—(Continued)
25. PROPERTY, PLANT AND EQUIPMENT—Continued
The following estimated useful lives are used for the depreciation of property, plant and equipment, other than construction in progress and freehold land:
Buildings | 10 to 30 years | |
Harbor works and crafts | 40 years | |
Railway structures | 15 to 25 years | |
Plant, machinery and equipment | 2.5 to 25 years | |
Transportation equipment | 6 to 18 years |
YANZHOU COAL MINING COMPANY LIMITED
NOTES TO THE CONSOLIDATED FINANCIAL STATEMENTS—(Continued)
24. PROPERTY, PLANT AND EQUIPMENT—Continued
Transportation equipment includes vessels which are depreciated over the estimated useful lives of 18 years.
The mining structures include the main and auxiliary mine shafts and underground tunnels. Depreciation is provided to write off the cost of the mining structures using the units of production method based on the estimated production volume for which the structure was designed and the contractual period of the relevant mining rights.
During the year ended December 31, 2010,2012, the directors conducted a review of the Group’s mining assets and determined that a number of thoseno assets were impaired due to physical damage and technical obsolescence. Accordingly, an aggregate amount of RMB1,491,000 (2009: RMB14,199,000) have been written off in respect of construction in progress including railway projects and water engineering projects.obsolescence (2011: nil).
At December 31, 2010,2012, property, plant and equipment with a carrying amount of approximately RMB4,361,373,000 (2009: RMB3,546,907,000)RMB5,546,226,000 (2011: RMB3,325,937,000 ) have been pledged to secure bank borrowings of the Group (Note 35)(note 37).
In addition,At December 31, 2012, the Group’s finance leases (Note 35) are secured by thecarrying amount of property, plant and equipment held under the relevant finance leases with a carrying amount of RMB856,876,000 (2009: RMB651,981,000)the group was RMB225,871,000 (2011: nil).
As a result of shortage in raw materials supply of methanol operations, the raw material prices continue to rise. Therefore theThe Group assessed the recoverable amount of property, plant and equipment and the Group recognized impairment loss of RMB97,559,000RMB226,925,000 (2011: RMB281,994,000) (included in selling, general and administrative expenses) for the year ended December 31, 2010.2012.
25.26. OVERBURDEN IN ADVANCE
| At December 31, | ||||||||
| 2010 | 2009 | |||||||
| RMB’000 | RMB’000 | |||||||
Overburden in advance - cost | 149,351 | 350,676 | ||||||
| At December 31, | ||||||||
| 2012 | 2011 | |||||||
| RMB’000 | RMB’000 | |||||||
Overburden in advance – cost | 448,889 | 261,441 | ||||||
|
|
|
| |||||
Overburden in advance comprises the accumulation of expenses incurred to enable access to the coal seams, and includes direct removal costs, machinery and plant running costs. The deferred costs are presented after the deduction of the portion that has been transferred to the income statement in the period.
YANZHOU COAL MINING COMPANY LIMITED
NOTES TO THE CONSOLIDATED FINANCIAL STATEMENTS—(Continued)
26.27. GOODWILL
| 2010 | 2009 | 2012 | 2011 | |||||||||||||
| RMB’000 | RMB’000 | RMB’000 | RMB’000 | |||||||||||||
COST | ||||||||||||||||
At January 1 | 1,305,345 | 298,650 | 1,866,037 | 1,196,586 | ||||||||||||
Acquisition of Hua Ju Energy | — | 239,879 | ||||||||||||||
Acquisition of Felix | — | 766,816 | ||||||||||||||
Disposal of a joint venture and subsidiaries | (181,883 | ) | — | |||||||||||||
Acquisition of Syntech | — | 25,642 | ||||||||||||||
Acquisition of Premier Coal and Wesfarmers Char | — | 17,849 | ||||||||||||||
Acquisition of Xintai | — | 653,837 | ||||||||||||||
Acquisition of Beisu and Yangcun | 712,214 | — | ||||||||||||||
Exchange re-alignment | 73,124 | — | 13,185 | (27,877 | ) | |||||||||||
Impairment loss | (17,625 | ) | — | |||||||||||||
|
| |||||||||||||||
At December 31 | 1,196,586 | 1,305,345 | 2,573,811 | 1,866,037 | ||||||||||||
|
| |||||||||||||||
Goodwill acquired in a business combination is allocated, at acquisition, to the cash generating units that are expected to benefit from that business combination. The carrying amount of goodwill had been allocated as follows:
| 2010 | 2009 | At December 31, | ||||||||||||||
| RMB’000 | RMB’000 | 2012 | 2011 | |||||||||||||
Coal Mining | ||||||||||||||||
| RMB’000 | RMB’000 | |||||||||||||||
Mining | ||||||||||||||||
- Jining II | 10,106 | 10,106 | 10,106 | 10,106 | ||||||||||||
- Shandong Yanmei Shipping Co., Ltd | 10,046 | 10,046 | 10,046 | 10,046 | ||||||||||||
- Heze | 35,645 | 35,645 | 35,645 | 35,645 | ||||||||||||
- Shanxi Group | 145,613 | 145,613 | 145,613 | 145,613 | ||||||||||||
- Felix | 658,057 | 766,816 | ||||||||||||||
- Yancoal Resources | 640,650 | 628,202 | ||||||||||||||
- Syntech | 28,581 | 28,035 | ||||||||||||||
- Premier Coal and Wesfarmers Char | 17,625 | 17,434 | ||||||||||||||
- Xintai | 653,837 | 653,837 | ||||||||||||||
- Beisu and Yangcun | 712,214 | — | ||||||||||||||
Coal Railway Transportation | ||||||||||||||||
- Railway Assets | 97,240 | 97,240 | 97,240 | 97,240 | ||||||||||||
Electricity and heat supply | ||||||||||||||||
- Hua Ju Energy | 239,879 | 239,879 | 239,879 | 239,879 | ||||||||||||
Impairment loss | (17,625 | ) | — | |||||||||||||
| 1,196,586 | 1,305,345 |
|
| |||||||||||||
| 2,573,811 | 1,866,037 | |||||||||||||||
|
| |||||||||||||||
The recoverable amounts of goodwill from each of the above cash generating units have been determined on the basis of value in use calculations. The recoverable amounts are based on certain similar key assumptions on discount rates, growth rates and expected changes in selling prices, foreign currency exchange rates, mining reserves and mining resources and direct cost. All value in use calculations use cash flow projections based on financial budgets approved by management covering a 5-year period, using a zero percent growth rate and with aan assumption of discount rate of 8-11% (2011: 8-10% (2009: 8%).
YANZHOU COAL MINING COMPANY LIMITED
NOTES TO THE CONSOLIDATED FINANCIAL STATEMENTS—(Continued)
27. GOODWILL—Continued
The cash flows beyond the 5-year period are extrapolated for 5 years using a zero percent growth rate. Cash flow projections during the budget period for each of the above units are based on the budgeted revenue and expected gross margins during the budget period and the same raw materials price inflation during the budget period. Expected cash inflows/outflows, which include budgeted sales, gross margin and raw material price inflation, have been determined based on past performance and management’s expectations for the market development. Management believes that any reasonably possible change in any of these assumptions would not cause the carrying amount of each of the above units to exceed the recoverable amount of each of the above units. During the yearsyear ended 31 December 31, 2010 and 2009,2012, the Group’s management determines that the recoverable cash flows of certain cash-generating unit is less than its commercial value, the Group determined that there are no impairmentsrecognised impairment loss on goodwill of anyRMB17,625,000 (2011: nil) in respect of its cash-generating units containinggoodwill arising from the acquisition of Premier Coal and Wesfarmers Char. No indication for impairment on other goodwill.
YANZHOU COAL MINING COMPANY LIMITED
NOTES TO THE CONSOLIDATED FINANCIAL STATEMENTS—(Continued)
27.28. INVESTMENTS IN SECURITIES
The investments in securities represent available-for-sale equity investments:
| At December 31, | At December 31, | |||||||||||||||
| 2010 | 2009 | 2012 | 2011 | |||||||||||||
| RMB’000 | RMB’000 | RMB’000 | RMB’000 | |||||||||||||
Equity securities listed on the SSE | ||||||||||||||||
Equity securities listed on the Shanghai Stock Exchange (“SSE”) | ||||||||||||||||
- Stated at fair value | 194,258 | 264,672 | 167,572 | 173,495 | ||||||||||||
Unlisted equity securities | 30,184 | 30,623 | 39,504 | 199,305 | ||||||||||||
|
| |||||||||||||||
| 224,442 | 295,295 | 207,076 | 372,800 | |||||||||||||
|
| |||||||||||||||
Previously,The investments in equity securities listed on the Group invested in certain state legal person sharesSSE of the Company included Shanghai Shenergy Company Limited and Jiangsu Lian Yun Gang Port Corporation Limited. These shares were not tradable.
Pursuant to the share reform plan of Shenergy Company Limited, carried out in 2006, the non-tradable legal person shares with the investment cost of RMB60,421,000 held by the Company were converted into tradable shares on August 17, 2006. Under this share reform plan, the Company has committed that the Company will not sell more than one-third of the shares held as of August 17, 2005 within one year after August 17, 2006; and two-third of the shares held as of August 17, 2005 within two years after August 17, 2006. This investment is presented as listed securities stated at the fair value as at December 31, 2010 at the amount2012 of RMB185,661,000 (2009:RMB254,046,000).
On April 26, 2007, Jiangsu Lian Yun Gang Port Corporation Limited became a public company with its shares listed in SSE. The Company has committed not to sell its holding, or transfer to others before April 28, 2008. This investment is presented as listed securities which amount to RMB8,597,000 as at December 31, 2010 (2009:RMB10,626,000).RMB161,328,000 (2011: RMB167,533,000) and RMB6,244,000 (2011: RMB5,962,000) respectively.
The investments in equity securities listed on the SSE are carried at fair value determined according to the quoted market prices in an active market.
The unlisted equity securities are stated at cost less impairment at each balance sheet date because the range of reasonable fair value estimates is so significant that the directors of the Company are of the opinion that their fair value cannot be measured reliably.
YANZHOU COAL MINING COMPANY LIMITED
NOTES TO THE CONSOLIDATED FINANCIAL STATEMENTS—(Continued)
28.29. INTERESTS IN ASSOCIATES
| At December 31, | At December 31, | |||||||||||||||
| 2010 | 2009 | 2012 | 2011 | |||||||||||||
| RMB’000 | RMB’000 | RMB’000 | RMB’000 | |||||||||||||
Cost of investments in associates | 1,025,000 | 900,000 | 2,378,927 | 1,565,000 | ||||||||||||
Share of post-acquisition profit and other comprehensive income | 49,958 | 39,981 | 260,973 | 118,897 | ||||||||||||
Dividend received | (15,624 | ) | — | |||||||||||||
|
| |||||||||||||||
| 1,074,958 | 939,981 | 2,624,276 | 1,683,897 | |||||||||||||
|
| |||||||||||||||
Information onof major associates is as follows:
| Place of establishment and operation | Class of shares held | Principal activity | At December 31, | Place of establishment and operation | Class of shares held | Principal activity | At December 31, | |||||||||||||||||||||
| 2010 | 2009 | 2012 | 2011 | |||||||||||||||||||||||||
Name of associate | Interest held | Interest held | Interest held | Interest held | ||||||||||||||||||||||||
Huadian Zouxian Power Generation Company Limited | PRC | | Registered Capital | | | Electricity generation business | | 30% | 30% | PRC | | Registered Capital | | | Electricity generation business | | 30% | 30% | ||||||||||
Yankuang Group Finance Company Limited | PRC | | Registered Capital | | | Financial services | | 25% | — | PRC | | Registered Capital | | | Financial services | | 25% | 25% | ||||||||||
Shaanxi Future Energy Chemical Corp. Ltd | PRC | | Registered Capital | | | Production and sales of chemical products, oil and coal | | 25% | 25% | |||||||||||||||||||
Shengyang Wood | PRC | | Registered Capital | |
| Artificial board, CCF processing |
| 39.77% | — | |||||||||||||||||||
Jiemei Wall Material | PRC | | Registered Capital | | | Coal refuse baked brick | | 20% | — | |||||||||||||||||||
Newcastle Coal Infrastructure Group Pty Ltd | Australia | | Registered Capital | | Coal terminal | 27% | — | |||||||||||||||||||||
Huadian Zouxian Power Generation Company Limited and YankuangExcept Newcastle Coal Infrastructure Group Finance Company LimitedPty Ltd, all associates are held by the Company directly.
Summarized financial information in respect of the Group’s associates is set out below:
| At December 31, | ||||||||
| 2010 | 2009 | |||||||
| RMB’000 | RMB’000 | |||||||
Total assets | 12,631,030 | 6,945,366 | ||||||
Total liabilities | (8,963,100 | ) | (3,812,095 | ) | ||||
Net assets | 3,667,930 | 3,133,271 | ||||||
Group’s share of net assets of associates | 1,074,958 | 939,981 | ||||||
| Year ended December 31, | ||||||||
| 2010 | 2009 | |||||||
| RMB’000 | RMB’000 | |||||||
Revenue | 4,239,375 | 3,832,204 | ||||||
Profit for the year | 30,968 | 365,954 | ||||||
Group’s share of profit of associates | 8,870 | 109,786 | ||||||
Group’s share of other comprehensive income of associates | 1,107 | — | ||||||
| 2012 | 2011 | |||||||
| RMB’000 | RMB’000 | |||||||
Total assets | 24,751,952 | 15,707,916 | ||||||
Total liabilities | (15,289,724 | ) | (9,621,441 | ) | ||||
|
|
|
| |||||
Net assets | 9,462,228 | 6,086,475 | ||||||
|
|
|
| |||||
Group’s share of net assets of associates | 2,624,276 | 1,683,897 | ||||||
|
|
|
| |||||
YANZHOU COAL MINING COMPANY LIMITED
NOTES TO THE CONSOLIDATED FINANCIAL STATEMENTS—(Continued)
29. INTERESTS IN ASSOCIATES—Continued
| For the year ended December 31, | ||||||||
| 2012 | 2011 | |||||||
| RMB’000 | RMB’000 | |||||||
Revenue | 5,030,530 | 4,343,215 | ||||||
|
|
|
| |||||
Profit for the year | 496,690 | 258,546 | ||||||
|
|
|
| |||||
Group’s share of profit of associates | 141,986 | 68,939 | ||||||
|
|
|
| |||||
Group’s share of other comprehensive income of associates | 90 | — | ||||||
|
|
|
| |||||
29.30. LONG TERM RECEIVABLES
| At December 31, | ||||||||
| 2012 | 2011 | |||||||
| RMB’000 | RMB’000 | |||||||
Loan to a jointly controlled entity (i) | 1,682,983 | — | ||||||
Others (ii) | 318,475 | 300,083 | ||||||
|
|
|
| |||||
| 2,001,458 | 300,083 | |||||||
|
|
|
| |||||
| (i) | Loan to a jointly controlled entity represented a loan to Middlemount Joint Venture of AUD257,483,000. The loan is unsecured and due on December 24, 2015 with normal commercial interest rate. |
| (ii) | Other long term receivables represented an investment in preference shares of a company (AUD15,300,000) with cumulative dividends and investment in the long term bonds of a company (AUD31,500,000) with floating interest rate. |
31. DEPOSITS MADE ON INVESTMENTS
| At December 31, | ||||||||
| 2010 | 2009 | |||||||
| RMB’000 | RMB’000 | |||||||
Shaanxi coal mine operating company | 117,926 | 117,926 | ||||||
Inner Mongolia Rong Xin Chemical Co., Ltd. | — | 1,320 | ||||||
Inner Mongolia Yi Feng Mining Investment Co., Ltd. | — | 53,880 | ||||||
Inner Mongolia Da Xin Industrial Gases Co., Ltd. | — | 1,800 | ||||||
Stamp duty paid | — | 95 | ||||||
Inner Mongolia Haosheng Coal Mining Limited | 2,045,753 | — | ||||||
Yijinhuoluo Qi Nalin Tao Hai Town An Yuan Coal Mine | 1,080,000 | — | ||||||
| 3,243,679 | 175,021 | |||||||
| At December 31, | ||||||||
| 2012 | 2011 | |||||||
| RMB’000 | RMB’000 | |||||||
Shaanxi coal mine operating company | 117,926 | 117,926 | ||||||
Inner Mongolia Haosheng Coal Mining Limited | 2,982,455 | 2,439,881 | ||||||
Shandong Yanmei Rizhao Port Coal Storage and Blending Co., Ltd. | 153,000 | — | ||||||
|
|
|
| |||||
| 3,253,381 | 2,557,807 | |||||||
|
|
|
| |||||
During 2006, the Company entered into a co-operative agreement with two independent third parties to establish a company for acquiring a coal mine in Shaanxi province for operations. The Company will have to invest approximately RMB196.8 millionRMB196,800,000 in order to obtain 41% equity interest. As at December 31, 2010,2012, the Company made a deposit of RMB118 million (2009: RMB118 million)RMB117,926,000 (2011: RMB117,926,000) in relation to this acquisition. As at December 31, 2010,2012, the relevant procedures to establish the new company are still in progress, and the establishment has not yet been completed.
During the year, the Company entered into a co-operative agreement with an independent third party to acquire the Yijinhuoluo Qi Nalin Tao Hai Town An Yuan Coal Mine at a consideration of RMB1,435 million. As at December 31, 2010, the Company made a deposit of RMB1,080 million on this investment. According to the agreement, the completion of acquisition is subject to the relevant approval from government authority. As at December 31, 2010, the transfer and the relevant procedures are still in progress and the acquisition has not yet been completed.
During the year, the Company entered into a co-operative agreement with three independent companiesthird parties to acquire 51% equity interest of Inner Mongolia HaoshengHao Sheng Coal Mining Limited (‘(“Hao Sheng’Sheng”) at a consideration of RMB6,649 million and to obtain the mining rights of the Shilawusu Coal Field (‘(“the mining right’right”) in name of Hao Sheng. As
YANZHOU COAL MINING COMPANY LIMITED
NOTES TO THE CONSOLIDATED FINANCIAL STATEMENTS—(Continued)
31. DEPOSITS MADE ON INVESTMENTS—Continued
During 2011, the Company entered into another co-operative agreement with two independent third parties to acquire additional 10% shareholding of Hao Sheng at a consideration of RMB1,314,000,000. In addition, the Company agreed to contribute RMB51 million in respect of increased registered capital of Hao Sheng.
On March 6, 2012, in response to the withdrawal of the allocated resources to one of the contract parties, Ordos Jin Cheng Tai Chemical Co., Ltd. (“Jin Cheng Tai”), by the Inner Mongolia government authority, the Company, together with four contract parties unanimously agreed to reduce the registered capital of Hao Sheng to RMB104,385,000 and adjust the equity interest of each contract party according to its share on the allocated resources. In addition, the Company entered into an additional agreement with Jin Cheng Tai to acquire additional 9.45% interest and adjusted the consideration paid to Jin Cheng Tai. During the year, the Company agreed with four contract parties to increase the registered capital of Hao Sheng by RMB 395,615,000.
Upon completion of the above agreements, the Company will hold 74.82% equity interest in Hao Sheng and the respective mining resources. Pursuant to the agreement, if the exploration license cannot be obtained within two years, this acquisition will be canceled and any consideration paid will be fully refunded to the Company. A supplemental agreement was entered with four contract parties during the year to extend the aforesaid terms for another two years. At December 31, 2010,2012, the Company made a deposit of RMB2,046 million in relation topaid RMB 2,982,455,000 (2011: RMB 2,439,881,000) for this acquisition. As at December 31, 2010, the relevant procedures are still in progress and the mining right has not yet been obtained. As the conditions of theinvestment. Since this acquisition is to obtain the mining rightrights in name of Hao Sheng, hencetherefore, the acquisitiontransaction has not been completed.
During the year, the Company entered into a cooperation agreement with two independent third parties to set up a company, Shandong Yanmei Rizhao Port Coal Storage and Blending Co., Ltd., as a coal blending, storage and distribution base in Rizhao Port. The Company contributed RMB153,000,000, representing 51% of its equity interest. At December 31, 2012, the registration procedures of such company have not yet completed.
YANZHOU COAL MINING COMPANY LIMITED
NOTES TO THE CONSOLIDATED FINANCIAL STATEMENTS—(Continued)
30.32. INTERESTS IN JOINTLY CONTROLLED ENTITIES
| At December 31, | ||||||||
| 2010 | 2009 | |||||||
| RMB’000 | RMB’000 | |||||||
Share of net assets | 751 | 1,257 | ||||||
| At December 31, | ||||||||
| 2012 | 2011 | |||||||
| RMB’000 | RMB’000 | |||||||
Share of net assets | 1,086,985 | 19,453 | ||||||
|
|
|
| |||||
Information on major jointly controlled entities is as follows:
| Place of establishment and operation | Class of shares held | Principal activity | At December 31, | Place of establishment and operation | Class of shares held | Principal activity | At December 31, | |||||||||||||||||||||||||||||||||||||||
| 2010 | 2009 | 2012 | 2011 | |||||||||||||||||||||||||||||||||||||||||||
Name of jointly controlled entity | Voting power | Interest held | Voting power | Interest held | Voting power | Interest held | Voting power | Interest Held | ||||||||||||||||||||||||||||||||||||||
Australian Coal Processing Holdings Pty Ltd (i) | Australia | Ordinary shares | Holding company | 33.33% | 60% | 33.33 | % | 60 | % | Australia | Ordinary shares | Investment holding | 50 | % | 90 | % | 50 | % | 90 | % | ||||||||||||||||||||||||||
Ashton Coal Mines Limited (ii) | Australia | Ordinary shares | Real estate holder & sales company | 33.33% | 60% | 33.33 | % | 60 | % | Australia | Ordinary shares | | Real estate holder & sales company | | 50 | % | 90 | % | 50 | % | 90 | % | ||||||||||||||||||||||||
Middlemount Joint Venture (iii) | Australia | Ordinary shares | Coal mining and sales | 50 | % | 49.9997 | % | — | — | |||||||||||||||||||||||||||||||||||||
| (i) |
| (ii) |
| (iii) |
YANZHOU COAL MINING COMPANY LIMITED
NOTES TO THE CONSOLIDATED FINANCIAL STATEMENTS—(Continued)
30.32. INTERESTS IN JOINTLY CONTROLLED ENTITIES—Continued
| (iv) | The above jointly controlled entities are indirectly held by the Company. |
Summarized financial information in respect of the Group’s jointly controlled entities is set out below:
| At December 31, | ||||||||
| 2010 | 2009 | |||||||
| RMB’000 | RMB’000 | |||||||
Total assets | 82,698 | 245,024 | ||||||
Total liabilities | (81,447 | ) | (242,929 | ) | ||||
Net assets | 1,251 | 2,095 | ||||||
Group’s share of net assets of jointly controlled entities | 751 | 1,257 | ||||||
| At December 31, | ||||||||
| 2012 | 2011 | |||||||
| RMB’000 | RMB’000 | |||||||
Share of total assets | 4,624,385 | 207,331 | ||||||
Share of total liabilities | (3,537,400 | ) | (187,878 | ) | ||||
|
|
|
| |||||
Group’s Share of net assets | 1,086,985 | 19,453 | ||||||
|
|
|
| |||||
| Year ended December 31, | ||||||||
| 2010 | 2009 | |||||||
| RMB’000 | RMB’000 | |||||||
Revenue | 2,029,948 | — | ||||||
Loss for the year | (770 | ) | — | |||||
Group’s share of net loss of jointly controlled entities | (462 | ) | — | |||||
Share of revenue Group’s Share of net loss For the year ended
December 31, 2012 2011 RMB’000 RMB’000 1,235,139 1,616,364 (103,217 ) —
YANZHOU COAL MINING COMPANY LIMITED
NOTES TO THE CONSOLIDATED FINANCIAL STATEMENTS—(Continued)
31.33. INTERESTS IN JOINT VENTURES
Information on major joint ventures (other than jointly controlled entities) is as follows:
Place of | Principal activity | At December 31, | Place of establishment and operation | Principal activity | At December 31, | |||||||||||||||||||||
| 2010 | 2009 | 2012 | 2011 | |||||||||||||||||||||||
Name of joint venture | Interest held | Interest held | Interest held | Interest held | ||||||||||||||||||||||
Boonal joint venture | Australia | Provision of a coal haul road and train load out facilities | 50 | % | 50 | % | Australia | Provision of a coal haul road and train load out facilities | 50 | % | 50 | % | ||||||||||||||
Athena joint venture | Australia | Coal exploration | 51 | % | 51 | % | Australia | Coal exploration | 51 | % | 51 | % | ||||||||||||||
Ashton joint venture | Australia | Development and operation of open-cut and underground coal mines | 60 | % | 60 | % | Australia | Development and operation of open-cut and underground coal mines | 90 | % | 90 | % | ||||||||||||||
Moolarben joint venture | Australia | Development and operation of open-cut and underground coal mines | 80 | % | 80 | % | Australia | Development and operation of open-cut and underground coal mines | 80 | % | 80 | % | ||||||||||||||
The above joint ventures are established and operated as unincorporated businesses and are held indirectly by the Company. These joint ventures are consolidated into the Company’s consolidated financial statements due to the acquisition of Felix. Therefore results of joint ventures were not shared by the Group during 2009.
YANZHOU COAL MINING COMPANY LIMITED
NOTES TO THE CONSOLIDATED FINANCIAL STATEMENTS—(Continued)
33. INTERESTS IN JOINT VENTURES—Continued
The Group’s interest in the assets and liabilities of the joint ventures are set out below:
| At December 31, | ||||||||
| 2010 | 2009 | |||||||
| RMB’000 | RMB’000 | |||||||
Current assets | 588,626 | 537,378 | ||||||
Non-current assets | 19,264,652 | 18,677,130 | ||||||
Current liabilities | (218,206 | ) | (326,604 | ) | ||||
Non-current liabilities | (57,218 | ) | (30,327 | ) | ||||
| 19,577,854 | 18,857,577 | |||||||
YANZHOU COAL MINING COMPANY LIMITED
NOTES TO THE CONSOLIDATED FINANCIAL STATEMENTS—(Continued)
31. INTERESTS IN JOINT VENTURES—Continued
| At December 31, | ||||||||
| 2012 | 2011 | |||||||
| RMB’000 | RMB’000 | |||||||
Current assets | 1,019,077 | 859,702 | ||||||
Non-current assets | 20,860,234 | 20,243,996 | ||||||
Current liabilities | (20,478,765 | ) | (284,493 | ) | ||||
Non-current liabilities | (113,300 | ) | (79,765 | ) | ||||
|
|
|
| |||||
| 1,287,246 | 20,739,440 | |||||||
|
|
|
| |||||
The Group’s share of revenue, expenses and profitloss before income tax of the joint ventures are set out below:
| Year ended December 31, | ||||||||
| 2010 | 2009 | |||||||
| RMB’000 | RMB’000 | |||||||
Revenue | 28,834 | — | ||||||
Expenses | (2,138,986 | ) | — | |||||
Loss before income tax | (2,110,152 | ) | — | |||||
The assets and liabilities as at December 31, 2009 included the Minerva joint venture disposed of during the year (note 45).
| For the year ended December 31, | ||||||||
| 2012 | 2011 | |||||||
| RMB’000 | RMB’000 | |||||||
Revenue | 6,085,954 | 1,007,606 | ||||||
Expenses | (9,282,244 | ) | (4,246,184 | ) | ||||
|
|
|
| |||||
Loss before income tax | (3,196,290 | ) | (3,238,578 | ) | ||||
|
|
|
| |||||
32.34. BILLS AND ACCOUNTS PAYABLE
| At December 31, | At December 31, | |||||||||||||||
| 2010 | 2009 | 2012 | 2011 | |||||||||||||
| RMB’000 | RMB’000 | RMB’000 | RMB’000 | |||||||||||||
Accounts payable | 2,906,612 | 2,003,643 | ||||||||||||||
- To third parties | 1,420,042 | 1,242,349 | ||||||||||||||
- To a jointly controlled entity | 7,943 | 5,667 | ||||||||||||||
| 1,427,985 | 1,248,016 | |||||||||||||||
Bills payable | 126,459 | 118,960 | 3,905,148 | 237,201 | ||||||||||||
|
| |||||||||||||||
| 1,554,444 | 1,366,976 | 6,811,760 | 2,240,844 | |||||||||||||
|
| |||||||||||||||
The following is an aged analysis of bills and accounts payable based on the invoice dates at the balance sheet date:
| At December 31, | At December 31, | |||||||||||||||
| 2010 | 2009 | 2012 | 2011 | |||||||||||||
| RMB’000 | RMB’000 | RMB’000 | RMB’000 | |||||||||||||
1 - 90 days | 1,321,149 | 1,153,686 | 6,384,206 | 1,790,743 | ||||||||||||
91 - 180 days | 78,647 | 84,400 | 224,505 | 257,392 | ||||||||||||
181 - 365 days | 23,607 | 46,955 | 68,640 | 60,865 | ||||||||||||
1 - 2 years | 131,041 | 81,935 | ||||||||||||||
Over 1 year | 134,409 | 131,844 | ||||||||||||||
|
| |||||||||||||||
| 1,554,444 | 1,366,976 | 6,811,760 | 2,240,844 | |||||||||||||
|
| |||||||||||||||
The average credit period for accounts payable and bills payable is 90 days. The Group has financial risk management policies in place to ensure that all payables are within the credit timeframe.
YANZHOU COAL MINING COMPANY LIMITED
NOTES TO THE CONSOLIDATED FINANCIAL STATEMENTS—(Continued)
33.35. OTHER PAYABLES AND ACCRUED EXPENSES
| At December 31, | ||||||||
| 2010 | 2009 | |||||||
| RMB’000 | RMB’000 | |||||||
Customers’ deposits | 1,378,811 | 1,488,748 | ||||||
Accrued wages | 823,655 | 578,679 | ||||||
Other taxes payable | 280,028 | 166,604 | ||||||
Payables in respect of purchases of property, plant and equipment and construction materials | 324,136 | 643,674 | ||||||
Accrued freight charges | 5,466 | 58,119 | ||||||
Accrued repairs and maintenance | 24,177 | 35,846 | ||||||
Accrued utility expenses | 8,516 | 18,829 | ||||||
Staff welfare payable | 96,501 | 122,487 | ||||||
Withholding tax payable | 258 | 1,869 | ||||||
Deposits received from employees | 9,946 | 14,469 | ||||||
Coal Price adjustment fund | 36,031 | 34,764 | ||||||
Accrued land subsidence, restoration, rehabilitation and environmental costs | 691 | 78,356 | ||||||
Payable on compensation fee of mining rights | 412,919 | 272,210 | ||||||
Payables by Felix to companies related to its directors (note) | — | 602,597 | ||||||
Others | 419,836 | 324,583 | ||||||
| 3,820,971 | 4,441,834 | |||||||
| At December 31, | ||||||||
| 2012 | 2011 | |||||||
| RMB’000 | RMB’000 | |||||||
Customers’ deposits | 1,368,734 | 1,523,567 | ||||||
Accrued wages | 1,084,200 | 1,047,144 | ||||||
Other taxes payable | 204,082 | 431,728 | ||||||
Payables in respect of purchases of property, plant and equipment and construction materials | 3,662,785 | 2,733,713 | ||||||
Accrued freight charges | 9,434 | 3,871 | ||||||
Accrued repairs and maintenance | 51,221 | 34,957 | ||||||
Staff welfare payable | 187,631 | 94,121 | ||||||
Withholding tax payable | 7,251 | 641 | ||||||
Deposits received from employees | 24,736 | 12,847 | ||||||
Coal price adjustment fund | 51,995 | 47,072 | ||||||
Accrued land subsidence, restoration, rehabilitation and environmental costs | 1,446 | 533 | ||||||
Payable on compensation fee of mining rights | — | 552,686 | ||||||
Interest payable | 395,778 | 243,437 | ||||||
Others | 1,964,504 | 618,498 | ||||||
|
|
|
| |||||
| 9,013,797 | 7,344,815 | |||||||
|
|
|
| |||||
34.36. PROVISION FOR LAND SUBSIDENCE, RESTORATION, REHABILITATION AND ENVIRONMENTAL COSTS
| 2010 | 2009 | 2012 | 2011 | |||||||||||||
| RMB’000 | RMB’000 | RMB’000 | RMB’000 | |||||||||||||
Balance at January 1 | 1,608,808 | 450,979 | 3,181,643 | 2,453,231 | ||||||||||||
Acquisition of Felix | — | 48,170 | ||||||||||||||
Disposal of a joint venture and subsidiaries | (6,878 | ) | — | |||||||||||||
Exchange re-alignment | 12,791 | — | 24,248 | (11,267 | ) | |||||||||||
Acquisition of Syntech | — | 14,259 | ||||||||||||||
Acquisition of Premier Coal and Wesfarmers Char | — | 168,847 | ||||||||||||||
Acquisition of Beisu and Yangcun | 20 | — | ||||||||||||||
Acquisition of Gloucester | 100,145 | — | ||||||||||||||
Additional provision in the year | 1,532,200 | 1,733,325 | 1,450,557 | 1,513,084 | ||||||||||||
Utilization of provision | (693,690 | ) | (623,666 | ) | (986,347 | ) | (956,511 | ) | ||||||||
|
| |||||||||||||||
Balance at December 31 | 2,453,231 | 1,608,808 | 3,770,266 | 3,181,643 | ||||||||||||
|
| |||||||||||||||
Presented as: | ||||||||||||||||
Current portion | 2,300,637 | 1,564,106 | 3,291,857 | 2,856,229 | ||||||||||||
Non-current portion | 152,594 | 44,702 | 478,409 | 325,414 | ||||||||||||
|
| |||||||||||||||
| 2,453,231 | 1,608,808 | 3,770,266 | 3,181,643 | |||||||||||||
|
| |||||||||||||||
YANZHOU COAL MINING COMPANY LIMITED
NOTES TO THE CONSOLIDATED FINANCIAL STATEMENTS—(Continued)
34. PROVISION FOR LAND SUBSIDENCE, RESTORATION, REHABILITATION AND ENVIRONMENTAL COSTS—Continued
The provisionProvision for land subsidence, restoration, rehabilitation and environmental costs has been determined by the directors based on their best estimates. However, in so far as the effect on the land and the environment from current mining activities becomes apparent in future periods, the estimate of the associated costs may be subject to change in the near term.
35.YANZHOU COAL MINING COMPANY LIMITED
NOTES TO THE CONSOLIDATED FINANCIAL STATEMENTS—(Continued)
37. BORROWINGS
| At December 31, | At December 31, | |||||||||||||||
| 2010 | 2009 | 2012 | 2011 | |||||||||||||
| RMB’000 | RMB’000 | RMB’000 | RMB’000 | |||||||||||||
Current liabilities | ||||||||||||||||
Bank borrowings | ||||||||||||||||
- Unsecured borrowings (i) | 156,278 | 22,000 | 5,024,476 | 13,193,083 | ||||||||||||
- Secured borrowings (ii) | 375,978 | 919,410 | 657,876 | 6,395,413 | ||||||||||||
Finance leases (iii) | 82,669 | 656,703 | ||||||||||||||
Loans pledged by machineries (iii) | 2,000,000 | — | ||||||||||||||
Finance lease liabilities (iv) | 30,240 | — | ||||||||||||||
|
| |||||||||||||||
| 614,925 | 1,598,113 | 7,712,592 | 19,588,496 | |||||||||||||
Non-current liabilities | ||||||||||||||||
Bank borrowings | ||||||||||||||||
- Unsecured borrowings (i) | 789,962 | 154,000 | 3,875,665 | 2,110,000 | ||||||||||||
- Secured borrowings (ii) | 20,871,536 | 20,757,728 | 17,967,840 | 12,759,324 | ||||||||||||
Finance leases (iii) | 739,335 | — | ||||||||||||||
Finance lease liabilities (iv) | 202,450 | — | ||||||||||||||
Guaranteed notes (v) | 11,237,835 | — | ||||||||||||||
|
| |||||||||||||||
| 22,400,833 | 20,911,728 | 33,283,790 | 14,869,324 | |||||||||||||
|
| |||||||||||||||
Total borrowings | 23,015,758 | 22,509,841 | 40,996,382 | 34,457,820 | ||||||||||||
|
| |||||||||||||||
(i) Unsecured borrowings are repayable as follows:
| At December 31, | At December 31, | |||||||||||||||
| 2010 | 2009 | 2012 | 2011 | |||||||||||||
| RMB’000 | RMB’000 | RMB’000 | RMB’000 | |||||||||||||
Within one year | 156,278 | 22,000 | 5,024,476 | 13,193,083 | ||||||||||||
More than one year, but not exceeding two years | 679,962 | 22,000 | 256,000 | 22,000 | ||||||||||||
More than two years, but not more than five years | 66,000 | 66,000 | 3,619,665 | 2,066,000 | ||||||||||||
More than five years | 44,000 | 66,000 | — | 22,000 | ||||||||||||
|
| |||||||||||||||
Total | 946,240 | 176,000 | 8,900,141 | 15,303,083 | ||||||||||||
|
| |||||||||||||||
The balance as ofAt December 31, 2010 represented2012, short-term borrowings amounting to RMB3,110,432,000 (2011: RMB11,892,000,000). Three new short-term borrowings of RMB1,083,858,000 (EUR130,165,000) are dominated in foreign currency with interest rates at three-months LIBOR plus a margin of 2%, approximately 2.31% (2011: nil). The remaining short term borrowings carried interest at 5.40%-6.56% per annum (2011: 6.06%-6.56% per annum). Long-term borrowings amounting to RMB4,403,887,000 (2011:RMB2,000,000,000) with RMB616,222,000 payable within one year. Long-term borrowing obtainedof RMB2,404,000,000 carried interest at 6.90% per annum while the remaining carried interest at 5.80% per annum (2011: 6.90% per annum). The interest rate will be adjusted in accordance with the benchmark lending rate published by Shanxi Tianchi before the Company acquired it and three newPeople’s Bank of China (“PBOC”). Long-term borrowings obtainedare guaranteed by Australian subsidiaries during the year. Parent Company.
The loan of Shanxi Tianchi amounting to RMB154,000,000 (2009: RMB176,000,000)was a loan which acquired before the acquisition of Shanxi Tianchi with the amount of RMB110,000,000 (2011: RMB132,000,000) carried interest at 5.94% (2009: 5.94%6.4% (2011: 7.05%) per annum and is subject to adjustment based on the interest rate stipulated by the People’s Bank of China (“PBOC”). ThePBOC. This loan is repayable by 20 instalments over a period of 12 years, with the first instalment due in May 2008. The amountloan is guaranteed by the Parent Company.
The total unsecured borrowings of Australian subsidiaries amounting to RMB792,240,000 (AUD 118,000,000) carried interest at three-month BBSY plus a margin of 1.5% (approximately 6.3%).
YANZHOU COAL MINING COMPANY LIMITED
NOTES TO THE CONSOLIDATED FINANCIAL STATEMENTS—(Continued)
35.37. BORROWINGS—Continued
(i) Unsecured borrowings are repayable as follows:—Continued
The short-term borrowings of Yancoal International amounting to RMB1,275,822,000 (USD203,000,000; 2011: RMB1,279,083,000), the borrowings carried interest at LIBOR plus a margin of 1.7%, approximately 2.01% (2011: LIBOR plus 2.6%, approximately 3.16%). The loan will be fully repayable at maturity.
(ii) Secured borrowings are repayable as follows:
| At December 31, | At December 31, | |||||||||||||||
| 2010 | 2009 | 2012 | 2011 | |||||||||||||
| RMB’000 | RMB’000 | RMB’000 | RMB’000 | |||||||||||||
Within one year | 375,978 | 919,410 | 657,876 | 6,395,413 | ||||||||||||
More than one year, but not exceeding two years | 6,925,847 | 6,930,623 | 685,521 | 6,395,413 | ||||||||||||
More than two years, but not more than five years | 13,945,689 | 13,827,105 | 1,105,228 | 6,363,911 | ||||||||||||
More than five years | 16,177,091 | — | ||||||||||||||
|
| |||||||||||||||
Total | 21,247,514 | 21,677,138 | 18,625,716 | 19,154,737 | ||||||||||||
|
| |||||||||||||||
Included in the balance as ofAt December 31, 2010 are2012, loans amounting to RMB20,133,007,000 (USD3,040,000,000) (2009: RMB20,757,728,000) obtained by the Group for the purpose of settling the consideration in respect of acquisition of Felix.Yancoal Resources amounting to RMB18,503,917,000 (USD 2,939,655,000; 2011: RMB19,154,737,000). The borrowings of RMB19,205,829,000 (USD2,900,000,000) (2009: RMB19,801,780,000) and of RMB927,178,000 (USD 140,000,000) (2009: RMB955,948,000) carried interest at three-month LIBOR plus a margin of 0.75% (approximately 1.05%) and at three-month LIBOR plus a margin of 0.8% (approximately 1.10%) respectively. The borrowingstogether with loans pledged by machineries are guaranteed by the Company, counter-guaranteed by the Parent Company and secured by the Group’s term deposit (Notedeposits (note 17)., property, plant and equipment (note 25), intangible assets (note 24) and other assets in Yancoal Resources.
Included in the balance asThe borrowings of December 31, 2010 were three new short term borrowings amounting to RMB161,133,000 (AUD24,000,000)RMB12,148,554,000 (USD1,930,000,000) (2011: RMB17,894,557,000) carried interest at BBSYthree-month LIBOR plus a margin of 1.8%0.75% (approximately 6.6%1.06%). The remaining borrowing attributable to Felix amounting to RMB953,374,000 (AUD142,000,000) (2009:RMB919,410,000)borrowings of RMB283,256,000 (USD45,000,000) (2011:RMB1,260,180,000) carried interest at BBSYthree-months LIBOR plus a margin of 3.8%0.8% (approximately 8.6%1.11%) (2009: approximately 7.6%. The borrowings of RMB6,072,107,000 (USD964,655,000) carried interest at three-month LIBOR plus 2.8% (approximately 3.11%) and was obtained prior to. Other borrowings arose from the acquisition of Felix. These borrowings and the finance leases are secured by the Group’s property, plant and equipment (Note 24) and intangible assets (Note 23) and are also secured by a floating charge over the other assets of Felix.Gloucester, amounting to RMB121,799,000 (USD19,350,000) carried interest at 5.68%.
(iii) Finance leasesLoans pledged by machineries are repayable as follows:
| At December 31, | At December 31, | |||||||||||||||
| 2010 | 2009 | 2012 | 2011 | |||||||||||||
| RMB’000 | RMB’000 | RMB’000 | RMB’000 | |||||||||||||
Minimum lease payments | ||||||||||||||||
Minimum payments | ||||||||||||||||
Within one year | 152,740 | 841,590 | 2,048,167 | — | ||||||||||||
More than one year, but not exceeding two years | 150,125 | — | ||||||||||||||
More than two years, but not more than five years | 747,900 | — | ||||||||||||||
| 1,050,765 | 841,590 | |||||||||||||||
Less: Future finance charges | (228,761 | ) | (184,887 | ) | (48,167 | ) | — | |||||||||
|
| |||||||||||||||
Present value of lease payments | 822,004 | 656,703 | 2,000,000 | — | ||||||||||||
|
| |||||||||||||||
YANZHOU COAL MINING COMPANY LIMITED
NOTES TO THE CONSOLIDATED FINANCIAL STATEMENTS—(Continued)
35.37. BORROWINGS—Continued
(iii) Finance leasesLoans pledged by machineries are repayable as follows:—Continued
| At December 31, | ||||||||
| 2010 | 2009 | |||||||
| RMB’000 | RMB’000 | |||||||
Present value of minimum finance lease payments | ||||||||
Within one year | 82,669 | 656,703 | ||||||
More than one year, but not exceeding two years | 88,144 | — | ||||||
More than two years, but not more than five years | 651,191 | — | ||||||
| 822,004 | 656,703 | |||||||
Less: amounts due within one year and included in current liabilities | (82,669 | ) | (656,703 | ) | ||||
Amounts due after one year and included in non-current liabilities | 739,335 | — | ||||||
Breach of loan agreement:
The bank borrowings and finance leases granted to Felix have a number of provisions including the satisfaction of minimum net assets value and the proportion of forward contracts by Felix as at balance sheet date.
| At December 31, | ||||||||
| 2012 | 2011 | |||||||
| RMB’000 | RMB’000 | |||||||
Present value of minimum payments | ||||||||
Within one year | 2,000,000 | — | ||||||
Less: Amounts due within one year and included in current liabilities | (2,000,000 | ) | — | |||||
|
|
|
| |||||
Amounts due after one year and included in non-current liabilities | — | — | ||||||
|
|
|
| |||||
At December 31, 2009, Felix breached the above2012, a loan provisions. As a resultof RMB2,000,000,000 carried interest at 6.56% per annum is pledged by machineries of the breach, long term portionsGroup. The interest rate will be adjusted in accordance with the benchmark lending rate published by the People’s Bank of the bank borrowings and finance leases of RMB919,410,000 and RMB654,546,000 respectively have been reclassified as current liabilities. In April 2010, Felix has obtained the waiver letter from the relevant lenders. The lenders agreed not to demand immediate payments from Felix and the terms of borrowings remained unchanged. Under the original borrowing terms, the bank borrowings and finance leases shall be repaidChina (“PBOC”).
(iv) Finance lease liabilities are repayable as follows:
| ||||
| ||||
| ||||
| ||||
| ||||
| ||||
| ||||
| ||||
| ||||
| ||||
| ||||
| At December 31, | ||||||||
| 2012 | 2011 | |||||||
| RMB’000 | RMB’000 | |||||||
Minimum payments | ||||||||
Within one year | 44,829 | — | ||||||
More than one year, but not exceeding two years | 44,832 | — | ||||||
More than two years, but not exceeding five years | 148,641 | — | ||||||
More than five years | 27,090 | — | ||||||
|
|
|
| |||||
| 265,392 | — | |||||||
Less: Future finance charges | (32,702 | ) | — | |||||
|
|
|
| |||||
Present value of lease payments | 232,690 | — | ||||||
|
|
|
| |||||
As
| At December 31, | ||||||||
| 2012 | 2011 | |||||||
| RMB’000 | RMB’000 | |||||||
Present value of minimum payments | ||||||||
Within one year | 30,240 | — | ||||||
More than one year, but not exceeding two years | 46,943 | — | ||||||
More than two years, but not exceeding five years | 140,829 | — | ||||||
More than five years | 14,678 | — | ||||||
|
|
|
| |||||
| 232,690 | — | |||||||
Less: Amounts due within one year and included in current liabilities | (30,240 | ) | — | |||||
|
|
|
| |||||
Amounts due after one year and included in non-current liabilities | 202,450 | — | ||||||
|
|
|
| |||||
Finance lease liabilities of RMB232,690,000 (AUD35,599,000) was obtained from the acquisition of Gloucester during the year, which carried interest at December 31, 2010, the Group did not breach any loan provisions.7.74% per annum.
YANZHOU COAL MINING COMPANY LIMITED
NOTES TO THE CONSOLIDATED FINANCIAL STATEMENTS—(Continued)
36.37. BORROWINGS—Continued
(v) Guaranteed notes are detailed as follows :
| At December 31, | ||||||||
| 2012 | 2011 | |||||||
| RMB’000 | RMB’000 | |||||||
Guaranteed notes denominated in USD repayable within five years | 2,828,176 | — | ||||||
Guaranteed notes denominated in RMB repayable within five years | 990,600 | — | ||||||
Guaranteed notes denominated in USD repayable after five years | 3,456,659 | — | ||||||
Guaranteed notes denominated in RMB repayable after five years | 3,962,400 | — | ||||||
|
|
|
| |||||
| 11,237,835 | — | |||||||
|
|
|
| |||||
The above USD guaranteed notes were issued by a subsidiary of the Company on May 16, 2012. Guaranteed notes with par value of USD450,000,000 and USD550,000,000 will mature in 2017 and 2022 and with interest rate of 4.461% and 5.730% per annum respectively. The notes are unconditionally secured by the Company and the respective security is non-cancellable. For the year ended December 31, 2012, there was no redemption on the notes.
During the year, with the approval from China Securities Regulatory Commission, the Company is allowed to issue RMB notes within PRC domicile, RMB notes with par value of RMB300,167,000 and RMB4,699,833,000 was issued to the public and institutional investors. An unconditional and irrecoverable corporate guarantee was provided by the Parent Company on the RMB notes. At December 31, 2012, RMB notes of RMB4,953,000,000 include notes of RMB3,962,400,000 with a maturity period of ten years and interest rate of 4.20% per annum and notes of RMB990,600,000 with a maturity period of five years and interest rate of 4.95% per annum. For the year ended December 31, 2012, there was no redemption on the notes.
38. DERIVATIVE FINANCIAL INSTRUMENTS
| At December 31, | At December 31, | |||||||||||||||
| 2010 | 2009 | 2012 | 2011 | |||||||||||||
| RMB’000 | RMB’000 | RMB’000 | RMB’000 | |||||||||||||
Derivatives used for cash flow hedging: | ||||||||||||||||
Current assets | ||||||||||||||||
- Forward foreign exchange contracts | 239,476 | 37,760 | 76,640 | 104,910 | ||||||||||||
- Collar Option | 14,091 | — | ||||||||||||||
|
| |||||||||||||||
| 90,731 | 104,910 | |||||||||||||||
|
| |||||||||||||||
Current liabilities | ||||||||||||||||
- Forward foreign exchange contracts | 12,269 | 23,980 | 13,656 | 42,471 | ||||||||||||
- Interest rate swap contracts | 153,909 | 4,353 | 114,421 | 179,618 | ||||||||||||
|
| |||||||||||||||
| 166,178 | 28,333 | 128,077 | 222,089 | |||||||||||||
|
| |||||||||||||||
YANZHOU COAL MINING COMPANY LIMITED
NOTES TO THE CONSOLIDATED FINANCIAL STATEMENTS—(Continued)
38. DERIVATIVE FINANCIAL INSTRUMENTS—Continued
During the year ended December 31, 2010,2012, the Group’s subsidiaries in Australia entered into forward foreign exchange contracts to sell or purchase specified amounts of foreign currencies in the future at stipulated exchange rates. The objective of entering into the forward foreign exchange contracts is to reduce the foreign exchange rate related volatility of revenue stream and capital expenditure and thereby assist in risk management for the Group. The outstanding sell United States dollars contracts are hedging highly probable forecasted sales of coal, whereascoal. Cash flows and any impact to profit or loss arising from all the outstanding buy United States dollars, Euro and Yenforeign exchange contracts relateare expected to occur within one year from the purchase of mining equipment.balance sheet date.
As at December 31, 2010,2012, the outstanding notional amount to sell United States dollars (sell United States dollars and buy Australian dollars) was approximately RMB4,169RMB5,390 million (2009: RMB1,143(2011: RMB3,279 million) and RMB746 million (2011: RMB1,553 million), all maturing within one year (2009: within(2011: one year) with forward rates ranging from 0.83690.9755 to 0.9887 (2009: floor price and ceiling price of 0.7661 and 0.90441.0013 (2011: ranging from 0.9182 to 1.0642 respectively).
As at December 31, 2010, the outstanding notional amount to buy United States dollars (buy United States dollars and sell Australian dollars), buy Euro (buy Euro and sell Australian dollars) and buy Yen (buy Yen and sell Australian dollars) was approximately RMB79 million (2009: RMB74 million), nil (2009: RMB27 million) and RMB9 million (2009: RMB72 million) respectively, all maturing within one year (2009: within six months) with forward rates of approximately 0.8811 (2009: 0.753), nil (2009: 0.552) and floor price and ceiling price of 63.50.934 and 65 (2009: floor price1.055 (2011: 0.9230 and ceiling price of 71.7 and 72.7) respectively.1.080).
The Group’s Australian subsidiaries also entered into contracts with banks to hedge a proportion of borrowings issued at variable interest rates through the use of floating-to-fixed interest rate swap contracts. As at December 31, 2010,2012, the outstanding notional amount to buy Euro (“EUR”) (sell Australian dollars and buy EUR) was approximately RMB1,503RMB51 million, (2009: RMB282 million), maturing within three years (2009:one year with forward rate at 0.99926 (2011: nil).
As at December 31, 2012, the outstanding notional amount to buy British Pound (sell Australian dollars and buy British Pound) was approximately RMB3 million, maturing within three years)one year with forward rate at a hedge period of 3 months0.99948 (2011: nil).
As at December 31, 2012, the outstanding notional amount to buy EUR (sell United States dollars and buy EUR) was approximately RMB114 million maturing within one year with floating rate and fixed rate of approximately 5.09% and 5.8312% respectively (2009: 4.2783% and 5.89%)forward rates ranging from 1.00013 to 1.00031 (2011: nil).
The Company also entered into contracts with three banks to hedge a proportion of borrowings issued at variable interest rates through the use of floating-to-fixed interest rate swap contracts. As at December 31, 2010,2012, the outstanding notional amount was approximately RMB9,934RMB 6,285 million (USD1,000 million) (2011: RMB9,451 million (USD 1,500,000,000)1,500 million)), maturing withincontract period of four years (2011: four years) at a hedge period of 3 months (2011: 3 months) with floating rate as LIBOR + 0.75% and fixed rate of approximately 2.75%, 2.42% and 2.41% for the three contracts respectively.(2011: approximately 2.75%, 2.42% and 2.41% respectively) and floating rate as LIBOR + 0.75% (2011: LIBOR + 0.75%). The non-current portion of the derivatives is not material and is included in current portion.
YANZHOU COAL MINING COMPANY LIMITED
NOTES TO THE CONSOLIDATED FINANCIAL STATEMENTS—(Continued)
36. DERIVATIVE FINANCIAL INSTRUMENTS—Continued
Cash flows and any impact to profit or loss arising from the above use of floating-to-fixed interest rate swap contracts are expected to occur within each hedge period of 3 months over the contract period.
For the year ended December 31, 2009, no ineffective hedging portion has been included in the consolidated income statement. The effective hedging portion was recognized as current portion of derivative financial instruments in the consolidated balance sheet. For the year ended December 31, 2010,2012, the ineffective hedging portion of the changes in fair values of the forward foreign exchange contracts of approximately RMB10RMB 20.4 million (2011: RMB1.9 million) was recognized as selling, general and administrative expenses in the consolidated income statement. The effective hedging portion was recognized as current portion of derivatives financial instruments in the consolidated balance sheet.
The fair values of the forward foreign exchange contracts are estimated based on the discounted cash flows between the contract forward rate and spot forward rate. The fair values of the interest rate swap contracts are estimated based on the discounted cash flows between the contract floating rate and the contract fixed rate.
37. LONG-TERM PAYABLEYANZHOU COAL MINING COMPANY LIMITED
NOTES TO THE CONSOLIDATED FINANCIAL STATEMENTS—(Continued)
39. CONTINGENT VALUE RIGHTS SHARES LIABILITIES
| At December 31, | ||||||||
| 2010 | 2009 | |||||||
| RMB’000 | RMB’000 | |||||||
Current liabilities | ||||||||
- Deferred income of sale and leaseback | 3,179 | 2,902 | ||||||
- Deferred payment for acquisition of interests in Minerva (i) | 3,357 | 3,065 | ||||||
| 6,536 | 5,967 | |||||||
Non-current liabilities | ||||||||
- Deferred income of sale and leaseback | 7,946 | 10,156 | ||||||
- Deferred payment for acquisition of interests in Minerva (i) | 12,991 | 12,244 | ||||||
- Others | 7,980 | 3,980 | ||||||
| 28,917 | 26,380 | |||||||
Total | 35,453 | 32,347 | ||||||
| 2012 | 2011 | |||||||
| RMB’000 | RMB’000 | |||||||
Balance at January 1 | — | — | ||||||
Acquisition of Gloucester | 1,312,913 | — | ||||||
Change in fair value | 79,423 | — | ||||||
Exchange re-alignment | 39,852 | — | ||||||
|
|
|
| |||||
Balance at December 31 | 1,432,188 | — | ||||||
|
|
|
| |||||
For more information about contingent value rights shares liabilities, please refer to note 46.
40. LONG-TERM PAYABLE AND PROVISION
| At December 31, | ||||||||
| 2012 | 2011 | |||||||
| RMB’000 | RMB’000 | |||||||
Current liabilities | ||||||||
- Deferred payment for acquisition of interests in Minerva (i) | 3,268 | 3,205 | ||||||
- Mining right compensation fee payable (ii) | 396,285 | — | ||||||
|
|
|
| |||||
| 399,553 | 3,205 | |||||||
Non-current liabilities | ||||||||
- Deferred payment for acquisition of interests in Minerva (i) | 8,088 | 8,159 | ||||||
-Mining right compensation fee payable (ii) | 1,585,139 | — | ||||||
- Others (iii) | 470,695 | 6,869 | ||||||
|
|
|
| |||||
| 2,063,922 | 15,028 | |||||||
|
|
|
| |||||
Total | 2,463,475 | 18,233 | ||||||
|
|
|
| |||||
| (i) | The carrying value of the deferred payment for acquisition of interests in Minerva is based on cash flows discounted using a rate of 7.5%. |
| (ii) |
| (iii) | Others mainly comprised of |
YANZHOU COAL MINING COMPANY LIMITED
NOTES TO THE CONSOLIDATED FINANCIAL STATEMENTS—(Continued)
38.41. DEFERRED TAXATION
| Available-for-sale investment | Accelerated tax depreciation | Fair value adjustment on mining rights (coal reserves) | Temporary differences on income and expenses recognized | Tax losses | Cash flow hedge reserve | Total | ||||||||||||||||||||||
| RMB’000 | RMB’000 | RMB’000 | RMB’000 | RMB’000 | RMB’000 | RMB’000 | ||||||||||||||||||||||
Balance at January 1, 2009 | (19,317 | ) | (239,346 | ) | (37,961 | ) | 225,125 | 66,914 | 8,831 | 4,246 | ||||||||||||||||||
Exchange re-alignment | — | — | — | (8,077 | ) | — | — | (8,077 | ) | |||||||||||||||||||
Acquisition of Hua Ju Energy | — | — | — | 2,017 | — | — | 2,017 | |||||||||||||||||||||
Acquisition of Felix | — | — | (596,585 | ) | (929,508 | ) | 554,300 | (1,318 | ) | (973,111 | ) | |||||||||||||||||
Charge to other comprehensive income | (31,306 | ) | — | — | — | — | (11,780 | ) | (43,086 | ) | ||||||||||||||||||
(Charge) Credit to the consolidated income statement (note 12) | — | (61,880 | ) | 1,513 | 378,493 | (57,543 | ) | — | 260,583 | |||||||||||||||||||
Balance at January 1, 2010 | (50,623 | ) | (301,226 | ) | (633,033 | ) | (331,950 | ) | 563,671 | (4,267 | ) | (757,428 | ) | |||||||||||||||
Exchange re-alignment | — | (3,897 | ) | (40,040 | ) | (30,255 | ) | 53,752 | — | (20,440 | ) | |||||||||||||||||
Disposal of a joint venture and subsidiaries | — | — | 2,229 | (5,653 | ) | — | — | (3,424 | ) | |||||||||||||||||||
Credit (Charge) to other comprehensive income | 21,818 | — | — | — | — | (24,350 | ) | (2,532 | ) | |||||||||||||||||||
Credit (Charge) to the consolidated income statement (note 12) | — | (230 | ) | (32,738 | ) | (406,304 | ) | (253,945 | ) | — | (693,217 | ) | ||||||||||||||||
Balance at December 31, 2010 | (28,805 | ) | (305,353 | ) | (703,582 | ) | (774,162 | ) | 363,478 | (28,617 | ) | (1,477,041 | ) | |||||||||||||||
| Available- for-sale investment | Accelerated tax depreciation | Fair value adjustment on mining rights (mining reserves) | Temporary differences on income and expenses recognized | Tax losses | Cash flow hedge reserve | Total | ||||||||||||||||||||||
| RMB’000 | RMB’000 | RMB’000 | RMB’000 | RMB’000 | RMB’000 | RMB’000 | ||||||||||||||||||||||
Balance at January 1, 2011 | (28,805 | ) | (305,353 | ) | (703,582 | ) | (774,162 | ) | 363,478 | (28,617 | ) | (1,477,041 | ) | |||||||||||||||
Exchange re-alignment | — | 3,846 | 87,322 | 25,090 | (8,008 | ) | — | 108,250 | ||||||||||||||||||||
Acquisition of additional interests in joint venture | — | — | (49,246 | ) | — | — | — | (49,246 | ) | |||||||||||||||||||
Acquisition of Syntech | — | — | (81,370 | ) | 55,728 | — | — | (25,642 | ) | |||||||||||||||||||
Acquisition of Premier Coal and Wesfarmers Char | — | — | (69,154 | ) | 51,305 | — | — | (17,849 | ) | |||||||||||||||||||
Acquisition of Xintai | — | — | (817,296 | ) | — | — | — | (817,296 | ) | |||||||||||||||||||
Charge to other comprehensive income | 5,190 | — | — | — | — | 62,073 | 67,263 | |||||||||||||||||||||
Charge (credit) to the consolidated income statement (note 12) | — | 70,100 | (550,430 | ) | 487,222 | (355,470 | ) | — | (348,578 | ) | ||||||||||||||||||
|
|
|
|
|
|
|
|
|
|
|
|
|
| |||||||||||||||
Balance at December 31, 2011 | (23,615 | ) | (231,407 | ) | (2,183,756 | ) | (154,817 | ) | — | 33,456 | (2,560,139 | ) | ||||||||||||||||
Exchange re-alignment | — | (2,253 | ) | (90,646 | ) | 191,400 | 16,160 | — | 114,661 | |||||||||||||||||||
Acquisition of Beisu and Yangcun | — | — | (47,375 | ) | 4,109 | — | — | (43,266 | ) | |||||||||||||||||||
Acquisition of Gloucester | — | — | (1,851,996 | ) | 778,477 | 258,003 | — | (815,516 | ) | |||||||||||||||||||
Charge (credit) to other comprehensive income | 1,481 | — | — | — | — | (28,641 | ) | (27,160 | ) | |||||||||||||||||||
Deferred tax arising from the restructuring of Australian subsidiaries | — | — | — | (141,067 | ) | — | — | (141,067 | ) | |||||||||||||||||||
Charge (credit) to the consolidated income statement (note 12) | — | (9,227 | ) | 538,989 | (46,703 | ) | 864,585 | — | 1,347,644 | |||||||||||||||||||
|
|
|
|
|
|
|
|
|
|
|
|
|
| |||||||||||||||
Balance at December 31, 2012 | (22,134 | ) | (242,887 | ) | (3,634,784 | ) | 631,399 | 1,138,748 | 4,815 | (2,124,843 | ) | |||||||||||||||||
|
|
|
|
|
|
|
|
|
|
|
|
|
| |||||||||||||||
The temporary differences on income and expenses recognized mainly arose in respect offrom unpaid provision of salaries and wages, provisions of compensation fees for mining rights and land subsidence, restoration, rehabilitation and environmental costs and also included payments on certain expenses such as exploration costs and certain income in Australia.
The following is the analysis of the deferred tax balances for financial reporting purposes:
| At December 31, | ||||||||||||||||
| 2010 | 2009 | 2012 | 2011 | |||||||||||||
| RMB’000 | RMB’000 | RMB’000 | RMB’000 | |||||||||||||
Deferred tax assets | 1,124,166 | 1,027,659 | 5,605,284 | 1,335,165 | ||||||||||||
Deferred tax liabilities | (2,601,207 | ) | (1,785,087 | ) | (7,730,127 | ) | (3,895,304 | ) | ||||||||
|
| |||||||||||||||
| (1,477,041 | ) | (757,428 | ) | (2,124,843 | ) | (2,560,139 | ) | |||||||||
|
| |||||||||||||||
At the balance sheet date, the Group has unused tax losses of RMB2,778RMB5,930 million (2009: RMB2,884(2011: RMB1,560 million) contributed by the subsidiaries available for offset against future profits. ARMB1,138 million deferred tax asset has been recognized in respect of RMB1,212 million (2009: RMB1,882 million) of(2011: nil) for such losses. No deferred tax asset has been recognized in respect of the remaining RMB1,566RMB2,134 million (2009: RMB1,002(2011: RMB1,560 million) due to the unpredictability of future profit streams. Included in unrecognized tax losses are losses of RMB106RMB298 million that will expire in 2012, losses of RMB 298 million that will expire in 2013, and losses of RMB357 million that will expire in 2014, (2009: losses of RMB55RMB517 million that will expire in 2011, losses2015 and loss of RMB106RMB282 million that will expire in 2012,2016. (2011: losses of RMB298 million that will expire in 2013 and losses of RMB357 million that will expire in 2014). Other losses may be carried forward indefinitely.
By reference to financial budgets, management believes that there will be sufficient future profits for the realization of deferred tax assets which have been recognized in respect of tax losses.
YANZHOU COAL MINING COMPANY LIMITED
NOTES TO THE CONSOLIDATED FINANCIAL STATEMENTS—(Continued)
39.42. SHAREHOLDERS’ EQUITY
Share capital
The Company’s share capital structure at the balance sheet date is as follows:
| Domestic invested shares | Foreign invested shares H shares (including H shares represented by ADS) | Total | Domestic invested shares | Foreign invested shares H shares (including H shares represented by ADS) | Total | |||||||||||||||||||||||||||
| State legal person shares (held by the Parent Company) | A shares | State legal person shares (held by the Parent Company) | A shares | |||||||||||||||||||||||||||||
Number of shares | ||||||||||||||||||||||||||||||||
At January 1, 2009, January 1, 2010 and December 31, 2010 | 2,600,000,000 | 360,000,000 | 1,958,400,000 | 4,918,400,000 | ||||||||||||||||||||||||||||
At January 1, 2011, January 1, 2012 and December 31, 2012 | 2,600,000,000 | 360,000,000 | 1,958,400,000 | 4,918,400,000 | ||||||||||||||||||||||||||||
|
|
|
| |||||||||||||||||||||||||||||
| Domestic invested shares | Foreign invested shares H shares (including H shares represented by ADS) | Total | Domestic invested shares | Foreign invested shares H shares (including H shares represented by ADS) | Total | |||||||||||||||||||||||||||
| State legal person shares (held by the Parent Company) | A shares | State legal person shares (held by the Parent Company) | A shares | |||||||||||||||||||||||||||||
| RMB’000 | RMB’000 | RMB’000 | RMB’000 | RMB’000 | RMB’000 | RMB’000 | RMB’000 | |||||||||||||||||||||||||
Registered, issued and fully paid | ||||||||||||||||||||||||||||||||
At January 1, 2009, January 1, 2010 and December 31, 2010 | 2,600,000 | 360,000 | 1,958,400 | 4,918,400 | ||||||||||||||||||||||||||||
At January 1, 2011, January 1, 2012 and December 31, 2012 | 2,600,000 | 360,000 | 1,958,400 | 4,918,400 | ||||||||||||||||||||||||||||
|
|
|
| |||||||||||||||||||||||||||||
Each share has a par value of RMB1.
The Company has completed the implementation of the share reform plan on April 3, 2006 and the non-tradable legal person shares held by the Parent Company become tradable shares. The Parent Company guaranteed that it would not trade these shares in the market within 48 months from that day. AsAll the commitment made by the Parent Company as part of the share reform plan was fulfilled. By application to local legislation, shares held by the Parent Company agreed thatwill become tradable shares. During the Group can participate in the investment and joint development in the oil production project ofyear, the Parent Company.Company has fulfilled all the requirements. Up to the issue of these financial statements, there is no progress onapplication for the project developmentright of shares trading in the market by the Parent Company and hence the shares held by the Parent Company are still not yet tradeable.
YANZHOU COAL MINING COMPANY LIMITED
NOTES TO THE CONSOLIDATED FINANCIAL STATEMENTS—(Continued)
39. SHAREHOLDERS’ EQUITY—Continued
tradable.
Reserves
Future Development Fund
Pursuant to regulation in the PRC, the Company, Shanxi Tianchi and Heze are required to transfer an annual amount to a future development fund at RMB6 per tonne of raw coal mined.mined (Xintai and Ordos: RMB6.5 per tonne of raw coal mined). The fund can only be used for the future development of the coal mining business and is not available for distribution to shareholders.
From 2008 onwards, Shanxi Tianchi is required to transfer an additional amount at RMB5 per tonne of raw coal mined from 2008 onwards as coal mine transformation fund.
YANZHOU COAL MINING COMPANY LIMITED
NOTES TO THE CONSOLIDATED FINANCIAL STATEMENTS—(Continued)
42. SHAREHOLDERS’ EQUITY—Continued
Pursuant to the regulations of the Shandong Province Finance Bureau, State-owned Assets Supervision and Administration Commission of Shandong Province and the Shandong Province Coal Mining Industrial Bureau, the Company is required to transfer an additional amount at RMB5 per tonne of raw coal mined from July 1, 2004 to the reform specific development fund for the future improvement of the mining facilities and is not distributable to shareholders. No further transfer to the reform specific development fund is required from January 1, 2008.
In accordance with the regulations of the State Administration of Work Safety, the Company has a commitment to incur RMB8 (Shanxi Tianchi: RMB15)RMB50, Xintai and Ordos: increased from RMB7 to RMB15 from February 1, 2012 onwards) for each tonne of raw coal mined from May 1, 2004 which will be used for enhancement of safety production environment and improvement of facilities (“Work Safety Cost”). From February 1, 2012 onwards, the work safety cost increased to RMB15 per tonne. In prior years, the work safety expenditures are recognized only when acquiring the fixed assets or incurring other work safety expenditures. The Company, Heze, and Shanxi Tianchi, Xintai and Ordos make appropriation to the future development fund in respect of unutilized Work Safety Cost from 2008 onwards.
In accordance with the regulations of the State Administration of Work Safety, the Company’s subsidiaries, Hua Ju Energy, Shanxi Tianhao and Yulin, have a commitment to incur Work Safety Cost at the rate of: 4% of the sales income for the year below RMB10 million; 2% of the actual sales income for the year between RMB10 million and RMB100 million (included); 0.5% of the actual sales income for the year between RMB100 million and RMB1 billion (included); 0.2% of the actual sales income for the year above RMB1 billion. The unutilized Work Safety Cost at December 31, 20102012 was RMB431,779,000.RMB1,019,799,000.
Statutory Common Reserve Fund
The Company and its subsidiaries in the PRC have to set aside 10% of its profit for the statutory common reserve fund (except where the fund has reached 50% of its registered capital). The statutory common reserve fund can be used for the following purposes:
to make good losses inof the previous years; or
to convert into capital, provided such conversion is approved by a resolution at a shareholders’ general meeting and the balance of the statutory common reserve fund does not fall below 25% of the registered capital.
YANZHOU COAL MINING COMPANY LIMITED
NOTES TO THE CONSOLIDATED FINANCIAL STATEMENTS—(Continued)
39. SHAREHOLDERS’ EQUITY—Continued
Reserves—Continued
Retained earnings
In accordance with the Company’s Articles of Association, the profit for the purpose of appropriation will be deemed to be the lesser of the amounts determined in accordance with (i) PRC accounting standards and regulations and (ii) IFRS or the accounting standards of the places in which its shares are listed.
The Company can also create a discretionary reserve in accordance with its Articles of Association or pursuant to resolutions which may be adopted at a meeting of shareholders.
The Company’s distributable reserve as at December 31, 20102012 is the retained earnings computed under PRC GAAP which amounted to approximately RMB19,727,074,000RMB23,733,069,000 (At December 31, 2009: RMB15,062,956,000)2011: RMB22,913,403,000).
40.YANZHOU COAL MINING COMPANY LIMITED
NOTES TO THE CONSOLIDATED FINANCIAL STATEMENTS—(Continued)
43. CAPITAL RISK MANAGEMENT
The Group manages its capital to ensure that entities in the Group will be able to continue as a going concern while maximisingmaximizing the return to shareholders through the optimisationoptimization of the debt and equity balance. The Group’s overall strategy remains unchanged from prior year.
The capital structure of the Group consists of debt, which includes the borrowings disclosed in note 3537 and equity attributable to equity holders of the Company, comprising issued share capital, reserves and retained earnings, and amounted to RMB60,347,644,000 (2009: RMB51,661,648,000)RMB86,822,738,000 (2011: RMB77,092,310,000) as at December 31, 2010.2012.
The directors of the Company review the capital structure regularly. As part of this review, the directors of the Company assess the annual budget prepared by the accounting and treasury department and consider and evaluate the cost of capital and the risks associated with each class of capital. The Group will balance its capital structure through the payment of dividends, issue of new shares and new debts or the repayment of existing debts.
YANZHOU COAL MINING COMPANY LIMITED
NOTES TO THE CONSOLIDATED44. FINANCIAL STATEMENTS—(Continued)
41. FINANCIAL INSTRUMENTINSTRUMENTS
41a.44a. Categories of financial instruments
| At December 31, | At December 31, | |||||||||||||||
| 2010 | 2009 | 2012 | 2011 | |||||||||||||
| RMB’000 | RMB’000 | RMB’000 | RMB’000 | |||||||||||||
Financial assets | ||||||||||||||||
Loans and receivables (including cash and cash equivalents) | 21,468,083 | 17,515,714 | 27,145,339 | 26,863,250 | ||||||||||||
Available-for-sale financial assets | 224,442 | 295,295 | 207,076 | 372,800 | ||||||||||||
Derivative financial instruments (financial instruments at fair value) | 239,476 | 37,760 | ||||||||||||||
Derivative financial instruments | 90,731 | 104,910 | ||||||||||||||
Royalty receivable (financial assets at fair value through profit or loss) | 1,349,447 | — | ||||||||||||||
Financial liabilities | ||||||||||||||||
Amortized cost | 26,757,425 | 27,262,173 | 57,348,667 | 41,576,750 | ||||||||||||
Derivative financial instruments (financial instruments at fair value) | 166,178 | 28,333 | ||||||||||||||
Derivative financial instruments | 128,077 | 222,089 | ||||||||||||||
Contingent value rights shares liabilities (financial liabilities at fair value through profit or loss) | 1,432,188 | — | ||||||||||||||
|
| |||||||||||||||
41b.44b. Financial risk management objectives and policies
The Group’s major financial instruments include available-for-sale equity instrument,instruments, bills and accounts receivable, royalty receivable, other current assets such as other receivables, bank balances and cash, term deposits, restricted cash, long term receivables, derivative financial instrument,instruments, bills and accounts payable, other payables, bank and other borrowings, and amount due to Parent Company and its subsidiary companies.companies, contingent value rights shares liabilities, finance lease liabilities and guaranteed notes. Details of these financial instruments are disclosed in respective notes. The risks associated with these financial instruments and the policies on how to mitigate these risks are set out below. The management manages and monitors these exposures to ensure appropriate measures are implemented on a timely and effective manner. There has been no significant change to the Group’s exposure to market risk or the manner in which it manages and measures the risk.
YANZHOU COAL MINING COMPANY LIMITED
NOTES TO THE CONSOLIDATED FINANCIAL STATEMENTS—(Continued)
44. FINANCIAL INSTRUMENTS—Continued
44b. Financial risk management objectives and policies—Continued
Credit risk
Credit risk refers to the risk that counterparty will default on its contractual obligations resulting in financial loss to the Group.
At December 31, 20102012 and 2009,2011, the Group’s maximum exposure to credit risk which will cause a financial loss to the Group arising from the failure to perform their obligations in relation to each class of recognized financial assets is the carrying amount of those assets as stated in the consolidated balance sheet.
In order to minimise the credit risk, the management of the Group has delegated a team responsible for determination of credit limits, credit approvals and other monitoring procedures to ensure that follow-up action is taken to recover overdue debts. In addition, the Group reviews the recoverable amount of each individual trade debt at each balance sheet date to ensure that adequate impairment losses are made for irrecoverable amounts. In this regard, the directors of the Company consider that the Group’s credit risk is significantly reduced.
The Group maintains its cash and cash equivalents with reputable banks.banks and Yankuang Group Finance Group Company Limited (see note 29). Therefore, the directors consider that the credit risk for such is minimal.
YANZHOU COAL MINING COMPANY LIMITED
NOTES TO THE CONSOLIDATED FINANCIAL STATEMENTS—(Continued)
41. FINANCIAL INSTRUMENT—Continued
41b. Financial risk management objectives and policies—Continued
Credit risk—Continued
The Group generally grants the customers with long-relationship credit terms not exceeding 180 days, depending on the situations of the individual customers. For small to medium sized new customers, the Group generally requires them to pay for the products before delivery.
Most of the Group’s domestic sales are sales to electric power plants, metallurgical companies, construction material producers and railway companies. The Group generally has established long-term and stable relationships with these companies. The Group also sells its coal to provincial and city fuel trading companies.
As the GroupGroup’s PRC operation does not currently have direct export rights, all of its export sales must be made through National Coal Corporation, Shanxi Coal Corporation or Minmetals Trading. The qualities, prices and final customer destinations of the Group’s export sales are determined by the Group, National Coal Corporation, Shanxi Coal Corporation or Minmetals Trading.
For the years ended December 31, 2010, 20092012, 2011 and 2008,2010, net sales to the Group’s five largest customers accounted for approximately 24.7%19.4%, 28.7%19.4% and, 32.8%,24.7% respectively, of the Group’s total net sales.revenue. Net sales to the Group’s largest customer accounted for 13.0%6.3%, 15.4%8.5%, and 17.7%13.0% of the Group’s net salesrevenue for the years ended December 31, 2010, 20092012, 2011 and 2008,2010 respectively. The Group’s largest customer was Huadian Power International Corporation Limited (“Huadian”) for the years ended December 31, 2010, 20092012, 2011 and 2008.2010.
YANZHOU COAL MINING COMPANY LIMITED
NOTES TO THE CONSOLIDATED FINANCIAL STATEMENTS—(Continued)
44. FINANCIAL INSTRUMENTS—Continued
44b. Financial risk management objectives and policies—Continued
Credit risk—Continued
Details of the accounts receivable from the five customers with the largest receivable balances at December 31, 20102012 and 20092011 are as follows:
| Percentage of accounts receivable | ||||||||
| At December 31, | ||||||||
| 2010 | 2009 | |||||||
Five largest receivable balances | 58.43 | % | 62.18 | % | ||||
| Percentage of accounts receivable | ||||||||
| At December 31, | ||||||||
| 2012 | 2011 | |||||||
Five largest receivable balances | 28.86 | % | 60.47 | % | ||||
|
|
|
| |||||
The management considers the strong financial background and good creditability of these customers, and there is no significant uncovered credit risk.
YANZHOU COAL MINING COMPANY LIMITED
NOTES TO THE CONSOLIDATED FINANCIAL STATEMENTS—(Continued)
41. FINANCIAL INSTRUMENT—Continued
41b. Financial risk management objectives and policies—Continued
Credit risk—Continued
The table below shows the credit limit and balance of 5 major counterparties at the balance sheet date:
| 31.12.2010 | 31.12.2009 | |||||||||||||||||
Counterparty | Location | Credit limit | Carrying amount | Credit limit | Carrying amount | |||||||||||||
| RMB’000 | RMB’000 | RMB’000 | RMB’000 | |||||||||||||||
| (note) | (note) | |||||||||||||||||
Company A | Australia | Not applicable | 64,170 | Not applicable | — | |||||||||||||
Company B | Korea | Not applicable | 59,133 | Not applicable | 51,235 | |||||||||||||
Company C | Korea | Not applicable | 58,773 | Not applicable | 54,959 | |||||||||||||
Company D | Australia | Not applicable | 53,450 | Not applicable | 81,329 | |||||||||||||
Company E | Japan | Not applicable | 52,600 | Not applicable | — | |||||||||||||
Company F | The PRC | Not applicable | — | Not applicable | 43,592 | |||||||||||||
Company G | The PRC | Not applicable | — | Not applicable | 41,615 | |||||||||||||
| 288,126 | 272,730 | |||||||||||||||||
| December 31, 2012 | December 31, 2011 | |||||||||||||||||
Counterparty | Location | Credit limit | Carrying amount | Credit limit | Carrying amount | |||||||||||||
| RMB’000 | RMB’000 | RMB’000 | RMB’000 | |||||||||||||||
Company A | China | Not applicable | 72,000 | Not applicable | — | |||||||||||||
Company B | Japan | Not applicable | 54,513 | Not applicable | — | |||||||||||||
Company C | Australia | Not applicable | 50,477 | Not applicable | — | |||||||||||||
Company D | Japan | Not applicable | 49,156 | Not applicable | — | |||||||||||||
Company E | Japan | Not applicable | 41,971 | Not applicable | — | |||||||||||||
Company F | Australia | Not applicable | — | Not applicable | 181,164 | |||||||||||||
Company G | Australia | Not applicable | — | Not applicable | 94,248 | |||||||||||||
Company H | Hong Kong | Not applicable | — | Not applicable | 80,156 | |||||||||||||
Company I | Korea | Not applicable | — | Not applicable | 69,566 | |||||||||||||
Company J | Hong Kong | Not applicable | — | Not applicable | 69,482 | |||||||||||||
|
|
|
| |||||||||||||||
| 268,117 | 494,616 | |||||||||||||||||
|
|
|
| |||||||||||||||
The Group’s geographical concentration of credit risk is mainly in East Asia (excluding the PRC) and Australia. As at December 31, 20102012 and 2009,2011, over 85%57% and 91%86% of the Group’s total trade receivables were from Australia and from East Asia (excluding the PRC) respectively.
YANZHOU COAL MINING COMPANY LIMITED
NOTES TO THE CONSOLIDATED FINANCIAL STATEMENTS—(Continued)
41.44. FINANCIAL INSTRUMENT—INSTRUMENTS—Continued
41b.44b. Financial risk management objectives and policies—Continued
Market risk
(i) Currency risk
The Group’s sales are denominated mainly in the functional currency of the relevant group entity making the sale, whilst costs are mainly denominated in the group entity’s functional currency. Accordingly, there is no significant exposure to foreign currency risk.
The carrying amounts of the Group’s foreign currency denominated monetary assets and monetary liabilities in currencies other than the functional currencies of the relevant group entities at the balance sheet date are as follows:
| Liabilities | Assets | Liabilities | Assets | |||||||||||||||||||||||||||||
| 2010 | 2009 | 2010 | 2009 | 2012 | 2011 | 2012 | 2011 | |||||||||||||||||||||||||
| RMB’000 | RMB’000 | RMB’000 | RMB’000 | RMB’000 | RMB’000 | RMB’000 | RMB’000 | |||||||||||||||||||||||||
United States Dollar (“USD”) | 20,516,314 | 20,757,943 | 902,402 | 1,311,500 | 18,294,655 | 19,309,802 | 2,267,878 | 1,025,746 | ||||||||||||||||||||||||
Euro (“EUR”) | — | — | 222 | 3,611 | 1,083,858 | — | 141 | 205 | ||||||||||||||||||||||||
Hong Kong Dollar (“HKD”) | — | — | 6,062 | 7,309 | — | — | 58 | 452 | ||||||||||||||||||||||||
Notional amounts of sell USD foreign exchange contracts used for hedging | — | — | 4,169,000 | 1,143,416 | 1,599,728 | 1,996,267 | 4,536,734 | 2,836,035 | ||||||||||||||||||||||||
Notional amounts of buy USD foreign exchange contracts used for hedging | 79,000 | 73,713 | — | — | ||||||||||||||||||||||||||||
Notional amounts of buy EUR foreign exchange contracts used for hedging | — | 26,541 | — | — | ||||||||||||||||||||||||||||
Notional amounts of buy Yen foreign exchange contracts used for hedging | 9,000 | 71,511 | — | — | ||||||||||||||||||||||||||||
Notional amount of buy EUR foreign exchange contracts used for hedging | — | — | 165,711 | — | ||||||||||||||||||||||||||||
Notional amount of buy British pound (“GBP”) foreign exchange contracts used for hedging | — | — | 2,919 | — | ||||||||||||||||||||||||||||
|
|
|
| |||||||||||||||||||||||||||||
The sales of the Group’s subsidiaries in Australia are mainly export sales and some of their fixed assets are imported from overseas. Their foreign exchange hedging policy is disclosed in note 36.38. The Group’s operations in the PRC do not adopt any foreign exchange hedging policy.
YANZHOU COAL MINING COMPANY LIMITED
NOTES TO THE CONSOLIDATED FINANCIAL STATEMENTS—(Continued)
41.44. FINANCIAL INSTRUMENT—INSTRUMENTS—Continued
41b.44b. Financial risk management objectives and policies—Continued
Market risk—Continued
(i) Currency risk—Continued
Sensitivity analysis
The Group is mainly exposed to the fluctuation against the currency ofbetween Renminbi (“RMB”) and United States Dollar and(“USD”) or Hong Kong Dollar.Dollar (“HKD”) and between Australian Dollar (“AUD”) and USD.
The following table details the Group’s sensitivity to a 5% increase and decrease in RMB against relevant foreign currencies. 5% represents management’s assessment of reasonably possible changes in foreign exchange rates over the period until the next annual balance sheet date. The sensitivity analysis includes only outstanding foreign currency denominated monetary items and adjusts their translation at the year end for a 5% change in foreign currency rates and also assumes all other risk variables remained constant. The sensitivity analysis includes loans to foreign operations within the Group where the denomination of the loan is in a currency other than the functional currency of the lender or the borrower.
| USD Impact (note i) | HKD Impact (note i ) | USD Impact (note i) | HKD Impact (note i ) | |||||||||||||||||||||||||||||
| 2010 | 2009 | 2010 | 2009 | 2012 | 2011 | 2012 | 2011 | |||||||||||||||||||||||||
| RMB’000 | RMB’000 | RMB’000 | RMB’000 | RMB’000 | RMB’000 | RMB’000 | RMB’000 | |||||||||||||||||||||||||
Increase (Decrease) to profit and loss | ||||||||||||||||||||||||||||||||
- if RMB weakens against respective foreign currency | 35,312 | 49,390 | 227 | 274 | 218,169 | 14,311 | 2 | 17 | ||||||||||||||||||||||||
- if RMB strengthens against respective foreign currency | (35,312 | ) | (49,390 | ) | (227 | ) | (274 | ) | (218,169 | ) | (14,311 | ) | (2 | ) | (17 | ) | ||||||||||||||||
|
|
|
| |||||||||||||||||||||||||||||
| USD Impact (note ii) | USD Impact (note ii) | |||||||||||||||
| 2010 | 2009 | 2012 | 2011 | |||||||||||||
| RMB’000 | RMB’000 | RMB’000 | RMB’000 | |||||||||||||
Increase (Decrease) to profit and loss | ||||||||||||||||
- if AUD weakens against respective foreign currency | (718,045 | ) | (739,749 | ) | (758,859 | ) | (873,588 | ) | ||||||||
- if AUD strengthens against respective foreign currency | 718,045 | 739,749 | 758,859 | 873,588 | ||||||||||||
Increase (Decrease) to shareholders’ equity | ||||||||||||||||
- if AUD weakens against respective foreign currency | (725,998 | ) | (740,615 | ) | (538,200 | ) | (680,643 | ) | ||||||||
- if AUD strengthens against respective foreign currency | 725,998 | 740,615 | 538,200 | 680,643 | ||||||||||||
|
| |||||||||||||||
YANZHOU COAL MINING COMPANY LIMITED
NOTES TO THE CONSOLIDATED FINANCIAL STATEMENTS—(Continued)
41.44. FINANCIAL INSTRUMENT—INSTRUMENTS—Continued
41b.44b. Financial risk management objectives and policies—Continued
Market risk—Continued
(i) Currency risk—Continued
Notes:
| (i) | This is mainly attributable to the exposure of the Group’s outstanding |
| (ii) | This is mainly attributable to the exposure |
In management’s opinion, the sensitivity analysis is unrepresentative of the inherent foreign exchange risk as the year end exposure does not reflect the exposure during the year.
(ii) Interest rate risk
The Group is exposed to cash flow interest rate risk in relation to variable-rate bank balances, term deposits, restricted cash (see note 17 for details of these bank balances)(note 17) and bankvariable rate borrowings (see note 35 for details of these borrowings)(note 37).
The interest rate hedging policy of the Group is disclosed in note 36.38.
The Group’s exposures to interest rate risk on financial assets and financial liabilities are detailed in the liquidity risk section of this note. The Group’s cash flow interest rate risk is mainly concentrated on the fluctuation of the PBOC arising from the Group’s RMB borrowings and the LIBOR arising from the Group’s USD borrowings and the Australian BBSY arising from the Group’s AUDforeign currencies borrowings.
YANZHOU COAL MINING COMPANY LIMITED
NOTES TO THE CONSOLIDATED FINANCIAL STATEMENTS—(Continued)
41.44. FINANCIAL INSTRUMENT—INSTRUMENTS—Continued
41b.44b. Financial risk management objectives and policies—Continued
Market risk—Continued
(ii) Interest rate risk—Continued
Sensitivity Analysis
The following table details the Group’s sensitivity to a change of 100 basis points in the interest rate, assuming the financial instruments outstanding at the end of the reporting period were outstanding for the whole year and all the variables were held constant. It includes the interest rate fluctuation of the abovementioned PBOC rate LIBOR and Australian BBSY rate.LIBOR.
| 2010 | 2009 | 2012 | 2011 | |||||||||||||
| RMB’000 | RMB’000 | RMB’000 | RMB’000 | |||||||||||||
Increase (Decrease) to profit and loss | ||||||||||||||||
-If increases by 100 basis points | (71,946 | ) | (61,818 | ) | (176,676 | ) | (114,257 | ) | ||||||||
-If decreases by 100 basis points | 71,946 | 61,818 | 176,676 | 114,257 | ||||||||||||
Increase (Decrease) to shareholders’ equity | ||||||||||||||||
-If increases by 100 basis points | (34,692 | ) | (61,818 | ) | (153,106 | ) | (78,815 | ) | ||||||||
-If decreases by 100 basis points | 34,692 | 61,818 | 153,106 | 78,815 | ||||||||||||
|
| |||||||||||||||
(iii) Other price risk
In addition to the above risks relating to financial instruments, the Group is exposed to equity price risk through investment in listed equity securities and also to price risk in non financial instruments such as steel and metals (the Group’s major raw materials). The Group currently does not have any arrangement to hedge the price risk exposure of its investment in equity securities and its purchase of raw materials. The Group’s exposure to equity price risk through investment in listed equity securities and also the result of the sensitivity analysis is not significant.
YANZHOU COAL MINING COMPANY LIMITED
NOTES TO THE CONSOLIDATED FINANCIAL STATEMENTS—(Continued)
41.44. FINANCIAL INSTRUMENT—INSTRUMENTS—Continued
41b.44b. Financial risk management objectives and policies—Continued
Liquidity risk
In the management of the liquidity risk, the Group monitors and maintains a level of cash and cash equivalents deemed adequate by the management to finance the Group’s operations and mitigate the effects of fluctuations in cash flows. The management monitors the utilization of bank borrowings and ensures compliance with loan covenants.
The following table details the Group’s remaining contractual maturity for its financial liabilities. For non-derivative financial liabilities, the table has been drawn up based on the undiscounted cash flows of financial liabilities based on the earliest date on which the Group can be required to pay. The table includes both interest and principal cash flows.
Liquidity and interest risk tables
| Weighted average effective interest rate | Less than 3 months | 3-6 months | 6 months to 1 year | 1-5 years | 5+ years | Total undiscounted cash flow | Carrying amount at 12.31 | Weighted average effective interest rate | Less than 3 months | 3-6 months | 6 months to 1 year | 1-5 years | 5+ years | Total undiscounted cash flow | Carrying amount at 12.31 | |||||||||||||||||||||||||||||||||||||||||||||||||
| % | RMB’000 | RMB’000 | RMB’000 | RMB’000 | RMB’000 | RMB’000 | RMB’000 | % | RMB’000 | RMB’000 | RMB’000 | RMB’000 | RMB’000 | RMB’000 | RMB’000 | |||||||||||||||||||||||||||||||||||||||||||||||||
2010 | ||||||||||||||||||||||||||||||||||||||||||||||||||||||||||||||||
2012 | ||||||||||||||||||||||||||||||||||||||||||||||||||||||||||||||||
Non-derivative financial liabilities | ||||||||||||||||||||||||||||||||||||||||||||||||||||||||||||||||
Bills and accounts payables | N/A | 1,539,098 | 15,346 | — | — | — | 1,554,444 | 1,554,444 | N/A | 6,793,293 | 18,467 | — | — | — | 6,811,760 | 6,811,760 | ||||||||||||||||||||||||||||||||||||||||||||||||
Other payables | N/A | 1,732,092 | — | — | — | — | 1,732,092 | 1,732,092 | N/A | 7,454,033 | — | — | — | — | 7,454,033 | 7,454,033 | ||||||||||||||||||||||||||||||||||||||||||||||||
Amount due to Parent Company and its subsidiary companies | N/A | 438,783 | — | — | — | — | 438,783 | 438,783 | N/A | 93,712 | — | — | — | — | 93,712 | 93,712 | ||||||||||||||||||||||||||||||||||||||||||||||||
Finance leases | 6.9%-12.47 | % | 38,185 | 38,185 | 76,370 | 898,025 | — | 1,050,765 | 822,004 | |||||||||||||||||||||||||||||||||||||||||||||||||||||||
USD Guaranteed note | 4.62%-5.80 | % | 81,058 | 81,058 | 162,116 | 4,054,258 | 4,349,975 | 8,728,465 | 6,284,835 | |||||||||||||||||||||||||||||||||||||||||||||||||||||||
RMB Guaranteed note | 4.42%-5.00 | % | — | — | 240,000 | 1,960,000 | 4,990,000 | 7,190,000 | 4,953,000 | |||||||||||||||||||||||||||||||||||||||||||||||||||||||
Loan pledged by machineries | 6.56 | % | 32,800 | 2,015,367 | — | — | — | 2,048,167 | 2,000,000 | |||||||||||||||||||||||||||||||||||||||||||||||||||||||
Finance lease liabilities | 7.74 | % | 11,207 | 11,207 | 22,415 | 193,473 | 27,090 | 265,392 | 232,690 | |||||||||||||||||||||||||||||||||||||||||||||||||||||||
Bank borrowings - variable rate | 1.05%-7.6 | % | 144,597 | 449,854 | 284,383 | 22,674,270 | 50,722 | 23,603,826 | 22,193,754 | 1.06%-6.90 | % | 599,726 | 1,501,707 | 3,717,194 | 7,085,626 | 17,933,866 | 30,838,119 | 27,525,857 | ||||||||||||||||||||||||||||||||||||||||||||||
Long-term payable | N/A | 1,626 | — | 1,576 | 10,968 | 2,337 | 16,507 | 16,348 | 4.98%-6.50 | % | 1,583 | — | 521,163 | 2,086,372 | — | 2,609,118 | 1,992,780 | |||||||||||||||||||||||||||||||||||||||||||||||
Contingent value rights shares liabilities | N/A | — | — | — | 1,432,188 | — | 1,432,188 | 1,432,188 | ||||||||||||||||||||||||||||||||||||||||||||||||||||||||
|
|
|
|
|
|
|
| |||||||||||||||||||||||||||||||||||||||||||||||||||||||||
| 3,894,381 | 503,385 | 362,329 | 23,583,263 | 53,059 | 28,396,417 | 26,757,425 | 15,067,412 | 3,627,806 | 4,662,888 | 16,811,917 | 27,300,931 | 67,470,954 | 58,780,855 | |||||||||||||||||||||||||||||||||||||||||||||||||||
|
|
|
|
|
|
|
| |||||||||||||||||||||||||||||||||||||||||||||||||||||||||
Financial guarantees issued | ||||||||||||||||||||||||||||||||||||||||||||||||||||||||||||||||
Maximum amount guaranteed (note) | N/A | — | — | — | — | 532,607 | 532,607 | — | N/A | — | — | — | — | 2,212,915 | 2,212,915 | — | ||||||||||||||||||||||||||||||||||||||||||||||||
|
|
|
|
|
|
|
| |||||||||||||||||||||||||||||||||||||||||||||||||||||||||
Derivative financial instruments – gross settlement | ||||||||||||||||||||||||||||||||||||||||||||||||||||||||||||||||
Forward foreign exchange contracts - Outflow | N/A | 14,747 | 41,098 | 32,155 | — | — | 88,000 | 88,000 | N/A | 1,580,690 | — | 19,038 | — | — | 1,599,728 | 1,599,728 | ||||||||||||||||||||||||||||||||||||||||||||||||
|
|
|
|
|
|
|
| |||||||||||||||||||||||||||||||||||||||||||||||||||||||||
Derivative financial instruments – net settlement | ||||||||||||||||||||||||||||||||||||||||||||||||||||||||||||||||
Interest rate swap contracts | N/A | 38,297 | 37,103 | 67,529 | 10,980 | — | 153,909 | 153,909 | N/A | 19,462 | 19,462 | 40,006 | 35,491 | — | 114,421 | 114,421 | ||||||||||||||||||||||||||||||||||||||||||||||||
|
|
|
|
|
|
|
| |||||||||||||||||||||||||||||||||||||||||||||||||||||||||
Note: the amount presented is the maximum contractual presented under guarantees issued.
YANZHOU COAL MINING COMPANY LIMITED
NOTES TO THE CONSOLIDATED FINANCIAL STATEMENTS—(Continued)
41.44. FINANCIAL INSTRUMENT—Continued
41b.44b. Financial risk management objectives and policies—Continued
Liquidity risk—Continued
Liquidity and interest risk tables—Continued
| Weighted average effective interest rate | Less than 3 months | 3-6 months | 6 months to 1 year | 1-5 years | 5+ years | Total undiscounted cash flow | Carrying amount at 12.31 | |||||||||||||||||||||||||
| % | RMB’000 | RMB’000 | RMB’000 | RMB’000 | RMB’000 | RMB’000 | RMB’000 | |||||||||||||||||||||||||
2009 | ||||||||||||||||||||||||||||||||
Non-derivative financial liabilities | ||||||||||||||||||||||||||||||||
Bills and accounts payables | N/A | 1,306,265 | 60,711 | — | — | — | 1,366,976 | 1,366,976 | ||||||||||||||||||||||||
Other payables | N/A | 2,612,165 | — | — | — | — | 2,612,165 | 2,612,165 | ||||||||||||||||||||||||
Amount due to Parent Company and its subsidiary companies | N/A | 757,882 | — | — | — | — | 757,882 | 757,882 | ||||||||||||||||||||||||
Finance Leases | 6.9%-12.47 | % | 656,703 | — | — | — | — | 656,703 | 656,703 | |||||||||||||||||||||||
Bank borrowings - variable rate | 4.02%-7.6 | % | 919,410 | 11,254 | 11,588 | 24,930,041 | 92,394 | 25,964,687 | 21,853,138 | |||||||||||||||||||||||
Long-term payable | N/A | 1,532 | — | 1,532 | 15,324 | 3,065 | 21,453 | 15,309 | ||||||||||||||||||||||||
| 6,253,957 | 71,965 | 13,120 | 24,945,365 | 95,459 | 31,379,866 | 27,262,173 | ||||||||||||||||||||||||||
Financial guarantees issued | ||||||||||||||||||||||||||||||||
Maximum amount guaranteed (note) | N/A | — | — | — | — | 286,181 | 286,181 | — | ||||||||||||||||||||||||
Derivative financial instruments – gross settlement | ||||||||||||||||||||||||||||||||
Forward foreign exchange contracts - Outflow | N/A | 100,254 | 71,511 | — | — | — | 171,765 | 171,765 | ||||||||||||||||||||||||
Derivative financial instruments – net settlement | ||||||||||||||||||||||||||||||||
Interest rate swap contracts | N/A | 4,353 | — | — | — | — | 4,353 | 4,353 | ||||||||||||||||||||||||
| Weighted average effective interest rate | Less than 3 months | 3-6 months | 6 months to 1 year | 1-5 years | 5+ years | Total undiscounted cash flow | Carrying amount at 12.31 | |||||||||||||||||||||||||
| % | RMB’000 | RMB’000 | RMB’000 | RMB’000 | RMB’000 | RMB’000 | RMB’000 | |||||||||||||||||||||||||
2011 | ||||||||||||||||||||||||||||||||
Non-derivative financial liabilities | ||||||||||||||||||||||||||||||||
Bills and accounts payables | N/A | 2,205,968 | 34,876 | — | — | — | 2,240,844 | 2,240,844 | ||||||||||||||||||||||||
Other payables | N/A | 4,514,097 | — | — | — | — | 4,514,097 | 4,514,097 | ||||||||||||||||||||||||
Amount due to Parent Company and its subsidiary companies | N/A | 352,625 | — | — | — | — | 352,625 | 352,625 | ||||||||||||||||||||||||
Bank borrowings - variable rate | 2.76%-6.90 | % | 7,845,689 | 2,344,366 | 10,279,014 | 15,970,348 | 34,020 | 36,473,437 | 34,457,820 | |||||||||||||||||||||||
Long-term payable | 6.50 | % | 1,535 | — | 1,474 | 9,807 | — | 12,816 | 11,364 | |||||||||||||||||||||||
|
|
|
|
|
|
|
|
|
|
|
|
|
|
|
| |||||||||||||||||
| 14,919,914 | 2,379,242 | 10,280,488 | 15,980,155 | 34,020 | 43,593,819 | 41,576,750 | ||||||||||||||||||||||||||
|
|
|
|
|
|
|
|
|
|
|
|
|
|
|
| |||||||||||||||||
Financial guarantees issued | ||||||||||||||||||||||||||||||||
Maximum amount guaranteed (note) | N/A | — | — | — | — | 1,392,566 | 1,392,566 | — | ||||||||||||||||||||||||
|
|
|
|
|
|
|
|
|
|
|
|
|
|
|
| |||||||||||||||||
Derivative financial instruments – gross settlement | ||||||||||||||||||||||||||||||||
Forward foreign exchange contracts - Outflow | N/A | 180,014 | 695,818 | 1,118,038 | — | — | 1,993,870 | 1,993,870 | ||||||||||||||||||||||||
|
|
|
|
|
|
|
|
|
|
|
|
|
|
|
| |||||||||||||||||
Derivative financial instruments – net settlement | ||||||||||||||||||||||||||||||||
Interest rate swap contracts | N/A | 30,552 | 30,552 | 62,802 | 55,712 | — | 179,618 | 179,618 | ||||||||||||||||||||||||
|
|
|
|
|
|
|
|
|
|
|
|
|
|
|
| |||||||||||||||||
Note: the amount presented is the maximum contractual presented under guarantees issued.
41c.44c. Fair values
The fair value of available-for-sales investment is determined with reference to quoted market price. The fair values of the forward foreign exchange contracts are estimated based on the discounted cash flows between the contract forward rate and spot forward rate. The fair values of interest rate swap contracts are estimated based on the discounted cash flows between the contract floating rate and contract fixed rate. The fair value of other financial assets and financial liabilities are determined in accordance with generally accepted pricing models based on discounted cash flow analysis.
The directors consider that the carrying amounts of financial assets and financial liabilities recorded at amortized cost in the consolidated financial statements approximate their fair values.
YANZHOU COAL MINING COMPANY LIMITED
NOTES TO THE CONSOLIDATED FINANCIAL STATEMENTS—(Continued)
41.44. FINANCIAL INSTRUMENT—INSTRUMENTS—Continued
41c.44c. Fair values—Continued
Fair values of financial assets and financial liabilities are determined as follows:
The following table presents the carrying value of financial instruments measured at fair value across the three levels of the fair value hierarchy defined in IFRS 7 (Amendment). The levels of fair value are defined as follows:
| Level 1: | fair value measurements are those derived from quoted prices (unadjusted) in active markets for identical assets and liabilities; | |
| Level 2: | fair value measurements are those derived from inputs other than quoted prices included within Level 1 that are observable for the asset or liability either directly (i.e. as prices) or indirectly (i.e. derived from prices); and | |
| Level 3: | fair value measurements are those derived from valuation techniques that include inputs for the assets or liability that are not based on observable market data (unobservable inputs). | |
| Level 1 | Level 2 | Level 3 | At December 31 Total | Level 1 | Level 2 | Level 3 | At December 31 Total | |||||||||||||||||||||||||
| RMB’000 | RMB’000 | RMB’000 | RMB’000 | RMB’000 | RMB’000 | RMB’000 | RMB’000 | |||||||||||||||||||||||||
2010 | ||||||||||||||||||||||||||||||||
2012 | ||||||||||||||||||||||||||||||||
Assets | ||||||||||||||||||||||||||||||||
Available-for-sale investments | ||||||||||||||||||||||||||||||||
- Investments in securities listed on the SSE | 194,258 | — | — | 194,258 | 167,572 | — | — | 167,572 | ||||||||||||||||||||||||
Derivative financial instruments | ||||||||||||||||||||||||||||||||
- Forward foreign exchange contracts | — | 239,476 | — | 239,476 | — | 76,640 | — | 76,640 | ||||||||||||||||||||||||
- Collar option | — | 14,091 | — | 14,091 | ||||||||||||||||||||||||||||
Financial assets at fair value through profit or loss | ||||||||||||||||||||||||||||||||
- Royalty receivable | — | — | 1,349,447 | 1,349,447 | ||||||||||||||||||||||||||||
|
|
|
| |||||||||||||||||||||||||||||
| 194,258 | 239,476 | — | 433,734 | 167,572 | 90,731 | 1,349,447 | 1,607,750 | |||||||||||||||||||||||||
|
|
|
| |||||||||||||||||||||||||||||
Liabilities | ||||||||||||||||||||||||||||||||
Derivative financial instruments | ||||||||||||||||||||||||||||||||
- Forward foreign exchange contracts | — | 12,269 | — | 12,269 | — | 13,656 | — | 13,656 | ||||||||||||||||||||||||
- Interest rate swap contracts | — | 153,909 | — | 153,909 | — | 114,421 | — | 114,421 | ||||||||||||||||||||||||
Financial liabilities at fair value through profit or loss | ||||||||||||||||||||||||||||||||
- Contingent value rights shares liabilities | 1,432,188 | — | — | 1,432,188 | ||||||||||||||||||||||||||||
|
|
|
| |||||||||||||||||||||||||||||
| — | 166,178 | — | 166,178 | 1,432,188 | 128,077 | — | 1,560,265 | |||||||||||||||||||||||||
|
|
|
| |||||||||||||||||||||||||||||
2009 | ||||||||||||||||||||||||||||||||
Assets | ||||||||||||||||||||||||||||||||
Available-for-sale investments | ||||||||||||||||||||||||||||||||
- Investments in securities listed on the SSE | 264,672 | — | — | 264,672 | ||||||||||||||||||||||||||||
Derivative financial instruments | ||||||||||||||||||||||||||||||||
- Forward foreign exchange contracts | — | 37,760 | — | 37,760 | ||||||||||||||||||||||||||||
| 264,672 | 37,760 | — | 302,432 | |||||||||||||||||||||||||||||
Liabilities | ||||||||||||||||||||||||||||||||
Derivative financial instruments | ||||||||||||||||||||||||||||||||
- Forward foreign exchange contracts | — | 23,980 | — | 23,980 | ||||||||||||||||||||||||||||
- Interest rate swap contracts | — | 4,353 | — | 4,353 | ||||||||||||||||||||||||||||
| — | 28,333 | — | 28,333 | |||||||||||||||||||||||||||||
YANZHOU COAL MINING COMPANY LIMITED
NOTES TO THE CONSOLIDATED FINANCIAL STATEMENTS—(Continued)
44. FINANCIAL INSTRUMENTS—Continued
44c. Fair values—Continued
| Level 1 | Level 2 | Level 3 | At December 31 Total | |||||||||||||
2011 | ||||||||||||||||
Assets | ||||||||||||||||
Available-for-sale investments | ||||||||||||||||
- Investments in securities listed on the SSE | 173,495 | — | — | 173,495 | ||||||||||||
Derivative financial instruments | ||||||||||||||||
- Forward foreign exchange contracts | — | 104,910 | — | 104,910 | ||||||||||||
|
|
|
|
|
|
|
| |||||||||
| 173,495 | 104,910 | — | 278,405 | |||||||||||||
|
|
|
|
|
|
|
| |||||||||
Liabilities | ||||||||||||||||
Derivative financial instruments | ||||||||||||||||
- Forward foreign exchange contracts | — | 42,471 | — | 42,471 | ||||||||||||
- Interest rate swap contracts | — | 179,618 | — | 179,618 | ||||||||||||
|
|
|
|
|
|
|
| |||||||||
| — | 222,089 | — | 222,089 | |||||||||||||
|
|
|
|
|
|
|
| |||||||||
There were no transfers between Levels 1 and 2 during the year ended December 31, 20102012 and 2009.2011.
YANZHOU COAL MINING COMPANY LIMITED
NOTES TO THE CONSOLIDATED FINANCIAL STATEMENTS—(Continued)
42.45. ACQUISITION OF HUA JU ENERGYBEISU AND YANGCUN
On October 24, 2008,
| Carrying amounts | Fair value Adjustments | Fair values | ||||||||||
| RMB’000 | RMB’000 | RMB’000 | ||||||||||
Bank balances and cash | 8,131 | — | 8,131 | |||||||||
Accounts receivable and other receivables | 96,626 | — | 96,626 | |||||||||
Inventories | 2,731 | 286 | 3,017 | |||||||||
Interests in associates | 3,927 | — | 3,927 | |||||||||
Property, plant and equipment, net | 285,515 | — | 285,515 | |||||||||
Intangible assets | 275,097 | 189,503 | 464,600 | |||||||||
Accounts payable and other payables | (708,584 | ) | 1,982 | (706,602 | ) | |||||||
Deferred taxation | 4,181 | (47,447 | ) | (43,266 | ) | |||||||
Provision for land subsidence, restoration, rehabilitation and environmental costs | (20 | ) | — | (20 | ) | |||||||
|
| |||||||||||
Net assets acquired | 111,928 | |||||||||||
Goodwill arising on acquisition | 712,214 | |||||||||||
|
| |||||||||||
| 824,142 | ||||||||||||
|
| |||||||||||
Considerations: | ||||||||||||
Cash paid on acquisition | 824,142 | |||||||||||
|
| |||||||||||
Net cash outflow arising on acquisition: | ||||||||||||
Cash outflow arising on acquisition | (824,142 | ) | ||||||||||
Bank balance and cash acquired | 8,131 | |||||||||||
|
| |||||||||||
| (816,011 | ) | |||||||||||
|
| |||||||||||
During the period from the acquisition date to 31 December 2012, Beisu and Yangcun did not contribute any significant revenue or profit to the Group. Goodwill arose because the Group can increase its production capacity in coal and the coverage of exploration from this acquisition.
YANZHOU COAL MINING COMPANY LIMITED
NOTES TO THE CONSOLIDATED FINANCIAL STATEMENTS—(Continued)
46. ACQUISITION OF GLOUCESTER
During the year, a wholly-owned subsidiary of the Company, entered into an acquisition agreementYancoal Australia, merged with the Parent Company to acquire 74% equity interest in Hua Ju Energy. On February 18, 2009, the acquisitionGloucester. The merger was completed and theon June 27, 2012. Yancoal Australia acquired Gloucester at a consideration of RMB593,243,000 was fully paid toa combination of 218,727,665 ordinary shares of Yancoal Australia and 87,645,184 CVR shares. Gloucester is a company listed on the Parent Company to acquire 74% equity interestASX. Following the completion of Hua Ju Energy.the merger, Yancoal Australia is separately listed on the ASX, replacing the listing position of Gloucester. The ordinary shares and CVR shares of Yancoal Australia were listed on the ASX on June 28, 2012. Gloucester mainly engaged in production of coking coal and thermal coal. The net assets acquired were included in the methanol, electricity and heat supplymining segment.
In July 2009, the Company paid RMB173,007,000 to three former shareholders of Hua Ju Energy to acquire additional 21.14% equity interest in Hua Ju Energy which gives rise to goodwill of RMB38,187,000.
ThisThe acquisition has been accounted for using the purchaseacquisition method.
The net assets of Hua Ju Energy acquired andon the goodwill arising,acquisition date are as follows:
| ||||
| ||||
| ||||
| ||||
| ||||
| ||||
| ||||
| ||||
| ||||
| ||||
| ||||
| ||||
| ||||
| ||||
| ||||
| ||||
| ||||
| ||||
| ||||
| ||||
| ||||
There is no significant difference between the carrying value and the fair value of net assets of Hua Ju Energy.
| Carrying amounts | Fair value Adjustments | Fair values | ||||||||||
| RMB’000 | RMB’000 | RMB’000 | ||||||||||
Bank balances and cash | 237,315 | — | 237,315 | |||||||||
Accounts receivable and other receivables | 605,407 | (379,589 | ) | 225,818 | ||||||||
Inventories | 232,490 | (3,076 | ) | 229,414 | ||||||||
Investments in jointly control entities | 1,951,741 | (814,218 | ) | 1,137,523 | ||||||||
Investment in securities | 47,026 | — | 47,026 | |||||||||
Royalty receivable | 1,243,158 | 46,857 | 1,290,015 | |||||||||
Property, plant and equipment, net | 2,611,394 | 761,968 | 3,373,362 | |||||||||
Construction in progress | 257,395 | 93,729 | 351,124 | |||||||||
Intangible assets | 4,908,788 | 710,512 | 5,619,300 | |||||||||
Long term receivables | 1,329,578 | — | 1,329,578 | |||||||||
Accounts payable and other payables | (3,988,052 | ) | 71,332 | (3,916,720 | ) | |||||||
Provision for land subsidence, restoration, rehabilitation and environmental costs | (100,145 | ) | — | (100,145 | ) | |||||||
Long term payables | (1,324,852 | ) | 781,691 | (543,161 | ) | |||||||
Tax recoverable | 14,978 | — | 14,978 | |||||||||
Deferred taxation | (1,283,674 | ) | 468,158 | (815,516 | ) | |||||||
Borrowings | (3,725,732 | ) | — | (3,725,732 | ) | |||||||
|
| |||||||||||
Net assets acquired | 4,754,179 | |||||||||||
Gain on bargain purchase | (1,269,269 | ) | ||||||||||
|
| |||||||||||
| 3,484,910 | ||||||||||||
|
| |||||||||||
Considerations: | ||||||||||||
Fair value of ordinary shares issued by Yancoal Australia | 2,138,130 | |||||||||||
Fair value of CVR shares issued | 1,312,913 | |||||||||||
Direct expenses incurred on the issuance of ordinary shares and CVR shares of Yancoal Australia | 33,867 | |||||||||||
|
| |||||||||||
| 3,484,910 | ||||||||||||
|
| |||||||||||
Net cash inflow arising on acquisition: | ||||||||||||
Bank balance and cash acquired | 237,315 | |||||||||||
|
| |||||||||||
YANZHOU COAL MINING COMPANY LIMITED
NOTES TO THE CONSOLIDATED FINANCIAL STATEMENTS—(Continued)
42.46. ACQUISITION OF HUA JU ENERGY—GLOUCESTER—Continued
Goodwill arising from acquisitionBargain purchase arises because the consideration (number of Hua Ju Energy is mainly because this acquisition can establish an electricity management platform forshares to be issued) was fixed when the Group and is beneficial tomerger proposal was announced. Upon the future developmentdate of coal resources ofcompletion, the Group. It also ensures stable supply of electricity to the Group, reduce operating costs, and enhance profitability and operating results. It further ensures environmental disposal of waste products such as coal gangue produced from the Group’s mining operations.
During the period from the acquisition date/the beginning period date to December 31, 2009, this transaction does not have any material impact on the revenue and operating results of the Group.
43. ACQUISITION OF FELIX
On 13 August 2009, the Company entered into a binding scheme implementation agreement with Felix to acquire 100% equity interest in Felix. On December 23, 2009, the acquisition was completedmarket capitalization and the Companymarket price of shares dropped and hence the total consideration paid were less than the considerationfair value of AUD3,333 million to all the shareholders of Felix. On December 30, 2009, Felix was delisted from the Australian Securities Exchange and all legal procedures of acquiring all of the Felix shares have been completed. The net identifiable assets acquired were included inbecause there is no mechanism to adjust the coal mining segment.
This acquisition has been accounted for using the purchase method.
YANZHOU COAL MINING COMPANY LIMITED
NOTES TO THE CONSOLIDATED FINANCIAL STATEMENTS—(Continued)
43. ACQUISITION OF FELIX—Continued
The net assetsnumber of Felix acquired, and the goodwill arising, are as follows:shares to be issued.
| Carrying amounts | Fair value adjustments | Fair values | ||||||||||
| RMB’000 | RMB’000 | RMB’000 | ||||||||||
Bank balances and cash | 872,435 | — | 872,435 | |||||||||
Term deposits | 91,941 | — | 91,941 | |||||||||
Bills and accounts receivable | 292,008 | — | 292,008 | |||||||||
Inventories | 306,444 | (39,349 | ) | 267,095 | ||||||||
Prepayments and other receivables | 214,501 | — | 214,501 | |||||||||
Derivative financial instrument assets | 27,928 | — | 27,928 | |||||||||
Tax recoverable | 46,777 | — | 46,777 | |||||||||
Other currents assets | 350,676 | — | 350,676 | |||||||||
Property, plant and equipment, net | 2,842,046 | 704,861 | 3,546,907 | |||||||||
Available-for-sale financial assets | 1 | — | 1 | |||||||||
Interests in jointly controlled entities | 1,257 | — | 1,257 | |||||||||
Intangible assets | 1,312,393 | 16,535,630 | 17,848,023 | |||||||||
Accounts payable | (390,927 | ) | — | (390,927 | ) | |||||||
Receipts in advance and other payables | (700,833 | ) | — | (700,833 | ) | |||||||
Borrowings | (1,573,956 | ) | — | (1,573,956 | ) | |||||||
Derivative financial instrument liabilities | (28,333 | ) | — | (28,333 | ) | |||||||
Deferred taxation | (376,526 | ) | (596,585 | ) | (973,111 | ) | ||||||
Provision for land subsidence, restoration, rehabilitation and environmental costs | (48,170 | ) | — | (48,170 | ) | |||||||
Other long-term payables | (28,367 | ) | — | (28,367 | ) | |||||||
Net assets acquired | 19,815,852 | |||||||||||
Non-controlling interests | (23,542 | ) | ||||||||||
Goodwill arising on acquisition | 766,816 | |||||||||||
| 20,559,126 | ||||||||||||
Total consideration satisfied by: | ||||||||||||
Cash consideration paid on acquisition | 20,428,030 | |||||||||||
Direct acquisition costs paid | 2,949 | |||||||||||
Direct acquisition costs not yet settled | 128,147 | |||||||||||
| 20,559,126 | ||||||||||||
Net cash outflow arising on acquisition: | ||||||||||||
Cash paid on acquisition | (20,430,979 | ) | ||||||||||
Bank balances and cash acquired | 872,435 | |||||||||||
| (19,558,544 | ) | |||||||||||
During the period from the acquisition date to December 31, 2009, Felix did not2012, Gloucester have any material impact on thecontributed a total revenue of RMB1,658 million and an operating results the Group.loss of RMB 387 million.
If the acquisition had been completedoccurred on January 1, 2009,2012, the Group’sconsolidated revenue and net profit of the Group for the year ended December 31, 2012 would have been RMB23,894RMB59,839 million and the Group’s profit for the year would have been RMB4,914 million.RMB4,846 million respectively. The pro formaproforma financial information is for illustrative purposespurpose only and isdoes not necessarily an indication ofreflect the Group’s revenue and operating results if the acquisition has been completed by January 1, 2012 and could not serve as a basis for the forecast of operationsfuture operation result.
The purpose of the Groupissuance of CVR shares is to protect the original shareholders of Gloucester from the fluctuation of the share price of the Yancoal Australia after the merger. If the weighted average price of the last 3 months in the next 18 months after the transaction is lower than AUD6.96 per share, the CVR shares will be redeemed by cash (or shares of Yancoal Australia held by the Company at the discretion of Yancoal Australia) at guaranteed price of AUD6.96 per share. The redemption price will not exceed AUD3 per share. The holders of the CVR shares do not have the power to vote (or shares of the condition that actually would have been achieved hadis required by the acquisition been completed on January 1, 2009, nor is it intendedASX). Also, the holders of the CVR shares are not entitled to be a projectionany dividend, right to enroll the new securities and bonus shares that are distributed or issued by Yancoal Australia. The Company are committed to the obligations related to the issuance of future results.
YANZHOU COAL MINING COMPANY LIMITED
NOTES TO THE CONSOLIDATED FINANCIAL STATEMENTS—(Continued)
43. ACQUISITION OF FELIX—Continued
the CVR shares by Yancoal Australia.
The goodwill arising fromvaluation of the acquisition is attributable toshares issued by Yancoal Australia and the extension of coal reserves and diversification of operations by the Group, and operational synergies and strategic benefits.CVR are stated at market value.
44.47. ACQUISITION OF THREE SUBSIDIARIES
In 2009, the Group signed a co-operation agreement with an independent third party for the acquisition of 100% equity of Yize. The acquisition was completed on April 30, 2010 with a consideration of RMB179.7 million being paid to the shareholders of Yize.
During the year,In 2010, the Group has also completed the acquisition of 100% equity of Inner Mongolia Rongxin Chemical Co., Ltd (“Rongxin Chemicals”) and Inner Mongolia Daxin Industrial Gas Co., Ltd (“Daxin Industrial”) with cash consideration of RMB4.4 million and RMB6 million respectively.
Yize, Rongxin Chemicals and Daxin Industrial have not engaged in any operating activities at the acquisition date and the acquisitions were reflected as purchases of assets and liabilities of which no goodwill was recognized.
YANZHOU COAL MINING COMPANY LIMITED
NOTES TO THE CONSOLIDATED FINANCIAL STATEMENTS—(Continued)
47. ACQUISITION OF THREE SUBSIDIARIES—Continued
Net book values of the acquired net assets at acquisition dates are as follow:
| Carrying amounts | ||||
| RMB’000 | ||||
Inventories | 7 | |||
Prepayments and other receivables | 15,600 | |||
Property, plant and equipment, net | 4,751 | |||
Prepaid lease payments | 55,418 | |||
Intangible assets | 131,985 | |||
Other payables | (17,666 | ) | ||
Net assets acquired | 190,095 | |||
Considerations: | ||||
Cash paid on acquisition | 133,000 | |||
Deposit paid for acquisition of investment in prior year | 57,095 | |||
| 190,095 | ||||
Net cash outflow arising on acquisition | (133,000 | ) | ||
48. ACQUISITION OF AN YUAN COAL MINE
In 2010, Ordos signed a co-operation agreement with an independent third party for the acquisition of An Yuan Coal Mine at a consideration of RMB1,435 million. The acquisition was completed during 2011.
The acquisition of An Yuan Coal Mine was classified as purchase of assets and liabilities of which no goodwill was recognized.
Net book values of the acquired net assets at acquisition date are as follow:
| Carrying amounts | ||||
| RMB’000 | ||||
Property, plant and equipment, net | 176,067 | |||
Intangible assets | 1,258,433 | |||
Other current assets | 500 | |||
Net assets acquired | 1,435,000 | |||
Considerations: | ||||
Cash paid on acquisition | 355,000 | |||
Deposit paid for acquisition of investment in prior year | 1,080,000 | |||
| 1,435,000 | ||||
Net cash outflow arising on acquisition | (355,000 | ) | ||
YANZHOU COAL MINING COMPANY LIMITED
NOTES TO THE CONSOLIDATED FINANCIAL STATEMENTS—(Continued)
45.49. ACQUISITION OF ADDITIONAL INTERESTS IN JOINT VENTURE
The Australia subsidiaries of the Group originally held 60% equity interests in Ashton joint venture. During 2011, the Group acquired additional 30% equity interests in Ashton joint venture from another venturer at a consideration of USD250 million. This included the acquisition of 30% equity interests in the jointly controlled entities, Ashton Coal Mines Limited and Australian Coal Processing Holdings Pty Ltd. Upon completion of the acquisition, the Group held 90% equity interest in Ashton joint venture.
Under the shareholders agreement, the 90% equity interest held in Ashton remained classified as a joint venture.
50. ACQUISITION OF SYNTECH
On May 13, 2011, a wholly-owned subsidiary of the Company acquired 100% equity interests in Syntech and its subsidiaries for a cash consideration of AUD208,480,000. The equity transfer was completed on August 1, 2011. The principal business of Syntech and its subsidiaries include exploration, production, sorting and processing of coal, the major product of which is thermal coal. The net assets acquired were included in the mining segment.
This acquisition has been accounted for using the acquisition method.
The net assets of Syntech acquired, and the goodwill arising, are as follows:
| Carrying amounts | Fair value adjustments | Fair values | ||||||||||
| RMB’000 | RMB’000 | RMB’000 | ||||||||||
Bank balances and cash | 51,828 | — | 51,828 | |||||||||
Accounts receivable and other receivables | 118,042 | — | 118,042 | |||||||||
Inventories | 85,190 | 28,539 | 113,729 | |||||||||
Property, plant and equipment, net | 1,227,053 | (301,522 | ) | 925,531 | ||||||||
Intangible assets | 121,140 | 271,234 | 392,374 | |||||||||
Accounts and other payables | (219,243 | ) | — | (219,243 | ) | |||||||
Deferred tax | — | (25,642 | ) | (25,642 | ) | |||||||
Provision for land subsidence, restoration, rehabilitation and environmental costs | (14,259 | ) | — | (14,259 | ) | |||||||
|
| |||||||||||
Net assets acquired | 1,342,360 | |||||||||||
Goodwill arising on acquisition | 25,642 | |||||||||||
|
| |||||||||||
| 1,368,002 | ||||||||||||
|
| |||||||||||
Total consideration satisfied by: | ||||||||||||
Cash consideration paid on acquisition | 1,368,002 | |||||||||||
|
| |||||||||||
Net cash outflow arising on acquisition: | ||||||||||||
Cash paid on acquisition | (1,368,002 | ) | ||||||||||
Bank balances and cash acquired | 51,828 | |||||||||||
|
| |||||||||||
| (1,316,174 | ) | |||||||||||
|
| |||||||||||
The goodwill arising from the acquisition is attributable to the extension of mining reserves in Australia and diversification of operation by the Group, and operational synergies and strategic benefits.
YANZHOU COAL MINING COMPANY LIMITED
NOTES TO THE CONSOLIDATED FINANCIAL STATEMENTS—(Continued)
51. ACQUISITION OF PREMIER COAL AND WESFARMERS CHAR
On September 27, 2011, a wholly-owned subsidiary of the Company acquired 100% equity interests of both Premier Coal and Wesfarmers Char as a package for a cash consideration of AUD 313,533,000. The equity transfer was completed on December 30, 2011. For Premier Coal, the principal businesses are exploration, production and processing of coal; for Wesfarmers Char, the principal businesses are the research and development of the technology and procedures in relation to processing coal char from low rank coals. The net assets acquired were included in the mining segment.
This acquisition has been accounted for using the acquisition method.
The net assets of Premier Coal and Wesfarmers Char acquired, and the goodwill arising, are as follows:
| Carrying amounts | Fair value adjustments | Fair values | ||||||||||
| RMB’000 | RMB’000 | RMB’000 | ||||||||||
Accounts receivable and other receivables | 91,416 | — | 91,416 | |||||||||
Inventories | 68,956 | 4,666 | 73,622 | |||||||||
Property, plant and equipment, net | 1,484,398 | 264,216 | 1,748,614 | |||||||||
Intangible assets | — | 511,186 | 511,186 | |||||||||
Accounts and other payables | (198,715 | ) | — | (198,715 | ) | |||||||
Deferred tax | (123,377 | ) | 105,528 | (17,849 | ) | |||||||
Provision for land subsidence, restoration, rehabilitation and environmental costs | (168,847 | ) | — | (168,847 | ) | |||||||
|
| |||||||||||
Net assets acquired | 2,039,427 | |||||||||||
Goodwill arising on acquisition | 17,849 | |||||||||||
|
| |||||||||||
| 2,057,276 | ||||||||||||
|
| |||||||||||
Total consideration satisfied by: | ||||||||||||
Cash consideration paid on acquisition | 2,057,276 | |||||||||||
|
| |||||||||||
Net cash outflow arising on acquisition: | ||||||||||||
Cash paid on acquisition | (2,057,276 | ) | ||||||||||
|
| |||||||||||
The goodwill arising from the acquisition is attributable to the extension of mining reserves in Australia and diversification of operation by the Group, and operational synergies and strategic benefits.
YANZHOU COAL MINING COMPANY LIMITED
NOTES TO THE CONSOLIDATED FINANCIAL STATEMENTS—(Continued)
52. ACQUISITION OF XINTAI
In 2011, the Company entered into an agreement with independent third party to acquire 80% equity interests in Xintai at a cash consideration of RMB2,801,557,000. The acquisition was completed in 2011. Xintai owns and operates Wenyu Coal Mine located in Inner Mongolia. The principle businesses are coal mining and sales. The net assets acquired were included in the mining segment.
This acquisition has been accounted for using the acquisition method.
The net assets of Xintai acquired and the goodwill arising, are as follows:
| Carrying amounts | Fair value adjustments | Fair values | ||||||||||
| RMB’000 | RMB’000 | RMB’000 | ||||||||||
Property, plant and equipment, net | 182,403 | (14,427 | ) | 167,976 | ||||||||
Intangible assets | 50,362 | 3,283,608 | 3,333,970 | |||||||||
Deferred tax | — | (817,296 | ) | (817,296 | ) | |||||||
|
| |||||||||||
Net assets acquired | 2,684,650 | |||||||||||
Non-controlling interests | (536,930 | ) | ||||||||||
Goodwill arising on acquisition | 653,837 | |||||||||||
|
| |||||||||||
| 2,801,557 | ||||||||||||
|
| |||||||||||
Considerations: | ||||||||||||
Cash paid on acquisition | 2,751,557 | |||||||||||
Outstanding consideration payable | 50,000 | |||||||||||
|
| |||||||||||
| 2,801,557 | ||||||||||||
|
| |||||||||||
Net cash outflow arising on acquisition | ||||||||||||
Cash paid on acquisition | (2,751,557 | ) | ||||||||||
|
| |||||||||||
The goodwill arising from the acquisition is attributable to the extension of mining reserves and diversification of operation by the Group, and operational synergies and strategic benefits.
YANZHOU COAL MINING COMPANY LIMITED
NOTES TO THE CONSOLIDATED FINANCIAL STATEMENTS—(Continued)
53. DISPOSAL OF A JOINT VENTURE
As atDuring the year ended December 31, 2010, the Group disposed of its 51% interest in Minerva joint venture to an independent third party at a consideration of AUD191,860,000 (RMB1,235,840,000).
Net assets of joint venture dispose of are as follows:
| Carrying amounts | ||||
| RMB’000 | ||||
Total assets | 1,401,548 | |||
Total liabilities | (283,636 | ) | ||
| 1,117,912 | ||||
Gain on disposal of a joint venture | 117,928 | |||
Total consideration | 1,235,840 | |||
Cash inflow | ||||
Cash consideration | 1,235,840 | |||
Disposal of cash and bank balance | (88,019 | ) | ||
Net cash inflow from the disposal of Minerva | 1,147,821 | |||
During the year,2010, the Group has also disposed of its interests in Minerva Mining Pty Ltd, Minerva Coal Pty Ltd and Felix Coal Sales Pty Ltd, subsidiaries related to the operations of Minerva joint venture. The subsidiaries are not material to the Group and their assets, liabilities and related profit or loss on disposal have been included in the above disposal of a joint venture.
46.YANZHOU COAL MINING COMPANY LIMITED
NOTES TO THE CONSOLIDATED FINANCIAL STATEMENTS—(Continued)
54. RELATED PARTY BALANCES AND TRANSACTIONS
Transactions between the Company and its subsidiaries, which are related parties of the Company, have been eliminated on consolidation and are not disclosed. Details of balances and transactions between the Group and other related parties are disclosed below.
RelatedBalances and transactions with related party balances
| At December 31, | ||||||||
| 2012 | 2011 | |||||||
| RMB’000 | RMB’000 | |||||||
Nature of balances (other than those already disclosed) | ||||||||
Bills and accounts receivable | ||||||||
- Parent Company and its subsidiaries | 1,039,461 | 648,201 | ||||||
- Jointly controlled entities | — | 181,164 | ||||||
Prepayments and other receivables | ||||||||
- Parent Company and its subsidiaries | 109,662 | 127,367 | ||||||
- Jointly controlled entities | 187,324 | 198,780 | ||||||
Bills and accounts payable | ||||||||
- Jointly controlled entities | — | 181 | ||||||
Other payables and accrued expenses | ||||||||
- Parent Company and its subsidiaries | 1,674,286 | 1,075,627 | ||||||
|
|
|
| |||||
The amounts due from/to the Parent Company and its subsidiary companies are non-interest bearing, unsecured and unsecured.
The amounts due to the Parent Company and its subsidiary companies as at December 31, 2010 and 2009 included the present value of the outstanding balance that arose from the funding of the acquisition of the mining rights of Jining III as of January 1, 2001 discounted using the market rate of bank borrowings.
The consideration for the cost of the mining rights of approximately RMB132,479,000 is to be settled over the 10 years, commencing from 2001.
Except the amounts disclosed above, the amount due to the Parent Company and / or its subsidiary companies are repayable on demand.
YANZHOU COAL MINING COMPANY LIMITED
NOTES TO THE CONSOLIDATED FINANCIAL STATEMENTS—(Continued)
46. RELATED PARTY BALANCES AND TRANSACTIONS—Continued
Related party transactions
During the years, the Group had the following significant transactions with the Parent Company and/or its subsidiary companies:
| Year ended December 31, | Year ended December 31, | |||||||||||||||||||||||
| 2010 | 2009 | 2008 | 2012 | 2011 | 2010 | |||||||||||||||||||
| RMB’000 | RMB’000 | RMB’000 | RMB’000 | RMB’000 | RMB’000 | |||||||||||||||||||
Income | ||||||||||||||||||||||||
Sales of coal | 2,672,424 | 2,086,542 | 1,384,415 | 3,162,122 | 2,088,794 | 2,672,424 | ||||||||||||||||||
Sales of auxiliary materials | 454,254 | 317,479 | 550,986 | 425,957 | 485,676 | 454,254 | ||||||||||||||||||
Sales of heat and electricity | 235,002 | 204,061 | — | 167,295 | 180,808 | 235,002 | ||||||||||||||||||
Sales of methanol | 47,909 | — | — | |||||||||||||||||||||
Expenditure | ||||||||||||||||||||||||
Utilities and facilities | 34,006 | 39,069 | 376,288 | 35,906 | 31,646 | 34,006 | ||||||||||||||||||
Annual fee for mining rights | — | — | — | |||||||||||||||||||||
Purchases of supply materials and equipment | 421,606 | 598,498 | 471,768 | 1,552,758 | 696,802 | 421,606 | ||||||||||||||||||
Repair and maintenance services | 262,478 | 388,917 | 253,864 | 327,600 | 323,550 | 262,478 | ||||||||||||||||||
Social welfare and support services | 794,621 | 769,561 | 255,265 | 802,540 | 848,121 | 794,621 | ||||||||||||||||||
Technical support and training | 26,000 | 26,000 | 20,000 | — | 26,000 | 26,000 | ||||||||||||||||||
Road transportation services | 64,945 | 79,560 | 86,671 | 67,654 | 73,638 | 64,945 | ||||||||||||||||||
Construction services | 655,311 | 242,593 | 294,938 | 689,787 | 718,155 | 655,311 | ||||||||||||||||||
|
|
| ||||||||||||||||||||||
Certain expenditureExpenditures for social welfare and support services (excluding medical and child care expenses) of RMB259,575,000, RMB165,900,000RMB176,820,000, RMB269,182,000 and RMB165,900,000RMB259,575,000 for the years ended December 31, 2010, 20092012, 2011 and 2008, respectively, and for2010. In addition, no technical support and training of RMB26,000,000, RMB26,000,000 and RMB20,000,000, have beenexpenses charged by the Parent Company at a new negotiated amount per annum, subject to changes every year.
Duringfor the year ended December 31, 2008,2012 (2011: RMB26,000,000; 2010: RMB26,000,000). These expenses will be negotiated with the Parent Company each year.
YANZHOU COAL MINING COMPANY LIMITED
NOTES TO THE CONSOLIDATED FINANCIAL STATEMENTS—(Continued)
54. RELATED PARTY BALANCES AND TRANSACTIONS—Continued
Balances and transactions with related party—Continued
On April 23, 2012, the Company acquired Zhaolou coal mineentered into the assets transfer agreement with the Parent Company and its subsidiary to purchase the target assets from the Parent Company.
DuringCompany and its subsidiary at a consideration of RMB824,142,000 to acquire all the year ended December 31, 2009, the Company acquired 74%assets and liabilities of Beisu and Yangcun and their equity interestinvestments in Hua Ju Energy from the Parent Company.Beisheng Industry and Trade, Shengyang Wood and Jiemei Wall Materials. Details of this acquisition are set out in note 42.45.
As at 31 December, 2012, the Company has deposited RMB1,719,621,000 (2011: RMB1,820,000,000; 2010: RMB1,400,000,000) to the Company’s associate, Yan Kuang Group Finance Company Limited. The interest income received and finance cost paid during the year amounted to RMB7,986,000 (2011: RMB7,665,000; 2010: RMB680,000) and RMB1,411,000 (2011: RMB10,119,000; 2010: nil) respectively.
In addition to the above, the Company participates in a retirement benefit scheme of the Parent Company in respect of retirement benefits (note 48)56).
Transactions/balancesBalances and transactions with other state-controlled entities in the PRC
The Group operates in an economic environment currently predominated by entities directly or indirectly owned or controlled by the PRC government (“state-controlled entities”). In addition, the Group itself is part of a largerlarge group of companies under the Parent Company which is controlled by the PRC government. Apart from the transactions with the Parent Company and its subsidiaries disclosed above, the Group also conducts business with other state-controlled entities. The directors consider those state-controlled entities are independent third parties so far as the Group’s business transactions with them are concerned.
YANZHOU COAL MINING COMPANY LIMITED
NOTES TO THE CONSOLIDATED FINANCIAL STATEMENTS—(Continued)
46. RELATED PARTY BALANCES AND TRANSACTIONS—Continued
Transactions/balances with other state-controlled entities in the PRC—Continued
Material transactions with other state- controlled entities are as follows:
| Year ended December 31, | ||||||||||||||||||||||||
| 2010 | 2009 | 2008 | Year ended December 31, | |||||||||||||||||||||
| RMB’000 | RMB’000 | RMB’000 | 2012 | 2011 | 2010 | |||||||||||||||||||
| RMB’000 | RMB’000 | RMB’000 | ||||||||||||||||||||||
Trade sales | 9,823,814 | 6,970,855 | 10,253,998 | 10,503,203 | 8,487,421 | 9,823,814 | ||||||||||||||||||
Trade purchases | 1,581,427 | 1,191,783 | 1,328,958 | 4,500,994 | 2,597,741 | 1,581,427 | ||||||||||||||||||
|
|
| ||||||||||||||||||||||
Material balances with other state-controlled entities are as follows:
| At December 31, | ||||||||||||||||
| 2010 | 2009 | At December 31, | ||||||||||||||
| RMB’000 | RMB’000 | 2012 | 2011 | |||||||||||||
| RMB’000 | RMB’000 | |||||||||||||||
Amounts due to other state-controlled entities | 443,403 | 359,726 | 592,267 | 580,726 | ||||||||||||
Amounts due from other state-controlled entities | 1,320,801 | 1,101,535 | 1,361,139 | 681,413 | ||||||||||||
|
| |||||||||||||||
Amounts due to and from state-controlled entities are trade nature of which terms are not different from other customers (notes 18 and 32)34).
YANZHOU COAL MINING COMPANY LIMITED
NOTES TO THE CONSOLIDATED FINANCIAL STATEMENTS—(Continued)
54. RELATED PARTY BALANCES AND TRANSACTIONS—Continued
In addition, the Group has entered into various transactions, including deposits placements, borrowings and other general banking facilities, with certain banks and financial institutions which are state-controlled entities in its ordinary course of business. In view of the nature of those banking transactions, the directors are of the opinion that separate disclosure would not be meaningful.
Except as disclosed above, the directors are of the opinion that transactions with other state- controlled entities are not significant to the Group’s operations.
Balances and transactions with jointly controlled entities
Due from a jointly controlled entity:
| Year ended December 31, | ||||||||
| 2010 | 2009 | |||||||
| RMB’000 | RMB’000 | |||||||
Due from a jointly controlled entity (note 20) | 115,480 | 66,321 | ||||||
| At December 31, | ||||||||
| 2012 | 2011 | |||||||
| RMB’000 | RMB’000 | |||||||
Due from a jointly controlled entity (refer to note 30) | 1,682,983 | — | ||||||
|
|
|
| |||||
The amount due from a jointly controlled entity is unsecured and interest-free.
YANZHOU COAL MINING COMPANY LIMITED
NOTES TO THE CONSOLIDATED FINANCIAL STATEMENTS—(Continued)
46. RELATED PARTY BALANCES AND TRANSACTIONS—Continued
Balances and transactions with jointly controlled entities—Continued
Asinterest is calculated at December 31, 2010, the trade balances betweencommercial rate, interest received by the Group and a jointly controlled entity are disclosed in notes 18 and 32. The jointly controlled entity was obtained through the acquisition of Felix. current year amounting to RMB17,831,000.
During the year, sales to the jointly controlled entity by the Group’s Australian subsidiaries amounted to RMB 1,202,255,000 (2009: nil)RMB1,030,323,000 (2011: RMB1,363,241,000; 2010: RMB1,202,255,000).
Compensation of key management personnel
The remuneration of directors and other members of key management were as follows:
| Year ended December 31, | Year ended December 31, | |||||||||||||||||||||||
| 2010 | 2009 | 2008 | 2012 | 2011 | 2010 | |||||||||||||||||||
| RMB’000 | RMB’000 | RMB’000 | RMB’000 | RMB’000 | RMB’000 | |||||||||||||||||||
Directors’ fee | 452 | 436 | 426 | 520 | 484 | 452 | ||||||||||||||||||
Salaries, allowance and other benefits in kind | 4,548 | 3,292 | 2,545 | 5,850 | 4,864 | 4,548 | ||||||||||||||||||
Retirement benefit scheme contributions | 778 | 550 | 407 | 1,033 | 834 | 778 | ||||||||||||||||||
|
|
| ||||||||||||||||||||||
| 5,778 | 4,278 | 3,378 | 7,403 | 6,182 | 5,778 | |||||||||||||||||||
|
|
| ||||||||||||||||||||||
The remuneration of directors and key executives is determined by the remuneration committee having regard to the performance of individuals and market trends.
47. COMMITMENTS
| At December 31, | ||||||||
| 2010 | 2009 | |||||||
| RMB’000 | RMB’000 | |||||||
Capital expenditure contracted for but not provided in the consolidated financial statements | ||||||||
Acquisition of property, plant and equipment | ||||||||
- the Group | 814,800 | 5,308 | ||||||
- share of joint ventures | 207,111 | 708,573 | ||||||
Exploration and evaluation expenditure | ||||||||
- share of joint ventures | — | 2,315 | ||||||
| 1,021,911 | 716,196 | |||||||
Capital expenditure authorized but not contracted for Acquisition of property, plant and equipment | ||||||||
- the Group | — | 142,565 | ||||||
During 2006, the Company entered into a co-operative agreement with two independent third parties to establish a company for acquiring a coal mine in Shaanxi province for operations. In addition to the deposit referred to in note 29, the Company is committed to invest a further RMB78.8 million as at December 31, 2010 and 2009.
YANZHOU COAL MINING COMPANY LIMITED
NOTES TO THE CONSOLIDATED FINANCIAL STATEMENTS—(Continued)
47. COMMITMENTS—Continued
55. COMMITMENTS
| At December 31, | ||||||||
| 2012 | 2011 | |||||||
| RMB’000 | RMB’000 | |||||||
Capital expenditure contracted for but not provided for in the consolidated financial statements | ||||||||
Acquisition of property, plant and equipment | ||||||||
- the Group | 2,626,207 | 2,022,362 | ||||||
- share of joint ventures | 310,912 | 179,166 | ||||||
Acquisition of intangible assets | ||||||||
- the Group | — | 1,947 | ||||||
- share of joint ventures | 30 | 158 | ||||||
|
|
|
| |||||
| 2,937,149 | 2,203,633 | |||||||
|
|
|
| |||||
Pursuant to the regulations issued by the Shandong Province Finance Bureau, the Group has to pay a deposit of RMB1,980RMB2,636 million (2009: RMB1,980(2011: RMB2,636 million) to the relevant government authority, which secured for the environmental protection work done by the Company. As at December 31, 2010,2012, deposit of RMB222RMB1,567 million (2009: RMB212(2011: RMB732 million) were made and the Company is committed to further make security deposit of RMB1,758 million. (2009: RMB1,768RMB1,069 million (2011: RMB1,904 million).
During 2007, theThe Company and four contract parties entered into an agreement withto acquire 74.82% interest in Hao Sheng at the Parent Company and China Credit Trust Co., Ltd. to establish a company, namedconsideration of Yankuang Group Finance Company Limited. In November 2009,RMB7,159,220,000. As at December 31, 2012, total amount paid by the Company has received the approval from China Banking Regulatory Commission. The Company shall contribute RMB125 million from internal resources, which would account for 25%in respect of the equity interest in the Investee. On April 20, 2010, all the investors signed a formal joint venture establishment agreement.this investment was RMB2,982,455,000 (2011: RMB2,439,881,000). Details related to acquisition of the establishmentHao Sheng are set out in note 28.
Compensation fees for mining rights are required to be pay annually and details are set out in note 23.
In 2009, the Company entered into agreements with third parties to acquire three subsidiary companies. The Company has made deposits of RMB 57 million in 2009 and the Group paid additional consideration of RMB133 million during the year. The acquisitions were completed during the year and details of the acquisitions are set out in note 44.
On October 27, 2009, the board of directors of the Company passed a resolution for additional investment in Yanmei Heze Neng Hua Co., Ltd of RMB1.5 billion by internal funding and thereby increasing its registered capital from RMB1.5 billion to RMB3 billion. The percentage of equity interest held by the Company increased from 96.67% to 98.33% and this capital increase was completed in March 2010.
On December 30, 2010, the Company’s board of directors approved to increase the capital investment in its wholly-owned subsidiary in Australia, Yancoal Australia Limited, by AUD909 million (approximately RMB5,900 million) by internal funding and thereby increasing its registered capital from AUD64 million to AUD973 million. The capital increase has been approved by the related governmental authorities and the procedures for remitting the capital increase are currently in progress.
As at December 31, 2010, the Company’s board of directors approved the acquisition of 30% equity interest in Ashton joint venture at a consideration of USD250 million. Up to the date of these financial statements, the acquisition has been completed.
YANZHOU COAL MINING COMPANY LIMITED31.
NOTES TO THE CONSOLIDATED FINANCIAL STATEMENTS—(Continued)
48.56. RETIREMENT BENEFITS
Qualifying employees of the Company are entitled to a pension, medical and other welfare benefits. The Company participates in a scheme of the Parent Company and pays a monthly contribution to the Parent Company in respect of retirement benefits at an agreed contribution rate based on the monthly basic salaries and wages of the qualified employees. The Parent Company is responsible for the payment of all retirement benefits to the retired employees of the Company.
Pursuant to the Provision of Insurance Fund Administrative Services Agreement entered into by the Company and the Parent Company on May 8, 2012 (2011: November 7, 2008,2008), the monthly contribution rate is set at 20% (2009:(2011: 20%; 2008: 45%2010: 20%) of the total monthly basic salaries and wages of the Company’s employees for the period from January 1, 20092010 to December 31, 2011. Retirement pension and other2012. Other welfare benefits will be provided by the Parent Company, on the actual cost basis, which will be reimbursed by the Company after the actual payment made by the Parent Company (included in 45% contribution rate in pension scheme for the years ended December 31, 2008).Company.
The amount of contributions paid to the Parent Company were RMB640,933,000, RMB520,273,000RMB857,352,000, RMB760,906,000, and RMB759,356,000RMB640,933,000 for the years ended December 31, 2012, 2011, and 2010, 2009, and 2008, respectively.
YANZHOU COAL MINING COMPANY LIMITED
NOTES TO THE CONSOLIDATED FINANCIAL STATEMENTS—(Continued)
56. RETIREMENT BENEFITS—Continued
The Company’s subsidiaries are participants in a state-managed retirement scheme pursuant to which the subsidiaries pay a fixed percentage of its qualifying staff’s wages as a contribution to the scheme. The subsidiaries’ financial obligations under this scheme are limited to the payment of the employer’s contribution. During the year, contributions paid and payable by the subsidiaries pursuant to this arrangement were insignificant to the Group. The Group’s overseas subsidiaries pay fixed contribution as pensions under the laws and regulations of the relevant countries.
During the year and at the balance sheet date, there were no forfeited contributions which arose upon employees leaving the above schemes available to reduce the contributions payable in future years.
49.57. HOUSING SCHEME
The Parent Company is responsible for providing accommodation to its employees and the domestic employees of the Company. The Company and the Parent Company share the incidental expenses relating to the accommodation at a negotiated amount for each of the three years ended December 31, 2010, 20092012, 2011 and 2008.2010. Such expenses, amounting to RMB140,000,000,RMB137,200,000, RMB140,000,000 and RMB86,200,000RMB140,000,000 for each of the three years ended December 31, 2010, 20092012, 2011 and 20082010 respectively, have been included as part of the social welfare and support services expenses summarized in note 48.54.
The Company currently makes a fixed monthly contribution for each of its qualifying employees to a housing fund which is equally matched by a contribution from the employees. The contributions are paid to the Parent Company which utilizes the funds, along with the proceeds from the sales of accommodation and, if the need arises, from loans arranged by the Parent Company, to construct new accommodation.
YANZHOU COAL MINING COMPANY LIMITED58. POST BALANCE SHEET EVENT
NOTES TO THE CONSOLIDATED FINANCIAL STATEMENTS—(Continued)
Subsequent to the balance sheet date, the Company additional paid RMB1,025,516,000 to Jin Cheng Tai in respect of the acquisition of Hao Sheng. Up to the date of the report, the Company in aggregate paid total consideration of RMB4,007,971,000, which equivalent to 63% of the committed amount.
50.59. MAJOR NON-CASH TRANSACTION
During the year ended December 31, 2010,2012, the Group acquired certain property, plant and equipment, of which RMB324,136,000 (2009: RMB606,227,000)RMB3,662,785,000 (2011: RMB2,733,713,000) have not yet been paid.
During the year ended December 31, 2010, the Group acquired certain property, plant and equipment at cost of RMB261,556,000 under finance leases.
51. POST BALANCE SHEET EVENT
On January 24, 2011, the Company, the Parent Company, and Shaanxi Yanchang Petroleum (Group) Corp. Ltd (“Yanchang Petroleum”) entered into an agreement for the formation of Shaanxi Future Energy Chemical Corp. Ltd. Upon completion of the agreement, the Parent Company, the Company and Yanchang Petroleum will contribute RMB2.7 billion, RMB1.35 billion and RMB1.35 billion as capital contribution and will hold 50%, 25% and 25% equity interest in the investee company respectively.
On January 17, 2011, the Company’s board of directors approved to increase the registered capital of Ordos by RMB2.6 billion with its internal resources. The registered capital of Ordos will therefore increase from RMB500 million to RMB3.1 billion. As of the date of these financial statements, the increase in registered capital has completed.
On January 28, 2011, the Company’s board of directors approved Ordos to participate in the public auction of the mining rights of Zhuan Longwan coal mine zone. Ordos was successful in the bidding at a consideration of RMB7.8 billion and entered into a confirmation agreement with the relative governmental authority of the Inner Mongolia Autonomous Region.
On March 31, 2011, the Company entered into equity transfer agreement with Ordos City Jiutaimanlai Coal Mining Company Limited (“Jiutaimanlai”) and Jiutai Technology to acquire 10% of the equity interests in Hao Sheng held by Jiutaimanlai and Jiutai Technology for a consideration of approximately RMB1,313.8 million. The share ownership transfer procedures were completed in April 2011. Up to the date of these financial statements, the Company hold 61% of the equity interests in Hao Sheng but the mining right of Shilawusu Coal Field has not yet been obtained.
YANZHOU COAL MINING COMPANY LIMITED
NOTES TO THE CONSOLIDATED FINANCIAL STATEMENTS—(Continued)
52. CONTINGENT LIABILITIES
| At December 31, | ||||||||||
| 2010 | 2009 | |||||||||
| RMB’000 | RMB’000 | |||||||||
Guarantees | ||||||||||
(a) | The Group | |||||||||
| Guarantees secured over deposits | 43,970 | 4,294 | ||||||||
| Performance guarantees provided to external parties | 248,763 | 197,466 | ||||||||
Guarantees provided in respect of the cost of restoration of certain mining leases, given to government departments as required by statute | 201,167 | 41,334 | ||||||||
(b) | Joint ventures | |||||||||
| Guarantees secured over deposits | 504 | 460 | ||||||||
| Performance guarantees provided to external parties | 463 | 423 | ||||||||
Guarantees provided in respect of the cost of restoration of certain mining leases, given to government departments as required by statute | 37,740 | 42,204 | ||||||||
| 532,607 | 286,181 | |||||||||
53.60. OPERATING LEASE COMMITMENTS
| At December 31, | At December 31, | |||||||||||||||
| 2010 | 2009 | 2012 | 2011 | |||||||||||||
| RMB’000 | RMB’000 | RMB’000 | RMB’000 | |||||||||||||
Within one year | 6,043 | 27,765 | 40,160 | 7,178 | ||||||||||||
More than one year, but not more than five years | 4,922 | 205,155 | 65,756 | 3,210 | ||||||||||||
|
| |||||||||||||||
| 10,965 | 232,920 | 105,916 | 10,388 | |||||||||||||
|
| |||||||||||||||
Operating leases have average remaining lease terms of 1 to 5 years. Items that are subject to operating leases include mining equipment, office space and small items of office equipment.
61. CONTINGENT LIABILITIES
F-99
| At December 31, | ||||||||||
| 2012 | 2011 | |||||||||
| RMB’000 | RMB’000 | |||||||||
Guarantees | ||||||||||
(a) | The Group | |||||||||
Guarantees secured over deposits | 13,256 | — | ||||||||
Performance guarantees provided to daily operations | 1,818,000 | 1,099,755 | ||||||||
Guarantees provided in respect of the cost of restoration of certain mining leases, given to government departments as required by statute | 352,481 | 263,603 | ||||||||
(b) | Joint ventures | |||||||||
Performance guarantees provided to daily operations | 745 | 731 | ||||||||
Guarantees provided in respect of the cost of restoration of certain mining leases, given to government departments as required by statute | 28,432 | 28,477 | ||||||||
|
|
|
| |||||||
| 2,212,914 | 1,392,566 | |||||||||
|
|
|
| |||||||
F-102