As filed with the Securities and Exchange Commission on June 28, 2011.April 8, 2013.
UNITED STATES
SECURITIES AND EXCHANGE COMMISSION
Washington, D.C. 20549
FORM 20-F
ANNUAL REPORT PURSUANT TO SECTION 13
OF THE SECURITIES EXCHANGE ACT OF 1934
For the fiscal year ended December 31, 20102012
Commission file number 333-08752
Fomento Económico Mexicano, S.A.B. de C.V.
(Exact name of registrant as specified in its charter)
Mexican Economic Development, Inc.
(Translation of registrant’s name into English)
United Mexican States
(Jurisdiction of incorporation or organization)
General Anaya No. 601 Pte.
Colonia Bella Vista
Monterrey, NL 64410 Mexico
(Address of principal executive offices)
Juan F. Fonseca
General Anaya No. 601 Pte.
Colonia Bella Vista
Monterrey, NL 64410 Mexico
(52-818) 328-6167
investor@femsa.com.mx
(Name, telephone, e-mail and/or facsimile number and
address of company contact person)
Securities registered or to be registered pursuant to Section 12(b) of the Act:
Title of each class: | Name of each exchange on which | |||
| American Depositary Shares, each representing 10 BD Units, and each BD Unit consisting of one Series B Share, two Series D-B Shares and two Series D-L Shares, without par value | New York Stock Exchange |
Securities registered or to be registered pursuant to Section 12(g) of the Act:
None
Securities for which there is a reporting obligation pursuant to Section 15(d) of the Act:
None
Indicate the number of outstanding shares of each of the issuer’s classes of capital or common stock as of the close of the period covered by the annual report:
2,161,177,770 | BD Units, each consisting of one Series B Share, two Series D-B Shares and two Series D-L Shares, without par value. The BD Units represent a total of 2,161,177,770 Series B Shares, 4,322,355,540 Series D-B Shares and 4,322,355,540 Series D-L Shares. | |
1,417,048,500 | B Units, each consisting of five Series B Shares without par value. The B Units represent a total of 7,085,242,500 Series B Shares. |
Indicate by check mark if the registrant is a well-known seasoned issuer, as defined in Rule 405 of the Securities Act.
x Yes | ¨ No |
If this report is an annual or transition report, indicate by check mark if the registrant is not required to file reports pursuant to Section 13 or 15(d) of the Securities Exchange Act of 1934.
¨ Yes | x No |
Indicate by check mark whether the registrant has submitted electronically and posted on its corporate Web site, if any, every Interactive Data File required to be submitted and posted pursuant to Rule 405 of Regulation S-T (§232.405 of this chapter) during the preceding 12 months (or for such shorter period that the registrant was required to submit and post such files). N/A
¨ Yes | ¨ No |
Indicate by check mark whether the registrant: (1) has filed all reports required to be file by Section 13 or 15(d) of the Securities Exchange Act of 1934 during the preceding 12 months (or for such shorter period that the registrant was required to file such reports) and (2) has been subject to such filing requirements for the past 90 days.
x Yes | ¨ No |
Indicate by check mark whether the registrant is a large accelerated filer, an accelerated filer or a non-accelerated filer. See definition of “accelerated filer and large accelerated filer” in Rule 12b-2 of the Exchange Act. (Check one):
Large Accelerated filer x | Accelerated filer ¨ | Non-accelerated filer ¨ |
Indicate by check mark which basis of accounting the registrant has used to prepare the financial statements included in this filing:
U.S. GAAP ¨ | IFRS | Other |
If “Other” has been checked in response to the previous question, indicate by check mark which financial statement item the registrant has elected to follow.
¨ Item 17 |
If this is an annual report, indicate by check mark whether the registrant is a shell company (as defined in Rule 12b-2 of the Exchange Act).
¨ Yes | x No |
| Page | ||||||
| INTRODUCTION | 1 | |||||
| References | 1 | |||||
| Currency Translations and Estimates | 1 | |||||
| Forward-Looking Information | 1 | |||||
| ITEMS | NOT APPLICABLE | 2 | ||||
| ITEM 3. | KEY INFORMATION | 2 | ||||
| Selected Consolidated Financial Data | 2 | |||||
| Dividends | 3 | |||||
| Exchange Rate Information | 5 | |||||
| Risk Factors | 6 | |||||
| ITEM 4. | INFORMATION ON THE COMPANY | 17 | ||||
| The Company | 17 | |||||
| Overview | 17 | |||||
| Corporate Background | 18 | |||||
| Ownership Structure | 22 | |||||
| Significant Subsidiaries | 23 | |||||
| Business Strategy | 23 | |||||
| Coca-Cola FEMSA | 24 | |||||
| FEMSA Comercio | 41 | |||||
| 45 | ||||||
| Other Business | 46 | |||||
| Description of Property, Plant and Equipment | 46 | |||||
| Insurance | 48 | |||||
| Capital Expenditures and Divestitures | 48 | |||||
| Regulatory Matters | 49 | |||||
| ITEM 4A. | UNRESOLVED STAFF COMMENTS | 56 | ||||
| ITEM 5. | OPERATING AND FINANCIAL REVIEW AND PROSPECTS | 56 | ||||
| Overview of Events, Trends and Uncertainties | 56 | |||||
| Recent Developments | 56 | |||||
| Operating Leverage | 57 | |||||
| 61 | ||||||
| Operating Results | 65 | |||||
| Liquidity and Capital Resources | 68 | |||||
-i-
TABLE OF CONTENTS
(continued)
| ITEM 6. | DIRECTORS, SENIOR MANAGEMENT AND EMPLOYEES | 74 | |||||
| Directors | 74 | ||||||
| Senior Management | 80 | ||||||
| Compensation of Directors and Senior Management | 82 | ||||||
| EVA Stock Incentive Plan | 82 | ||||||
| Insurance Policies | 83 | ||||||
| Ownership by Management | 83 | ||||||
| Board Practices | |||||||
i
| 84 | ||||||
| Employees | ||||||
ITEM 7. | MAJOR SHAREHOLDERS AND RELATED PARTY TRANSACTIONS | |||||
| Major Shareholders | ||||||
| Related-Party Transactions | ||||||
| Voting Trust | ||||||
| Interest of Management in Certain Transactions | ||||||
| Business Transactions between Coca-Cola FEMSA, FEMSA and The Coca-Cola Company | ||||||
ITEM 8. | FINANCIAL INFORMATION | |||||
| Consolidated Financial Statements | ||||||
| Dividend Policy | ||||||
| Legal Proceedings | ||||||
| Significant Changes | ||||||
ITEM 9. | THE OFFER AND LISTING | |||||
| Description of Securities | ||||||
| Trading Markets | ||||||
| Trading on the Mexican Stock Exchange | ||||||
| Price History | ||||||
ITEM 10. | ADDITIONAL INFORMATION | |||||
| Bylaws | ||||||
| Taxation | ||||||
| Material Contracts | ||||||
| Documents on Display | ||||||
ITEM 11. | QUANTITATIVE AND QUALITATIVE DISCLOSURES ABOUT MARKET RISK | |||||
| Interest Rate Risk | ||||||
| Foreign Currency Exchange Rate Risk | ||||||
| Equity Risk | ||||||
| Commodity Price Risk | ||||||
-ii-
TABLE OF CONTENTS
(continued)
| Page | ||||||
| ITEM 12. | DESCRIPTION OF SECURITIES OTHER THAN EQUITY SECURITIES | |||||
ITEM 12A. | DEBT SECURITIES | |||||
ITEM 12B. | WARRANTS AND RIGHTS | |||||
ITEM 12C. | OTHER SECURITIES | |||||
ITEM 12D. | AMERICAN DEPOSITARY SHARES | |||||
| NOT APPLICABLE | ||||||
ITEM 15. | CONTROLS AND PROCEDURES | |||||
ITEM 16A. | AUDIT COMMITTEE FINANCIAL EXPERT | |||||
ITEM 16B. | CODE OF ETHICS | |||||
ITEM 16C. | PRINCIPAL ACCOUNTANT FEES AND SERVICES | |||||
ii
| ITEM 16D. | NOT APPLICABLE | |||||
| ITEM 16E. | PURCHASES OF EQUITY SECURITIES BY THE ISSUER AND AFFILIATED PURCHASERS | |||||
| ITEM 16F. | NOT APPLICABLE | |||||
| ITEM 16G. | CORPORATE GOVERNANCE | |||||
| ITEM 16H. | NOT APPLICABLE | 123 | ||||
| ITEM 17. | NOT APPLICABLE | |||||
| ITEM 18. | FINANCIAL STATEMENTS | |||||
| ITEM 19. | EXHIBITS | |||||
iii-iii-
This annual report contains information materially consistent with the information presented in the audited financial statements and is free of material misstatements of fact that are not material inconsistencies with the information in the audited financial statements.
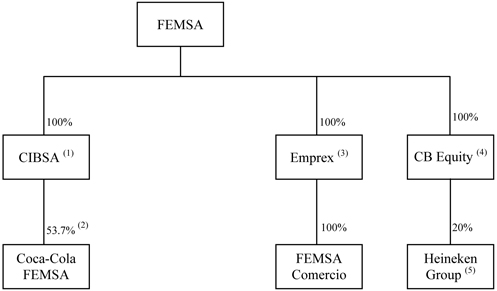
The terms “FEMSA,” “our company,” “we,” “us” and “our,” are used in this annual report to refer to Fomento Económico Mexicano, S.A.B. de C.V. and, except where the context otherwise requires, its subsidiaries on a consolidated basis. We refer to our subsidiary Coca-Cola FEMSA, S.A.B. de C.V., as “Coca-Cola FEMSA,” and our subsidiary FEMSA Comercio, S.A. de C.V., as “FEMSA Comercio.Comercio,” and our subsidiary CB Equity LLP, as “CB Equity.”
The term “S.A.B.” stands forsociedad anónima bursátil, which is the term used in the United Mexican States, or Mexico, to denominate a publicly traded company under the Mexican Securities Market Law (Ley del Mercado de Valores), which we refer to as the Mexican Securities Law.
References to “U.S. dollars,” “US$,” “dollars” or “$” are to the lawful currency of the United States of America.America (which we refer to as the United States). References to “Mexican pesos,” “pesos” or “Ps.” are to the lawful currency of Mexico. References to “euros” or “€” are to the United Mexican States, or Mexico.lawful currency of the European Economic and Monetary Union (which we refer to as the Euro Zone).
Currency Translations and Estimates
This annual report contains translations of certain Mexican peso amounts into U.S. dollars at specified rates solely for the convenience of the reader. These translations should not be construed as representations that the Mexican peso amounts actually represent such U.S. dollar amounts or could be converted into U.S. dollars at the rate indicated. Unless otherwise indicated, such U.S. dollar amounts have been translated from Mexican pesos at an exchange rate of Ps. 12.382512.9635 to US$ 1.00, the noon buying rate for Mexican pesos on December 31, 2010,2012, as published by the U.S. Federal Reserve BankBoard in its H.10 Weekly Release of New York.Foreign Exchange Rates. On MayMarch 31, 2011,2013, this exchange rate was Ps. 11.579012.3155 to US$ 1.00.See “Item 3. Key Information—Exchange Rate Information” for information regarding exchange rates since January 1, 2006.2008.
To the extent estimates are contained in this annual report, we believe that such estimates, which are based on internal data, are reliable. Amounts in this annual report are rounded, and the totals may therefore not precisely equal the sum of the numbers presented.
Per capita growth rates and population data have been computed based upon statistics prepared by theInstituto Nacional de Estadística, Geografía e Informáticaof Mexico (National Institute of Statistics, Geography and Information, which we refer to as the Mexican Institute of Statistics)INEGI), the Federal Reserve Bank of New York, the U.S. Federal Reserve Board andBanco de México (Bank of Mexico), local entities in each country and upon our estimates.
This annual report contains words, such as “believe,” “expect” and “anticipate” and similar expressions that identify forward-looking statements. Use of these words reflects our views about future events and financial performance. Actual results could differ materially from those projected in these forward-looking statements as a result of various factors that may be beyond our control, including but not limited to effects on our company from changes in our relationship with or among our affiliated companies, movements in the prices of raw materials, competition, significant developments in Mexico or international economic or political conditions or changes in our regulatory environment. Accordingly, we caution readers not to place undue reliance on these forward-looking statements. In any event, these statements speak only as of their respective dates, and we undertake no obligation to update or revise any of them, whether as a result of new information, future events or otherwise.
Selected Consolidated Financial Data
This annual report includes, under Item 18,We prepared our audited consolidated balance sheets as of December 31, 2010 and 2009, the related consolidated statements of income, cash flows and changes in stockholders’ equity for the years ended December 31, 2010, 2009 and 2008. Our audited consolidated financial statements included in this annual report in accordance with International Financial Reporting Standards (“IFRS”) as issued by the International Accounting Standards Board (“IASB”). Our date of transition to IFRS was January 1, 2011. These consolidated annual financial statements are our first financial statements prepared in accordance with MexicanIFRS. IFRS 1— “First-time Adoption of International Financial Reporting Standards, or Mexican FRS, (Normas de Información Financieraor NIF), which differStandards” has been applied in certain significant respects from accounting principles generally accepted in the United States, or U.S. GAAP.
Notespreparing these financial statements. Note 27 and 28 to our audited consolidated financial statements provide a descriptioncontains an explanation of the principal differencesour adoption of IFRS and reconciliation between Mexican FRSFinancial Reporting Standards (Normas de Información Financiera Mexicanas, or “Mexican FRS”) and U.S. GAAPIFRS as they relate to our company, together with a reconciliation to U.S. GAAP of net income, comprehensive incomeJanuary 1, 2011 and stockholders’ equity as well as U.S. GAAP consolidated balance sheets, statements of income and comprehensive income and cash flows for the same periods presented for Mexican FRS purposesDecember 31, 2011 and for the consolidated statement of changes in stockholders’ equity for the yearsyear ended December 31, 2010 and 2009. In the reconciliation to U.S. GAAP, we present our subsidiary Coca-Cola FEMSA, which is a consolidated subsidiary for purposes of Mexican FRS, under the equity method for U.S. GAAP purposes, due to the substantive participating rights of The Coca-Cola Company as a minority shareholder in Coca-Cola FEMSA for the years ended December 31, 2009 and 2008.2011.
On February 1, 2010, FEMSA and The Coca-Cola Company signed an amendment to their Shareholders’ Agreement. As a result of this amendment, FEMSA began to consolidate Cola-Cola FEMSA for U.S. GAAP purposes on this date. See Note 27A toThis annual report includes (under Item 18) our audited consolidated statements of financial statements.
Beginning on January 1, 2008, in accordance with changes to NIF B-10 under the Mexican FRS, we discontinued the use of inflation accounting for our subsidiaries that operate in “non-inflationary” countries where cumulative inflation for the three preceding years was less than 26%. Our subsidiaries in Mexico, Guatemala, Panama, Colombia and Brazil operate in non-inflationary economic environments, therefore 2010, 2009 and 2008 figures reflect inflation effects only through 2007. Our subsidiaries in Nicaragua, Costa Rica, Venezuela and Argentina operate in economic environments in which cumulative inflation during the same three-year period was 26% or greater, and we therefore continue recognizing inflationary accounting for 2010, 2009 and 2008. For comparison purposes, the figures prior to 2008 have been restated in Mexican pesos with purchasing powerposition as of December 31, 2007, taking into account local inflation for each country with reference to the consumer price index. Local currencies have been converted into Mexican pesos using official exchange rates published by the local central bank of each country. Our subsidiary in the Euro Zone operated in a non-inflationary economic environment in 2010. See Note 5 to our audited consolidated financial statements.
As a result of discontinuing inflationary accounting for subsidiaries that operate in non-inflationary economic environments, the financial statements are no longer considered to be presented in a reporting currency that comprehensively includes the effects of price level changes. Therefore, the inflationary effects of inflationary economic environments arising in 2008, 20092012 and 2010 result in a difference that must be reconciled for U.S. GAAP purposes, except for Venezuela, which is considered to be a hyperinflationary environment since2011, and January 20101, 2011, and which inflationary effects have not been reversed under U.S. GAAP. See Notes 27 and 28 to our audited consolidated financial statements.
On April 30, 2010, FEMSA announced the closing of the transaction pursuant to which FEMSA agreed to exchange 100% of its beer operations for a 20% economic interest in Heineken Holding N.V. and Heineken N.V., which, together with their respective subsidiaries, we refer to as Heineken or the Heineken Group. See “Item 4. Information on the Company—FEMSA Cerveza and Equity Method Investment in Heineken Group.” Under Mexican FRS, we have reclassified our audited consolidated balance sheets as of December 31, 2010 and 2009, the related consolidated income statements, consolidated statements of comprehensive income, and changes in stockholders’ equity and cash flows for the years ended December 31, 2010, 20092012 and 20082011. Our consolidated financial statements as of and for the year ended December 31, 2012 were prepared in accordance with IFRS. The consolidated financial statements as of and for the year ended December 31, 2011 were prepared in accordance with IFRS, but they differ from the information previously published for 2011 because they were originally presented in accordance with Mexican FRS.
Pursuant to reflect FEMSA Cerveza, S.A. de C.V. (now Cuauhtémoc Moctezuma Holding, S.A. de C.V.), which we referIFRS, the information presented in this annual report presents financial information for 2012 and 2011 in nominal terms in Mexican pesos, taking into account local inflation of any hyperinflationary economic environment and converting from local currency to as FEMSA Cerveza or Cuauhtemoc Moctezuma,Mexican pesos using the official exchange rate at the end of the period published by the local central bank of each country categorized as a discontinued
operation. However, FEMSA Cerveza is not presented as a discontinued operation under U.S. GAAP. See “Item 5. OperatingOur non-Mexican subsidiaries maintain their accounting records in the currency and Financial Review and Prospects—U.S. GAAP Reconciliation” and Notes 27 and 28 toin accordance with accounting principles generally accepted in the country where they are located. For presentation in our audited consolidated financial statements.statements, we adjust these accounting records into IFRS and reported in Mexican pesos under these standards.
The following table presents selected financial information of our company. This information should be read in conjunction with, and is qualified in its entirety by reference to, our audited consolidated financial statements, andincluding the notes to those statements. See “Item 18. Financial Statements.”thereto. The selected financial information contained herein is presented on a consolidated basis, and is not necessarily indicative of our financial position or results from operations at or for any future date or period. Under Mexican FRS, FEMSA Cerveza figures for years prior to 2010 have been reclassified and presented as discontinued operations for comparison purposes to 2010 figures. Seeperiod; see Note 23 to our audited consolidated financial statements. Under U.S. GAAP, FEMSA Cerveza figures are presented as a continuing operation.statements for our significant accounting policies.
| Selected Consolidated Financial Information Year Ended December 31, | ||||||||||||||||||||||||
| 2010(2) | 2010 | 2009 | 2008 | 2007 | 2006 | |||||||||||||||||||
(In millions of U.S. dollars and millions of Mexican pesos, except for percentages, per share data and weighted average number of shares outstanding) | ||||||||||||||||||||||||
Income Statement Data: | ||||||||||||||||||||||||
Mexican FRS:(1) | ||||||||||||||||||||||||
Total revenues | $ | 13,705 | Ps | .169,702 | Ps. | 160,251 | Ps. | 133,808 | Ps. | 114,459 | Ps.102,870 | |||||||||||||
Income from operations(3) | 1,819 | 22,529 | 21,130 | 17,349 | 14,300 | 12,431 | ||||||||||||||||||
Income taxes(4) | 457 | 5,671 | 4,959 | 3,108 | 3,931 | 3,091 | ||||||||||||||||||
Consolidated net income before discontinued operations | 1,451 | 17,961 | 11,799 | 7,630 | 8,438 | 6,685 | ||||||||||||||||||
Income from the exchange of shares with Heineken, net of taxes | 2,150 | 26,623 | — | — | — | — | ||||||||||||||||||
Net income from discontinued operations | 57 | 706 | 3,283 | 1,648 | 3,498 | 3,175 | ||||||||||||||||||
Consolidated net income | 3,658 | 45,290 | 15,082 | 9,278 | 11,936 | 9,860 | ||||||||||||||||||
Net controlling interest income | 3,251 | 40,251 | 9,908 | 6,708 | 8,511 | 7,127 | ||||||||||||||||||
Net non-controlling interest income | 407 | 5,039 | 5,174 | 2,570 | 3,425 | 2,733 | ||||||||||||||||||
Net controlling interest income before discontinued operations:(5) | ||||||||||||||||||||||||
Per series “B” share | 0.05 | 0.64 | 0.33 | 0.25 | 0.25 | 0.20 | ||||||||||||||||||
Per series “D” share | 0.07 | 0.81 | 0.42 | 0.32 | 0.32 | 0.24 | ||||||||||||||||||
Net controlling income from discontinued operations:(5) | ||||||||||||||||||||||||
Per series “B” share | 0.11 | 1.37 | 0.16 | 0.08 | 0.17 | 0.16 | ||||||||||||||||||
Per series “D” share | 0.14 | 1.70 | 0.20 | 0.10 | 0.21 | 0.20 | ||||||||||||||||||
Net controlling interest income:(5) | ||||||||||||||||||||||||
Per Series B Share | 0.16 | 2.01 | 0.49 | 0.33 | 0.42 | 0.36 | ||||||||||||||||||
Per Series D Share | 0.21 | 2.51 | 0.62 | 0.42 | 0.53 | 0.44 | ||||||||||||||||||
Weighted average number of shares outstanding (in millions): | ||||||||||||||||||||||||
Series B Shares | 9,246.4 | 9,246.4 | 9,246.4 | 9,246.4 | 9,246.4 | 9,246.4 | ||||||||||||||||||
Series D Shares | 8,644.7 | 8,644.7 | 8,644.7 | 8,644.7 | 8,644.7 | 8,644.7 | ||||||||||||||||||
Allocation of earnings: | ||||||||||||||||||||||||
Series B Shares | 46.11 | % | 46.11 | % | 46.11 | % | 46.11 | % | 46.11 | % | 46.11 | % | ||||||||||||
Series D Shares | 53.89 | % | 53.89 | % | 53.89 | % | 53.89 | % | 53.89 | % | 53.89 | % | ||||||||||||
U.S. GAAP:(6) | ||||||||||||||||||||||||
Total revenues | $ | 14,299 | Ps. | 177,053 | Ps. | 102,902 | Ps. | 91,650 | Ps. | 83,362 | Ps. 75,704 | |||||||||||||
Income from operations | 1,715 | 21,235 | 8,661 | 7,881 | 7,667 | 7,821 | ||||||||||||||||||
Participation in Coca-Cola FEMSA’s earnings(6) | 15 | 183 | 4,516 | 2,994 | 3,635 | 2,420 | ||||||||||||||||||
(In millions of U.S. dollars and millions of Mexican pesos, except for percentages, per share data and weighted average number of shares outstanding) Consolidated net income Less: Net income attributable to the non-controlling interest income Net income attributable to controlling interest income Net controlling interest income(5): Per Series B Share Per Series D Share Weighted average number of shares outstanding (in millions): Series B Shares Series D Shares Balance Sheet Data: Mexican FRS:(1) Total assets of continuing operations Total assets of discontinued operations Current liabilities of continuing operations Current liabilities of discontinued operations Long-term debt of continuing operations(7) Other long-term liabilities of continuing operations Non-current liabilities of discontinued operations Capital stock Total stockholders’ equity Controlling interest Non-controlling interest U.S. GAAP:(6) Total assets Current liabilities Long-term debt(7) Other long-term liabilities Non-controlling interest Controlling interest Capital stock Stockholders’ equity(8) Other information: Mexican FRS:(1) Depreciation(9) Capital expenditures(10) Operating margin(11) U.S. GAAP: Depreciation(9) Operating margin(11) Selected Consolidated Financial Information
Year Ended December 31, 2010(2) 2010 2009 2008 2007 2006 5,831 72,204 (12) 10,685 6,599 8,589 6,804 (384 ) (4,759 ) (783 ) 253 (32 ) 169 5,447 67,445 9,902 6,852 8,557 6,973 0.27 3.36 0.49 0.34 0.43 0.35 0.34 4.20 0.62 0.43 0.53 0.43 9,246.4 9,246.4 9,246.4 9,246.4 9,246.4 9,246.4 8,644.7 8,644.7 8,644.7 8,644.7 8,644.7 8,644.7 $ 18,056 Ps. 223,578 Ps. 153,638 Ps. 126,833 Ps. 114,537 Ps. 97,623 — — 72,268 71,201 68,881 62,350 2,464 30,516 37,218 35,351 28,783 22,846 — — 10,883 12,912 13,581 10,503 1,793 22,203 21,260 21,853 23,066 21,160 1,442 17,846 8,500 8,285 9,882 7,249 — — 32,216 22,738 18,453 20,007 432 5,348 5,348 5,348 5,348 5,348 12,357 153,013 115,829 96,895 89,653 78,208 9,477 117,348 81,637 68,821 64,578 56,654 2,880 35,665 34,192 28,074 25,075 21,554 $ 27,015 Ps. 334,517 Ps. 158,000 Ps. 139,219 Ps. 127,167 Ps. 116,392 2,474 30,629 23,539 23,654 18,579 14,814 1,771 21,927 24,119 19,557 16,569 18,749 3,216 39,825 10,900 9,966 8,715 8,738 6,339 78,495 1,274 505 698 166 13,216 163,641 98,168 85,537 82,606 73,925 432 5,348 5,348 5,348 5,348 5,348 19,555 242,136 99,442 86,042 83,304 74,091 $ 366 Ps. 4,527 Ps. 4,391 Ps. 3,762 Ps. 4,930 Ps. 4,954 902 11,171 9,067 7,816 5,939 5,003 13.3 % 13.3 % 13.2 % 13.0 % 12.5 % 12.1 % $ 394 Ps. 4,884 Ps. 2,786 Ps. 2,439 Ps. 2,114 Ps. 2,080 11.9 % 11.9 % 8.4 % 8.6 % 9.2 % 10.3 %
Income Statement Data: IFRS Total revenues Gross Profit Income before Income Taxes and Share of the Profit of Associates and Joint Ventures Accounted for Using the Equity Method Income taxes Consolidated net income Controlling interest net income Non-controlling interest net income Basic controlling interest net income: Per Series B Share Per Series D Share Diluted controlling interest net income: Per Series B Share Per Series D Share Weighted average number of shares outstanding (in millions): Series B Shares Series D Shares Allocation of earnings: Series B Shares Series D Shares Financial Position Data: IFRS Total assets Current liabilities Long-term debt(4) Other long-term liabilities Capital stock Total equity Controlling interest Non-controlling interest Other Information IFRS Depreciation Capital expenditures(5) Gross margin(6) Year Ended December 31, 2012(1)(2) 2012(2) 2011(3) (in millions of Mexican pesos or millions of
U.S. dollars, except share and per share data) US$ 18,383 Ps.238,309 Ps.201,540 7,814 101,300 84,296 2,124 27,530 23,552 613 7,949 7,618 2,164 28,051 20,901 1,597 20,707 15,332 567 7,344 5,569 0.08 1.03 0.77 0.10 1.30 0.96 0.08 1.03 0.76 0.10 1.29 0.96 9,246.4 9,246.4 9,246.4 8,644.7 8,644.7 8,644.7 46.11 % 46.11 % 46.11 % 53.89 % 53.89 % 53.89 % US$ 22,829 Ps.295,942 Ps.263,362 3,743 48,516 39,325 2,209 28,640 23,819 665 8,625 8,047 258 3,346 3,345 16,212 210,161 192,171 11,977 155,259 144,222 4,235 54,902 47,949 US$ 553 Ps. 7,175 Ps. 5,694 1,200 15,560 12,666 43 % 43 % 42 %
| (1) |
| Translation to U.S. dollar amounts at an exchange rate of Ps. |
| (2) | Includes results of Grupo Fomento Queretano from May 2012.See “Item 4—Information on the Company—The Company—Corporate History.” |
| (3) |
| (4) |
| Includes long-term debt minus the current portion of long-term debt. |
| Includes investments in property, plant and equipment, intangible and other |
We have historically paid dividends per BD Unit (including in the form of American Depositary Shares, or ADSs) approximately equal to or greater than 1% of the market price on the date of declaration, subject to changes in our results from operations and financial position, including due to extraordinary economic events and to the factors described in “Risk“Item 3. Key Information—Risk Factors” that affect our financial condition and liquidity. These factors may affect whether or not dividends are declared and the amount of such dividends. We do not expect to be subject to any contractual restrictions on our ability to pay dividends, although our subsidiaries may be subject to such restrictions. Because we are a holding company with no significant operations of our own, we will have distributable profits and cash to pay dividends only to the extent that we receive dividends from our subsidiaries. Accordingly, we cannot assure you that we will pay dividends or as to the amount of any dividends.
The following table sets forth for each year the nominal amount of dividends per share that we declared in Mexican pesospeso and U.S. dollar amounts and their respective payment dates for the 20062008 to 20102012 fiscal years:
Date Dividend Paid | Fiscal Year with Respect to which Dividend was Declared | Aggregate Amount of Dividend Declared | Per Series B Share Dividend | Per Series B Share Dividend | Per Series D Share Dividend | Per Series D Share Dividend | ||||||||||||||||||
May 15, 2007 | 2006 | (1) | Ps.1,485,000,000 | Ps.0.0741 | $ | 0.0069 | Ps.0.0926 | $ | 0.0086 | |||||||||||||||
May 8, 2008 | 2007 | (1) | Ps.1,620,000,000 | Ps.0.0807 | $ | 0.0076 | Ps.0.1009 | $ | 0.0095 | |||||||||||||||
May 4, 2009 and November 3, 2009(2) | 2008 | Ps.1,620,000,000 | Ps.0.0807 | $ | 0.0061 | Ps.0.1009 | $ | 0.0076 | ||||||||||||||||
May 4, 2009 | Ps.0.0404 | $ | 0.0030 | Ps.0.0505 | $ | 0.0038 | ||||||||||||||||||
November 3, 2009 | Ps.0.0404 | $ | 0.0030 | Ps.0.0505 | $ | 0.0038 | ||||||||||||||||||
May 4, 2010 and November 3, 2010(3) | 2009 | Ps.2,600,000,000 | Ps.0.1296 | $ | 0.0105 | Ps.0.1621 | $ | 0.0132 | ||||||||||||||||
May 4, 2010 | Ps.0.0648 | $ | 0.0053 | Ps.0.0810 | $ | 0.0066 | ||||||||||||||||||
November 3, 2010 | Ps.0.0648 | $ | 0.0053 | Ps.0.0810 | $ | 0.0066 | ||||||||||||||||||
Date Dividend Paid | Fiscal Year with Respect to which Dividend was Declared | Aggregate Amount of Dividend Declared | Per Series B Share Dividend | Per Series B Share Dividend | Per Series D Share Dividend | Per Series D Share Dividend | Fiscal Year with Respect to which Dividend was Declared | Aggregate Amount of Dividend Declared | Per Series B Share Dividend | Per Series B Share Dividend | Per Series D Share Dividend | Per Series D Share Dividend | ||||||||||||||||||||||||||||||||||
May 3, 2011 and November 2, 2011(4)(5) | 2010 | Ps.4,600,000,000 | Ps.0.2294 | N/a | Ps.0.28675 | N/a | ||||||||||||||||||||||||||||||||||||||||
May 3, 2011 | Ps.0.1147 | $ | 0.0099 | Ps.0.14338 | $ | 0.0124 | ||||||||||||||||||||||||||||||||||||||||
May 8, 2008 | 2007(1) | Ps.1,620,000,000 | Ps.0.0807 | $ | 0.0076 | Ps.0.1009 | $ | 0.0095 | ||||||||||||||||||||||||||||||||||||||
May 4, 2009 and November 3, 2009(2) | 2008 | Ps.1,620,000,000 | Ps.0.0807 | $ | 0.0061 | Ps.0.1009 | $ | 0.0076 | ||||||||||||||||||||||||||||||||||||||
May 4, 2009 | Ps.0.0404 | $ | 0.0030 | Ps.0.0505 | $ | 0.0038 | ||||||||||||||||||||||||||||||||||||||||
November 3, 2009 | Ps.0.0404 | $ | 0.0030 | Ps.0.0505 | $ | 0.0038 | ||||||||||||||||||||||||||||||||||||||||
May 4, 2010 and November 3, 2010(3) | 2009 | Ps.2,600,000,000 | Ps.0.1296 | $ | 0.0105 | Ps.0.1621 | $ | 0.0132 | ||||||||||||||||||||||||||||||||||||||
May 4, 2010 | Ps.0.0648 | $ | 0.0053 | Ps.0.0810 | $ | 0.0066 | ||||||||||||||||||||||||||||||||||||||||
November 3, 2010 | Ps.0.0648 | $ | 0.0053 | Ps.0.0810 | $ | 0.0066 | ||||||||||||||||||||||||||||||||||||||||
May 4, 2011 and November 2, 2011(4) | 2010 | Ps.4,600,000,000 | Ps.0.2294 | $ | 0.0199 | Ps.0.28675 | $ | 0.0249 | ||||||||||||||||||||||||||||||||||||||
May 4, 2011 | Ps.0.1147 | $ | 0.0099 | Ps.0.14338 | $ | 0.0124 | ||||||||||||||||||||||||||||||||||||||||
November 2, 2011 | Ps.0.1147 | N/a | Ps.0.14338 | N/a | Ps.0.1147 | $ | 0.0100 | Ps.0.14338 | $ | 0.0125 | ||||||||||||||||||||||||||||||||||||
May 3, 2012 and November 6, 2012(5) | 2011 | Ps.6,200,000,000 | Ps.0.3092 | $ | 0.0231 | Ps.0.3865 | $ | 0.0288 | ||||||||||||||||||||||||||||||||||||||
May 3, 2012 | Ps.0.1546 | $ | 0.0119 | Ps.0.1932 | $ | 0.0149 | ||||||||||||||||||||||||||||||||||||||||
November 6, 2012 | Ps.0.1546 | $ | 0.0119 | Ps.0.1932 | $ | 0.0149 | ||||||||||||||||||||||||||||||||||||||||
May 7, 2013 and November 7, 2013(6) | 2012 | Ps.6,684,103,000 | Ps.0.3333 | N/a | (7) | Ps. 0.4166 | N/a | |||||||||||||||||||||||||||||||||||||||
May 7, 2013 | Ps.0.1666 | N/a | Ps.0.2083 | N/a | ||||||||||||||||||||||||||||||||||||||||||
November 7, 2013 | Ps.0.1666 | N/a | Ps.0.2083 | N/a | ||||||||||||||||||||||||||||||||||||||||||
| (1) | The per series dividend amount has been adjusted for comparability purposes to reflect the 3:1 stock split effective May 25, |
| (2) | The dividend payment for 2008 was divided into two equal payments. The first payment was |
| (3) | The dividend payment for 2009 was divided into two equal payments. The first payment was |
| (4) | The dividend payment for 2010 was divided into two equal payments. The first payment was |
| (5) | The dividend payment for 2011 was divided into two equal payments. The first payment was payable on May 3, 2012 with a record date of May 2, 2012, and the second payment was payable on November 6, 2012 with a record date of November 5, 2012. |
| (6) | The dividend payment for 2012 was divided into two equal payments. The first payment will become payable on May 7, 2013 with a record date of May 6, 2013, and the second payment will become payable on November 7, 2013 with a record date of November 6, 2013. |
| (7) | The U.S. dollar |
At the annual ordinary general shareholders meeting, or AGM, the board of directors submits the financial statements of our company for the previous fiscal year, together with a report thereon by the board of directors. Once the holders of Series B Shares have approved the financial statements, they determine the allocation of our net profits for the preceding year. Mexican law requires the allocation of at least 5% of net profits to a legal reserve, which is not subsequently available for distribution, until the amount of the legal reserve equals 20% of our paid in capital stock. As of the date of this report, the legal reserve of our company is fully constituted. Thereafter, the holders of Series B Shares may determine and allocate a certain percentage of net profits to any general or special reserve, including a reserve for open-market purchases of our shares. The remainder of net profits is available for distribution in the form of dividends to our shareholders. Dividends may only be paid if net profits are sufficient to offset losses from prior fiscal years.
Our bylaws provide that dividends will be allocated among the shares outstanding and fully paid shares at the time a dividend is declared in such manner that each Series D-B Share and Series D-L Share receives 125% of the dividend distributed in respect of each Series B Share. Holders of Series D-B Shares and Series D-L Shares are entitled to this dividend premium in connection with all dividends paid by us other than payments in connection with the liquidation of our company.
Subject to certain exceptions contained in the deposit agreement dated May 11, 2007, among FEMSA, The Bank of New York, as ADS depositary, and holders and beneficial owners from time to time of our American Depositary Shares, or ADSs, evidenced by American Depositary Receipts, or ADRs, any dividends distributed to holders of our ADSs will be paid to the ADS depositary in Mexican pesos and will be converted by the ADS depositary into U.S. dollars. As a result, restrictions on conversion of Mexican pesos into foreign currencies and exchange rate fluctuations may affect the ability of holders of our ADSs to receive U.S. dollars and the U.S. dollar amount actually received by holders of our ADSs.
The following table sets forth, for the periods indicated, the high, low, average and year-end noon buying exchange rate, published by the Federal Reserve Bank of New York for cable transfers ofexpressed in Mexican pesos per U.S. dollar. The Federal Reserve Bank of New York discontinued the publication of foreign exchange rates on December 31, 2008, and therefore, the data provided for the periods beginning January 1, 2009, is based on the ratesdollar, as published by the U.S. Federal Reserve Board in its H.10 Weekly Release of Foreign Exchange Rates. The rates have not been restated in constant currency units and therefore represent nominal historical figures.
Year ended December 31, | Exchange Rate | Exchange Rate | ||||||||||||||||||||||||||||||
| High | Low | Average(1) | Year End | High | Low | Average(1) | Year End | |||||||||||||||||||||||||
2006 | 11.46 | 10.43 | 10.91 | 10.80 | ||||||||||||||||||||||||||||
2007 | 11.27 | 10.67 | 10.93 | 10.92 | ||||||||||||||||||||||||||||
2008 | 13.94 | 9.92 | 11.21 | 13.83 | Ps.13.94 | Ps.9.92 | Ps.11.21 | Ps.13.83 | ||||||||||||||||||||||||
2009 | 15.41 | 12.63 | 13.50 | 13.06 | 15.41 | 12.63 | 13.58 | 13.06 | ||||||||||||||||||||||||
2010 | 13.19 | 12.16 | 12.64 | 12.38 | 13.19 | 12.16 | 12.64 | 12.38 | ||||||||||||||||||||||||
2011 | 14.25 | 11.51 | 12.46 | 13.95 | ||||||||||||||||||||||||||||
2012 | 14.37 | 12.63 | 13.14 | 12.96 | ||||||||||||||||||||||||||||
| (1) | Average month-end rates. |
| Exchange Rate | ||||||||||||
| High | Low | Period End | ||||||||||
2009: | ||||||||||||
First Quarter | Ps.15.41 | Ps.13.33 | Ps.14.21 | |||||||||
Second Quarter | 13.89 | 12.89 | 13.17 | |||||||||
Third Quarter | 13.80 | 12.82 | 13.48 | |||||||||
Fourth Quarter | 13.67 | 12.63 | 13.06 | |||||||||
2010: | ||||||||||||
First Quarter | Ps.13.19 | Ps.12.30 | Ps.12.30 | |||||||||
Second Quarter | 13.14 | 12.16 | 12.83 | |||||||||
Third Quarter | 13.17 | 12.49 | 12.63 | |||||||||
Fourth Quarter | 12.61 | 12.21 | 12.38 | |||||||||
2011: | ||||||||||||
January | Ps.12.25 | Ps.12.04 | Ps.12.15 | |||||||||
February | 12.18 | 11.97 | 12.11 | |||||||||
March | 12.11 | 11.92 | 11.92 | |||||||||
First Quarter | 12.25 | 11.92 | 11.92 | |||||||||
April | 11.86 | 11.52 | 11.52 | |||||||||
May | 11.77 | 11.51 | 11.58 | |||||||||
June(1) | 11.87 | 11.64 | 11.87 | |||||||||
| Exchange Rate | ||||||||||||
| High | Low | Period End | ||||||||||
2011: | ||||||||||||
First Quarter | Ps.12.25 | Ps.11.92 | Ps.11.92 | |||||||||
Second Quarter | 11.97 | 11.51 | 11.72 | |||||||||
Third Quarter | 13.87 | 11.57 | 13.77 | |||||||||
Fourth Quarter | 14.25 | 13.10 | 13.95 | |||||||||
2012: | ||||||||||||
First Quarter | Ps.13.75 | Ps.12.63 | Ps.12.81 | |||||||||
Second Quarter | 14.37 | 12.73 | 13.41 | |||||||||
Third Quarter | 13.72 | 12.74 | 12.86 | |||||||||
Fourth Quarter | 13.25 | 12.71 | 12.96 | |||||||||
October | 13.09 | 12.71 | 13.09 | |||||||||
November | 13.25 | 12.92 | 12.92 | |||||||||
December | 13.01 | 12.72 | 12.96 | |||||||||
2013: | ||||||||||||
January | Ps.12.79 | Ps.12.59 | Ps.12.73 | |||||||||
February | 12.88 | 12.63 | 12.78 | |||||||||
March | 12.80 | 12.32 | 12.32 | |||||||||
First Quarter | 12.88 | 12.32 | 12.32 | |||||||||
Risks Related to Our Company
Coca-Cola FEMSA
Coca-Cola FEMSA’s business reliesdepends on its relationship with The Coca-Cola Company, and changes in this relationship may adversely affect itsCoca-Cola FEMSA’s results from operations and financial condition.
Approximately 99%Substantially all of Coca-Cola FEMSA’s sales volume in 2010 wasare derived from sales ofCoca-Cola trademark beverages. Coca-Cola FEMSA produces, markets, sells and distributesCoca-Cola trademark beverages through standard bottler agreements in certain territories in Mexico and Latin America, which we referCoca-Cola FEMSA refers to as Coca-Cola“Coca-Cola FEMSA’s territories.”See “Item 4. Information on the Company—Coca-Cola FEMSA—Coca-Cola FEMSA’s Territories.”Through its rights under theCoca-Cola FEMSA’s bottler agreements and as a large shareholder, The Coca-Cola Company has the right to participate in the process for making important decisions related to Coca-Cola FEMSA’s business.
The Coca-Cola Company may unilaterally set the price for its concentrate. In addition, under itsCoca-Cola FEMSA’s bottler agreements, Coca-Cola FEMSA is prohibited from bottling or distributing any other beverages without The Coca-Cola Company’s authorization or consent, and itCoca-Cola FEMSA may not transfer control of the bottler rights of any of its territories without prior consent offrom The Coca-Cola Company. On February 1, 2010, FEMSA’s subsidiaries signed an agreement with subsidiaries of The Coca-Cola Company to amend the shareholders agreement of Coca-Cola FEMSA. The purpose of the amendment is to set forth that the appointment and compensation of the chief executive officer and all officers reporting to the chief executive officer, as well as the adoption of decisions related to the ordinary operations of Coca-Cola FEMSA shall only require a simple majority vote of the board of directors. See “Item 4. Information on the Company—The Company—Overview.” The Coca-Cola Company may require that Coca-Cola FEMSA demonstrate its financial ability to meet its business.
The Coca-Cola Company also makes significant contributions to Coca-Cola FEMSA’s marketing expenses, although it is not required to contribute a particular amount. Accordingly, The Coca-Cola Company may discontinue or reduce such contributions at any time.
Coca-Cola FEMSA depends on The Coca-Cola Company to renew itsCoca-Cola FEMSA’s bottler agreements. In Mexico,As of December 31, 2012, Coca-Cola FEMSA has fourhad eight bottler agreements;agreements in Mexico: (i) the agreements for two territoriesMexico’s Valley territory, which expire in June 2013 and April 2016, (ii) the agreements for the other two territoriesCentral territory, which expire in August 2013, May 2015.2015 and July 2016, (iii) the agreement for the Northeast territory, which expires in September 2014, (iv) the agreement for the Bajio territory, which expires in May 2015, and (v) the agreement for the Southeast territory, which expires in June 2013. Coca-Cola FEMSA’s bottler agreements with The Coca-Cola Company will expire for Coca-Cola FEMSA’s territories in other countries as follows: Argentina in September 2014; Brazil in April 2014; Colombia in June 2014; Venezuela in August 2016; Guatemala in March 2015; Costa Rica in September 2017; Nicaragua in May 2016;2016 and Panama in November 2014. All of Coca-Cola FEMSA’s bottler agreements are automatically renewable for ten-year terms, subject to the right of either party to give prior notice that it does not wish to renew a specificthe applicable agreement. In addition, these agreements generally may be terminated in the case of material breach.See “Item 10. Additional Information—Material Contracts—Material Contracts Relating to Coca-Cola FEMSA.”Termination would prevent Coca-Cola FEMSA from sellingCoca-Cola trademark beverages in the affected territory and would have an adverse effect on Coca-Cola FEMSA’s business, financial conditions,condition, results from operations and prospects.
The Coca-Cola Company has significantsubstantial influence on the conduct of Coca-Cola FEMSA’s business, which may result in Coca-Cola FEMSA taking actions contrary to the interests of its remaining shareholders.
The Coca-Cola Company has significantsubstantial influence on the conduct of Coca-Cola FEMSA’s business. Currently,As of March 31, 2013, The Coca-Cola Company indirectly owns 31.6%owned 28.7% of Coca-Cola FEMSA’s outstanding capital stock, representing 37.0% of its capital stockCoca-Cola FEMSA’s shares with full voting rights. The Coca-Cola Company is entitled to appoint fourfive of Coca-Cola FEMSA’s 18maximum of 21 directors and the vote of at least two of them is required to approve certain actions by Coca-Cola FEMSA’s board of directors. On February 1, 2010,As of March 31, 2013, we and The Coca-Cola Company signed a second amendment to the shareholders agreement that confirms our power to govern the operating and financial policiesindirectly owned 48.9% of Coca-Cola FEMSA in order to exercise control over its operations in the ordinary courseFEMSA’s outstanding capital stock, representing 63.0% of business. Consequently, weCoca-Cola FEMSA’s shares with full voting rights. We are entitled to appoint 1113 of Coca-Cola FEMSA’s 18maximum of 21 directors and all of its executive officers. We and The Coca-Cola Company has the power to determine the outcome oftogether, or only we in certain protective rights, such as mergers, acquisitions, or the sale of any line of business, requiring approval by its board of directors and maycircumstances, have the power to determine the outcome of certainall actions requiring the approval of Coca-Cola FEMSA’s board of directors, and we and The Coca-Cola Company together, or only we in certain circumstances, have the power to determine the outcome of all actions requiring the approval of Coca-Cola FEMSA’s shareholders.See “Item 10. Additional Information—Material Contracts—Material Contracts Relating to Coca-Cola FEMSA.”The interests of The Coca-Cola Company may be different from the interests of Coca-Cola FEMSA’s remaining shareholders, which may result in Coca-Cola FEMSA taking actions contrary to the interests of itsCoca-Cola FEMSA’s remaining shareholders.
Coca-Cola FEMSA has significant transactions with affiliates, particularly The Coca-Cola Company, which may create the potential for conflicts of interest and could result in less favorable terms to Coca-Cola FEMSA.
Coca-Cola FEMSA engages in transactions with subsidiaries of The Coca-Cola Company, including cooperative marketing arrangements and a number of bottler agreements. In addition, Coca-Cola FEMSA has entered into cooperative marketing arrangements with The Coca-Cola Company. The transactions may create potential conflicts of interest, which could result in terms less favorable to Coca-Cola FEMSA than could be obtained from an unaffiliated third-party.
Competition could adversely affect Coca-Cola FEMSA’s financial performance.
The beverage industry in the territories in which Coca-Cola FEMSA operates is highly competitive. Coca-Cola FEMSA faces competition from other bottlers of sparkling beverages, such asPepsi products, and from producers of low cost beverages or “B brands.” Coca-Cola FEMSA also competes in different beverage categories other than sparkling beverages, such as water, juice-based beverages, teas, sport drinks and sport drinks.value-added dairy products. Although competitive conditions are different in each of Coca-Cola FEMSA’s territories, Coca-Cola FEMSA competes principally in terms of price, packaging, consumer sales promotions, customer service and product innovation.See “Item 4. Information on the Company—Coca-Cola FEMSA—Competition.”There can be no assurances that Coca-Cola FEMSA will be able to avoid lower pricing as a result of competitive pressure. Lower pricing, changes made in response to competition and changes in consumer preferences may have an adverse effect on Coca-Cola FEMSA’s financial performance.
Changes in consumer preference could reduce demand for some of Coca-Cola FEMSA’s productsproducts.
The non-alcoholic beverage industry is rapidly evolving as a result of, among other things, changes in consumer preferences. Specifically, consumers are becoming increasingly more aware of and concerned about environmental and health issues. Concerns over the environmental impact of plastic may reduce the consumption of Coca-Cola FEMSA’s products sold in plastic bottles or result in additional taxes that would adversely affect consumer demand. In addition, researchers, health advocates and dietary guidelines are encouraging consumers to reduce their consumption of certain types of beverages sweetened with sugar and high fructose corn syrup,High Fructose Corn Syrup (“HFCS”), which could reduce demand for certain of Coca-Cola FEMSA’s products. A reduction in consumer demand would adversely affect Coca-Cola FEMSA’s results from operations.results.
Water shortages or any failure to maintain existing concessions could adversely affect Coca-Cola FEMSA’s business.
Water is an essential component of all of Coca-Cola FEMSA’s products. Coca-Cola FEMSA obtains water from various sources in its territories, including springs, wells, rivers and municipal and state water companies pursuant to either contracts to obtain water or pursuant to concessions granted by governments in its various territories.territories or pursuant to contracts.
Coca-Cola FEMSA obtains the vast majority of the water used in its production pursuant to concessions to exploituse wells, which are generally granted based on studies of the existing and projected groundwater supply. Coca-Cola FEMSA’s existing water concessions or contracts to obtain water may be terminated by governmental authorities under certain circumstances and their renewal depends on receiving necessary authorizations from local and/or federal water authorities.See “Item 4. Information on the Company—Regulatory Matters—Water Supply Law.Supply.”In some of Coca-Cola FEMSA’s other territories, itsCoca-Cola FEMSA’s existing water supply may not be sufficient to meet itsCoca-Cola FEMSA’s future production needs, and the available water supply may be adversely affected by shortages or changes in governmental regulations and environmental changes.
We cannot assure you that water will be available in sufficient quantities to meet Coca-Cola FEMSA’s future production needs or will prove sufficient to meet itsCoca-Cola FEMSA’s water supply needs.
Increases in the prices of raw materials would increase Coca-Cola FEMSA’s cost of salesgoods sold and may adversely affect its results from operations.Coca-Cola FEMSA’s results.
In addition to water, Coca-Cola FEMSA’s most significant raw materials are (1) concentrate, which itCoca-Cola FEMSA acquires from affiliates of The Coca-Cola Company, (2) packaging materialssweeteners and (3) sweeteners.packaging materials. Prices for sparkling beveragesbeverages’ concentrate are determined by The Coca-Cola Company as a percentage of the weighted average retail price in local currency, net of applicable taxes. In 2005,We cannot assure you that The Coca-Cola Company decided to graduallywill not increase the price of the concentrate prices for sparkling beverages or change the manner in Brazil and Mexico. These increases were fully implemented in Brazil in 2008 and in Mexico in 2009. However, Coca-Cola FEMSA may experience further increaseswhich such price will be calculated in the future. The prices for Coca-Cola FEMSA’s remaining raw materials are driven by market prices and local availability, as well as the imposition of import duties and import restrictions and fluctuations in exchange rates. Coca-Cola FEMSA is also required to meet all of its supply needs from suppliers approved by The Coca-Cola Company, which may limit the number of suppliers available to it. Coca-Cola FEMSA’s sales prices are denominated in the local currency in each country in which it operates, while the prices of certain materials, including those used in the bottling of itsCoca-Cola FEMSA’s products, (mainlymainly resin, ingots usedpreforms to make plastic bottles, finished plastic bottles, aluminum cans and high fructose corn syrup),HFCS, are paid in or determined with reference to the U.S. dollar. These pricesdollar, and therefore may increase if the U.S. dollar appreciates against the currency of any countrythe countries in which Coca-Cola FEMSA operates, which occurredas was the case in 2008 and 2009.See2009. In 2011, the U.S. dollar did not appreciate against the currencies of most of the countries in which Coca-Cola FEMSA operated; however, in 2012, the U.S. dollar did appreciate against some of those currencies. We cannot anticipate whether the U.S. dollar will appreciate or depreciate with respect to such currencies in the future.See “Item 4. Information on the Company—Coca-Cola FEMSA—Raw Materials.”
After concentrate, packaging materials and sweeteners constitute the largest portion of Coca-Cola FEMSA’s raw material costs. Coca-Cola FEMSA’s most significant packaging raw material costs arise from the purchase of resin and plastic ingotspreforms to make plastic bottles and from the purchase of finished plastic bottles, the prices of which are tied to crude oil prices and global resin supply. The average prices that Coca-Cola FEMSA paid for resin and plastic ingotspreforms in U.S. dollars decreased significantlywere lower in 2009 and in 2010. Prices may also2012, as compared to 2011. We cannot provide any assurance that prices will not increase in future periods. During 2012, average sweetener prices, as a whole, were lower as compared to 2011 in all of the countries in which Coca-Cola FEMSA operates. From 2009 and 2010,through 2012, international sugar prices were volatile due to various factors, including shifting demands, availability and climate issues affecting production and distribution. Sugar prices inIn all of the countries in which Coca-Cola FEMSA operates, other than Brazil, sugar prices are subject to local regulations and other barriers to market entry that cause Coca-Cola FEMSA to pay in excess of international market prices for sugar. Average sweetener prices paid during 2010 were higher as compared to 2009 in all of the countries in which Coca-Cola FEMSA operates. prices.See “Item 4. Information on the Company—Coca-Cola FEMSA—Raw Materials.”
We cannot assure you that Coca-Cola FEMSA’s raw material prices will not further increase in the future. Increases in the prices of raw materials would increase Coca-Cola FEMSA’s cost of salesgoods sold and adversely affect itsCoca-Cola FEMSA’s financial performance.
Taxes could adversely affect Coca-Cola FEMSA’s business.
The countries in which Coca-Cola FEMSA operates may adopt new tax laws or modify existing lawlaws to increase taxes applicable to itsCoca-Cola FEMSA’s business. For example, in Mexico, a general tax reform became effective on January 1, 2010, pursuant to which, as applicable to Coca-Cola FEMSA,Coca-Cola-FEMSA, there was a temporary increase in the income tax rate from 28% to 30% from 2010 through 2012. This increasePursuant to an amendment issued at the end of 2012, the 30% income tax rate will be followed by a reductioncontinue to 29% for the year 2013 and a further reduction in 2014 to return to the previous rate of 28%.apply through 2013. In addition, the value added tax (VAT)(“VAT”) rate in Mexico increased in 2010 from 15% to 16%. This increase had an impact on Coca-Cola FEMSA’s results from operations due to the reduction in consumer acquisition capacity.
In Panama, there was an increase in a certain consumer tax, effective as of April 1, 2010, affecting syrups, powders and concentrate. Some of these materials are used for the production of Coca-Cola FEMSA’s sparkling beverages. These taxes increased from 6% to 10%.
In November 2012, the government of the Province of Buenos Aires adopted Law No. 14,394, which increased the tax rate applied to product sales within the Province of Buenos Aires. If the products are manufactured in plants located in the territory of the Province of Buenos Aires, Law No. 14,394 increases the tax rate from 1% to 1.75%; if the products are manufactured in any other Argentine province, the law increases the tax rate from 3% to 4%.
In Brazil, the federal taxes applied on the production and sale of beverages are based on the national average retail price, calculated based on a yearly survey of each Brazilian beverage brand, combined with a fixed tax rate and a multiplier specific for each class of presentation (glass, plastic or can). On October 1, 2012, a number of changes to the Brazilian tax rate became effective. These changes include increases in the multipliers used to calculate soft drink taxes when presented in cans or glasses. Upon effectiveness, the multiplier for cans increased from 30.0% to 31.9%, and beginning in September 2014, the multiplier will gradually increase up to 38.1% in October 1, 2018. The multiplier for glasses increased from 35.0% to 37.2%, and beginning in September 2014, the multiplier will gradually increase up to 44.4% in October 1, 2018. In addition, the amendment suspended the 50% production tax benefit that had previously applied to juice-added soft drinks, and raised the rate for such beverages to the level currently applied to cola beverages. The amendments that benefited Coca-Cola FEMSA’s Brazilian subsidiary were the reduction of the production tax on concentrate, from 27.0% to 20.0%, and the elimination of the sale tax on mineral water (sparkling or still).
Coca-Cola FEMSA’s products are also subject to certain taxes in many of the countries in which it operates. Certain countries in Central America, Brazil and Argentina also impose taxes on sparkling beverages.See “Item 4. Information on the Company—Regulatory Matters—Taxation of Sparkling Beverages.”We cannot assure you that any governmental authority in any country where Coca-Cola FEMSA operates will not impose new taxes or increase taxes on itsCoca-Cola FEMSA’s products in the future. The imposition of new taxes or increases in taxes on Coca-Cola FEMSA’s products may have a material adverse effect on Coca-Cola FEMSA’s business, financial condition, prospects and results.
Regulatory developments may adversely affect Coca-Cola FEMSA’s business.
Coca-Cola FEMSA is subject to regulation in each of the territories in which it operates. The principal areas in which Coca-Cola FEMSA is subject to regulation are water, environment, labor, taxation, health and antitrust. Regulation can also affect Coca-Cola FEMSA’s ability to set prices for its products.See “Item 4. Information on the Company—Regulatory Matters.”The adoption of new laws or regulations or a stricter interpretation or enforcement thereof in the countries in which Coca-Cola FEMSA operates may increase itsCoca-Cola FEMSA’s operating costs or impose restrictions on itsCoca-Cola FEMSA’s operations which, in turn, may adversely affect its financial condition, business and results from operations.results. In particular, environmental standards are becoming more stringent in several of the countries in which Coca-Cola FEMSA operates, and Coca-Cola FEMSA is in the process of complying with these standards, although we cannot assure you that Coca-Cola FEMSA will be able to meet any timelines for compliance established by the relevant regulatory authorities.See “Item 4. Information on the Company—Regulatory Matters—Environmental Matters.”Further changes in current regulations may result in an increase in compliance costs, which may have an adverse effect on Coca-Cola FEMSA’s future results from operations or financial condition.
Voluntary price restraints or statutory price controls have been imposed historically in several of the countries in which Coca-Cola FEMSA operates. It is currently subject toCurrently, there are no price controls on Coca-Cola FEMSA’s products in Argentina.any of the territories in which it has operations, except for those in (i) Argentina, where authorities directly supervise certain products sold through supermarkets to control inflation; and (ii) Venezuela, where the government has recently imposed price controls on certain products including bottled water. The imposition of these restrictions or voluntary price restraints in other territories may have an adverse effect on Coca-Cola FEMSA’s results from operations and financial position.See “Item 4. Information on the Company—Regulatory Matters—Price Controls.”We cannot assure you that governmental authorities in any country where Coca-Cola FEMSA operates will not impose statutory price controls or that it will not need to implement voluntary price restraints in the future.
In January 2010, the Venezuelan government amended theLey para la Defensa y Acceso a las Personas a los Bienes y Servicios(Access (Access to Goods and Services Defense Law). Any violation by a company that produces, distributes and sells goods and services could lead to fines, penalties or the confiscation of the assets used to produce, distribute and sell these goods without compensation. Although we believe that Coca-Cola FEMSA believes it is in compliance with this law, consumer protection laws in Venezuela are subject to continuing review and changes, and any such changes may have an adverse impact on Coca-Cola FEMSA.
In July 2011, the Venezuelan government passed theLey de Costos y Precios Justos (Fair Costs and Prices Law). The purpose of this law is to establish the regulations and administrative processes necessary to maintain the price stability of, and equal access to, goods and services. The law also creates the National Ministry of Costs and Prices, the main role of which is to oversee price controls and set maximum retail prices on certain consumer goods and services. Of Coca-Cola FEMSA’s products, only certain of its bottled water beverages were affected by these regulations, which mandated lower sale prices as of April 2012. Any failure to comply with this law would result in fines, temporary suspension or the closure of operations. We cannot assure you that the Venezuelan government’s future regulation of goods and services will not result in a forced reduction of prices in other of Coca-Cola FEMSA’s products, which could have a negative effect on Coca-Cola FEMSA’s results.
In May 2012, the Venezuelan government adopted significant changes to labor regulations. This amendment to Venezuela’s labor regulations could have a negative impact on Coca-Cola FEMSA’s business and operations. The principal changes that impact on Coca-Cola FEMSA’s operations are: (i) the requirement that employee terminations are now subject to governmental authorization; (ii) retroactive assessments for any modifications to Coca-Cola FEMSA’s severance payment system; (iii) the reduction of the maximum daily and weekly work hours (from 44 to 40 weekly); and (iv) the increase in obligatory weekly breaks, prohibiting any corresponding reduction in salaries.
In January 2012, the Costa Rican government approved a decree which regulates the sale of food and beverages in schools. The decree came into effect in 2012. Enforcement of this law will be gradual, from 2012 to 2014, depending on the specific characteristics of the food and beverage in question. According to the decree, the sale of specific sparkling beverages and still beverages that contain sugar, syrup or HFCS in any type of presentation in schools is prohibited. Coca-Cola FEMSA will still be allowed to sell water and certain still beverages in schools. We cannot assure you that the Costa Rican government will not further restrict sales of other of its products in schools in the future; any such further restrictions could lead to an adverse impact on Coca-Cola FEMSA.its results.
Coca-Cola FEMSA’s operations have from time to time been subject to investigations and proceedings by antitrust authorities, and litigation relating to alleged anticompetitive practices. Coca-Cola FEMSA has also been subject to investigations and proceedings on environmental and labor matters.See “Item 8. Financial Information—Legal Proceedings.”We cannot assure you that these investigations and proceedings couldwill not have an adverse effect on Coca-Cola FEMSA’s results from operations or financial condition.
Economic and political conditions in the other Latin American countries in which Coca-Cola FEMSA operates other than Mexico may have an increasingly adverse effect onadversely affect its business.
In addition to operating in Mexico, our subsidiary Coca-Cola FEMSA conducts operations in Brazil, Guatemala, Nicaragua, Costa Rica, Panama, Colombia, Venezuela Brazil and Argentina. Total revenues and income from Coca-Cola FEMSA’s combined non-Mexican operations increaseddecreased as a percentage of theirits consolidated total revenues and income from operations from 42.8% and 29.5%, respectively,63.8% in 20052011 to 62.5% and 61.3%, respectively,60.8% in 2010. As a consequence,2012; for the same non-Mexican operations, Coca-Cola FEMSA’s gross profit decreased as a percentage of its consolidated gross profit from 62.2% in 2011 to 59.3% in 2012. Given the relevance of Coca-Cola FEMSA’s non-Mexican operations, its results have been increasinglycontinue to be affected by the economic and political conditions in the countries, other than Mexico, where it conducts operations.
Coca-Cola FEMSA’s business may be affected by the general conditions of the Brazilian economy, the rate of inflation, Brazilian interest rates or exchange rates for Brazilian reais. Decreases in the growth rate of the Brazilian economy, periods of negative growth and/or increases in inflation or interest rates may result in lower demand for Coca-Cola FEMSA’s products, lower real pricing of its products or a shift to lower margin products.
Consumer demand, preferences, real prices and the costs of raw materials are heavily influenced by macroeconomic and political conditions in the other countries in which Coca-Cola FEMSA operates. These conditions vary by country and may not be correlated to conditions in Coca-Cola FEMSA’s Mexican operations. In Venezuela, Coca-Cola FEMSA continues to face exchange rate risk as well as scarcity of raw materials and restrictions with respect to the import of suchon importing raw materials. Deterioration in economic and political conditions in any of these countries would have an adverse effect on Coca-Cola FEMSA’s financial position and results fromresults.
Venezuelan political events may affect Coca-Cola FEMSA’s operations. Although Venezuela will hold elections on April 14, 2013, in light of the death of President Hugo Chavez, political uncertainty remains. We cannot provide any assurances that political developments in Venezuela, over which Coca-Cola FEMSA has no control, will not have an adverse effect on Coca-Cola FEMSA’s business, financial condition or results.
On October 7, 2012, General Otto Peréz Molina, representing thePartido Patriota(Patriot Party), was elected to the presidency in Guatemala. We cannot assure you that the elected president will continue to apply the same policies that have been applied to Coca-Cola FEMSA in the past.
Depreciation of the local currencies of the countries in which Coca-Cola FEMSA operates against the U.S. dollar may increase itsCoca-Cola FEMSA’s operating costs. Coca-Cola FEMSA has also operated under exchange controls in Venezuela since 2003, thatwhich limit theits ability to remit dividends abroad or make payments other than in local currencies and that may increase the real price paid for raw materials and services purchased in local currency. In January 2010,February 2013, the Venezuelan government announced a devaluation ofin its official exchange rate, from 4.30 to 6.30 bolivars per US$ 1.00. For further information, please see Note 3.3 and the establishment of a multiple exchange rate system of (1) 2.60 bolivarsNote 29 to US$ 1.00 for high priority categories (2) 4.30 bolivars to US$ 1.00 for non-priority categories and (3) the recognition of the existence of other exchange rates that the government shall determine. In January 2011, the
Venezuelan government announced that its only official exchange rate as of January 1, 2011 is 4.30 bolivars to US$ 1.00, althoughour audited consolidated financial statements. Future changes in the Venezuelan government continues to recognize the existence of other exchange rates that the government shall determine; FEMSA expects this devaluation may have an adverse impact on its results from operations as a result of the exchange rate as applied to Coca-Cola FEMSA’s U.S. dollar-denominated raw material costs. Futurecontrol regime, and future currency devaluationdevaluations or the imposition of exchange controls in any of the countries in which Coca-Cola FEMSA has operations could have an adverse effect on its financial position and results from operations.
During 2010, Coca-Cola FEMSA’s plant in Valencia, Venezuela, was affected by a strike for 26 days, which stopped all production at this plant. The Valencia plant is Coca-Cola FEMSA’s principal plant, producing 50% of the volume of sales in Venezuela. A final agreement was reached with the union that resulted in additional expenditures in the form of increased wages and certain improvements in work conditions for the plant’s employees.results.
We cannot assure you that political or social developments in any of the countries in which Coca-Cola FEMSA has operations, and over which it haswe have no control, will not have a corresponding adverse effect on the economic situation andglobal market or on Coca-Cola FEMSA’s business, financial condition or results from operations.results.
Weather conditions may adversely affect Coca-Cola FEMSA’s results.
Lower temperatures and higher rainfall may negatively impact consumer patterns, which may result in lower per capita consumption of Coca-Cola FEMSA’s beverage offerings. Additionally, adverse weather conditions may affect road infrastructure in the territories in which Coca-Cola FEMSA operates and may limits itslimit Coca-Cola FEMSA’s ability to sell and distribute its products, thus affecting its results.
Coca-Cola FEMSA now conducts business in countries in which it has not previously operated and that present different or greater risks than certain countries in Latin America.
As a result of the acquisition of 51% of the outstanding shares of the Coca-Cola Bottlers Philippines, Inc. (“CCBPI”), Coca-Cola FEMSA has expanded its geographic reach from Latin America to include the Philippines. The Philippines presents different risks than the risks Coca-Cola FEMSA faces in Latin America. Coca-Cola FEMSA has not previously conducted business in CCPBI’s territories. Coca-Cola FEMSA now faces competitive pressures that are different than those Coca-Cola FEMSA has historically faced. In the Philippines, Coca-Cola FEMSA is the only beverage company competing across categories, and it faces significant competition in each category. In addition, the per capita income of the population in Philippines is lower than the average per capita income in the countries in which Coca-Cola FEMSA currently operates, and the distribution and marketing practices in the Philippines differ from Coca-Cola FEMSA’s results from operations. As was the case in Mexico, Colombia, Venezuelahistorical practices. Coca-Cola FEMSA may have to adapt its marketing and Central America in 2010, adverse weather conditions affecteddistribution strategies to compete effectively. Coca-Cola FEMSA’s sales in certain regions of these territories.inability to compete effectively may have an adverse effect on its future results.See “Item 4. Information on the Company—The Company—Recent Acquisitions.”
FEMSA Comercio
Competition from other retailers in Mexico could adversely affect FEMSA Comercio’s business.
The Mexican retail sector is highly competitive. FEMSA participates in the retail sector primarily through FEMSA Comercio. FEMSA Comercio’s OXXO convenience stores face competition on a regional basis from small-format stores like 7-Eleven, Super Extra, Super City, Círculo K stores and Circle K stores. OXXO convenience stores also face competition fromother numerous small chains of retailers across Mexico.Mexico, from other regional small format retailers to small informal neighborhood stores. In the future, OXXOparticular, small informal neighborhood stores can sometimes avoid regulatory oversight and taxation, enabling them to sell certain products at below market prices. In addition, these small informal neighborhood stores could improve their technological capabilities so as to enable credit card transactions and electronic payment of utility bills, which would diminish FEMSA Comercio’s competitive advantage. FEMSA Comercio may face additional competition from other retailers that do not currently participate in the convenience store sector or from new market entrants. Increased competition may limit the number of new locations available to FEMSA Comercio and require FEMSA Comercio to modify its product offering or pricing. In addition, consumers may prefer alternative products or store formats offered by competitors. As a result, FEMSA Comercio’s results from operations and financial position may be adversely affected by competition in the future.
Sales of OXXO convenience stores may be adversely affected by changes in economic conditions in Mexico.
Convenience stores often sell certain products at a premium. The convenience store market is thus highly sensitive to economic conditions, since an economic slowdown is often accompanied by a decline in consumer purchasing power, which in turn results in a decline in the overall consumption of FEMSA Comercio’s main product categories. During periods of economic slowdown, OXXO stores may experience a decline in traffic per store and purchases per customer, and this may result in a decline in FEMSA Comercio’s resultsresults.
Taxes could adversely affect FEMSA Comercio’s business.
Mexico may adopt new tax laws or modify existing laws to increase taxes applicable to FEMSA Comercio’s business. For example, a general tax reform became effective on January 1, 2010, pursuant to which, as applicable to FEMSA Comercio, there was a temporary increase in the income tax rate from operations.28% to 30% from 2010 through 2012. Pursuant to an amendment issued at the end of 2012, the 30% income tax rate will continue to apply through 2013. In addition, the VAT rate in Mexico increased in 2010 from 15% to 16%. If the VAT rate increases, it could cause lower traffic or ticket figures for FEMSA Comercio.
FEMSA Comercio may not be able to maintain its historic growth rate.
FEMSA Comercio increased the number of OXXO stores at a compound annual growth rate of 14.8%13.6% from 20062008 to 2010.2012. The growth in the number of OXXO stores has driven growth in total revenue and operating incomeresults at FEMSA Comercio over the same period. As the overall number of stores increases, percentage growth in the number of OXXO stores is likely to decrease. In addition, as convenience store penetration in Mexico grows, the number of viable new store locations may decrease, and new store locations may be less favorable in terms of same store sales, average ticket and store traffic. As a result, FEMSA Comercio’s future results from operations and financial condition may not be consistent with prior periods and may be characterized by lower growth rates in terms of total revenue and operating income.results. In Colombia, FEMSA Comercio may not be able to maintain similar historic growth rates to those in Mexico.
FEMSA Comercio’s business may be adversely affected by an increase in the crime rateof insecurity in Mexico.
In recent years, crime rates have increased,remained high, particularly in the north of Mexico, and there has been a particular increase in drug-related crime and other organized crime. Although FEMSA Comercio has stores across the majority of the Mexican territory, the north of Mexico represents an important region in FEMSA Comercio’s operations. An increase in crime rates could negatively affect sales and customer traffic, increase security expenses incurred in each store, result in higher turnover of personnel or damage to the perception of the OXXO brand, each of which could have an adverse effect on FEMSA Comercio’s business.
FEMSA Comercio’s business may be adversely affected by changes in information technology.
FEMSA Comercio invests aggressively in information technology (which we refer to as IT) in order to maximize its value generation potential. Given the rapid speed at which FEMSA Comercio adds new services and products to its commercial offerings, the development of information technologyIT systems, hardware and software needs to keep pace with the growth of the business. If these systems became unstable or if planning for future information technologyIT investments were inadequate, it could affect FEMSA Comercio’s business by reducing the flexibility of its value proposition to consumers or by increasing its operating complexity, either of which could adversely affect FEMSA Comercio’s revenue-per-store trends.
FEMSA Comercio’s business could be adversely affected by a failure, interruption, or breach of our IT system.
FEMSA Comercio’s business relies heavily on its advanced IT system to effectively manage its data, communications, connectivity, and other business processes. Although we constantly improve our IT system and protect it with advanced security measures, it may still be subject to defects, interruptions, or security breaches such as viruses or data theft. Such a defect, interruption, or breach could adversely affect FEMSA Comercio’s results or financial position.
FEMSA Comercio’s business may be adversely affected by an increase in the price of electricity.
The performance of FEMSA Comercio’s stores would be adversely affected by increases in the price of utilities on which the stores depend, such as electricity. Although the price of electricity in Mexico has remained stable recently, it could potentially increase as a result of inflation, shortages, interruptions in supply, or other reasons, and such an increase could adversely affect our results or financial position.
Risks Related to Our Holding of Heineken N.V. and Heineken Holding N.V. Shares
FEMSA willdoes not control Heineken N.V.’s and Heineken Holding N.V.’s decisions.
On April 30, 2010, FEMSA announced the closing of the transaction pursuant to which FEMSA agreed to exchange 100% of its beer operations for a 20% economic interest in Heineken N.V. and Heineken Holding N.V. (which, together with their respective subsidiaries, we refer to as Heineken or the Heineken Group,Group). As a consequence of this transaction, which we refer to as the Heineken transaction. As a consequence of the Heineken transaction, FEMSA now participates in the Heineken Holding N.V. Board of Directors, which we refer to as the Heineken Holding Board, and in the Heineken N.V. Supervisory Board, which we refer to as the Heineken Supervisory Board. However, FEMSA is not a majority or controlling shareholder of Heineken N.V. andor Heineken Holding N.V., nor does it control the decisions of the Heineken Holding Board or the Heineken Supervisory Board. Therefore, the decisions made by the majority or controlling shareholders of Heineken N.V. andor Heineken Holding N.V. or the Heineken Holding Board or the Heineken Supervisory Board may not be consistent with or may not consider the interests of FEMSA’s shareholders or may be adverse to the interests of FEMSA’s shareholders. Additionally, FEMSA has agreed not to disclose non-public information and decisions taken by Heineken.
Heineken is present in a large number of countries.
Heineken is a global distributorbrewer and brewerdistributor of beer in a large number of countries. As a consequence of the Heineken transaction, FEMSA shareholders are indirectly exposed to the political, economic and social circumstances affecting the markets in which Heineken is present, which may have an adverse effect on the value of FEMSA’s interest in Heineken, and, consequently, the value of FEMSA shares.
Strengthening of the Mexican peso.peso compared to the Euro.
In the event of a depreciation of the Euro (€)euro against the Mexican Peso,peso, the fair value of FEMSA’s investment in shares will be adversely affected.
Furthermore, the cash flow that is expected to be received in the form of dividends from Heineken will be in Euros,euros, and therefore, in the event of a depreciation of the Euroeuro against the Mexican Peso,peso, the amount of expected cash flow will be adversely affected.
Heineken N.V. and Heineken Holding N.V. are publicly listed companies.
Heineken N.V. and Heineken Holding N.V. are listed companies whose stock trades publicly and is subject to market fluctuation. A reduction in the price of Heineken N.V. andor Heineken Holding N.V. shares would result in a reduction in the economic value of FEMSA’s participation in Heineken.
Risks Related to Our Principal Shareholders and Capital Structure
A majority of our voting shares are held by a voting trust, which effectively controls the management of our company, and whosethe interests of which may differ from those of other shareholders.
As of April 30, 2011,March 15, 2013, a voting trust, of which the participants of which are members of seven families, owned 38.69% of our capital stock and 74.86% of our capital stock with full voting rights, consisting of the Series B Shares. Consequently, the voting trust has the power to elect a majority of the members of our board of directors and to play a significant or controlling role in the outcome of substantially all matters to be decided by our board of directors or our shareholders. The interests of the voting trust may differ from those of our other shareholders.See “Item 7. Major Shareholders and Related Party Transactions” and “Item 10. Additional Information—Bylaws—Voting Rights and Certain Minority Rights.”
Holders of Series D-B and D-L Shares have limited voting rights.
Holders of Series D-B and D-L Shares have limited voting rights and are only entitled to vote on specific matters, such as certain changes in the form of our corporate organization, dissolution, or liquidation, a merger with a company with a distinct corporate purpose, a merger in which we are not the surviving entity, a change of our jurisdiction of incorporation, the cancellation of the registration of the Series D-B and D-L Shares and any other matters that expressly require approval from such holders under the Mexican Securities Law. As a result of these limited voting rights, Series D-B and D-L holders will not be able to influence our business or operations.See “Item 7. Major Shareholders and Related Party Transactions—Major Shareholders” and “Item 10. Additional Information—Bylaws—Voting Rights and Certain Minority Rights.”
Holders of ADSs may not be able to vote at our shareholder meetings.
Our shares are traded on the New York Stock Exchange, or NYSE, in the form of ADSs. We cannot assure you that holders of our shares in the form of ADSs will receive notice of shareholders’ meetings from our ADS depositary in sufficient time to enable such holders to return voting instructions to the ADS depositary in a timely manner. In the event that instructions are not received with respect to any shares underlying ADSs, the ADS depositary will, subject to certain limitations, grant a proxy to a person designated by us in respect of these shares. In the event that this proxy is not granted, the ADS depositary will vote these shares in the same manner as the majority of the shares of each class for which voting instructions are received.
Holders of BD Units in the United States and holders of ADSs may not be able to participate in any future preemptive rights offering and as a result may be subject to dilution of their equity interests.
Under applicable Mexican law, if we issue new shares for cash as a part of a capital increase, other than in connection with a public offering of newly issued shares or treasury stock, we are generally required to grant our shareholders the right to purchase a sufficient number of shares to maintain their existing ownership percentage.
Rights to purchase shares in these circumstances are known as preemptive rights. WeBy law, we may not legally allow holders of our shares or ADSs who are located in the United States to exercise any preemptive rights in any future capital increases unless (1) we file a registration statement with the U.S. Securities and Exchange Commission, which we refer to as the SEC, with respect to that future issuance of shares or (2) the offering qualifies for an exemption from the registration requirements of the U.S. Securities Act of 1933. At the time of any future capital increase, we will evaluate the costs and potential liabilities associated with filing a registration statement with the SEC, as well as the benefits of preemptive rights to holders of our shares in the form of ADSs in the United States and any other factors that we consider important in determining whether to file a registration statement.
We may decide not to file a registration statement with the SEC to allow holders of our shares or ADSs who are located in the United States to participate in a preemptive rights offering. In addition, under current Mexican law, the sale by the ADS depositary of preemptive rights and the distribution of the proceeds from such sales to the holders of our shares in the form of ADSs is not possible. As a result, the equity interest of holders of our shares in the form of ADSs would be diluted proportionately.See “Item 10. Additional Information—Bylaws—Preemptive Rights.”
The protections afforded to minority shareholders in Mexico are different from those afforded to minority shareholders in the United States.
Under Mexican law, the protections afforded to minority shareholders are different from, and may be less than, those afforded to minority shareholders in the United States. Mexican laws do not provide a remedy to shareholders relating to violations of fiduciary duties. There is no procedure for class actions as such actions are conducted in the United States and there are different procedural requirements for bringing shareholder lawsuits against directors for the benefit of companies. Therefore, it may be more difficult for minority shareholders to enforce their rights against us, our directors or our controlling shareholders than it would be for minority shareholders of a United States company.
Investors may experience difficulties in enforcing civil liabilities against us or our directors, officers and controlling persons.
FEMSA is organized under the laws of Mexico, and most of our directors, officers and controlling persons reside outside the United States. In addition, all or a substantial portion of our assets and their respective assets are located outside the United States. As a result, it may be difficult for investors to effect service of process within the United States on such persons or to enforce judgments against them, including any action based on civil liabilities under the U.S. federal securities laws. There is doubt as to the enforceability against such persons in Mexico, whether in original actions or in actions to enforce judgments of U.S. courts, of liabilities based solely on the U.S. federal securities laws.
Developments in other countries may adversely affect the market for our securities.
The market value of securities of Mexican companies is, to varying degrees, influenced by economic and securities market conditions in other emerging market countries. Although economic conditions are different in each country, investors’ reaction to developments in one country can have effects on the securities of issuers in other countries, including Mexico. We cannot assure you that events elsewhere, especially in emerging markets, will not adversely affect the market value of our securities.
The failure or inability of our subsidiaries to pay dividends or other distributions to us may adversely affect us and our ability to pay dividends to holders of ADSs.
FEMSA isWe are a holding company. Accordingly, FEMSA’sour cash flows are principally derived from dividends, interest and other distributions made to FEMSAus by itsour subsidiaries. Currently, FEMSA’sour subsidiaries do not have contractual obligations that require them to pay dividends to FEMSA.us. In addition, debt and other contractual obligations of our subsidiaries may in the future impose restrictions on our subsidiaries’ ability to make dividend or other payments to FEMSA,us, which in turn may adversely affect FEMSA’sour ability to pay dividends to shareholders and meet its debt and other obligations. As of December 31, 2010, FEMSA2012, we had no restrictions on itsour ability to pay
dividends. Given the exchange of 100% of our ownership of the business of Cuauhtémoc Moctezuma Holding, S.A. de C.V. (formerly FEMSA Cerveza, businessS.A. de C.V.) (which we refer to as Cuauhtémoc Moctezuma or FEMSA Cerveza) for a 20% economic interest in the Heineken, Group, FEMSA’sour non-controlling shareholder position in Heineken N.V. and Heineken Holding N.V. means that itwe will be unable to require payment of dividends with respect to the Heineken N.V. and Heineken Holding N.V. shares.
Risks Related to Mexico and the Other Countries in Which We Operate
Adverse economic conditions in Mexico may adversely affect our financial position and results from operations.results.
We are a Mexican corporation, and our Mexican operations are our single most important geographic territory. Given the exchange of 100% of our FEMSA Cerveza business for a 20% economic interest in the Heineken Group, FEMSA shareholders may face a lesser degree of exposure with respect to economic conditions in Mexico and a greater degree of indirect exposure to the political, economic and social circumstances affecting the markets in which Heineken is present. For the year ended December 31, 2010,2012, 62% of our consolidated total revenues were attributable to Mexico and at the net income level the percentage attributable to our Mexican operations is further reduced. The Mexican economy experienced a downturn as a result of the impact of the global financial crisis on many emerging economies that began in the second half of 2008 and continued through 2010.
In the first quarter of 2011,2012, Mexican gross domestic product, or GDP, increased by approximately 4.6%3.9% on an annualized basis compared to the same period in 20102011, due to an improvement in the manufacturing and servicesmost sectors of the economy.economy, driven by agriculture. The Mexican economy continues to be heavily influenced by the U.S. economy, and therefore, further deterioration in economic conditions in, or delays in recovery of, the U.S. economy may hinder any recovery in Mexico. In the past, Mexico has experienced both prolonged periods of weak economic conditions and deteriorations in economic conditions that have had a negative impact on our results from operations.results. Given the continuing global macroeconomic downturn in 2009 and 2010, and the slow and incipient recovery in 2011 and 2012, which also affected the Mexican economy, we cannot assure you that such conditions will not have a material adverse effect on our results from operations and financial position going forward.
Our business may be significantly affected by the general condition of the Mexican economy, or by the rate of inflation in Mexico, interest rates in Mexico and exchange rates for, or exchange controls affecting, the Mexican peso. Decreases in the growth rate of the Mexican economy, periods of negative growth and/or increases in inflation or interest rates may result in lower demand for our products, lower real pricing of our products or a shift to lower margin products. Because a large percentage of our costs and expenses are fixed, we may not be able to reduce costs and expenses upon the occurrence of any of these events, and our profit margins may suffer as a result.
In addition, an increase in interest rates in Mexico would increase the cost to us of variable rate debt, Mexican peso-denominated funding, which constituted 52.1%18.3% of our total debt as of December 31, 2010 (including2012 (the total amount of the debt and the variable rate debt used in the calculation of this percentage considers converting only the units of investments debt for the related cross currency swap, and it also includes the effect of related interest rate swaps), and have an adverse effect on our financial position and results from operations.results.
Depreciation of the Mexican peso relative to the U.S. dollar could adversely affect our financial position and results from operations.results.
Depreciation of the Mexican peso relative to the U.S. dollar increases the cost to us of a portion of the raw materials we acquire, the price of which is paid in or determined with reference to U.S. dollars, and of our debt obligations denominated in U.S. dollars, and thereby negatively affects our financial position and results from operations.results. A severe devaluation or depreciation of the Mexican peso may result in disruption of the international foreign exchange markets and may limit our ability to transfer or to convert Mexican pesos into U.S. dollars and other currencies for the purpose of making timely payments of interest and principal on our U.S. dollar-denominated debt or obligations in other currencies. Although the value of the Mexican peso against the U.S. dollar had been fairly stable until mid-2008, in the fourth quarter of 2008, the Mexican peso depreciated approximately 27% compared to the fourth quarter of 2007. Since 2008, the Mexican peso has continued to experience exchange rate fluctuations relative to the U.S. dollar, as follows. During 20092010 and 2010,2011, the Mexican peso experienced a recoverydifferent fluctuations relative to the U.S. dollar of approximately 5.2%5.6% of recovery and 5.6%12.7% of depreciation compared to the yearyears of 20082009 and 2009 respectively, and in2010 respectively. During 2012, the Mexican peso experienced an appreciation relative to the U.S. dollar of approximately 7.1% compared to 2011. In the first quarter of 2011,2013, the Mexican peso has appreciated approximately 3%5.0% relative to the U.S. dollar compared to the fourth quarter of 2010.2012.
While the Mexican government does not currently restrict, and since 1982 has not restricted, the right or ability of Mexican or foreign persons or entities to convert Mexican pesos into U.S. dollars or to transfer other currencies out of Mexico, the Mexican government could institute restrictive exchange rate policies in the future, as
it has done in the past. Currency fluctuations may have an adverse effect on our financial position, results from operations and cash flows in future periods.
When the financial markets are volatile, as they have been in recent periods, our results from operations may be substantially affected by variations in exchange rates and commodity prices, and to a lesser degree, interest rates. These effects include foreign exchange gain and loss on assets and liabilities denominated in U.S. dollars, fair value gain and loss on derivative financial instruments, commodities prices and changes in interest income and interest expense. These effects can be much more volatile than our operating performance and our operating cash flows.
Political events in Mexico could adversely affect our operations.
Mexican political events may significantly affect our operations. Presidential elections in Mexico occur every six years, andwith the most recent election occurredone occurring in July 2006. Elections2012. Enrique Peña Nieto, a member of the senate also occurredPartido Revolucionario Institucional, was elected as the new president of Mexico and took office on December 1, 2012. As with any governmental change, the new government may lead to significant changes in July 2006,governmental policies, may contribute to economic uncertainty and although thePartido Acción Nacional won a pluralityto heightened volatility of the seatsMexican capital markets and securities issued by Mexican companies. Currently, no single party has a majority in the Mexican congress in the election, no party succeeded in securing a majority. Elections ofSenate or theCámara de Diputados(House (House of Representatives) occurred in 2009,, and although thePartido Revolucionario Institucionalwon a plurality of seats in the House of Representatives, no party succeeded in securing a majority. The absence of a clear majority by a single party is likely to continue. This situation maycould result in government gridlock and political uncertainty.uncertainty due to the Mexican congress’ potential inability to reach consensus on the structural reforms required to modernize certain sectors of and foster growth in the Mexican economy. We cannot provide any assurances that political developments in Mexico, over which we have no control, will not have an adverse effect on our business, financial condition, or results from operations.and prospects.
Insecurity in Mexico could increase, and this could adversely affect our results.
The presence and increasing levels of violence among drug cartels, and between these and the Mexican law enforcement and armed forces, pose a risk to our business. Organized criminal activity and related violent incidents remained high during 20102012 and to a lesser extent in the first quarter of 2013 and are relatively concentrated along the northern Mexican border, as well as in certain other Mexican states such as Sinaloa, Michoacán and Michoacán. Mexican President Felipe Calderón has acted to fight the drug cartels and has disrupted the balance of power among them.Guerrero. The principal driver of organized criminal activity is the drug trade that aims to supply and profit from the uninterrupted demand for drugs and the supply of weapons from the United States. This situation could impact our business because consumer habits and patterns adjust to the increased perceived and real insecurity as people refrain from going out as much and gradually shift some on-premise consumption to off-premise consumption of food and beverages on certain social occasions. Insecurity could increase, and this could therefore adversely affect our operational and financial results.
Depreciation of local currencies in other Latin American countries in which we operate may adversely affect our financial position.
Total revenues increased in certain of our non-Mexican beverage operations at a higher rate relative to their respective Mexican operations in 2010. This2012. The recurrence of such a higher rate of total revenue growth could result in a greater contribution to the respective results from operations for these territories, but may also expose us to greater risk in these territories as a result. The devaluation of the local currencies against the U.S. dollar in our non-Mexican territories can increase our operating costs in these countries, and depreciation of the local currencies against the Mexican peso can negatively affect our results from operations for these countries. In recent years, the value of the currency in the countries in which we operate had been relatively stable except in Venezuela. Future currency devaluation or the imposition of exchange controls in any of these countries, including Mexico, would have an adverse effect on our financial position and results from operations.
| ITEM 4. | INFORMATION ON THE COMPANY |
We are a Mexican company headquartered in Monterrey, Mexico, and our origin dates back to 1890. Our company was incorporated on May 30, 1936 and has a duration of 99 years. The duration can be extended indefinitely by resolution of our shareholders. Our legal name is Fomento Económico Mexicano, S.A.B. de C.V., and in commercial contexts we frequently refer to ourselves as FEMSA. Our principal executive offices are located at General Anaya No. 601 Pte., Colonia Bella Vista, Monterrey, Nuevo León 64410, Mexico. Our telephone number at this location is (52-81) 8328-6000. Our website is www.femsa.com. We are organized as asociedad anónima bursátil de capital variable under the laws of Mexico.
We conduct our operations through the following principal holding companies, each of which we refer to as a principal sub-holding company:
Coca-Cola FEMSA, which engages in the production, distribution and marketing of soft drinks;beverages;
FEMSA Comercio, which operates conveniencesmall-format stores; and
CB Equity, which holds our investment in Heineken.
On April 30, 2010, FEMSA announced the closing of the transaction pursuant to which FEMSA agreed to exchange 100% of its beer operations for a 20% economic interest in the Heineken Group. Under Mexican FRS, we have reclassified our audited consolidated balance sheets as of December 31, 2010 and 2009, the related consolidated statements of income and changes in stockholders’ equity and cash flows for the years ended December 31, 2010, 2009 and 2008 to reflect FEMSA Cerveza as a discontinued operation. However, FEMSA Cerveza is not a discontinued operation under U.S. GAAP. See “Item 5. Operating and Financial Review and Prospects—U.S. GAAP Reconciliation” and Notes 27 and 28 to our audited consolidated financial statements.
FEMSA traces its origins to the establishment of Mexico’s first brewery, Cervecería Cuauhtémoc, S.A., which we refer to as Cuauhtémoc, thatwhich was founded in 1890 by four Monterrey businessmen: Francisco G. Sada, José A. Muguerza, Isaac Garza and José M. Schneider. Descendants of certain of the founders of Cuauhtémoc are participants of the voting trust that controls the management of our company.
The strategic integration of our company dates back to 1936 when our packaging operations were established to supply crown caps to the brewery. During this period, these operations were part of what was known as the Monterrey Group, which also included interests in banking, steel and other packaging operations.
In 1974, the Monterrey Group was split between two branches of the descendants of the founding families of Cuauhtémoc. The steel and other packaging operations formed the basis for the creation of Corporación Siderúrgica, S.A. (now Alfa, S.A.B. de C.V.), controlled by the Garza Sada family, and the beverage and banking operations were consolidated under the Valores Industriales, S.A. de C.V. (the corporate predecessor of FEMSA) corporate umbrella controlled by the Garza Lagüera family. FEMSA’s shares were first listed on what is now the Bolsa Mexicana de Valores, S.A.B. de C.V. (which we refer to as the Mexican Stock ExchangeExchange) on September 19, 1978. Between 1977 and 1981, FEMSA diversified its operations through acquisitions in the soft drinks and mineral water industries, the establishment of the first convenience stores under the trade name OXXO and other investments in the hotel, construction, auto parts, food and fishing industries, which were considered non-core businesses and were subsequently divested.
In August 1982, the Mexican government suspended payment on its international debt obligations and nationalized the Mexican banking system. In 1985, certain controlling shareholders of FEMSA acquired a
controlling interest in Cervecería Moctezuma, S.A., which was then Mexico’s third-largest brewery and which we refer to as Moctezuma, and related companies in the packaging industry. FEMSA subsequently undertook an extensive corporate and financial restructuring that was completed in December 1988, and pursuant to which FEMSA’s assets were combined under a single corporate entity, which became Grupo Industrial Emprex, S.A. de C.V., which we refer to as Emprex.
In October 1991, certain majority shareholders of FEMSA acquired a controlling interest in Bancomer, S.A., which we refer to as Bancomer. The investment in Bancomer was undertaken as part of the Mexican government’s reprivatization of the banking system, which had been nationalized in 1982. The Bancomer acquisition was financed in part by a subscription by Emprex’s shareholders, including FEMSA, of shares in Grupo Financiero Bancomer, S.A. de C.V. (currently Grupo Financiero BBVA Bancomer, S.A. de C.V.), which we refer to as BBVA Bancomer, the Mexican financial services holding company that was formed to hold a controlling interest in Bancomer. In February 1992, FEMSA offered Emprex’s shareholders the opportunity to exchange the BBVA Bancomer shares to which they were entitled for Emprex shares owned by FEMSA. In August 1996, the shares of BBVA Bancomer that were received by FEMSA in the exchange with Emprex’s shareholders were distributed as a dividend to FEMSA’s shareholders.
Upon the completion of these transactions,1990s, we began a series of strategic transactions to strengthen the competitive positions of our operating subsidiaries. These transactions included the sale of a 30% strategic interest in Coca-Cola FEMSA to a wholly-owned subsidiary of The Coca-Cola Company and a subsequent public offering of Coca-Cola FEMSA shares, both of which occurred in 1993,1993. Coca-Cola FEMSA listed its L shares on the Mexican Stock Exchange, and, in the saleform of a 22% strategic interest in FEMSA Cerveza to Labatt Brewing Company Limited, which we refer to as Labatt, in 1994. Labatt, which was later acquired by InBev S.A., or InBev (known atADS, on the time of the acquisition of Labatt as Interbrew and currently referred to as A-B InBev), subsequently increased its interest in FEMSA Cerveza to 30%.New York Stock Exchange.
In 1998, we completed a reorganization that:
that changed our capital structure by converting our outstanding capital stock at the time of the reorganization into BD Units and B Units, and
united the shareholders of FEMSA and the former shareholders of Grupo Industrial Emprex, S.A. de C.V. (which we refer to as Emprex) at the same corporate level through an exchange offer that was consummated on May 11, 1998.
As part of the reorganization, FEMSA listed ADSs on the New York Stock ExchangeNYSE representing BD Units, and listed the BD Units and its B Units on the Mexican Stock Exchange.
In May 2003, our subsidiary Coca-Cola FEMSA expanded its operations throughout Latin America by acquiring 100% of Panamco México, S.A. de C.V.Panamerican Beverages, Inc., which we refer to as Panamco, then the largest soft drink bottler in Latin America in terms of sales volume in 2002. Through its acquisition of Panamco, Coca-Cola FEMSA began producing and distributingCoca-Cola trademark beverages in additional territories in Mexico, Central America, Colombia, Venezuela and Brazil, along with bottled water, beer and other beverages in some of these territories. The Coca-Cola Company and its subsidiaries received Series D Shares in exchange for their equity interest in Panamco of approximately 25%.
On August 31, 2004, we consummated a series of transactions with InBev, Labatt and certain of their affiliates to terminate the existing arrangements between FEMSA Cerveza and Labatt. As a result of these transactions, FEMSA acquired 100% ownership of FEMSA Cerveza and previously existing arrangements among affiliates of FEMSA and InBev relating to governance, transfer of ownership and other matters with respect to FEMSA Cerveza were terminated.
On June 1, 2005, we consummated an equity offering of 80.5 million BD Units (including BD Units in the form of ADSs) and 52.78 million B units that resulted in net proceeds to us of US$ 700 million after underwriting spreads and commissions. We used the proceeds of the equity offering to refinance indebtedness incurred in connection with the transactions with InBev, Labatt and certain of their affiliates.
On January 13, 2006, FEMSA Cerveza, through one of its subsidiaries, acquired 68% of the equity of the Brazilian brewer Kaiser from the Molson Coors Brewing Company, or Molson Coors, for US$ 68 million. Molson Coors retained a 15% ownership stake in Kaiser, while Heineken N.V.’s ownership of 17% remained unchanged. In December 2006, Molson Coors completed its exit from Kaiser by exercising its option to sell its 15% holding to FEMSA Cerveza. On December 22, 2006, FEMSA Cerveza made a capital increase of US$ 200 million in Kaiser. At the time, Heineken N.V. elected not to participate in the increase, thereby diluting its 17% interest in Kaiser to 0.17%, and FEMSA Cerveza thereby increasing its stake to 99.83% of the equity of Kaiser, however, in AugustNovember 2007, FEMSA Cerveza and Heineken N.V. closed a stock purchase agreement whereby Heineken N.V. purchased the shares necessary to regain its 17% interest in Kaiser. As a result of this transaction, FEMSA Cerveza obtained ownership of 83% of Kaiser and Heineken N.V. obtained ownership of 17%.
On November 3, 2006, we acquired from certain subsidiaries of The Coca-Cola Company 148,000,000 Series “D” shares of Coca-Cola FEMSA, representing 8.02% of the total outstanding stock of Coca-Cola FEMSA. We acquired these shares at a price of US$ 427.4 million in the aggregate, pursuant to a Memorandum of Understanding with The Coca-Cola Company. As of March 30, 2011, FEMSA indirectly owns 53.7% of the capital stock of Coca-Cola FEMSA (63.0% of its capital stock with full voting rights) and The Coca-Cola Company indirectly owns 31.6% of the capital stock of Coca-Cola FEMSA (37.0% of its capital stock with full voting rights). The remaining 14.7% of its capital consists of Series L Shares with limited voting rights, which trade on the Mexican Stock Exchange and on the New York Stock Exchange in the form of ADSs under the trading symbol KOF.
In March 2007, at our company’s AGM, our shareholders approved a three-for-one stock split of FEMSA’s outstanding stock and our ADSs traded on the NYSE. The pro rata stock split had no effect on the ownership structure of FEMSA. The new units issued in the stock split were distributed by the Mexican Stock Exchange on May 28, 2007, to holders of record as of May 25, 2007, and ADSs traded on the NYSE were distributed on May 30, 2007, to holders of record as of May 25, 2007.
On November 8, 2007, Administración, S.A.P.I. de C.V., or Administración S.A.P.I., a Mexican company owned directly or indirectly by Coca-Cola FEMSA and by The Coca-Cola Company, acquired 58,350,908 shares representing 100% of the shares of the capital stock of Jugos del Valle, for US$ 370 million in cash, with assumed liabilities of US$ 86 million. On June 30, 2008, Administración S.A.P.I. andde C.V. (which we refer to as Jugos del Valle merged, and Jugos del Valle became the surviving entity. Subsequent to the initial acquisitionValle). The business of Jugos del Valle in the United States was acquired and sold by The Coca-Cola Company. In 2008, Coca-Cola FEMSA, offered to sell 30% of its interest in Administración S.A.P.I. to other Coca-Cola bottlers in Mexico. In December 2008, the surviving Jugos del Valle entity sold its operations to The Coca-Cola Company Coca-Cola FEMSA and other bottlers ofall Mexican and BrazilianCoca-Cola trademark brands in Brazil. These still beverage operations were integratedbottlers entered into a joint business with Thefor the Mexican and the Brazilian operations, respectively, of Jugos del Valle. Taking into account the participation held by Grupo Fomento Queretano, Coca-Cola CompanyFEMSA currently holds an interest of 25.1% in Brazil. Through Coca-Cola FEMSA’sthe Mexican joint ventures with The Coca-Cola Company, we distributebusiness and approximately 19.7% in the Brazilian joint businesses. Jugos del Valle line ofsells fruit juice-based beverages and have begun to develop and distribute new products. As of December 31, 2010, 2009 and 2008, Coca-Cola FEMSA has a recorded investment of 19.8% of the capital stock of Jugos del Valle.fruit derivatives.
On
In April 22, 2008, FEMSA shareholders approved a proposal to amend our bylaws in order to preserve the unit structure for our shares that has been in place since May 1998, and to maintain our existing share structure beyond May 11, 2008. Our bylaws previously provided that on May 11, 2008 our Series D-B Shares would convert into Series B Shares and our Series D-L Shares would convert into Series L Shares with limited voting rights. In addition, our bylaws provided that, on May 11, 2008, our current unit structure would cease to exist and each of our B Units would be unbundled into five Series B Shares, while each BD Unit would unbundle into three Series B Shares and two newly issued Series L Shares. Following the April 22, 2008 shareholder approvals, the automatic conversion of our share and unit structures no longer exist, and, absent shareholder action, our share structure will continue to be comprised of Series B Shares, which must represent not less than 51% of our outstanding capital stock, and Series D-B and Series D-L Shares, which together may represent up to 49% of our outstanding capital stock. Our Unit structure, absent shareholder action, will continue to consist of B Units, which bundle five Series B Shares, and BD Units, which bundle one Series B Share, two Series D-B Shares and two Series D-L Shares. See “Item 9. The Offer and Listing—Description of Securities.”
In May 2008, Coca-Cola FEMSA completed its acquisition of REMIL in Brazil for US$ 364.1 million, net of cash received, and assumed liabilities of US$ 196.9 million.
On January 11, 2010, FEMSA announced that its Board of Directors unanimously approved a definitive agreement under which FEMSA would exchange its FEMSA Cerveza business for a 20% economic interest in Heineken, one of the world’s leading brewers. In April 2010, FEMSA announced the closing of the transaction, after Heineken N.V., Heineken Holding N.V. and FEMSA held their corresponding AGMs and approved the transaction. Under the terms of the agreement, FEMSA received 43,018,320 shares of Heineken Holding N.V. and 43,009,699 shares of Heineken N.V., with an additional 29,172,504 shares of Heineken N.V. (which shares we refer to as the Allotted Shares) to be delivered pursuant to an allotted share delivery instrument. It is expected thatinstrument, or the allotted shares will be acquired byASDI. Heineken in the secondary market for delivery to FEMSA over a term not to exceed five years. Nonetheless, during the period for the delivery of the allotted shares, FEMSA will be subject to all the economic benefits, as well as the risk and obligations, of the Heineken Group as if such shares had been delivered at the closing of the transaction on April 30, 2010. Heineken would also assumeassumed US$ 2.1 billion of indebtedness, including FEMSA Cerveza’s unfunded pension obligations. The Allotted Shares were delivered to FEMSA in several installments during 2010 and 2011, with the final installment delivered on October 5, 2011. As of December 31, 2012, FEMSA’s interest in Heineken N.V. represented 12.53% of Heineken N.V.’s outstanding capital and 14.94% of Heineken Holding N.V.’s outstanding capital. The principal terms of the Heineken transaction documents are summarized below in “Item 10. Additional Information—Material Contracts.”
OnIn February 1, 2010, FEMSA signed an agreement with subsidiaries of The Coca-Cola Company to amend the shareholders agreement for Coca-Cola FEMSA. The purpose of the amendment is to set forth that the appointment and compensation of the chief executive officer and all officers reporting to the chief executive officer, as well as the adoption of decisions related to the ordinary operations of Coca-Cola FEMSA, shall only require a simple majority vote of the board of directors. Decisions related to extraordinary matters (such as business acquisitions or combinations in an amount exceeding US$ 100 million, among others) shall continue to require the vote of the majority of the board of directors, including the affirmative vote of two of the board members appointed by The Coca-Cola Company. The amendment was approved at Coca-Cola FEMSA’s extraordinary shareholders meeting on April 14, 2010, and is reflected in the by-lawsbylaws of Coca-Cola FEMSA. This amendment was signed without transfer of any consideration. The percentage of our voting interest in our subsidiary Coca-Cola FEMSA remains the same after the signing of this amendment.
On April 22, 2010, Heineken N.V. and Heineken Holding N.V. held their AGM, and approved the acquisition of 100% of the shares of the beer operations owned by FEMSA, under the terms announced on January 11, 2010. The AGM of Heineken appointed, subject to the completion of the acquisition of FEMSA’s beer operations, Mr. Jose Antonio Fernández Carbajal as member of the Board of Directors of Heineken Holding N.V. and Heineken Supervisory Board, and Mr. Javier Astaburuaga Sanjines as second representative in the Heineken Supervisory Board. Their appointments became effective on April 30, 2010.
On April 26, 2010, FEMSA held its AGM, during which shareholders approved the transaction with Heineken. Shareholders approved the exchange of 100% of FEMSA’s beer operations in Mexico and Brazil for a 20% economic interest in the Heineken Group, and the assumption by Heineken of debt in the amount of US$2.1 billion dollars, under the transaction terms described on January 11, 2010.
On April 30, 2010, FEMSA announced the closing of the transaction pursuant to which FEMSA agreed to exchange 100% of its beer operations for a 20% economic interest in the Heineken Group. The principal terms of the Heineken transaction documents are summarized below in “Item 10. Additional Information—Material Contracts.”
OnIn September 2010, FEMSA sold Promotora de Marcas Nacionales, S. de R.L. de C.V., which we refer to as Promotora, to The Coca-Cola Company. Promotora was the owner of theMundet brands of soft drinks in Mexico.
On SeptemberDecember 31, 2010, FEMSA signed definitive agreements with GPC III, B.V. to sellsold its flexible packaging and label operations, Grafo Regia, S.A. de C.V., to a Mexican subsidiary of GPC III, B.V. This transaction was part of FEMSA’s strategy to divest non-core assets. The transaction was closed on December 31, 2010.businesses.
During the third quarter of 2010, Coca-Cola FEMSA completed a transaction with a Brazilian subsidiary of The Coca-Cola Company to produce, sell and distributeMatte Leão branded products. This transaction will reinforcereinforced Coca-Cola FEMSA’s non-carbonated product offering through the platform that is operated by The Coca-Cola Company and its bottling partners in Brazil. As a part of the agreement, Coca-Cola FEMSA has been selling and distributing certainMatte Leão branded ready-to-drink products since the first quarter of 2010. As of March 31, 2013, Coca-Cola FEMSA currently hashad a 13.84%19.4% indirect interest in theMatte Leãobusiness in Brazil.
OnIn March 17, 2011, a consortium of investors formed by FEMSA, the Macquarie Mexican Infrastructure Fund and other investors, acquired Energía Alterna Istmeña, S. de R.L. de C.V., which we refer to as EAI, and Energía Eólica Mareña, S.A. de C.V., which we refer to as EEM, from subsidiaries of Preneal, S.A., which we refer to as Preneal, for a transaction enterprise value of Ps. 1,063.5 million. FEMSA owns a 45% interest in the consortium.Preneal. EAI and EEM aretogether constitute the owners ofMareña Renovables Wind Farm, a 396 megawatt late-stage wind energy project in the south-easternsoutheastern region of the State of Oaxaca. The Mareña Renovables Wind Farm is expected to be the largest wind power farm in Latin America. On February 23, 2012, a wholly-owned subsidiary of Mitsubishi Corporation, and Stichting Depositary PGGM Infrastructure Funds, a pension fund managed by PGGM, acquired the 45% interest held by FEMSA in the parent companies of the Mareña Renovables Wind Farm. The sale of FEMSA’s participation as an investor resulted in a gain of Ps. 933 million. Certain subsidiaries of FEMSA, FEMSA Comercio and Coca-Cola FEMSA have entered into 20-year wind power supply agreements with EAI and EEMthe Mareña Renovables Wind Farm to purchase energy output produced by such companies. The project is currentlyit. These agreements will remain in its long-term financing stage.full force and effect.
OnIn March 28, 2011, Coca-Cola FEMSA, together with The Coca-Cola Company and through Compañía Panameña de Bebidas S.A.P.I. de C.V., acquired Grupo Estrella Azul (also known as Grupo Industrias Lacteas)Lácteas S.A., which we refer to as Grupo Estrella Azul, a Panamanian company engaged for more than 50 years in the dairy and juice-based beverage categories. The CompanyCoca-Cola FEMSA acquired a 50% interest and will continue to develop this business jointly with The Coca-Cola Company. Beginning in April 2011, both The Coca-Cola Company and Coca-Cola FEMSA commenced the gradual integration of Grupo Estrella Azul into the existing beverage platform they share for the development of non-carbonated products in Panama.
In October 2011, Coca-Cola FEMSA merged with Administradora de Acciones del Noreste, S.A.P.I. de C.V., which constituted the beverage division of Grupo Tampico, S.A. de C.V. (which we refer to as Grupo Tampico) and was one of the largest family-ownedCoca-Cola product bottlers in Mexico, as calculated by sales volume. This franchise territory operates in the states of Tamaulipas, San Luis Potosí and Veracruz, as well as in certain parts of the states of Hidalgo, Puebla and Querétaro, and sold 155.7 million unit cases of beverages in 2011. The aggregate enterprise value of this transaction was Ps. 9,300 million and a total of 63.5 million new Coca-Cola FEMSA Series L Shares were issued in connection with this transaction. Coca-Cola FEMSA began to consolidate the beverage division of Grupo Tampico in its financial statements as of October 2011.
In December 2011, Coca-Cola FEMSA merged with Corporación de los Ángeles, S.A. de C.V. (which we refer to as Grupo CIMSA), a Mexican family-owned bottler ofCoca-Cola trademark products. This franchise territory operates mainly in the states of Morelos and Mexico, as well as in certain parts of the states of Guerrero and Michoacán, and sold 154.8 million unit cases of beverages in 2011. The aggregate enterprise value at the announcement date of this transaction was Ps. 11,000 million. A total of 75.4 million new Coca-Cola FEMSA Series L Shares were issued in connection with the transaction, and Coca-Cola FEMSA began to consolidate Grupo CIMSA in its financial statements as of December 2011. As part of its merger with Grupo CIMSA, Coca-Cola FEMSA acquired a 13.2% equity interest in Promotora Industrial Azucarera, S.A. de C.V., one of Mexico’s leading sugar producers, which we refer to as Piasa.
In 2012, Coca-Cola FEMSA began the construction of a production plant in Minas Gerais, Brazil, which has required an investment of 400 million Brazilian reais (equivalent to approximately US$ 198 million). We expect that the construction will generate 800 direct and indirect jobs. It is anticipated that the new plant will be completed as of December 2013 and will begin operations in the first quarter of 2014. The plant will be located on a parcel of land 300,000 square meters in size, and it is expected that by 2015 the annual production capacity will be approximately 1.2 billion liters of sparkling beverages, representing an increase of approximately 47% as compared to the current installed capacity of Coca-Cola FEMSA’s plant in Belo Horizonte, Brazil. The new plant will produce all of Coca-Cola FEMSA’s existing brands and presentations ofCoca-Cola products.
In May 2012, Coca-Cola FEMSA closed its merger with Grupo Fomento Queretano, S.A.P.I. de C.V. (“Grupo Fomento Queretano”), one of the oldest family-owned beverage players in theCoca-Cola system in Mexico, with operations mainly in the state of Querétaro, as well as in parts of the states of Mexico, Hidalgo, and Guanajuato. Coca-Cola FEMSA sold approximately 74 million unit cases of beverages in this franchise territory during 2012. The aggregate enterprise value of this transaction was Ps. 6,600 million and a total of 45.1 million new Coca-Cola FEMSA series L shares were issued in connection with this transaction. Coca-Cola FEMSA began to consolidate Grupo Fomento Queretano in its financial statements as of May 2012. As part of the merger with Grupo Fomento Queretano, Coca-Cola FEMSA also acquired an additional 12.9% equity interest in Piasa.
In August 2012, Coca-Cola FEMSA acquired, through Jugos del Valle, an indirect participation in Santa Clara Mercantil de Pachuca, S.A. de C.V. (“Santa Clara”), an important producer of milk and dairy products in Mexico. Coca-Cola FEMSA currently owns an indirect participation of 23.8% in Santa Clara.
On September 24, 2012, FEMSA signed definitive agreements to sell its wholly owned subsidiary Industria Mexicana de Quimicos, S.A. de C.V. (“Quimiproductos”) to a Mexican subsidiary of Ecolab Inc. (NYSE: ECL). Quimiproductos manufactures and provides cleaning and sanitizing products and services related to food and beverage industrial processes, as well as water treatment. The transaction is consistent with FEMSA’s long-standing strategy to divest non-core businesses. Quimiproductos was sold on December 31, 2012, resulting in a gain of Ps. 871 million.
Recent Acquisitions
In November 2012, through FEMSA Comercio, we agreed to acquire a 75% stake in Farmacias YZA, a leading drugstore operator in Southeast Mexico, with the current shareholders staying as partners with the remaining 25%. Farmacias YZA, headquartered in Merida, Yucatan, operated 333 stores as of the date of the agreement. We believe we can contribute our significant expertise in the development of small-box retail formats to what is already a successful regional player in this industry. In turn, this transaction opens a new avenue for growth for FEMSA Comercio. The transaction is pending customary regulatory approvals and is expected to close in the second quarter of 2013.
In December 2012, Coca-Cola FEMSA reached an agreement with The Coca-Cola Company to acquire a 51% non-controlling majority stake of CCBPI for US$ 688.5 million in an all-cash transaction. Coca-Cola FEMSA closed this transaction on January 25, 2013. The implied enterprise value of 100% of CCPBI is US$ 1,350 million. Coca-Cola FEMSA will have an option to acquire all of the remaining 49% of the capital stock of CCBPI at any time during the seven years following the closing, at the same enterprise value adjusted for a carrying cost and certain other adjustments. Coca-Cola FEMSA will have a put option, exercisable six years after the initial closing, to sell its ownership in CCBPI back to The Coca-Cola Company at a price that will be calculated using the same EBITDA multiple used in the acquisition of the 51% stake of CCBPI, capped at the aggregate enterprise value for the amount acquired, adjusted for certain items. Coca-Cola FEMSA will be managing the day-to-day operations of the business. The Coca-Cola Company will have certain rights on the operational business plan. Given the terms of both the options agreement and Coca-Cola FEMSA’s shareholders agreement with The Coca-Cola Company, Coca-Cola FEMSA will not consolidate the results of CCBPI, and will recognize the results of CCBPI using the equity method. CCBPI sold approximately 531 million unit cases of beverages during 2012 and generated revenues of approximately US$ 1.1 billion.
In January 2013, Coca-Cola FEMSA entered into an agreement to merge Grupo Yoli, S.A. de C.V. (“Grupo Yoli”) into Coca-Cola FEMSA. Grupo Yoli operates mainly in the state of Guerrero, Mexico, as well as in parts of the state of Oaxaca, Mexico. The merger agreement was approved by both Coca-Cola FEMSA and Grupo Yoli’s boards of directors and is subject to the approval of the Comisión Federal de Competencia (the Mexican Antitrust Comission, or CFC) and the shareholders’ meetings of both companies. Grupo Yoli sold approximately 99 million unit cases in 2012. The aggregate enterprise value of this transaction was Ps. 8,806 million. Coca-Cola FEMSA will issue approximately 42.4 million new series “L” shares to the shareholders of Grupo Yoli once the transaction closes. As part of this transaction, Coca-Cola FEMSA will increase its participation in Piasa by 9.5%. Coca-Cola FEMSA expects to close this transaction in the second quarter of 2013.
We conduct our business through our principal sub-holding companies as shown in the following diagram and table:
Principal Sub-holding Companies—Ownership Structure
As of MayMarch 31, 20112013
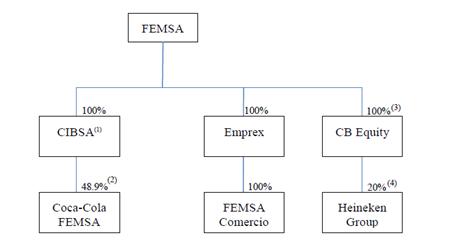
| (1) | Compañía Internacional de Bebidas, S.A. de C.V., which we refer to as CIBSA. |
| (2) | Percentage of issued and outstanding capital stock |
| (3) |
| Ownership in CB Equity held through various FEMSA subsidiaries. |
| Combined economic interest in Heineken N.V. and Heineken Holding N.V. |
The following tables presenttable presents an overview of our operations by reportable segment and by geographic region under Mexican FRS:area:
Operations by Segment—Overview
Year Ended December 31, 20102012 and % of growth vs. last year(1)
| Coca-Cola FEMSA | FEMSA Comercio | CB Equity(2) | Coca-Cola FEMSA | FEMSA Comercio | CB Equity(2) | |||||||||||||||||||||||||||||||||||||||||||
| (in millions of Mexican pesos, except for employees and percentages) | (in millions of Mexican pesos, except for employees and percentages) | |||||||||||||||||||||||||||||||||||||||||||||||
Total revenues | Ps.103,456 | 0.7 | % | Ps.62,259 | 16.3 | % | Ps. | — | N/a | Ps.147,739 | 20 | % | Ps.86,433 | 17 | % | Ps. | — | — | ||||||||||||||||||||||||||||||
Income from operations | 17,079 | 7.9 | 5,200 | 16.7 | (3 | ) | N/a | |||||||||||||||||||||||||||||||||||||||||
Gross Profit | 68,630 | 21 | % | 30,250 | 19 | % | — | — | ||||||||||||||||||||||||||||||||||||||||
Total assets | 114,061 | 3.1 | 23,677 | 20.2 | 67,010 | N/a | 166,103 | 17 | % | 31,092 | 17 | % | 79,268 | 4 | % | |||||||||||||||||||||||||||||||||
Employees | 68,449 | 1.5 | 73,101 | 20.0 | — | N/a | 73,395 | 5 | % | 91,943 | 10 | % | — | — | ||||||||||||||||||||||||||||||||||
Total Revenues Summary by Segment(1)
| Year Ended December 31, | ||||||||||||||||||||
| 2010 | 2009 | 2008 | Year Ended December 31, | |||||||||||||||||
| (in millions of Mexican pesos) | 2012 | 2011 | ||||||||||||||||||
Coca-Cola FEMSA | Ps. | 103,456 | Ps. | 102,767 | Ps. | 82,976 | Ps.147,739 | Ps.123,224 | ||||||||||||
FEMSA Comercio | 62,259 | 53,549 | 47,146 | 86,433 | 74,112 | |||||||||||||||
CB Equity(2) | — | N/a | N/a | — | — | |||||||||||||||
Other | 12,010 | 10,991 | 9,401 | 15,899 | 13,360 | |||||||||||||||
Consolidated total revenues(3) | Ps. | 169,702 | Ps. | 160,251 | Ps. | 133,808 | ||||||||||||||
Consolidated total revenues | Ps.238,309 | Ps.201,540 | ||||||||||||||||||
Total Revenues Summary by Geographic RegionArea(4)(3)
| Year Ended December 31, | ||||||||||||||
| 2010 | 2009 | 2008 | ||||||||||||
Mexico(3) | Ps. | 105,448 | Ps. | 94,819 | Ps. | 84,920 | ||||||||
Latincentro(5) | 17,492 | 16,211 | 12,853 | |||||||||||
Venezuela | 14,048 | 22,448 | 15,217 | |||||||||||
Mercosur(3)(6) | 33,409 | 27,604 | 21,227 | |||||||||||
Consolidated total revenues(3) | Ps. | 169,702 | Ps. | 160,251 | Ps. | 133,808 | ||||||||
| Year Ended December 31, | ||||||||
| 2012 | 2011 | |||||||
Mexico and Central America(4) | Ps.155,576 | Ps.129,716 | ||||||
South America(5) | 56,444 | 52,149 | ||||||
Venezuela | 26,800 | 20,173 | ||||||
Consolidated total revenues | 238,309 | 201,540 | ||||||
| (1) | The sum of the financial data for each of our segments and percentages with respect thereto differ from our consolidated financial information due to intercompany transactions, which are eliminated in consolidation, and certain assets and activities of FEMSA. |
| (2) | CB Equity holds Heineken N.V. and Heineken Holding N.V. shares. |
| (3) |
| The sum of the financial data for each geographic |
| Includes Colombia, Brazil and Argentina. Brazilian revenues were Ps. 30,930 million and Ps. 31,405 million for the years ended December 31, 2012 and 2011, respectively. |
The following table sets forth our significant subsidiaries as of April 30, 2011:February 28, 2013:
Name of Company | Jurisdiction of Establishment | Percentage Owned | ||||
| Mexico | 100.0 | % | |||
Coca-Cola FEMSA | Mexico | 48.9 | %(1) | |||
Grupo Industrial Emprex, S.A. de C.V.: | Mexico | 100.0 | % | |||
FEMSA Comercio | Mexico | 100.0 | % | |||
| ||||||
| ||||||
| ||||||
| ||||||
| ||||||
| ||||||
| ||||||
| ||||||
| United Kingdom | 100.0 | % | |||
| (1) | Percentage of capital stock. FEMSA, through CIBSA, owns 63.0% of the |
| (2) | Ownership in CB Equity held through various FEMSA subsidiaries. |
FEMSA is a leading company that participates in the non-alcoholic beverage industry through Coca-Cola FEMSA, the largest independentfranchise bottler of Coca-Cola products in the world in terms of sales volume;world; in the retail industry through FEMSA Comercio, operating OXXO, the largest and fastest-growing chain of conveniencesmall-format stores in Latin America,America; and in the beer industry, through its ownership of the second largest equity stake in Heineken, one of the world’s leading brewers with operations in over 70178 countries.
We understand the importance of connecting with our end consumers by interpreting their needs, and ultimately delivering the right products to them for the right occasions and the optimal value proposition. We strive to achieve this by developing brand value, expanding our significant distribution capabilities, and improving the efficiency of our operations while aiming to reach our full potential. We continue to improve our information gathering and processing systems in order to better know and understand what our consumers want and need, and we are improving our production and distribution by more efficiently leveraging our asset base.
We believe that the competencies that our businesses have developed can be replicated in other geographic regions. This underlying principle guided our consolidation efforts, which culminated in Coca-Cola FEMSA’s acquisition of Panamco onin May 6, 2003. The continental platform that this combination produced—encompassing a significant territorial expanse in Mexico and Central America, including some of the most populous metropolitan areas in Latin America—has provided us with opportunities to create value through both an improved ability to execute our strategies and the use of superior marketing tools. We have also increased our capabilities to operate and succeed in other geographic regions, by developing significant management and marketing tools to gain an understanding of local consumer needs and trends, as is the case with OXXO’s new Colombian operations. Going forward, we canintend to use those capabilities to continue our international expansion of both Coca-Cola FEMSA and OXXO.FEMSA Comercio, expanding both our geographic footprint and our presence in beverage categories and small box retail formats, as well as taking advantage of potential opportunities to leverage our skill set and key competencies.
Our ultimate objectives are achieving sustainable revenue growth, improving profitabilityobjective is to create economic, social and increasing the return on invested capital in each of our operations. We believe that by achieving these goals we will create sustainableenvironmental value for our shareholders.stakeholders—including our employees, our consumers, our shareholders and the enterprises and institutions within our society—now and into the future.
Overview
Coca-Cola FEMSA is the largest publicly listedfranchise bottler ofCoca-Colatrademark beverages in the world, calculated by sales volume in 2010.world. Coca-Cola FEMSA operates in territories in the following territories:countries:
Mexico – a substantial portion of central Mexico, (including Mexico Citythe southeast and the statesnortheast of Michoacán and Guanajuato) and southeast Mexico (including the Gulf region).
Central America – Guatemala (Guatemala City and surrounding areas), Nicaragua (nationwide), Costa Rica (nationwide) and Panama (nationwide).
Colombia – most of the country.
Venezuela – nationwide.
Argentina – Buenos Aires and surrounding areas.
Brazil – the area of greater São Paulo, Campinas, Santos, the state of Mato Grosso do Sul, part of the state of Minas Gerais and part of the state of Goiás.
Argentina – Buenos Aires and surrounding areas.
Coca-Cola FEMSAFEMSA’s company was organized on October 30, 1991 as asociedad anónima de capital variable (a variable capital stock corporation) under the laws of Mexico with a duration of 99 years. On December 5, 2006, as required by amendments to the Mexican Securities Market Law, Coca-Cola FEMSA became asociedad anónima bursátil de capital variable (a listed variable capital listed stock corporation). Coca-Cola FEMSA’s legal name is Coca-Cola FEMSA, S.A.B. de C.V. Coca-Cola FEMSA’s principal executive offices are located at Guillermo González CamarenaMario Pani No. 600,100, Col. Centro de Ciudad Santa Fé,Fe Cuajimalpa, Delegación Álvaro Obregón,Cuajimalpa, México, D.F., 01210,05348, México. Coca-Cola FEMSA’s telephone number at this location is (52-55) 5081-5100.1519-5000. Coca-Cola FEMSA’s website iswww.coca-colafemsa.com.www.coca-colafemsa.com.
The following is an overview of Coca-Cola FEMSA’s operations by reporting segment in 2010:2012.
Operations by Reporting Segment—Overview
Year Ended December 31, 20102012(1)
| Total Revenues | Percentage of Total Revenues | Income from Operations | Percentage of Income from Operations | |||||||
Mexico | 38,782 | 37.5% | 6,605 | 38.7% | ||||||
Latincentro(2) | 17,281 | 16.7% | 3,022 | 17.7% | ||||||
Venezuela | 14,033 | 13.6% | 2,444 | 14.3% | ||||||
Mercosur(3) | 33,360 | 32.2% | 5,008 | 29.3% | ||||||
Consolidated | 103,456 | 100% | 17,079 | 100% | ||||||
| Total Revenues | Percentage of Total Revenues | Gross Profit | Percentage of Gross Profit | |||||||||||||
Mexico and Central America(2) | 66,141 | 44.8 | % | 31,643 | 46.1 | % | ||||||||||
South America(3) (excluding Venezuela) | 54,821 | 37.1 | % | 23,667 | 34.5 | % | ||||||||||
Venezuela | 26,777 | 18.1 | % | 13,320 | 19.4 | % | ||||||||||
Consolidated | 147,739 | 100.0 | % | 68,630 | 100.0 | % | ||||||||||
| (1) | Expressed in millions of Mexican pesos, except for percentages. |
| (2) | Includes Mexico, Guatemala, Nicaragua, Costa Rica |
| (3) | Includes Colombia, Brazil and Argentina. |
Corporate History
In 1979, one of our subsidiaries acquired certain sparkling beverage bottlers that are now a part of itsCoca-Cola FEMSA’s company. At that time, the acquired bottlers had 13 Mexican distribution centers operating 701 distribution routes, and their production capacity was 83 million physical cases. In 1991, FEMSAwe transferred itsour ownership in the bottlers to FEMSA Refrescos, S.A. de C.V., the corporate predecessor to Coca-Cola FEMSA, S.A.B. de C.V.
In June 1993, a subsidiary of The Coca-Cola Company subscribed for 30% of Coca-Cola FEMSAFEMSA’s capital stock in the form of Series D Sharesshares for US$ 195 million. In September 1993, FEMSAwe sold Series L Sharesshares that represented 19% of Coca-Cola FEMSA’s capital stock to the public, and Coca-Cola FEMSA listed these shares on the Mexican Stock Exchange and, in the form of ADSs, on the New York Stock Exchange. In a series of transactions between 1994 and 1997, Coca-Cola FEMSA acquired territories in Argentina and additional territories in southern Mexico.
In May 2003, Coca-Cola FEMSA acquired Panamerican Beverages, or Panamco, and began producing and distributingCoca-ColaCoca-Cola trademark beverages in additional territories in the central and the gulf regions of Mexico and in Central America (Guatemala, Nicaragua, Costa Rica and Panama), Colombia, Venezuela and Brazil, along with bottled water, beer and other beverages in some of these territories. As a result of the acquisition, the interest of The Coca-Cola Company in the capital stock of Coca-Cola FEMSAFEMSA’s company increased from 30%30.0% to 39.6%.
During August 2004, Coca-Cola FEMSA conducted a rights offering to allow existing holders of itsCoca-Cola FEMSA’s Series L Sharesshares and ADSs to acquire newly-issuednewly issued Series L Sharesshares in the form of Series L Sharesshares and ADSs, respectively, at the same price per share at which ourselveswe and The Coca-Cola Company subscribed in connection with the Panamco acquisition. On March 8, 2006, its shareholders approved the non-cancellation of the 98,684,857 Series L Shares (equivalent to approximately 9.87 million ADSs, or over one-third of the outstanding Series L Shares) that were not subscribed for in the rights offering which are available for issuance at an issuance price of no less than US$ 2.216 per share or its equivalent in Mexican currency.
OnIn November 3, 2006, we acquired, through a subsidiary, 148,000,000 of Coca-Cola FEMSAFEMSA’s Series D Sharesshares from certain subsidiaries of The Coca-Cola Company representing 9.4% of the total outstanding voting shares and 8.0% of the total outstanding equity of Coca-Cola FEMSA, at a price of US$ 2.888 per share for an aggregate amount of US$ 427.4 million. With this purchase, we increased our ownership to 53.7% of Coca-Cola FEMSAFEMSA’s capital stock. Pursuant to Coca-Cola FEMSAFEMSA’s bylaws, the acquired shares were converted from Series D Sharesshares to Series A Shares.shares.
OnIn November 8, 2007, Administración, S.A.P.I. de C.V., or Administración, a Mexican company owned directly orand indirectly by Coca-Cola FEMSA and The Coca-Cola Company, acquired 100% of the shares of capital stock of Jugos del Valle, S.A.P.I. de C.V. The business of Jugos del Valle in the United States was acquired and sold by The Coca-Cola Company. In 2008, Coca-Cola FEMSA, The Coca-Cola Company and all Mexican and BrazilianCoca-Cola bottlers entered into a joint business for the Mexican and Brazilian operations, respectively, of Jugos del Valle. See “—The Company—Corporate Background.”Taking into account the participation held by Grupo Fomento Queretano, Coca-Cola FEMSA currently holds an interest of 25.1% in the Mexican joint business and approximately 19.7% in the Brazilian joint businesses. Jugos del Valle sells fruit juice-based beverages and fruit derivatives.
In December 2007 and May 2008, Coca-Cola FEMSA sold most of its proprietary brands to The Coca-Cola Company for a total amount of US$ 64 million. Both of these transactions were conducted on an arm’s length basis. These trademarksCompany. The proprietary brands are now being licensed back to Coca-Cola FEMSA by The Coca-Cola Company subjectpursuant to existingCoca-Cola FEMSA’s bottler agreements. The December 2007 transaction was valued at US$ 48 million and the May 2008 transaction was valued at US$ 16 million. Revenues from the sale of proprietary brands in which Coca-Cola FEMSA has a significant continuing involvement are deferred and amortized against the related costs of future sales over the estimated sales period.
OnIn May 30, 2008, Coca-Cola FEMSA entered into a transaction with The Coca-Cola Company to acquire its wholly-ownedwholly owned bottling territory,franchise Refrigerantes Minas Gerais, Ltda., or REMIL, located in the State of Minas Gerais in Brazil. During the second quarterBrazil, for a purchase price of 2008, Coca-Cola FEMSA closed this transaction for US$ 364.1 million. Coca-Cola FEMSA consolidatesbegan to consolidate REMIL in its financial statements as ofin June 1, 2008.
In July 2008, Coca-Cola FEMSA acquired the Agua de losDe Los Angeles S.A. de C.V. (Agua de los Angeles), abulk water business in the Valley of Mexico (Mexico City and surrounding areas) from Grupo Embotellador CIMSA, S.A. de C.V., at the time one of the Coca-Cola bottlersbottling franchises in Mexico, for a purchase price of US$ 18.3 million. The trademarks remain with The Coca-Cola Company. Coca-Cola FEMSA subsequently merged Agua de losDe Los Angeles into its jugbulk water business under theCiel brand.
In December 2008, Jugos del Valle sold its Brazilian operations, Holdinbrás, Ltd. to a subsidiary of The Coca-Cola Company, Coca-Cola FEMSA and other bottlers ofCoca-Cola trademark brands in Brazil. These operations were integrated into the Sucos Mais business, a joint venture with The Coca-Cola Company in Brazil.
In February 2009, Coca-Cola FEMSA completed the transaction with Bavaria, a subsidiary of SABMiller, to jointly acquireacquired with The Coca-Cola Company theBrisa bottled water business in Colombia (includingfrom Bavaria, S.A., a subsidiary of SABMiller plc. Coca-Cola FEMSA acquired the production assets and the distribution territory, and The Coca-Cola Company acquired theBrisa brand).brand. Coca-Cola FEMSA and The Coca-Cola Company equally shared in paying the purchase price of US$ 92 million was shared equally by Coca-Cola FEMSA and The Coca-Cola Company.million. Following a transition period, in June 2009, Coca-Cola FEMSA beganstarted to sell and distribute theBrisaportfolio of products in that country.Colombia.
In May 2009, Coca-Cola FEMSA entered into an agreement to developbegin selling theCrystal trademark water products in Brazil jointly with The Coca-Cola Company.
In August 2010, Coca-Cola FEMSA acquired from The Coca-Cola Company, along with other BrazilianCoca-Colabottlers, the business operations of theMatte Leaotea brand. As of March 31, 2013, Coca-Cola FEMSA currently hashad a 13.84%19.4% indirect interest in theMatte Leao business in Brazil.
OnIn March 28, 2011, Coca-Cola FEMSA togetheracquired with The Coca-Cola Company, acquired Grupothrough Compañía Panameña de Bebidas S.A.P.I. de C.V., Estrella Azul, (also known as Grupo Industrias Lacteas), a Panamanian conglomerate that participates in the dairy and juice-based beverage categories in Panama. Coca-Cola FEMSA will continue to develop this business jointly with The Coca-Cola Company.
In October 2011, Coca-Cola FEMSA closed its merger with the beverage division of Grupo Tampico, one of the largest family-ownedCoca-Cola bottlers calculated by sales volume in Mexico. This franchise territory operates in the states of Tamaulipas, San Luis Potosí, and Veracruz, as well as in parts of the states of Hidalgo, Puebla and Queretaro, and sold 155.7 million unit cases of beverages in 2011. The aggregate enterprise value of this transaction was Ps. 9,300 million and Coca-Cola FEMSA issued a total of 63.5 million new Series L shares in connection with this transaction. Coca-Cola FEMSA began to consolidate the beverage division of Grupo Tampico in its financial statements as of October 2011.
In December 2011, Coca-Cola FEMSA closed its merger with Grupo CIMSA, a Mexican family-ownedCoca-Cola bottler with operations mainly in the states of Morelos and Mexico, as well as in parts of the states of Guerrero and Michoacán. This franchise territory sold 154.8 million unit cases of beverages in 2011. The aggregate enterprise value of this transaction was Ps. 11,000 million and Coca-Cola FEMSA issued a total of 75.4 million new Series L shares in connection with this transaction. Coca-Cola FEMSA began to consolidate Grupo CIMSA in its financial statements as of December 2011. As part of Coca-Cola FEMSA’s merger with Grupo CIMSA, it also acquired a 13.2% equity interest in Piasa.
In May 2012, Coca-Cola FEMSA closed its merger with Grupo Fomento Queretano, one of the oldest family-owned beverage players in theCoca-Cola system in Mexico, with operations mainly in the state of Querétaro, as well as in parts of the states of Mexico, Hidalgo and Guanajuato. Coca-Cola FEMSA sold approximately 74 million unit cases of beverages in this franchise territory during 2012. The aggregate enterprise value of this transaction was Ps. 6,600 million and Coca-Cola FEMSA issued a total of 45.1 million new Series L shares in connection with this transaction. Coca-Cola FEMSA began to consolidate Grupo Fomento Queretano in its financial statements as of May 2012. As part of Coca-Cola FEMSA’s merger with Grupo Fomento Queretano it also acquired an additional 12.9% equity interest in Piasa.
In August 2012, Coca-Cola FEMSA acquired, through Jugos del Valle, an indirect participation in Santa Clara, an important producer of milk and dairy products in Mexico. Coca-Cola FEMSA currently owns an indirect participation of 23.8% in Santa Clara.
Recent Acquisitions
In December 2012, Coca-Cola FEMSA reached an agreement with The Coca-Cola Company to acquire a 51% non-controlling majority stake of CCBPI for US$ 688.5 million in an all-cash transaction. Coca-Cola FEMSA closed this transaction on January 25, 2013. The implied enterprise value of 100% of CCBPI is US$ 1,350 million. Coca-Cola FEMSA will have an option to acquire all of the remaining 49% of the capital stock of CCBPI at any time during the seven years following the closing, at the same enterprise value adjusted for a carrying cost and certain other adjustments. Coca-Cola FEMSA will have a put option, exercisable six years after the initial closing, to sell its ownership in CCBPI back to The Coca-Cola Company at a price that will be calculated using the same EBITDA multiple used in the acquisition of the 51% stake of CCBPI, capped at the aggregate enterprise value for the amount acquired, adjusted for certain items. Coca-Cola FEMSA will be managing the day-to-day operations of the business. The Coca-Cola Company will have certain rights on the operational business plan. Given the terms of both the options agreements and Coca-Cola FEMSA’s shareholders agreement with The Coca-Cola Company, Coca-Cola FEMSA will not consolidate the results of CCBPI. Coca-Cola FEMSA will recognize the results of CCBPI using the equity method. CCBPI sold approximately 531 million unit cases of beverages during 2012 and generated revenues of approximately US$ 1.1 billion.
In January 2013, Coca-Cola FEMSA entered into an agreement to merge Grupo Yoli into its company. Grupo Yoli operates mainly in the state of Guerrero, Mexico as well as in parts of the state of Oaxaca, Mexico. The merger agreement was approved by both Coca-Cola FEMSA’s and Grupo Yoli’s boards of directors and is subject to the approval of theComisión Federal de Competencia (the Mexican Antitrust Comission, or CFC) and the shareholders’ meetings of both companies. Grupo Yoli sold approximately 99 million unit cases in 2012. The aggregate enterprise value of this transaction was Ps. 8,806 million. Coca-Cola FEMSA will issue approximately 42.4 million new Series L shares to the shareholders of Grupo Yoli once the transaction closes. As part of this transaction, Coca-Cola FEMSA will increase its participation in Piasa by 9.5%. Coca-Cola FEMSA expects to close this transaction in the second quarter of 2013.
Capital Stock
As of MayMarch 31, 2011,2013, we indirectly owned Series A Shares equal to 53.7%48.9% of Coca-Cola FEMSAFEMSA’s capital stock (63.0% of its capital stockCoca-Cola FEMSA’s shares with full voting rights). As of MayMarch 31, 2011,2013, The Coca-Cola Company indirectly owned Series D Sharesshares equal to 31.6%28.7% of the capital stock of Coca-Cola FEMSA (37%FEMSA’s company (37.0% of Coca-Cola FEMSA’s capital stockshares with full voting rights). Series L Sharesshares with limited voting rights, which trade on the Mexican Stock Exchange and in the form of ADSs on the New York Stock Exchange, constitute the remaining 14.7%22.4% of Coca-Cola FEMSA’s capital stock.
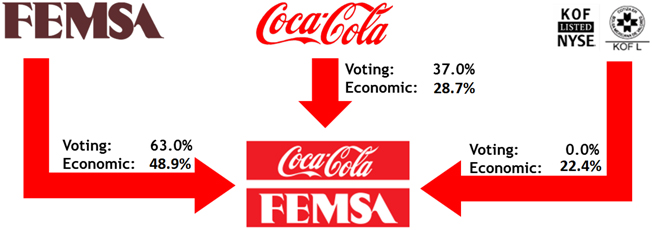
Business Strategy
In August 2011, Coca-Cola FEMSA is the largest bottlerrestructured its operations under two new divisions: (1) Mexico & Central America and (2) South America, creating a more flexible structure to execute its strategies and extend its track record of growth. Previously, Coca-Colatrademark beverages FEMSA managed its business under three divisions—Mexico, Latincentro and Mercosur. With this new business structure, Coca-Cola FEMSA aligned its business strategies more efficiently, ensuring a faster introduction of new products and categories, and a more rapid and effective design and deployment of commercial models.
Coca-Cola FEMSA operates with a large geographic footprint in Latin America, in terms of total sales volume in 2010, with operations in Mexico, Guatemala, Nicaragua, Costa Rica, Panama, Colombia, Venezuela, Argentina and Brazil. While its corporate headquarters are in Mexico City, it has established divisional headquarters in the following three regions:two divisions:
Mexico with headquartersand Central America (covering certain territories in Mexico City;
Latincentro (covering territories inand Guatemala, and all of Nicaragua, Costa Rica Panama, Colombia and Venezuela) with headquarters in San José, Costa Rica;Panama); and
MercosurSouth America (covering certain territories in Brazil and Argentina, and Brazil) with headquarters in São Paulo, Brazil.all of Colombia and Venezuela).
One of Coca-Cola FEMSA seeksFEMSA’s goals is to provide its shareholders with an attractive return on their investment by increasing its profitability. The key factors in achieving increased revenuesmaximize growth and profitability to create value for its shareholders. Coca-Cola FEMSA’s efforts to achieve this goal are based on: (1) transforming its commercial models to focus on its customers’ value potential and using a value-based segmentation approach to capture the industry’s value potential;potential, (2) implementing multi-segmentation strategies in its major markets to target distinct market clusters divided by consumption occasion, competitive intensity and socioeconomic levels; (3) implementing well-planned product, packaging and pricing strategies through different distribution channels; and (4) driving product innovation along its different product categoriescategories; (5) developing new businesses and (5)distribution channels, and (6) achieving the full operating potential of its commercial models and processes to drive operational efficiencies throughout its company. To achieve these goals, Coca-Cola FEMSA continuesintends to continue to focus its efforts on, among other initiatives, the following:
working with The Coca-Cola Company to develop a business model to continue exploring and participating in new lines of beverages, extending existing product lines and effectively advertising and marketing itsCoca-Cola FEMSA’s products;
developing and expanding itsCoca-Cola FEMSA’s still beverage portfolio through innovation, strategic acquisitions and by entering into joint venturesagreements to acquire companies with The Coca-Cola Company;
expanding itsCoca-Cola FEMSA’s bottled water strategy in conjunction with The Coca-Cola Company through innovation and selective acquisitions to maximize its profitability across itsCoca-Cola FEMSA’s market territories;
strengthening itsCoca-Cola FEMSA’s selling capabilities and go-to-market strategies, including pre-sale, conventional selling and hybrid routes, in order to get closer to itsCoca-Cola FEMSA’s clients and help them satisfy the beverage needs of consumers;
| • | implementing selective packaging strategies designed to increase consumer demand for |
replicating itsCoca-Cola FEMSA’s best practices throughout the whole value chain;
rationalizing and adapting itsCoca-Cola FEMSA’s organizational and asset structure in order to be in a better position to respond to a changing competitive environment;
committing to building a multi-cultural collaborative team, from top to bottom; and
broadening its geographicalCoca-Cola FEMSA’s geographic footprint through organic growth and strategic joint ventures, mergers and acquisitions.
Coca-Cola FEMSA seeks to increase per capita consumption of its products in the territories in which it operates. To that end, itsCoca-Cola FEMSA’s marketing teams continuously develop sales strategies tailored to the different characteristics of its various territories and distribution channels. Coca-Cola FEMSA continues to develop its product portfolio to better meet market demand and maintain its overall profitability. To stimulate and respond to consumer demand, itCoca-Cola FEMSA continues to introduce new categories, products and new presentations.See “—Product and Packaging Mix.” It also seeks to increase placement of coolers, including promotional displays, in retail outlets to showcase and promote its products. In addition, because itCoca-Cola FEMSA views its relationship with The Coca-Cola Company as integral to itsCoca-Cola FEMSA’s business, itCoca-Cola FEMSA uses market information systems and strategies developed with The Coca-Cola Company to improve itsCoca-Cola FEMSA’s business and marketing strategies.See “—Marketing—Channel Marketing.“Marketing.”
In each of its facilities,
Coca-Cola FEMSA also continuously seeks to increase productivity in its facilities through infrastructure and process reengineering for improved asset utilization. ItsCoca-Cola FEMSA’s capital expenditure program includes investments in production and distribution facilities, bottles, cases, coolers and information systems. Coca-Cola FEMSA believes that this program will allow it to maintain its capacity and flexibility to innovate and to respond to consumer demand for its non-alcoholic beverages.products.
Coca-Cola FEMSA focuses on management quality as a key element of its growth strategy and remains committed to fostering the development of quality management at all levels. Both we and The Coca-Cola Company and we provide Coca-Cola FEMSA with managerial experience. To build upon these skills, the board of directors has allocated a portion of Coca-Cola FEMSA also offersFEMSA’s operating budget to pay for management training programs designed to enhance its executives’ abilities and to provide a forum for exchanging experiences, know-how and talent among an increasing number of multinational executives from itsCoca-Cola FEMSA’s new and existing territories.
Sustainable development is an important pillara comprehensive part of Coca-Cola FEMSA’s strategy.strategic framework for business operation and growth. Coca-Cola FEMSA continually develops programs that ensurebases its efforts in its Corporate Values and Ethics. Coca-Cola FEMSA focuses on three core areas, (i) its people, by encouraging the creation of social and economic value by fostering the quality of lifedevelopment of its employees and their families; (ii) its communities, by promoting a culturedevelopment in the communities it serves, an attitude of health, self-care, adequate nutrition and well-being, supportingphysical activity, and evaluating the impact of its surrounding communitiesvalue chain; and minimizing(iii) its operations’ environmental impact.planet, by establishing guidelines that it believes will result in efficient use of natural resources to minimize the impact that its operations might have on the environment and create a broader awareness of caring for its environment.
Coca-Cola FEMSA’s Territories
The following map shows Coca-Cola FEMSA’s territories, giving estimates in each case of the population to which itCoca-Cola FEMSA offers products, the number of retailers of its sparklingCoca-Cola FEMSA’s beverages and the per capita consumption of its sparklingCoca-Cola FEMSA’s beverages as of December 31, 2010:2012:
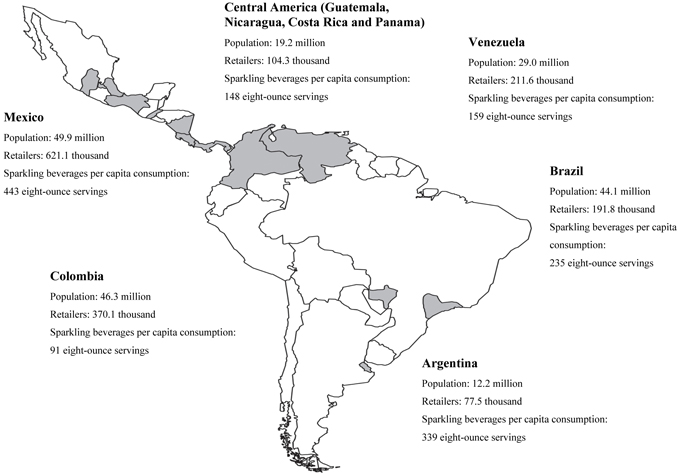
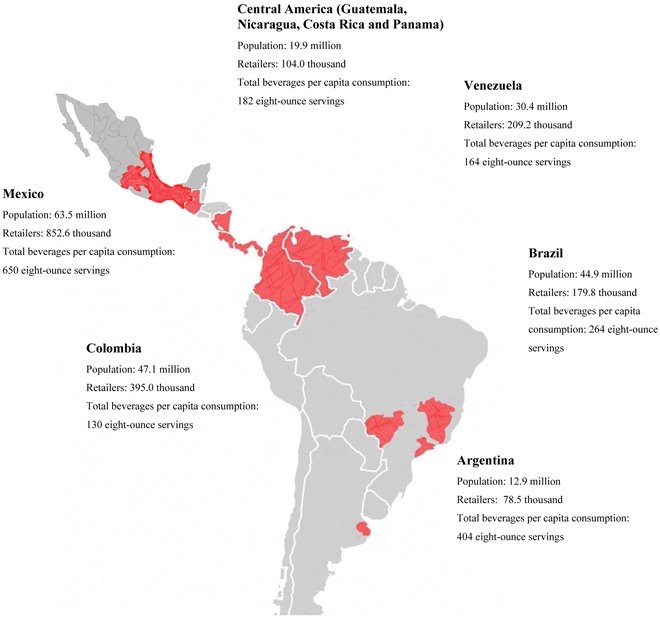
Per capita consumption data for a territory is determined by dividing sparklingtotal beverage sales volume within the territory (in bottles, cans, and fountain containers) by the estimated population within such territory, and is expressed on the basis of the number of eight-ounce servings of Coca-Cola FEMSAFEMSA’s products consumed annually per capita. In evaluating the development of local volume sales in itsCoca-Cola FEMSA’s territories and to determine product potential, Coca-Cola FEMSA and The Coca-Cola Company measure, among other factors, the per capita consumption of its sparklingall Coca-Cola FEMSA’s beverages.
Coca-Cola FEMSA’s Products
Coca-Cola FEMSA produces, markets, sells and distributesCoca-Cola trademark beverages, proprietary brands and brands licensed from us through 2010.beverages. TheCoca-Cola trademark beverages include: sparkling beverages (colas and flavored sparkling beverages); water;, waters, and still beverages (including juice drinks, ready-to-drinkcoffee, teas, milk, value-added dairy and isotonics)isotonic). InThe following table sets forth Coca-Cola FEMSA’s main brands as of December 2007 and May 2008, Coca-Cola FEMSA sold most of its proprietary brands to The Coca-Cola Company. See “Item 7. Major Shareholders and Related Party Transactions—Related Party Transactions—Business Transactions between Coca-Cola FEMSA and The Coca-Cola Company.”31, 2012:
Colas: | Mexico | Central America(1) | America(2) | Venezuela | ||||||||||||||
Coca-Cola | ü | ü | ü | |||||||||||||||
Coca-Cola Light | ü | ü | ü | |||||||||||||||
Coca-Cola Zero | ü | ü | ||||||||||||||||
Flavored sparkling beverages: | Mexico | Central America(1) | America(2) | Venezuela | ||||||||||||||
| ü | |||||||||||||||||
Canada Dry | ü | |||||||||||||||||
Chinotto | ü | |||||||||||||||||
Crush | ü | |||||||||||||||||
Escuis | ü | |||||||||||||||||
Fanta | ü | ü | ||||||||||||||||
Fresca | ü | |||||||||||||||||
Frescolita | ü | ü | ||||||||||||||||
Hit | ü | |||||||||||||||||
Kist | ü | |||||||||||||||||
Kuat | ü | |||||||||||||||||
Lift | ü | |||||||||||||||||
Mundet | ü | |||||||||||||||||
Quatro | ü | |||||||||||||||||
Schweppes | ü | ü | ü | |||||||||||||||
Simba | ü | |||||||||||||||||
Sprite | ü | ü | ||||||||||||||||
Victoria | ü | |||||||||||||||||
Yoli | ü | |||||||||||||||||
Water: | Mexico | Central America(1) | America(2) | Venezuela | ||||||||||||||
Alpina | ü | |||||||||||||||||
Aquarius(3) | ü | |||||||||||||||||
Bonaqua | ü | |||||||||||||||||
Brisa | ü | |||||||||||||||||
Ciel | ü | |||||||||||||||||
Crystal | ü | |||||||||||||||||
Dasani | ü | |||||||||||||||||
| ||||||||||||||||||
Manantial | ü | |||||||||||||||||
Nevada | ü | |||||||||||||||||
Other Categories: | Mexico | Central America(1) | America(2) | |||||||||||||||
| ||||||||||||||||||
Cepita | ü | |||||||||||||||||
Del Prado(4) | ü | |||||||||||||||||
| ||||||||||||||||||
| ü | |||||||||||||||||
| ü | ü | ||||||||||||||||
| ü | ü | ||||||||||||||||
Leche Santa Clara(5) | ü | |||||||||||||||||
| ü | ü | ü | |||||||||||||||
Matte Leao(8) | ü | |||||||||||||||||
Powerade(9) | ü | ü | ü | |||||||||||||||
Valle Frut(10) | ü | ü | ü | |||||||||||||||
| (1) | Includes Mexico, Guatemala, Nicaragua, Costa Rica |
| (2) | Includes Colombia, Brazil and |
| (3) |
| Flavored water. In Brazil, also flavored sparkling |
| (4) | Juice-based beverage in Central America |
| (5) |
| (6) |
| (7) | Juice-based beverage |
| (8) | Ready to drink |
| (9) | Isotonic |
| (10) | Orangeade. IncludesDel Valle Freshin Costa Rica, Nicaragua, Panama, Colombia and Venezuela |
Sales Overview
Coca-Cola FEMSA measures total sales volume in terms of unit cases. Unit case“Unit case” refers to 192 ounces of finished beverage product (24 eight-ounce servings) and, when applied to soda fountains, refers to the volume of syrup, powders and concentrate that is required to produce 192 ounces of finished beverage product.Theproduct. The following table illustrates itsCoca-Cola FEMSA’s historical sales volume for each of its territories.
| Sales Volume Year Ended December 31, | ||||||||||||
| 2010 | 2009 | 2008 | ||||||||||
| (millions of unit cases) | ||||||||||||
Mexico | 1,242.3 | 1,227.2 | 1,149.0 | |||||||||
Latincentro | ||||||||||||
Central America(1) | 137.0 | 135.8 | 132.6 | |||||||||
Colombia(2) | 244.3 | 232.2 | 197.9 | |||||||||
Venezuela | 211.0 | 225.2 | 206.7 | |||||||||
Mercosur | ||||||||||||
Brazil(3) | 475.6 | 424.1 | 370.6 | |||||||||
Argentina | 189.3 | 184.1 | 186.0 | |||||||||
Combined Volume | 2,499.5 | 2,428.6 | 2,242.8 | |||||||||
| Sales Volume Year Ended December 31, | ||||||||||||
| 2012 | 2011 | 2010 | ||||||||||
| (millions of unit cases) | ||||||||||||
Mexico and Central America | ||||||||||||
Mexico(1) | 1,720.3 | 1,366.5 | 1,242.3 | |||||||||
Central America(2) | 151.2 | 144.3 | 137.0 | |||||||||
South America (excluding Venezuela) | ||||||||||||
Colombia | 255.8 | 252.1 | 244.3 | |||||||||
Brazil(3) | 494.2 | 485.3 | 475.6 | |||||||||
Argentina | 217.0 | 210.7 | 189.3 | |||||||||
Venezuela | 207.7 | 189.8 | 211.0 | |||||||||
|
|
|
|
|
| |||||||
Consolidated Volume | 3,046.2 | 2,648.7 | 2,499.5 | |||||||||
| (1) | Includes results of Grupo Fomento Queretano from May 2012, Grupo CIMSA from December 2011 and Grupo Tampico from October 2011. |
| (2) | Includes Guatemala, Nicaragua, Costa Rica and Panama. |
| (3) | Excludes beer sales volume. |
Product and Packaging Mix
Out of the more than 100121 brands and line extensions of beverages sold and distributed bythat Coca-Cola FEMSA theirsells and distributes, Coca-Cola FEMSA’s most important brand,Coca-Cola, together with its line extensions,Coca-Cola Light andCoca-Cola Zero, accounted for 61.7%60.2% of total sales volume in 2010.2012. Coca-Cola FEMSA’s next largest brands,Ciel (a(a water brand from Mexico),Fanta(Mexico and its line extensions), SpriteFanta(and (and its line extensions) and,ValleFrut(and (and its line extensions), andSprite (and its line extensions) accounted for 9.9%12.8%, 5.8%4.7%, 2.6%, and 2.2%2.6%, respectively, of total sales volume in 2010.2012. Coca-Cola FEMSA uses the term line extensions to refer to the different flavors in which itCoca-Cola FEMSA offers its brands. Coca-Cola FEMSA produces, markets, sells and distributesCoca-Cola trademark beverages in each of its territories in containers authorized by The Coca-Cola Company, which consist of a variety of returnable and non-returnable presentations in the form of glass bottles, cans and plastic bottles mainly made of polyethylene therephthalate,terephthalate, which we refer to as PET.
Coca-Cola FEMSA uses the term presentation to refer to the packaging unit in which itCoca-Cola FEMSA sells its products. Presentation sizes for itsCoca-Cola FEMSA’sCoca-Cola trademark beverages range from a 6.5-ounce personal size to a 3-liter multiple serving size. For all of itsCoca-Cola FEMSA’s products excluding water, Coca-Cola FEMSA considers a multiple serving size as equal to, or larger than, 1.0 liter. In general, personal sizes have a higher price per unit case as compared to multiple serving sizes. Coca-Cola FEMSA offers both returnable and non-returnable presentations, which allow Coca-Cola FEMSAallows it to offer portfolio alternatives based on convenience and affordability to implement revenue management strategies and to target specific distribution channels and population segments in its territories. In addition, itCoca-Cola FEMSA sells someCoca-Cola trademark beverage syrups in containers designed for soda fountain use, which it referswe refer to as fountain. ItCoca-Cola FEMSA also sells bottled water products in bulk sizes, which refersrefer to presentations equal to or larger than 5 liters, thatwhich have a much lower average price per unit case than itsCoca-Cola FEMSA’s other beverage products.
The characteristics of Coca-Cola FEMSA’s territories are very diverse. Central Mexico and itsCoca-Cola FEMSA’s territories in Argentina are densely populated and have a large number of competing sparkling beveragesbeverage brands as compared
to the rest of itsCoca-Cola FEMSA’s territories. ItsCoca-Cola FEMSA’s territories in Brazil are densely populated but have lower per capita consumption of sparkling beverage products as compared to Mexico. Portions of southern Mexico, Central America and Colombia are large and mountainous areas with lower population density, lower per capita income and lower per capita consumption of sparkling beverages. In Venezuela, Coca-Cola FEMSA faces operational disruptions from time to time, which may have an effect on Coca-Cola FEMSA’sits volumes sold, and consequently, may result in lower per capita consumption.
The following discussion analyzes Coca-Cola FEMSA’s product and packaging mix by reporting segment. The volume data presented is for the years 2010, 20092012, 2011 and 2008.2010.
Mexico.Mexico and Central America.Coca-Cola FEMSA’s product portfolio consists ofCoca-Cola trademark beverages. In 2008, as part of itsCoca-Cola FEMSA’s efforts to strengthen its multi-category beverage portfolio, Coca-Cola FEMSA incorporated theJugos del Valle line of juice basedjuice-based beverages in Mexico and subsequently in Central America.Total beverage perIn 2012, Coca-Cola FEMSA launchedFUZETea in the division. Per capita consumption of itsCoca-Cola FEMSA’s beverage products in its Mexican territoriesMexico and Central America was 650 and 182 eight-ounce servings, respectively, in 2010 was 598 eight-ounce servings.2012.
The following table highlights historical sales volume and mix in Mexico and Central America for itsCoca-Cola FEMSA’s products:
| Year Ended December 31, | Year Ended December 31, | |||||||||||||||||||||||
| 2010 | 2009 | 2008 | 2012 | 2011 | 2010 | |||||||||||||||||||
| (millions of unit cases) | ||||||||||||||||||||||||
Total Sales Volume | ||||||||||||||||||||||||
Total | 1,242.3 | 1,227.2 | 1,149.0 | |||||||||||||||||||||
% Growth | 1.2 | % | 6.8 | % | 3.5 | % | ||||||||||||||||||
Total Sales Volume(1) | ||||||||||||||||||||||||
Total (millions of unit cases) | 1,871.5 | 1,510.8 | 1,379.3 | |||||||||||||||||||||
Growth (%) | 23.9 | 9.5 | 1.2 | |||||||||||||||||||||
| (in percentages) | (in percentages) | |||||||||||||||||||||||
Unit Case Volume Mix by Category | ||||||||||||||||||||||||
Sparkling beverages | 74.1 | % | 73.4 | % | 75.4 | % | 73.0 | 74.9 | 75.2 | |||||||||||||||
Water(1) | 20.6 | 21.5 | 21.6 | |||||||||||||||||||||
Water(2) | 21.4 | 19.7 | 19.4 | |||||||||||||||||||||
Still beverages | 5.3 | 5.1 | 3.0 | 5.6 | 5.4 | 5.4 | ||||||||||||||||||
|
|
| ||||||||||||||||||||||
Total | 100.0 | % | 100.0 | % | 100.0 | % | 100.0 | 100.0 | 100.0 | |||||||||||||||
|
|
| ||||||||||||||||||||||
| (1) | Includes results from the operations of Grupo Fomento Queretano from May 2012, Grupo CIMSA from December 2011 and Grupo Tampico from October 2011. |
| (2) | Includes bulk water volumes. |
In 2012, multiple serving presentations represented 66.2% of total sparkling beverages sales volume in Mexico, a 140 basis points decrease compared to 2011; and 56.1% of total sparkling beverages sales volume in Central America, a 40 basis points increase compared to 2011. Coca-Cola FEMSA’s strategy is to foster consumption of single serve presentations while maintaining multiple serving volumes. In 2012, returnable packaging, as a percentage of total sparkling beverage sales volume, accounted for 33.7% in Mexico, a 200 basis points increase compared to 2011; and 33.6% in Central America, a 190 basis points increase compared to 2011.
In 2012, Coca-Cola FEMSA’s sparkling beverages decreased as a percentage of its total sales volume from 74.9% in 2011 to 73.0% in 2012, mainly due to the integration of Grupo Tampico, Grupo CIMSA and Grupo Fomento Queretano in Mexico, which have a higher mix of bulk water in their portfolios.
In 2012, Coca-Cola FEMSA’s most popular sparkling beverage presentations in Mexico were the 2.5-liter returnable plastic bottle, the 3.0-liter non-returnable plastic bottle and the 0.6-liter non-returnable plastic bottle (the 20-ounce bottle that is also popular in the United States) and the 3.0-liter non-returnable plastic bottle, which together accounted for 54.3%51.2% of total sparkling beverage sales volume in Mexico in 2010. In 2010, multiple serving presentations represented 67.5% of total sparkling beverages sales volume in Mexico, a 3.2% increase compared to 2009. Coca-Cola FEMSA’s commercial strategy is to foster consumption in single serving presentations while maintaining multiple serving volumes. In 2010, its sparkling beverages increased as a percentage of its total sales volume from 73.4% in 2009 to 74.1% in 2010, mainly due to a decrease of the bulk water business and the strong preference of Coca-Cola FEMSA’s consumers for theCoca-Cola brand.Mexico.
Total sales volume reached 1,242.31,871.5 million unit cases in 2010,2012, an increase of 1.2%23.9% compared to 1,227.21,510.8 million unit cases in 2009. Sparkling beverage2011. The non-comparable effect of the integration of Grupo Tampico, Grupo CIMSA and Grupo Fomento Queretano in Mexico contributed 332.7 million unit cases in 2012 of which 62.5% were sparkling beverages, 5.1% bottled water, 27.9% bulk water and 4.5% still beverages. Excluding the integration of these territories, volume grew 1.9% to 1,538.8 million unit cases. Organically sparkling beverages sales volume increased 2.3%2.5% as compared to 2009.2011. The sparkling beveragebottled water category, and theincluding bulk water, decreased 2.6%. The still beverage category accounted for total incremental volumes during the year.increased 8.9%.
Latincentro (excludingSouth America (Excluding Venezuela).Coca-Cola FEMSA’s total sales volumeproduct portfolio in Latincentro consist predominantlySouth America consists mainly ofCoca-Cola trademark beverages. Per capita consumption of its beverage productsbeverages and theKaiser beer brands in ColombiaBrazil, which Coca-Cola FEMSA sells and Central America was 127 and 171 eight-ounce servings, respectively, in 2010.
The following table highlights historical total sales volume and sales volume mix in Latincentro:
| Year Ended December 31, | ||||||||||||
| 2010 | 2009 | 2008 | ||||||||||
| (millions of unit cases) | ||||||||||||
Total Sales Volume | ||||||||||||
Total | 381.3 | 368.0 | 330.5 | |||||||||
% Growth | 3.6 | % | 11.3 | % | 1.4 | % | ||||||
| (in percentages) | ||||||||||||
Unit Case Volume Mix by Category | ||||||||||||
Sparkling beverages | 76.9 | % | 79.3 | % | 87.9 | % | ||||||
Water(1) | 15.3 | % | 13.0 | % | 7.7 | % | ||||||
Still beverages | 7.8 | % | 7.7 | % | 4.4 | % | ||||||
Total | 100.0 | % | 100.0 | % | 100.0 | % | ||||||
In 2010, multiple serving presentations as a percentage of total sparkling beverage sales volume, represented 56.3% in Central America and 58.7% in Colombia.distributes. In 2008, as part of itsCoca-Cola FEMSA’s efforts to strengthen its multi-category beverage portfolio, Coca-Cola FEMSAit incorporated theJugos del Valle line of juice-based beverages.beverages in Colombia. This line of beverages was relaunched in Brazil in 2009 as well. The acquisition ofBrisain 2009 helped Coca-Cola FEMSA to become the leader, based oncalculated by sales volume, in the water market in Colombia.
Total sales volume was 381.3 million unit casesIn 2010, Coca-Cola FEMSA incorporated ready to drink beverages under theMatte Leao brand in 2010, increasing 3.6% comparedBrazil. During 2011, as part of Coca-Cola FEMSA’s continuous effort to 368.0 milliondevelop non-carbonated beverages, Coca-Cola FEMSA launchedCepita in 2009. Water sales, including bulk water, represented approximately 80%non-returnable polyethylene terephthalate (“PET”) bottles andHi-C, an orangeade, both in Argentina. Since 2009, as part of total incremental volume, mainly driven by the integration of theBrisa bottled water businessCoca-Cola FEMSA’s efforts to foster sparkling beverage per capita consumption in Colombia. Sparkling beverages, driven byBrazil, Coca-Cola FEMSA re-launched a 2.0-liter returnable plastic bottle for theCoca-Cola brand and still beverages, mainly driven by the Jugos del Valle line of products and Nestea, represented the balance. See “—The Company—Corporate Background.”
Venezuela.Coca-Cola FEMSA’s product portfolio in Venezuela consists ofCoca-Cola trademark beverages.introduced two single-serve 0.25-liter presentations. Per capita consumption of itsCoca-Cola FEMSA’s beverages in Venezuela during 2010Colombia, Brazil and Argentina was 175130, 264 and 404 eight-ounce servings.servings, respectively, in 2012.
The following table highlights historical total sales volume and sales volume mix in Venezuela:
| Year Ended December 31, | ||||||||||||
| 2010 | 2009 | 2008 | ||||||||||
| (millions of unit cases) | ||||||||||||
Total Sales Volume | ||||||||||||
Total | 211.0 | 225.2 | 206.7 | |||||||||
% Growth | (6.3 | %) | 9.0 | % | (1.1 | )% | ||||||
| (in percentages) | ||||||||||||
Unit Case Volume Mix by Category | ||||||||||||
Sparkling beverages | 91.2 | % | 91.7 | % | 91.3 | % | ||||||
Water(1) | 5.4 | % | 5.0 | % | 5.8 | % | ||||||
Still beverages | 3.4 | % | 3.3 | % | 2.9 | % | ||||||
Total | 100.0 | % | 100.0 | % | 100.0 | % | ||||||
Coca-Cola FEMSA implemented a product portfolio rationalization strategy that allows it to minimize the impact of certain operating disruptions that have been recurrent in the last several years. During 2010, Coca-Cola FEMSA faced a difficult economic environment that prevented it from growing sales volume for its products, and its sparkling beverage volume decreased by 6.8%.
In 2010, multiple serving presentations represented 77.6% of total sparkling beverages sales volume in Venezuela. Total sales volume was 211.0 million unit cases in 2010, a decrease of 6.3% compared to 225.2 million in 2009.
Mercosur (Brazil and Argentina).Coca-Cola FEMSA’s product portfolio in Mercosur consists mainly ofCoca-Cola trademark beverages and theKaiser beer brand in Brazil, which Coca-Cola FEMSA sells and distributes. In 2009, as part of its efforts to strengthen its multi-category beverage portfolio, Coca-Cola FEMSA incorporated the Jugos del Valle line of juice based beverages in Brazil. Per capita consumption of its beverages in Brazil and Argentina was 259 and 374 eight-ounce servings, respectively, in 2010.
The following table highlights historical total sales volume and sales volume mix in Mercosur,South America (excluding Venezuela), not including beer:
| Year Ended December 31, | ||||||||||||||||||||||||
| 2010 | 2009 | 2008 | Year Ended December 31, | |||||||||||||||||||||
| (millions of unit cases) | 2012 | 2011 | 2010 | |||||||||||||||||||||
Total Sales Volume | ||||||||||||||||||||||||
Total | 664.9 | 608.2 | 556.6 | |||||||||||||||||||||
% Growth | 9.3 | % | 9.3 | % | 17.1 | % | ||||||||||||||||||
Total (millions of unit cases) | 967.0 | 948.1 | 909.2 | |||||||||||||||||||||
Growth (%) | 2.0 | 4.3 | 11.2 | |||||||||||||||||||||
| (in percentages) | (in percentages) | |||||||||||||||||||||||
Unit Case Volume Mix by Category | ||||||||||||||||||||||||
Sparkling beverages | 90.8 | % | 92.0 | % | 93.3 | % | 84.9 | 85.9 | 85.5 | |||||||||||||||
Water(1) | 4.2 | 4.1 | 4.2 | 10.0 | 9.2 | 10.1 | ||||||||||||||||||
Still beverages | 5.0 | 3.9 | 2.5 | 5.1 | 4.9 | 4.4 | ||||||||||||||||||
|
|
| ||||||||||||||||||||||
Total | 100.0 | % | 100.0 | % | 100.0 | % | 100.0 | 100.0 | 100.0 | |||||||||||||||
|
|
| ||||||||||||||||||||||
| (1) | Includes bulk water volume. |
In 2008, in its continued effort to develop the still beverage category in Argentina, Coca-Cola FEMSA launched Aquarius, a flavored water. During 2010, as part of its efforts to foster sparkling beverage per capita consumption in Brazil, Coca-Cola FEMSA re-launched a 2.0 liter returnable plastic bottle for theCoca-Cola brand and introduced two single-serve 0.25-liter presentations. These presentations accounted for close to 50% of incremental volumes in Brazil.
Total sales volume was 664.9967.0 million unit cases in 2010,2012, an increase of 9.3%2.0% compared to 608.2948.1 million unit cases in 2009.2011. Growth in sparkling beverages, mainly driven by the sales of theCoca-Cola brand in bothArgentina and theFanta brand in Brazil and Argentina,Colombia, accounted for close to 80%the largest component of the growth during the year. GrowthCoca-Cola FEMSA’s growth in still beverages mainlywas primarily driven by theJugos del Valle line of products in Brazil and theAquariusCepita flavoredjuice brand in Argentina. The growth in sales volume of Coca-Cola FEMSA’s water portfolio, including bulk water, was driven mainly by theCrystal brand in Argentina, represented more than 15% incremental volumes. Brazil and theBrisa brand in Colombia.
In 2010,2012, returnable packaging, as a percentage of total sparkling beverage sales volume, accounted for 28.5%40.4% in Colombia, remaining flat as compared to 2011; 28.9% in Argentina, an increase of 110 basis points and 14.9%14.4% in Brazil.Brazil, a 150 basis points decrease compared to 2011. In 2010,2012, multiple serving presentations represented 71.1%62.9%, 72.5% and 84.6%85.2% of total sparkling beverages sales volume in Colombia, Brazil and Argentina, respectively.
Coca-Cola FEMSA sellscontinues to distribute and distributessell theKaiser brands of beer in its territories in Brazil. In January 2006, FEMSA Cerveza acquired a controlling stake in Cervejarias Kaiser. Since that time, Coca-Cola FEMSA has distributed the Kaiser beer portfolio in Coca-Cola FEMSA’sits Brazilian territories through the 20-year term, consistent with the arrangements between Coca-Cola FEMSA andin place since 2006 with Cervejarias Kaiser, in placea subsidiary of the Heineken Group prior to 2004.the acquisition of Cervejarias Kaiser by Cuauhtémoc Moctezuma Holding, S.A. de C.V., formerly known as FEMSA Cerveza. Beginning in the second quarter of 2005, Coca-Cola FEMSA ceased including beer that it distributes in Brazil in its reported sales volumes. On April 30, 2010, FEMSA announced the closing of the transaction pursuant to which FEMSA agreed to exchangewe exchanged 100% of itsour beer operations for a 20% economic interest in the Heineken Group. Group closed.
Venezuela. Coca-Cola FEMSA’s product portfolio in Venezuela consists ofCoca-Cola trademark beverages. Per capita consumption of Coca-Cola FEMSA’s beverages in Venezuela during 2012 was 164 eight-ounce servings. At the end of 2011, Coca-Cola FEMSA launchedDel Valle Fresh, an orangeade, in Venezuela, which contributed significantly to incremental volume growth in this country during 2012. During 2012, Coca-Cola FEMSA launched two new presentations for Coca-Cola FEMSA’s sparkling beverage portfolio: a 0.355-liter non-returnable PET presentation and a 1-liter non-returnable PET presentation.
The following table highlights historical total sales volume and sales volume mix in Venezuela:
| Year Ended December 31, | ||||||||||||
| 2012 | 2011 | 2010 | ||||||||||
Total Sales Volume | ||||||||||||
Total (millions of unit cases) | 207.7 | 189.8 | 211.0 | |||||||||
Growth (%) | 9.4 | (10.0 | ) | (6.3 | ) | |||||||
| (in percentages) | ||||||||||||
Unit Case Volume Mix by Category | ||||||||||||
Sparkling beverages | 87.9 | 91.7 | 91.3 | |||||||||
Water(1) | 5.6 | 5.4 | 6.5 | |||||||||
Still beverages | 6.5 | 2.9 | 2.2 | |||||||||
|
|
|
|
|
| |||||||
Total | 100.0 | 100.0 | 100.0 | |||||||||
|
|
|
|
|
| |||||||
| (1) | Includes bulk water volume. |
Coca-Cola FEMSA has agreed with Cervejarias Kaiserimplemented a product portfolio rationalization strategy that allows it to continue to distributeminimize the impact of certain operating disruptions that have been recurrent in Venezuela over the last several years. During 2011, Coca-Cola FEMSA faced a 26-day strike at one of its Venezuelan production and sell the Kaiser beer portfolio indistribution facilities and a difficult economic environment that prevented it from growing sales volume of Coca-Cola FEMSA’s Brazilian territories through the 20-year termproducts. As a result, Coca-Cola FEMSA’s sparkling beverage volume decreased by 9.6%.
In 2012, multiple serving presentations represented 79.9% of the arrangementtotal sparkling beverages sales volume in place priorVenezuela, a 140 basis points increase compared to 2004.2011. In 2012, returnable presentations represented 7.5% of total sparkling beverages sales volume in Venezuela, a 50 basis points decrease compared to 2011. Total sales volume was 207.7 million unit cases in 2012, an increase of 9.4% compared to 189.8 million unit cases in 2011.
Seasonality
Sales of Coca-Cola FEMSA’s products are seasonal, as itsCoca-Cola FEMSA’s sales levels generally increase during the summer months of each country and during the Christmas holiday season. In Mexico, Central America, Colombia and Venezuela, Coca-Cola FEMSA typically achieves its highest sales during the summer months of April through September as well as during the Christmas holidays in December. In Brazil and Argentina, and Brazil, itsCoca-Cola FEMSA’s highest sales levels occur during the summer months of October through March and the Christmas holidays in December.
Marketing
Coca-Cola FEMSA, in conjunction with The Coca-Cola Company, has developed a marketing strategy to promote the sale and consumption of itsCoca-Cola FEMSA’s products. Coca-Cola FEMSA relies extensively on advertising, sales promotions and retailer support programs to target the particular preferences of its soft drinkCoca-Cola FEMSA’s consumers. ItsCoca-Cola FEMSA’s consolidated marketing expenses in 2010,2012, net of contributions by The Coca-Cola Company, were Ps. 3,9793,681 million. The Coca-Cola Company contributed an additional Ps. 2,3863,018 million in 2010,2012, which mainly includes contributions for coolers, bottles and cases. Through the use of advanced information technology, itCoca-Cola FEMSA has collected customer and consumer information that allows it to tailor its marketing strategies to target different types of customers located in each of its territories and to meet the specific needs of the various markets it serves.
Retailer Support Programs. Support programs include providing retailers with point-of-sale display materials and consumer sales promotions, such as contests, sweepstakes and the giveaway of product samples.
Coolers. Cooler distribution among retailers is important for the visibility and consumption of Coca-Cola FEMSA’s products and to ensure that they are sold at the proper temperature.
Advertising. Coca-Cola FEMSA advertises in all major communications media. ItCoca-Cola FEMSA focuses its advertising efforts on increasing brand recognition by consumers and improving its customer relations. National advertising campaigns are designed and proposed by The Coca-Cola Company’s local affiliates, with Coca-Cola FEMSA’s input at the local or regional level.
Channel Marketing. In order to provide more dynamic and specialized marketing of itsCoca-Cola FEMSA’s products, Coca-Cola FEMSA’s strategy is to classify its markets and develop targeted efforts for each consumer segment or distribution channel. ItsCoca-Cola FEMSA’s principal channels are small retailers, “on-premise” consumption such as restaurants and bars, supermarkets and third-partythird party distributors. Presence in these channels entails a comprehensive and detailed analysis of the purchasing patterns and preferences of various groups of soft drinkbeverage consumers in each of the different types of locations or distribution channels. In response to this analysis, Coca-Cola FEMSA tailors its product, price, packaging and distribution strategies to meet the particular needs of and exploit the potential of each channel.
Multi-Segmentation. Coca-Cola FEMSA has been implementing a multi-segmentation strategy in the majority of its markets. This strategy consists onof the implementation of different product/price/package portfolios by market cluster or group. These clusters are defined based on consumption occasion, competitive intensity and socio-economic levels, rather than solely on the types of distribution channels.
Client Value Management.Management. Coca-Cola FEMSA has been transforming its commercial models to focus on its customers’ value potential using a value-based segmentation approach to capture the industry’s potential. Coca-Cola FEMSA has started the rollout of this new model in its Mexico, Brazil,Central America, Colombia and Central America operations.Brazil operations in 2009 and has covered close to 95% of its total volumes as of the end of 2012, including the later rollout in Argentina and, more recently, in Venezuela.
Coca-Cola FEMSA believes that the implementation of its channel marketing strategythese strategies described above also enables it to respond to competitive initiatives with channel-specific responses as opposed to market-wide responses. In addition, it allows Coca-Cola FEMSA to be more efficient in the way it goes to market and invests its marketing resources in those segments that could provide a higher return. Coca-Cola FEMSA’s channel marketing, segmentation and distribution activities are facilitated by its management information systems. Coca-Cola FEMSA has invested significantly in creating these systems, including in hand-held computers to support the gathering of product, consumer and delivery information for most of its sales routes throughout its territories.
Product Sales and Distribution
The following table provides an overview of itsCoca-Cola FEMSA’s distribution centers and the number of retailers to which itCoca-Cola FEMSA sells its products:
Product Distribution Summary
as of December 31, 20102012
| Mexico | Latincentro(1) | Venezuela | Mercosur(2) | Mexico and Central America(1) | South America(2) | Venezuela | ||||||||||||||||||||||
Distribution centers | 83 | 57 | 32 | 32 | 149 | 64 | 33 | |||||||||||||||||||||
Retailers(3) | 621,053 | 474,387 | 211,568 | 269,349 | 956,618 | 653,321 | 209,232 | |||||||||||||||||||||
| (1) | Includes Mexico, Guatemala, Nicaragua, Costa Rica |
| (2) | Includes Colombia, Brazil and Argentina. |
| (3) | Estimated. |
Coca-Cola FEMSA continuously evaluates its distribution model in order to fit with the local dynamics of the market placemarketplace and to analyze the way it goes to market, recognizing different service needs from its customers, while looking for a more efficient distribution model. As part of this strategy, Coca-Cola FEMSA is rolling out a variety of new distribution models throughout its territories looking for improvements in its distribution network.
Coca-Cola FEMSA uses several sales and distribution models depending on market, geographic conditions and the customer’s profile: (1) the pre-sale system, which separates the sales and delivery functions, permitting trucks to be loaded with the mix of products that retailers have previously ordered, thereby increasing both sales and distribution efficiency, (2) the conventional truck route system, in which the person in charge of the delivery makes immediate sales from inventory available on the truck, (3) a hybrid distribution system, where the same truck carries product available for immediate sale and product previously ordered through the pre-sale system, (4) the telemarketing system, which could be combined with pre-sales visits and (5) sales through third-party wholesalers of itsCoca-Cola FEMSA’s products.
As part of the pre-sale system, sales personnel also providesprovide merchandising services during retailer visits, which itCoca-Cola FEMSA believes enhance the shopper experience at the point of sale. Coca-Cola FEMSA believes that an adequate number of service visits to retailers and frequency of deliveries are essential elements in an effective selling and distribution system for its products.
Coca-Cola FEMSA’s distribution centers range from large warehousing facilities and re-loading centers to small deposit centers. In addition to its fleet of trucks, Coca-Cola FEMSA distributes its products in certain locations through a fleet of electric carts and hand-trucks in order to comply with local environmental and traffic regulations. In some of its territories, Coca-Cola FEMSA retains third parties to transport its finished products from the bottling plants to the distribution centers.
Mexico. Coca-Cola FEMSA contracts with one of our subsidiaries for the transportation of finished products to its distribution centers from its Mexican production facilities. See “Item 7. Major Shareholders and Related Party Transactions—Related Party Transactions.” From the distribution centers, itCoca-Cola FEMSA then distributes its finished products to retailers through its own fleet of trucks.
In Mexico, Coca-Cola FEMSA sells a majority of its beverages at small retail stores to consumers who may take the beverages for consumption at home or elsewhere. Coca-Cola FEMSA also sells products through the “on-premise” consumerconsumption segment, supermarkets and other locations. The “on-premise” consumerconsumption segment consists of sales through sidewalk stands, restaurants, bars and various types of dispensing machines as well as sales through point-of-sale programs in stadiums, concert halls, auditoriums and theaters.
BrazilBrazil.. In Brazil, Coca-Cola FEMSA sold 21.4%31.9% of its total sales volume through supermarkets in 2010.2012. Also in Brazil, the delivery of itsCoca-Cola FEMSA’s finished products to customers is completed by a third-party.third party, while Coca-Cola FEMSA maintains control over the selling function. In designated zones in Brazil,
third-party distributors purchase itsCoca-Cola FEMSA’s products at a discount from the wholesale price and resell the products to retailers.
Territories other than Mexico and Brazil. Coca-Cola FEMSA distributes its finished products to retailers through a combination of its own fleet of trucks and third-partythird party distributors. In most of itsCoca-Cola FEMSA’s territories, an important part of Coca-Cola FEMSA’sits total sales volume is sold through small retailers, with low supermarket penetration.
Competition
Although we believeCoca-Cola FEMSA believes that Coca-Cola FEMSA’sits products enjoy wider recognition and greater consumer loyalty than those of its principal competitors, the markets in the territories in which itCoca-Cola FEMSA operates are highly competitive. Coca-Cola FEMSA’s principal competitors are localPepsi bottlers and other bottlers and distributors of national and regional sparkling beverage brands. Coca-Cola FEMSA faces increased competition in many of its territories from producers of low price beverages, commonly referred to as “B brands.” A number of itsCoca-Cola FEMSA’s competitors in Central America, Venezuela, Brazil and Argentina offer beer in addition to sparkling beverages, still beverages, and water, which may enable them to achieve distribution efficiencies.
Price discounting and packaging have joined consumer sales promotions, customer service and non-price retailer incentives as the primary means of competition among bottlers. Coca-Cola FEMSA competes by seeking to offer products at an attractive price in the different segments in its markets and by building on the value of its brands. Coca-Cola FEMSA believes that the introduction of new products and new presentations has been a significant competitive technique that allows it to increase demand for its products, provide different options to consumers and increase new consumption opportunities. See “—Sales Overview.”
Mexico and Central America. Coca-Cola FEMSA’s principal competitors in Mexico are bottlers ofPepsi products, whose territories overlap but are not co-extensive with itsCoca-Cola FEMSA’s own. In central Mexico Coca-Cola FEMSA competes with a subsidiary of PepsiCo, Pepsi Beverage Company, the largest bottler of Pepsi products globally, and Grupo Embotelladores Unidos,Organización Cultiba, S.A.B. de C.V., a joint venture recently formed by Grupo Embotelladoras Unidas, S.A.B. de C.V., the formerPepsi bottler in central and southeast Mexico.Mexico, a subsidiary of PepsiCo, and Empresas Polar, S.A., the leading beer distributor andPepsi bottler in Venezuela. Coca-Cola FEMSA’s main competition in the juice category in Mexico is Grupo Jumex. In the water category, Coca-Cola FEMSA’s main competitor isBonafont, a water brand owned by Groupe Danone.Grupo Danone, is Coca-Cola FEMSA’s main competition. In addition, Coca-Cola FEMSA competes with Cadbury Schweppes in sparkling beverages and with other national and regional brands in itsCoca-Cola FEMSA’s Mexican territories, as well as low-price producers, such asBig Cola Ajemex, S.A. de C.V. and Consorcio AGA, S.A. de C.V., that offer various presentations of sparkling and still beverages.
In the countries that comprise Coca-Cola FEMSA’s Central America region, Coca-Cola FEMSA’s main competitors arePepsi andBig Cola bottlers. In Guatemala and Nicaragua, Coca-Cola FEMSA competes with a joint venture between AmBev and The Central American Bottler Corporation. In Costa Rica, Coca-Cola FEMSA’s principal competitor is Florida Bebidas S.A., subsidiary of Florida Ice and Farm Co. In Panama, Coca-Cola FEMSA’s main competitor is Cervecería Nacional, S.A. Coca-Cola FEMSA also faces competition from “B brands” offering multiple serving size presentations in some Central American countries.
LatincentroSouth America (excluding Venezuela). Coca-Cola FEMSA’s principal competitor in Colombia is Postobón, a well-established local bottler that sells flavored sparkling beverages (under the brandsPostobón andSpeed), some of which have a wide consumption preference, such asmanzana Postobón (apple Postobón), which is the second most popular flavor in the Colombian sparkling beverage industry in terms of total sales volume. Postobón also sellsPepsi products. Postobón is a vertically integrated producer, the owners of which hold other significant commercial interests in Colombia. ItCoca-Cola FEMSA also competes with low-price producers, such as the producers ofBig Cola, which principally offer multiple serving size presentations in the sparkling and still beverage industry.
In the countries that comprise Coca-Cola FEMSA’s Central America region, its main competitors are Pepsi andBig Cola bottlers. In Guatemala and Nicaragua, Coca-Cola FEMSA competes with a joint venture between AmBev and The Central American Bottler Corporation. In Costa Rica, its principal competitor is Florida Bebidas S.A., subsidiary of Florida Ice and Farm Co. S.A. In Panama, its main competitor is Cervecería Nacional, S.A. Coca-Cola FEMSA also faces competition from low-price producers offering multiple serving size presentations in some Central American countries.
Venezuela. In Venezuela, Coca-Cola FEMSA’s main competitor is Pepsi-Cola Venezuela, C.A., a joint venture formed between PepsiCo and Empresas Polar, S.A., the leading beer distributor in the country. Coca-Cola FEMSA also competes with the producers ofBig Cola in parts of the country.
Mercosur (Brazil and Argentina). In Brazil, Coca-Cola FEMSA competes against AmBev, a Brazilian company with a portfolio of brands that includesPepsi, local brands with flavors such as guaraná, and proprietary
beers. beer brands. Coca-Cola FEMSA also competes against “B brands” or “Tubainas,” which are small, local producers of low-cost flavored sparkling beverages in multiple serving presentations that represent a significant portion of the sparkling beverage market.
In Argentina, Coca-Cola FEMSA’s main competitor is Buenos Aires Embotellador S.A. (BAESA), aPepsi bottler, which is owned by Argentina’s principal brewery, Quilmes Industrial S.A., and indirectly controlled by AmBev. In addition, Coca-Cola FEMSA competes with a number of competitors offering generic, low-priced sparkling beverages as well as many other generic products and private label proprietary supermarket brands.
Venezuela. In Venezuela, Coca-Cola FEMSA’s main competitor is Pepsi-Cola Venezuela, C.A., a joint venture formed between PepsiCo and Empresas Polar, S.A., the leading beer distributor in the country. Coca-Cola FEMSA also competes with the producers ofBig Cola in part of the country.
Raw Materials
Pursuant to Coca-Cola FEMSA’s bottler agreements, Coca-Cola FEMSA is authorized to manufacture, sell and distributeCoca-Cola trademark beverages within specific geographic areas, and it is required to purchase in some of its territories for allCoca-Colatrademark beverages concentrate from companies designated by The Coca-Cola Company and artificial sweeteners from companies authorized by The Coca-Cola Company. Concentrate prices for sparkling beverages are determined as a percentage of the weighted average retail price in local currency net of applicable taxes. Although The Coca-Cola Company has the right to unilaterally set the price of concentrates, in practice this percentage has historically been set pursuant to periodic negotiations with The Coca-Cola Company.
In 2005, The Coca-Cola Company decided to gradually increase concentrate prices for sparkling beverages in Brazil and Mexico. These increases were fully implemented in Brazil in 2008 and in Mexico in 2009. As part of the cooperation framework that Coca-Cola FEMSA reached with The Coca-Cola Company at the end of 2006, The Coca-Cola Company will provideprovides a relevant portion of the funds derived from the concentrate increase for marketing support of Coca-Cola FEMSA’s sparkling and still beverages portfolio. See “Item 7. Major Shareholders and Related Party Transactions—Related Party Transactions—Business Transactions between Coca-Cola FEMSA and The Coca-Cola Company.”
In addition to concentrate, Coca-Cola FEMSA purchases sweeteners, carbon dioxide, and other raw materials, resin and ingotspreforms to make plastic bottles, finished plastic and glass bottles, cans, closurescaps and fountain containers, as well as other packaging materials and raw materials. Sweeteners are combined with water to produce basic syrup, which is added to the concentrate as the sweetener for most of Coca-Cola FEMSA’s beverages. Coca-Cola FEMSA’s bottler agreements provide that, with respect toCoca-Colatrademark beverages, these materials may be purchased only from suppliers approved by The Coca-Cola Company, including affiliates of FEMSA. Prices for packaging materials and high fructose corn syrupHFCS historically have been determined with reference to the U.S. dollar, although the local currency equivalent in a particular country is subject to price volatility in accordance with changes in exchange rates. Coca-Cola FEMSA’s most significant packaging raw material costs arise from the purchase of resin, plastic ingotspreforms to make plastic bottles and finished plastic bottles, which itCoca-Cola FEMSA obtains from international and local producers. The prices of these materials are tied to crude oil prices and global resin supply. In recent years Coca-Cola FEMSA has experienced volatility in the prices it pays for these materials. Across Coca-Cola FEMSA’s territories, its average price for resin in U.S. dollars increaseddecreased approximately 6.0% in 20102012 as compared to 2009.2011.
Under Coca-Cola FEMSA’s agreements with The Coca-Cola Company, it may use raw or refined sugar or high fructose corn syrupHFCS as sweeteners in its products. Sugar prices in all of the countries in which Coca-Cola FEMSA operates, other than Brazil, are subject to local regulations and other barriers to market entry that cause itCoca-Cola FEMSA to pay in excess of international market prices for sugar in certain countries. During 2010,In recent years, international sugar prices experienced significant volatility.
None of the materials or supplies that Coca-Cola FEMSA uses is presently in short supply, although the supply of specific materials could be adversely affected by strikes, weather conditions, governmental controls or national emergency situations.
Mexico and Central America. In Mexico, Coca-Cola FEMSA purchases its returnable plastic bottles from Graham Packaging México, S.A. de C.V., known as Graham, which is the exclusive supplier of returnable plastic bottles to The Coca-Cola Company and its bottlers in Mexico. In addition, Coca-Cola FEMSA mainly purchases resin from Indorama Ventures Polymers México, S. de R.L. de C.V. (formerly Arteva Specialties, S. de R.L. de C.V.), M. & G. Polímeros México, S.A. de C.V. and DAK Resinas Americas Mexico, S.A. de C.V., which
ALPLA México, S.A. de C.V., known as ALPLA, and Envases InnovativosUniversales de México, S.A.S.A.P.I. de C.V. manufacture into non-returnable plastic bottles for Coca-Cola FEMSA.
Coca-Cola FEMSA purchases all of its cans for its Mexican operations from Fábricas de Monterrey, S.A. de C.V., known as FAMOSA, a wholly-owned subsidiary of the Heineken Group, and Envases Universales de México, S.A.P.I. de C.V., through Promotora Mexicana de Embotelladoras, S.A. de C.V., known as PROMESA, a cooperative ofcompany owned by variousCoca-Cola bottlers, in which, as of March 31, 2013, Coca-Cola FEMSA indirectly holds a 15%30.0% equity interest. Coca-Cola FEMSA mainly purchases its glass bottles from EXCO Integral Services, S.A. de C.V. (formerly Compañía Vidriera, S.A. de C.V., known as VITRO, and Silices de Veracruz,or VITRO), FEVISA Industrial, S.A. de C.V., known as SIVESA,FEVISA, and Glass & Silice, S.A. de C.V., a wholly-owned subsidiary of Cuauhtémoc Moctezuma and the Heineken Group.
Coca-Cola FEMSA purchases sugar from, among other suppliers, Piasa and Beta San Miguel, S.A. de C.V., aboth sugar cane producerproducers in which, it currently holds a 2.6% equity interest.as of March 31, 2013, Coca-Cola FEMSA purchases high fructose corn syrup form CPIngredientes,held an approximate 26.1% and 2.7% equity interest, respectively. Coca-Cola FEMSA purchase HFCS from CP Ingredientes, S.A. de C.V. and Almidones Mexicanos, S.A. de C.V., known as Almex.
Imported sugar isSugar prices in Mexico are subject to import duties,local regulations and other barriers to market entry that cause Coca-Cola FEMSA to pay higher prices than those paid in the amount of which is set by the Mexican government.international market for sugar. As a result, sugar prices in Mexico are in excess ofhave no correlation to international market prices for sugar. In 2010,2012, sugar prices increaseddecreased approximately 15% as compared to 2009.
Latincentro (excluding Venezuela). In Colombia, Coca-Cola FEMSA uses sugar as a sweetener in most of its products, which it buys from several domestic sources. Coca-Cola FEMSA purchases plastic bottles from Amcor and Tapón Corona de Colombia S.A. Coca-Cola FEMSA purchases all its glass bottles from Peldar O-I and cans from Crown, both suppliers in which Grupo Ardila Lulle, owners of Coca-Cola FEMSA’s competitor, Postobón, owns an equity interest. Glass bottles and cans are available only from theses local sources.2011.
In Central America, the majority of Coca-Cola FEMSA’s raw materials such as glass and plastic bottles and cans are purchased from several local suppliers. Coca-Cola FEMSA purchases all of itsCoca-Cola FEMSA’s cans for its Central American operations from PROMESA. Sugar is available from suppliers that represent several local producers. Local sugar prices, in the countries that comprise the region, have increased mainly due to volatility in international prices. In Costa Rica, Coca-Cola FEMSA acquires plastic non-returnable bottles from ALPLA C.R. S.A., and in Nicaragua itCoca-Cola FEMSA acquires such plastic bottles from ALPLA Nicaragua, S.A.
VenezuelaSouth America (excluding Venezuela). In Colombia, Coca-Cola FEMSA uses sugar as a sweetener in most of its products, which Coca-Cola FEMSA buys from several domestic sources. In 2011, Coca-Cola FEMSA started to use HFCS as an alternative sweetener for its products. Coca-Cola FEMSA purchases HFCS from Archer Daniels Midland Company. Coca-Cola FEMSA purchases plastic bottles from Amcor and Tapón Corona de Colombia S.A. Coca-Cola FEMSA purchases all of its glass bottles from Peldar O-I and cans from Crown, both suppliers in which Grupo Ardila Lulle, owners of Coca-Cola FEMSA’s competitor Postobón, owns a minority equity interest. Glass bottles and cans are available only from these local sources.
Sugar is available in Brazil at local market prices, which historically have been similar to international prices. Sugar prices in Brazil in recent periods have been volatile, mainly due to the increased demand for sugar cane for production of alternative fuels, and Coca-Cola FEMSA’s average acquisition cost for sugar in 2012 decreased approximately 24% as compared to 2011. Coca-Cola FEMSA purchases glass bottles, plastic bottles and cans from several domestic and international suppliers.
In Argentina, Coca-Cola FEMSA mainly uses HFCS that it purchases from several different local suppliers as a sweetener in its products instead of sugar. Coca-Cola FEMSA purchases glass bottles, plastic cases and other raw materials from several domestic sources. Coca-Cola FEMSA purchases plastic preforms, as well as returnable plastic bottles, at competitive prices from Embotelladora del Atlántico S.A., a local subsidiary of Embotelladora Andina S.A., aCoca-Cola bottler with operations in Argentina, Chile and Brazil, and other local suppliers. Coca-Cola FEMSA also acquires plastic preforms from ALPLA Avellaneda S.A. and other suppliers.
Venezuela. In Venezuela, Coca-Cola FEMSA uses sugar as a sweetener in most of its products, which Coca-Cola FEMSA purchases mainly from the local market. Since 2003, from time to time, Coca-Cola FEMSA has experienced a sugar shortage due to lower domestic production and the inability of the predominant sugar importers to obtain permission to import in a timely manner. Sugar supply was affected in 2010 dueWhile sugar distribution to (1) shortages in local sugar cane production, (2) quotas imposedthe food and beverages industry and to retailers is controlled by the government, Coca-Cola FEMSA did not experience any disruptions during 2012 with respect to access to sufficient sugar suppliers that limit the quantity of sugar that can be delivered (3) a production decrease by certain sugar mills. Wesupply. However, we cannot assure you that Coca-Cola FEMSA will be ablenot experience disruptions in its ability to meet its sugar requirements in the long-term if sugar supply conditions do not improve.future should the Venezuelan government impose restrictive measures in the future. Coca-Cola FEMSA buys glass bottles from one local supplier, Productos de Vidrio, S.A., but there are alternative suppliers authorized by The Coca-Cola Company. Coca-Cola FEMSA acquires most of its plastic non-returnable bottles from ALPLA de Venezuela, S.A. and all of its aluminum cans from a local producer, Dominguez Continental, C.A.
Under current regulations promulgated by the Venezuelan authorities, Coca-Cola FEMSA’s ability to import some of its raw materials and other supplies used in itsCoca-Cola FEMSA’s production could be limited, and access to the official exchange rate for these items for Coca-Cola FEMSA and its suppliers, including, among others, resin, aluminum, plastic caps, distribution trucks and vehicles is only achieved by obtaining proper approvals from the relevant authorities.
Mercosur (Brazil and Argentina). Sugar is available in Brazil at local market prices, which historically have been similar to international prices. Sugar prices in Brazil in recent periods have been volatile, mainly due to the increased demand for sugar cane for production of alternative fuels, and Coca-Cola FEMSA’s average acquisition cost for sugar in 2010 increased. Coca-Cola FEMSA purchases glass bottles, plastic bottles and cans from several domestic and international suppliers.Comercio
Argentina. In Argentina,Overview and Background
FEMSA Comercio operates the largest chain of small-format stores in Mexico, measured in terms of number of stores as of December 31, 2012, under the trade name OXXO. As of December 31, 2012, FEMSA Comercio operated 10,601 OXXO stores, of which 10,567 are located throughout the country, with a particularly strong presence in the northern part of Mexico, and the remaining 34 stores are located in Bogotá, Colombia.
FEMSA Comercio, the largest single customer of Cuauhtémoc Moctezuma and of the Coca-Cola system in Mexico, was established by FEMSA mainly uses high fructose corn syrup that it purchases from several different local suppliers as a sweetener in its products instead of sugar. Coca-Cola FEMSA purchases glass
bottles, plastic cases1978 when two OXXO stores were opened in Monterrey, one store in Mexico City and other raw materials from several domestic sources. Coca-Cola FEMSA purchases pre-formed plastic ingots,another store in Guadalajara. The motivating factor behind FEMSA’s entrance into the retail industry was to enhance beer sales through company-owned retail outlets as well as returnable plastic bottles,to gather information on customer preferences. In 2012, a typical OXXO store carried 2,427 different store keeping units (SKUs) in 31 main product categories.
In recent years, FEMSA Comercio has represented an effective distribution channel for our beverage products, as well as a rapidly growing point of contact with our consumers. Based on the belief that location plays a major role in the long-term success of a retail operation such as a convenience store, as well as a role in our continually improving ability to accelerate and streamline the new-store development process, FEMSA Comercio has focused on a strategy of rapid, profitable growth. FEMSA Comercio opened 1,092, 1,135 and 1,040 net new OXXO stores in 2010, 2011 and 2012, respectively. The accelerated expansion in the number of stores yielded total revenue growth of 16.6% to reach Ps. 86,433 million in 2012. Same store sales increased an average of 7.7%, driven by increases in store traffic and average customer ticket. FEMSA Comercio performed approximately 3.0 billion transactions in 2012 compared to 2.7 billion transactions in 2011.
Business Strategy
A fundamental element of FEMSA Comercio’s business strategy is to utilize its position in the convenience store market to grow in a cost-effective and profitable manner. As a market leader in convenience store retailing, based on internal company surveys, management believes that FEMSA Comercio has an in-depth understanding of its markets and significant expertise in operating a national store chain. FEMSA Comercio intends to continue increasing its store base while capitalizing on the market knowledge gained at existing stores.
FEMSA Comercio has developed proprietary models to assist in identifying appropriate store locations, store formats and product categories. Its model utilizes location-specific demographic data and FEMSA Comercio’s experience in similar locations to fine tune the store format and product offerings to the target market. Market segmentation is becoming an important strategic tool, and it should increasingly allow FEMSA Comercio to improve the operating efficiency of each location and the overall profitability of the chain.
FEMSA Comercio has made and will continue to make significant investments in IT to improve its ability to capture customer information from its existing stores and to improve its overall operating performance. The majority of products carried through OXXO stores are bar-coded, and all OXXO stores are equipped with point-of-sale systems that are integrated into a company-wide computer network. To implement revenue management strategies, FEMSA Comercio created a division in charge of product category management for products, such as beverages, fast food and perishables, to enhance and better utilize its consumer information base and market intelligence capabilities. FEMSA Comercio utilizes a technology platform supported by an enterprise resource planning (ERP) system, as well as other technological solutions such as merchandising and point-of-sale systems, which will allow FEMSA Comercio to continue redesigning its key operating processes and enhance the usefulness of its market information going forward. In addition, FEMSA Comercio has expanded its operations by opening 11 new stores in Bogotá, Colombia in 2012.
FEMSA Comercio has adopted innovative promotional strategies in order to increase store traffic and sales. In particular, FEMSA Comercio sells high-frequency items such as beverages, snacks and cigarettes at competitive prices from Embotelladora del Atlántico S.A.,prices. FEMSA Comercio’s ability to implement this strategy profitably is partly attributable to the size of the OXXO chain, as FEMSA Comercio is able to work together with its suppliers to implement their revenue-management strategies through differentiated promotions. OXXO’s national and local marketing and promotional strategies are an effective revenue driver and a local subsidiarymeans of Embotelladora Andina S.A.,reaching new segments of the population while strengthening the OXXO brand. For example, the organization has refined its expertise in executing cross promotions (discounts on multi-packs or sales of complementary products at a Coca-Cola bottlerspecial price) and targeted promotions to attract new customer segments, such as housewives, by expanding the offerings in the grocery product category in certain stores. FEMSA Comercio is also strengthening its capabilities to increasingly provide consumers with operations in Argentina, Chile and Brazil,services such as utility bill payment and other local suppliers. Coca-Colabasic transactions.
Store Locations
With 10,567 OXXO stores in Mexico and 34 stores in Colombia as of December 31, 2012, FEMSA Comercio operates the largest small-format store chain in Latin America measured by number of stores. OXXO stores are concentrated in the northern part of Mexico, but also acquires pre-formed plastic ingots from ALPLA Avellaneda S.A. Coca-Cola FEMSA produces its own can presentations for distributionhave a growing presence in the rest of its products to customers in Buenos Aires.the country.
PlantsFEMSA Comercio
Regional Allocation of OXXO Stores in Mexico and FacilitiesLatin America(*)
Overas of December 31, 2012
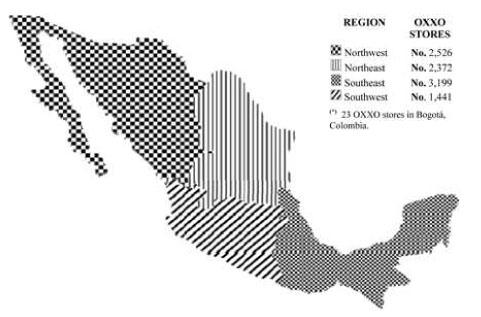
FEMSA Comercio has aggressively expanded its number of stores over the past several years. The average investment required to open a new store varies, depending on location and format and whether the store is opened in an existing retail location or requires construction of a new store. FEMSA Comercio is generally able to use supplier credit to fund the initial inventory of new stores.
Growth in Total OXXO Stores
| Year Ended December 31, | ||||||||||||||||||||
| 2012 | 2011 | 2010 | 2009 | 2008 | ||||||||||||||||
Total OXXO stores | 10,601 | 9,561 | 8,426 | 7,334 | 6,374 | |||||||||||||||
Store growth (% change over previous year) | 10.9 | % | 13.5 | % | 14.9 | % | 15.1 | % | 14.6 | % | ||||||||||
FEMSA Comercio currently expects to continue the growth trend established over the past several years Coca-Colaby emphasizing growth in areas of high economic potential in existing markets and by expanding in underserved and unexploited markets. Management believes that the southeast part of Mexico is particularly underserved by the convenience store industry.
The identification of locations and pre-opening planning in order to optimize the results of new stores are important elements in FEMSA made significant capital investmentsComercio’s growth plan. FEMSA Comercio continuously reviews store performance against certain operating and financial benchmarks to modernizeoptimize the overall performance of the chain. Stores unable to maintain benchmark standards are generally closed. Between December 31, 2008 and 2012, the total number of OXXO stores increased by 4,227, which resulted from the opening of 4,328 new stores and the closing of 101 existing stores.
Competition
FEMSA Comercio, mainly through OXXO, competes in the overall retail market, which we believe is highly competitive. OXXO stores face competition from small-format stores like 7-Eleven, Super Extra, Super City, Círculo K stores and other numerous chains of retailers across Mexico, from other regional small-format retailers to small informal neighborhood stores. OXXO competes both for consumers and for new locations for stores and the managers to operate those stores. FEMSA Comercio operates in the 32 Mexican states and has much broader geographical coverage than any of its facilitiescompetitors in Mexico.
Market and improve operating efficiencyStore Characteristics
Market Characteristics
FEMSA Comercio is placing increased emphasis on market segmentation and productivity, including:differentiation of store formats to more appropriately serve the needs of customers on a location-by-location basis. The principal segments include residential neighborhoods, commercial and office locations and stores near schools and universities, along with other types of specialized locations.
Approximately 64% of OXXO’s customers are between the ages of 15 and 35. FEMSA Comercio also segments the market according to demographic criteria, including income level.
Store Characteristics
The average size of an OXXO store is approximately 103 square meters of selling space, excluding space dedicated to refrigeration, storage or parking. The average constructed area of a store is approximately 186 square meters and, when parking areas are included, the average store size is approximately 429 square meters.
FEMSA Comercio—Operating Indicators
| Year Ended December 31, | ||||||||||||||||||||
| 2012 | 2011 | 2010 | 2009 | 2008 | ||||||||||||||||
| (percentage increase compared to previous year) | ||||||||||||||||||||
Total FEMSA Comercio revenues | 16.6 | % | 19.0 | % | 16.3 | % | 13.6 | % | 12.0 | % | ||||||||||
OXXO same-store sales(1) | 7.7 | % | 9.2 | % | 5.2 | % | 1.3 | % | 0.4 | % | ||||||||||
increasing
| (1) | Same-store sales growth is calculated by comparing the sales of stores for each year that have been in operation for more than 12 months with the sales of those same stores during the previous year. |
Beer, cigarettes, soft drinks and other beverages, snacks and cellular telephone air-time represent the annual capacitymain product categories for OXXO stores. FEMSA Comercio has a distribution agreement with Cuauhtémoc Moctezuma (which is now part of its bottling plantsthe Heineken Group). As a result of this agreement, OXXO stores only carry beer brands produced and distributed by installing new production lines;
installing clarification facilitiesCuauhtémoc Moctezuma. OXXO stores will continue to process different typesbenefit from the existing relationship under which Cuauhtémoc Moctezuma will continue to be the exclusive supplier of sweeteners;beer to OXXO until June 2020.
Approximately 65% of OXXO stores are operated by independent managers responsible for all aspects of store operations. The managers are commission agents and are not employees of FEMSA Comercio. Each store manager is the legal employer of the store’s staff, which typically numbers six people per store. FEMSA Comercio continually invests in on-site operating personnel, with the objective of promoting loyalty, customer service and low personnel turnover in the stores.
installing plastic bottle-blowing equipment;
Advertising and Promotion
modifying equipmentFEMSA Comercio’s marketing efforts include both specific product promotions and image advertising campaigns. These strategies seek to increase flexibilitystore traffic and sales, and to produce different presentations, including faster sanitationreinforce the OXXO name and changeover timesmarket position.
FEMSA Comercio manages its advertising on production lines;three levels depending on the nature and scope of the specific campaign: local or store-specific, regional and national. Store-specific and regional campaigns are closely monitored to ensure consistency with the overall corporate image of OXXO stores and to avoid conflicts with national campaigns. FEMSA Comercio primarily uses point of purchase materials, flyers, handbills and print and radio media for promotional campaigns, although television is used occasionally for the introduction of new products and services. The OXXO chain’s image and brand name are presented consistently across all stores, irrespective of location.
Inventory and Purchasing
closing obsolete production facilities.
FEMSA Comercio has placed considerable emphasis on improving operating performance. As part of December 31, 2010, Coca-Colathese efforts, FEMSA owned thirty bottling plants company-wide. By country, itComercio continues to invest in extensive information management systems to improve inventory management. Electronic data collection has nine bottling facilitiesenabled FEMSA Comercio to reduce average inventory levels. Inventory replenishment decisions are carried out on a store-by-store basis.
Management believes that the OXXO chain’s scale of operations provides FEMSA Comercio with a competitive advantage in its ability to realize strategic alliances with suppliers. General category offerings are determined on a national level, although purchasing decisions are implemented on a local, regional or national level, depending on the nature of the product category. Given the fragmented nature of the retail industry in Mexico five in Central America, sixgeneral, Mexican producers of beer, soft drinks, bread, dairy products, snacks, cigarettes and other high-frequency products have established proprietary distribution systems with extensive direct distribution routes. As a result, approximately 51% of the OXXO chain’s total sales consist of products that are delivered directly to the stores by suppliers. Other products with longer shelf lives are distributed to stores by FEMSA Comercio’s distribution system, which includes 14 regional warehouses located in Colombia, four in Venezuela, four in BrazilMonterrey, Guadalajara, Mexicali, Mérida, León, Obregón, Puebla, Chihuahua, Reynosa, Tijuana, Toluca, Villahermosa and two in Argentina.Mexico City. The distribution centers operate a fleet of approximately 746 trucks that make deliveries to each store approximately twice per week.
Seasonality
OXXO stores experience periods of high demand in December, as a result of the holidays, and in July and August, as a result of increased consumption of beer and soft drinks during the hot summer months. The months of November and February are generally the weakest sales months for OXXO stores. In general, colder weather during these months reduces store traffic and consumption of cold beverages.
Other Stores
FEMSA Comercio also operates other small format stores, which include soft discount stores with a focus on perishables, liquor stores and smaller convenience stores.
Equity Method Investment in the Heineken Group
As of December 31, 2012, FEMSA owned a non-controlling interest in the Heineken Group, one of the world’s leading brewers. As of December 31, 2012, our 20% economic interest in the Heineken Group was comprised of 43,018,320 shares of Heineken Holding N.V. and 72,182,203 shares of Heineken N.V. For 2012, FEMSA recognized equity income of Ps. 8,311 regarding its 20% economic interest in the Heineken Group; see note 10 to our audited consolidated financial statements.
As described above, FEMSA Comercio has a distribution agreement with Cuauhtémoc Moctezuma (which is now a part of the Heineken Group) pursuant to which OXXO stores only carry beer brands produced and distributed by Cuauhtémoc Moctezuma. OXXO stores will continue to benefit from the existing relationship under which Cuauhtémoc Moctezuma will continue to be the exclusive supplier of beer to OXXO until June 2020. As of April 30, 2010, Coca-Cola FEMSA operated 204 distribution centers, approximately 40%has agreed with Cervejarias Kaiser (also now part of the Heineken Group) to continue to distribute and sell theKaiser beer portfolio in Coca-Cola FEMSA’s Brazilian territories for a 20-year term beginning in 2003, consistent with the arrangement already in place. In addition, our logistic services, corporate and shared services subsidiary continues to provide certain services to Cuauhtémoc Moctezuma and its subsidiaries.
Our other business consists of the following smaller operations that support our core operations:
Our logistics services subsidiary provides a broad range of logistics and vehicle maintenance services to Coca-Cola FEMSA, FEMSA Comercio and third-party clients in the beverages, consumer products and retail industries. It has operations in Mexico, Brazil, Colombia, Panama, Costa Rica and Nicaragua.
Our refrigeration business produces vertical and horizontal commercial refrigerators for the soft drink, beer and food industries, with an annual capacity of 475,416 units at December 31, 2012. In 2012, this business sold 389,132 refrigeration units, 36.0% of which were in its Mexican territories.sold to Coca-Cola FEMSA, and the remainder of which were sold to third parties.
Our corporate services subsidiary employs all of our corporate staff, including the personnel managing the areas of finance, corporate accounting, taxation, legal, financial and strategic planning, human resources, corporate affairs and internal audit. Through this subsidiary, we direct, control, supervise and review the operations of our sub-holding companies. As of December 31, 2012, FEMSA Comercio and our other business subsidiaries pay management fees for the services provided to them. In addition, Coca-Cola FEMSA has entered into a services agreement pursuant to which it pays for specific services. As part of the Heineken transaction, the corporate and shared services subsidiaries continue to provide some limited corporate services and shared services to subsidiaries of Cuauhtémoc Moctezuma (now part of the Heineken Group), for which such companies continue to pay.
Until December 31, 2010, our labeling and flexible packaging business was our wholly-owned subsidiary. In 2010, this business sold 14% of its label sales volume to Cuauhtémoc Moctezuma, 20% to Coca-Cola FEMSA and 66% to third parties. Our labeling and flexible packaging business was sold on December 31, 2010.
Until December 31, 2012, Quimiproductos, our manufacturer and supplier of cleaning and sanitizing products and services related to food and beverage industrial processes, as well as of water treatment, was our wholly-owned subsidiary. In 2012, this business sold 38% of its products to Cuauhtémoc Moctezuma, 27% to Coca-Cola FEMSA and 35% to third parties. Our Quimiproductos business was sold on December 31, 2012.
Until September 23, 2010 we owned the Mundet brands in Mexico, which were disposed through the sale to The Coca-Cola Company of Promotora de Marcas Nacionales, S. de R.L. de C.V., which was a wholly owned subsidiary of FEMSA.
Description of Property, Plant and Equipment
As of December 31, 2012, we owned all of our manufacturing facilities and substantially all of our warehouses and distribution centers. Our properties primarily consisted of production and distribution facilities for our soft drink operations and office space. In addition, FEMSA Comercio owns more than 88%approximately 10.6% of these distribution centers and leases the remainder. See “—Product Sales and Distribution.”OXXO store locations, while the other stores are located in properties that are rented under long-term lease arrangements with third parties.
The table below summarizes by country the principal use, installed capacity and percentage utilization of Coca-Cola FEMSA’s production facilities:
Bottling Facility Summary
As of December 31, 2010Growth in Total OXXO Stores
Country | Installed Capacity (thousands of unit cases) | % Utilization(1) | ||||||
Mexico | 1,651,786 | 73 | % | |||||
Guatemala | 35,909 | 72 | % | |||||
Nicaragua | 63,674 | 55 | % | |||||
Costa Rica | 85,194 | 53 | % | |||||
Panama | 41,428 | 60 | % | |||||
Colombia | 484,344 | 50 | % | |||||
Venezuela | 266,859 | 76 | % | |||||
Brazil | 630,276 | 69 | % | |||||
Argentina | 277,992 | 67 | % | |||||
| Year Ended December 31, | ||||||||||||||||||||
| 2012 | 2011 | 2010 | 2009 | 2008 | ||||||||||||||||
Total OXXO stores | 10,601 | 9,561 | 8,426 | 7,334 | 6,374 | |||||||||||||||
Store growth (% change over previous year) | 10.9 | % | 13.5 | % | 14.9 | % | 15.1 | % | 14.6 | % | ||||||||||
FEMSA Comercio currently expects to continue the growth trend established over the past several years by emphasizing growth in areas of high economic potential in existing markets and by expanding in underserved and unexploited markets. Management believes that the southeast part of Mexico is particularly underserved by the convenience store industry.
The identification of locations and pre-opening planning in order to optimize the results of new stores are important elements in FEMSA Comercio’s growth plan. FEMSA Comercio continuously reviews store performance against certain operating and financial benchmarks to optimize the overall performance of the chain. Stores unable to maintain benchmark standards are generally closed. Between December 31, 2008 and 2012, the total number of OXXO stores increased by 4,227, which resulted from the opening of 4,328 new stores and the closing of 101 existing stores.
Competition
FEMSA Comercio, mainly through OXXO, competes in the overall retail market, which we believe is highly competitive. OXXO stores face competition from small-format stores like 7-Eleven, Super Extra, Super City, Círculo K stores and other numerous chains of retailers across Mexico, from other regional small-format retailers to small informal neighborhood stores. OXXO competes both for consumers and for new locations for stores and the managers to operate those stores. FEMSA Comercio operates in the 32 Mexican states and has much broader geographical coverage than any of its competitors in Mexico.
Market and Store Characteristics
Market Characteristics
FEMSA Comercio is placing increased emphasis on market segmentation and differentiation of store formats to more appropriately serve the needs of customers on a location-by-location basis. The principal segments include residential neighborhoods, commercial and office locations and stores near schools and universities, along with other types of specialized locations.
Approximately 64% of OXXO’s customers are between the ages of 15 and 35. FEMSA Comercio also segments the market according to demographic criteria, including income level.
Store Characteristics
The average size of an OXXO store is approximately 103 square meters of selling space, excluding space dedicated to refrigeration, storage or parking. The average constructed area of a store is approximately 186 square meters and, when parking areas are included, the average store size is approximately 429 square meters.
FEMSA Comercio—Operating Indicators
| Year Ended December 31, | ||||||||||||||||||||
| 2012 | 2011 | 2010 | 2009 | 2008 | ||||||||||||||||
| (percentage increase compared to previous year) | ||||||||||||||||||||
Total FEMSA Comercio revenues | 16.6 | % | 19.0 | % | 16.3 | % | 13.6 | % | 12.0 | % | ||||||||||
OXXO same-store sales(1) | 7.7 | % | 9.2 | % | 5.2 | % | 1.3 | % | 0.4 | % | ||||||||||
| (1) |
OverviewBeer, cigarettes, soft drinks and Background
FEMSA Comercio operatesother beverages, snacks and cellular telephone air-time represent the largest chain of convenience stores in Mexico, measured in terms of number of stores as of December 31, 2010, under the trade name OXXO. As of December 31, 2010, FEMSA Comercio operated 8,426 OXXO stores, of which 8,409 are located throughout the country, with a particularly strong presence in the northern part of Mexico, and the remaining 17 stores are located in Bogotá, Colombia.
FEMSA Comercio, the largest single customer of Cuauhtémoc Moctezuma and of the Coca-Cola system in Mexico, was established by FEMSA in 1978 when two OXXO stores were opened in Monterrey, one store in Mexico City and another store in Guadalajara. The motivating factor behind FEMSA’s entrance into the retail industry was to enhance beer sales through company-owned retail outlets as well as to gather information on customer preferences. In 2010, sales of beer through OXXO represented 16.1% of FEMSA Comercio’s revenues. In 2010, a typical OXXO store carried 2,059 different store keeping units (SKUs) in 31 main product categories.
In recent years,categories for OXXO stores. FEMSA Comercio has gained importance as an effectivea distribution channel for our beverage products, as well asagreement with Cuauhtémoc Moctezuma (which is now part of the Heineken Group). As a rapidly growing pointresult of contact with our consumers. Based on the belief that location plays a major role in the long-term success of a retail operation such as a convenience store, as well as a role in our continually improving ability to accelerate and streamline the new-store development process, FEMSA Comercio has focused on a strategy of rapid, profitable growth. FEMSA Comercio opened 811, 960 and 1,092 net newthis agreement, OXXO stores in 2008, 2009only carry beer brands produced and 2010, respectively. The accelerated expansion in the number ofdistributed by Cuauhtémoc Moctezuma. OXXO stores yielded total revenue growth of 16.3% to reach Ps. 62,259 million in 2010. Same store sales increased an average of 5.2% driven by an increase in store traffic. Starting in 2008, FEMSA Comercio revenues reflect an accounting effect of the mix shift from physical prepaid wireless air-time cards to the sale of electronic air-time for which only the margin is recorded, not the full revenue amount of the electronic recharge. FEMSA Comercio performed approximately 2.3 billion transactions in 2010 compared to 2.0 billion in 2009.
Business Strategy
A fundamental element of FEMSA Comercio’s business strategy is to utilize its position in the convenience store market to grow in a cost-effective and profitable manner. As a market leader in convenience store retailing, based on internal company surveys, management believes that FEMSA Comercio has an in-depth understanding of its markets and significant expertise in operating a national store chain. FEMSA Comercio intends to continue increasing its store base while capitalizing on the market knowledge gained at existing stores.
FEMSA Comercio has developed proprietary models to assist in identifying appropriate store locations, store formats and product categories. Its model utilizes location-specific demographic data and FEMSA Comercio’s experience in similar locations to fine tune the store format and product offerings to the target market. Market segmentation is becoming an important strategic tool, and it should increasingly allow FEMSA Comercio to improve the operating efficiency of each location and the overall profitability of the chain.
FEMSA Comercio has made and will continue to make significant investments in information technologybenefit from the existing relationship under which Cuauhtémoc Moctezuma will continue to improve its abilitybe the exclusive supplier of beer to capture customer information from its existing stores and to improve its overall operating performance. The majorityOXXO until June 2020.
Approximately 65% of products carried through OXXO stores are bar-coded,operated by independent managers responsible for all aspects of store operations. The managers are commission agents and all OXXO stores are equipped with point-of-sale systems that are integrated into a company-wide computer network. To implement revenue management strategies,not employees of FEMSA Comercio. Each store manager is the legal employer of the store’s staff, which typically numbers six people per store. FEMSA Comercio created a divisioncontinually invests in chargeon-site operating personnel, with the objective of product category management for products, such as beverages, fast foodpromoting loyalty, customer service and perishables, to enhancelow personnel turnover in the stores.
Advertising and better utilize its consumer information base and market intelligence capabilities. FEMSA Comercio has implemented an ERP system, which will allow FEMSA Comercio to continue redesigning its key operating processes and enhance the usefulness of its market information going forward. In addition, FEMSA Comercio has expanded its operations by opening 12 new stores in Bogotá, Colombia in 2010.Promotion
FEMSA Comercio has adopted innovative promotionalComercio’s marketing efforts include both specific product promotions and image advertising campaigns. These strategies in orderseek to increase store traffic and sales. In particular, sales, and to reinforce the OXXO name and market position.
FEMSA Comercio sells high-frequency items such as beverages, snacksmanages its advertising on three levels depending on the nature and cigarettes at competitive
prices. FEMSA Comercio’s ability to implement this strategy profitably is partly attributable to the sizescope of the specific campaign: local or store-specific, regional and national. Store-specific and regional campaigns are closely monitored to ensure consistency with the overall corporate image of OXXO chain, asstores and to avoid conflicts with national campaigns. FEMSA Comercio primarily uses point of purchase materials, flyers, handbills and print and radio media for promotional campaigns, although television is able to work together with its suppliers to implement their revenue-management strategies through differentiated promotions. OXXO’s nationalused occasionally for the introduction of new products and local marketingservices. The OXXO chain’s image and promotional strategiesbrand name are an effective revenue driver and a meanspresented consistently across all stores, irrespective of reaching new segments of the population while strengthening the OXXO brand. For example, the organization has refined its expertise in executing cross promotions (discounts on multi-packs or sales of complementary products at a special price) and targeted promotions to attract new customer segments, such as housewives, by expanding the offerings in the grocery product category in certain stores. FEMSA Comercio is also strengthening its capabilities to increasingly provide consumers with services such as utility bill payment and other basic transactions.location.
Store Locations
With 8,409 OXXO stores in MexicoInventory and 17 stores in Colombia as of December 31, 2010, FEMSA Comercio operates the largest convenience store chain in Latin America measured by number of stores. OXXO stores are concentrated in the northern part of Mexico, but also have a growing presence in the rest of the country.
FEMSA ComercioPurchasing
Regional Allocation of OXXO Stores in Mexico and Latin America(*)
as of December 31, 2010
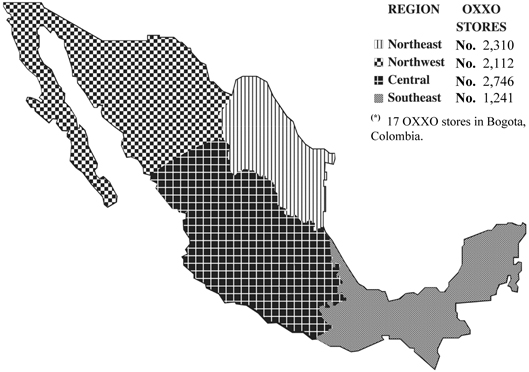
FEMSA Comercio has aggressively expandedplaced considerable emphasis on improving operating performance. As part of these efforts, FEMSA Comercio continues to invest in extensive information management systems to improve inventory management. Electronic data collection has enabled FEMSA Comercio to reduce average inventory levels. Inventory replenishment decisions are carried out on a store-by-store basis.
Management believes that the OXXO chain’s scale of operations provides FEMSA Comercio with a competitive advantage in its number of stores over the past several years. The average investment requiredability to openrealize strategic alliances with suppliers. General category offerings are determined on a new store varies,national level, although purchasing decisions are implemented on a local, regional or national level, depending on locationthe nature of the product category. Given the fragmented nature of the retail industry in Mexico in general, Mexican producers of beer, soft drinks, bread, dairy products, snacks, cigarettes and formatother high-frequency products have established proprietary distribution systems with extensive direct distribution routes. As a result, approximately 51% of the OXXO chain’s total sales consist of products that are delivered directly to the stores by suppliers. Other products with longer shelf lives are distributed to stores by FEMSA Comercio’s distribution system, which includes 14 regional warehouses located in Monterrey, Guadalajara, Mexicali, Mérida, León, Obregón, Puebla, Chihuahua, Reynosa, Tijuana, Toluca, Villahermosa and whethertwo in Mexico City. The distribution centers operate a fleet of approximately 746 trucks that make deliveries to each store approximately twice per week.
Seasonality
OXXO stores experience periods of high demand in December, as a result of the holidays, and in July and August, as a result of increased consumption of beer and soft drinks during the hot summer months. The months of November and February are generally the weakest sales months for OXXO stores. In general, colder weather during these months reduces store is opened in an existing retail location or requires constructiontraffic and consumption of a new store. cold beverages.
Other Stores
FEMSA Comercio is generally ablealso operates other small format stores, which include soft discount stores with a focus on perishables, liquor stores and smaller convenience stores.
Equity Method Investment in the Heineken Group
As of December 31, 2012, FEMSA owned a non-controlling interest in the Heineken Group, one of the world’s leading brewers. As of December 31, 2012, our 20% economic interest in the Heineken Group was comprised of 43,018,320 shares of Heineken Holding N.V. and 72,182,203 shares of Heineken N.V. For 2012, FEMSA recognized equity income of Ps. 8,311 regarding its 20% economic interest in the Heineken Group; see note 10 to use supplier credit to fund the initial inventory of new stores.our audited consolidated financial statements.
As described above, FEMSA Comercio has a distribution agreement with Cuauhtémoc Moctezuma (which is now a part of the Heineken Group) pursuant to which OXXO stores only carry beer brands produced and distributed by Cuauhtémoc Moctezuma. OXXO stores will continue to benefit from the existing relationship under which Cuauhtémoc Moctezuma will continue to be the exclusive supplier of beer to OXXO until June 2020. As of April 30, 2010, Coca-Cola FEMSA has agreed with Cervejarias Kaiser (also now part of the Heineken Group) to continue to distribute and sell theKaiser beer portfolio in Coca-Cola FEMSA’s Brazilian territories for a 20-year term beginning in 2003, consistent with the arrangement already in place. In addition, our logistic services, corporate and shared services subsidiary continues to provide certain services to Cuauhtémoc Moctezuma and its subsidiaries.
Our other business consists of the following smaller operations that support our core operations:
Our logistics services subsidiary provides a broad range of logistics and vehicle maintenance services to Coca-Cola FEMSA, FEMSA Comercio and third-party clients in the beverages, consumer products and retail industries. It has operations in Mexico, Brazil, Colombia, Panama, Costa Rica and Nicaragua.
Our refrigeration business produces vertical and horizontal commercial refrigerators for the soft drink, beer and food industries, with an annual capacity of 475,416 units at December 31, 2012. In 2012, this business sold 389,132 refrigeration units, 36.0% of which were sold to Coca-Cola FEMSA, and the remainder of which were sold to third parties.
Our corporate services subsidiary employs all of our corporate staff, including the personnel managing the areas of finance, corporate accounting, taxation, legal, financial and strategic planning, human resources, corporate affairs and internal audit. Through this subsidiary, we direct, control, supervise and review the operations of our sub-holding companies. As of December 31, 2012, FEMSA Comercio and our other business subsidiaries pay management fees for the services provided to them. In addition, Coca-Cola FEMSA has entered into a services agreement pursuant to which it pays for specific services. As part of the Heineken transaction, the corporate and shared services subsidiaries continue to provide some limited corporate services and shared services to subsidiaries of Cuauhtémoc Moctezuma (now part of the Heineken Group), for which such companies continue to pay.
Until December 31, 2010, our labeling and flexible packaging business was our wholly-owned subsidiary. In 2010, this business sold 14% of its label sales volume to Cuauhtémoc Moctezuma, 20% to Coca-Cola FEMSA and 66% to third parties. Our labeling and flexible packaging business was sold on December 31, 2010.
Until December 31, 2012, Quimiproductos, our manufacturer and supplier of cleaning and sanitizing products and services related to food and beverage industrial processes, as well as of water treatment, was our wholly-owned subsidiary. In 2012, this business sold 38% of its products to Cuauhtémoc Moctezuma, 27% to Coca-Cola FEMSA and 35% to third parties. Our Quimiproductos business was sold on December 31, 2012.
Until September 23, 2010 we owned the Mundet brands in Mexico, which were disposed through the sale to The Coca-Cola Company of Promotora de Marcas Nacionales, S. de R.L. de C.V., which was a wholly owned subsidiary of FEMSA.
Description of Property, Plant and Equipment
As of December 31, 2012, we owned all of our manufacturing facilities and substantially all of our warehouses and distribution centers. Our properties primarily consisted of production and distribution facilities for our soft drink operations and office space. In addition, FEMSA Comercio owns approximately 10.6% of the OXXO store locations, while the other stores are located in properties that are rented under long-term lease arrangements with third parties.
The table below summarizes by country the installed capacity and percentage utilization of Coca-Cola FEMSA’s production facilities:
Growth in Total OXXO Stores
| Year Ended December 31, | Year Ended December 31, | |||||||||||||||||||||||||||||||||||||||
| 2010 | 2009 | 2008 | 2007 | 2006 | 2012 | 2011 | 2010 | 2009 | 2008 | |||||||||||||||||||||||||||||||
Total OXXO stores | 8,426 | 7,334 | 6,374 | 5,563 | 4,847 | 10,601 | 9,561 | 8,426 | 7,334 | 6,374 | ||||||||||||||||||||||||||||||
Store growth (% change over previous year) | 14.9 | % | 15.1 | % | 14.6 | % | 14.8 | % | 17.0 | % | 10.9 | % | 13.5 | % | 14.9 | % | 15.1 | % | 14.6 | % | ||||||||||||||||||||
FEMSA Comercio currently expects to continue the growth trend established over the past several years by emphasizing growth in areas of high economic potential in existing markets and by expanding in underserved and unexploited markets. Management believes that the southeast part of Mexico is particularly underserved by the convenience store industry.
The identification of locations and pre-opening planning in order to optimize the results of new stores are important elements in FEMSA Comercio’s growth plan. FEMSA Comercio continuously reviews store performance against certain operating and financial benchmarks to optimize the overall performance of the chain. Stores unable to maintain benchmark standards are generally closed. Between December 31, 20062008 and 2010,2012, the total number of OXXO stores increased by 3,5794,227, which resulted from the opening of 3,6634,328 new stores and the closing of 84101 existing stores.
Competition
FEMSA Comercio, mainly through OXXO, competes in the convenience store segment of theoverall retail market, withwhich we believe is highly competitive. OXXO stores face competition from small-format stores like 7-Eleven, Super Extra, Super City, Círculo K stores and Circle-K, as well as other local convenience stores. The formatnumerous chains of these stores is similarretailers across Mexico, from other regional small-format retailers to the format of the OXXOsmall informal neighborhood stores. OXXO competes both for consumers and for new locations for stores and the managers to operate those stores. Based on an internal market survey conducted by FEMSA Comercio, management believes that, as of December 31, 2010, there were approximately 13,138 stores in Mexico that could be considered part of the convenience store segment of the retail market. OXXO is the largest chain in Mexico, operating more than 60% of the country’s convenience stores. Furthermore, FEMSA Comercio operates in the 32 Mexican states and has much broader geographical coverage than any of its competitors in Mexico.
Market and Store Characteristics
Market Characteristics
FEMSA Comercio is placing increased emphasis on market segmentation and differentiation of store formats to more appropriately serve the needs of customers on a location-by-location basis. The principal segments include residential neighborhoods, commercial and office locations and stores near schools and universities, along with other types of specialized locations.
Approximately 67%64% of OXXO’s customers are between the ages of 15 and 35. FEMSA Comercio also segments the market according to demographic criteria, including income level.
Store Characteristics
The average size of an OXXO store is approximately 105103 square meters of selling space, excluding space dedicated to refrigeration, storage or parking. The average constructed area of a store is approximately 186 square meters and, when parking areas are included, the average store size increases tois approximately 437429 square meters.
FEMSA Comercio—Operating Indicators
| Year Ended December 31, | Year Ended December 31, | |||||||||||||||||||||||||||||||||||||||
| 2010 | 2009 | 2008 | 2007 | 2006 | 2012 | 2011 | 2010 | 2009 | 2008 | |||||||||||||||||||||||||||||||
| (percentage increase compared to previous year) | (percentage increase compared to previous year) | |||||||||||||||||||||||||||||||||||||||
Total FEMSA Comercio revenues | 16.3 | % | 13.6 | % | 12.0 | % | 14.3 | % | 18.7 | % | 16.6 | % | 19.0 | % | 16.3 | % | 13.6 | % | 12.0 | % | ||||||||||||||||||||
OXXO same-store sales(1) | 5.2 | % | 1.3 | % | 0.4 | % | 3.3 | % | 8.2 | % | 7.7 | % | 9.2 | % | 5.2 | % | 1.3 | % | 0.4 | % | ||||||||||||||||||||
| (percentage of total) | ||||||||||||||||||||||||||||||||||||||||
Beer-related data: | ||||||||||||||||||||||||||||||||||||||||
Beer sales as % of total store sales | 16.1 | % | 15.1 | % | 14.6 | % | 13.4 | % | 13.5 | % | ||||||||||||||||||||||||||||||
| (1) | Same-store sales growth is calculated by comparing the sales of stores for each year that have been in operation for more than 12 months with the sales of those same stores during the previous year. |
Beer, cigarettes, soft drinks and other beverages, snacks and cellular telephone air-time soft drinks and cigarettes represent the main product categories for OXXO stores. FEMSA Comercio has a distribution agreement with Cuauhtémoc Moctezuma.Moctezuma (which is now part of the Heineken Group). As a result of this agreement, OXXO stores only carry beer brands produced and distributed by Cuauhtémoc Moctezuma. OXXO stores will continue to benefit from the existing relationship under which Cuauhtémoc Moctezuma will continue to be the exclusive supplier of beer to OXXO until June 2020. Prior to 2001, OXXO stores had informal agreements with Coca-Cola bottlers, including Coca-Cola FEMSA’s territories in central Mexico, to sell only their products. Since 2001, a limited number of OXXO stores began sellingPepsi products in certain cities in northern Mexico.
Approximately 69%65% of OXXO stores are operated by independent managers responsible for all aspects of store operations. The managers are commission agents and are not employees of FEMSA Comercio. Each store manager is the legal employer of the store’s staff, which typically numbers six people per store. FEMSA Comercio continually invests in on-site operating personnel, with the objective of promoting loyalty, customer-servicecustomer service and low personnel turnover in the stores.
Advertising and Promotion
FEMSA Comercio’s marketing efforts include both specific product promotions and image advertising campaigns. These strategies seek to increase store traffic and sales, and to reinforce the OXXO name and market position.
FEMSA Comercio manages its advertising on three levels depending on the nature and scope of the specific campaign: local or store-specific, regional and national. Store-specific and regional campaigns are closely monitored to ensure consistency with the overall corporate image of OXXO stores and to avoid conflicts with national campaigns. FEMSA Comercio primarily uses point of purchase materials, flyers, handbills and print and radio media for promotional campaigns, although television is used occasionally for the introduction of new products and services. The OXXO chain’s image and brand name are presented consistently across all stores, irrespective of location.
Inventory and Purchasing
FEMSA Comercio has placed considerable emphasis on improving operating performance. As part of these efforts, FEMSA Comercio continues to invest in extensive information management systems to improve inventory management. Electronic data collection has enabled FEMSA Comercio to reduce average inventory levels. Inventory replenishment decisions are carried out on a store-by-store basis.
Management believes that the OXXO chain’s scale of operations provides FEMSA Comercio with a competitive advantage in its ability to realize strategic alliances with suppliers. General category offerings are determined on a national level, although purchasing decisions are implemented on a local, regional or national level, depending on the nature of the product category. Given the fragmented nature of the retail industry in Mexico in general, Mexican producers of beer, soft drinks, bread, dairy products, snacks, cigarettes and other high-frequency
products have established proprietary distribution systems with extensive direct distribution routes. As a result, approximately 53%51% of the OXXO chain’s total sales consist of products carried by the OXXO chainthat are delivered directly to the stores by suppliers. Other products with longer shelf lives are distributed to stores by FEMSA Comercio’s distribution system, which includes 1114 regional warehouses located in Monterrey, Mexico City, Guadalajara, Mexicali, Mérida, León, Obregón, Puebla, Chihuahua, Reynosa, Tijuana, Toluca, Villahermosa and Tijuana.two in Mexico City. The distribution centers operate a fleet of approximately 491746 trucks that make deliveries to each store approximately once atwice per week.
Seasonality
OXXO stores experience periods of high demand in December, as a result of the holidays, and in July and August, as a result of increased consumption of beer and soft drinks during the hot summer months. The months of November and February are generally the weakest sales months for OXXO stores. In general, colder weather during these months reduces store traffic and consumption of cold beverages.
Other Stores
FEMSA Comercio also operates other small format stores, under the names Bara, Sixwhich include soft discount stores with a focus on perishables, liquor stores and Matador.smaller convenience stores.
FEMSA Cerveza and Equity Method Investment in the Heineken Group
Until April 30, 2010, FEMSA Cerveza was our wholly-owned subsidiary, producing beer in Mexico and Brazil and exporting its products to more than 50 countries worldwide, with North America being its most important export market, followed by certain markets in Europe, Latin America and Asia. As of December 31, 2009,2012, FEMSA Cerveza was ranked the tenth-largest brewer in the world in terms of sales volume, and in Mexico, its main market, FEMSA Cerveza was ranked the second-largest beer producer in terms of sales volume. In 2009, approximately 66.4% of FEMSA Cerveza’s sales volume came from Mexico, with the remaining 24.8% from Brazil and 8.8% from exports. As of December 31, 2009, FEMSA Cerveza sold 40.548 million hectoliters of beer and produced and/or distributed 21 brands of beer in 14 different presentations resulting in a portfolio of 111 different product offerings in Mexico.
As of December 31, 2009, FEMSA Cerveza represented 23.5% of our total revenues and 34.1% of our total assets. For the period from January 1, 2010 to April 30, 2010, FEMSA Cerveza contributed net income of Ps. 706 to our net income. On April 30, 2010, FEMSA announced the closing of the transaction pursuant to which FEMSA agreed to exchange 100% of its beer operations for a 20% economic interest in the Heineken Group. The principal terms of the Heineken transaction documents are summarized below in “Item 10. Additional Information—Material Contracts.”
As of April 30, 2010, FEMSA ownsowned a non-controlling interest in the Heineken Group, one of the world’s leading brewers. OurAs of December 31, 2012, our 20% economic interest in the Heineken Group was comprised of 43,018,320 shares of Heineken Holding N.V. and 43,009,69972,182,203 shares of Heineken N.V., with an additional 29,172,504 shares to be delivered pursuant to allotted share delivery instruments. As of May 31, 2011, 13,147,233 shares have been delivered pursuant to the allotted share delivery instruments. For the eight-month period from May 1, 2010 to December 31, 2010,2012, FEMSA recognized an equity income of Ps. 3,319 million8,311 regarding its 20% economic interest in the Heineken Group.Group; see note 10 to our audited consolidated financial statements.
As described above, FEMSA Comercio has a distribution agreement with Cuauhtémoc Moctezuma (which is now a part of the Heineken Group) pursuant to which OXXO stores only carry beer brands produced and distributed by Cuauhtémoc Moctezuma. OXXO stores will continue to benefit from the existing relationship under which Cuauhtémoc Moctezuma will continue to be the exclusive supplier of beer to OXXO until June 2020. As of April 30, 2010, Coca-Cola FEMSA has agreed with Cervejarias Kaiser (also now part of the Heineken Group) to continue to distribute and sell theKaiser beer portfolio in Coca-Cola FEMSA’s Brazilian territories for a 20-year term beginning in 2003, consistent with the arrangement already in place. In addition, our logistic services, corporate and shared services subsidiary will continuecontinues to provide certain services to Cuauhtémoc Moctezuma and its subsidiaries.
Our other business consists of the following smaller operations that support our core operations:
Our logistics services subsidiary provides a broad range of logistics and vehicle maintenance services to Coca-Cola FEMSA, FEMSA Comercio and third-party clients in the beverages, consumer products and retail industries. It has operations in Mexico, Brazil, Colombia, Panama, Costa Rica and Nicaragua.
Our refrigeration business produces vertical and horizontal commercial refrigerators for the soft drink, beer and food industries, with an annual capacity of 260,500475,416 units at December 31, 2010.2012. In 2010,2012, this business sold 293,982389,132 refrigeration units, 40%36.0% of which were sold to Coca-Cola FEMSA, and the remainder of which were sold to third parties.
Our corporate services subsidiary employs all of our corporate staff, including the personnel managing the areas of finance, corporate accounting, taxation, legal, financial and strategic planning, human resources, corporate affairs and internal audit. Through this subsidiary, we direct, control, supervise and review the operations of our sub-holding companies. As of December 31, 2012, FEMSA Comercio and our other business subsidiaries pay management fees for the services provided to them. In addition, Coca-Cola FEMSA has entered into a services agreement pursuant to which it pays for specific services. As part of the Heineken transaction, the corporate and shared services subsidiaries continue to provide some limited corporate services and shared services to subsidiaries of Cuauhtémoc Moctezuma (now part of the Heineken Group), for which such companies continue to pay.
Until December 31, 2010, our labeling and flexible packaging business was our wholly-owned subsidiary. In 2010, this business sold 14% of its label sales volume to Cuauhtémoc Moctezuma, 20% to Coca-Cola FEMSA and 66% to third parties. Our labeling and flexible packaging business was sold on December 31, 2010.
Our logisticsUntil December 31, 2012, Quimiproductos, our manufacturer and supplier of cleaning and sanitizing products and services subsidiary provides logistics servicesrelated to food and beverage industrial processes, as well as of water treatment, was our wholly-owned subsidiary. In 2012, this business sold 38% of its products to Cuauhtémoc Moctezuma, 27% to Coca-Cola FEMSA FEMSA Comercio and third-party clients that either supply or participate directly in the Mexican beverage industry or in other industries. It also provided logistics services35% to the packaging operations of FEMSA and to Cuauhtémoc Moctezuma. Thisthird parties. Our Quimiproductos business provides integrated logistics support for its clients’ supply chain, including the management of carriers and other supply chain services.was sold on December 31, 2012.
Until September 23, 2010 we owned the Mundet brands in Mexico, which were disposed through the sale to The Coca-Cola Company of Promotora de Marcas Nacionales, S. de R.L. de C.V., which was a wholly owned |
Our corporate services subsidiary employs all of our corporate staff, including the personnel managing the areas of finance, corporate accounting, taxation, legal, financial and strategic planning, human resources and internal audit. Through this subsidiary, we direct, control, supervise and review the operations of our sub-holding companies. As of December 31, 2010, FEMSA Comercio and our packaging subsidiaries pay management fees for the services provided to them. In addition, Coca-Cola FEMSA has entered into a services agreement pursuant to which it pays for specific services. As part of the Heineken transaction, the corporate and shared services subsidiaries will continue to provide some limited corporate services and shared services to subsidiaries of Cuauhtémoc Moctezuma (now part of the Heineken Group), for which such companies will continue to pay.
Description of Property, Plant and Equipment
As of December 31, 2010,2012, we owned all of our manufacturing facilities and substantially all of our warehouses and distribution centers. Our properties primarily consisted of production and distribution facilities for our beer and soft drink operations and office space. In addition, FEMSA Comercio owns approximately 10.9%10.6% of the OXXO store locations, while the other stores are located in properties that are rented under long-term lease arrangements with third parties.
The table below sets forthsummarizes by country the location, principal useinstalled capacity and percentage utilization of Coca-Cola FEMSA’s production area of our production facilities, each of which is owned by Coca-Cola FEMSA.
Bottling Facility Summary
Production Facilities As of December 31, 20102012
Country | Installed Capacity (thousands of unit cases) | Utilization(1) (%) | ||||||
Mexico | 2,671,963 | 62.0 | ||||||
Guatemala | 35,527 | 77.0 | ||||||
Nicaragua | 66,516 | 60.0 | ||||||
Costa Rica | 81,424 | 56.0 | ||||||
Panama | 55,863 | 52.0 | ||||||
Colombia | 514,813 | 49.0 | ||||||
Venezuela | 288,751 | 69.0 | ||||||
Brazil | 720,704 | 64.0 | ||||||
Argentina | 347,307 | 62.0 | ||||||
| (1) | Annualized rate. |
The table below summarizes by country the location and facility area of each of Coca-Cola FEMSA’s production facilities.
Bottling Facilities by Location as of December 31, 2012
Country | Location |
| Production Area | |||
( of sq. meters) | ||||||
Mexico | San Cristóbal de las Casas, Chiapas | 45 | ||||
| Cuautitlán, Estado de México | 35 | |||||
| Los Reyes la Paz, Estado de México | 50 | |||||
| Toluca, Estado de México | 242 | |||||
| León, Guanajuato | 124 | |||||
| Morelia, | 50 | |||||
| Ixtacomitán, Tabasco | 117 | |||||
| Apizaco, Tlaxcala | 80 | |||||
| Coatepec, Veracruz | 142 | |||||
| La Pureza Altamira, Tamaulipas | 300 | |||||
| Poza Rica, Veracruz | 42 | |||||
| Pacífico, Estado de México | 89 | |||||
| Cuernavaca, Morelos | 37 | |||||
| Toluca, Estado de México | 41 | |||||
| San Juan del Río, Querétaro | 84 | |||||
| Querétaro, Querétaro | 80 | |||||
Guatemala | Guatemala City | 47 | ||||
Nicaragua | Managua | 54 | ||||
Costa Rica | Calle Blancos, San José | 52 | ||||
| Coronado, San José | 14 | |||||
Panama | Panama City | |||||
Country | Location | Production Area | ||||
(thousands of sq. meters) | ||||||
Colombia | Barranquilla | 37 | ||||
| Bogotá | 105 | |||||
| Bucaramanga | 26 | |||||
| Cali | 76 | |||||
| Manantial, | 67 | |||||
| Medellín | 47 | |||||
Venezuela | 15 | |||||
| Barcelona | 141 | |||||
| Maracaibo | 68 | |||||
| Valencia | 100 | |||||
Brazil | Campo Grande | 36 | ||||
| Jundiaí | 191 | |||||
| Mogi das Cruzes | 119 | |||||
| Belo Horizonte | 73 | |||||
Argentina | Alcorta, | 73 | ||||
| Monte Grande, Buenos Aires | 32 | |||||
We maintain an “all risk” insurance policy covering our properties (owned and leased), machinery and equipment and inventories as well as losses due to business interruptions. The policy covers damages caused by natural disaster, including hurricane, hail, earthquake and damages caused by human acts, including explosion, fire, vandalism, riot and losses incurred in connection with goods in transit. In addition, we maintain an “all risk” liability insurance policy that covers product liability. We purchase our insurance coverage through an insurance broker. TheIn 2012, the policies for “all risk” property insurance and “all risk” liability insurance arewere issued by ACE Seguros, S.A., and the coverage iswas partially reinsured in the international reinsurance market. In 2013, “all risk” liability insurance policy will be issued by XL Insurance Mexico SA de CV. We believe that our coverage is consistent with the coverage maintained by similar companies operating in Mexico.
Capital Expenditures and Divestitures
Our consolidated capital expenditures for the years ended December 31, 2010, 20092012 and 20082011 were Ps. 11,171 million, Ps. 9,10315,560 million and Ps. 7,81612,666 million respectively, and were for the most part financed from cash from operations generated by our subsidiaries. These amounts were invested in the following manner:
| Year Ended December 31, | ||||||||||||
| 2010 | 2009 | 2008 | ||||||||||
| (in millions of Mexican pesos) | ||||||||||||
Coca-Cola FEMSA | Ps. | 7,478 | Ps. | 6,282 | Ps. | 4,802 | ||||||
FEMSA Comercio | 3,324 | 2,668 | 2,720 | |||||||||
Other | 369 | 153 | 294 | |||||||||
Total(1) | Ps. | 11,171 | Ps. | 9,103 | Ps. | 7,816 | ||||||
| Year Ended December 31, | ||||||||
| 2012 | 2011 | |||||||
| (In millions of Mexican pesos) | ||||||||
Coca-Cola FEMSA | Ps. | 10,259 | Ps. | 7,862 | ||||
FEMSA Comercio | 4,707 | 4,186 | ||||||
Other | 594 | 618 | ||||||
|
|
|
| |||||
Total | Ps. | 15,560 | Ps. | 12,666 | ||||
Coca-Cola FEMSA
During 2010,2012, Coca-Cola FEMSA’s capital expenditures focused on increasing plant production capacity, placing coolers with retailers, returnable bottles and cases, improving the efficiency of its distribution infrastructure, and information technology.IT. Capital expenditures in Mexico and Central America were approximately Ps. 2,9325,350 million and accounted for approximately 39%52% of Coca-Cola FEMSA’s capital expenditures.expenditures, with South America representing the balance.
FEMSA Comercio
FEMSA Comercio’s principal investment activity is the construction and opening of new stores. During 2010,2012, FEMSA Comercio opened 1,0921,040 net new OXXO stores. FEMSA Comercio invested Ps. 3,3254,707 million in 20102012 in the addition of new stores, warehouses and improvements to leased properties.
Competition Legislation
TheLey Federal de Competencia Económica (Federal Economic Competition Law or Mexican Competition Law) became effective on June 22, 1993. The Mexican Competition Law and theReglamento de la Ley Federal de Competencia Económica (Regulations under the Mexican Competition Law), effective as of October 13, 2007, regulate monopolies and monopolistic practices and require Mexican government approval of certain mergers and acquisitions. The Mexican Competition Law subjects the activities of certain Mexican companies, including us, to regulatory scrutiny. In addition, the Regulations under the Mexican Competition Law prohibit members of any trade association from reaching any agreement relating to the price of their products.
Management believes that we are currently in compliance in all material respects with Mexican competition legislation.
In Mexico and in some of the other countries in which we operate, we are involved in different ongoing competition related proceedings. We believe that the outcome of these proceedings will not have a material adverse effect on our financial position or results from operations.results. See “Item 8. Financial Information—Legal Proceedings—Coca-Cola FEMSA—Antitrust Matters.”
Price Controls
Voluntary price restraints or statutory price controls have been imposed historically in several of the countries in which Coca-Cola FEMSA operates. Currently, there are no price controls on Coca-Cola FEMSA’s products in any of its territories, except for (i) Argentina, where authorities directly supervise certain products sold through supermarkets to control inflation, and (ii) Venezuela, where the government has recently imposed price controls on certain products including bottled water.See “Item 3. Key Information—Risk Factors—Regulatory developments may adversely affect Coca-Cola FEMSA’s business.”
Taxation of Sparkling Beverages
All the countries in which Coca-Cola FEMSA operates, except for Panama, impose a value-added tax on the sale of sparkling beverages, with a rate of 16% in Mexico, beginning in January 2010, 12% in Guatemala, 15% in Nicaragua, 13% in Costa Rica, 16% in Colombia (applied only to the first sale in supply chain), 12% in Venezuela, (beginning21% in April 2009),Argentina, and 17% (Mato Grosso do Sul)Sul and Goiás) and 18% (São Paulo, Minas Gerais and Minas Gerais)Rio de Janeiro) in Brazil,Brazil. Also, Coca-Cola FEMSA’s Brazilian bottler is responsible for charging and 21% in Argentina.collecting the value-added tax from each of its retailers, based on average retail prices for each state where the company operates, defined primarily through a survey conducted by the government of each state and generally updated every three months. In addition, several of the countries in which Coca-Cola FEMSA operates impose the following excise or other taxes:
Guatemala imposes an excise tax of 0.18 cents in local currency (approximately Ps. 0.2775(Ps. 0.30 as of December 31, 2010)2012) per liter of sparkling beverage.
Costa Rica imposes a specific tax on non-alcoholic bottled beverages based on the combination of packaging and flavor, currently assessed at 15.5016.74 colones (approximately Ps. 0.3705per 250 ml (Ps. 0.42 as of December 31, 2010) per 250 ml,2012), and an excise tax on local brandscurrently assessed at 5.79 colones per 250 ml (approximately Ps. 0.15 as of 5%, foreign brands of 10% and mixers of 14%December 31, 2012).
Nicaragua imposes a 9%9.0% tax on consumption, and municipalities impose a 1% tax on Coca-Cola FEMSA’s Nicaraguan gross income.
Panama imposes a 5%5.0% tax based on the cost of goods produced. Panama also imposes a 10% selective consumption tax on syrups, powders and concentrate.
BrazilArgentina imposes an excise tax of 8.7% on sparkling beverages containing less than 5.0% lemon juice or less than 10.0% fruit juice, and an excise tax of 4.2% on sparkling water and flavored sparkling beverages with 10.0% or more fruit juice, although this excise tax is not applicable to certain of Coca-Cola FEMSA’s products.
Brazil’s federal government assesses an average production tax of approximately 4.4%4.7% and an average sales tax of approximately 7.9%, both assessed by the federal government.10.8%. Most of these taxes are fixed, based on average retail prices in each state where the company operates (VAT) or fixed by the federal government (excise and sales tax).
Argentina imposes an excise tax on sparkling beverages containing less than 5% lemon juice or less than 10% fruit juice of 8.7%, and an excise tax on flavored sparkling beverages with 10% or more fruit juice and on sparkling water of 4.2%, although this excise tax is not applicable to certain of Coca-Cola FEMSA’s products.
Environmental Matters
In all of our territories, our operations are subject to federal and state laws and regulations applicable in the respective jurisdiction relating to the protection of the environment.
Mexico
The Mexican federal authority in charge of overseeing compliance with the federal environmental laws is theSecretaria del Medio Ambiente y Recursos Naturales or Secretary of Environment and Natural Resources, which we refer to as “SEMARNAT”. An agency of SEMARNAT, theProcuraduría Federal de Protección al Ambiente or Federal Environmental Protection Agency, which we refer to as “PROFEPA”, has the authority to enforce the Mexican federal environmental laws. As part of its enforcement powers, PROFEPA can bring administrative, civil and criminal proceedings against companies and individuals that violate environmental laws, regulations and Mexican Official Standards and has the authority to impose a variety of sanctions. These sanctions may include, among other things, monetary fines, revocation of authorizations, concessions, licenses, permits or registrations, administrative arrests, seizure of contaminating equipment, and in certain cases, temporary or permanent closure of facilities. Additionally, as part of its inspection authority, PROFEPA is entitled to periodically inspect the facilities of companies whose activities are regulated by the Mexican environmental legislation and verify compliance therewith. Furthermore, in special situations or certain areas where federal jurisdiction is not applicable or appropriate, the state and municipal authorities can administer and enforce certain environmental regulations of their respective jurisdictions.
In Mexico, the principal legislation relating to environmental matters is theLey General delde Equilibrio Ecológico y la Protección al Ambiente (Federal General Law for Ecological Equilibrium and Environmental Protection, or the Mexican Environmental Law) and theLey General para la Prevención y Gestión Integral de los Residuos(General Law for the Prevention and Integral Management of Waste), which are enforced by theSecretaría de Medio Ambiente y Recursos Naturales(Ministry of the Environment and Natural Resources or SEMARNAT). SEMARNAT can bring administrative and criminal proceedings against companies that violate environmental laws, and it also has the power to temporarily close non-complying facilities. Under the Mexican Environmental Law, rules have been
promulgated concerning water, air and noise pollution and hazardous substances. In particular, Mexican environmental laws and regulations require that we file periodic reports with respect to air and water emissions and hazardous wastes and set forth standards for waste water discharge that apply to our operations. We are also subject to certain minimal restrictions on the operation of delivery trucks in Mexico City. We have implemented several programs designed to facilitate compliance with air, waste, noise and energy standards established by current Mexican federal and state environmental laws, including a program that installs catalytic converters and liquid petroleum gas in delivery trucks for our operations in Mexico City. See “—Coca-Cola FEMSA—Product Sales and Distribution.”
In addition, we are subject to theLey de Aguas Nacionales de 1992 (the National(as amended, the 1992 Water Law), enforced by the Mexican Comisión Nacional del Agua(National Water Commission.Commission). Adopted in December 1992, and amended in 2004, the law1992 Water Law provides that plants located in Mexico that use deep water wells to supply their water requirements must pay a fee to the citylocal governments for the discharge of residual waste water to drainage. Pursuant to this law, certain local authorities test the quality of the waste water discharge and charge plants an additional fee for measurements that exceed certain standards published by the Mexican National Water Commission. In the case of non-compliance with the law, penalties, including closures, may be imposed. All of Coca-Cola FEMSA’s bottler plants located in Mexico have met these standards. In addition, Coca-Cola FEMSA’s plants in Apizaco and San Cristóbal are certified with ISO 14001.
In Coca-Cola FEMSA’s Mexican operations, it established a partnership with The Coca-Cola Company and ALPLA, a supplier of plastic bottles to Coca-Cola FEMSA in Mexico, to createIndustria Mexicana de Reciclaje (IMER), a PET recycling facility located in Toluca, Mexico. This facility started operations in 2005 and has a recycling capacity of approximately 25,000 metric tons per year from which 15,000 metric tons can be re-used in PET bottles for food packaging purposes. Coca-Cola FEMSA has also continued contributing funds to a nationwide recycling company,Ecología y Compromiso Empresarial(Environmentally Committed Companies). In addition, Coca-Cola FEMSA’s plants located in Toluca, Reyes, Cuautitlán, Apizaco, San Cristobal,Cristóbal, Morelia, Ixtacomitan, Coatepec, Poza Rica and CoatepecCuernavaca have received aCertificado de Industria Limpia (Certificate of Clean Industry).
As part of our environmental protection and sustainability strategies, several of our subsidiaries have entered into 20-year wind power supplypurchase agreements with EAI, and EEMthe Mareña Renovables Wind Farm to receive electrical energy for use at production and distribution facilities of FEMSA and Coca-Cola FEMSA throughout Mexico, as well as for a significant number of OXXO convenience stores. The wind farmsMareña Renovables Wind Farm will be located in the state of Oaxaca and areis expected to have a capacity of 396 megawatts. We anticipate that the wind farmsMareña Renovables Wind Farm will begin operations in 2013.2014.
Also, asAs part of Coca-Cola FEMSA’s environmental protection and sustainability strategies, in December 2009, some of its affiliates,Coca-Cola FEMSA, jointly with strategic partners, entered into a wind energy supply agreement with a Mexican subsidiary of Iberdrolathe Spanish wind farm developer, GAMESA Energía, S.A., or GAMESA, to supply clean energy to a plantCoca-Cola FEMSA’s bottling facility in Toluca, Mexico, owned by Coca-Cola FEMSA’sits subsidiary, Propimex, S. de R.L. de C.V. (formerly Propimex, S.A. de C.V.), or Propimex, and to supply green energy to Coca-Cola FEMSA’ssome of its suppliers of PET bottles. The 26.7 megawattIn 2010, GAMESA sold its interest in the Mexican subsidiary that owned the wind farm to Iberdrola Renovables México, S.A. de C.V. The wind farm generating such energy, which is located in La Ventosa, Oaxaca, and is expected to generate approximately 100 thousand megawatt hours of energy annually. The energy supply services began in April 2010.
Central America
Coca-Cola FEMSA’s Central American operations are subject to several federal and state laws and regulations relating to the protection of the environment, which have been enacted in the last ten years, as awareness has increased in this region about the protection of the environment and the disposal of hazardous and toxic materials as well as water usage. In some countries in Central America, Coca-Cola FEMSA is in the process of bringing its operations into compliance with new environmental laws on the timeline established by the relevant regulatory authorities. Coca-Cola FEMSA’s Costa Rica and Panama operations have participated in a joint effort along with the local division of The Coca-Cola Company calledMisión Planeta (Mission Planet) for the collection and recycling of non-returnable plastic bottles.
Colombia
Coca-Cola FEMSA’s Colombian operations are subject to several Colombian federal, state and municipal laws and regulations related to the protection of the environment and the disposal of treated water and toxic and hazardous materials. These laws include the control of atmospheric emissions, noise emissions, disposal of treated water and strict limitations on the use of chlorofluorocarbons. For Coca-Cola FEMSA’s plants in Colombia, haveit has obtained theCertificación Ambiental Fase IV (Phase IV Environmental Certificate) demonstrating its compliance at
the highest level with relevant Colombian regulations. Coca-Cola FEMSA is also engaged in nationwide reforestation programs, and national campaigns for the collection and recycling of glass and plastic bottlesbottles. In 2011, jointly with the FEMSA Foundation, Coca-Cola FEMSA was commended with the “Western Hemisphere Corporate Citizenship Award” for the social responsibility programs it carried out to respond to the extreme weather experienced in Colombia in 2010 and 2011, known locally as wellthe “winter emergency.” In addition, Coca-Cola FEMSA also obtained the ISO 9001, ISO 22000, ISO 14001 and PAS 220 certifications for its plants located in Medellín, Cali, Bogotá, Barranquilla, Bucaramanga and La Calera, as reforestation programs.recognition for the highest quality and food harmlessness in its production processes. These six plants joined a small group of companies that have obtained these certifications.
Venezuela
Coca-Cola FEMSA’s Venezuelan operations are subject to several Venezuelan federal, state and municipal laws and regulations related to the protection of the environment. The most relevant of these laws are theLey Orgánica del Ambiente (Organic Environmental Law), theLey Sobre Sustancias, Materiales y Desechos Peligrosos(Substance, Material and Dangerous Waste Law), theLey Penal del Ambiente (Criminal Environmental Law) and theLey de Aguas(Water Law). Since the enactment of the Organic Environmental Law in 1995, Coca-Cola FEMSA’s Venezuelan subsidiary has presented the proper authorities with plans to bring their production facilities and distribution centers into compliance with applicable laws, which mainly consist of building or expanding the capacity of water treatment plants in Coca-Cola FEMSA’s bottling facilities. Even though Coca-Cola FEMSA has had to adjust some of the originally proposed timelines due to construction delays, in 2009, Coca-Cola FEMSA completed the construction and received all the required permits to operate a new water treatment plant in its bottling facility located in the city of Barcelona. At the end of 2009,2011, Coca-Cola FEMSA also agreed withconcluded the relevant authorities to constructconstruction of a new water treatment plant in its bottling plant in the city of Valencia, which began operations in February 2012. During 2011, Coca-Cola FEMSA also commenced construction of a new water treatment plant withinin its Antimano bottling plant in Caracas, which construction was concluded during the next 18 months, and construction has begun.second quarter of 2012. Coca-Cola FEMSA is also inconcluding the process of obtaining the necessary authorizationauthorizations and licenses before it can begin the construction and expansion of two additionalits current water treatment plantsplant in Antimano andits bottling facility in Maracaibo. In December 2011, Coca-Cola FEMSA expects that by the end of 2011, these three plants will be in operation. Coca-Cola FEMSA is also in process of obtainingobtained the ISO 14000 certification for all of its plants in Venezuela.
In addition, in December 2010, the Venezuelan government approved theLey Integral de Gestión de la Basura (Comprehensive Waste Management Law), which will regulateregulates solid waste management and which may be applicable to manufacturers of products for mass consumption. The full scope of this law has not yet been established.
Brazil
Coca-Cola FEMSA’s Brazilian operations are subject to several federal, state and municipal laws and regulations related to the protection of the environment. Among the most relevant laws and regulations are those dealing with the emission of toxic and hazardous gases, disposal of wastewater and solid waste, and soil contamination by hazardous chemicals, which impose penalties, such as fines, facility closures or criminal charges depending upon the level of non-compliance.
Coca-Cola FEMSA’s production plant located in Jundiaí has been recognized by the Brazilian authorities for its compliance with environmental regulations and for having standards well above those imposed by the law. The plant has been certified for thefor: (i) ISO 9001 since March 1995;1993; (ii) ISO 14001 since March 1997; (iii) norm OHSAS 18001 since 2005; and iv)(iv) ISO 22000 since 2007. Coca-Cola FEMSA’s Brazilian operations are also ISO 9001, ISO 140012007; and OHSAS 18001 certified.(v) PAS: 220 since 2010.
In Brazil it is also necessary to obtain concessions from the government to cast drainage. Coca-Cola FEMSA’s plants in Brazil have been granted this concession, except Mogi das Cruzes, where it has timely begun the process of obtaining one. In December, 2010, Coca-Cola FEMSA increased the capacity of the water treatment plant in its Jundiaí facility. In 2012, Coca-Cola FEMSA’s production plants in Jundiaí and Mogi das Cruzes were certified in standard FSSC22000, and its plant located in Campo Grande is in the process of obtaining this certification as well.
In Brazil, a municipal regulation of the City of São Paulo, implemented pursuant to Law 13.316/2002, came into effect in May 2008. This regulation requires Coca-Cola FEMSA to collect for recycling a specified annual percentage of plastic bottles made from PET sold in the City of São Paulo; such percentage increases each year. As ofBeginning in May 2009, it2011, Coca-Cola FEMSA was required to collect for recycling 50%90% of the PET bottles sold in the Citycity of São Paulo and by May 2010, it was required to collect 75%, and as of May 2011, it was required to collect 90%.for recycling. Currently, Coca-Cola FEMSA is not able to collect the entire required volume required of the PET bottles it has sold in the City of São Paulo for recycling. If Coca-Cola FEMSA does not meet the requirements of this regulation, which we believe to be more onerous than those imposed by the countries with the highest recycling standards, it could be fined and be subject to other sanctions, such as the suspension of operations in any of its plants and/or distribution centers located in the City of São Paulo. In May 2008, Coca-Cola FEMSA, together with other bottlers in the city of São Paulo, through theAssociação Brasileira das Indústrias de Refrigerantes e de Bebidas Não-alcoólicas (Brazilian Soft Drink and Non-Alcoholic Beverage Association, or ABIR),
filed a motion requesting a court to overturn this regulation ondue to the basis of impossibility of compliance. In addition, in November 2009, in response to a municipal authority request for Coca-Cola FEMSA to demonstrate the destination of the PET bottles sold by it in the City of São Paulo, Coca-Cola FEMSA filed a motion showing all of its recycling programs and requesting a more practical timeline to comply with the requirements of the law. In October 2010, the municipal authority of the City of São PaoloPaulo levied a fine on Coca-Cola FEMSA’s Brazilian operating subsidiary of 250,000 Brazilian reais (approximately Ps. 1,750,0001,548,874 as of December 31, 2010)2012) on the grounds that the report submitted by Coca-Cola FEMSA’s Brazilian operating subsidiary did not comply with the 75% proper disposal requirement for the period from mayMay 2008 to May 2010. Coca-Cola FEMSA filed an appeal against this fine. In addition,July 2012, the State Appellate Court of São Paulo rendered a decision admitting the interlocutory appeal filed on behalf of ABIR in November 2009, in responseorder to a requirementsuspend the fines and other sanctions to ABIR’s associated companies, including Coca-Cola FEMSA’s Brazilian subsidiary, for alleged noncompliance with the municipal regulation pending the final resolution of the municipal authority request for Coca-Cola FEMSA to demonstrate the destination of the PET bottles sold in São Paulo, it filed a motion showing all of its recycling programs and requesting a more practical timeline to comply with the requirements of the law.lawsuit. Coca-Cola FEMSA is currently awaiting final resolution ofon both matters.
In August 2010, Law No. 12.305/2010 established the Brazilian National Solid Waste Policy. This policy is based on the principle of shared responsibility between the government, companies and the public, and provides for the post-consumption return of products to companies and requires public authorities to implement waste management programs. This law is regulated by Federal Decree No. 7.404/2010, and was published in December 2010. Coca-Cola FEMSA is currently discussing with the relevant authorities the impact this law may have on Brazilian companies in complying with the regulation in effect in the City of São Paulo. In response to the Brazilian National Solid Waste Policy, in December 2012, a proposal was provided to the Ministry of the Environment by almost 30 associations involved in the packaging sector, including ABIR in its capacity as representative for The Coca-Cola Company, Coca-Cola FEMSA’s Brazilian subsidiary, and other bottlers. The proposal involved creating a “coalition” to implement systems for reverse logistics packaging non-dangerous waste that makes up the dry portion of municipal solid waste or its equivalent. The goal of the proposal is to create methodologies for sustainable development, and protect the environment, society, and the economy. Coca-Cola FEMSA has not yet received a response from the Ministry of Environment.
Argentina
Coca-Cola FEMSA’s Argentine operations are subject to federal and municipal laws and regulations relating to the protection of the environment. The most significant of these are regulations concerning waste water discharge, which are enforced by theSecretaría de Ambiente y Desarrollo Sustentable(Ministry of Natural Resources and Sustainable Development) and theOrganismo Provincial para el Desarrollo Sostenible(Provincial Organization for Sustainable Development) for the province of Buenos Aires. Coca-Cola FEMSA’s Alcorta plant is in compliance with environmental standards and Coca-Cola FEMSA has been certified for ISO 14001:2004 for theits plants and operative units in Buenos Aires.
For all of Coca-Cola FEMSA’s plant operations, Coca-Cola FEMSAit employs twoan environmental management systems: (i) Sistema Integral de Calidad (Integral Quality System or SICKOF) and (ii) system:Sistema de Administración Ambiental (Environmental Administration System, or EKOSYSTEM). We do not believe that Coca-Cola FEMSA’s business activities pose a material risk to the environment, and we believe that Coca-Cola FEMSA is in material compliance with all applicable laws and regulations.contained withinSistema Integral de Calidad (Integral Quality System, or SICKOF).
Coca-Cola FEMSA has expended, and may be required to expend in the future, funds for compliance with and remediation under local environmental laws and regulations. Currently, we do not believe that such costs will have a material adverse effect on Coca-Cola FEMSA’s results from operations, or financial condition. However, since environmental laws and regulations and their enforcement are becoming increasingly more stringent in Coca-Cola FEMSA’s territories, and there is increased recognition by local authorities of the need for higher environmental standards in the countries where it operates, changes in current regulations may result in an increase in costs, which may have an adverse effect on Coca-Cola FEMSA’s future results from operations or financial condition. Coca-Cola FEMSA’s management is not aware of any significant pending regulatory changes that would require a significant amount of additional remedial capital expenditures.
We do not believe that Coca-Cola FEMSA’s business activities pose a material risk to the environment, and we believe that Coca-Cola FEMSA is in material compliance with all applicable environmental laws and regulations.
Other regulations
In December 2009, the Venezuelan government issued a decree requiring a reduction in energy consumption by at least 20% for industrial companies whose consumption is greater than two megawatts per hour and to submit an energy-usage reduction plan. Some of Coca-Cola FEMSA’s bottling operations in Venezuela outside of Caracas met this threshold and it submitted a plan, which included the purchase of generators for its plants. In January 2010, the Venezuelan government subsequently implemented power cuts and other measures for all industries in Caracas whose consumption was above 35 kilowatts per hour.
In January 2010, the Venezuelan government amended theLey para la Defensa y Acceso a las Personas a los Bienes y Servicios( (Defense of and Access to Goods and Services Defense Law). Any violation by a company that produces, distributes and sells goods and services could lead to among other consequences, fines, penalties or the confiscation of the assets used to produce, distribute and sell these goods without compensation. Although we believe Coca-Cola FEMSA is in compliance with this law, consumer protection laws in Venezuela are subject to continuing review and changes.changes, and any such changes could lead to an adverse impact on Coca-Cola FEMSA.
In July 2011, the Venezuelan government passed theLey de Costos y Precios Justos(Fair Costs and Prices Law). The purpose of this law is to establish the regulations and administrative processes necessary to maintain the price stability of, and equal access to, goods and services. The law also creates the National Ministry of Costs and Prices, whose main role is to oversee price controls and set maximum retail prices on certain consumer goods and services. Of Coca-Cola FEMSA’s products, only certain of its bottled water beverages were affected by these regulations, which mandated a lowering of its sale prices as of April 2012. Any failure to comply with this law would result in fines, temporary suspension or the closure of operations. While Coca-Cola FEMSA is currently in compliance with this law, we cannot assure you that the Venezuelan government’s future regulation of goods and services will not result in a forced reduction of prices in respect of certain of Coca-Cola FEMSA’s other products, which could have a negative effect on its results.
In May 2012, the Venezuelan government adopted significant changes to its labor regulations. This amendment to Venezuela’s labor regulations could have a negative impact on Coca-Cola FEMSA’s business and operations. The principal changes that impact Coca-Cola FEMSA’s operations are: (i) the requirement that employee terminations are now subject to governmental authorization; (ii) retroactive assessments for any modifications to Coca-Cola FEMSA’s severance payment system; (iii) the reduction of the maximum daily and weekly work hours (from 44 to 40 weekly); and (iv) the increase in obligatory weekly breaks, prohibiting any corresponding reduction in salaries.
In November, 2012, the government of the Province of Buenos Aires, Argentina, adopted Law No. 14,394, which increased the tax rate applied to product sales within the Province of Buenos Aires. If the products are manufactured in plants located in the territory of the Province of Buenos Aires, Law No. 14,394 increases the tax rate from 1% to 1.75%; if the products are manufactured in any other Argentine province, the law increases the tax rate from 3% to 4%.
In January 2012, the Costa Rican government approved a decree that regulates the sale of food and beverages in schools. The decree came into effect in 2012. Enforcement of this law will be gradual, from 2012 to 2014, depending on the specific characteristics of the food or beverage in question. According to the decree, the sale of specific sparkling beverages and still beverages that contain sugar, syrup or HFCS in any type of presentation in schools is prohibited. Coca-Cola FEMSA will still be allowed to sell water and certain still beverages in schools. We cannot assure you that the Costa Rican government will not further restrict sales of other of Coca-Cola FEMSA’s products in schools in the future; any such further restrictions could lead to an adverse impact on Coca-Cola FEMSA’s results.
In December 2012, the Cost Rican government repealed Article 61 of theirCódigo Fiscal(Fiscal Code), which had allowed Costa Rican subsidiaries to follow certain specified procedures to prevent tax withholdings on dividends paid to parent companies.
Water Supply Law
In Mexico, Coca-Cola FEMSA purchasesobtains water in Mexico directly from municipal waterutility companies and pumps water from its own wells and rivers pursuant to concessions obtained from the Mexican government on a plant-by-plant basis. Water use in Mexico is regulated primarily by theLey de Aguas Nacionales de 1992 (1992 Water Law),Law, and regulations issued thereunder, which created theComisión Nacional del Agua(National Water Commission).Commission. The National Water Commission is charged within charge of overseeing the national system of water use. Under the 1992 Water Law, concessions for the use of a specific volume of ground or surface water generally run for five, ten, or fifteen-yearfrom five- to fifty-year terms, depending on the supply of groundwater in each region as projected by the National Water Commission. Concessionaires may request that concession terms to be extended upon termination.before they expire. The Mexican government is authorized to reduce the volume of ground or surface water granted for use by a concession by whatever volume of water is not used by the concessionaire for two consecutive years. However, because the current concessions for each of Coca-Cola FEMSA’s plants in Mexico do not match each plant’s projected needs for water in future years, we successfully negotiated with the Mexican government the right to transfer the unused volume under concessions from certain plants to other plants anticipating greater water usage in the future. These concessions may be terminated if, among other things, we use more water than permitted or we fail to pay required concession-related fees and do not cure such situations in a timely manner.
Although we have not undertaken independent studies to confirm the sufficiency of the existing or future groundwater supply, we believe that our existing concessions satisfy our current water requirements in Mexico.
In Argentina, a state water company provides water to Coca-Cola FEMSA’s Alcorta plant on a limited basis; however, we believe the authorized amount meets Coca-Cola FEMSA’s requirements for this plant. Water is pumped fromIn Coca-Cola FEMSA’s own wells in its Monte Grande plant in Argentina, without the need for any specific permit or license, regulated by theit pumps water from its own wells, in accordance with Law 25.688.
In Brazil, we buyCoca-Cola FEMSA buys water directly from municipal utility companies and pumpwe also capture water from our ownunderground sources, wells or rivers (Mogi das Cruzes plant)surface sources (i.e., rivers), pursuant to concessions granted by the Brazilian government for each plant. According to the Brazilian Constitution, water is considered an asset of common use and maycan only be exploited for the national interest by Brazilians or companies incorporatedformed under Brazilian law. DealersConcessionaires and users have the responsibility for any damage to the environment. The exploitation and use of water is regulated by theCódigo de Mineração (Code of Mining, Decree Law nº.No. 227/67), by theCódigo de Águas Minerais (Mineral Water Code, Decree Law nº.No. 7841/45), the National Water Resources Policy (Law nº.No. 9433/97) and by regulations issued thereunder. CompaniesThe companies that exploit water are supervised by theDepartamento Nacional de Produção Mineira—Mineiral—DNPM (National Department of Mineral Production) and the National Water Agency in connection with sanitary, federal health agencies, as well as state and municipal authorities. In Coca-Cola FEMSA’s JundaíJundiaí and Belo Horizonte plants, we do not exploit mineral water. In the Mogi das Cruzes and Campo Grande plants, we have all the necessary permits related tofor the exploitation of mineral water.
In Colombia, in addition to natural spring water, Coca-Cola FEMSA acquiresobtains water directly from its own wells and from utility companies. Coca-Cola FEMSA is required to have a specific concession to exploit water from natural sources. Water use in Colombia is regulated by law no.Law No. 9 of 1979 and decrees no.Decrees No. 1594 of 1984 and no.No. 2811 of 1974. In addition, on February 6, 2012, Colombia promulgated Decree No. 303, which requires Coca-Cola FEMSA to apply for water concessions and for authorization to discharge its water into public waterways. The National Institute of National Resources supervises companies that exploit water.use water as a raw material for their business.
In Nicaragua, the use of water is regulated by the Coca-Cola FEMSA Substantially all of Coca-Cola FEMSA’s sales are derived from sales ofCoca-Cola The Coca-Cola Company may unilaterally set the price for its concentrate. In addition, under Coca-Cola FEMSA’s bottler agreements, Coca-Cola FEMSA is prohibited from bottling or distributing any other beverages without The Coca-Cola Company’s authorization or consent, and Coca-Cola FEMSA may not transfer control of the bottler rights of any of its territories without prior consent from The Coca-Cola Company. The Coca-Cola Company also makes significant contributions to Coca-Cola FEMSA’s marketing expenses, although it is not required to contribute a particular amount. Accordingly, The Coca-Cola Company may discontinue or reduce such contributions at any time. Coca-Cola FEMSA depends on The Coca-Cola Company to renew Coca-Cola FEMSA’s bottler agreements. As of December 31, 2012, Coca-Cola FEMSA had eight bottler agreements in Mexico: (i) the agreements for Mexico’s Valley territory, which expire in June 2013 and April 2016, (ii) the agreements for the Central territory, which expire in August 2013, May 2015 and July 2016, (iii) the agreement for the Northeast territory, which expires in September 2014, (iv) the agreement for the Bajio territory, which expires in May 2015, and (v) the agreement for the Southeast territory, which expires in June 2013. Coca-Cola FEMSA’s bottler agreements with The Coca-Cola Company will expire for Coca-Cola FEMSA’s territories in other countries as follows: Argentina in September 2014; Brazil in April 2014; Colombia in June 2014; Venezuela in August 2016; Guatemala in March 2015; Costa Rica in September 2017; Nicaragua in May 2016 and Panama in November 2014. All of Coca-Cola FEMSA’s bottler agreements are automatically renewable for ten-year terms, subject to the The Coca-Cola Company has substantial influence on the conduct of Coca-Cola FEMSA’s business, which may result in Coca-Cola FEMSA taking actions contrary to the interests of its remaining shareholders. The Coca-Cola Company has substantial influence on the conduct of Coca-Cola FEMSA’s business. As of March 31, 2013, The Coca-Cola Company indirectly owned 28.7% of Coca-Cola FEMSA’s outstanding capital stock, representing 37.0% of Coca-Cola FEMSA’s shares with full voting rights. The Coca-Cola Company is entitled to appoint five of Coca-Cola FEMSA’s maximum of 21 directors and the vote of at least two of them Ley General de Aguas NacionalesCoca-Cola FEMSA’s business depends on its relationship with The Coca-Cola Company, and changes in this relationship may adversely affect Coca-Cola FEMSA’s results and financial condition.(National Water Law).trademark beverages. Coca-Cola FEMSA produces, markets, sells and distributesCoca-Cola trademark beverages through standard bottler agreements in certain territories in Mexico and Latin America, which Coca-Cola FEMSA refers to as “Coca-Cola FEMSA’s territories.”See “Item 4. Information on the Company—Coca-Cola FEMSA—Coca-Cola FEMSA’s Territories.”Through its rights under Coca-Cola FEMSA’s bottler agreements and as a large shareholder, The Coca-Cola Company has the right to participate in the process for making important decisions related to Coca-Cola FEMSA’s business.useright of water is regulated byeither party to give prior notice that it does not wish to renew theLey de Aguas (Water Law). applicable agreement. In bothaddition, these agreements generally may be terminated in the case of these countries,material breach.See “Item 10. Additional Information—Material Contracts—Material Contracts Relating to Coca-Cola FEMSA.”Termination would prevent Coca-Cola FEMSA ownsfrom sellingCoca-Cola trademark beverages in the affected territory and exploits their own water wells grantedwould have an adverse effect on Coca-Cola FEMSA’s business, financial condition, results and prospects.through governmental concessions. In Guatemala, no license or permits areis required to exploitapprove certain actions by Coca-Cola FEMSA’s board of directors. As of March 31, 2013, we indirectly owned 48.9% of Coca-Cola FEMSA’s outstanding capital stock, representing 63.0% of Coca-Cola FEMSA’s shares with full voting rights. We are entitled to appoint 13 of Coca-Cola FEMSA’s maximum of 21 directors and all of its executive officers. We and The Coca-Cola Company together, or only we in certain circumstances, have the power to determine the outcome of all actions requiring the approval of Coca-Cola FEMSA’s board of directors, and we and The Coca-Cola Company together, or only we in certain circumstances, have the power to determine the outcome of all actions requiring the approval of Coca-Cola FEMSA’s shareholders.See “Item 10. Additional Information—Material Contracts—Material Contracts Relating to Coca-Cola FEMSA.”The interests of The Coca-Cola Company may be different from the interests of Coca-Cola FEMSA’s remaining shareholders, which may result in Coca-Cola FEMSA taking actions contrary to the interests of Coca-Cola FEMSA’s remaining shareholders.
Competition could adversely affect Coca-Cola FEMSA’s financial performance.
The beverage industry in the territories in which Coca-Cola FEMSA operates is highly competitive. Coca-Cola FEMSA faces competition from other bottlers of sparkling beverages, such asPepsi products, and from producers of low cost beverages or “B brands.” Coca-Cola FEMSA also competes in beverage categories other than sparkling beverages, such as water, juice-based beverages, teas, sport drinks and value-added dairy products. Although competitive conditions are different in each of Coca-Cola FEMSA’s territories, Coca-Cola FEMSA competes principally in terms of price, packaging, consumer sales promotions, customer service and product innovation.See “Item 4. Information on the Company—Coca-Cola FEMSA—Competition.”There can be no assurances that Coca-Cola FEMSA will be able to avoid lower pricing as a result of competitive pressure. Lower pricing, changes made in response to competition and changes in consumer preferences may have an adverse effect on Coca-Cola FEMSA’s financial performance.
Changes in consumer preference could reduce demand for some of Coca-Cola FEMSA’s products.
The non-alcoholic beverage industry is rapidly evolving as a result of, among other things, changes in consumer preferences. Specifically, consumers are becoming increasingly more aware of and concerned about environmental and health issues. Concerns over the environmental impact of plastic may reduce the consumption of Coca-Cola FEMSA’s products sold in plastic bottles or result in additional taxes that would adversely affect consumer demand. In addition, researchers, health advocates and dietary guidelines are encouraging consumers to reduce their consumption of certain types of beverages sweetened with sugar and High Fructose Corn Syrup (“HFCS”), which could reduce demand for certain of Coca-Cola FEMSA’s products. A reduction in consumer demand would adversely affect Coca-Cola FEMSA’s results.
Water shortages or any failure to maintain existing concessions could adversely affect Coca-Cola FEMSA’s business.
Water is an essential component of all of Coca-Cola FEMSA’s products. Coca-Cola FEMSA obtains water from various sources in its territories, including springs, wells, rivers and municipal and state water companies pursuant to either concessions granted by governments in its various territories or pursuant to contracts.
Coca-Cola FEMSA obtains the privatevast majority of the water used in its production pursuant to concessions to use wells, inwhich are generally granted based on studies of the existing and projected groundwater supply. Coca-Cola FEMSA’s plants. existing water concessions or contracts to obtain water may be terminated by governmental authorities under certain circumstances and their renewal depends on receiving necessary authorizations from local and/or federal water authorities.See “Item 4. Information on the Company—Regulatory Matters—Water Supply.”In Panama,some of Coca-Cola FEMSA acquiresFEMSA’s other territories, Coca-Cola FEMSA’s existing water from a state water company,supply may not be sufficient to meet Coca-Cola FEMSA’s future production needs, and the use of water is regulated by theReglamento de Uso de Aguas de Panamá(Panama Use of Water Regulation). In Venezuela, Coca-Cola FEMSA uses private wells in addition to water provided by the municipalities, and it has taken the appropriate actions, including actions to comply with water regulations, to haveavailable water supply available from these sources, regulatedmay be adversely affected by theLey de Aguas (Water Law).shortages or changes in governmental regulations and environmental changes.
We cannot assure you that water will be available in sufficient quantities to meet ourCoca-Cola FEMSA’s future production needs or will prove sufficient to meet Coca-Cola FEMSA’s water supply needs.
Increases in the prices of raw materials would increase Coca-Cola FEMSA’s cost of goods sold and may adversely affect Coca-Cola FEMSA’s results.
In addition to water, Coca-Cola FEMSA’s most significant raw materials are (1) concentrate, which Coca-Cola FEMSA acquires from affiliates of The Coca-Cola Company, (2) sweeteners and (3) packaging materials. Prices for sparkling beverages’ concentrate are determined by The Coca-Cola Company as a percentage of the weighted average retail price in local currency, net of applicable taxes. We cannot assure you that The Coca-Cola Company will not increase the price of the concentrate for sparkling beverages or change the manner in which such price will be calculated in the future. The prices for Coca-Cola FEMSA’s remaining raw materials are driven by market prices and local availability, the imposition of import duties and restrictions and fluctuations in exchange rates. Coca-Cola FEMSA is also required to meet all of its supply needs from suppliers approved by The Coca-Cola Company, which may limit the number of suppliers available to it. Coca-Cola FEMSA’s sales prices are denominated in the local currency in each country in which it operates, while the prices of certain materials, including those used in the bottling of Coca-Cola FEMSA’s products, mainly resin, preforms to make plastic bottles, finished plastic bottles, aluminum cans and HFCS, are paid in or determined with reference to the U.S. dollar, and therefore may increase if the U.S. dollar appreciates against the currency of the countries in which Coca-Cola FEMSA operates, as was the case in 2008 and 2009. In 2011, the U.S. dollar did not appreciate against the currencies of most of the countries in which Coca-Cola FEMSA operated; however, in 2012, the U.S. dollar did appreciate against some of those currencies. We cannot anticipate whether the U.S. dollar will appreciate or depreciate with respect to such currencies in the future.See “Item 4. Information on the Company—Coca-Cola FEMSA—Raw Materials.”
Coca-Cola FEMSA’s most significant packaging raw material costs arise from the purchase of resin and plastic preforms to make plastic bottles and from the purchase of finished plastic bottles, the prices of which are tied to crude oil prices and global resin supply. The average prices that Coca-Cola FEMSA paid for resin and plastic preforms in U.S. dollars were lower in 2012, as compared to 2011. We cannot provide any assurance that prices will not increase in future periods. During 2012, average sweetener prices, as a whole, were lower as compared to 2011 in all of the countries in which Coca-Cola FEMSA operates. From 2009 through 2012, international sugar prices were volatile due to various factors, including shifting demands, availability and climate issues affecting production and distribution. In all of the countries in which Coca-Cola FEMSA operates, other than Brazil, sugar prices are subject to local regulations and other barriers to market entry that cause Coca-Cola FEMSA to pay in excess of international market prices.See “Item 4. Information on the Company—Coca-Cola FEMSA—Raw Materials.”We cannot assure you that Coca-Cola FEMSA’s raw material prices will not further increase in the future. Increases in the prices of raw materials would increase Coca-Cola FEMSA’s cost of goods sold and adversely affect Coca-Cola FEMSA’s financial performance.
Taxes could adversely affect Coca-Cola FEMSA’s business.
The countries in which Coca-Cola FEMSA operates may adopt new tax laws or modify existing laws to increase taxes applicable to Coca-Cola FEMSA’s business. For example, in Mexico, a general tax reform became effective on January 1, 2010, pursuant to which, as applicable to Coca-Cola-FEMSA, there was a temporary increase in the income tax rate from 28% to 30% from 2010 through 2012. Pursuant to an amendment issued at the end of 2012, the 30% income tax rate will continue to apply through 2013. In addition, the value added tax (“VAT”) rate in Mexico increased in 2010 from 15% to 16%.
In Panama, there was an increase in a certain consumer tax, effective as of April 1, 2010, affecting syrups, powders and concentrate. Some of these materials are used for the production of Coca-Cola FEMSA’s sparkling beverages. These taxes increased from 6% to 10%.
In November 2012, the government of the Province of Buenos Aires adopted Law No. 14,394, which increased the tax rate applied to product sales within the Province of Buenos Aires. If the products are manufactured in plants located in the territory of the Province of Buenos Aires, Law No. 14,394 increases the tax rate from 1% to 1.75%; if the products are manufactured in any other Argentine province, the law increases the tax rate from 3% to 4%.
In Brazil, the federal taxes applied on the production and sale of beverages are based on the national average retail price, calculated based on a yearly survey of each Brazilian beverage brand, combined with a fixed tax rate and a multiplier specific for each class of presentation (glass, plastic or can). On October 1, 2012, a number of changes to the Brazilian tax rate became effective. These changes include increases in the multipliers used to calculate soft drink taxes when presented in cans or glasses. Upon effectiveness, the multiplier for cans increased from 30.0% to 31.9%, and beginning in September 2014, the multiplier will gradually increase up to 38.1% in October 1, 2018. The multiplier for glasses increased from 35.0% to 37.2%, and beginning in September 2014, the multiplier will gradually increase up to 44.4% in October 1, 2018. In addition, the amendment suspended the 50% production tax benefit that had previously applied to juice-added soft drinks, and raised the rate for such beverages to the level currently applied to cola beverages. The amendments that benefited Coca-Cola FEMSA’s Brazilian subsidiary were the reduction of the production tax on concentrate, from 27.0% to 20.0%, and the elimination of the sale tax on mineral water (sparkling or still).
Coca-Cola FEMSA’s products are also subject to certain taxes in many of the countries in which it operates. Certain countries in Central America, Brazil and Argentina also impose taxes on sparkling beverages.See “Item 4. Information on the Company—Regulatory Matters—Taxation of Sparkling Beverages.”We cannot assure you that any governmental authority in any country where Coca-Cola FEMSA operates will not impose new taxes or increase taxes on Coca-Cola FEMSA’s products in the future. The imposition of new taxes or increases in taxes on Coca-Cola FEMSA’s products may have a material adverse effect on Coca-Cola FEMSA’s business, financial condition, prospects and results.
Regulatory developments may adversely affect Coca-Cola FEMSA’s business.
Coca-Cola FEMSA is subject to regulation in each of the territories in which it operates. The principal areas in which Coca-Cola FEMSA is subject to regulation are water, environment, labor, taxation, health and antitrust. Regulation can also affect Coca-Cola FEMSA’s ability to set prices for its products.See “Item 4. Information on the Company—Regulatory Matters.”The adoption of new laws or regulations or a stricter interpretation or enforcement thereof in the countries in which Coca-Cola FEMSA operates may increase Coca-Cola FEMSA’s operating costs or impose restrictions on Coca-Cola FEMSA’s operations which, in turn, may adversely affect its financial condition, business and results. In particular, environmental standards are becoming more stringent in several of the countries in which Coca-Cola FEMSA operates, and Coca-Cola FEMSA is in the process of complying with these standards, although we cannot assure you that Coca-Cola FEMSA will be able to meet any timelines for compliance established by the relevant regulatory authorities.See “Item 4. Information on the Company—Regulatory Matters—Environmental Matters.”Further changes in current regulations may result in an increase in compliance costs, which may have an adverse effect on Coca-Cola FEMSA’s future results or financial condition.
Voluntary price restraints or statutory price controls have been imposed historically in several of the countries in which Coca-Cola FEMSA operates. Currently, there are no price controls on Coca-Cola FEMSA’s products in any of the territories in which it has operations, except for those in (i) Argentina, where authorities directly supervise certain products sold through supermarkets to control inflation; and (ii) Venezuela, where the government has recently imposed price controls on certain products including bottled water. The imposition of these restrictions or voluntary price restraints in other territories may have an adverse effect on Coca-Cola FEMSA’s results and financial position.See “Item 4. Information on the Company—Regulatory Matters—Price Controls.”We cannot assure you that governmental authorities in any country where Coca-Cola FEMSA operates will not impose statutory price controls or that it will not need to implement voluntary price restraints in the future.
In January 2010, the Venezuelan government amended theLey para la Defensa y Acceso a las Personas a los Bienes y Servicios (Access to Goods and Services Defense Law). Any violation by a company that produces, distributes and sells goods and services could lead to fines, penalties or the confiscation of the assets used to produce, distribute and sell these goods without compensation. Although Coca-Cola FEMSA believes it is in compliance with this law, consumer protection laws in Venezuela are subject to continuing review and changes, and any such changes may have an adverse impact on Coca-Cola FEMSA.
In July 2011, the Venezuelan government passed theLey de Costos y Precios Justos (Fair Costs and Prices Law). The purpose of this law is to establish the regulations and administrative processes necessary to maintain the price stability of, and equal access to, goods and services. The law also creates the National Ministry of Costs and Prices, the main role of which is to oversee price controls and set maximum retail prices on certain consumer goods and services. Of Coca-Cola FEMSA’s products, only certain of its bottled water beverages were affected by these regulations, which mandated lower sale prices as of April 2012. Any failure to comply with this law would result in fines, temporary suspension or the closure of operations. We cannot assure you that the Venezuelan government’s future regulation of goods and services will not result in a forced reduction of prices in other of Coca-Cola FEMSA’s products, which could have a negative effect on Coca-Cola FEMSA’s results.
In May 2012, the Venezuelan government adopted significant changes to labor regulations. This amendment to Venezuela’s labor regulations could have a negative impact on Coca-Cola FEMSA’s business and operations. The principal changes that impact on Coca-Cola FEMSA’s operations are: (i) the requirement that employee terminations are now subject to governmental authorization; (ii) retroactive assessments for any modifications to Coca-Cola FEMSA’s severance payment system; (iii) the reduction of the maximum daily and weekly work hours (from 44 to 40 weekly); and (iv) the increase in obligatory weekly breaks, prohibiting any corresponding reduction in salaries.
In January 2012, the Costa Rican government approved a decree which regulates the sale of food and beverages in schools. The decree came into effect in 2012. Enforcement of this law will be gradual, from 2012 to 2014, depending on the specific characteristics of the food and beverage in question. According to the decree, the sale of specific sparkling beverages and still beverages that contain sugar, syrup or HFCS in any type of presentation in schools is prohibited. Coca-Cola FEMSA will still be allowed to sell water and certain still beverages in schools. We cannot assure you that the Costa Rican government will not further restrict sales of other of its products in schools in the future; any such further restrictions could lead to an adverse impact on its results.
Coca-Cola FEMSA’s operations have from time to time been subject to investigations and proceedings by antitrust authorities, and litigation relating to alleged anticompetitive practices. Coca-Cola FEMSA has also been subject to investigations and proceedings on environmental and labor matters.See “Item 8. Financial Information—Legal Proceedings.”We cannot assure you that these investigations and proceedings will not have an adverse effect on Coca-Cola FEMSA’s results or financial condition.
Economic and political conditions in the countries in which Coca-Cola FEMSA operates other than Mexico may increasingly adversely affect its business.
In addition to Mexico, Coca-Cola FEMSA conducts operations in Brazil, Guatemala, Nicaragua, Costa Rica, Panama, Colombia, Venezuela and Argentina. Total revenues from Coca-Cola FEMSA’s combined non-Mexican operations decreased as a percentage of its consolidated total revenues from 63.8% in 2011 to 60.8% in 2012; for the same non-Mexican operations, Coca-Cola FEMSA’s gross profit decreased as a percentage of its consolidated gross profit from 62.2% in 2011 to 59.3% in 2012. Given the relevance of Coca-Cola FEMSA’s non-Mexican operations, its results continue to be affected by the economic and political conditions in the countries, other than Mexico, where it conducts operations.
Coca-Cola FEMSA’s business may be affected by the general conditions of the Brazilian economy, the rate of inflation, Brazilian interest rates or exchange rates for Brazilian reais. Decreases in the growth rate of the Brazilian economy, periods of negative growth and/or increases in inflation or interest rates may result in lower demand for Coca-Cola FEMSA’s products, lower real pricing of its products or a shift to lower margin products.
Consumer demand, preferences, real prices and the costs of raw materials are heavily influenced by macroeconomic and political conditions in the other countries in which Coca-Cola FEMSA operates. These conditions vary by country and may not be correlated to conditions in Coca-Cola FEMSA’s Mexican operations. In Venezuela, Coca-Cola FEMSA continues to face exchange rate risk as well as scarcity of and restrictions on importing raw materials. Deterioration in economic and political conditions in any of these countries would have an adverse effect on Coca-Cola FEMSA’s financial position and results.
Venezuelan political events may affect Coca-Cola FEMSA’s operations. Although Venezuela will hold elections on April 14, 2013, in light of the death of President Hugo Chavez, political uncertainty remains. We cannot provide any assurances that political developments in Venezuela, over which Coca-Cola FEMSA has no control, will not have an adverse effect on Coca-Cola FEMSA’s business, financial condition or results.
On October 7, 2012, General Otto Peréz Molina, representing thePartido Patriota(Patriot Party), was elected to the presidency in Guatemala. We cannot assure you that the elected president will continue to apply the same policies that have been applied to Coca-Cola FEMSA in the past.
Depreciation of the local currencies of the countries in which Coca-Cola FEMSA operates against the U.S. dollar may increase Coca-Cola FEMSA’s operating costs. Coca-Cola FEMSA has also operated under exchange controls in Venezuela since 2003, which limit its ability to remit dividends abroad or make payments other than in local currencies and that may increase the real price paid for raw materials and services purchased in local currency. In February 2013, the Venezuelan government announced a devaluation in its official exchange rate, from 4.30 to 6.30 bolivars per US$ 1.00. For further information, please see Note 3.3 and Note 29 to our audited consolidated financial statements. Future changes in the Venezuelan exchange control regime, and future currency devaluations or the imposition of exchange controls in any of the countries in which Coca-Cola FEMSA has operations could have an adverse effect on its financial position and results.
We cannot assure you that political or social developments in any of the countries in which Coca-Cola FEMSA has operations, over which we have no control, will not have a corresponding adverse effect on the global market or on Coca-Cola FEMSA’s business, financial condition or results.
Weather conditions may adversely affect Coca-Cola FEMSA’s results.
Lower temperatures and higher rainfall may negatively impact consumer patterns, which may result in lower per capita consumption of Coca-Cola FEMSA’s beverage offerings. Additionally, adverse weather conditions may affect road infrastructure in the territories in which Coca-Cola FEMSA operates and limit Coca-Cola FEMSA’s ability to sell and distribute its products, thus affecting its results.
Coca-Cola FEMSA now conducts business in countries in which it has not previously operated and that present different or greater risks than certain countries in Latin America.
As a result of the acquisition of 51% of the outstanding shares of the Coca-Cola Bottlers Philippines, Inc. (“CCBPI”), Coca-Cola FEMSA has expanded its geographic reach from Latin America to include the Philippines. The Philippines presents different risks than the risks Coca-Cola FEMSA faces in Latin America. Coca-Cola FEMSA has not previously conducted business in CCPBI’s territories. Coca-Cola FEMSA now faces competitive pressures that are different than those Coca-Cola FEMSA has historically faced. In the Philippines, Coca-Cola FEMSA is the only beverage company competing across categories, and it faces significant competition in each category. In addition, the per capita income of the population in Philippines is lower than the average per capita income in the countries in which Coca-Cola FEMSA currently operates, and the distribution and marketing practices in the Philippines differ from Coca-Cola FEMSA’s historical practices. Coca-Cola FEMSA may have to adapt its marketing and distribution strategies to compete effectively. Coca-Cola FEMSA’s inability to compete effectively may have an adverse effect on its future results.See “Item 4. Information on the Company—The Company—Recent Acquisitions.”
FEMSA Comercio
Competition from other retailers in Mexico could adversely affect FEMSA Comercio’s business.
The Mexican retail sector is highly competitive. FEMSA participates in the retail sector primarily through FEMSA Comercio. FEMSA Comercio’s OXXO stores face competition from small-format stores like 7-Eleven, Super Extra, Super City, Círculo K stores and other numerous chains of retailers across Mexico, from other regional small format retailers to small informal neighborhood stores. In particular, small informal neighborhood stores can sometimes avoid regulatory oversight and taxation, enabling them to sell certain products at below market prices. In addition, these small informal neighborhood stores could improve their technological capabilities so as to enable credit card transactions and electronic payment of utility bills, which would diminish FEMSA Comercio’s competitive advantage. FEMSA Comercio may face additional competition from new market entrants. Increased competition may limit the number of new locations available to FEMSA Comercio and require FEMSA Comercio to modify its product offering or pricing. In addition, consumers may prefer alternative products or store formats offered by competitors. As a result, FEMSA Comercio’s results and financial position may be adversely affected by competition in the future.
Sales of OXXO convenience stores may be adversely affected by changes in economic conditions in Mexico.
Convenience stores often sell certain products at a premium. The convenience store market is thus highly sensitive to economic conditions, since an economic slowdown is often accompanied by a decline in consumer purchasing power, which in turn results in a decline in the overall consumption of FEMSA Comercio’s main product categories. During periods of economic slowdown, OXXO stores may experience a decline in traffic per store and purchases per customer, and this may result in a decline in FEMSA Comercio’s results.
Taxes could adversely affect FEMSA Comercio’s business.
Mexico may adopt new tax laws or modify existing laws to increase taxes applicable to FEMSA Comercio’s business. For example, a general tax reform became effective on January 1, 2010, pursuant to which, as applicable to FEMSA Comercio, there was a temporary increase in the income tax rate from 28% to 30% from 2010 through 2012. Pursuant to an amendment issued at the end of 2012, the 30% income tax rate will continue to apply through 2013. In addition, the VAT rate in Mexico increased in 2010 from 15% to 16%. If the VAT rate increases, it could cause lower traffic or ticket figures for FEMSA Comercio.
FEMSA Comercio may not be able to maintain its historic growth rate.
FEMSA Comercio increased the number of OXXO stores at a compound annual growth rate of 13.6% from 2008 to 2012. The growth in the number of OXXO stores has driven growth in total revenue and results at FEMSA Comercio over the same period. As the overall number of stores increases, percentage growth in the number of OXXO stores is likely to decrease. In addition, as convenience store penetration in Mexico grows, the number of viable new store locations may decrease, and new store locations may be less favorable in terms of same store sales, average ticket and store traffic. As a result, FEMSA Comercio’s future results and financial condition may not be consistent with prior periods and may be characterized by lower growth rates in terms of total revenue and results. In Colombia, FEMSA Comercio may not be able to maintain similar historic growth rates to those in Mexico.
FEMSA Comercio’s business may be adversely affected by an increase of insecurity in Mexico.
In recent years, crime rates have remained high, particularly in the north of Mexico, and there has been a particular increase in drug-related crime and other organized crime. Although FEMSA Comercio has stores across the majority of the Mexican territory, the north of Mexico represents an important region in FEMSA Comercio’s operations. An increase in crime rates could negatively affect sales and customer traffic, increase security expenses incurred in each store, result in higher turnover of personnel or damage to the perception of the OXXO brand, each of which could have an adverse effect on FEMSA Comercio’s business.
FEMSA Comercio’s business may be adversely affected by changes in information technology.
FEMSA Comercio invests aggressively in information technology (which we refer to as IT) in order to maximize its value generation potential. Given the rapid speed at which FEMSA Comercio adds new services and products to its commercial offerings, the development of IT systems, hardware and software needs to keep pace with the growth of the business. If these systems became unstable or if planning for future IT investments were inadequate, it could affect FEMSA Comercio’s business by reducing the flexibility of its value proposition to consumers or by increasing its operating complexity, either of which could adversely affect FEMSA Comercio’s revenue-per-store trends.
FEMSA Comercio’s business could be adversely affected by a failure, interruption, or breach of our IT system.
FEMSA Comercio’s business relies heavily on its advanced IT system to effectively manage its data, communications, connectivity, and other business processes. Although we constantly improve our IT system and protect it with advanced security measures, it may still be subject to defects, interruptions, or security breaches such as viruses or data theft. Such a defect, interruption, or breach could adversely affect FEMSA Comercio’s results or financial position.
FEMSA Comercio’s business may be adversely affected by an increase in the price of electricity.
The performance of FEMSA Comercio’s stores would be adversely affected by increases in the price of utilities on which the stores depend, such as electricity. Although the price of electricity in Mexico has remained stable recently, it could potentially increase as a result of inflation, shortages, interruptions in supply, or other reasons, and such an increase could adversely affect our results or financial position.
Risks Related to Our Holding of Heineken N.V. and Heineken Holding N.V. Shares
FEMSA does not control Heineken N.V.’s and Heineken Holding N.V.’s decisions.
On April 30, 2010, FEMSA announced the closing of the transaction pursuant to which FEMSA agreed to exchange 100% of its beer operations for a 20% economic interest in Heineken N.V. and Heineken Holding N.V. (which, together with their respective subsidiaries, we refer to as Heineken or the Heineken Group). As a consequence of this transaction, which we refer to as the Heineken transaction, FEMSA now participates in the Heineken Holding N.V. Board of Directors, which we refer to as the Heineken Holding Board, and in the Heineken N.V. Supervisory Board, which we refer to as the Heineken Supervisory Board. However, FEMSA is not a majority or controlling shareholder of Heineken N.V. or Heineken Holding N.V., nor does it control the decisions of the Heineken Holding Board or the Heineken Supervisory Board. Therefore, the decisions made by the majority or controlling shareholders of Heineken N.V. or Heineken Holding N.V. or the Heineken Holding Board or the Heineken Supervisory Board may not be consistent with or may not consider the interests of FEMSA’s shareholders or may be adverse to the interests of FEMSA’s shareholders. Additionally, FEMSA has agreed not to disclose non-public information and decisions taken by Heineken.
Heineken is present in a large number of countries.
Heineken is a global brewer and distributor of beer in a large number of countries. As a consequence of the Heineken transaction, FEMSA shareholders are indirectly exposed to the political, economic and social circumstances affecting the markets in which Heineken is present, which may have an adverse effect on the value of FEMSA’s interest in Heineken, and, consequently, the value of FEMSA shares.
Strengthening of the Mexican peso compared to the Euro.
In the event of a depreciation of the euro against the Mexican peso, the fair value of FEMSA’s investment in shares will be adversely affected.
Furthermore, the cash flow that is expected to be received in the form of dividends from Heineken will be in euros, and therefore, in the event of a depreciation of the euro against the Mexican peso, the amount of expected cash flow will be adversely affected.
Heineken N.V. and Heineken Holding N.V. are publicly listed companies.
Heineken N.V. and Heineken Holding N.V. are listed companies whose stock trades publicly and is subject to market fluctuation. A reduction in the price of Heineken N.V. or Heineken Holding N.V. shares would result in a reduction in the economic value of FEMSA’s participation in Heineken.
Risks Related to Our Principal Shareholders and Capital Structure
A majority of our voting shares are held by a voting trust, which effectively controls the management of our company, and the interests of which may differ from those of other shareholders.
As of March 15, 2013, a voting trust, of which the participants are members of seven families, owned 38.69% of our capital stock and 74.86% of our capital stock with full voting rights, consisting of the Series B Shares. Consequently, the voting trust has the power to elect a majority of the members of our board of directors and to play a significant or controlling role in the outcome of substantially all matters to be decided by our board of directors or our shareholders. The interests of the voting trust may differ from those of our other shareholders.See “Item 7. Major Shareholders and Related Party Transactions” and “Item 10. Additional Information—Bylaws—Voting Rights and Certain Minority Rights.”
Holders of Series D-B and D-L Shares have limited voting rights.
Holders of Series D-B and D-L Shares have limited voting rights and are only entitled to vote on specific matters, such as certain changes in the form of our corporate organization, dissolution, or liquidation, a merger with a company with a distinct corporate purpose, a merger in which we are not the surviving entity, a change of our jurisdiction of incorporation, the cancellation of the registration of the Series D-B and D-L Shares and any other matters that expressly require approval from such holders under the Mexican Securities Law. As a result of these limited voting rights, Series D-B and D-L holders will not be able to influence our business or operations.See “Item 7. Major Shareholders and Related Party Transactions—Major Shareholders” and “Item 10. Additional Information—Bylaws—Voting Rights and Certain Minority Rights.”
Holders of ADSs may not be able to vote at our shareholder meetings.
Our shares are traded on the New York Stock Exchange, or NYSE, in the form of ADSs. We cannot assure you that holders of our shares in the form of ADSs will receive notice of shareholders’ meetings from our ADS depositary in sufficient time to enable such holders to return voting instructions to the ADS depositary in a timely manner. In the event that instructions are not received with respect to any shares underlying ADSs, the ADS depositary will, subject to certain limitations, grant a proxy to a person designated by us in respect of these shares. In the event that this proxy is not granted, the ADS depositary will vote these shares in the same manner as the majority of the shares of each class for which voting instructions are received.
Holders of BD Units in the United States and holders of ADSs may not be able to participate in any future preemptive rights offering and as a result may be subject to dilution of their equity interests.
Under applicable Mexican law, if we issue new shares for cash as a part of a capital increase, other than in connection with a public offering of newly issued shares or treasury stock, we are generally required to grant our shareholders the right to purchase a sufficient number of shares to maintain their existing ownership percentage. Rights to purchase shares in these circumstances are known as preemptive rights. By law, we may not allow holders of our shares or ADSs who are located in the United States to exercise any preemptive rights in any future capital increases unless (1) we file a registration statement with the U.S. Securities and Exchange Commission, which we refer to as the SEC, with respect to that future issuance of shares or (2) the offering qualifies for an exemption from the registration requirements of the U.S. Securities Act of 1933. At the time of any future capital increase, we will evaluate the costs and potential liabilities associated with filing a registration statement with the SEC, as well as the benefits of preemptive rights to holders of our shares in the form of ADSs in the United States and any other factors that we consider important in determining whether to file a registration statement.
We may decide not to file a registration statement with the SEC to allow holders of our shares or ADSs who are located in the United States to participate in a preemptive rights offering. In addition, under current Mexican law, the sale by the ADS depositary of preemptive rights and the distribution of the proceeds from such sales to the holders of our shares in the form of ADSs is not possible. As a result, the equity interest of holders of our shares in the form of ADSs would be diluted proportionately.See “Item 10. Additional Information—Bylaws—Preemptive Rights.”
The protections afforded to minority shareholders in Mexico are different from those afforded to minority shareholders in the United States.
Under Mexican law, the protections afforded to minority shareholders are different from, and may be less than, those afforded to minority shareholders in the United States. Mexican laws do not provide a remedy to shareholders relating to violations of fiduciary duties. There is no procedure for class actions as such actions are conducted in the United States and there are different procedural requirements for bringing shareholder lawsuits against directors for the benefit of companies. Therefore, it may be more difficult for minority shareholders to enforce their rights against us, our directors or our controlling shareholders than it would be for minority shareholders of a United States company.
Investors may experience difficulties in enforcing civil liabilities against us or our directors, officers and controlling persons.
FEMSA is organized under the laws of Mexico, and most of our directors, officers and controlling persons reside outside the United States. In addition, all or a substantial portion of our assets and their respective assets are located outside the United States. As a result, it may be difficult for investors to effect service of process within the United States on such persons or to enforce judgments against them, including any action based on civil liabilities under the U.S. federal securities laws. There is doubt as to the enforceability against such persons in Mexico, whether in original actions or in actions to enforce judgments of U.S. courts, of liabilities based solely on the U.S. federal securities laws.
Developments in other countries may adversely affect the market for our securities.
The market value of securities of Mexican companies is, to varying degrees, influenced by economic and securities market conditions in other emerging market countries. Although economic conditions are different in each country, investors’ reaction to developments in one country can have effects on the securities of issuers in other countries, including Mexico. We cannot assure you that events elsewhere, especially in emerging markets, will not adversely affect the market value of our securities.
The failure or inability of our subsidiaries to pay dividends or other distributions to us may adversely affect us and our ability to pay dividends to holders of ADSs.
We are a holding company. Accordingly, our cash flows are principally derived from dividends, interest and other distributions made to us by our subsidiaries. Currently, our subsidiaries do not have contractual obligations that require them to pay dividends to us. In addition, debt and other contractual obligations of our subsidiaries may in the future impose restrictions on our subsidiaries’ ability to make dividend or other payments to us, which in turn may adversely affect our ability to pay dividends to shareholders and meet its debt and other obligations. As of December 31, 2012, we had no restrictions on our ability to pay dividends. Given the exchange of 100% of our ownership of the business of Cuauhtémoc Moctezuma Holding, S.A. de C.V. (formerly FEMSA Cerveza, S.A. de C.V.) (which we refer to as Cuauhtémoc Moctezuma or FEMSA Cerveza) for a 20% economic interest in Heineken, our non-controlling shareholder position in Heineken means that we will be unable to require payment of dividends with respect to the Heineken shares.
Risks Related to Mexico and the Other Countries in Which We Operate
Adverse economic conditions in Mexico may adversely affect our financial position and results.
We are a Mexican corporation, and our Mexican operations are our single most important geographic territory. Given the exchange of 100% of our FEMSA Cerveza business for a 20% economic interest in the Heineken Group, FEMSA shareholders may face a lesser degree of exposure with respect to economic conditions in Mexico and a greater degree of indirect exposure to the political, economic and social circumstances affecting the markets in which Heineken is present. For the year ended December 31, 2012, 62% of our consolidated total revenues were attributable to Mexico and at the net income level the percentage attributable to our Mexican operations is further reduced. The Mexican economy experienced a downturn as a result of the impact of the global financial crisis on many emerging economies that began in the second half of 2008 and continued through 2010.
In 2012, Mexican gross domestic product, or GDP, increased by approximately 3.9% on an annualized basis compared to 2011, due to an improvement in most sectors of the economy, driven by agriculture. The Mexican economy continues to be heavily influenced by the U.S. economy, and therefore, further deterioration in economic conditions in, or delays in recovery of, the U.S. economy may hinder any recovery in Mexico. In the past, Mexico has experienced both prolonged periods of weak economic conditions and deteriorations in economic conditions that have had a negative impact on our results. Given the global macroeconomic downturn in 2009 and 2010, and the slow and incipient recovery in 2011 and 2012, which also affected the Mexican economy, we cannot assure you that such conditions will not have a material adverse effect on our results and financial position going forward.
Our business may be significantly affected by the general condition of the Mexican economy, or by the rate of inflation in Mexico, interest rates in Mexico and exchange rates for, or exchange controls affecting, the Mexican peso. Decreases in the growth rate of the Mexican economy, periods of negative growth and/or increases in inflation or interest rates may result in lower demand for our products, lower real pricing of our products or a shift to lower margin products. Because a large percentage of our costs and expenses are fixed, we may not be able to maintainreduce costs and expenses upon the occurrence of any of these events, and our current concessionsprofit margins may suffer as a result.
In addition, an increase in interest rates in Mexico would increase the cost to us of variable rate debt, Mexican peso-denominated funding, which constituted 18.3% of our total debt as of December 31, 2012 (the total amount of the debt and the variable rate debt used in the calculation of this percentage considers converting only the units of investments debt for the related cross currency swap, and it also includes the effect of related interest rate swaps), and have an adverse effect on our financial position and results.
Depreciation of the Mexican peso relative to the U.S. dollar could adversely affect our financial position and results.
Depreciation of the Mexican peso relative to the U.S. dollar increases the cost to us of a portion of the raw materials we acquire, the price of which is paid in or that additional regulations relatingdetermined with reference to water use willU.S. dollars, and of our debt obligations denominated in U.S. dollars, and thereby negatively affects our financial position and results. A severe devaluation or depreciation of the Mexican peso may result in disruption of the international foreign exchange markets and may limit our ability to transfer or to convert Mexican pesos into U.S. dollars and other currencies for the purpose of making timely payments of interest and principal on our U.S. dollar-denominated debt or obligations in other currencies. Although the value of the Mexican peso against the U.S. dollar had been fairly stable until mid-2008, in the fourth quarter of 2008, the Mexican peso depreciated approximately 27% compared to the fourth quarter of 2007. Since 2008, the Mexican peso has continued to experience exchange rate fluctuations relative to the U.S. dollar, as follows. During 2010 and 2011, the Mexican peso experienced different fluctuations relative to the U.S. dollar of approximately 5.6% of recovery and 12.7% of depreciation compared to the years of 2009 and 2010 respectively. During 2012, the Mexican peso experienced an appreciation relative to the U.S. dollar of approximately 7.1% compared to 2011. In the first quarter of 2013, the Mexican peso appreciated approximately 5.0% relative to the U.S. dollar compared to the fourth quarter of 2012.
While the Mexican government does not be adoptedcurrently restrict, and since 1982 has not restricted, the right or ability of Mexican or foreign persons or entities to convert Mexican pesos into U.S. dollars or to transfer other currencies out of Mexico, the Mexican government could institute restrictive exchange rate policies in the future, as it has done in the past. Currency fluctuations may have an adverse effect on our financial position, results and cash flows in future periods.
When the financial markets are volatile, as they have been in recent periods, our results may be substantially affected by variations in exchange rates and commodity prices, and to a lesser degree, interest rates. These effects include foreign exchange gain and loss on assets and liabilities denominated in U.S. dollars, fair value gain and loss on derivative financial instruments, commodities prices and changes in interest income and interest expense. These effects can be much more volatile than our operating performance and our operating cash flows.
Political events in Mexico could adversely affect our operations.
Mexican political events may significantly affect our operations. Presidential elections in Mexico occur every six years, with the most recent one occurring in July 2012. Enrique Peña Nieto, a member of thePartido Revolucionario Institucional, was elected as the new president of Mexico and took office on December 1, 2012. As with any governmental change, the new government may lead to significant changes in governmental policies, may contribute to economic uncertainty and to heightened volatility of the Mexican capital markets and securities issued by Mexican companies. Currently, no single party has a majority in the Senate or theCámara de Diputados (House of Representatives), and the absence of a clear majority by a single party could result in government gridlock and political uncertainty due to the Mexican congress’ potential inability to reach consensus on the structural reforms required to modernize certain sectors of and foster growth in the Mexican economy. We cannot provide any assurances that political developments in Mexico, over which we have no control, will not have an adverse effect on our business, financial condition, results and prospects.
Insecurity in Mexico could increase, and this could adversely affect our results.
The presence and increasing levels of violence among drug cartels, and between these and the Mexican law enforcement and armed forces, pose a risk to our business. Organized criminal activity and related violent incidents remained high during 2012 and to a lesser extent in the first quarter of 2013 and are relatively concentrated along the northern Mexican border, as well as in certain other Mexican states such as Sinaloa, Michoacán and Guerrero. The principal driver of organized criminal activity is the drug trade that aims to supply and profit from the uninterrupted demand for drugs and the supply of weapons from the United States. This situation could impact our business because consumer habits and patterns adjust to the increased perceived and real insecurity as people refrain from going out as much and gradually shift some on-premise consumption to off-premise consumption of food and beverages on certain social occasions. Insecurity could increase, and this could therefore adversely affect our operational and financial results.
Depreciation of local currencies in other Latin American countries in which we operate may adversely affect our financial position.
Total revenues increased in certain of our non-Mexican beverage operations at a higher rate relative to their respective Mexican operations in 2012. The recurrence of such a higher rate of total revenue growth could result in a greater contribution to the respective results for these territories, but may also expose us to greater risk in these territories as a result. The devaluation of the local currencies against the U.S. dollar in our territories. We believe thatnon-Mexican territories can increase our operating costs in these countries, and depreciation of the local currencies against the Mexican peso can negatively affect our results for these countries. In recent years, the value of the currency in the countries in which we areoperate had been relatively stable except in material compliance withVenezuela. Future currency devaluation or the termsimposition of exchange controls in any of these countries, including Mexico, would have an adverse effect on our existing water concessionsfinancial position and that we are in compliance with all relevant water regulations.results.
| ITEM |
None
The following discussion should be read in conjunction with, and is entirely qualified by reference to, our audited consolidated financial statements and the notes to those financial statements. Our audited consolidated financial statements were prepared in accordance with Mexican FRS, which differ in certain significant respects from U.S. GAAP. Notes 27 and 28 to our audited consolidated financial statements provide a description of the principal differences between Mexican FRS and U.S. GAAP as they relate to us, as well as U.S. GAAP consolidated balance sheets, statements of income and comprehensive income, and cash flows for the same periods presented for Mexican FRS purposes and for the consolidated statement of changes in stockholders’ equity for the years ended December 31, 2009 and 2010, and reconciliation to U.S. GAAP of net income, comprehensive income and stockholders’ equity. See “—U.S. GAAP Reconciliation.”
Overview of Events, Trends and Uncertainties
Management currently considersWe are a Mexican company headquartered in Monterrey, Mexico, and our origin dates back to 1890. Our company was incorporated on May 30, 1936 and has a duration of 99 years. The duration can be extended indefinitely by resolution of our shareholders. Our legal name is Fomento Económico Mexicano, S.A.B. de C.V., and in commercial contexts we frequently refer to ourselves as FEMSA. Our principal executive offices are located at General Anaya No. 601 Pte., Colonia Bella Vista, Monterrey, Nuevo León 64410, Mexico. Our telephone number at this location is (52-81) 8328-6000. Our website is www.femsa.com. We are organized as asociedad anónima bursátil de capital variable under the laws of Mexico.
We conduct our operations through the following events, trends and uncertaintiesprincipal holding companies, each of which we refer to be important to understanding its results from operations and financial position during the periods discussed in this section:as a principal sub-holding company:
|
Coca-Cola FEMSA, which engages in the production, distribution and marketing of beverages;
FEMSA Comercio, acceleratedwhich operates small-format stores; and
CB Equity, which holds our investment in Heineken.
FEMSA traces its rateorigins to the establishment of Mexico’s first brewery, Cervecería Cuauhtémoc, S.A., which we refer to as Cuauhtémoc, which was founded in 1890 by four Monterrey businessmen: Francisco G. Sada, José A. Muguerza, Isaac Garza and José M. Schneider. Descendants of certain of the founders of Cuauhtémoc are participants of the voting trust that controls the management of our company.
The strategic integration of our company dates back to 1936 when our packaging operations were established to supply crown caps to the brewery. During this period, these operations were part of what was known as the Monterrey Group, which also included interests in banking, steel and other packaging operations.
In 1974, the Monterrey Group was split between two branches of the descendants of the founding families of Cuauhtémoc. The steel and other packaging operations formed the basis for the creation of Corporación Siderúrgica, S.A. (now Alfa, S.A.B. de C.V.), controlled by the Garza Sada family, and the beverage and banking operations were consolidated under the Valores Industriales, S.A. de C.V. (the corporate predecessor of FEMSA) corporate umbrella controlled by the Garza Lagüera family. FEMSA’s shares were first listed on what is now the Bolsa Mexicana de Valores, S.A.B. de C.V. (which we refer to as the Mexican Stock Exchange) on September 19, 1978. Between 1977 and 1981, FEMSA diversified its operations through acquisitions in the soft drinks and mineral water industries, the establishment of the first stores under the trade name OXXO store openings and continuesother investments in the hotel, construction, auto parts, food and fishing industries, which were considered non-core businesses and were subsequently divested.
In the 1990s, we began a series of strategic transactions to growstrengthen the competitive positions of our operating subsidiaries. These transactions included the sale of a 30% strategic interest in Coca-Cola FEMSA to a wholly-owned subsidiary of The Coca-Cola Company and a subsequent public offering of Coca-Cola FEMSA shares, both of which occurred in 1993. Coca-Cola FEMSA listed its L shares on the Mexican Stock Exchange, and, in the form of ADS, on the New York Stock Exchange.
In 1998, we completed a reorganization that changed our capital structure by converting our outstanding capital stock at the time of the reorganization into BD Units and B Units, and united the shareholders of FEMSA and the former shareholders of Grupo Industrial Emprex, S.A. de C.V. (which we refer to as Emprex) at the same corporate level through an exchange offer that was consummated on May 11, 1998. As part of the reorganization, FEMSA listed ADSs on the NYSE representing BD Units, and listed the BD Units and its B Units on the Mexican Stock Exchange.
In May 2003, our subsidiary Coca-Cola FEMSA expanded its operations throughout Latin America by acquiring 100% of Panamerican Beverages, Inc., which we refer to as Panamco, then the largest soft drink bottler in Latin America in terms of total revenuessales volume in 2002. Through its acquisition of Panamco, Coca-Cola FEMSA began producing and distributingCoca-Cola trademark beverages in additional territories in Mexico, Central America, Colombia, Venezuela and Brazil, along with bottled water, beer and other beverages in some of these territories. The Coca-Cola Company and its subsidiaries received Series D Shares in exchange for their equity interest in Panamco of approximately 25%.
In November 2007, Administración S.A.P.I., a Mexican company owned directly or indirectly by Coca-Cola FEMSA and The Coca-Cola Company, acquired 100% of the shares of capital stock of Jugos del Valle, S.A.P.I. de C.V. (which we refer to as Jugos del Valle). The business of Jugos del Valle in the United States was acquired and sold by The Coca-Cola Company. In 2008, Coca-Cola FEMSA, The Coca-Cola Company and all Mexican and BrazilianCoca-Colabottlers entered into a joint business for the Mexican and the Brazilian operations, respectively, of Jugos del Valle. Taking into account the participation held by Grupo Fomento Queretano, Coca-Cola FEMSA currently holds an interest of 25.1% in the Mexican joint business and approximately 19.7% in the Brazilian joint businesses. Jugos del Valle sells fruit juice-based beverages and fruit derivatives.
In April 2008, FEMSA shareholders approved a proposal to amend our bylaws in order to preserve the unit structure for our shares that has been in place since May 1998, and to maintain our existing share structure beyond May 11, 2008. Our bylaws previously provided that on May 11, 2008 our Series D-B Shares would convert into Series B Shares and our Series D-L Shares would convert into Series L Shares with limited voting rights. In addition, our bylaws provided that, on May 11, 2008, our current unit structure would cease to exist and each of our B Units would be unbundled into five Series B Shares, while each BD Unit would unbundle into three Series B Shares and two newly issued Series L Shares. Following the April 22, 2008 shareholder approvals, the automatic conversion of our share and unit structures no longer exist, and, absent shareholder action, our share structure will continue to be comprised of Series B Shares, which must represent not less than 51% of our outstanding capital stock, and Series D-B and Series D-L Shares, which together may represent up to 49% of our outstanding capital stock. Our Unit structure, absent shareholder action, will continue to consist of B Units, which bundle five Series B Shares, and BD Units, which bundle one Series B Share, two Series D-B Shares and two Series D-L Shares. See “Item 9. The Offer and Listing—Description of Securities.”
In January 2010, FEMSA announced that its Board of Directors unanimously approved a definitive agreement under which FEMSA would exchange its FEMSA Cerveza business for a 20% economic interest in Heineken, one of the world’s leading brewers. In April 2010, FEMSA announced the closing of the transaction, after Heineken N.V., Heineken Holding N.V. and FEMSA held their corresponding AGMs and approved the transaction. Under the terms of the agreement, FEMSA received 43,018,320 shares of Heineken Holding N.V. and 43,009,699 shares of Heineken N.V., with an additional 29,172,504 shares of Heineken N.V. (which shares we refer to as the Allotted Shares) to be delivered pursuant to an allotted share delivery instrument, or the ASDI. Heineken also assumed US$ 2.1 billion of indebtedness, including FEMSA Cerveza’s unfunded pension obligations. The Allotted Shares were delivered to FEMSA in several installments during 2010 and 2011, with the final installment delivered on October 5, 2011. As of December 31, 2012, FEMSA’s interest in Heineken N.V. represented 12.53% of Heineken N.V.’s outstanding capital and 14.94% of Heineken Holding N.V.’s outstanding capital. The principal terms of the Heineken transaction documents are summarized below in “Item 10. Additional Information—Material Contracts.”
In February 2010, FEMSA signed an agreement with subsidiaries of The Coca-Cola Company to amend the shareholders agreement for Coca-Cola FEMSA. The purpose of the amendment is to set forth that the appointment and compensation of the chief executive officer and all officers reporting to the chief executive officer, as well as the adoption of decisions related to the ordinary operations of Coca-Cola FEMSA, shall only require a simple majority vote of the board of directors. Decisions related to extraordinary matters (such as business acquisitions or combinations in an amount exceeding US$ 100 million, among others) shall continue to require the vote of the majority of the board of directors, including the affirmative vote of two of the board members appointed by The Coca-Cola Company. The amendment was approved at Coca-Cola FEMSA’s extraordinary shareholders meeting on April 14, 2010, and is reflected in the bylaws of Coca-Cola FEMSA. This amendment was signed without transfer of any consideration. The percentage of our consolidated total revenues.voting interest in our subsidiary Coca-Cola FEMSA Comercio has lower operating margins than our beverage business. Given that FEMSA Comercio has lower operating margins and fixed costs, it is more sensitive to changes in sales which could negatively affect operating margins. We expect to continue to expandremains the OXXO chain during 2011.
Our results from operations and financial position are affected bysame after the economic and market conditions in the countries where our subsidiaries conduct their operations, particularly in Mexico. Changes in these conditions are influenced by a numbersigning of factors, including those discussed in “Item 3. Key Information—Risk Factors.”this amendment.
OnIn September 23, 2010, FEMSA sold Promotora de Marcas Nacionales, S. de R.L. de C.V., which we refer to as Promotora, to The Coca-Cola Company. Promotora was the owner of theMundetbrands of soft drinks in Mexico, which comprised 100-plus year old brands acquired by FEMSA in 2001 for which a payment of Ps. 1,002 million was received.Mexico.
In SeptemberOn December 31, 2010, FEMSA signed definitive agreements with GPC III, B.V., to sellsold its flexible packaging and label operations, Grafo Regia, S.A. de C.V., to a Mexican subsidiary of GPC III, B.V. This transaction was part of FEMSA’s strategy to divest non-core assets. The transaction was closed on December 31, 2010 for which a payment of Ps. 1,021 million was received.businesses.
During the third quarter of 2010, Coca-Cola FEMSA completed a transaction with a Brazilian subsidiary of The Coca-Cola Company to produce, sell and distributeMatte Leão branded products. This transaction will
reinforcereinforced Coca-Cola FEMSA’s non-carbonated product offering through the platform that is operated by The Coca-Cola Company and its bottling partners in Brazil. As a part of the agreement, Coca-Cola FEMSA has been selling and distributing certainMatte Leão branded ready-to-drink products since the first quarter of 2010. As of March 31, 2013, Coca-Cola FEMSA had a 19.4% indirect interest in theMatte Leãobusiness in Brazil.
On
In March 17, 2011, a consortium of investors formed by FEMSA, the Macquarie Mexican Infrastructure Fund and other investors, acquired Energía Alterna Istmeña, S. de R.L. de C.V., which we refer to as EAI, and Energía Eólica Mareña, S.A. de C.V., which we refer to as EEM, from subsidiaries of Preneal, S.A., which we refer to as Preneal. FEMSA holds a 45% interest in the consortium. EAI and EEM aretogether constitute the owners ofMareña Renovables Wind Farm, a 396 megawatt late-stage wind energy project in the south-easternsoutheastern region of the State of Oaxaca. The Mareña Renovables Wind Farm is expected to be the largest wind power farm in Latin America. On February 23, 2012, a wholly-owned subsidiary of Mitsubishi Corporation, and Stichting Depositary PGGM Infrastructure Funds, a pension fund managed by PGGM, acquired the 45% interest held by FEMSA in the parent companies of the Mareña Renovables Wind Farm. The sale of FEMSA’s participation as an investor resulted in a gain of Ps. 933 million. Certain subsidiaries of FEMSA, FEMSA Comercio and Coca-Cola FEMSA have entered into 20-year wind power supply agreements with EAI and EEMthe Mareña Renovables Wind Farm to purchase energy output produced by such companies. The project is currentlyit. These agreements will remain in its long-term financing stage.full force and effect.
OnIn March 28, 2011, Coca-Cola FEMSA, together with The Coca-Cola Company and through Compañía Panameña de Bebidas S.A.P.I. de C.V., acquired Grupo Industrias Lácteas S.A., which we refer to as Estrella Azul, a Panamanian company engaged for more than 50 years in the dairy and juice-based beverage categories. The CompanyCoca-Cola FEMSA acquired a 50% interest and will continue to develop this business jointly with The Coca-Cola Company. Beginning in April 2011, both The Coca-Cola Company and Coca-Cola FEMSA commenced the gradual integration of Grupo Estrella Azul into the existing beverage platform they share for the development of non-carbonated products in Panama.
ChangesIn October 2011, Coca-Cola FEMSA merged with Administradora de Acciones del Noreste, S.A.P.I. de C.V., which constituted the beverage division of Grupo Tampico, S.A. de C.V. (which we refer to as Grupo Tampico) and was one of the largest family-ownedCoca-Cola product bottlers in Mexican Financial Reporting StandardsMexico, as calculated by sales volume. This franchise territory operates in the states of Tamaulipas, San Luis Potosí and Veracruz, as well as in certain parts of the states of Hidalgo, Puebla and Querétaro, and sold 155.7 million unit cases of beverages in 2011. The aggregate enterprise value of this transaction was Ps. 9,300 million and a total of 63.5 million new Coca-Cola FEMSA Series L Shares were issued in connection with this transaction. Coca-Cola FEMSA began to consolidate the beverage division of Grupo Tampico in its financial statements as of October 2011.
In December 2011, Coca-Cola FEMSA merged with Corporación de los Ángeles, S.A. de C.V. (which we refer to as Grupo CIMSA), a Mexican family-owned bottler ofCoca-Cola trademark products. This franchise territory operates mainly in the states of Morelos and Mexico, as well as in certain parts of the states of Guerrero and Michoacán, and sold 154.8 million unit cases of beverages in 2011. The Mexican National Bankingaggregate enterprise value at the announcement date of this transaction was Ps. 11,000 million. A total of 75.4 million new Coca-Cola FEMSA Series L Shares were issued in connection with the transaction, and Securities Commission announced the adoptionCoca-Cola FEMSA began to consolidate Grupo CIMSA in its financial statements as of International Financial Reporting Standards for public companies
TheComisión Nacional Bancaria yDecember 2011. As part of its merger with Grupo CIMSA, Coca-Cola FEMSA acquired a 13.2% equity interest in Promotora Industrial Azucarera, S.A. de Valores (Mexican National Banking and Securities Commission, or CNBV) has announced that commencing in 2012, all Mexican public companies must report their financial information in accordance with International Financial Reporting Standards,C.V., one of Mexico’s leading sugar producers, which we refer to as IFRS. Since 2006,Piasa.
In 2012, Coca-Cola FEMSA began theConsejo Mexicano para la Investigación y Desarrollo de Normas de Información Financiera (Mexican Board construction of Researcha production plant in Minas Gerais, Brazil, which has required an investment of 400 million Brazilian reais (equivalent to approximately US$ 198 million). We expect that the construction will generate 800 direct and Developmentindirect jobs. It is anticipated that the new plant will be completed as of Financial Reporting Standards) has been modifying Mexican FRS in order to ensure their convergence with IFRS. We areDecember 2013 and will begin operations in the adoption process and we expect to report our financial information according to IFRS starting on January 1, 2012first quarter of 2014. The plant will be located on a comparable basis.parcel of land 300,000 square meters in size, and it is expected that by 2015 the annual production capacity will be approximately 1.2 billion liters of sparkling beverages, representing an increase of approximately 47% as compared to the current installed capacity of Coca-Cola FEMSA’s plant in Belo Horizonte, Brazil. The new plant will produce all of Coca-Cola FEMSA’s existing brands and presentations ofCoca-Cola products.
EffectsIn May 2012, Coca-Cola FEMSA closed its merger with Grupo Fomento Queretano, S.A.P.I. de C.V. (“Grupo Fomento Queretano”), one of Changesthe oldest family-owned beverage players in Economic Conditions
Our results from operations are affected by changes in economic conditionstheCoca-Cola system in Mexico, andwith operations mainly in the other countriesstate of Querétaro, as well as in which we operate. Forparts of the years endedstates of Mexico, Hidalgo, and Guanajuato. Coca-Cola FEMSA sold approximately 74 million unit cases of beverages in this franchise territory during 2012. The aggregate enterprise value of this transaction was Ps. 6,600 million and a total of 45.1 million new Coca-Cola FEMSA series L shares were issued in connection with this transaction. Coca-Cola FEMSA began to consolidate Grupo Fomento Queretano in its financial statements as of May 2012. As part of the merger with Grupo Fomento Queretano, Coca-Cola FEMSA also acquired an additional 12.9% equity interest in Piasa.
In August 2012, Coca-Cola FEMSA acquired, through Jugos del Valle, an indirect participation in Santa Clara Mercantil de Pachuca, S.A. de C.V. (“Santa Clara”), an important producer of milk and dairy products in Mexico. Coca-Cola FEMSA currently owns an indirect participation of 23.8% in Santa Clara.
On September 24, 2012, FEMSA signed definitive agreements to sell its wholly owned subsidiary Industria Mexicana de Quimicos, S.A. de C.V. (“Quimiproductos”) to a Mexican subsidiary of Ecolab Inc. (NYSE: ECL). Quimiproductos manufactures and provides cleaning and sanitizing products and services related to food and beverage industrial processes, as well as water treatment. The transaction is consistent with FEMSA’s long-standing strategy to divest non-core businesses. Quimiproductos was sold on December 31, 2010, 2009 and 2008, 62%, 59% and 64%, respectively,2012, resulting in a gain of Ps. 871 million.
Recent Acquisitions
In November 2012, through FEMSA Comercio, we agreed to acquire a 75% stake in Farmacias YZA, a leading drugstore operator in Southeast Mexico, with the current shareholders staying as partners with the remaining 25%. Farmacias YZA, headquartered in Merida, Yucatan, operated 333 stores as of the date of the agreement. We believe we can contribute our total sales were attributablesignificant expertise in the development of small-box retail formats to Mexico. Aswhat is already a result, we have greater exposure to the economic conditions of certain countries, particularly thosesuccessful regional player in Central America, Colombia, Venezuela and Brazil, although we continue to generatethis industry. In turn, this transaction opens a substantial portion of our total sales from Mexico.new avenue for growth for FEMSA Comercio. The participation of these other countries as a percentage of our total sales has not changed significantly during the last five yearstransaction is pending customary regulatory approvals and is expected to continueclose in the second quarter of 2013.
In December 2012, Coca-Cola FEMSA reached an agreement with The Coca-Cola Company to maintain 2010 percentagesacquire a 51% non-controlling majority stake of CCBPI for US$ 688.5 million in future periods.
an all-cash transaction. Coca-Cola FEMSA closed this transaction on January 25, 2013. The Mexican economyimplied enterprise value of 100% of CCPBI is gradually recovering from a downturn as a resultUS$ 1,350 million. Coca-Cola FEMSA will have an option to acquire all of the impactremaining 49% of the global financial crisiscapital stock of CCBPI at any time during the seven years following the closing, at the same enterprise value adjusted for a carrying cost and certain other adjustments. Coca-Cola FEMSA will have a put option, exercisable six years after the initial closing, to sell its ownership in CCBPI back to The Coca-Cola Company at a price that will be calculated using the same EBITDA multiple used in the acquisition of the 51% stake of CCBPI, capped at the aggregate enterprise value for the amount acquired, adjusted for certain items. Coca-Cola FEMSA will be managing the day-to-day operations of the business. The Coca-Cola Company will have certain rights on many emerging economiesthe operational business plan. Given the terms of both the options agreement and Coca-Cola FEMSA’s shareholders agreement with The Coca-Cola Company, Coca-Cola FEMSA will not consolidate the results of CCBPI, and will recognize the results of CCBPI using the equity method. CCBPI sold approximately 531 million unit cases of beverages during 2012 and generated revenues of approximately US$ 1.1 billion.
In January 2013, Coca-Cola FEMSA entered into an agreement to merge Grupo Yoli, S.A. de C.V. (“Grupo Yoli”) into Coca-Cola FEMSA. Grupo Yoli operates mainly in 2009. In the thirdstate of Guerrero, Mexico, as well as in parts of the state of Oaxaca, Mexico. The merger agreement was approved by both Coca-Cola FEMSA and Grupo Yoli’s boards of directors and is subject to the approval of the Comisión Federal de Competencia (the Mexican Antitrust Comission, or CFC) and the shareholders’ meetings of both companies. Grupo Yoli sold approximately 99 million unit cases in 2012. The aggregate enterprise value of this transaction was Ps. 8,806 million. Coca-Cola FEMSA will issue approximately 42.4 million new series “L” shares to the shareholders of Grupo Yoli once the transaction closes. As part of this transaction, Coca-Cola FEMSA will increase its participation in Piasa by 9.5%. Coca-Cola FEMSA expects to close this transaction in the second quarter of 2010, Mexican GDP expanded by approximately 5.1% compared to the same period in 2009 and experienced an expansion of 5.4% for the full year of 2010, according to INEGI. According to the Banco Nacional de México survey regarding the economic expectations of specialists, Mexican GDP is expected to increase by 4.4% in 2011,2013.
We conduct our business through our principal sub-holding companies as of the last estimate published in March 2011. The Mexican economy continues to be heavily influenced by the U.S. economy, and therefore, further deterioration in economic conditions in, or delaysshown in the recovery of, the U.S. economy may hinder any recovery in Mexico.following diagram and table:
Principal Sub-holding Companies—Ownership Structure
Our future results may be significantly affected by the general economic and financial conditions in the countries where we operate, including by levels of economic growth, by the devaluation of the local currency, by inflation and high interest rates or by political developments, and may result in lower demand for our products, lower real pricing or a shift to lower margin products. Because a large percentage of our costs are fixed costs, we may not be able to reduce such costs and expenses, and our profit margins may suffer as a result of downturns in the economy of each country.
The decrease in interest rates in Mexico in 2010 decreases our cost of Mexican peso-denominated variable interest rate indebtedness and could have a favorable effect on our financial position and results from operations during 2011. During 2010, our weighted average interest rate decreased by 140 basis points.
Beginning in the fourth quarter of 2009 and through 2010, the value of the Mexican peso relative to the U.S. dollar fluctuated from a low of Ps. 12.16 per U.S. dollar, to a high of Ps. 13.67 per U.S. dollar. At December 31, 2010, the exchange rate (noon buying rate) was Ps. 12.3825 to US$ 1.00. On May 31, 2011, the exchange rate was 11.579. See “Item 3. Key Information—Exchange Rate Information.” A depreciation of the Mexican peso or local currencies in the countries in which we operate relative to the U.S. dollar increases our cost of raw materials priced in U.S. dollars, including raw materials whose prices are set with reference to the U.S. dollar. In addition, a depreciation of the Mexican peso or local currencies in the countries in which we operate relative to the U.S. dollar will increase our U.S.-denominated debt obligations, which could negatively affect our financial position and results from operations.
Companies with structural characteristics that result in margin expansion in excess of sales growth are referred to as having high “operating leverage.”
The operating subsidiaries of Coca-Cola FEMSA are engaged, to varying degrees, in capital-intensive activities. The high utilization of the installed capacity of the production facilities results in better fixed cost absorption, as increased output results in higher revenues without additional fixed costs. Absent significant increases in variable costs, gross profit margins will expand when production facilities are operated at higher utilization rates. Alternatively, higher fixed costs will result in lower gross profit margins in periods of lower output.
In addition, the commercial operations of Coca-Cola FEMSA are carried out through extensive distribution networks, the principal fixed assets of which are warehouses and trucks and are designed to handle large volumes of beverages. Fixed costs represent an important proportion of the total distribution expense of Coca-Cola FEMSA. Generally, the higher the volume that passes through the distribution system, the lower the fixed distribution cost as a percentage of the corresponding revenues. As a result, operating margins improve when the distribution capacity is operated at higher utilization rates. Alternatively, periods of decreased utilization because of lower volumes will negatively affect our operating margins.
FEMSA Comercio operations result in a low margin business with relatively fixed costs. These two characteristics make FEMSA Comercio a business with an operating margin that might be affected more easily by a change in sales levels.
Critical Accounting Estimates
The preparation of our audited consolidated financial statements requires that we make estimates and assumptions that affect (1) the reported amounts of our assets and liabilities, (2) the disclosure of our contingent liabilities at the date of the financial statements and (3) the reported amounts of revenues and expenses during the reporting period. We base our estimates and judgments on our historical experience and on various other reasonable factors that together form the basis for making judgments about the carrying values of our assets and liabilities. Our actual results may differ from these estimates under different assumptions or conditions. We evaluate our estimates and judgments on an on-going basis. Our significant accounting policies are described in Note 5 to our audited consolidated financial statements. We believe our most critical accounting policies that imply the application of estimates and/or judgments are the following:
Bottles and cases; allowance for bottle breakage
We recorded returnable bottles and cases at acquisition cost and restated them applying inflation factors only when they form part of our operations in countries with an inflationary economic environment. For Coca-Cola FEMSA, breakage is expensed as it is incurred. We compare quarterly bottle breakage expense with the calculated depreciation expense of our returnable bottles and cases in plant and distribution centers, estimating a useful life of four years for returnable glass soft drink bottles and plastic cases and 18 months for returnable plastic soft drink bottles. These useful lives are determined in accordance with our business experience. The annual calculated depreciation expense has been similar to the annual bottle breakage expense. Whenever we decide to discontinue a particular returnable presentation and retire it from the market, we write off the discontinued presentation through an increase in breakage expense.
Property, plant and equipment
Property, plant and equipment are depreciated over their estimated useful lives. The estimated useful lives represent the period we expect the assets to remain in service and to generate revenues. We base our estimates on the experience of our technical personnel. Depreciation is computed using the straight line method of accounting.
Imported equipment is recorded using the exchange rate as of the acquisition date and, if part of an inflationary economic environment, is restated applying the inflation rate of the reporting entity.
We test at fair value long-lived assets for impairment and determine whether impairment exists, by comparing the book value of the assets with their fair value, which is calculated considering their operating conditions and the future cash flows expected to be generated based on their estimated remaining useful life as determined by management.
Valuation of intangible assets and goodwill
We identify all intangible assets associated with business acquisitions. We separate intangible assets between those with a finite useful life and those with an indefinite useful life, in accordance with the period over which we expect to receive the benefits.
The intangible assets of indefinite life are subject to annual impairment tests. As of DecemberMarch 31, 2010, we have recorded intangible assets with indefinite lives, which consist of:2013
|
Other intangible assets with indefinite lives that amounted to Ps. 462 million.
Impairment of intangible assets with indefinite lives
We review annually the carrying value of our intangible assets with indefinite lives for impairment based on recognized valuation techniques. While we believe that our estimates are reasonable, different assumptions regarding such estimates could materially affect our evaluations.
Following our evaluations during 2010 and up to the date of this annual report, we do not have any information which leads to any impairment of intangible assets with indefinite lives. We can give no assurance that our expectations will not change as a result of new information or developments. Future changes in economic or political conditions in any country in which we operate or in the industries in which we participate, however, may cause us to change our current assessment.
Employee benefits
Our employee benefits, which we used to refer to as labor liabilities, are comprised of pension plan, seniority premium, post-retirement medical services and severance indemnities. The determination of our obligations and expenses for pension and other post-retirement benefits are determined by actuarial calculations and are dependent on our determination of certain assumptions used to estimate such amounts. We evaluate our assumptions at least annually.
In 2008, we adopted NIF D-3 (“Employee Benefits”), which eliminates the recognition of the additional liability resulting from the difference between obligations for accumulated benefits and net projected liability, in addition to making other important changes. On January 1, 2008, our additional liability cancelled was Ps. 868 million, of which Ps. 447 million corresponds to intangible assets and Ps. 251 to cumulative other comprehensive income, net of its deferred tax of Ps. 170 million.
NIF D-3 establishes a maximum five-year period to amortize the initial balance of the labor costs of past services of pension and retirement plans and the same amortization period for the labor cost of past service of severance indemnities, previously defined by Bulletin D-3 (“Labor Liabilities”) as unrecognized transition obligations and unrecognized prior service costs. For the year ended December 31, 2009, labor costs for past services amounted to Ps. 81 million, and for the year ended December 31, 2010, they amounted to Ps. 81 million, and were recorded within operating income.
Actuarial gains and losses related to severance indemnities are registered under operating income during the year in which they are generated. The balance of unrecognized actuarial gains and losses as of January 1, 2008 was recorded in other expenses and amounted to Ps. 163 million.
While we believe that our assumptions are appropriate, significant differences in our actual experience or significant changes in our assumptions may materially affect our pension and other post-retirement obligations and our future expense. The following table is a summary of the three key assumptions to be used in determining 2010 annual labor liability expense, along with the impact on this expense of a 1% change in each assumed rate.
| Nominal Rates(3) | Real Rates(4) | Impact of Rate Changes(2) | ||||||||||||||||||||||||||||||
Assumptions 2010(1) | 2010 | 2009 | 2008 | 2010 | 2009 | 2008 | +1% | -1% | ||||||||||||||||||||||||
| (in millions of Mexican pesos) | ||||||||||||||||||||||||||||||||
Mexican and Foreign Subsidiaries: | ||||||||||||||||||||||||||||||||
Discount rate | 7.6 | % | 8.2 | % | 8.2 | % | 4.0 | % | 4.5 | % | 4.5 | % | Ps. | (288) | Ps. | 413 | ||||||||||||||||
Salary increase | 4.8 | % | 5.1 | % | 5.1 | % | 1.2 | % | 1.5 | % | 1.5 | % | 354 | (183) | ||||||||||||||||||
Long-term asset return | 8.2 | % | 8.2 | % | 11.3 | % | 3.6 | % | 4.5 | % | 4.5 | % | (40) | 11 | ||||||||||||||||||
| (1) |
| (2) |
| (3) |
| (4) |
Income taxes
As we describe in Note 24 to our audited consolidated financial statements, on January 1, 2010, the Mexican tax reform became effective. The most important changes are: an increase in the value added tax rate (IVA) from 15% to 16%, an increase on special tax on production and services from 25% to 26.5% and an increase in the statutory income tax rate from 28% in 2009 to 30% for 2010, 2011 and 2012, and a reduction from 30% to 29% and 28% for 2013 and 2014, respectively. In addition, the Mexican tax reform requires that income tax payments related to consolidated tax benefits obtained since 1999 be paid during the next five years beginning on the sixth year when tax benefits were used. See Note 24 D and E to our audited consolidated financial statements.
Mexican tax reform effective in 2008 introduced theImpuesto Empresarial de Tasa Unica (IETU) that functions similar to an alternative minimum corporate income tax, except that any amounts paid are not creditable
against future income tax payments. Mexican taxpayers are now subject to the higher of the IETU or the income tax liability computed under Mexican Income Tax Law. This new tax is calculated on a cash-flow basis and the rate for 2010 and 2011 is 17.5% for both years.
Based on our financial projections estimated for our Mexican tax returns, we expect to pay corporate income tax in the future and do not expect to pay IETU, therefore we did not record deferred IETU. As such, the enactment of IETU did not impact our consolidated financial position or results from operations, as it only recognizes deferred income tax.
We recognize deferred tax assets and liabilities based on the differences between the financial statement carrying amounts and the tax basis of assets and liabilities. We regularly review our deferred taxes for recoverability and/or payment, and establish a valuation allowance based on our judgment regarding historical taxable income, projected future taxable income and the expected timing of the reversals of existing temporary differences. If these estimates and related assumptions change in the future, we may be required to record additional valuation allowances against our deferred taxes resulting in an impact in net income.
The statutory income tax rate in Mexico was 30% for 2010, and 28% for 2009 and 2008.
Indirect tax and legal contingencies
We are subject to various claims and contingencies related to indirect tax and legal proceedings as described in Note 25 to our audited consolidated financial statements. Due to their nature, such legal proceedings involve inherent uncertainties including, but not limited to, court rulings, negotiations between affected parties and governmental actions. Management periodically assesses the probability of loss for such contingencies and accrues a liability and/or discloses the relevant circumstances, as appropriate. If the potential loss from any claim or legal proceeding is considered probable and the amount can be reasonably estimated, we accrue a liability for the estimated loss.
Derivative Financial Instruments
We are required to measure all derivative financial instruments at fair value and recognize them in the balance sheet as an asset or liability. Changes in the fair value of derivative financial instruments are recorded each year in net income or as a component of cumulative other comprehensive income, based on the type of hedging instrument and the ineffectiveness of the hedge. The fair values of derivative financial instruments are determined considering quoted prices in recognized markets. If such instruments are not traded, fair value is determined by applying techniques based upon technical models supported by sufficient reliable and verifiable data, recognized in the financial sector. We base our forward price curves upon market price quotations.
As of the date of issuance of these consolidated financial statements and their accompanying notes, the Company is determining its opening consolidated balance sheet as of January 1, 2011 for IFRS and assessing all the possible impacts in 2011 in order to have a comparable basis in the 2012 consolidated financial statements. As part of the transition process to IFRS, the Company is reviewing its accounting policies in order to comply with international standards by the transition date.
The following accounting standards have been issued under Mexican FRS; the application of which is required as indicated. Except as otherwise noted, the Company will adopt these standards when they become effective. The Company is in the process of assessing the effect of adopting the new standards, but it does not anticipate any significant impact except as may be described below.
NIF B-5 “Financial Information by Segment”
NIF B-5 establishes that an operating segment shall meet the following criteria: i) the segment engages in business activities from which it earns or is in the process of obtaining revenues, and incurs related costs and expenses; ii) the operating results are reviewed regularly by the main authority of the entity’s
decision maker; and iii) specific financial information is available. NIF B-5 also requires disclosures related to operating segments subject to reporting, including details of earnings, assets and liabilities, reconciliations, information about products and services, and geographical areas. NIF B-5 is effective beginning on January 1, 2011, and this guidance shall be applied retrospectively for comparative purposes.
NIF B-9 “Interim Financial Reporting”
NIF B-9 prescribes the content to be included in a complete or condensed set of financial statements for an interim period. In accordance with this standard, the complete set of financial statements shall include: a) a statement of financial position as of the end of the period, b) an income statement for the period, c) a statement of changes in equity for the period, d) a statement of cash flows for the period, and e) notes providing the relevant accounting policies and other explanatory notes. Condensed financial statements shall include: a) condensed statement of financial position, b) condensed income statement, c) condensed statement of changes in equity, d) condensed statement of cash flows, and e) selected explanatory notes. NIF B-9 is effective beginning on January 1, 2011. Interim financial statements shall be presented in comparative form.
NIF C-4 “Inventories”
NIF C-4 replaces Bulletin C-4, and describes new accounting treatment for inventories. This standard eliminates the option to use “direct costing” as a valuation system; and it does not permit the use of the last-in, first-out (LIFO) formula to measure the cost of inventories. NIF C-4 establishes that the cost of inventories should be modified on the basis of net realizable value. According to this standard, when an entity purchase inventories on deferred settlement terms, the difference between the purchase price for normal credit terms and the amount paid, should be recognized as interest expense. NIF C-4 also requires companies to disclose the amount of any inventory recognized as an expense, when the cost of sales includes other elements or when a part of the cost of sales is included as discontinued operations. In addition, advances to suppliers are no longer part of inventories. When an entity changes the cost formula, this change should be treated as an accounting change. NIF C-4 is effective beginning on January 1, 2011, and has to be applied prospectively.
NIF C-5 “Prepaid Expenses”
NIF C-5 replaces Bulletin C-5, and establishes general rules for recognition of prepaid expenses. This standard excludes from the scope prepaid expenses which are treated in other NIF, as such as: prepaid income taxes, prepaid net assets from pension plans, and prepaid interest expenses. NIF C-5 establishes the cases in which prepaid expenses of inventories or tangible assets, among others, should be presented in the line of “Prepaid Expenses”, instead of the lines of “Inventories” or “Property, Plant and Equipment”. Prepaid expenses should be classified as current or noncurrent. This statement establishes that prepaid expenses shall be recognized as “expense” in the Income Statement when the company receives benefits from the asset; and prepaid expenses shall be recognized as “assets” when the entity is certain that the asset will generate future economic benefits. Additionally, when an impairment loss arises, prepaid expenses shall be recognized in the income statement. NIF C-5 is effective beginning on January 1, 2011, and has to be applied prospectively.
NIF C-6 “Property, Plant and Equipment”
NIF C-6 replaces Bulletin C-6, and establishes general rules for valuation, presentation and disclosures about property, plant and equipment, also known as “fixed assets”. This standard requires entities to recognize and depreciate fixed assets by components, instead of doing as a whole. NIF C-6 also eliminates the requirement to revaluate fixed assets acquired with no cost, and states that those assets have to be recognized as an equity contribution with no cost. NIF C-6 is effective beginning on January 1, 2011, and has to be applied prospectively, except for those changes regarding recognition by components, which are effective beginning on January 1, 2012.
NIF C-18 “Obligations Associated with the Disposal of Property, Plant and Equipment”
NIF C-18 contains guidance on accounting for changes in liabilities that have been recognized as part of the cost of a property, plant and equipment under NIF C-6 “Property, plant and equipment” (NIF C-6) and as a provision (liability) under Bulletin C-9 “Liabilities, provisions, contingent assets and liabilities, and commitments” (Bulletin C-9). NIF C-18 establishes: (a) the requirements to be considered for the assessment of a liability associated with the disposal of a component of property,
plant and equipment; (b) the requirement to recognize such obligations as a provision that increases the acquisition cost of a component; (c) the methodology to recognize changes to the valuation of these provisions, for revisions to the cash flows, the frequency for its liquidation and the appropriate discount rate that has to be used; (d) the use of an adequate discount rate that includes time value of money and credit risk of the entity; (e) the use of present value to determine the best estimation of provisions; (f) the disclosures that an entity has to present when it has an obligation associated with the disposal of a component. NIF C-18 is effective beginning on January 1, 2011.
There are no significant new U.S. GAAP accounting standards effective in 2011 that are expected to impact the Company.
The following table sets forthpresents an overview of our consolidated income statement under Mexican FRS for the years endedoperations by reportable segment and by geographic area:
Operations by Segment—Overview
Year Ended December 31, 2010, 20092012 and 2008:% of growth vs. last year(1)
| Year Ended December 31, | ||||||||||||||||
| 2010(1) | 2010 | 2009 | 2008 | |||||||||||||
| (in millions of U.S. dollars and Mexican pesos) | ||||||||||||||||
Net sales | $ | 13,598 | Ps. 168,376 | Ps. 158,503 | Ps. 132,260 | |||||||||||
Other operating revenues | 107 | 1,326 | 1,748 | 1,548 | ||||||||||||
Total revenues | 13,705 | 169,702 | 160,251 | 133,808 | ||||||||||||
Cost of sales | 7,974 | 98,732 | 92,313 | 77,990 | ||||||||||||
Gross profit | 5,731 | 70,970 | 67,938 | 55,818 | ||||||||||||
Operating expenses: | ||||||||||||||||
Administrative | 627 | 7,766 | 7,835 | 6,292 | ||||||||||||
Selling | 3,285 | 40,675 | 38,973 | 32,177 | ||||||||||||
Total operating expenses | 3,912 | 48,441 | 46,808 | 38,469 | ||||||||||||
Income from operations | 1,819 | 22,529 | 21,130 | 17,349 | ||||||||||||
Other expenses, net | (23 | ) | (282 | ) | (1,877 | ) | (2,019 | ) | ||||||||
Interest expense | (264 | ) | (3,265 | ) | (4,011 | ) | (3,823 | ) | ||||||||
Interest income | 89 | 1,104 | 1,205 | 865 | ||||||||||||
Interest expense, net | (175 | ) | (2,161 | ) | (2,806 | ) | (2,958 | ) | ||||||||
Foreign exchange loss, net | (50 | ) | (614 | ) | (431 | ) | (1,431 | ) | ||||||||
Gain on monetary position, net | 34 | 410 | 486 | 657 | ||||||||||||
Market value gain (loss) on ineffective portion of derivative financial instrument | 17 | 212 | 124 | (950 | ) | |||||||||||
Comprehensive financing result | (174 | ) | (2,153 | ) | (2,627 | ) | (4,682 | ) | ||||||||
Equity method of associates | 286 | 3,538 | 132 | 90 | ||||||||||||
Income before income taxes | 1,908 | 23,632 | 16,758 | 10,738 | ||||||||||||
Income taxes | 457 | 5,671 | 4,959 | 3,108 | ||||||||||||
Consolidated net income before discontinued operations | 1,451 | 17,961 | 11,799 | 7,630 | ||||||||||||
Income from the exchange of shares with Heineken, net | 2,150 | 26,623 | — | — | ||||||||||||
Net income from discontinued operations | 57 | 706 | 3,283 | 1,648 | ||||||||||||
Consolidated net income | 3,658 | 45,290 | 15,082 | 9,278 | ||||||||||||
Net controlling interest income | 3,251 | 40,251 | 9,908 | 6,708 | ||||||||||||
Net non-controlling interest income | 407 | 5,039 | 5,174 | 2,570 | ||||||||||||
Consolidated net income | 3,658 | 45,290 | 15,082 | Ps. 9,278 | ||||||||||||
| Coca-Cola FEMSA | FEMSA Comercio | CB Equity(2) | ||||||||||||||||||||||
| (in millions of Mexican pesos, except for employees and percentages) | ||||||||||||||||||||||||
Total revenues | Ps.147,739 | 20 | % | Ps.86,433 | 17 | % | Ps. | — | — | |||||||||||||||
Gross Profit | 68,630 | 21 | % | 30,250 | 19 | % | — | — | ||||||||||||||||
Total assets | 166,103 | 17 | % | 31,092 | 17 | % | 79,268 | 4 | % | |||||||||||||||
Employees | 73,395 | 5 | % | 91,943 | 10 | % | — | — | ||||||||||||||||
Total Revenues Summary by Segment(1)
| Year Ended December 31, | ||||||||
| 2012 | 2011 | |||||||
Coca-Cola FEMSA | Ps.147,739 | Ps.123,224 | ||||||
FEMSA Comercio | 86,433 | 74,112 | ||||||
CB Equity(2) | — | — | ||||||
Other | 15,899 | 13,360 | ||||||
Consolidated total revenues | Ps.238,309 | Ps.201,540 | ||||||
Total Revenues Summary by Geographic Area(3)
| Year Ended December 31, | ||||||||
| 2012 | 2011 | |||||||
Mexico and Central America(4) | Ps.155,576 | Ps.129,716 | ||||||
South America(5) | 56,444 | 52,149 | ||||||
Venezuela | 26,800 | 20,173 | ||||||
Consolidated total revenues | 238,309 | 201,540 | ||||||
| (1) |
The following table sets forth certain operating results by reportable segment under Mexican FRS for each of our segments for the years ended December 31, 2010, 2009 and 2008. Due to the discontinued operation of FEMSA Cerveza it is not considered as a reportable segment.
| Year Ended December 31, | ||||||||||||||||||||
| Percentage Growth | ||||||||||||||||||||
| 2010 | 2009 | 2008 | 2010 vs. 2009 | 2009 vs. 2008 | ||||||||||||||||
| (in millions of Mexican pesos at December 31, 2010, except for percentages) | ||||||||||||||||||||
Net sales | ||||||||||||||||||||
Coca-Cola FEMSA | Ps. 102,988 | Ps. 102,229 | Ps. 82,468 | 0.7 | % | 24.0 | % | |||||||||||||
FEMSA Comercio | 62,259 | 53,549 | 47,146 | 16.3 | % | 13.6 | % | |||||||||||||
CB Equity(1) | — | N/a | N/a | N/a | N/a | |||||||||||||||
Total revenues | ||||||||||||||||||||
Coca-Cola FEMSA | 103,456 | 102,767 | 82,976 | 0.7 | % | 23.9 | % | |||||||||||||
FEMSA Comercio | 62,259 | 53,549 | 47,146 | 16.3 | % | 13.6 | % | |||||||||||||
CB Equity | — | N/a | N/a | N/a | N/a | |||||||||||||||
Cost of sales | ||||||||||||||||||||
Coca-Cola FEMSA | 55,534 | 54,952 | 43,895 | 1.1 | % | 25.2 | % | |||||||||||||
FEMSA Comercio | 41,220 | 35,825 | 32,565 | 15.1 | % | 10.0 | % | |||||||||||||
CB Equity | — | N/a | N/a | N/a | N/a | |||||||||||||||
Gross profit | ||||||||||||||||||||
Coca-Cola FEMSA | 47,922 | 47,815 | 39,081 | 0.2 | % | 22.3 | % | |||||||||||||
FEMSA Comercio | 21,039 | 17,724 | 14,581 | 18.7 | % | 21.6 | % | |||||||||||||
CB Equity | — | N/a | N/a | N/a | N/a | |||||||||||||||
Income from operations | ||||||||||||||||||||
Coca-Cola FEMSA | 17,079 | 15,835 | 13,695 | 7.9 | % | 15.6 | % | |||||||||||||
FEMSA Comercio | 5,200 | 4,457 | 3,077 | 16.7 | % | 44.8 | % | |||||||||||||
CB Equity | (3 | ) | N/a | N/a | N/a | N/a | ||||||||||||||
Depreciation(2) | ||||||||||||||||||||
Coca-Cola FEMSA | 3,333 | 3,473 | 3,036 | (4.0 | )% | 14.4 | % | |||||||||||||
FEMSA Comercio | 990 | 819 | 663 | 20.9 | % | 23.5 | % | |||||||||||||
CB Equity | — | N/a | N/a | N/a | N/a | |||||||||||||||
Gross margin(3)(4) | ||||||||||||||||||||
Coca-Cola FEMSA | 46.3 | % | 46.5 | % | 47.1 | % | (0.2 | ) p.p. | (0.6 | ) p.p. | ||||||||||
FEMSA Comercio | 33.8 | % | 33.1 | % | 30.9 | % | 0.7 | p.p. | 2.2 | p.p. | ||||||||||
CB Equity | N/a | N/a | N/a | N/a | N/a | |||||||||||||||
Operating margin(4)(5) | ||||||||||||||||||||
Coca-Cola FEMSA | 16.5 | % | 15.4 | % | 16.5 | % | 1.1 | p.p. | (1.1 | ) p.p. | ||||||||||
FEMSA Comercio | 8.4 | % | 8.3 | % | 6.5 | % | 0.1 | p.p. | 1.8 | p.p. | ||||||||||
CB Equity | N/a | N/a | N/a | N/a | N/a | |||||||||||||||
| CB Equity holds Heineken N.V. and Heineken Holding N.V. |
| (3) | The sum of the financial data for each geographic area differs from our consolidated financial information due to intercompany transactions, which are eliminated in consolidation. |
| (4) | Central America includes Guatemala, Nicaragua, Costa Rica and Panama. Domestic (Mexico-only) revenues were Ps. 148,098 million and Ps. 122,690 million for the years ended December 31, 2012 and 2011, respectively. |
| (5) | Includes Colombia, Brazil and Argentina. Brazilian revenues were Ps. 30,930 million and Ps. 31,405 million for the years ended December 31, 2012 and 2011, respectively. |
The following table sets forth our significant subsidiaries as of February 28, 2013:
Name of Company | Jurisdiction of Establishment | Percentage Owned | ||||
CIBSA: | Mexico | 100.0 | % | |||
Coca-Cola FEMSA | Mexico | 48.9 | %(1) | |||
Grupo Industrial Emprex, S.A. de C.V.: | Mexico | 100.0 | % | |||
FEMSA Comercio | Mexico | 100.0 | % | |||
CB Equity(2) | United Kingdom | 100.0 | % | |||
| (1) | Percentage of capital stock. FEMSA, through CIBSA, owns 63.0% of the shares with full voting rights. |
| (2) | Ownership in CB Equity held through various FEMSA subsidiaries. |
FEMSA is a leading company that participates in the beverage industry through Coca-Cola FEMSA, the largest franchise bottler of Coca-Cola products in the world; in the retail industry through FEMSA Comercio, operating OXXO, the largest and fastest-growing chain of small-format stores in Latin America; and in the beer industry, through its ownership of the second largest equity stake in Heineken, one of the world’s leading brewers with operations in 178 countries.
We understand the importance of connecting with our end consumers by interpreting their needs, and ultimately delivering the right products to them for the right occasions and the optimal value proposition. We strive to achieve this by developing brand value, expanding our significant distribution capabilities, and improving the efficiency of our operations while aiming to reach our full potential. We continue to improve our information gathering and processing systems in order to better know and understand what our consumers want and need, and we are improving our production and distribution by more efficiently leveraging our asset base.
We believe that the competencies that our businesses have developed can be replicated in other geographic regions. This underlying principle guided our consolidation efforts, which culminated in Coca-Cola FEMSA’s acquisition of Panamco in May 2003. The continental platform that this combination produced—encompassing a significant territorial expanse in Mexico and Central America, including some of the most populous metropolitan areas in Latin America—has provided us with opportunities to create value through both an improved ability to execute our strategies and the use of superior marketing tools. We have also increased our capabilities to operate and succeed in other geographic regions, by developing significant management and marketing tools to gain an understanding of local consumer needs and trends, as is the case with OXXO’s Colombian operations. Going forward, we intend to use those capabilities to continue our international expansion of both Coca-Cola FEMSA and FEMSA Comercio, expanding both our geographic footprint and our presence in beverage categories and small box retail formats, as well as taking advantage of potential opportunities to leverage our skill set and key competencies.
Our objective is to create economic, social and environmental value for our stakeholders—including our employees, our consumers, our shareholders and the enterprises and institutions within our society—now and into the future.
Overview
Coca-Cola FEMSA is the largest franchise bottler ofCoca-Colatrademark beverages in the world. Coca-Cola FEMSA operates in territories in the following countries:
Mexico – a substantial portion of central Mexico, the southeast and northeast of Mexico (including the Gulf region).
Central America – Guatemala (Guatemala City and surrounding areas), Nicaragua (nationwide), Costa Rica (nationwide) and Panama (nationwide).
Colombia – most of the country.
Venezuela – nationwide.
Brazil – the area of greater São Paulo, Campinas, Santos, the state of Mato Grosso do Sul, part of the state of Minas Gerais and part of the state of Goiás.
Argentina – Buenos Aires and surrounding areas.
Coca-Cola FEMSA’s company was organized on October 30, 1991 as asociedad anónima de capital variable (a variable capital stock corporation) under the laws of Mexico with a duration of 99 years. On December 5, 2006, as required by amendments to the Mexican Securities Market Law, Coca-Cola FEMSA became asociedad anónima bursátil de capital variable (a listed variable capital stock corporation). Coca-Cola FEMSA’s legal name is Coca-Cola FEMSA, S.A.B. de C.V. Coca-Cola FEMSA’s principal executive offices are located at Mario Pani No. 100, Col. Santa Fe Cuajimalpa, Delegación Cuajimalpa, México, D.F., 05348, México. Coca-Cola FEMSA’s telephone number at this location is (52-55) 1519-5000. Coca-Cola FEMSA’s website iswww.coca-colafemsa.com.
The following is an overview of Coca-Cola FEMSA’s operations by reporting segment in 2012.
Operations by Reporting Segment—Overview
Year Ended December 31, 2012(1)
| Total Revenues | Percentage of Total Revenues | Gross Profit | Percentage of Gross Profit | |||||||||||||
Mexico and Central America(2) | 66,141 | 44.8 | % | 31,643 | 46.1 | % | ||||||||||
South America(3) (excluding Venezuela) | 54,821 | 37.1 | % | 23,667 | 34.5 | % | ||||||||||
Venezuela | 26,777 | 18.1 | % | 13,320 | 19.4 | % | ||||||||||
Consolidated | 147,739 | 100.0 | % | 68,630 | 100.0 | % | ||||||||||
| (1) | Expressed in millions of Mexican pesos, except for percentages. |
| (2) | Includes |
| (3) |
Corporate History
In 1979, one of our subsidiaries acquired certain sparkling beverage bottlers that are now a part of Coca-Cola FEMSA’s company. At that time, the acquired bottlers had 13 Mexican distribution centers operating 701 distribution routes, and their production capacity was 83 million cases. In 1991, we transferred our ownership in the bottlers to FEMSA Refrescos, S.A. de C.V., the corporate predecessor to Coca-Cola FEMSA, S.A.B. de C.V.
In June 1993, a subsidiary of The Coca-Cola Company subscribed for 30% of Coca-Cola FEMSA’s capital stock in the form of Series D shares for US$ 195 million. In September 1993, we sold Series L shares that represented 19% of Coca-Cola FEMSA’s capital stock to the public, and Coca-Cola FEMSA listed these shares on the Mexican Stock Exchange and, in the form of ADSs, on the New York Stock Exchange. In a series of transactions between 1994 and 1997, Coca-Cola FEMSA acquired territories in Argentina and additional territories in southern Mexico.
In May 2003, Coca-Cola FEMSA acquired Panamerican Beverages, or Panamco, and began producing and distributingCoca-Cola trademark beverages in additional territories in the central and gulf regions of Mexico and in Central America (Guatemala, Nicaragua, Costa Rica and Panama), Colombia, Venezuela and Brazil, along with bottled water, beer and other beverages in some of these territories. As a result of the acquisition, the interest of The Coca-Cola Company in the capital stock of Coca-Cola FEMSA’s company increased from 30.0% to 39.6%.
During August 2004, Coca-Cola FEMSA conducted a rights offering to allow existing holders of Coca-Cola FEMSA’s Series L shares and ADSs to acquire newly issued Series L shares in the form of Series L shares and ADSs, respectively, at the same price per share at which we and The Coca-Cola Company subscribed in connection with the Panamco acquisition.
In November 2006, we acquired, through a subsidiary, 148,000,000 of Coca-Cola FEMSA’s Series D shares from certain subsidiaries of The Coca-Cola Company representing 9.4% of the total outstanding voting shares and 8.0% of the total outstanding equity of Coca-Cola FEMSA, at a price of US$ 2.888 per share for an aggregate amount of US$ 427.4 million. With this purchase, we increased our ownership to 53.7% of Coca-Cola FEMSA’s capital stock. Pursuant to Coca-Cola FEMSA’s bylaws, the acquired shares were converted from Series D shares to Series A shares.
In November 2007, Administración, S.A.P.I. de C.V., or Administración, a Mexican company owned directly and indirectly by Coca-Cola FEMSA and The Coca-Cola Company, acquired 100% of the shares of capital stock of Jugos del Valle, S.A.P.I. de C.V. The business of Jugos del Valle in the United States was acquired and sold by The Coca-Cola Company. In 2008, Coca-Cola FEMSA, The Coca-Cola Company and all Mexican and BrazilianCoca-Cola bottlers entered into a joint business for the Mexican and Brazilian operations, respectively, of Jugos del Valle. Taking into account the participation held by Grupo Fomento Queretano, Coca-Cola FEMSA currently holds an interest of 25.1% in the Mexican joint business and approximately 19.7% in the Brazilian joint businesses. Jugos del Valle sells fruit juice-based beverages and fruit derivatives.
In December 2007 and May 2008, Coca-Cola FEMSA sold most of its proprietary brands to The Coca-Cola Company. The proprietary brands are now being licensed back to Coca-Cola FEMSA by The Coca-Cola Company pursuant to Coca-Cola FEMSA’s bottler agreements. The December 2007 transaction was valued at US$ 48 million and the May 2008 transaction was valued at US$ 16 million. Revenues from the sale of proprietary brands in which Coca-Cola FEMSA has a significant continuing involvement are deferred and amortized against the related costs of future sales over the estimated sales period.
In May 2008, Coca-Cola FEMSA entered into a transaction with The Coca-Cola Company to acquire its wholly owned bottling franchise Refrigerantes Minas Gerais, Ltda., or REMIL, located in the State of Minas Gerais in Brazil, for a purchase price of US$ 364.1 million. Coca-Cola FEMSA began to consolidate REMIL in its financial statements in June 2008.
In July 2008, Coca-Cola FEMSA acquired the Agua De Los Angeles bulk water business in the Valley of Mexico (Mexico City and surrounding areas) from Grupo Embotellador CIMSA, S.A. de C.V., at the time one of the Coca-Cola bottling franchises in Mexico, for a purchase price of US$ 18.3 million. The trademarks remain with The Coca-Cola Company. Coca-Cola FEMSA subsequently merged Agua De Los Angeles into its bulk water business under theCiel brand.
In February 2009, Coca-Cola FEMSA acquired with The Coca-Cola Company the Brisa bottled water business in Colombia from Bavaria, S.A., a subsidiary of SABMiller plc. Coca-Cola FEMSA acquired the production assets and the distribution territory, and The Coca-Cola Company acquired theBrisa brand. Coca-Cola FEMSA and The Coca-Cola Company equally shared in paying the purchase price of US$ 92 million. Following a transition period, in June 2009, Coca-Cola FEMSA started to sell and distribute theBrisa portfolio of products in Colombia.
In May 2009, Coca-Cola FEMSA entered into an agreement to begin selling theCrystal trademark water products in Brazil jointly with The Coca-Cola Company.
In August 2010, Coca-Cola FEMSA acquired from The Coca-Cola Company, along with other BrazilianCoca-Cola bottlers, the business operations of theMatte Leaotea brand. As of March 31, 2013, Coca-Cola FEMSA had a 19.4% indirect interest in the Matte Leao business in Brazil.
In March 2011, Coca-Cola FEMSA acquired with The Coca-Cola Company, through Compañía Panameña de Bebidas S.A.P.I. de C.V., Estrella Azul, a Panamanian conglomerate that participates in the dairy and juice-based beverage categories in Panama. Coca-Cola FEMSA will continue to develop this business with The Coca-Cola Company.
In October 2011, Coca-Cola FEMSA closed its merger with the beverage division of Grupo Tampico, one of the largest family-ownedCoca-Cola bottlers calculated by sales volume in Mexico. This franchise territory operates in the states of Tamaulipas, San Luis Potosí, and Veracruz, as well as in parts of the states of Hidalgo, Puebla and Queretaro, and sold 155.7 million unit cases of beverages in 2011. The aggregate enterprise value of this transaction was Ps. 9,300 million and Coca-Cola FEMSA issued a total of 63.5 million new Series L shares in connection with this transaction. Coca-Cola FEMSA began to consolidate the beverage division of Grupo Tampico in its financial statements as of October 2011.
In December 2011, Coca-Cola FEMSA closed its merger with Grupo CIMSA, a Mexican family-ownedCoca-Cola bottler with operations mainly in the states of Morelos and Mexico, as well as in parts of the states of Guerrero and Michoacán. This franchise territory sold 154.8 million unit cases of beverages in 2011. The aggregate enterprise value of this transaction was Ps. 11,000 million and Coca-Cola FEMSA issued a total of 75.4 million new Series L shares in connection with this transaction. Coca-Cola FEMSA began to consolidate Grupo CIMSA in its financial statements as of December 2011. As part of Coca-Cola FEMSA’s merger with Grupo CIMSA, it also acquired a 13.2% equity interest in Piasa.
In May 2012, Coca-Cola FEMSA closed its merger with Grupo Fomento Queretano, one of the oldest family-owned beverage players in theCoca-Cola system in Mexico, with operations mainly in the state of Querétaro, as well as in parts of the states of Mexico, Hidalgo and Guanajuato. Coca-Cola FEMSA sold approximately 74 million unit cases of beverages in this franchise territory during 2012. The aggregate enterprise value of this transaction was Ps. 6,600 million and Coca-Cola FEMSA issued a total of 45.1 million new Series L shares in connection with this transaction. Coca-Cola FEMSA began to consolidate Grupo Fomento Queretano in its financial statements as of May 2012. As part of Coca-Cola FEMSA’s merger with Grupo Fomento Queretano it also acquired an additional 12.9% equity interest in Piasa.
In August 2012, Coca-Cola FEMSA acquired, through Jugos del Valle, an indirect participation in Santa Clara, an important producer of milk and dairy products in Mexico. Coca-Cola FEMSA currently owns an indirect participation of 23.8% in Santa Clara.
Recent Acquisitions
In December 2012, Coca-Cola FEMSA reached an agreement with The Coca-Cola Company to acquire a 51% non-controlling majority stake of CCBPI for US$ 688.5 million in an all-cash transaction. Coca-Cola FEMSA closed this transaction on January 25, 2013. The implied enterprise value of 100% of CCBPI is US$ 1,350 million. Coca-Cola FEMSA will have an option to acquire all of the remaining 49% of the capital stock of CCBPI at any time during the seven years following the closing, at the same enterprise value adjusted for a carrying cost and certain other adjustments. Coca-Cola FEMSA will have a put option, exercisable six years after the initial closing, to sell its ownership in CCBPI back to The Coca-Cola Company at a price that will be calculated using the same EBITDA multiple used in the acquisition of the 51% stake of CCBPI, capped at the aggregate enterprise value for the amount acquired, adjusted for certain items. Coca-Cola FEMSA will be managing the day-to-day operations of the business. The Coca-Cola Company will have certain rights on the operational business plan. Given the terms of both the options agreements and Coca-Cola FEMSA’s shareholders agreement with The Coca-Cola Company, Coca-Cola FEMSA will not consolidate the results of CCBPI. Coca-Cola FEMSA will recognize the results of CCBPI using the equity method. CCBPI sold approximately 531 million unit cases of beverages during 2012 and generated revenues of approximately US$ 1.1 billion.
In January 2013, Coca-Cola FEMSA entered into an agreement to merge Grupo Yoli into its company. Grupo Yoli operates mainly in the state of Guerrero, Mexico as well as in parts of the state of Oaxaca, Mexico. The merger agreement was approved by both Coca-Cola FEMSA’s and Grupo Yoli’s boards of directors and is subject to the approval of theComisión Federal de Competencia (the Mexican Antitrust Comission, or CFC) and the shareholders’ meetings of both companies. Grupo Yoli sold approximately 99 million unit cases in 2012. The aggregate enterprise value of this transaction was Ps. 8,806 million. Coca-Cola FEMSA will issue approximately 42.4 million new Series L shares to the shareholders of Grupo Yoli once the transaction closes. As part of this transaction, Coca-Cola FEMSA will increase its participation in Piasa by 9.5%. Coca-Cola FEMSA expects to close this transaction in the second quarter of 2013.
Capital Stock
As of March 31, 2013, we indirectly owned Series A Shares equal to 48.9% of Coca-Cola FEMSA’s capital stock (63.0% of Coca-Cola FEMSA’s shares with full voting rights). As of March 31, 2013, The Coca-Cola Company indirectly owned Series D shares equal to 28.7% of the capital stock of Coca-Cola FEMSA’s company (37.0% of Coca-Cola FEMSA’s shares with full voting rights). Series L shares with limited voting rights, which trade on the Mexican Stock Exchange and in the form of ADSs on the New York Stock Exchange, constitute the remaining 22.4% of Coca-Cola FEMSA’s capital stock.
Business Strategy
In August 2011, Coca-Cola FEMSA restructured its operations under two new divisions: (1) Mexico & Central America and (2) South America, creating a more flexible structure to execute its strategies and extend its track record of growth. Previously, Coca-Cola FEMSA managed its business under three divisions—Mexico, Latincentro and Mercosur. With this new business structure, Coca-Cola FEMSA aligned its business strategies more efficiently, ensuring a faster introduction of new products and categories, and a more rapid and effective design and deployment of commercial models.
Coca-Cola FEMSA operates with a large geographic footprint in Latin America, in two divisions:
Mexico and Central America (covering certain territories in Mexico and Guatemala, and all of Nicaragua, Costa Rica and Panama); and
South America (covering certain territories in Brazil and Argentina, and all of Colombia and Venezuela).
One of Coca-Cola FEMSA’s goals is to maximize growth and profitability to create value for its shareholders. Coca-Cola FEMSA’s efforts to achieve this goal are based on: (1) transforming its commercial models to focus on its customers’ value potential and using a value-based segmentation approach to capture the industry’s value potential, (2) implementing multi-segmentation strategies in its major markets to target distinct market clusters divided by consumption occasion, competitive intensity and socioeconomic levels; (3) implementing well-planned product, packaging and pricing strategies through different distribution channels; (4) driving product innovation along its different product categories; (5) developing new businesses and distribution channels, and (6) achieving the full operating potential of its commercial models and processes to drive operational efficiencies throughout its company. To achieve these goals, Coca-Cola FEMSA intends to continue to focus its efforts on, among other initiatives, the following:
working with The Coca-Cola Company to develop a business model to continue exploring and participating in new lines of beverages, extending existing product lines and effectively advertising and marketing Coca-Cola FEMSA’s products;
developing and expanding Coca-Cola FEMSA’s still beverage portfolio through innovation, strategic acquisitions and by entering into agreements to acquire companies with The Coca-Cola Company;
expanding Coca-Cola FEMSA’s bottled water strategy with The Coca-Cola Company through innovation and selective acquisitions to maximize profitability across Coca-Cola FEMSA’s market territories;
strengthening Coca-Cola FEMSA’s selling capabilities and go-to-market strategies, including pre-sale, conventional selling and hybrid routes, in order to get closer to Coca-Cola FEMSA’s clients and help them satisfy the beverage needs of consumers;
| • | implementing selective packaging strategies designed to |
replicating Coca-Cola FEMSA’s best practices throughout the value chain;
rationalizing and adapting Coca-Cola FEMSA’s organizational and asset structure in order to be in a better position to respond to a changing competitive environment;
committing to building a multi-cultural collaborative team, from top to bottom; and
broadening Coca-Cola FEMSA’s geographic footprint through organic growth and strategic joint ventures, mergers and acquisitions.
Coca-Cola FEMSA seeks to increase per capita consumption of its products in the territories in which it operates. To that end, Coca-Cola FEMSA’s marketing teams continuously develop sales strategies tailored to the different characteristics of its various territories and distribution channels. Coca-Cola FEMSA continues to develop its product portfolio to better meet market demand and maintain its overall profitability. To stimulate and respond to consumer demand, Coca-Cola FEMSA continues to introduce new categories, products and presentations.See “—Product and Packaging Mix.” In addition, because Coca-Cola FEMSA views its relationship with The Coca-Cola Company as integral to Coca-Cola FEMSA’s business, Coca-Cola FEMSA uses market information systems and strategies developed with The Coca-Cola Company to improve Coca-Cola FEMSA’s business and marketing strategies.See “Marketing.”
Coca-Cola FEMSA also continuously seeks to increase productivity in its facilities through infrastructure and process reengineering for improved asset utilization. Coca-Cola FEMSA’s capital expenditure program includes investments in production and distribution facilities, bottles, cases, coolers and information systems. Coca-Cola FEMSA believes that this program will allow it to maintain its capacity and flexibility to innovate and to respond to consumer demand for its products.
Coca-Cola FEMSA focuses on management quality as a key element of its growth strategy and remains committed to fostering the development of quality management at all levels. Both we and The Coca-Cola Company provide Coca-Cola FEMSA with managerial experience. To build upon these skills, the board of directors has allocated a portion of Coca-Cola FEMSA’s operating budget to pay for management training programs designed to enhance its executives’ abilities and provide a forum for exchanging experiences, know-how and talent among an increasing number of multinational executives from Coca-Cola FEMSA’s new and existing territories.
Sustainable development is a comprehensive part of Coca-Cola FEMSA’s strategic framework for business operation and growth. Coca-Cola FEMSA bases its efforts in its Corporate Values and Ethics. Coca-Cola FEMSA focuses on three core areas, (i) its people, by encouraging the development of its employees and their families; (ii) its communities, by promoting development in the communities it serves, an attitude of health, self-care, adequate nutrition and physical activity, and evaluating the impact of its value chain; and (iii) its planet, by establishing guidelines that it believes will result in efficient use of natural resources to minimize the impact that its operations might have on the environment and create a broader awareness of caring for its environment.
Coca-Cola FEMSA’s Territories
The following map shows Coca-Cola FEMSA’s territories, giving estimates in each case of the population to which Coca-Cola FEMSA offers products, the number of retailers of Coca-Cola FEMSA’s beverages and the per capita consumption of Coca-Cola FEMSA’s beverages as of December 31, 2012:
Per capita consumption data for a territory is determined by dividing total beverage sales volume within the territory (in bottles, cans, and fountain containers) by the estimated population within such territory, and is expressed on the basis of the number of eight-ounce servings of Coca-Cola FEMSA’s products consumed annually per capita. In evaluating the development of local volume sales in Coca-Cola FEMSA’s territories and to determine product potential, Coca-Cola FEMSA and The Coca-Cola Company measure, among other factors, the per capita consumption of all Coca-Cola FEMSA’s beverages.
Coca-Cola FEMSA’s Products
Coca-Cola FEMSA produces, markets, sells and distributesCoca-Cola trademark beverages. TheCoca-Cola trademark beverages include: sparkling beverages (colas and flavored sparkling beverages), waters, and still beverages (including juice drinks, coffee, teas, milk, value-added dairy and isotonic). The following table sets forth Coca-Cola FEMSA’s main brands as of December 31, 2012:
Colas: | Mexico and Central America(1) | South America(2) | Venezuela | |||
Coca-Cola | ü | ü | ü | |||
Coca-Cola Light | ü | ü | ü | |||
Coca-Cola Zero | ü | ü | ||||
Flavored sparkling beverages: | Mexico and Central America(1) | South America(2) | Venezuela | |||
Ameyal | ü | |||||
Canada Dry | ü | |||||
Chinotto | ü | |||||
Crush | ü | |||||
Escuis | ü | |||||
Fanta | ü | ü | ||||
Fresca | ü | |||||
Frescolita | ü | ü | ||||
Hit | ü | |||||
Kist | ü | |||||
Kuat | ü | |||||
Lift | ü | |||||
Mundet | ü | |||||
Quatro | ü | |||||
Schweppes | ü | ü | ü | |||
Simba | ü | |||||
Sprite | ü | ü | ||||
Victoria | ü | |||||
Yoli | ü | |||||
Water: | Mexico and Central America(1) | South America(2) | Venezuela | |||
Alpina | ü | |||||
Aquarius(3) | ü | |||||
Bonaqua | ü | |||||
Brisa | ü | |||||
Ciel | ü | |||||
Crystal | ü | |||||
Dasani | ü | |||||
Manantial | ü | |||||
Nevada | ü | |||||
Other Categories: | Mexico and Central America(1) | South America(2) | Venezuela | |||
Cepita | ü | |||||
Del Prado(4) | ü | |||||
Estrella Azul(5) | ü | |||||
FUZE Tea | ü | ü | ||||
Hi-C(6) | ü | ü | ||||
Leche Santa Clara(5) | ü | |||||
Jugos del Valle(7) | ü | ü | ü | |||
Matte Leao(8) | ü | |||||
Powerade(9) | ü | ü | ü | |||
Valle Frut(10) | ü | ü | ü | |||
| (1) | Includes Mexico, Guatemala, Nicaragua, Costa Rica and Panama |
| (2) | Includes Colombia, Brazil and Argentina |
| (3) | Flavored water. In Brazil, also flavored sparkling beverage |
| (4) |
| (5) |
| (6) | Juice-based beverage. IncludesHi-C Orangeade in Argentina |
| (7) | Juice-based beverage |
| (8) | Ready to drink tea |
| (9) | Isotonic |
| (10) | Orangeade. IncludesDel Valle Freshin Costa Rica, Nicaragua, Panama, Colombia and Venezuela |
Sales Overview
Coca-Cola FEMSA measures total sales volume in terms of unit cases. “Unit case” refers to 192 ounces of finished beverage product (24 eight-ounce servings) and, when applied to soda fountains, refers to the volume of syrup, powders and concentrate that is required to produce 192 ounces of finished beverage product. The following table illustrates Coca-Cola FEMSA’s historical sales volume for each of its territories.
| Sales Volume Year Ended December 31, | ||||||||||||
| 2012 | 2011 | 2010 | ||||||||||
| (millions of unit cases) | ||||||||||||
Mexico and Central America | ||||||||||||
Mexico(1) | 1,720.3 | 1,366.5 | 1,242.3 | |||||||||
Central America(2) | 151.2 | 144.3 | 137.0 | |||||||||
South America (excluding Venezuela) | ||||||||||||
Colombia | 255.8 | 252.1 | 244.3 | |||||||||
Brazil(3) | 494.2 | 485.3 | 475.6 | |||||||||
Argentina | 217.0 | 210.7 | 189.3 | |||||||||
Venezuela | 207.7 | 189.8 | 211.0 | |||||||||
|
|
|
|
|
| |||||||
Consolidated Volume | 3,046.2 | 2,648.7 | 2,499.5 | |||||||||
| (1) | Includes results of Grupo Fomento Queretano from May 2012, Grupo CIMSA from December 2011 and Grupo Tampico from October 2011. |
| (2) | Includes Guatemala, Nicaragua, Costa Rica and Panama. |
| (3) | Excludes beer sales volume. |
Product and Packaging Mix
Out of the more than 121 brands and line extensions of beverages that Coca-Cola FEMSA sells and distributes, Coca-Cola FEMSA’s most important brand, Coca-Cola, together with its line extensions,Coca-Cola Light andCoca-Cola Zero, accounted for 60.2% of total sales volume in 2012. Coca-Cola FEMSA’s next largest brands,Ciel(a water brand from Mexico and its line extensions),Fanta (and its line extensions),ValleFrut (and its line extensions), andSprite (and its line extensions) accounted for 12.8%, 4.7%, 2.6% and 2.6%, respectively, of total sales volume in 2012. Coca-Cola FEMSA uses the term line extensions to refer to the different flavors in which Coca-Cola FEMSA offers its brands. Coca-Cola FEMSA produces, markets, sells and distributesCoca-Cola trademark beverages in each of its territories in containers authorized by The Coca-Cola Company, which consist of a variety of returnable and non-returnable presentations in the form of glass bottles, cans and plastic bottles mainly made of polyethylene terephthalate, which we refer to as PET.
Coca-Cola FEMSA uses the term presentation to refer to the packaging unit in which Coca-Cola FEMSA sells its products. Presentation sizes for Coca-Cola FEMSA’sCoca-Cola trademark beverages range from a 6.5-ounce personal size to a 3-liter multiple serving size. For all of Coca-Cola FEMSA’s products excluding water, Coca-Cola FEMSA considers a multiple serving size as equal to, or larger than, 1.0 liter. In general, personal sizes have a higher price per unit case as compared to multiple serving sizes. Coca-Cola FEMSA offers both returnable and non-returnable presentations, which allows it to offer portfolio alternatives based on convenience and affordability to implement revenue management strategies and to target specific distribution channels and population segments in its territories. In addition, Coca-Cola FEMSA sells someCoca-Cola trademark beverage syrups in containers designed for soda fountain use, which we refer to as fountain. Coca-Cola FEMSA also sells bottled water products in bulk sizes, which refer to presentations equal to or larger than 5 liters, which have a much lower average price per unit case than Coca-Cola FEMSA’s other beverage products.
ResultsThe characteristics of Coca-Cola FEMSA’s territories are very diverse. Central Mexico and Coca-Cola FEMSA’s territories in Argentina are densely populated and have a large number of competing beverage brands as compared to the rest of Coca-Cola FEMSA’s territories. Coca-Cola FEMSA’s territories in Brazil are densely populated but have lower per capita consumption of beverage products as compared to Mexico. Portions of southern Mexico, Central America and Colombia are large and mountainous areas with lower population density, lower per capita income and lower per capita consumption of beverages. In Venezuela, Coca-Cola FEMSA faces operational disruptions from operationstime to time, which may have an effect on its volumes sold, and consequently, may result in lower per capita consumption.
The following discussion analyzes Coca-Cola FEMSA’s product and packaging mix by reporting segment. The volume data presented is for the Year Ended December 31, 2010 Comparedyears 2012, 2011 and 2010.
Mexico and Central America.Coca-Cola FEMSA’s product portfolio consists ofCoca-Cola trademark beverages. In 2008, as part of Coca-Cola FEMSA’s efforts to strengthen its multi-category beverage portfolio, Coca-Cola FEMSA incorporated theJugos del Valle line of juice-based beverages in Mexico and subsequently in Central America.In 2012, Coca-Cola FEMSA launchedFUZETea in the Year Ended December 31, 2009division. Per capita consumption of Coca-Cola FEMSA’s beverage products in Mexico and Central America was 650 and 182 eight-ounce servings, respectively, in 2012.
FEMSA ConsolidatedThe following table highlights historical sales volume and mix in Mexico and Central America for Coca-Cola FEMSA’s products:
Under Mexican FRS, we reclassified our financial statements to reflect FEMSA Cerveza as
| Year Ended December 31, | ||||||||||||
| 2012 | 2011 | 2010 | ||||||||||
Total Sales Volume(1) | ||||||||||||
Total (millions of unit cases) | 1,871.5 | 1,510.8 | 1,379.3 | |||||||||
Growth (%) | 23.9 | 9.5 | 1.2 | |||||||||
| (in percentages) | ||||||||||||
Unit Case Volume Mix by Category | ||||||||||||
Sparkling beverages | 73.0 | 74.9 | 75.2 | |||||||||
Water(2) | 21.4 | 19.7 | 19.4 | |||||||||
Still beverages | 5.6 | 5.4 | 5.4 | |||||||||
|
|
|
|
|
| |||||||
Total | 100.0 | 100.0 | 100.0 | |||||||||
|
|
|
|
|
| |||||||
| (1) | Includes results from the operations of Grupo Fomento Queretano from May 2012, Grupo CIMSA from December 2011 and Grupo Tampico from October 2011. |
| (2) | Includes bulk water volumes. |
In 2012, multiple serving presentations represented 66.2% of total sparkling beverages sales volume in Mexico, a discontinued operation.
Total Revenues
FEMSA’s consolidated total revenues increased 5.9% to Ps. 169,702 million in 2010140 basis points decrease compared to Ps. 160,251 million2011; and 56.1% of total sparkling beverages sales volume in 2009. All of FEMSA’s beverage and retail operations contributed positivelyCentral America, a 40 basis points increase compared to this revenue growth.2011. Coca-Cola FEMSA’s total revenues increased 0.7%strategy is to Ps. 103,456 million, driven by the revenue growth in our Mercosur and Mexico divisions. FEMSA Comercio’s revenues increased 16.3% to Ps. 62,259 million, mainly driven by the openingfoster consumption of 1,092 net new stores combined with an average increase of 5.2% in same-store sales.
Gross Profit
Consolidated gross profit increased 4.5% to Ps. 70,970 million in 2010 compared to Ps. 67,938 million in 2009, driven by FEMSA Comercio. Gross margin contracted by 0.6 percentage points, from 42.4% of consolidated total revenues in 2009 to 41.8% in 2010single serve presentations while maintaining multiple serving volumes. In 2012, returnable packaging, as the faster growth of lower-margin FEMSA Comercio tends to compress FEMSA’s consolidated margins over time. Gross margin improvement at FEMSA Comercio partially offset raw-material cost pressures at Coca-Cola FEMSA.
Income from Operations
Consolidated operating expenses increased 3.5% to Ps. 48,441 million in 2010 compared to Ps. 46,808 million in 2009. The majority of this increase resulted from additional operating expenses at FEMSA Comercio, due to an accelerated store expansion. As a percentage of total revenues, consolidated operating expensessparkling beverage sales volume, accounted for 33.7% in Mexico, a 200 basis points increase compared to 2011; and 33.6% in Central America, a 190 basis points increase compared to 2011.
In 2012, Coca-Cola FEMSA’s sparkling beverages decreased as a percentage of its total sales volume from 29.2%74.9% in 2011 to 73.0% in 2012, mainly due to the integration of Grupo Tampico, Grupo CIMSA and Grupo Fomento Queretano in Mexico, which have a higher mix of bulk water in their portfolios.
In 2012, Coca-Cola FEMSA’s most popular sparkling beverage presentations in Mexico were the 2.5-liter returnable plastic bottle, the 3.0-liter non-returnable plastic bottle and the 0.6-liter non-returnable plastic bottle (the 20-ounce bottle that is also popular in the United States) which together accounted for 51.2% of total sparkling beverage sales volume in Mexico.
Total sales volume reached 1,871.5 million unit cases in 2012, an increase of 23.9% compared to 1,510.8 million unit cases in 2011. The non-comparable effect of the integration of Grupo Tampico, Grupo CIMSA and Grupo Fomento Queretano in Mexico contributed 332.7 million unit cases in 2012 of which 62.5% were sparkling beverages, 5.1% bottled water, 27.9% bulk water and 4.5% still beverages. Excluding the integration of these territories, volume grew 1.9% to 1,538.8 million unit cases. Organically sparkling beverages sales volume increased 2.5% as compared to 2011. The bottled water category, including bulk water, decreased 2.6%. The still beverage category increased 8.9%.
South America (Excluding Venezuela). Coca-Cola FEMSA’s product portfolio in South America consists mainly ofCoca-Cola trademark beverages and theKaiser beer brands in Brazil, which Coca-Cola FEMSA sells and distributes. In 2008, as part of Coca-Cola FEMSA’s efforts to strengthen its multi-category beverage portfolio, it incorporated theJugos del Valle line of juice-based beverages in Colombia. This line of beverages was relaunched in Brazil in 2009 as well. The acquisition ofBrisain 2009 helped Coca-Cola FEMSA to 28.5%become the leader, calculated by sales volume, in 2010.the water market in Colombia.
Consolidated administrative expenses decreased 0.9%In 2010, Coca-Cola FEMSA incorporated ready to Ps. 7,766drink beverages under theMatte Leao brand in Brazil. During 2011, as part of Coca-Cola FEMSA’s continuous effort to develop non-carbonated beverages, Coca-Cola FEMSA launchedCepita in non-returnable polyethylene terephthalate (“PET”) bottles andHi-C, an orangeade, both in Argentina. Since 2009, as part of Coca-Cola FEMSA’s efforts to foster sparkling beverage per capita consumption in Brazil, Coca-Cola FEMSA re-launched a 2.0-liter returnable plastic bottle for theCoca-Cola brand and introduced two single-serve 0.25-liter presentations. Per capita consumption of Coca-Cola FEMSA’s beverages in Colombia, Brazil and Argentina was 130, 264 and 404 eight-ounce servings, respectively, in 2012.
The following table highlights historical total sales volume and sales volume mix in South America (excluding Venezuela), not including beer:
| Year Ended December 31, | ||||||||||||
| 2012 | 2011 | 2010 | ||||||||||
Total Sales Volume | ||||||||||||
Total (millions of unit cases) | 967.0 | 948.1 | 909.2 | |||||||||
Growth (%) | 2.0 | 4.3 | 11.2 | |||||||||
| (in percentages) | ||||||||||||
Unit Case Volume Mix by Category | ||||||||||||
Sparkling beverages | 84.9 | 85.9 | 85.5 | |||||||||
Water(1) | 10.0 | 9.2 | 10.1 | |||||||||
Still beverages | 5.1 | 4.9 | 4.4 | |||||||||
|
|
|
|
|
| |||||||
Total | 100.0 | 100.0 | 100.0 | |||||||||
|
|
|
|
|
| |||||||
| (1) | Includes bulk water volume. |
Total sales volume was 967.0 million unit cases in 20102012, an increase of 2.0% compared to Ps. 7,835948.1 million unit cases in 2009. As2011. Growth in sparkling beverages, mainly driven by sales of theCoca-Cola brand in Argentina and theFanta brand in Brazil and Colombia, accounted for the largest component of growth during the year. Coca-Cola FEMSA’s growth in still beverages was primarily driven by theJugos del Valle line of products in Brazil and theCepita juice brand in Argentina. The growth in sales volume of Coca-Cola FEMSA’s water portfolio, including bulk water, was driven mainly by theCrystal brand in Brazil and theBrisa brand in Colombia.
In 2012, returnable packaging, as a percentage of total revenues, consolidated administrative expenses remained stable at 4.6%sparkling beverage sales volume, accounted for 40.4% in 2010 compared with 4.9% in 2009.
Consolidated selling expenses increased 4.4% to Ps. 40,675 million in 2010Colombia, remaining flat as compared to 2011; 28.9% in Argentina, an increase of 110 basis points and 14.4% in Brazil, a 150 basis points decrease compared to 2011. In 2012, multiple serving presentations represented 62.9%, 72.5% and 85.2% of total sparkling beverages sales volume in Colombia, Brazil and Argentina, respectively.
Coca-Cola FEMSA continues to distribute and sell theKaiser beer portfolio in its Brazilian territories through the 20-year term, consistent with the arrangements in place since 2006 with Cervejarias Kaiser, a subsidiary of the Heineken Group prior to the acquisition of Cervejarias Kaiser by Cuauhtémoc Moctezuma Holding, S.A. de C.V., formerly known as FEMSA Cerveza. Beginning in the second quarter of 2005, Coca-Cola FEMSA ceased including beer that it distributes in Brazil in its reported sales volumes. On April 30, 2010, the transaction pursuant to which we exchanged 100% of our beer operations for a 20% economic interest in the Heineken Group closed.
Venezuela. Coca-Cola FEMSA’s product portfolio in Venezuela consists ofCoca-Cola trademark beverages. Per capita consumption of Coca-Cola FEMSA’s beverages in Venezuela during 2012 was 164 eight-ounce servings. At the end of 2011, Coca-Cola FEMSA launchedDel Valle Fresh, an orangeade, in Venezuela, which contributed significantly to incremental volume growth in this country during 2012. During 2012, Coca-Cola FEMSA launched two new presentations for Coca-Cola FEMSA’s sparkling beverage portfolio: a 0.355-liter non-returnable PET presentation and a 1-liter non-returnable PET presentation.
The following table highlights historical total sales volume and sales volume mix in Venezuela:
| Year Ended December 31, | ||||||||||||
| 2012 | 2011 | 2010 | ||||||||||
Total Sales Volume | ||||||||||||
Total (millions of unit cases) | 207.7 | 189.8 | 211.0 | |||||||||
Growth (%) | 9.4 | (10.0 | ) | (6.3 | ) | |||||||
| (in percentages) | ||||||||||||
Unit Case Volume Mix by Category | ||||||||||||
Sparkling beverages | 87.9 | 91.7 | 91.3 | |||||||||
Water(1) | 5.6 | 5.4 | 6.5 | |||||||||
Still beverages | 6.5 | 2.9 | 2.2 | |||||||||
|
|
|
|
|
| |||||||
Total | 100.0 | 100.0 | 100.0 | |||||||||
|
|
|
|
|
| |||||||
| (1) | Includes bulk water volume. |
Coca-Cola FEMSA has implemented a product portfolio rationalization strategy that allows it to minimize the impact of certain operating disruptions that have been recurrent in Venezuela over the last several years. During 2011, Coca-Cola FEMSA faced a 26-day strike at one of its Venezuelan production and distribution facilities and a difficult economic environment that prevented it from growing sales volume of Coca-Cola FEMSA’s products. As a result, Coca-Cola FEMSA’s sparkling beverage volume decreased by 9.6%.
In 2012, multiple serving presentations represented 79.9% of total sparkling beverages sales volume in Venezuela, a 140 basis points increase compared to 2011. In 2012, returnable presentations represented 7.5% of total sparkling beverages sales volume in Venezuela, a 50 basis points decrease compared to 2011. Total sales volume was 207.7 million unit cases in 2012, an increase of 9.4% compared to 189.8 million unit cases in 2011.
Seasonality
Sales of Coca-Cola FEMSA’s products are seasonal, as Coca-Cola FEMSA’s sales levels generally increase during the summer months of each country and during the Christmas holiday season. In Mexico, Central America, Colombia and Venezuela, Coca-Cola FEMSA typically achieves its highest sales during the summer months of April through September as well as during the Christmas holidays in December. In Brazil and Argentina, Coca-Cola FEMSA’s highest sales levels occur during the summer months of October through March and the Christmas holidays in December.
Marketing
Coca-Cola FEMSA, in conjunction with The Coca-Cola Company, has developed a marketing strategy to promote the sale and consumption of Coca-Cola FEMSA’s products. Coca-Cola FEMSA relies extensively on advertising, sales promotions and retailer support programs to target the particular preferences of Coca-Cola FEMSA’s consumers. Coca-Cola FEMSA’s consolidated marketing expenses in 2012, net of contributions by The Coca-Cola Company, were Ps. 38,9733,681 million. The Coca-Cola Company contributed an additional Ps. 3,018 million in 2009.2012, which mainly includes contributions for coolers, bottles and cases. Through the use of advanced information technology, Coca-Cola FEMSA has collected customer and consumer information that allows it to tailor its marketing strategies to target different types of customers located in each of its territories and to meet the specific needs of the various markets it serves.
Retailer Support Programs. Support programs include providing retailers with point-of-sale display materials and consumer sales promotions, such as contests, sweepstakes and the giveaway of product samples.
Coolers. Cooler distribution among retailers is important for the visibility and consumption of Coca-Cola FEMSA’s products and to ensure that they are sold at the proper temperature.
Advertising. Coca-Cola FEMSA advertises in all major communications media. Coca-Cola FEMSA focuses its advertising efforts on increasing brand recognition by consumers and improving its customer relations. National advertising campaigns are designed and proposed by The Coca-Cola Company’s local affiliates, with Coca-Cola FEMSA’s input at the local or regional level.
Channel Marketing. In order to provide more dynamic and specialized marketing of Coca-Cola FEMSA’s products, Coca-Cola FEMSA’s strategy is to classify its markets and develop targeted efforts for each consumer segment or distribution channel. Coca-Cola FEMSA’s principal channels are small retailers, “on-premise” consumption such as restaurants and bars, supermarkets and third party distributors. Presence in these channels entails a comprehensive and detailed analysis of the purchasing patterns and preferences of various groups of beverage consumers in each of the different types of locations or distribution channels. In response to this analysis, Coca-Cola FEMSA tailors its product, price, packaging and distribution strategies to meet the particular needs of and exploit the potential of each channel.
Multi-Segmentation. Coca-Cola FEMSA has been implementing a multi-segmentation strategy in the majority of its markets. This strategy consists of the implementation of different product/price/package portfolios by market cluster or group. These clusters are defined based on consumption occasion, competitive intensity and socio-economic levels, rather than solely on the types of distribution channels.
Client Value Management. Coca-Cola FEMSA has been transforming its commercial models to focus on its customers’ value potential using a value-based segmentation approach to capture the industry’s potential. Coca-Cola FEMSA started the rollout of this new model in its Mexico, Central America, Colombia and Brazil operations in 2009 and has covered close to 95% of its total volumes as of the end of 2012, including the later rollout in Argentina and, more recently, in Venezuela.
Coca-Cola FEMSA believes that the implementation of these strategies described above also enables it to respond to competitive initiatives with channel-specific responses as opposed to market-wide responses. In addition, it allows Coca-Cola FEMSA to be more efficient in the way it goes to market and invests its marketing resources in those segments that could provide a higher return. Coca-Cola FEMSA’s marketing, segmentation and distribution activities are facilitated by its management information systems. Coca-Cola FEMSA has invested significantly in creating these systems, including in hand-held computers to support the gathering of product, consumer and delivery information for most of its sales routes throughout its territories.
Product Sales and Distribution
The following table provides an overview of Coca-Cola FEMSA’s distribution centers and the retailers to which Coca-Cola FEMSA sells its products:
Product Distribution Summary
as of December 31, 2012
| Mexico and Central America(1) | South America(2) | Venezuela | ||||||||||
Distribution centers | 149 | 64 | 33 | |||||||||
Retailers(3) | 956,618 | 653,321 | 209,232 | |||||||||
| (1) | Includes Mexico, Guatemala, Nicaragua, Costa Rica and Panama. |
| (2) | Includes Colombia, Brazil and Argentina. |
| (3) | Estimated. |
Coca-Cola FEMSA continuously evaluates its distribution model in order to fit with the local dynamics of the marketplace and analyze the way it goes to market, recognizing different service needs from its customers, while looking for a more efficient distribution model. As part of this strategy, Coca-Cola FEMSA is rolling out a variety of new distribution models throughout its territories looking for improvements in its distribution network.
Coca-Cola FEMSA uses several sales and distribution models depending on market, geographic conditions and the customer’s profile: (1) the pre-sale system, which separates the sales and delivery functions, permitting trucks to be loaded with the mix of products that retailers have previously ordered, thereby increasing both sales and distribution efficiency, (2) the conventional truck route system, in which the person in charge of the delivery makes immediate sales from inventory available on the truck, (3) a hybrid distribution system, where the same truck carries product available for immediate sale and product previously ordered through the pre-sale system, (4) the telemarketing system, which could be combined with pre-sales visits and (5) sales through third-party wholesalers of Coca-Cola FEMSA’s products.
As part of the pre-sale system, sales personnel also provide merchandising services during retailer visits, which Coca-Cola FEMSA believes enhance the shopper experience at the point of sale. Coca-Cola FEMSA believes that an adequate number of service visits to retailers and frequency of deliveries are essential elements in an effective selling and distribution system for its products.
Coca-Cola FEMSA’s distribution centers range from large warehousing facilities and re-loading centers to small deposit centers. In addition to its fleet of trucks, Coca-Cola FEMSA distributes its products in certain locations through electric carts and hand-trucks in order to comply with local environmental and traffic regulations. In some of its territories, Coca-Cola FEMSA retains third parties to transport its finished products from the bottling plants to the distribution centers.
Mexico. Coca-Cola FEMSA contracts with one of our subsidiaries for the transportation of finished products to its distribution centers from its production facilities. From the distribution centers, Coca-Cola FEMSA then distributes its finished products to retailers through its own fleet of trucks.
In Mexico, Coca-Cola FEMSA sells a majority of its beverages at small retail stores to consumers who may take the beverages for consumption at home or elsewhere. Coca-Cola FEMSA also sells products through the “on-premise” consumption segment, supermarkets and other locations. The “on-premise” consumption segment consists of sales through sidewalk stands, restaurants, bars and various types of dispensing machines as well as sales through point-of-sale programs in stadiums, concert halls, auditoriums and theaters.
Brazil.In Brazil, Coca-Cola FEMSA sold 31.9% of its total sales volume through supermarkets in 2012. Also in Brazil, the delivery of Coca-Cola FEMSA’s finished products to customers is completed by a third party, while Coca-Cola FEMSA maintains control over the selling function. In designated zones in Brazil, third-party distributors purchase Coca-Cola FEMSA’s products at a discount from the wholesale price and resell the products to retailers.
Territories other than Mexico and Brazil. Coca-Cola FEMSA distributes its finished products to retailers through a combination of its own fleet of trucks and third party distributors. In most of Coca-Cola FEMSA’s territories, an important part of its total sales volume is sold through small retailers, with low supermarket penetration.
Competition
Although Coca-Cola FEMSA believes that its products enjoy wider recognition and greater consumer loyalty than those of its principal competitors, the markets in the territories in which Coca-Cola FEMSA operates are highly competitive. Coca-Cola FEMSA’s principal competitors are localPepsi bottlers and other bottlers and distributors of national and regional beverage brands. Coca-Cola FEMSA faces increased competition in many of its territories from producers of low price beverages, commonly referred to as “B brands.” A number of Coca-Cola FEMSA’s competitors in Central America, Venezuela, Brazil and Argentina offer beer in addition to sparkling beverages, still beverages, and water, which may enable them to achieve distribution efficiencies.
Price discounting and packaging have joined consumer sales promotions, customer service and non-price retailer incentives as the primary means of competition among bottlers. Coca-Cola FEMSA competes by seeking to offer products at an attractive price in the different segments in its markets and by building on the value of its brands. Coca-Cola FEMSA believes that the introduction of new products and new presentations has been a significant competitive technique that allows it to increase was attributabledemand for its products, provide different options to consumers and increase new consumption opportunities.
Mexico and Central America. Coca-Cola FEMSA’s principal competitors in Mexico are bottlers ofPepsi products, whose territories overlap but are not co-extensive with Coca-Cola FEMSA’s own. Coca-Cola FEMSA Comercio. Ascompetes with Organización Cultiba, S.A.B. de C.V., a percentagejoint venture recently formed by Grupo Embotelladoras Unidas, S.A.B. de C.V., the formerPepsi bottler in central and southeast Mexico, a subsidiary of PepsiCo, and Empresas Polar, S.A., the leading beer distributor andPepsi bottler in Venezuela. Coca-Cola FEMSA’s main competition in the juice category in Mexico is Grupo Jumex. In the water category,Bonafont, a water brand owned by Grupo Danone, is Coca-Cola FEMSA’s main competition. In addition, Coca-Cola FEMSA competes with Cadbury Schweppes in sparkling beverages and with other national and regional brands in Coca-Cola FEMSA’s Mexican territories, as well as low-price producers, such as Ajemex, S.A. de C.V. and Consorcio AGA, S.A. de C.V., that offer various presentations of sparkling and still beverages.
In the countries that comprise Coca-Cola FEMSA’s Central America region, Coca-Cola FEMSA’s main competitors arePepsi andBig Cola bottlers. In Guatemala and Nicaragua, Coca-Cola FEMSA competes with a joint venture between AmBev and The Central American Bottler Corporation. In Costa Rica, Coca-Cola FEMSA’s principal competitor is Florida Bebidas S.A., subsidiary of Florida Ice and Farm Co. In Panama, Coca-Cola FEMSA’s main competitor is Cervecería Nacional, S.A. Coca-Cola FEMSA also faces competition from “B brands” offering multiple serving size presentations in some Central American countries.
South America (excluding Venezuela). Coca-Cola FEMSA’s principal competitor in Colombia is Postobón, a well-established local bottler that sells flavored sparkling beverages (under the brandsPostobón andSpeed), some of which have a wide consumption preference, such asmanzana Postobón (apple Postobón), which is the second most popular flavor in the Colombian sparkling beverage industry in terms of total revenues, selling expenses decreased 0.3 percentage points from to 24.3%sales volume. Postobón also sellsPepsi products. Postobón is a vertically integrated producer, the owners of which hold other significant commercial interests in 2009 to 24.0% in 2010.
Consolidated income from operations increased 6.6% to Ps. 22,529 million in 2010 as compared to Ps. 21,130 million in 2009. This increase was driven by the results ofColombia. Coca-Cola FEMSA also competes with low-price producers, such as the producers ofBig Cola, which principally offer multiple serving size presentations in the sparkling and still beverage industry.
In Brazil, Coca-Cola FEMSA Comercio. Excluding one-time Heineken Transaction-related expenses, consolidated incomecompetes against AmBev, a Brazilian company with a portfolio of brands that includesPepsi, local brands with flavors such as guaraná, and proprietary beer brands. Coca-Cola FEMSA also competes against “B brands” or “Tubainas,” which are small, local producers of low-cost flavored sparkling beverages in multiple serving presentations that represent a significant portion of the sparkling beverage market.
In Argentina, Coca-Cola FEMSA’s main competitor is Buenos Aires Embotellador S.A. (BAESA), aPepsi bottler, which is owned by Argentina’s principal brewery, Quilmes Industrial S.A., and indirectly controlled by AmBev. In addition, Coca-Cola FEMSA competes with a number of competitors offering generic, low-priced sparkling beverages as well as many other generic products and private label proprietary supermarket brands.
Venezuela. In Venezuela, Coca-Cola FEMSA’s main competitor is Pepsi-Cola Venezuela, C.A., a joint venture formed between PepsiCo and Empresas Polar, S.A., the leading beer distributor in the country. Coca-Cola FEMSA also competes with the producers ofBig Cola in part of the country.
Raw Materials
Pursuant to Coca-Cola FEMSA’s bottler agreements, Coca-Cola FEMSA is authorized to manufacture, sell and distributeCoca-Cola trademark beverages within specific geographic areas, and it is required to purchase in some of its territories for allCoca-Cola trademark beverages concentrate from operations would have grown 8.7% in that period. Consolidated operating margin increased 0.1 percentage pointscompanies designated by The Coca-Cola Company and sweeteners from 13.2% in 2009, to 13.3%companies authorized by The Coca-Cola Company. Concentrate prices for sparkling beverages are determined as a percentage of the weighted average retail price in local currency net of applicable taxes. Although The Coca-Cola Company has the right to unilaterally set the price of concentrates, in practice this percentage has historically been set pursuant to periodic negotiations with The Coca-Cola Company.
As part of the cooperation framework that Coca-Cola FEMSA reached with The Coca-Cola Company at the end of 2006, The Coca-Cola Company provides a relevant portion of the funds derived from the concentrate increase for marketing support of Coca-Cola FEMSA’s sparkling and still beverages portfolio.
In addition to concentrate, Coca-Cola FEMSA purchases sweeteners, carbon dioxide, resin and preforms to make plastic bottles, finished plastic and glass bottles, cans, caps and fountain containers, as well as other packaging materials and raw materials. Sweeteners are combined with water to produce basic syrup, which is added to the concentrate as the sweetener for most of Coca-Cola FEMSA’s beverages. Coca-Cola FEMSA’s bottler agreements provide that, with respect toCoca-Colatrademark beverages, these materials may be purchased only from suppliers approved by The Coca-Cola Company, including affiliates of FEMSA. Prices for packaging materials and HFCS historically have been determined with reference to the U.S. dollar, although the local currency equivalent in a particular country is subject to price volatility in accordance with changes in exchange rates. Coca-Cola FEMSA’s most significant packaging raw material costs arise from the purchase of resin, plastic preforms to make plastic bottles and finished plastic bottles, which Coca-Cola FEMSA obtains from international and local producers. The prices of these materials are tied to crude oil prices and global resin supply. In recent years Coca-Cola FEMSA has experienced volatility in the prices it pays for these materials. Across Coca-Cola FEMSA’s territories, its average price for resin in U.S. dollars decreased approximately 6.0% in 2012 as compared to 2011.
Under Coca-Cola FEMSA’s agreements with The Coca-Cola Company, it may use raw or refined sugar or HFCS as sweeteners in its products. Sugar prices in all of the countries in which Coca-Cola FEMSA operates, other than Brazil, are subject to local regulations and other barriers to market entry that cause Coca-Cola FEMSA to pay in excess of international market prices for sugar in certain countries. In recent years, international sugar prices experienced significant volatility.
None of the materials or supplies that Coca-Cola FEMSA uses is presently in short supply, although the supply of specific materials could be adversely affected by strikes, weather conditions, governmental controls or national emergency situations.
Mexico and Central America. In Mexico, Coca-Cola FEMSA purchases its returnable plastic bottles from Graham Packaging México, S.A. de C.V., known as Graham, which is the exclusive supplier of returnable plastic bottles to The Coca-Cola Company and its bottlers in Mexico. Coca-Cola FEMSA mainly purchases resin from Indorama Ventures Polymers México, S. de R.L. de C.V. (formerly Arteva Specialties, S. de R.L. de C.V.), M. & G. Polímeros México, S.A. de C.V. and DAK Resinas Americas Mexico, S.A. de C.V., which ALPLA México, S.A. de C.V., known as ALPLA, and Envases Universales de México, S.A.P.I. de C.V. manufacture into non-returnable plastic bottles for Coca-Cola FEMSA.
Coca-Cola FEMSA purchases all of its cans from Fábricas de Monterrey, S.A. de C.V., known as FAMOSA, a wholly-owned subsidiary of the Heineken Group, and Envases Universales de México, S.A.P.I. de C.V., through Promotora Mexicana de Embotelladoras, S.A. de C.V., known as PROMESA, a company owned by variousCoca-Cola bottlers, in which, as of March 31, 2013, Coca-Cola FEMSA holds a 30.0% equity interest. Coca-Cola FEMSA mainly purchases its glass bottles from EXCO Integral Services, S.A. de C.V. (formerly Compañía Vidriera, S.A. de C.V., or VITRO), FEVISA Industrial, S.A. de C.V., known as FEVISA, and Glass & Silice, S.A. de C.V., a wholly-owned subsidiary of the Heineken Group.
Coca-Cola FEMSA purchases sugar from, among other suppliers, Piasa and Beta San Miguel, S.A. de C.V., both sugar cane producers in which, as of March 31, 2013, Coca-Cola FEMSA held an approximate 26.1% and 2.7% equity interest, respectively. Coca-Cola FEMSA purchase HFCS from CP Ingredientes, S.A. de C.V. and Almidones Mexicanos, S.A. de C.V., known as Almex.
Sugar prices in Mexico are subject to local regulations and other barriers to market entry that cause Coca-Cola FEMSA to pay higher prices than those paid in the international market for sugar. As a result, sugar prices in Mexico have no correlation to international market prices for sugar. In 2012, sugar prices decreased approximately 15% as compared to 2011.
In Central America, the majority of Coca-Cola FEMSA’s raw materials such as glass and plastic bottles are purchased from several local suppliers. Coca-Cola FEMSA purchases all of Coca-Cola FEMSA’s cans from PROMESA. Sugar is available from suppliers that represent several local producers. Local sugar prices, in the countries that comprise the region, have increased mainly due to volatility in international prices. In Costa Rica, Coca-Cola FEMSA acquires plastic non-returnable bottles from ALPLA C.R. S.A., and in Nicaragua Coca-Cola FEMSA acquires such plastic bottles from ALPLA Nicaragua, S.A.
South America (excluding Venezuela). In Colombia, Coca-Cola FEMSA uses sugar as a sweetener in most of its products, which Coca-Cola FEMSA buys from several domestic sources. In 2011, Coca-Cola FEMSA started to use HFCS as an alternative sweetener for its products. Coca-Cola FEMSA purchases HFCS from Archer Daniels Midland Company. Coca-Cola FEMSA purchases plastic bottles from Amcor and Tapón Corona de Colombia S.A. Coca-Cola FEMSA purchases all of its glass bottles from Peldar O-I and cans from Crown, both suppliers in which Grupo Ardila Lulle, owners of Coca-Cola FEMSA’s competitor Postobón, owns a minority equity interest. Glass bottles and cans are available only from these local sources.
Sugar is available in Brazil at local market prices, which historically have been similar to international prices. Sugar prices in Brazil in recent periods have been volatile, mainly due to the increased demand for sugar cane for production of alternative fuels, and Coca-Cola FEMSA’s average acquisition cost for sugar in 2012 decreased approximately 24% as compared to 2011. Coca-Cola FEMSA purchases glass bottles, plastic bottles and cans from several domestic and international suppliers.
In Argentina, Coca-Cola FEMSA mainly uses HFCS that it purchases from several different local suppliers as a sweetener in its products instead of sugar. Coca-Cola FEMSA purchases glass bottles, plastic cases and other raw materials from several domestic sources. Coca-Cola FEMSA purchases plastic preforms, as well as returnable plastic bottles, at competitive prices from Embotelladora del Atlántico S.A., a local subsidiary of Embotelladora Andina S.A., aCoca-Cola bottler with operations in Argentina, Chile and Brazil, and other local suppliers. Coca-Cola FEMSA also acquires plastic preforms from ALPLA Avellaneda S.A. and other suppliers.
Venezuela. In Venezuela, Coca-Cola FEMSA uses sugar as a sweetener in most of its products, which Coca-Cola FEMSA purchases mainly from the local market. Since 2003, from time to time, Coca-Cola FEMSA has experienced a sugar shortage due to lower domestic production and the inability of the predominant sugar importers to obtain permission to import in a timely manner. While sugar distribution to the food and beverages industry and to retailers is controlled by the government, Coca-Cola FEMSA did not experience any disruptions during 2012 with respect to access to sufficient sugar supply. However, we cannot assure you that Coca-Cola FEMSA will not experience disruptions in its ability to meet its sugar requirements in the future should the Venezuelan government impose restrictive measures in the future. Coca-Cola FEMSA buys glass bottles from one local supplier, Productos de Vidrio, S.A., but there are alternative suppliers authorized by The Coca-Cola Company. Coca-Cola FEMSA acquires most of its plastic non-returnable bottles from ALPLA de Venezuela, S.A. and all of its aluminum cans from a local producer, Dominguez Continental, C.A.
Under current regulations promulgated by the Venezuelan authorities, Coca-Cola FEMSA’s ability to import some of its raw materials and other supplies used in Coca-Cola FEMSA’s production could be limited, and access to the official exchange rate for these items for Coca-Cola FEMSA and its suppliers, including, among others, resin, aluminum, plastic caps, distribution trucks and vehicles is only achieved by obtaining proper approvals from the relevant authorities.
Overview and Background
FEMSA Comercio operates the largest chain of small-format stores in Mexico, measured in terms of number of stores as of December 31, 2012, under the trade name OXXO. As of December 31, 2012, FEMSA Comercio operated 10,601 OXXO stores, of which 10,567 are located throughout the country, with a particularly strong presence in the northern part of Mexico, and the remaining 34 stores are located in Bogotá, Colombia.
FEMSA Comercio, the largest single customer of Cuauhtémoc Moctezuma and of the Coca-Cola system in Mexico, was established by FEMSA in 1978 when two OXXO stores were opened in Monterrey, one store in Mexico City and another store in Guadalajara. The motivating factor behind FEMSA’s entrance into the retail industry was to enhance beer sales through company-owned retail outlets as well as to gather information on customer preferences. In 2012, a typical OXXO store carried 2,427 different store keeping units (SKUs) in 31 main product categories.
In recent years, FEMSA Comercio has represented an effective distribution channel for our beverage products, as well as a rapidly growing point of contact with our consumers. Based on the belief that location plays a major role in the long-term success of a retail operation such as a convenience store, as well as a role in our continually improving ability to accelerate and streamline the new-store development process, FEMSA Comercio has focused on a strategy of rapid, profitable growth. FEMSA Comercio opened 1,092, 1,135 and 1,040 net new OXXO stores in 2010, 2011 and 2012, respectively. The accelerated expansion in the number of stores yielded total revenue growth of 16.6% to reach Ps. 86,433 million in 2012. Same store sales increased an average of 7.7%, driven by increases in store traffic and average customer ticket. FEMSA Comercio performed approximately 3.0 billion transactions in 2012 compared to 2.7 billion transactions in 2011.
Business Strategy
A fundamental element of FEMSA Comercio’s business strategy is to utilize its position in the convenience store market to grow in a cost-effective and profitable manner. As a market leader in convenience store retailing, based on internal company surveys, management believes that FEMSA Comercio has an in-depth understanding of its markets and significant expertise in operating a national store chain. FEMSA Comercio intends to continue increasing its store base while capitalizing on the market knowledge gained at existing stores.
FEMSA Comercio has developed proprietary models to assist in identifying appropriate store locations, store formats and product categories. Its model utilizes location-specific demographic data and FEMSA Comercio’s experience in similar locations to fine tune the store format and product offerings to the target market. Market segmentation is becoming an important strategic tool, and it should increasingly allow FEMSA Comercio to improve the operating efficiency of each location and the overall profitability of the chain.
FEMSA Comercio has made and will continue to make significant investments in IT to improve its ability to capture customer information from its existing stores and to improve its overall operating performance. The majority of products carried through OXXO stores are bar-coded, and all OXXO stores are equipped with point-of-sale systems that are integrated into a company-wide computer network. To implement revenue management strategies, FEMSA Comercio created a division in charge of product category management for products, such as beverages, fast food and perishables, to enhance and better utilize its consumer information base and market intelligence capabilities. FEMSA Comercio utilizes a technology platform supported by an enterprise resource planning (ERP) system, as well as other technological solutions such as merchandising and point-of-sale systems, which will allow FEMSA Comercio to continue redesigning its key operating processes and enhance the usefulness of its market information going forward. In addition, FEMSA Comercio has expanded its operations by opening 11 new stores in Bogotá, Colombia in 2012.
FEMSA Comercio has adopted innovative promotional strategies in order to increase store traffic and sales. In particular, FEMSA Comercio sells high-frequency items such as beverages, snacks and cigarettes at competitive prices. FEMSA Comercio’s ability to implement this strategy profitably is partly attributable to the size of the OXXO chain, as FEMSA Comercio is able to work together with its suppliers to implement their revenue-management strategies through differentiated promotions. OXXO’s national and local marketing and promotional strategies are an effective revenue driver and a means of reaching new segments of the population while strengthening the OXXO brand. For example, the organization has refined its expertise in executing cross promotions (discounts on multi-packs or sales of complementary products at a special price) and targeted promotions to attract new customer segments, such as housewives, by expanding the offerings in the grocery product category in certain stores. FEMSA Comercio is also strengthening its capabilities to increasingly provide consumers with services such as utility bill payment and other basic transactions.
Store Locations
With 10,567 OXXO stores in Mexico and 34 stores in Colombia as of December 31, 2012, FEMSA Comercio operates the largest small-format store chain in Latin America measured by number of stores. OXXO stores are concentrated in the northern part of Mexico, but also have a growing presence in the rest of the country.
FEMSA Comercio
Regional Allocation of OXXO Stores in Mexico and Latin America(*)
as of December 31, 2012
FEMSA Comercio has aggressively expanded its number of stores over the past several years. The average investment required to open a new store varies, depending on location and format and whether the store is opened in an existing retail location or requires construction of a new store. FEMSA Comercio is generally able to use supplier credit to fund the initial inventory of new stores.
Growth in Total OXXO Stores
| Year Ended December 31, | ||||||||||||||||||||
| 2012 | 2011 | 2010 | 2009 | 2008 | ||||||||||||||||
Total OXXO stores | 10,601 | 9,561 | 8,426 | 7,334 | 6,374 | |||||||||||||||
Store growth (% change over previous year) | 10.9 | % | 13.5 | % | 14.9 | % | 15.1 | % | 14.6 | % | ||||||||||
FEMSA Comercio currently expects to continue the growth trend established over the past several years by emphasizing growth in areas of high economic potential in existing markets and by expanding in underserved and unexploited markets. Management believes that the southeast part of Mexico is particularly underserved by the convenience store industry.
The identification of locations and pre-opening planning in order to optimize the results of new stores are important elements in FEMSA Comercio’s growth plan. FEMSA Comercio continuously reviews store performance against certain operating and financial benchmarks to optimize the overall performance of the chain. Stores unable to maintain benchmark standards are generally closed. Between December 31, 2008 and 2012, the total number of OXXO stores increased by 4,227, which resulted from the opening of 4,328 new stores and the closing of 101 existing stores.
Competition
FEMSA Comercio, mainly through OXXO, competes in the overall retail market, which we believe is highly competitive. OXXO stores face competition from small-format stores like 7-Eleven, Super Extra, Super City, Círculo K stores and other numerous chains of retailers across Mexico, from other regional small-format retailers to small informal neighborhood stores. OXXO competes both for consumers and for new locations for stores and the managers to operate those stores. FEMSA Comercio operates in the 32 Mexican states and has much broader geographical coverage than any of its competitors in Mexico.
Market and Store Characteristics
Market Characteristics
FEMSA Comercio is placing increased emphasis on market segmentation and differentiation of store formats to more appropriately serve the needs of customers on a location-by-location basis. The principal segments include residential neighborhoods, commercial and office locations and stores near schools and universities, along with other types of specialized locations.
Approximately 64% of OXXO’s customers are between the ages of 15 and 35. FEMSA Comercio also segments the market according to demographic criteria, including income level.
Store Characteristics
The average size of an OXXO store is approximately 103 square meters of selling space, excluding space dedicated to refrigeration, storage or parking. The average constructed area of a store is approximately 186 square meters and, when parking areas are included, the average store size is approximately 429 square meters.
FEMSA Comercio—Operating Indicators
| Year Ended December 31, | ||||||||||||||||||||
| 2012 | 2011 | 2010 | 2009 | 2008 | ||||||||||||||||
| (percentage increase compared to previous year) | ||||||||||||||||||||
Total FEMSA Comercio revenues | 16.6 | % | 19.0 | % | 16.3 | % | 13.6 | % | 12.0 | % | ||||||||||
OXXO same-store sales(1) | 7.7 | % | 9.2 | % | 5.2 | % | 1.3 | % | 0.4 | % | ||||||||||
| (1) | Same-store sales growth is calculated by comparing the sales of stores for each year that have been in operation for more than 12 months with the sales of those same stores during the previous year. |
Beer, cigarettes, soft drinks and other beverages, snacks and cellular telephone air-time represent the main product categories for OXXO stores. FEMSA Comercio has a distribution agreement with Cuauhtémoc Moctezuma (which is now part of the Heineken Group). As a result of this agreement, OXXO stores only carry beer brands produced and distributed by Cuauhtémoc Moctezuma. OXXO stores will continue to benefit from the existing relationship under which Cuauhtémoc Moctezuma will continue to be the exclusive supplier of beer to OXXO until June 2020.
Approximately 65% of OXXO stores are operated by independent managers responsible for all aspects of store operations. The managers are commission agents and are not employees of FEMSA Comercio. Each store manager is the legal employer of the store’s staff, which typically numbers six people per store. FEMSA Comercio continually invests in on-site operating personnel, with the objective of promoting loyalty, customer service and low personnel turnover in the stores.
Advertising and Promotion
FEMSA Comercio’s marketing efforts include both specific product promotions and image advertising campaigns. These strategies seek to increase store traffic and sales, and to reinforce the OXXO name and market position.
FEMSA Comercio manages its advertising on three levels depending on the nature and scope of the specific campaign: local or store-specific, regional and national. Store-specific and regional campaigns are closely monitored to ensure consistency with the overall corporate image of OXXO stores and to avoid conflicts with national campaigns. FEMSA Comercio primarily uses point of purchase materials, flyers, handbills and print and radio media for promotional campaigns, although television is used occasionally for the introduction of new products and services. The OXXO chain’s image and brand name are presented consistently across all stores, irrespective of location.
Inventory and Purchasing
FEMSA Comercio has placed considerable emphasis on improving operating performance. As part of these efforts, FEMSA Comercio continues to invest in extensive information management systems to improve inventory management. Electronic data collection has enabled FEMSA Comercio to reduce average inventory levels. Inventory replenishment decisions are carried out on a store-by-store basis.
Management believes that the OXXO chain’s scale of operations provides FEMSA Comercio with a competitive advantage in its ability to realize strategic alliances with suppliers. General category offerings are determined on a national level, although purchasing decisions are implemented on a local, regional or national level, depending on the nature of the product category. Given the fragmented nature of the retail industry in Mexico in general, Mexican producers of beer, soft drinks, bread, dairy products, snacks, cigarettes and other high-frequency products have established proprietary distribution systems with extensive direct distribution routes. As a result, approximately 51% of the OXXO chain’s total sales consist of products that are delivered directly to the stores by suppliers. Other products with longer shelf lives are distributed to stores by FEMSA Comercio’s distribution system, which includes 14 regional warehouses located in Monterrey, Guadalajara, Mexicali, Mérida, León, Obregón, Puebla, Chihuahua, Reynosa, Tijuana, Toluca, Villahermosa and two in Mexico City. The distribution centers operate a fleet of approximately 746 trucks that make deliveries to each store approximately twice per week.
Seasonality
OXXO stores experience periods of high demand in December, as a result of the holidays, and in July and August, as a result of increased consumption of beer and soft drinks during the hot summer months. The months of November and February are generally the weakest sales months for OXXO stores. In general, colder weather during these months reduces store traffic and consumption of cold beverages.
Other Stores
FEMSA Comercio also operates other small format stores, which include soft discount stores with a focus on perishables, liquor stores and smaller convenience stores.
Equity Method Investment in the Heineken Group
As of December 31, 2012, FEMSA owned a non-controlling interest in the Heineken Group, one of the world’s leading brewers. As of December 31, 2012, our 20% economic interest in the Heineken Group was comprised of 43,018,320 shares of Heineken Holding N.V. and 72,182,203 shares of Heineken N.V. For 2012, FEMSA recognized equity income of Ps. 8,311 regarding its 20% economic interest in the Heineken Group; see note 10 to our audited consolidated total revenues.financial statements.
Some
As described above, FEMSA Comercio has a distribution agreement with Cuauhtémoc Moctezuma (which is now a part of the Heineken Group) pursuant to which OXXO stores only carry beer brands produced and distributed by Cuauhtémoc Moctezuma. OXXO stores will continue to benefit from the existing relationship under which Cuauhtémoc Moctezuma will continue to be the exclusive supplier of beer to OXXO until June 2020. As of April 30, 2010, Coca-Cola FEMSA has agreed with Cervejarias Kaiser (also now part of the Heineken Group) to continue to distribute and sell theKaiser beer portfolio in Coca-Cola FEMSA’s Brazilian territories for a 20-year term beginning in 2003, consistent with the arrangement already in place. In addition, our logistic services, corporate and shared services subsidiary continues to provide certain services to Cuauhtémoc Moctezuma and its subsidiaries.
Our other business consists of the following smaller operations that support our core operations:
Our logistics services subsidiary provides a broad range of logistics and vehicle maintenance services to Coca-Cola FEMSA, FEMSA Comercio and third-party clients in the beverages, consumer products and retail industries. It has operations in Mexico, Brazil, Colombia, Panama, Costa Rica and Nicaragua.
Our refrigeration business produces vertical and horizontal commercial refrigerators for the soft drink, beer and food industries, with an annual capacity of 475,416 units at December 31, 2012. In 2012, this business sold 389,132 refrigeration units, 36.0% of which were sold to Coca-Cola FEMSA, and the remainder of which were sold to third parties.
Our corporate services subsidiary employs all of our corporate staff, including the personnel managing the areas of finance, corporate accounting, taxation, legal, financial and strategic planning, human resources, corporate affairs and internal audit. Through this subsidiary, we direct, control, supervise and review the operations of our sub-holding companies. As of December 31, 2012, FEMSA Comercio and our other business subsidiaries pay management fees for the services provided to us in considerationthem. In addition, Coca-Cola FEMSA has entered into a services agreement pursuant to which it pays for specific services. As part of the Heineken transaction, the corporate and shared services subsidiaries continue to provide some limited corporate services and shared services to subsidiaries of Cuauhtémoc Moctezuma (now part of the Heineken Group), for which such companies continue to pay.
Until December 31, 2010, our labeling and flexible packaging business was our wholly-owned subsidiary. In 2010, this business sold 14% of its label sales volume to Cuauhtémoc Moctezuma, 20% to Coca-Cola FEMSA and 66% to third parties. Our labeling and flexible packaging business was sold on December 31, 2010.
Until December 31, 2012, Quimiproductos, our manufacturer and supplier of cleaning and sanitizing products and services related to food and beverage industrial processes, as well as of water treatment, was our wholly-owned subsidiary. In 2012, this business sold 38% of its products to Cuauhtémoc Moctezuma, 27% to Coca-Cola FEMSA and 35% to third parties. Our Quimiproductos business was sold on December 31, 2012.
Until September 23, 2010 we provideowned the Mundet brands in Mexico, which were disposed through the sale to them. These feesThe Coca-Cola Company of Promotora de Marcas Nacionales, S. de R.L. de C.V., which was a wholly owned subsidiary of FEMSA.
Description of Property, Plant and Equipment
As of December 31, 2012, we owned all of our manufacturing facilities and substantially all of our warehouses and distribution centers. Our properties primarily consisted of production and distribution facilities for our soft drink operations and office space. In addition, FEMSA Comercio owns approximately 10.6% of the OXXO store locations, while the other stores are recordedlocated in properties that are rented under long-term lease arrangements with third parties.
The table below summarizes by country the installed capacity and percentage utilization of Coca-Cola FEMSA’s production facilities:
Bottling Facility Summary
As of December 31, 2012
Country | Installed Capacity (thousands of unit cases) | Utilization(1) (%) | ||||||
Mexico | 2,671,963 | 62.0 | ||||||
Guatemala | 35,527 | 77.0 | ||||||
Nicaragua | 66,516 | 60.0 | ||||||
Costa Rica | 81,424 | 56.0 | ||||||
Panama | 55,863 | 52.0 | ||||||
Colombia | 514,813 | 49.0 | ||||||
Venezuela | 288,751 | 69.0 | ||||||
Brazil | 720,704 | 64.0 | ||||||
Argentina | 347,307 | 62.0 | ||||||
| (1) | Annualized rate. |
The table below summarizes by country the location and facility area of each of Coca-Cola FEMSA’s production facilities.
Bottling Facilities by Location as administrative expensesof December 31, 2012
Country | Location | Production Area | ||
(thousands of sq. meters) | ||||
Mexico | San Cristóbal de las Casas, Chiapas | 45 | ||
| Cuautitlán, Estado de México | 35 | |||
| Los Reyes la Paz, Estado de México | 50 | |||
| Toluca, Estado de México | 242 | |||
| León, Guanajuato | 124 | |||
| Morelia, Michoacán | 50 | |||
| Ixtacomitán, Tabasco | 117 | |||
| Apizaco, Tlaxcala | 80 | |||
| Coatepec, Veracruz | 142 | |||
| La Pureza Altamira, Tamaulipas | 300 | |||
| Poza Rica, Veracruz | 42 | |||
| Pacífico, Estado de México | 89 | |||
| Cuernavaca, Morelos | 37 | |||
| Toluca, Estado de México | 41 | |||
| San Juan del Río, Querétaro | 84 | |||
| Querétaro, Querétaro | 80 | |||
Guatemala | Guatemala City | 47 | ||
Nicaragua | Managua | 54 | ||
Costa Rica | Calle Blancos, San José | 52 | ||
| Coronado, San José | 14 | |||
Panama | Panama City | 29 | ||
Country | Location | Production Area | ||
(thousands of sq. meters) | ||||
Colombia | Barranquilla | 37 | ||
| Bogotá, DC | 105 | |||
| Bucaramanga | 26 | |||
| Cali | 76 | |||
| Manantial, Cundenamarca | 67 | |||
| Medellín | 47 | |||
Venezuela | Antímano | 15 | ||
| Barcelona | 141 | |||
| Maracaibo | 68 | |||
| Valencia | 100 | |||
Brazil | Campo Grande | 36 | ||
| Jundiaí | 191 | |||
| Mogi das Cruzes | 119 | |||
| Belo Horizonte | 73 | |||
Argentina | Alcorta, Buenos Aires | 73 | ||
| Monte Grande, Buenos Aires | 32 | |||
We maintain an “all risk” insurance policy covering our properties (owned and leased), machinery and equipment and inventories as well as losses due to business interruptions. The policy covers damages caused by natural disaster, including hurricane, hail, earthquake and damages caused by human acts, including explosion, fire, vandalism, riot and losses incurred in connection with goods in transit. In addition, we maintain an “all risk” liability insurance policy that covers product liability. We purchase our insurance coverage through an insurance broker. In 2012, the policies for “all risk” property insurance and “all risk” liability insurance were issued by ACE Seguros, S.A., and the coverage was partially reinsured in the respective business segments. international reinsurance market. In 2013, “all risk” liability insurance policy will be issued by XL Insurance Mexico SA de CV. We believe that our coverage is consistent with the coverage maintained by similar companies operating in Mexico.
Capital Expenditures and Divestitures
Our subsidiaries’ paymentsconsolidated capital expenditures for the years ended December 31, 2012 and 2011 were Ps. 15,560 million and Ps. 12,666 million respectively, and were for the most part financed from cash from operations generated by our subsidiaries. These amounts were invested in the following manner:
| Year Ended December 31, | ||||||||
| 2012 | 2011 | |||||||
| (In millions of Mexican pesos) | ||||||||
Coca-Cola FEMSA | Ps. | 10,259 | Ps. | 7,862 | ||||
FEMSA Comercio | 4,707 | 4,186 | ||||||
Other | 594 | 618 | ||||||
|
|
|
| |||||
Total | Ps. | 15,560 | Ps. | 12,666 | ||||
Coca-Cola FEMSA
During 2012, Coca-Cola FEMSA’s capital expenditures focused on increasing production capacity, placing coolers with retailers, returnable bottles and cases, improving the efficiency of management feesdistribution infrastructure, and IT. Capital expenditures in Mexico and Central America were approximately Ps. 5,350 million and accounted for approximately 52% of Coca-Cola FEMSA’s capital expenditures, with South America representing the balance.
FEMSA Comercio
FEMSA Comercio’s principal investment activity is the construction and opening of new stores. During 2012, FEMSA Comercio opened 1,040 net new OXXO stores. FEMSA Comercio invested Ps. 4,707 million in 2012 in the addition of new stores, warehouses and improvements to leased properties.
Competition Legislation
TheLey Federal de Competencia Económica (Federal Economic Competition Law or Mexican Competition Law) became effective on June 22, 1993. The Mexican Competition Law and theReglamento de la Ley Federal de Competencia Económica (Regulations under the Mexican Competition Law), effective as of October 13, 2007, regulate monopolistic practices and require Mexican government approval of certain mergers and acquisitions. The Mexican Competition Law subjects the activities of certain Mexican companies, including us, to regulatory scrutiny. In addition, the Regulations under the Mexican Competition Law prohibit members of any trade association from reaching any agreement relating to the price of their products. Management believes that we are eliminatedcurrently in consolidationcompliance in all material respects with Mexican competition legislation.
In Mexico and therefore,in some of the other countries in which we operate, we are involved in different ongoing competition related proceedings. We believe that the outcome of these proceedings will not have noa material adverse effect on our consolidatedfinancial position or results. See “Item 8. Financial Information—Legal Proceedings—Coca-Cola FEMSA—Antitrust Matters.”
Price Controls
Voluntary price restraints or statutory price controls have been imposed historically in several of the countries in which Coca-Cola FEMSA operates. Currently, there are no price controls on Coca-Cola FEMSA’s products in any of its territories, except for (i) Argentina, where authorities directly supervise certain products sold through supermarkets to control inflation, and (ii) Venezuela, where the government has recently imposed price controls on certain products including bottled water.See “Item 3. Key Information—Risk Factors—Regulatory developments may adversely affect Coca-Cola FEMSA’s business.”
Taxation of Sparkling Beverages
All the countries in which Coca-Cola FEMSA operates, except for Panama, impose a value-added tax on the sale of sparkling beverages, with a rate of 16% in Mexico, 12% in Guatemala, 15% in Nicaragua, 13% in Costa Rica, 16% in Colombia (applied only to the first sale in supply chain), 12% in Venezuela, 21% in Argentina, and 17% (Mato Grosso do Sul and Goiás) and 18% (São Paulo, Minas Gerais and Rio de Janeiro) in Brazil. Also, Coca-Cola FEMSA’s Brazilian bottler is responsible for charging and collecting the value-added tax from each of its retailers, based on average retail prices for each state where the company operates, defined primarily through a survey conducted by the government of each state and generally updated every three months. In addition, several of the countries in which Coca-Cola FEMSA operates impose the following excise or other taxes:
Guatemala imposes an excise tax of 0.18 cents in local currency (Ps. 0.30 as of December 31, 2012) per liter of sparkling beverage.
Costa Rica imposes a specific tax on non-alcoholic bottled beverages based on the combination of packaging and flavor, currently assessed at 16.74 colones per 250 ml (Ps. 0.42 as of December 31, 2012), and an excise tax currently assessed at 5.79 colones per 250 ml (approximately Ps. 0.15 as of December 31, 2012).
Nicaragua imposes a 9.0% tax on consumption, and municipalities impose a 1% tax on Coca-Cola FEMSA’s Nicaraguan gross income.
Panama imposes a 5.0% tax based on the cost of goods produced. Panama also imposes a 10% selective consumption tax on syrups, powders and concentrate.
Argentina imposes an excise tax of 8.7% on sparkling beverages containing less than 5.0% lemon juice or less than 10.0% fruit juice, and an excise tax of 4.2% on sparkling water and flavored sparkling beverages with 10.0% or more fruit juice, although this excise tax is not applicable to certain of Coca-Cola FEMSA’s products.
Brazil’s federal government assesses an average production tax of approximately 4.7% and an average sales tax of approximately 10.8%. Most of these taxes are fixed, based on average retail prices in each state where the company operates (VAT) or fixed by the federal government (excise and sales tax).
Environmental Matters
In all of our territories, our operations are subject to federal and state laws and regulations relating to the protection of the environment.
Mexico
The Mexican federal authority in charge of overseeing compliance with the federal environmental laws is theSecretaria del Medio Ambiente y Recursos Naturales or Secretary of Environment and Natural Resources, which we refer to as “SEMARNAT”. An agency of SEMARNAT, theProcuraduría Federal de Protección al Ambiente or Federal Environmental Protection Agency, which we refer to as “PROFEPA”, has the authority to enforce the Mexican federal environmental laws. As part of its enforcement powers, PROFEPA can bring administrative, civil and criminal proceedings against companies and individuals that violate environmental laws, regulations and Mexican Official Standards and has the authority to impose a variety of sanctions. These sanctions may include, among other things, monetary fines, revocation of authorizations, concessions, licenses, permits or registrations, administrative arrests, seizure of contaminating equipment, and in certain cases, temporary or permanent closure of facilities. Additionally, as part of its inspection authority, PROFEPA is entitled to periodically inspect the facilities of companies whose activities are regulated by the Mexican environmental legislation and verify compliance therewith. Furthermore, in special situations or certain areas where federal jurisdiction is not applicable or appropriate, the state and municipal authorities can administer and enforce certain environmental regulations of their respective jurisdictions.
In Mexico, the principal legislation relating to environmental matters is theLey General de Equilibrio Ecológico y Protección al Ambiente (Federal General Law for Ecological Equilibrium and Environmental Protection, or the Mexican Environmental Law) and theLey General para la Prevención y Gestión Integral de los Residuos(General Law for the Prevention and Integral Management of Waste). Under the Mexican Environmental Law, rules have been promulgated concerning water, air and noise pollution and hazardous substances. In particular, Mexican environmental laws and regulations require that we file periodic reports with respect to air and water emissions and hazardous wastes and set forth standards for waste water discharge that apply to our operations. We are also subject to certain minimal restrictions on the operation of delivery trucks in Mexico City. We have implemented several programs designed to facilitate compliance with air, waste, noise and energy standards established by current Mexican federal and state environmental laws, including a program that installs catalytic converters and liquid petroleum gas in delivery trucks for our operations in Mexico City.
In addition, we are subject to theLey de Aguas Nacionales de 1992(as amended, the 1992 Water Law), enforced by theComisión Nacional del Agua(National Water Commission). Adopted in December 1992, and amended in 2004, the 1992 Water Law provides that plants located in Mexico that use deep water wells to supply their water requirements must pay a fee to the local governments for the discharge of residual waste water to drainage. Pursuant to this law, certain local authorities test the quality of the waste water discharge and charge plants an additional fee for measurements that exceed certain standards published by the National Water Commission. In the case of non-compliance with the law, penalties, including closures, may be imposed. All of Coca-Cola FEMSA’s bottler plants located in Mexico have met these standards. In addition, Coca-Cola FEMSA’s plants in Apizaco and San Cristóbal are certified with ISO 14001.
In Coca-Cola FEMSA’s Mexican operations, it established a partnership with The Coca-Cola Company and ALPLA, a supplier of plastic bottles to Coca-Cola FEMSA in Mexico, to createIndustria Mexicana de Reciclaje (IMER), a PET recycling facility located in Toluca, Mexico. This facility started operations in 2005 and has a recycling capacity of approximately 25,000 metric tons per year from which 15,000 metric tons can be re-used in PET bottles for food packaging purposes. Coca-Cola FEMSA has also continued contributing funds to a nationwide recycling company,Ecología y Compromiso Empresarial(Environmentally Committed Companies). In addition, Coca-Cola FEMSA’s plants located in Toluca, Reyes, Cuautitlán, Apizaco, San Cristóbal, Morelia, Ixtacomitan, Coatepec, Poza Rica and Cuernavaca have received aCertificado de Industria Limpia (Certificate of Clean Industry).
As part of our environmental protection and sustainability strategies, several of our subsidiaries have entered into 20-year wind power purchase agreements with the Mareña Renovables Wind Farm to receive electrical energy for use at production and distribution facilities of FEMSA and Coca-Cola FEMSA throughout Mexico, as well as for a significant number of OXXO stores. The Mareña Renovables Wind Farm will be located in the state of Oaxaca and is expected to have a capacity of 396 megawatts. We anticipate the Mareña Renovables Wind Farm will begin operations in 2014.
As part of Coca-Cola FEMSA’s environmental protection and sustainability strategies, in December 2009, Coca-Cola FEMSA, jointly with strategic partners, entered into a wind energy supply agreement with a Mexican subsidiary of the Spanish wind farm developer, GAMESA Energía, S.A., or GAMESA, to supply clean energy to Coca-Cola FEMSA’s bottling facility in Toluca, Mexico, owned by its subsidiary, Propimex, S. de R.L. de C.V. (formerly Propimex, S.A. de C.V.), or Propimex, and to some of its suppliers of PET bottles. In 2010, GAMESA sold its interest in the Mexican subsidiary that owned the wind farm to Iberdrola Renovables México, S.A. de C.V. The wind farm generating such energy, which is located in La Ventosa, Oaxaca, is expected to generate approximately 100 thousand megawatt hours of energy annually. The energy supply services began in April 2010.
Central America
Coca-Cola FEMSA’s Central American operations are subject to several federal and state laws and regulations relating to the protection of the environment, which have been enacted in the last ten years, as awareness has increased in this region about the protection of the environment and the disposal of hazardous and toxic materials as well as water usage. Coca-Cola FEMSA’s Costa Rica and Panama operations have participated in a joint effort along with the local division of The Coca-Cola Company calledMisión Planeta (Mission Planet) for the collection and recycling of non-returnable plastic bottles.
Colombia
Coca-Cola FEMSA’s Colombian operations are subject to several Colombian federal, state and municipal laws and regulations related to the protection of the environment and the disposal of treated water and toxic and hazardous materials. These laws include the control of atmospheric emissions, noise emissions, disposal of treated water and strict limitations on the use of chlorofluorocarbons. For Coca-Cola FEMSA’s plants in Colombia, it has obtained theCertificación Ambiental Fase IV (Phase IV Environmental Certificate) demonstrating its compliance at the highest level with relevant Colombian regulations. Coca-Cola FEMSA is also engaged in nationwide reforestation programs, and national campaigns for the collection and recycling of glass and plastic bottles. In 2011, jointly with the FEMSA Foundation, Coca-Cola FEMSA was commended with the “Western Hemisphere Corporate Citizenship Award” for the social responsibility programs it carried out to respond to the extreme weather experienced in Colombia in 2010 and 2011, known locally as the “winter emergency.” In addition, Coca-Cola FEMSA also obtained the ISO 9001, ISO 22000, ISO 14001 and PAS 220 certifications for its plants located in Medellín, Cali, Bogotá, Barranquilla, Bucaramanga and La Calera, as recognition for the highest quality and food harmlessness in its production processes. These six plants joined a small group of companies that have obtained these certifications.
Venezuela
Coca-Cola FEMSA’s Venezuelan operations are subject to several Venezuelan federal, state and municipal laws and regulations related to the protection of the environment. The most relevant of these laws are theLey Orgánica del Ambiente (Organic Environmental Law), theLey Sobre Sustancias, Materiales y Desechos Peligrosos(Substance, Material and Dangerous Waste Law), theLey Penal del Ambiente (Criminal Environmental Law) and theLey de Aguas(Water Law). Since the enactment of the Organic Environmental Law in 1995, Coca-Cola FEMSA’s Venezuelan subsidiary has presented the proper authorities with plans to bring their production facilities and distribution centers into compliance with applicable laws, which mainly consist of building or expanding the capacity of water treatment plants in Coca-Cola FEMSA’s bottling facilities. Even though Coca-Cola FEMSA has had to adjust some of the originally proposed timelines due to construction delays, in 2009, Coca-Cola FEMSA completed the construction and received all the required permits to operate a new water treatment plant in its bottling facility located in the city of Barcelona. At the end of 2011, Coca-Cola FEMSA concluded the construction of a new water treatment plant in its bottling plant in the city of Valencia, which began operations in February 2012. During 2011, Coca-Cola FEMSA also commenced construction of a new water treatment plant in its Antimano bottling plant in Caracas, which construction was concluded during the second quarter of 2012. Coca-Cola FEMSA is also concluding the process of obtaining the necessary authorizations and licenses before it can begin the construction and expansion of its current water treatment plant in its bottling facility in Maracaibo. In December 2011, Coca-Cola FEMSA obtained the ISO 14000 certification for all of its plants in Venezuela.
In addition, in December 2010, the Venezuelan government approved theLey Integral de Gestión de la Basura (Comprehensive Waste Management Law), which regulates solid waste management and which may be applicable to manufacturers of products for mass consumption. The full scope of this law has not yet been established.
Brazil
Coca-Cola FEMSA’s Brazilian operations are subject to several federal, state and municipal laws and regulations related to the protection of the environment. Among the most relevant laws and regulations are those dealing with the emission of toxic and hazardous gases, disposal of wastewater and solid waste, and soil contamination by hazardous chemicals, which impose penalties, such as fines, facility closures or criminal charges depending upon the level of non-compliance.
Coca-Cola FEMSA’s production plant located in Jundiaí has been recognized by the Brazilian authorities for its compliance with environmental regulations and for having standards well above those imposed by the law. The plant has been certified for: (i) ISO 9001 since 1993; (ii) ISO 14001 since March 1997; (iii) norm OHSAS 18001 since 2005; (iv) ISO 22000 since 2007; and (v) PAS: 220 since 2010.
In Brazil it is also necessary to obtain concessions from the government to cast drainage. In December, 2010, Coca-Cola FEMSA increased the capacity of the water treatment plant in its Jundiaí facility. In 2012, Coca-Cola FEMSA’s production plants in Jundiaí and Mogi das Cruzes were certified in standard FSSC22000, and its plant located in Campo Grande is in the process of obtaining this certification as well.
In Brazil, a municipal regulation of the City of São Paulo, implemented pursuant to Law 13.316/2002, came into effect in May 2008. This regulation requires Coca-Cola FEMSA to collect for recycling a specified annual percentage of plastic bottles made from PET sold in the City of São Paulo; such percentage increases each year. Beginning in May 2011, Coca-Cola FEMSA was required to collect 90% of the PET bottles sold in the city of São Paulo for recycling. Currently, Coca-Cola FEMSA is not able to collect the entire required volume of PET bottles it has sold in the City of São Paulo for recycling. If Coca-Cola FEMSA does not meet the requirements of this regulation, which we believe to be more onerous than those imposed by the countries with the highest recycling standards, it could be fined and be subject to other sanctions, such as the suspension of operations in any of its plants and/or distribution centers located in the City of São Paulo. In May 2008, Coca-Cola FEMSA, together with other bottlers in the city of São Paulo, through theAssociação Brasileira das Indústrias de Refrigerantes e de Bebidas Não-alcoólicas (Brazilian Soft Drink and Non-Alcoholic Beverage Association, or ABIR), filed a motion requesting a court to overturn this regulation due to the impossibility of compliance. In addition, in November 2009, in response to a municipal authority request for Coca-Cola FEMSA to demonstrate the destination of the PET bottles sold by it in the City of São Paulo, Coca-Cola FEMSA filed a motion showing all of its recycling programs and requesting a more practical timeline to comply with the requirements of the law. In October 2010, the municipal authority of the City of São Paulo levied a fine on Coca-Cola FEMSA’s Brazilian operating expenses.subsidiary of 250,000 Brazilian reais (approximately Ps. 1,548,874 as of December 31, 2012) on the grounds that the report submitted by Coca-Cola FEMSA’s Brazilian operating subsidiary did not comply with the 75% proper disposal requirement for the period from May 2008 to May 2010. Coca-Cola FEMSA filed an appeal against this fine. In July 2012, the State Appellate Court of São Paulo rendered a decision admitting the interlocutory appeal filed on behalf of ABIR in order to suspend the fines and other sanctions to ABIR’s associated companies, including Coca-Cola FEMSA’s Brazilian subsidiary, for alleged noncompliance with the municipal regulation pending the final resolution of the lawsuit. Coca-Cola FEMSA is currently awaiting final resolution on both matters.
In August 2010, Law No. 12.305/2010 established the Brazilian National Solid Waste Policy. This policy is based on the principle of shared responsibility between the government, companies and the public, and provides for the post-consumption return of products to companies and requires public authorities to implement waste management programs. This law is regulated by Federal Decree No. 7.404/2010, and was published in December 2010. Coca-Cola FEMSA is currently discussing with the relevant authorities the impact this law may have on Brazilian companies in complying with the regulation in effect in the City of São Paulo. In response to the Brazilian National Solid Waste Policy, in December 2012, a proposal was provided to the Ministry of the Environment by almost 30 associations involved in the packaging sector, including ABIR in its capacity as representative for The Coca-Cola Company, Coca-Cola FEMSA’s Brazilian subsidiary, and other bottlers. The proposal involved creating a “coalition” to implement systems for reverse logistics packaging non-dangerous waste that makes up the dry portion of municipal solid waste or its equivalent. The goal of the proposal is to create methodologies for sustainable development, and protect the environment, society, and the economy. Coca-Cola FEMSA has not yet received a response from the Ministry of Environment.
Argentina
Coca-Cola FEMSA’s Argentine operations are subject to federal and municipal laws and regulations relating to the protection of the environment. The most significant of these are regulations concerning waste water discharge, which are enforced by theSecretaría de Ambiente y Desarrollo Sustentable(Ministry of Natural Resources and Sustainable Development) and theOrganismo Provincial para el Desarrollo Sostenible(Provincial Organization for Sustainable Development) for the province of Buenos Aires. Coca-Cola FEMSA’s Alcorta plant is in compliance with environmental standards and Coca-Cola FEMSA has been certified for ISO 14001:2004 for its plants and operative units in Buenos Aires.
For all of Coca-Cola FEMSA’s plant operations, it employs an environmental management system:Sistema de Administración Ambiental (Environmental Administration System, or EKOSYSTEM) that is contained withinSistema Integral de Calidad (Integral Quality System, or SICKOF).
Coca-Cola FEMSA has expended, and may be required to expend in the future, funds for compliance with and remediation under local environmental laws and regulations. Currently, we do not believe that such costs will have a material adverse effect on Coca-Cola FEMSA’s results or financial condition. However, since environmental laws and regulations and their enforcement are becoming increasingly more stringent in Coca-Cola FEMSA’s territories, and there is increased recognition by local authorities of the need for higher environmental standards in the countries where it operates, changes in current regulations may result in an increase in costs, which may have an adverse effect on Coca-Cola FEMSA’s future results or financial condition. Coca-Cola FEMSA’s management is not aware of any significant pending regulatory changes that would require a significant amount of additional remedial capital expenditures.
We do not believe that Coca-Cola FEMSA’s business activities pose a material risk to the environment, and we believe that Coca-Cola FEMSA is in material compliance with all applicable environmental laws and regulations.
Other regulations
In December 2009, the Venezuelan government issued a decree requiring a reduction in energy consumption by at least 20% for industrial companies whose consumption is greater than two megawatts per hour and to submit an energy-usage reduction plan. Some of Coca-Cola FEMSA’s bottling operations in Venezuela outside of Caracas met this threshold and it submitted a plan, which included the purchase of generators for its plants. In January 2010, the Venezuelan government subsequently implemented power cuts and other measures for all industries in Caracas whose consumption was above 35 kilowatts per hour.
In January 2010, the Venezuelan government amended theLey para la Defensa y Acceso a las Personas a los Bienes y Servicios (Defense of and Access to Goods and Services Law). Any violation by a company that produces, distributes and sells goods and services could lead to fines, penalties or the confiscation of the assets used to produce, distribute and sell these goods without compensation. Although we believe Coca-Cola FEMSA is in compliance with this law, consumer protection laws in Venezuela are subject to continuing review and changes, and any such changes could lead to an adverse impact on Coca-Cola FEMSA.
In July 2011, the Venezuelan government passed theLey de Costos y Precios Justos(Fair Costs and Prices Law). The purpose of this law is to establish the regulations and administrative processes necessary to maintain the price stability of, and equal access to, goods and services. The law also creates the National Ministry of Costs and Prices, whose main role is to oversee price controls and set maximum retail prices on certain consumer goods and services. Of Coca-Cola FEMSA’s products, only certain of its bottled water beverages were affected by these regulations, which mandated a lowering of its sale prices as of April 2012. Any failure to comply with this law would result in fines, temporary suspension or the closure of operations. While Coca-Cola FEMSA is currently in compliance with this law, we cannot assure you that the Venezuelan government’s future regulation of goods and services will not result in a forced reduction of prices in respect of certain of Coca-Cola FEMSA’s other products, which could have a negative effect on its results.
In May 2012, the Venezuelan government adopted significant changes to its labor regulations. This amendment to Venezuela’s labor regulations could have a negative impact on Coca-Cola FEMSA’s business and operations. The principal changes that impact Coca-Cola FEMSA’s operations are: (i) the requirement that employee terminations are now subject to governmental authorization; (ii) retroactive assessments for any modifications to Coca-Cola FEMSA’s severance payment system; (iii) the reduction of the maximum daily and weekly work hours (from 44 to 40 weekly); and (iv) the increase in obligatory weekly breaks, prohibiting any corresponding reduction in salaries.
In November, 2012, the government of the Province of Buenos Aires, Argentina, adopted Law No. 14,394, which increased the tax rate applied to product sales within the Province of Buenos Aires. If the products are manufactured in plants located in the territory of the Province of Buenos Aires, Law No. 14,394 increases the tax rate from 1% to 1.75%; if the products are manufactured in any other Argentine province, the law increases the tax rate from 3% to 4%.
In January 2012, the Costa Rican government approved a decree that regulates the sale of food and beverages in schools. The decree came into effect in 2012. Enforcement of this law will be gradual, from 2012 to 2014, depending on the specific characteristics of the food or beverage in question. According to the decree, the sale of specific sparkling beverages and still beverages that contain sugar, syrup or HFCS in any type of presentation in schools is prohibited. Coca-Cola FEMSA will still be allowed to sell water and certain still beverages in schools. We cannot assure you that the Costa Rican government will not further restrict sales of other of Coca-Cola FEMSA’s products in schools in the future; any such further restrictions could lead to an adverse impact on Coca-Cola FEMSA’s results.
In December 2012, the Cost Rican government repealed Article 61 of theirCódigo Fiscal(Fiscal Code), which had allowed Costa Rican subsidiaries to follow certain specified procedures to prevent tax withholdings on dividends paid to parent companies.
Water Supply
In Mexico, Coca-Cola FEMSA obtains water directly from municipal utility companies and pumps water from its own wells pursuant to concessions obtained from the Mexican government on a plant-by-plant basis. Water use in Mexico is regulated primarily by the 1992 Water Law, and regulations issued thereunder, which created the National Water Commission. The National Water Commission is in charge of overseeing the national system of water use. Under the 1992 Water Law, concessions for the use of a specific volume of ground or surface water generally run from five- to fifty-year terms, depending on the supply of groundwater in each region as projected by the National Water Commission. Concessionaires may request that concession terms be extended before they expire. The Mexican government is authorized to reduce the volume of ground or surface water granted for use by a concession by whatever volume of water is not used by the concessionaire for two consecutive years. However, because the current concessions for each of Coca-Cola FEMSA’s plants in Mexico do not match each plant’s projected needs for water in future years, we successfully negotiated with the Mexican government the right to transfer the unused volume under concessions from certain plants to other plants anticipating greater water usage in the future. These concessions may be terminated if, among other things, we use more water than permitted or we fail to pay required concession-related fees and do not cure such situations in a timely manner.
Although we have not undertaken independent studies to confirm the sufficiency of the existing groundwater supply, we believe that our existing concessions satisfy our current water requirements in Mexico.
In Argentina, a state water company provides water to Coca-Cola FEMSA’s Alcorta plant on a limited basis; however, we believe the authorized amount meets Coca-Cola FEMSA’s requirements for this plant. In Coca-Cola FEMSA’s Monte Grande plant in Argentina, it pumps water from its own wells, in accordance with Law 25.688.
In Brazil, Coca-Cola FEMSA buys water directly from municipal utility companies and we also capture water from underground sources, wells or surface sources (i.e., rivers), pursuant to concessions granted by the Brazilian government for each plant. According to the Brazilian Constitution, water is considered an asset of common use and can only be exploited for the national interest by Brazilians or companies formed under Brazilian law. Concessionaires and users have the responsibility for any damage to the environment. The exploitation and use of water is regulated by theCódigo de Mineração (Code of Mining, Decree Law No. 227/67), theCódigo de Águas Minerais (Mineral Water Code, Decree Law No. 7841/45), the National Water Resources Policy (Law No. 9433/97) and by regulations issued thereunder. The companies that exploit water are supervised by theDepartamento Nacional de Produção Mineiral—DNPM (National Department of Mineral Production) and the National Water Agency in connection with federal health agencies, as well as state and municipal authorities. In Coca-Cola FEMSA’s Jundiaí and Belo Horizonte plants, we do not exploit mineral water. In the Mogi das Cruzes and Campo Grande plants, we have all the necessary permits for the exploitation of mineral water.
In Colombia, in addition to natural spring water, Coca-Cola FEMSA obtains water directly from its own wells and from utility companies. Coca-Cola FEMSA is required to have a specific concession to exploit water from natural sources. Water use in Colombia is regulated by Law No. 9 of 1979 and Decrees No. 1594 of 1984 and No. 2811 of 1974. In addition, on February 6, 2012, Colombia promulgated Decree No. 303, which requires Coca-Cola FEMSA to apply for water concessions and for authorization to discharge its water into public waterways. The National Institute of National Resources supervises companies that use water as a raw material for their business.
In Nicaragua, the use of water is regulated by the Coca-Cola FEMSA Substantially all of Coca-Cola FEMSA’s sales are derived from sales ofCoca-Cola trademark beverages. Coca-Cola FEMSA The Coca-Cola Company may unilaterally set the price for its concentrate. In addition, under Coca-Cola FEMSA’s bottler agreements, Coca-Cola FEMSA is prohibited from bottling or distributing any other beverages without The Coca-Cola Company’s authorization or consent, and Coca-Cola FEMSA may not transfer control of the bottler rights of any of its territories without prior consent from The Coca-Cola Company. The Coca-Cola Company also makes significant contributions to Coca-Cola FEMSA’s marketing expenses, although it is not required to contribute a particular amount. Accordingly, The Coca-Cola Company may discontinue or reduce such contributions at any time. Coca-Cola FEMSA depends on The Coca-Cola Company to renew Coca-Cola FEMSA’s bottler agreements. As of December 31, 2012, Coca-Cola FEMSA had eight bottler agreements in The Coca-Cola Company has substantial influence on the conduct of Coca-Cola FEMSA’s business, which may result in Coca-Cola FEMSA taking actions contrary to the interests of its remaining shareholders. The Coca-Cola Company has substantial influence on the conduct of Coca-Cola FEMSA’s business. As of March 31, 2013, The Coca-Cola Company indirectly owned 28.7% of Coca-Cola FEMSA’s outstanding capital stock, representing 37.0% of Coca-Cola FEMSA’s shares with full voting rights. The Coca-Cola Company is entitled to appoint five of Coca-Cola FEMSA’s maximum of 21 directors and the vote of at least two of them is required to approve certain actions by Coca-Cola FEMSA’s board of directors. As of March 31, 2013, we indirectly owned 48.9% of Coca-Cola FEMSA’s outstanding capital stock, representing 63.0% of Coca-Cola FEMSA’s shares with full voting rights. We are entitled to appoint 13 of Coca-Cola FEMSA’s maximum of 21 directors and all of its executive officers. We and The Coca-Cola Company together, or only we in certain circumstances, have the power to determine the outcome of all actions requiring the approval of Coca-Cola FEMSA’s board of directors, and we and The Coca-Cola Company together, or only we in certain circumstances, have the power to determine the outcome of all actions requiring the approval of Coca-Cola FEMSA’s shareholders.See “Item 10. Additional Information—Material Contracts—Material Contracts Relating to Coca-Cola FEMSA.”The interests of The Coca-Cola Company may be different from the interests of Coca-Cola FEMSA’s remaining shareholders, which may result in Coca-Cola FEMSA taking actions contrary to the interests of Coca-Cola FEMSA’s remaining shareholders.Total RevenuesCoca-Cola FEMSA’s business depends on its relationship with The Coca-Cola Company, and changes in this relationship may adversely affect Coca-Cola FEMSA’s results and financial condition.total revenues increased 0.7%produces, markets, sells and distributesCoca-Cola trademark beverages through standard bottler agreements in certain territories in Mexico and Latin America, which Coca-Cola FEMSA refers to Ps. 103,456 millionas “Coca-Cola FEMSA’s territories.”See “Item 4. Information on the Company—Coca-Cola FEMSA—Coca-Cola FEMSA’s Territories.”Through its rights under Coca-Cola FEMSA’s bottler agreements and as a large shareholder, The Coca-Cola Company has the right to participate in 2010, comparedthe process for making important decisions related to Ps. 102,767 millionCoca-Cola FEMSA’s business.2009Mexico: (i) the agreements for Mexico’s Valley territory, which expire in June 2013 and April 2016, (ii) the agreements for the Central territory, which expire in August 2013, May 2015 and July 2016, (iii) the agreement for the Northeast territory, which expires in September 2014, (iv) the agreement for the Bajio territory, which expires in May 2015, and (v) the agreement for the Southeast territory, which expires in June 2013. Coca-Cola FEMSA’s bottler agreements with The Coca-Cola Company will expire for Coca-Cola FEMSA’s territories in other countries as follows: Argentina in September 2014; Brazil in April 2014; Colombia in June 2014; Venezuela in August 2016; Guatemala in March 2015; Costa Rica in September 2017; Nicaragua in May 2016 and Panama in November 2014. All of Coca-Cola FEMSA’s bottler agreements are automatically renewable for ten-year terms, subject to the right of either party to give prior notice that it does not wish to renew the applicable agreement. In addition, these agreements generally may be terminated in the case of material breach.See “Item 10. Additional Information—Material Contracts—Material Contracts Relating to Coca-Cola FEMSA.”Termination would prevent Coca-Cola FEMSA from sellingCoca-Cola trademark beverages in the affected territory and would have an adverse effect on Coca-Cola FEMSA’s business, financial condition, results and prospects.
Competition could adversely affect Coca-Cola FEMSA’s financial performance.
The beverage industry in the territories in which Coca-Cola FEMSA operates is highly competitive. Coca-Cola FEMSA faces competition from other bottlers of sparkling beverages, such asPepsi products, and from producers of low cost beverages or “B brands.” Coca-Cola FEMSA also competes in beverage categories other than sparkling beverages, such as water, juice-based beverages, teas, sport drinks and value-added dairy products. Although competitive conditions are different in each of Coca-Cola FEMSA’s territories, Coca-Cola FEMSA competes principally in terms of price, packaging, consumer sales promotions, customer service and product innovation.See “Item 4. Information on the Company—Coca-Cola FEMSA—Competition.”There can be no assurances that Coca-Cola FEMSA will be able to avoid lower pricing as a result of revenuecompetitive pressure. Lower pricing, changes made in response to competition and changes in consumer preferences may have an adverse effect on Coca-Cola FEMSA’s financial performance.
Changes in consumer preference could reduce demand for some of Coca-Cola FEMSA’s products.
The non-alcoholic beverage industry is rapidly evolving as a result of, among other things, changes in consumer preferences. Specifically, consumers are becoming increasingly more aware of and concerned about environmental and health issues. Concerns over the environmental impact of plastic may reduce the consumption of Coca-Cola FEMSA’s products sold in plastic bottles or result in additional taxes that would adversely affect consumer demand. In addition, researchers, health advocates and dietary guidelines are encouraging consumers to reduce their consumption of certain types of beverages sweetened with sugar and High Fructose Corn Syrup (“HFCS”), which could reduce demand for certain of Coca-Cola FEMSA’s products. A reduction in consumer demand would adversely affect Coca-Cola FEMSA’s results.
Water shortages or any failure to maintain existing concessions could adversely affect Coca-Cola FEMSA’s business.
Water is an essential component of all of Coca-Cola FEMSA’s products. Coca-Cola FEMSA obtains water from various sources in its territories, including springs, wells, rivers and municipal and state water companies pursuant to either concessions granted by governments in its various territories or pursuant to contracts.
Coca-Cola FEMSA obtains the vast majority of the water used in its production pursuant to concessions to use wells, which are generally granted based on studies of the existing and projected groundwater supply. Coca-Cola FEMSA’s existing water concessions or contracts to obtain water may be terminated by governmental authorities under certain circumstances and their renewal depends on receiving necessary authorizations from local and/or federal water authorities.See “Item 4. Information on the Company—Regulatory Matters—Water Supply.”In some of Coca-Cola FEMSA’s other territories, Coca-Cola FEMSA’s existing water supply may not be sufficient to meet Coca-Cola FEMSA’s future production needs, and the available water supply may be adversely affected by shortages or changes in governmental regulations and environmental changes.
We cannot assure you that water will be available in sufficient quantities to meet Coca-Cola FEMSA’s future production needs or will prove sufficient to meet Coca-Cola FEMSA’s water supply needs.
Increases in the prices of raw materials would increase Coca-Cola FEMSA’s cost of goods sold and may adversely affect Coca-Cola FEMSA’s results.
In addition to water, Coca-Cola FEMSA’s most significant raw materials are (1) concentrate, which Coca-Cola FEMSA acquires from affiliates of The Coca-Cola Company, (2) sweeteners and (3) packaging materials. Prices for sparkling beverages’ concentrate are determined by The Coca-Cola Company as a percentage of the weighted average retail price in local currency, net of applicable taxes. We cannot assure you that The Coca-Cola Company will not increase the price of the concentrate for sparkling beverages or change the manner in which such price will be calculated in the future. The prices for Coca-Cola FEMSA’s remaining raw materials are driven by market prices and local availability, the imposition of import duties and restrictions and fluctuations in exchange rates. Coca-Cola FEMSA is also required to meet all of its supply needs from suppliers approved by The Coca-Cola Company, which may limit the number of suppliers available to it. Coca-Cola FEMSA’s sales prices are denominated in the local currency in each country in which it operates, while the prices of certain materials, including those used in the bottling of Coca-Cola FEMSA’s products, mainly resin, preforms to make plastic bottles, finished plastic bottles, aluminum cans and HFCS, are paid in or determined with reference to the U.S. dollar, and therefore may increase if the U.S. dollar appreciates against the currency of the countries in which Coca-Cola FEMSA operates, as was the case in 2008 and 2009. In 2011, the U.S. dollar did not appreciate against the currencies of most of the countries in which Coca-Cola FEMSA operated; however, in 2012, the U.S. dollar did appreciate against some of those currencies. We cannot anticipate whether the U.S. dollar will appreciate or depreciate with respect to such currencies in the future.See “Item 4. Information on the Company—Coca-Cola FEMSA—Raw Materials.”
Coca-Cola FEMSA’s most significant packaging raw material costs arise from the purchase of resin and plastic preforms to make plastic bottles and from the purchase of finished plastic bottles, the prices of which are tied to crude oil prices and global resin supply. The average prices that Coca-Cola FEMSA paid for resin and plastic preforms in U.S. dollars were lower in 2012, as compared to 2011. We cannot provide any assurance that prices will not increase in future periods. During 2012, average sweetener prices, as a whole, were lower as compared to 2011 in all of the countries in which Coca-Cola FEMSA operates. From 2009 through 2012, international sugar prices were volatile due to various factors, including shifting demands, availability and climate issues affecting production and distribution. In all of the countries in which Coca-Cola FEMSA operates, other than Brazil, sugar prices are subject to local regulations and other barriers to market entry that cause Coca-Cola FEMSA to pay in excess of international market prices.See “Item 4. Information on the Company—Coca-Cola FEMSA—Raw Materials.”We cannot assure you that Coca-Cola FEMSA’s raw material prices will not further increase in the future. Increases in the prices of raw materials would increase Coca-Cola FEMSA’s cost of goods sold and adversely affect Coca-Cola FEMSA’s financial performance.
Taxes could adversely affect Coca-Cola FEMSA’s business.
The countries in which Coca-Cola FEMSA operates may adopt new tax laws or modify existing laws to increase taxes applicable to Coca-Cola FEMSA’s business. For example, in Mexico, a general tax reform became effective on January 1, 2010, pursuant to which, as applicable to Coca-Cola-FEMSA, there was a temporary increase in the income tax rate from 28% to 30% from 2010 through 2012. Pursuant to an amendment issued at the end of 2012, the 30% income tax rate will continue to apply through 2013. In addition, the value added tax (“VAT”) rate in Mexico increased in 2010 from 15% to 16%.
In Panama, there was an increase in a certain consumer tax, effective as of April 1, 2010, affecting syrups, powders and concentrate. Some of these materials are used for the production of Coca-Cola FEMSA’s sparkling beverages. These taxes increased from 6% to 10%.
In November 2012, the government of the Province of Buenos Aires adopted Law No. 14,394, which increased the tax rate applied to product sales within the Province of Buenos Aires. If the products are manufactured in plants located in the territory of the Province of Buenos Aires, Law No. 14,394 increases the tax rate from 1% to 1.75%; if the products are manufactured in any other Argentine province, the law increases the tax rate from 3% to 4%.
In Brazil, the federal taxes applied on the production and sale of beverages are based on the national average retail price, calculated based on a yearly survey of each Brazilian beverage brand, combined with a fixed tax rate and a multiplier specific for each class of presentation (glass, plastic or can). On October 1, 2012, a number of changes to the Brazilian tax rate became effective. These changes include increases in the multipliers used to calculate soft drink taxes when presented in cans or glasses. Upon effectiveness, the multiplier for cans increased from 30.0% to 31.9%, and beginning in September 2014, the multiplier will gradually increase up to 38.1% in October 1, 2018. The multiplier for glasses increased from 35.0% to 37.2%, and beginning in September 2014, the multiplier will gradually increase up to 44.4% in October 1, 2018. In addition, the amendment suspended the 50% production tax benefit that had previously applied to juice-added soft drinks, and raised the rate for such beverages to the level currently applied to cola beverages. The amendments that benefited Coca-Cola FEMSA’s Brazilian subsidiary were the reduction of the production tax on concentrate, from 27.0% to 20.0%, and the elimination of the sale tax on mineral water (sparkling or still).
Coca-Cola FEMSA’s products are also subject to certain taxes in many of the countries in which it operates. Certain countries in Central America, Brazil and Argentina also impose taxes on sparkling beverages.See “Item 4. Information on the Company—Regulatory Matters—Taxation of Sparkling Beverages.”We cannot assure you that any governmental authority in any country where Coca-Cola FEMSA operates will not impose new taxes or increase taxes on Coca-Cola FEMSA’s products in the future. The imposition of new taxes or increases in taxes on Coca-Cola FEMSA’s products may have a material adverse effect on Coca-Cola FEMSA’s business, financial condition, prospects and results.
Regulatory developments may adversely affect Coca-Cola FEMSA’s business.
Coca-Cola FEMSA is subject to regulation in each of the territories in which it operates. The principal areas in which Coca-Cola FEMSA is subject to regulation are water, environment, labor, taxation, health and antitrust. Regulation can also affect Coca-Cola FEMSA’s ability to set prices for its products.See “Item 4. Information on the Company—Regulatory Matters.”The adoption of new laws or regulations or a stricter interpretation or enforcement thereof in the countries in which Coca-Cola FEMSA operates may increase Coca-Cola FEMSA’s operating costs or impose restrictions on Coca-Cola FEMSA’s operations which, in turn, may adversely affect its financial condition, business and results. In particular, environmental standards are becoming more stringent in several of the countries in which Coca-Cola FEMSA operates, and Coca-Cola FEMSA is in the process of complying with these standards, although we cannot assure you that Coca-Cola FEMSA will be able to meet any timelines for compliance established by the relevant regulatory authorities.See “Item 4. Information on the Company—Regulatory Matters—Environmental Matters.”Further changes in current regulations may result in an increase in compliance costs, which may have an adverse effect on Coca-Cola FEMSA’s future results or financial condition.
Voluntary price restraints or statutory price controls have been imposed historically in several of the countries in which Coca-Cola FEMSA operates. Currently, there are no price controls on Coca-Cola FEMSA’s products in any of the territories in which it has operations, except for those in (i) Argentina, where authorities directly supervise certain products sold through supermarkets to control inflation; and (ii) Venezuela, where the government has recently imposed price controls on certain products including bottled water. The imposition of these restrictions or voluntary price restraints in other territories may have an adverse effect on Coca-Cola FEMSA’s results and financial position.See “Item 4. Information on the Company—Regulatory Matters—Price Controls.”We cannot assure you that governmental authorities in any country where Coca-Cola FEMSA operates will not impose statutory price controls or that it will not need to implement voluntary price restraints in the future.
In January 2010, the Venezuelan government amended theLey para la Defensa y Acceso a las Personas a los Bienes y Servicios (Access to Goods and Services Defense Law). Any violation by a company that produces, distributes and sells goods and services could lead to fines, penalties or the confiscation of the assets used to produce, distribute and sell these goods without compensation. Although Coca-Cola FEMSA believes it is in compliance with this law, consumer protection laws in Venezuela are subject to continuing review and changes, and any such changes may have an adverse impact on Coca-Cola FEMSA.
In July 2011, the Venezuelan government passed theLey de Costos y Precios Justos (Fair Costs and Prices Law). The purpose of this law is to establish the regulations and administrative processes necessary to maintain the price stability of, and equal access to, goods and services. The law also creates the National Ministry of Costs and Prices, the main role of which is to oversee price controls and set maximum retail prices on certain consumer goods and services. Of Coca-Cola FEMSA’s products, only certain of its bottled water beverages were affected by these regulations, which mandated lower sale prices as of April 2012. Any failure to comply with this law would result in fines, temporary suspension or the closure of operations. We cannot assure you that the Venezuelan government’s future regulation of goods and services will not result in a forced reduction of prices in other of Coca-Cola FEMSA’s products, which could have a negative effect on Coca-Cola FEMSA’s results.
In May 2012, the Venezuelan government adopted significant changes to labor regulations. This amendment to Venezuela’s labor regulations could have a negative impact on Coca-Cola FEMSA’s business and operations. The principal changes that impact on Coca-Cola FEMSA’s operations are: (i) the requirement that employee terminations are now subject to governmental authorization; (ii) retroactive assessments for any modifications to Coca-Cola FEMSA’s severance payment system; (iii) the reduction of the maximum daily and weekly work hours (from 44 to 40 weekly); and (iv) the increase in obligatory weekly breaks, prohibiting any corresponding reduction in salaries.
In January 2012, the Costa Rican government approved a decree which regulates the sale of food and beverages in schools. The decree came into effect in 2012. Enforcement of this law will be gradual, from 2012 to 2014, depending on the specific characteristics of the food and beverage in question. According to the decree, the sale of specific sparkling beverages and still beverages that contain sugar, syrup or HFCS in any type of presentation in schools is prohibited. Coca-Cola FEMSA will still be allowed to sell water and certain still beverages in schools. We cannot assure you that the Costa Rican government will not further restrict sales of other of its products in schools in the future; any such further restrictions could lead to an adverse impact on its results.
Coca-Cola FEMSA’s operations have from time to time been subject to investigations and proceedings by antitrust authorities, and litigation relating to alleged anticompetitive practices. Coca-Cola FEMSA has also been subject to investigations and proceedings on environmental and labor matters.See “Item 8. Financial Information—Legal Proceedings.”We cannot assure you that these investigations and proceedings will not have an adverse effect on Coca-Cola FEMSA’s results or financial condition.
Economic and political conditions in the countries in which Coca-Cola FEMSA operates other than Mexico may increasingly adversely affect its business.
In addition to Mexico, Coca-Cola FEMSA conducts operations in Brazil, Guatemala, Nicaragua, Costa Rica, Panama, Colombia, Venezuela and Argentina. Total revenues from Coca-Cola FEMSA’s combined non-Mexican operations decreased as a percentage of its consolidated total revenues from 63.8% in 2011 to 60.8% in 2012; for the same non-Mexican operations, Coca-Cola FEMSA’s gross profit decreased as a percentage of its consolidated gross profit from 62.2% in 2011 to 59.3% in 2012. Given the relevance of Coca-Cola FEMSA’s non-Mexican operations, its results continue to be affected by the economic and political conditions in the countries, other than Mexico, where it conducts operations.
Coca-Cola FEMSA’s business may be affected by the general conditions of the Brazilian economy, the rate of inflation, Brazilian interest rates or exchange rates for Brazilian reais. Decreases in the growth rate of the Brazilian economy, periods of negative growth and/or increases in inflation or interest rates may result in lower demand for Coca-Cola FEMSA’s products, lower real pricing of its products or a shift to lower margin products.
Consumer demand, preferences, real prices and the costs of raw materials are heavily influenced by macroeconomic and political conditions in the other countries in which Coca-Cola FEMSA operates. These conditions vary by country and may not be correlated to conditions in Coca-Cola FEMSA’s MercosurMexican operations. In Venezuela, Coca-Cola FEMSA continues to face exchange rate risk as well as scarcity of and restrictions on importing raw materials. Deterioration in economic and political conditions in any of these countries would have an adverse effect on Coca-Cola FEMSA’s financial position and results.
Venezuelan political events may affect Coca-Cola FEMSA’s operations. Although Venezuela will hold elections on April 14, 2013, in light of the death of President Hugo Chavez, political uncertainty remains. We cannot provide any assurances that political developments in Venezuela, over which Coca-Cola FEMSA has no control, will not have an adverse effect on Coca-Cola FEMSA’s business, financial condition or results.
On October 7, 2012, General Otto Peréz Molina, representing thePartido Patriota(Patriot Party), was elected to the presidency in Guatemala. We cannot assure you that the elected president will continue to apply the same policies that have been applied to Coca-Cola FEMSA in the past.
Depreciation of the local currencies of the countries in which Coca-Cola FEMSA operates against the U.S. dollar may increase Coca-Cola FEMSA’s operating costs. Coca-Cola FEMSA has also operated under exchange controls in Venezuela since 2003, which limit its ability to remit dividends abroad or make payments other than in local currencies and that may increase the real price paid for raw materials and services purchased in local currency. In February 2013, the Venezuelan government announced a devaluation in its official exchange rate, from 4.30 to 6.30 bolivars per US$ 1.00. For further information, please see Note 3.3 and Note 29 to our audited consolidated financial statements. Future changes in the Venezuelan exchange control regime, and future currency devaluations or the imposition of exchange controls in any of the countries in which Coca-Cola FEMSA has operations could have an adverse effect on its financial position and results.
We cannot assure you that political or social developments in any of the countries in which Coca-Cola FEMSA has operations, over which we have no control, will not have a corresponding adverse effect on the global market or on Coca-Cola FEMSA’s business, financial condition or results.
Weather conditions may adversely affect Coca-Cola FEMSA’s results.
Lower temperatures and higher rainfall may negatively impact consumer patterns, which may result in lower per capita consumption of Coca-Cola FEMSA’s beverage offerings. Additionally, adverse weather conditions may affect road infrastructure in the territories in which Coca-Cola FEMSA operates and limit Coca-Cola FEMSA’s ability to sell and distribute its products, thus affecting its results.
Coca-Cola FEMSA now conducts business in countries in which it has not previously operated and that present different or greater risks than certain countries in Latin America.
As a result of the acquisition of 51% of the outstanding shares of the Coca-Cola Bottlers Philippines, Inc. (“CCBPI”), Coca-Cola FEMSA has expanded its geographic reach from Latin America to include the Philippines. The Philippines presents different risks than the risks Coca-Cola FEMSA faces in Latin America. Coca-Cola FEMSA has not previously conducted business in CCPBI’s territories. Coca-Cola FEMSA now faces competitive pressures that are different than those Coca-Cola FEMSA has historically faced. In the Philippines, Coca-Cola FEMSA is the only beverage company competing across categories, and it faces significant competition in each category. In addition, the per capita income of the population in Philippines is lower than the average per capita income in the countries in which Coca-Cola FEMSA currently operates, and the distribution and marketing practices in the Philippines differ from Coca-Cola FEMSA’s historical practices. Coca-Cola FEMSA may have to adapt its marketing and distribution strategies to compete effectively. Coca-Cola FEMSA’s inability to compete effectively may have an adverse effect on its future results.See “Item 4. Information on the Company—The Company—Recent Acquisitions.”
FEMSA Comercio
Competition from other retailers in Mexico divisionscould adversely affect FEMSA Comercio’s business.
The Mexican retail sector is highly competitive. FEMSA participates in the retail sector primarily through FEMSA Comercio. FEMSA Comercio’s OXXO stores face competition from small-format stores like 7-Eleven, Super Extra, Super City, Círculo K stores and despiteother numerous chains of retailers across Mexico, from other regional small format retailers to small informal neighborhood stores. In particular, small informal neighborhood stores can sometimes avoid regulatory oversight and taxation, enabling them to sell certain products at below market prices. In addition, these small informal neighborhood stores could improve their technological capabilities so as to enable credit card transactions and electronic payment of utility bills, which would diminish FEMSA Comercio’s competitive advantage. FEMSA Comercio may face additional competition from new market entrants. Increased competition may limit the number of new locations available to FEMSA Comercio and require FEMSA Comercio to modify its product offering or pricing. In addition, consumers may prefer alternative products or store formats offered by competitors. As a result, FEMSA Comercio’s results and financial position may be adversely affected by competition in the future.
Sales of OXXO convenience stores may be adversely affected by changes in economic conditions in Mexico.
Convenience stores often sell certain products at a premium. The convenience store market is thus highly sensitive to economic conditions, since an economic slowdown is often accompanied by a decline in consumer purchasing power, which in turn results in a decline in the overall consumption of FEMSA Comercio’s main product categories. During periods of economic slowdown, OXXO stores may experience a decline in traffic per store and purchases per customer, and this may result in a decline in FEMSA Comercio’s results.
Taxes could adversely affect FEMSA Comercio’s business.
Mexico may adopt new tax laws or modify existing laws to increase taxes applicable to FEMSA Comercio’s business. For example, a general tax reform became effective on January 1, 2010, pursuant to which, as applicable to FEMSA Comercio, there was a temporary increase in the income tax rate from 28% to 30% from 2010 through 2012. Pursuant to an amendment issued at the end of 2012, the 30% income tax rate will continue to apply through 2013. In addition, the VAT rate in Mexico increased in 2010 from 15% to 16%. If the VAT rate increases, it could cause lower traffic or ticket figures for FEMSA Comercio.
FEMSA Comercio may not be able to maintain its historic growth rate.
FEMSA Comercio increased the number of OXXO stores at a compound annual growth rate of 13.6% from 2008 to 2012. The growth in the number of OXXO stores has driven growth in total revenue and results at FEMSA Comercio over the same period. As the overall number of stores increases, percentage growth in the number of OXXO stores is likely to decrease. In addition, as convenience store penetration in Mexico grows, the number of viable new store locations may decrease, and new store locations may be less favorable in terms of same store sales, average ticket and store traffic. As a result, FEMSA Comercio’s future results and financial condition may not be consistent with prior periods and may be characterized by lower growth rates in terms of total revenue and results. In Colombia, FEMSA Comercio may not be able to maintain similar historic growth rates to those in Mexico.
FEMSA Comercio’s business may be adversely affected by an increase of insecurity in Mexico.
In recent years, crime rates have remained high, particularly in the north of Mexico, and there has been a particular increase in drug-related crime and other organized crime. Although FEMSA Comercio has stores across the majority of the Mexican territory, the north of Mexico represents an important region in FEMSA Comercio’s operations. An increase in crime rates could negatively affect sales and customer traffic, increase security expenses incurred in each store, result in higher turnover of personnel or damage to the perception of the OXXO brand, each of which could have an adverse effect on FEMSA Comercio’s business.
FEMSA Comercio’s business may be adversely affected by changes in information technology.
FEMSA Comercio invests aggressively in information technology (which we refer to as IT) in order to maximize its value generation potential. Given the rapid speed at which FEMSA Comercio adds new services and products to its commercial offerings, the development of IT systems, hardware and software needs to keep pace with the growth of the business. If these systems became unstable or if planning for future IT investments were inadequate, it could affect FEMSA Comercio’s business by reducing the flexibility of its value proposition to consumers or by increasing its operating complexity, either of which could adversely affect FEMSA Comercio’s revenue-per-store trends.
FEMSA Comercio’s business could be adversely affected by a failure, interruption, or breach of our IT system.
FEMSA Comercio’s business relies heavily on its advanced IT system to effectively manage its data, communications, connectivity, and other business processes. Although we constantly improve our IT system and protect it with advanced security measures, it may still be subject to defects, interruptions, or security breaches such as viruses or data theft. Such a defect, interruption, or breach could adversely affect FEMSA Comercio’s results or financial position.
FEMSA Comercio’s business may be adversely affected by an increase in the price of electricity.
The performance of FEMSA Comercio’s stores would be adversely affected by increases in the price of utilities on which the stores depend, such as electricity. Although the price of electricity in Mexico has remained stable recently, it could potentially increase as a result of inflation, shortages, interruptions in supply, or other reasons, and such an increase could adversely affect our results or financial position.
Risks Related to Our Holding of Heineken N.V. and Heineken Holding N.V. Shares
FEMSA does not control Heineken N.V.’s and Heineken Holding N.V.’s decisions.
On April 30, 2010, FEMSA announced the closing of the transaction pursuant to which FEMSA agreed to exchange 100% of its beer operations for a 20% economic interest in Heineken N.V. and Heineken Holding N.V. (which, together with their respective subsidiaries, we refer to as Heineken or the Heineken Group). As a consequence of this transaction, which we refer to as the Heineken transaction, FEMSA now participates in the Heineken Holding N.V. Board of Directors, which we refer to as the Heineken Holding Board, and in the Heineken N.V. Supervisory Board, which we refer to as the Heineken Supervisory Board. However, FEMSA is not a majority or controlling shareholder of Heineken N.V. or Heineken Holding N.V., nor does it control the decisions of the Heineken Holding Board or the Heineken Supervisory Board. Therefore, the decisions made by the majority or controlling shareholders of Heineken N.V. or Heineken Holding N.V. or the Heineken Holding Board or the Heineken Supervisory Board may not be consistent with or may not consider the interests of FEMSA’s shareholders or may be adverse to the interests of FEMSA’s shareholders. Additionally, FEMSA has agreed not to disclose non-public information and decisions taken by Heineken.
Heineken is present in a large number of countries.
Heineken is a global brewer and distributor of beer in a large number of countries. As a consequence of the Heineken transaction, FEMSA shareholders are indirectly exposed to the political, economic and social circumstances affecting the markets in which Heineken is present, which may have an adverse effect on the value of FEMSA’s interest in Heineken, and, consequently, the value of FEMSA shares.
Strengthening of the Mexican peso compared to the Euro.
In the event of a depreciation of the euro against the Mexican peso, the fair value of FEMSA’s investment in shares will be adversely affected.
Furthermore, the cash flow that is expected to be received in the form of dividends from Heineken will be in euros, and therefore, in the event of a depreciation of the euro against the Mexican peso, the amount of expected cash flow will be adversely affected.
Heineken N.V. and Heineken Holding N.V. are publicly listed companies.
Heineken N.V. and Heineken Holding N.V. are listed companies whose stock trades publicly and is subject to market fluctuation. A reduction in the price of Heineken N.V. or Heineken Holding N.V. shares would result in a reduction in the economic value of FEMSA’s participation in Heineken.
Risks Related to Our Principal Shareholders and Capital Structure
A majority of our voting shares are held by a voting trust, which effectively controls the management of our company, and the interests of which may differ from those of other shareholders.
As of March 15, 2013, a voting trust, of which the participants are members of seven families, owned 38.69% of our capital stock and 74.86% of our capital stock with full voting rights, consisting of the Series B Shares. Consequently, the voting trust has the power to elect a majority of the members of our board of directors and to play a significant or controlling role in the outcome of substantially all matters to be decided by our board of directors or our shareholders. The interests of the voting trust may differ from those of our other shareholders.See “Item 7. Major Shareholders and Related Party Transactions” and “Item 10. Additional Information—Bylaws—Voting Rights and Certain Minority Rights.”
Holders of Series D-B and D-L Shares have limited voting rights.
Holders of Series D-B and D-L Shares have limited voting rights and are only entitled to vote on specific matters, such as certain changes in the form of our corporate organization, dissolution, or liquidation, a merger with a company with a distinct corporate purpose, a merger in which we are not the surviving entity, a change of our jurisdiction of incorporation, the cancellation of the registration of the Series D-B and D-L Shares and any other matters that expressly require approval from such holders under the Mexican Securities Law. As a result of these limited voting rights, Series D-B and D-L holders will not be able to influence our business or operations.See “Item 7. Major Shareholders and Related Party Transactions—Major Shareholders” and “Item 10. Additional Information—Bylaws—Voting Rights and Certain Minority Rights.”
Holders of ADSs may not be able to vote at our shareholder meetings.
Our shares are traded on the New York Stock Exchange, or NYSE, in the form of ADSs. We cannot assure you that holders of our shares in the form of ADSs will receive notice of shareholders’ meetings from our ADS depositary in sufficient time to enable such holders to return voting instructions to the ADS depositary in a timely manner. In the event that instructions are not received with respect to any shares underlying ADSs, the ADS depositary will, subject to certain limitations, grant a proxy to a person designated by us in respect of these shares. In the event that this proxy is not granted, the ADS depositary will vote these shares in the same manner as the majority of the shares of each class for which voting instructions are received.
Holders of BD Units in the United States and holders of ADSs may not be able to participate in any future preemptive rights offering and as a result may be subject to dilution of their equity interests.
Under applicable Mexican law, if we issue new shares for cash as a part of a capital increase, other than in connection with a public offering of newly issued shares or treasury stock, we are generally required to grant our shareholders the right to purchase a sufficient number of shares to maintain their existing ownership percentage. Rights to purchase shares in these circumstances are known as preemptive rights. By law, we may not allow holders of our shares or ADSs who are located in the United States to exercise any preemptive rights in any future capital increases unless (1) we file a registration statement with the U.S. Securities and Exchange Commission, which we refer to as the SEC, with respect to that future issuance of shares or (2) the offering qualifies for an exemption from the registration requirements of the U.S. Securities Act of 1933. At the time of any future capital increase, we will evaluate the costs and potential liabilities associated with filing a registration statement with the SEC, as well as the benefits of preemptive rights to holders of our shares in the form of ADSs in the United States and any other factors that we consider important in determining whether to file a registration statement.
We may decide not to file a registration statement with the SEC to allow holders of our shares or ADSs who are located in the United States to participate in a preemptive rights offering. In addition, under current Mexican law, the sale by the ADS depositary of preemptive rights and the distribution of the proceeds from such sales to the holders of our shares in the form of ADSs is not possible. As a result, the equity interest of holders of our shares in the form of ADSs would be diluted proportionately.See “Item 10. Additional Information—Bylaws—Preemptive Rights.”
The protections afforded to minority shareholders in Mexico are different from those afforded to minority shareholders in the United States.
Under Mexican law, the protections afforded to minority shareholders are different from, and may be less than, those afforded to minority shareholders in the United States. Mexican laws do not provide a remedy to shareholders relating to violations of fiduciary duties. There is no procedure for class actions as such actions are conducted in the United States and there are different procedural requirements for bringing shareholder lawsuits against directors for the benefit of companies. Therefore, it may be more difficult for minority shareholders to enforce their rights against us, our directors or our controlling shareholders than it would be for minority shareholders of a United States company.
Investors may experience difficulties in enforcing civil liabilities against us or our directors, officers and controlling persons.
FEMSA is organized under the laws of Mexico, and most of our directors, officers and controlling persons reside outside the United States. In addition, all or a substantial portion of our assets and their respective assets are located outside the United States. As a result, it may be difficult for investors to effect service of process within the United States on such persons or to enforce judgments against them, including any action based on civil liabilities under the U.S. federal securities laws. There is doubt as to the enforceability against such persons in Mexico, whether in original actions or in actions to enforce judgments of U.S. courts, of liabilities based solely on the U.S. federal securities laws.
Developments in other countries may adversely affect the market for our securities.
The market value of securities of Mexican companies is, to varying degrees, influenced by economic and securities market conditions in other emerging market countries. Although economic conditions are different in each country, investors’ reaction to developments in one country can have effects on the securities of issuers in other countries, including Mexico. We cannot assure you that events elsewhere, especially in emerging markets, will not adversely affect the market value of our securities.
The failure or inability of our subsidiaries to pay dividends or other distributions to us may adversely affect us and our ability to pay dividends to holders of ADSs.
We are a holding company. Accordingly, our cash flows are principally derived from dividends, interest and other distributions made to us by our subsidiaries. Currently, our subsidiaries do not have contractual obligations that require them to pay dividends to us. In addition, debt and other contractual obligations of our subsidiaries may in the future impose restrictions on our subsidiaries’ ability to make dividend or other payments to us, which in turn may adversely affect our ability to pay dividends to shareholders and meet its debt and other obligations. As of December 31, 2012, we had no restrictions on our ability to pay dividends. Given the exchange of 100% of our ownership of the business of Cuauhtémoc Moctezuma Holding, S.A. de C.V. (formerly FEMSA Cerveza, S.A. de C.V.) (which we refer to as Cuauhtémoc Moctezuma or FEMSA Cerveza) for a 20% economic interest in Heineken, our non-controlling shareholder position in Heineken means that we will be unable to require payment of dividends with respect to the Heineken shares.
Risks Related to Mexico and the Other Countries in Which We Operate
Adverse economic conditions in Mexico may adversely affect our financial position and results.
We are a Mexican corporation, and our Mexican operations are our single most important geographic territory. Given the exchange of 100% of our FEMSA Cerveza business for a 20% economic interest in the Heineken Group, FEMSA shareholders may face a lesser degree of exposure with respect to economic conditions in Mexico and a greater degree of indirect exposure to the political, economic and social circumstances affecting the markets in which Heineken is present. For the year ended December 31, 2012, 62% of our consolidated total revenues were attributable to Mexico and at the net income level the percentage attributable to our Mexican operations is further reduced. The Mexican economy experienced a downturn as a result of the impact of the global financial crisis on many emerging economies that began in the second half of 2008 and continued through 2010.
In 2012, Mexican gross domestic product, or GDP, increased by approximately 3.9% on an annualized basis compared to 2011, due to an improvement in most sectors of the economy, driven by agriculture. The Mexican economy continues to be heavily influenced by the U.S. economy, and therefore, further deterioration in economic conditions in, or delays in recovery of, the U.S. economy may hinder any recovery in Mexico. In the past, Mexico has experienced both prolonged periods of weak economic conditions and deteriorations in economic conditions that have had a negative impact on our results. Given the global macroeconomic downturn in 2009 and 2010, and the slow and incipient recovery in 2011 and 2012, which also affected the Mexican economy, we cannot assure you that such conditions will not have a material adverse effect on our results and financial position going forward.
Our business may be significantly affected by the general condition of the Mexican economy, or by the rate of inflation in Mexico, interest rates in Mexico and exchange rates for, or exchange controls affecting, the Mexican peso. Decreases in the growth rate of the Mexican economy, periods of negative growth and/or increases in inflation or interest rates may result in lower demand for our products, lower real pricing of our products or a shift to lower margin products. Because a large percentage of our costs and expenses are fixed, we may not be able to reduce costs and expenses upon the occurrence of any of these events, and our profit margins may suffer as a result.
In addition, an increase in interest rates in Mexico would increase the cost to us of variable rate debt, Mexican peso-denominated funding, which constituted 18.3% of our total debt as of December 31, 2012 (the total amount of the debt and the variable rate debt used in the calculation of this percentage considers converting only the units of investments debt for the related cross currency swap, and it also includes the effect of related interest rate swaps), and have an adverse effect on our financial position and results.
Depreciation of the Mexican peso relative to the U.S. dollar could adversely affect our financial position and results.
Depreciation of the Mexican peso relative to the U.S. dollar increases the cost to us of a portion of the raw materials we acquire, the price of which is paid in or determined with reference to U.S. dollars, and of our debt obligations denominated in U.S. dollars, and thereby negatively affects our financial position and results. A severe devaluation or depreciation of the Mexican peso may result in disruption of the international foreign exchange markets and may limit our ability to transfer or to convert Mexican pesos into U.S. dollars and other currencies for the purpose of making timely payments of interest and principal on our U.S. dollar-denominated debt or obligations in other currencies. Although the value of the Mexican peso against the U.S. dollar had been fairly stable until mid-2008, in the fourth quarter of 2008, the Mexican peso depreciated approximately 27% compared to the fourth quarter of 2007. Since 2008, the Mexican peso has continued to experience exchange rate fluctuations relative to the U.S. dollar, as follows. During 2010 and 2011, the Mexican peso experienced different fluctuations relative to the U.S. dollar of approximately 5.6% of recovery and 12.7% of depreciation compared to the years of 2009 and 2010 respectively. During 2012, the Mexican peso experienced an appreciation relative to the U.S. dollar of approximately 7.1% compared to 2011. In the first quarter of 2013, the Mexican peso appreciated approximately 5.0% relative to the U.S. dollar compared to the fourth quarter of 2012.
While the Mexican government does not currently restrict, and since 1982 has not restricted, the right or ability of Mexican or foreign persons or entities to convert Mexican pesos into U.S. dollars or to transfer other currencies out of Mexico, the Mexican government could institute restrictive exchange rate policies in the future, as it has done in the past. Currency fluctuations may have an adverse effect on our financial position, results and cash flows in future periods.
When the financial markets are volatile, as they have been in recent periods, our results may be substantially affected by variations in exchange rates and commodity prices, and to a lesser degree, interest rates. These effects include foreign exchange gain and loss on assets and liabilities denominated in U.S. dollars, fair value gain and loss on derivative financial instruments, commodities prices and changes in interest income and interest expense. These effects can be much more volatile than our operating performance and our operating cash flows.
Political events in Mexico could adversely affect our operations.
Mexican political events may significantly affect our operations. Presidential elections in Mexico occur every six years, with the most recent one occurring in July 2012. Enrique Peña Nieto, a member of thePartido Revolucionario Institucional, was elected as the new president of Mexico and took office on December 1, 2012. As with any governmental change, the new government may lead to significant changes in governmental policies, may contribute to economic uncertainty and to heightened volatility of the Mexican capital markets and securities issued by Mexican companies. Currently, no single party has a majority in the Senate or theCámara de Diputados (House of Representatives), and the absence of a clear majority by a single party could result in government gridlock and political uncertainty due to the Mexican congress’ potential inability to reach consensus on the structural reforms required to modernize certain sectors of and foster growth in the Mexican economy. We cannot provide any assurances that political developments in Mexico, over which we have no control, will not have an adverse effect on our business, financial condition, results and prospects.
Insecurity in Mexico could increase, and this could adversely affect our results.
The presence and increasing levels of violence among drug cartels, and between these and the Mexican law enforcement and armed forces, pose a risk to our business. Organized criminal activity and related violent incidents remained high during 2012 and to a lesser extent in the first quarter of 2013 and are relatively concentrated along the northern Mexican border, as well as in certain other Mexican states such as Sinaloa, Michoacán and Guerrero. The principal driver of organized criminal activity is the drug trade that aims to supply and profit from the uninterrupted demand for drugs and the supply of weapons from the United States. This situation could impact our business because consumer habits and patterns adjust to the increased perceived and real insecurity as people refrain from going out as much and gradually shift some on-premise consumption to off-premise consumption of food and beverages on certain social occasions. Insecurity could increase, and this could therefore adversely affect our operational and financial results.
Depreciation of local currencies in other Latin American countries in which we operate may adversely affect our financial position.
Total revenues increased in certain of our non-Mexican beverage operations at a higher rate relative to their respective Mexican operations in 2012. The recurrence of such a higher rate of total revenue growth could result in a greater contribution to the respective results for these territories, but may also expose us to greater risk in these territories as a result. The devaluation of the Venezuelan bolivar,local currencies against the U.S. dollar in our non-Mexican territories can increase our operating costs in these countries, and depreciation of the local currencies against the Mexican peso can negatively affect our results for these countries. In recent years, the value of the currency in the countries in which affectedwe operate had been relatively stable except in Venezuela. Future currency devaluation or the imposition of exchange controls in any of these countries, including Mexico, would have an adverse effect on our revenuesfinancial position and results.
| ITEM 4. | INFORMATION ON THE COMPANY |
We are a Mexican company headquartered in Monterrey, Mexico, and our origin dates back to 1890. Our company was incorporated on May 30, 1936 and has a duration of 99 years. The duration can be extended indefinitely by resolution of our shareholders. Our legal name is Fomento Económico Mexicano, S.A.B. de C.V., and in commercial contexts we frequently refer to ourselves as FEMSA. Our principal executive offices are located at General Anaya No. 601 Pte., Colonia Bella Vista, Monterrey, Nuevo León 64410, Mexico. Our telephone number at this location is (52-81) 8328-6000. Our website is www.femsa.com. We are organized as asociedad anónima bursátil de capital variable under the laws of Mexico.
We conduct our operations through the following principal holding companies, each of which we refer to as a principal sub-holding company:
Coca-Cola FEMSA, which engages in the production, distribution and marketing of beverages;
FEMSA Comercio, which operates small-format stores; and
CB Equity, which holds our investment in Heineken.
FEMSA traces its origins to the establishment of Mexico’s first brewery, Cervecería Cuauhtémoc, S.A., which we refer to as Cuauhtémoc, which was founded in 1890 by four Monterrey businessmen: Francisco G. Sada, José A. Muguerza, Isaac Garza and José M. Schneider. Descendants of certain of the founders of Cuauhtémoc are participants of the voting trust that country. controls the management of our company.
The strategic integration of our company dates back to 1936 when our packaging operations were established to supply crown caps to the brewery. During this period, these operations were part of what was known as the Monterrey Group, which also included interests in banking, steel and other packaging operations.
In 1974, the Monterrey Group was split between two branches of the descendants of the founding families of Cuauhtémoc. The steel and other packaging operations formed the basis for the creation of Corporación Siderúrgica, S.A. (now Alfa, S.A.B. de C.V.), controlled by the Garza Sada family, and the beverage and banking operations were consolidated under the Valores Industriales, S.A. de C.V. (the corporate predecessor of FEMSA) corporate umbrella controlled by the Garza Lagüera family. FEMSA’s shares were first listed on what is now the Bolsa Mexicana de Valores, S.A.B. de C.V. (which we refer to as the Mexican Stock Exchange) on September 19, 1978. Between 1977 and 1981, FEMSA diversified its operations through acquisitions in the soft drinks and mineral water industries, the establishment of the first stores under the trade name OXXO and other investments in the hotel, construction, auto parts, food and fishing industries, which were considered non-core businesses and were subsequently divested.
In the 1990s, we began a series of strategic transactions to strengthen the competitive positions of our operating subsidiaries. These transactions included the sale of a 30% strategic interest in Coca-Cola FEMSA to a wholly-owned subsidiary of The Coca-Cola Company and a subsequent public offering of Coca-Cola FEMSA shares, both of which occurred in 1993. Coca-Cola FEMSA listed its L shares on the Mexican Stock Exchange, and, in the form of ADS, on the New York Stock Exchange.
In 1998, we completed a reorganization that changed our capital structure by converting our outstanding capital stock at the time of the reorganization into BD Units and B Units, and united the shareholders of FEMSA and the former shareholders of Grupo Industrial Emprex, S.A. de C.V. (which we refer to as Emprex) at the same corporate level through an exchange offer that was consummated on May 11, 1998. As part of the reorganization, FEMSA listed ADSs on the NYSE representing BD Units, and listed the BD Units and its B Units on the Mexican Stock Exchange.
In May 2003, our subsidiary Coca-Cola FEMSA expanded its operations throughout Latin America by acquiring 100% of Panamerican Beverages, Inc., which we refer to as Panamco, then the largest soft drink bottler in Latin America in terms of sales volume in 2002. Through its acquisition of Panamco, Coca-Cola FEMSA began producing and distributingCoca-Cola trademark beverages in additional territories in Mexico, Central America, Colombia, Venezuela and Brazil, along with bottled water, beer and other beverages in some of these territories. The Coca-Cola Company and its subsidiaries received Series D Shares in exchange for their equity interest in Panamco of approximately 25%.
In November 2007, Administración S.A.P.I., a Mexican company owned directly or indirectly by Coca-Cola FEMSA and The Coca-Cola Company, acquired 100% of the shares of capital stock of Jugos del Valle, S.A.P.I. de C.V. (which we refer to as Jugos del Valle). The business of Jugos del Valle in the United States was acquired and sold by The Coca-Cola Company. In 2008, Coca-Cola FEMSA, The Coca-Cola Company and all Mexican and BrazilianCoca-Colabottlers entered into a joint business for the Mexican and the Brazilian operations, respectively, of Jugos del Valle. Taking into account the participation held by Grupo Fomento Queretano, Coca-Cola FEMSA currently holds an interest of 25.1% in the Mexican joint business and approximately 19.7% in the Brazilian joint businesses. Jugos del Valle sells fruit juice-based beverages and fruit derivatives.
In April 2008, FEMSA shareholders approved a proposal to amend our bylaws in order to preserve the unit structure for our shares that has been in place since May 1998, and to maintain our existing share structure beyond May 11, 2008. Our bylaws previously provided that on May 11, 2008 our Series D-B Shares would convert into Series B Shares and our Series D-L Shares would convert into Series L Shares with limited voting rights. In addition, our bylaws provided that, on May 11, 2008, our current unit structure would cease to exist and each of our B Units would be unbundled into five Series B Shares, while each BD Unit would unbundle into three Series B Shares and two newly issued Series L Shares. Following the April 22, 2008 shareholder approvals, the automatic conversion of our share and unit structures no longer exist, and, absent shareholder action, our share structure will continue to be comprised of Series B Shares, which must represent not less than 51% of our outstanding capital stock, and Series D-B and Series D-L Shares, which together may represent up to 49% of our outstanding capital stock. Our Unit structure, absent shareholder action, will continue to consist of B Units, which bundle five Series B Shares, and BD Units, which bundle one Series B Share, two Series D-B Shares and two Series D-L Shares. See “Item 9. The Offer and Listing—Description of Securities.”
In January 2010, FEMSA announced that its Board of Directors unanimously approved a definitive agreement under which FEMSA would exchange its FEMSA Cerveza business for a 20% economic interest in Heineken, one of the world’s leading brewers. In April 2010, FEMSA announced the closing of the transaction, after Heineken N.V., Heineken Holding N.V. and FEMSA held their corresponding AGMs and approved the transaction. Under the terms of the agreement, FEMSA received 43,018,320 shares of Heineken Holding N.V. and 43,009,699 shares of Heineken N.V., with an additional 29,172,504 shares of Heineken N.V. (which shares we refer to as the Allotted Shares) to be delivered pursuant to an allotted share delivery instrument, or the ASDI. Heineken also assumed US$ 2.1 billion of indebtedness, including FEMSA Cerveza’s unfunded pension obligations. The Allotted Shares were delivered to FEMSA in several installments during 2010 and 2011, with the final installment delivered on October 5, 2011. As of December 31, 2012, FEMSA’s interest in Heineken N.V. represented 12.53% of Heineken N.V.’s outstanding capital and 14.94% of Heineken Holding N.V.’s outstanding capital. The principal terms of the Heineken transaction documents are summarized below in “Item 10. Additional Information—Material Contracts.”
In February 2010, FEMSA signed an agreement with subsidiaries of The Coca-Cola Company to amend the shareholders agreement for Coca-Cola FEMSA. The purpose of the amendment is to set forth that the appointment and compensation of the chief executive officer and all officers reporting to the chief executive officer, as well as the adoption of decisions related to the ordinary operations of Coca-Cola FEMSA, shall only require a simple majority vote of the board of directors. Decisions related to extraordinary matters (such as business acquisitions or combinations in an amount exceeding US$ 100 million, among others) shall continue to require the vote of the majority of the board of directors, including the affirmative vote of two of the board members appointed by The Coca-Cola Company. The amendment was approved at Coca-Cola FEMSA’s extraordinary shareholders meeting on April 14, 2010, and is reflected in the bylaws of Coca-Cola FEMSA. This amendment was signed without transfer of any consideration. The percentage of our voting interest in our subsidiary Coca-Cola FEMSA remains the same after the signing of this amendment.
In September 2010, FEMSA sold Promotora de Marcas Nacionales, S. de R.L. de C.V., which we refer to as Promotora, to The Coca-Cola Company. Promotora was the owner of theMundet brands of soft drinks in Mexico.
On December 31, 2010, FEMSA sold its flexible packaging and label operations, Grafo Regia, S.A. de C.V., to a currency-neutral basisMexican subsidiary of GPC III, B.V. This transaction was part of FEMSA’s strategy to divest non-core businesses.
During the third quarter of 2010, Coca-Cola FEMSA completed a transaction with a Brazilian subsidiary of The Coca-Cola Company to produce, sell and excludingdistributeMatte Leão branded products. This transaction reinforced Coca-Cola FEMSA’s non-carbonated product offering through the platform that is operated by The Coca-Cola Company and its bottling partners in Brazil. As a part of the agreement, Coca-Cola FEMSA has been selling and distributing certainMatte Leão branded ready-to-drink products since the first quarter of 2010. As of March 31, 2013, Coca-Cola FEMSA had a 19.4% indirect interest in theMatte Leãobusiness in Brazil.
In March 2011, a consortium of investors formed by FEMSA, the Macquarie Mexican Infrastructure Fund and other investors, acquired Energía Alterna Istmeña, S. de R.L. de C.V., which we refer to as EAI, and Energía Eólica Mareña, S.A. de C.V., which we refer to as EEM, from subsidiaries of Preneal, S.A., which we refer to as Preneal. EAI and EEM together constitute the Mareña Renovables Wind Farm, a 396 megawatt late-stage wind energy project in the southeastern region of the State of Oaxaca. The Mareña Renovables Wind Farm is expected to be the largest wind power farm in Latin America. On February 23, 2012, a wholly-owned subsidiary of Mitsubishi Corporation, and Stichting Depositary PGGM Infrastructure Funds, a pension fund managed by PGGM, acquired the 45% interest held by FEMSA in the parent companies of the Mareña Renovables Wind Farm. The sale of FEMSA’s participation as an investor resulted in a gain of Ps. 933 million. Certain subsidiaries of FEMSA, FEMSA Comercio and Coca-Cola FEMSA have entered into 20-year wind power supply agreements with the Mareña Renovables Wind Farm to purchase energy output produced by it. These agreements will remain in full force and effect.
In March 2011, Coca-Cola FEMSA, with The Coca-Cola Company and through Compañía Panameña de Bebidas S.A.P.I. de C.V., acquired Grupo Industrias Lácteas S.A., which we refer to as Estrella Azul, a Panamanian company engaged for more than 50 years in the dairy and juice-based beverage categories. Coca-Cola FEMSA acquired a 50% interest and will continue to develop this business with The Coca-Cola Company. Beginning in April 2011, both The Coca-Cola Company and Coca-Cola FEMSA commenced the gradual integration of Estrella Azul into the existing beverage platform they share for the development of non-carbonated products in Panama.
In October 2011, Coca-Cola FEMSA merged with Administradora de Acciones del Noreste, S.A.P.I. de C.V., which constituted the beverage division of Grupo Tampico, S.A. de C.V. (which we refer to as Grupo Tampico) and was one of the largest family-ownedCoca-Cola product bottlers in Mexico, as calculated by sales volume. This franchise territory operates in the states of Tamaulipas, San Luis Potosí and Veracruz, as well as in certain parts of the states of Hidalgo, Puebla and Querétaro, and sold 155.7 million unit cases of beverages in 2011. The aggregate enterprise value of this transaction was Ps. 9,300 million and a total of 63.5 million new Coca-Cola FEMSA Series L Shares were issued in connection with this transaction. Coca-Cola FEMSA began to consolidate the beverage division of Grupo Tampico in its financial statements as of October 2011.
In December 2011, Coca-Cola FEMSA merged with Corporación de los Ángeles, S.A. de C.V. (which we refer to as Grupo CIMSA), a Mexican family-owned bottler ofCoca-Cola trademark products. This franchise territory operates mainly in the states of Morelos and Mexico, as well as in certain parts of the states of Guerrero and Michoacán, and sold 154.8 million unit cases of beverages in 2011. The aggregate enterprise value at the announcement date of this transaction was Ps. 11,000 million. A total of 75.4 million new Coca-Cola FEMSA Series L Shares were issued in connection with the transaction, and Coca-Cola FEMSA began to consolidate Grupo CIMSA in its financial statements as of December 2011. As part of its merger with Grupo CIMSA, Coca-Cola FEMSA acquired a 13.2% equity interest in Promotora Industrial Azucarera, S.A. de C.V., one of Mexico’s leading sugar producers, which we refer to as Piasa.
In 2012, Coca-Cola FEMSA began the construction of a production plant in Minas Gerais, Brazil, which has required an investment of 400 million Brazilian reais (equivalent to approximately US$ 198 million). We expect that the construction will generate 800 direct and indirect jobs. It is anticipated that the new plant will be completed as of December 2013 and will begin operations in the first quarter of 2014. The plant will be located on a parcel of land 300,000 square meters in size, and it is expected that by 2015 the annual production capacity will be approximately 1.2 billion liters of sparkling beverages, representing an increase of approximately 47% as compared to the current installed capacity of Coca-Cola FEMSA’s plant in Belo Horizonte, Brazil. The new plant will produce all of Coca-Cola FEMSA’s existing brands and presentations ofCoca-Cola products.
In May 2012, Coca-Cola FEMSA closed its merger with Grupo Fomento Queretano, S.A.P.I. de C.V. (“Grupo Fomento Queretano”), one of the oldest family-owned beverage players in theCoca-Cola system in Mexico, with operations mainly in the state of Querétaro, as well as in parts of the states of Mexico, Hidalgo, and Guanajuato. Coca-Cola FEMSA sold approximately 74 million unit cases of beverages in this franchise territory during 2012. The aggregate enterprise value of this transaction was Ps. 6,600 million and a total of 45.1 million new Coca-Cola FEMSA series L shares were issued in connection with this transaction. Coca-Cola FEMSA began to consolidate Grupo Fomento Queretano in its financial statements as of May 2012. As part of the merger with Grupo Fomento Queretano, Coca-Cola FEMSA also acquired an additional 12.9% equity interest in Piasa.
In August 2012, Coca-Cola FEMSA acquired, through Jugos del Valle, an indirect participation in Santa Clara Mercantil de Pachuca, S.A. de C.V. (“Santa Clara”), an important producer of milk and dairy products in Mexico. Coca-Cola FEMSA currently owns an indirect participation of 23.8% in Santa Clara.
On September 24, 2012, FEMSA signed definitive agreements to sell its wholly owned subsidiary Industria Mexicana de Quimicos, S.A. de C.V. (“Quimiproductos”) to a Mexican subsidiary of Ecolab Inc. (NYSE: ECL). Quimiproductos manufactures and provides cleaning and sanitizing products and services related to food and beverage industrial processes, as well as water treatment. The transaction is consistent with FEMSA’s long-standing strategy to divest non-core businesses. Quimiproductos was sold on December 31, 2012, resulting in a gain of Ps. 871 million.
Recent Acquisitions
In November 2012, through FEMSA Comercio, we agreed to acquire a 75% stake in Farmacias YZA, a leading drugstore operator in Southeast Mexico, with the current shareholders staying as partners with the remaining 25%. Farmacias YZA, headquartered in Merida, Yucatan, operated 333 stores as of the date of the agreement. We believe we can contribute our significant expertise in the development of small-box retail formats to what is already a successful regional player in this industry. In turn, this transaction opens a new avenue for growth for FEMSA Comercio. The transaction is pending customary regulatory approvals and is expected to close in the second quarter of 2013.
In December 2012, Coca-Cola FEMSA reached an agreement with The Coca-Cola Company to acquire a 51% non-controlling majority stake of CCBPI for US$ 688.5 million in an all-cash transaction. Coca-Cola FEMSA closed this transaction on January 25, 2013. The implied enterprise value of 100% of CCPBI is US$ 1,350 million. Coca-Cola FEMSA will have an option to acquire all of the remaining 49% of the capital stock of CCBPI at any time during the seven years following the closing, at the same enterprise value adjusted for a carrying cost and certain other adjustments. Coca-Cola FEMSA will have a put option, exercisable six years after the initial closing, to sell its ownership in CCBPI back to The Coca-Cola Company at a price that will be calculated using the same EBITDA multiple used in the acquisition of the 51% stake of CCBPI, capped at the aggregate enterprise value for the amount acquired, adjusted for certain items. Coca-Cola FEMSA will be managing the day-to-day operations of the business. The Coca-Cola Company will have certain rights on the operational business plan. Given the terms of both the options agreement and Coca-Cola FEMSA’s shareholders agreement with The Coca-Cola Company, Coca-Cola FEMSA will not consolidate the results of CCBPI, and will recognize the results of CCBPI using the equity method. CCBPI sold approximately 531 million unit cases of beverages during 2012 and generated revenues of approximately US$ 1.1 billion.
In January 2013, Coca-Cola FEMSA entered into an agreement to merge Grupo Yoli, S.A. de C.V. (“Grupo Yoli”) into Coca-Cola FEMSA. Grupo Yoli operates mainly in the state of Guerrero, Mexico, as well as in parts of the state of Oaxaca, Mexico. The merger agreement was approved by both Coca-Cola FEMSA and Grupo Yoli’s boards of directors and is subject to the approval of the Comisión Federal de Competencia (the Mexican Antitrust Comission, or CFC) and the shareholders’ meetings of both companies. Grupo Yoli sold approximately 99 million unit cases in 2012. The aggregate enterprise value of this transaction was Ps. 8,806 million. Coca-Cola FEMSA will issue approximately 42.4 million new series “L” shares to the shareholders of Grupo Yoli once the transaction closes. As part of this transaction, Coca-Cola FEMSA will increase its participation in Piasa by 9.5%. Coca-Cola FEMSA expects to close this transaction in the second quarter of 2013.
We conduct our business through our principal sub-holding companies as shown in the following diagram and table:
Principal Sub-holding Companies—Ownership Structure
As of March 31, 2013
| (1) | Compañía Internacional de Bebidas, S.A. de C.V., which we refer to as CIBSA. |
| (2) | Percentage of issued and outstanding capital stock owned by CIBSA (63.0% of shares with full voting rights). |
| (3) | Ownership in CB Equity held through various FEMSA subsidiaries. |
| (4) | Combined economic interest in Heineken N.V. and Heineken Holding N.V. |
The following table presents an overview of our operations by reportable segment and by geographic area:
Operations by Segment—Overview
Year Ended December 31, 2012 and % of growth vs. last year(1)
| Coca-Cola FEMSA | FEMSA Comercio | CB Equity(2) | ||||||||||||||||||||||
| (in millions of Mexican pesos, except for employees and percentages) | ||||||||||||||||||||||||
Total revenues | Ps.147,739 | 20 | % | Ps.86,433 | 17 | % | Ps. | — | — | |||||||||||||||
Gross Profit | 68,630 | 21 | % | 30,250 | 19 | % | — | — | ||||||||||||||||
Total assets | 166,103 | 17 | % | 31,092 | 17 | % | 79,268 | 4 | % | |||||||||||||||
Employees | 73,395 | 5 | % | 91,943 | 10 | % | — | — | ||||||||||||||||
Total Revenues Summary by Segment(1)
| Year Ended December 31, | ||||||||
| 2012 | 2011 | |||||||
Coca-Cola FEMSA | Ps.147,739 | Ps.123,224 | ||||||
FEMSA Comercio | 86,433 | 74,112 | ||||||
CB Equity(2) | — | — | ||||||
Other | 15,899 | 13,360 | ||||||
Consolidated total revenues | Ps.238,309 | Ps.201,540 | ||||||
Total Revenues Summary by Geographic Area(3)
| Year Ended December 31, | ||||||||
| 2012 | 2011 | |||||||
Mexico and Central America(4) | Ps.155,576 | Ps.129,716 | ||||||
South America(5) | 56,444 | 52,149 | ||||||
Venezuela | 26,800 | 20,173 | ||||||
Consolidated total revenues | 238,309 | 201,540 | ||||||
| (1) | The sum of the financial data for each of our segments and percentages with respect thereto differ from our consolidated financial information due to intercompany transactions, which are eliminated in consolidation, and certain assets and activities of FEMSA. |
| (2) | CB Equity holds Heineken N.V. and Heineken Holding N.V. shares. |
| (3) | The sum of the financial data for each geographic area differs from our consolidated financial information due to intercompany transactions, which are eliminated in consolidation. |
| (4) | Central America includes Guatemala, Nicaragua, Costa Rica and Panama. Domestic (Mexico-only) revenues were Ps. 148,098 million and Ps. 122,690 million for the years ended December 31, 2012 and 2011, respectively. |
| (5) | Includes Colombia, Brazil and Argentina. Brazilian revenues were Ps. 30,930 million and Ps. 31,405 million for the years ended December 31, 2012 and 2011, respectively. |
The following table sets forth our significant subsidiaries as of February 28, 2013:
Name of Company | Jurisdiction of Establishment | Percentage Owned | ||||
CIBSA: | Mexico | 100.0 | % | |||
Coca-Cola FEMSA | Mexico | 48.9 | %(1) | |||
Grupo Industrial Emprex, S.A. de C.V.: | Mexico | 100.0 | % | |||
FEMSA Comercio | Mexico | 100.0 | % | |||
CB Equity(2) | United Kingdom | 100.0 | % | |||
| (1) | Percentage of capital stock. FEMSA, through CIBSA, owns 63.0% of the shares with full voting rights. |
| (2) | Ownership in CB Equity held through various FEMSA subsidiaries. |
FEMSA is a leading company that participates in the beverage industry through Coca-Cola FEMSA, the largest franchise bottler of Coca-Cola products in the world; in the retail industry through FEMSA Comercio, operating OXXO, the largest and fastest-growing chain of small-format stores in Latin America; and in the beer industry, through its ownership of the second largest equity stake in Heineken, one of the world’s leading brewers with operations in 178 countries.
We understand the importance of connecting with our end consumers by interpreting their needs, and ultimately delivering the right products to them for the right occasions and the optimal value proposition. We strive to achieve this by developing brand value, expanding our significant distribution capabilities, and improving the efficiency of our operations while aiming to reach our full potential. We continue to improve our information gathering and processing systems in order to better know and understand what our consumers want and need, and we are improving our production and distribution by more efficiently leveraging our asset base.
We believe that the competencies that our businesses have developed can be replicated in other geographic regions. This underlying principle guided our consolidation efforts, which culminated in Coca-Cola FEMSA’s acquisition of Panamco in May 2003. The continental platform that this combination produced—encompassing a significant territorial expanse in Mexico and Central America, including some of the most populous metropolitan areas in Latin America—has provided us with opportunities to create value through both an improved ability to execute our strategies and the use of superior marketing tools. We have also increased our capabilities to operate and succeed in other geographic regions, by developing significant management and marketing tools to gain an understanding of local consumer needs and trends, as is the case with OXXO’s Colombian operations. Going forward, we intend to use those capabilities to continue our international expansion of both Coca-Cola FEMSA and FEMSA Comercio, expanding both our geographic footprint and our presence in beverage categories and small box retail formats, as well as taking advantage of potential opportunities to leverage our skill set and key competencies.
Our objective is to create economic, social and environmental value for our stakeholders—including our employees, our consumers, our shareholders and the enterprises and institutions within our society—now and into the future.
Overview
Coca-Cola FEMSA is the largest franchise bottler ofCoca-Colatrademark beverages in the world. Coca-Cola FEMSA operates in territories in the following countries:
Mexico – a substantial portion of central Mexico, the southeast and northeast of Mexico (including the Gulf region).
Central America – Guatemala (Guatemala City and surrounding areas), Nicaragua (nationwide), Costa Rica (nationwide) and Panama (nationwide).
Colombia – most of the country.
Venezuela – nationwide.
Brazil – the area of greater São Paulo, Campinas, Santos, the state of Mato Grosso do Sul, part of the state of Minas Gerais and part of the state of Goiás.
Argentina – Buenos Aires and surrounding areas.
Coca-Cola FEMSA’s company was organized on October 30, 1991 as asociedad anónima de capital variable (a variable capital stock corporation) under the laws of Mexico with a duration of 99 years. On December 5, 2006, as required by amendments to the Mexican Securities Market Law, Coca-Cola FEMSA became asociedad anónima bursátil de capital variable (a listed variable capital stock corporation). Coca-Cola FEMSA’s legal name is Coca-Cola FEMSA, S.A.B. de C.V. Coca-Cola FEMSA’s principal executive offices are located at Mario Pani No. 100, Col. Santa Fe Cuajimalpa, Delegación Cuajimalpa, México, D.F., 05348, México. Coca-Cola FEMSA’s telephone number at this location is (52-55) 1519-5000. Coca-Cola FEMSA’s website iswww.coca-colafemsa.com.
The following is an overview of Coca-Cola FEMSA’s operations by reporting segment in 2012.
Operations by Reporting Segment—Overview
Year Ended December 31, 2012(1)
| Total Revenues | Percentage of Total Revenues | Gross Profit | Percentage of Gross Profit | |||||||||||||
Mexico and Central America(2) | 66,141 | 44.8 | % | 31,643 | 46.1 | % | ||||||||||
South America(3) (excluding Venezuela) | 54,821 | 37.1 | % | 23,667 | 34.5 | % | ||||||||||
Venezuela | 26,777 | 18.1 | % | 13,320 | 19.4 | % | ||||||||||
Consolidated | 147,739 | 100.0 | % | 68,630 | 100.0 | % | ||||||||||
| (1) | Expressed in millions of Mexican pesos, except for percentages. |
| (2) | Includes Mexico, Guatemala, Nicaragua, Costa Rica and Panama. Includes results of Grupo Fomento Queretano from May 2012. |
| (3) | Includes Colombia, Brazil and Argentina. |
Corporate History
In 1979, one of our subsidiaries acquired certain sparkling beverage bottlers that are now a part of Coca-Cola FEMSA’s company. At that time, the acquired bottlers had 13 Mexican distribution centers operating 701 distribution routes, and their production capacity was 83 million cases. In 1991, we transferred our ownership in the bottlers to FEMSA Refrescos, S.A. de C.V., the corporate predecessor to Coca-Cola FEMSA, S.A.B. de C.V.
In June 1993, a subsidiary of The Coca-Cola Company subscribed for 30% of Coca-Cola FEMSA’s capital stock in the form of Series D shares for US$ 195 million. In September 1993, we sold Series L shares that represented 19% of Coca-Cola FEMSA’s capital stock to the public, and Coca-Cola FEMSA listed these shares on the Mexican Stock Exchange and, in the form of ADSs, on the New York Stock Exchange. In a series of transactions between 1994 and 1997, Coca-Cola FEMSA acquired territories in Argentina and additional territories in southern Mexico.
In May 2003, Coca-Cola FEMSA acquired Panamerican Beverages, or Panamco, and began producing and distributingCoca-Cola trademark beverages in additional territories in the central and gulf regions of Mexico and in Central America (Guatemala, Nicaragua, Costa Rica and Panama), Colombia, Venezuela and Brazil, along with bottled water, beer and other beverages in some of these territories. As a result of the acquisition, the interest of The Coca-Cola Company in the capital stock of Coca-Cola FEMSA’s company increased from 30.0% to 39.6%.
During August 2004, Coca-Cola FEMSA conducted a rights offering to allow existing holders of Coca-Cola FEMSA’s Series L shares and ADSs to acquire newly issued Series L shares in the form of Series L shares and ADSs, respectively, at the same price per share at which we and The Coca-Cola Company subscribed in connection with the Panamco acquisition.
In November 2006, we acquired, through a subsidiary, 148,000,000 of Coca-Cola FEMSA’s Series D shares from certain subsidiaries of The Coca-Cola Company representing 9.4% of the total outstanding voting shares and 8.0% of the total outstanding equity of Coca-Cola FEMSA, at a price of US$ 2.888 per share for an aggregate amount of US$ 427.4 million. With this purchase, we increased our ownership to 53.7% of Coca-Cola FEMSA’s capital stock. Pursuant to Coca-Cola FEMSA’s bylaws, the acquired shares were converted from Series D shares to Series A shares.
In November 2007, Administración, S.A.P.I. de C.V., or Administración, a Mexican company owned directly and indirectly by Coca-Cola FEMSA and The Coca-Cola Company, acquired 100% of the shares of capital stock of Jugos del Valle, S.A.P.I. de C.V. The business of Jugos del Valle in the United States was acquired and sold by The Coca-Cola Company. In 2008, Coca-Cola FEMSA, The Coca-Cola Company and all Mexican and BrazilianCoca-Cola bottlers entered into a joint business for the Mexican and Brazilian operations, respectively, of Jugos del Valle. Taking into account the participation held by Grupo Fomento Queretano, Coca-Cola FEMSA currently holds an interest of 25.1% in the Mexican joint business and approximately 19.7% in the Brazilian joint businesses. Jugos del Valle sells fruit juice-based beverages and fruit derivatives.
In December 2007 and May 2008, Coca-Cola FEMSA sold most of its proprietary brands to The Coca-Cola Company. The proprietary brands are now being licensed back to Coca-Cola FEMSA by The Coca-Cola Company pursuant to Coca-Cola FEMSA’s bottler agreements. The December 2007 transaction was valued at US$ 48 million and the May 2008 transaction was valued at US$ 16 million. Revenues from the sale of proprietary brands in which Coca-Cola FEMSA has a significant continuing involvement are deferred and amortized against the related costs of future sales over the estimated sales period.
In May 2008, Coca-Cola FEMSA entered into a transaction with The Coca-Cola Company to acquire its wholly owned bottling franchise Refrigerantes Minas Gerais, Ltda., or REMIL, located in the State of Minas Gerais in Brazil, for a purchase price of US$ 364.1 million. Coca-Cola FEMSA began to consolidate REMIL in its financial statements in June 2008.
In July 2008, Coca-Cola FEMSA acquired the Agua De Los Angeles bulk water business in the Valley of Mexico (Mexico City and surrounding areas) from Grupo Embotellador CIMSA, S.A. de C.V., at the time one of the Coca-Cola bottling franchises in Mexico, for a purchase price of US$ 18.3 million. The trademarks remain with The Coca-Cola Company. Coca-Cola FEMSA subsequently merged Agua De Los Angeles into its bulk water business under theCiel brand.
In February 2009, Coca-Cola FEMSA acquired with The Coca-Cola Company theBrisa bottled water business in Colombia from Bavaria, S.A., a subsidiary of SABMiller plc. Coca-Cola FEMSA acquired the production assets and the distribution territory, and The Coca-Cola Company acquired theBrisa brand. Coca-Cola FEMSA and The Coca-Cola Company equally shared in paying the purchase price of US$ 92 million. Following a transition period, in June 2009, Coca-Cola FEMSA started to sell and distribute theBrisa portfolio of products in Colombia.
In May 2009, Coca-Cola FEMSA entered into an agreement to begin selling theCrystal trademark water products in Brazil jointly with The Coca-Cola Company.
In August 2010, Coca-Cola FEMSA acquired from The Coca-Cola Company, along with other BrazilianCoca-Cola bottlers, the business operations of theMatte Leaotea brand. As of March 31, 2013, Coca-Cola FEMSA had a 19.4% indirect interest in the Matte Leao business in Brazil.
In March 2011, Coca-Cola FEMSA acquired with The Coca-Cola Company, through Compañía Panameña de Bebidas S.A.P.I. de C.V., Estrella Azul, a Panamanian conglomerate that participates in the dairy and juice-based beverage categories in Panama. Coca-Cola FEMSA will continue to develop this business with The Coca-Cola Company.
In October 2011, Coca-Cola FEMSA closed its merger with the beverage division of Grupo Tampico, one of the largest family-ownedCoca-Cola bottlers calculated by sales volume in Mexico. This franchise territory operates in the states of Tamaulipas, San Luis Potosí, and Veracruz, as well as in parts of the states of Hidalgo, Puebla and Queretaro, and sold 155.7 million unit cases of beverages in 2011. The aggregate enterprise value of this transaction was Ps. 9,300 million and Coca-Cola FEMSA issued a total of 63.5 million new Series L shares in connection with this transaction. Coca-Cola FEMSA began to consolidate the beverage division of Grupo Tampico in its financial statements as of October 2011.
In December 2011, Coca-Cola FEMSA closed its merger with Grupo CIMSA, a Mexican family-ownedCoca-Cola bottler with operations mainly in the states of Morelos and Mexico, as well as in parts of the states of Guerrero and Michoacán. This franchise territory sold 154.8 million unit cases of beverages in 2011. The aggregate enterprise value of this transaction was Ps. 11,000 million and Coca-Cola FEMSA issued a total of 75.4 million new Series L shares in connection with this transaction. Coca-Cola FEMSA began to consolidate Grupo CIMSA in its financial statements as of December 2011. As part of Coca-Cola FEMSA’s merger with Grupo CIMSA, it also acquired a 13.2% equity interest in Piasa.
In May 2012, Coca-Cola FEMSA closed its merger with Grupo Fomento Queretano, one of the oldest family-owned beverage players in theCoca-Cola system in Mexico, with operations mainly in the state of Querétaro, as well as in parts of the states of Mexico, Hidalgo and Guanajuato. Coca-Cola FEMSA sold approximately 74 million unit cases of beverages in this franchise territory during 2012. The aggregate enterprise value of this transaction was Ps. 6,600 million and Coca-Cola FEMSA issued a total of 45.1 million new Series L shares in connection with this transaction. Coca-Cola FEMSA began to consolidate Grupo Fomento Queretano in its financial statements as of May 2012. As part of Coca-Cola FEMSA’s merger with Grupo Fomento Queretano it also acquired an additional 12.9% equity interest in Piasa.
In August 2012, Coca-Cola FEMSA acquired, through Jugos del Valle, an indirect participation in Santa Clara, an important producer of milk and dairy products in Mexico. Coca-Cola FEMSA currently owns an indirect participation of 23.8% in Santa Clara.
Recent Acquisitions
In December 2012, Coca-Cola FEMSA reached an agreement with The Coca-Cola Company to acquire a 51% non-controlling majority stake of CCBPI for US$ 688.5 million in an all-cash transaction. Coca-Cola FEMSA closed this transaction on January 25, 2013. The implied enterprise value of 100% of CCBPI is US$ 1,350 million. Coca-Cola FEMSA will have an option to acquire all of the remaining 49% of the capital stock of CCBPI at any time during the seven years following the closing, at the same enterprise value adjusted for a carrying cost and certain other adjustments. Coca-Cola FEMSA will have a put option, exercisable six years after the initial closing, to sell its ownership in CCBPI back to The Coca-Cola Company at a price that will be calculated using the same EBITDA multiple used in the acquisition of the 51% stake of CCBPI, capped at the aggregate enterprise value for the amount acquired, adjusted for certain items. Coca-Cola FEMSA will be managing the day-to-day operations of the business. The Coca-Cola Company will have certain rights on the operational business plan. Given the terms of both the options agreements and Coca-Cola FEMSA’s shareholders agreement with The Coca-Cola Company, Coca-Cola FEMSA will not consolidate the results of CCBPI. Coca-Cola FEMSA will recognize the results of CCBPI using the equity method. CCBPI sold approximately 531 million unit cases of beverages during 2012 and generated revenues increasedof approximately 15%US$ 1.1 billion.
In January 2013, Coca-Cola FEMSA entered into an agreement to merge Grupo Yoli into its company. Grupo Yoli operates mainly in 2010.the state of Guerrero, Mexico as well as in parts of the state of Oaxaca, Mexico. The merger agreement was approved by both Coca-Cola FEMSA’s and Grupo Yoli’s boards of directors and is subject to the approval of theComisión Federal de Competencia (the Mexican Antitrust Comission, or CFC) and the shareholders’ meetings of both companies. Grupo Yoli sold approximately 99 million unit cases in 2012. The aggregate enterprise value of this transaction was Ps. 8,806 million. Coca-Cola FEMSA will issue approximately 42.4 million new Series L shares to the shareholders of Grupo Yoli once the transaction closes. As part of this transaction, Coca-Cola FEMSA will increase its participation in Piasa by 9.5%. Coca-Cola FEMSA expects to close this transaction in the second quarter of 2013.
ConsolidatedCapital Stock
As of March 31, 2013, we indirectly owned Series A Shares equal to 48.9% of Coca-Cola FEMSA’s capital stock (63.0% of Coca-Cola FEMSA’s shares with full voting rights). As of March 31, 2013, The Coca-Cola Company indirectly owned Series D shares equal to 28.7% of the capital stock of Coca-Cola FEMSA’s company (37.0% of Coca-Cola FEMSA’s shares with full voting rights). Series L shares with limited voting rights, which trade on the Mexican Stock Exchange and in the form of ADSs on the New York Stock Exchange, constitute the remaining 22.4% of Coca-Cola FEMSA’s capital stock.
Business Strategy
In August 2011, Coca-Cola FEMSA restructured its operations under two new divisions: (1) Mexico & Central America and (2) South America, creating a more flexible structure to execute its strategies and extend its track record of growth. Previously, Coca-Cola FEMSA managed its business under three divisions—Mexico, Latincentro and Mercosur. With this new business structure, Coca-Cola FEMSA aligned its business strategies more efficiently, ensuring a faster introduction of new products and categories, and a more rapid and effective design and deployment of commercial models.
Coca-Cola FEMSA operates with a large geographic footprint in Latin America, in two divisions:
Mexico and Central America (covering certain territories in Mexico and Guatemala, and all of Nicaragua, Costa Rica and Panama); and
South America (covering certain territories in Brazil and Argentina, and all of Colombia and Venezuela).
One of Coca-Cola FEMSA’s goals is to maximize growth and profitability to create value for its shareholders. Coca-Cola FEMSA’s efforts to achieve this goal are based on: (1) transforming its commercial models to focus on its customers’ value potential and using a value-based segmentation approach to capture the industry’s value potential, (2) implementing multi-segmentation strategies in its major markets to target distinct market clusters divided by consumption occasion, competitive intensity and socioeconomic levels; (3) implementing well-planned product, packaging and pricing strategies through different distribution channels; (4) driving product innovation along its different product categories; (5) developing new businesses and distribution channels, and (6) achieving the full operating potential of its commercial models and processes to drive operational efficiencies throughout its company. To achieve these goals, Coca-Cola FEMSA intends to continue to focus its efforts on, among other initiatives, the following:
working with The Coca-Cola Company to develop a business model to continue exploring and participating in new lines of beverages, extending existing product lines and effectively advertising and marketing Coca-Cola FEMSA’s products;
developing and expanding Coca-Cola FEMSA’s still beverage portfolio through innovation, strategic acquisitions and by entering into agreements to acquire companies with The Coca-Cola Company;
expanding Coca-Cola FEMSA’s bottled water strategy with The Coca-Cola Company through innovation and selective acquisitions to maximize profitability across Coca-Cola FEMSA’s market territories;
strengthening Coca-Cola FEMSA’s selling capabilities and go-to-market strategies, including pre-sale, conventional selling and hybrid routes, in order to get closer to Coca-Cola FEMSA’s clients and help them satisfy the beverage needs of consumers;
| • | implementing selective packaging strategies designed to increase consumer demand for Coca-Cola FEMSA’s products and to build a strong returnable base for theCoca-Cola brand; |
replicating Coca-Cola FEMSA’s best practices throughout the value chain;
rationalizing and adapting Coca-Cola FEMSA’s organizational and asset structure in order to be in a better position to respond to a changing competitive environment;
committing to building a multi-cultural collaborative team, from top to bottom; and
broadening Coca-Cola FEMSA’s geographic footprint through organic growth and strategic joint ventures, mergers and acquisitions.
Coca-Cola FEMSA seeks to increase per capita consumption of its products in the territories in which it operates. To that end, Coca-Cola FEMSA’s marketing teams continuously develop sales strategies tailored to the different characteristics of its various territories and distribution channels. Coca-Cola FEMSA continues to develop its product portfolio to better meet market demand and maintain its overall profitability. To stimulate and respond to consumer demand, Coca-Cola FEMSA continues to introduce new categories, products and presentations.See “—Product and Packaging Mix.” In addition, because Coca-Cola FEMSA views its relationship with The Coca-Cola Company as integral to Coca-Cola FEMSA’s business, Coca-Cola FEMSA uses market information systems and strategies developed with The Coca-Cola Company to improve Coca-Cola FEMSA’s business and marketing strategies.See “Marketing.”
Coca-Cola FEMSA also continuously seeks to increase productivity in its facilities through infrastructure and process reengineering for improved asset utilization. Coca-Cola FEMSA’s capital expenditure program includes investments in production and distribution facilities, bottles, cases, coolers and information systems. Coca-Cola FEMSA believes that this program will allow it to maintain its capacity and flexibility to innovate and to respond to consumer demand for its products.
Coca-Cola FEMSA focuses on management quality as a key element of its growth strategy and remains committed to fostering the development of quality management at all levels. Both we and The Coca-Cola Company provide Coca-Cola FEMSA with managerial experience. To build upon these skills, the board of directors has allocated a portion of Coca-Cola FEMSA’s operating budget to pay for management training programs designed to enhance its executives’ abilities and provide a forum for exchanging experiences, know-how and talent among an increasing number of multinational executives from Coca-Cola FEMSA’s new and existing territories.
Sustainable development is a comprehensive part of Coca-Cola FEMSA’s strategic framework for business operation and growth. Coca-Cola FEMSA bases its efforts in its Corporate Values and Ethics. Coca-Cola FEMSA focuses on three core areas, (i) its people, by encouraging the development of its employees and their families; (ii) its communities, by promoting development in the communities it serves, an attitude of health, self-care, adequate nutrition and physical activity, and evaluating the impact of its value chain; and (iii) its planet, by establishing guidelines that it believes will result in efficient use of natural resources to minimize the impact that its operations might have on the environment and create a broader awareness of caring for its environment.
Coca-Cola FEMSA’s Territories
The following map shows Coca-Cola FEMSA’s territories, giving estimates in each case of the population to which Coca-Cola FEMSA offers products, the number of retailers of Coca-Cola FEMSA’s beverages and the per capita consumption of Coca-Cola FEMSA’s beverages as of December 31, 2012:
Per capita consumption data for a territory is determined by dividing total beverage sales volume within the territory (in bottles, cans, and fountain containers) by the estimated population within such territory, and is expressed on the basis of the number of eight-ounce servings of Coca-Cola FEMSA’s products consumed annually per capita. In evaluating the development of local volume sales in Coca-Cola FEMSA’s territories and to determine product potential, Coca-Cola FEMSA and The Coca-Cola Company measure, among other factors, the per capita consumption of all Coca-Cola FEMSA’s beverages.
Coca-Cola FEMSA’s Products
Coca-Cola FEMSA produces, markets, sells and distributesCoca-Cola trademark beverages. TheCoca-Cola trademark beverages include: sparkling beverages (colas and flavored sparkling beverages), waters, and still beverages (including juice drinks, coffee, teas, milk, value-added dairy and isotonic). The following table sets forth Coca-Cola FEMSA’s main brands as of December 31, 2012:
Colas: | Mexico and Central America(1) | South America(2) | Venezuela | |||
Coca-Cola | ü | ü | ü | |||
Coca-Cola Light | ü | ü | ü | |||
Coca-Cola Zero | ü | ü | ||||
Flavored sparkling beverages: | Mexico and Central America(1) | South America(2) | Venezuela | |||
Ameyal | ü | |||||
Canada Dry | ü | |||||
Chinotto | ü | |||||
Crush | ü | |||||
Escuis | ü | |||||
Fanta | ü | ü | ||||
Fresca | ü | |||||
Frescolita | ü | ü | ||||
Hit | ü | |||||
Kist | ü | |||||
Kuat | ü | |||||
Lift | ü | |||||
Mundet | ü | |||||
Quatro | ü | |||||
Schweppes | ü | ü | ü | |||
Simba | ü | |||||
Sprite | ü | ü | ||||
Victoria | ü | |||||
Yoli | ü | |||||
Water: | Mexico and Central America(1) | South America(2) | Venezuela | |||
Alpina | ü | |||||
Aquarius(3) | ü | |||||
Bonaqua | ü | |||||
Brisa | ü | |||||
Ciel | ü | |||||
Crystal | ü | |||||
Dasani | ü | |||||
Manantial | ü | |||||
Nevada | ü | |||||
Other Categories: | Mexico and Central America(1) | South America(2) | Venezuela | |||
Cepita | ü | |||||
Del Prado(4) | ü | |||||
Estrella Azul(5) | ü | |||||
FUZE Tea | ü | ü | ||||
Hi-C(6) | ü | ü | ||||
Leche Santa Clara(5) | ü | |||||
Jugos del Valle(7) | ü | ü | ü | |||
Matte Leao(8) | ü | |||||
Powerade(9) | ü | ü | ü | |||
Valle Frut(10) | ü | ü | ü | |||
| (1) | Includes Mexico, Guatemala, Nicaragua, Costa Rica and Panama |
| (2) | Includes Colombia, Brazil and Argentina |
| (3) | Flavored water. In Brazil, also flavored sparkling beverage |
| (4) | Juice-based beverage in Central America |
| (5) | Milk and value-added dairy and juices |
| (6) | Juice-based beverage. IncludesHi-C Orangeade in Argentina |
| (7) | Juice-based beverage |
| (8) | Ready to drink tea |
| (9) | Isotonic |
| (10) | Orangeade. IncludesDel Valle Freshin Costa Rica, Nicaragua, Panama, Colombia and Venezuela |
Sales Overview
Coca-Cola FEMSA measures total sales volume in terms of unit cases. “Unit case” refers to 192 ounces of finished beverage product (24 eight-ounce servings) and, when applied to soda fountains, refers to the volume of syrup, powders and concentrate that is required to produce 192 ounces of finished beverage product. The following table illustrates Coca-Cola FEMSA’s historical sales volume for each of its territories.
| Sales Volume Year Ended December 31, | ||||||||||||
| 2012 | 2011 | 2010 | ||||||||||
| (millions of unit cases) | ||||||||||||
Mexico and Central America | ||||||||||||
Mexico(1) | 1,720.3 | 1,366.5 | 1,242.3 | |||||||||
Central America(2) | 151.2 | 144.3 | 137.0 | |||||||||
South America (excluding Venezuela) | ||||||||||||
Colombia | 255.8 | 252.1 | 244.3 | |||||||||
Brazil(3) | 494.2 | 485.3 | 475.6 | |||||||||
Argentina | 217.0 | 210.7 | 189.3 | |||||||||
Venezuela | 207.7 | 189.8 | 211.0 | |||||||||
|
|
|
|
|
| |||||||
Consolidated Volume | 3,046.2 | 2,648.7 | 2,499.5 | |||||||||
| (1) | Includes results of Grupo Fomento Queretano from May 2012, Grupo CIMSA from December 2011 and Grupo Tampico from October 2011. |
| (2) | Includes Guatemala, Nicaragua, Costa Rica and Panama. |
| (3) | Excludes beer sales volume. |
Product and Packaging Mix
Out of the more than 121 brands and line extensions of beverages that Coca-Cola FEMSA sells and distributes, Coca-Cola FEMSA’s most important brand, Coca-Cola, together with its line extensions,Coca-Cola Light andCoca-Cola Zero, accounted for 60.2% of total sales volume in 2012. Coca-Cola FEMSA’s next largest brands,Ciel(a water brand from Mexico and its line extensions),Fanta (and its line extensions),ValleFrut (and its line extensions), andSprite (and its line extensions) accounted for 12.8%, 4.7%, 2.6% and 2.6%, respectively, of total sales volume in 2012. Coca-Cola FEMSA uses the term line extensions to refer to the different flavors in which Coca-Cola FEMSA offers its brands. Coca-Cola FEMSA produces, markets, sells and distributesCoca-Cola trademark beverages in each of its territories in containers authorized by The Coca-Cola Company, which consist of a variety of returnable and non-returnable presentations in the form of glass bottles, cans and plastic bottles mainly made of polyethylene terephthalate, which we refer to as PET.
Coca-Cola FEMSA uses the term presentation to refer to the packaging unit in which Coca-Cola FEMSA sells its products. Presentation sizes for Coca-Cola FEMSA’sCoca-Cola trademark beverages range from a 6.5-ounce personal size to a 3-liter multiple serving size. For all of Coca-Cola FEMSA’s products excluding water, Coca-Cola FEMSA considers a multiple serving size as equal to, or larger than, 1.0 liter. In general, personal sizes have a higher price per unit case as compared to multiple serving sizes. Coca-Cola FEMSA offers both returnable and non-returnable presentations, which allows it to offer portfolio alternatives based on convenience and affordability to implement revenue management strategies and to target specific distribution channels and population segments in its territories. In addition, Coca-Cola FEMSA sells someCoca-Cola trademark beverage syrups in containers designed for soda fountain use, which we refer to as fountain. Coca-Cola FEMSA also sells bottled water products in bulk sizes, which refer to presentations equal to or larger than 5 liters, which have a much lower average price per unit case decreased 2.6%, reaching Ps. 39.89than Coca-Cola FEMSA’s other beverage products.
The characteristics of Coca-Cola FEMSA’s territories are very diverse. Central Mexico and Coca-Cola FEMSA’s territories in 2010Argentina are densely populated and have a large number of competing beverage brands as compared to Ps. 40.95the rest of Coca-Cola FEMSA’s territories. Coca-Cola FEMSA’s territories in 2009, reflectingBrazil are densely populated but have lower per capita consumption of beverage products as compared to Mexico. Portions of southern Mexico, Central America and Colombia are large and mountainous areas with lower population density, lower per capita income and lower per capita consumption of beverages. In Venezuela, Coca-Cola FEMSA faces operational disruptions from time to time, which may have an effect on its volumes sold, and consequently, may result in lower per capita consumption.
The following discussion analyzes Coca-Cola FEMSA’s product and packaging mix by reporting segment. The volume data presented is for the devaluationyears 2012, 2011 and 2010.
Mexico and Central America.Coca-Cola FEMSA’s product portfolio consists ofCoca-Cola trademark beverages. In 2008, as part of Coca-Cola FEMSA’s efforts to strengthen its multi-category beverage portfolio, Coca-Cola FEMSA incorporated theJugos del Valle line of juice-based beverages in Mexico and subsequently in Central America.In 2012, Coca-Cola FEMSA launchedFUZETea in the Venezuelan bolivar.division. Per capita consumption of Coca-Cola FEMSA’s beverage products in Mexico and Central America was 650 and 182 eight-ounce servings, respectively, in 2012.
ConsolidatedThe following table highlights historical sales volume and mix in Mexico and Central America for Coca-Cola FEMSA’s products:
| Year Ended December 31, | ||||||||||||
| 2012 | 2011 | 2010 | ||||||||||
Total Sales Volume(1) | ||||||||||||
Total (millions of unit cases) | 1,871.5 | 1,510.8 | 1,379.3 | |||||||||
Growth (%) | 23.9 | 9.5 | 1.2 | |||||||||
| (in percentages) | ||||||||||||
Unit Case Volume Mix by Category | ||||||||||||
Sparkling beverages | 73.0 | 74.9 | 75.2 | |||||||||
Water(2) | 21.4 | 19.7 | 19.4 | |||||||||
Still beverages | 5.6 | 5.4 | 5.4 | |||||||||
|
|
|
|
|
| |||||||
Total | 100.0 | 100.0 | 100.0 | |||||||||
|
|
|
|
|
| |||||||
| (1) | Includes results from the operations of Grupo Fomento Queretano from May 2012, Grupo CIMSA from December 2011 and Grupo Tampico from October 2011. |
| (2) | Includes bulk water volumes. |
In 2012, multiple serving presentations represented 66.2% of total sparkling beverages sales volume in Mexico, a 140 basis points decrease compared to 2011; and 56.1% of total sparkling beverages sales volume in Central America, a 40 basis points increase compared to 2011. Coca-Cola FEMSA’s strategy is to foster consumption of single serve presentations while maintaining multiple serving volumes. In 2012, returnable packaging, as a percentage of total sparkling beverage sales volume, accounted for 33.7% in Mexico, a 200 basis points increase compared to 2011; and 33.6% in Central America, a 190 basis points increase compared to 2011.
In 2012, Coca-Cola FEMSA’s sparkling beverages decreased as a percentage of its total sales volume from 74.9% in 2011 to 73.0% in 2012, mainly due to the integration of Grupo Tampico, Grupo CIMSA and Grupo Fomento Queretano in Mexico, which have a higher mix of bulk water in their portfolios.
In 2012, Coca-Cola FEMSA’s most popular sparkling beverage presentations in Mexico were the 2.5-liter returnable plastic bottle, the 3.0-liter non-returnable plastic bottle and the 0.6-liter non-returnable plastic bottle (the 20-ounce bottle that is also popular in the United States) which together accounted for 51.2% of total sparkling beverage sales volume in Mexico.
Total sales volume reached 2,499.51,871.5 million unit cases in 2010,2012, an increase of 23.9% compared to 2,428.61,510.8 million unit cases in 2009, an increase2011. The non-comparable effect of 2.9%. Volume growth resulted largely from increasesthe integration of Grupo Tampico, Grupo CIMSA and Grupo Fomento Queretano in Mexico contributed 332.7 million unit cases in 2012 of which 62.5% were sparkling beverages, which accounted for approximately 70%5.1% bottled water, 27.9% bulk water and 4.5% still beverages. Excluding the integration of incremental volumes, mainly driven by the Coca-Cola brand.these territories, volume grew 1.9% to 1,538.8 million unit cases. Organically sparkling beverages sales volume increased 2.5% as compared to 2011. The bottled water category, including bulk water, decreased 2.6%. The still beverage category increased 8.9%.
South America (Excluding Venezuela). Coca-Cola FEMSA’s product portfolio in South America consists mainly ofCoca-Cola trademark beverages and theKaiser beer brands in Brazil, which Coca-Cola FEMSA sells and distributes. In 2008, as part of Coca-Cola FEMSA’s efforts to strengthen its multi-category beverage portfolio, it incorporated theJugos del Valle line of juice-based beverages in Colombia. This line of beverages was relaunched in Brazil in 2009 as well. The acquisition ofBrisain 2009 helped Coca-Cola FEMSA to become the leader, calculated by sales volume, in the water market in Colombia.
In 2010, Coca-Cola FEMSA incorporated ready to drink beverages under theMatte Leao brand in Brazil. During 2011, as part of Coca-Cola FEMSA’s continuous effort to develop non-carbonated beverages, Coca-Cola FEMSA launchedCepita in non-returnable polyethylene terephthalate (“PET”) bottles andHi-C, an orangeade, both in Argentina. Since 2009, as part of Coca-Cola FEMSA’s efforts to foster sparkling beverage per capita consumption in Brazil, Coca-Cola FEMSA re-launched a 2.0-liter returnable plastic bottle for theCoca-Cola brand and introduced two single-serve 0.25-liter presentations. Per capita consumption of Coca-Cola FEMSA’s beverages in Colombia, Brazil and Argentina was 130, 264 and 404 eight-ounce servings, respectively, in 2012.
The following table highlights historical total sales volume and sales volume mix in South America (excluding Venezuela), not including beer:
| Year Ended December 31, | ||||||||||||
| 2012 | 2011 | 2010 | ||||||||||
Total Sales Volume | ||||||||||||
Total (millions of unit cases) | 967.0 | 948.1 | 909.2 | |||||||||
Growth (%) | 2.0 | 4.3 | 11.2 | |||||||||
| (in percentages) | ||||||||||||
Unit Case Volume Mix by Category | ||||||||||||
Sparkling beverages | 84.9 | 85.9 | 85.5 | |||||||||
Water(1) | 10.0 | 9.2 | 10.1 | |||||||||
Still beverages | 5.1 | 4.9 | 4.4 | |||||||||
|
|
|
|
|
| |||||||
Total | 100.0 | 100.0 | 100.0 | |||||||||
|
|
|
|
|
| |||||||
| (1) | Includes bulk water volume. |
Total sales volume was 967.0 million unit cases in 2012, an increase of 2.0% compared to 948.1 million unit cases in 2011. Growth in sparkling beverages, mainly driven by sales of theCoca-Cola brand in Argentina and theFanta brand in Brazil and Colombia, accounted for the largest component of growth during the year. Coca-Cola FEMSA’s growth in still beverages was primarily driven by theJugos del Valle line of businessproducts in Brazil and theCepita juice brand in Argentina. The growth in sales volume of Coca-Cola FEMSA’s water portfolio, including bulk water, was driven mainly by theCrystal brand in Brazil and theBrisa brand in Colombia.
In 2012, returnable packaging, as a percentage of total sparkling beverage sales volume, accounted for 40.4% in Colombia, remaining flat as compared to 2011; 28.9% in Argentina, an increase of 110 basis points and 14.4% in Brazil, a 150 basis points decrease compared to 2011. In 2012, multiple serving presentations represented 62.9%, 72.5% and 85.2% of total sparkling beverages sales volume in Colombia, Brazil and Argentina, respectively.
Coca-Cola FEMSA continues to distribute and sell theKaiser beer portfolio in its Brazilian territories through the 20-year term, consistent with the arrangements in place since 2006 with Cervejarias Kaiser, a subsidiary of the Heineken Group prior to the acquisition of Cervejarias Kaiser by Cuauhtémoc Moctezuma Holding, S.A. de C.V., formerly known as FEMSA Cerveza. Beginning in the second quarter of 2005, Coca-Cola FEMSA ceased including beer that it distributes in Brazil in its reported sales volumes. On April 30, 2010, the transaction pursuant to which we exchanged 100% of our beer operations for a 20% economic interest in the Heineken Group closed.
Venezuela. Coca-Cola FEMSA’s product portfolio in Venezuela consists ofCoca-Cola trademark beverages. Per capita consumption of Coca-Cola FEMSA’s beverages in Venezuela during 2012 was 164 eight-ounce servings. At the end of 2011, Coca-Cola FEMSA launchedDel Valle Fresh, an orangeade, in Venezuela, which contributed significantly to incremental volume growth in this country during 2012. During 2012, Coca-Cola FEMSA launched two new presentations for Coca-Cola FEMSA’s sparkling beverage portfolio: a 0.355-liter non-returnable PET presentation and a 1-liter non-returnable PET presentation.
The following table highlights historical total sales volume and sales volume mix in Venezuela:
| Year Ended December 31, | ||||||||||||
| 2012 | 2011 | 2010 | ||||||||||
Total Sales Volume | ||||||||||||
Total (millions of unit cases) | 207.7 | 189.8 | 211.0 | |||||||||
Growth (%) | 9.4 | (10.0 | ) | (6.3 | ) | |||||||
| (in percentages) | ||||||||||||
Unit Case Volume Mix by Category | ||||||||||||
Sparkling beverages | 87.9 | 91.7 | 91.3 | |||||||||
Water(1) | 5.6 | 5.4 | 6.5 | |||||||||
Still beverages | 6.5 | 2.9 | 2.2 | |||||||||
|
|
|
|
|
| |||||||
Total | 100.0 | 100.0 | 100.0 | |||||||||
|
|
|
|
|
| |||||||
| (1) | Includes bulk water volume. |
Coca-Cola FEMSA has implemented a product portfolio rationalization strategy that allows it to minimize the impact of certain operating disruptions that have been recurrent in Venezuela over the last several years. During 2011, Coca-Cola FEMSA faced a 26-day strike at one of its Venezuelan production and distribution facilities and a difficult economic environment that prevented it from growing sales volume of Coca-Cola FEMSA’s products. As a result, Coca-Cola FEMSA’s sparkling beverage volume decreased by 9.6%.
In 2012, multiple serving presentations represented 79.9% of total sparkling beverages sales volume in Venezuela, a 140 basis points increase compared to 2011. In 2012, returnable presentations represented 7.5% of total sparkling beverages sales volume in Venezuela, a 50 basis points decrease compared to 2011. Total sales volume was 207.7 million unit cases in 2012, an increase of 9.4% compared to 189.8 million unit cases in 2011.
Seasonality
Sales of Coca-Cola FEMSA’s products are seasonal, as Coca-Cola FEMSA’s sales levels generally increase during the summer months of each country and during the Christmas holiday season. In Mexico, Central America, Colombia and Venezuela, Coca-Cola FEMSA typically achieves its highest sales during the summer months of April through September as well as during the Christmas holidays in December. In Brazil and Argentina, Coca-Cola FEMSA’s highest sales levels occur during the summer months of October through March and the Christmas holidays in December.
Marketing
Coca-Cola FEMSA, in conjunction with The Coca-Cola Company, has developed a marketing strategy to promote the sale and consumption of Coca-Cola FEMSA’s products. Coca-Cola FEMSA relies extensively on advertising, sales promotions and retailer support programs to target the particular preferences of Coca-Cola FEMSA’s consumers. Coca-Cola FEMSA’s consolidated marketing expenses in 2012, net of contributions by The Coca-Cola Company, were Ps. 3,681 million. The Coca-Cola Company contributed an additional Ps. 3,018 million in 2012, which mainly includes contributions for coolers, bottles and cases. Through the use of advanced information technology, Coca-Cola FEMSA has collected customer and consumer information that allows it to tailor its marketing strategies to target different types of customers located in each of its territories and to meet the specific needs of the various markets it serves.
Retailer Support Programs. Support programs include providing retailers with point-of-sale display materials and consumer sales promotions, such as contests, sweepstakes and the giveaway of product samples.
Coolers. Cooler distribution among retailers is important for the visibility and consumption of Coca-Cola FEMSA’s products and to ensure that they are sold at the proper temperature.
Advertising. Coca-Cola FEMSA advertises in all major communications media. Coca-Cola FEMSA focuses its advertising efforts on increasing brand recognition by consumers and improving its customer relations. National advertising campaigns are designed and proposed by The Coca-Cola Company’s local affiliates, with Coca-Cola FEMSA’s input at the local or regional level.
Channel Marketing. In order to provide more dynamic and specialized marketing of Coca-Cola FEMSA’s products, Coca-Cola FEMSA’s strategy is to classify its markets and develop targeted efforts for each consumer segment or distribution channel. Coca-Cola FEMSA’s principal channels are small retailers, “on-premise” consumption such as restaurants and bars, supermarkets and third party distributors. Presence in these channels entails a comprehensive and detailed analysis of the purchasing patterns and preferences of various groups of beverage consumers in each of the different types of locations or distribution channels. In response to this analysis, Coca-Cola FEMSA tailors its product, price, packaging and distribution strategies to meet the particular needs of and exploit the potential of each channel.
Multi-Segmentation. Coca-Cola FEMSA has been implementing a multi-segmentation strategy in the majority of its markets. This strategy consists of the implementation of different product/price/package portfolios by market cluster or group. These clusters are defined based on consumption occasion, competitive intensity and socio-economic levels, rather than solely on the types of distribution channels.
Client Value Management. Coca-Cola FEMSA has been transforming its commercial models to focus on its customers’ value potential using a value-based segmentation approach to capture the industry’s potential. Coca-Cola FEMSA started the rollout of this new model in its Mexico, Central America, Colombia and Brazil operations in 2009 and has covered close to 95% of its total volumes as of the end of 2012, including the later rollout in Argentina and, more recently, in Venezuela.
Coca-Cola FEMSA believes that the implementation of these strategies described above also enables it to respond to competitive initiatives with channel-specific responses as opposed to market-wide responses. In addition, it allows Coca-Cola FEMSA to be more efficient in the way it goes to market and invests its marketing resources in those segments that could provide a higher return. Coca-Cola FEMSA’s marketing, segmentation and distribution activities are facilitated by its management information systems. Coca-Cola FEMSA has invested significantly in creating these systems, including in hand-held computers to support the gathering of product, consumer and delivery information for most of its sales routes throughout its territories.
Product Sales and Distribution
The following table provides an overview of Coca-Cola FEMSA’s distribution centers and the retailers to which Coca-Cola FEMSA sells its products:
Product Distribution Summary
as of December 31, 2012
| Mexico and Central America(1) | South America(2) | Venezuela | ||||||||||
Distribution centers | 149 | 64 | 33 | |||||||||
Retailers(3) | 956,618 | 653,321 | 209,232 | |||||||||
| (1) | Includes Mexico, Guatemala, Nicaragua, Costa Rica and Panama. |
| (2) | Includes Colombia, Brazil and Argentina. |
| (3) | Estimated. |
Coca-Cola FEMSA continuously evaluates its distribution model in order to fit with the local dynamics of the marketplace and analyze the way it goes to market, recognizing different service needs from its customers, while looking for a more efficient distribution model. As part of this strategy, Coca-Cola FEMSA is rolling out a variety of new distribution models throughout its territories looking for improvements in its distribution network.
Coca-Cola FEMSA uses several sales and distribution models depending on market, geographic conditions and the customer’s profile: (1) the pre-sale system, which separates the sales and delivery functions, permitting trucks to be loaded with the mix of products that retailers have previously ordered, thereby increasing both sales and distribution efficiency, (2) the conventional truck route system, in which the person in charge of the delivery makes immediate sales from inventory available on the truck, (3) a hybrid distribution system, where the same truck carries product available for immediate sale and product previously ordered through the pre-sale system, (4) the telemarketing system, which could be combined with pre-sales visits and (5) sales through third-party wholesalers of Coca-Cola FEMSA’s products.
As part of the pre-sale system, sales personnel also provide merchandising services during retailer visits, which Coca-Cola FEMSA believes enhance the shopper experience at the point of sale. Coca-Cola FEMSA believes that an adequate number of service visits to retailers and frequency of deliveries are essential elements in an effective selling and distribution system for its products.
Coca-Cola FEMSA’s distribution centers range from large warehousing facilities and re-loading centers to small deposit centers. In addition to its fleet of trucks, Coca-Cola FEMSA distributes its products in certain locations through electric carts and hand-trucks in order to comply with local environmental and traffic regulations. In some of its territories, Coca-Cola FEMSA retains third parties to transport its finished products from the bottling plants to the distribution centers.
Mexico. Coca-Cola FEMSA contracts with one of our subsidiaries for the transportation of finished products to its distribution centers from its production facilities. From the distribution centers, Coca-Cola FEMSA then distributes its finished products to retailers through its own fleet of trucks.
In Mexico, Coca-Cola FEMSA sells a majority of its beverages at small retail stores to consumers who may take the beverages for consumption at home or elsewhere. Coca-Cola FEMSA also sells products through the “on-premise” consumption segment, supermarkets and other locations. The “on-premise” consumption segment consists of sales through sidewalk stands, restaurants, bars and various types of dispensing machines as well as sales through point-of-sale programs in stadiums, concert halls, auditoriums and theaters.
Brazil.In Brazil, Coca-Cola FEMSA sold 31.9% of its total sales volume through supermarkets in 2012. Also in Brazil, the delivery of Coca-Cola FEMSA’s finished products to customers is completed by a third party, while Coca-Cola FEMSA maintains control over the selling function. In designated zones in Brazil, third-party distributors purchase Coca-Cola FEMSA’s products at a discount from the wholesale price and resell the products to retailers.
Territories other than Mexico and Brazil. Coca-Cola FEMSA distributes its finished products to retailers through a combination of its own fleet of trucks and third party distributors. In most of Coca-Cola FEMSA’s territories, an important part of its total sales volume is sold through small retailers, with low supermarket penetration.
Competition
Although Coca-Cola FEMSA believes that its products enjoy wider recognition and greater consumer loyalty than those of its principal competitors, the markets in the territories in which Coca-Cola FEMSA operates are highly competitive. Coca-Cola FEMSA’s principal competitors are localPepsi bottlers and other bottlers and distributors of national and regional beverage brands. Coca-Cola FEMSA faces increased competition in many of its territories from producers of low price beverages, commonly referred to as “B brands.” A number of Coca-Cola FEMSA’s competitors in Central America, Venezuela, Brazil and Argentina offer beer in addition to sparkling beverages, still beverages, and water, which may enable them to achieve distribution efficiencies.
Price discounting and packaging have joined consumer sales promotions, customer service and non-price retailer incentives as the primary means of competition among bottlers. Coca-Cola FEMSA competes by seeking to offer products at an attractive price in the different segments in its markets and by building on the value of its brands. Coca-Cola FEMSA believes that the introduction of new products and new presentations has been a significant competitive technique that allows it to increase demand for its products, provide different options to consumers and increase new consumption opportunities.
Mexico and Central America. Coca-Cola FEMSA’s principal competitors in Mexico are bottlers ofPepsi products, whose territories overlap but are not co-extensive with Coca-Cola FEMSA’s own. Coca-Cola FEMSA competes with Organización Cultiba, S.A.B. de C.V., a joint venture recently formed by Grupo Embotelladoras Unidas, S.A.B. de C.V., the formerPepsi bottler in central and southeast Mexico, a subsidiary of PepsiCo, and Empresas Polar, S.A., the leading beer distributor andPepsi bottler in Venezuela. Coca-Cola FEMSA’s main competition in the juice category in Mexico is Grupo Jumex. In the water category,Bonafont, a water brand owned by Grupo Danone, is Coca-Cola FEMSA’s main competition. In addition, Coca-Cola FEMSA competes with Cadbury Schweppes in sparkling beverages and with other national and regional brands in Coca-Cola FEMSA’s Mexican territories, as well as low-price producers, such as Ajemex, S.A. de C.V. and Consorcio AGA, S.A. de C.V., that offer various presentations of sparkling and still beverages.
In the countries that comprise Coca-Cola FEMSA’s Central America region, Coca-Cola FEMSA’s main competitors arePepsi andBig Cola bottlers. In Guatemala and Nicaragua, Coca-Cola FEMSA competes with a joint venture between AmBev and The Central American Bottler Corporation. In Costa Rica, Coca-Cola FEMSA’s principal competitor is Florida Bebidas S.A., subsidiary of Florida Ice and Farm Co. In Panama, Coca-Cola FEMSA’s main competitor is Cervecería Nacional, S.A. Coca-Cola FEMSA also faces competition from “B brands” offering multiple serving size presentations in some Central American countries.
South America (excluding Venezuela). Coca-Cola FEMSA’s principal competitor in Colombia is Postobón, a well-established local bottler that sells flavored sparkling beverages (under the brandsPostobón andSpeed), some of which have a wide consumption preference, such asmanzana Postobón (apple Postobón), which is the second most popular flavor in the Colombian sparkling beverage industry in terms of total sales volume. Postobón also sellsPepsi products. Postobón is a vertically integrated producer, the owners of which hold other significant commercial interests in Colombia. Coca-Cola FEMSA also competes with low-price producers, such as the producers ofBig Cola, which principally offer multiple serving size presentations in the sparkling and still beverage industry.
In Brazil, Coca-Cola FEMSA competes against AmBev, a Brazilian company with a portfolio of brands that includesPepsi, local brands with flavors such as guaraná, and proprietary beer brands. Coca-Cola FEMSA also competes against “B brands” or “Tubainas,” which are small, local producers of low-cost flavored sparkling beverages in multiple serving presentations that represent a significant portion of the sparkling beverage market.
In Argentina, Coca-Cola FEMSA’s main competitor is Buenos Aires Embotellador S.A. (BAESA), aPepsi bottler, which is owned by Argentina’s principal brewery, Quilmes Industrial S.A., and indirectly controlled by AmBev. In addition, Coca-Cola FEMSA competes with a number of competitors offering generic, low-priced sparkling beverages as well as many other generic products and private label proprietary supermarket brands.
Venezuela. In Venezuela, Coca-Cola FEMSA’s main competitor is Pepsi-Cola Venezuela, C.A., a joint venture formed between PepsiCo and Empresas Polar, S.A., the leading beer distributor in the country. Coca-Cola FEMSA also competes with the producers ofBig Cola in part of the country.
Raw Materials
Pursuant to Coca-Cola FEMSA’s bottler agreements, Coca-Cola FEMSA is authorized to manufacture, sell and distributeCoca-Cola trademark beverages within specific geographic areas, and it is required to purchase in some of its territories for allCoca-Cola trademark beverages concentrate from companies designated by The Coca-Cola Company and sweeteners from companies authorized by The Coca-Cola Company. Concentrate prices for sparkling beverages are determined as a percentage of the weighted average retail price in local currency net of applicable taxes. Although The Coca-Cola Company has the right to unilaterally set the price of concentrates, in practice this percentage has historically been set pursuant to periodic negotiations with The Coca-Cola Company.
As part of the cooperation framework that Coca-Cola FEMSA reached with The Coca-Cola Company at the end of 2006, The Coca-Cola Company provides a relevant portion of the funds derived from the concentrate increase for marketing support of Coca-Cola FEMSA’s sparkling and still beverages portfolio.
In addition to concentrate, Coca-Cola FEMSA purchases sweeteners, carbon dioxide, resin and preforms to make plastic bottles, finished plastic and glass bottles, cans, caps and fountain containers, as well as other packaging materials and raw materials. Sweeteners are combined with water to produce basic syrup, which is added to the concentrate as the sweetener for most of Coca-Cola FEMSA’s beverages. Coca-Cola FEMSA’s bottler agreements provide that, with respect toCoca-Colatrademark beverages, these materials may be purchased only from suppliers approved by The Coca-Cola Company, including affiliates of FEMSA. Prices for packaging materials and HFCS historically have been determined with reference to the U.S. dollar, although the local currency equivalent in a particular country is subject to price volatility in accordance with changes in exchange rates. Coca-Cola FEMSA’s most significant packaging raw material costs arise from the purchase of resin, plastic preforms to make plastic bottles and finished plastic bottles, which Coca-Cola FEMSA obtains from international and local producers. The prices of these materials are tied to crude oil prices and global resin supply. In recent years Coca-Cola FEMSA has experienced volatility in the prices it pays for these materials. Across Coca-Cola FEMSA’s territories, its average price for resin in U.S. dollars decreased approximately 6.0% in 2012 as compared to 2011.
Under Coca-Cola FEMSA’s agreements with The Coca-Cola Company, it may use raw or refined sugar or HFCS as sweeteners in its products. Sugar prices in all of the countries in which Coca-Cola FEMSA operates, other than Brazil, are subject to local regulations and other barriers to market entry that cause Coca-Cola FEMSA to pay in excess of international market prices for sugar in certain countries. In recent years, international sugar prices experienced significant volatility.
None of the materials or supplies that Coca-Cola FEMSA uses is presently in short supply, although the supply of specific materials could be adversely affected by strikes, weather conditions, governmental controls or national emergency situations.
Mexico and Central America. In Mexico, Coca-Cola FEMSA purchases its returnable plastic bottles from Graham Packaging México, S.A. de C.V., known as Graham, which is the exclusive supplier of returnable plastic bottles to The Coca-Cola Company and its bottlers in Mexico. Coca-Cola FEMSA mainly purchases resin from Indorama Ventures Polymers México, S. de R.L. de C.V. (formerly Arteva Specialties, S. de R.L. de C.V.), M. & G. Polímeros México, S.A. de C.V. and DAK Resinas Americas Mexico, S.A. de C.V., which ALPLA México, S.A. de C.V., known as ALPLA, and Envases Universales de México, S.A.P.I. de C.V. manufacture into non-returnable plastic bottles for Coca-Cola FEMSA.
Coca-Cola FEMSA purchases all of its cans from Fábricas de Monterrey, S.A. de C.V., known as FAMOSA, a wholly-owned subsidiary of the Heineken Group, and Envases Universales de México, S.A.P.I. de C.V., through Promotora Mexicana de Embotelladoras, S.A. de C.V., known as PROMESA, a company owned by variousCoca-Cola bottlers, in which, as of March 31, 2013, Coca-Cola FEMSA holds a 30.0% equity interest. Coca-Cola FEMSA mainly purchases its glass bottles from EXCO Integral Services, S.A. de C.V. (formerly Compañía Vidriera, S.A. de C.V., or VITRO), FEVISA Industrial, S.A. de C.V., known as FEVISA, and Glass & Silice, S.A. de C.V., a wholly-owned subsidiary of the Heineken Group.
Coca-Cola FEMSA purchases sugar from, among other suppliers, Piasa and Beta San Miguel, S.A. de C.V., both sugar cane producers in which, as of March 31, 2013, Coca-Cola FEMSA held an approximate 26.1% and 2.7% equity interest, respectively. Coca-Cola FEMSA purchase HFCS from CP Ingredientes, S.A. de C.V. and Almidones Mexicanos, S.A. de C.V., known as Almex.
Sugar prices in Mexico are subject to local regulations and other barriers to market entry that cause Coca-Cola FEMSA to pay higher prices than those paid in the international market for sugar. As a result, sugar prices in Mexico have no correlation to international market prices for sugar. In 2012, sugar prices decreased approximately 15% as compared to 2011.
In Central America, the majority of Coca-Cola FEMSA’s raw materials such as glass and plastic bottles are purchased from several local suppliers. Coca-Cola FEMSA purchases all of Coca-Cola FEMSA’s cans from PROMESA. Sugar is available from suppliers that represent several local producers. Local sugar prices, in the countries that comprise the region, have increased mainly due to volatility in international prices. In Costa Rica, Coca-Cola FEMSA acquires plastic non-returnable bottles from ALPLA C.R. S.A., and in Nicaragua Coca-Cola FEMSA acquires such plastic bottles from ALPLA Nicaragua, S.A.
South America (excluding Venezuela). In Colombia, Coca-Cola FEMSA uses sugar as a sweetener in most of its products, which Coca-Cola FEMSA buys from several domestic sources. In 2011, Coca-Cola FEMSA started to use HFCS as an alternative sweetener for its products. Coca-Cola FEMSA purchases HFCS from Archer Daniels Midland Company. Coca-Cola FEMSA purchases plastic bottles from Amcor and Tapón Corona de Colombia S.A. Coca-Cola FEMSA purchases all of its glass bottles from Peldar O-I and cans from Crown, both suppliers in which Grupo Ardila Lulle, owners of Coca-Cola FEMSA’s competitor Postobón, owns a minority equity interest. Glass bottles and cans are available only from these local sources.
Sugar is available in Brazil at local market prices, which historically have been similar to international prices. Sugar prices in Brazil in recent periods have been volatile, mainly due to the increased demand for sugar cane for production of alternative fuels, and Coca-Cola FEMSA’s average acquisition cost for sugar in 2012 decreased approximately 24% as compared to 2011. Coca-Cola FEMSA purchases glass bottles, plastic bottles and cans from several domestic and international suppliers.
In Argentina, Coca-Cola FEMSA mainly uses HFCS that it purchases from several different local suppliers as a sweetener in its products instead of sugar. Coca-Cola FEMSA purchases glass bottles, plastic cases and other raw materials from several domestic sources. Coca-Cola FEMSA purchases plastic preforms, as well as returnable plastic bottles, at competitive prices from Embotelladora del Atlántico S.A., a local subsidiary of Embotelladora Andina S.A., aCoca-Cola bottler with operations in Argentina, Chile and Brazil, and other local suppliers. Coca-Cola FEMSA also acquires plastic preforms from ALPLA Avellaneda S.A. and other suppliers.
Venezuela. In Venezuela, Coca-Cola FEMSA uses sugar as a sweetener in most of its products, which Coca-Cola FEMSA purchases mainly from the local market. Since 2003, from time to time, Coca-Cola FEMSA has experienced a sugar shortage due to lower domestic production and the inability of the predominant sugar importers to obtain permission to import in a timely manner. While sugar distribution to the food and beverages industry and to retailers is controlled by the government, Coca-Cola FEMSA did not experience any disruptions during 2012 with respect to access to sufficient sugar supply. However, we cannot assure you that Coca-Cola FEMSA will not experience disruptions in its ability to meet its sugar requirements in the future should the Venezuelan government impose restrictive measures in the future. Coca-Cola FEMSA buys glass bottles from one local supplier, Productos de Vidrio, S.A., but there are alternative suppliers authorized by The Coca-Cola Company. Coca-Cola FEMSA acquires most of its plastic non-returnable bottles from ALPLA de Venezuela, S.A. and all of its aluminum cans from a local producer, Dominguez Continental, C.A.
Under current regulations promulgated by the Venezuelan authorities, Coca-Cola FEMSA’s ability to import some of its raw materials and other supplies used in Coca-Cola FEMSA’s production could be limited, and access to the official exchange rate for these items for Coca-Cola FEMSA and its suppliers, including, among others, resin, aluminum, plastic caps, distribution trucks and vehicles is only achieved by obtaining proper approvals from the relevant authorities.
Overview and Background
FEMSA Comercio operates the largest chain of small-format stores in Mexico, measured in terms of number of stores as of December 31, 2012, under the trade name OXXO. As of December 31, 2012, FEMSA Comercio operated 10,601 OXXO stores, of which 10,567 are located throughout the country, with a particularly strong presence in the northern part of Mexico, and the remaining 34 stores are located in Bogotá, Colombia.
FEMSA Comercio, the largest single customer of Cuauhtémoc Moctezuma and of the Coca-Cola system in Mexico, was established by FEMSA in 1978 when two OXXO stores were opened in Monterrey, one store in Mexico City and another store in Guadalajara. The motivating factor behind FEMSA’s entrance into the retail industry was to enhance beer sales through company-owned retail outlets as well as to gather information on customer preferences. In 2012, a typical OXXO store carried 2,427 different store keeping units (SKUs) in 31 main product categories.
In recent years, FEMSA Comercio has represented an effective distribution channel for our beverage products, as well as a rapidly growing point of contact with our consumers. Based on the belief that location plays a major role in the long-term success of a retail operation such as a convenience store, as well as a role in our continually improving ability to accelerate and streamline the new-store development process, FEMSA Comercio has focused on a strategy of rapid, profitable growth. FEMSA Comercio opened 1,092, 1,135 and 1,040 net new OXXO stores in 2010, 2011 and 2012, respectively. The accelerated expansion in the number of stores yielded total revenue growth of 16.6% to reach Ps. 86,433 million in 2012. Same store sales increased an average of 7.7%, driven by increases in store traffic and average customer ticket. FEMSA Comercio performed approximately 3.0 billion transactions in 2012 compared to 2.7 billion transactions in 2011.
Business Strategy
A fundamental element of FEMSA Comercio’s business strategy is to utilize its position in the convenience store market to grow in a cost-effective and profitable manner. As a market leader in convenience store retailing, based on internal company surveys, management believes that FEMSA Comercio has an in-depth understanding of its markets and significant expertise in operating a national store chain. FEMSA Comercio intends to continue increasing its store base while capitalizing on the market knowledge gained at existing stores.
FEMSA Comercio has developed proprietary models to assist in identifying appropriate store locations, store formats and product categories. Its model utilizes location-specific demographic data and FEMSA Comercio’s experience in similar locations to fine tune the store format and product offerings to the target market. Market segmentation is becoming an important strategic tool, and it should increasingly allow FEMSA Comercio to improve the operating efficiency of each location and the overall profitability of the chain.
FEMSA Comercio has made and will continue to make significant investments in IT to improve its ability to capture customer information from its existing stores and to improve its overall operating performance. The majority of products carried through OXXO stores are bar-coded, and all OXXO stores are equipped with point-of-sale systems that are integrated into a company-wide computer network. To implement revenue management strategies, FEMSA Comercio created a division in charge of product category management for products, such as beverages, fast food and perishables, to enhance and better utilize its consumer information base and market intelligence capabilities. FEMSA Comercio utilizes a technology platform supported by an enterprise resource planning (ERP) system, as well as other technological solutions such as merchandising and point-of-sale systems, which will allow FEMSA Comercio to continue redesigning its key operating processes and enhance the usefulness of its market information going forward. In addition, FEMSA Comercio has expanded its operations contributedby opening 11 new stores in Bogotá, Colombia in 2012.
FEMSA Comercio has adopted innovative promotional strategies in order to increase store traffic and sales. In particular, FEMSA Comercio sells high-frequency items such as beverages, snacks and cigarettes at competitive prices. FEMSA Comercio’s ability to implement this strategy profitably is partly attributable to the size of the OXXO chain, as FEMSA Comercio is able to work together with its suppliers to implement their revenue-management strategies through differentiated promotions. OXXO’s national and local marketing and promotional strategies are an effective revenue driver and a means of reaching new segments of the population while strengthening the OXXO brand. For example, the organization has refined its expertise in executing cross promotions (discounts on multi-packs or sales of complementary products at a special price) and targeted promotions to attract new customer segments, such as housewives, by expanding the offerings in the grocery product category in certain stores. FEMSA Comercio is also strengthening its capabilities to increasingly provide consumers with services such as utility bill payment and other basic transactions.
Store Locations
With 10,567 OXXO stores in Mexico and 34 stores in Colombia as of December 31, 2012, FEMSA Comercio operates the largest small-format store chain in Latin America measured by number of stores. OXXO stores are concentrated in the northern part of Mexico, but also have a growing presence in the rest of the country.
FEMSA Comercio
Regional Allocation of OXXO Stores in Mexico and Latin America(*)
as of December 31, 2012
FEMSA Comercio has aggressively expanded its number of stores over the past several years. The average investment required to open a new store varies, depending on location and format and whether the store is opened in an existing retail location or requires construction of a new store. FEMSA Comercio is generally able to use supplier credit to fund the initial inventory of new stores.
Growth in Total OXXO Stores
| Year Ended December 31, | ||||||||||||||||||||
| 2012 | 2011 | 2010 | 2009 | 2008 | ||||||||||||||||
Total OXXO stores | 10,601 | 9,561 | 8,426 | 7,334 | 6,374 | |||||||||||||||
Store growth (% change over previous year) | 10.9 | % | 13.5 | % | 14.9 | % | 15.1 | % | 14.6 | % | ||||||||||
FEMSA Comercio currently expects to continue the growth trend established over the past several years by emphasizing growth in areas of high economic potential in existing markets and by expanding in underserved and unexploited markets. Management believes that the southeast part of Mexico is particularly underserved by the convenience store industry.
The identification of locations and pre-opening planning in order to optimize the results of new stores are important elements in FEMSA Comercio’s growth plan. FEMSA Comercio continuously reviews store performance against certain operating and financial benchmarks to optimize the overall performance of the chain. Stores unable to maintain benchmark standards are generally closed. Between December 31, 2008 and 2012, the total number of OXXO stores increased by 4,227, which resulted from the opening of 4,328 new stores and the closing of 101 existing stores.
Competition
FEMSA Comercio, mainly through OXXO, competes in the overall retail market, which we believe is highly competitive. OXXO stores face competition from small-format stores like 7-Eleven, Super Extra, Super City, Círculo K stores and other numerous chains of retailers across Mexico, from other regional small-format retailers to small informal neighborhood stores. OXXO competes both for consumers and for new locations for stores and the managers to operate those stores. FEMSA Comercio operates in the 32 Mexican states and has much broader geographical coverage than any of its competitors in Mexico.
Market and Store Characteristics
Market Characteristics
FEMSA Comercio is placing increased emphasis on market segmentation and differentiation of store formats to more appropriately serve the needs of customers on a location-by-location basis. The principal segments include residential neighborhoods, commercial and office locations and stores near schools and universities, along with other types of specialized locations.
Approximately 64% of OXXO’s customers are between the ages of 15 and 35. FEMSA Comercio also segments the market according to demographic criteria, including income level.
Store Characteristics
The average size of an OXXO store is approximately 103 square meters of selling space, excluding space dedicated to refrigeration, storage or parking. The average constructed area of a store is approximately 186 square meters and, when parking areas are included, the average store size is approximately 429 square meters.
FEMSA Comercio—Operating Indicators
| Year Ended December 31, | ||||||||||||||||||||
| 2012 | 2011 | 2010 | 2009 | 2008 | ||||||||||||||||
| (percentage increase compared to previous year) | ||||||||||||||||||||
Total FEMSA Comercio revenues | 16.6 | % | 19.0 | % | 16.3 | % | 13.6 | % | 12.0 | % | ||||||||||
OXXO same-store sales(1) | 7.7 | % | 9.2 | % | 5.2 | % | 1.3 | % | 0.4 | % | ||||||||||
| (1) | Same-store sales growth is calculated by comparing the sales of stores for each year that have been in operation for more than 12 months with the sales of those same stores during the previous year. |
Beer, cigarettes, soft drinks and other beverages, snacks and cellular telephone air-time represent the main product categories for OXXO stores. FEMSA Comercio has a distribution agreement with Cuauhtémoc Moctezuma (which is now part of the Heineken Group). As a result of this agreement, OXXO stores only carry beer brands produced and distributed by Cuauhtémoc Moctezuma. OXXO stores will continue to benefit from the existing relationship under which Cuauhtémoc Moctezuma will continue to be the exclusive supplier of beer to OXXO until June 2020.
Approximately 65% of OXXO stores are operated by independent managers responsible for all aspects of store operations. The managers are commission agents and are not employees of FEMSA Comercio. Each store manager is the legal employer of the store’s staff, which typically numbers six people per store. FEMSA Comercio continually invests in on-site operating personnel, with the objective of promoting loyalty, customer service and low personnel turnover in the stores.
Advertising and Promotion
FEMSA Comercio’s marketing efforts include both specific product promotions and image advertising campaigns. These strategies seek to increase store traffic and sales, and to reinforce the OXXO name and market position.
FEMSA Comercio manages its advertising on three levels depending on the nature and scope of the specific campaign: local or store-specific, regional and national. Store-specific and regional campaigns are closely monitored to ensure consistency with the overall corporate image of OXXO stores and to avoid conflicts with national campaigns. FEMSA Comercio primarily uses point of purchase materials, flyers, handbills and print and radio media for promotional campaigns, although television is used occasionally for the introduction of new products and services. The OXXO chain’s image and brand name are presented consistently across all stores, irrespective of location.
Inventory and Purchasing
FEMSA Comercio has placed considerable emphasis on improving operating performance. As part of these efforts, FEMSA Comercio continues to invest in extensive information management systems to improve inventory management. Electronic data collection has enabled FEMSA Comercio to reduce average inventory levels. Inventory replenishment decisions are carried out on a store-by-store basis.
Management believes that the OXXO chain’s scale of operations provides FEMSA Comercio with a competitive advantage in its ability to realize strategic alliances with suppliers. General category offerings are determined on a national level, although purchasing decisions are implemented on a local, regional or national level, depending on the nature of the product category. Given the fragmented nature of the retail industry in Mexico in general, Mexican producers of beer, soft drinks, bread, dairy products, snacks, cigarettes and other high-frequency products have established proprietary distribution systems with extensive direct distribution routes. As a result, approximately 51% of the OXXO chain’s total sales consist of products that are delivered directly to the stores by suppliers. Other products with longer shelf lives are distributed to stores by FEMSA Comercio’s distribution system, which includes 14 regional warehouses located in Monterrey, Guadalajara, Mexicali, Mérida, León, Obregón, Puebla, Chihuahua, Reynosa, Tijuana, Toluca, Villahermosa and two in Mexico City. The distribution centers operate a fleet of approximately 746 trucks that make deliveries to each store approximately twice per week.
Seasonality
OXXO stores experience periods of high demand in December, as a result of the holidays, and in July and August, as a result of increased consumption of beer and soft drinks during the hot summer months. The months of November and February are generally the weakest sales months for OXXO stores. In general, colder weather during these months reduces store traffic and consumption of cold beverages.
Other Stores
FEMSA Comercio also operates other small format stores, which include soft discount stores with a focus on perishables, liquor stores and smaller convenience stores.
Equity Method Investment in the Heineken Group
As of December 31, 2012, FEMSA owned a non-controlling interest in the Heineken Group, one of the world’s leading brewers. As of December 31, 2012, our 20% economic interest in the Heineken Group was comprised of 43,018,320 shares of Heineken Holding N.V. and 72,182,203 shares of Heineken N.V. For 2012, FEMSA recognized equity income of Ps. 8,311 regarding its 20% economic interest in the Heineken Group; see note 10 to our audited consolidated financial statements.
As described above, FEMSA Comercio has a distribution agreement with Cuauhtémoc Moctezuma (which is now a part of the Heineken Group) pursuant to which OXXO stores only carry beer brands produced and distributed by Cuauhtémoc Moctezuma. OXXO stores will continue to benefit from the existing relationship under which Cuauhtémoc Moctezuma will continue to be the exclusive supplier of beer to OXXO until June 2020. As of April 30, 2010, Coca-Cola FEMSA has agreed with Cervejarias Kaiser (also now part of the Heineken Group) to continue to distribute and sell theKaiser beer portfolio in Coca-Cola FEMSA’s Brazilian territories for a 20-year term beginning in 2003, consistent with the arrangement already in place. In addition, our logistic services, corporate and shared services subsidiary continues to provide certain services to Cuauhtémoc Moctezuma and its subsidiaries.
Our other business consists of the following smaller operations that support our core operations:
Our logistics services subsidiary provides a broad range of logistics and vehicle maintenance services to Coca-Cola FEMSA, FEMSA Comercio and third-party clients in the beverages, consumer products and retail industries. It has operations in Mexico, Brazil, Colombia, Panama, Costa Rica and Nicaragua.
Our refrigeration business produces vertical and horizontal commercial refrigerators for the soft drink, beer and food industries, with an annual capacity of 475,416 units at December 31, 2012. In 2012, this business sold 389,132 refrigeration units, 36.0% of which were sold to Coca-Cola FEMSA, and the remainder of which were sold to third parties.
Our corporate services subsidiary employs all of our corporate staff, including the personnel managing the areas of finance, corporate accounting, taxation, legal, financial and strategic planning, human resources, corporate affairs and internal audit. Through this subsidiary, we direct, control, supervise and review the operations of our sub-holding companies. As of December 31, 2012, FEMSA Comercio and our other business subsidiaries pay management fees for the services provided to them. In addition, Coca-Cola FEMSA has entered into a services agreement pursuant to which it pays for specific services. As part of the Heineken transaction, the corporate and shared services subsidiaries continue to provide some limited corporate services and shared services to subsidiaries of Cuauhtémoc Moctezuma (now part of the Heineken Group), for which such companies continue to pay.
Until December 31, 2010, our labeling and flexible packaging business was our wholly-owned subsidiary. In 2010, this business sold 14% of its label sales volume to Cuauhtémoc Moctezuma, 20% to Coca-Cola FEMSA and 66% to third parties. Our labeling and flexible packaging business was sold on December 31, 2010.
Until December 31, 2012, Quimiproductos, our manufacturer and supplier of cleaning and sanitizing products and services related to food and beverage industrial processes, as well as of water treatment, was our wholly-owned subsidiary. In 2012, this business sold 38% of its products to Cuauhtémoc Moctezuma, 27% to Coca-Cola FEMSA and 35% to third parties. Our Quimiproductos business was sold on December 31, 2012.
Until September 23, 2010 we owned the Mundet brands in Mexico, which were disposed through the sale to The Coca-Cola Company of Promotora de Marcas Nacionales, S. de R.L. de C.V., which was a wholly owned subsidiary of FEMSA.
Description of Property, Plant and Equipment
As of December 31, 2012, we owned all of our manufacturing facilities and substantially all of our warehouses and distribution centers. Our properties primarily consisted of production and distribution facilities for our soft drink operations and office space. In addition, FEMSA Comercio owns approximately 10.6% of the OXXO store locations, while the other stores are located in properties that are rented under long-term lease arrangements with third parties.
The table below summarizes by country the installed capacity and percentage utilization of Coca-Cola FEMSA’s production facilities:
Bottling Facility Summary
As of December 31, 2012
Country | Installed Capacity (thousands of unit cases) | Utilization(1) (%) | ||||||
Mexico | 2,671,963 | 62.0 | ||||||
Guatemala | 35,527 | 77.0 | ||||||
Nicaragua | 66,516 | 60.0 | ||||||
Costa Rica | 81,424 | 56.0 | ||||||
Panama | 55,863 | 52.0 | ||||||
Colombia | 514,813 | 49.0 | ||||||
Venezuela | 288,751 | 69.0 | ||||||
Brazil | 720,704 | 64.0 | ||||||
Argentina | 347,307 | 62.0 | ||||||
| (1) | Annualized rate. |
The table below summarizes by country the location and facility area of each of Coca-Cola FEMSA’s production facilities.
Bottling Facilities by Location as of December 31, 2012
Country | Location | Production Area | ||
(thousands of sq. meters) | ||||
Mexico | San Cristóbal de las Casas, Chiapas | 45 | ||
| Cuautitlán, Estado de México | 35 | |||
| Los Reyes la Paz, Estado de México | 50 | |||
| Toluca, Estado de México | 242 | |||
| León, Guanajuato | 124 | |||
| Morelia, Michoacán | 50 | |||
| Ixtacomitán, Tabasco | 117 | |||
| Apizaco, Tlaxcala | 80 | |||
| Coatepec, Veracruz | 142 | |||
| La Pureza Altamira, Tamaulipas | 300 | |||
| Poza Rica, Veracruz | 42 | |||
| Pacífico, Estado de México | 89 | |||
| Cuernavaca, Morelos | 37 | |||
| Toluca, Estado de México | 41 | |||
| San Juan del Río, Querétaro | 84 | |||
| Querétaro, Querétaro | 80 | |||
Guatemala | Guatemala City | 47 | ||
Nicaragua | Managua | 54 | ||
Costa Rica | Calle Blancos, San José | 52 | ||
| Coronado, San José | 14 | |||
Panama | Panama City | 29 | ||
Country | Location | Production Area | ||
(thousands of sq. meters) | ||||
Colombia | Barranquilla | 37 | ||
| Bogotá, DC | 105 | |||
| Bucaramanga | 26 | |||
| Cali | 76 | |||
| Manantial, Cundenamarca | 67 | |||
| Medellín | 47 | |||
Venezuela | Antímano | 15 | ||
| Barcelona | 141 | |||
| Maracaibo | 68 | |||
| Valencia | 100 | |||
Brazil | Campo Grande | 36 | ||
| Jundiaí | 191 | |||
| Mogi das Cruzes | 119 | |||
| Belo Horizonte | 73 | |||
Argentina | Alcorta, Buenos Aires | 73 | ||
| Monte Grande, Buenos Aires | 32 | |||
We maintain an “all risk” insurance policy covering our properties (owned and leased), machinery and equipment and inventories as well as losses due to business interruptions. The policy covers damages caused by natural disaster, including hurricane, hail, earthquake and damages caused by human acts, including explosion, fire, vandalism, riot and losses incurred in connection with goods in transit. In addition, we maintain an “all risk” liability insurance policy that covers product liability. We purchase our insurance coverage through an insurance broker. In 2012, the policies for “all risk” property insurance and “all risk” liability insurance were issued by ACE Seguros, S.A., and the coverage was partially reinsured in the international reinsurance market. In 2013, “all risk” liability insurance policy will be issued by XL Insurance Mexico SA de CV. We believe that our coverage is consistent with the coverage maintained by similar companies operating in Mexico.
Capital Expenditures and Divestitures
Our consolidated capital expenditures for the years ended December 31, 2012 and 2011 were Ps. 15,560 million and Ps. 12,666 million respectively, and were for the most part financed from cash from operations generated by our subsidiaries. These amounts were invested in the following manner:
| Year Ended December 31, | ||||||||
| 2012 | 2011 | |||||||
| (In millions of Mexican pesos) | ||||||||
Coca-Cola FEMSA | Ps. | 10,259 | Ps. | 7,862 | ||||
FEMSA Comercio | 4,707 | 4,186 | ||||||
Other | 594 | 618 | ||||||
|
|
|
| |||||
Total | Ps. | 15,560 | Ps. | 12,666 | ||||
Coca-Cola FEMSA
During 2012, Coca-Cola FEMSA’s capital expenditures focused on increasing production capacity, placing coolers with retailers, returnable bottles and cases, improving the efficiency of distribution infrastructure, and IT. Capital expenditures in Mexico and Central America were approximately Ps. 5,350 million and accounted for approximately 52% of Coca-Cola FEMSA’s capital expenditures, with South America representing the balance.
FEMSA Comercio
FEMSA Comercio’s principal investment activity is the construction and opening of new stores. During 2012, FEMSA Comercio opened 1,040 net new OXXO stores. FEMSA Comercio invested Ps. 4,707 million in 2012 in the addition of new stores, warehouses and improvements to leased properties.
Competition Legislation
TheLey Federal de Competencia Económica (Federal Economic Competition Law or Mexican Competition Law) became effective on June 22, 1993. The Mexican Competition Law and theReglamento de la Ley Federal de Competencia Económica (Regulations under the Mexican Competition Law), effective as of October 13, 2007, regulate monopolistic practices and require Mexican government approval of certain mergers and acquisitions. The Mexican Competition Law subjects the activities of certain Mexican companies, including us, to regulatory scrutiny. In addition, the Regulations under the Mexican Competition Law prohibit members of any trade association from reaching any agreement relating to the price of their products. Management believes that we are currently in compliance in all material respects with Mexican competition legislation.
In Mexico and in some of the other countries in which we operate, we are involved in different ongoing competition related proceedings. We believe that the outcome of these proceedings will not have a material adverse effect on our financial position or results. See “Item 8. Financial Information—Legal Proceedings—Coca-Cola FEMSA—Antitrust Matters.”
Price Controls
Voluntary price restraints or statutory price controls have been imposed historically in several of the countries in which Coca-Cola FEMSA operates. Currently, there are no price controls on Coca-Cola FEMSA’s products in any of its territories, except for (i) Argentina, where authorities directly supervise certain products sold through supermarkets to control inflation, and (ii) Venezuela, where the government has recently imposed price controls on certain products including bottled water.See “Item 3. Key Information—Risk Factors—Regulatory developments may adversely affect Coca-Cola FEMSA’s business.”
Taxation of Sparkling Beverages
All the countries in which Coca-Cola FEMSA operates, except for Panama, impose a value-added tax on the sale of sparkling beverages, with a rate of 16% in Mexico, 12% in Guatemala, 15% in Nicaragua, 13% in Costa Rica, 16% in Colombia (applied only to the first sale in supply chain), 12% in Venezuela, 21% in Argentina, and 17% (Mato Grosso do Sul and Goiás) and 18% (São Paulo, Minas Gerais and Rio de Janeiro) in Brazil. Also, Coca-Cola FEMSA’s Brazilian bottler is responsible for charging and collecting the value-added tax from each of its retailers, based on average retail prices for each state where the company operates, defined primarily through a survey conducted by the government of each state and generally updated every three months. In addition, several of the countries in which Coca-Cola FEMSA operates impose the following excise or other taxes:
Guatemala imposes an excise tax of 0.18 cents in local currency (Ps. 0.30 as of December 31, 2012) per liter of sparkling beverage.
Costa Rica imposes a specific tax on non-alcoholic bottled beverages based on the combination of packaging and flavor, currently assessed at 16.74 colones per 250 ml (Ps. 0.42 as of December 31, 2012), and an excise tax currently assessed at 5.79 colones per 250 ml (approximately Ps. 0.15 as of December 31, 2012).
Nicaragua imposes a 9.0% tax on consumption, and municipalities impose a 1% tax on Coca-Cola FEMSA’s Nicaraguan gross income.
Panama imposes a 5.0% tax based on the cost of goods produced. Panama also imposes a 10% selective consumption tax on syrups, powders and concentrate.
Argentina imposes an excise tax of 8.7% on sparkling beverages containing less than 5.0% lemon juice or less than 10.0% fruit juice, and an excise tax of 4.2% on sparkling water and flavored sparkling beverages with 10.0% or more fruit juice, although this excise tax is not applicable to certain of Coca-Cola FEMSA’s products.
Brazil’s federal government assesses an average production tax of approximately 4.7% and an average sales tax of approximately 10.8%. Most of these taxes are fixed, based on average retail prices in each state where the company operates (VAT) or fixed by the federal government (excise and sales tax).
Environmental Matters
In all of our territories, our operations are subject to federal and state laws and regulations relating to the protection of the environment.
Mexico
The Mexican federal authority in charge of overseeing compliance with the federal environmental laws is theSecretaria del Medio Ambiente y Recursos Naturales or Secretary of Environment and Natural Resources, which we refer to as “SEMARNAT”. An agency of SEMARNAT, theProcuraduría Federal de Protección al Ambiente or Federal Environmental Protection Agency, which we refer to as “PROFEPA”, has the authority to enforce the Mexican federal environmental laws. As part of its enforcement powers, PROFEPA can bring administrative, civil and criminal proceedings against companies and individuals that violate environmental laws, regulations and Mexican Official Standards and has the authority to impose a variety of sanctions. These sanctions may include, among other things, monetary fines, revocation of authorizations, concessions, licenses, permits or registrations, administrative arrests, seizure of contaminating equipment, and in certain cases, temporary or permanent closure of facilities. Additionally, as part of its inspection authority, PROFEPA is entitled to periodically inspect the facilities of companies whose activities are regulated by the Mexican environmental legislation and verify compliance therewith. Furthermore, in special situations or certain areas where federal jurisdiction is not applicable or appropriate, the state and municipal authorities can administer and enforce certain environmental regulations of their respective jurisdictions.
In Mexico, the principal legislation relating to environmental matters is theLey General de Equilibrio Ecológico y Protección al Ambiente (Federal General Law for Ecological Equilibrium and Environmental Protection, or the Mexican Environmental Law) and theLey General para la Prevención y Gestión Integral de los Residuos(General Law for the Prevention and Integral Management of Waste). Under the Mexican Environmental Law, rules have been promulgated concerning water, air and noise pollution and hazardous substances. In particular, Mexican environmental laws and regulations require that we file periodic reports with respect to air and water emissions and hazardous wastes and set forth standards for waste water discharge that apply to our operations. We are also subject to certain minimal restrictions on the operation of delivery trucks in Mexico City. We have implemented several programs designed to facilitate compliance with air, waste, noise and energy standards established by current Mexican federal and state environmental laws, including a program that installs catalytic converters and liquid petroleum gas in delivery trucks for our operations in Mexico City.
In addition, we are subject to theLey de Aguas Nacionales de 1992(as amended, the 1992 Water Law), enforced by theComisión Nacional del Agua(National Water Commission). Adopted in December 1992, and amended in 2004, the 1992 Water Law provides that plants located in Mexico that use deep water wells to supply their water requirements must pay a fee to the local governments for the discharge of residual waste water to drainage. Pursuant to this law, certain local authorities test the quality of the waste water discharge and charge plants an additional fee for measurements that exceed certain standards published by the National Water Commission. In the case of non-compliance with the law, penalties, including closures, may be imposed. All of Coca-Cola FEMSA’s bottler plants located in Mexico have met these standards. In addition, Coca-Cola FEMSA’s plants in Apizaco and San Cristóbal are certified with ISO 14001.
In Coca-Cola FEMSA’s Mexican operations, it established a partnership with The Coca-Cola Company and ALPLA, a supplier of plastic bottles to Coca-Cola FEMSA in Mexico, to createIndustria Mexicana de Reciclaje (IMER), a PET recycling facility located in Toluca, Mexico. This facility started operations in 2005 and has a recycling capacity of approximately 25,000 metric tons per year from which 15,000 metric tons can be re-used in PET bottles for food packaging purposes. Coca-Cola FEMSA has also continued contributing funds to a nationwide recycling company,Ecología y Compromiso Empresarial(Environmentally Committed Companies). In addition, Coca-Cola FEMSA’s plants located in Toluca, Reyes, Cuautitlán, Apizaco, San Cristóbal, Morelia, Ixtacomitan, Coatepec, Poza Rica and Cuernavaca have received aCertificado de Industria Limpia (Certificate of Clean Industry).
As part of our environmental protection and sustainability strategies, several of our subsidiaries have entered into 20-year wind power purchase agreements with the Mareña Renovables Wind Farm to receive electrical energy for use at production and distribution facilities of FEMSA and Coca-Cola FEMSA throughout Mexico, as well as for a significant number of OXXO stores. The Mareña Renovables Wind Farm will be located in the state of Oaxaca and is expected to have a capacity of 396 megawatts. We anticipate the Mareña Renovables Wind Farm will begin operations in 2014.
As part of Coca-Cola FEMSA’s environmental protection and sustainability strategies, in December 2009, Coca-Cola FEMSA, jointly with strategic partners, entered into a wind energy supply agreement with a Mexican subsidiary of the Spanish wind farm developer, GAMESA Energía, S.A., or GAMESA, to supply clean energy to Coca-Cola FEMSA’s bottling facility in Toluca, Mexico, owned by its subsidiary, Propimex, S. de R.L. de C.V. (formerly Propimex, S.A. de C.V.), or Propimex, and to some of its suppliers of PET bottles. In 2010, GAMESA sold its interest in the Mexican subsidiary that owned the wind farm to Iberdrola Renovables México, S.A. de C.V. The wind farm generating such energy, which is located in La Ventosa, Oaxaca, is expected to generate approximately 100 thousand megawatt hours of energy annually. The energy supply services began in April 2010.
Central America
Coca-Cola FEMSA’s Central American operations are subject to several federal and state laws and regulations relating to the protection of the environment, which have been enacted in the last ten years, as awareness has increased in this region about the protection of the environment and the disposal of hazardous and toxic materials as well as water usage. Coca-Cola FEMSA’s Costa Rica and Panama operations have participated in a joint effort along with the local division of The Coca-Cola Company calledMisión Planeta (Mission Planet) for the collection and recycling of non-returnable plastic bottles.
Colombia
Coca-Cola FEMSA’s Colombian operations are subject to several Colombian federal, state and municipal laws and regulations related to the protection of the environment and the disposal of treated water and toxic and hazardous materials. These laws include the control of atmospheric emissions, noise emissions, disposal of treated water and strict limitations on the use of chlorofluorocarbons. For Coca-Cola FEMSA’s plants in Colombia, it has obtained theCertificación Ambiental Fase IV (Phase IV Environmental Certificate) demonstrating its compliance at the highest level with relevant Colombian regulations. Coca-Cola FEMSA is also engaged in nationwide reforestation programs, and national campaigns for the collection and recycling of glass and plastic bottles. In 2011, jointly with the FEMSA Foundation, Coca-Cola FEMSA was commended with the “Western Hemisphere Corporate Citizenship Award” for the social responsibility programs it carried out to respond to the extreme weather experienced in Colombia in 2010 and 2011, known locally as the “winter emergency.” In addition, Coca-Cola FEMSA also obtained the ISO 9001, ISO 22000, ISO 14001 and PAS 220 certifications for its plants located in Medellín, Cali, Bogotá, Barranquilla, Bucaramanga and La Calera, as recognition for the highest quality and food harmlessness in its production processes. These six plants joined a small group of companies that have obtained these certifications.
Venezuela
Coca-Cola FEMSA’s Venezuelan operations are subject to several Venezuelan federal, state and municipal laws and regulations related to the protection of the environment. The most relevant of these laws are theLey Orgánica del Ambiente (Organic Environmental Law), theLey Sobre Sustancias, Materiales y Desechos Peligrosos(Substance, Material and Dangerous Waste Law), theLey Penal del Ambiente (Criminal Environmental Law) and theLey de Aguas(Water Law). Since the enactment of the Organic Environmental Law in 1995, Coca-Cola FEMSA’s Venezuelan subsidiary has presented the proper authorities with plans to bring their production facilities and distribution centers into compliance with applicable laws, which mainly consist of building or expanding the capacity of water treatment plants in Coca-Cola FEMSA’s bottling facilities. Even though Coca-Cola FEMSA has had to adjust some of the originally proposed timelines due to construction delays, in 2009, Coca-Cola FEMSA completed the construction and received all the required permits to operate a new water treatment plant in its bottling facility located in the city of Barcelona. At the end of 2011, Coca-Cola FEMSA concluded the construction of a new water treatment plant in its bottling plant in the city of Valencia, which began operations in February 2012. During 2011, Coca-Cola FEMSA also commenced construction of a new water treatment plant in its Antimano bottling plant in Caracas, which construction was concluded during the second quarter of 2012. Coca-Cola FEMSA is also concluding the process of obtaining the necessary authorizations and licenses before it can begin the construction and expansion of its current water treatment plant in its bottling facility in Maracaibo. In December 2011, Coca-Cola FEMSA obtained the ISO 14000 certification for all of its plants in Venezuela.
In addition, in December 2010, the Venezuelan government approved theLey Integral de Gestión de la Basura (Comprehensive Waste Management Law), which regulates solid waste management and which may be applicable to manufacturers of products for mass consumption. The full scope of this law has not yet been established.
Brazil
Coca-Cola FEMSA’s Brazilian operations are subject to several federal, state and municipal laws and regulations related to the protection of the environment. Among the most relevant laws and regulations are those dealing with the emission of toxic and hazardous gases, disposal of wastewater and solid waste, and soil contamination by hazardous chemicals, which impose penalties, such as fines, facility closures or criminal charges depending upon the level of non-compliance.
Coca-Cola FEMSA’s production plant located in Jundiaí has been recognized by the Brazilian authorities for its compliance with environmental regulations and for having standards well above those imposed by the law. The plant has been certified for: (i) ISO 9001 since 1993; (ii) ISO 14001 since March 1997; (iii) norm OHSAS 18001 since 2005; (iv) ISO 22000 since 2007; and (v) PAS: 220 since 2010.
In Brazil it is also necessary to obtain concessions from the government to cast drainage. In December, 2010, Coca-Cola FEMSA increased the capacity of the water treatment plant in its Jundiaí facility. In 2012, Coca-Cola FEMSA’s production plants in Jundiaí and Mogi das Cruzes were certified in standard FSSC22000, and its plant located in Campo Grande is in the process of obtaining this certification as well.
In Brazil, a municipal regulation of the City of São Paulo, implemented pursuant to Law 13.316/2002, came into effect in May 2008. This regulation requires Coca-Cola FEMSA to collect for recycling a specified annual percentage of plastic bottles made from PET sold in the City of São Paulo; such percentage increases each year. Beginning in May 2011, Coca-Cola FEMSA was required to collect 90% of the PET bottles sold in the city of São Paulo for recycling. Currently, Coca-Cola FEMSA is not able to collect the entire required volume of PET bottles it has sold in the City of São Paulo for recycling. If Coca-Cola FEMSA does not meet the requirements of this regulation, which we believe to be more onerous than those imposed by the countries with the highest recycling standards, it could be fined and be subject to other sanctions, such as the suspension of operations in any of its plants and/or distribution centers located in the City of São Paulo. In May 2008, Coca-Cola FEMSA, together with other bottlers in the city of São Paulo, through theAssociação Brasileira das Indústrias de Refrigerantes e de Bebidas Não-alcoólicas (Brazilian Soft Drink and Non-Alcoholic Beverage Association, or ABIR), filed a motion requesting a court to overturn this regulation due to the impossibility of compliance. In addition, in November 2009, in response to a municipal authority request for Coca-Cola FEMSA to demonstrate the destination of the PET bottles sold by it in the City of São Paulo, Coca-Cola FEMSA filed a motion showing all of its recycling programs and requesting a more practical timeline to comply with the requirements of the law. In October 2010, the municipal authority of the City of São Paulo levied a fine on Coca-Cola FEMSA’s Brazilian operating subsidiary of 250,000 Brazilian reais (approximately Ps. 1,548,874 as of December 31, 2012) on the grounds that the report submitted by Coca-Cola FEMSA’s Brazilian operating subsidiary did not comply with the 75% proper disposal requirement for the period from May 2008 to May 2010. Coca-Cola FEMSA filed an appeal against this fine. In July 2012, the State Appellate Court of São Paulo rendered a decision admitting the interlocutory appeal filed on behalf of ABIR in order to suspend the fines and other sanctions to ABIR’s associated companies, including Coca-Cola FEMSA’s Brazilian subsidiary, for alleged noncompliance with the municipal regulation pending the final resolution of the lawsuit. Coca-Cola FEMSA is currently awaiting final resolution on both matters.
In August 2010, Law No. 12.305/2010 established the Brazilian National Solid Waste Policy. This policy is based on the principle of shared responsibility between the government, companies and the public, and provides for the post-consumption return of products to companies and requires public authorities to implement waste management programs. This law is regulated by Federal Decree No. 7.404/2010, and was published in December 2010. Coca-Cola FEMSA is currently discussing with the relevant authorities the impact this law may have on Brazilian companies in complying with the regulation in effect in the City of São Paulo. In response to the Brazilian National Solid Waste Policy, in December 2012, a proposal was provided to the Ministry of the Environment by almost 30 associations involved in the packaging sector, including ABIR in its capacity as representative for The Coca-Cola Company, Coca-Cola FEMSA’s Brazilian subsidiary, and other bottlers. The proposal involved creating a “coalition” to implement systems for reverse logistics packaging non-dangerous waste that makes up the dry portion of municipal solid waste or its equivalent. The goal of the proposal is to create methodologies for sustainable development, and protect the environment, society, and the economy. Coca-Cola FEMSA has not yet received a response from the Ministry of Environment.
Argentina
Coca-Cola FEMSA’s Argentine operations are subject to federal and municipal laws and regulations relating to the protection of the environment. The most significant of these are regulations concerning waste water discharge, which are enforced by theSecretaría de Ambiente y Desarrollo Sustentable(Ministry of Natural Resources and Sustainable Development) and theOrganismo Provincial para el Desarrollo Sostenible(Provincial Organization for Sustainable Development) for the province of Buenos Aires. Coca-Cola FEMSA’s Alcorta plant is in compliance with environmental standards and Coca-Cola FEMSA has been certified for ISO 14001:2004 for its plants and operative units in Buenos Aires.
For all of Coca-Cola FEMSA’s plant operations, it employs an environmental management system:Sistema de Administración Ambiental (Environmental Administration System, or EKOSYSTEM) that is contained withinSistema Integral de Calidad (Integral Quality System, or SICKOF).
Coca-Cola FEMSA has expended, and may be required to expend in the future, funds for compliance with and remediation under local environmental laws and regulations. Currently, we do not believe that such costs will have a material adverse effect on Coca-Cola FEMSA’s results or financial condition. However, since environmental laws and regulations and their enforcement are becoming increasingly more stringent in Coca-Cola FEMSA’s territories, and there is increased recognition by local authorities of the need for higher environmental standards in the countries where it operates, changes in current regulations may result in an increase in costs, which may have an adverse effect on Coca-Cola FEMSA’s future results or financial condition. Coca-Cola FEMSA’s management is not aware of any significant pending regulatory changes that would require a significant amount of additional remedial capital expenditures.
We do not believe that Coca-Cola FEMSA’s business activities pose a material risk to the environment, and we believe that Coca-Cola FEMSA is in material compliance with all applicable environmental laws and regulations.
Other regulations
In December 2009, the Venezuelan government issued a decree requiring a reduction in energy consumption by at least 20% for industrial companies whose consumption is greater than two megawatts per hour and to submit an energy-usage reduction plan. Some of Coca-Cola FEMSA’s bottling operations in Venezuela outside of Caracas met this threshold and it submitted a plan, which included the purchase of generators for its plants. In January 2010, the Venezuelan government subsequently implemented power cuts and other measures for all industries in Caracas whose consumption was above 35 kilowatts per hour.
In January 2010, the Venezuelan government amended theLey para la Defensa y Acceso a las Personas a los Bienes y Servicios (Defense of and Access to Goods and Services Law). Any violation by a company that produces, distributes and sells goods and services could lead to fines, penalties or the confiscation of the assets used to produce, distribute and sell these goods without compensation. Although we believe Coca-Cola FEMSA is in compliance with this law, consumer protection laws in Venezuela are subject to continuing review and changes, and any such changes could lead to an adverse impact on Coca-Cola FEMSA.
In July 2011, the Venezuelan government passed theLey de Costos y Precios Justos(Fair Costs and Prices Law). The purpose of this law is to establish the regulations and administrative processes necessary to maintain the price stability of, and equal access to, goods and services. The law also creates the National Ministry of Costs and Prices, whose main role is to oversee price controls and set maximum retail prices on certain consumer goods and services. Of Coca-Cola FEMSA’s products, only certain of its bottled water beverages were affected by these regulations, which mandated a lowering of its sale prices as of April 2012. Any failure to comply with this law would result in fines, temporary suspension or the closure of operations. While Coca-Cola FEMSA is currently in compliance with this law, we cannot assure you that the Venezuelan government’s future regulation of goods and services will not result in a forced reduction of prices in respect of certain of Coca-Cola FEMSA’s other products, which could have a negative effect on its results.
In May 2012, the Venezuelan government adopted significant changes to its labor regulations. This amendment to Venezuela’s labor regulations could have a negative impact on Coca-Cola FEMSA’s business and operations. The principal changes that impact Coca-Cola FEMSA’s operations are: (i) the requirement that employee terminations are now subject to governmental authorization; (ii) retroactive assessments for any modifications to Coca-Cola FEMSA’s severance payment system; (iii) the reduction of the maximum daily and weekly work hours (from 44 to 40 weekly); and (iv) the increase in obligatory weekly breaks, prohibiting any corresponding reduction in salaries.
In November, 2012, the government of the Province of Buenos Aires, Argentina, adopted Law No. 14,394, which increased the tax rate applied to product sales within the Province of Buenos Aires. If the products are manufactured in plants located in the territory of the Province of Buenos Aires, Law No. 14,394 increases the tax rate from 1% to 1.75%; if the products are manufactured in any other Argentine province, the law increases the tax rate from 3% to 4%.
In January 2012, the Costa Rican government approved a decree that regulates the sale of food and beverages in schools. The decree came into effect in 2012. Enforcement of this law will be gradual, from 2012 to 2014, depending on the specific characteristics of the food or beverage in question. According to the decree, the sale of specific sparkling beverages and still beverages that contain sugar, syrup or HFCS in any type of presentation in schools is prohibited. Coca-Cola FEMSA will still be allowed to sell water and certain still beverages in schools. We cannot assure you that the Costa Rican government will not further restrict sales of other of Coca-Cola FEMSA’s products in schools in the future; any such further restrictions could lead to an adverse impact on Coca-Cola FEMSA’s results.
In December 2012, the Cost Rican government repealed Article 61 of theirCódigo Fiscal(Fiscal Code), which had allowed Costa Rican subsidiaries to follow certain specified procedures to prevent tax withholdings on dividends paid to parent companies.
Water Supply
In Mexico, Coca-Cola FEMSA obtains water directly from municipal utility companies and pumps water from its own wells pursuant to concessions obtained from the Mexican government on a plant-by-plant basis. Water use in Mexico is regulated primarily by the 1992 Water Law, and regulations issued thereunder, which created the National Water Commission. The National Water Commission is in charge of overseeing the national system of water use. Under the 1992 Water Law, concessions for the use of a specific volume of ground or surface water generally run from five- to fifty-year terms, depending on the supply of groundwater in each region as projected by the National Water Commission. Concessionaires may request that concession terms be extended before they expire. The Mexican government is authorized to reduce the volume of ground or surface water granted for use by a concession by whatever volume of water is not used by the concessionaire for two consecutive years. However, because the current concessions for each of Coca-Cola FEMSA’s plants in Mexico do not match each plant’s projected needs for water in future years, we successfully negotiated with the Mexican government the right to transfer the unused volume under concessions from certain plants to other plants anticipating greater water usage in the future. These concessions may be terminated if, among other things, we use more water than permitted or we fail to pay required concession-related fees and do not cure such situations in a timely manner.
Although we have not undertaken independent studies to confirm the sufficiency of the existing groundwater supply, we believe that our existing concessions satisfy our current water requirements in Mexico.
In Argentina, a state water company provides water to Coca-Cola FEMSA’s Alcorta plant on a limited basis; however, we believe the authorized amount meets Coca-Cola FEMSA’s requirements for this plant. In Coca-Cola FEMSA’s Monte Grande plant in Argentina, it pumps water from its own wells, in accordance with Law 25.688.
In Brazil, Coca-Cola FEMSA buys water directly from municipal utility companies and we also capture water from underground sources, wells or surface sources (i.e., rivers), pursuant to concessions granted by the Brazilian government for each plant. According to the Brazilian Constitution, water is considered an asset of common use and can only be exploited for the national interest by Brazilians or companies formed under Brazilian law. Concessionaires and users have the responsibility for any damage to the environment. The exploitation and use of water is regulated by theCódigo de Mineração (Code of Mining, Decree Law No. 227/67), theCódigo de Águas Minerais (Mineral Water Code, Decree Law No. 7841/45), the National Water Resources Policy (Law No. 9433/97) and by regulations issued thereunder. The companies that exploit water are supervised by theDepartamento Nacional de Produção Mineiral—DNPM (National Department of Mineral Production) and the National Water Agency in connection with federal health agencies, as well as state and municipal authorities. In Coca-Cola FEMSA’s Jundiaí and Belo Horizonte plants, we do not exploit mineral water. In the Mogi das Cruzes and Campo Grande plants, we have all the necessary permits for the exploitation of mineral water.
In Colombia, in addition to natural spring water, Coca-Cola FEMSA obtains water directly from its own wells and from utility companies. Coca-Cola FEMSA is required to have a specific concession to exploit water from natural sources. Water use in Colombia is regulated by Law No. 9 of 1979 and Decrees No. 1594 of 1984 and No. 2811 of 1974. In addition, on February 6, 2012, Colombia promulgated Decree No. 303, which requires Coca-Cola FEMSA to apply for water concessions and for authorization to discharge its water into public waterways. The National Institute of National Resources supervises companies that use water as a raw material for their business.
In Nicaragua, the use of water is regulated by theLey General de Aguas Nacionales (National Water Law), and Coca-Cola FEMSA obtains water directly from its own wells. In Costa Rica, the use of water is regulated by theLey de Aguas (Water Law). In both of these countries, Coca-Cola FEMSA owns and exploits its own water wells granted to it through governmental concessions. In Guatemala, no license or permits are required to exploit water from the private wells in Coca-Cola FEMSA’s own plants. In Panama, Coca-Cola FEMSA acquires water from a state water company, and the use of water is regulated by theReglamento de Uso de Aguas de Panamá(Panama Use of Water Regulation). In Venezuela, Coca-Cola FEMSA uses private wells in addition to water provided by the municipalities, and it has taken the appropriate actions, including actions to comply with water regulations, to have water supply available from these sources, regulated by theLey de Aguas (Water Law).
We cannot assure you that water will be available in sufficient quantities to meet our future production needs, that we will be able to maintain our current concessions or that additional regulations relating to water use will not be adopted in the future in our territories. We believe that we are in material compliance with the terms of our existing water concessions and that we are in compliance with all relevant water regulations.
| ITEM 4A. | UNRESOLVED STAFF COMMENTS |
None.
| ITEM 5. | OPERATING AND FINANCIAL REVIEW AND PROSPECTS |
The following discussion should be read in conjunction with, and is entirely qualified by reference to, our audited consolidated financial statements and the notes to those financial statements. Our consolidated financial statements were prepared in accordance with IFRS as issued by the IASB.
Overview of Events, Trends and Uncertainties
Management currently considers the following events, trends and uncertainties to be important to understanding its results and financial position during the periods discussed in this section:
| • | Coca-Cola FEMSA continues growing organic volumes at a steady but moderate pace, and additionally integrated Grupo Tampico, Grupo CIMSA and Grupo Fomento Queretano in its Mexican operations. Volume growth was mainly driven by theCoca-Cola brand, together with the performance of Coca-Cola FEMSA’s still beverage portfolio. |
FEMSA Comercio has maintained high rates of OXXO store openings and continues to grow in terms of total revenues. FEMSA Comercio has lower operating margins than our beverage business. Given that FEMSA Comercio has lower operating margins and given its fixed cost structure, it is more sensitive to changes in sales which could negatively affect operating margins.
Our results and financial position are affected by the economic and market conditions in the countries where our subsidiaries conduct their operations, particularly in Mexico. Changes in these conditions are influenced by a number of factors, including those discussed in“Item 3. Key Information—Risk Factors.”
In November 2012, through FEMSA Comercio, we agreed to acquire a 75% stake in Farmacias YZA, a leading drugstore operator in Southeast Mexico, with the current shareholders staying as partners with the remaining 25%. Farmacias YZA, headquartered in Merida, Yucatan, operated 333 stores as of the date of the agreement. We believe we can contribute our significant expertise in the development of small-box retail formats to what is already a successful regional player in this industry. In turn, this transaction opens a new avenue for growth for FEMSA Comercio. The transaction is pending customary regulatory approvals and is expected to close in the second quarter of 2013.
In December 2012, Coca-Cola FEMSA reached an agreement with The Coca-Cola Company to acquire a 51% non-controlling majority stake of CCBPI for US $688.5 million in an all-cash transaction. Coca-Cola FEMSA closed this transaction on January 25, 2013. The implied enterprise value of 100% of CCBPI is US$ 1,350 million. Coca-Cola FEMSA will have an option to acquire all of the remaining 49% of the capital stock of CCBPI at any time during the seven years following the closing, at the same enterprise value adjusted for a carrying cost and certain other adjustments. Coca-Cola FEMSA will have a put option, exercisable six years after the initial closing, to sell its ownership in CCBPI back to The Coca-Cola Company at a price that will be calculated using the same EBITDA multiple used in the acquisition of the 51% stake of CCBPI, capped at the aggregate enterprise value for the amount acquired, adjusted for certain items. Coca-Cola FEMSA will be managing the day-to-day operations of the business. The Coca-Cola Company will have certain rights on the operational business plan. Given the terms of both the options agreement and Coca-Cola FEMSA’s shareholders agreement with The Coca-Cola Company, Coca-Cola FEMSA will not consolidate the results of CCBPI. Coca-Cola FEMSA will recognize the results of CCBPI using the equity method.
In January 2013, Coca-Cola FEMSA entered into an agreement to merge Grupo Yoli into its company. Grupo Yoli operates in Mexico, mainly in the state of Guerrero, Mexico, as well as in parts of the state of Oaxaca, Mexico. The merger agreement was approved by both Coca-Cola FEMSA and Grupo Yoli’s boards of directors and is subject to the approval of the CFC and the shareholders’ meetings of both companies. The aggregate enterprise value of this transaction was Ps. 8,806 million. Coca-Cola FEMSA will issue approximately 42.4 million new series “L” shares to the shareholders of Grupo Yoli once the transaction closes. As part of this transaction, Coca-Cola FEMSA will increase its participation in Piasa by 9.5%. Coca-Cola FEMSA expects to close this transaction in the second quarter of 2013.
Effects of Changes in Economic Conditions
Our results are affected by changes in economic conditions in Mexico and in the other countries in which we operate. For the years ended December 31, 2012, and 2011, 62%, and 61%, respectively, of our total sales were attributable to Mexico. As a result, we have significant exposure to the economic conditions of certain countries, particularly those in Central America, Colombia, Venezuela, Brazil and Argentina, although we continue to generate a substantial portion of our total sales from Mexico. The participation of these other countries as a percentage of our total sales has not changed significantly during the last five years and total sales are expected to increase in future periods due to acquisitions.
The Mexican economy is gradually recovering from a downturn as a result of the impact of the global financial crisis on many emerging economies in 2009. According to INEGI, in both 2012 and 2011 Mexican GDP expanded by approximately 3.9%. According to the Banco Nacional de México survey regarding the economic expectations of specialists, Mexican GDP is expected to increase by 3.54% in 2013, as of the latest estimate, published on March 1, 2013. The Mexican economy continues to be heavily influenced by the U.S. economy, and therefore, further deterioration in economic conditions in, or delays in the recovery of, the U.S. economy may hinder any recovery in Mexico.
Our future results may be significantly affected by the general economic and financial conditions in the countries where we operate, including by levels of economic growth, by the devaluation of the local currency, by inflation and high interest rates or by political developments, and may result in lower demand for our products, lower real pricing or a shift to lower margin products. Because a large percentage of our costs are fixed costs, we may not be able to reduce such costs and expenses, and our profit margins may suffer as a result of downturns in the economy of each country.
Beginning in the fourth quarter of 2010 and through 2012, the exchange rate between the Mexican peso and the U.S. dollar fluctuated from a low of Ps. 11.51 per U.S. dollar, to a high of Ps. 14.37 per U.S. dollar. At December 31, 2012, the exchange rate (noon buying rate) was Ps. 12.9635 to US$ 1.00. On March 31, 2013, the exchange rate was Ps. 12.3155 to US$ 1.00.See “Item 3. Key Information—Exchange Rate Information.” A depreciation of the Mexican peso or local currencies in the countries in which we operate relative to the U.S. dollar increases our cost of raw materials priced in U.S. dollars, including raw materials whose prices are set with reference to the U.S. dollar. In addition, a depreciation of the Mexican peso or local currencies in the countries in which we operate relative to the U.S. dollar will increase our U.S. dollar-denominated debt obligations, which could negatively affect our financial position and results. However, this effect could be offset by a corresponding appreciation of our U.S. dollar denominated cash position.
Companies with structural characteristics that result in margin expansion in excess of sales growth are referred to as having high “operating leverage.”
The operating subsidiaries of Coca-Cola FEMSA are engaged, to varying degrees, in capital-intensive activities. The high utilization of the installed capacity of the production facilities results in better fixed cost absorption, as increased output results in higher revenues without additional fixed costs. Absent significant increases in variable costs, gross profit margins will expand when production facilities are operated at higher utilization rates. Alternatively, higher fixed costs will result in lower gross profit margins in periods of lower output.
In addition, the commercial operations of Coca-Cola FEMSA are carried out through extensive distribution networks, the principal fixed assets of which are warehouses and trucks and are designed to handle large volumes of beverages. Fixed costs represent an important proportion of the total distribution expense of Coca-Cola FEMSA. Generally, the higher the volume that passes through the distribution system, the lower the fixed distribution cost as a percentage of the corresponding revenues. As a result, operating margins improve when the distribution capacity is operated at higher utilization rates. Alternatively, periods of decreased utilization because of lower volumes will negatively affect our operating margins.
FEMSA Comercio operations result in a low margin business with relatively fixed costs. These two characteristics make FEMSA Comercio a business with an operating margin that might be affected more easily by a change in sales levels.
Critical Accounting Judgments and Estimates
In the application of our accounting policies, which are described in Note 3 to our audited consolidated financial statements, management is required to make judgments, estimates and assumptions about the carrying amounts of assets and liabilities that are not readily apparent from other sources. The estimates and associated assumptions are based on historical experience and other factors that are considered to be relevant. Actual results may differ from these estimates. The estimates and underlying assumptions are reviewed on an ongoing basis. Revisions to accounting estimates are recognized in the period in which the estimate is revised if the revision affects only that period or in the period of the revision and future periods if the revision affects both current and future periods.
The following are the key assumptions concerning the future and other key sources of estimation uncertainty at the end of the reporting period that have a significant risk of causing a material adjustment to the carrying amounts of assets and liabilities within the next financial year. Existing circumstances and assumptions about future developments, however, may change due to market changes or circumstances arising beyond our control. Such changes are reflected in the assumptions when they occur.
Impairment of indefinite lived intangible assets, goodwill and depreciable long-lived assets
Intangible assets with indefinite lives including goodwill are subject to annual impairment tests. An impairment exists when the carrying value of an asset or cash generating unit (“CGU”) exceeds its recoverable amount, which is the higher of its fair value less costs to sell or its value in use. The fair value less costs to sell calculation is based on available data from binding sales transactions in arm’s length transactions of similar assets or observable market prices less incremental costs for disposing of the asset. In order to determine whether such assets are impaired, we initially calculate an estimation of the value in use of the cash generating units to which such assets have been allocated. The value in use calculation requires management to estimate the future cash flows expected to arise from the cash-generating unit and a suitable discount rate in order to calculate present value. We review annually the carrying value of our intangible assets with indefinite lives and goodwill for impairment based on recognized valuation techniques. While we believe that our estimates are reasonable, different assumptions regarding such estimates could materially affect our evaluations. Impairment losses are recognized in current earnings in the period the related impairment is determined.
We assess at each reporting date whether there is an indication that a depreciable long lived asset may be impaired. If any indication exists, or when annual impairment testing for an asset is required, we estimate the asset’s recoverable amount. When the carrying amount of an asset or CGU exceeds its recoverable amount, the asset is considered impaired and is written down to its recoverable amount. In assessing value in use, the estimated future cash flows are discounted to their present value using a pre-tax discount rate that reflects current market assessments of the time value of money and the risks specific to the asset. In determining fair value less costs to sell, recent market transactions are taken into account, if available. If no such transactions can be identified, an appropriate valuation model is used. These calculations are corroborated by valuation multiples, quoted share prices for publicly traded subsidiaries or other available fair value indicators. The key assumptions used to determine the recoverable amount for our CGUs, including a sensitivity analysis, are further explained in Notes 3.15 and 12 to our audited consolidated financial statements.
Useful lives of property, plant and equipment and intangible assets with defined useful lives
Property, plant and equipment, including returnable bottles as they are expected to provide benefits over a period of more than one year, as well as intangible assets with defined useful lives, are depreciated/amortized over their estimated useful lives. We base our estimates on the experience of our technical personnel as well as on our experience in the industry for similar assets; see Notes 3.11, 3.13, 11 and 12 to our audited consolidated financial statements.
Post-employment and other long-term employee benefits
We annually evaluate the reasonableness of the assumptions used in our post-employment and other long-term employee benefit computations. Information about such assumptions is described in Note 16.1 to our audited consolidated financial statements.
Income taxes
Deferred tax assets and liabilities are determined based on the differences between the financial statement carrying amounts and the tax basis of assets and liabilities. For our particular Mexican subsidiaries, we recognize deferred income taxes, based on our financial projections depending on whether we expect to incur the regular income tax (“ISR”) or the business flat tax (“IETU”) in the future. Additionally, we regularly review our deferred tax assets for recoverability, and record a deferred tax asset based on our judgment regarding the probability of historical taxable income, projected future taxable income and the expected timing of the reversals of existing temporary differences; see Note 24 to our audited consolidated financial statements.
Tax, labor and legal contingencies and provisions
We are subject to various claims and contingencies on a range of matters including, among others, tax, labor and legal proceedings as described in Note 25 to our audited consolidated financial statements. Due to their nature, such legal proceedings involve inherent uncertainties including, but not limited to, court rulings, negotiations between affected parties and governmental actions. Management periodically assesses the probability of loss for such contingencies and accrues a provision and/or discloses the relevant circumstances, as appropriate. If the potential loss of any claim or legal proceeding is considered probable and the amount can be reasonably estimated, we accrue a provision for the estimated loss. Management’s judgment must be exercised to determine the likelihood of such a loss and an estimate of the amount, due to the subjective nature of the loss.
Valuation of financial instruments
We are required to measure all derivative financial instruments at fair value. The fair values of derivative financial instruments are determined considering quoted prices in recognized markets. If such instruments are not traded, fair value is determined by applying techniques based upon technical models supported by sufficient reliable and verifiable data, recognized in the financial sector. We base our forward price curves upon market price quotations. Management believes that the chosen valuation techniques and assumptions used are appropriate in determining the fair value of financial instruments; see Note 20 to our audited consolidated financial statements.
Business combinations
Acquisitions of businesses are accounted for using the acquisition method. The consideration transferred in a business combination is measured at fair value, which is calculated as the sum of the acquisition-date fair values of the assets transferred by us, liabilities assumed by us to the former owners of the acquiree and the equity interests issued by us in exchange for control of the acquiree.
At the acquisition date, the identifiable assets acquired and the liabilities assumed are recognized at their fair value, except that:
| • | Deferred tax assets or liabilities, and assets or liabilities related to employee benefit arrangements are recognized and measured in accordance with IAS 12, “Income Taxes” (which we refer to as IAS 12) and IAS 19, “Employee Benefits” (which we refer to as IAS 19), respectively; |
| • | Liabilities or equity instruments related to share-based payment arrangements of the acquiree or to our share-based payment arrangements entered into to replace share-based payment arrangements of the acquiree are measured in accordance with IFRS 2,Share-based Payment at the acquisition date, see Note 3.23 to our audited consolidated financial statements; and |
| • | Assets (or disposal groups) that are classified as held for sale in accordance with IFRS 5,Non-current Assets Held for Sale and Discontinued Operations are measured in accordance with that Standard. |
Management’s judgment must be exercised to determine the fair value of assets acquired and liabilities assumed.
Goodwill is measured as the excess of the sum of the consideration transferred, the amount of any non-controlling interests in the acquiree, and the fair value of our previously held equity interest in the acquiree (if any) over the net of the acquisition date amounts of the identifiable assets acquired and the liabilities assumed. If, after reassessment, the net of the acquisition date amounts of the identifiable assets acquired and liabilities assumed exceeds the sum of the consideration transferred, the amount of any non-controlling interests in the acquiree and the fair value of our previously held interest in the acquiree (if any), the excess is recognized immediately in profit or loss as a bargain purchase gain.
For each business combination, we elect whether we measure the non-controlling interest in the acquiree either at fair value or at the proportionate share of the acquiree’s identifiable net assets.
Investments in Associates
If we hold, directly or indirectly, 20% or more of the voting power of the investee, it is presumed that we have significant influence, unless it can be clearly demonstrated that this is not the case. If we hold, directly or indirectly, less than 20% of the incremental volumesvoting power of the investee, it is presumed that we do not have significant influence, unless such influence can be clearly demonstrated. Decisions regarding the propriety of utilizing the equity method of accounting for a less than 20%-owned corporate investee require a careful evaluation of voting rights and their impact on our ability to exercise significant influence. Management considers the existence of the following circumstances which may indicate that we are in a position to exercise significant influence over a less than 20 per cent-owned corporate investee:
Representation on the board of directors or equivalent governing body of the investee;
Participation in policy-making processes, including participation in decisions about dividends or other distributions;
Material transactions between us and the bottled water category representedinvestee;
Interchange of managerial personnel; or
Provision of essential technical information.
Management also considers whether the balance. Excludingexistence and effect of potential voting rights that are currently exercisable or currently convertible should also be considered when assessing whether we have significant influence. In addition, we evaluate the acquisitionsfollowing indicators that provide evidence of Brisa, total sales volume increased 2.1%significant influence:
Extent of our ownership is significant relative to reach 2,479.6 million unit cases.other shareholdings (i.e. a lack of concentration of other shareholders);
Gross Profit
Cost of sales increased 1.1% to Ps. 55,534 million in 2010 compared to Ps. 54,952 million in 2009, as a result of increasesOur significant stockholders, our parent, fellow subsidiaries, or our officers, hold additional investment in the costinvestee; and
We are part of sweetenerssignificant investee committees, such as the executive committee or the finance committee.
As described in Note 2 to our audited consolidated financial statements, we adopted IFRS for the preparation of our operations, which were partially offset by the appreciation of the Brazilian real, the Colombian peso and the Mexican peso as appliedfinancial information beginning in 2012. Pursuant to Coca-Cola FEMSA’scurrent SEC reporting requirements, foreign private issuers may provide in their SEC filings financial statements prepared in accordance with IFRS, without a reconciliation to U.S. dollar-denominated raw material costs. Gross profit increased 0.2% to Ps. 47,922 million in 2010, as compared to 2009, despite the devaluation of the Venezuelan bolivar; Coca-Cola FEMSA’s gross margin decreased 0.2 percentage points to 46.3% in 2010.GAAP.
Operating Expenses
Operating expenses decreased 3.6% to Ps. 30,843 million in 2010. As a percentage of sales, operating expenses decreased to 29.8% in 2010 from 31.1% in 2009.
Income from Operations
Income from operations increased 7.9% to Ps. 17,079 million in 2010, as compared to Ps. 15,835 million in 2009 driven by Coca-Cola FEMSA’s Mercosur and Latincentro divisions. Operating margin was 16.5% in 2010, an expansion of 1.1 percentage points as compared to 2009.
FEMSA Comercio
Total Revenues
FEMSA Comercio total revenues increased 16.3% to Ps. 62,259 million in 2010 compared to Ps. 53,549 million in 2009, primarily as a result of the opening of 1,092 net new stores during 2010, combined with an average increase of same-store sales of 5.2%. As of December 31, 2010, there were a total of 8,409 stores in Mexico and 17 stores in Colombia. FEMSA Comercio same-store sales increased an average of 5.2% compared to 2009, driven by a 3.9% increase in store traffic and 1.3% in average ticket. As was the case in 2009, the same-store sales, ticket and traffic dynamics continued to reflect the effects from the continued mix shift from physical prepaid wireless air-time cards to the sale of electronic air-time, for which only the margin is recorded, rather than the full amount of the electronic recharge.
Gross Profit
Cost of sales increased 15.1% to Ps. 41,220 million in 2010, below total revenue growth, compared with Ps. 35,825 million in 2009. As a result, gross profit reached Ps. 21,039 million in 2010, which represented an 18.7% increase from 2009. Gross margin expanded 0.7 percentage points to reach 33.8% of total revenues. This increase reflects a positive mix shift due to (i) the growth of higher margin categories, (ii) a more effective collaboration and execution with FEMSA Comercio’s key supplier partners combined with a more efficient use of promotion-related marketing resources, and (iii) to a lesser extent, the continued mix shift towards electronic air-time recharges as described above.
Income from Operations
Operating expenses increased 19.4% to Ps. 15,839 million in 2010 compared with Ps. 13,267 million in 2009, largely driven by the growing number of stores as well as by incremental expenses such as (i) higher utility tariffs at the store level and (ii) the strengthening of FEMSA Comercio’s organizational structure, mainly IT-related, which was deferred in 2009 in response to the challenging economic environment that prevailed in Mexico at the time.
Administrative expenses increased 23.7% to Ps. 1,186 million in 2010, compared with Ps. 959 million in 2009, however, as a percentage of sales remained stable at 1.9%.
Selling expenses increased 19.1% to Ps. 14,653 in 2010 compared with Ps. 12,308 million in 2009. Income from operations increased 16.7% to Ps. 5,200 million in 2010 compared with Ps. 4,457 million in 2009, resulting in an operating margin expansion of 10 basis points to 8.4% as a percentage of total revenuesThe consolidated financial statements we issued for the year comparedended December 31, 2012 were our first annual financial statements that complied with 8.3% in 2009.
FEMSA Consolidated—Net Income
Other Expenses
Other expenses include employee profit sharing, whichIFRS. Our IFRS transition date was January 1, 2011, and therefore, the year ended December 31, 2011 was the comparative period to be covered. IFRS 1, “First-Time Adoption of International Financial Reporting Standards” (which we refer to as PTU, impairmentIFRS 1), sets forth mandatory exceptions and allows certain optional exemptions to the complete retrospective application of long-lived assets, contingencies,IFRS; see Note 27 to our audited consolidated financial statements;
Mandatory Exceptions
We have applied the following mandatory exceptions to retrospective application of IFRS, effective as of our IFRS transition date:
Derecognition of Financial Assets and Liabilities:
We applied the derecognition rules of IAS 39,Financial Instruments: Recognition and Measurementprospectively for transactions occurring on or after the date of transition. As a result, there was no impact in our consolidated financial statements due to the application of this exception.
Hedge Accounting:
We measured at fair value all derivative financial instruments and hedging relationships designated and documented effectively as accounting hedges as required by IAS 39 as of the transition date. As a result, there was no impact in our consolidated financial statements due to the application of this exception.
Non-controlling Interest:
We applied the requirements in IAS 27, Consolidated and Separate Financial Statements related to non-controlling interests prospectively beginning on the transition date. As a result, there was no impact in our consolidated financial statements due to the application of this exception.
Accounting Estimates:
Estimates prepared under IFRS as of January 1, 2011 are consistent with the estimates recognized under Mexican FRS as of the same date.
Optional Exemptions
We have elected the following optional exemptions to retrospective application of IFRS, effective as of our IFRS transition date:
Business Combinations and Acquisitions of Associates and Joint Ventures
We elected not to apply IFRS 3Business Combinations, to business combinations as well as to acquisitions of associates and joint ventures prior to our transition date.
Deemed Cost
An entity may elect to measure an item or all of property, plant and equipment at the Transition date at its fair value and use that fair value as its deemed cost at that date. In addition, a first-time adopter may elect to use a previous GAAP’s revaluation of an item of property, plant and equipment at, or before, the Transition date as deemed cost at the date of the revaluation, if the revaluation was, at the date of the revaluation, broadly comparable to (i) fair value; or (ii) cost or depreciated cost in accordance with IFRS, adjusted to reflect changes in a general or specific price index.
We have presented our property, plant and equipment and our intangible assets at IFRS historical costs in all countries.
In Mexico, we ceased to record inflationary adjustments to our property, plant and equipment on December 31, 2007, due to both changes in Mexican FRS in effect at that time, and the fact that the Mexican peso was not deemed to be a currency of an inflationary economy as of that date. According to IAS 29Financial Reporting in Hyperinflationary Economies, the last hyperinflationary period for the Mexican peso was in 1998. As a result, we eliminated the cumulative inflation recognized within long-lived assets for our Mexican operations, based on Mexican FRS for the years 1999 through 2007, which were not deemed hyperinflationary for IFRS purposes.
In Venezuela, this IFRS historical cost represents actual historical cost in the year of acquisition, indexed for inflation in a hyperinflationary economy based on the provisions of IAS 29.
Cumulative Translation Effect
We applied the exemption to not recalculate retroactively the translation differences in the financial statements of foreign operations; accordingly, at the transition date, we reclassified the cumulative translation effect to retained earnings.
The application of this exemption is detailed in Note 27.3 (h) to our audited consolidated financial statements.
Borrowing Costs
We began capitalizing our borrowing costs at the transition date in accordance with IAS 23,Borrowing Costs. The borrowing costs included previously under Mexican FRS were subject to the deemed cost exemption mentioned above.
Future Impact of Recently Issued Accounting Standards not yet in Effect
We have not early adopted the following new and revised IFRS, which were not yet effective as of December 31, 2012:
IFRS 9, Financial Instruments, issued in November 2009 and amended in October 2010, introduces new requirements for the classification and measurement of financial assets and financial liabilities and for derecognition. The standard requires all recognized financial assets that are within the scope of IAS 39 to be subsequently measured at amortized cost or fair value. Specifically, debt investments that are held within a business model whose objective is to collect the contractual cash flows, and that have contractual cash flows that are solely payments of principal and interest on the principal outstanding, are generally measured at amortized cost at the end of subsequent accounting periods. All other debt investments and equity investments are measured at their fair values at the end of subsequent interestaccounting periods. The most significant effect of IFRS 9 regarding the classification and penalties, severance payments derived from restructuring programsmeasurement of financial liabilities relates to the accounting for changes in fair value of a financial liability (designated as at FVTPL) attributable to changes in the credit risk of that liability. Specifically, under IFRS 9, for financial liabilities that are designated as at FVTPL, the amount of change in the fair value of the financial liability that is attributable to changes in the credit risk of that liability is recognized in other comprehensive income, unless the recognition of the effects of changes in the liability’s credit risk in other comprehensive income would create or enlarge an accounting mismatch in profit or loss. Changes in fair value attributable to a financial liability’s credit risk are not subsequently reclassified to profit or loss. Previously, under IAS 39, the entire amount of the change in the fair value of the financial liability designated as at FVTPL was recognized in profit or loss. We have not early adopted this standard. We have yet to complete our evaluation of whether this standard will have a material impact on our consolidated financial statements.
In May and June, 2011, the IASB issued new standards and amended some existing standards including requirements of accounting and presentation for particular topics that have not yet been applied in these consolidated financial statements. A summary of those changes and amendments includes the following:
IAS 28, “Investments in Associates and Joint Ventures” (2011) (which we refer to as IAS 28) prescribes the accounting for investments in associates and establishes the requirements to apply the equity method for those investments in associates and in joint ventures. The standard is applicable to all entities with joint control of, or significant influence over, an investee. This standard supersedes the previous version of IAS 28, Investments in Associates. The effective date of IAS 28 (2011) is January 1, 2013, with early application permitted, but it must be applied in conjunction with IFRS 10, IFRS 11 and IFRS 12. This standard has not been early adopted by us. We have yet to complete our evaluation, of whether this standard will have a material impact on our consolidated financial statements.
IFRS 10, Consolidated Financial Statements, establishes the principles for the presentation and preparation of consolidated financial statements when an entity controls one or more entities. The standard requires the controlling company to present its consolidated financial statements; modifies the definition about the principle of control, establishes such definition as the basis for consolidation; and establishes how to apply the principle of control to identify if an investment is subject to consolidation. The standard replaces IAS 27, Consolidated and Separate Financial Statements and SIC 12, Consolidation – Special Purpose Entities. The effective date of IFRS 10 is January 1, 2013, with early application permitted, but it must be applied in conjunction with IAS 28 (2011), IFRS 11 and IFRS 12. This standard has not been early adopted by us. We have yet to complete our evaluation of whether this standard will have a material impact on our consolidated financial statements.
IFRS 11, Joint Arrangements, classifies joint arrangements as either joint operations (combining the existing concepts of jointly controlled assets and jointly controlled operations) or joint ventures (equivalent to the existing concept of a jointly controlled entity). Joint operation is a joint arrangement whereby the parties that have joint control have rights to the assets and obligations for the liabilities. Joint venture is a joint arrangement whereby the parties that have joint control of the arrangement have rights to the net assets of the arrangement. IFRS 11 requires the use of the equity method of accounting for interests in joint ventures thereby eliminating the proportionate consolidation method. The determination of whether a joint arrangement is a joint operation or a joint venture is based on the parties’ rights and obligations under the arrangement, with the existence of a separate legal vehicle no longer being the key factor. The effective date of IFRS 11 is January 1, 2013, with early application permitted, but it must be applied in conjunction with IAS 28 (2011), IFRS 10 and IFRS 12. This standard has not been early adopted by us. We have yet to complete our evaluation of whether this standard will have a material impact on our consolidated financial statements.
IFRS 12, Disclosure of Interests in Other Entities, has the objective to require the disclosure of information to allow the users of financial information to evaluate the nature and risk associated with their interests in other non-recurring expenses relatedentities, and the effects of such interests on their financial position, financial performance and cash flows. The effective date of IFRS 12 is January 1, 2013, with early application permitted in certain circumstances, but it must be applied in conjunction with IAS 28 (2011), IFRS 10 and IFRS 11. This standard has not been early adopted by us. We have yet to activities differentcomplete our evaluation of whether this standard will have a material impact on our consolidated financial statements.
IFRS 13, Fair Value Measurement, establishes a single framework for measuring fair value where that is required by other standards. The standard applies to both financial and non-financial items measured at fair value. Fair value is defined as “the price that would be received to sell an asset or paid to transfer a liability in an orderly transaction between market participants at the measurement date.” IFRS 13 is effective for annual periods beginning on or after January 1, 2013, with early adoption permitted, and applies prospectively from the main activitiesbeginning of the Companyannual period in which the standard is adopted. This standard has not been early adopted by us. We have yet to complete our evaluation of whether this standard will have a material impact on our consolidated financial statements.
Amendments to IAS 32, Financial Instruments: Presentation, and thatIFRS 7, Financial Instruments: Disclosures, as it relates to offsetting financial assets and financial liabilities and the related disclosures. The amendments to IAS 32 clarify existing application issues relating to the offsetting requirements. Specifically, the amendments clarify the meaning of ‘currently has a legally enforceable right of set-off’ and ‘simultaneous realization and settlement’. The amendments to IAS 32 are effective for annual periods beginning on or after January 1, 2014, with retrospective application required. The amendments to IFRS 7 require entities to disclose information about rights of offset and related arrangements (such as collateral posting requirements) for financial instruments under an enforceable master netting agreement or similar arrangement. The amendments to IFRS 7 are required for annual periods beginning on or after January 1, 2013 and interim periods within those annual periods. The disclosures should be provided retrospectively for all comparative periods. This standard has not recognized as partbeen early adopted by us. We have yet to complete our evaluation of the comprehensive financing result. During 2010, other expenses contracted to Ps. 282 million from Ps. 1,877 million in 2009.
Comprehensive Financing Result
Comprehensive financing result decreased 18.0% in 2010 to Ps. 2,153 million, reflecting an improvement over the low comparison base of 2009, driven by lower interest expenses.
Income Taxes
Our accounting provision for income taxes in 2010 was Ps. 5,671 million compared to Ps. 4,959 million in 2009, resulting in an effective tax rate of 24.0% in 2010 as compared with 29.6% in 2009 as the inclusion of the participation in Heineken’s 2010 net income is shown net of taxes.
Consolidated Net Income before Discontinued Operations
Net income from continuing operations increased 52.2% to Ps. 17,961 million in 2010 compared to Ps. 11,799 million in 2009. These results were driven by the combination of (i) the inclusion of FEMSA’s 20% participation in the last eight months of Heineken’s 2010 net income, (ii) growth in income from operations, and (iii)whether this standard will have a reduction in the other expenses line.material impact on our consolidated financial statements.
Consolidated Net IncomeOperating Results
NetThe following table sets forth our consolidated income reached Ps. 45,290 million in 2010 compared to Ps. 15,082 million in 2009, drivenstatement under IFRS for the years ended December 31, 2012, and 2011:
| Year Ended December 31, | ||||||||||||
| 2012(1) | 2012 | 2011 | ||||||||||
| (in millions of U.S. dollars and Mexican pesos) | ||||||||||||
Net sales | $ | 18,276 | Ps.236,922 | Ps.200,426 | ||||||||
Other operating revenues | 107 | 1,387 | 1,114 | |||||||||
|
|
|
|
|
| |||||||
Total revenues | 18,383 | 238,309 | 201,540 | |||||||||
Cost of goods sold | 10,569 | 137,009 | 117,244 | |||||||||
|
|
|
|
|
| |||||||
Gross profit | 7,814 | 101,300 | 84,296 | |||||||||
Administrative expenses | 737 | 9,552 | 8,172 | |||||||||
Selling expenses | 4,789 | 62,086 | 50,685 | |||||||||
Other income | 135 | 1,745 | 381 | |||||||||
Other Expenses | (152 | ) | (1,973 | ) | (2,072 | ) | ||||||
Interest expense | (193 | ) | (2,506 | ) | (2,302 | ) | ||||||
Interest income | 60 | 783 | 1,014 | |||||||||
Foreign exchange (loss) gain, net | (14 | ) | (176 | ) | 1,148 | |||||||
(Loss) gain on monetary position for subsidiaries in hyperinflationary economies | (1 | ) | (13 | ) | 53 | |||||||
Market value gain (loss) on financial instruments | 1 | 8 | (109 | ) | ||||||||
Income before income taxes and share of the profit of associates and joint ventures accounted for using the equity method | 2,124 | 27,530 | 23,552 | |||||||||
Income taxes | 613 | 7,949 | 7,618 | |||||||||
Share of the profit of associates and joint ventures accounted for using the equity method, net of taxes | 653 | 8,470 | 4,967 | |||||||||
|
|
|
|
|
| |||||||
Consolidated net income | $ | 2,164 | Ps. 28,051 | Ps. 20,901 | ||||||||
|
|
|
|
|
| |||||||
Controlling interest net income | 1,597 | 20,707 | 15,332 | |||||||||
Non-controlling interest net income | 567 | 7,344 | 5,569 | |||||||||
|
|
|
|
|
| |||||||
Consolidated net income | $ | 2,164 | Ps. 28,051 | Ps. 20,901 | ||||||||
|
|
|
|
|
| |||||||
| (1) | Translation to U.S. dollar amounts at an exchange rate of Ps. 12.9635 to US$ 1.00, provided solely for the convenience of the reader. |
The following table sets forth certain operating results by (i)reportable segment under IFRS for each of our segments for the one-time Heineken transaction-related gainyears ended December 31, 2012 and (ii) a double-digit increase in FEMSA’s net income from continuing operations.2011.
Net controlling interest amounted to Ps. 40,251 million in 2010 compared to Ps. 9,908 million in 2009. Net controlling interest in 2010 per FEMSA Unit(1)was Ps. 11.25 (US$ 9.08 per ADS).
| As of December 31, | ||||||||||||
| Percentage Growth | ||||||||||||
| 2012 | 2011 | 2012 vs. 2011 | ||||||||||
Net sales | ||||||||||||
Coca-Cola FEMSA | Ps.146,907 | Ps.122,638 | 19.8 | % | ||||||||
FEMSA Comercio | 86,433 | 74,112 | 16.6 | % | ||||||||
Total revenues | ||||||||||||
Coca-Cola FEMSA | 147,739 | 123,224 | 19.9 | % | ||||||||
FEMSA Comercio | 86,433 | 74,112 | 16.6 | % | ||||||||
Cost of goods sold | ||||||||||||
Coca-Cola FEMSA | 79,109 | 66,693 | 18.6 | % | ||||||||
FEMSA Comercio | 56,183 | 48,636 | 15.5 | % | ||||||||
Gross profit | ||||||||||||
Coca-Cola FEMSA | 68,630 | 56,531 | 21.4 | % | ||||||||
FEMSA Comercio | 30,250 | 25,476 | 18.7 | % | ||||||||
Administrative expenses | ||||||||||||
Coca-Cola FEMSA | 6,217 | 5,140 | 21.0 | % | ||||||||
FEMSA Comercio | 1,666 | 1,433 | 16.3 | % | ||||||||
Selling expenses | ||||||||||||
Coca-Cola FEMSA | 40,223 | 32,093 | 25.3 | % | ||||||||
FEMSA Comercio | 21,686 | 18,353 | 18.2 | % | ||||||||
Depreciation | ||||||||||||
Coca-Cola FEMSA | 5,078 | 3,850 | 31.9 | % | ||||||||
FEMSA Comercio | 1,940 | 1,685 | 15.1 | % | ||||||||
Gross margin(1)(2) | ||||||||||||
Coca-Cola FEMSA | 46.5 | % | 45.9 | % | 0.6p.p | |||||||
FEMSA Comercio | 35.0 | % | 34.4 | % | 0.6p.p | |||||||
Share of the profit of associates and joint ventures accounted for using the equity method, net of taxes | ||||||||||||
Coca-Cola FEMSA | 180 | 86 | 109.3 | % | ||||||||
FEMSA Comercio | (23 | ) | — | N/a | ||||||||
CB Equity(3) | 8,311 | 4,880 | 70.3 | % | ||||||||
| (1) | Gross margin is calculated with reference to total revenues. |
| (2) | As used herein, p.p refers to a percentage point increase (or decrease) contrasted with a straight percentage increase (or decrease). |
| (3) | CB Equity holds Heineken N.V. and Heineken Holding N.V. shares. |
Results from operationsour Operations for the Year Ended December 31, 20092012 Compared to the Year Ended December 31, 20082011
FEMSA Consolidated
Under Mexican FRS, we reclassified our financial statements to reflect FEMSA Cerveza as a discontinued operation.
Total Revenues
FEMSA’s consolidated total revenues increased 19.8%18.2% to Ps. 160,251238,309 million in 20092012 compared to Ps. 133,808201,540 million in 2008. Our beverage2011. All of FEMSA’s operations—beverages and retail businesses retail—contributed positively to this revenue growth. Coca-Cola FEMSA’s total revenues increased 23.9%19.9% to Ps. 102,767147,739 million, driven by a 13.9% higher average price per unit casedouble-digit total revenue growth in both of its divisions and a volume growththe integration of 8.3%, from 2,242.8 million unit casesthe beverage divisions of Grupo Tampico, Grupo CIMSA and Grupo Fomento Queretano in 2008 to 2,428.6 million unit cases in 2009.Mexico. FEMSA Comercio’s revenues increased 13.6%16.6% to Ps. 53,54986,433 million, mainly driven by the opening of 9601,040 net new stores combined with an average increase of 1.3%7.7% in same-store sales.
Gross Profit
Consolidated cost of sales increased 18.4% to Ps. 92,313 million in 2009 compared to Ps. 77,990 million in 2008. Approximately 80% of this increase came from Coca-Cola FEMSA as a result of cost pressures due to (i) the devaluation of local currencies in Coca-Cola FEMSA’s main operations as applied to its dollar-denominated raw material costs, (ii) the higher cost of sweetener across its operations, (iii) the integration of REMIL and (iv) the third and final stage of the scheduled Coca-Cola Company concentrate price increase announced in 2006 in Mexico.
Consolidated gross profit increased 21.7%20.2% to Ps. 67,938101,300 million in 20092012 compared to Ps. 55,81884,296 million in 2008 due to gross profit increases in our beverage2011, driven by Coca-Cola FEMSA and retail operations.FEMSA Comercio. Gross margin expandedincreased by 0.70.70 percentage points, from 41.7%41.8% of consolidated total revenues in 20082011 to 42.4%42.5% in 2009. Gross margin improvement at FEMSA Comercio, more than offset raw-material cost pressures at Coca-Cola FEMSA.
Income from Operations
Consolidated operating expenses increased 21.7% to Ps. 46,808 million in 2009 compared to Ps. 38,469 million in 2008. Approximately 80% of this increase resulted from additional operating expenses at Coca-Cola FEMSA due to higher labor costs and increased marketing expenses in certain of our divisions. FEMSA Comercio accounted for the balance, resulting from accelerated store expansion. As a percentage of total revenues, consolidated operating expenses expanded from 28.7% in 2008 to 29.2% in 2009.2012.
Consolidated administrative expenses increased 24.5%16.9% to Ps. 7,8359,552 million in 20092012 compared to Ps. 6,2928,172 million in 2008.2011. As a percentage of total revenues, consolidated administrative expenses remained stable at 4.9%decreased from 4.1% in
|
2009 compared with 4.7% 2011 to 4.0% in 2008, due to operating leverage driven by higher revenues achieved in all of FEMSA’s operations.2012.
Consolidated selling expenses increased 21.1%22.5% to Ps. 38,97362,086 million in 20092012 as compared to Ps. 32,17750,685 million in 2008. Approximately 80% of this2011. This increase was attributable to greater selling expenses at Coca-Cola FEMSA and FEMSA Comercio represented the balance.Comercio. As a percentage of total revenues, selling expenses increased 0.30.90 percentage points, from 25.1% in 2011 to 24.0%26.0% in 2008 to 24.3% in 2009.
Consolidated income from operations increased 21.8% to Ps. 21,130 million in 2009 as compared to Ps. 17,349 million in 2008. This increase was driven by the results from both of our businesses. Consolidated operating margin, as a percentage of consolidated total revenues, increased 0.2 percentage points from 2008 levels, to 13.2% in 2009. Gross margin improvement at FEMSA Comercio offset raw material pressures at the beverages operations.2012.
Some of our subsidiaries pay management fees to us in consideration for corporate services we provide to them. These fees are recorded as administrative expenses in the respective business segments. Our subsidiaries’ payments of management fees are eliminated in consolidation and, therefore, have no effect on our consolidated operating expenses.
Coca-Cola FEMSA
Total Revenues
Coca-Cola FEMSA total revenues increased 23.9% to Ps. 102,767 million in 2009, compared to Ps. 82,976 million in 2008 as a result of revenue growth in all of its divisions. Organic growth across Coca-Cola FEMSA’s operations contributed more than 75% of incremental revenue. The acquisition of REMIL in Brazil andBrisa in Colombia together contributed to slightly less than 15% of this growth, while a positive exchange rate translation effect resulting from the depreciation of the peso against its operations’ local currencies represented the balance.
Coca-Cola FEMSA’s average price per unit case increased 13.9%, reaching Ps. 40.95 in 2009 as compared to Ps. 35.94 in 2008, reflecting higher average prices in all of Coca-Cola FEMSA’s territories resulting from selective price increases implemented during the year across geographies.
Coca-Cola FEMSA’s total sales volume increased 8.3% to 2,428.6 million unit cases in 2009, compared to 2,242.8 million unit cases in 2008. Excluding the acquisitions of REMIL andBrisa, total sales volume increased 5.1% to reach 2,357.0 million unit cases. Organic volume growth resulted from increases in sparkling beverages, which accounted for approximately 45% of incremental volumes, mainly driven by theCoca-Cola brand. The still beverage category, mainly driven by the Jugos del Valle line of business in its main operations, contributed with less than 45% of the incremental volumes and the bottled water category represented the balance.
Gross Profit
Cost of sales increased 25.2% to Ps. 54,952 million in 2009 compared to Ps. 43,895 million in 2008, as a result of cost pressures due to (i) the devaluation of local currencies in Coca-Cola FEMSA’s main operations in Mexico, Colombia and Brazil, as applied to its U.S. dollar-denominated raw material costs, (ii) the higher cost of sweetener across its operations, (iii) the integration of REMIL and (iv) the third and final stage of the scheduled Coca-Cola Company concentrate price increase announced in 2006 in Mexico. All of these items were partially offset by lower resin costs. Gross profit increased 22.3% to Ps. 47,815 million in 2009, as compared to 2008, driven by gross profit growth across all of Coca-Cola FEMSA’s divisions, however Coca-Cola FEMSA’s gross margin decreased 0.6 percentage points to 46.5% in 2009.
Income from Operations
Operating expenses increased 26.0% to Ps. 31,980 million in 2009, mainly as a result of (i) higher labor costs in Venezuela, (ii) increased marketing investments in the Mexico division, (iii) the integration of REMIL in Brazil and (iv) increased marketing expenses in the Latincentro division, mainly due to the integration of theBrisaportfolio in Colombia and the continued expansion of the Jugos del Valle line of products in Colombia and Central America. As a percentage of sales, operating expenses increased to 31.1% in 2009 from 30.6% in 2008.
Income from operations increased 15.6% to Ps. 15,835 million in 2009, as compared to Ps. 13,695 million in 2008. Increases in operating income from the Latincentro division, including Venezuela, accounted for approximately 50% of this growth, while operating income growth in the Mercosur division accounted for more than 40% of incremental operating income. Operating margin was 15.4% in 2009, a decline of 110 basis points as compared to 2008.
FEMSA Comercio
Total Revenues
FEMSA Comercio total revenues increased 13.6% to Ps. 53,549 million in 2009 compared to Ps. 47,146 million in 2008, primarily as a result of the opening of 960 net new stores during 2009, combined with an average increase of same-store sales of 1.3%. As of December 31, 2009, there were a total of 7,329 stores in Mexico and 5 stores in Colombia. FEMSA Comercio same-store sales increased an average of 1.3% compared to 2008, driven by a 3.3% increase in store traffic, which more than offset a slight reduction of 1.6% in average ticket. As was the case in 2008, the same-store sales, ticket and traffic dynamics continued to reflect the effects from the continued mix shift from physical prepaid wireless air-time cards to the sale of electronic air-time, for which only the margin is recorded, rather than the full amount of the electronic recharge. As 2009 progressed, this effect diminished.
Gross Profit
Cost of sales increased 10.0% to Ps. 35,825 million in 2009, below total revenue growth, compared with Ps. 32,565 million in 2008. As a result, gross profit reached Ps. 17,724 million in 2009, which represented a 21.6% increase from 2008. Gross margin expanded 2.2 percentage points to reach 33.1% of total revenues. This increase reflects more effective collaboration and execution with our key supplier partners, combined with a more efficient use of promotion-related marketing resources and a positive mix shift due to the growth of higher-margin categories and, to a lesser extent, the continued shift towards electronic air-time recharges described above.
Income from Operations
Operating expenses increased 15.3% to Ps. 13,267 million in 2009 compared with Ps. 11,504 million in 2008, largely driven by the growing number of stores, and partially offset by broad expense-containment initiatives at the store level and by scale-driven efficiencies.
Administrative expenses increased 15.1% to Ps. 959 million in 2009, compared with Ps. 833 million in 2008, however, as a percentage of sales remained stable at 1.8%.
Selling expenses increased 15.3% to Ps. 12,308 in 2009 compared with Ps. 10,671 million in 2008.
Income from operations increased 44.8% to Ps. 4,457 million in 2009 compared with Ps. 3,077 million in 2008, resulting in an operating margin expansion of 1.8 percentage points to 8.3% as a percentage of total revenues for the year, compared with 6.5% in 2008. This all-time high operating margin was driven by gross margin expansion, which more than offset the increase in operating expenses.
FEMSA Consolidated—Net Income
Other Expenses
Other expenses mainly include employee profit sharing, which we refer to as PTU,disposal and impairment of long-lived assets, contingencies, as well as their subsequent interest and penalties, severance payments derived from restructuring programs and all other non-recurring expenses related to activities different from the main activities of the Company and that are not recognized as part of the comprehensive financing result.donations. During 2009,2012, other expenses decreased to Ps. 1,8771,973 million from Ps. 2,0192,072 million in 2008.2011. In both 2012 and 2011, other expenses was largely driven by the net effect of certain items, such as a new labor law in Venezuela (LOTTT) in 2012, and losses on significant disposals of long-lived assets in 2011.
Comprehensive Financing Result
Net interest expense reachedOther income mainly includes gains on sales of shares and long-lived assets and the write-off of certain contingencies. During 2012, other income increased to Ps. 4,0111,745 million from Ps. 381 million in 2009 compared with2011, largely driven by the net effect of certain items driven by the sale of Quimiproductos in the fourth quarter of 2012.
Net financing expenses1 increased to Ps. 3,8231,904 million from Ps. 196 million in 2008. Foreign2011, driven by a non-cash foreign exchange recorded a loss of Ps. 431176 million in 2009 from2012 compared to a losstough comparison base of Ps. 1,431 million in 2008, reflecting an important improvement due to the significant loss reported in 2008, driven by lowera non-cash foreign exchange losses in 2009 due to the lower depreciation of local currencies in our markets against the U.S. dollar. Additionally, the monetary position represented a lower gain of Ps. 4861,148 million in 2009 compared to Ps. 657 million in 2008, due to a lower liability monetary position in 2009 (monetary liabilities less monetary assets) and a lower inflation rate in countries in which inflationary adjustments are applied.
The market value2011 resulting from the sequential appreciation of the ineffectiveMexican Peso and its impact on the dollar-denominated portion of our derivative financial instruments reflects a shift to a gain of Ps. 124 million in 2009 from a loss of Ps. 950 million in 2008, reflecting an improvement due to the significant loss reported in 2008, driven by losses in certain derivative instruments that do not meet hedging criteria for accounting purposes, due to mark-to-market recognition in our U.S. dollar cross-swap.
Comprehensive financing result decreased 43.9% in 2009 to Ps. 2,627 million, reflecting an important improvement due to the significant loss reported in 2008, driven by lower foreign exchange losses in 2009 due to the lower depreciation of local currencies in our markets against the U.S. dollar and a shift to gains in certain derivative instruments during the year, as mentioned above.
Taxescash balance.
Our accounting provision for income taxes in 20092012 was Ps. 4,9597,949 million, as compared to Ps. 3,1087,618 million in 2011, resulting in an effective tax rate of 29.6%28.9% in 20092012, as compared with 28.9%to 32.3% in 2008.2011.
Net Income
Net incomeShare of the profit of associates and joint ventures was accounted for using the equity method, net of taxes. This line item increased 62.6%70.5% to Ps. 15,0828,470 million in 20092012 compared with Ps. 4,967 million in 2011, mainly driven by a non-cash exceptional gain related to the revaluation of certain previously held equity interests of Heineken in connection with an acquisition made in Asia.
Consolidated net income was Ps. 28,051 million in 2012 compared to Ps. 9,27820,901 million in 2008. These results were driven by (i) operating income growth during2011, a difference mainly attributable to Coca-Cola FEMSA, FEMSA Comercio and a non-cash exceptional gain related to the year, (ii) a significant improvementrevaluation of certain previously held equity interests of Heineken in the comprehensive financing result driven by the factors mentioned above and (iii) an improvement inAsia. Controlling interest net income from discontinued operations.
Net controlling interest income amounted to Ps. 9,90820,707 million in 20092012 compared to Ps. 6,70815,332 million in 2008, an increase2011, which difference was also due principally to a non-cash exceptional gain related to the revaluation of 47.7%. Net controllingcertain previously held equity interests of Heineken in Asia. Controlling interest net income in 20092012 per one FEMSA ShareUnit2 was Ps. 2.775.79 (US$2.12 4.45 per ADS).
Coca-Cola FEMSA
Coca-Cola FEMSA consolidated total revenues increased 19.9% to Ps. 147,739 million in 2012, as compared to 2011, driven by double-digit total revenue growth in both of its divisions, including Venezuela, and including the integration of Grupo Tampico, Grupo CIMSA and Grupo Fomento Queretano into its Mexican operations. Excluding the non-comparable effect of Grupo Tampico, Grupo CIMSA and Grupo Fomento Queretano in Coca-Cola FEMSA’s Mexican operations, total revenues grew 11.6%. On a currency neutral basis and excluding the non-comparable effect of Grupo Tampico, Grupo CIMSA and Grupo Fomento Queretano in Mexico, total revenues increased 15.0%.
Total sales volume increased 15.0% to 3,046.2 million unit cases in 2012, as compared to 2011. The integration of Grupo Tampico, Grupo CIMSA and Grupo Fomento Queretano in Coca-Cola FEMSA’s Mexican operations accounted for 332.7 million unit cases, of which sparkling beverages represented 62.5%, water 5.1%, bulk water 27.9% and still beverages 4.5%. Excluding non-comparable effects of Grupo Tampico, Grupo CIMSA and Grupo Fomento Queretano in Mexico, total sales volumes grew 2.4% to 2,713.5 million unit cases. On the same basis, the sparkling beverage category grew 2.0%, mainly driven by theCoca-Cola brand, which accounted for more than 65% of incremental volumes of Coca-Cola FEMSA. The still beverage category grew 13.5%, mainly driven by the performance of the Jugos del Valle line of business in Mexico, Venezuela and Brazil, and the Del Prado line of business in Central America, representing close to 30% of incremental volumes. Coca-Cola FEMSA’s bottled water portfolio, including bulk water, grew 0.9%, and contributed the balance.
Consolidated average price per unit case increased by 4.4%, reaching Ps. 47.27 in 2012, as compared to Ps. 45.29 in 2011. In local currency, average price per unit case increased in all of Coca-Cola FEMSA’s territories, mainly driven by price increases implemented during the year and higher volumes of sparkling beverages, which carry higher average prices per unit case.
| 1 | Which includes interest expense, interest income, net foreign exchange (loss) gain, (loss) gain on monetary position for subsidiaries in hyperinflationary economies and market value gain (loss) on financial instruments. |
| 2 | FEMSA Units consist of FEMSA BD Units and FEMSA B Units. Each FEMSA BD Unit is comprised of one Series B Share, two Series D-B Shares and two Series D-L Shares. Each FEMSA B Unit is comprised of five Series B Shares. The number of FEMSA Units outstanding as of December 31, 2012 was 3,578,226,270 which is equivalent to the total number of FEMSA Shares outstanding as of the same date, divided by five. |
Cost of goods sold increased 18.6% to Ps. 79,109, mainly as a result of higher sweetener costs in Mexico during the first half of the year and the depreciation of the average exchange rate of the Brazilian real, the Argentinian peso and the Mexican peso as applied to Coca-Cola FEMSA’s U.S. dollar-denominated raw material costs. Gross margin reached 46.5% in 2012, an expansion of 60 basis points as compared to 2011. Gross profit increased 21.4% to Ps. 68,630 million in 2012, as compared to 2011.
Administrative expenses increased 21.0% to Ps. 6,217 in 2012, compared with Ps. 5,140 in 2011; however, as a percentage of sales they remained stable at 4.2%
Selling expenses, in absolute terms, increased 25.3%, mainly as a result of the integration of Grupo Tampico, Grupo CIMSA and Grupo Fomento Queretano in Mexico. In addition, selling expenses grew as a consequence of higher labor costs in Venezuela and Brazil in combination with higher labor and freight costs in Argentina, and continued marketing investment to reinforce Coca-Cola FEMSA’s execution in the marketplace, widen its cooler coverage and broaden its returnable base availability across its territories. During the year Coca-Cola FEMSA also recorded additional expenses related to the development of information systems and commercial capabilities in connection with its commercial models, and certain investments related, among others, to the development of new lines of business and non-carbonated beverage categories.
FEMSA Comercio
FEMSA Comercio total revenues increased 16.6% to Ps. 86,433 million in 2012 compared to Ps. 74,112 million in 2011, primarily as a result of the opening of 1,040 net new stores during 2012, together with an average increase in same-store sales of 7.7%. As of December 31, 2012, there were a total of 10,601 stores in Mexico. FEMSA Comercio same-store sales increased an average of 7.7% compared to 2011, driven by a 3.8% increase in store traffic and 3.8% in average ticket.
Cost of goods sold increased 15.5% to Ps. 56,183 million in 2012, below total revenue growth, compared with Ps. 48,636 million in 2011. As a result, gross profit reached Ps. 30,250 million in 2012, which represented a 18.7% increase from 2011. Gross margin expanded 0.60 percentage points to reach 35.0% of total revenues. This increase reflects a positive mix shift due to the growth of higher margin categories, a more effective collaboration and execution with our key supplier partners, including our achievement of certain sales objectives with some of these partners and the corresponding benefit accrued to us, a more efficient use of promotion-related marketing resources, and a better execution of segmented pricing strategies across markets.
Administrative expenses increased 16.3% to Ps. 1,666 million in 2012, compared with Ps. 1,433 million in 2011; however, as a percentage of sales, they remained stable at 1.9%.
Selling expenses increased 18.2% to Ps. 21,686 million in 2012 compared with Ps. 18,353 million in 2011,largely driven by the growing number of stores as well as incremental expenses relating to, among other things, the continued strengthening of FEMSA Comercio’s organizational and IT structure, and the development of specialized distribution routes aimed at enabling our prepared food initiatives.
Liquidity and Capital Resources
Liquidity
Each of our sub-holding companies generally finances its operational and capital requirements on an independent basis. As of December 31, 2010, 68%2012, 81% of our outstanding consolidated total indebtedness was at the level of our sub-holding companies. This structure is attributable, in part, to the inclusion of third parties in the capital structure of Coca-Cola FEMSA. Currently, we expect to continue to finance our operations and capital requirements primarily at the level of our sub-holding companies. Nonetheless, weWe may decide to incur indebtedness at our holding company in the future to finance the operations and capital requirements of our subsidiaries or significant acquisitions, investments or capital expenditures. As a holding company, we depend on dividends and other distributions from our subsidiaries to service our indebtedness.indebtedness and to finance our operations and capital requirements.
We continuously evaluate opportunities to pursue acquisitions or engage in joint ventures or other transactions. We would expect to finance any significant future transactions with a combination of cash from operations, long-term indebtedness and capital stock.
TheOur principal source of liquidity of each sub-holding company has generally been cash generated from our operations. We have traditionally been able to rely on cash generated from operations because a significant majority of the sales of Coca-Cola FEMSA and FEMSA Comercio are on a cash or short-term credit basis, and FEMSA Comercio’s OXXO stores are able to finance a significant portion of their initial and ongoing inventories with supplier credit. Our principal use of cash has generally been for capital expenditure programs, debt repayment and dividend payments.
The following is a summary of the principal sources and uses of cash for the years ended December 31, 2010, 20092012 and 2008,2011, from our consolidated statement of cash flows:
Principal Sources and Uses of Cash
of continuing operations
Years ended December 31, 2010, 20092012 and 20082011
(in millions of Mexican pesos)(1)
| 2010 | 2009 | 2008 | 2012 | 2011 | ||||||||||||||||||||
Net cash flows provided by operating activities | Net cash flows provided by operating activities | Ps. | 17,802 | Ps. | 22,744 | Ps. | 16,023 | Ps.30,785 | Ps.21,247 | |||||||||||||||
Net cash flows provided (used) in investing activities(2) | 6,178 | (11,376 | ) | (11,267 | ) | |||||||||||||||||||
Net cash flows used in investing activities(1) | (14,643 | ) | (18,089 | ) | ||||||||||||||||||||
Net cash flows used in financing activities | Net cash flows used in financing activities | (10,496 | ) | (7,889 | ) | (5,543 | ) | Net cash flows used in financing activities | (3,418 | ) | (6,258 | ) | ||||||||||||
Dividends paid | Dividends paid | (3,813 | ) | (2,246 | ) | (2,058 | ) | (9,186 | ) | (6,625 | ) | |||||||||||||
| (1) |
| Includes dividends declared and paid. |
Our sub-holding companies generally incur short-term indebtedness in the event that they are temporarily unable to finance operations or meet any capital requirements with cash from operations. A significant decline in the business of any of our sub-holding companies may affect the sub-holding company’s ability to fund its capital requirements. A significant and prolonged deterioration in the economies in which we operate or in our businesses may affect our ability to obtain short-term and long-term credit or to refinance existing indebtedness on terms satisfactory to us.
We have financed significant acquisitions, principally Coca-Cola FEMSA’s acquisition of Coca-Cola Buenos Aires in 1994 and its acquisition of Panamco in May 2003 and our acquisition of the 30% interest in FEMSA Cerveza owned by affiliates of InBev in August 2004, capital expenditures and other capital requirements that could not be financed with cash from operations by incurring long-term indebtedness and through the issuance of equity.
Our consolidated total indebtedness as of December 31, 2010,2012, was Ps. 25,50637,342 million compared to Ps.29,799Ps. 29,392 million as of December 31, 2009, excluding FEMSA Cerveza total debt.2011. Short-term debt (including maturities of long-term debt) and long-term debt were Ps. 3,3038,702 million and Ps. 22,20328,640 million, respectively, as of December 31, 2010,2012, as compared to Ps. 8,5395,573 million and Ps. 21,26023,819 million, respectively, as of December 31, 2009.2011. Cash and cash equivalents were Ps. 27,09736,521 million as of December 31, 2010,2012, as compared to Ps. 14,50825,841 million as of December 31, 2009, excluding FEMSA Cerveza.
We believe that our sources of liquidity as of December 31, 2010, were adequate for the conduct of our sub-holding companies’ businesses and that we will have sufficient funds available to meet our expenditure demands and financing needs in 2011 and in the following years.2011.
Off-Balance Sheet Arrangements
We do not have any material off-balance sheet arrangements.
Contractual Obligations
The table below sets forth our contractual obligations as of December 31, 2010.2012.
| Maturity | Maturity | |||||||||||||||||||||||||||||||||||||||
| Less than 1 year | 1 - 3 years | 3 - 5 years | In excess of 5 years | Total | Less than 1 year | 1 - 3 years | 3 - 5 years | In excess of 5 years | Total | |||||||||||||||||||||||||||||||
| (in millions of Mexican pesos) | (in millions of Mexican pesos) | |||||||||||||||||||||||||||||||||||||||
Long-Term Debt | ||||||||||||||||||||||||||||||||||||||||
Mexican pesos | Ps.1,500 | Ps.6,834 | Ps | .4,216 | Ps.3,193 | Ps | .15,740 | Ps.3,766 | Ps.4,114 | Ps.6,078 | Ps.2,495 | Ps.16,453 | ||||||||||||||||||||||||||||
Brazilian reais | 4 | 24 | 29 | 45 | 102 | 17 | 148 | 40 | 20 | 225 | ||||||||||||||||||||||||||||||
Colombian pesos | 155 | 839 | — | — | 994 | — | 1,023 | — | — | 1,023 | ||||||||||||||||||||||||||||||
U.S. dollars | — | 222 | — | 6,179 | 6,401 | 195 | 7,795 | — | 6,458 | 14,448 | ||||||||||||||||||||||||||||||
Argentine pesos | 62 | 622 | — | — | 684 | 286 | 349 | — | — | 635 | ||||||||||||||||||||||||||||||
Capital Leases | ||||||||||||||||||||||||||||||||||||||||
U.S. dollars | 4 | — | — | — | 4 | |||||||||||||||||||||||||||||||||||
Colombian pesos | 185 | — | — | — | 185 | |||||||||||||||||||||||||||||||||||
Brazilian reais | 40 | 90 | 30 | — | 160 | |||||||||||||||||||||||||||||||||||
Interest payments(1) | ||||||||||||||||||||||||||||||||||||||||
Mexican pesos | 710 | 1,078 | 542 | 257 | 2,587 | 917 | 1,302 | 729 | 493 | 3,441 | ||||||||||||||||||||||||||||||
Brazilian reais | 4 | 7 | 5 | 8 | 24 | 28 | 24 | 5 | 1 | 58 | ||||||||||||||||||||||||||||||
Colombian pesos | 73 | 20 | — | — | 93 | 81 | 48 | — | — | 129 | ||||||||||||||||||||||||||||||
U.S. dollars | 287 | 573 | 572 | 1,180 | 2,612 | 407 | 750 | 607 | 549 | 2,313 | ||||||||||||||||||||||||||||||
Argentine pesos | 134 | 37 | — | — | 171 | 97 | 45 | — | — | 142 | ||||||||||||||||||||||||||||||
Interest rate swaps and cross currency swaps(2) | ||||||||||||||||||||||||||||||||||||||||
Mexican pesos | 898 | 229 | 335 | 184 | 1,646 | 958 | 1,236 | 666 | 493 | 3,353 | ||||||||||||||||||||||||||||||
Brazilian reais | 4 | — | (4) | 1 | 1 | 6 | 28 | 24 | 5 | 1 | 58 | |||||||||||||||||||||||||||||
Colombian pesos | 73 | 73 | — | — | 146 | 80 | 48 | — | — | 128 | ||||||||||||||||||||||||||||||
U.S. dollars | 287 | — | (4) | 1 | — | 288 | 424 | 750 | 607 | 550 | 2,331 | |||||||||||||||||||||||||||||
Argentine pesos | 134 | 134 | — | — | 268 | 97 | 45 | — | — | 142 | ||||||||||||||||||||||||||||||
Operating leases | ||||||||||||||||||||||||||||||||||||||||
Mexican pesos | 2,014 | 3,726 | 3,342 | 8,298 | 17,380 | 2,966 | 5,503 | 4,995 | 13,516 | 26,980 | ||||||||||||||||||||||||||||||
U.S. dollars | 94 | 174 | 842 | — | 1,110 | 77 | 217 | 118 | 544 | 956 | ||||||||||||||||||||||||||||||
Brazilian reais | 105 | 143 | 16 | 8 | 272 | |||||||||||||||||||||||||||||||||||
Others | 97 | 79 | 7 | — | 183 | |||||||||||||||||||||||||||||||||||
Commodity price contracts | ||||||||||||||||||||||||||||||||||||||||
U.S. dollars | 445 | — | — | — | 445 | |||||||||||||||||||||||||||||||||||
Expected benefits to be paid for pension plans, seniority premiums, post-retirement medical benefits and severance indemnities | 517 | 554 | 576 | 1,616 | 3,263 | |||||||||||||||||||||||||||||||||||
Other long-term liabilities(3) | — | — | — | 5,396 | 5,396 | |||||||||||||||||||||||||||||||||||
Sugar(3) | 1,567 | 1,069 | — | — | 2,636 | |||||||||||||||||||||||||||||||||||
Aluminum(3) | 335 | — | — | — | 335 | |||||||||||||||||||||||||||||||||||
Expected benefits to be paid for pension and retirement plans, seniority premiums, post-retirement medical services and post-employment | 543 | 631 | 689 | 2,047 | 3,910 | |||||||||||||||||||||||||||||||||||
Other long-term liabilities(4) | Ps.— | Ps.— | Ps.— | Ps.4,250 | Ps. 4,250 | |||||||||||||||||||||||||||||||||||
| (1) | Interest was calculated using long-term debt as of and interest rate amounts in effect on December 31, |
| (2) | Reflects the amount of future payments that we would be required to make. The amounts were calculated by applying the difference between the interest rate swaps and cross currency swaps and the nominal interest rates contracted to long-term debt as of December 31, |
| (3) | Reflects the notional amount of the futures and forward contracts used to hedge sugar and aluminum cost with a fair value liability of Ps. 200 million; see Note 20.6 to our audited consolidated financial statements. |
| (4) | Other long-term liabilities |
As of December 31, 2010,2012, Ps. 3,3038,702 million of our total consolidated indebtedness was short-term debt (including maturities of long-term debt).
As of December 31, 2010,2012, our consolidated average cost of borrowing, after giving effect to the cross currency and interest rate swaps, was approximately 5.8%5.3%, a decrease of 2.0%1.0% percentage points compared to 7.8%6.3% in 2009.2011 (the total amount of the debt used in the calculation of this percentage considers converting only the units of investments debt for the related cross currency swap, and it also includes the effect of related interest rate swaps). As of December 31, 2010,2012, after giving effect to cross currency swaps, 61.7%approximately 42.4% of our total consolidated indebtedness was denominated and payable in Mexican pesos, 25.1%50.6% in U.S. dollars, 8.1%3.3% in Colombian pesos, 4.7%2.6% in Argentine pesos and the remaining 0.4%1.1% in Brazilian reais.
Overview of Debt Instruments
The following table shows the allocations of total debt of our company as of December 31, 2010:2012:
| Total Debt Profile of the Company | Total Debt Profile of the Company | |||||||||||||||||||||||||||||||
| FEMSA | Coca-Cola FEMSA | FEMSA Comercio | Total Debt | FEMSA and Others | Coca-Cola FEMSA | FEMSA Comercio | Total Debt | |||||||||||||||||||||||||
| (in millions of Mexican pesos) | (in millions of Mexican pesos) | |||||||||||||||||||||||||||||||
Short-term Debt | ||||||||||||||||||||||||||||||||
Argentine pesos: | ||||||||||||||||||||||||||||||||
Bank loans | — | 506 | — | 506 | Ps.— | Ps.291 | Ps.— | Ps.291 | ||||||||||||||||||||||||
Colombian pesos | ||||||||||||||||||||||||||||||||
U.S. dollars: | ||||||||||||||||||||||||||||||||
Bank loans | — | 3,903 | — | 3,903 | ||||||||||||||||||||||||||||
Brazilian reais: | ||||||||||||||||||||||||||||||||
Bank loans | — | 1,072 | — | 1,072 | 19 | — | — | 19 | ||||||||||||||||||||||||
Long-term Debt(1) | ||||||||||||||||||||||||||||||||
Mexican pesos: | ||||||||||||||||||||||||||||||||
Bank loans | — | 4,550 | — | 4,550 | — | 4,380 | — | 4,380 | ||||||||||||||||||||||||
Units of Investment (UDI) | 3,193 | — | — | 3,193 | ||||||||||||||||||||||||||||
Units of Investment (UDIs) | 3,567 | — | — | 3,567 | ||||||||||||||||||||||||||||
Senior notes | 5,000 | 3,000 | — | 8,000 | 3,500 | 5,006 | — | 8,506 | ||||||||||||||||||||||||
U.S. dollars: | ||||||||||||||||||||||||||||||||
Bank loans | — | 6,401 | — | 6,401 | — | 14,448 | — | 14,448 | ||||||||||||||||||||||||
Leasing | — | 4 | — | 4 | ||||||||||||||||||||||||||||
Brazilian reais: | ||||||||||||||||||||||||||||||||
Bank Loans | — | 102 | — | 102 | 161 | 64 | — | 225 | ||||||||||||||||||||||||
Capital leases | 149 | 11 | — | 160 | ||||||||||||||||||||||||||||
Colombian pesos: | ||||||||||||||||||||||||||||||||
Bank Loans | — | 994 | — | 994 | 6 | 990 | 27 | 1,023 | ||||||||||||||||||||||||
Capital leases | — | 185 | — | 185 | ||||||||||||||||||||||||||||
Argentine pesos: | ||||||||||||||||||||||||||||||||
Bank Loans | — | 684 | — | 684 | — | 635 | — | 635 | ||||||||||||||||||||||||
Total | Ps. 8,193 | Ps. 17,313 | — | Ps. 25,506 | Ps.7,402 | Ps.29,913 | Ps. 27 | Ps.37,342 | ||||||||||||||||||||||||
Average Cost(2) | ||||||||||||||||||||||||||||||||
Mexican pesos | 5.8 | % | 6.2 | % | — | 5.9 | % | 6.1 | % | 6.6 | % | — | 6.4 | % | ||||||||||||||||||
U.S. dollars | — | 4.5 | % | — | 4.5 | % | — | 3.4 | % | — | 3.4 | % | ||||||||||||||||||||
Brazilian reais | — | 4.5 | % | — | 4.5 | % | 8.7 | % | 4.5 | % | — | 7.9 | % | |||||||||||||||||||
Argentine pesos | — | 16.0 | % | — | 16.0 | % | — | 20.0 | % | — | 20.0 | % | ||||||||||||||||||||
Colombian pesos | — | 4.5 | % | — | 4.5 | % | 8.7 | % | 6.8 | % | 8.5 | % | 6.8 | % | ||||||||||||||||||
Total | 5.8 | % | 6.0 | % | — | 5.8 | % | 6.2 | % | 5.0 | % | 8.5 | % | 5.3 | % | |||||||||||||||||
| (1) | Includes the Ps. |
| (2) | Includes the effect of cross currency and interest rate |
Restrictions Imposed by Debt Instruments
Generally, the covenants contained in the credit agreements and other instruments governing indebtedness entered into by us or our sub-holding companies include limitations on the incurrence of any additional debt based on debt service coverage ratios or leverage tests. These credit agreements also generally include restrictive covenants applicable to us, our sub-holding companies and their subsidiaries.
As of December 31, 2010, we are2012, Coca-Cola FEMSA was in compliance with all of Coca-Cola FEMSA’sits covenants. FEMSA was not subject to any financial covenants as of that date. A significant and prolonged deterioration in our consolidated results from operations could cause us to cease to be in compliance under certain indebtedness in the future. We can provide no assurances that we will be able to incur indebtedness or to refinance existing indebtedness on similar terms in the future.
Summary of Debt
The following is a summary of our indebtedness by sub-holding company and for FEMSA as of December 31, 2010:2012:
| • | Coca-Cola FEMSA. Coca-Cola FEMSA’s total indebtedness was Ps. |
As part of Coca-Cola FEMSA’s financing policy, it expects to continue to finance its liquidity needs with cash from operations. Nonetheless, as a result of regulations in certain countries in which it operates, it may not be beneficial or, as the case of exchange controls in Venezuela, practicable for Coca-Cola FEMSA to remit cash generated in local operations to fund cash requirements in other countries. Exchange controls like those in Venezuela may also increase the real price of remitting cash from operations to fund debt requirements in other countries. In addition, in the event that cash from operations in these countries is not sufficient to fund future working capital requirements and capital expenditures, Coca-Cola FEMSA may decide, or be required, to fund cash requirements in these countries through local borrowings rather than remitting funds from another country. In addition, in the future Coca-Cola FEMSA may finance its working capital and capital expenditure needs with short-term or other borrowings.borrowings and may borrow under a shelf registration statement filed on March 15, 2013.
Coca-Cola FEMSA’s average cost of debt, based on interest rates as of December 31, 20102012 and after giving effect to cross currency and interest rate swaps, was 4.5%3.4% in U.S. dollars, 6.2%6.6% in Mexican pesos, 4.5%6.8% in Colombian pesos, 4.5% in Brazilian reais and 16.0%20.0% in Argentine pesos as of December 31, 2010,2012, compared to 2.6%4.6% in U.S. dollars, 7.2%6.4% in Mexican pesos, 12.5%6.4% in Colombian pesos, 18.9%4.5% in Venezuelan bolívares fuertesBrazilian reais and 21.6%17.3% in Argentine pesos as of December 31, 2009.2011.
|
| • | FEMSA Comercio. As of December 31, |
| • | FEMSA and others. As of December 31, |
average cost of debt, after giving effect to interest rate swaps, as of December 31, 2010, was 5.9% in Mexican pesos.
Contingencies
We have various loss contingencies, for which reserves have been recorded in those cases where we believe an unfavorable resolution is probable.probable and can be reasonably quantified. See “Item 8. Financial Information—Legal Proceedings.” Most of these loss contingencies were recorded in Coca-Cola FEMSA’s books as reserves as a result of Panamco acquisition. Any amounts required to be paid in connection with these loss contingencies would be required to be paid from available cash.
During 2009 and 2010, Brazil adopted new laws providing for certain tax amnesties. The tax amnesty programs offers Brazilian legal entities and individuals an opportunity to pay off their income tax and indirect tax debts under less stringent conditions than would normally apply. The amnesty programs also include a favorable option under which taxpayers may utilize income tax loss carry-forwards, which we refer to as NOLs, when settling certain outstanding income tax and indirect tax debts. Brazilian subsidiary of Coca-Cola FEMSA, decided to participate in the amnesty programs allowing it to settle certain previously accrued indirect tax contingencies. During the years ended December 31, 2010 and 2009 the Company de-recognized indirect tax contingency accruals of Ps. 333 and Ps. 433, respectively, making payments of Ps. 118 and Ps. 243, recording a credit to other expenses of Ps. 179 and Ps. 311, reversing previously recorded Brazil valuation allowances against NOLs in 2009, and recording certain taxes recoverable. See Note 19 and Note 25 C to our audited consolidated financial statements.
The following table presents the nature and amount of loss contingencies recorded as of December 31, 2010:2012:
| Loss Contingencies As of December 31, | ||||
(in millions of Mexican pesos) | ||||
| ||||
Legal | 279 | |||
Labor | ||||
| ||||
Total | ||||
As is customary in Brazil, we have been asked by the tax authorities to collateralize tax contingencies currently in litigation in respectamounting to Ps. 2,164 million and of Ps. 2,2922,418 million as of December 31, 2012 and 2011, respectively, by pledging fixed assets and entering into available lines of credit to cover suchor providing bank guarantees.
In connection with certain past business combinations, Coca-Cola FEMSA has been indemnified by the sellers for certain contingencies. The agreement in connection with Coca-Cola FEMSA’s recent merger with Grupo Fomento Queretano contains comparable indemnification provisions.See “Item 4. Information on the Company—Coca-Cola FEMSA—Corporate History.”
We have other contingencies which,that, based on a legal assessment on whetherof their risk of loss, is deemed to be otherhave been classified by our legal counsel as more than remote but less than probable,probable. These contingencies have a financial impact that is disclosed as loss contingencies in the notes of the consolidated financial statements. These contingencies, or our assessment of them, may change in the future, and we may record reserves or be required to pay amounts in respect of these contingencies. As of December 31, 2010,2012, the aggregate amount of such contingencies for which we havehad not recorded a reserve was Ps. 5,76713,309 million. These contingencies have been classified as less than probable but more than remote by our legal counsel.
Capital Expenditures
For the past five years, we have had significant capital expenditure programs, which for the most part were financed with cash from operations. Capital expenditures reached Ps. 11,17115,560 million in 20102012 compared to Ps. 9,10312,666 million in 2009,2011, an increase of 22.7%22.8%. This was primarily due to higher capacity-related investments at Coca-Cola FEMSA and incremental investments inat FEMSA Comercio, mainly related mainly to store expansions.expansion. The principal components of our capital expenditures have been for equipment, market-related investments and production capacity and distribution network expansion at Coca-Cola FEMSA and the opening of new stores at FEMSA Comercio.See “Item 4. Information on the Company—Capital Expenditures and Divestitures.”
Expected Capital Expenditures for 20112013
Our capital expenditure budget for 20112013 is expected to be approximately US$ 9001,250 million. The following discussion is based on each of our sub-holding companies’ internal 20112013 budgets. The capital expenditure plan for 20112013 is subject to change based on market and other conditions and the subsidiaries’ results from operations and financial resources.
Coca-Cola FEMSA’s capital expenditures in 20112013 are expected to be approximately up to approximately US$ 600800 million. Coca-Cola FEMSA’s capital expenditures in 20112013 are primarily intended for:
investmentinvestments in manufacturing lines;production capacity (primarily for a plant in Colombia and a plant in Brazil);
market investments (primarily for the placement of coolers);
returnable bottles and cases;
market investments (primarily for the placement of refrigeration equipment);
improvements throughout its distribution network; and
IT investments.investments in IT.
Coca-Cola FEMSA estimates that of its projected capital expenditures for 2011,2013, approximately 33%35% will be allocated in respect offor its Mexican territories and the remainingremainder will be for its non-Mexican territories. Coca-Cola FEMSA believes that internally generated funds will be sufficient to meet its budgetbudgeted capital expenditures for 2011.2013. Coca-Cola FEMSA’s capital expenditure plan for 20112013 may change based on market and other conditions and based on its results from operations and financial results.resources.
FEMSA Comercio’s capital expenditure budget in 20112013 is expected to total approximately US$ 250400 million, and will be allocated to the opening of new OXXO stores and to a lesser extent to the refurbishing of existing OXXO stores and the investment in two new distribution centers. In addition, investments are planned in FEMSA Comercio’s information technology,IT, ERP software updates and transportation equipment.
Hedging Activities
Our business activities require the holding or issuing of derivative instruments to hedge our exposure to market risks related to changes in interest rates, foreign currency exchange rates, equity risk and commodity price risk.See “Item 11. Quantitative and Qualitative Disclosures about Market Risk.”
The following table provides a summary of the fair value of derivative financial instruments as of December 31, 2010.2012. If such instruments are not traded in a formal market, fair value is determined by applying techniques based upon technical models we believe are supported by sufficient, reliable and verifiable market data, recognized in the financial sector.
| Fair Value At December 31, | |||||||||||||||||||||||||
| Maturity less than 1 year | Maturity 1 - 3 years | Maturity 3 - 5 years | Maturity in excess of 5 years | Fair Value Asset (Liability) | |||||||||||||||||||||
| (in millions of Mexican pesos) | |||||||||||||||||||||||||
| Ps. (146) | Ps. (184) | Ps. 1,089 | — | Ps. | 759 | |||||||||||||||||||
Plan for the Disposal of Certain Fixed Assets
We have identified certain fixed assets consisting of land, buildings and equipment for disposal, and we have an approved program for disposal of these fixed assets. These assets are not in use and have been valued at
their estimated net realizable value without exceeding their restated acquisition cost. These assets are allocated as follows:
| December 31, | ||||||||
| 2010 | 2009 | |||||||
| (in millions of Mexican pesos) | ||||||||
Coca-Cola FEMSA | Ps. | 189 | Ps. | 288 | ||||
FEMSA and other | 43 | 42 | ||||||
Total | Ps. | 232 | Ps. | 330 | ||||
In inflationary economic environments, fixed assets recorded at their estimated realizable value are considered monetary assets on which a loss on monetary position is computed and recorded in results of operation.
The principal differences between Mexican FRS and U.S. GAAP that affect our net income and majority stockholders’ equity relate to the accounting treatment of the following items:
consolidation of our subsidiary Coca-Cola FEMSA, which is a consolidated subsidiary for purposes of Mexican FRS but presented under the equity method for U.S. GAAP purposes up until January 31, 2010. As of February 1, 2010, we acquired control of Coca-Cola FEMSA through a business acquisition without any transfer of consideration (see “Item 18. Financial Statements”);
discontinued operations of FEMSA Cerveza due to the disposal of FEMSA Cerveza, which was accounted for as discontinued operations for purposes of Mexican FRS, and considered to be a continuing operation due to significant involvement with the disposed operation and accounted for as a disposal of net assets under U.S. GAAP (see “Item 18. Financial Statements”);
subsequent accounting of our investment in Heineken under the equity method for purposes of Mexican FRS; for U.S. GAAP purposes our investment in Heineken has been recognized based on the cost method because it was unable to obtain the required information to reconcile Heineken’s net income from IFRS to U.S. GAAP (see “Item 18. Financial Statements”);
FEMSA’s non-controlling interest acquisition and sales;
deferred income taxes and deferred employee profit sharing;
capitalization of comprehensive financing result;
labor liabilities; and
start-up expenses.
For a more detailed description of the differences between Mexican FRS and U.S. GAAP as they relate to us, as well as U.S. GAAP consolidated balance sheets, statements of income and comprehensive income, and cash flows for the same periods presented for Mexican FRS purposes and, for the consolidated statement of changes in stockholders’ equity for the years ended December 31, 2010 and 2009 and reconciliation of net income, comprehensive income and stockholders’ equity under Mexican FRS to net income, comprehensive income and stockholders’ equity under U.S. GAAP, see Notes 27 and 28 to our audited consolidated financial statements.
Pursuant to Mexican FRS through 2007, our audited consolidated financial statements recognize certain effects of inflation in accordance with Bulletin B-10. As a result of discontinued inflationary accounting for subsidiaries that operate in non-inflationary environments, our financial statements are no longer considered to be presented in a reporting currency that comprehensively includes the effects of price level changes, therefore, the
inflationary effects if inflationary economic environments arising in 2008, 2009 and 2010 resulted in a difference to be reconciled for U.S. GAAP purposes.
Under U.S. GAAP, we had net income attributable to controlling interest of Ps. 67,445 million and Ps. 9,902 million in 2010 and 2009, respectively. Under Mexican FRS, we had net controlling interest income of Ps. 40,251 million and Ps. 9,908 million in 2010 and 2009, respectively. In 2010, net income attributable to controlling interest under U.S. GAAP was higher than net controlling income under Mexican FRS, mainly due to the gain recognized under U.S. GAAP regarding the control acquisition of Coca-Cola FEMSA without any transfer consideration, which amounted to Ps. 39,847.
Controlling interest equity under U.S. GAAP as of December 31, 2010 and 2009 was Ps. 163,641 million and Ps. 98,168 million, respectively. Under Mexican FRS, controlling interest equity as of December 31, 2010 and 2009 was Ps. 117,348 million and Ps. 81,637 million, respectively. The principal reasons for the difference between controlling interest stockholders’ equity under U.S. GAAP and controlling interest equity under Mexican FRS were the effect of the fair valuation recognized regarding the Coca-Cola FEMSA acquisition.
| ITEM 6. | DIRECTORS, SENIOR MANAGEMENT AND EMPLOYEES |
Management of our business is vested in the board of directors and in our chief executive officer. Our bylaws provide that the board of directors will consist of no more than 21 directors and their corresponding alternate directors elected by our shareholders at the AGM. Directors are elected for a term of one year. Alternate directors are authorized to serve on the board of directors in place of their specific directors who are unable to attend meetings and may participate in the activities of the board of directors. Nineteen members form our board of directors. Our bylaws provide that the holders of the Series B Shares elect at least eleven directors and that the holders of the Series D Shares elect five directors. See “Item“Item 10. Additional Information—Bylaws.”
In accordance with our bylaws and article 24 of the Mexican Securities Law, at least 25% of the members of our board of directors must be independent (as defined by the Mexican Securities Law).
The board of directors may appoint interim directors in the event that a director is absent or an elected director and corresponding alternate are unable to serve. Such interim directors shall serve until the next AGM, at which the shareholders shall elect a replacement.
Our bylaws provide that the board of directors shall meet at least once every 3three months. Actions by the board of directors must be approved by at least a majority of the directors present and voting. The chairman of the board of directors, the chairman of our audit or corporate practices committee, or at least 25% of our directors may call a board of directors’ meeting and include matters in the meeting agenda.
Our board of directors was elected at the AGM held on March 15th, 2013, and is currently comprised of 17 directors and 15 alternate directors. The following table sets forth the current members of our board of directors:
Series “B”B Directors
José Antonio Fernández Carbajal Chairman of the Board and Chief Executive Officer of FEMSA | Born: | February 1954 | ||
First elected (Chairman): | 2001 | |||
First elected (Director): | 1984 | |||
| Term expires: | ||||
| Principal occupation: | Chairman and Chief Executive Officer of FEMSA | |||
| Other directorships: | Chairman of the board of Coca-Cola FEMSA and Fundación FEMSA A.C., Vice-Chairman of the supervisory board of Heineken N.V. and | |||
| member of the board of Heineken Holding N.V., | ||||
| Business experience: | Joined FEMSA’s strategic planning department in 1988, held managerial positions at FEMSA Cerveza’s commercial division and OXXO, was appointed Deputy Chief Executive Officer of | |||
| Education: | Holds a degree in industrial engineering and an MBA from ITESM | |||
| Alternate director: | Federico Reyes García | |||
Eva Garza Lagüera Gonda(1) Director | Born: | April 1958 | ||
| First elected: | 1999 | |||
| Term expires: | ||||
| Principal occupation: | Private investor | |||
| Other | Member of the boards of directors of | |||
| Education: | Holds a degree in Communication Sciences from ITESM | |||
| Alternate director: | ||||
Paulina Garza Lagüera Gonda (2) Director | Born: | March 1972 | ||
| First elected: | ||||
| Term expires: | ||||
| Principal occupation: | Private investor | |||
| Other directorships: | Member of the board of directors of Coca-Cola FEMSA | |||
| Education: | Holds a business administration degree from ITESM | |||
| Alternate director: | Othón Páez Garza | |||
José Fernando Calderón Rojas Director | Born: | July 1954 | ||
| First elected: | 2005 | |||
| Term expires: | ||||
| Principal occupation: | Chief Executive Officer of Franca Servicios, S.A. de C.V., Servicios Administrativos de Monterrey, S.A. de C.V., Regio Franca, S.A. de C.V., and Franca Industrias, S.A. de C.V. | |||
| Other directorships: | Chairman of the boards of | |||
| Education: | Holds a law degree from the Universidad Autónoma de Nuevo León (UANL) and completed specialization studies in tax at UANL | |||
| Alternate director: | Francisco José Calderón Rojas(3) | |||
Consuelo Garza de Garza Director | Born: | October 1930 | ||
| First elected: | 1995 | |||
| Term expires: | ||||
| Business experience: | Founder and former President of Asociación Nacional Pro-Superación Personal, (a non-profit organization) | |||
| Alternate director: | Alfonso Garza Garza(4) | |||
Max Michel Suberville Director | Born: | July 1932 | ||
| First elected: | 1985 | |||
| Term expires: | ||||
| Principal occupation: | Private Investor | |||
| Other directorships: | Co-chairman of the equity committee of El Puerto de Liverpool, S.A.B. de C.V. (Liverpool) | |||
| Education: | Holds a graduate degree from The Massachusetts Institute of Technology and completed post-graduate studies at Harvard University | |||
| Alternate director: | Max Michel González(5) | |||
Alberto Bailleres González Director | Born: | August 1931 | ||
| First elected: | 1989 | |||
| Term expires: | ||||
| Principal occupation: | Chairman of the boards of directors of Grupo BAL, S.A. de C.V. Peñoles, GNP, Fresnillo plc, Grupo Palacio de Hierro, S.A.B. de C.V., and Profuturo, and Chairman of the Governance Board of Instituto Tecnológico Autónomo de Mé | |||
| Other directorships: | Member of the boards of directors of Valores Mexicanos Casa de Bolsa, S.A. de C.V., BBVA Bancomer, Bancomer, Dine, S.A.B. de C.V. | |||
| Education: | Holds an economics degree and an Honorary Doctorate, both from Instituto Tecnológico Autónomo de México | |||
| Alternate director: | Arturo Fernández Pérez | |||
Francisco Javier Fernández Carbajal(6) Director | Born: | April 1955 | ||
| First elected: | 2005 | |||
| Term expires: | ||||
| Principal occupation: | Chief Executive Officer of Servicios Administrativos Contry, S.A. de C.V. | |||
| Other directorships: | ||||
| Education: | Holds degrees in mechanical and electrical engineering from ITESM and an MBA from Harvard Business School | |||
| Alternate director: | Javier Astaburuaga Sanjines | |||
Ricardo Guajardo Touché Director | Born: | May 1948 | ||
| First elected: | 1988 | |||
| Term expires: | ||||
| Principal occupation: | Chairman of the board of directors of Solfi, S.A. | |||
| Other directorships: | Member of the | |||
| Education: | Holds degrees in electrical engineering from ITESM and the University of Wisconsin and a | |||
| Alternate director: | Alfonso González Migoya | |||
Alfredo Livas Cantú Director | Born: | July 1951 | ||
| First elected: | 1995 | |||
| Term expires: | ||||
| Principal occupation: | ||||
| Other directorships: | Member of the boards of | |||
| Education: | Holds an economics degree from UANL and an MBA and masters degree in economics from the University of Texas | |||
| Alternate Director: | Sergio Deschamps Ebergenyi | |||
Director | Born: | |||
| First elected: | ||||
| Term expires: | ||||
| Private Investor | ||||
| Other directorships: | Member of the boards of directors of Coca-Cola FEMSA, | |||
| Education: | Holds a | |||
| Alternate director: | Juan Guichard Michel(7) | |||
José Manuel Canal Hernando Director | Born: | February 1940 | ||
| First elected: | 2003 | |||
| Term expires: | ||||
| Principal occupation: | Private consultant | |||
| Other directorships: | Member of the boards of directors of Coca-Cola FEMSA, | |||
| Education: | Holds a CPA degree from the Universidad Nacional Autónoma de México | |||
| Alternate director: | Ricardo Saldívar Escajadillo | |||
| Series | ||||||
Armando Garza Sada Director | Born: | June 1957 | ||||
| First elected: | 2003 | |||||
| Term expires: | ||||||
| Principal occupation: | Chairman of the board of directors of Alfa | |||||
| Other directorships: | Member of the boards of | |||||
| Business experience: | He has a long professional career in Alfa, including Executive Vice-President of Corporate Development | |||||
| Education: | Holds a B.S. in Management from the Massachusetts Institute of Technology and an MBA from Stanford University | |||||
| Alternate director: | Enrique F. Senior Hernández | |||||
Director | Born: | July | ||||
| First elected: | ||||||
| Term expires: | ||||||
| Principal occupation: | ||||||
| Business experience: | ||||||
| Education: | Holds a | |||||
| Alternate director: | Francisco Zambrano Rodríguez | |||||
Helmut Paul Director | Born: | March 1940 | ||
| First elected: | 1988 | |||
| Term expires: | ||||
| Principal occupation: | Member of the Advisory Council of Zurich Financial Services | |||
| Other directorships: | Member of the board of directors of Coca-Cola FEMSA | |||
| Business experience: | Advisor at Darby Overseas Investment, Ltd. | |||
| Education: | Holds an MBA from the University of Hamburg | |||
| Alternate director: |
Michael Larson Director | Born: | October 1959 | ||||
| First elected: | 2011 | |||||
| Term expires: | ||||||
| Principal occupation: | Chief Investment Officer of William H. Gates III | |||||
| Other directorships: | ||||||
| Education: | Holds an MBA from the University of Chicago and a BA from Claremont Men’s College | |||||
Robert E. Denham Director | Born: | August 1945 | ||||
| First elected: | 2001 | |||||
| Term expires: | ||||||
| Principal occupation: | Partner of Munger, Tolles & Olson LLP law firm | |||||
| Other directorships: | Member of the boards of | |||||
| Education: | Magna cum laude graduate from the University of Texas, holds a JD from Harvard Law School and | |||||
| (1) | Wife of José Antonio Fernández Carbajal. |
| (2) | Sister-in-law of José Antonio Fernández Carbajal. |
| (3) | Brother of José Calderón Rojas. |
| (4) | Son of Consuelo Garza de Garza. |
| (5) | Son of Max Michel Suberville. |
| (6) | Brother of José Antonio Fernández Carbajal. |
| (7) | Nephew of Max Michel Suberville. |
The names and positions of the members of our current senior management and that of our principal sub-holding companies, their dates of birth and information on their principal business activities both within and outside of FEMSA are as follows:
| FEMSA | ||||
José Antonio Fernández Carbajal Chairman of the Board and Chief Executive Officer of FEMSA | See “—Directors.” Joined FEMSA: Appointed to current position: | 1987 1994 | ||
Javier Gerardo Astaburuaga Sanjines Chief | Born: Joined FEMSA: Appointed to current | |||
within FEMSA: | July 1959 1982 | |||
| 2006 | |||
|
| Joined FEMSA as a financial information analyst and later acquired experience in corporate development, administration and finance, held various senior positions at FEMSA Cerveza between 1993 and 2001, including Chief Financial Officer, and for two years was FEMSA Cerveza’s Director of Sales for the north region of Mexico until 2003, in which year he was appointed FEMSA Cerveza’s Co-Chief Executive | ||
| Directorships: | Member of the | |||
| Education: | Holds a CPA degree from ITESM | |||
Federico Reyes García Vice-President of Corporate Development of FEMSA | Born: Joined FEMSA: Appointed to current position: | September 1945 1992 2006 | ||
|
Business experience within FEMSA: |
| ||
| Directorships: | Member of the boards of Coca-Cola FEMSA | |||
| Education: | Holds a degree in business and finance from ITESM | |||
José González Ornelas Vice-President of Administration and Corporate Control of FEMSA | Born: Joined FEMSA: Appointed to current position: | April 1951 1973 2001 | ||
|
Business experience within FEMSA: |
Has held several managerial positions in FEMSA including Chief Financial Officer of FEMSA Cerveza, Director of Planning and Corporate Development of FEMSA and Chief Executive Officer of FEMSA Logística, S.A. de C.V. | ||
| Directorships: | Member of the board of directors of Productora de Papel, S.A. | |||
| Education: | Holds a CPA degree from UANL and has post-graduate studies in business administration from the Instituto Panamericano de Alta Dirección de Empresa (IPADE) | |||
Alfonso Garza Garza | ||||
| Born: Joined FEMSA: Appointed to current position: | July 1962 1985
| ||
Business experience within FEMSA: | Has experience in several FEMSA business units and departments, including domestic sales, international sales, procurement and marketing, mainly at FEMSA Cerveza and as Chief Executive Officer of FEMSA Empaques, S.A. de C.V. | |||
| Directorships: | Member of the | |||
| Education: | Holds a degree in Industrial Engineering from ITESM and an MBA from IPADE | |||
Genaro Borrego Estrada Vice-President of Corporate Affairs | Born: Joined FEMSA: Appointed to current position: | February 1949 2007 | ||
|
2007 | ||||
| Professional | Constitutional Governor of the Mexican State of Zacatecas from 1986 to 1992, General Director of the Mexican Social Security Institute from 1993 to 2000, and Senator in Mexico for the State of Zacatecas from 2000 to 2006 | |||
| Directorships: | Member of the | |||
| Education: | Holds a bachelor’s degree in International Relations from the Universidad Iberoamericana | |||
Carlos Eduardo Aldrete Ancira |
|
| ||
General Counsel and Secretary of the Board of Directors | Born: Joined FEMSA: Appointed to current position:
| August 1956 1979
1996 | ||
| Directorships: | Secretary | |||
Business experience within FEMSA: | Extensive experience in international business and financial transactions, debt issuances and corporate restructurings and expertise in securities and private mergers and acquisitions law | |||
| Education: | Holds a law degree from the UANL and a masters degree in Comparative Law from the College of Law of the University of Illinois | |||
| Coca-Cola FEMSA | ||||||
Carlos Salazar Lomelín Chief Executive Officer of Coca-Cola FEMSA | Born: Joined FEMSA: Appointed to current position: | April 1951 1973 2000 | ||||
|
Business experience within FEMSA: |
Has held managerial positions in several subsidiaries of FEMSA, including Grafo Regia, S.A. de C.V. and Plásticos Técnicos Mexicanos, S.A. de C.V., served as Chief Executive Officer of FEMSA Cerveza, where he also held various management positions in the Commercial Planning and Export divisions | ||||
| Directorships: | Member of the boards of Coca-Cola FEMSA, BBVA Bancomer, AFORE Bancomer, S.A. de C.V., Seguros Bancomer, S.A. de C.V., member of the advisory board of Premio Eugenio Garza Sada, Centro Internacional de Negocios Monterrey A.C. (CINTERMEX), | |||||
| Education: | Holds a bachelor’s degree in economics from ITESM, and performed postgraduate studies in business administration at ITESM and economic development in Italy | |||||
Héctor Treviño Gutiérrez Chief Financial Officer of Coca-Cola FEMSA | Born: Joined FEMSA: Appointed to current position: | August 1956 1981 | ||||
|
| 1993 | ||||
Business experience within FEMSA: | Has held managerial positions in the international financing, financial planning, strategic planning and corporate development areas of FEMSA | |||||
| Directorships: | Member of the boards of SIEFORES, Insurance and Pensions Committee of BBVA Bancomer and Vinte Viviendas Integrales, S.A.P.I. de C.V., and member of the Technical Committee of Capital-3 | |||||
| Education: | Holds a degree in chemical engineering from ITESM and an MBA from the Wharton Business School | |||||
FEMSA Comercio | ||||
Eduardo Padilla Silva Chief Executive Officer of FEMSA Comercio | Born: Joined FEMSA: Appointed to current position: | January 1955 1997 | ||
|
| 2004 | ||
| Business experience within FEMSA: | Director of Planning and Control of FEMSA from 1997 to 1999 and Chief Executive Officer of the Strategic Procurement Business Division of FEMSA from 2000 until 2003 | |||
| Other business experience: | Had a 20-year career in Alfa, culminating with a ten-year tenure as Chief Executive Officer of Terza, S.A. de C.V., major areas of expertise include operational control, strategic planning and financial restructuring | |||
| Directorships: | Member of the | |||
| Education: | Holds a degree in mechanical engineering from ITESM, an MBA from Cornell University and a Masters degree from IPADE | |||
Compensation of Directors and Senior Management
The compensation of Directors is approved at the AGM. For the year ended December 31, 2010,2012, the aggregate compensation paid to our directors was approximately Ps. 1014 million.
For the year ended December 31, 2010,2012, the aggregate compensation paid to executive officers and senior management of FEMSA and its subsidiaries was approximately Ps. 1,3071,297 million. Aggregate compensation includes bonuses we paid to certain members of senior management and payments in connection with the EVA stock incentive plan described in Note 17 to our audited consolidated financial statements. Our senior management and executive officers participate in our benefit plan and post-retirement medical services plan on the same basis as our other employees. Members of our board of directors do not participate in our benefit plan and post-retirement medical services plan, unless they are retired employees of our company. As of December 31, 2010,2012, amounts set aside or accrued for all employees under these retirement plans were Ps. 4,2365,086 million, of which Ps. 1,5442,110 million is already funded.
In 2004, we, along with our subsidiaries, commenced a new stock incentive plan for the benefit of our executive officers,senior executives, which we refer to as the EVA stock incentive plan. This plan was developed usinguses as theits main evaluation metric for the first three years of the plan for evaluation the Economic Value Added or EVA,(EVA) framework developed by Stern Stewart & Co., a compensation consulting firm. Under the EVA stock incentive plan, eligible executive officersemployees are entitled to receive a special cash bonus, which will be used to purchase shares.shares of FEMSA (in the case of employees of FEMSA) or of both FEMSA and Coca-Cola FEMSA (in the case of employees of Coca-Cola FEMSA). Under the plan it is also possible to provide stock options of FEMSA or Coca-Cola FEMSA to employees, however since the plan’s inception only shares have been granted.
Under this plan, each year, our Chief Executive Officer in conjunctiontogether with the Corporate Governance Committee of our board of directors, together with the chief executive officer of the respective sub-holding company, determines the amountemployees eligible to participate in the plan. A bonus formula is then created for each eligible employee, using the EVA framework, which determines the number of shares to be received by such employee. The terms and conditions of the special cashshare-based payment arrangement are then agreed upon with the eligible employee, such that the employee can begin to accrue shares under the plan, which vest ratably over a six year period. We account for the EVA stock incentive plan as an equity-settled share based payment transaction, as we will ultimately settle our obligations with our employees by issuing our own shares or those of our subsidiary Coca-Cola FEMSA.
The bonus used to purchase shares. This amount is determined based on each executive officer’seligible participant’s level of responsibility and based on the EVA generated by Coca-Cola FEMSA or FEMSA, as applicable.the applicable business unit the employee works for. The formula considers the employees’ level of responsibility within the organization, the employees’ evaluation and competitive compensation in the market. The bonus is granted to the eligible employee on an annual basis and after withholding applicable taxes.
The shares are administrated by a trust for the benefit of the selected executive officers. Undereligible executives (the “Administrative Trust”). We created the Administrative Trust with the objective of administering the purchase of FEMSA and Coca-Cola FEMSA shares, so that the shares can then be assigned (granted) to the eligible executives participating in the EVA stock incentive plan, each time a special bonus is assignedplan. The Administrative Trust’s objectives are to an executive officer, the executive officer contributes the special bonus received to the administrative trust. Pursuant to the plan, the administrative trust acquires BD Unitsacquire shares of FEMSA or in the case of officers of Coca-Cola FEMSA a specified proportion of publicly traded localand to manage the shares of FEMSA and Series L Shares of Coca-Cola FEMSAgranted to the individual employees based on instructions set forth by the Mexican Stock Exchange using the special
bonus contributed by each executive officer. The ownershipTechnical Committee of the publicly traded localAdministrative Trust. Once the shares ofare acquired following the Technical Committee’s instructions, the Administrative Trust assigns to each participant their respective rights. As the trust is controlled and therefore consolidated by FEMSA, and,shares purchased in the case of Coca-Cola FEMSA executives,market and held within the Series L Shares of Coca-Cola FEMSA vests atAdministrative Trust are presented as treasury stock (as it relates to FEMSA’s shares) or as a rate per year equivalent to 20%reduction of the numbernoncontrolling interest (as it relates to Coca-Cola FEMSA’s shares). Should an employee leave prior to their shares vesting, they would lose the rights to such shares, which would then remain within the Administrative Trust and be able to be reallocated to other eligible employees as determined by us. The incentive plan target is expressed in months of publicly traded localsalary, and the final amount payable is computed based on a percentage of compliance with the goals established every year.
All shares of FEMSAheld in the Administrative Trust are considered outstanding for diluted earnings per share purposes and Series L Shares of Coca-Cola FEMSA.dividends on shares held by the trusts are charged to retained earnings.
As ofOn March 31, 2011,22, 2013, the trust that manages the EVA stock incentive plan held a total of 9,632,9367,150,612 BD Units of FEMSA and 2,850,4512,031,543 Series L Shares of Coca-Cola FEMSA, each representing 0.27%0.20% and 0.15%0.10% of the total number of shares outstanding of FEMSA and of Coca-Cola FEMSA, respectively.
We maintain life insurance policies for all of our employees. These policies mitigate the risk of having to pay death benefits in the event of an industrial accident.accident, natural or accidental death within or outside working hours, and total and permanent disability. We maintain a directorsdirectors’ and officers’ insurance policy covering all directors and certain key executive officers for liabilities incurred in their capacities as directors and officers.
Several of our directors are participants of a voting trust. Each of the trust participants of the voting trust is deemed to have beneficial ownership with shared voting power over the shares deposited in the voting trust. As of April 30, 2011,March 15, 2013, 6,922,159,485 Series B Shares representing 74.86% of the outstanding Series B Shares were deposited in the voting trust.See “Item 7. Major Shareholders and Related Party Transactions.”
The following table shows the Series B Shares, Series D-B Shares and Series D-L Shares as of April 30, 2011March 15, 2013 beneficially owned by our directors and alternate directors who are participants in the voting trust, other than the shares deposited in the voting trust:
| Series B | Series D-B | Series D-L | Series B | Series D-B | Series D-L | |||||||||||||||||||||||||||||||||||||||||||
Beneficial Owner | Shares | Percent of Class | Shares | Percent of Class | Shares | Percent of Class | Shares | Percent of Class | Shares | Percent of Class | Shares | Percent of Class | ||||||||||||||||||||||||||||||||||||
Eva Garza Lagüera Gonda | 2,674,394 | 0.03 | % | 5,331,688 | 0.12 | % | 5,331,688 | 0.12 | % | 2,769,980 | 0.03 | % | 5,470,960 | 0.13 | % | 5,470,960 | 0.12 | % | ||||||||||||||||||||||||||||||
Mariana Garza Lagüera Gonda | 2,665,480 | 0.03 | % | 5,330,960 | 0.12 | % | 5,330,960 | 0.12 | % | 2,944,090 | 0.03 | % | 5,888,180 | 0.14 | % | 5,888,180 | 0.14 | % | ||||||||||||||||||||||||||||||
Barbara Garza Lagüera Gonda | 2,665,480 | 0.03 | % | 5,330,960 | 0.12 | % | 5,330,960 | 0.12 | % | 2,665,480 | 0.03 | % | 5,330,960 | 0.12 | % | 5,330,960 | 0.12 | % | ||||||||||||||||||||||||||||||
Paulina Garza Lagüera Gonda | 2,665,480 | 0.03 | % | 5,330,960 | 0.12 | % | 5,330,960 | 0.12 | % | 2,665,480 | 0.03 | % | 5,330,960 | 0.12 | % | 5,330,960 | 0.12 | % | ||||||||||||||||||||||||||||||
Consuelo Garza de Garza | 69,401,775 | 0.75 | % | 12,574,950 | 0.29 | % | 12,574,950 | 0.29 | % | 69,908,559 | 0.76 | % | 13,768,518 | 0.32 | % | 13,768,518 | 0.32 | % | ||||||||||||||||||||||||||||||
Alberto Bailleres González | 8,872,881 | 0.10 | % | 11,558,112 | 0.26 | % | 11,558,112 | 0.26 | % | 9,475,196 | 0.10 | % | 11,664,112 | 0.27 | % | 11,664,112 | 0.27 | % | ||||||||||||||||||||||||||||||
Alfonso Garza Garza | 874,347 | — | 1,212,594 | 0.03 | % | 1,212,594 | 0.03 | % | 1,524,095 | 0.02 | % | 2,999,790 | 0.07 | % | 2,999,790 | 0.07 | % | |||||||||||||||||||||||||||||||
Max Michel Suberville | 17,379,630 | 0.19 | % | 34,759,260 | 0.80 | % | 34,759,260 | 0.80 | % | 17,379,630 | 0.19 | % | 34,759,260 | 0.80 | % | 34,759,260 | 0.80 | % | ||||||||||||||||||||||||||||||
Francisco José Calderón Rojas and José Fernando Calderón Rojas(1) | 8,317,759 | 0.09 | % | 16,558,518 | 0.38 | % | 16,558,518 | 0.38 | % | |||||||||||||||||||||||||||||||||||||||
Juan Guichard Michel | 367,079 | 0.00 | % | 298 | 0.00 | % | 298 | 0.00 | % | |||||||||||||||||||||||||||||||||||||||
| (1) | Shares beneficially owned through various family-controlled entities |
To our knowledge, no other director or officer is the beneficial owner of more than 1% of any class of our capital stock.
Our bylaws state that the board of directors will meet at least once every three months following the end of each quarter to discuss our operating results and the advancement in the achievement of strategic objectives. Our board of directors can also hold extraordinary meetings.See “Item 10. Additional Information—Bylaws.”
Under our bylaws, directors serve one-year terms although they continue in office even after the term for which they were appointed ends for up to 30 calendar days, as set forth in article 24 of Mexican Securities Law. None of our directors or senior managers of our subsidiaries has service contracts providing for benefits upon termination of employment, other than post-retirement medical services plans and post-retirement pension plans for our senior managers on the same basis as our other employees.
Our board of directors is supported by committees, which are working groups that analyze issues and provide recommendations to the board of directors regarding their respective areas of focus. The executive officers interact periodically with the committees to address management issues. Each committee has a non-member secretary who attends meetings but is not a member of the committee. The following are the three committees of the board of directors:
| • | Audit Committee. The Audit Committee is responsible for (1) reviewing the accuracy and integrity of quarterly and annual financial statements in accordance with accounting, internal control and auditing requirements, (2) the appointment, compensation, retention and oversight of the independent auditor, who reports directly to the Audit Committee and (3) identifying and following-up on contingencies and legal proceedings. The Audit Committee has implemented procedures for receiving, retaining and addressing complaints regarding accounting, internal control and auditing matters, including the submission of confidential, anonymous complaints from employees regarding questionable accounting or auditing matters. The Chairman of the Audit Committee submits an annual report to the board of directors of the Audit Committee’s activities performed during the corresponding fiscal year. To carry out its duties, the Audit Committee may hire independent counsel and other advisors. As necessary, the company compensates the independent auditor and any outside advisor hired by the Audit Committee and provides funding for ordinary administrative expenses incurred by the Audit Committee in the course of its duties. The current Audit Committee members are: |
| • |
|
| • | Corporate Practices Committee. The Corporate Practices Committee is responsible for preventing or reducing the risk of performing operations that could damage the value of our company or that benefit a particular group of shareholders. The committee may call a shareholders’ meeting and include matters on the agenda for that meeting that it may deem appropriate, approve policies on the use of our company’s assets or related party transactions, approve the compensation of the chief executive officer and relevant officers and support our board of directors in the elaboration of reports on accounting practices. The Chairman of the Corporate Practices Committee submits an annual report to the board of directors of the Corporate Practices Committee’s activities performed during the corresponding fiscal year. The chairman of the Corporate Practices Committee is Helmut Paul. The additional members |
As of December 31, 2010,2012, our headcount by geographic region was as follows: 112,811146,695 in Mexico, 5,3856,076 in Central America, 8,6226,400 in Colombia, 8,2887,787 in Venezuela, 14,71112,470 in Brazil, 2,827 in Argentina and 3,9925 in Argentina.the United States. We include in headcount employees of third-party distributors and non-management store employees. The table below sets forth headcount for the years ended December 31, 2010, 20092012, 2011, and 2008:2010:
Headcount for the Year Ended December 31,(1)
| 2010 | 2009 | 2008 | 2012 | 2011 | 2010 | |||||||||||||||||||||||||||||||||||||||||||||||||||||||||||
| Non-Union | Union | Total | Non-Union | Union | Non-Union | Union | Non-Union | Union | Total | Non-Union | Union | Total | Non-Union | Union | Total | |||||||||||||||||||||||||||||||||||||||||||||||||
Sub-holding company | ||||||||||||||||||||||||||||||||||||||||||||||||||||||||||||||||
Sub-holding company: | ||||||||||||||||||||||||||||||||||||||||||||||||||||||||||||||||
Coca-Cola FEMSA | 35,364 | 33,085 | 68,449 | 35,734 | 31,692 | 34,773 | 30,248 | 32,272 | 41,123 | 73,395 | 32,362 | 37,517 | 69,879 | 26,118 | 33,085 | 59,203 | ||||||||||||||||||||||||||||||||||||||||||||||||
FEMSA Comercio | 51,919 | 21,182 | 73,101 | 43,142 | 17,760 | 37,252 | 16,342 | 59,358 | 32,585 | 91,943 | 56,914 | 26,906 | 83,820 | 51,919 | 21,182 | 73,101 | ||||||||||||||||||||||||||||||||||||||||||||||||
Other | 6,270 | 5,989 | 12,259 | 6,592 | 4,947 | 6,186 | 4,488 | 9,371 | 7,551 | 16,922 | 8,043 | 6,628 | 14,671 | 6,270 | 5,989 | 12,259 | ||||||||||||||||||||||||||||||||||||||||||||||||
Total | 93,553 | 60,256 | 153,809 | 85,468 | 54,399 | 78,211 | 51,078 | 101,001 | 81,259 | 182,260 | 97,319 | 71,051 | 168,370 | 84,307 | 60,256 | 144,563 | ||||||||||||||||||||||||||||||||||||||||||||||||
| (1) |
| Includes employees of third-party distributors |
| Includes non-management store employees, |
As of December 31, 2010,2012, our subsidiaries had entered into 274306 collective bargaining or similar agreements with personnel employed at our operations. Each of the labor unions in Mexico is associated with one of eight different national Mexican labor organizations. In general, we have a good relationship with the labor unions throughout our operations, except for in Colombia, Venezuela and Venezuela,Guatemala which are or have been the subject of significant labor-related litigation.litigation. See “Item 8. Financial Information—Legal Proceedings—Coca-Cola FEMSA.” The agreements applicable to our Mexican operations generally have an indefinite term and provide for an annual salary review and for review of other terms and conditions, such as fringe benefits, every two years.
The table below sets forth the number of collective bargaining agreements and unions for our employees:
Collective Bargaining Labor Agreements Between
Sub-holding Companies and Unions
As of December 31, 20102012
Sub-holding Company | Collective Bargaining Agreements | Labor Unions | Collective Bargaining Agreements | Labor Unions | ||||||||||||
Coca-Cola FEMSA | 104 | 68 | 126 | 82 | ||||||||||||
FEMSA Comercio(1) | 96 | 4 | 106 | 4 | ||||||||||||
Others | 72 | 11 | 74 | 18 | ||||||||||||
Total | 274 | 83 | 306 | 104 | ||||||||||||
| (1) | Does not include non-management store employees, who are employed directly by each individual store. |
| ITEM 7. | MAJOR SHAREHOLDERS AND RELATED PARTY TRANSACTIONS |
The following table identifies each owner of more than 5% of any class of our shares known to the company as of April 30, 2011.March 15, 2013. Except as described below, we are not aware of any holder of more than 5% of any class of our shares. Only the Series B Shares have full voting rights under our bylaws.
Ownership of Capital Stock as of April 30, 2011March 15, 2013
| Series B Shares(1) | Series D-B Shares(2) | Series D-L Shares(3) | Total Shares of FEMSA Common Stock | Series B Shares(1) | Series D-B Shares(2) | Series D-L Shares(3) | Total Shares of FEMSA Capital Stock | |||||||||||||||||||||||||||||||||||||||||||||||||
| Shares Owned | Percent of Class | Shares Owned | Percent of Class | Shares Owned | Percent of Class | Shares Owned | Percent of Class | Shares Owned | Percent of Class | Shares Owned | Percent of Class | |||||||||||||||||||||||||||||||||||||||||||||
Shareholder | ||||||||||||||||||||||||||||||||||||||||||||||||||||||||
Technical Committee and Trust Participants under the Voting Trust(4) | 6,922,159,485 | 74.86 | % | — | 0 | % | — | 0 | % | 38.69 | % | 6,922,159,485 | 74.86 | % | — | — | — | — | 38.69 | % | ||||||||||||||||||||||||||||||||||||
William H. Gates III(5) | 281,053,490 | 3.04 | % | 562,106,980 | 13.00 | % | 562,106,980 | 13.00 | % | 7.85 | % | |||||||||||||||||||||||||||||||||||||||||||||
Aberdeen Asset Management PLC(6) | 196,577,170 | 2.13 | % | 393,154,340 | 9.10 | % | 393,154,340 | 9.10 | % | 5.49 | % | |||||||||||||||||||||||||||||||||||||||||||||
Aberdeen Asset Management PLC(5) | 282,293,390 | 3.05 | % | 564,586,780 | 13.06 | % | 564,586,780 | 13.06 | % | 7.89 | % | |||||||||||||||||||||||||||||||||||||||||||||
William H. Gates III(6) | 281,053,490 | 3.04 | % | 562,106,980 | 13.00 | % | 562,106,980 | 13.00 | % | 7.85 | % | |||||||||||||||||||||||||||||||||||||||||||||
| (1) | As of |
| (2) | As of |
| (3) | As of |
| (4) | As a consequence of the voting trust’s internal procedures, the following trust participants are deemed to have beneficial ownership with shared voting power over those same deposited shares: BBVA Bancomer, |
| (5) | As reported on Schedule |
| (6) | Includes aggregate shares beneficially owned by Cascade Investments, LLC, over which William H. Gates III has sole voting and dispositive power, and shares beneficially owned by the Bill and Melinda Gates Foundation Trust, over which William H. Gates III and Melinda French Gates have shared voting and dispositive power. |
As of June 10, 2011,February 28, 2013, there were 4448 holders of record of ADSs in the United States, which represented approximately 58%56% of our outstanding BD Units. Since a substantial number of ADSs are held in the name of nominees of the beneficial owners, including the nominee of The Depository Trust Company, the number of beneficial owners of ADSs is substantially greater than the number of record holders of these securities.
The trust participants, who are our principal shareholders, agreed in Aprilon May 6, 1998 to deposit a majority of their shares, which we refer to as the trust assets, of FEMSA into the voting trust, and later entered into an amended agreement on August 8, 2005, following the substitution by Banco Invex, S.A. as trustee to the voting trust.trust, which agreement was subsequently renewed on March 15, 2013. The primary purpose of the voting trust is to permit the trust assets to be voted as a block, in accordance with the instructions of the technical committee.committee of the voting trust. The trust participants are separated into seven trust groups and the technical committee is comprised of one representative appointed by each trust group. The number of B Units corresponding with each trust group (the proportional share of the shares deposited in the trust of such group) determines the number of votes that each trust representative has on the technical committee. Most matters are decided by a simple majority of the trust assets.
The trust participants agreed to certain transfer restrictions with respect to the trust assets. The trust is irrevocable, for a term that will conclude on May 31, 2013January 17, 2020 (subject to additional five-year renewal terms), during which time, trust assets may be transferred by trust participants to spouses and immediate family members and, subject to certain conditions, to companies that are 100% owned by trust participants, which we refer to as the permitted transferees, provided in all cases that the transferee agrees to be bound by the terms of the voting trust. In the event that a trust participant wishes to sell part of its trust assets to someone other than a permitted transferee, the other trust participants have a right of first refusal to purchase the trust assets that the trust participant wishes to sell. If none of the trust participants elects to acquire the trust assets from the selling trust participant, the technical committee will have a right to nominate (subject to the approval of technical committee members representing 75% of the trust assets, excluding trust assets that are the subject of the sale) a purchaser for such trust assets. In the event that none of the trust participants or a nominated purchaser elects to acquire trust assets, the selling trust participant will have the right to sell the trust assets to a third-party on the same terms and conditions that were offered to the trust participants. Acquirors of trust assets will only be permitted to become parties to the voting trust upon the affirmative vote by the technical committee of at least 75% of the trust shares, which must include trust shares represented by at least three trust group representatives. In the event that a trust participant holding a majority of the trust assets elects to sell its trust assets, the other trust participants have “tag along” rights that will enable them to sell their trust assets to the acquiror of the selling trust participant’s trust assets.
Because of their ownership of a majority of the Series B Shares, the trust participants may be deemed to control our company. Other than as a result of their ownership of the Series B Shares, the trust participants do not have any voting rights that are different from those of other shareholders.
Interest of Management in Certain Transactions
The following is a summary of the main transactions we have entered into with entities for which members of our board of directors or management serve as a member of the board of directors or management. Each of these transactions was entered into in the ordinary course of business, and we believe each is on terms comparable to those that could be obtained in arm’s length negotiations with unaffiliated third parties. Under our by-laws,bylaws, transactions entered with related parties not in the ordinary course of business are subject to the approval of our board of directors, subject to the prior opinion of the corporate practices committee.
On April 30, 2010, José Antonio Fernández Carbajal, our Chairman and Chief Executive Officer, started to serve as a member of the Board of Directors of Heineken Holding, N.V. and the Supervisory Board of Heineken N.V. Javier Astaburuaga Sanjines, our Chief Financial and Strategic Development Officer, also serves on the supervisory Board of Heineken N.V. as of April 30, 2010. Since that date, FEMSA Comercio’sWe made purchases of beer in the ordinary course of business from Cuauhtémoc Moctezuma (a wholly-owned subsidiary of the Heineken Group) amounted toGroup in the amount of Ps. 7,0639,397 million for the last eight months of 2010. During the same period, wein 2011 and Ps. 11,013 million in 2012. We also supplied logisticlogistics and administrative services to
subsidiaries of Heineken for a total of Ps. 7062,169 million in 2011 and Ps. 3422,979 million respectively.in 2012. As of the end of December 31, 20102012 and 2011, our net balance due to Heineken amounted to Ps. 1,038 million.1,477 million and Ps. 1,291 million, respectively.
We, along with certain of our subsidiaries, regularly engage in financing and insurance coverage transactions, including entering into loans and bond offerings in the local capital markets, and credit line facilities, with subsidiaries of BBVA Bancomer, a financial services holding company of which Alberto Bailleres González, Ricardo Guajardo Touché, José Antonio Fernández Carbajal, our Chairman and Chief Executive Officer, Alberto Bailleres González and Ricardo Guajardo TouchéBarbara Garza Lagüera Gonda , who are also directors of FEMSA, are directors.directors, and for which José Manuel Canal Hernando, also a director of FEMSA, serves as Statutory Auditor. We made interest expense payments and fees paid to BBVA Bancomer in respect of these transactions of Ps. 108 million, Ps. 260Ps.205 million and Ps. 235128 million as of the end of December 31, 2010, 20092012 and 2008,2011, respectively. The total amount due to BBVA Bancomer as of the end of December 31, 20102012 and 2009 were2011 was Ps. 9991,136 million and Ps. 4,1121,076 million, respectively, and we also havehad a receivable balance with BBVA Bancomer of Ps. 2,9442,299 million and Ps. 4,4742,791 million, respectively, as of the end of December 31, 20102012 and 2009.
We maintain an insurance policy covering auto insurance and medical expenses for executives issued by Grupo Nacional Provincial, S.A., an insurance company of which the chairman of the board is Alberto Bailleres González, one of our directors. The aggregate amount of premiums paid under these policies was approximately Ps. 69 million, Ps. 78 million and Ps. 57 million in 2010, 2009 and 2008, respectively.2011.
We regularly engage in the ordinary course of business in hedging transactions, and enter into loans and credit line facilities on an arm’s length basis with subsidiaries of Grupo Financiero Banamex, S.A. de C.V., or Grupo Financiero Banamex, a financial services holding company in which Lorenzo Zambrano Treviño, who servedqualified as a director of FEMSAour related party until March 2011, also serves as a director of Grupo Financiero Banamex.2011. The interest expense and fees paid to Grupo Financiero Banamex as of December 31, 2010, 20092011 was Ps. 28 million.
We maintain an insurance policy covering medical expenses for executives issued by Grupo Nacional Provincial, S.A.B., an insurance company of which Alberto Bailleres González and 2008 wereMax Michel Suberville, who are also directors of FEMSA, and Juan Guichard Michel, who is an alternate director of FEMSA, are directors. The aggregate amount of premiums paid under these policies was approximately Ps. 56 million, Ps. 6157 million and Ps. 50 million, respectively; and we also have a balance of Ps. 2,103 as of the end of December 31, 2010 and the total amount due to Grupo Financiero Banamex as of December 31, 2010 and 2009, was Ps. 50059 million in each year.2012 and 2011, respectively.
We, along with certain of our subsidiaries, spent Ps. 37 million, Ps. 13124 million and Ps. 2086 million in the ordinary course of business in 2010, 20092012 and 2008,2011, respectively, in publicity and advertisement purchased from Grupo Televisa, S.A.B., a media corporation in which our Chairman and Chief Executive Officer, José Antonio Fernández Carbajal, and two of our Directors, Alberto Bailleres González and Michael Larson, serve as directors.
Coca-Cola FEMSA, in its ordinary course of business, purchased Ps. 1,206 million, Ps. 1,0441,577 million and Ps. 8631,248 million in 2010, 20092012 and 2008,2011, respectively, in juices from subsidiaries of Jugos del Valle.
In October 2011, Coca-Cola FEMSA executed certain agreements with affiliates of Grupo Tampico to acquire specific products and services such as plastic cases, certain truck and car brands, as well as auto parts, exclusively for the territories of Grupo Tampico. The agreements provide for certain preferences to be elected as suppliers in Coca-Cola FEMSA’s suppliers’ bidding processes.
FEMSA Comercio, in its ordinary course of business, purchased Ps. 2,018 million, Ps. 1,7332,394 million and Ps. 1,5782,270 million in 2010, 20092012 and 2008,2011, respectively, in baked goods and snacks for its stores from subsidiaries of Grupo Bimbo, of which the chairmanRicardo Guajardo Touché, one of the boardFEMSA’s directors, is Roberto Servitje Sendra, who served as a director of FEMSA until March 2011. Additionally,director. FEMSA Comercio also purchased Ps. 1,883 million, Ps. 1,413408 million and Ps. 1,439316 million in 2010, 20092012 and 2008,2011, respectively, in cigarettesjuices from British American Tobacco Mexico (BAT Mexico),subsidiaries of which Alfredo Livas Cantú, who is member of the board of directors of FEMSA, is also a member of the board of directors. These purchases were entered into in the ordinary course of business, and we believe they were made on terms comparable to those that could be obtained in arm’s length negotiations with unaffiliated third parties.Jugos del Valle.
José Antonio Fernández Carbajal, Eva Garza Lagüera Gonda, Mariana Garza Lagüera Gonda, Ricardo Guajardo Touché, Alfonso Garza Garza and Armando Garza Sada, who are directors or alternate directors of FEMSA, are also members of the board of directors of ITESM, which is a prestigious university system with headquarters in Monterrey, Mexico that routinely receives donations from FEMSA and its subsidiaries. As ofFor the end ofyears ended December 31, 2010, 20092012 and 2008,2011, donations to ITESM amounted to Ps. 63 million, Ps. 72109 million and Ps. 4981 million, respectively.
José Antonio Fernández Carbajal, Alfonso Garza Garza, Federico Reyes Garcia, and Javier Astaburuaga Sanjines, who are directors, alternate directors and senior officers of FEMSA, are also members of the board of directors of Fundación FEMSA, A.C., which is a social investment instrument for communities in Latin America. For the years ended December 31, 2012 and 2011, donations to Fundación FEMSA, A.C. amounted to Ps. 864 million and Ps. 46 million, respectively.
Business Transactions between Coca-Cola FEMSA, FEMSA and The Coca-Cola Company
Coca-Cola FEMSA regularly engages in transactions with The Coca-Cola Company and its affiliates. Coca-Cola FEMSA purchases all of its concentrate requirements forCoca-Cola trademark beverages from The
Coca-Cola Company. Total payments byexpenses charged to Coca-Cola FEMSA toby The Coca-Cola Company for concentrates were approximately Ps. 19,371 million, Ps. 16,86323,886 million and Ps. 13,51820,882 million in 2010, 20092012 and 2008,2011, respectively. Coca-Cola FEMSA and The Coca-Cola Company pay and reimburse each other for marketing expenditures. The Coca-Cola Company also contributes to Coca-Cola FEMSA’s coolers, bottles and casescase investment program. Coca-Cola FEMSA received contributions to its marketing expenses and the coolers investment program, of Ps. 2,386 million, Ps. 1,9453,018 million and Ps. 1,9952,595 million in 2010, 20092012 and 2008,2011, respectively.
In December 2007 and in May 2008, Coca-Cola FEMSA sold most of its proprietary brands to The Coca-Cola Company. The proprietary brands are now being licensed back to Coca-Cola FEMSA by The Coca-Cola Company pursuant to Coca-Cola FEMSA’s bottler agreements. The December 2007 transaction was valued at US$ 48 million and the May 2008 transaction was valued at US$ 16 million. Coca-Cola FEMSA believes that both of these transactions were conducted on an arm’s length basis. Revenues from the sale of proprietary brands realized in prior years in which Coca-Cola FEMSA has a significant continuing involvement are deferred and amortized against the related costs of future sales over the estimated sales period. The balance to be amortized amounted to Ps. 547 million, Ps. 61698 million and Ps. 571302 million as of December 31, 2010, 20092012 and 2008,2011, respectively. The short-term portions are included in other current liabilities as of December 31, 2010, 2009 and 2008, and amounted to Ps. 276 million, Ps. 203 million and Ps. 139 million, respectively.liabilities. The long-term portions are included in other liabilities.
In Argentina, Coca-Cola FEMSA purchases a portion of its pre-formed plastic ingot requirements for producing plastic bottles and all ofingots, as well as its returnable plastic bottle requirementsbottles from Embotelladora del Atlántico S.A., a local subsidiary of Embotelladora Andina, S.A., a Coca-Cola bottler with operations in Argentina, Chile and Brazil in which The Coca-Cola Company has a substantial interest.
In Argentina, Coca-Cola FEMSA mainly uses High Fructose Corn Syrup that Coca-Cola FEMSA purchases from several different local suppliers as a sweetener in its products instead of sugar. Coca-Cola FEMSA purchases glass bottles, plastic cases and other raw materials from several domestic sources. Coca-Cola FEMSA purchases pre-formed plastic ingots, as well as returnable plastic bottles, at competitive prices from Embotelladora del Atlántico S.A., a local subsidiary of Embotelladora Andina S.A., a bottler of The Coca-Cola Company with operations in Argentina, Chile and Brazil, and other local suppliers. Coca-Cola FEMSA also acquires pre-formed plastic ingots from ALPLA Avellaneda S.A. and other suppliers.
In November 2007, Administración S.A.P.IS.A.P.I., a Mexican company owned directly or indirectly by Coca-Cola FEMSA and The Coca-Cola Company, acquired 100% of the shares of capital stock of Jugos del Valle. The business of Jugos del Valle in the United States was acquired and sold by The Coca-Cola Company. In June 2008, Administración S.A.P.I. and Jugos del Valle (surviving company) were merged. Subsequently, Coca-Cola FEMSA, and The Coca-Cola Company and all Mexican and BrazilianCoca-Colabottlers entered into a joint business for the Mexican and the Brazilian operations, respectively, of Jugos del Valle, through transactions completed during 2008.Valle. Taking into account the participation held by Grupo Fomento Queretano, Coca-Cola FEMSA currently holds an interest of approximately 20%25.1% in each of the Mexican joint business and approximately 19.7% in the Brazilian joint businesses. Jugos del Valle sells fruit juice-based beverages and fruit derivatives. Coca-Cola FEMSA distributes the Jugos del Valle line of juice-based beverages in Brazil and its territories in Latincentro.
In February 2009, Coca-Cola FEMSA acquired with The Coca-Cola Company theBrisa bottled water business in Colombia from Bavaria, S.A., a subsidiary of SABMiller.SABMiller plc. Coca-Cola FEMSA acquired the production assets and the rights to distribute in thedistribution territory, and The Coca-Cola Company acquired theBrisa brand. Coca-Cola FEMSA and The Coca-Cola Company equally shared in paying the purchase price of US$ 92 million. Following a transition period, in June 2009, Coca-Cola FEMSA started to sell and distribute theBrisa portfolio of products in Colombia.
In May 2009, Coca-Cola FEMSA completed a transaction to develop theCrystal trademark water business in Brazil jointly with The Coca-Cola Company.
In August 2010, Coca-Cola FEMSA acquired from The Coca-Cola Company along with other BrazilianCoca-Colabottlers the business operations of theMatte LeaoLeãotea brand. As of March 31, 2013 Coca-Cola FEMSA currently has a 13.84%19.4% indirect interest in theMatte Leão business in Brazil.
In September 2010, FEMSA sold Promotora to The Coca-Cola Company. Promotora was the owner of theMundet brands of soft drinks in Mexico.
In March 2011, Coca-Cola FEMSA, together with The Coca-Cola Company and through Compañía Panameña de Bebidas S.A.P.I. de C.V., acquired Grupo Estrella Azul, a Panamanian conglomerate that participates in the dairy and juice-based beverage categories in Panama. Coca-Cola FEMSA will continue to develop this business jointly with The Coca-Cola Company.
In March 2011, with The Coca-Cola Company, through Compañía de Bebidas Panameñas S.A.P.I. de C.V. Coca-Cola FEMSA entered into several credit agreements, pursuant to which it lent an aggregate amount of US$ 112.3 million to Estrella Azul. Subject to certain events which could lead to an acceleration of payments, the principal balance of the Credit Facilities is payable in one installment on March 24, 2021.
In August 2012, Coca-Cola FEMSA acquired, throughJugos del Valle, an indirect participation in Santa Clara, an important producer of milk and dairy products in Mexico. Coca-Cola FEMSA currently owns an indirect participation of 23.8% in Santa Clara.
In December, 2012, Coca-Cola FEMSA reached an agreement with The Coca-Cola Company to acquire a 51% non-controlling majority stake of CCBPI for US $688.5 million in an all-cash transaction. Coca-Cola FEMSA closed this transaction on January 25, 2013. The implied enterprise value of 100% of CCPBI is US$ 1,350 million. Coca-Cola FEMSA will have an option to acquire all of the remaining 49% of the capital stock of CCBPI at any time during the seven years following the closing, at the same enterprise value adjusted for a carrying cost and certain other adjustments. Coca-Cola FEMSA will have a put option, exercisable six years after the initial closing, to sell its ownership in CCBPI back to The Coca-Cola Company at a price that will be calculated using the same EBITDA multiple used in the acquisition of the 51% stake of CCBPI, capped at the aggregate enterprise value for the amount acquired, adjusted for certain items. Coca-Cola FEMSA will be managing the day-to-day operations of the business. The Coca-Cola Company will have certain rights on the operational business plan. Given the terms of both the options agreements and Coca-Cola FEMSA’s shareholders agreement with The Coca-Cola Company, Coca-Cola FEMSA will not consolidate the results of CCBPI. Coca-Cola FEMSA will recognize the results of CCBPI using the equity method. CCBPI sold approximately 531 million unit cases of beverages during 2012 and generated revenues of approximately US$ 1.1 billion.See “Item 19. Exhibits—Exhibit 4.28.”
| ITEM 8. | FINANCIAL INFORMATION |
Consolidated Financial Statements
See pages F-1 through F-145,F-144, incorporated herein by reference.
For a discussion of our dividend policy, seeSee “Item 3. Key Information—Dividends” and “Item 10. Additional Information.”
We are party to various legal proceedings in the ordinary course of business. Other than as disclosed in this annual report, we are not currently involved in any litigation or arbitration proceeding, including any proceeding that is pending or threatened of which we are aware, which we believe will have, or has had, a material adverse effect on our company. Other legal proceedings that are pending against or involve us and our subsidiaries are incidental to the conduct of our and their business. We believe that the ultimate disposition of such other proceedings individually or on an aggregate basis will not have a material adverse effect on our consolidated financial condition or results from operations.results.
Coca-Cola FEMSA
Mexico
Antitrust Matters
During 2000, theComisión Federal de Competencia in Mexico (Mexican Antitrust Commission or CFC), CFC, pursuant to complaints filed by PepsiCo.PepsiCo and certain of its bottlers in Mexico, began an investigation of The Coca-Cola Company Export Corporation (TCCEC)(TCECC) and the Mexican Coca-Cola bottlers for alleged monopolistic practices through exclusivity arrangements with certain retailers.
Nine of Coca-Cola FEMSA’s Mexican subsidiaries, including those that it acquired as a result of its merger with Grupo CIMSA, Grupo Tampico’s beverage division, and Grupo Fomento Queretano, are involved in this matter. After the corresponding legal proceedings in 2008, in theTribunal Colegiado de Circuito (Mexicana Mexican Federal Court), a finalCourt rendered an adverse judgment was rendered against two out of the sixCoca-Cola FEMSA’s nine Mexican Coca-Cola FEMSA subsidiaries involved in the proceedings, upholding a fine of approximately Ps. 10.5 million imposed by CFC on each of the two subsidiaries and ordering the immediate suspension of such practices of alleged exclusivity arrangements and conditional dealing. The Mexican Supreme Court decided to resolve the proceedings withWith respect to the complaints against the remaining fourseven subsidiaries, and on June 9, 2010, thea favorable resolution was rendered in Mexican Federal Court orderedand the CFC, to reconsider certain aspects of these proceedings. In March 2011,which ruling dropped the CFCfines and ruled in favor of six of Coca-Cola FEMSA’s subsidiaries, on the grounds of insufficient evidence to prove individual and specific liability of its subsidiaries in the alleged antitrust violations. PepsiCoOn August 7, 2012, the court dismissed and denied an appeal that Coca-Cola FEMSA filed on behalf of Grupo Fomento Queretano, which had received an adverse judgment. Coca-Cola FEMSA filed a motion for an administrative recourse against the CFC’sreconsideration on September 12, 2012 and is awaiting final resolution.
In February 2009, the CFC began a new investigation of alleged monopolistic practices consisting of sparkling beverage sales subject to exclusivity agreements and the granting of discounts and/or benefits in exchange for exclusivity arrangements with certain retailers. As part ofIn December 2011, the CFC closed this investigation on the CFC has been requiring several Coca-Cola bottlers in Mexico to deliver information regarding their commercial practices and Coca-Cola FEMSA was required to do so in February 2010. In the event that the CFC findsgrounds of insufficient evidence of monopolistic practices it may begin administrative proceedings against the companies involved. We cannot determine the scope of the investigation at this time.
Central America
Antitrust Matters in Costa Rica
During August 2001, theComisión para Promover la Competenciain Costa Rica (Costa Rican Antitrust Commission), pursuant to a complaint filed by PepsiCo. and its bottler in Costa Rica, initiated an investigation of the sales practices of The Coca-Cola Company and Coca-Cola FEMSA’s Costa Rican subsidiary for alleged monopolistic practices in retail distribution, including sales exclusivity arrangements. A ruling fromits bottlers. However, on February 9, 2012 the Costa Rican Antitrust Commission was issued in July 2004, which found Coca-Cola FEMSA’s subsidiary in Costa Rica engaged in monopolistic practices with respect to exclusivity arrangements, pricing andplaintiff appealed the sharing of coolers under certain limited circumstances and imposed a fine of US$ 130,000 (approximately Ps. 1.5 million). Coca-Cola FEMSA’s appealdecision of the Costa Rican Antitrust Commission’s ruling was dismissed. Coca-Cola FEMSACFC. The CFC confirmed its initial ruling. In a related case, a Circuit Court has filed judicial proceedings challengingruled that the rulingCFC must reexamine part of the Costa Rican Antitrust Commission andevidence originally provided by a plaintiff. It is currently unclear how the process is still pending in court. We believe thatCFC will rule upon this matter will not have a material adverse effect on its financial condition or results from operations.
In November, 2004,Ajecen del Sur S.A., the bottler ofBig Cola in Costa Rica, filed a complaint before the Costa Rican Antitrust Commission related to monopolistic practices in retail distribution and exclusivity agreements against The Coca-Cola Company and Coca-Cola FEMSA’s Costa Rican subsidiary. The Costa Rican Antitrust Commission has decided to pursue an investigation. The period for gathering of evidence ended in August 2008, and the final arguments have been filed. Coca-Cola FEMSA expects that the maximum fine that could be imposed is US$ 300,000 (approximately Ps. 3.5 million). Coca-Cola FEMSA is waiting for the final resolution to be issued by the Costa Rican Antitrust Commission.appeal.
Colombia
Labor Matters
During July 2001, a labor union and several individuals from the Republic of Colombia filed a lawsuit in the U.S. District Court for the Southern District of Florida against certain of Coca-Cola FEMSA’s subsidiaries. The plaintiffs alleged that the subsidiaries engaged in wrongful acts against the labor union and its members in Colombia, including kidnapping, torture, death threats and intimidation. The complaint alleges claims under the U.S. Alien Tort Claims Act, Torture Victim Protection Act, Racketeer Influenced and Corrupt Organizations Act and state tort law and seeks injunctive and declaratory relief and damages of more than US$ 500 million, including treble and punitive damages and the cost of the suit, including attorney fees. In September 2006, the federal district court dismissed the complaint with respect to all claims. The plaintiffs appealed and in August 2009, the Appellate Court affirmed the decision in favor of Coca-Cola FEMSA’s subsidiaries. The plaintiffs moved for a rehearing, and in September 2009, the rehearing motion was denied. Plaintiffs attempted to seek reconsiderationen banc, but so far, the court has not considered it.Court dismissed the entire case for lack of jurisdiction and such resolution is final and cannot be appealed.
Venezuela
Tax Matters
In 1999, some of Coca-Cola FEMSA’s Venezuelan subsidiaries received notice of indirect tax claims asserted by the Venezuelan tax authorities. These subsidiaries have taken the appropriate measures against these claims at the administrative level and filed appeals with the Venezuelan courts. The claims currently amount to approximately US$ 21.1 million (approximately Ps. 250 million). Coca-Cola FEMSA has certain rights to indemnification from Venbottling Holding, Inc., a former shareholder of Panamco and The Coca-Cola Company, for a substantial portion of the claims. Coca-Cola FEMSA does not believe that the ultimate resolution of these cases will have a material adverse effect on its financial condition or results from operations.results.
Brazil
Antitrust Matters
Several claims have been filed against Coca-Cola FEMSA by private parties that allege anticompetitive practices by Coca-Cola FEMSA’s Brazilian subsidiaries. The plaintiffs are Ragi (Dolly), a Brazilian producer of “B Brands,” and PepsiCo, alleging anticompetitive practices by Spal Indústria Brasileira de Bebidas, S.A. and Recofarma Indústria do Amazonas Ltda. Of the four claims Dolly filed against Coca-Cola FEMSA,us, the only one remaining concerns a denial of access to common suppliers. Of the two claims made by PepsiCo, the first concerns exclusivity arrangements at the point of sale, and the second is aan alleged corporate espionage allegation against the Pepsi bottler, BAESA, which the Ministry of Economy recommended to be dismissed for lack of evidence. Under Brazilian law, each of these claims could result in substantial monetary fines and other penalties although Coca-Cola FEMSA believeswe believe each of the claims is without merit. Regarding the claims made by Pepsico, in December 2012, the Administrative Council of Economic Defense (“CADE”) issued a decision dismissing the claim related to exclusivity arrangements at the point of sale. Also in December 2012, CADE issued a technical note advocating dismissal of the claim related to an alleged corporate espionage against the Pepsi bottler, BAESA, for lack of evidence. Currently, we are awaiting the final decision.
Since December 31, 2010, the followingExcept as disclosed under “Recent Developments” in Item 5, no significant changes have occurred since the date of the annual financial statements included in our business, each of which is described in more detail in “Item 5. Operating and Financial Review and Prospects—Recent Developments” and in Note 30 to our audited consolidated financial statements:this annual report.
On March 17, 2011 a consortium of investors formed by FEMSA, the Macquarie Mexican Infrastructure Fund and other investors, acquired Energia Alterna Istmeña, S. de R.L. de C.V. (EAI) and Energia Eólica Mareña, S.A. de C.V. (EEM), from subsidiaries of Preneal, S.A. for a transaction enterprise value of Ps. 1,063.5 million. FEMSA owns a 45% interest in the consortium.
On March 28, 2011, Coca-Cola FEMSA, together with The Coca-Cola Company, completed the acquisition of Grupo Estrella Azul, a Panamanian conglomerate that participates in the dairy and juice-based beverage categories in Panama.
| ITEM 9. | THE OFFER AND LISTING |
We have three series of capital stock, each with no par value:
Series B Shares;
Series D-B Shares; and
Series D-L Shares.
Series B Shares have full voting rights, and Series D-B and D-L Shares have limited voting rights. The shares of our company are not separable and may be transferred only in the following forms:
B Units, consisting of five Series B Shares; and
BD Units, consisting of one Series B Share, two Series D-B Shares and two Series D-L Shares.
At our AGM held on March 29, 2007, our shareholders approved a three-for-one stock split in respect all of our outstanding capital stock.stock, which became effective in May 2007. Following the stock split, our total capital stock consists of 2,161,177,770 BD Units and 1,417,048,500 B Units. Our stock split also resulted in a three-for-one stock split of our American Depositary Shares.ADSs. The stock-split was conducedconducted on a pro-rata basis in respect of all holders of our shares and all ADSsADS holders of record as of May 25, 2007, and the ratio of voting and non-voting shares was maintained, thereby preserving our ownership structure as it was prior to the stock-split.
On April 22, 2008, FEMSA shareholders approved a proposal to amend our bylaws in order to preserve the unit structure for our shares that has been in place since May 1998, and to maintain our existing share structure beyond May 11, 2008, absent further shareholder action.
Previously, our bylaws provided that on May 11, 2008, each Series D-B Share would automatically convert into one Series B Share with full voting rights, and each Series D-L Share would automatically convert into one Series L Share with limited voting rights. At that time:
the BD Units and the B Units would cease to exist and the underlying Series B Shares and Series L Shares would be separate; and
the Series B Shares and Series L Shares would be entitled to share equally in any dividend, and the dividend preferences of the Series D-B Shares and Series D-L Shares of 125% of any amount distributed in respect of each Series B Share existing prior to May 11, 2008, would be terminated.
However, following the April 22, 2008, shareholder approvals, these changes will no longer occur and instead our share and unit structure will remain unchanged, absent shareholder action, as follows:
the BD Units and the B Units will continue to exist; and
the dividend preferences of the Series D-B Shares and Series D-L Shares of 125% of any amount distributed in respect of each Series B Share will continue to exist.
The following table sets forth information regarding our capital stock as of MayMarch 31, 2011:2013:
| Number | Percentage of Capital | Percentage of Full Voting Rights | Number | Percentage of Capital | Percentage of Full Voting Rights | |||||||||||||||||||
Class | ||||||||||||||||||||||||
Series B Shares (no par value) | 9,246,420,270 | 51.68 | % | 100 | % | 9,246,420,270 | 51.68 | % | 100 | % | ||||||||||||||
Series D-B Shares (no par value) | 4,322,355,540 | 24.16 | % | 0 | % | 4,322,355,540 | 24.16 | % | 0 | % | ||||||||||||||
Series D-L Shares (no par value) | 4,322,355,540 | 24.16 | % | 0 | % | 4,322,355,540 | 24.16 | % | 0 | % | ||||||||||||||
Total Shares | 17,891,131,350 | 100 | % | 100 | % | 17,891,131,350 | 100 | % | 100 | % | ||||||||||||||
Units | ||||||||||||||||||||||||
BD Units | 2,161,177,770 | 60.38 | % | 23.47 | % | 2,161,177,770 | 60.40 | % | 23.47 | % | ||||||||||||||
B Units | 1,417,848,500 | 39.62 | % | 76.63 | % | 1,417,048,500 | 39.60 | % | 76.63 | % | ||||||||||||||
Total Units | 3,578,226,270 | 100 | % | 100 | % | 3,578,226,270 | 100 | % | 100 | % | ||||||||||||||
Since May 11, 1998, ADSs representing BD Units have been listed on the New York Stock Exchange,NYSE, and the BD Units and the B Units have been listed on the Mexican Stock Exchange. Each ADS represents 10 BD Units deposited under the deposit agreement with the ADS depositary. As of June 10, 2011,February 28, 2013, approximately 58%56% of BD Units traded in the form of ADSs.
The New York Stock ExchangeNYSE trading symbol for the ADSs is “FMX” and the Mexican Stock Exchange trading symbols are “FEMSA UBD” for the BD Units and “FEMSA UB” for the B Units.
Fluctuations in the exchange rate between the Mexican peso and the U.S. dollar have affected the U.S. dollar equivalent of the Mexican peso price of our shares on the Mexican Stock Exchange and, consequently, have also affected the market price of our ADSs.See “Item 3. Key Information—Exchange Rate Information.”
Trading on the Mexican Stock Exchange
The Mexican Stock Exchange, located in Mexico City, is the only stock exchange in Mexico. Founded in 1907, it is organized as asociedad anónima bursátil. Trading on the Mexican Stock Exchange takes place principally through automated systems and is open between the hours of 9:30 a.m. and 4:00 p.m. Eastern Time, each business day. Trades in securities listed on the Mexican Stock Exchange can also be effected off the exchange. The Mexican Stock Exchange operates a system of automatic suspension of trading in shares of a particular issuer as a
means of controlling excessive price volatility, but under current regulations this system does not apply to securities such as the BD Units that are directly or indirectly (for example, in the form of ADSs) quoted on a stock exchange (including for these purposes the New York Stock Exchange)NYSE) outside Mexico.
Settlement is effected three business days after a share transaction on the Mexican Stock Exchange. Deferred settlement, even by mutual agreement, is not permitted without the approval of theComisión Nacional Bancaria y de Valores (Mexican National Banking and Securities Commission or CNBV). CNBV. Most securities traded on the Mexican Stock Exchange, including ours, are on deposit withS.D. Indeval Instituto para el Depósito de Valores S.A. de C.V., which we refer to as Indeval, a privately owned securities depositary that acts as a clearinghouse for Mexican Stock Exchange transactions.
The following tables set forth, for the periods indicated, the reported high, low and closing sale prices and the average daily trading volumes for the B Units and BD Units on the Mexican Stock Exchange and the reported high, low and closing sale prices and the average daily trading volumes for the ADSs on the New York Stock Exchange.NYSE.
| B Units(1) | B Units(1) | |||||||||||||||||||||||||||||||||||||||||||
| Nominal pesos | Close US$(4) | Average Daily Trading Volume (Units) | Nominal pesos | Close US$(4) | Average Daily Trading Volume (Units) | |||||||||||||||||||||||||||||||||||||||
| High(2) | Low(2) | Close(3) | FX rate | High(2) | Low(2) | Close(3) | ||||||||||||||||||||||||||||||||||||||
2006 | 34.03 | 23.00 | 33.33 | 10.80 | 3.09 | 197,478 | ||||||||||||||||||||||||||||||||||||||
2007 | 42.33 | 31.79 | 37.00 | 10.92 | 3.39 | 1,814 | ||||||||||||||||||||||||||||||||||||||
2008 | 46.00 | 32.00 | 34.99 | 13.83 | 2.53 | 7,286 | 46.00 | 32.00 | 34.99 | 2.53 | 7,286 | |||||||||||||||||||||||||||||||||
2009 | 57.00 | 30.50 | 55.00 | 4.21 | 300 | |||||||||||||||||||||||||||||||||||||||
2010 | 57.99 | 44.00 | 57.9 | 4.68 | 1,629 | |||||||||||||||||||||||||||||||||||||||
2011 | ||||||||||||||||||||||||||||||||||||||||||||
First Quarter | 34.00 | 30.50 | 30.50 | 14.21 | 2.15 | 18 | 57.99 | 50.00 | 51.50 | 4.32 | 2,062 | |||||||||||||||||||||||||||||||||
Second Quarter | 38.79 | 31.00 | 35.60 | 13.17 | 2.70 | 556 | 58.00 | 51.50 | 58.00 | 4.95 | 975 | |||||||||||||||||||||||||||||||||
Third Quarter | 41.00 | 35.00 | 38.60 | 13.48 | 2.86 | 363 | 71.00 | 59.00 | 71.00 | 5.16 | 2,597 | |||||||||||||||||||||||||||||||||
Fourth Quarter | 57.00 | 38.00 | 55.00 | 13.06 | 4.21 | 440 | 81.00 | 78.05 | 78.05 | 5.59 | 795 | |||||||||||||||||||||||||||||||||
2010 | ||||||||||||||||||||||||||||||||||||||||||||
2012 | ||||||||||||||||||||||||||||||||||||||||||||
First Quarter | 55.00 | 44.00 | 48.50 | 12.30 | 3.94 | 1,900 | 82.00 | 75.00 | 80.50 | 6.28 | 872 | |||||||||||||||||||||||||||||||||
Second Quarter | 51.00 | 45.05 | 49.97 | 12.83 | 3.89 | 1,881 | 97.00 | 83.00 | 97.00 | 7.17 | 140 | |||||||||||||||||||||||||||||||||
Third Quarter | 51.99 | 47.50 | 50.50 | 12.63 | 4.00 | 1,364 | 94.00 | 89.70 | 91.49 | 6.95 | 3,615 | |||||||||||||||||||||||||||||||||
Fourth Quarter | 57.99 | 49.50 | 57.98 | 12.38 | 4.68 | 1,629 | 99.00 | 88.50 | 99.00 | 7.65 | 2,033 | |||||||||||||||||||||||||||||||||
October | 52.30 | 49.50 | 51.00 | 12.34 | 4.13 | 2,406 | 95.00 | 88.50 | 91.00 | 6.95 | 2,261 | |||||||||||||||||||||||||||||||||
November | 54.33 | 51.00 | 54.33 | 12.45 | 4.36 | 2,200 | 96.00 | 91.00 | 95.60 | 7.40 | 3,262 | |||||||||||||||||||||||||||||||||
December | 57.99 | 54.12 | 57.98 | 12.38 | 4.68 | 638 | 99.00 | 92.00 | 99.00 | 7.64 | 1,855 | |||||||||||||||||||||||||||||||||
2011 | ||||||||||||||||||||||||||||||||||||||||||||
2013 | ||||||||||||||||||||||||||||||||||||||||||||
January | 57.99 | 52.00 | 52.00 | 12.15 | 4.28 | 1,810 | 117.00 | 99.00 | 117.00 | 9.19 | 375 | |||||||||||||||||||||||||||||||||
February | 55.00 | 50.00 | 50.01 | 12.11 | 4.13 | 1,213 | 121.80 | 114.00 | 120.00 | 9.39 | 1,785 | |||||||||||||||||||||||||||||||||
March | 52.00 | 50.00 | 51.50 | 11.92 | 4.32 | 3,836 | 119.00 | 112.00 | 117.00 | 9.50 | 1,387 | |||||||||||||||||||||||||||||||||
First Quarter | 57.99 | 50.00 | 51.50 | 11.92 | 4.32 | 2,062 | 121.80 | 99.00 | 117.00 | 9.50 | 1,046 | |||||||||||||||||||||||||||||||||
April | 55.00 | 51.50 | 54.99 | 11.52 | 4.77 | 1,568 | ||||||||||||||||||||||||||||||||||||||
May | 56.00 | 53.00 | 56.00 | 11.58 | 4.83 | 1,374 | ||||||||||||||||||||||||||||||||||||||
June(5) | 56.00 | 56.00 | 56.00 | 11.87 | 4.72 | — | ||||||||||||||||||||||||||||||||||||||
| (1) | The prices and average daily trading volume for the B Units were taken from Bloomberg and reflect our 3:1 stock split, which was effective May 25, 2007. |
| (2) | High and low closing prices for the periods presented. |
| (3) | Closing price on the last day of the periods presented. |
| (4) | Represents the translation from Mexican pesos to U.S. dollars of the closing price of the B Units on the last day of the periods presented based on the noon buying rate for the purchase of U.S. dollars, as reported by the U.S. Federal Reserve |
| BD Units(1) | BD Units(1) | |||||||||||||||||||||||||||||||||||||||||||
| Nominal pesos | Close US$(4) | Average Daily Trading Volume (Units) | Nominal pesos | Close US$(4) | Average Daily Trading Volume (Units) | |||||||||||||||||||||||||||||||||||||||
| High(2) | Low(2) | Close(3) | FX rate | High(2) | Low(2) | Close(3) | ||||||||||||||||||||||||||||||||||||||
2006 | 42.25 | 25.69 | 41.72 | 10.80 | 3.86 | 2,368,706 | ||||||||||||||||||||||||||||||||||||||
2007 | 48.58 | 32.73 | 41.70 | 10.92 | 3.82 | 3,889,800 | ||||||||||||||||||||||||||||||||||||||
2008 | 49.19 | 26.10 | 41.37 | 13.83 | 2.99 | 3,089,044 | 49.19 | 26.10 | 41.37 | 2.99 | 3,089,044 | |||||||||||||||||||||||||||||||||
2009 | 63.20 | 30.49 | 62.65 | 4.80 | 3,011,747 | |||||||||||||||||||||||||||||||||||||||
2010 | 71.21 | 53.22 | 69.32 | 5.60 | 3,177,203 | |||||||||||||||||||||||||||||||||||||||
2011 | ||||||||||||||||||||||||||||||||||||||||||||
First Quarter | 44.24 | 30.49 | 35.86 | 14.21 | 2.52 | 3,032,889 | 70.61 | 64.01 | 69.85 | 5.86 | 2,562,803 | |||||||||||||||||||||||||||||||||
Second Quarter | 45.99 | 35.32 | 42.41 | 13.17 | 3.22 | 2,833,756 | 77.79 | 70.52 | 77.79 | 6.64 | 2,546,271 | |||||||||||||||||||||||||||||||||
Third Quarter | 52.26 | 40.98 | 51.38 | 13.48 | 3.81 | 2,637,506 | 91.39 | 75.28 | 90.16 | 6.55 | 3,207,475 | |||||||||||||||||||||||||||||||||
Fourth Quarter | 63.20 | 55.92 | 62.65 | 13.06 | 4.80 | 3,552,563 | 97.80 | 87.05 | 97.02 | 6.95 | 2,499,269 | |||||||||||||||||||||||||||||||||
2010 | ||||||||||||||||||||||||||||||||||||||||||||
2012 | ||||||||||||||||||||||||||||||||||||||||||||
First Quarter | 64.39 | 53.33 | 59.03 | 12.30 | 4.80 | 4,213,385 | 105.33 | 88.64 | 105.33 | 8.22 | 2,865,624 | |||||||||||||||||||||||||||||||||
Second Quarter | 58.94 | 53.22 | 55.68 | 12.83 | 4.34 | 3,066,006 | 121.25 | 105.73 | 119.03 | 8.80 | 1,955,790 | |||||||||||||||||||||||||||||||||
Third Quarter | 66.14 | 55.79 | 63.66 | 12.63 | 5.04 | 3,526,727 | 121.27 | 108.26 | 118.56 | 9.01 | 2,162,873 | |||||||||||||||||||||||||||||||||
Fourth Quarter | 71.21 | 62.58 | 69.32 | 12.38 | 5.60 | 3,177,203 | 130.64 | 116.41 | 129.31 | 9.99 | 2,135,503 | |||||||||||||||||||||||||||||||||
October | 68.27 | 62.58 | 67.98 | 12.34 | 5.51 | 4,128,790 | 123.80 | 117.54 | 117.92 | 9.01 | 1,928,946 | |||||||||||||||||||||||||||||||||
November | 70.71 | 67.04 | 70.60 | 12.45 | 5.67 | 3,244,960 | 127.71 | 116.41 | 126.66 | 9.81 | 2,176,913 | |||||||||||||||||||||||||||||||||
December | 71.21 | 68.73 | 69.32 | 12.38 | 5.60 | 2,249,443 | 130.64 | 124.66 | 129.31 | 9.97 | 2,341,957 | |||||||||||||||||||||||||||||||||
2011 | ||||||||||||||||||||||||||||||||||||||||||||
2013 | ||||||||||||||||||||||||||||||||||||||||||||
January | 69.47 | 64.32 | 64.37 | 12.15 | 5.30 | 2,439,567 | 141.85 | 129.11 | 137.29 | 10.78 | 2,174,196 | |||||||||||||||||||||||||||||||||
February | 68.27 | 64.01 | 68.03 | 12.11 | 5.62 | 2,699,563 | 147.24 | 138.61 | 142.91 | 11.18 | 2,123,164 | |||||||||||||||||||||||||||||||||
March | 70.61 | 67.00 | 69.85 | 11.92 | 5.86 | 2,562,327 | 141.04 | 132.58 | 138.97 | 11.28 | 2,836,236 | |||||||||||||||||||||||||||||||||
First Quarter | 70.61 | 64.01 | 69.85 | 11.92 | 5.86 | 2,562,803 | 147.24 | 129.11 | 138.97 | 11.28 | 2,359,740 | |||||||||||||||||||||||||||||||||
April | 73.91 | 70.52 | 72.45 | 11.52 | 6.29 | 2,425,921 | ||||||||||||||||||||||||||||||||||||||
May | 73.68 | 70.75 | 71.44 | 11.58 | 6.17 | 3,077,382 | ||||||||||||||||||||||||||||||||||||||
June(5) | 75.26 | 72.07 | 74.60 | 11.87 | 6.28 | 2,227,763 | ||||||||||||||||||||||||||||||||||||||
| (1) | The prices and average daily trading volume for the BD Units were taken from Bloomberg and reflect our 3:1 stock split, which was effective May 25, 2007. |
| (2) | High and low closing prices for the periods presented. |
| (3) | Closing price on the last day of the periods presented. |
| (4) | Represents the translation from Mexican pesos to U.S. dollars of the closing price of the BD Units on the last day of the periods presented based on the noon buying rate for the purchase of U.S. dollars, as reported by the U.S. Federal Reserve |
| ADSs(1) | ||||||||||||||||
| U.S. dollars | Average Daily Trading Volume (ADSs) | |||||||||||||||
| High(2) | Low(2) | Close(3) | ||||||||||||||
2008 | 49.39 | 19.25 | 30.13 | 1,321,098 | ||||||||||||
2009 | 49.00 | 19.91 | 47.88 | 1,188,775 | ||||||||||||
2010 | 57.38 | 40.49 | 55.92 | 534,197 | ||||||||||||
2011 | ||||||||||||||||
First Quarter | 58.93 | 52.67 | 58.70 | 523,823 | ||||||||||||
Second Quarter | 66.49 | 59.60 | 66.49 | 519,035 | ||||||||||||
Third Quarter | 73.00 | 61.34 | 64.82 | 641,559 | ||||||||||||
Fourth Quarter | 72.23 | 61.73 | 69.71 | 527,067 | ||||||||||||
2012 | ||||||||||||||||
First Quarter | 82.27 | 52.95 | 82.27 | 525,762 | ||||||||||||
Second Quarter | 89.25 | 77.19 | 89.25 | 567,603 | ||||||||||||
Third Quarter | 92.26 | 82.31 | 91.98 | 554,361 | ||||||||||||
Fourth Quarter | 101.70 | 88.56 | 100.70 | 494,332 | ||||||||||||
October | 96.72 | 90.61 | 90.61 | 467,090 | ||||||||||||
November | 98.18 | 88.56 | 98.08 | 480,962 | ||||||||||||
December | 101.70 | 97.21 | 100.70 | 536,976 | ||||||||||||
2006 2007 2008 2009 First Quarter Second Quarter Third Quarter Fourth Quarter October November December 2010 First Quarter Second Quarter Third Quarter Fourth Quarter October November December 2011 January February March First Quarter April May June(4) 2013 January February March First Quarter ADSs(1) U.S. dollars Average Daily
Trading Volume
(ADSs) High(2) Low(2) Close(3) 39.17 24.41 38.59 1,159,232 44.42 29.96 38.17 1,350,303 49.39 19.25 30.13 1,321,098 32.06 19.91 25.21 1,168,072 34.96 25.27 32.24 820,917 40.01 30.58 38.05 899,509 49.00 42.65 47.88 1,859,885 45.98 42.95 43.31 3,002,220 45.69 42.65 45.51 1,425,004 49.00 46.52 47.88 1,112,896 50.01 40.82 47.53 1,394,455 48.14 40.49 42.89 854,938 52.09 42.78 50.43 752,792 57.38 49.89 55.92 534,197 55.05 49.89 54.91 762,224 56.83 53.89 56.55 498,769 57.38 55.46 55.92 350,353 57.16 52.67 53.07 441,382 56.84 52.95 56.23 566,677 58.93 55.49 58.70 560,110 58.93 52.67 58.70 523,823 63.80 59.60 62.90 615,518 63.31 60.48 61.93 463,290 63.80 61.52 62.58 563,503 ADSs(1) U.S. dollars Average Daily
Trading Volume
(ADSs) High(2) Low(2) Close(3) 111.23 101.30 107.89 609,183 114.91 109.08 111.74 497,343 113.50 107.27 113.50 632,567 114.91 101.30 113.50 581,561
| (1) | Each ADS is comprised of 10 BD Units. Prices and average daily trading volume were taken from Bloomberg and reflect our 3:1 stock split, which was effective May 25, 2007. |
| (2) | High and low closing prices for the periods presented. |
| (3) | Closing price on the last day of the periods presented. |
| ITEM 10. | ADDITIONAL INFORMATION |
The following is a summary of the material provisions of our bylaws and applicable Mexican law. Our bylaws were last amended on April 22, 2008. For a description of the provisions of our bylaws relating to our board of directors and executive officers see, See “Item 6. Directors, Senior Management and Employees.”
Organization and Registry
We are asociedad anónima bursátil de capital variable organized in Mexico under the Mexican General Corporations Law and the Mexican Securities Law. We were incorporated in 1936 under the name Valores Industriales, S.A., as asociedad anónima, and are currently named Fomento Económico Mexicano, S.A.B. de C.V. We are registered in theRegistro Público de la Propiedad y del Comercio(Public Registry of Property and Commerce) of Monterrey, Nuevo León.
Voting Rights and Certain Minority Rights
Each Series B Share entitles its holder to one vote at any of our ordinary or extraordinary general shareholders meetings. Our bylaws state that the board of directors must be composed of no more than 21 members.members, at least 25% of whom must be independent. Holders of Series B Shares are entitled to elect at least 11 members of our board of directors. Holders of Series D Shares are entitled to elect five members of our board of directors. Our bylaws also contemplate that, should a conversion of the Series D-L Shares to Series L Shares occur pursuant to the vote of our Series D-B and Series D-L shareholders at special and extraordinary shareholders meetings, the holders of Series D-L shares (who would become holders of newly-issued Series L Shares) will be entitled to elect two members of the board of directors. None of our shares has cumulative voting rights, which is a right not regulated under Mexican law.
Under our bylaws, the holders of Series D Shares are entitled to vote at extraordinary shareholders meetings called to consider any of the following limited matters: (1) the transformation from one form of corporate organization to another, other than from a company with variable capital stock to a company without variable capital stock or vice versa, (2) any merger in which we are not the surviving entity or with other entities whose principal corporate purposes are different from those of our company or our subsidiaries, (3) change of our jurisdiction of incorporation, (4) dissolution and liquidation and (5) the cancellation of the registration of the Series D Shares or Series L Shares in the Mexican Stock Exchange or in any other foreign stock market where listed, except in the case of the conversion of these shares as provided for in our bylaws.
Holders of Series D Shares are also entitled to vote on the matters that they are expressly authorized to vote on by the Mexican Securities Law and at any extraordinary shareholders meeting called to consider any of the following matters:
To approve a conversion of all of the outstanding Series D-B Shares and Series D-L Shares into Series B shares with full voting rights and Series L Shares with limited voting rights, respectively.
To agree to the unbundling of their share Units.
This conversion and/or unbundling of shares would become effective two (2) years after the date on which the shareholders agreed to such conversion and/or unbundling.
Under Mexican law, holders of shares of any series are entitled to vote as a class in a special meeting governed by the same rules that apply to extraordinary shareholders meetings on any action that would have an effect on the rights of holders of shares of such series. There are no procedures for determining whether a particular proposed shareholder action requires a class vote, and Mexican law does not provide extensive guidance on the criteria to be applied in making such a determination.
The Mexican Securities Law, the Mexican General Corporations Law and our bylaws provide for certain minority shareholder protections. These minority protections include provisions that permit:
holders of at least 10% of our outstanding capital stock entitled to vote, including in a limited or restricted manner, to require the chairman of the board of directors or of the Audit or Corporate Practices Committees to call a shareholders’ meeting;
holders of at least 5% of our outstanding capital stock, including limited or restricted vote, may bring an action for liabilities against our directors, the secretary of the board of directors or the relevantcertain key officers;
holders of at least 10% of our outstanding capital stock who are entitled to vote, including limited or restricted vote, at any shareholders meeting to request that resolutions with respect to any matter on which they considered they were not sufficiently informed be postponed;
holders of 20% of our outstanding capital stock to oppose any resolution adopted at a shareholders meeting in which they are entitled to vote, including limited or restricted vote, and file a petition for a court order to suspend the resolution temporarily within 15 days following the adjournment of the meeting at which the action was taken, provided that (1) the challenged resolution violates Mexican law or our bylaws, (2) the opposing shareholders neither attended the meeting nor voted in favor of the challenged resolution and (3) the opposing shareholders deliver a bond to the court to secure payment of any damages that we may suffer as a result of suspending the resolution in the event that the court ultimately rules against the opposing shareholder; and
holders of at least 10% of our outstanding capital stock who are entitled to vote, including limited or restricted vote, to appoint one member of our board of directors and one alternate member of our board of directors.
Shareholders Meetings
General shareholders meetings may be ordinary meetings or extraordinary meetings. Extraordinary meetings are those called to consider certain matters specified in Article 182 and 228 BIS of the Mexican General Corporations Law, Articles 53 and 108(II) of the Mexican Securities Law and in our bylaws. These matters include: amendments to our bylaws, liquidation, dissolution, merger, spin-off and transformation from one form of corporate organization to another, issuance of preferred stock and increases and reductions of the fixed portion of our capital stock. In addition, our bylaws require ana general shareholders’ extraordinary meeting to consider the cancellation of the registration of shares with the Mexican Registry of Securities, or RNV or with other foreign stock exchanges on which our shares may be listed, the amortization of distributable earnings into capital stock, and an increase in our capital stock in terms of the Mexican Securities Law. General meetings called to consider all other matters, including increases or decreases affecting the variable portion of our capital stock, are ordinary meetings. An ordinary meeting must be held at least once each year within the first four months following the end of the preceding fiscal year. Holders of BD Units or B Units are entitled to attend all shareholders meetings of the Series B Shares and Series D Shares and to vote on matters that are subject to the vote of holders of the underlying shares.
The quorum for an ordinary shareholders meeting on first call is more than 50% of the Series B Shares, and action may be taken by a majority of the Series B Shares represented at the meeting. If a quorum is not available, a second or subsequent meeting may be called and held by whatever number of Series B Shares is represented at the meeting, at which meeting action may be taken by a majority of the Series B Shares that are represented at the meeting.
The quorum for an extraordinary shareholders meeting is at least 75% of the shares entitled to vote at the meeting, and action may be taken by a vote of the majority of all the outstanding shares that are entitled to vote. If a quorum is not available, a second meeting may be called, at which the quorum will be the majority of the outstanding capital stock entitled to vote, and actions will be taken by holders of the majority of all the outstanding capital stock entitled to vote.
Shareholders meetings may be called by the board of directors, the audit committee or the corporate practices committee and, under certain circumstances, a Mexican court. HoldersAdditionally, holders of 10% or more of our capital stock may require the chairman of the board of directors, or the chairman of the audit or corporate practices committees to call a shareholders meeting. A notice of meeting and an agenda must be published in thePeriódico Oficial del Estado de Nuevo León (Official State Gazette of Nuevo León)n, or the Official State Gazette) or a newspaper of general circulationdistribution in Monterrey, Nuevo León, Mexico at least 15 days prior to the date set for the meeting. Notices must set forth the place, date and time of the meeting and the matters to be addressed and must be signed by whomeverwhoever convened the meeting. Shareholders meetings will be deemed validly held and convened without a prior notice or publication wheneveronly to the extent that all the shares representing our capital stock are fully represented. All relevant information relating to the shareholders meeting must be made available to shareholders starting on the date of publication of the notice.notice involving such shareholders meeting. To attend a meeting, shareholders must deposit their shares with the company or with Indeval or an institution for the deposit of securities prior to the meeting as indicated in the notice. If entitled to attend a meeting, a shareholder may be represented by an attorney-in-fact.
In addition to the provisions of the Mexican General Corporations Law, the ordinary shareholders meeting shall be convened to approve any transaction that, in a fiscal year, represents 20% or more of the consolidated assets of the company as of the immediately prior quarter, whether such transaction is executed in one or several operations.operations, to the extent that, according to the nature of such transactions, they may be deemed the same. All shareholders shall be entitled to vote on in such ordinary shareholders meeting, including those with limited or restricted voting rights.
Dividend Rights
At the AGM, the board of directors submits the financial statements of the company for the previous fiscal year, together with a report thereon by the board of directors. Once the holders of Series B Shares have approved the financial statements, they determine the allocation of our net profits for the preceding year. Mexican law requires the allocation of at least 5% of net profits to a legal reserve, which is not subsequently available for distribution, until the amount of the legal reserve equals 20% of our paid in capital stock. Thereafter, the holders of Series B Shares may determine and allocate a certain percentage of net profits to any general or special reserve, including a reserve for open-market purchases of our shares. The remainder of net profits is available for distribution in the form of dividends to the shareholders. Dividends may only be paid if net profits are sufficient to offset losses from prior fiscal years.
Our bylaws provide that dividends will be allocated among the shares outstanding and fully paid at the time a dividend is declared in such manner that each Series D-B Share and Series D-L Share receives 125% of the dividend distributed in respect of each Series B Share. Holders of Series D-B Shares and Series D-L Shares are entitled to this dividend premium in connection with all dividends paid by us.
Change in Capital
Our outstanding capital stock consists of both a fixed and a variable portion. The fixed portion of our capital stock may be increased or decreased only by an amendment of the bylaws adopted by an extraordinary shareholders meeting. The variable portion of our capital stock may be increased or decreased by resolution of an ordinary shareholders meeting. Capital increases and decreases must be recorded in our share registry and book of capital variations, if applicable.
A capital stock increase may be effected through the issuance of new shares for payment in cash or in kind, or by capitalization of indebtedness or of certain items of stockholders’ equity. Treasury stock may only be sold pursuant to a public offering.
Any increase or decrease in our capital stock or any redemption or repurchase will be subject to the following limitations: (1) Series B Shares will always represent at least 51% of our outstanding capital stock and the Series D-L Shares and Series L Shares will never represent more than 25% of our outstanding capital stock; and (2) the Series D-B, Series D-L and Series L Shares will not exceed, in the aggregate, 49% of our outstanding capital stock.
Preemptive Rights
Under Mexican law, except in limited circumstances which are described below, in the event of an increase in our capital stock, a holder of record generally has the right to subscribe to shares of a series held by such holder sufficient to maintain such holder’s existing proportionate holding of shares of that series. Preemptive rights must be exercised during a term fixed by the shareholders at the meeting declaring the capital increase, which term must last at least 15 days following the publication of notice of the capital increase in the Official State Gazette. As a result of applicable United States securities laws, holders of ADSs may be restricted in their ability to participate in the exercise of preemptive rights under the terms of the deposit agreement. Shares subject to a preemptive rights offering, with respect to which preemptive rights have not been exercised, may be sold by us to third parties on the same terms and conditions previously approved by the shareholders or the board of directors. Under Mexican law, preemptive rights cannot be waived in advance or be assigned, or be represented by an instrument that is negotiable separately from the corresponding shares.
Our bylaws provide that shareholders will not have preemptive rights to subscribe shares in the event of a capital stock increase or listing of treasury stock in any of the following events: (i) merger of the Company; (ii) conversion of obligations (conversion de obligaciones) in terms of the Mexican General Credit Instruments and Credit Operations Law (Ley General de Títulos y Operaciones de Crédito); (iii) public offering inmade according to the terms of articles 53, 56 and related provisions of the Mexican Securities Law; and (iv) capital increase made through the payment in kind of the issued shares or through the cancellation of debt of the Company.
Limitations on Share Ownership
Ownership by non-Mexican nationals of shares of Mexican companies is regulated by the Foreign Investment Law and its regulations. The Foreign Investment Commission is responsible for the administration of the Foreign Investment Law and its regulations.
As a general rule, the Foreign Investment Law allows foreign holdings of up to 100% of the capital stock of Mexican companies, except for those companies engaged in certain specified restricted industries. The Foreign Investment Law and its regulations require that Mexican shareholders retain the power to determine the administrative control and the management of corporations in industries in which special restrictions on foreign holdings are applicable. Foreign investment in our shares is not limited under either the Foreign Investment Law or its regulations.
Management of the Company
Management of the company is entrusted to the board of directors and also to the chief executive officer, who is required to follow the strategies, policies and guidelines approved by the board of directors and the authority, obligations and duties expressly authorized in the Mexican Securities Law.
At least 25% of the members of the board of directors shall be independent. Independence of the members of the board of directors is determined by the shareholders meeting, subject to the CNBV’s challenge of such determination. In the performance of its responsibilities, the board of directors will be supported by a corporate practices committee and an audit committee. The corporate practices committee and the audit committee consist solely of independent directors. Each committee is formed by at least three board members appointed by the shareholders or by the board of directors. The chairmen of said committees are appointed (taking into consideration their experience, capacity and professional prestige) and removed exclusively by a vote in a shareholders meeting or by the board of directors.
Surveillance
Surveillance of the company is entrusted to the board of directors, which shall be supported in the performance of these functions by the corporate practices committee, the audit committee and our external auditor. The external auditor may be invited to attend board of directors meetings as an observer, with a right to participate but without voting rights.
Authority of the Board of Directors
The board of directors is our legal representative and is authorized to take any action in connection with our operations not expressly reserved to our shareholders. Pursuant to the Mexican Securities Law, the board of directors must approve,observing at all moments their duty of care and duty of loyalty, among other matters:
any transactions to be entered into with related parties which are deemed to be outside the ordinary course of our business
significant asset transfers or acquisitions;
material guarantees or collateral;
internal policies; and
other material transactions.
Meetings of the board of directors are validly convened and held if a majority of the members are present. Resolutions passed at these meetings will be valid if approved by a majority of members of the board of directors are present at the meeting. If required, the chairman of the board of directors may cast a tie-breaking vote.
Redemption
We may redeem part of our shares for cancellation with distributable earnings pursuant to a decision of an extraordinary shareholders meeting. Only shares subscribed and fully paid for may be redeemed. Any shares intended to be redeemed shall be purchased on the Mexican Stock Exchange in accordance with the Mexican General Corporations Law and the Mexican Securities Law. No shares will be redeemed, if as a consequence of such redemption, the Series D and Series L Shares in the aggregate exceed the percentages permitted by our bylaws or if any such redemption will reduce our fixed capital below its minimum.
Repurchase of Shares
According to our bylaws, subject to the provisions of the Mexican Securities Law and under rules promulgated by the CNBV, we may repurchase our shares at any time at the then prevailing market price. The maximum amount available for repurchase of our shares must be approved at the AGM. The economic and voting rights corresponding to such repurchased shares may not be exercised while our company owns the shares.
In accordance with the Mexican Securities Law, our subsidiaries may not purchase, directly or indirectly, shares of our capital stock or any security that represents such shares.
Forfeiture of Shares
As required by Mexican law, our bylaws provide that non-Mexican holders of BD Units, B Units or shares (1) are considered to be Mexican with respect to such shares that they acquire or hold and (2) may not invoke the protection of their own governments in respect of the investment represented by those shares. Failure to comply with our bylaws may result in a penalty of forfeiture of a shareholder’s capital stock in favor of the Mexican state. In the opinion of Carlos E.Eduardo Aldrete Ancira, our general counsel, under this provision, a non-Mexican shareholder (including a non-Mexican holder of ADSs) is deemed to have agreed not to invoke the protection of its own government by asking such government to interpose a diplomatic claim against the Mexican state with respect to its rights as a shareholder, but is not deemed to have waived any other rights it may have, including any rights under the United States securities laws, with respect to its investment in our company. If a shareholder should invoke governmental protection in violation of this agreement, its shares could be forfeited to the Mexican state.
Duration
The bylaws provide that the duration of our company is 99 years, commencing on May 30, 1936, unless extended by a resolution of an extraordinary shareholders meeting.
Appraisal Rights
Whenever the shareholders approve a change of corporate purpose, change of jurisdiction of incorporation or the transformation from one form of corporate organization to another, any shareholder entitled to vote on such change that has voted against it, may withdraw as a shareholder of our company and have its shares redeemed by FEMSA at a price per share calculated as specified under applicable Mexican law, provided that it exercises its right within 15 days following the adjournment of the meeting at which the change was approved. Under Mexican law, the amount which a withdrawing shareholder is entitled to receive is equal to its proportionate interest in our capital stock or according to our most recent balance sheet approved by an ordinary general shareholders meeting.
Delisting of Shares
In the event of a cancellation of the registration of any of our shares with the RNV, whether by order of the CNBV or at our request with the prior consent of 95% of the holders of our outstanding capital stock, our bylaws and the new Mexican Securities Law require us to make a public offer to acquire these shares prior to their cancellation.
Liquidation
Upon the dissolution of our company, one or more liquidators must be appointed by an extraordinary general meeting of the shareholders to wind up its affairs. All fully paid and outstanding shares of capital stock will be entitled to participate equally in any distribution upon liquidation.
Actions Against Directors
Shareholders (including holders of Series D-B and Series D-L Shares) representing, in the aggregate, not less than 5% of our capital stock may directly bring an action against directors.
In the event of actions derived from any breach of the duty of care and the duty of loyalty, liability is exclusively in favor of the company. The Mexican Securities Law establishes that liability may be imposed on the members and the secretary of the board of directors, as well as to the relevant officers.
Notwithstanding, the Mexican Securities Law provides that the members of the board of directors will not incur, individually or jointly, liability for damages and losses caused to the company, when their acts were made in good faith, in any of the following events (1) the directors complied with the requirements of the Mexican Securities Law and with the company’s bylaws, (2) the decision making or voting was based on information provided by the relevant officers, the external auditor or the independent experts, whose capacity and credibility do not offer reasonable doubt; (3) the negative economic effects could not have been foreseen, based on the information available; and (4) they comply with the resolutions of the shareholders’ meeting when such resolutions comply with applicable law.
Fiduciary Duties—Duty of Care
The Mexican Securities Law provides that the directors shall act in good faith and in our best interest and in the best interest of our subsidiaries. In order to fulfill its duty, the board of directors may:
request information about us or our subsidiaries that is reasonably necessary to fulfill its duties;
require our officers and certain other persons, including the external auditors, to appear at board of directors’ meetings to report to the board of directors;
postpone board of directors’ meetings for up to three days when a director has not been given sufficient notice of the meeting or in the event that a director has not been provided with the information provided to the other directors; and
require a matter be discussed and voted upon by the full board of directors in the presence of the secretary of the board of directors.
Our directors may be liable for damages for failing to comply their duty of care if such failure causes economic damage to us or our subsidiaries and the director (1) failed to attend, board of directors’ or committee meetings and as a result of, such failure, the board of directors was unable to take action, unless such absence is approved by the shareholders meeting, (2) failed to disclose to the board of directors or the committees material information necessary for the board of directors to reach a decision, unless legally or contractually prohibited from doing so in order to maintain confidentiality, and (3) failed to comply with the duties imposed by the Mexican Securities Law or our bylaws.
Fiduciary Duties—Duty of Loyalty
The Mexican Securities Law provides that the directors and secretary of the board of directors shall keep confidential any non-public information and matters about which they have knowledge as a result of their position. Also, directors should abstain from participating, attending or voting at meetings related to matters where they have a conflict of interest.
The directors and secretary of the board of directors will be deemed to have violated the duty of loyalty, and will be liable for damages, when they obtain an economic benefit by virtue of their position. Further, the directors will fail to comply with their duty of loyalty if they:
vote at a board of directors’ meeting or take any action on a matter involving our assets where there is a conflict of interest;
fail to disclose a conflict of interest during a board of directors’ meeting;
enter into a voting arrangement to support a particular shareholder or group of shareholders against the other shareholders;
approve of transactions without complying with the requirements of the Mexican Securities Law;
use company property in violation of the policies approved by the board of directors;
unlawfully use material non-public information; and
usurp a corporate opportunity for their own benefit or the benefit of third parties, without the prior approval of the board of directors.
Limited Liability of Shareholders
The liability of shareholders for our company’s losses is limited to their shareholdings in our company.
The following summary contains a description of certain U.S. federal income and Mexican federal tax consequences of the purchase, ownership and disposition of our ADSs by a holder that is a citizen or resident of the United States, a U.S. domestic corporation or a person or entity that otherwise will be subject to U.S. federal income tax on a net income basis in respect of our ADSs, whom we refer to as a U.S. holder, but it does not purport to be a description of all of the possible tax considerations that may be relevant to a decision to purchase, hold or dispose of ADSs. In particular, this discussion does not address all Mexican or U.S. federal income tax considerations that may be relevant to a particular investor, nor does it address the special tax rules applicable to certain categories of investors, such as banks, dealers, traders who elect to mark to market, tax-exempt entities, insurance companies, certain short-term holders of ADSs or investors who hold our ADSs as part of a hedge, straddle, conversion or integrated transaction or investors who have a “functional currency” other than the U.S. dollar. This summary deals
only with U.S. holders that will hold our ADSs as capital assets and does not address the tax treatment of a U.S. holder that owns or is treated as owning 10% or more of the voting shares (including ADSs) of the company.
This summary is based upon the federal tax laws of the United States and Mexico as in effect on the date of this annual report, including the provisions of the income tax treaty between the United States and Mexico which we refer to as the Tax Treaty, which are subject to change. The summary does not address any tax consequences under the laws of any state or locality of Mexico or the United States or the laws of any taxing jurisdiction other than the federal laws of Mexico and the United States. Holders of our ADSs should consult their tax advisors as to the U.S., Mexican or other tax consequences of the purchase, ownership and disposition of ADSs, including, in particular, the effect of any foreign, state or local tax laws.
Mexican Taxation
For purposes of this summary, the term “non-resident holder” means a holder that is not a resident of Mexico for tax purposes and that does not hold our ADSs in connection with the conduct of a trade or business through a permanent establishment for tax purposes in Mexico. For purposes of Mexican taxation, an individual is a resident of Mexico if he or she has established his or her home in Mexico, or if he or she has another home outside Mexico, but his or herCentro de Intereses Vitales (Center of Vital Interests) (as defined in the Mexican Tax Code) is located in Mexico and, among other circumstances, more than 50% of that person’s total income during a calendar year comes from within Mexico. A legal entity is a resident of Mexico either if it has either its principal place of business or its place of effective management in Mexico. A Mexican citizen is presumed to be a resident of Mexico unless he or she can demonstrate that the contrary is true. If a legal entity or an individual is deemed to have a permanent establishment in Mexico for tax purposes, all income attributable to the permanent establishment will be subject to Mexican taxes, in accordance with applicable tax laws.
Taxation of Dividends. Under Mexican income tax law, dividends, either in cash or in kind, paid with respect to our shares represented by our ADSs are not subject to Mexican withholding tax.
Taxation of Dispositions of ADSs. Gains from the sale or disposition of ADSs by non-resident holders will not be subject to Mexican tax, if the disposition is carried out through a stock exchange recognized under applicable Mexican tax law.
In compliance with certain requirements, gains on the sale or other disposition of ADSs made in circumstances different from those set forth in the prior paragraph generally would be subject to Mexican tax, regardless of the nationality or residence of the transferor. However, under the Tax Treaty, a holder that is eligible to claim the benefits of the Tax Treaty will be exempt from Mexican tax on gains realized on a sale or other disposition of our ADSs in a transaction that is not carried out through the Mexican Stock Exchange or other approved securities markets, so long as the holder did not own, directly or indirectly, 25% or more of our outstanding capital stock (including shares represented by our ADSs) within the 12-month period preceding such sale or other disposition. Deposits of shares in exchange for ADSs and withdrawals of shares in exchange for our ADSs will not give rise to Mexican tax.
Other Mexican Taxes. There are no Mexican inheritance, gift, succession or value added taxes applicable to the ownership, transfer, exchange or disposition of our ADSs. There are no Mexican stamp, issue, registration or similar taxes or duties payable by holders of our ADSs.
United States Taxation
Taxation of Dividends.The gross amount of any dividends paid with respect to our shares represented by our ADSs generally will be included in the gross income of a U.S. holder as ordinary income on the day on which the dividends are received by the ADS depositary and will not be eligible for the dividends received deduction allowed to corporations under the Internal Revenue Code of 1986, as amended. Dividends, which will be paid in Mexican pesos, will be includible in the income of a U.S. holder in a U.S. dollar amount calculated, in general, by reference to the exchange rate in effect on the date that they are received by the ADS depositary (regardless of whether such Mexican pesos are in fact converted into U.S. dollars on such date). If such dividends are converted
into U.S. dollars on the date of receipt, a U.S. holder generally should not be required to recognize foreign currency gain or loss in respect of the dividends. U.S. holders should consult their tax advisors regarding the treatment of the foreign currency gain or loss, if any, on any Mexican pesos received that are converted into U.S. dollars on a date subsequent to the date of receipt. Subject to certain exceptions for short-term and hedged positions, the U.S. dollar amount of dividends received by an individual U.S. holder in respect of the ADSs for taxable years beginning before January 1, 2013 is subject to taxation at a maximumthe reduced rate of 15%applicable to long-term capital gains if the dividends are “qualified dividends.” Dividends paid on the ADSs will be treated as qualified dividends if (1) we are eligible for the benefits of a comprehensive income tax treaty with the United States that the Internal Revenue Service has approved for the purposes of the qualified dividend rules and (2) we were not, in the year prior to the year in which the dividend was paid, and are not, in the year in which the dividend is paid, a passive foreign investment company. The income tax treaty between Mexico and the United States has been approved for the purposes of the qualified dividend rules. Based on our audited consolidated financial statements and relevant market and shareholder data, we believe that we were not treated as a passive foreign investment company for U.S. federal income tax purposes with respect to our 20102012 taxable year. In addition, based on our audited consolidated financial statements and our current expectations regarding the value and nature of our assets, the sources and nature of our income, and relevant market and shareholder data, we do not anticipate becoming a passive foreign investment company for our 20112013 taxable year. Dividends generally will constitute foreign source “passive income” for U.S. foreign tax credit purposes.
Distributions to holders of additional shares with respect to our ADSs that are made as part of a pro rata distribution to all of our shareholders generally will not be subject to U.S. federal income tax.
A holder of ADSs that is, with respect to the United States, a foreign corporation or non-U.S. holder generally will not be subject to U.S. federal income or withholding tax on dividends received on ADSs unless such income is effectively connected with the conduct by the non-U.S. holder of a trade or business in the United States.
Taxation of Capital Gains. A gain or loss realized by a U.S. holder on the sale or other disposition of ADSs will be subject to U.S. federal income taxation as a capital gain or loss in an amount equal to the difference between the amount realized on the disposition and such U.S. holder’s tax basis in the ADSs.ADSs (each calculated in dollars). Any such gain or loss will be a long-term capital gain or loss if the ADSs were held for more than one year on the date of such sale. Any long-term capital gain recognized by a U.S. holder that is an individual is subject to a reduced rate of federal income taxation. The deduction of capital losses is subject to limitations for U.S. federal income tax purposes. Deposits and withdrawals of shares by U.S. holders in exchange for ADSs will not result in the realization of gains or losses for U.S. federal income tax purposes.
Any gain realized by a U.S. holder on the sale or other disposition of ADSs generally will be treated as U.S. source income for U.S. foreign tax credit purposes.
A non-U.S. holder of ADSs will not be subject to U.S. federal income or withholding tax on any gain realized on the sale of ADSs, unless (1) such gain is effectively connected with the conduct by the non-U.S. holder of a trade or business in the United States, or (2) in the case of a gain realized by an individual non-U.S. holder, the non-U.S. holder is present in the United States for 183 days or more in the taxable year of the sale and certain other conditions are met.
United States Backup Withholding and Information Reporting. A U.S. holder of ADSs may, under certain circumstances, be subject to “information reporting” and “backup withholding” with respect to certain payments to such U.S. holder, such as dividends, interest or the proceeds of a sale or disposition of ADSs, unless such holder (1) is a corporation or comes within certain exempt categories, and demonstrates this fact when so required, or (2) in the case of backup withholding, provides a correct taxpayer identification number, certifies that it is not subject to backup withholding and otherwise complies with applicable requirements of the backup withholding rules. Any amount withheld under these rules does not constitute a separate tax and will be creditable against the holder’s U.S. federal income tax liability. While non-U.S. holders generally are exempt from information reporting and backup withholding, a non-U.S. holder may, in certain circumstances, be required to comply with certain information and identification procedures in order to prove this exemption.
We and our subsidiaries are parties to a variety of material agreements with third parties, including shareholders’ agreements, supply agreements and purchase and service agreements. Set forth below are summaries of the material terms of such agreements. The actual agreements have either been filed as exhibits to, or incorporated by reference in, this annual report.See “Item 19. Exhibits.”
Material Contracts Relating to Coca-Cola FEMSA
Shareholders Agreement
Coca-Cola FEMSA operates pursuant to a shareholders agreement among two subsidiaries of FEMSA, The Coca-Cola Company and certain of its subsidiaries. This agreement, together with Coca-Cola FEMSA’s bylaws, sets forth the basic rules under which Coca-Cola FEMSA operates.
In February 2010, Coca-Cola FEMSA’s main shareholders, FEMSA and The Coca-Cola Company, amended the shareholders agreement, and Coca-Cola FEMSA’s by-lawsbylaws were amended accordingly. The amendment mainly relates to changes in the voting requirements for decisions on: (1) ordinary operations within an annual business plan and (2) appointment of the chief executive officer and all officers reporting to him, all of which now may be taken by the board of directors by simple majority voting. Also, the amendment provides that payment of dividends, up to an amount equivalent to 20% of the preceding years’ retained earnings, may be approved by a simple majority of the shareholders. Any decision on extraordinary matters, as they are defined in Coca-Cola FEMSA’s by-lawsbylaws and which include, among other things, any new business acquisition, or business combinations, in an amount exceeding US$ 100 million and outside the ordinary operations contained in the annual business plan, or any change in the existing line of business, shall require the approval of the majority of the members of the board of directors, with the vote of two of the members appointed by The Coca-Cola Company. Also, any decision related to such extraordinary matters or any payment of dividends above 20% of the preceding years’ retained earnings shall require the approval of thea majority of the shareholders of each ofCoca-Cola FEMSA’s Series A and Series D Shares voting together as a single class, a majority of which must include the majority of the Series D shareholders.class.
Under Coca-Cola FEMSA’s bylaws and shareholders agreement, its Series A Shares and Series D Shares are the only shares with full voting rights and, therefore, control actions by its shareholders. The shareholders agreement also sets forth the principal shareholders’ understanding as to the effect of adverse actions of The Coca-Cola Company under the bottler agreements. Coca-Cola FEMSA’s bylaws and shareholders agreement provide that a majority of the directors appointed by the holders of its Series A Shares, upon making a reasonable, good faith determination that any action of The Coca-Cola Company under any bottler agreement between The Coca-Cola Company and Coca-Cola FEMSA or any of its subsidiaries is materially adverse to Coca-Cola FEMSA’s business interests and that The Coca-Cola Company has failed to cure such action within 60 days of notice, may declare a simple“simple majority periodperiod”, as defined in Coca-Cola FEMSA’s bylaws, at any time within 90 days after giving notice. During the “simplesimple majority period” as defined in Coca-Cola FEMSA’s bylaws, certain decisions, namely the approval of material changes in Coca-Cola FEMSA’s business plans, the introduction of a new, or termination of an existing, line of business, and related party transactions outside the ordinary course of business, to the extent the presence and approval of at least two Coca-Cola FEMSA Series D directors would otherwise be required, can be made by a simple majority vote of its entire board of directors, without requiring the presence or approval of any Coca-Cola FEMSA Series D director. A majority of the Coca-Cola FEMSA Series A directors may terminate a simple majority period but, once having done so, cannot declare another simple majority period for one year after the termination. If a simple majority period persists for one year or more, the provisions of the shareholders agreement for resolution of irreconcilable differences may be triggered, with the consequences outlined in the following paragraph.
In addition to the rights of first refusal provided for in Coca-Cola FEMSA’s bylaws regarding proposed transfers of its Series A Shares or Series D Shares, the shareholders agreement contemplates three circumstances under which one principal shareholder may purchase the interest of the other in Coca-Cola FEMSA: (1) a change in control in a principal shareholder; (2) the existence of irreconcilable differences between the principal shareholders; or (3) the occurrence of certain specified events of default.
In the event that (1) one of the principal shareholders buys the other’s interest in Coca-Cola FEMSA in any of the circumstances described above or (2) the ownership of Coca-Cola FEMSA’s shares of capital stock other than the Series L Shares of the subsidiaries of The Coca-Cola Company or FEMSA is reduced below 20% and upon the request of the shareholder whose interest is not so reduced, the shareholders agreement requires that Coca-Cola FEMSA’s bylaws be amended to eliminate all share transfer restrictions and all special-majority voting and quorum requirements, after which the shareholders agreement would terminate.
The shareholders agreement also contains provisions relating to the principal shareholders’ understanding as to Coca-Cola FEMSA’s growth. It states that it is The Coca-Cola Company’s intention that Coca-Cola FEMSA will be viewed as one of a small number of its “anchor” bottlers in Latin America. In particular, the parties agree that it is desirable that Coca-Cola FEMSA expands by acquiring additional bottler territories in Mexico and other Latin American countries in the event any become available through horizontal growth. In addition, The Coca-Cola Company has agreed, subject to a number of conditions, that if it obtains ownership of a bottler territory that fits with Coca-Cola FEMSA’s operations, it will give Coca-Cola FEMSA the option to acquire such territory. The Coca-Cola Company has also agreed to support prudent and sound modifications to Coca-Cola FEMSA’s capital structure to support horizontal growth. The Coca-Cola Company’s agreement as to horizontal growth expires upon either the elimination of the super-majority voting requirements described above or The Coca-Cola Company’s election to terminate the agreement as a result of a default.
The Coca-Cola Memorandum
In connection with the acquisition of Panamco, in 2003, Coca-Cola FEMSA established certain understandings primarily relating to operational and business issues with both The Coca-Cola Company and our company that were memorialized in writing prior to completion of the acquisition. Although the memorandum has not been amended, Coca-Cola FEMSA continues to develop its relationship with The Coca-Cola Company (through,inter alia, acquisitions and taking on new product categories), and Coca-Cola FEMSA therefore believes that the memorandum should be interpreted in the context of subsequent events, some of which have been noted in the description below. The terms are as follows:
The shareholder arrangements between directly wholly-owned subsidiaries of our company and The Coca-Cola Company will continue in place. On February 1, 2010, FEMSA amended its shareholders agreement with The Coca-Cola Company. See “—Shareholders Agreement.”
We will continue to consolidate Coca-Cola FEMSA’s financial results under Mexican FRS.IFRS.
The Coca-Cola Company and our company will continue to discuss in good faith the possibility of implementing changes to Coca-Cola FEMSA’s capital structure in the future.
There willwere to be no changes in concentrate pricing or marketing support by The Coca-Cola Company up to May 2004. After such time, The Coca-Cola Company hasobtained complete discretion to implement any changes with respect to these matters, but any decision in this regard will be discussed with Coca-Cola FEMSA and will take Coca-Cola FEMSA’s operating condition into consideration. In 2005, The Coca-Cola Company decided to gradually increase concentrate prices for sparkling beverages over a three-year period in Brazil beginning in 2006 and in Mexico beginning in 2007. These increases were fully implemented in Brazil 2008 and in Mexico in 2009.
The Coca-Cola Company may require the establishment of a different long-term strategy for Brazil. If, after taking into account our performance in Brazil, The Coca-Cola Company does not consider us to be part of this long-term strategic solution for Brazil, then we will sell our Brazilian franchise to The Coca-Cola Company or its designee at fair market value. Fair market value would be determined by independent investment bankers retained by each party at their own expense pursuant to specified procedures. Coca-Cola FEMSA currently believes the likelihood of this term applying is remote.
FEMSA, The Coca-Cola Company and Coca-Cola FEMSA will meet to discuss the optimal Latin American territorial configuration for the Coca-Cola bottler system. During these meetings, Coca-Cola FEMSA will consider all possible combinations and any asset swap transactions that may arise from these discussions. In addition, Coca-Cola FEMSA will entertain any potential combination as long as it is strategically sound and done at fair market value.
|
Coca-Cola FEMSA would like to keep open strategic alternatives that relate to the integration of sparkling beverages and beer. The Coca-Cola Company, our company and Coca-Cola FEMSA would explore these alternatives on a market-by-market basis at the appropriate time.
The Coca-Cola Company agreed to sell to a subsidiary of our company sufficient shares to permit FEMSAus to beneficially own 51% of Coca-Cola FEMSA’s outstanding capital stock (assuming that this subsidiary of FEMSA does not sell any shares and that there are no issuances of Coca-Cola FEMSA’s stock other than as contemplated by the acquisition). As a result of this understanding, onin November 3, 2006, FEMSAwe acquired, through a subsidiary, 148,000,000 of Coca-Cola FEMSA’s Series D shares from certain subsidiaries of The Coca-Cola Company, representing 9.4% of the total outstanding voting shares and 8.02% of the total outstanding equity of Coca-Cola FEMSA, at a price of US$ 2.888 per share for an aggregate amount of US$ 427.4 million. Pursuant to Coca-Cola FEMSA’s bylaws, the acquired shares were converted from Coca-Cola FEMSA Series D Shares to Coca-Cola FEMSA Series A Shares.
Coca-Cola FEMSA may be entering some markets where significant infrastructure investment may be required. The Coca-Cola Company and FEMSA will conduct a joint study that will outline strategies for these markets, as well as the investment levels required to execute these strategies. Subsequently, it is intended that our company and The Coca-Cola Company will reach agreement on the level of funding to be provided by each of the partners. The parties intend that this allocation of funding responsibilities would not be overly burdensome for either partner.
Coca-Cola FEMSA entered into a stand-by credit facility, on December 19, 2003 with The Coca-Cola Export Corporation, which expired in December 2006 and was never used.
Cooperation Framework with The Coca-Cola Company
OnIn September 1, 2006, Coca-Cola FEMSA and The Coca-Cola Company reached a comprehensive cooperation framework for a new stage of collaboration going forward. This new framework includes the main aspects of Coca-Cola FEMSA’s relationship with The Coca-Cola Company and defines the terms for the new collaborative business model. The framework is structured around three main objectives, which have been implemented as outlined below.
| • | Sustainable growth of sparkling beverages, still beverages and |
| • | Horizontal growth: The framework includes The Coca-Cola Company’s endorsement of Coca-Cola FEMSA’s aspiration to continue being a leading participant in the consolidation of the Coca-Cola system in Latin America, as well as the exploration of potential opportunities in other markets where Coca-Cola FEMSA’s operating model and strong execution capabilities could be leveraged. For example, in 2008 Coca-Cola FEMSA entered into a transaction with The Coca-Cola Company to acquire from it REMIL, which was The Coca-Cola Company’s wholly-owned bottling franchise in the majority of the State of Minas Gerais of Brazil. On January 25, 2013, Coca-Cola FEMSA closed the acquisition of a 51% non-controlling stake in the outstanding shares of CCBPI in the Philippines. |
| • | Long-term vision in relationship economics: Coca-Cola FEMSA and The Coca-Cola Company understand each other’s business objectives and growth plans, and the new framework provides long-term perspective on the economics of their relationship. This will allow Coca-Cola FEMSA and The Coca-Cola Company to focus on continuing to drive the business forward and generating profitable growth. |
Bottler Agreements
Bottler agreements are the standard agreements for each territory that The Coca-Cola Company enters into with bottlers outside the United States. Pursuant to its bottler agreements, Coca-Cola FEMSA manufactures, packages, distributesis authorized to manufacture, sell, and sells sparklingdistributeCoca-Cola trademark beverages bottled still beverageswithin specific geographic areas, and water under a separate bottler agreement for each of its territories. Coca-Cola FEMSA is required to purchase concentrate and artificial sweeteners in some of its territories for allCoca-Cola trademark beverages from companies designated by The Coca-Cola Company.Company, and sweeteners from companies authorized by The Coca-Cola Company, for all of itsCoca-Cola trademark beverages.
These bottler agreements also provide that Coca-Cola FEMSA will purchase its entire requirement of concentrate forCoca-Cola trademark beverages from The Coca-Cola Company and other authorized suppliers at prices, terms of payment and on other terms and conditions of supply as determined from time to time by The Coca-Cola Company at its sole discretion. Concentrate prices for sparkling beverages are determined as a percentage of the weighted average retail price in local currency, net of applicable taxes. Although the price multipliers used to calculate the cost of concentrate and the currency of payment, among other terms, are set by The Coca-Cola Company at its sole discretion, Coca-Cola FEMSA sets the price of products sold to customers at its discretion, subject to the applicability of price restraints. Coca-Cola FEMSA has the exclusive right to distributeCoca-Cola trademark beverages for sale in its territories in authorized containers of the nature prescribed by the bottler agreements and currently used by Coca-Cola FEMSA. These containers include various configurations of cans and returnable and non-returnable bottles made of glass and plastic and fountain containers.
The bottler agreements include an acknowledgment by Coca-Cola FEMSA that The Coca-Cola Company is the sole owner of the trademarks that identify theCoca-Cola trademark beverages and of the secret formulas with which The Coca-Cola Company’s concentrates are made. Subject to Coca-Cola FEMSA’s exclusive right to distributeCoca-Colatrademark beverages in its territories, The Coca-Cola Company reserves the right to import and exportCoca-Cola trademark beverages to and from each of its territories. Coca-Cola FEMSA’s bottler agreements do not contain restrictions on The Coca-Cola Company’s ability to set the price of concentrates charged to its subsidiaries and do not impose minimum marketing obligations on The Coca-Cola Company. The prices at which Coca-Cola FEMSA purchases concentrates under the bottler agreements may vary materially from the prices it has historically paid. However, under Coca-Cola FEMSA’s bylaws and the shareholders agreement among certain subsidiaries of The Coca-Cola Company and certain subsidiaries of our company, an adverse action by The Coca-Cola Company under any of the bottler agreements may result in a suspension of certain vetovoting rights of the directors appointed by The Coca-Cola Company. This provides Coca-Cola FEMSA with limited protection against The Coca-Cola Company’s ability to raise concentrate prices to the extent that such increase is deemed detrimental to Coca-Cola FEMSA pursuant to the shareholdersuch shareholders agreement and the Coca-Cola FEMSA’s bylaws. See “—Shareholders Agreement.”
The Coca-Cola Company has the ability, at its sole discretion, to reformulate any of theCoca-Cola trademark beverages and to discontinue any of theCoca-Cola trademark beverages, subject to certain limitations, so long as allCoca-Cola trademark beverages are not discontinued. The Coca-Cola Company may also introduce new beverages in Coca-Cola FEMSA’s territories in which case Coca-Cola FEMSA has a right of first refusal with respect to the manufacturing, packaging, distribution and sale of such new beverages subject to the same obligations as then exist with respect to theCoca-Cola trademark beverages under the bottler agreements. The bottler agreements prohibit Coca-Cola FEMSA from producing, bottling or handling cola productsbeverages other than those of The Coca-Cola Company trademark beverages, or other products or packages that would imitate, infringe upon, or cause confusion with the products, trade dress, containers or trademarks of The Coca-Cola Company, except under the authority of, or with the consent of, The Coca-Cola Company. The bottler agreements also prohibit Coca-Cola FEMSA from acquiring or holding an interest in a party that engages in such restricted activities. The bottler agreements also prohibit Coca-Cola FEMSA from producing, bottling or handling any sparkling beverage product except under the authority of, or with the consent of, The Coca-Cola Company. The bottler agreements impose restrictions concerning the use of certain trademarks, authorized containers, packaging and labeling of The Coca-Cola Company so as to conform to policies prescribed by The Coca-Cola Company. In particular, Coca-Cola FEMSA is obligated to:
| • | maintain plant and equipment, staff and distribution facilities capable of manufacturing, packaging and distributing theCoca-Cola trademark beverages in authorized containers in accordance with Coca-Cola FEMSA bottler agreements and in sufficient quantities to satisfy fully the demand in its territories; |
undertake adequate quality control measures prescribed by The Coca-Cola Company;
| • | develop, stimulate and satisfy fully the demand forCoca-Cola trademark beverages using all approved means, which includes the investment in advertising and marketing plans; |
maintain a sound financial capacity as may be reasonably necessary to assure performance by Coca-Cola FEMSA and its affiliates of their obligations to The Coca-Cola Company; and
submit annually, to The Coca-Cola Company, Coca-Cola FEMSA’s marketing, management, promotional and advertising plans for the ensuing year.
The Coca-Cola Company contributed a significant portion of Coca-Cola FEMSA’s total marketing expenses in its territories during 20102012 and has reiterated its intention to continue providing such support as part of its new cooperation framework. Although Coca-Cola FEMSA believes that The Coca-Cola Company will continue to provide funds for advertising and marketing, it is not obligated to do so. Consequently, future levels of advertising and marketing support provided by The Coca-Cola Company may vary materially from the levels historically provided. See “—Shareholders Agreement.”
Coca-Cola FEMSA has separate bottler agreements with The Coca-Cola Company for each of the territories in which it operates.operates, on substantially the same terms and conditions. These bottler agreements are automatically renewable for ten-year terms, subject to the right of either party to give prior notice that it does not wish to renew a specific agreement.
In Mexico,As of December 31, 2012, Coca-Cola FEMSA has fourhad eight bottler agreements;agreements in Mexico: (i) the agreements for two territoriesMexico’s Valley territory, which expire in June 2013 and April 2016; (ii) the agreements for the other two territoriesCentral territory, which expire in August 2013, May 2015.2015, and July 2016; (iii) the agreement for the Northeast territory, which expires in September 2014; (iv) the agreement for the Bajio territory, which expires in May 2015; and (v) the agreement for the Southeast territory, which expires in June 2013. Coca-Cola FEMSA’s bottler agreements with The Coca-Cola Company will expire for itsCoca-Cola FEMSA’s territories in the following countries:other countries as follows: Argentina in September 2014; Brazil in April 2014; Colombia in June 2014; Venezuela in August 2016; Guatemala in March 2015; Costa Rica in September 2017; Nicaragua in May 2016; and Panama in November 2014.
The bottler agreements are subject to termination by The Coca-Cola Company in the event of default by Coca-Cola FEMSA. The default provisions include limitations on the change in ownership or control of Coca-Cola FEMSA and the assignment or transfer of the bottler agreements and are designed to preclude any person not acceptable to The Coca-Cola Company from obtaining an assignment of a bottler agreement or from acquiring Coca-Cola FEMSA independently of other rights set forth in the shareholders agreement. These provisions may prevent changes in Coca-Cola FEMSA’s principal shareholders, including mergers or acquisitions involving sales or dispositions of Coca-Cola FEMSA’s capital stock, which will involve an effective change of control without the consent of The Coca-Cola Company. See “—Shareholders Agreement.”
Coca-Cola FEMSA has also entered into tradename licensinglicense agreements with The Coca-Cola Company pursuant to which Coca-Cola FEMSA is authorized to use certain trademark names of The Coca-Cola Company.Company with its corporate name. These agreements have a ten-year term and are automatically renewed for ten-year terms, but are terminated if Coca-Cola FEMSA’s ceases to manufacture, market, sell and distributeCoca-Cola trademark products pursuant to the bottler agreements or if the shareholders agreement is terminated. The Coca-Cola Company also has the right to terminate a license agreement if Coca-Cola FEMSA uses its trademark names in a manner not authorized by the bottler agreements.
Material Contracts Relating to our Holding of Heineken Shares
Share Exchange Agreement
As ofOn January 11, 2010, FEMSA and certain of our subsidiaries entered into a share exchange agreement, which we refer to as the Share Exchange Agreement, with Heineken Holding N.V. and Heineken N.V. The Share Exchange Agreement required Heineken N.V., in consideration for 100% of the shares of EMPREX Cerveza, S.A.
de C.V. (now Heineken Mexico Holding, S.A. de C.V.), which we refer to as EMPREX Cerveza, to deliver at the closing of the Heineken transaction 86,028,019 newly-issued Heineken N.V. shares to FEMSA with a commitment to deliver, pursuant to the ASDI, 29,172,504 additional Heineken N.V. sharesAllotted Shares over a period of not more than five years from the date of the closing of the Heineken transaction, whichtransaction. As of October 5, 2011, we refer to ashad received the totality of the Allotted Shares. If Heineken N.V. is unable to fulfill its obligations to deliver the Allotted Shares, these obligations may be settled in cash with a significant penalty. The Allotted Shares will be delivered to us pursuant to an allotted shares delivery instrument.
The Share Exchange Agreement provided that, simultaneously with the closing of the transaction, Heineken Holding N.V. would swap 43,018,320 Heineken N.V. shares with FEMSA for an equal number of newly issued Heineken Holding N.V. shares. After the closing of the Heineken transaction, we owned 7.5% of Heineken N.V. shares, which will increase’s shares. This percentage increased to 12.5%12.53% upon full delivery of the Allotted Shares and, 14.9%together with our ownership of 14.94% of Heineken Holding N.V.’s shares, which will representrepresents an aggregate 20% economic interest in the Heineken Group.
Under the terms of the Share Exchange Agreement, in exchange for such economic interest in the Heineken Group, FEMSA delivered 100% of the shares representing the capital stock of EMPREX Cerveza, which owned 100% of the shares of FEMSA Cerveza. As a result of the transaction, EMPREX Cerveza and FEMSA Cerveza became wholly-owned subsidiaries of Heineken.
The principal provisions of the Share Exchange AgreementsAgreement are as follows:
Deliverydelivery to Heineken N.V., by FEMSA, of 100% of the outstanding share capital of EMPREX Cerveza, which together with its subsidiaries, constitutes the entire beer business and operations of FEMSA in Mexico and Brazil (including the United States and other export business);
Deliverydelivery to FEMSA by Heineken N.V. of 86,028,019 new Heineken N.V. shares;
Simultaneouslysimultaneously with the closing of the Heineken transaction, a swap between Heineken Holding N.V. and FEMSA of 43,018,320 Heineken N.V. shares for an equal number of newly issued shares in Heineken Holding N.V.;
Thethe commitment by Heineken N.V. to assume indebtedness of EMPREX Cerveza and subsidiaries amounting to approximately US$2.1 billion;
Thethe provision by FEMSA to the Heineken Group of indemnities customary in transactions of this nature concerning FEMSA and FEMSA Cerveza and its subsidiaries and their businesses;
FEMSA’s covenants to operate the EMPREX Cerveza business in the ordinary course consistent with past practice until the closing of the transaction, subject to customary exceptions, with the economic risks and benefits of the EMPREX Cerveza business transferring to Heineken as of January 1, 2010;
Thethe provision by Heineken N.V. and Heineken Holding N.V. to FEMSA of indemnities customary in transactions of this nature concerning the Heineken Group; and
FEMSA’s covenants, subject to certain limitations, to not engage in the production, manufacture, packaging, distribution, marketing or sale of beer and similar beverages in Latin America, the United States, Canada and the Caribbean.
Corporate Governance Agreement
As ofOn April 30, 2010, FEMSA, CB Equity LLP (as transferee of the Heineken N.V. & Heineken Holding N.V. Exchange Shares and Allotted Shares), Heineken N.V., Heineken Holding N.V. and L’Arche Green N.V., as (as majority shareholder of Heineken Holding N.V.,) entered into thea corporate governance agreement, which we refer to as the Corporate Governance Agreement, which establishes the terms of the relationship between Heineken and FEMSA after the closing of the Heineken transaction.
The Corporate Governance Agreement covers, among other things, the following topics:
FEMSA’s representation on the Heineken Holding Board and the Heineken Supervisory Board and the creation of an Americas committee, also with FEMSA’s representation;
FEMSA’s representation on the selection and appointment committee and the audit committee of the Heineken Supervisory Board;
FEMSA’s commitment to not increase its holding in Heineken Holding N.V. above 20% and to not increase its holding in the Heineken Group above a maximum 20% economic interest (subject to certain exceptions); and
FEMSA’s agreement to not transfer any shares in Heineken N.V. or Heineken Holding N.V. for a five-year period, subject to certain exceptions, including among others, (i) beginning in the third anniversary, the right to sell up to 1% of all outstanding shares of each of Heineken N.V. and Heineken Holding N.V. in anyeach calendar quarter, and (ii) beginning in the third anniversary, the right to dividend or distribute to its shareholders each of Heineken N.V. and Heineken Holding N.V. shares.
Under the Corporate Governance Agreement, FEMSA is entitled to nominate two representatives to the Heineken Supervisory Board, one of whom will be appointed as Vice Chairman of the board of Heineken N.V. and will also serve as a representative of FEMSA on the Heineken Holding N.V. Board of Directors. Our nominees for appointment to the Heineken Supervisory Board were José Antonio Fernández Carbajal, our Chairman and Chief Executive Officer, and Javier Astaburuaga Sanjines, our Chief Financial and Strategic Development Officer, who were both approved by Heineken N.V.’s general meeting of shareholders. Mr. José Antonio Fernández was also approved to the Heineken Holding N.V. Board of Directors by the general meeting of shareholders of Heineken Holding N.V.
In addition, the Heineken Supervisory Board has created an Americas committee to oversee the strategic direction of the business in the American continent and assess new business opportunities in that region. The Americas committee consists of two existing members of the Heineken Supervisory Board and one FEMSA representative, who acts as the chairman. The chairman of the Americas committee is José Antonio Fernández Carbajal, our Chairman and Chief Executive Officer.
The Corporate Governance Agreement has no fixed term, but certain provisions cease to apply if FEMSA ceases to have the right to nominate a representative to the Heineken Holding N.V. Board of Directors and the Heineken N.V. Supervisory Board. For example, in certain circumstances, FEMSA would be entitled to only one representative on the Heineken Supervisory Board, including in the event that FEMSA’s economic interest in the Heineken Group were to fall below 14%, the current FEMSA control structure were to change or FEMSA were to be subject to a change of control. In the event that FEMSA’s economic interest in Heineken falls below 7% or a beer producer acquires control of FEMSA, all of FEMSA’s corporate governance rights would end pursuant to the Corporate Governance Agreement.
We file reports, including annual reports on Form 20-F, and other information with the SEC pursuant to the rules and regulations of the SEC that apply to foreign private issuers. You may read and copy any materials filed with the SEC at its public reference rooms in Washington, D.C., at 450 Fifth Street, N.W., Washington, D.C. 20549. Please call the SEC at 1-800-SEC-0330 for further information on the public reference room. Filings we make electronically with the SEC are also available to the public over the Internet at the SEC’s website at www.sec.gov.
| ITEM 11. | QUANTITATIVE AND QUALITATIVE DISCLOSURES ABOUT MARKET RISK |
Our business activities require the holding or issuing of derivative financial instruments that expose us to market risks related to changes in interest rates, foreign currency exchange rates, equity risk and commodity price risk.
Interest rate risk exists principally with respect to our indebtedness that bears interest at floating rates. At December 31, 2010,2012, we had outstanding total debt of Ps. 25,50637,342 million, of which 40%63.9% bore interest at fixedvariable interest rates and 60%36.1% bore interest at variablefixed interest rates. Swap contracts held by us effectively switch a portion of our variable rate indebtedness into fixed-rate indebtedness. After giving effect to these contracts, as of December 31, 2010, 47.9%2012, 44.5% of our total debt was fixed rate and 52.1%55.5% of our total debt was variable rate.rate (the total amount of the debt and the amounts of the variable rate debt and fixed rate debt used in the calculation of this percentage considers converting only the units of investments debt for the related cross currency swap, and it also includes the effect of related interest rate swaps). The interest rate on our variable rate debt is determined by reference to the London Interbank Offered Rate, or LIBOR, (a benchmark rate used for Eurodollar loans), theTasa de Interés Interbancaria de Equilibrio (Equilibrium Interbank Interest Rate)Rate, or TIIE,TIIE), and theCertificados de la Tesorería(Treasury Certificates)Certificates, or CETESCETES) rate. If these reference rates increase, our interest payments would consequently increase.
The table below provides information about our derivative financial instruments that are sensitive to changes in interest rates and exchange rates. The table presents notional amounts and weighted average interest rates by expected contractual maturity dates. Notional amounts are used to calculate the contractual payments to be exchanged under the contract. Weighted average variable rates are based on the reference rates on December 31, 2010,2012, plus spreads contracted by us. Our derivative financial instruments’ current payments are denominated in U.S. dollars and Mexican pesos. All of the payments in the table are presented in Mexican pesos, our reporting currency, utilizing the December 31, 20102012 exchange rate of Ps. 12.3571 Mexican pesos12.9635 per U.S. dollar.
The table below also includes the estimated fair value as of December 31, 20102012 of:
short and long-term debt, based on the discounted value of contractual cash flows, in which the discount rate is estimated using rates currently offered for debt with similar terms and remaining maturities;
long-term notes payable and capital leases, based on quoted market prices; and
cross currency swaps and interest rate swaps, based on quoted market prices to terminate the contracts as of December 31, 2010.2012.
As of December 31, 2010,2012, the fair value represents a decreasean increase in total debt of Ps. 551,114 million lessmore than book value due to a decreasean increase in the interest rate in Mexico.
Principal by Year of Maturity
| At December 31, 2010 | At December 31, 2009 | At December 31, 2012 | At December 31, 2011 | |||||||||||||||||||||||||||||||||||||||||||||||||||||||||||||||||||||||||||||
| 2011 | 2012 | 2013 | 2014 | 2015 | 2016 and thereafter | Carrying Value | Fair Value | Carrying Value | Fair Value | 2013 | 2014 | 2015 | 2016 | 2017 | 2018 and thereafter | Carrying Value | Fair Value | Carrying Value | Fair Value | |||||||||||||||||||||||||||||||||||||||||||||||||||||||||||||
| (in millions of Mexican pesos) | (in millions of Mexican pesos, except for percentages) | |||||||||||||||||||||||||||||||||||||||||||||||||||||||||||||||||||||||||||||||
Short-term debt: | ||||||||||||||||||||||||||||||||||||||||||||||||||||||||||||||||||||||||||||||||
Fixed rate debt: | ||||||||||||||||||||||||||||||||||||||||||||||||||||||||||||||||||||||||||||||||
Mexican pesos: | ||||||||||||||||||||||||||||||||||||||||||||||||||||||||||||||||||||||||||||||||
Capital leases | — | — | — | — | — | — | — | — | 18 | 18 | ||||||||||||||||||||||||||||||||||||||||||||||||||||||||||||||||||||||
Interest rate(1) | — | — | — | — | — | — | — | — | 6.9 | % | — | |||||||||||||||||||||||||||||||||||||||||||||||||||||||||||||||||||||
Argentine pesos: | ||||||||||||||||||||||||||||||||||||||||||||||||||||||||||||||||||||||||||||||||
Bank loans | 291 | — | — | — | — | — | 291 | 291 | 325 | 317 | ||||||||||||||||||||||||||||||||||||||||||||||||||||||||||||||||||||||
Interest rate(1) | 19.2 | % | — | — | — | — | — | 19.2 | % | — | 14.9 | % | — | |||||||||||||||||||||||||||||||||||||||||||||||||||||||||||||||||||
Variable rate debt: | ||||||||||||||||||||||||||||||||||||||||||||||||||||||||||||||||||||||||||||||||
Mexican pesos | — | 1,400 | 1,400 | |||||||||||||||||||||||||||||||||||||||||||||||||||||||||||||||||||||||||||||
Colombian pesos: | ||||||||||||||||||||||||||||||||||||||||||||||||||||||||||||||||||||||||||||||||
Bank loans | — | — | — | — | — | — | — | — | 295 | 295 | ||||||||||||||||||||||||||||||||||||||||||||||||||||||||||||||||||||||
Interest rate(1) | 8.2 | % | — | — | — | — | — | — | — | — | 6.8 | % | — | |||||||||||||||||||||||||||||||||||||||||||||||||||||||||||||||||||
Argentine pesos | 506 | — | — | — | — | — | 506 | 506 | 1,179 | 1,179 | ||||||||||||||||||||||||||||||||||||||||||||||||||||||||||||||||||||||
Brazilian reais: | ||||||||||||||||||||||||||||||||||||||||||||||||||||||||||||||||||||||||||||||||
Bank loans | 19 | — | — | — | — | — | 19 | 19 | — | — | ||||||||||||||||||||||||||||||||||||||||||||||||||||||||||||||||||||||
Interest rate(1) | 15.3 | % | 15.3 | % | 20.7 | % | 8.1 | % | — | — | — | — | — | 8.1 | % | — | — | — | ||||||||||||||||||||||||||||||||||||||||||||||||||||||||||||||
Colombian pesos | 1,072 | — | — | — | — | — | 1,072 | 1,072 | 496 | 496 | ||||||||||||||||||||||||||||||||||||||||||||||||||||||||||||||||||||||
U.S. dollars: | ||||||||||||||||||||||||||||||||||||||||||||||||||||||||||||||||||||||||||||||||
Bank loans | 3,903 | — | — | — | — | — | 3,903 | 3,899 | — | — | ||||||||||||||||||||||||||||||||||||||||||||||||||||||||||||||||||||||
Interest rate(1) | 4.4 | % | 4.4 | % | — | 4.9 | % | 0.6 | % | — | — | — | — | — | 0.6 | % | — | — | ||||||||||||||||||||||||||||||||||||||||||||||||||||||||||||||
Venezuelan Bolívares fuertes | — | 741 | 741 | |||||||||||||||||||||||||||||||||||||||||||||||||||||||||||||||||||||||||||||
Interest rate(1) | 18.1 | % | ||||||||||||||||||||||||||||||||||||||||||||||||||||||||||||||||||||||||||||||
|
|
|
|
|
|
|
|
|
| |||||||||||||||||||||||||||||||||||||||||||||||||||||||||||||||||||||||
Subtotal | 1,578 | — | — | — | — | — | 1,578 | 1,578 | 3,816 | 3,816 | 4,213 | — | — | — | — | — | 4,213 | 4,209 | 638 | 630 | ||||||||||||||||||||||||||||||||||||||||||||||||||||||||||||
Long-term debt: | ||||||||||||||||||||||||||||||||||||||||||||||||||||||||||||||||||||||||||||||||
Fixed rate debt: | ||||||||||||||||||||||||||||||||||||||||||||||||||||||||||||||||||||||||||||||||
Mexican pesos | — | 2,000 | 2,050 | |||||||||||||||||||||||||||||||||||||||||||||||||||||||||||||||||||||||||||||
Mexican pesos: | ||||||||||||||||||||||||||||||||||||||||||||||||||||||||||||||||||||||||||||||||
Domestic senior notes | — | — | — | — | — | 2,495 | 2,495 | 2,822 | 2,495 | 2,631 | ||||||||||||||||||||||||||||||||||||||||||||||||||||||||||||||||||||||
Interest rate(1) | 9.8 | % | — | — | — | — | — | 8.3 | % | 8.3 | % | — | 8.3 | % | — | |||||||||||||||||||||||||||||||||||||||||||||||||||||||||||||||||
J.P. Morgan (Yankee Bond) | 6,179 | 6,179 | 6,179 | — | ||||||||||||||||||||||||||||||||||||||||||||||||||||||||||||||||||||||||||||
Interest rate | 4.6 | % | 4.6 | % | ||||||||||||||||||||||||||||||||||||||||||||||||||||||||||||||||||||||||||||
Units of Investment (UDIs) | 3,193 | 3,193 | 3,193 | 2,964 | 2,964 | — | — | — | — | 3,567 | — | 3,567 | 3,567 | 3,337 | 3,337 | |||||||||||||||||||||||||||||||||||||||||||||||||||||||||||||||||
Interest rate(1) | 4.2 | % | 4.2 | % | 4.2 | % | — | — | — | — | 4.2 | % | — | 4.2 | % | — | 4.2 | % | — | |||||||||||||||||||||||||||||||||||||||||||||||||||||||||||||
U.S. dollars | 4 | — | — | — | — | 4 | 4 | 15 | 15 | |||||||||||||||||||||||||||||||||||||||||||||||||||||||||||||||||||||||
U.S. dollars: | ||||||||||||||||||||||||||||||||||||||||||||||||||||||||||||||||||||||||||||||||
J.P. Morgan (Yankee Bond) | — | — | — | — | — | 6,458 | 6,458 | 7,351 | 6,940 | 7,737 | ||||||||||||||||||||||||||||||||||||||||||||||||||||||||||||||||||||||
Interest rate(1) | 3.8 | % | 3.8 | % | 3.8 | % | — | — | — | — | — | 4.6 | % | 4.6 | % | — | 4.6 | % | — | |||||||||||||||||||||||||||||||||||||||||||||||||||||||||||||
Argentine pesos | 62 | 622 | — | — | — | — | 684 | 684 | 69 | 69 | ||||||||||||||||||||||||||||||||||||||||||||||||||||||||||||||||||||||
Argentine pesos: | ||||||||||||||||||||||||||||||||||||||||||||||||||||||||||||||||||||||||||||||||
Bank loans | 180 | 336 | 13 | — | — | — | 529 | 514 | 595 | 570 | ||||||||||||||||||||||||||||||||||||||||||||||||||||||||||||||||||||||
Interest rate(1) | 20.5 | % | 16.1 | % | 16.5 | % | 20.5 | % | 18.7 | % | 20.7 | % | 15.0 | % | — | — | — | 19.9 | % | — | 16.4 | % | — | |||||||||||||||||||||||||||||||||||||||||||||||||||||||||
Brazilian reais | 4 | 9 | 15 | 15 | 14 | 45 | 102 | 102 | — | — | ||||||||||||||||||||||||||||||||||||||||||||||||||||||||||||||||||||||
Brazilian reais: | ||||||||||||||||||||||||||||||||||||||||||||||||||||||||||||||||||||||||||||||||
Bank loans | 17 | 21 | 21 | 21 | 19 | 20 | 119 | 114 | 82 | 87 | ||||||||||||||||||||||||||||||||||||||||||||||||||||||||||||||||||||||
Interest rate(1) | 3.8 | % | 3.6 | % | 3.6 | % | 3.6 | % | 3.6 | % | 4.5 | % | 3.8 | % | — | 4.5 | % | — | ||||||||||||||||||||||||||||||||||||||||||||||||||||||||||||||
Capital leases | 4 | 4 | 3 | — | — | — | 11 | 11 | 17 | 18 | ||||||||||||||||||||||||||||||||||||||||||||||||||||||||||||||||||||||
Interest rate(1) | 4.5 | % | 4.5 | % | 4.5 | % | 4.5 | % | 4.5 | % | 4.5 | % | 4.5 | % | 4.5 | % | 4.5 | % | 4.5 | % | — | — | — | 4.5 | % | — | 4.5 | % | — | |||||||||||||||||||||||||||||||||||||||||||||||||||
Subtotal | 70 | 631 | 15 | 15 | 14 | 9,417 | 10,162 | 10,162 | 5,048 | 5,098 | 201 | 361 | 37 | 21 | 3,586 | 8,973 | 13,179 | 14,379 | 13,466 | 14,380 | ||||||||||||||||||||||||||||||||||||||||||||||||||||||||||||
Variable rate debt: | ||||||||||||||||||||||||||||||||||||||||||||||||||||||||||||||||||||||||||||||||
Mexican pesos | 1,500 | 3,067 | 3,767 | 1,392 | 2,824 | — | 12,550 | 12,495 | 18,062 | 17,886 | ||||||||||||||||||||||||||||||||||||||||||||||||||||||||||||||||||||||
Mexican pesos: | ||||||||||||||||||||||||||||||||||||||||||||||||||||||||||||||||||||||||||||||||
Bank loans | 266 | 1,370 | 2,744 | — | — | — | 4,380 | 4,430 | 4,550 | 4,456 | ||||||||||||||||||||||||||||||||||||||||||||||||||||||||||||||||||||||
Interest rate(1) | 4.9 | % | 4.8 | % | 4.8 | % | 5.1 | % | 5.1 | % | 4.9 | % | 5.6 | % | 5.1 | % | 5.1 | % | 5.1 | % | — | — | — | 5.1 | % | — | 5.0 | % | — | |||||||||||||||||||||||||||||||||||||||||||||||||||
U.S. dollars | — | 37 | 185 | — | — | — | 222 | 222 | 2,873 | 2,873 | ||||||||||||||||||||||||||||||||||||||||||||||||||||||||||||||||||||||
Domestic senior notes | 3,500 | — | — | 2,511 | — | — | 6,011 | 5,999 | 8,843 | 8,981 | ||||||||||||||||||||||||||||||||||||||||||||||||||||||||||||||||||||||
Interest rate(1) | — | 0.5 | % | 0.6 | % | 0.6 | % | 0.5 | % | 4.8 | % | — | — | 5.0 | % | — | — | 5.0 | % | — | 4.7 | % | — | |||||||||||||||||||||||||||||||||||||||||||||||||||||||||
Colombian pesos | 155 | 839 | — | — | — | — | 994 | 994 | — | |||||||||||||||||||||||||||||||||||||||||||||||||||||||||||||||||||||||
U.S. dollars: | ||||||||||||||||||||||||||||||||||||||||||||||||||||||||||||||||||||||||||||||||
Bank loans | 195 | 2,600 | 5,195 | — | — | — | 7,990 | 8,008 | 251 | 251 | ||||||||||||||||||||||||||||||||||||||||||||||||||||||||||||||||||||||
Interest rate(1) | 0.6 | % | 0.9 | % | 0.9 | % | — | — | — | 0.9 | % | — | 0.7 | % | — | |||||||||||||||||||||||||||||||||||||||||||||||||||||||||||||||||
Argentine pesos: | ||||||||||||||||||||||||||||||||||||||||||||||||||||||||||||||||||||||||||||||||
Bank loans | 106 | — | — | — | — | — | 106 | 106 | 130 | 116 | ||||||||||||||||||||||||||||||||||||||||||||||||||||||||||||||||||||||
Interest rate(1) | 22.9 | % | — | — | — | — | — | 22.9 | % | — | 27.3 | % | — | |||||||||||||||||||||||||||||||||||||||||||||||||||||||||||||||||||
Brazilian reais: | ||||||||||||||||||||||||||||||||||||||||||||||||||||||||||||||||||||||||||||||||
Bank loans | — | 106 | — | — | — | — | 106 | — | — | — | ||||||||||||||||||||||||||||||||||||||||||||||||||||||||||||||||||||||
Interest rate(1) | — | 8.9 | % | — | — | — | — | 8.9 | % | — | — | — | ||||||||||||||||||||||||||||||||||||||||||||||||||||||||||||||||||||
Capital leases | 36 | 40 | 43 | 30 | — | — | 149 | 149 | 193 | 193 | ||||||||||||||||||||||||||||||||||||||||||||||||||||||||||||||||||||||
Interest rate(1) | 10.5 | % | 10.5 | % | 10.5 | % | 10.5 | % | — | — | 10.5 | % | — | 11.0 | % | — | ||||||||||||||||||||||||||||||||||||||||||||||||||||||||||||||||
Colombian pesos: | ||||||||||||||||||||||||||||||||||||||||||||||||||||||||||||||||||||||||||||||||
Bank loans | — | 1,023 | — | — | — | — | 1,023 | 990 | 935 | 929 | ||||||||||||||||||||||||||||||||||||||||||||||||||||||||||||||||||||||
Interest rate(1) | — | 6.8 | % | — | — | — | — | 6.8 | % | — | 6.1 | % | — | |||||||||||||||||||||||||||||||||||||||||||||||||||||||||||||||||||
Capital leases | 185 | — | — | — | — | — | 185 | 186 | 386 | 384 | ||||||||||||||||||||||||||||||||||||||||||||||||||||||||||||||||||||||
Interest rate(1) | 6.8 | % | — | — | — | — | — | 6.8 | % | — | 6.6 | % | — | |||||||||||||||||||||||||||||||||||||||||||||||||||||||||||||||||||
|
|
|
|
|
|
|
|
|
| |||||||||||||||||||||||||||||||||||||||||||||||||||||||||||||||||||||||
Subtotal | 4,288 | 5,139 | 7,982 | 2,541 | — | — | 19,950 | 19,868 | 15,288 | 15,310 | ||||||||||||||||||||||||||||||||||||||||||||||||||||||||||||||||||||||
|
|
|
|
|
|
|
|
|
| |||||||||||||||||||||||||||||||||||||||||||||||||||||||||||||||||||||||
Total long-term debt | 4,489 | 5,500 | 8,019 | 2,562 | 3,586 | 8,973 | 33,129 | 34,247 | 28,754 | 29,690 | ||||||||||||||||||||||||||||||||||||||||||||||||||||||||||||||||||||||
| At December 31, 2010 | At December 31, 2009 | At December 31, 2012 | At December 31, 2011 | |||||||||||||||||||||||||||||||||||||||||||||||||||||||||||||||||||||
| 2011 | 2012 | 2013 | 2014 | 2015 | 2016 and thereafter | Carrying Value | Fair Value | Carrying Value | Fair Value | 2013 | 2014 | 2015 | 2016 | 2017 | 2018 and thereafter | Carrying Value | Carrying Value | |||||||||||||||||||||||||||||||||||||||||||||||||||||||
| (in millions of Mexican pesos) | (in millions of Mexican pesos, except for percentages) | |||||||||||||||||||||||||||||||||||||||||||||||||||||||||||||||||||||||
Interest rate(1) | 4.7 | % | 4.7 | % | 4.7 | % | ||||||||||||||||||||||||||||||||||||||||||||||||||||||||||||||||||
Subtotal | 1,655 | 3,943 | 3,952 | 1,392 | 2,824 | — | 13,766 | 13,711 | 20,935 | 20,759 | ||||||||||||||||||||||||||||||||||||||||||||||||||||||||||||||
Total long-term debt | 1,725 | 4,574 | 3,967 | 1,407 | 2,838 | 9,417 | 23,928 | 23,873 | 25,983 | 25,857 | ||||||||||||||||||||||||||||||||||||||||||||||||||||||||||||||
Derivative financial instruments: | ||||||||||||||||||||||||||||||||||||||||||||||||||||||||||||||||||||||||
Interest rate swaps(2): | ||||||||||||||||||||||||||||||||||||||||||||||||||||||||||||||||||||||||
Interest rate swaps: | ||||||||||||||||||||||||||||||||||||||||||||||||||||||||||||||||||||||||
Mexican pesos: | ||||||||||||||||||||||||||||||||||||||||||||||||||||||||||||||||||||||||
Variable to fixed | — | 1,600 | 2,500 | — | 1,160 | — | 5,260 | (302 | ) | 5,012 | (142 | ) | 3,787 | 575 | 1,963 | — | — | — | 6,325 | 6,638 | ||||||||||||||||||||||||||||||||||||||||||||||||||||
Interest pay rate(1) | 8.1 | % | 8.1 | % | 8.4 | % | 8.1 | % | 8.9 | % | 8.2 | % | 8.4 | % | 8.6 | % | — | — | — | 8.4 | % | 8.3 | % | |||||||||||||||||||||||||||||||||||||||||||||||||
Interest receive rate(1) | 4.8 | % | 4.8 | % | 5.1 | % | 4.9 | % | 4.9 | % | 4.9 | % | 5.1 | % | 5.1 | % | — | — | — | 5.0 | % | 4.9 | % | |||||||||||||||||||||||||||||||||||||||||||||||||
U.S. dollars: variable to fixed rate(1) | — | 1,632 | (34 | ) | ||||||||||||||||||||||||||||||||||||||||||||||||||||||||||||||||||||
Cross currency swaps: | ||||||||||||||||||||||||||||||||||||||||||||||||||||||||||||||||||||||||
Units of Investment (UDIs) to Mexican pesos and variable rate | — | — | — | 2,500 | — | — | 2,500 | 2,500 | ||||||||||||||||||||||||||||||||||||||||||||||||||||||||||||||||
Interest pay rate(1) | 3.1 | % | — | — | — | 4.7 | % | — | — | 4.7 | % | 4.6 | % | |||||||||||||||||||||||||||||||||||||||||||||||||||||||||||
Interest receive rate(1) | 0.5 | % | — | — | — | 4.2 | % | — | — | 4.2 | % | 4.2 | % | |||||||||||||||||||||||||||||||||||||||||||||||||||||||||||
Cross currency swaps: | ||||||||||||||||||||||||||||||||||||||||||||||||||||||||||||||||||||||||
Units of Investment (or UDIs) | ||||||||||||||||||||||||||||||||||||||||||||||||||||||||||||||||||||||||
To Mexican pesos and variable rate | — | — | — | 2,500 | 2,500 | 717 | 2,500 | 480 | ||||||||||||||||||||||||||||||||||||||||||||||||||||||||||||||||
U.S. dollars to Mexican pesos | — | 2,553 | — | — | — | — | 2,553 | — | ||||||||||||||||||||||||||||||||||||||||||||||||||||||||||||||||
Interest pay rate(1) | — | — | — | 4.7 | % | 4.7 | % | 4.8 | % | — | 3.7 | % | — | — | — | — | 3.7 | % | — | |||||||||||||||||||||||||||||||||||||||||||||||||||||
Interest receive rate(1) | — | — | — | 4.2 | % | 4.2 | % | 4.2 | % | — | 1.4 | % | — | — | — | — | 1.4 | % | — | |||||||||||||||||||||||||||||||||||||||||||||||||||||
| (1) | Weighted average interest rate. |
A hypothetical, instantaneous and unfavorable change of one percentage point100 basis points in the average interest rate applicable to variable-rate liabilities held at FEMSA as of December 31, 20102012 would increase our variable interest expense by approximately Ps. 132.8198 million, or 15.2%7.9%, over the 12-month period of 20102013, assuming no additional debt is incurred during such period, in each case after giving effect to all of our interest and cross currency swap agreements.
Foreign Currency Exchange Rate Risk
Our principal exchange rate risk involves changes in the value of the local currencies, of each country in which we operate, relative to the U.S. dollar. In 2010,2012, the percentage of our consolidated total revenues was denominated as follows:
Total Revenues by CountriesCurrency At December 31, 20102012
Region | % of Consolidated Total Revenues | |||||
Mexico and Central America(1) | Mexican peso and others | % | ||||
Venezuela | Bolívar fuerte | % | ||||
| peso, Colombian peso | |||||
| % | |||||
| (1) | Mexican peso, Quetzal, |
We estimate that a majority of our consolidated costs and expenses are denominated in Mexican pesos for Mexican subsidiaries and in the aforementioned currencies for the foreign subsidiaries, which are principally subsidiaries of Coca-Cola FEMSA. Substantially all of our costs and expenses denominated in a foreign currency, other than the functional currency of each country in which we operate, are denominated in U.S. dollars. As of December 31, 20102012, after giving effect to all cross currency swaps, 65.8%42.5% of our long-term indebtedness was denominated in Mexican pesos, 26.8%50.5% was denominated in U.S. dollars, 4.1%3.3% was denominated in Colombian pesos, 2.9%2.6% was denominated in Argentine pesos and 0.4%1.1% was denominated in Brazilian reais. We also have short-term indebtedness, which consists of bank loans in ColombianArgentine pesos, Brazilian reais, and Argentine pesos.U.S. dollars. Decreases in the value of the different currencies relative to the U.S. dollar will increase the cost of our foreign currency denominated operating costs and expenses, and the debt service obligations with respect to our foreign currency denominatedcurrency-denominated indebtedness. A depreciation of the Mexican peso relative to the U.S. dollar will also result in foreign exchange losses, as the Mexican peso value of our foreign currency denominatedcurrency-denominated long-term indebtedness is increased.
Our exposure to market risk associated with changes in foreign currency exchange rates relates primarily to U.S. dollar-denominated debt obligations as shown in the interest risk table above. We occasionally utilize financial derivative instruments to hedge our exposure to the U.S. dollar relative to the Mexican peso and other currencies.
As of December 31, 2010,2012, we had forward agreements that meetmet the hedging criteria for accounting purposes, to hedge our operationstransactions denominated in U.S. dollars.dollars and Euros. The notional amount isof these forward agreements was Ps. 5782,803 million, withfor which we have recorded a fair value asset of Ps. 2 million and a notional amount of Ps. 1,690 million with a fair value liability of Ps. 18 million, in each case with a36 million. The maturity date during 2011. For the year ended December 31, 2010, we recorded a net gain on expiredof these forward agreements of Ps. 27 million as a part of foreign exchange.is in 2013. The fair value of the foreign currency forward contracts is estimated based on the quoted market price of each agreement at year-end assuming the same maturity dates originally contracted.contracted for. For the year ended December 31, 2012, a gain of Ps. 126 million was recorded in our consolidated results.
As of December 31, 2009, certain2011, we had forward agreements do not meetthat met the hedging criteria for accounting purposes; consequently changespurposes, to hedge our transactions denominated in the estimatedU.S. dollars. The notional amount of these forward agreements was Ps. 2,933 million, for which we have recorded a fair value were recorded in our consolidated income statement. For the years ended December 31, 2009 and 2008, the net effect of expired contracts that do not meet hedging criteria for accounting purposes, were lossesasset of Ps. 63 million and Ps. 705 million, respectively.183 million. The maturity date of these forward agreements is in 2012. The fair value of the foreign currency forward contracts is estimated based on the quoted market price of each agreement at year endyear-end assuming the same maturity dates originally contracted.
As ofcontracted for. For the year ended December 31, 2010, we did not have any call option agreements to buy U.S. dollars.2011, a gain of Ps. 21 million was recorded in our consolidated results.
As of December 31, 2010,2012, we had options to purchase U.S. dollars to reduce our exposure to the risk of exchange rate fluctuations. The notional amount of these options was Ps. 982 million, for which we have recorded a net fair value asset of Ps. 47 million as part of cumulative other comprehensive income. The maturity date of these options is in 2013.
As of December 31, 2011, we had options to purchase U.S. dollars to reduce our exposure to the risk of exchange rate fluctuations. The notional amount of these options was Ps. 1,901 million, for which we have recorded a net fair value asset of Ps. 300 million as part of cumulative other comprehensive income. The maturity date of these options was in 2012.
The following table illustrates the effects that hypothetical fluctuations in the exchange rates of the U.S. dollar and the Euro relative to the Mexican peso would have on our equity and profit or loss:
| Foreign Currency Risk(1)(2) | Change in Exchange Rate | Effect on Equity | Effect on Profit or Loss | |||||||
2012 | ||||||||||
FEMSA | +9%EUR/+11%USD | Ps. | (250 | ) | Ps. | — | ||||
| -9%EUR/-11%USD | 104 | — | ||||||||
Coca-Cola FEMSA | -11%USD | (438 | ) | — | ||||||
2011 | ||||||||||
FEMSA | +13%EUR/+15%USD | Ps. | (189 | ) | Ps. | — | ||||
| -13%EUR/-15%USD | 191 | — | ||||||||
Coca-Cola FEMSA | -15%USD | (352 | ) | (127 | ) | |||||
| (1) | The sensitivity analysis effects include all subsidiaries of the Company. |
| (2) | Includes the sensitivity analysis effects of all derivative financial instruments related to foreign exchange risk. |
As of December 31, 2012, we had (i) cross currency swaps designated as fair value hedges under contracts with an aggregate notional amount of Ps. 2,553 million that expire in 2014, for which we have recorded a net fair value asset of Ps. 46 million; and (ii) cross currency swaps designated as fair value hedges under contracts with an aggregate notional amount of Ps. 2,711 million that expire in 2017, for which we have recorded a net fair value asset of Ps. 1,089 million. The net effect of our expired contracts for the year ended December 31, 2012, was recorded as interest expense of Ps. 44 million.
As of December 31, 2011, we had cross currency swaps designated as fair value hedges under contracts with an aggregate notional amount of Ps. 2,500 million that expire in 2013 and 2017, for which we have recorded a net fair value asset of Ps. 717860 million. The net effect of our expired contracts for the year ended December 31, 2011, was recorded as interest income of Ps. 8 million.
For the years ended December 31, 2010, 20092012, and 2008 was recorded as an interest income of Ps. 2 million in 2010, and as interest expenses of Ps. 32 million and Ps. 73 million as of December 31, 2009 and 2008, respectively.
For the year ended December 31, 2010,2011, certain cross currency swap instruments did not meet the hedging criteria for accounting purposes; consequently, changes in the estimated fair value were recorded in the income statement. The changes in fair value of these contracts represented gains of Ps. 205 million and Ps. 168 million in 2010 and 2009, respectively, and a loss of Ps. 2002 million in 2008.
As of December 31, 2010, we had determined that our leasing contracts denominated in U.S. dollars host an embedded derivative financial instrument. The fair value of these contracts is based on the exchange rate used to finish the contract as of the end of the period. For the year ended December 31, 20102012 and 2009, the fair value of these contracts resulted in gains of Ps. 15 million and Ps. 19 million, respectively, and a loss of Ps. 68 million as of December 31, 2008, which are recorded in the income statement as market value loss on ineffective portion of derivative financial instruments.2011, respectively.
A hypothetical, instantaneous and unfavorable 10% devaluation in the value of the Mexican peso relative to the U.S. dollar occurring on December 31, 2010,2012 would have resulted in a reduction inforeign exchange gain increasing our consolidated net consolidated integral result of financing expense ofincome by approximately Ps. 368526 million over the 12-month period of 2010,2012, reflecting highergreater foreign exchange gain and interest expense generated byin the cash balances held by us in U.S. dollars as of that date,and Euros, net of thea loss based onrelated to our U.S. dollar-denominated indebtedness at December 31, 2010. However, this result does not take into account any gain on monetary position that would be expected to result from an increase in the inflation rate generated by a devaluation of local currencies relative to the U.S. dollar in inflationary economic environments, which gain on monetary position would reduce the consolidated comprehensive financial result.denominated indebtedness.
As of MayMarch 31, 2011,2013, the exchange rates relative to the U.S. dollar of all the countries in which we operate, as well as their devaluation/revaluation effect compared to December 31, 2010,2012, are as follows:
Country | Currency | Exchange Rate as of May 31, 2011 | (Devaluation) / Revaluation | Currency | Exchange Rate as of March 31, 2013 | (Devaluation) / Revaluation | ||||||||||||||
Mexico | Mexican peso | 11.6526 | 5.9 | % | Mexican peso | 12.35 | 5.0 | % | ||||||||||||
Brazil | Reais | 1.5799 | 5.2 | % | Brazilian real | 2.01 | 1.5 | % | ||||||||||||
Venezuela | Bolívar fuerte | 4.3000 | — | Bolívar fuerte | 6.30 | (46.5 | )% | |||||||||||||
Colombia | Colombian peso | 1,817.3400 | 5.0 | % | Colombian peso | 1,832.20 | (3.6 | )% | ||||||||||||
Argentina | Argentine peso | 4.0900 | (2.9 | )% | Argentine peso | 5.12 | (4.1 | )% | ||||||||||||
Costa Rica | Colon | 511.1500 | 1.3 | % | Colón | 504.65 | 1.9 | % | ||||||||||||
Guatemala | Quetzal | 7.7956 | 2.7 | % | Quetzal | 7.78 | 1.6 | % | ||||||||||||
Nicaragua | Cordoba | 22.3287 | (2.0 | )% | Cordoba | 24.42 | (1.2 | )% | ||||||||||||
Panama | U.S. dollar | 1.0000 | — | U.S. dollar | 1.00 | 0.0 | % | |||||||||||||
Euro Zone | Euro | 16.5150 | 0.7 | % | Euro | 0.78 | (3.0 | )% | ||||||||||||
A hypothetical, instantaneous and unfavorable 10% devaluation in the value of the currencies of all the countries in which we operate, relative to the U.S. dollar, occurring on December 31, 2010,2012, would produce a reduction (or gain) in stockholders’ equity as follows:
Country | Currency | Reduction (gain) in Stockholders’ Equity | ||||
| (in millions of Mexican pesos) | ||||||
Mexico | Mexican peso | ) | ||||
Brazil | ||||||
Venezuela | Bolívar fuerte | |||||
Colombia | Colombian peso | |||||
Costa Rica | ||||||
Argentina | Argentine peso | |||||
Guatemala | Quetzal | |||||
Nicaragua | Cordoba | |||||
Panama | U.S. dollar | |||||
Euro Zone | Euro | |||||
As of December 31, 20102012 and 2009,2011, we did not have any equity forwardderivative agreements.
We entered into various derivative contracts to hedge the cost of certain raw materials that are exposed to variations of commodity price exchange rates. As of December 31, 2010,2012, we had various derivative instruments contracts with maturity dates in 20112013, 2014 and 2012,2015 notional amounts of Ps. 4512,971 million and a fair value assetliability of Ps. 445200 million. The resultresults of our commodity price contracts for the years ended December 31, 2010, 20092012, and 2008,2011, were gains of Ps. 393 million, Ps. 2476 million, and Ps. 2257 million, respectively, which were recorded in the results from operations of each year. After discontinuing our beer business, we have no derivative contracts that do not meet hedging criteria for accounting purposes.
| ITEM 12. | DESCRIPTION OF SECURITIES OTHER THAN EQUITY SECURITIES |
| ITEM 12A. | DEBT SECURITIES |
Not applicable.
| ITEM 12B. | WARRANTS AND RIGHTS |
Not applicable.
| ITEM 12C. | OTHER SECURITIES |
Not applicable.
| ITEM 12D. | AMERICAN DEPOSITARY SHARES |
The Bank of New York Mellon serves as the depositary for our ADSs. Holders of our ADSs, evidenced by ADRs, are required to pay various fees to the depositary, and the depositary may refuse to provide any service for which a fee is assessed until the applicable fee has been paid.
ADS holders are required to pay the depositary amounts in respect of expenses incurred by the depositary or its agents on behalf of ADS holders, including expenses arising from compliance with applicable law, taxes or other governmental charges, cable, telex and facsimile transmission, or the conversion of foreign currency into U.S. dollars. The depositary may decide in its sole discretion to seek payment by either billing holders or by deducting the fee from one or more cash dividends or other cash distributions.
ADS holders are also required to pay additional fees for certain services provided by the depositary, as set forth in the table below.
Depositary service | Fee payable by ADS holders | |
Issuance and delivery of ADSs, including in connection with share distributions, stock splits | Up to US$5.00 per 100 ADSs (or portion thereof) | |
Distribution of dividends(1) | Up to US$0.02 per ADS | |
Withdrawal of shares underlying ADSs | Up to US$5.00 per 100 ADSs (or portion thereof) |
| (1) | As of the date of this annual report, holders of our ADSs were not required to pay additional fees with respect to this service. |
Direct and indirect payments by the depositary
The depositary pays us an agreed amount, which includes reimbursements for certain expenses we incur in connection with the ADS program. These reimbursable expenses include legal and accounting fees, listing fees, investor relations expenses and fees payable to service providers for the distribution of material to ADS holders. For the year ended December 31, 2010,2012, this amount was US$728.7 thousand. 500,872.79.
| ITEMS 13-14. | NOT APPLICABLE |
| ITEM 15. | CONTROLS AND PROCEDURES |
(a) Disclosure Controls and Procedures
We have evaluated, with the participation of our chief executive officer and chief financial officer, the effectiveness of our disclosure controls and procedures as of December 31, 2010.2012. There are inherent limitations to the effectiveness of any system of disclosure controls and procedures, including the possibility of human error and the circumvention or overriding of the controls and procedures. Accordingly, even effective disclosure controls and procedures can only provide reasonable assurance of achieving their control objectives. Based upon our evaluation, our principal executive officer and principal financial officer concluded that our disclosure controls and procedures were effective to provide reasonable assurance that information required to be disclosed by us in the reports that we file or submit under the Securities Exchange Act of 1934, as amended (or the Exchange Act) is recorded, processed, summarized and reported, within the time periods specified in the applicable rules and forms, and that it is accumulated and communicated to our management, including our chief executive officer and chief financial officer, as appropriate to allow timely decisions regarding required disclosure.
(b) Management’s annual report on internal control over financial reporting
Our management is responsible for establishing and maintaining adequate internal control over financial reporting, as such term is defined in Rules 13a-15(f) and 15d-15(f) under the Securities Exchange Act of 1934, as amended.Act. Under the supervision and with the participation of our management, including our principal executive officer and principal financial officer, we conducted an evaluation of the effectiveness of our internal control over financial reporting based on the framework in Internal“Internal Control—Integrated Framework,” as issued by the Committee of Sponsoring Organizations of the Treadway Commission.
Our internal control over financial reporting is a process designed to provide reasonable assurance regarding the reliability of financial reporting and the preparation of financial statements for external purposes in accordance with generally accepted accounting principles.international financial reporting standards. Our internal control over financial reporting includes those policies and procedures that (i) pertain to the maintenance of records that, in reasonable detail, accurately and fairly reflect the transactions and dispositions of our assets, (ii) provide reasonable assurance that transactions are recorded as necessary to permit preparation of financial statements in accordance with generally accepted accounting principles,international financial reporting standards, and that our receipts and expenditures are being made only in accordance with authorizations of our management and directors, and (iii) provide reasonable assurance regarding prevention or timely detection of unauthorized acquisition, use, or disposition of our assets that could have a material effect on our financial statements.
Because of its inherent limitations, internal control over financial reporting may not prevent or detect misstatements. Also, projections of any evaluation of effectiveness to future periods are subject to the risk that controls may become inadequate because of changes in conditions, or that the degree of compliance with the policies or procedures may deteriorate. Based on our evaluation under the framework in Internal“Internal Controls—Integrated Framework,” as issued by the Committee of Sponsoring Organizations of the Treadway Commission, our management concluded that our internal control over financial reporting was effective as of December 31, 2010.2012.
Our management’s assessment and conclusion on the effectiveness of internal control over financial reporting as of December 31, 2012 excludes, in accordance with applicable guidance provided by the SEC, an assessment of the internal control over financial reporting of Fomento Queretano, the beverage division of which was acquired by our subsidiary Coca-Cola FEMSA in May 2012. The beverage division of Fomento Queretano represented 0.8%, as of December 31, 2012, of our total and of our net assets, and 1.0% of our revenues and of our net income for the year ended December 31, 2012.
The effectiveness of our internal control over financial reporting as of December 31, 20102012 has been audited by Mancera, S.C., a member of Ernst & Young Global, an independent registered public accounting firm, as stated in its report included herein.
(c) Attestation Report of the Registered Public Accounting Firm
REPORT OF INDEPENDENT REGISTERED PUBLIC ACCOUNTING FIRM ON
INTERNAL CONTROL OVER FINANCIAL REPORTING
The Board of Directors and Stockholders
Fomento Económico Mexicano, S.A.B. de C.V.
We have audited Fomento Económico Mexicano, S.A.B. de C.V. and subsidiaries’ internal control over financial reporting as of December 31, 2010,2012, based on criteria established in Internal Control—Integrated Framework issued by the Committee of Sponsoring Organizations of the Treadway Commission (the COSO criteria). Fomento Económico Mexicano, S.A.B. de C.V. and subsidiaries’ management is responsible for maintaining effective internal control over financial reporting, and for its assessment of the effectiveness of internal control over financial reporting included in the accompanying Management’s Annual Report on Internal Control over Financial Reporting. Our responsibility is to express an opinion on the company’s internal control over financial reporting based on our audit.
We conducted our audit in accordance with the standards of the Public Company Accounting Oversight Board (United States). Those standards require that we plan and perform the audit to obtain reasonable assurance about whether effective internal control over financial reporting was maintained in all material respects. Our audit included obtaining an understanding of internal control over financial reporting, assessing the risk that a material weakness exists, testing and evaluating the design and operating effectiveness of internal control based on the assessed risk, and performing such other procedures as we considered necessary in the circumstances. We believe that our audit provides a reasonable basis for our opinion.
A company’s internal control over financial reporting is a process designed to provide reasonable assurance regarding the reliability of financial reporting and the preparation of financial statements for external purposes in accordance with MexicanInternational Financial Reporting Standards includingas issued by the reconciliation to U.S. GAAP in accordance with Item 18 of Form 20F.International Accounting Standards Board. A company’s internal control over financial reporting includes those policies and procedures that (1) pertain to the maintenance of records that, in reasonable detail, accurately and fairly reflect the transactions and dispositions of the assets of the company; (2) provide reasonable assurance that transactions are recorded as necessary to permit preparation of financial statements in accordance with MexicanInternational Financial Reporting Standards includingas issued by the reconciliation to U.S. GAAP in accordance with Item 18 of Form 20F,International Accounting Standards Board, and that receipts and expenditures of the company are being made only in accordance with authorizations of management and directors of the company; and (3) provide reasonable assurance regarding prevention or timely detection of unauthorized acquisition, use, or disposition of the company’s assets that could have a material effect on the financial statements.
Because of its inherent limitations, internal control over financial reporting may not prevent ofor detect misstatements. Also, projections of any evaluation of effectiveness to future periods are subject to the risk that controls may become inadequate because of changes in conditions, or that the degree of compliance with the policies or procedures may deteriorate.
As indicated in the accompanying Management’s Annual Report on Internal Control over Financial Reporting, management’s assessment of and conclusion on the effectiveness of internal control over financial reporting did not include the internal controls of Grupo Fomento Queretano, S.A.P.I. de C.V. and its subsidiaries (collectively “Grupo FOQUE”) which was acquired on May 4, 2012, which is included in the 2012 consolidated financial statements of Fomento Económico Mexicano, S.A.B. de C.V. and subsidiaries, and constituted 0.8% of Fomento Economico Mexicano, S.A.B. de C.V.’s total and net assets respectively, as of December 31, 2012 and 1% of revenues and net income respectively, for the year then ended. Our audit of internal control over financial reporting of Fomento Económico Mexicano, S.A.B. de C.V. and subsidiaries, also did not include an evaluation of the internal control over financial reporting of Grupo FOQUE.
In our opinion, Fomento Económico Mexicano, S.A.B. de C.V. and subsidiaries maintained, in all material respects, effective internal control over financial reporting as of December 31, 2010,2012, based on the COSO criteria.
We also have audited, in accordance with the standards of the Public Company Accounting Oversight Board (United States), the consolidated balance sheetsstatements of financial position of Fomento Económico Mexicano, S.A.B. de C.V. and subsidiaries as of December 31, 20102012 and 2009,2011, and January 1, 2011 and the related consolidated income statements, consolidated statements of comprehensive income, consolidated statements of changes in stockholders’ equity, and consolidated statements of cash flows for each of the threetwo years in the period ended December 31, 2010,2012, and our report dated June 28, 2011April 8, 2013 expressed an unqualified opinion on those financial statements.thereon.
Mancera, S.C.
A member practice of Ernst & Young Global Agustín Aguilar Laurents | ||
| ||
|
Monterrey, N.L., Mexico
June 28, 2011April 8, 2013
(d) Changes in Internal Control over Financial Reporting
During 2010, there wereThere has been no changeschange in our internal control over financial reporting during 2012 that eitherhas materially affected, or would beis reasonably likely to have a material effect, on our internal control over financial reporting. The share exchange transaction with Heineken for our FEMSA Cerveza division caused the elimination of certain processes related to the FEMSA Cerveza division and the termination of certain non key financial reporting personnel. However, these changes did not have any effect onmaterially affect, our internal control over financial reporting.
| ITEM 16A. | AUDIT COMMITTEE FINANCIAL EXPERT |
ITEM 16A. AUDIT COMMITTEE FINANCIAL EXPERT
Our shareholders and our board of directors have designated José Manuel Canal Hernando, an independent director as required byunder the Mexican Securities Law and applicable New York Stock ExchangeU.S. Securities Laws and NYSE listing standards, as an “audit committee financial expert” within the meaning of this Item 16A.See “Item 6. Directors, Senior Management and Employees—Directors.”
| ITEM 16B. | CODE OF ETHICS |
We have adopted a code of ethics, within the meaning of this Item 16B of Form 20-F. Our code of ethics applies to our chief executive officer, chief financial officer, chief accounting officer and persons performing similar functions as well as to our directors and other officers and employees. Our code of ethics is available on our website at www.femsa.com. If we amend the provisions of our code of ethics that apply to our chief executive officer, chief financial officer, chief accounting officer and persons performing similar functions, or if we grant any waiver of such provisions, we will disclose such amendment or waiver on our web sitewebsite at the same address.
| ITEM 16C. | PRINCIPAL ACCOUNTANT FEES AND SERVICES |
Audit and Non-Audit Fees
For the fiscal years ended December 31, 20102012 and 2009,2011, Mancera, S.C., a member practice of Ernst & Young Global, was our auditor.
The following table summarizes the aggregate fees billed to us in 20102012 and 20092011 by Mancera, S.C., which is an independent registered public accounting firm, during the fiscal years ended December 31, 20102012 and 2009:2011:
| Year ended December 31, | Year ended December 31, | |||||||||||||||
| 2010 | 2009 | 2012 | 2011 | |||||||||||||
| (in millions of Mexican pesos) | (in millions of Mexican pesos) | |||||||||||||||
Audit fees | Ps. | 64 | Ps. | 88 | Ps. 88 | Ps. 83 | ||||||||||
Audit-related fees | 14 | 7 | 5 | 10 | ||||||||||||
Tax fees | 5 | 6 | 9 | 8 | ||||||||||||
Other fees | 0 | 1 | 5 | — | ||||||||||||
Total | Ps. | 83 | Ps. | 102 | Ps. 107 | Ps. 101 | ||||||||||
Audit fees. Audit fees in the above table represent the aggregate fees billed in connection with the audit of our annual financial statements, as well as to other limited procedures in connection with our quarterly financial information and other statutory and regulatory audit activities.
Audit-related fees. Audit-related fees in the above table for the year ended December 31, 2010 and 2009,2012 are the aggregate fees billed for assurance and other services related to the performance of the audit, mainly in connection with pro forma financial information, due diligence servicesspecial audits and other technical advice on accounting and audit related matters mainly associated with the Heineken transaction.reviews.
Tax fees. Tax fees in the above table are fees billed for services based upon existing facts and prior transactions in order to document, compute, and obtain government approval for amounts included in tax filings such as value-added tax return assistance and transfer pricing documentation and requests for technical advice from taxing authorities.documentation.
Other fees. In 2010Other fees in the above table, for the year ended December 31, 2012, includes mainly fees billed for due diligence services. For the year ended December 31, 2011, there were no other fees. Other fees in 2009 represented mainly non audit related services.
Audit Committee Pre-Approval Policies and Procedures
We have adopted pre-approval policies and procedures under which all audit and non-audit services provided by our external auditors must be pre-approved by the audit committee as set forth in the Audit Committee’s charter. Any service proposals submitted by external auditors need to be discussed and approved by the Audit Committee during its meetings, which take place at least four times a year. Once the proposed service is approved, we or our subsidiaries formalize the engagement of services. The approval of any audit and non-audit services to be provided by our external auditors is specified in the minutes of our Audit Committee. In addition, the members of our board of directors are briefed on matters discussed by the different committees of our board.
| ITEM 16D. | NOT APPLICABLE |
| ITEM 16E. | PURCHASES OF EQUITY SECURITIES BY THE ISSUER AND AFFILIATED PURCHASERS |
We did not purchase any of our equity securities in 2010.2012. The following table presents purchases by trusts that we administer in connection with our stock incentive plans, which purchases may be deemed to be purchases by an affiliated purchaser of us.See “Item 6. Directors, Senior Management and Employees—Employees––EVA Stock Incentive Plan.”
Purchases of Equity Securities
| Total Number of BD Units Purchased | Average Price Paid per BD Units | Total Number of Shares (or Units) Purchased as Part of Publicly Announced Plans Programs | Maximum Number (or Appropriate U.S. dollar Value) of Shares May Yet Be Purchased Under the Plans or Programs | |||||||||||||||
March | |||||||||||||||||||
| Ps.92.75 | — | — | |||||||||||||||||
| |||||||||||||||||||
| |||||||||||||||||||
| |||||||||||||||||||
| ITEM 16F. | NOT APPLICABLE |
| ITEM 16G. | CORPORATE GOVERNANCE |
Pursuant to Rule 303A.11 of the Listed Company Manual of the NYSE, we are required to provide a summary of the significant ways in which our corporate governance practices differ from those required for U.S. companies under the NYSE listing standards. We are a Mexican corporation with shares listed on the Mexican Stock Exchange. Our corporate governance practices are governed by our bylaws, the Mexican Securities Law and the regulations issued by the CNBV. We also disclose the extent of compliance with theCódigo de Mejores Prácticas Corporativas (Mexican Code of Best Corporate Practices), which was created by a group of Mexican business leaders and was endorsed by the CNBV.
The table below discloses the significant differences between our corporate governance practices and the NYSE standards.
NYSE Standards | Our Corporate Governance Practices | |
| Directors | Directors
The Mexican Securities Law sets forth, in article 26, the definition of “independence,” which differs from the one set forth in Section 303A.02 of the Listed Company Manual of the NYSE. Generally, under the Mexican Securities Law, a director is not independent if such director: (i) is an employee or a relevant officer of the company or its subsidiaries; (ii) is an individual with significant influence over the company or its subsidiaries; (iii) is a shareholder or participant of the controlling group of the company; (iv) is a client, supplier, debtor, creditor, partner or employee of an important client, supplier, debtor or creditor of the company; or (v) is a family member of any of the aforementioned persons.
In accordance with the Mexican Securities Law, our shareholders are required to make a determination as to the independence of our directors at an ordinary meeting of our shareholders, though the CNBV may challenge that determination. Our board of directors is not required to make a determination as to the independence of our directors. | |
| Executive sessions:Non-management directors must meet at regularly scheduled executive sessions without management. | Executive sessions:Under our bylaws and applicable Mexican law, our non-management and independent directors are not required to meet in executive sessions.
Our bylaws state that the board of directors will meet at least four times a year, following the end of each quarter, to discuss our operating results and progress in achieving strategic objectives. Our board of directors can also hold extraordinary meetings. | |
| Nominating/Corporate Governance Committee:A nominating/corporate governance committee composed entirely of independent directors is required. | Nominating/Corporate Governance Committee:We are not required to have a nominating committee, and the Mexican Code of Best Corporate Practices does not provide for a nominating committee. | |
| However, Mexican law requires us to have a Corporate Practices Committee. Our Corporate Practices Committee is composed of three members, and as required by the Mexican Securities Law and our bylaws, the three members are independent. | ||
NYSE Standards | Our Corporate Governance Practices | |
| Compensation Committee:A compensation committee composed entirely independent directors is required. | Compensation Committee: We do not have a committee that exclusively oversees compensation issues. Our Corporate Practices Committee, composed entirely of independent directors, reviews and recommends management compensation programs in order to ensure that they are aligned with shareholders’ interests and corporate performance. | |
|
| |
| Audit Committee: Listed companies must have an | Audit Committee: We have an Audit Committee of four members. Each member of the Audit Committee is an independent director, as required by the Mexican Securities Law. | |
| Equity compensation plan:Equity compensation plans require shareholder approval, subject to limited exemptions. | Equity compensation plan:Shareholder approval is not required under Mexican law or our bylaws for the adoption and amendment of an equity compensation plan. Such plans should provide for general application to all executives. Our current equity compensation plans have been approved by our board of directors. | |
| Code of business conduct and ethics:Corporate governance guidelines and a code of conduct and ethics are required, with disclosure of any waiver for directors or executive officers. | Code of business conduct and ethics: We have adopted a code of ethics, within the meaning of Item 16B of SEC Form 20-F. Our code of ethics applies to our Chief Executive Officer, Chief Financial Officer and persons performing similar functions as well as to our directors and other officers and employees. Our code of ethics is available on our website at www.femsa.com. If we amend the provisions of our code of ethics that apply to our Chief Executive Officer, Chief Financial Officer and persons performing similar functions, or if we grant any waiver of such provisions, we will disclose such amendment or waiver on our website at the same address. | |
| ITEM 16H. | NOT APPLICABLE |
| ITEM 17. | NOT APPLICABLE |
| ITEM 18. | FINANCIAL STATEMENTS |
See pages F-1 through F-145,F-144, incorporated herein by reference.
| 1.1 | Bylaws | |
| 1.2 | Share Exchange Agreement by and between Heineken Holding N.V., Heineken N.V., Compañía Internacional de Bebidas, S.A. de C.V., Grupo Industrial Emprex, S.A. de C.V., and FEMSA dated as of January 11, 2010 (incorporated by reference to Exhibit 1.2 of FEMSA’s Annual Report on Form 20-F filed on June 25, 2010 (File No. 333-08752)). | |
| 1.3 | First Amendment to Share Exchange Agreement by and between Heineken Holding N.V., Heineken N.V., Compañía Internacional de Bebidas, S.A. de C.V., Grupo Industrial Emprex, S.A. de C.V., and FEMSA dated as of April 26, 2010 (incorporated by reference to Exhibit 1.3 of FEMSA’s Annual Report on Form 20-F filed on June 25, 2010 (File No. 333-08752)). | |
| 1.4 | Corporate Governance Agreement, dated April 30, 2010, between Heineken Holding N.V., Heineken N.V., L’Arche Green N.V., FEMSA and CB | |
| 2.1 | Deposit Agreement, as further amended and restated as of May 11, 2007, among FEMSA, The Bank of New York, and all owners and holders from time to time of any American Depositary Receipts, including the form of American Depositary Receipt (incorporated by reference to FEMSA’s registration statement on Form F-6 filed on April 30, 2007 (File No. 333- 142469)). | |
| 2.2 | Specimen certificate representing a BD Unit, consisting of one Series B Share, two Series D-B Shares and two Series D-L Shares, together with an English translation (incorporated by reference to FEMSA’s registration statement on Form F-4 filed on April 9, 1998 (File No. 333-8618)). | |
| 2.3 | Indenture dated as of February 5, 2010 among Coca-Cola FEMSA, S.A.B. de C.V., and The Bank of New York Mellon (incorporated by reference to Exhibit 2.2 to Coca-Cola FEMSA’s Annual Report on Form 20-F filed on June 10, 2010 (File No. 1-12260)). | |
| 2.4 | First Supplemental Indenture dated as of February 5, 2010 among Coca-Cola FEMSA, S.A.B. de C.V., and The Bank of New York Mellon and the Bank of New York Mellon (Luxembourg) S.A. (incorporated by reference to Exhibit 2.3 to Coca-Cola FEMSA’s Annual Report on Form 20-F filed on June 10, 2010 (File No. 1-12260)). | |
| 2.5 | Second Supplemental Indenture dated as of April 1, 2011 among Coca-Cola FEMSA, S.A.B. de C.V., Propimex, S. de R.L. de C.V. (formerly Propimex, S.A. de C.V.), as Guarantor, and The Bank of New York Mellon (incorporated by reference to Coca-Cola FEMSA’s Annual Report on Form 20-F filed on June 17, 2011 (File No. 001-12260)). | |
| 3.1 | Amended Voting Trust Agreement among certain principal shareholders of FEMSA together with an English translation (incorporated by reference to FEMSA’s Schedule 13D as amended filed on August 11, 2005 (File No. 005-54705)). | |
| 4.1 | Amended and Restated Shareholders’ Agreement, dated as of July 6, 2002, by and among CIBSA, Emprex, The Coca-Cola Company and Inmex (incorporated by reference to Coca-Cola FEMSA’s Annual Report on Form 20-F filed on June 27, 2003 (File No. 1-12260)). | |
| 4.2 | Amendment, dated May 6, 2003, to the Amended and Restated Shareholders’ Agreement dated July 6, 2002, among CIBSA, Emprex, The Coca-Cola Company, Inmex, Atlantic Industries, Dulux CBAI 2003 B.V. and Dulux CBEXINMX 2003 B.V. (incorporated by reference to Exhibit 4.14 to Coca-Cola FEMSA’s Annual Report on Form 20-F filed on June 27, 2003 (File No. 1-12260)). | |
| 4.3 | Second Amendment, dated February 1, 2010, to the Amended and Restated Shareholders’ Agreement dated July 6, 2002, among CIBSA, Emprex, The Coca-Cola Company, Inmex and Dulux CBAI 2003 B.V. (incorporated by reference to Exhibit 4.3 to Coca-Cola FEMSA’s Annual Report on Form 20-F filed on June 10, 2010 (File No. 1-12260)). | |
| 4.4 | Amended and Restated Bottler Agreement, dated June 21, 2003, between Coca-Cola FEMSA and The Coca-Cola Company with respect to operations in the southeast of Mexico (incorporated by reference to Exhibit 4.3 to Coca-Cola FEMSA’s Annual Report on Form 20-F filed on April 5, 2004 (File No. 1-12260)). | |
| 4.5 | Supplemental Agreement, dated June 21, 1993, between Coca-Cola FEMSA and The Coca-Cola Company with respect to operations in the southeast of Mexico (with English translation) (incorporated by reference to Exhibit 10.3 to Coca-Cola FEMSA’s Registration Statement on Form F-1 filed on August 13, 1993 (File No. 333-67380)). | |
| 4.6 | Amended and Restated Bottler Agreement, dated June 21, 2003, between Coca-Cola FEMSA and The Coca-Cola Company with respect to operations in the southeast of Mexico (incorporated by reference to Coca-Cola FEMSA’s Annual Report on Form 20-F filed on April 5, 2004 (File No. 1-12260)). | |
| 4.7 | Supplemental Agreement, dated June 21, 1993, between Coca-Cola FEMSA and The Coca-Cola Company with respect to operations in the southeast of Mexico (with English translation) (incorporated by reference to Exhibit 10.4 to Coca-Cola FEMSA’s Registration Statement on Form F-1 filed on August 13, 1993 (File No. 333-67380)). | |
| 4.8 | Amendments, dated May 17 and July 20, 1995, to Bottler Agreement and Letter of Agreement, dated August 22, 1994, each with respect to operations in Argentina between Coca-Cola FEMSA and The Coca-Cola Company (with English translation) (incorporated by reference to Exhibit 10.3 to Coca-Cola FEMSA’s Annual Report on Form 20-F filed on June 28, 1996 (File No. 1-12260)). | |
| 4.9 | Bottler Agreement, dated December 1, 1995, between Coca-Cola FEMSA and The Coca-Cola Company with respect to operations in SIRSA (with English translation) (incorporated by reference to Exhibit 10.4 to Coca-Cola FEMSA’s Annual Report on Form 20-F filed on June 28, 1996 (File No. 1-12260)). | |
| 4.10 | Supplemental Agreement, dated December 1, 1995, between Coca-Cola FEMSA and The Coca-Cola Company with respect to operations in SIRSA (with English translation) (incorporated by reference to Exhibit 10.6 to Coca-Cola FEMSA’s Annual Report on Form 20-F filed on June 28, 1996 (File No. 1-12260)). | |
| 4.11 | Amendment, dated February 1, 1996, to Bottler Agreement between Coca-Cola FEMSA and The Coca-Cola Company with respect to operations in SIRSA, dated December 1, 1995 (with English translation) (incorporated by reference to Exhibit 10.5 to Coca-Cola FEMSA’s Annual Report on Form 20-F filed on June 28, 1996 (File No. 1-12260)). | |
| 4.12 | Amendment, dated May 22, 1998, to Bottler Agreement with respect to the former SIRSA territory, dated December 1, 1995, between Coca-Cola FEMSA and The Coca-Cola Company (with English translation) (incorporated by reference to Exhibit 4.12 to Coca-Cola FEMSA’s Annual Report on Form 20-F filed on June 20, 2001 (File No. 1-12260)). | |
| 4.13 | Supply Agreement, dated June 21, 1993, between Coca-Cola FEMSA and FEMSA Empaques (incorporated by reference to FEMSA’s registration statement on Form F-4 filed on April 9, 1998 (File No. 333-8618)). | |
| 4.14 | Bottler Agreement and Side Letter dated June 1, 2005, between Panamco Golfo, S.A. de C.V. and The Coca-Cola Company with respect to operations in Golfo, Mexico (English translation) (incorporated by reference to Exhibit 4.7 to Coca-Cola FEMSA’s Annual Report on Form 20-F filed on April 18, 2006 (File No. 1-12260)). | |
| 4.15 | Bottler Agreement and Side Letter dated June 1, 2005, between Panamco Baijo, S.A. de C.V., and The Coca-Cola Company with respect to operations in Baijo, Mexico (English translation). (incorporated by reference to Exhibit 4.8 to Coca-Cola FEMSA’s Annual Report on Form 20-F filed on April 18, 2006 (File No. 1-12260)). | |
| 4.16 | Coca-Cola Tradename License Agreement dated June 21, 1993, between Coca-Cola FEMSA and The Coca-Cola Company (with English translation) (incorporated by reference to FEMSA’s Registration Statement on Form F-4 filed on April 9, 1998 (File No. 333-8618)). | |
| 4.17 | Amendment to the Trademark License Agreement, dated December 1, 2002, entered by and among Administración de Marcas S.A. de C.V., as proprietor, and The Coca-Cola Export Corporation Mexico branch, as licensee (incorporated by reference to Panamco’s Quarterly Report on Form 10-Q for the period ended March 31, 2003 (File No. 1-2290)). | |
| 4.18 | Trademark Sub-License Agreement, dated January 4, 2003, entered by and among Panamco Golfo S.A. de C.V., as licensor, and The Coca-Cola Company, as licensee (incorporated by reference to Panamco’s Quarterly Report on Form 10-Q for the period ended March 31, 2003 (File No. 1-12290)). | |
| 4.19 | Trademark Sub-License Agreement, dated January 4, 2003, entered by and among Panamco Bajio S.A. de C.V., as licensor, and The Coca-Cola Company, as licensee (incorporated by reference to Panamco’s Quarterly Report on Form 10-Q for the period ended March 31, 2003 (File No. 1-12290)). | |
| 4.20 | Supply Agreement dated April 3, 1998, between ALPLA Fábrica de Plásticos, S.A. de C.V. and Industria Embotelladora de México, S.A. de C.V. (with English translation) (incorporated by reference to Exhibit 4.18 to Coca-Cola FEMSA’s Annual Report on Form 20-F filed on July 1, 2002 (File No. 1-12260)). | |
| 4.21 | Services Agreement, dated November 7, 2000, between Coca-Cola FEMSA and FEMSA Logística (with English translation) (incorporated by reference to Exhibit 4.15 to Coca-Cola FEMSA’s Annual Report on Form 20-F filed on June 20, 2001 (File No. 1-12260)). | |
| 4.22 | Promotion and Non-Compete Agreement, dated March 11, 2003, entered by and among The Coca-Cola Export Corporation Mexico branch and Panamco Bajio S.A. de C.V. (with English translation) (incorporated by reference to Panamco’s Quarterly Report on Form 10-Q for the period ended March 31, 2003 (File No. 1-12290)). | |
| 4.23 | Promotion and Non-Compete Agreement, dated March 11, 2003, entered by and among The Coca-Cola Export Corporation Mexico branch and Panamco Golfo S.A. de C.V. (with English translation) (incorporated by reference to Panamco’s Quarterly Report on Form 10-Q for the period ended March 31, 2003 (File No. 1-12290)). | |
| 4.24 | Memorandum of Understanding, dated as of March 11, 2003, by and among Panamco, as seller, and The Coca-Cola Company, as buyer (incorporated by reference to Panamco’s Quarterly Report on Form 10-Q for the period ended March 31, 2003 (File No. 1-12290)). | |
| 4.25 | Bottler Agreement, dated August 22, 1994, between Coca-Cola FEMSA and The Coca-Cola Company with respect to operations in Argentina (with English translation) (incorporated by reference to Exhibit 10.1 to Coca-Cola FEMSA’s Annual Report on Form 20-F filed on June 30, 1995 (File No. 1-12260)). | |
| 4.26 | Supplemental Agreement, dated August 22, 1994, between Coca-Cola FEMSA and The Coca-Cola Company with respect to operations in Argentina (with English translation) (incorporated by reference to Exhibit 10.2 to Coca-Cola FEMSA’s Annual Report on Form 20-F filed on June 30, 1995 (File No. 1-12260)). | |
| 4.27 | The Coca-Cola Company Memorandum to Steve Heyer from Jose Antonio Fernández, dated December 22, 2002 (incorporated by reference to Exhibit 10.1 to FEMSA’s Registration Statement on Amendment No. 1 to the Form F-3 filed on September 20, 2004 (File No. 333-117795)). | |
| 4.28 | Shareholders Agreement dated as of January 25, 2013, by and among CCBPI, Coca-Cola South Asia Holdings, Inc., Coca-Cola Holdings (Overseas) Limited and Controladora de Inversiones en Bebidas Refrescantes, S.L. (incorporated by reference to Exhibit 4.27 to Coca-Cola FEMSA’s Annual Report on Form 20-F filed on March 15, 2013 (File No. 1-12260)). | |
| 8.1 | Significant Subsidiaries. | |
| 12.1 | CEO Certification pursuant to Section 302 of the Sarbanes-Oxley Act of 2002, dated | |
| 12.2 | CFO Certification pursuant to Section 302 of the Sarbanes-Oxley Act of 2002, dated | |
| 13.1 | Officer Certification pursuant to Section 906 of the Sarbanes-Oxley Act of 2002, dated | |
SIGNATURE
The registrant hereby certifies that it meets all of the requirements for filing on Form 20-F and that it has duly caused and authorized the undersigned to sign this annual report on its behalf.
Date: June 28, 2011April 8, 2013
| Fomento Económico Mexicano, S.A.B. de C.V. | ||
| By: | /s/ Javier Astaburuaga Sanjines | |
Javier Astaburuaga Sanjines | ||
| ||
FOMENTO ECONÓMICO MEXICANO, S.A.B. DE C.V. AND SUBSIDIARIES
MONTERREY, N.L., MEXICOMÉXICO
Audited consolidated financial statements of Fomento Económico Mexicano, S.A.B. de C.V.
| F-1 | ||||
| F-2 | ||||
Consolidated income statements for the years ended December 31, | F-3 | |||
Consolidated statements of comprehensive income for the years ended December 31, 2012 and 2011 | F-4 | |||
Consolidated statements of changes in equity for the years ended December 31, 2012 and 2011 | F-5 | |||
Consolidated statements of cash flows for the years ended December 31, | ||||
| F-6 | ||||
| F-7 | ||||
Audited consolidated financial statements of Heineken N.V. | ||||
| F-70 | ||||
Consolidated income statement for the years ended December 31, | F-71 | |||
| F-72 | ||||
Consolidated statement of financial position as at December 31, | F-73 | |||
Consolidated statement of cash flows for the years ended December 31, | F-74 | |||
Consolidated statement of changes in equity for the years ended December 31, | F-76 | |||
| F-78 | ||||
REPORT OF INDEPENDENT REGISTERED PUBLIC ACCOUNTING FIRM
The Board of Directors and StockholdersShareholders of
Fomento Económico Mexicano, S.A.B. de C.V.
We have audited the accompanying consolidated balance sheetsstatements of financial position of Fomento Económico Mexicano, S.A.B. de C.V. and its subsidiaries as of December 31, 20102012 and 2009,2011 and January 1, 2011, and the related consolidated income statements, consolidated statements of comprehensive income, consolidated statements of changes in stockholders’ equity and consolidated statements of cash flows for each of the threetwo years in the period ended December 31, 2010.2012. These financial statements are the responsibility of the Company’s management. Our responsibility is to express an opinion on these financial statements based on our audits. The financial statements of Heineken N. V. (a corporation in which the Company has a 9.24% interest)12.53% interest as of December 31, 2012, 2011 and January 1, 2011) which is majority owned by Heineken HoldingsHolding N.V. (a corporation in which the Company has a 14.94% interest)interest in both years and as of January 1, 2011) (collectively “Heineken”), prepared under International Financial Reporting Standards as adopted by the International Accounting Standards Board (IFRS), have been audited by other auditors whose report dated February 15, 201112, 2013 has been furnished to us, and our opinion on the consolidated financial statements, insofar as it relates to the amounts included for Heineken, is based on the report of the other auditors. In the consolidated financial statements, the Company’s investment in Heineken is stated at Ps.77,484, Ps. 74,746 and Ps. 66,478 million at December 31, 20102012, 2011 and January 1, 2011 respectively and the Company’s equity in the net income of Heineken is stated at Ps. 3,319 million8,311 and Ps. 4,880 for the eight month period from April 30 toyears ended December 31, 2010.2012 and 2011 respectively.
We conducted our audits in accordance with the standards of the Public Company Accounting Oversight Board (United States). Those standards require that we plan and perform the audit to obtain reasonable assurance about whether the financial statements are free of material misstatement. An audit includes examining, on a test basis, evidence supporting the amounts and disclosures in the financial statements. An audit also includes assessing the accounting principles used and significant estimates made by management, as well as evaluating the overall financial statement presentation (including the Company’s conversion of the financial statements of Heineken to Mexican Financial Reporting Standards, as of December 31, 2010 and for the eight month period from April 30 to December 31, 2010).presentation. We believe that our audits and the report of other auditors provide a reasonable basis for our opinion.
In our opinion, based on our audits and the report of other auditors, the accompanying consolidated financial statements referred to above present fairly, in all material respects, the consolidated financial position of Fomento Económico Mexicano, S.A.B. de C.V. and its subsidiaries atas of December 31, 20102012 and 2009,2011 and January 1, 2011, and the consolidated results of their operations and consolidatedtheir cash flows for each of the threetwo years in the period ended December 31, 2010,2012, in conformity with MexicanInternational Financial Reporting Standards which differ in certain respects from accounting principles generally accepted inas issued by the United States (See Notes 27 and 28 to the consolidated financial statements).
As disclosed in Note 3 to the accompanying consolidated financial statements, among other Mexican Financial ReportingInternational Accounting Standards (“MFRS”), the Company adopted MFRS B-8Consolidated and Combined Financial Statements during 2009.Board.
We have also have audited, in accordance with the standards of the Public Company Accounting Oversight Board (United States), Fomento Económico Mexicano, S.A.B. de C.V. and subsidiaries’ internal control over financial reporting as of December 31, 2010,2012, based on criteria established in Internal Control—IntegratedControl-Integrated Framework issued by the Committee of Sponsoring Organizations of the Treadway Commission and our report dated June 28, 2011April 8, 2013 expressed an unqualified opinion thereon.
Mancera, S.C. A member practice of Ernst & Young Global Agustin Aguilar Laurents
|
Monterrey, N.L., MéxicoNL, Mexico
June 28, 2011April 8, 2013
FOMENTO ECONÓMICO MEXICANO, S.A.B. DE C.V. AND SUBSIDIARIES
MONTERREY, N.L., MÉXICO
Consolidated Balance SheetsStatements of Financial Position
AtAs of December 31, 20102012, 2011 and 2009. as of January 1, 2011 (Date of transition to IFRS)
Amounts expressed in millions of U.S. dollars ($) and in millions of Mexican pesos (Ps.).
| Note | 2010 | 2009 | Note | December 2012(*) | December 2012 | December 2011 | January 1, 2011 | |||||||||||||||||||||||||||||
ASSETS | ||||||||||||||||||||||||||||||||||||
Current Assets: | ||||||||||||||||||||||||||||||||||||
Cash and cash equivalents | 5 B | $ | 2,188 | Ps. | 27,097 | Ps. | 14,508 | 5 | $ | 2,817 | Ps. 36,521 | Ps. 25,841 | Ps. 26,705 | |||||||||||||||||||||||
Marketable securities | 5 B | 5 | 66 | 2,113 | ||||||||||||||||||||||||||||||||
Accounts receivable | 7 | 623 | 7,702 | 6,891 | ||||||||||||||||||||||||||||||||
Investments | 6 | 123 | 1,595 | 1,329 | 66 | |||||||||||||||||||||||||||||||
Accounts receivable, net | 7 | 837 | 10,837 | 10,498 | 7,701 | |||||||||||||||||||||||||||||||
Inventories | 8 | 924 | 11,447 | 9,995 | 8 | 1,261 | 16,345 | 14,360 | 11,314 | |||||||||||||||||||||||||||
Recoverable taxes | 343 | 4,243 | 3,491 | 484 | 6,277 | 5,343 | 5,152 | |||||||||||||||||||||||||||||
Other current financial assets | 9 | 196 | 2,546 | 1,018 | 409 | |||||||||||||||||||||||||||||||
Other current assets | 9 | 73 | 905 | 1,265 | 9 | 103 | 1,334 | 1,594 | 976 | |||||||||||||||||||||||||||
Current assets of discontinued operations | 2 | — | — | 13,450 | ||||||||||||||||||||||||||||||||
|
|
|
| |||||||||||||||||||||||||||||||||
Total current assets | 4,156 | 51,460 | 51,713 | 5,821 | 75,455 | 59,983 | 52,323 | |||||||||||||||||||||||||||||
|
|
|
| |||||||||||||||||||||||||||||||||
Investments in shares | 10 | 5,556 | 68,793 | 2,208 | ||||||||||||||||||||||||||||||||
Property, plant and equipment | 11 | 3,219 | 39,856 | 38,369 | ||||||||||||||||||||||||||||||||
Bottles and cases | 184 | 2,280 | 1,914 | |||||||||||||||||||||||||||||||||
Intangible assets | 12 | 4,227 | 52,340 | 51,992 | ||||||||||||||||||||||||||||||||
Deferred tax asset | 24 D | 28 | 346 | 1,527 | ||||||||||||||||||||||||||||||||
Other assets | 13 | 686 | 8,503 | 19,365 | ||||||||||||||||||||||||||||||||
Non current assets of discontinued operations | 2 | — | — | 58,818 | ||||||||||||||||||||||||||||||||
Investments in associates and joint ventures | 10 | 6,467 | 83,840 | 78,643 | 68,793 | |||||||||||||||||||||||||||||||
Property, plant and equipment, net | 11 | 4,756 | 61,649 | 54,563 | 42,182 | |||||||||||||||||||||||||||||||
Intangible assets, net | 12 | 5,237 | 67,893 | 63,030 | 44,253 | |||||||||||||||||||||||||||||||
Deferred tax assets | 24 | 156 | 2,028 | 2,000 | 3,734 | |||||||||||||||||||||||||||||||
Other financial assets | 13 | 174 | 2,254 | 2,745 | 1,388 | |||||||||||||||||||||||||||||||
Other assets, net | 13 | 218 | 2,823 | 2,398 | 2,022 | |||||||||||||||||||||||||||||||
|
|
|
| |||||||||||||||||||||||||||||||||
TOTAL ASSETS | 18,056 | 223,578 | 225,906 | $ | 22,829 | Ps. 295,942 | Ps. 263,362 | Ps. 214,695 | ||||||||||||||||||||||||||||
|
|
|
| |||||||||||||||||||||||||||||||||
LIABILITIES AND STOCKHOLDERS’ EQUITY | ||||||||||||||||||||||||||||||||||||
LIABILITIES AND EQUITY | ||||||||||||||||||||||||||||||||||||
Current Liabilities: | ||||||||||||||||||||||||||||||||||||
Bank loans and notes payable | 18 | 127 | 1,578 | 3,816 | 18 | $ | 325 | Ps. 4,213 | Ps. 638 | Ps. 1,578 | ||||||||||||||||||||||||||
Current portion of long-term debt | 18 | 139 | 1,725 | 4,723 | 18 | 346 | 4,489 | 4,935 | 1,725 | |||||||||||||||||||||||||||
Interest payable | 13 | 165 | 103 | 16 | 207 | 216 | 165 | |||||||||||||||||||||||||||||
Suppliers | 1,410 | 17,458 | 16,311 | 1,900 | 24,629 | 21,475 | 17,458 | |||||||||||||||||||||||||||||
Accounts payable | 434 | 5,375 | 6,305 | 503 | 6,522 | 5,488 | 5,151 | |||||||||||||||||||||||||||||
Taxes payable | 176 | 2,180 | 4,038 | 389 | 5,048 | 4,241 | 3,089 | |||||||||||||||||||||||||||||
Other current liabilities | 25 A | 165 | 2,035 | 1,922 | ||||||||||||||||||||||||||||||||
Current liabilities of discontinued operations | 2 | — | — | 10,883 | ||||||||||||||||||||||||||||||||
Other current financial liabilities | 25 | 258 | 3,347 | 2,135 | 1,726 | |||||||||||||||||||||||||||||||
Current portion of other long-term liabilities | 6 | 61 | 197 | 276 | ||||||||||||||||||||||||||||||||
|
|
|
| |||||||||||||||||||||||||||||||||
Total current liabilities | 2,464 | 30,516 | 48,101 | 3,743 | 48,516 | 39,325 | 31,168 | |||||||||||||||||||||||||||||
|
|
|
| |||||||||||||||||||||||||||||||||
Long-Term Liabilities: | ||||||||||||||||||||||||||||||||||||
Bank loans and notes payable | 18 | 1,793 | 22,203 | 21,260 | 18 | 2,209 | 28,640 | 23,819 | 21,935 | |||||||||||||||||||||||||||
Labor liabilities | 16 B | 152 | 1,883 | 1,776 | ||||||||||||||||||||||||||||||||
Deferred tax liability | 24 D | 853 | 10,567 | 867 | ||||||||||||||||||||||||||||||||
Contingencies and other liabilities | 25 B | 437 | 5,396 | 5,857 | ||||||||||||||||||||||||||||||||
Non current liabilities of discontinued operations | 2 | — | — | 32,216 | ||||||||||||||||||||||||||||||||
Post-employment and other long-term employee benefits | 16 | 283 | 3,675 | 2,584 | 2,338 | |||||||||||||||||||||||||||||||
Deferred tax liabilities | 24 | 54 | 700 | 414 | 223 | |||||||||||||||||||||||||||||||
Other financial liabilities | 25 | 65 | 836 | 1,493 | 1,972 | |||||||||||||||||||||||||||||||
Provisions and other long-term liabilities | 25 | 263 | 3,414 | 3,556 | 3,661 | |||||||||||||||||||||||||||||||
|
|
|
| |||||||||||||||||||||||||||||||||
Total long-term liabilities | 3,235 | 40,049 | 61,976 | 2,874 | 37,265 | 31,866 | 30,129 | |||||||||||||||||||||||||||||
|
|
|
| |||||||||||||||||||||||||||||||||
Total liabilities | 5,699 | 70,565 | 110,077 | 6,617 | 85,781 | 71,191 | 61,297 | |||||||||||||||||||||||||||||
|
|
|
| |||||||||||||||||||||||||||||||||
Stockholders’ Equity: | ||||||||||||||||||||||||||||||||||||
Noncontrolling interest in consolidated subsidiaries | 21 | 2,880 | 35,665 | 34,192 | ||||||||||||||||||||||||||||||||
Equity: | ||||||||||||||||||||||||||||||||||||
Controlling interest: | ||||||||||||||||||||||||||||||||||||
Capital stock | 432 | 5,348 | 5,348 | 258 | 3,346 | 3,345 | 3,345 | |||||||||||||||||||||||||||||
Additional paid-in capital | 1,660 | 20,558 | 20,548 | 1,754 | 22,740 | 20,656 | 14,757 | |||||||||||||||||||||||||||||
Retained earnings from prior years | 4,122 | 51,045 | 43,835 | |||||||||||||||||||||||||||||||||
Net income | 3,251 | 40,251 | 9,908 | |||||||||||||||||||||||||||||||||
Retained earnings | 9,913 | 128,508 | 114,487 | 103,695 | ||||||||||||||||||||||||||||||||
Cumulative other comprehensive income | 5 W | 12 | 146 | 1,998 | 52 | 665 | 5,734 | 80 | ||||||||||||||||||||||||||||
|
|
|
| |||||||||||||||||||||||||||||||||
Controlling interest | 9,477 | 117,348 | 81,637 | |||||||||||||||||||||||||||||||||
Total controlling interest | 11,977 | 155,259 | 144,222 | 121,877 | ||||||||||||||||||||||||||||||||
|
|
|
| |||||||||||||||||||||||||||||||||
Total stockholders’ equity | 12,357 | 153,013 | 115,829 | |||||||||||||||||||||||||||||||||
Non-controlling interest in consolidated subsidiaries | 21 | 4,235 | 54,902 | 47,949 | 31,521 | |||||||||||||||||||||||||||||||
|
|
|
| |||||||||||||||||||||||||||||||||
TOTAL LIABILITIES AND STOCKHOLDERS’ EQUITY | $ | 18,056 | Ps. | 223,578 | Ps. | 225,906 | ||||||||||||||||||||||||||||||
Total equity | 16,212 | 210,161 | 192,171 | 153,398 | ||||||||||||||||||||||||||||||||
|
|
|
| |||||||||||||||||||||||||||||||||
TOTAL LIABILITIES AND EQUITY | $ | 22,829 | Ps. 295,942 | Ps. 263,362 | Ps. 214,695 | |||||||||||||||||||||||||||||||
|
|
|
| |||||||||||||||||||||||||||||||||
| (*) | Convenience translation to U. S. dollars ($) – see Note 2. 2. 3 |
| José Antonio Fernández Carbajal | Javier Astaburuaga Sanjines | |
| Chairman of the Board and Chief Executive Officer | Chief Financial and Strategic Development Officer |
The accompanying notes are an integral part of these consolidated balance sheets.statements of financial position.
Monterrey, N.L., México.
|  | |||
| ||||
FOMENTO ECONÓMICO MEXICANO, S.A.B. DE C.V. AND SUBSIDIARIES
MONTERREY, N.L., MÉXICO
Consolidated Income Statements
For the years ended December 31, 2010, 20092012 and 2008.2011 Amounts expressed in millions of U.S. dollars ($) and in millions of Mexican pesos (Ps.), except for data per share.share amounts
| 2010 | 2009 | 2008 | ||||||||||||||
Net sales | $ | 13,598 | Ps. | 168,376 | Ps. | 158,503 | Ps. | 132,260 | ||||||||
Other operating revenues | 107 | 1,326 | 1,748 | 1,548 | ||||||||||||
Total revenues | 13,705 | 169,702 | 160,251 | 133,808 | ||||||||||||
Cost of sales | 7,974 | 98,732 | 92,313 | 77,990 | ||||||||||||
Gross profit | 5,731 | 70,970 | 67,938 | 55,818 | ||||||||||||
Operating expenses: | ||||||||||||||||
Administrative | 627 | 7,766 | 7,835 | 6,292 | ||||||||||||
Selling | 3,285 | 40,675 | 38,973 | 32,177 | ||||||||||||
| 3,912 | 48,441 | 46,808 | 38,469 | |||||||||||||
Income from operations | 1,819 | 22,529 | 21,130 | 17,349 | ||||||||||||
Other expenses, net (Note 19) | (23 | ) | (282 | ) | (1,877 | ) | (2,019 | ) | ||||||||
Comprehensive financing result: | ||||||||||||||||
Interest expense | (264 | ) | (3,265 | ) | (4,011 | ) | (3,823 | ) | ||||||||
Interest income | 89 | 1,104 | 1,205 | 865 | ||||||||||||
Foreign exchange loss, net | (50 | ) | (614 | ) | (431 | ) | (1,431 | ) | ||||||||
Gain on monetary position, net | 34 | 410 | 486 | 657 | ||||||||||||
Market value gain (loss) on ineffective portion of derivative financial instruments | 17 | 212 | 124 | (950 | ) | |||||||||||
| (174 | ) | (2,153 | ) | (2,627 | ) | (4,682 | ) | |||||||||
Equity method of associates (Note 10) | 286 | 3,538 | 132 | 90 | ||||||||||||
Income before income taxes | 1,908 | 23,632 | 16,758 | 10,738 | ||||||||||||
Income taxes (Note 24 E) | 457 | 5,671 | 4,959 | 3,108 | ||||||||||||
Consolidated net income before discontinued operations | 1,451 | 17,961 | 11,799 | 7,630 | ||||||||||||
Income from the exchange of shares with Heineken, net of taxes | 2,150 | 26,623 | — | — | ||||||||||||
Net income from discontinued operations (Note 2) | 57 | 706 | 3,283 | 1,648 | ||||||||||||
Consolidated net income | $ | 3,658 | Ps. | 45,290 | Ps. | 15,082 | Ps. | 9,278 | ||||||||
Net controlling interest income | 3,251 | 40,251 | 9,908 | 6,708 | ||||||||||||
Net noncontrolling interest income | 407 | 5,039 | 5,174 | 2,570 | ||||||||||||
Consolidated net income | $ | 3,658 | Ps | . 45,290 | Ps. | 15,082 | Ps. | 9,278 | ||||||||
Consolidated net income before discontinued operations(1): | ||||||||||||||||
Per series “B” share | $ | 0.05 | Ps. | 0.64 | Ps. | 0.33 | Ps. | 0.25 | ||||||||
Per series “D” share | 0.07 | 0.81 | 0.42 | 0.32 | ||||||||||||
Net income from discontinued operations(1): | ||||||||||||||||
Per series “B” share | 0.11 | 1.37 | 0.16 | 0.08 | ||||||||||||
Per series “D”share | 0.14 | 1.70 | 0.20 | 0.10 | ||||||||||||
Net controlling interest income(1): | ||||||||||||||||
Per series “B” share | 0.16 | 2.01 | 0.49 | 0.33 | ||||||||||||
Per series “D”share | 0.20 | 2.51 | 0.62 | 0.42 | ||||||||||||
| Note | 2012(*) | 2012 | 2011 | |||||||||||||
Net sales | $ | 18,276 | Ps. | 236,922 | Ps. | 200,426 | ||||||||||
Other operating revenues | 107 | 1,387 | 1,114 | |||||||||||||
|
|
|
|
|
| |||||||||||
Total revenues | 18,383 | 238,309 | 201,540 | |||||||||||||
Cost of goods sold | 10,569 | 137,009 | 117,244 | |||||||||||||
|
|
|
|
|
| |||||||||||
Gross profit | 7,814 | 101,300 | 84,296 | |||||||||||||
|
|
|
|
|
| |||||||||||
Administrative expenses | 737 | 9,552 | 8,172 | |||||||||||||
Selling expenses | 4,789 | 62,086 | 50,685 | |||||||||||||
Other income | 19 | 135 | 1,745 | 381 | ||||||||||||
Other expenses | 19 | (152 | ) | (1,973 | ) | (2,072 | ) | |||||||||
Interest expense | 18 | (193 | ) | (2,506 | ) | (2,302 | ) | |||||||||
Interest income | 60 | 783 | 1,014 | |||||||||||||
Foreign exchange (loss) gain, net | (14 | ) | (176 | ) | 1,148 | |||||||||||
(Loss) gain on monetary position for subsidiaries in hyperinflationary economies | (1 | ) | (13 | ) | 53 | |||||||||||
Market value gain (loss) on financial instruments | 1 | 8 | (109 | ) | ||||||||||||
|
|
|
|
|
| |||||||||||
Income before income taxes and share of the profit of associates and joint ventures accounted for using the equity method | 2,124 | 27,530 | 23,552 | |||||||||||||
Income taxes | 24 | 613 | 7,949 | 7,618 | ||||||||||||
Share of the profit of associates and joint ventures accounted for using the equity method, net of taxes | 10 | 653 | 8,470 | 4,967 | ||||||||||||
|
|
|
|
|
| |||||||||||
Consolidated net income | $ | 2,164 | Ps. | 28,051 | Ps. | 20,901 | ||||||||||
|
|
|
|
|
| |||||||||||
Attributable to: | ||||||||||||||||
Controlling interest | 1,597 | 20,707 | 15,332 | |||||||||||||
Non-controlling interest | 567 | 7,344 | 5,569 | |||||||||||||
|
|
|
|
|
| |||||||||||
Consolidated net income | $ | 2,164 | Ps. | 28,051 | Ps. | 20,901 | ||||||||||
|
|
|
|
|
| |||||||||||
Basic net controlling interest income: | ||||||||||||||||
Per series “B” share | 23 | $ | 0.08 | Ps. | 1.03 | Ps. | 0.77 | |||||||||
Per series “D” share | 23 | 0.10 | 1.30 | 0.96 | ||||||||||||
Diluted net controlling interest income: | ||||||||||||||||
Per series “B” share | 23 | 0.08 | 1.03 | 0.76 | ||||||||||||
Per series “D” share | 23 | 0.10 | 1.29 | 0.96 | ||||||||||||
|
|
|
|
|
| |||||||||||
The accompanying notes are an integral part of these consolidated income statements.
FOMENTO ECONÓMICO MEXICANO, S.A.B. DE C.V. AND SUBSIDIARIES
MONTERREY, N.L., MÉXICO
Consolidated Statements of Cash FlowsComprehensive Income
For the years ended December 31, 2010, 20092012 and 2008.2011 Amounts expressed in millions of U.S. dollars ($) and in millions of Mexican pesos (Ps.).
| 2010 | 2009 | 2008 | ||||||||||||||
Cash Flow Generated by (Used in) Operating Activities: | ||||||||||||||||
Income before income taxes from continuing operations | $ | 1,908 | Ps. | 23,632 | Ps. 16,758 | Ps. 10,738 | ||||||||||
Non-cash operating expenses | 31 | 386 | 664 | 295 | ||||||||||||
Other adjustments regarding operating activities | 44 | 545 | 773 | 1,199 | ||||||||||||
Adjustments regarding investing activities: | ||||||||||||||||
Depreciation | 366 | 4,527 | 4,391 | 3,762 | ||||||||||||
Amortization | 79 | 975 | 798 | 689 | ||||||||||||
Loss on sale of long-lived assets | 17 | 215 | 177 | 166 | ||||||||||||
Gain on sale of shares | (125 | ) | (1,554 | ) | (35 | ) | (85 | ) | ||||||||
Write-off of long-lived assets | 1 | 9 | 129 | 378 | ||||||||||||
Interest income | (89 | ) | (1,104 | ) | (1,205 | ) | (865 | ) | ||||||||
Equity method of associates | (286 | ) | (3,538 | ) | (132 | ) | (90 | ) | ||||||||
Adjustments regarding financing activities: | ||||||||||||||||
Interest expenses | 264 | 3,265 | 4,011 | 3,823 | ||||||||||||
Foreign exchange loss, net | 50 | 614 | 431 | 1,431 | ||||||||||||
Gain on monetary position, net | (34 | ) | (410 | ) | (486 | ) | (657 | ) | ||||||||
Market value (gain) loss on ineffective portion of derivative financial instruments | (17 | ) | (212 | ) | (124 | ) | 950 | |||||||||
| 2,209 | 27,350 | 26,150 | 21,734 | |||||||||||||
Accounts receivable and other current assets | (116 | ) | (1,431 | ) | (535 | ) | (294 | ) | ||||||||
Inventories | (108 | ) | (1,340 | ) | (844 | ) | (1,567 | ) | ||||||||
Suppliers and other accounts payable | 66 | 823 | 2,373 | 1,469 | ||||||||||||
Other liabilities | (20 | ) | (249 | ) | (267 | ) | (94 | ) | ||||||||
Labor liabilities | (43 | ) | (530 | ) | (302 | ) | (230 | ) | ||||||||
Income taxes paid | (551 | ) | (6,821 | ) | (3,831 | ) | (4,995 | ) | ||||||||
Net cash flows provided by continuing operations | 1,437 | 17,802 | 22,744 | 16,023 | ||||||||||||
Net cash flows provided by discontinued operations | 91 | 1,127 | 8,181 | 6,959 | ||||||||||||
Net cash flows provided by operating activities | 1,528 | 18,929 | 30,925 | 22,982 | ||||||||||||
Cash Flow Generated by (Used in) Investing Activities: | ||||||||||||||||
BRISA acquisition, net of cash acquired (see Note 6) | — | — | (717 | ) | — | |||||||||||
REMIL acquisition, net of cash acquired (see Note 6) | — | (3,633 | ) | |||||||||||||
Other acquisitions, net of cash acquired | — | — | — | (206 | ) | |||||||||||
Purchase of marketable securities | (5 | ) | (66 | ) | (2,001 | ) | — | |||||||||
Proceeds from marketable securities | 89 | 1,108 | — | — | ||||||||||||
Recovery of long-term financing receivables with FEMSA Cerveza (see Note 13) | 986 | 12,209 | — | — | ||||||||||||
Net effects of FEMSA Cerveza exchange | 71 | 876 | — | — | ||||||||||||
Other disposals | 157 | 1,949 | — | — | ||||||||||||
Interest received | 89 | 1,104 | 1,205 | 865 | ||||||||||||
Dividends received | 105 | 1,304 | — | — | ||||||||||||
Long-lived assets acquisition | (677 | ) | (8,386 | ) | (6,636 | ) | (7,153 | ) | ||||||||
Long-lived assets sale | 50 | 624 | 679 | 511 | ||||||||||||
Other assets | (212 | ) | (2,630 | ) | (1,747 | ) | (597 | ) | ||||||||
Bottles and cases | (82 | ) | (1,022 | ) | (812 | ) | (700 | ) | ||||||||
Intangible assets | (72 | ) | (892 | ) | (1,347 | ) | (354 | ) | ||||||||
Net cash flows used in investment activities by continuing operations | 499 | 6,178 | (11,376 | ) | (11,267 | ) | ||||||||||
Net cash flows used in investment activities by discontinued operations | — | (4 | ) | (3,389 | ) | (6,007 | ) | |||||||||
Net cash flows used in investing activities | 499 | 6,174 | (14,765 | ) | (17,274 | ) | ||||||||||
Net cash flows available for financing activities | 2,027 | 25,103 | 16,160 | 5,708 | ||||||||||||
| Note | 2012(*) | 2012 | 2011 | |||||||||||||
Consolidated net income | $ | 2,164 | Ps. 28,051 | Ps. 20,901 | ||||||||||||
Other comprehensive income: | ||||||||||||||||
Items that may be reclassified to consolidated net income, net of tax: | ||||||||||||||||
Unrealized gain on available for sale securities | 6 | — | (2 | ) | 4 | |||||||||||
Valuation of the effective portion of derivative financial instruments | (19 | ) | (243 | ) | 118 | |||||||||||
Exchange differences on translating foreign operations | (405 | ) | (5,250 | ) | 9,008 | |||||||||||
Share of other comprehensive income of associates and joint ventures | 10 | (60 | ) | (781 | ) | (1,395 | ) | |||||||||
|
|
|
|
|
| |||||||||||
Total items that may be reclassified | (484 | ) | (6,276 | ) | 7,735 | |||||||||||
|
|
|
|
|
| |||||||||||
Items that will not to be reclassified to consolidated net income, net of tax: | ||||||||||||||||
Remeasurements of the net defined benefit liability | 16 | (22 | ) | (279 | ) | (59 | ) | |||||||||
|
|
|
|
|
| |||||||||||
Total items that will not be reclassified | (22 | ) | (279 | ) | (59 | ) | ||||||||||
|
|
|
|
|
| |||||||||||
Total other comprehensive income, net of tax | (506 | ) | (6,555 | ) | 7,676 | |||||||||||
|
|
|
|
|
| |||||||||||
Consolidated comprehensive income, net of tax | 1,658 | 21,496 | 28,577 | |||||||||||||
|
|
|
|
|
| |||||||||||
Controlling interest comprehensive income | 1,206 | 15,638 | 20,986 | |||||||||||||
Reattribution to non-controlling interest of other comprehensive income by acquisition of FOQUE | 2 | 29 | — | |||||||||||||
Reattribution to non-controlling interest of other comprehensive income by acquisition of Grupo Tampico | — | — | 37 | |||||||||||||
Reattribution to non-controlling interest of other comprehensive income by acquisition of Grupo CIMSA | — | — | 50 | |||||||||||||
|
|
|
|
|
| |||||||||||
Controlling interest, net of reattribution | 1,208 | 15,667 | 21,073 | |||||||||||||
|
|
|
|
|
| |||||||||||
Non-controlling interest comprehensive income | 452 | 5,858 | 7,591 | |||||||||||||
Reattribution from controlling interest of other comprehensive income by acquisition of FOQUE | (2 | ) | (29 | ) | — | |||||||||||
Reattribution from controlling interest of other comprehensive income by acquisition of Grupo Tampico | — | — | (37 | ) | ||||||||||||
Reattribution from controlling interest of other comprehensive income by acquisition of Grupo CIMSA | — | — | (50 | ) | ||||||||||||
|
|
|
|
|
| |||||||||||
Non-controlling interest, net of reattribution | 450 | 5,829 | 7,504 | |||||||||||||
|
|
|
|
|
| |||||||||||
Consolidated comprehensive income | $ | 1,658 | Ps. 21,496 | Ps. 28,577 | ||||||||||||
|
|
|
|
|
| |||||||||||
| (*) | Convenience translation to U. S. dollars ($) – see Note 2.2.3 |
The accompanying notes are an integral part of thisthese consolidated statementstatements of cash flows.
Cash Flow Generated by (Used in) Financing Activities: Bank loans obtained Bank loans paid Interest paid Dividends paid Acquisition of noncontrolling interest Other liabilities payments Net cash flows used in financing activities by continuing operations Net cash flows used in financing activities by discontinued operations Net cash flows used in financing activities Net cash flow by continuing operations Net cash flow by discontinued operations Net cash flow Translation and restatement effect on cash and cash equivalents Initial cash Initial cash of discontinued operations Initial cash and cash equivalents Ending balance Ending balance by discontinued operations Total ending balance of cash and cash equivalents, net 2010 2009 2008 728 9,016 14,107 7,505 (1,012 ) (12,536 ) (15,533 ) (7,098 ) (244 ) (3,018 ) (4,259 ) (3,733 ) (308 ) (3,813 ) (2,246 ) (2,058 ) (18 ) (219 ) 67 (175 ) 6 74 (25 ) 16 (848 ) (10,496 ) (7,889 ) (5,543 ) (82 ) (1,012 ) (909 ) (1,416 ) (930 ) (11,508 ) (8,798 ) (6,959 ) 1,088 13,484 3,479 (787 ) 9 111 3,883 (464 ) 1,097 13,595 7,362 (1,251 ) (81 ) (1,006 ) (1,173 ) 192 1,278 15,824 9,635 10,694 (106 ) (1,316 ) — — 1,172 14,508 9,635 10,694 2,188 27,097 15,824 9,635 — — (1,316 ) (1,070 ) $ 2,188 Ps. 27,097 Ps. 14,508 Ps. 8,565
The accompanying notes are an integral part of this consolidated statement of cash flows.comprehensive income.
FOMENTO ECONÓMICO MEXICANO, S.A.B. DE C.V. AND SUBSIDIARIES
MONTERREY, N.L., MÉXICO
Consolidated Statements of Changes in Stockholders’ Equity
For the years ended December 31, 2010, 20092012 and 2008.2011 Amounts expressed in millions of Mexican pesos (Ps.).
| Capital Stock | Additional Paid-in Capital | Retained Earnings from Prior Years | Net Income | Cumulative Other Comprehensive Income (Loss) | Controlling Interest | Non-Controlling Interest in Consolidated Subsidiaries | Total Stockholders’ Equity | |||||||||||||||||||||||||
Balances at December 31, 2007(1) | Ps. | 5,348 | Ps. | 20,612 | Ps. | 38,108 | Ps. | 8,511 | Ps. | (8,001) | Ps. | 64,578 | Ps. | 25,075 | Ps. | 89,653 | ||||||||||||||||
Transfer of prior year net income | 8,511 | (8,511 | ) | — | — | — | ||||||||||||||||||||||||||
Change in accounting principles (see Note 3 I and K) | (6,070 | ) | 6,424 | 354 | — | 354 | ||||||||||||||||||||||||||
Dividends declared and paid (see Note 22) | (1,620 | ) | (1,620 | ) | (445 | ) | (2,065 | ) | ||||||||||||||||||||||||
Acquisitions by Coca-Cola FEMSA of noncontrolling interest (see Note 6) | (61 | ) | (61 | ) | (162 | ) | (223 | ) | ||||||||||||||||||||||||
Other transactions of noncontrolling interest | 91 | 91 | ||||||||||||||||||||||||||||||
Comprehensive income | 6,708 | (1,138 | ) | 5,570 | 3,515 | 9,085 | ||||||||||||||||||||||||||
Balances at December 31, 2008 | 5,348 | 20,551 | 38,929 | 6,708 | (2,715 | ) | 68,821 | 28,074 | 96,895 | |||||||||||||||||||||||
Transfer of prior year net income | 6,708 | (6,708 | ) | — | — | — | ||||||||||||||||||||||||||
Change in accounting principle (see Note 3 E) | (182 | ) | (182 | ) | — | (182 | ) | |||||||||||||||||||||||||
Dividends declared and paid (see Note 22) | (1,620 | ) | (1,620 | ) | (635 | ) | (2,255 | ) | ||||||||||||||||||||||||
Acquisition by FEMSA Cerveza of noncontrolling interest | (3 | ) | (3 | ) | 19 | 16 | ||||||||||||||||||||||||||
Comprehensive income | 9,908 | 4,713 | 14,621 | 6,734 | 21,355 | |||||||||||||||||||||||||||
Balances at December 31, 2009 | 5,348 | 20,548 | 43,835 | 9,908 | 1,998 | 81,637 | 34,192 | 115,829 | ||||||||||||||||||||||||
Transfer of prior year net income | 9,908 | (9,908 | ) | — | — | — | ||||||||||||||||||||||||||
Dividends declared and paid (see Note 22) | (2,600 | ) | (2,600 | ) | (1,213 | ) | (3,813 | ) | ||||||||||||||||||||||||
Other transactions of noncontrolling interest | 10 | 10 | (283 | ) | (273 | ) | ||||||||||||||||||||||||||
Recycling of OCI and decreasing of noncontrolling interest due to exchange of FEMSA Cerveza (see Note 2) | 525 | (525 | ) | — | (1,221 | ) | (1,221 | ) | ||||||||||||||||||||||||
Other movements of equity method of associates, net of taxes | (98 | ) | (98 | ) | — | (98 | ) | |||||||||||||||||||||||||
Comprehensive income | 39,726 | (1,327 | ) | 38,399 | 4,190 | 42,589 | ||||||||||||||||||||||||||
Balances at December 31, 2010 | Ps. | 5,348 | Ps. | 20,558 | Ps. | 51,045 | Ps. | 40,251 | Ps. | 146 | Ps. | 117,348 | Ps. | 35,665 | Ps. | 153,013 | ||||||||||||||||
| Capital Stock | Additional Paid-in Capital | Retained Earnings | Unrealized Gain on Available for Sale Securities | Valuation of the Effective Portion of Derivative Financial Instrument | Exchange Differences on Translation of Foreign Operations | Remeasurements of the Net Defined Benefit Liability | Total Controlling Interest | Non-Controlling Interest | Total Equity | |||||||||||||||||||||||||||||||
Balances at January 1, 2011 | Ps. | 3,345 | Ps. | 14,757 | Ps. | 103,695 | Ps. | — | Ps. | 139 | Ps. | — | Ps. | (59 | ) | Ps. | 121,877 | Ps. | 31,521 | Ps. | 153,398 | |||||||||||||||||||
|
|
|
|
|
|
|
|
|
|
|
|
|
|
|
|
|
|
|
| |||||||||||||||||||||
Net income | 15,332 | 15,332 | 5,569 | 20,901 | ||||||||||||||||||||||||||||||||||||
Other comprehensive income, net of tax | 4 | 228 | 5,810 | (301 | ) | 5,741 | 1,935 | 7,676 | ||||||||||||||||||||||||||||||||
|
|
|
|
|
|
|
|
|
|
|
|
|
|
|
|
|
|
|
| |||||||||||||||||||||
Comprehensive income | 15,332 | 4 | 228 | 5,810 | (301 | ) | 21,073 | 7,504 | 28,577 | |||||||||||||||||||||||||||||||
Dividends declared | (4,600 | ) | (4,600 | ) | (2,025 | ) | (6,625 | ) | ||||||||||||||||||||||||||||||||
Issuance (repurchase) or shares associated with share-based payment plans | 50 | 50 | (19 | ) | 31 | |||||||||||||||||||||||||||||||||||
Acquisition of Grupo Tampico through issuance of Coca-Cola FEMSA shares (see Note 4) | 2,854 | (1 | ) | (39 | ) | 3 | 2,817 | 5,011 | 7,828 | |||||||||||||||||||||||||||||||
Acquisition of Grupo CIMSA through issuance of Coca-Cola FEMSA shares (see Note 4) | 3,040 | (1 | ) | (54 | ) | 5 | 2,990 | 6,027 | 9,017 | |||||||||||||||||||||||||||||||
Other transactions of non-controlling interest | (45 | ) | (45 | ) | (70 | ) | (115 | ) | ||||||||||||||||||||||||||||||||
Other movements of equity method of associates, net of taxes | 60 | 60 | — | 60 | ||||||||||||||||||||||||||||||||||||
|
|
|
|
|
|
|
|
|
|
|
|
|
|
|
|
|
|
|
| |||||||||||||||||||||
Balances at December 31, 2011 | 3,345 | 20,656 | 114,487 | 4 | 365 | 5,717 | (352 | ) | 144,222 | 47,949 | 192,171 | |||||||||||||||||||||||||||||
|
|
|
|
|
|
|
|
|
|
|
|
|
|
|
|
|
|
|
| |||||||||||||||||||||
Net income | 20,707 | 20,707 | 7,344 | 28,051 | ||||||||||||||||||||||||||||||||||||
Other comprehensive income, net of tax | (2 | ) | (17 | ) | (3,725 | ) | (1,296 | ) | (5,040 | ) | (1,515 | ) | (6,555 | ) | ||||||||||||||||||||||||||
|
|
|
|
|
|
|
|
|
|
|
|
|
|
|
|
|
|
|
| |||||||||||||||||||||
Comprehensive income | 20,707 | (2 | ) | (17 | ) | (3,725 | ) | (1,296 | ) | 15,667 | 5,829 | 21,496 | ||||||||||||||||||||||||||||
Dividends declared | (6,200 | ) | (6,200 | ) | (2,986 | ) | (9,186 | ) | ||||||||||||||||||||||||||||||||
Issuance (repurchase) of shares associated with share-based payment plans | 1 | (50 | ) | (49 | ) | (12 | ) | (61 | ) | |||||||||||||||||||||||||||||||
Acquisition of Grupo Fomento Queretano (see Note 4) | 2,134 | 1 | (31 | ) | 1 | 2,105 | 4,172 | 6,277 | ||||||||||||||||||||||||||||||||
Other transactions of non-controlling interest | (50 | ) | (50 | ) | ||||||||||||||||||||||||||||||||||||
Other movements of equity method of associates, net of taxes | (486 | ) | (486 | ) | — | (486 | ) | |||||||||||||||||||||||||||||||||
|
|
|
|
|
|
|
|
|
|
|
|
|
|
|
|
|
|
|
| |||||||||||||||||||||
Balances at December 31, 2012 | Ps. | 3,346 | Ps. | 22,740 | Ps. | 128,508 | Ps. | 2 | Ps. | 349 | Ps. | 1,961 | Ps. | (1,647) | Ps. | 155,259 | Ps | 54,902 | Ps. | 210,161 | ||||||||||||||||||||
|
|
|
|
|
|
|
|
|
|
|
|
|
|
|
|
|
|
|
| |||||||||||||||||||||
The accompanying notes are an integral part of these consolidated statements of changes in stockholders’ equity.
FOMENTO ECONÓMICO MEXICANO, S.A.B. DE C.V. AND SUBSIDIARIES
MONTERREY, N.L., MÉXICO
Notes to the Consolidated Financial Statements of Cash Flows
For the years ended December 31, 2010, 20092012 and 2008. 2011
Amounts expressed in millions of U.S. dollars ($) and in millions of Mexican pesos (Ps.).
| 2012(*) | 2012 | 2011 | ||||||||||
Cash flows from operating activities: | ||||||||||||
Income before income taxes and share of the profit of associates and joint ventures accounted for using the equity method | $ | 2,124 | Ps. | 27,530 | Ps. | 23,552 | ||||||
Adjustments for: | ||||||||||||
Non-cash operating expenses | 258 | 3,333 | 1,711 | |||||||||
Depreciation | 553 | 7,175 | 5,694 | |||||||||
Amortization | 55 | 715 | 469 | |||||||||
Gain on sale of long-lived assets | (10 | ) | (132 | ) | (95 | ) | ||||||
Gain on sale of shares | (166 | ) | (2,148 | ) | — | |||||||
Disposal of long-lived assets | 10 | 133 | 656 | |||||||||
Impairment of long-lived assets | 30 | 384 | 146 | |||||||||
Interest income | (60 | ) | (783 | ) | (1,014 | ) | ||||||
Interest expenses | 193 | 2,506 | 2,302 | |||||||||
Foreign exchange loss (gain), net | 14 | 176 | (1,148 | ) | ||||||||
Monetary position loss (gain), net | 1 | 13 | (53 | ) | ||||||||
Market value (gain) loss on financial instruments | (1 | ) | (8 | ) | 109 | |||||||
|
|
|
|
|
| |||||||
Cash flow from operating activities before changes in working capital and provisions | 3,001 | 38,894 | 32,329 | |||||||||
Accounts receivable and other current assets | (57 | ) | (746 | ) | (2,990 | ) | ||||||
Other current financial assets | (75 | ) | (977 | ) | (94 | ) | ||||||
Inventories | (177 | ) | (2,289 | ) | (2,277 | ) | ||||||
Derivative financial instruments | (1 | ) | (17 | ) | (43 | ) | ||||||
Suppliers and other accounts payable | 296 | 3,833 | 1,364 | |||||||||
Other long-term liabilities | (1 | ) | (18 | ) | (391 | ) | ||||||
Other current financial liabilities | 25 | 329 | 116 | |||||||||
Post-employment and other long-term employee benefits | (16 | ) | (209 | ) | (348 | ) | ||||||
|
|
|
|
|
| |||||||
Cash generated from operations | 2,995 | 38,800 | 27,666 | |||||||||
Income taxes paid | (618 | ) | (8,015 | ) | (6,419 | ) | ||||||
|
|
|
|
|
| |||||||
Net cash generated by operating activities | 2,377 | 30,785 | 21,247 | |||||||||
|
|
|
|
|
| |||||||
Cash flows from investing activities: | ||||||||||||
Acquisition of Grupo Tampico, net of cash acquired (see Note 4) | — | — | (2,414 | ) | ||||||||
Acquisition of Grupo CIMSA, net of cash acquired (see Note 4) | — | — | (1,912 | ) | ||||||||
Acquisition of Grupo Fomento Queretano, net of cash acquired (see Note 4) | (86 | ) | (1,114 | ) | — | |||||||
Disposals of subsidiaries and associates, net of cash | 81 | 1,055 | — | |||||||||
Purchase of investments | (217 | ) | (2,808 | ) | (1,351 | ) | ||||||
Proceeds from investments | 195 | 2,534 | 68 | |||||||||
Interest received | 60 | 777 | 1,029 | |||||||||
Derivative financial instruments | 7 | 94 | 6 | |||||||||
Dividends received from associates and joint ventures | 131 | 1,697 | 1,661 | |||||||||
Long-lived assets acquisitions | (1,145 | ) | (14,844 | ) | (12,046 | ) | ||||||
Proceeds from the sale of long-lived assets | 28 | 362 | 535 | |||||||||
Acquisition of intangible assets | (34 | ) | (441 | ) | (639 | ) | ||||||
Other assets | (191 | ) | (2,471 | ) | (2,102 | ) | ||||||
Other financial assets | 40 | 516 | (924 | ) | ||||||||
|
|
|
|
|
| |||||||
Net cash used in investing activities | $ | (1,131 | ) | Ps. | (14,643 | ) | Ps. | (18,089 | ) | |||
|
|
|
|
|
| |||||||
Cash flows from financing activities: | ||||||||||||
Proceeds from borrowings | $ | 1,084 | Ps. | 14,048 | Ps. | 6,606 | ||||||
Payments of bank loans | (453 | ) | (5,872 | ) | (3,732 | ) | ||||||
Interest paid | (168 | ) | (2,172 | ) | (2,020 | ) | ||||||
Derivative financial instruments | (16 | ) | (209 | ) | (359 | ) | ||||||
Dividends paid | (709 | ) | (9,186 | ) | (6,625 | ) | ||||||
Acquisition of non-controlling interests | — | (6 | ) | (115 | ) | |||||||
Other financing activities | (2 | ) | (21 | ) | (13 | ) | ||||||
|
|
|
|
|
| |||||||
Net cash used in financing activities | (264 | ) | (3,418 | ) | (6,258 | ) | ||||||
|
|
|
|
|
| |||||||
Increase (decrease) in cash and cash equivalents | 982 | 12,724 | (3,100 | ) | ||||||||
|
|
|
|
|
| |||||||
Initial balance of cash and cash equivalents | 1,993 | 25,841 | 26,705 | |||||||||
|
|
|
|
|
| |||||||
Effects of exchange rate changes and inflation effects on cash and cash equivalents held in foreign currencies | (158 | ) | (2,044 | ) | 2,236 | |||||||
|
|
|
|
|
| |||||||
Ending balance of cash and cash equivalents | $ | 2,817 | Ps. | 36,521 | Ps. | 25,841 | ||||||
|
|
|
|
|
| |||||||
| (*) | Convenience translation to U.S. dollars ($) – see Note 2.2.3 |
The accompanying notes are an integral part of these consolidated statements of cash flow.
FOMENTO ECONÓMICO MEXICANO, S.A.B. DE C.V. AND SUBSIDIARIES
Note 1.MONTERREY, N.L., MÉXICO
Notes to the Consolidated Financial Statements
As of December 31, 2012, 2011 and as of January 1, 2011 (Date of transition to IFRS)
Amounts expressed in millions of U.S. dollars ($) and in millions of Mexican pesos (Ps.)
1 Activities of the Company.Company
Fomento Económico Mexicano, S.A.B. de C.V. (“FEMSA”) is a Mexican holding company. The principal activities of FEMSA and its subsidiaries (the “Company”), as an economic unit, are carried out by operating subsidiaries and groupedcompanies under direct and indirect holding company subsidiaries (the “Subholding Companies”) of FEMSA.
On February 1, 2010, The Company and The Coca-Cola Company signed a second amendment to the shareholders agreement that confirms contractually the capability of the Company to govern the operating and financial policies of Coca-Cola FEMSA, to exercise control over the operations in the ordinary course of business and grants protective rights to The Coca-Cola Company on such items as mergers, acquisitions or sales of any line business. These amendments were signed without transfer of any consideration. The percentage of voting interest of the Company in Coca-Cola FEMSA remains the same after the signing of this amendment.
On April 30, 2010, FEMSA exchanged 100% of its stake in FEMSA Cerveza, the beer business unit, for a 20% economic interest in Heineken Group (“Heineken”). This strategic transaction is broadly described in Note 2, as well as the related impacts.
The following is a description of the activities of the Company as of the date of the issuance of these consolidated financial statements, together with the ownership interest in each Subholding Company:
|
| |||
| ||||
Subholding Company | December 31, 2012 | % Ownership December 31, 2011 | January 1, 2011 | Activities | ||||
| Coca-Cola FEMSA, S.A.B. de C.V. and subsidiaries (“Coca-Cola FEMSA”) | 48.9% (1)(2) (63.0% of the voting shares) | 50.0% (1)(3) (63.0% of the voting shares) | 53.7% (1) (63.0% of the voting shares) | Production, distribution and marketing of certain Coca-Cola trademark beverages in Mexico, Guatemala, Nicaragua, Costa Rica, Panama, Colombia, Venezuela, Brazil and Argentina.. At December 31, 2012, The Coca-Cola Company indirectly owns 28.7% of Coca-Cola FEMSA’s capital stock. In addition, shares representing 22.4% of Coca-Cola FEMSA’s capital stock are traded on the Bolsa Mexicana de Valores (Mexican Stock Exchange “BMV”). Its American Depositary Shares (“ADS”) trade on the New York Stock Exchange, Inc (NYSE). | ||||
| FEMSA Comercio, S.A. de C.V. and subsidiaries (“FEMSA Comercio”) | 100% | 100% | 100% | Operation of a chain of convenience stores in Mexico and Colombia under the trade name “OXXO.” | ||||
| CB Equity, LLP (“CB Equity”) | 100% | 100% | 100% | This Company holds Heineken N.V.. and Heineken Holding N.V. shares, which represents in the aggregated a 20% economic interest in both entities (“Heineken Company”). | ||||
| Other companies | 100% | 100% | 100% | Companies engaged in the production and distribution of coolers, commercial refrigeration equipment and plastic cases; as well as transportation logistics and maintenance services to FEMSA’s subsidiaries and to third parties. | ||||
| (1) | The Company controls the operating and financial policies. |
| (2) | The ownership decreased from 50.0% as of December 31, 2011 to 48.9% as of December 31, 2012 as a result of merger transactions (see Note 4). |
| (3) | The ownership decreased from 53.7% as of January 1, 2011 to 50.0% as of December 31, 2011 as a result of merger transactions (see Note 4). |
Note 2. Exchange2 Basis of FEMSA Cerveza Business.Preparation
On April 30, 2010 FEMSA exchanged 100%2.1 Statement of FEMSA Cerveza,compliance
The consolidated financial statements have been prepared in accordance with International Financial Reporting Standards (“IFRS”) as issued by the beer business unit, for 20% economic interest in Heineken. Under the termsInternational Accounting Standards Board (“IASB”). The consolidated financial statements of the agreement, FEMSA exchanged its beer business and received 43,018,320 shares of Heineken Holding N.V., and 72,182,203 shares of Heineken N.V., of which 29,172,504 will be delivered pursuant to an allotted share delivery instrument (“ASDI”). Those shares are considered in substance common stock due to its similarity to common stock, such as rights to receiveCompany for the same dividends as any other share. As ofyear ended December 31, 2010, 10,240,5532012 are the first annual financial statements that comply with IFRS and where IFRS 1,First Time Adoption of Heineken shares haveInternational Financial Reporting Standards, has been deliveredapplied.
The Company’s transition date to IFRS is January 1, 2011 and management prepared the Company. It is expectedopening balance sheet under IFRS as of that date. Until the remaining allotted shares will be acquired by Heinekenyear ended December 31, 2011, the Company prepared its consolidated financial information under Mexican Financial Reporting Standards (“Mexican FRS”). The differences in the secondary marketrequirements for delivery to FEMSA over a term not to exceed five years.
The total transaction was valued approximately at $7,347, net of assumed debt of $2,100, based on shares closing prices of € 35.18recognition, measurement and presentation between IFRS and Mexican FRS were reconciled for Heineken N.V., and € 30.82 for Heineken Holding N.V. on April 30, 2010. The Company recorded a net gain after taxes that amounted to Ps. 26,623 which is the difference between the fair valuepurposes of the consideration received and the book value of FEMSA Cerveza as of April 30, 2010; a deferred income tax of Ps. 10,379 (see “Income from the exchange of shares with Heineken, net of taxes” in the consolidated income statements and Note 24 D), and recycling Ps. 525 (see consolidated statements of changes in stockholders’ equity) from other comprehensive income which are integrated of Ps.1,418 accounted as a gain of cumulative translation adjustment and Ps. 893 as a mark to market loss on derivatives in cumulative comprehensive loss. Additionally, the Company maintained a loss contingency of Ps. 560, regarding the indemnification accorded with Heineken over FEMSA Cerveza prior tax contingencies (see Note 25 B).
As ofCompany’s equity at the date of the exchange, the Company lost control over FEMSA Cervezatransition and stopped consolidating its financial informationat December 31, 2011, and accountedfor purposes of consolidated comprehensive income for the 20% economic interestyear ended December 31, 2011. Reconciliations and explanations of Heineken acquired byhow the purchase method as established in NIF C-7 Investments in associates and other permanent investments. Subsequently, this investment in sharestransition to IFRS has been accounted for by the equity method, because of the Company’s significant influence.
After purchase price adjustments, the Company identified intangible assets of indefinite and finite life brands and goodwill that amounted to EUR 14,074 million and EUR 1,200 million respectively and increased certain operating assets and liabilities to fair value, which are presented as part of the investment in shares of Heineken withinaffected the consolidated financial statement.
The fair valuesposition, results of operations and cash flows of the proportional assets acquired and liabilities assumed as part of this transactionCompany are as follows:provided in Note 27.
(in millions of EUR) | Heineken Figures at Fair Value | Fair Value of Proportional Net Assets Acquired by FEMSA (20%) | ||||||
ASSETS | ||||||||
Property, plant & equipment | 8,506 | 1,701 | ||||||
Intangible assets | 15,274 | 3,055 | ||||||
Other assets | 4,025 | 805 | ||||||
Total non-current assets | 27,805 | 5,561 | ||||||
Inventories | 1,579 | 316 | ||||||
Trade and other receivable | 3,240 | 648 | ||||||
Other assets | 1,000 | 200 | ||||||
Total current assets | 5,819 | 1,164 | ||||||
Total assets | 33,624 | 6,725 | ||||||
LIABILITIES | ||||||||
Loans and borrowings | 9,551 | 1,910 | ||||||
Employee benefits | 1,335 | 267 | ||||||
Deferred tax liabilities | 2,437 | 487 | ||||||
Other non-current liabilities | 736 | 147 | ||||||
Total non-current liabilities | 14,059 | 2,811 | ||||||
Trade and other payables | 5,019 | 1,004 | ||||||
Other current liabilities | 1,221 | 244 | ||||||
Total current liabilities | 6,240 | 1,248 | ||||||
Total liabilities | 20,299 | 4,059 | ||||||
Net assets acquired | 13,325 | 2,666 | ||||||
Summarized consolidated balance sheets and income statements of FEMSA Cerveza are presented as follows as of:
Consolidated Balance Sheets | April 30, 2010 | December 31, 2009 | ||||||
Current assets | Ps.13,770 | Ps.13,450 | ||||||
Property, plant and equipment | 26,356 | 26,669 | ||||||
Intangible assets and goodwill | 18,828 | 19,190 | ||||||
Other assets | 11,457 | 12,959 | ||||||
Total assets | 70,411 | 72,268 | ||||||
Current liabilities | 14,039 | 10,883 | ||||||
Long term liabilities | 27,586 | 32,216 | ||||||
Total liabilities | 41,625 | 43,099 | ||||||
Total stockholders’ equity: | ||||||||
Controlling interest | 27,417 | 27,950 | ||||||
Noncontrolling interest in consolidated subsidiaries | 1,369 | 1,219 | ||||||
Total stockholders’ equity | 28,786 | 29,169 | ||||||
Total liabilities and stockholders’ equity | Ps.70,411 | Ps.72,268 | ||||||
Consolidated Income Statements | April 30, 2010 | December 31, 2009 | December 31, 2008 | |||||||||
Total revenues | Ps. | 14,490 | Ps. | 46,329 | Ps. | 42,276 | ||||||
Income from operations | 1,342 | 5,887 | 5,286 | |||||||||
Income before income tax | 749 | 2,231 | 2,748 | |||||||||
Income tax | 43 | (1,052 | ) | 1,100 | ||||||||
Consolidated net income | 706 | 3,283 | 1,648 | |||||||||
Less: Net income attributable to the noncontrolling interest | 48 | 787 | (243 | ) | ||||||||
Net income attributable to the controlling interest | Ps. | 658 | Ps. | 2,496 | Ps. | 1,891 | ||||||
As a result of the transaction described above FEMSA Cerveza operations for the period ended on April 30, 2010, December 31, 2009 and 2008 are presented within the consolidated income statement, net of taxes in a single line as discontinued operations. Prior yearsThe accompanying consolidated financial statements and its notes were approved for issuance in accordance with the accompanying notes have been reformulated in order to present FEMSA Cerveza as discontinued operations for comparable purposes.
Consolidated statementresolution of balance sheet and cash flowsthe board of December 31, 2009 and 2008 presents FEMSA Cerveza as discontinued operations. Intercompany transactions between the Company and FEMSA Cerveza are reclassified in order to conform todirectors on February 27, 2013. These consolidated financial statements as of December 31, 2010.
Note 3. Basis of Presentation.
and their accompanying notes were then approved at the Company’s shareholders meeting in March 15, 2013. The accompanying consolidated financial statements were preparedapproved for issuance in accordance with Normas de Información Financiera (Mexican Financial Reporting Standards or “Mexican FRS”), individually referred to as “NIFs,” and are stated in millions of Mexican pesos (“Ps.”). The translation of Mexican pesos into U.S. dollars (“$”) is included solely for the convenience of the reader, using the noon buying exchange rate publishedCompany’s annual report on Form 20-F by the Federal Reserve BankCompany’s Chief Executive Officer and Chief Financial Officer on April 8, 2013, and subsequent events have been considered through that date (See Note 29).
2.2 Basis of New York of 12.3825 pesos per U.S. dollar as of December 30, 2010.measurement and presentation
The consolidated financial statements includehave been prepared on the historical cost basis except for the following:
Available-for-sale investments.
Derivative financial instruments.
Long-term notes payable on which fair value hedge accounting is applied.
Trust assets of post-employment and other long-term employee benefit plans.
The financial statements of FEMSA and those companiessubsidiaries whose functional currency is the currency of a hyperinflationary economy are stated in which it exercises control. All intercompany account balances and transactions have been eliminated in consolidation.terms of the measuring unit current at the end of the reporting period.
2.2.1 Presentation of consolidated income statement
The Company classifies its costs and expenses by function in the consolidated income statement,statements, in order to conform to the industry’sindustry practices where the Company operates.
2.2.2 Presentation of consolidated statements of cash flows
The income from operations lineCompany´s consolidated statements of cash flows is presented using the indirect method.
2.2.3 Convenience translation to U.S. dollars ($)
The consolidated financial statements are stated in millions of Mexican pesos (“Ps.”) and rounded to the income statement isnearest million unless stated otherwise. However, solely for the result of subtracting cost of sales and operating expenses from total revenues and it has been included for a better understandingconvenience of the Company’sreaders, the consolidated statement of financial and economic performance.
Figures presentedposition as of December 31, 2007,2012, the consolidated income statement, the consolidated statement of comprehensive income and consolidated statement of cash flows for the year ended December 31, 2012 were converted into U.S. dollars at the exchange rate of 12.9635 pesos per U.S. dollar as established by the U.S. Federal Reserve Board in its H.10 Weekly Release of Foreign Exchange Rates as of that date. This arithmetic conversion should not be construed as a representation that the amounts expressed in Mexican pesos may be converted into U.S. dollars at that or any other exchange rate.
2.3 Critical accounting judgments and estimates
In the application of the Company’s accounting policies, which are described in Note 3, management is required to make judgments, estimates and assumptions about the carrying amounts of assets and liabilities that are not readily apparent from other sources. The estimates and associated assumptions are based on historical experience and other factors that are considered to be relevant. Actual results may differ from these estimates.
The estimates and underlying assumptions are reviewed on an ongoing basis. Revisions to accounting estimates are recognized in the period in which the estimate is revised if the revision affects only that period or in the period of the revision and future periods if the revision affects both current and future periods.
2.3.1 Key sources of estimation uncertainty
The following are the key assumptions concerning the future and other key sources of estimation uncertainty at the end of the reporting period that have a significant risk of causing a material adjustment to the carrying amounts of assets and liabilities within the next financial year. Existing circumstances and assumptions about future developments, however, may change due to market changes or circumstances arising beyond the control of the Company. Such changes are reflected in the assumptions when they occur.
2.3.1.1 Impairment of indefinite lived intangible assets, goodwill and depreciable long-lived assets
Intangible assets with indefinite lives including goodwill are subject to annual impairment tests. An impairment exists when the carrying value of an asset or cash generating unit (CGU) exceeds its recoverable amount, which is the higher of its fair value less costs to sell or its value in use. The fair value less costs to sell calculation is based on available data from binding sales transactions in arm’s length transactions of similar assets or observable market prices less incremental costs for disposing of the asset. In order to determine whether such assets are impaired, the Company initially calculates an estimation of the value in use of the cash-generating units to which such assets have been restatedallocated. The value in use calculation requires management to estimate the future cash flows expected to arise from the cash-generating unit and translateda suitable discount rate in order to calculate present value. The Company reviews annually the carrying value of our intangible assets with indefinite lives and goodwill for impairment based on recognized valuation techniques. While the Company believes that its estimates are reasonable, different assumptions regarding such estimates could materially affect its evaluations. Impairment losses are recognized in current earnings in the period the related impairment is determined.
The Company assesses at each reporting date whether there is an indication that a depreciable long lived asset may be impaired. If any indication exists, or when annual impairment testing for an asset is required, the Company estimates the asset’s recoverable amount. When the carrying amount of an asset or CGU exceeds its recoverable amount, the asset is considered impaired and is written down to its recoverable amount. In assessing value in use, the estimated future cash flows are discounted to their present value using a pre-tax discount rate that reflects current market assessments of the time value of money and the risks specific to the asset. In determining fair value less costs to sell, recent market transactions are taken into account, if available. If no such transactions can be identified, an appropriate valuation model is used. These calculations are corroborated by valuation multiples, quoted share prices for publicly traded subsidiaries or other available fair value indicators. The key assumptions used to determine the recoverable amount for the Company’s CGUs, including a sensitivity analysis, are further explained in Notes 3.15 and 12.
2.3.1.2 Useful lives of property, plant and equipment and intangible assets with defined useful lives
Property, plant and equipment, including returnable bottles as they are expected to provide benefits over a period of more than one year, as well as intangible assets with defined useful lives are depreciated/amortized over their estimated useful lives. The Company bases it estimates on the experience of its technical personnel as well as based on its experience in the industry for similar assets, see Notes 3.11, 3.13, 11 and 12.
2.3.1.3 Post-employment and other long-term employee benefits
The Company annually evaluates the reasonableness of the assumptions used in its post-employment and other long-term employee benefit computations. Information about such assumptions is described in Note 16.1.
2.3.1.4 Income taxes
Deferred tax assets and liabilities are determined based on the differences between the financial statement carrying amounts and the tax basis of assets and liabilities. For its particular Mexican subsidiaries, the Company recognizes deferred income taxes, based on its financial projections depending on whether it expects to incur the regular income tax (“ISR”) or the business flat tax (“IETU”) in the future. Additionally, the Company regularly reviews its deferred tax assets for recoverability, and records a deferred tax asset based on its judgment regarding the probability of historical taxable income, projected future taxable income and the expected timing of the reversals of existing temporary differences (see Note 24).
2.3.1.5 Tax, labor and legal contingencies and provisions
The Company is subject to various claims and contingencies on a range of matters including, among others, tax, labor and legal proceedings as described in Note 25. Due to their nature, such legal proceedings involve inherent uncertainties including, but not limited to, court rulings, negotiations between affected parties and governmental actions. Management periodically assesses the probability of loss for such contingencies and accrues a provision and/or discloses the relevant circumstances, as appropriate. If the potential loss of any claim or legal proceeding is considered probable and the amount can be reasonably estimated, the Company accrues a provision for the estimated loss. Management’s judgment must be exercised to determine the likelihood of such a loss and an estimate of the amount, due to the subjective nature of the loss.
2.3.1.6 Valuation of financial instruments
The Company is required to measure all derivative financial instruments at fair value.
The fair values of derivative financial instruments are determined considering quoted prices in recognized markets. If such instruments are not traded, fair value is determined by applying techniques based upon technical models supported by sufficient reliable and verifiable data, recognized in the financial sector. The Company bases its forward price curves upon market price quotations. Management believes that the chosen valuation techniques and assumptions used are appropriate in determining the fair value of financial instruments (see Note 20).
2.3.1.7 Business combinations
Acquisitions of businesses are accounted for using the acquisition method. The consideration transferred in a business combination is measured at fair value, which is calculated as the sum of the acquisition-date fair values of the assets transferred by the Company, liabilities assumed by the Company to the former owners of the acquiree and the equity interests issued by the Company in exchange for control of the acquiree.
At the acquisition date, the identifiable assets acquired and the liabilities assumed are recognized at their fair value, except that:
| • | Deferred tax assets or liabilities, and assets or liabilities related to employee benefit arrangements are recognized and measured in accordance with IAS 12,Income Taxesand IAS 19,Employee Benefits, respectively; |
| • | Liabilities or equity instruments related to share-based payment arrangements of the acquiree or share-based payment arrangements of the Company entered into to replace share-based payment arrangements of the acquiree are measured in accordance with IFRS 2,Share-based Paymentat the acquisition date, see Note 3.23; and |
| • | Assets (or disposal groups) that are classified as held for sale in accordance with IFRS 5,Non-current Assets Held for Sale andDiscontinued Operations are measured in accordance with that Standard. |
Management’s judgment must be exercised to determine the fair value of assets acquired and liabilities assumed.
Goodwill is measured as the excess of the sum of the consideration transferred, the amount of any non-controlling interests in the acquiree, and the fair value of the Company’s previously held equity interest in the acquiree (if any) over the net of the acquisition - date amounts of the identifiable assets acquired and the liabilities assumed. If, after reassessment, the net of the acquisition-date amounts of the identifiable assets acquired and liabilities assumed exceeds the sum of the consideration transferred, the amount of any non-controlling interests in the acquiree and the fair value of the Company’s previously held interest in the acquiree (if any), the excess is recognized immediately in profit or loss as a bargain purchase gain.
For each business combination, the Company elects whether it measures the non-controlling interest in the acquiree either at fair value or at the proportionate share of the acquiree’s identifiable net assets.
2.3.1.8 Investments in associates
If the Company holds, directly or indirectly, 20 per cent or more of the voting power of the investee, it is presumed that it has significant influence, unless it can be clearly demonstrated that this is not the case. If the Company holds, directly or indirectly, less than 20 per cent of the voting power of the investee, it is presumed that the Company does not have significant influence, unless such influence can be clearly demonstrated. Decisions regarding the propriety of utilizing the equity method of accounting for a less than 20 per cent-owned corporate investee require a careful evaluation of voting rights and their impact on the Company’s ability to exercise significant influence. Management considers the existence of the following circumstances which may indicate that the Company is in a position to exercise significant influence over a less than 20 per cent-owned corporate investee:
Representation on the board of directors or equivalent governing body of the investee;
Participation in policy-making processes, including participation in decisions about dividends or other distributions;
Material transactions between the Company and the investee;
Interchange of managerial personnel; or
Provision of essential technical information.
Management also considers the existence and effect of potential voting rights that are currently exercisable or currently convertible securities should also be considered when assessing whether the Company has significant influence.
In addition, the Company evaluates the following indicators that provide evidence of significant influence:
The Company’s extent of ownership is significant relative to other shareholdings (i.e., a lack of concentration of other shareholders);
The Company’s significant stockholders, its parent, fellow subsidiaries, or officers of the Company, hold additional investment in the investee; and
The Company is a part of significant investee committees, such as the executive committee or the finance committee.
3 Significant Accounting Policies
3.1 Basis of consolidation
The consolidated financial statements incorporate the financial statements of FEMSA and subsidiaries controlled by the Company. Control is achieved where the Company has the power to govern the financial and operating policies of an entity so as to obtain benefits from its activities.
Subsidiaries are fully consolidated from the date of acquisition, being the date on which the Company obtains control, and continue to be consolidated until the date when such control ceases.. Total consolidated net income (loss) and comprehensive income (loss) of subsidiaries is attributed to the controlling interest and to non-controlling interests even if this results in the non-controlling interests having a deficit balance.
When necessary, adjustments are made to the financial statements of subsidiaries to bring their accounting policies in line with those used by the Company.
All intercompany transactions, balances, income and expenses have been eliminated in the consolidated financial statements.
Note 1 to the consolidated financial statements lists all significant subsidiaries that are controlled by the Company as of December 31, 2007, which2012, 2011 and January 1, 2011 (transition date to IFRS).
3.1.1 Acquisitions of non-controlling interests
Acquisitions of non-controlling interests are accounted for as transactions with owners in their capacity as owners and therefore no goodwill is recognized as a result. Adjustments to non-controlling interests arising from transactions that do not involve the dateloss of control are measured at carrying amount and reflected in equity as part of additional paid-in capital.
3.1.2 Special Purpose Entities (“SPEs”)
An SPE is consolidated if, based on an evaluation of the last comprehensive recognitionsubstance of the effects of the inflation in the financial information in inflationary and non-inflationary economic environments. Beginning on January 1, 2008 and according to NIF B-10 “Effects of Inflation,” only inflationary economic environments have to recognize inflation effects. As described in Note 5 A), since 2008its relationship with the Company has operated in a non-inflationary economic environment in Mexico. Figures as of December 31, 2009, 2008 and 2007 are presented as they were reported in last year; as a result figures have not been comprehensively restated as required by NIF B-10 for reporting entitiesthe SPE’s risks and rewards, the Company concludes that operate in non-inflationary economic environments.
The results of operations of businesses acquiredit controls the SPE. SPEs controlled by the Company are includedwere established under terms that impose strict limitations on the decision-making powers of the SPE’s management and that result in the consolidated financial statements sinceCompany receiving the datemajority of acquisition. As a result of certain acquisitions (see Note 6), the consolidated financial statements are not comparablebenefits related to the figures presentedSPE’s operations and net assets, being exposed to the majority of risks incident to the SPE’s activities, and retaining the majority of the residual or ownership risks related to the SPEs or their assets.
3.1.3 Loss of control
Upon the loss of control, the Company derecognizes the assets and liabilities of the subsidiary, any non-controlling interests and the other components of equity related to the subsidiary. Any surplus or deficit arising on the loss of control is recognized in prior years.
The accompanying consolidated financial statements and their accompanying notes were approved for issuancenet income, including the share by the Company’s Chief Executive Officer and Chief Financial Officer on June 27, 2011 and subsequent events have been considered through that date.
On January 1, 2010, 2009, and 2008 several Mexican FRS came into effect. Such changes and their application are described as follows:
In 2010,controlling interest of components previously recognized in other comprehensive income. If the Company adopted NIF C-1 “Cash and Cash Equivalents”, which superseded Bulletin C-1 “Cash”. NIF C-1 establishes that cash shall be measured at nominal value, and cash equivalents shall be measured at acquisition cost for initial recognition. Subsequently, cash equivalents should be measured according to its designation: precious metals shall beretains any interest in the previous subsidiary, then such interest is measured at fair value foreign currencies shall be translated to the reporting currency applying the closing exchange rate, other cash equivalents denominated in a different measure of exchange shall be recognized to the extent provided for this purpose at the closing date of financial statements, and available-for-sale investments shall be presented at fair value. Cash and cash equivalents will be presented in the first line of assets, including restricted cash. This pronouncement was applied retrospectively, causing an increase in the cash balances reported as a result of the treatment of presentation of restricted cash, which was reclassified from “other current assets” for the amount of Ps. 394 and Ps. 214 at December 31, 2010 and 2009, respectively (see Note 5 B).
On September 30, 2010, INIF 19 “Accounting change as a result of IFRS adoption” was issued. INIF 19 states disclosure requirements for: (a) financial statements based on Mexican FRS that were issued before IFRS adoption and (b) financial statements on Mexican FRS that are issued during IFRS adoption process. Either A) or B) will result in additional disclosures regarding IFRS adoption, such as date of adoption, significant financial impact, significant changes in accounting policies, among others. The Company will adopt IFRS in 2012.
In 2009, the Company adopted NIF B-7 “Business Combinations,” whichcontrol is an amendment to the previous Bulletin B-7 “Business Acquisitions.” NIF B-7 establishes general rules for recognizing the fair value of net assets of businesses acquired as well as the fair value of noncontrolling interests, at the purchase date. This statement differs from the previous Bulletin B-7 in the following: a) To recognize all assets and liabilities acquired at their fair value, including the noncontrolling interest based on the acquirer accounting policies, b) acquisition-related costs and restructuring expenses should not be part of the purchase price, and c) changes to tax amounts recorded in acquisitions must be recognized as part of the income tax provision. This pronouncement was applied prospectively to business combinations for which the acquisition datelost. Subsequently it is on or after January 1, 2009.
NIF C-7 “Investments in Associates and Other Permanent Investments,” establishes general rules of accounting recognition for the investments in associated and other permanent investments not jointly or fully controlled or that are significantly influenced by an entity. This pronouncement includes guidance to determine the existence of significant influence. Previous Bulletin B-8 “Consolidated and combined financial statements and assessment of permanent share investments,” defined that permanent share investments were accounted for by the equity method ifor as a financial asset depending on the entity held 10% or morelevel of its outstanding shares. NIF C-7 establishes that permanent share investments should to beinfluence retained.
3.1.4 Disposals without loss of control
A change in the ownership interest of a subsidiary, without a loss of control, is accounted for byas an equity method if: a) an entity holds 10% or moretransaction.
In equity transactions, carrying amounts of a public entity, b) an entity holds 25% or more of a non-public company, or c) an entity has significant influencethe controlling and non-controlling interests shall be adjusted to reflect the changes in its investment as defined in NIF C-7. The Company adopted NIF C-7 on January 1, 2009, and its adoption did not have a significant impact in its consolidated financial results.
In 2009, the Company adopted NIF C-8 “Intangible Assets” which is similar to previous Bulletin C-8 “Intangible Assets.” NIF C-8, establishes the rules of valuation, presentation and disclosures for the initial and subsequent recognition of intangible assets that are acquired either individually, through acquisition of an entity, or generated internallytheir relative interests in the course ofsubsidiary. Any difference between the entity’s operations. This NIF considers intangible assets as non-monetary items, broadensamount by which the criteria of identification to include not only if they are separable (asset could be sold, transferred or used by the entity) but also whether they come from contractual or legal rights. NIF C-8 establishes that preoperative costs capitalized before this standard went into effect should have intangible assets characteristics, otherwise preoperative costs must be expensed as incurred. The impact of adopting NIF C-8 was a Ps. 182, net of deferred income tax, regarding prior years preoperative costs that did not have intangible asset characteristics, charged to retained earnings in the consolidated financial statementsnon-controlling interest is adjusted, and is presented as a change in accounting principle in the consolidated statements of changes in stockholders’ equity.
In 2009, the Company adopted NIF D-8 “Share-Based Payments” which establishes the recognition of share-based payments. When an entity purchases goods or pays for services with equity instruments, the NIF requires the entity to recognize those goods and services at fair value and the corresponding increase in equity. If the entity cannot determine the fair value of goodsthe consideration paid or received is recognized directly in equity and services, it should determine itattributed to the owners of the Company (the controlling interest).
3.2 Business combinations
Business combinations are accounted for using an indirectthe acquisition method basedat the acquisition date, which is the date on which control is transferred to the Company. In assessing control, the Company takes into consideration potential voting rights that are currently exercisable.
The Company measures goodwill at the acquisition date as the fair value of the consideration transferred plus the fair value of any previously-held equity instruments. This pronouncement substitutes forinterest in the supplementary useacquiree and the recognized amount of IFRS 2 “Share-Based Payments.” The adoption of NIF D-8 did not impactany non-controlling interests in the Company’s financial statements.
NIF B-8 “Consolidated and Combined Financial Statements,” issued in 2008 amends Bulletin B-8 “Consolidated and Combined Financial Statements and Assessment of Permanent Share Investments.” Prior Bulletin B-8 based its consolidation principle mainly on ownershipacquiree (if any), less the net recognized amount of the majority voting capital stock. NIF B-8 differs from previous Bulletin B-8identifiable assets acquired and liabilities assumed. If after reassessment, the excess is negative, a bargain purchase gain is recognized in consolidated net income at the following: a) defines controltime of the acquisition.
The consideration transferred does not include amounts related to the settlement of pre-existing relationships. Such amounts are recognized in consolidated net income of the Company.
Costs related to the acquisition, other than those associated with the issuance of debt or equity securities, that the Company incurs in connection with a business combination are expensed as the power to govern financial and operating policies, b) establishes that there are other facts, such as contractual agreements that have to be considered to determine if an entity exercises control or not, c) defines “Specific-Purpose Entity” (“SPE”), as those entities that are created to achieve a specific purpose and are considered within the scope of this pronouncement, d) establishes new terms as “controlling interest” instead of “majority interest” and “noncontrolling interest” instead “minority interest,” and e) confirms that noncontrolling interest must be assessedincurred.
Any contingent consideration payable is recognized at fair value at the subsidiary acquisition date. NIF B-8 shall be applied prospectively, beginning on January 1, 2009. The amendmentIf the contingent consideration is classified as equity, it is not remeasured and settlement is accounted for within equity. Otherwise, subsequent changes to the shareholders agreement described in Note 1, allowed the Company to continue to consolidate Coca-Cola FEMSA for Mexican FRS purposes during 2009.
In 2008, the Company adopted NIF B-2 “Statement of Cash Flows.” As established in NIF B-2, the Consolidated Statement of Cash Flows is presented as part of these financial statements for the years ended December 31, 2010, 2009 and 2008. The adoption of NIF B-2 also resulted in several complementary disclosures not previously required.
In 2008, the Company adopted NIF B-10 “Effects of Inflation.” Before 2008, the Company restated prior year financial statements to reflect the impact of current period inflation for comparability purposes.
NIF B-10 establishes two types of inflationary environments: a) Inflationary Economic Environment; this is when cumulative inflationfair value of the three preceding years is 26% or more. In such case, inflation effects should becontingent considerations are recognized in consolidated net income.
If the financial statementsinitial accounting for a business combination is incomplete by applying the integral method as described in NIF B-10; the recognized restatement effects for inflationary economic environments is made starting in the period that the entity becomes inflationary; and b) Non-Inflationary Economic Environment; this is when cumulative inflationend of the three preceding years is less than 26%. In such case, no inflationary effects should be recognized in the financial statements, keeping the recognized restatement effects until the lastreporting period in which the inflationarycombination occurs, the Company reports provisional amounts for the items for which the accounting was applied.is incomplete, and discloses that its allocation is preliminary in nature. Those provisional amounts are adjusted during the measurement period (not greater than 12 months), or additional assets or liabilities are recognized, to reflect new information obtained about facts and circumstances that existed at the acquisition date that, if known, would have affected the amounts recognized at that date.
3.3 Foreign currencies and consolidation of foreign subsidiaries, investments in associates and joint ventures
In order to reverseconsolidating the effects of inflationary accounting, NIF B-10 establishes that the results of holding non-monetary assets (RETANM) of previous periods should be reclassified in retained earnings. On January 1, 2008, the amount of RETANM reclassified in retained earnings was Ps. 6,070 (see Consolidated Statements of Changes in Stockholders’ Equity).
Through December 31, 2007, the Company accounted for inventories at replacement cost. As a result of NIF B-10 adoption, beginning in 2008, the Company carries out the inventories valuation based on valuation methods described in Bulletin C-4 “Inventories.” Inventories from Subholding Companies that operate in inflationary environments are restated using inflation factors. The change in accounting for inventories impacted the consolidated income statement, through an increase to cost of sales of Ps. 350 for the year ended on December 31, 2008.
In addition, NIF B-10 eliminates the restatement of imported equipment by applying the inflation factors and exchange rate of the country where the asset was purchased. Beginning in 2008, these assets are recorded using the exchange rate of the acquisition date. Subholding Companies that operate in inflationary environments should restate imported equipment using the inflation factors of the country where the asset is acquired. The change in this methodology did not significantly impact the consolidated financial statements of each individual subsidiary, investment in associates and joint venture, transactions in currencies other than the Company.individual entity’s functional currency (foreign currencies) are recognized at the rates of exchange prevailing at the dates of the transactions. At the end of each reporting period, monetary items denominated in foreign currencies are retranslated at the rates prevailing at that date. Non-monetary items that are measured in terms of historical cost in a foreign currency are not remeasured.
Exchange differences on monetary items are recognized in profit or loss in the period in which they arise except for:
NIF B-15 went into effectThe variations in 2008 and incorporates the conceptsnet investment in foreign subsidiaries generated by exchange rate fluctuation are included as part of recording currency, functional currency and reporting currency, and establishes the methodology to translate financial information of a foreign entity, basedexchange differences on those terms. Additionally, this rule is aligned with NIF B-10, which defines translation procedures of financial information from subsidiaries that operate in inflationary and non-inflationary environments. Prior to the application of this rule, translation of financial information from foreign subsidiaries was according to inflationary environments methodology. The adoption of this pronouncement is prospective and did not impactoperations within the consolidated financial statements of the Company (see Note 4).
The Company adopted NIF D-3 in 2008, which eliminates the recognition of the additional liability which resulted from the difference between obligations for accumulated benefits and the net projected liability. On January 1, 2008, the additional liability derecognized amounted to Ps. 868 from which Ps.447 corresponds to the intangible asset and Ps. 251 to the controlling cumulative other comprehensive income net from its deferred tax(loss) item, which is recorded in equity.
Intercompany financing balances with foreign subsidiaries that are considered as long-term investments, since there is no plan to pay such financing in the foreseeable future. Monetary position and exchange rate fluctuation regarding this financing is included in the exchange differences on translation of Ps. 170 These figures do not match to those presented previously due to discontinued operations.
NIF D-3 establishes a maximum five-year period to amortize the initial balance of the labor costs of past services of pension and retirement plans and the same amortization period for the labor cost of past service of severance indemnities, previously defined by Bulletin D-3 “Labor Liabilities” as unrecognized transition obligation and unrecognized prior service costs.
For the years ended December 31, 2010, 2009 and 2008, labor costs of past services amounted to Ps. 81, Ps. 81 and Ps. 99, respectively; and were recordedforeign operations within the operatingcumulative other comprehensive income (see Note 16).
Actuarial gains and losses of severance indemnities are registered in the operating income of the year they were generated and the balance of unrecognized actuarial gains and losses as of January 1, 2008 was(loss) item, which is recorded in other expenses (see Note 19) and amountedequity.
Exchange differences on transactions entered into in order to Ps. 163.
Note 4. Foreign Subsidiary Incorporation.
The accounting records ofhedge certain foreign subsidiaries are maintained in local currency and in accordance with local accounting principles of each country. risks.
For incorporation into the Company’s consolidated financial statements, each foreign subsidiary’ssubsidiary, associates or joint venture’s individual financial statements are adjusted to Mexican FRS, and translated into Mexican pesos, as described as follows:
For inflationaryhyperinflationary economic environments, the inflation effects of the origin country are recognized, and subsequently translated into Mexican pesos using the year-end exchange rate for the balance sheetsconsolidated statements of financial position and consolidated income statements;statements and comprehensive income; and
For non-inflationary economic environments, assets and liabilities are translated into Mexican pesos using the period-endyear-end exchange rate, stockholders’ equity is translated into Mexican pesos using the historical exchange rate, and the income statement and comprehensive income is translated using the exchange rate at the date of each transaction. The Company uses the average exchange rate of each month.month only if the exchange rate does not fluctuate significantly.
| Local Currencies to Mexican Pesos | Exchange Rates of Local Currencies Translated to Mexican Pesos | |||||||||||||||||||||||||||||||||||||||||||||||
Country | Functional / Recording Currency | Average Exchange Rate for | Exchange Rate as of December 31 | |||||||||||||||||||||||||||||||||||||||||||||
| 2010 | 2009 | 2008 | 2010 | 2009 | 2008 | |||||||||||||||||||||||||||||||||||||||||||
| Functional / Recording Currency | Average Exchange Rate for | Exchange Rate as of | ||||||||||||||||||||||||||||||||||||||||||||||
Country or Zone | 2012 | 2011 | December 31, 2012 | December 31, 2011 | January 1, 2011(1) | |||||||||||||||||||||||||||||||||||||||||||
Mexico | Mexican peso | Ps. | 1.00 | Ps. 1.00 | Ps. | 1.00 | Ps. | 1.00 | Ps. | 1.00 | Ps. | 1.00 | Mexican peso | Ps. | 1.00 | Ps. | 1.00 | Ps. | 1.00 | Ps. | 1.00 | Ps. | 1.00 | |||||||||||||||||||||||||
Guatemala | Quetzal | 1.57 | 1.66 | 1.47 | 1.54 | 1.56 | 1.74 | Quetzal | 1.68 | 1.59 | 1.65 | 1.79 | 1.54 | |||||||||||||||||||||||||||||||||||
Costa Rica | Colon | 0.02 | 0.02 | 0.02 | 0.02 | 0.02 | 0.02 | Colon | 0.03 | 0.02 | 0.03 | 0.03 | 0.02 | |||||||||||||||||||||||||||||||||||
Panama | U.S. dollar | 12.64 | 13.52 | 11.09 | 12.36 | 13.06 | 13.54 | U.S. dollar | 13.17 | 12.43 | 13.01 | 13.98 | 12.36 | |||||||||||||||||||||||||||||||||||
Colombia | Colombian peso | 0.01 | 0.01 | 0.01 | 0.01 | 0.01 | 0.01 | Colombian peso | 0.01 | 0.01 | 0.01 | 0.01 | 0.01 | |||||||||||||||||||||||||||||||||||
Nicaragua | Cordoba | 0.59 | 0.67 | 0.57 | 0.56 | 0.63 | 0.68 | Cordoba | 0.56 | 0.55 | 0.54 | 0.61 | 0.56 | |||||||||||||||||||||||||||||||||||
Argentina | Argentine peso | 3.23 | 3.63 | 3.50 | 3.11 | 3.44 | 3.92 | Argentine peso | 2.90 | 3.01 | 2.65 | 3.25 | 3.11 | |||||||||||||||||||||||||||||||||||
Venezuela | Bolivar | 2.97 | 6.29 | 5.20 | 2.87 | 6.07 | 6.30 | Bolivar | 3.06 | 2.89 | 3.03 | 3.25 | 2.87 | |||||||||||||||||||||||||||||||||||
Brazil | Reai | 7.18 | 6.83 | 6.11 | 7.42 | 7.50 | 5.79 | Reai | 6.76 | 7.42 | 6.37 | 7.45 | 7.42 | |||||||||||||||||||||||||||||||||||
Euro Zone | Euro | 16.74 | 18.80 | 16.20 | 16.41 | 18.81 | 18.84 | Euro (€) | 16.92 | 17.28 | 17.12 | 18.05 | 16.41 | |||||||||||||||||||||||||||||||||||
| (1) |
The variations in the net investment in foreign subsidiaries generated by exchange rate fluctuation are included in the cumulative translation adjustment, which is recorded in stockholders’ equity as part of cumulative other comprehensive income (loss).
Beginning in 2010, the government of Venezuela announced the devaluation of the Bolivar (Bs). The official exchange rate of 2.150 Bs to the dollar, in effect since 2005, was replaced on January 8, 2010, with a dual-rate regime, which allows two official exchange rates, one for essential products Bs 2.60 per U.S. dollar and other non-essential products of 4.30 Bs per U.S. dollar. According to this, the exchange rate used by the company to convert the information of the operation for this country changed Bs 2.15 to 4.30 per U.S. dollar in 2010. As a result of this devaluation, the balance sheet of the Coca-Cola FEMSA Venezuelan subsidiary reflected a reduction in shareholder’s equity of Ps. 3,700 which was accounted for at the time of the devaluation in January 2010.
The Company has operated under exchangesexchange controls in Venezuela since 2003 that affect its ability to remit dividends abroad or make payments other than in local currencies and that may increase the real price to us of raw materials purchased in local currency. In January 2010, the Venezuelan government announced a devaluation of its official exchange rate to 4.30 bolivars to one U .S. dollar.
During December 2010, authoritiesThe translation of the Venezuelan Government announced the unificationfinancial statements of their two fixed U.S. dollar exchange rates to Bs. 4.30 per U.S. dollar, effective January 1, 2011. As a result of this change, the balance sheet of the Coca-Cola FEMSA’s Venezuelan subsidiary did not have an impact in shareholders’ equity since transactionsis performed by this subsidiary were already using the Bs. 4.304. 30 bolivars exchange rate.rate per U. S. dollar (see also Note 29).
Intercompany financing balances withOn the disposal of a foreign subsidiariesoperation (i.e., a disposal of the Company’s entire interest in a foreign operation, or a disposal involving loss of control over a subsidiary that includes a foreign operation, a disposal involving loss of joint control over a jointly controlled entity that includes a foreign operation, or a disposal involving loss of significant influence over an associate that includes a foreign operation), all of the exchange differences accumulated in equity in respect of that operation attributable to the owners of the Company (the controlling interest) are considered as long-term investments, since there is no planreclassified to pay such financingprofit or loss.
In addition, in relation to a partial disposal of a subsidiary that does not result in the foreseeable future. Monetary positionCompany losing control over the subsidiary, the proportionate share of accumulated exchange differences are re-attributed to non-controlling interests and are not recognized in profit or loss. For all other partial disposals (i.e., partial disposals of associates or jointly controlled entities that do not result in the Company losing significant influence or joint control), the proportionate share of the accumulated exchange differences is reclassified to profit or loss.
Goodwill and fair value adjustments on identifiable assets and liabilities acquired arising on the acquisition of a foreign operation are treated as assets and liabilities of the foreign operation and translated at the rate fluctuation regarding this financingof exchange prevailing at the end of each reporting period. Exchange differences arising are recordedrecognized in equity as part of cumulativethe exchange differences on translation adjustment, in cumulative other comprehensive income (loss).of foreign operations item.
The translation of assets and liabilities denominated in foreign currencies into Mexican pesos is for consolidation purposes and does not indicate that the Company could realize or settle the reported value of those assets and liabilities in Mexican pesos. Additionally, this does not indicate that the Company could return or distribute the reported Mexican peso value equity to its shareholders.
Note 5. Significant Accounting Policies.
The Company’s accounting policies are in accordance with Mexican FRS, which require that the Company’s management make certain estimates and use certain assumptions to determine the valuation of various items included in the consolidated financial statements. The Company’s management believes that the estimates and assumptions used were appropriate as3.4 Recognition of the dateeffects of these consolidated financial statements. However actual results are subject to future events and uncertainties, which could materially impact the Company’s actual performance.inflation in countries with hyperinflationary economic environments
The significant accounting policies are as follows:
The Company recognizes the effects of inflation inon the financial information of its subsidiariesVenezuelan subsidiary that operateoperates in inflationarya hyperinflationary economic environments (whenenvironment (its cumulative inflation of the three preceding years is 26%approaching, or more)exceeds, 100% or more in addition to other qualitative factors), through the integral method, which consists of (see Note 3 I):of:
Using inflation factors to restate non-monetary assets, such as inventories, investments in process, property, plant and equipment, intangible assets, including related costs and expenses when such assets are consumed or depreciated;
Applying the appropriate inflation factors to restate capital stock, additional paid-in capital, net income, retained earnings and the cumulativeitems of other comprehensive income/lossincome by the necessary amount to maintain the purchasing power equivalent in Mexican pesosthe currency of Venezuela on the dates such capital was contributed or income was generated up to the date of these consolidated financial statements are presented; and
Including in the Comprehensive Financing Result themonetary position gain or loss on monetary position (see Note 5 U).in consolidated net income.
The Company restates the financial information of itsa subsidiaries that operateoperates in inflationaryhyperinflationary economic environmentsenvironment (Venezuela) using the consumer price index of eachthat country.
The operations of the Company are classified as follows considering the cumulative inflation of the three preceding years of 2010. The following classification was also applied for the 2009 period:
| Inflation Rate | Cumulative Inflation | |||||||||||||||||||
| 2010 | 2009 | 2008 | 2009-2007 | Type of Economy | ||||||||||||||||
Mexico | 4.4 | % | 3.6 | % | 6.5 | % | 14.5 | % | Non-Inflationary | |||||||||||
Guatemala | 5.4 | % | (0.3 | )% | 9.4 | % | 18.6 | % | Non-Inflationary | |||||||||||
Colombia | 3.2 | % | 2.0 | % | 7.7 | % | 16.1 | % | Non-Inflationary | |||||||||||
Brazil | 5.9 | % | 4.1 | % | 6.5 | % | 16.6 | % | Non-Inflationary | |||||||||||
Panama | 4.9 | % | 1.9 | % | 6.8 | % | 15.7 | % | Non-Inflationary | |||||||||||
Euro Zone | 2.2 | % | 0.9 | % | 1.6 | % | 5.7 | % | Non-Inflationary | |||||||||||
Argentina(1) | 10.9 | % | 7.7 | % | 7.2 | % | 25.3 | % | Inflationary | |||||||||||
Venezuela | 27.2 | % | 25.1 | % | 30.9 | % | 100.5 | % | Inflationary | |||||||||||
Nicaragua | 9.2 | % | 0.9 | % | 13.8 | % | 34.2 | % | Inflationary | |||||||||||
Costa Rica | 5.8 | % | 4.0 | % | 13.9 | % | 31.3 | % | Inflationary | |||||||||||
3.5 Cash and Cash Equivalentscash equivalents and restricted cash
Cash is measured at nominal value and consists of non-interest bearing bank deposits and restricted cash. Beginning in 2010 restricted cash is presented within cash; prior years have been reclassified from other current assets to cash for comparable purposes.deposits. Cash equivalents consisting principally of short-term bank deposits and fixed-ratefixed rate investments with original maturities of three months or less at the acquisition date. They are recorded at its acquisition cost plus interest income not yet received, which is similar to listed market prices.
| 2010 | 2009 | |||||||
Mexican pesos | Ps. | 11,207 | Ps. | 8,575 | ||||
U.S. dollars | 12,652 | 3,181 | ||||||
Brazilian reais | 1,792 | 1,915 | ||||||
Euros | 531 | — | ||||||
Venezuelan bolivars | 460 | 524 | ||||||
Colombian pesos | 213 | 245 | ||||||
Argentine pesos | 153 | 68 | ||||||
Others | 89 | — | ||||||
| Ps. | 27,097 | Ps. | 14,508 | |||||
3.6 Financial assets
AsFinancial assets are classified into the following specified categories: “at fair value through profit or loss (FVTPL),” “held-to-maturity investments,” “available-for-sale,” “loans and receivables” or as derivatives designated as hedging instruments in an effective hedge, as appropriate. The classification depends on the nature and purpose of December 31, 2010holding the financial assets and 2009,is determined at the time of initial recognition.
When a financial asset or financial liability is recognised initially, the Company has restrictedmeasures it at its fair value plus, in the case of a financial asset or financial liability not at fair value through profit or loss, transaction costs that are directly attributable to the acquisition or issue of the financial asset or financial liability.
The Company’s financial assets include cash which is pledged as collateral of accounts payable in different currencies as follows:
| 2010 | 2009 | |||||||
Venezuelan bolivars | Ps. 143 | Ps. 161 | ||||||
Argentine pesos | 2 | — | ||||||
Brazilian reais | 249 | 53 | ||||||
| Ps. 394 | Ps. 214 | |||||||
As of December 31, 2010 and 2009, cash equivalents, amounted to Ps. 19,770investments, loans and Ps. 9,950, respectively.receivables, derivative financial instruments and other financial assets.
Marketable Securities3.6.1 Effective interest method
The effective interest rate method is a method of calculating the amortized cost of loans and receivables and other financial assets (designated as held-to-maturity) and of allocating interest income over the relevant period. The effective interest rate is the rate that exactly discounts estimated future cash receipts (including all fees on points paid or received that form an integral part of the effective interest rate, transaction costs and other premiums or discounts) through the expected life of the financial asset, or (where appropriate) a shorter period, to the net carrying amount on initial recognition.
3.6.2 Investments
Investments consist of debt securities and bank deposits with maturities of more than three months at the acquisition date. Management determines the appropriate classification of debt securitiesinvestments at the time of purchase and reevaluatesassesses such designation as of each balance date. Marketable securities are classified as available-for-sale. reporting date (see Note 6).
3.6.2.1Available-for-sale securitiesinvestments are carried at fair value, with the unrealized gains and losses, net of tax, reported in other comprehensive income. Interest and dividends on securitiesinvestments classified as available-for-sale are included in investmentinterest income. The fair values of the investments are readily available based on quoted market prices. The followingexchange effects of securities available for sale are recognized in the consolidated income statement in the period in which they arise.
3.6.2.2Held-to maturity investments are those that the Company has the positive intent and ability to hold to maturity, and after initial measurement, such financial assets are subsequently measured at amortized cost, which includes any cost of purchase and premium or discount related to the investment. Subsequently, the premium/discount is amortized over the life of the investment based on its outstanding balance utilizing the effective interest method, less any impairment. Interest and dividends on investments classified as held-to maturity are included in interest income.
3.6.3 Loans and receivables
Loans and receivables are non-derivative financial instruments with fixed or determinable payments that are not quoted in an active market. Loans and receivables (including trade and other receivables) are measured at amortized cost using the effective interest method, less any impairment.
Interest income is recognized by applying the effective interest rate, except for short-term receivables when the recognition of interest would be immaterial. For the years ended December 31, 2012 and 2011, the interest income recognized in the interest income line item within the consolidated income statements for loans and receivable is Ps. 87 and Ps. 61, respectively.
3.6.4 Other financial assets
Other financial assets are non current accounts receivable and derivative financial instruments. Other financial assets with a detailrelevant period are measured at amortized cost using the effective interest method, less any impairment.
3.6.5 Impairment of available-for-sale securities.financial assets
Financial assets, other than those at FVTPL, are assessed for indicators of impairment at the end of each reporting period. Financial assets are considered to be impaired when there is objective evidence that, as a result of one or more events that occurred after the initial recognition of the financial asset, there is an incurred “loss event” and that loss event has an impact on the estimated future cash flows of the financial assets that can be reliably estimated.
Evidence of impairment may include indicators as follows:
Debt Securities | Amortized Cost | Gross Unrealized Gain | Fair Value | |||||||||
December 31, 2010 | Ps. | 66 | — | Ps. | 66 | |||||||
December 31, 2009 | Ps. | 2,001 | Ps. | 112 | Ps. | 2,113 | ||||||
Significant financial difficulty of the issuer or counterparty; or
AllowanceDefault or delinquent in interest or principal payments; or
It becoming probable that the borrower will enter bankruptcy or financial re-organization; or
The disappearance of an active market for that financial asset because of financial difficulties.
For financial assets carried at amortized cost, the amount of the impairment loss recognized is the difference between the asset’s carrying amount and the present value of estimated future cash flows, discounted at the financial asset’s original effective interest rate.
The carrying amount of the financial asset is reduced by the impairment loss directly for all financial assets with the exception of trade receivables, where the carrying amount is reduced through the use of an allowance for doubtful accountsaccounts. When a trade receivable is considered uncollectible, it is written off against the allowance account. Subsequent recoveries of amounts previously written off are credited against the allowance account. Changes in the carrying amount of the allowance account are recognized in profit and loss.
As of December 31, 2012, the Company recognized an impairment charge of Ps. 384 (see Note 19).
3.6.6 Derecognition
A financial asset (or, where applicable, a part of a financial asset or part of a group of similar financial assets) is derecognised when:
The rights to receive cash flows from the financial asset have expired; or
The Company has transferred its rights to receive cash flows from the asset or has assumed an obligation to pay the received cash flows in full without material delay to a third party under a ‘pass-through’ arrangement; and either (a) the Company has transferred substantially all the risks and rewards of the asset, or (b) the Company has neither transferred nor retained substantially all the risks and rewards of the asset, but has transferred control of the asset.
3.6.7 Offsetting of financial instruments
Financial assets are required to be offset against financial liabilities and the net amount reported in the consolidated statement of financial position if, and only when the Company:
Currently has an enforceable legal right to offset the recognised amounts, and
Intends to settle on a net basis, or to realize the assets and settle the liabilities simultaneously.
3.7 Derivative financial instruments
The Company is exposed to different risks related to cash flows, liquidity, market and third party credit. As a result, the Company contracts in different derivative financial instruments in order to reduce its exposure to the risk of exchange rate fluctuations between the Mexican peso and other currencies, the risk of exchange rate and interest rate fluctuations associated with its borrowings denominated in foreign currencies and the exposure to the risk of fluctuation in the costs of certain raw materials.
The Company values and records all derivative financial instruments and hedging activities, in the consolidated statement of financial position as either an asset or liability measured at fair value, considering quoted prices in recognized markets. If such instruments are not traded in a formal market, fair value is determined by applying techniques based upon technical models supported by sufficient, reliable and verifiable market data recognized in the financial sector. Such techniques may include using recent arm’s length market transactions, reference to the current fair value or another instrument that is substantially the same and a discounted cash flow analysis of other valuation models. Changes in the fair value of derivative financial instruments are recorded each year in current earnings or as a component of cumulative other comprehensive income based on an evaluationthe item being hedged and the effectiveness of the aginghedge.
3.7.1 Hedge accounting
The Company designates certain hedging instruments, which include derivatives and non-derivatives in respect of foreign currency risk, as either fair value hedges or cash flow hedges. Hedges of foreign exchange risk on firm commitments are accounted for as cash flow hedges.
At the inception of the receivable portfoliohedge relationship, the Company documents the relationship between the hedging instrument and the economic situationhedged item, along with its risk management objectives and its strategy for undertaking various hedge transactions. Furthermore, at the inception of the Company’s clients,hedge and on an ongoing basis, the Company documents whether the hedging instrument is highly effective in offsetting changes in fair values or cash flows of the hedged item attributable to the hedged risk.
3.7.2 Cash flow hedges
The effective portion of changes in the fair value of derivatives that are designated and qualify as wellcash flow hedges is recognized in other comprehensive income and accumulated under the heading valuation of the effective portion of derivative financial instruments. The gain or loss relating to the ineffective portion is recognized immediately in consolidated net income, and is included in the market value gain (loss) on financial instruments line item within the consolidated income statements.
Amounts previously recognized in other comprehensive income and accumulated in equity are reclassified to consolidated net income in the periods when the hedged item is recognized in consolidated net income, in the same line of the consolidated income statement as the Company’s historicalrecognized hedged item. However, when the hedged forecast transaction results in the recognition of a non-financial asset, the gains and losses previously recognized in other comprehensive income and accumulated in equity are transferred from equity and included in the initial measurement of the cost of the non-financial asset.
Hedge accounting is discontinued when the Company revokes the hedging relationship, when the hedging instrument expires or is sold, terminated, or exercised, or when it no longer qualifies for hedge accounting. Any gain or loss rate on receivablesrecognized in cumulative other comprehensive income in equity at that time remains in equity and is recognized when the forecast transaction is ultimately recognized in consolidated net income. When a forecast transaction is no longer expected to occur, the gain or loss accumulated in equity is recognized immediately in consolidated net income.
3.7.3 Fair value hedges
Changes in the fair value of derivatives that are designated and qualify as fair value hedges are recognized in consolidated net income immediately, together with any changes in the fair value of the hedged asset or liability that are attributable to the hedged risk. The change in the fair value of the hedging instrument and the economic environmentchange in whichthe hedged item attributable to the hedged risk are recognized in the line of the consolidated income statement relating to the hedged item.
Hedge accounting is discontinued when the Company operates.revokes the hedging relationship, when the hedging instrument expires or is sold, terminated, or exercised, or when it no longer qualifies for hedge accounting. The carrying value of accounts receivable approximates its fair value asadjustment to the carrying amount of both December 31, 2010the hedged item arising from the hedged risk is amortized to consolidated net income from that date over the remaining term of the hedge using the effective interest method.
3.8 Inventories and 2009.cost of sales
Inventories are measured at the lower of cost and net realizable value. Net realizable value represents the estimated selling price for inventories less all estimated costs of completion and costs necessary to make the sale.
Inventories represent the acquisition or production cost which is incurred when purchasing or producing a product, and are based on the weighted average cost formula. The operating segments of the Company use inventory costing methodologies provided by Bulletin C-4 “Inventories” to value their inventories, such as averagethe standard cost method in Coca-Cola FEMSA and retail method in FEMSA Comercio. Advances to suppliers of raw materials are included in the inventory account.
Cost of salesgoods sold is based on average cost is determined based on the average amount of the inventories at the time of sale. Cost of salesgoods sold in Coca-Cola FEMSA includes expenses related to the purchase of raw materials used in the production process, as well as labor costcosts (wages and other benefits)benefits, including employee profit sharing), depreciation of production facilities, equipment and other costs, such asincluding fuel, electricity, breakage of returnable bottles induring the production process, equipment maintenance, inspection and plant transfer costs.
3.9 Other current assets
Other current assets, are comprised of payments for services thatwhich will be received over the next 12 months and the fair market value of derivative financial instruments with maturity datesrealized within a period of less than one year (see Note 5 V),from the reporting date, are comprised of prepaid assets and long-lived assets available for sale that will be sold within the following year.agreements with customers.
Prepaid expensesassets principally consist of advances to suppliers of raw materials, advertising, promotional, leasing and insurance expenses,expenses. Prepaid assets are carried to the appropriate caption when inherent benefits and are recognized inrisks have already been transferred to the income statement when theCompany or services or benefits arehave been received.
Advertising
Prepaid advertising costs consist of television and radio advertising airtime paid in advance, and isadvance: these expenses are generally amortized over a 12-monththe period based on the transmission of the television and radio spots. The related production costs are recognized in consolidated net income from operationsas incurred.
Coca-Cola FEMSA has agreements with customers for the first timeright to sell and promote the advertising is broadcasted.
PromotionalCompany’s products over a certain period. The majority of these agreements have terms of more than one year, and the related costs are expensedamortized using the straight-line method over the term of the contract, with amortization presented as incurred, except for those promotionala reduction of net sales. For the years ended December 31,
2012 and 2011, such amortization aggregated to Ps. 970 and Ps. 793, respectively. The costs related to the launching of new products or presentations before they are on the market. These costs areagreements with terms of less than one year recorded as prepaid expensesa reduction in net sales when incurred.
3.10 Investments in associates and amortized over the period during which theyjoint ventures
Investments in associates are estimated to increase sales of the related products or container presentations to normal operating levels, which is generally no longer than one year.
The long-lived assets available for sale are recorded at their net realizable value. Long-lived assets are subject to impairment tests (see Note 9).
Comprehensive financing result directly attributable to qualifying assets has to be capitalized as part historic cost, except for interest income obtained from temporary investments while the entity is waiting to investthose entities in the qualifying asset. Comprehensive financing result of long-term financing clearly linked to qualifying assets is capitalized directly. When comprehensive financing result of direct or indirect financing is not clearly linked to qualifying assets, the Company capitalizes the proportional comprehensive financing result attributable to those qualifying assets by the weighted average interest rate of each business, including the effects of derivative financial instruments related to those financing.
Non-returnable bottles and cases are recorded in the results of operations at the time of product sale. Returnable bottles and cases are recorded at acquisition cost. There are two types of returnable bottles and cases:
Those that are in the Company’s control within its facilities, plants and distribution centers; and
Those that have been placed in the hands of customers, but still belong to the Company.
Breakage of returnable bottles and cases within plants and distribution centers is recorded as an expense as it is incurred. The Company estimates that breakage expense of returnable bottles and cases in plants and distribution centers is similar to the depreciation calculated on an estimated useful life of approximately four years for returnable soft drinks glass bottles and plastic cases, and 18 months for returnable soft drink plastic bottles. As of December 31, 2010 and 2009 the accumulated depreciation of bottles and cases amounted to Ps. 1,061 and Ps. 812, respectively.
Returnable bottles and cases that have been placed in the hands of customers are subject to an agreement with a retailer pursuant to which the Company retains ownership. These bottleshas significant influence. Significant influence is the power to participate in the financial and casesoperating policy decisions of the investee, but not control over the financial and operating policies. Joint ventures are monitored by sales personnel during periodic visits to retailers andthose companies over whose activities the Company has the right to charge any breakage identified to the retailer. Bottlesjoint control, established by contractual agreement and cases that are not subject to such agreements are expensed when placed in the hands of retailers.
The Company’s returnable bottlesrequiring unanimous consent for strategic financial and cases in the market and for which a deposit from customers has been received are presented net of such deposits, and the difference between the cost of these assets and the deposits received is depreciated according to their useful lives.operating decisions.
Investments in shares of associated companies where the Company holds 10% or more of a public company, 25% or more of a non-public company, or exercises significant influence according to NIF C-7 (see Note 3 D),associates and joint ventures are initially recorded at their acquisition cost as of acquisition date and are subsequently accounted for by the equity method. In order to applyusing the equity method from associates,and initial recognition comprises the Company uses the investee’s financial statements for the same period as the Company’sinvestment’s purchase price and any directly attributable expenditure necessary to acquire it.
The consolidated financial statements include the Company’s share of the consolidated net income and converts themother comprehensive income, after adjustments to Mexican FRS ifalign the investee reports financial information in a different GAAP. Equity method incomeaccounting policies with those of the Company, from associates is presentedthe date that significant influence or joint control commences until the date that significant influence or joint control ceases.
Profits and losses resulting from ‘upstream’ and ‘downstream’ transactions between the Company (including its consolidated subsidiaries) and an associate are recognised in the consolidated incomefinancial statements as partonly to the extent of unrelated investors’ interests in the associate. ‘Upstream’ transactions are, for example, sales of assets from an associate to the investor. ‘Downstream’ transactions are, for example, sales of assets from the Company to an associate. The Company’s share in the associate’s profits and losses resulting from these transactions is eliminated.
When the Company’s share of losses exceeds the carrying amount of the income from continuing operations.associate or joint venture, including any long-term investments, the carrying amount is reduced to nil and recognition of further losses is discontinued except to the extent that the Company has a legal or constructive obligation or has made payments on behalf of the associate or joint venture.
Goodwill identified at the investment’s acquisition date is presented as part of the investment ofin shares of anthe associate or joint venture in the consolidated balance sheet. Investmentstatement of sharesfinancial position. Any goodwill arising on the acquisition of anthe Company’s interest in a jointly controlled entity or associate is testedmeasured in accordance with the Company’s accounting policy for impairment whenever certain circumstances indicate that the carrying amount might exceed its fair value. A temporary decreasegoodwill arising in a business combination, see Note 3. 2.
After application of its market value is not recognized as impairment. Usually, investees recognize impairment when it first occurs. However, when this does not happen, the Company recognizes it as a decrease in the equity method, incomethe Company determines whether it is necessary to recognize an additional impairment loss on its investment in its associate. For investments in shares, the Company determines at each reporting date whether there is any objective evidence that the investment in shares is impaired. If this is the case, the Company calculates the amount of impairment as the difference between the recoverable amount of the period.
On May 1, 2010,associate and its carrying value, and recognizes the Company started to accountamount in the share of the profit or loss of associates and joint ventures accounted for using the equity method regardingin the 20% interest in Heineken Group (see Note 2). Heineken is an international company which prepares its information based on International Financial Reporting Standards (IFRS). The Company has analyzed differences between Mexican FRSconsolidated income statements.
3.11 Property, plant and IFRS to reconcile Heineken’s profit and total comprehensive income as required by NIF C-7, in order to estimate the impact on its figures.equipment
Investments in affiliated companies in which the Company does not have significant influence are recorded at acquisition cost and restated using the consumer price index if that entity operates in an inflationary environment.
Property, plant and equipment are initially recorded at their cost of acquisition and/or construction.construction, and are presented net of accumulated depreciation and/or accumulated impairment losses, if any. The comprehensive financing result generatedborrowing costs related to fund long-term assets investmentthe acquisition or construction of qualifying asset is capitalized as part of the total acquisition cost. Ascost of December 31, 2010 and 2009, the Company has capitalized Ps. 66 and Ps. 55 respectively, based on a capitalization weighted average rate of 5.3% and 7.2% for long-term assets investments that require more than the operating cycle of the Company to get ready for its intended use. As of December 31, 2008 the capitalization of the comprehensive financing result did not have a significant impact in the consolidated financial statements. asset.
Major maintenance costs are capitalized as part of total acquisition cost. Routine maintenance and repair costs are expensed as incurred.
Investments in progress consist of long-lived assets not yet in service, in other words, that are not yet used for the purpose that they were bought, built or developed. The Company expects to complete those investments during the following 12 months.
Depreciation is computed using the straight-line method over acquisition cost, reduced by their residual values.cost. Where an item of property, plant and equipment comprises major components having different useful lives, they are accounted and depreciated for as separate items (major components) of property, plant and equipment. The Company estimates depreciation rates, considering the estimated useful lives of the assets.
The estimated useful lives of the Company’s principal assets are as follows:
Years | ||||
Buildings | ||||
Machinery and equipment | ||||
Distribution equipment | ||||
Refrigeration equipment | ||||
Returnable bottles | 1.5-4 | |||
Leasehold improvements | The shorter of lease term or 15 years | |||
Information technology equipment | ||||
Other equipment | 3-10 | |||
Leasing Contracts
The Company leases assets such as property, land, transportationestimated useful lives, residual values and computer equipments, whichdepreciation method are reviewed at the end of each reporting period, with the effect of any changes in estimate accounted for as operating leases. Payments regarding operating leaseson a prospective basis.
An item of property, plant and equipment is derecognized upon disposal or when no future economic benefits are recorded as expenses inexpected to arise from the consolidated income of statement when incurred.
Other assets represent payments whose benefits will be received in future years and mainly consistcontinued use of the following:asset. Any gain or loss arising on the disposal or retirement of an item of property, plant and equipment is determined as the difference between the sales proceeds (if any) and the carrying amount of the asset and is recognized in consolidated net income.
Returnable and non-returnable bottles:
Coca-Cola FEMSA has two types of bottles: returnable and non-returnable.
Agreements with customers forNon returnable: Are recorded in consolidated net income at the right to sell and promote the Company’s products during certain periodstime of time, which are considered monetary assets and amortized under the straight-line method, which amortizes the asset over the life of the contract.product sale.
The amortization is recorded reducing net sales, which during years ended December 31, 2010, 2009 and 2008, amounted to Ps. 553, Ps. 604 and Ps. 383, respectively.
Leasehold improvementsReturnable: Are classified as long-lived assets as a component of property, plant and equipment. Returnable bottles are amortizedrecorded at acquisition cost; for countries with hyperinflationary economies, restated according to IAS 29. Depreciation of returnable bottles is computed using the straight-line method overconsidering their estimated useful lives.
There are two types of returnable bottles:
Those that are in Coca-Cola FEMSA’s control within its facilities, plants and distribution centers; and
Those that have been placed in the shorterhands of customers, but still belong to Coca-Cola FEMSA.
Returnable bottles that have been placed in the hands of customers are subject to an agreement with a retailer pursuant to which Coca-Cola FEMSA retains ownership. These bottles are monitored by sales personnel during periodic visits to retailers and Coca-Cola FEMSA has the right to charge any breakage identified to the retailer. Bottles that are not subject to such agreements are expensed when placed in the hands of retailers.
Coca-Cola FEMSA’s returnable bottles in the market and for which a deposit from customers has been received are depreciated according to their estimated useful lifelives.
3.12 Borrowing costs
Borrowing costs directly attributable to the acquisition, construction or production of qualifying assets, which are assets that necessarily take a substantial period of time to get ready for their intended use or sale, are added to the cost of those assets, until such time as the assets are substantially ready for their intended use or a term equivalentsale. Borrowing costs may include:
Interest expense;
Finance charges in respect of finance leases; and
Exchange differences arising from foreign currency borrowings to the lease period. The amortizationextent that they are regarded as an adjustment to interest costs.
Interest income earned on the temporary investment of leasehold improvements as of December 31, 2010, 2009 and 2008 were Ps. 518, Ps. 471 and Ps. 456, respectively.specific borrowings pending their expenditure on qualifying assets is deducted from the borrowing costs eligible for capitalization.
All other borrowing costs are recognized in consolidated net income in the period in which they are incurred.
3.13 Intangible assets
Intangible assets are identifiable non monetary assets without physical substance and represent payments whose benefits will be received in future years. TheseIntangible assets acquired separately are measured on initial recognition at cost. The cost of intangible assets acquired in a business combination is their fair value as at the date of acquisition. Following initial recognition, intangible assets are classifiedcarried at cost less any accumulated amortization and accumulated impairment losses. The useful lives of intangible assets are assessed as either intangible assets with a finite useful life or intangible assets with an indefinite, useful life, in accordance with the period over which the Company is expectedexpects to receive the benefits.
Intangible assets with finite useful lives are amortized and mainly consist of:
Information technology and management systemssystem costs incurred during the development stage which are currently in use. Such amounts wereare capitalized and then amortized using the straight-line method over four years.their expected useful lives. Expenses that do not fulfill the requirements for capitalization are expensed as incurred.
Other computer systems cost in the development stage, not yet in use. Such amounts are capitalized as they are expected to add value such as income or cost savings in the future. Such amounts will be amortized on a straight-line basis over their estimated useful life after they are placed in service.
Long-term alcohol licenses are amortized using the straight-line method over their estimated useful lives, which range between 12 and 15 years, and are presented as part of intangible assets ofwith finite useful life.lives.
Through 2008, start-up expenses, which represented costs incurred prior toAmortized intangible assets, such as finite lived intangible assets are reviewed for impairment whenever events or changes in circumstances indicate that the opening of OXXO stores with the characteristicscarrying amount of an intangible asset internally developed, were amortized on a straight-line basis in accordance with the termsor group of the lease contract. In 2009, according to NIF C-8, these amounts were reclassified in retained earnings (see Note 3 E).assets may not be recoverable through its expected future cash flows.
Intangible assets with an indefinite liveslife are not amortized and are subject to annual impairment tests or more frequently if necessary. These assets are recorded inon an annual basis as well as whenever certain circumstances indicate that the functional currencycarrying amount of the subsidiary in which the investment was made and are subsequently translated into Mexican pesos applying the closing rate of each period. Where inflationary accounting is applied, thethose intangible assets are restated applying inflation factors of the country of origin and then translated into Mexican pesos at the year-end exchange rate. exceeds their recoverable value.
The Company’s intangible assets with an indefinite liveslife mainly consist of rights to produce and distribute Coca-Cola trademark products in the territories acquired.Company’s territories. These rights are contained in agreements that are standard contracts that The Coca-Cola Company has with its bottlers.
There are four
In Mexico, Coca-Cola FEMSA has eight bottler agreements for Coca-Cola FEMSA’s territories in Mexico; two expire in June 2013, and the other two expire in May 2015.2015 and additionally four contracts that arose from the merger with Grupo Tampico, CIMSA and Grupo Fomento Queretano, expire in September 2014, April and July 2016 and August 2013, respectively. The bottler agreement for Argentina expires in September 2014, for Brazil will expireexpires in April 2014, in Colombia in June 2014, in Venezuela in August 2016, in Guatemala in March 2015, in Costa Rica in September 2017, in Nicaragua in May 2016 and in Panama in November 2014. All of the Company’sThese bottler agreements are automatically renewable for ten-year terms,term, subject to the right of eacheither party to decidegive prior notice that it does not wish to renew any of these agreements.the agreement. In addition, these agreements generally may be terminated in the case of material breach. Termination would prevent Coca-Cola FEMSA from selling Coca-Cola trademark beverages in the affected territory and would have an adverse effect on its business, financial conditions, results offrom operations and prospects.
Goodwill equates to synergies both existing in the acquired operations and those further expected to be realized upon integration. Goodwill recognized separately is tested annually for impairment and is carried at cost, less accumulated impairment losses. Gains and losses on the sale of an entity include the carrying amount of the goodwill related to that entity. Goodwill is allocated to CGUs in order to test for impairment losses. The allocation is made to CGUs that are expected to benefit from the business combination that generated the goodwill.
The3.14 Non-current assets held for sale
Non-current assets and disposal groups are classified as held for sale if their carrying amount will be recovered principally through a sale transaction rather than through continuing use. This condition is regarded as met only when the sale is highly probable and the non-current asset (or disposal group) is available for immediate sale in its present condition. Management must be committed to the sale, which should be expected to qualify for recognition as a completed sale within one year from the date of classification.
When the Company is committed to a sale plan involving loss of control of a subsidiary, all of the assets and liabilities of that subsidiary are classified as held for sale when the criteria described above are met, regardless of whether the Company will retain a non-controlling interest in its former subsidiary after the sale.
Non-current assets (and disposal groups) classified as held for sale are measured at the lower of their previous carrying amount and fair value less costs to sell.
3.15 Impairment of non financial assets
At the end of each reporting period, the Company reviews the carrying valueamounts of its long-livedtangible and intangible assets and goodwill forto determine whether there is any indication that those assets have suffered an impairment and determines whether impairmentloss. If any such indication exists, by comparing the book valuerecoverable amount of the assets with its fair value whichasset is calculated using recognized methodologies. In caseestimated in order to determine the extent of the impairment loss (if any). Where it is not possible to estimate the Company records the resulting fair value.
For depreciable and amortizable long-lived assets, such as property, plant and equipment and certain other definite long–lived assets, the Company performs tests for impairment whenever events or changes in circumstances indicate that the carryingrecoverable amount of an individual asset, or group of assets may not be recoverable through their expected future cash flows.
For indefinite life intangible assets, such as distribution rights and trademarks, the Company tests for impairment on an annual basis and whenever certain circumstances indicate thatestimates the carryingrecoverable amount of those intangiblethe cash-generating unit to which the asset belongs. Where a reasonable and consistent basis of allocation can be identified, corporate assets exceeds its implied fair value calculated using recognized methodologiesare also allocated to individual CGUs, or otherwise they are allocated to the smallest CGUs for which a reasonable and consistent with them.allocation basis can be identified.
For goodwill and other indefinite lived intangible assets, the Company tests for impairment on an annual basis and whenever certain circumstances indicate that the carrying amount of the reporting unit might exceed its impliedrecoverable value.
Recoverable amount is the higher of fair value.value less costs to sell and value in use. In assessing value in use, the estimated future cash flows are discounted to their present value using a pre-tax discount rate that reflects current market assessments of the time value of money and the risks specific to the asset for which the estimates of future cash flows have not been adjusted.
If the recoverable amount of an asset (or CGU) is estimated to be less than its carrying amount, the carrying amount of the asset (or CGU) is reduced to its recoverable amount. An impairment loss is recognized immediately in consolidated net income.
Where an impairment loss subsequently reverses, the carrying amount of the asset (or CGU) is increased to the revised estimate of its recoverable amount, but so that the increased carrying amount does not exceed the carrying amount that would have been determined had no impairment loss been recognized for the asset (or CGU) in prior years. A reversal of an impairment loss is recognized immediately in consolidated net income. Impairment charges regarding long-lived assets andlosses related to goodwill are recognized in other expenses.not reversible.
TheFor the year ended December 31, 2011, the Company recognized an impairment of Ps. 146 (see Note 12) regarding to indefinite life intangible assets of Ps. 10 as of the end of December 31, 2010 (see Note 12).assets. No impairment was recognized regarding indefinite life intangibleto depreciable long-lived assets, goodwill nor investment in associates and goodwill asjoint ventures.
3.16 Leases
The determination of whether an arrangement is, or contains, a lease is based on the substance of the endarrangement at inception date, whether fulfillment of December 31, 2009the arrangement is dependent on the use of a specific asset or assets or the arrangement conveys a right to use the asset, even if that right is not explicitly specified in an arrangement.
Leases are classified as finance leases whenever the terms of the lease transfer substantially all the risks and 2008.rewards of ownership to the lessee. All other leases are classified as operating leases.
Assets held under finance leases are initially recognized as assets of the Company at their fair value at the inception of the lease or, if lower, at the present value of the minimum lease payments. The Coca-Cola Company participatescorresponding liability to the lessor is included in certain advertisingthe consolidated statement of financial position as a finance lease obligation. Lease payments are apportioned between finance expenses and promotional programsreduction of the lease obligation so as wellto achieve a constant rate of interest on the remaining balance of the liability. Finance expenses are recognized immediately in consolidated net income, unless they are directly attributable to qualifying assets, in which case they are capitalized in accordance with the Company’s general policy on borrowing costs. Contingent rentals are recognized as expenses in Coca-Cola FEMSA’s refrigeration equipment and returnable bottles investment program. The contributions received for advertising and promotionalthe periods in which they are incurred. Assets held under finance leases are depreciated over their expected useful lives on the same basis as owned assets or, where shorter, the term of the relevant lease.
Operating lease payments are recognized as an expense on a straight-line basis over the lease term, except where another systematic basis is more representative of the time pattern in which economic benefits from the leased asset are consumed. Contingent rentals arising under operating leases are recognized as an expense in the period in which they are incurred. In the event that lease incentives are includedreceived to enter into operating leases, such incentives are recognized as a liability. The aggregate benefit of incentives is recognized as a reduction of selling expenses.rental expense on a straight-line basis, except where another systematic basis is more representative of the time pattern in which economic benefits from the leased asset are consumed. Leasehold improvements on operating leases are amortized using the straight-line method over the shorter of either the useful life of the assets or the related lease term.
3.17 Financial liabilities and equity instruments
3.17.1 Classification as debt or equity
Debt and equity instruments issued by the Company are classified as either financial liabilities or as equity in accordance with the substance of the contractual arrangements and the definitions of a financial liability and an equity instrument.
3.17.2 Equity instruments
An equity instrument is any contract that evidences a residual interest in the assets of an entity after deducting all of its liabilities. Equity instruments issued by the Company are recognized at the proceeds received, net of direct issue costs.
Repurchase of the Company’s own equity instruments is recognized and deducted directly in equity. No gain or loss is recognized in profit or loss on the purchase, sale, issue or cancellation of the Company’s own equity instruments.
3.17.3 Financial liabilities
Initial recognition and measurement.
Financial liabilities within the scope of IAS 39 are classified as financial liabilities at FVTPL, loans and borrowings, or as derivatives designated as hedging instruments in an effective hedge, as appropriate. The contributions received forCompany determines the refrigeration equipmentclassification of its financial liabilities at initial recognition.
All financial liabilities are recognised initially at fair value plus, in the case of loans and returnable bottles investment programborrowings, directly attributable transaction costs.
The Company financial liabilities include trade and other payables, loans and borrowings, and derivative financial instruments, see Note 3. 7.
Subsequent measurement.
The measurement of financial liabilities depends on their classification as described below:
3.17.4 Loans and borrowings
After initial recognition, interest bearing loans and borrowings are recordedsubsequently measured at amortized cost using the effective interest method. Gains and losses are recognized in the consolidated income statements when the liabilities are derecognized as well as through the effective interest method amortization process.
Amortized cost is calculated by taking into account any discount or premium on acquisition and fees or costs that are an integral part of the effective interest method. The effective interest method amortization is included in interest expense in the consolidated income statements.
3.17.5 Derecognition
A financial liability is derecognised when the obligation under the liability is discharged or cancelled or expires. When an existing financial liability is replaced by another from the same lender on substantially different terms, or the terms of an existing liability are substantially modified, such an exchange or modification is treated as the derecognition of the original liability and the recognition of a new liability. The difference in the respective carrying amounts is recognised in the consolidated income statements.
3.18 Provisions
Provisions are recognized when the Company has a present obligation (legal or constructive) as a reductionresult of a past event, it is probable that the Company will be required to settle the obligation, and a reliable estimate can be made of the investmentamount of the obligation.
The amount recognized as a provision is the best estimate of the consideration required to settle the present obligation at the end of the reporting period, taking into account the risks and uncertainties surrounding the obligation. When a provision is measured using the cash flows estimated to settle the present obligation, its carrying amount is the present value of those cash flows (where the effect of the time value of money is material).
When some or all of the economic benefits required to settle a provision are expected to be recovered from a third party, a receivable is recognized as an asset if it is virtually certain that reimbursement will be received and the amount of the receivable can be measured reliably.
The Company recognizes a provision for a loss contingency when it is probable (i.e., the probability that the event will occur is greater than the probability that it will not) that certain effects related to past events, would materialize and can be reasonably quantified. These events and their financial impact are also disclosed as loss contingencies in refrigeration equipmentthe consolidated financial statements when the risk of loss is deemed to be other than remote. The Company does not recognize an asset for a gain contingency until the gain is realized, see Note 25.
Restructuring provisions are recognized only when the recognition criteria for provisions are fulfilled. The Company has a constructive obligation when a detailed formal plan identifies the business or part of the business concerned, the location and returnable bottles. Total contributions received were Ps. 2,386, Ps. 1,945number of employees affected, a detailed estimate of the associated costs, and Ps. 1,995 duringan appropriate timeline. Furthermore, the years ended December 31, 2010, 2009employees affected must have been notified of the plan’s main features.
3.19 Post-employment and 2008, respectively.other long-term employee benefits
Labor liabilitiesPost-employment and other long-term employee benefits, which are considered to be monetary items, include obligations for pension and retirement plans, seniority premiums and postretirement medical services, and severance indemnity liabilities other than restructuring, all based on actuarial calculations, using the projected unit
credit method. Costs related
In Mexico and Brazil, the economic benefits and retirement pensions are granted to compensated absences,employees with 10 years of service and minimum age of 60and 65, respectively. In accordance with Mexican Labor Law, the Company provides seniority premium benefits to its employees under certain circumstances. These benefits consist of a one-time payment equivalent to 12 days wages for each year of service (at the employee’s most recent salary, but not to exceed twice the legal minimum wage), payable to all employees with 15 or more years of service, as well as to certain employees terminated involuntarily prior to the vesting of their seniority premium benefit. For qualifying employees, the Company also provides certain post employment healthcare benefits such as vacationsthe medical- surgical services, pharmaceuticals and vacationhospital.
For defined benefit retirement plans and other long-term employee benefits, such as the Company’s sponsored pension and retirement plans, seniority premiums are accrued on a cumulative basis, from which an accrualand postretirement medical service plans, the cost of providing benefits is made.
Labor liabilities are considered to be non-monetary and are determined using long-term assumptions.the projected unit credit method, with actuarial valuations being carried out at the end of each reporting period. All remeasurements of the Company’s defined benefit obligation such as actuarial gains and losses are recognized directly in other comprehensive income (“OCI”). The yearlyCompany presents service costs within cost of labor liabilities is charged togoods sold, administrative and selling expenses in the consolidated income from operations and laborstatements. The Company presents net interest cost within interest expense in the consolidated income statements. The projected benefit obligation recognized in the consolidated statement of past services is recorded as expenses overfinancial position represents the remaining working life periodpresent value of the employees.
defined benefit obligation as of the end of each reporting period. Certain subsidiaries of the Company have established fundsplan assets for the payment of pension benefits, seniority premiums and postretirement medical services through irrevocable trusts of which the employees are named as beneficiaries.beneficiaries, which serve to increase the funded status of such plans’ related obligations.
The Company also provides statutorily mandated severance benefits (termination benefits) to its employees terminated under certain circumstances. Such benefits consist of a one-time payment of three months wages plus 20 days wages for each year of service payable upon involuntary termination without just cause. The Company records a liability for such severance benefits when the event that gives rise to an obligation occurs upon the termination of employment as termination benefits result from either management’s decision to terminate the employment or an employee’s decision to accept an offer of benefits in exchange for termination of employment.
Costs related to compensated absences, such as vacations and vacation premiums, are recognized on an accrual basis.
The Company recognizes a liability and expense for a loss when it is probable that certain effects related to past events, would materialize and could be reasonably estimated. These events and its financial impact are disclosed as loss contingencies intermination benefits at the consolidated financial statements. The Company does not recognize an asset for a gain contingency unless it is certain that will be collected.earlier of the following dates:
| b. | When it recognizes costs for a restructuring and it involves the payment of termination benefits. |
The Company disclosesis demonstrably committed to a termination when, and only when, the entity has a detailed formal plan for the termination and is without realistic possibility of withdrawal.
A settlement occurs when an employer enters into a transaction that eliminates all its commitments regarding material long-lived assets acquisitions, andfurther legal or constructive obligations for part or all contractual obligations (see Note 25 F).of the benefits provided under a defined benefit plan. A curtailment arises from an isolated event such as closing of a plant, discontinuance of an operation or termination or suspension of a plan. Gains or losses on the settlement or curtailment of a defined benefit plan are recognized when the settlement or curtailment occurs.
3.20 Revenue is recognized in accordance with stated shipping terms, as follows:recognition
For Coca-Cola FEMSA salesSales of products are recognized as revenue upon delivery to the customer, and once all the customerfollowing conditions are satisfied:
The Company has takentransferred to the buyer the significant risks and rewards of ownership of the goods.goods;
The Company retains neither continuing managerial involvement to the degree usually associated with ownership nor effective control over the goods sold;
The amount of revenue can be measured reliably;
It is probable that the economic benefits associated with the transaction will flow to the Company; and
The costs incurred or to be incurred in respect of the transaction can be measured reliably.
All of the above conditions are typically met at the point in time that goods are delivered to the customer at the customers’ facilities. Net sales reflect units delivered at list prices reduced by promotional allowances, discounts and the amortization of the agreements with customers to obtain the rights to sell and promote the products of Coca-Cola FEMSA; and
For FEMSA Comercio retail sales, net revenues are recognized when the product is delivered to customers, and customers take possession ofCompany’s products.
During 2007 and 2008, Coca-Cola FEMSA sold certain of its private label brands to The Coca-Cola Company. ProceedsBecause Coca-Cola FEMSA has significant continuing involvement with these brands, proceeds received from The Coca-Cola Company were initially deferred and are being amortized against the related costs of future product sales over the estimated period of such sales. The balance of unearned revenues as of December 31, 20102012 and 20092011 and January 1, 2011 amounted to Ps. 54798, Ps. 302 and Ps. 616,547, respectively. TheAs of December 31, 2012 , 2011 and January 1, 2011 the short-term portions of such amounts are presented as current portion of other currentlong-term liabilities in the consolidated statements of financial position, amounted to Ps. 61, Ps. 197 and Ps. 276, respectively.
Other operating revenues:
Revenue arising from services of sales of waste material and Ps. 203 at December 31, 2010packing of raw materials are recognized in the other operating revenues caption in the consolidated income statement.
The Company recognizes these transactions as revenues in accordance with the requirements established in the IAS 18, delivery of goods and 2009, respectively.rendering of services, which are:
Operating expenses
| b. | It is probable that the economic benefits associated with the transaction will flow to the entity. |
| Interest | income: |
Revenue arising from the use by others of entity assets yielding interest is recognised once all the following conditions are comprisedsatisfied:
The amount of administrativethe revenue can be measured reliably; and
It is probable that the economic benefits associated with the transaction will flow to the entity.
For all financial instruments measured at amortized cost and interest bearing financial assets classified as available for sale, interest income is recorded using the effective interest rate (“EIR”), which is the rate that exactly discounts the estimated future cash receipts through the expected life of the financial instrument or a shorter period, where appropriate, to the net carrying amount of the financial asset. The related interest income is included in the consolidated income statements.
3.21 Administrative and selling expenses. expenses
Administrative expenses include labor costs (salaries and other benefits)benefits, including employee profit sharing (“PTU”)) of employees not directly involved in the sale of the Company’s products, as well as professional service fees, the depreciation of office facilities, and amortization of capitalized information technology system implementation costs and any other similar costs.
Selling expenses include:
Distribution: labor costs (salaries and other related benefits);, outbound freight costs, warehousing costs of finished products, breakage of returnable bottles in the distribution process, depreciation and maintenance of trucks and other distribution facilities and equipment. For the years ended December 31, 2010, 20092012 and 2008,2011, these distribution costs amounted to Ps. 12,774, Ps. 13,39516,839 and Ps. 10,468,14,967, respectively;
Sales: labor costs (salaries and other benefits)benefits, including PTU) and sales commissions paid to sales personnel; and
Marketing: labor costs (salaries and other benefits), promotional expenses and advertising costs.
Other expenses include Employee Profit Sharing (“PTU”), gains or losses on sales of fixed assets, impairment of long-lived assets, contingencies reserves as well as their subsequent interest and penalties, severance payments derived from restructuring programs and all other non-recurring expenses related to activities different from the main activities of the Company that are not recognized as part of the comprehensive financing result.
PTU is applicablepaid by the Company’s Mexican and Venezuelan subsidiaries to Mexico and Venezuela.its eligible employees. In Mexico, employee profit sharing is computed at the rate of 10% of the individual company taxable income, except for considering cumulative dividends received from resident legal persons in Mexico, depreciation of historical rather restated values, foreign exchange gains and losses, which are not included until the asset is disposed of or the liability is due and other effects of inflation are also excluded. In Venezuela, employee profit sharing is computed at a rate equivalent to 15% of after tax income, and it is no more than four months of salary.
According3.22 Income taxes
Income tax expense represents the sum of the tax currently payable and deferred tax. Income taxes are charged to consolidated net income as they are incurred, except when they relate to items that are recognized in other comprehensive income or directly in equity, in which case, the current and deferred tax are also recognized in other comprehensive income or directly in equity, respectively.
3.22.1 Current income taxes
Income taxes are recorded in the results of the year they are incurred.
3.22.2 Deferred income taxes
Deferred tax is recognized on temporary differences between the carrying amounts of assets and liabilities method described in NIF D-4 Income Taxes, the Company does not expect relevant deferred items to materialize. As a result, the Company has not recognized deferred employee profit sharing as of either December 31, 2010, 2009 or 2008.
Severance indemnities resulting from a restructuring program and associated with an ongoing benefit arrangement are charged to other expenses on the date when the decision to dismiss personnel under a formal program or for specific causes is taken.
Income tax is charged to results as incurred as are deferred income taxes. For purposes of recognizing the effects of deferred income taxes in the consolidated financial statements and the Company utilizes both retrospective and prospective analysis over the medium term when more than onecorresponding tax regime exists per jurisdiction and recognizes the amount based on the tax regime it expects to be subject to,bases used in the future.computation of taxable profit. Deferred income taxes assets andtax liabilities are generally recognized for all taxable temporary differences. Deferred tax assets are generally recognized for all deductible temporary differences resulting from comparingto the bookextent that it is probable that taxable profits will be available against which those deductible temporary differences can be utilized and tax values of assets and liabilities plusif any, future benefits from tax loss carryforwards. Deferred incomecarryforwards and certain tax credits. Such deferred tax assets and liabilities are reduced by any benefitsnot recognized if the temporary difference arises from initial recognition of goodwill (no recognition of deferred tax liabilities) or from the initial recognition (other than in a business combination) of other assets and liabilities in a transaction that affects neither the taxable profit nor the accounting profit.
Deferred tax liabilities are recognized for whichtaxable temporary differences associated with investments in subsidiaries, associates, and interests in joint ventures, except where the Company is able to control the reversal of the temporary difference and it is more likely thanprobable that the temporary difference will not reverse in the foreseeable future. Deferred tax assets arising from deductible temporary differences associated with such investments and interests are only recognized to the extent that they are not realizable.
The balanceit is probable that there will be sufficient taxable profits against which to utilize the benefits of deferred taxes is comprised of monetary and non-monetary items, based on the temporary differences from which it is derived. and they are expected to reverse in the foreseeable future.
Deferred income taxes are classified as a long-term asset or liability, regardless of when the temporary differences are expected to reverse.
The Company determines deferred taxes for temporary differencescarrying amount of its permanent investments.
The deferred tax provisionassets is reviewed at the end of each reporting period and reduced to the extent that it is no longer probable that sufficient taxable profits will be available to allow all or part of the asset to be includedrecovered.
Deferred tax assets and liabilities are measured at the tax rates that are expected to apply in the income statementperiod in which the liability is determinedsettled or the asset realized, based on tax rates (and tax laws) that have been enacted or substantively enacted by comparing the end of the reporting period. The measurement of deferred tax balanceliabilities and assets reflects the tax consequences that would follow from the manner in which the Company expects, at the end of the yearreporting period, to recover or settle the balance at the beginningcarrying amount of the year, excluding from both balances any temporary differences that are recorded directly in stockholders’ equity. The deferred taxes related to such temporary differences are recorded in the same stockholders’ equity account that gave rise to them.its assets and liabilities.
Comprehensive financing result includes interest, foreign exchange gain and losses, market value gain or loss on ineffective portion of derivative financial instruments and gain or loss on monetary position, except for those amounts capitalized and those that are recognized as part of the cumulative comprehensive income (loss). The components of the Comprehensive Financing Result are described as follows:
Interest: Interest income and expenses are recorded when earned or incurred, respectively, except for interest capitalized on the financing of long-term assets;
Foreign Exchange Gains and Losses: Transactions in foreign currencies are recorded in local currencies using the exchange rate applicable on the date they occur. Assets and liabilities in foreign currencies are adjusted to the year-end exchange rate, recording the resulting foreign exchange gain or loss directly inIn Mexico, the income statement, excepttax rate is 30% for the foreign exchange gain or loss from the intercompany financing foreign currency denominated balances that2011 and 2012, on 2013 will remain in 30% according with new resolution of Federal Income Law, then in 2014 and 2015 will decrease to 29% and 28%, respectively.
3.23 Share-based payments arrangements
Equity-settled share-based payments to employees are considered to be of a long-term investment nature and the foreign exchange gain or loss from the financing of long-term assets (see Note 4);
Gain or Loss on Monetary Position: The gain or loss on monetary position results from the changes in the general price level of monetary accounts of those subsidiaries that operate in inflationary environments (see Note 5 A), which is determined by applying inflation factors of the country of origin to the net monetary positionmeasured at the beginning of each month and excluding the intercompany financing in foreign currency that is considered as long-term investment because of its nature (see Note 4), as well as the gain or loss on monetary position from long-term liabilities to finance long-term assets, and
Market Value Gain or Loss on Ineffective Portion of Derivative Financial Instruments: Represents the net change in the fair value of the ineffective portion of derivative financialequity instruments at the net change in thegrant date. The fair value determined at the grant date of those derivative financialthe equity-settled share-based payments is expensed and recognized based on the graded vesting method over the vesting period, based on the Company’s estimate of equity instruments that do not meet hedging criteria for accounting purposes; andwill eventually vest, with a corresponding increase in equity. At the net change in the fair valueend of embedded derivative financial instruments.
The Company is exposed to different risks related to cash flows, liquidity, market and credit. As a resulteach reporting period, the Company contractsrevises its estimate of the number of equity instruments expected to vest. The impact of the revision of the original estimates, if any, is recognized in different derivative financial instruments in order to reduce its exposure toprofit or loss such that the risk of exchange rate fluctuations betweencumulative expense reflects the Mexican peso and other currencies, the risk of exchange rate and interest rate fluctuations associatedrevised estimate, with its borrowings denominated in foreign currencies and the exposure to the risk of fluctuation in the costs of certain raw materials.a corresponding adjustment within equity.
3.24 Earnings per share
The Company valuespresents basic and records all derivative financial instruments and hedging activities, including certain derivative financial instruments embedded in other contracts,diluted earnings per share (EPS) data for its shares. Basic EPS is calculated by dividing the net income attributable to controlling interest by the weighted average number of shares outstanding during the period adjusted for the weighted average of own shares purchased in the balance sheet as either an asset or liability measured at fair value, considering quoted prices in recognized markets. If such instruments are not traded in a formal market, fair valueyear. Diluted EPS is determined by applying techniques based upon technical models supported by sufficient, reliable and verifiable market data, recognizedadjusting the weighted average number of shares outstanding including the weighted average of own shares purchased in the financial sector. Changes in the fair value of derivative financial instruments are recorded each year in current earnings or as a component of cumulative other comprehensive income (loss), based on the item being hedged and the ineffectiveness of the hedge.
As of December 31, 2010 and 2009, the balance in other current assets of derivative financial instruments was Ps. 24 and Ps. 26 (see Note 9), and in other assets Ps. 708 and Ps. 481 (see Note 13), respectively. The Company recognized liabilities regarding derivative financial instruments in other current liabilities of Ps. 41 and Ps. 45 (see Note 25 A), as of the end of December 31, 2010 and 2009, respectively, and other liabilities of Ps. 653 and Ps. 553 (see Note 25 B) for the same periods.effects of all potentially dilutive securities, which comprise share rights granted to employees described above.
The Company designates its financial instruments as cash flow hedges at the inception3.25 Issuance of the hedging relationship, when transactions meet all hedging accounting requirements. For cash flow hedges, the effective portion is recognized temporarily in cumulative other comprehensive income (loss) within stockholders’ equity and subsequently reclassified to current earnings at the same time the hedged item is recorded in earnings. When derivative financial instruments do not meet all of the accounting requirements for hedging purposes, the change in fair value is immediately recognized in net income. For fair value hedges, the changes in the fair value are recorded in the consolidated results in the period the change occurs as part of the market value gain or loss on ineffective portion of derivative financial instruments.subsidiary stock
The Company identifies embedded derivatives that should be segregated from the host contract for purposes of valuation and recognition. When an embedded derivative is identified and the host contract has not been stated at fair value the embedded derivative is segregated from the host contract, stated at fair value and is classified as trading. Changes in the fair value of the embedded derivatives at the closing of each period are recognized in the consolidated results.
The cumulative other comprehensive income represents the period net income as described in NIF B-3 “Income Statement,” plus the cumulative translation adjustment resulted from translation of foreign subsidiaries and associates to Mexican pesos and the effect of unrealized gain/loss on cash flow hedges from derivative financial instruments.
| 2010 | 2009 | |||||||
Unrealized gain (loss) on cash flow hedges | Ps. | 140 | Ps. | (896) | ||||
Cumulative translation adjustment | 6 | 2,894 | ||||||
| Ps. | 146 | Ps. | 1,998 | |||||
The changes in the cumulative translation adjustment (“CTA”) were as follows:
| 2010 | 2009 | 2008 | ||||||||||
Initial balance | Ps. | 2,894 | Ps. | (826) | Ps. | (1,337) | ||||||
Recycling of CTA from FEMSA Cerveza business (see Note 2) | (1,418 | ) | — | — | ||||||||
Translation effect | (3,031 | ) | 2,183 | (1,023 | ) | |||||||
Foreign exchange effect from intercompany long-term loans | 1,561 | 1,537 | 1,534 | |||||||||
Ending balance | Ps. | 6 | Ps. | 2,894 | Ps. | (826) | ||||||
The deferred income tax from the cumulative translation adjustment amounted to an asset of Ps. 352 and a liability of Ps. 609 as of December 2010 and 2009, respectively (see Note 24 D).
Provisions are recognized for obligations that result from a past event that will probably result in the use of economic resources and that can be reasonably estimated. Such provisions are recorded at net present values when the effect of the discount is significant. The Company has recognized provisions regarding contingencies and vacations in the consolidated financial statements.
The Company recognizes issuancesthe issuance of a subsidiary’s stock as a capitalan equity transaction. The difference between the book value of the shares issued and the amount contributed by the noncontrolling interest holder or a third party is recorded as additional paid-in capital.
Earnings per share are determined by dividing net controlling interest income by the average weighted number of shares outstanding during the period.
Earnings per share before discontinued operations are calculated by dividing consolidated net income before discontinued operations by the average weighted number of shares outstanding during the period.
Earnings per share from discontinued operations are calculated by dividing net income from discontinued operations by the average weighted number of shares outstanding during the period.
Note 6.4 Mergers, Acquisitions and Disposals.Disposals
4.1 Mergers and Acquisitions
Coca-Cola FEMSAThe Company made certain business mergers and acquisitions that were recorded using the purchase method.acquisition method of accounting. The results of the acquired operations have been included in the consolidated financial statements since Coca-Cola FEMSAthe date on which the Company obtained control of acquired businesses.the business, as disclosed below. Therefore, the consolidated income statements and the consolidated balance sheetsstatements of financial position in the years of such acquisitions are not comparable with periods before acquisition date.previous periods. The consolidated statements of cash flows for the years ended December 31, 20092012 and 20082011 show the merged and acquired operations net of the cash related to those mergers and acquisitions. In 2010
4.1.1 Merger with Grupo Fomento Queretano
On May 4, 2012, Coca-Cola FEMSA completed the Company did not have any significant business combinations.merger of 100% of Grupo Fomento Queretano, S. A. P. I. (“Grupo Fomento Queretano”) a bottler of Coca-Cola trademark products in the state of Queretaro, Mexico. This acquisition was made so as to reinforce Coca-Cola FEMSA’s leadership position in Mexico and Latin America. The transaction involved the issuance of 45,090,375 shares of previously unissued Coca-Cola FEMSA L shares, along with the cash payment prior to closing of Ps. 1,221, in exchange for 100% share ownership of Grupo Fomento Queretano, which was accomplished through a merger. The total purchase price was Ps. 7,496 based on a share price of Ps. 139.22 per share on May 4, 2012. Transaction related costs of Ps. 12 were expensed by Coca-Cola FEMSA as incurred, and recorded as a component of administrative expenses in the accompanying consolidated income statements. Grupo Fomento Queretano was included in operating results from May 2012.
The estimated fair value of the BrisaGrupo Fomento Queretano’s net assets acquired by Coca-Cola FEMSA is as follows:
| 2012 | ||||
Total current assets, including cash acquired of Ps. 107 | Ps. | 445 | ||
Total non-current assets | 2,123 | |||
Distribution rights | ||||
Total assets | 5,489 | |||
Total liabilities | (598 | ) | ||
Net assets acquired | ||||
Goodwill | 2,605 | |||
Total consideration transferred | Ps. | 7,496 | ||
The resultsCompany expects to recover the amount recorded as goodwill through synergies related to the available production capacity. Goodwill has been allocated to Coca-Cola FEMSA’s cash generating unit in Mexico.
Selected income statement information of operation of BrisaGrupo Fomento Queretano for the period from the acquisition throughMay to December 31, 2009 were not material to our consolidated results of operations.
The estimated fair value of the REMIL net assets acquired by Coca-Cola FEMSA2012 is as follows:
Income Statement | 2012 | |||
Total | Ps. | | ||
| ||||
| Ps. | |||
| ||||
| ||||
| ||||
4.1.2 Acquisition of Grupo CIMSA
On December 9, 2011, Coca-Cola FEMSA completed the acquisition of 100% of Corporación de los Angeles, S. A. de C.V. (“Grupo CIMSA”), a bottler of Coca-Cola trademark products, which operates mainly in the states of Morelos and Mexico, as well as in parts of the states of Guerrero and Michoacan, Mexico. This acquisition was also made so as to reinforce Coca-Cola FEMSA’s leadership position in Mexico and Latin America. The transaction involved the issuance of 75,423,728 shares of previously unissued Coca-Cola FEMSA L shares along with the cash payment prior to closing of Ps. 2,100 in exchange for 100% share ownership of Grupo CIMSA, which was accomplished through a merger. The total purchase price was Ps. 11,117 based on a share price of Ps. 119.55 per share on December 9, 2011. Transaction related costs of Ps. 24 were expensed by Coca-Cola FEMSA as incurred, and recorded as a component of administrative expenses in the accompanying consolidated income statements. Grupo CIMSA was included in operating results from December 2011.
The fair value of Grupo CIMSA’s net assets acquired is as follows:
| 2011 Preliminary | Fair Value Adjustments | 2011 Final | ||||||||||
Total current assets, including cash acquired of Ps. 188 | Ps. | 737 | Ps. | (134) | Ps. | 603 | ||||||
Total non-current assets | 2,802 | 253 | 3,055 | |||||||||
Distribution rights | 6,228 | (42 | ) | 6,186 | ||||||||
|
|
|
|
|
| |||||||
Total assets | 9,767 | 77 | 9,844 | |||||||||
Total liabilities | (586 | ) | 28 | (558 | ) | |||||||
|
|
|
|
|
| |||||||
Net assets acquired | 9,181 | 105 | 9,286 | |||||||||
|
|
|
|
|
| |||||||
Goodwill | 1,936 | (105 | ) | 1,831 | ||||||||
|
|
|
|
|
| |||||||
Total consideration transferred | Ps. | 11,117 | Ps. | — | Ps. | 11,117 | ||||||
|
|
|
|
|
| |||||||
The Company expects to recover the amount recorded as goodwill through synergies related to the available production capacity. Goodwill has been allocated to Coca-Cola FEMSA’s cash generating unit in Mexico.
Selected income statement information of Grupo CIMSA for the period from December to December 31, 2011 is as follows:
Income Statement | 2011 | |||
Total revenues | Ps. | 429 | ||
Income before taxes | 32 | |||
Net income | Ps. | 23 | ||
4.1.3 Acquisition of Grupo Tampico
On October 10, 2011, Coca-Cola FEMSA completed the acquisition of 100% of Administradora de Acciones del Noreste, S. A. de C. V. (“Grupo Tampico”) a bottler of Coca-Cola trademark products in the states of Tamaulipas, San Luis Potosí and Veracruz; as well as in parts of the states of Hidalgo, Puebla and Queretaro. This acquisition was made so as to reinforce Coca-Cola FEMSA’s leadership position in Mexico and Latin America. The transaction involved: (i) the issuance of 63,500,000 shares of previously unissued Coca- Cola FEMSA L shares, and (ii) the cash payment of Ps. 2,436, in exchange for 100% share ownership of Grupo Tampico, which was accomplished through a merger. The total purchase price was Ps. 10,264 based on a share price of Ps. 123.27 per share on October 10, 2011. Transaction related costs of Ps. 20 were expensed as incurred, and recorded as a component of administrative expenses in the accompanying consolidated income statements. Grupo Tampico was included in operating results from October 2011.
The fair value of the Grupo Tampico’s net assets acquired is as follows:
| 2011 Preliminary | Fair Value Adjustments | 2011 Final | ||||||||||
Total current assets, including cash acquired of Ps. 22 | Ps. | 461 | Ps. | — | Ps. | 461 | ||||||
Total non-current assets | 2,529 | (17 | ) | 2,512 | ||||||||
Distribution rights | 5,499 | — | 5,499 | |||||||||
|
|
|
|
|
| |||||||
Total assets | 8,489 | (17 | ) | 8,472 | ||||||||
Total liabilities | (804 | ) | 60 | (744 | ) | |||||||
|
|
|
|
|
| |||||||
Net assets acquired | 7,685 | 43 | 7,728 | |||||||||
|
|
|
|
|
| |||||||
Goodwill | 2,579 | (43 | ) | 2,536 | ||||||||
|
|
|
|
|
| |||||||
Total consideration transferred | Ps. | 10,264 | Ps. | — | Ps. | 10,264 | ||||||
|
|
|
|
|
| |||||||
The Company expects to recover the amount recorded as goodwill through synergies related to the available production capacity. Goodwill has been allocated to Coca-Cola FEMSA’s cash generating unit in Mexico.
Selected income statement of Grupo Tampico for the period from October to December 31, 2011 is as follows:
Income statement | 2011 | |||
Total revenues | Ps. | 1,056 | ||
Income before taxes | 43 | |||
Net income | Ps. | 31 | ||
Unaudited Pro Forma Financial Data
The following unaudited consolidated pro forma financial data represent the Company’s historical financial statements, adjusted to give effect to (i) the acquisition of Grupo Tampico, CIMSA and Grupo Fomento Queretano mentioned in the preceding paragraphs; and (ii) certain accounting adjustments mainly related to the pro forma depreciation of fixed assets of the acquired companies.
Below are pro-forma 2012 results as if Grupo Fomento Queretano was acquired on January 1, 2012:
| Grupo Fomento Queretano unaudited pro forma consolidated financial data for the period January 1 - December 31, 2012 | ||||
Total revenues | Ps. | |||
Income before taxes | 27,618 | |||
Net income | 28,104 | |||
Basic net controlling interest income per share Series “B” | 1.03 | |||
Basic net controlling interest income per share Series “D” | Ps. | 1.30 | ||
Below are pro-forma 2011 results as if Grupo Tampico and Grupo CIMSA were acquired on January 1, 2011:
| Grupo Tampico and CIMSA unaudited pro forma consolidated financial data for the period January 1 - December 31, 2011 | ||||
Total revenues | Ps. | 210,760 | ||
Income before taxes | 24,477 | |||
Net income | 21,536 | |||
Basic net controlling interest income per share Series “B” | 0.78 | |||
Basic net controlling interest income per share Series “D” | Ps. | 0.98 | ||
4.2 Disposals
During 2012, gain on sale for shares from the disposal of subsidiaries and investments of associates amounted to Ps. 1,215, primarily related to the sale of the Company’s subsidiary Industria Mexicana de Quimicos, S. A. de C. V., a manufacturer and supplier of cleaning and sanitizing products and services related to food and beverage industrial processes, as well as of water treatment, for an amount of Ps. 975. The Company recognized a gain of Ps. 871, as a sales of shares within other income, which is the difference between the fair value of the consideration received and the book value of the net assets disposed. None of the Company’s other disposals was individually significant. (see Note 19).
5 Cash and Cash Equivalents
For the purposes of the statement of cash flows, cash includes cash on hand and in banks and cash equivalents, which represent short-term investments that are readily convertible to known amounts of cash and which are subject to an insignificant risk of changes in value, with a maturity date of less than three months at their acquisition date. Cash and cash equivalents is comprised as follow:
| December 31, 2012 | December 31, 2011 | January 1, 2011 | ||||||||||
Cash and bank balances | Ps. | 10,577 | Ps. | 8,256 | Ps. | 7,072 | ||||||
Cash equivalents (see Note 3. 5) | 25,944 | 17,585 | 19,633 | |||||||||
|
|
|
|
|
| |||||||
| Ps. | 36,521 | Ps. | 25,841 | Ps. | 26,705 | |||||||
|
|
|
|
|
| |||||||
6 Investments
As of December 31, 2008, Coca-Cola FEMSA has recognized2012 and 2011 investments are classified as available-for-sale and held-to maturity. The carrying value of held-to maturity investments is similar to its fair value. The following is a lossdetail of Ps. 45 as part of the income statement of Coca-Cola FEMSA related to REMIL’s results after its acquisition.available-for-sale and held-to maturity investments.
| 2012 | 2011 | January 1, 2011(2) | ||||||||||
Available-for-Sale(1) | ||||||||||||
Debt Securities | ||||||||||||
|
|
|
|
|
| |||||||
Acquisition cost | Ps. | 10 | Ps. | 326 | Ps. | 66 | ||||||
Unrealized gain recognized in other comprehensive income | 2 | 4 | — | |||||||||
|
|
|
|
|
| |||||||
Fair value | Ps. | 12 | Ps. | 330 | Ps. | 66 | ||||||
|
|
|
|
|
| |||||||
Held-to Maturity(3) | ||||||||||||
Bank Deposits | ||||||||||||
|
|
|
|
|
| |||||||
Acquisition cost | Ps. | 1,579 | Ps. | 993 | Ps. | — | ||||||
Accrued interest | 4 | 6 | — | |||||||||
|
|
|
|
|
| |||||||
Amortized cost | Ps. | 1,583 | Ps. | 999 | Ps. | — | ||||||
|
|
|
|
|
| |||||||
Total investments | Ps. | 1,595 | Ps. | 1,329 | Ps. | 66 | ||||||
|
|
|
|
|
| |||||||
| (1) |
| (2) |
| (3) | Investments contracted in euros at a fixed interest rate. Investments as of December 31, 2012 mature during 2013. |
For the years ended December 31, 2012 and 2011, the effect of the investments in the consolidated income statements under the interest income caption is Ps. 23 and Ps. 37, respectively.
7 Accounts Receivable, Net
| December 31, 2012 | December 31, 2011 | January 1, 2011 | ||||||||||
Trade receivables | Ps. | 7,649 | Ps. | 8,175 | Ps. | 5,739 | ||||||
Allowance for doubtful accounts | (413 | ) | (343 | ) | (249 | ) | ||||||
Current trade customer notes receivable | 434 | 182 | 286 | |||||||||
The Coca-Cola Company (see Note 14) | 1,835 | 1,157 | 1,030 | |||||||||
Loans to employees | 172 | 146 | 111 | |||||||||
Travel advances to employees | 46 | 54 | 51 | |||||||||
Other related parties (see Note 14) | 253 | 283 | 216 | |||||||||
Others | 861 | 844 | 517 | |||||||||
|
|
|
|
|
| |||||||
| Ps. | 10,837 | Ps. | 10,498 | Ps. | 7,701 | |||||||
|
|
|
|
|
| |||||||
7.1 Accounts receivable
Accounts receivable representing rights arising from sales and loans to employees or any other similar concept, are presented net of discounts and the allowance for doubtful accounts.
Coca-Cola FEMSA has accounts receivable from The resultsCoca-Cola Company arising from the latter’s participation in advertising and promotional programs and investment in refrigeration equipment and returnable bottles made by Coca-Cola FEMSA.
The carrying value of operationaccounts receivable approximates its fair value as of BrisaDecember 31, 2012 and 2011 and as of January 1, 2011.
Aging of past due but not impaired
| December 31, 2012 | December 31, 2011 | January 1, 2011 | ||||||||||
60-90 days | Ps. | 242 | Ps. | 25 | Ps. | 78 | ||||||
90-120 days | 69 | 34 | 25 | |||||||||
120+ days | 144 | 30 | 145 | |||||||||
|
|
|
|
|
| |||||||
Average age (days outstanding) | Ps. | 455 | Ps. | 89 | Ps. | 248 | ||||||
|
|
|
|
|
| |||||||
7.2 Movement in the allowance for doubtful accounts
| December 31, 2012 | December 31, 2011 | |||||||
Opening balance | Ps. | 343 | Ps. | 249 | ||||
Allowance for the year | 330 | 146 | ||||||
Charges and write-offs of uncollectible accounts | (232 | ) | (84 | ) | ||||
Restatement of beginning balance in hyperinflationary economies | (28 | ) | 32 | |||||
|
|
|
| |||||
Ending balance | Ps. | 413 | Ps. | 343 | ||||
|
|
|
| |||||
In determining the recoverability of trade receivables, the Company considers any change in the credit quality of the trade receivable from the date credit was initially granted up to the end of the reporting period. The concentration of credit risk is limited due to the customer base being large and unrelated.
Aging of impaired trade receivables (days outstanding)
| December 31, 2012 | December 31, 2011 | January 1, 2011 | ||||||||||
60-90 days | Ps. | 4 | Ps. | 33 | Ps. | 10 | ||||||
90-120 days | 12 | 31 | 17 | |||||||||
120+ days | 397 | 279 | 222 | |||||||||
|
|
|
|
|
| |||||||
Total | Ps. | 413 | Ps. | 343 | Ps. | 249 | ||||||
|
|
|
|
|
| |||||||
7.3 Payments from The Coca-Cola Company
The Coca-Cola Company participates in certain advertising and promotional programs as well as in the Company’s refrigeration equipment and returnable bottles investment program. Contributions received by the Company for advertising and promotional incentives are recognized as a reduction in selling expenses and contributions received for the refrigeration equipment and returnable bottles investment program are recorded as a reduction in the investment in refrigeration equipment and returnable bottles items. Contributions received were Ps. 3,018 and Ps. 2,595 for the years ended December 31, 20092012 and 2008 were not material2011, respectively.
8 Inventories
| December 31, 2012 | December 31, 2011 | January 1, 2011 | ||||||||||
Finished products | Ps. | 9,630 | Ps. | 8,326 | Ps. | 7,192 | ||||||
Raw materials | 4,541 | 3,582 | 2,614 | |||||||||
Spare parts | 978 | 779 | 710 | |||||||||
Work in process | 63 | 82 | 60 | |||||||||
Inventories in transit | 1,118 | 1,529 | 525 | |||||||||
Other | 15 | 62 | 213 | |||||||||
|
|
|
|
|
| |||||||
| Ps. | 16,345 | Ps. | 14,360 | Ps. | 11,314 | |||||||
|
|
|
|
|
| |||||||
For the years ended at 2012 and 2011, the Company recognized write-downs of its inventories for Ps. 793 and Ps. 747 to the Company’s consolidated resultsnet realizable value, respectively.
9 Other Current Assets and Other Current Financial Assets
9.1 Other Current Assets
| December 31, 2012 | December 31, 2011 | January 1, 2011 | ||||||||||
Prepaid expenses | Ps. | 1,108 | Ps. | 1,282 | Ps. | 638 | ||||||
Agreements with customers | 128 | 194 | 90 | |||||||||
Short-term licenses | 47 | 28 | 24 | |||||||||
Other | 51 | 90 | 224 | |||||||||
|
|
|
|
|
| |||||||
| Ps. | 1,334 | Ps. | 1,594 | Ps. | 976 | |||||||
|
|
|
|
|
| |||||||
Prepaid expenses as of operations for those periods. Accordingly, pro forma 2009December 31, 2012 and 2008 financial data considering the acquisition of Brisa2011 and as of January 1, 2008 has not been presented herein.
Note 7. Accounts Receivable.
| 2010 | 2009 | |||||||
Trade | Ps. 5,739 | Ps. 5,162 | ||||||
Allowance for doubtful accounts | (249 | ) | (246 | ) | ||||
The Coca-Cola Company | 1,030 | 1,034 | ||||||
Notes receivable | 402 | 302 | ||||||
Loans to employees | 111 | 104 | ||||||
Travel advances to employees | 51 | 62 | ||||||
Other | 618 | 473 | ||||||
| Ps. 7,702 | Ps. 6,891 | |||||||
The changes in the allowance for doubtful accounts2011 are as follows:
| 2010 | 2009 | 2008 | ||||||||||
Opening balance | Ps. 246 | Ps. 206 | Ps. 170 | |||||||||
Provision for the year | 113 | 91 | 194 | |||||||||
Write-off of uncollectible accounts | (100 | ) | (76 | ) | (157 | ) | ||||||
Translation of foreign currency effect | (10 | ) | 25 | (1 | ) | |||||||
Ending balance | Ps. 249 | Ps. 246 | Ps. 206 | |||||||||
| December 31, 2012 | December 31, 2011 | January 1, 2011 | ||||||||||
Advances for inventories | Ps. | 86 | Ps. | 513 | Ps. | 133 | ||||||
Advertising and promotional expenses paid in advance | 284 | 212 | 203 | |||||||||
Advances to service suppliers | 339 | 258 | 154 | |||||||||
Prepaid leases | 101 | 87 | 84 | |||||||||
Prepaid insurance | 61 | 56 | 27 | |||||||||
Others | 237 | 156 | 37 | |||||||||
|
|
|
|
|
| |||||||
| Ps. | 1,108 | Ps. | 1,282 | Ps. | 638 | |||||||
|
|
|
|
|
| |||||||
Note 8. Inventories.
| 2010 | 2009 | |||||||
Finished products | Ps. 7,437 | Ps. 6,065 | ||||||
Raw materials | 3,164 | 3,020 | ||||||
Spare parts | 710 | 645 | ||||||
Advances to suppliers | 187 | 276 | ||||||
Work in process | 60 | 70 | ||||||
Allowance for obsolescence | (111 | ) | (81 | ) | ||||
| Ps. 11,447 | Ps. 9,995 | |||||||
Note 9. Other Current Assets.
| 2010 | 2009 | |||||||
Long-lived assets available for sale | Ps. 125 | Ps. 326 | ||||||
Advertising and deferred promotional expenses | 207 | 204 | ||||||
Advances to services suppliers | 154 | 253 | ||||||
Prepaid leases | 84 | 79 | ||||||
Agreements with customers | 85 | 96 | ||||||
Derivative financial instruments | 24 | 26 | ||||||
Short-term licenses | 24 | 12 | ||||||
Prepaid insurance | 31 | 24 | ||||||
Financing receivables(1) | — | 171 | ||||||
Other | 171 | 74 | ||||||
| Ps. 905 | Ps. 1,265 | |||||||
The advertisingAdvertising and deferred promotional expenses recorded in the consolidated income statementsstatement for the years ended December 31, 2010, 20092012 and 20082011 amounted to Ps. 4,406 Ps. 3,6294,471 and Ps. 2,600,4,695, respectively.
Note 10. Investments in Shares.9.2 Other Current Financial Assets
Company | %Ownership | 2010 | 2009 | |||||||||
Heineken Group(1) | 20.00% | (2) | 66,478 | — | ||||||||
Coca-Cola FEMSA: | ||||||||||||
Jugos del Valle, S.A.P.I. de C.V.(1) | 19.79% | Ps. 603 | Ps. 1,162 | |||||||||
Sucos del Valle Do Brasil, LTDA(1) | 19.89% | 340 | 325 | |||||||||
Mais Industria de Alimentos, LTDA(1) | 19.89% | 474 | 289 | |||||||||
Holdfab2, LTDA(1) | 27.69% | 300 | — | |||||||||
Industria Envasadora de Querétaro, S.A. de C.V. (“IEQSA”)(1) | 13.45% | 67 | 78 | |||||||||
Industria Mexicana de Reciclaje, S.A. de C.V.(1) | 35.00% | 69 | 76 | |||||||||
Estancia Hidromineral Itabirito, LTDA(1) | 50.00% | 87 | 76 | |||||||||
Beta San Miguel, S.A. de C.V. (“Beta San Miguel”)(3) | 2.54% | 69 | 69 | |||||||||
KSP Partiçipações, LTDA(1) | 38.74% | 93 | 88 | |||||||||
Other | Various | 6 | 7 | |||||||||
Other investments | Various | 207 | 38 | |||||||||
| Ps. 68,793 | Ps. 2,208 | |||||||||||
| December 31, 2012 | December 31, 2011 | January 1, 2011 | ||||||||||
Restricted cash | Ps. | 1,465 | Ps. | 488 | Ps. | 394 | ||||||
Derivative financial instruments | 106 | 530 | 15 | |||||||||
Short term accounts receivable | 975 | — | — | |||||||||
|
|
|
|
|
| |||||||
| Ps. | 2,546 | Ps. | 1,018 | Ps. | 409 | |||||||
|
|
|
|
|
| |||||||
The Company has pledged part of its short-term deposits in order to fulfill the collateral requirements for account payables in different currencies. As of December 31, 2012 and 2011 and as of January 1, 2011, the fair values of the short-term deposit pledged were:
| December 31, 2012 | December 31, 2011 | January 1, 2011 | ||||||||||
Venezuelan bolivars | Ps. | 1,141 | Ps. | 324 | Ps. | 143 | ||||||
Brazilian reais | 183 | 164 | 249 | |||||||||
Colombian pesos | 141 | — | — | |||||||||
Argentine pesos | — | — | 2 | |||||||||
|
|
|
|
|
| |||||||
| Ps. | 1,465 | Ps. | 488 | Ps. | 394 | |||||||
|
|
|
|
|
| |||||||
10 Investments in Associates and Joint Ventures
Details of the Company’s associates at the end of the reporting period are as follows:
Ownership Percentage | Carrying Amount | |||||||||||||||||||||||||||||
Investee | Principal Activity | Place of Incorporation | December 31, 2012 | December 31, 2011 | January 1, 2011 | December 31, 2012 | December 31, 2011 | January 1, 2011 | ||||||||||||||||||||||
Heineken Company(1) (2) | Beverages | The Netherlands | 20.0 | % (3) | 20.0 | % (3) | 20.0 | % (3) | Ps. | 77,484 | Ps. | 74,746 | Ps. | 66,478 | ||||||||||||||||
Coca-Cola FEMSA: | ||||||||||||||||||||||||||||||
Joint ventures: | ||||||||||||||||||||||||||||||
Compañía Panameña de Bebidas, S. A. P. I., S. A. de C. V.(1) (5) | Holding | Panama | 50.0 | % | 50.0 | % | — | 756 | 703 | — | ||||||||||||||||||||
Dispensadoras de Café, S. A. P. I. de C. V.(1) (5) | Services | Mexico | 50.0 | % | 50.0 | % | — | 167 | 161 | — | ||||||||||||||||||||
Estancia Hidromineral Itabirito, LTDA(1) (5) | | Bottling and distribution | | Brazil | 50.0 | % | 50.0 | % | 50.0 | % | 147 | 142 | 87 | |||||||||||||||||
Associates: | ||||||||||||||||||||||||||||||
Promotora Industrial Azucarera, S. A. de C. V. (“PIASA”) (2) | Sugar | Mexico | 26.1 | % | 13.2 | % | — | 1,447 | 281 | — | ||||||||||||||||||||
Industria Envasadora de Querétaro, S. A. de C. V. (“IEQSA”) (2) | Canned | Mexico | 27.9 | % | 19.2 | % | 13.5 | % | 141 | 100 | 67 | |||||||||||||||||||
Industria Mexicana de Reciclaje, S. A. de C. V. | Recycling | Mexico | 35.0 | % | 35.0 | % | 35.0 | % | 74 | 70 | 69 | |||||||||||||||||||
Jugos del Valle, S. A. P. I. de C. V. (2) | Beverages | Mexico | 25.1 | % | 24.0 | % | 19.8 | % | 1,351 | 819 | 603 | |||||||||||||||||||
KSP Partiçipações, LTDA | Beverages | Brazil | 38.7 | % | 38.7 | % | 38.7 | % | 93 | 102 | 93 | |||||||||||||||||||
SABB Sistema de Alimentos e Bebidas Do Brasil, LTDA (2)(4) | Beverages | Brazil | 19.7 | % | 19.7 | % | 19.9 | % | 902 | 931 | 814 | |||||||||||||||||||
Holdfab2 Partiçipações Societárias, LTDA | ||||||||||||||||||||||||||||||
(“Holdfab2”) | Beverages | Brazil | 27.7 | % | 27.7 | % | 27.7 | % | 205 | 262 | 300 | |||||||||||||||||||
Other investments in Coca-Cola FEMSA companies | Various | Various | Various | Various | 69 | 85 | 75 | |||||||||||||||||||||||
FEMSA Comercio: | ||||||||||||||||||||||||||||||
Café del Pacífico, S. A. P. I. de C. V. (Caffenio) (1) (2) | Coffee | Mexico | 40.0 | % | — | — | 459 | — | — | |||||||||||||||||||||
Other investments | Various | Various | Various | Various | 545 | 241 | 207 | |||||||||||||||||||||||
|
|
|
|
|
| |||||||||||||||||||||||||
| Ps. 83,840 | Ps. 78,643 | Ps. 68,793 | ||||||||||||||||||||||||||||
|
|
|
|
|
| |||||||||||||||||||||||||
| (1) | Equity method. |
| (2) | The Company has significant influence |
| As of December 31, |
| (5) | The Company has joint control over this entity’s operating and financial policies. |
In August 2010,On October 1, 2012 FEMSA Comercio acquired a 40% ownership interest in Café del Pacífico, S. A. P.I de C. V., a Mexican coffee producing company for Ps. 462. On the acquisition date, the difference between the cost of its investment and the Company’s share of the net book value and net fair value of the associate’s identifiable assets, liabilities and contingent liabilities was accounted for in accordance with the Company’s accounting policy described in Note 2.3.1.7 and resulted in the identification of amortizable intangible assets, primarily customer lists, step-up adjustments associated with the fair value of acquired fixed assets, including the associated deferred tax impacts as well as goodwill, which is not amortized, all of which are included in the carrying amount of the investment in associates. The Company made adjustments to its share of the associate’s profits after the acquisition date to account for the depreciation of the depreciable assets and amortizable intangible assets based on their fair values at the acquisition date, net of their deferred tax impact and recognized a loss of Ps. 23 associated with its investment in this associate for the period from October 1, 2012 to December 31, 2012.
As mentioned in Note 4, on May 4, 2012 and December 9, 2011, Coca-Cola FEMSA completed the acquisition of 100% of Grupo FOQUE and Grupo CIMSA. As part of the acquisition of Grupo FOQUE and Grupo CIMSA, the Company also acquired a 26.1% equity interest in Promotora Industrial Azucarera, S. A. de C. V.
During 2012 the Company made an additional equity investment in Jugos del Valle, S. A. de C. V. for Ps. 469. The funds were mainly used by Jugos del Valle to acquire Santa Clara (a non-carbonated beverage Company).
On March 28, 2011 Coca-Cola FEMSA made an initial investment followed by subsequent increases in the investment for approximately Ps. 295 (R$40 million)620 together with The Coca-Cola Company in Holdfab2 Participações Societárias, LTDA representing 27.69%. Holdfab2 has Compañía 50%Panameña de Bebidas S. A. P. I. de C. V. (Grupo Estrella Azul), a Panamanian conglomerate in the dairy and juice-based beverage categories business in Panama. The investment in Leao Junior, a tea producer company in Brazil.
During 2010, the shareholders of Jugos del Valle, including Coca-Cola FEMSA agreed to spin-offrepresents
50% of ownership.
On March 17, 2011, a consortium of investors formed by FEMSA, the distribution rights. This distributionMacquarie Mexican Infrastructure Fund and other investors, acquired Energía Alterna Istmeña, S. de R. L. de C. V. (“EAI”), and Energía Eólica Mareña, S. A. de C. V. (“EEM”), from subsidiaries of Preneal, S. A. (“Preneal”). EAI and EEM are the owners of a 396 megawatt late-stage wind energy project in the southeastern region of the State of Oaxaca. On February 23, 2012, a wholly-owned subsidiary of Mitsubishi Corporation, and Stichting Depositary PGGM Infrastructure Funds, a pension fund managed by PGGM, acquired the 45% interest held by FEMSA in the parent companies of the Mareña Renovables Wind Power Farm. The sale of FEMSA’s participation as an investor resulted in a decrease of Coca-Cola FEMSA’s investment in sharesgain of Ps. 735933. Certain subsidiaries of FEMSA, FEMSA Comercio and an increaseCoca-Cola FEMSA have entered into 20-year wind power supply agreements with the Mareña Renovables Wind Power Farm to its intangible assets (distribution rightspurchase some of a separate legal entity) for the same amount.energy output produced by it. These agreements will remain in full force and effect.
As of December 31, 2010, the Company owns an economic interest of 20% of Heineken Group (see Note 2). Heineken’s main activities are the production, distribution and marketing of beer worldwide. The Company recognized an equity income of Ps. 3,3198,311 and Ps. 4,880, net of taxes regarding to its interest in Heineken for the period from May 1, 2010 toyears ended December 31, 2010.2012 and 2011, respectively.
The following is some relevantSummarized financial information fromin respect of the associate Heineken as of December 31, 2010 andaccounted for under the condensated results for the full year as of December 31, 2010:equity method is set out below.
| ||||
| ||||
| ||||
| ||||
| ||||
| ||||
| ||||
| ||||
| ||||
| ||||
| ||||
| ||||
| ||||
| ||||
| ||||
| ||||
| ||||
| ||||
| December 31, 2012 | December 31, 2011 | January 1, 2011 | ||||||||||
Total current assets | €. | 5,537 | €. | 4,708 | €. | 4,318 | ||||||
Total non-current assets | 30,442 | 22,419 | 22,344 | |||||||||
Total current liabilities | 7,800 | 6,159 | 5,623 | |||||||||
Total non-current liabilities | 15,417 | 10,876 | 10,819 | |||||||||
Total revenue and other income | €. | 19,893 | €. | 17,187 | ||||||||
Total cost and expenses | 16,202 | 14,972 | ||||||||||
Net income | 3,109 | 1,560 | ||||||||||
|
|
|
| |||||||||
As of December 31, 20102012 and 2011 and as of January 1, 2011 fair value of FEMSA’sCompany’s investment in Heineken N.V. Holding and Heineken N.V. represented by shares equivalent to 20% of its outstanding shares amounted to Ps. 66,980€ 5,425, € 3,942 million and € 4,048 million based on quoted market prices of that date.those dates. As of April 8, 2013, approval date of these consolidated financial statements, fair value amounted to € 6,248 million.
Note 11. Property, PlantDuring the years ended December 31, 2012 and Equipment.2011, the Company received dividends distributions from Heineken, amounted to Ps. 1,697 and Ps. 1,661, respectively.
Summarized financial information in respect of Coca-Cola FEMSA associates and joint ventures accounted for under the equity method is set out below.
| 2010 | 2009 | |||||||
Land | Ps. 5,226 | Ps. 5,412 | ||||||
Buildings, machinery and equipment | 51,003 | 51,645 | ||||||
Accumulated depreciation | (24,041 | ) | (25,538 | ) | ||||
Refrigeration equipment | 9,829 | 9,180 | ||||||
Accumulated depreciation | (5,849 | ) | (6,016 | ) | ||||
Investment in fixed assets in progress (see Note 5 I) | 3,164 | 3,024 | ||||||
Long-lived assets stated at net realizable value | 232 | 330 | ||||||
Other long-lived assets | 292 | 332 | ||||||
| Ps. 39,856 | Ps. 38,369 | |||||||
| December 31, 2012 | December 31, 2011 | January 1, 2011 | ||||||||||
Total current assets | Ps. | 8,569 | Ps. | 8,129 | Ps. | 7,164 | ||||||
Total non-current assets | 14,639 | 12,941 | 8,649 | |||||||||
Total current liabilities | 5,340 | 5,429 | 2,306 | |||||||||
Total non-current liabilities | 2,457 | 2,208 | 1,433 | |||||||||
Total revenue | Ps. | 18,796 | Ps. | 18,183 | ||||||||
Total cost and expenses | 17,776 | 16,987 | ||||||||||
Net income | 781 | 1,046 | ||||||||||
|
|
|
| |||||||||
AsThe Company’s share of other comprehensive income of associates that may be reclassified to consolidated net income, net of taxes as of December 31, 20102012 and 2009, the Company has identified long-term assets investments of Ps. 1,929 and Ps. 845, respectively that are not ready for their intended use and met the definition of qualified assets for comprehensive financing result capitalization, which amounted to Ps. 66 and Ps. 55. As of December 31, 2008, the capitalization of the comprehensive financing result did not have a significant impact on the consolidated financial statements.
The changes in the carrying amount of the capitalized comprehensive financial result2011 are as follows:
| 2010 | 2009 | |||||||
Beginning balance | Ps. 55 | Ps. — | ||||||
Capitalization of comprehensive financial result | 12 | 55 | ||||||
Amortization | (1 | ) | — | |||||
Ending balance | Ps. 66 | Ps. 55 | ||||||
| 2012 | 2011 | |||||||
Valuation of the effective portion of derivative financial instruments | Ps. | 113 | Ps. | 94 | ||||
Exchange differences on translating foreign operations | 183 | (1,253 | ) | |||||
Remeasurements of the net defined benefit liability | (1,077 | ) | (236) | |||||
|
|
|
| |||||
| Ps. | (781) | Ps. | (1,395) | |||||
|
|
|
| |||||
The Company has identified certain long-lived assets that are not strategic to the current
11 Property, Plant and future operations of the business and are not being used, comprised of land, buildings and equipment, in accordance with an approved program for the disposal of certain investments. Such long-lived assets have been recorded at their estimated net realizable value without exceeding their acquisition cost, as follows:
Coca-Cola FEMSA Other subsidiaries Buildings Land Equipment 2010 2009 Ps. 189 Ps. 288 43 42 Ps. 232 Ps. 330 Ps. 64 Ps. 88 139 60 29 182 Ps. 232 Ps. 330
Cost | Land | Buildings | Machinery and Equipment | Refrigeration Equipment | Returnable Bottles | Investments in Fixed Assets in Progress | Leasehold Improvements | Other | Total | |||||||||||||||||||||||||||
Cost as of January 1, 2011 | Ps. | 4,006 | Ps. | 10,273 | Ps. | 32,600 | Ps. | 8,462 | Ps. | 2,930 | Ps. | 3,082 | Ps. | 7,270 | Ps. | 629 | Ps. | 69,252 | ||||||||||||||||||
Additions | 233 | 271 | 3,348 | 960 | 1,236 | 5,849 | 45 | 104 | 12,046 | |||||||||||||||||||||||||||
Additions from business combinations | 597 | 1,103 | 2,309 | 314 | 183 | 202 | — | — | 4,708 | |||||||||||||||||||||||||||
Transfer of completed projects in progress | 23 | 379 | 2,542 | 421 | 521 | (5,162 | ) | 1,277 | (1 | ) | — | |||||||||||||||||||||||||
Transfer to assets classified as held for sale | 111 | 144 | (13 | ) | — | — | — | — | (68 | ) | 174 | |||||||||||||||||||||||||
Disposals | (58 | ) | (15 | ) | (2,315 | ) | (325 | ) | (901 | ) | 5 | (331 | ) | (162 | ) | (4,102 | ) | |||||||||||||||||||
Effects of changes in foreign exchange rates | 141 | 414 | 981 | 536 | 143 | 76 | 12 | 82 | 2,385 | |||||||||||||||||||||||||||
Changes in value on the recognition of inflation effects | 91 | 497 | 1,155 | 268 | 3 | 50 | — | 11 | 2,075 | |||||||||||||||||||||||||||
Capitalization of borrowing costs | — | — | 17 | — | — | — | — | — | 17 | |||||||||||||||||||||||||||
|
|
|
|
|
|
|
|
|
|
|
|
|
|
|
|
|
| |||||||||||||||||||
Cost as ofDecember 31, 2011 | Ps. | 5,144 | Ps. | 13,066 | Ps. | 40,624 | Ps. | 10,636 | Ps. | 4,115 | Ps. | 4,102 | Ps. | 8,273 | Ps. | 595 | Ps. | 86,555 | ||||||||||||||||||
|
|
|
|
|
|
|
|
|
|
|
|
|
|
|
|
|
| |||||||||||||||||||
Cost | ||||||||||||||||||||||||||||||||||||
Cost as of January 1, 2012 | Ps. | 5,144 | Ps. | 13,066 | Ps. | 40,624 | Ps. | 10,636 | Ps. | 4,115 | Ps. | 4,102 | Ps. | 8,273 | Ps. | 595 | Ps. | 86,555 | ||||||||||||||||||
Additions | 329 | 415 | 4,607 | 1,176 | 1,434 | 6,511 | 186 | 186 | 14,844 | |||||||||||||||||||||||||||
Additions from business combinations | 206 | 390 | 486 | 84 | 18 | — | — | — | 1,184 | |||||||||||||||||||||||||||
Adjustments of fair value of past business combinations | 57 | 312 | (462 | ) | (39 | ) | (77 | ) | — | (1 | ) | — | (210 | ) | ||||||||||||||||||||||
Transfer of completed projects in progress | 137 | 339 | 1,721 | 901 | 765 | (5,183 | ) | 1,320 | — | — | ||||||||||||||||||||||||||
Transfer to assets classified as held for sale | — | — | (34 | ) | — | — | — | — | — | (34 | ) | |||||||||||||||||||||||||
Disposals | (82 | ) | (131 | ) | (963 | ) | (591 | ) | (324 | ) | (14 | ) | (100 | ) | (69 | ) | (2,274 | ) | ||||||||||||||||||
Effects of changes in foreign exchange rates | (107 | ) | (485 | ) | (2,051 | ) | (451 | ) | (134 | ) | (28 | ) | (60 | ) | (41 | ) | (3,357 | ) | ||||||||||||||||||
Changes in value on the recognition of inflation effects | 85 | 471 | 1,138 | 275 | 17 | (31 | ) | — | 83 | 2,038 | ||||||||||||||||||||||||||
Capitalization of borrowing costs | — | — | 16 | — | — | — | — | — | 16 | |||||||||||||||||||||||||||
Cost as of December 31, 2012 | Ps. | 5,769 | Ps. | 14,377 | Ps. | 45,082 | Ps. | 11,991 | Ps. | 5,814 | Ps. | 5,357 | Ps. | 9,618 | Ps. | 754 | Ps. | 98,762 | ||||||||||||||||||
|
|
|
|
|
|
|
|
|
|
|
|
|
|
|
|
|
| |||||||||||||||||||
Accumulated Depreciation | ||||||||||||||||||||||||||||||||||||
Accumulated Depreciation as of January 1, 2011 | Ps. | (3,347) | Ps. | (15,829) | Ps. | (4,778) | Ps. | (478) | Ps. | — | Ps. | (2,464) | Ps. | (174) | Ps. | (27,070) | ||||||||||||||||||||
Depreciation for the year | (328 | ) | (2,985 | ) | (948 | ) | (853 | ) | Ps. | — | (533 | ) | (47 | ) | (5,694 | ) | ||||||||||||||||||||
Transfer (to) assets classified as held for sale | (41 | ) | (3 | ) | — | — | — | — | — | (44 | ) | |||||||||||||||||||||||||
Disposals | 6 | 2,146 | 154 | 335 | 298 | 67 | 3,006 | |||||||||||||||||||||||||||||
Effects of changes in foreign exchange rates | (171 | ) | (525 | ) | (270 | ) | (35 | ) | — | — | (29 | ) | (1,030 | ) | ||||||||||||||||||||||
Changes in value on the recognition of inflation effects | (280 | ) | (653 | ) | (202 | ) | — | — | — | (25 | ) | (1,160 | ) | |||||||||||||||||||||||
|
|
|
|
|
|
|
|
|
|
|
|
|
|
|
| |||||||||||||||||||||
Accumulated Depreciation as of December 31, 2011 | Ps. | (4,161) | Ps. | (17,849) | Ps. | (6,044) | Ps. | (1,031) | — | Ps. | (2,699) | Ps. | (208) | Ps. | (31,992) | |||||||||||||||||||||
|
|
|
|
|
|
|
|
|
|
|
|
|
|
|
| |||||||||||||||||||||
Accumulated Depreciation Accumulated Depreciation as of January 1, 2012 Ps. (31,992) Depreciation for the year Transfer (to) assets classified as held for sale Disposals Effects of changes in foreign exchange rates Changes in value on the recognition of inflation effects Accumulated Depreciation as of December 31, 2012 As a result of selling certain not strategic long-lived assets, the Company recognized a loss of Ps. 41, gains of Ps. 6 and Ps. 1 for Buildings Machinery
and
Equipment Refrigeration
Equipment Returnable
Bottles Investments
in Fixed
Assets in
Progress Leasehold
Improvements Other Total Ps. (4,161) Ps. (17,849) Ps. (6,044) Ps. (1,031) Ps. — Ps. (2,699) Ps. (208) (361) (3,781) (1,173) (1,149) (639) (72) (7,175) 1 10 — — — — (26) (15) 158 951 492 200 — 94 1 1,896 200 749 303 (5) — 68 (5) 1,310 (288) (641) (200) (3) — — (5) (1,137) Ps. (4,451) Ps. (20,561) Ps. (6,622) Ps. (1,988) Ps. — Ps. (3,176) Ps. (315) Ps. (37,113)
Carrying Amount | Land | Buildings | Machinery and Equipment | Refrigeration Equipment | Returnable Bottles | Investments in Fixed Assets in Progress | Leasehold Improvements | Other | Total | |||||||||||||||||||||||||||
As of January 1, 2011 | Ps. | 4,006 | Ps. | 6,926 | Ps. | 16,771 | Ps. | 3,684 | Ps. | 2,452 | Ps. | 3,082 | Ps. | 4,806 | Ps. | 455 | Ps. | 42,182 | ||||||||||||||||||
|
|
|
|
|
|
|
|
|
|
|
|
|
|
|
|
|
| |||||||||||||||||||
As of December 31, 2011 | 5,144 | 8,905 | 22,775 | 4,592 | 3,084 | 4,102 | 5,574 | 387 | 54,563 | |||||||||||||||||||||||||||
|
|
|
|
|
|
|
|
|
|
|
|
|
|
|
|
|
| |||||||||||||||||||
As of December 31, 2012 | 5,769 | 9,926 | 24,521 | 5,369 | 3,826 | 5,357 | 6,442 | 439 | 61,649 | |||||||||||||||||||||||||||
|
|
|
|
|
|
|
|
|
|
|
|
|
|
|
|
|
| |||||||||||||||||||
During the years ended December 31, 2010, 20092012 and 2008,2011 the Company capitalized Ps. 16 and Ps. 17, respectively of borrowing costs in relation to Ps. 196 and Ps. 256 in qualifying assets, respectively. The rates used to determine the amounts of borrowing costs eligible for capitalization were 4.3% and 5.8%, respectively.
Long-lived assets thatFor the years ended December 31, 2012 and 2011 interest expense, interest income and net foreign exchange losses (gains) are available for sale have been reclassified fromanalyzed as follows:
| 2012 | 2011 | |||||||
Interest expense, interest income and foreign exchange losses (gains) | Ps. | 1,937 | Ps. | 325 | ||||
Amount capitalized(1) | 38 | 185 | ||||||
|
|
|
| |||||
Net amount in consolidated income statements | Ps. | 1,899 | Ps. | 140 | ||||
|
|
|
| |||||
| (1) | Amount capitalized in property, plant and equipment and amortized intangible assets. |
Commitments to acquisitions of property, plant and equipment to other current assets. As ofare disclosed in Note 25.
12 Intangible Assets, Net
Cost | Rights to Produce and Distribute Coca-Cola Trademark Products | Goodwill | Other Indefinite Lived Intangible Assets | Total Unamortized Intangible Assets | Technology Costs and Management Systems | Systems in Development | Alcohol Licenses | Other | Total Amortized Intangible Assets | Total Intangible Assets | ||||||||||||||||||||||||||||||
Balance as of January 1, 2011 | Ps. | 41,173 | Ps. | — | Ps. | 386 | Ps. | 41,559 | Ps. | 1,627 | Ps. | 1,389 | Ps. | 499 | Ps. | 226 | Ps. | 3,741 | Ps. | 45,300 | ||||||||||||||||||||
Purchases | — | — | 9 | 9 | 221 | 300 | 61 | 48 | 630 | 639 | ||||||||||||||||||||||||||||||
Acquisition from business combinations | 11,878 | 4,515 | — | 16,393 | 66 | 3 | — | — | 69 | 16,462 | ||||||||||||||||||||||||||||||
Transfer of completed development systems | — | — | — | — | 261 | (261 | ) | — | — | — | — | |||||||||||||||||||||||||||||
Effect of movements in exchange rates | 1,072 | — | — | 1,072 | 30 | — | — | 7 | 37 | 1,109 | ||||||||||||||||||||||||||||||
Changes in value on the recognition of inflation effect | 815 | — | — | 815 | — | — | — | — | — | 815 | ||||||||||||||||||||||||||||||
Capitalization of borrowing costs | — | — | — | — | 168 | — | — | — | 168 | 168 | ||||||||||||||||||||||||||||||
|
|
|
|
|
|
|
|
|
|
|
|
|
|
|
|
|
|
|
| |||||||||||||||||||||
Balance as of December 31, 2011 | Ps. | 54,938 | Ps. | 4,515 | Ps. | 395 | Ps. | 59,848 | Ps. | 2,373 | Ps. | 1,431 | Ps. | 560 | Ps. | 281 | Ps. | 4,645 | Ps. | 64,493 | ||||||||||||||||||||
|
|
|
|
|
|
|
|
|
|
|
|
|
|
|
|
|
|
|
| |||||||||||||||||||||
Cost | ||||||||||||||||||||||||||||||||||||||||
Balance as of January 1, 2012 | Ps. | 54,938 | Ps. | 4,515 | Ps. | 395 | Ps. | 59,848 | Ps. | 2,373 | Ps. | 1,431 | Ps. | 560 | Ps. | 281 | Ps. | 4,645 | Ps. | 64,493 | ||||||||||||||||||||
Purchases | — | — | 6 | 6 | 35 | 90 | 166 | 106 | 397 | 403 | ||||||||||||||||||||||||||||||
Acquisition from business combinations | 2,973 | 2,605 | 5,578 | — | — | — | — | — | 5,578 | |||||||||||||||||||||||||||||||
Internally developed | — | — | — | — | — | 38 | — | — | 38 | 38 | ||||||||||||||||||||||||||||||
Adjustments of fair value of past business combinations | (42 | ) | (148 | ) | — | (190 | ) | — | — | — | — | — | (190 | ) | ||||||||||||||||||||||||||
Transfer of completed development systems | — | — | — | — | 559 | (559 | ) | — | — | — | — | |||||||||||||||||||||||||||||
Disposals | — | — | (62 | ) | (62 | ) | (7 | ) | — | — | — | (7 | ) | (69 | ) | |||||||||||||||||||||||||
Effect of movements in exchange rates | (478 | ) | — | — | (478 | ) | (97 | ) | (3 | ) | — | (3 | ) | (103 | ) | (581 | ) | |||||||||||||||||||||||
Changes in value on the recognition of inflation effects | (121 | ) | — | — | (121 | ) | — | — | — | — | — | (121 | ) | |||||||||||||||||||||||||||
Capitalization of borrowing costs | — | — | — | — | — | 22 | — | — | 22 | 22 | ||||||||||||||||||||||||||||||
|
|
|
|
|
|
|
|
|
|
|
|
|
|
|
|
|
|
|
| |||||||||||||||||||||
Balance as of December 31, 2012 | Ps. | 57,270 | Ps. | 6,972 | Ps. | 339 | Ps. | 64,581 | Ps. | 2,863 | Ps. 1,019 | Ps. | 726 | Ps. | 384 | Ps. 4,992 | Ps. 69,573 | |||||||||||||||||||||||
|
|
|
|
|
|
|
|
|
|
|
|
|
|
|
|
|
|
|
| |||||||||||||||||||||
Amortization Impairment | ||||||||||||||||||||||||||||||||||||||||
Balance as of January 1, 2011 | Ps. — | Ps. — | Ps. — | Ps. — | Ps. (914) | Ps. — | Ps. (87) | Ps. (46) | Ps. (1,047) | Ps. (1,047) | ||||||||||||||||||||||||||||||
Amortization expense | — | — | — | (187) | — | (27) | (41) | (255) | (255) | |||||||||||||||||||||||||||||||
Impairment losses | — | — | (103) | (103) | — | — | — | (43) | (43) | (146) | ||||||||||||||||||||||||||||||
Effect of movements in exchange rates | — | — | — | — | (15) | — | — | — | (15) | (15) | ||||||||||||||||||||||||||||||
|
|
|
|
|
|
|
|
|
|
|
|
|
|
|
|
|
|
|
| |||||||||||||||||||||
Balance as of December 31, 2011 | Ps. | — | Ps. | — | Ps. | (103) | Ps. | (103) | Ps. | (1,116) | Ps. | — | Ps. | (114) | Ps. | (130) | Ps. | (1,360) | Ps. | (1,463) | ||||||||||||||||||||
|
|
|
|
|
|
|
|
|
|
|
|
|
|
|
|
|
|
|
| |||||||||||||||||||||
Amortization and Impairment Losses Balance as of January 1, 2012 Amortization expense Disposals Effect of movements in exchange rates (3) 62 Balance as of December 31, 2012 Carrying Amount As of January 1, 2011 As of December 31, 2011 As of December 31, 2012 Rights to
Produce and
Distribute
Coca-Cola
Trademark
Products Goodwill Other
Indefinite
Lived
Intangible
Assets Total
Unamortized
Intangible
Assets Technology
Costs and
Management
Systems Systems in
Development Alcohol
Licenses Other Total
Amortized
Intangible
Assets Total
Intangible
Assets Ps. — Ps. — Ps. (103) Ps. (103) Ps. (1,116) Ps. — Ps. (114) Ps. (130) Ps. (1,360) Ps. (1,463) — — — — (202) — (36) (66) (304) (304) — — — — 25 — — — 25 25 — — — — 65 — — 62 Ps. — Ps. — Ps. (103) Ps. (103) Ps. (1,228) Ps. — Ps. (150) Ps. (199) Ps. (1,577) Ps. (1,680) Ps. 41,173 Ps. — Ps. 386 Ps. 41,559 Ps. 713 Ps. 1,389 Ps. 412 Ps. 180 Ps. 2,694 Ps. 44,253 54,938 4,515 292 59,745 1,257 1,431 446 151 3,285 63,030 57,270 6,972 236 64,478 1,635 1,019 576 185 3,415 67,893
During the years ended December 31, 20102012 and 2009, long-lived2011 the Company capitalized Ps. 22 and Ps. 168, respectively of borrowing costs in relation to Ps. 674 and Ps. 1,761 in qualifying assets, availablerespectively. The rates used to determine the amounts of borrowing costs eligible for salecapitalization were 4.3% and 5.8%, respectively.
For the year ended in December 31, 2012, the amortization of intangible assets is recognized in cost of goods sold, selling expenses and administrative expenses and amounted to Ps. 1253, Ps. 97 and Ps. 326 (see Note 9).204, respectively.
Note 12. Intangible Assets.For the year ended in December 31, 2011, the amortization of intangible assets is recognized in cost of goods sold, selling expenses and administrative expenses and amounted to Ps. 4, Ps. 100 and Ps. 151, respectively.
The remaining period for the Company’s intangible assets that are subject to amortization is as follows:
| 2010 | 2009 | |||||||
Unamortized intangible assets: | ||||||||
Coca-Cola FEMSA: | ||||||||
Rights to produce and distribute Coca-Cola trademark products | Ps. | 49,169 | Ps. | 49,520 | ||||
Other unamortized intangible assets | 462 | 623 | ||||||
| Ps. | 49,631 | Ps. | 50,143 | |||||
Amortized intangible assets: | ||||||||
Systems in development costs | Ps. | 1,898 | Ps. | 1,188 | ||||
Technology costs and management systems | 286 | 310 | ||||||
Alcohol licenses (see Note 5 K) | 410 | 223 | ||||||
Other | 115 | 128 | ||||||
| Ps. | 2,709 | Ps. | 1,849 | |||||
Total intangible assets | Ps. | 52,340 | Ps. | 51,992 | ||||
| Years | ||||
Technology Costs and Management Systems | 9-11 | |||
Alcohol Licenses | 11 | |||
Coca-Cola FEMSA impairment Tests for Cash-Generating Units Containing Goodwill
For the purpose of impairment testing, goodwill and distribution rights are allocated and monitored on an individual country basis, which is considered to be the CGU.
The changes in theaggregate carrying amountamounts of unamortized intangible assetsgoodwill and distribution rights allocated to each CGU are as follows:
| 2010 | 2009 | |||||||
Beginning balance | Ps. | 50,143 | Ps. | 47,514 | ||||
Acquisitions | 833 | 698 | ||||||
Cancellations | (151 | ) | — | |||||
Impairment | (10 | ) | — | |||||
Translation and restatement of foreign currency effect | (1,184 | ) | 1,931 | |||||
Ending balance | Ps. | 49,631 | Ps. | 50,143 | ||||
| December 31, 2012 | December 31, 2011 | |||||||
Mexico | Ps. | 47,492 | Ps. | 42,099 | ||||
Guatemala | 299 | 325 | ||||||
Nicaragua | 407 | 459 | ||||||
Costa Rica | 1,114 | 1,201 | ||||||
Panama | 781 | 839 | ||||||
Colombia | 6,387 | 6,240 | ||||||
Venezuela | 3,236 | 2,941 | ||||||
Brazil | 4,416 | 5,169 | ||||||
Argentina | 110 | 180 | ||||||
|
|
|
| |||||
Total | Ps. | 64,242 | Ps. | 59,453 | ||||
|
|
|
| |||||
Throughout the year, total goodwill mainly increased due to the acquisition of the Fomento Queretano “FOQUE.”
Goodwill and distribution rights are tested for impairments annually. The recoverable amounts of the CGUs are based on value-in-use calculations. Value in use was determined by discounting the future cash flows generated from the continuing use of the reporting unit using a discount rate.
The changes inkey assumptions used for the carrying amount of amortized intangible assetsvalue-in-use calculations are as follows:
| Investments | Amortization | |||||||||||||||||||
| Accumulated at the Beginning of the Year | Additions | Accumulated at the Beginning of the Year | For the Year | Total | ||||||||||||||||
2010 | ||||||||||||||||||||
Systems in development costs | Ps. | 1,188 | Ps. 751 | Ps. | — | Ps. | (41) | Ps. | 1,898 | |||||||||||
Technology costs and management systems | 1,327 | 76 | (1,017 | ) | (100 | ) | 286 | |||||||||||||
Alcohol licenses(1) | 271 | 224 | (48 | ) | (37 | ) | 410 | |||||||||||||
2009 | ||||||||||||||||||||
Systems in development costs | Ps | 333 | Ps. 855 | Ps. | — | Ps. | — | Ps. | 1,188 | |||||||||||
Technology costs and management systems | 968 | 359 | (667 | ) | (350 | ) | 310 | |||||||||||||
Alcohol licenses(1) | 169 | 102 | (31 | ) | (17 | ) | 223 | |||||||||||||
2008 | ||||||||||||||||||||
Systems in development costs | Ps. | — | Ps. 333 | Ps. | — | Ps. | — | Ps. | 333 | |||||||||||
Technology costs and management systems | 853 | 115 | (521 | ) | (146 | ) | 301 | |||||||||||||
Alcohol licenses(1) | 110 | 59 | (23 | ) | (8 | ) | 138 | |||||||||||||
Cash flows were projected based on actual operating results and the five-year business plan. Cash flows for a further five-year were forecasted maintaining the same stable growth and margins per country of the last year base. Coca-Cola FEMSA believes that this forecasted period is justified due to the non-current nature of the business and past experiences.
Cash flows after the first ten-year period were extrapolated using a perpetual growth rate equal to the expected annual population growth, in order to calculate the terminal recoverable amount.
A per CGU-specific Weighted Average Cost of Capital (“WACC”) was applied as a hurdle rate to discount cash flows to get the recoverable amount of the units.
The values assigned to the key assumptions used for the value in use calculations are as follows:
CGU | WACC Real | Expected Annual Long-Term Inflation 2013-2023 | Expected Volume Growth Rates 2013-2023 | |||||||||
Mexico | 5.5 | % | 3.6 | % | 2.8 | % | ||||||
Colombia | 5.8 | % | 3.0 | % | 6.1 | % | ||||||
Venezuela | 11.3 | % | 25.8 | % | 2.8 | % | ||||||
Costa Rica | 7.7 | % | 5.7 | % | 2.8 | % | ||||||
Guatemala | 8.1 | % | 5.3 | % | 4.0 | % | ||||||
Nicaragua | 9.5 | % | 6.6 | % | 5.1 | % | ||||||
Panama | 7.7 | % | 4.6 | % | 3.6 | % | ||||||
Argentina | 10.7 | % | 10.0 | % | 4.2 | % | ||||||
Brazil | 5.5 | % | 5.8 | % | 3.8 | % | ||||||
|
|
|
|
|
| |||||||
The values assigned to the key assumptions represent management’s assessment of future trends in the industry and are based on both external sources and internal sources (historical data). Coca-Cola FEMSA consistently applied its methodology to determine CGU specific WACC’s to perform its annual impairment testing.
Sensitivity to Changes in Assumptions
Coca-Cola FEMSA performed an additional impairment sensitivity calculation, taking into account an adverse change of a 100 basis point in the key assumptions noted above, and concluded that no impairment would be recorded.
CGU | Change in WACC | Change in Volume Growth Rate | Effect on Valuation | |||||||||
Mexico | +1.0 | % | -1.0 | % | Passes by 3.4x | |||||||
Colombia | +1.0 | % | -1.0 | % | Passes by 6.2x | |||||||
Venezuela | +1.0 | % | -1.0 | % | Passes by 8.1x | |||||||
Costa Rica | +1.0 | % | -1.0 | % | Passes by 3.2x | |||||||
Guatemala | +1.0 | % | -1.0 | % | Passes by 7.0x | |||||||
Nicaragua | +1.0 | % | -1.0 | % | Passes by 4.4x | |||||||
Panama | +1.0 | % | -1.0 | % | Passes by 7.5x | |||||||
Argentina | +1.0 | % | -1.0 | % | Passes by 103x | |||||||
Brazil | +1.0 | % | -1.0 | % | Passes by 12.6x | |||||||
13 Other Assets, Net and Other Financial Assets
13.1 Other assets, net
| December 31, 2012 | December 31, 2011 | January 1, 2011 | ||||||||||
Agreement with customers, net | Ps. | 278 | Ps. | 256 | Ps. | 186 | ||||||
Long term prepaid advertising expenses | 78 | 113 | 125 | |||||||||
Guarantee deposits(1) | 953 | 948 | 897 | |||||||||
Prepaid bonuses | 117 | 97 | 84 | |||||||||
Advances in acquisitions of property, plant and equipment | 973 | 362 | 227 | |||||||||
Recoverable taxes | 93 | 353 | 152 | |||||||||
Others | 331 | 269 | 351 | |||||||||
|
|
|
|
|
| |||||||
| Ps. | 2,823 | Ps. | 2,398 | Ps. | 2,022 | |||||||
|
|
|
|
|
| |||||||
| (1) |
The estimated amortization for intangible13.2 Other financial assets of definite life is as follows:
| 2011 | 2012 | 2013 | 2014 | 2015 | ||||||||||||||||
Systems amortization | Ps. 347 | Ps. 346 | Ps. 302 | Ps. 276 | Ps. 267 | |||||||||||||||
Alcohol licenses | 33 | 43 | 56 | 73 | 95 | |||||||||||||||
Others | 25 | 40 | 32 | 26 | 22 | |||||||||||||||
Note 13. Other Assets.
| 2010 | 2009 | |||||||
Leasehold improvements-net | Ps. 5,261 | Ps. 4,401 | ||||||
Agreements with customers (see Note 5 J) | 186 | 260 | ||||||
Derivative financial instruments | 708 | 481 | ||||||
Guarantee deposits | 897 | 859 | ||||||
Long-term accounts receivable | 371 | 214 | ||||||
Advertising and promotional expenses | 125 | 106 | ||||||
Long-term financing receivables(1) | — | 12,209 | ||||||
Other | 955 | 835 | ||||||
| Ps. 8,503 | Ps. 19,365 | |||||||
Long-term accounts receivables are comprised of Ps. 337 and Ps. 34 of principal and interests, and are expected to be collected as follows:
2011 | Ps. | 7 | ||
2012 | 72 | |||
2013 | 93 | |||
2014 | 197 | |||
2015 and thereafter | 2 | |||
| Ps. | 371 | |||
| December 31, 2012 | December 31, 2011 | January 1, 2011 | ||||||||||
Long term accounts receivable | Ps. | 1,110 | Ps. | 1,895 | Ps. | 681 | ||||||
Derivative financial instruments | 1,144 | 850 | 707 | |||||||||
|
|
|
|
|
| |||||||
| Ps. | 2,254 | Ps. | 2,745 | Ps. | 1,388 | |||||||
|
|
|
|
|
| |||||||
Note 14.14 Balances and Transactions with Related Parties and Affiliated Companies.Companies
Balances and transactions with related parties and affiliated companies include consideration of: a) the overall business in which the reporting entity participates; b) close family members of key officers; and c) any fund created in connection with a labor related compensation plan.
On April 30, 2010,between the Company lost control over FEMSA Cervezaand its subsidiaries, which became a subsidiary of Heineken Group. As a result, balances and transactions with Heineken Group and subsidiaries are presented since that date as balances and transactions with related parties. Balances and transactions prior to that date are not disclosed because they were not transactions between related parties of the Company.Company, have been eliminated on consolidation and are not disclosed in this note. Details of transactions between the Company and other related parties are disclosed as follows:
The consolidated balance sheetsstatements of financial position and consolidated income statementsstatement include the following balances and transactions with related parties and affiliated companies:
Balances | 2010 | 2009 | ||||||
Due from The Coca-Cola Company (see Note 5 M)(1) | Ps. 1,030 | Ps. 1,034 | ||||||
Balance with BBVA Bancomer, S.A. de C.V.(2) | 2,944 | 4,474 | ||||||
Due from Grupo Financiero Banamex, S.A. de C.V.(2) | 2,103 | — | ||||||
Due from Heineken Group(1) | 425 | — | ||||||
Other receivables(1) | 295 | 58 | ||||||
Due to BBVA Bancomer, S.A. de C.V.(3) | 999 | 4,112 | ||||||
Due to The Coca-Cola Company(4) | 1,911 | 2,405 | ||||||
Due to Grupo Financiero Banamex, S.A. de C.V.(3) | 500 | 500 | ||||||
Due to British American Tobacco México(4) | 287 | 186 | ||||||
Due to Heineken Group(4) | 1,463 | — | ||||||
Other payables(4) | 210 | 345 | ||||||
| December 31, 2012 | December 31, 2011 | January 1, 2011 | ||||||||||
Balances | ||||||||||||
Due from The Coca-Cola Company (see Note 7)(1)(8) | Ps. | 1,835 | Ps. | 1,157 | Ps. | 1,030 | ||||||
Balance with BBVA Bancomer, S.A. de C.V.(2) | 2,299 | 2,791 | 2,944 | |||||||||
Balance with Grupo Financiero Banamex, S.A. de C.V.(2) | — | — | 2,103 | |||||||||
Due from Heineken Company(1)(6) | 462 | 857 | 425 | |||||||||
Due from Grupo Estrella Azul(3)(7) | 828 | 825 | — | |||||||||
Other receivables(1) | 211 | 505 | 295 | |||||||||
|
|
|
|
|
| |||||||
Due to BBVA Bancomer, S.A. de C.V.(4) | Ps. | 1,136 | Ps. | 1,076 | Ps. | 960 | ||||||
Due to The Coca-Cola Company(5)(8) | 4,088 | 2,853 | 1,911 | |||||||||
Due to Caffenio(5)(6) | 144 | — | — | |||||||||
Due to Grupo Financiero Banamex, S.A. de C.V.(4) | — | — | 500 | |||||||||
Due to British American Tobacco Mexico(5) | 395 | 316 | 287 | |||||||||
Due to Heineken Company(5)(6) | 1,939 | 2,148 | 1,463 | |||||||||
Other payables(5) | 488 | 524 | 210 | |||||||||
|
|
|
|
|
| |||||||
| (1) |
| (2) |
| (3) |
| (4) | Recorded |
| (5) | Recorded within accounts payable. |
| (6) | Associates. |
| (7) | Joint venture. |
| (8) | Non controlling interest. |
Balances due from related parties are considered to be recoverable. Accordingly, for the years ended December 31, 2012 and 2011, there was no expense resulting from the uncollectibility of balances due from related parties.
Transactions Income: Logistic services to Heineken Group Administrative services to Heineken Group Logistic services to Grupo Industrial Saltillo, S.A. de C.V. Sales of Grupo Inmobiliario San Agustín, S.A. shares to Instituto Tecnológico y de Estudios Superiores de Monterrey, A.C. Other revenues from related parties Expenses: Purchase of concentrate from The Coca-Cola Company(1) Purchase of beer from Heineken Group(1) (2) Purchase of baked goods and snacks from Grupo Bimbo, S.A.B. de C.V.(2) Purchase of cigarettes from British American Tobacco México(2) Advertisement expense paid to The Coca-Cola Company(1) Purchase of juices from Jugos del Valle, S.A. de C.V.(1) (2) Interest expense and fees paid to BBVA Bancomer, S.A. de C.V. Purchase of sugar from Beta San Miguel(1) Purchase of sugar, cans and aluminum lids from Promotora Mexicana de Embotelladores, S.A. de C.V.(1) Purchase of canned products from IEQSA(1) Advertising paid to Grupo Televisa, S.A.B. Interest expense paid to Grupo Financiero Banamex, S.A. de C.V. Insurance premiums for policies with Grupo Nacional Provincial, S.A.B. Donations to Instituto Tecnológico y de Estudios Superiores de Monterrey, A.C. Purchase of plastic bottles from Embotelladora del Atlántico, S.A. (formerly Complejo Industrial Pet, S.A.) (1) Donations to Difusión y Fomento Cultural, A.C. Interest expense paid to The Coca-Cola Company(1) Other expenses with related parties Transactions Income: Services to Heineken Company (1) Logistic services to Grupo Industrial Saltillo, S.A. de C.V. (4) Sales of Grupo Inmobiliario San Agustin, S.A. shares to Instituto Tecnologico y de Estudios Superiores de Monterrey, A.C. (4) Logistic services to Jugos del Valle (1) Other revenues from related parties Expenses: Purchase of concentrate from The Coca-Cola Company (3) Purchases of raw material, beer and operating expenses from Heineken Company (1) Purchase of coffee from Caffenio (1) Purchase of baked goods and snacks from Grupo Bimbo, S.A.B. de C.V. (4) Purchase of cigarettes from British American Tobacco Mexico (4) Advertisement expense paid to The Coca-Cola Company (3)(5) Purchase of juices from Jugos del Valle, S.A.P.I. de C.V. (1) Interest expense and fees paid to BBVA Bancomer, S.A. de C.V. (4) Purchase of sugar from Beta San Miguel (4) Purchase of sugar, cans and aluminum lids from Promotora Mexicana de Embotelladores, S.A. de C.V. (4) Purchase of canned products from IEQSA (1) Advertising paid to Grupo Televisa, S.A.B. (4) Interest expense paid to Grupo Financiero Banamex, S.A. de C.V. (4) Insurance premiums for policies with Grupo Nacional Provincial, S.A.B. (4) Donations to Instituto Tecnológico y de Estudios Superiores de Monterrey, A.C. (4) Donations to Fundación FEMSA, A.C. (4) Purchase of plastic bottles from Embotelladora del Atlántico, S.A. (formerly Complejo Industrial Pet, S.A.) (4) Purchase of juice and milk powder from Grupo Estrella Azul (2) Donations to Difusión y Fomento Cultural, A.C. (4) Interest expense paid to The Coca-Cola Company (3) Other expenses with related parties 2010 2009 2008 Ps. 706 Ps. — Ps. — 342 — — 241 234 252 62 64 66 42 22 9 19,371 16,863 13,518 7,063 — — 2,018 1,733 1,578 1,883 1,413 1,439 1,117 780 931 1,332 1,044 863 108 260 235 1,307 713 687 684 783 525 196 208 333 37 13 20 56 61 50 69 78 57 63 72 49 52 54 42 29 18 29 5 25 27 31 42 30 2012 2011 Ps. 2,979 Ps. 2,169 242 241 391 — 431 — 341 469 Ps. 23,886 Ps. 20,882 11,013 9,397 342 — 2,394 2,270 2,342 1,964 1,052 872 1,985 1,564 205 128 1,439 1,397 711 701 483 262 124 86 — 28 57 59 109 81 864 46 99 56 — 60 29 21 24 7 389 321
| (1) |
| (2) |
| (3) | Non controlling interest. |
| (4) | Members of |
| (5) | Net of the contributions from The Coca-Cola Company of Ps. 3,018 and Ps. 2,595, for the years ended in 2012 and 2011, respectively. |
Commitments with related parties
Related Party | Commitment | Amount | Conditions | |||||||
Heineken Company | Supply | Ps. | — | Supply of all beer products in Mexico’s | ||||||
| OXXO stores. The contract may be renewed for five years on additional periods. At the end of the contract OXXO will not hold exclusive contract with another supplier of beer for the next 3 years. Commitment term, Jan 1st, 2010 to Jun 30, 2020. | ||||||||||
| Ps. | — | |||||||||
The benefits and aggregate compensation paid to executive officers and senior management of FEMSA and its subsidiariesthe Company were as follows:
| 2010 | 2009 | 2008 | ||||||||||
Short- and long-term benefits paid | Ps. 1,307 | Ps. 1,206 | Ps. 1,083 | |||||||||
Severance indemnities | 34 | 47 | 10 | |||||||||
Postretirement benefits (labor cost) | 83 | 23 | 23 | |||||||||
| 2012 | 2011 | |||||||
Short-term employee benefits paid | Ps. | 1,022 | Ps. | 998 | ||||
Postemployment benefits | 161 | 117 | ||||||
Termination benefits | 13 | 13 | ||||||
Share based payments | 275 | 253 | ||||||
Note 15.15 Balances and Transactions in Foreign Currencies.Currencies
According to NIF B-15, assets,Assets, liabilities and transactions denominated in foreign currencies are those realized in a currency different than the recording, functional or reporting currency of each reporting unit.subsidiary of the Company. As of the end of and for the years ended on December 31, 20102012 and 2009,2011 and as of January 1, 2011, assets, liabilities and transactions denominated in foreign currencies, expressed in Mexican pesos are as follows:
| 2010 | 2009 | |||||||||||||||||||||||
| U.S. Dollars | Other Currencies | Total | U.S. Dollars | Other Currencies | Total | |||||||||||||||||||
Assets: | ||||||||||||||||||||||||
Short-term | Ps. | 11,761 | Ps. | 480 | Ps. | 12,241 | Ps. 6,186 | Ps. — | Ps. 6,186 | |||||||||||||||
Long-term | 321 | — | 321 | 263 | — | 263 | ||||||||||||||||||
Liabilities: | ||||||||||||||||||||||||
Short-term | 1,501 | 247 | 1,748 | 1,562 | 17 | 1,579 | ||||||||||||||||||
Long-term | 6,962 | — | 6,962 | 2,878 | — | 2,878 | ||||||||||||||||||
Transactions | U.S. Dollars | Other Currencies | Total | U.S. Dollars | Other Currencies | Total | ||||||||||||||||||
Total revenues | Ps. | 1,111 | Ps. | — | Ps. | 1,111 | Ps. 1,128 | Ps. — | Ps. 1,128 | |||||||||||||||
Expenses and investments: | ||||||||||||||||||||||||
Purchases of raw materials | 5,648 | — | 5,648 | 7,300 | — | 7,300 | ||||||||||||||||||
Interest expense | 13 | — | 13 | 149 | — | 149 | ||||||||||||||||||
Consulting fees | 452 | 24 | 476 | 101 | — | 101 | ||||||||||||||||||
Assets acquisitions | 311 | — | 311 | 183 | 12 | 195 | ||||||||||||||||||
Other | 804 | 3 | 807 | 721 | — | 721 | ||||||||||||||||||
| Ps. | 7,228 | Ps. | 27 | Ps. | 7,255 | Ps. 8,454 | Ps. 12 | Ps. 8,466 | ||||||||||||||||
| Assets | Liabilities | |||||||||||||||
| Balances | �� | Short-Term | Long-Term | Short-Term | Long-Term | |||||||||||
As of December 31, 2012 | ||||||||||||||||
U.S. dollars | Ps. | 21,236 | Ps. | 912 | Ps. | 6,588 | Ps. | 14,493 | ||||||||
Euros | — | — | 38 | — | ||||||||||||
Other currencies | 8 | — | 75 | 250 | ||||||||||||
|
|
|
|
|
|
|
| |||||||||
Total | Ps. | 21,244 | Ps. | 912 | Ps. | 6,701 | Ps. | 14,743 | ||||||||
|
|
|
|
|
|
|
| |||||||||
As of December 31, 2011 | ||||||||||||||||
U.S. dollars | Ps. | 13,756 | Ps. 1,049 | Ps. 2,325 | Ps. 7,199 | |||||||||||
Euros | 18 | — | 41 | — | ||||||||||||
Other currencies | — | — | 164 | 445 | ||||||||||||
|
|
|
|
|
|
|
| |||||||||
Total | Ps. | 13,774 | Ps. 1,049 | Ps. | 2,530 | Ps. | 7,644 | |||||||||
|
|
|
|
|
|
|
| |||||||||
As of January 1, 2011 | ||||||||||||||||
U.S. dollars | Ps. | 11,761 | Ps. | 321 | Ps. | 1,501 | Ps. | 6,402 | ||||||||
Euros | — | — | 245 | — | ||||||||||||
Other currencies | 480 | — | 490 | 560 | ||||||||||||
|
|
|
|
|
|
|
| |||||||||
Total | Ps. | 12,241 | Ps. | 321 | Ps. | 2,236 | Ps. | 6,962 | ||||||||
|
|
|
|
|
|
|
| |||||||||
As
| Incomes | Expenses | |||||||||||||||||||||||||||||||
Transactions | Revenues | Disposal Shares | Other Revenues | Purchases of Raw Materials | Interest Expense | Consulting Fees | Assets Acquisitions | Other | ||||||||||||||||||||||||
For the year ended December 31, 2012 | ||||||||||||||||||||||||||||||||
U.S. dollars | Ps. 1,631 | Ps. 1,127 | Ps. 717 | Ps. 12,016 | Ps. 380 | Ps. 13 | Ps. | 154 | Ps. | 1,585 | ||||||||||||||||||||||
Euros | — | — | — | — | — | — | 32 | 10 | ||||||||||||||||||||||||
Other currencies | — | — | — | — | — | — | — | 68 | ||||||||||||||||||||||||
|
|
|
|
|
|
|
|
|
|
|
|
|
|
|
| |||||||||||||||||
Total | Ps. 1,631 | Ps. 1,127 | Ps. 717 | Ps. 12,016 | Ps. 380 | Ps. 13 | Ps.186 | Ps. 1,663 | ||||||||||||||||||||||||
|
|
|
|
|
|
|
|
|
|
|
|
|
|
|
| |||||||||||||||||
For the year ended December 31, 2011 | ||||||||||||||||||||||||||||||||
U.S. dollars | Ps. 1,067 | Ps. — | Ps. 497 | Ps. 9,424 | Ps. 319 | Ps. 11 | Ps. 306 | Ps. | 1,075 | |||||||||||||||||||||||
Euros | — | — | — | — | — | — | — | — | ||||||||||||||||||||||||
Other currencies | — | — | 2 | — | 5 | — | — | 90 | ||||||||||||||||||||||||
|
|
|
|
|
|
|
|
|
|
|
|
|
|
|
| |||||||||||||||||
Total | Ps. 1,067 | Ps. — | Ps. 499 | Ps. 9,424 | Ps. 324 | Ps. 11 | Ps. | 306 | Ps. | 1,165 | ||||||||||||||||||||||
|
|
|
|
|
|
|
|
|
|
|
|
|
|
|
| |||||||||||||||||
Mexican peso exchange rates in effect at the dates of June 27, 2011, issuancethe consolidated statements of financial position and at the approval date of thesethe Company’s consolidated financial statements the exchange rate published by “Banco de México” was Ps.11.8816 Mexican pesos per one U.S. Dollar,were as follows:
| December 31, | January 1, | April 8, | ||||||||||||||
| 2012 | 2011 | 2011 | 2013 | |||||||||||||
U.S. dollar | 13.0101 | 13.9787 | 12.3817 | 12.3197 | ||||||||||||
Euro | 17.0889 | 18.0454 | 16.3881 | 15.8131 | ||||||||||||
|
|
|
|
|
|
|
| |||||||||
16 Post-Employment and the foreign currency position was similar to that as of December 31, 2010.
Note 16. Labor Liabilities.Other Long-Term Employee Benefits
The Company has various labor liabilities for employee benefits in connection with pension, seniority post retirementand post-retirement medical and severance benefits. Benefits vary depending upon country.the country where the individual employees are located. Presented below is a discussion of the Company’s labor liabilities in Mexico, Brazil and Venezuela, which comprise the substantial majority of those recorded in the consolidated financial statements.
16.1 Assumptions
The Company annually evaluates the reasonableness of the assumptions used in its labor liabilitiesliability for post-employment and other non-current employee benefits computations.
Actuarial calculations for pension and retirement plans, seniority premiums postretirementand post-retirement medical services and severance indemnity liabilities,benefits, as well as the associated cost for the period, were determined using the following long-term assumptions:assumptions for non-hyperinflationary countries:
| Nominal Rates(1) | Real Rates(2) | |||||||||||||||||||||||||
| 2010 | 2009 | 2008 | 2010 | 2009 | 2008 | |||||||||||||||||||||
Annual discount rate | 7.6 | % | 8.2 | % | 8.2 | % | 4.0 | % | 4.5 | % | 4.5 | % | ||||||||||||||
Salary increase | 4.8 | % | 5.1 | % | 5.1 | % | 1.2 | % | 1.5 | % | 1.5 | % | ||||||||||||||
Return on assets | 8.2 | % | 8.2 | % | 11.3 | % | 3.6 | % | 4.5 | % | 4.5 | % | ||||||||||||||
Measurement date: December 2010 | ||||||||||||||||||||||||||
Mexico | December 31, 2012 | December 31, 2011 | January 1, 2011 | |||||||||
Financial: | ||||||||||||
Discount rate used to calculate the defined benefit obligation | 7.10 | % | 7.64 | % | 7.64 | % | ||||||
Salary increase | 4.79 | % | 4.79 | % | 4.79 | % | ||||||
Future pension increases | 3.50 | % | 3.50 | % | 3.50 | % | ||||||
Healthcare cost increase rate | 5.10 | % | 5.10 | % | 5.10 | % | ||||||
Biometric: | ||||||||||||
Mortality(1) | EMSSA 82-89 | EMSSA 82-89 | EMSSA 82-89 | |||||||||
Disability(2) | IMSS - 97 | IMSS - 97 | IMSS - 97 | |||||||||
Normal retirement age | 60 years | 60 years | 60 years | |||||||||
Employee turnover table(3) | BMA R 2007 | BMA R 2007 | BMA R 2007 | |||||||||
Measurement date December:
| (1) |
| (2) | IMSS. Mexican Experience of Instituto Mexicano del Seguro Social. |
| (3) | BMAR. Actuary experience. |
Brazil | December 31, 2012 | December 31, 2011 | January 1, 2011 | |||||||||
Financial: | ||||||||||||
Discount rate used to calculate the defined benefit obligation | 9.30 | % | 9.70 | % | 9.70 | % | ||||||
Salary increase | 5.00 | % | 5.00 | % | 5.00 | % | ||||||
Future pension increases | 4.00 | % | 4.00 | % | 4.00 | % | ||||||
Biometric: | ||||||||||||
Mortality(1) | UP84 | UP84 | UP84 | |||||||||
Disability(2) | IMSS - 97 | IMSS - 97 | IMSS - 97 | |||||||||
Normal retirement age | 65 years | 65 years | 65 years | |||||||||
Employee turnover table | Brazil | Brazil | Brazil | |||||||||
Measurement date December:
| (1) | UP84. Unisex mortality table. |
| (2) | IMSS. Mexican Experience of Instituto Mexicano del Seguro Social. |
Venezuela is a hyper-inflationary economy. The actuarial calculations for post-employment benefit (termination indemnity), as well as the associated cost for the period, were determined using the following long-term assumptions which are “real” assumptions (excluding inflation):
Venezuela | December 31, 2012 | |||
Financial: | ||||
Discount rate used to calculate the defined benefit obligation | 1.50 | % | ||
Salary increase | 1.50 | % | ||
Biometric: | ||||
Mortality(1) | EMSSA 82-89 | |||
Disability(2) | IMSS - 97 | |||
Normal retirement age | 65 years | |||
Employee turnover table(3) | BMA R 2007 | |||
Measurement date December:
| (1) | EMSSA. Mexican Experience of social security. |
| (2) |
| (3) | BMAR. Actuary experience. |
The basis forIn Mexico the determinationmethodology used to determine the discount rate was the Yield or Internal Rate of the long-term rate of return is supported byReturn (“IRR”) which involves a historical analysis of average returns in real terms for the last 30 years of the Certificados de Tesorería del Gobierno Federal (Mexican Federal Government Treasury Certificates) for Mexican investments, treasury bonds of each country for other investments andyield curve. In this case, the expected rates of long-term returnseach period were taken from a yield curve of Mexican Federal Government Treasury Bond (known as CETES in Mexico).
In Brazil the actual investmentsmethodology used to determine the discount rate was the Yield or Internal Rate of Return (“IRR”) which involves a yield curve. In this case, the Company.expected rates of each period were taken from a yield curve of fixed long term bonds of Federal Republic of Brazil.
In Venezuela the methodology used to determine the discount rate started with reference to the interest rate bonds of similar denomination issued by the Republic of Venezuela, with subsequent consideration of other economic assumptions appropriate for hyper-inflationary economy. Ultimately, the discount rates disclosed in the table below are calculated in real terms (without inflation).
The annual growth rate for health care expenses is 5.1% in nominal terms, consistent withIn Mexico upon retirement, the historical average health care expense rateCompany purchases an annuity for the past 30 years. Such rate is expectedemployee, which will be paid according to remain consistent for the foreseeable future.option chosen by the employee.
Based on these assumptions, the amounts of benefits expected benefits to be paid out in the following years are as follows:
| Pension and Retirement Plans | Seniority Premiums | Postretirement Medical Services | Severance Indemnities | Pension and Retirement Plans | Seniority Premiums | Post Retirement Medical Services | Post- employment (Venezuela) | Total | ||||||||||||||||||||||||||||
2011 | Ps. 390 | Ps. 11 | Ps. 12 | Ps. 104 | ||||||||||||||||||||||||||||||||
2012 | 163 | 10 | 11 | 83 | ||||||||||||||||||||||||||||||||
2013 | 190 | 10 | 11 | 76 | Ps.472 | Ps.20 | Ps.14 | Ps.37 | Ps.543 | |||||||||||||||||||||||||||
2014 | 190 | 12 | 11 | 73 | 256 | 19 | 13 | 27 | 315 | |||||||||||||||||||||||||||
2015 | 197 | 13 | 11 | 69 | 261 | 21 | 13 | 21 | 316 | |||||||||||||||||||||||||||
2016 to 2021 | 1,181 | 91 | 45 | 299 | ||||||||||||||||||||||||||||||||
2016 | 234 | 23 | 13 | 18 | 288 | |||||||||||||||||||||||||||||||
2017 | 345 | 26 | 13 | 17 | 401 | |||||||||||||||||||||||||||||||
2018 to 2022 | 1,738 | 175 | 55 | 79 | 2,047 | |||||||||||||||||||||||||||||||
|
|
|
|
| ||||||||||||||||||||||||||||||||
| Balances of the |
| 2010 | 2009 | |||||||
Pension and Retirement Plans: | ||||||||
Vested benefit obligation | Ps. | 1,461 | Ps. | 1,146 | ||||
Non-vested benefit obligation | 1,080 | 875 | ||||||
Accumulated benefit obligation | 2,541 | 2,021 | ||||||
Excess of projected benefit obligation over accumulated benefit obligation | 757 | 591 | ||||||
Defined benefit obligation | 3,298 | 2,612 | ||||||
Pension plan funds at fair value | (1,501 | ) | (1,144 | ) | ||||
Unfunded defined benefit obligation | 1,797 | 1,468 | ||||||
Labor cost of past services(1) | (349 | ) | (365 | ) | ||||
Unrecognized actuarial (loss) gain, net | (272 | ) | 72 | |||||
Total | Ps. | 1,176 | Ps. | 1,175 | ||||
Seniority Premiums: | ||||||||
Vested benefit obligation | Ps. | 12 | Ps. | 3 | ||||
Non-vested benefit obligation | 93 | 98 | ||||||
Accumulated benefit obligation | 105 | 101 | ||||||
Excess of projected benefit obligation over accumulated benefit obligation | 49 | 65 | ||||||
Unfunded defined benefit obligation | 154 | 166 | ||||||
Unrecognized actuarial gain (loss), net | 17 | (17 | ) | |||||
Total | Ps. | 171 | Ps. | 149 | ||||
Postretirement Medical Services: | ||||||||
Vested benefit obligation | Ps. | 119 | Ps. | 94 | ||||
Non-vested benefit obligation | 112 | 97 | ||||||
Defined benefit obligation | 231 | 191 | ||||||
Medical services funds at fair value | (43 | ) | (39 | ) | ||||
Unfunded defined benefit obligation | 188 | 152 | ||||||
Labor cost of past services(1) | (4 | ) | (6 | ) | ||||
Unrecognized actuarial (loss), net | (102 | ) | (81 | ) | ||||
Total | Ps. | 82 | Ps. | 65 | ||||
Severance Indemnities: | ||||||||
Accumulated benefit obligation | Ps. | 462 | Ps. | 447 | ||||
Excess of projected benefit obligation over accumulated benefit obligation | 91 | 88 | ||||||
Defined benefit obligation | 553 | 535 | ||||||
Labor cost of past services(1) | (99 | ) | (148 | ) | ||||
Total | Ps. | 454 | Ps. | 387 | ||||
Total labor liabilities | Ps. | 1,883 | Ps. | 1,776 | ||||
| December 31, 2012 | December 31, 2011 | January 1, 2011 | ||||||||||
Pension and Retirement Plans: | ||||||||||||
Defined benefit obligation | Ps. | 4,495 | Ps. | 3,972 | Ps. | 3,297 | ||||||
Pension plan funds at fair value | (2,043 | ) | (1,927 | ) | (1,501 | ) | ||||||
|
|
|
|
|
| |||||||
Net defined benefit liability | 2,452 | 2,045 | 1,796 | |||||||||
Effect due to asset ceiling | 105 | 127 | 199 | |||||||||
|
|
|
|
|
| |||||||
Net defined benefit liability after asset ceiling | Ps. | 2,557 | Ps. | 2,172 | Ps. | 1,995 | ||||||
|
|
|
|
|
| |||||||
Seniority Premiums: | ||||||||||||
Defined benefit obligation | Ps. | 324 | Ps. | 241 | Ps. | 154 | ||||||
Seniority premium plan funds at fair value | (18 | ) | (19 | ) | — | |||||||
|
|
|
|
|
| |||||||
Net defined benefit liability | Ps. | 306 | Ps. | 222 | Ps. | 154 | ||||||
|
|
|
|
|
| |||||||
Postretirement Medical Services: | ||||||||||||
Defined benefit obligation | Ps. | 267 | Ps. | 235 | Ps. | 232 | ||||||
Medical services funds at fair value | (49 | ) | (45 | ) | (43 | ) | ||||||
|
|
|
|
|
| |||||||
Net defined benefit liability | Ps. | 218 | Ps. | 190 | Ps. | 189 | ||||||
|
|
|
|
|
| |||||||
Post-employment: | ||||||||||||
Defined benefit obligation | Ps. | 594 | Ps. | — | Ps. | — | ||||||
Post-employment plan funds at fair value | — | — | — | |||||||||
|
|
|
| |||||||||
Net defined benefit liability (asset) | Ps. | 594 | Ps. | — | Ps. | — | ||||||
|
|
|
|
|
| |||||||
Total post-employment and other long-term employee benefits | Ps. | 3,675 | Ps. | 2,584 | Ps. | 2,338 | ||||||
|
|
|
|
|
| |||||||
The net defined benefit liability of the pension and retirement plan includes an asset generated in Brazil (the following information is included in the consolidated information of the tables above), which is as follows:
| December 31, 2012 | December 31, 2011 | January 1, 2011 | ||||||||||
Defined benefit obligation | Ps.313 | Ps.370 | Ps.345 | |||||||||
Pension plan funds at fair value | (589 | ) | (616 | ) | (595 | ) | ||||||
|
|
|
|
|
| |||||||
Net defined benefit asset | (276 | ) | (246 | ) | (250 | ) | ||||||
Effect due to asset ceiling | 105 | 127 | 199 | |||||||||
|
|
|
|
|
| |||||||
Net defined benefit asset after asset ceiling | Ps.(171 | ) | Ps.(119 | ) | Ps.(51 | ) | ||||||
|
|
|
|
|
| |||||||
The accumulated actuarial gains and losses were generated by the differences in the assumptions used for the actuarial calculations at the beginning of the year versus the actual behavior of those variables at the end of the year.
| Trust |
Trust assets consist of fixed and variable return financial instruments recorded at market value. The trust assetsvalue, which are invested as follows:
| 2010 | 2009 | |||||||||||||||||||
Type of Instrument | December 31, 2012 | December 31, 2011 | January 1, 2011 | |||||||||||||||||
Fixed return: | ||||||||||||||||||||
Publicly traded securities | 10 | % | 10 | % | ||||||||||||||||
Traded securities | 10 | % | 7 | % | 8 | % | ||||||||||||||
Bank instruments | 8 | % | 5 | % | 5 | % | 2 | % | 6 | % | ||||||||||
Federal government instruments | 60 | % | 65 | % | ||||||||||||||||
Federal government instruments of the respective countries | 65 | % | 76 | % | 67 | % | ||||||||||||||
Variable return: | ||||||||||||||||||||
Publicly traded shares | 22 | % | 20 | % | 20 | % | 15 | % | 19 | % | ||||||||||
|
|
| ||||||||||||||||||
| 100 | % | 100 | % | 100 | % | 100 | % | 100 | % | |||||||||||
|
|
| ||||||||||||||||||
In Mexico, the regulatory framework for pension plans is established in the Income Tax Law and its Regulations, the Federal Labor Law and the Mexican Social Security Institute Law. None of these laws establish minimum funding levels or a minimum required level of contributions.
In Brazil, the regulatory framework for pension plans is established by the Brazilian Social Security Institute (INSS), which indicates that the contributions must be made by the Company and the workers.
In Venezuela, the regulatory framework for post-employment benefits is established by the Organic Labor Law for Workers (LOTTT) . The organic nature of this law means that its purpose is to defend constitutional rights, and therefore has precedence over other laws.
In Mexico, the Income Tax Law requires that, in the case of private plans, certain notifications must be submitted to the authorities and a certain level of instruments must be invested in Federal Government securities among others.
The Company’s various pension plans have a technical committee that is responsible for verifying the correct operation of the plans with regard to the payment of benefits, actuarial valuations of the plan, and supervise the trustee. The committee is responsible for determining the investment portfolio and the types of instruments the fund will be invested in. This technical committee is also responsible for reviewing the correct operation of the plans in all of the countries in which the Company has these benefits.
The risks related to the Company’s employee benefit plans are primarily attributable to the plan assets. The Company’s plan assets are invested in a diversified portfolio, which considers the term of the plan so as to invest in assets whose expected return coincides with the estimated future payments.
Since the Mexican Tax Law limits the plan asset investment to 10% for related parties, this risk is not considered to be significant for purposes of the Company’s Mexican subsidiaries.
The Company’s policy of maintainingis to invest at least 30% of the trustfund assets of the Mexico plan in Mexican Federal Government instruments. ObjectiveGuidelines for the target portfolio guidelines have been established for the remaining percentage and investment decisions are made to comply with thosethese guidelines toinsofar as the extent that market conditions and available funds allow.
TheIn Brazil, the investment target is to obtain the consumer price index (inflation), plus six percent. Investment decisions are made to comply with this guideline insofar as the market conditions and available funds allow.
On May 7, 2012, the President of Venezuela amended the LOTTT, which establishes a minimum level of social welfare benefits to which workers have a right when their labor relationship ends for whatever reason. This benefit is computed based on the last salary received by the worker and retroactive to June 19, 1997 for any employee who joined the Company prior to that date. For employees who joined the Company after June 19, 1997, the benefit is computed based on the date on which the employee joined the Company. An actuarial computation was performed using the projected unit credit method to determine the amount of the labor obligations that arise, and the Company recorded Ps. 381 in the other expenses caption in the consolidated income statement reflecting past service costs (see Note 19).
In Mexico, the amounts and types of securities of the Company andin related parties included in plan assets are as follows:
| 2010 | 2009 | |||||||
Debt: | ||||||||
CEMEX, S.A.B. de C.V. | Ps. 20 | Ps. 21 | ||||||
BBVA Bancomer, S.A. de C.V. | 11 | 6 | ||||||
Sigma Alimentos, S.A. de C.V. | — | 10 | ||||||
Coca-Cola FEMSA | 2 | 2 | ||||||
Grupo Industrial Bimbo, S.A. de C.V. | 2 | 2 | ||||||
Capital: | ||||||||
FEMSA | 97 | 90 | ||||||
Grupo Televisa, S.A.B. | 8 | 7 | ||||||
| December 31, | December 31, | January 1, | ||||||||||
| 2012 | 2011 | 2011 | ||||||||||
Debt: | ||||||||||||
CEMEX, S. A. B. de C.V. | Ps. | — | Ps. | — | Ps. | 20 | ||||||
BBVA Bancomer, S. A. de C.V. | 10 | 30 | 11 | |||||||||
Grupo Televisa, S. A. B. de C.V. | 3 | 3 | — | |||||||||
Grupo Financiero Banorte, S. A. B. de C.V. | 8 | 7 | — | |||||||||
Coca-Cola FEMSA | — | 2 | 2 | |||||||||
El Puerto de Liverpool, S. A.B. de C.V. | 5 | — | — | |||||||||
Grupo Industrial Bimbo, S. A. B. de C. V. | 3 | 2 | 2 | |||||||||
Capital: | ||||||||||||
FEMSA | 70 | 58 | 97 | |||||||||
Coca-Cola FEMSA | 8 | 5 | — | |||||||||
Grupo Televisa, S. A. B. de C.V. | 10 | — | 8 | |||||||||
Alfa, S. A. B. de C. V. | 5 | — | — | |||||||||
Grupo Aeroportuario del Sureste, S. A. B. de C.V. | 8 | — | — | |||||||||
In Brazil, the amounts and types of securities of the Company included in plan assets are as follows:
| December 31, | December 31, | January 1, | ||||||||||
Brazil Portfolio | 2012 | 2011 | 2011 | |||||||||
Debt: | ||||||||||||
HSBC—Sociedad de inversión Atuarial INPC (Brazil) | Ps. | 485 | Ps. | 509 | Ps. | 461 | ||||||
Capital: | ||||||||||||
HSBC—Sociedad de inversión Atuarial INPC (Brazil) | 104 | 107 | 134 | |||||||||
During the years ended December 31, 2012 and 2011, the Company did not make significant contributions to the plan assets and does not expect to make material contributions to the plan assets during the following fiscal year.
16.4 Amounts recognized in the consolidated income statements and the consolidated statement of comprehensive income
| Income Statement | OCI | |||||||||||||||||||
December 31, 2012 | Current Service Cost | Past Service Cost | Gain or Loss on Settlement | Net Interest on the Net Defined Benefit Liability | Remeasurements of the Net Defined Benefit Liability(1) | |||||||||||||||
Pension and retirement plans | Ps. | 184 | Ps. | — | Ps. | 1 | Ps. | 136 | Ps. | 499 | ||||||||||
Seniority premiums | 42 | — | — | 17 | 38 | |||||||||||||||
Postretirement medical services | 8 | — | — | 14 | 25 | |||||||||||||||
Post-employment Venezuela | 49 | 381 | — | 63 | 71 | |||||||||||||||
|
|
|
|
|
|
|
|
|
| |||||||||||
Total | Ps. | 283 | Ps. | 381 | Ps. | 1 | Ps. | 230 | Ps. | 633 | ||||||||||
|
|
|
|
|
|
|
|
|
| |||||||||||
December 31, 2011 | ||||||||||||||||||||
Pension and retirement plans | Ps. | 164 | Ps. | — | Ps. | 5 | Ps. | 151 | Ps. | 272 | ||||||||||
Seniority premiums | 30 | — | — | 12 | 3 | |||||||||||||||
Postretirement medical services | 9 | — | (6) | 14 | 1 | |||||||||||||||
|
|
|
|
|
|
|
|
|
| |||||||||||
Total | Ps. | 203 | Ps. | — | Ps. | (1) | Ps. | 177 | Ps. | 276 | ||||||||||
|
|
|
|
|
|
|
|
|
| |||||||||||
| (1) | Interests due to asset ceiling amounted to Ps. 11 and Ps. 19 in 2012 and 2011, respectively. |
For the years ended December 31, 2012 and 2011, current service cost of Ps. 283 and Ps. 203 have been included in the consolidated income statement as cost of goods sold and in administrative and selling expenses.
Remeasurements of the net defined benefit liability recognized in other comprehensive income are as follows:
| December 31, 2012 | December 31, 2011 | |||||||
Amount accumulated in other comprehensive income as of the beginning of the period, net of tax | Ps. | 190 | Ps. | 131 | ||||
Actuarial gains and losses arising from exchange rates | (13 | ) | — | |||||
Remeasurements during the year, net of tax | 20 | 119 | ||||||
Actuarial gains and losses arising from changes in financial assumptions | 281 | — | ||||||
Changes in the effect of limiting a net defined benefit asset to the asset ceiling | (9 | ) | (60 | ) | ||||
|
|
|
| |||||
Amount accumulated in other comprehensive income as of the end of the period, net of tax | Ps. | 469 | Ps. | 190 | ||||
|
|
|
| |||||
Remeasurements of the net defined benefit liability include the following:
The Companyreturn on plan assets, excluding amounts included in interest expense.
Actuarial gains and losses arising from changes in demographic assumptions.
Actuarial gains and losses arising from changes in financial assumptions.
Changes in the effect of limiting a net defined benefit asset to the asset ceiling, excluding amounts included in interest expense.
16.5 Changes in the balance of the defined benefit obligation for post-employment and other long-term employee benefits
| December 31, 2012 | December 31, 2011 | |||||||
Pension and Retirement Plans: | ||||||||
Initial balance | Ps. | 3,972 | Ps. | 3,297 | ||||
Current service cost | 185 | 164 | ||||||
Interest expense | 288 | 263 | ||||||
Settlement | 1 | 5 | ||||||
Remeasurements of the net defined benefit liability | 238 | 85 | ||||||
Foreign exchange (gain) loss | (67 | ) | 45 | |||||
Benefits paid | (154 | ) | (142 | ) | ||||
Acquisitions | 32 | 255 | ||||||
|
|
|
| |||||
Ending balance | Ps. | 4,495 | Ps. | 3,972 | ||||
|
|
|
| |||||
Seniority Premiums: | ||||||||
Initial balance | Ps. | 241 | Ps. | 154 | ||||
Current service cost | 42 | 30 | ||||||
Interest expense | 19 | 12 | ||||||
Curtailment | (2 | ) | — | |||||
Remeasurements of the net defined benefit liability | 33 | 2 | ||||||
Benefits paid | (23 | ) | (19 | ) | ||||
Acquisitions | 14 | 62 | ||||||
|
|
|
| |||||
Ending balance | Ps. | 324 | Ps. | 241 | ||||
|
|
|
| |||||
Postretirement Medical Services: | ||||||||
Initial balance | Ps. | 235 | Ps. | 232 | ||||
Current service cost | 8 | 9 | ||||||
Interest expense | 17 | 15 | ||||||
Curtailment | — | (6 | ) | |||||
Remeasurements of the net defined benefit liability | 25 | — | ||||||
Benefits paid | (18 | ) | (15 | ) | ||||
|
|
|
| |||||
Ending balance | Ps. | 267 | Ps. | 235 | ||||
|
|
|
| |||||
Post-employment: | ||||||||
Initial balance | Ps. | — | Ps. | — | ||||
Current service cost | 48 | — | ||||||
Past service cost | 381 | — | ||||||
Interest expense | 63 | — | ||||||
Remeasurements of the net defined benefit liability | 108 | — | ||||||
Benefits paid | (6 | ) | — | |||||
|
|
|
| |||||
Ending balance | Ps. | 594 | Ps. | — | ||||
|
|
|
| |||||
16.6 Changes in the balance of plan assets
| December 31, 2012 | December 31, 2011 | |||||||
Total Plan Assets | ||||||||
Initial balance | Ps. | 1,991 | Ps. | 1,544 | ||||
Actual return on trust assets | 145 | 53 | ||||||
Foreign exchange (gain) loss | (91 | ) | 6 | |||||
Life annuities | 29 | 152 | ||||||
Benefits paid | (12 | ) | (12 | ) | ||||
Acquisitions | 48 | 248 | ||||||
|
|
|
| |||||
Ending balance | Ps. | 2,110 | Ps. | 1,991 | ||||
|
|
|
| |||||
As a result of the Company’s investments in life annuities plan for qualified employees of Mexican Subsidiaries, management does not expect to make material contributions to plan assets during the following fiscal year.
16.7 Variation in assumptions
| 2010 | 2009 | 2008 | ||||||||||
Pension and Retirement Plans: | ||||||||||||
Labor cost | Ps. | 136 | Ps. | 136 | Ps. | 117 | ||||||
Interest cost | 219 | 216 | 186 | |||||||||
Expected return on trust assets | (94 | ) | (80 | ) | (94 | ) | ||||||
Labor cost of past services(1) | 30 | 29 | 29 | |||||||||
Amortization of net actuarial loss | 4 | 17 | 12 | |||||||||
| 295 | 318 | 250 | ||||||||||
Seniority Premiums: | ||||||||||||
Labor cost | 27 | 25 | 22 | |||||||||
Interest cost | 13 | 12 | 11 | |||||||||
Labor cost of past services(1) | 1 | — | 1 | |||||||||
Amortization of net actuarial loss | — | — | 20 | |||||||||
| 41 | 37 | 54 | ||||||||||
Postretirement Medical Services: | ||||||||||||
Labor cost | 8 | 7 | 6 | |||||||||
Interest cost | 16 | 15 | 13 | |||||||||
Expected return on trust assets | (3 | ) | (3 | ) | (3 | ) | ||||||
Labor cost of past services(1) | 2 | 2 | 2 | |||||||||
Amortization of net actuarial loss | 4 | 5 | 4 | |||||||||
| 27 | 26 | 22 | ||||||||||
Severance Indemnities: | ||||||||||||
Labor cost | 65 | 61 | 70 | |||||||||
Interest cost | 31 | 32 | 38 | |||||||||
Labor cost of past services(1) | 48 | 50 | 67 | |||||||||
Amortization of net actuarial loss | 93 | 45 | 163 | |||||||||
| 237 | 188 | 338 | ||||||||||
| Ps. | 600 | Ps. | 569 | Ps. | 664 | |||||||
| ||||||||||||
Discount rate: The rate that determines the value of the obligations over time.
| 2010 | 2009 | |||||||
Pension and Retirement Plans: | ||||||||
Initial balance | Ps. | 2,612 | Ps. | 2,614 | ||||
Labor cost | 136 | 136 | ||||||
Interest cost | 219 | 216 | ||||||
Curtailment | 129 | — | ||||||
Actuarial loss (gain), net | 358 | (182 | ) | |||||
Benefits paid | (156 | ) | (172 | ) | ||||
Ending balance | 3,298 | 2,612 | ||||||
Seniority Premiums: | ||||||||
Initial balance | 166 | 149 | ||||||
Labor cost | 27 | 25 | ||||||
Interest cost | 13 | 12 | ||||||
Actuarial gain, net | (33 | ) | (8 | ) | ||||
Benefits paid | (19 | ) | (12 | ) | ||||
Ending balance | 154 | 166 | ||||||
Postretirement Medical Services: | ||||||||
Initial balance | 191 | 183 | ||||||
Labor cost | 8 | 7 | ||||||
Interest cost | 16 | 15 | ||||||
Curtailment | 8 | — | ||||||
Actuarial loss (gain), net | 21 | (2 | ) | |||||
Benefits paid | (13 | ) | (12 | ) | ||||
Ending balance | 231 | 191 | ||||||
Severance Indemnities: | ||||||||
Initial balance | 535 | 489 | ||||||
Labor cost | 65 | 61 | ||||||
Interest cost | 31 | 32 | ||||||
Curtailment | 1 | — | ||||||
Actuarial loss | 74 | 65 | ||||||
Benefits paid | (153 | ) | (112 | ) | ||||
Ending balance | 553 | 535 | ||||||
Salary increase rate: The rate that considers the salary increase which implies an increase in the benefit payable.
| 2010 | 2009 | |||||||
Initial balance | Ps. | 1,183 | Ps. | 893 | ||||
Actual return on trust assets | 114 | 299 | ||||||
Life annuities(1) | 264 | — | ||||||
Benefits paid | (17 | ) | (9 | ) | ||||
Ending balance | 1,544 | 1,183 | ||||||
|
Healthcare cost increase rate: The following table presentsrate that considers the trends of health care costs which implies an impact toon the postretirement medical service obligations and the expenses recordedcost for the year.
The following table presents the impact in the income statement withabsolute terms of a variation of 1% in the assumed health care cost trend rates.
Postretirement medical services obligation Cost for the year Impact of Changes: +1% -1% Ps. 35 Ps. (28) 5 (3)
+1%: | Income Statement | OCI | ||||||||||||||||||
Discount rate used to calculate the defined benefit obligation and the net interest on the net defined benefit liability | Current Service Cost | Past Service Cost | Gain or Loss on Settlement | Net Interest on the Net Defined Benefit Liability | Remeasurements of the Net Defined Benefit Liability (Asset) | |||||||||||||||
Pension and retirement plans | Ps. | 161 | Ps. | — | Ps. | 1 | Ps. | 128 | Ps. | 104 | ||||||||||
Seniority premiums | 38 | — | — | 17 | 5 | |||||||||||||||
Postretirement medical services | 6 | — | — | 15 | (7) | |||||||||||||||
Post-employment | 34 | 320 | — | 52 | 15 | |||||||||||||||
|
|
|
|
|
|
|
|
|
| |||||||||||
Total | Ps. | 239 | Ps. | 320 | Ps. | 1 | Ps. | 212 | Ps. | 117 | ||||||||||
|
|
|
|
|
|
|
|
|
| |||||||||||
Expected salary increase | ||||||||||||||||||||
Pension and retirement plans | Ps. | 215 | Ps. | — | Ps. | 1 | Ps. | 161 | Ps. | 793 | ||||||||||
Seniority premiums | 48 | — | — | 20 | 73 | |||||||||||||||
Post-employment | 58 | 511 | — | 85 | 302 | |||||||||||||||
|
|
|
|
|
|
|
|
|
| |||||||||||
Total | Ps. | 321 | Ps. | 511 | Ps. | 1 | Ps. | 266 | Ps. | 1,168 | ||||||||||
|
|
|
|
|
|
|
|
|
| |||||||||||
Assumed rate of increase in healthcare costs | ||||||||||||||||||||
Postretirement medical services | Ps. | 10 | Ps. | — | Ps. | — | Ps. | 17 | Ps. | 63 | ||||||||||
|
|
|
|
|
|
|
|
|
| |||||||||||
-1%: | ||||||||||||||||||||
Discount rate used to calculate the defined benefit obligation and the net interest on the net defined benefit liability | ||||||||||||||||||||
Pension and retirement plans | Ps. | 217 | Ps. | — | Ps. | 1 | Ps. | 148 | Ps. | 917 | ||||||||||
Seniority premiums | 47 | — | — | 19 | 72 | |||||||||||||||
Postretirement medical services | 10 | — | — | 15 | 65 | |||||||||||||||
Post-employment | 51 | 457 | — | 76 | 225 | |||||||||||||||
|
|
|
|
|
|
|
|
|
| |||||||||||
Total | Ps. | 325 | Ps. | 457 | Ps. | 1 | Ps. | 258 | Ps. | 1,279 | ||||||||||
|
|
|
|
|
|
|
|
|
| |||||||||||
Expected salary increase | ||||||||||||||||||||
Pension and retirement plans | Ps. | 163 | Ps. | — | Ps. | 1 | Ps. | 123 | Ps. | 228 | ||||||||||
Seniority premiums | 37 | — | — | 15 | 3 | |||||||||||||||
Post-employment | 29 | 279 | — | 45 | (44) | |||||||||||||||
|
|
|
|
|
|
|
|
|
| |||||||||||
Total | Ps. | 229 | Ps. | 279 | Ps. | 1 | Ps. | 183 | Ps. | 187 | ||||||||||
|
|
|
|
|
|
|
|
|
| |||||||||||
Assumed rate of increase in healthcare costs | ||||||||||||||||||||
Postretirement medical services | Ps. | 6 | Ps. | — | Ps. | — | Ps. | 12 | Ps. | (6) | ||||||||||
|
|
|
|
|
|
|
|
|
| |||||||||||
Note 17.16.8 Post-employment and other long-term employee benefits expense
For the years ended December 31, 2012 and 2011, employee benefits expenses recognized in the consolidated income statements are as follows:
| 2012 | 2011 | |||||||
Post employment benefits | Ps. | 283 | Ps. | 203 | ||||
Post employment benefits recognized in other expenses (see Note 19) | 381 | — | ||||||
Share-based payments | 275 | 253 | ||||||
Termination benefits | 541 | 411 | ||||||
|
|
|
| |||||
| Ps. | 1,480 | Ps. | 867 | |||||
|
|
|
| |||||
17 Bonus Program.Program
17.1 Quantitative and qualitative objectives
The bonus program for executives is based on complying with certain goals established annually by management, which include quantitative and qualitative objectives, and special projects.
The quantitative objectives represent approximately 50% of the bonus, and are based on the Economic Value Added (“EVA”) methodology. The objective established for the executives at each entity is based on a combination of the EVA per entity and the EVA generated by the Company, calculated at approximately 70% and 30%, respectively. The qualitative objectives and special projects represent the remaining 50% of the annual bonus and are based on the critical success factors established at the beginning of the year for each executive.
In addition,The bonus amount is determined based on each eligible participant’s level of responsibility and based on the Company provides a defined contribution planEVA generated by the applicable business unit the employee works for. This formula is established by considering the level of shareresponsibility within the organization, the employees’ evaluation and competitive compensation in the market. The bonus is granted to certain key executives, consisting ofthe eligible employee on an annual basis and after withholding applicable taxes. The Company contributes the individual employee’s special bonus (after taxes) in cash bonusto the Administrative Trust (which is controlled and consolidated by FEMSA), who then uses the funds to purchase FEMSA or Coca-Cola FEMSA shares (as instructed by the Administrative Trust’s Technical Committee), which are then allocated to such employee.
17.2 Share-based payment bonus plan
The Company has implemented a stock incentive plan for the benefit of its senior executives. As discussed above, this plan uses as its main evaluation metric the Economic Value Added, or EVA. Under the EVA stock incentive plan, eligible employees are entitled to receive a special annual bonus, to be paid in shares of FEMSA or Coca-Cola FEMSA, as applicable or (2) stock options (the plan considers providing stock options to employees; however, since inception only shares of FEMSA or Coca-Cola FEMSA have been granted).
The plan is managed by FEMSA’s chief executive officer (CEO), with the support of the board of directors, together with the CEO of the respective sub-holding company. FEMSA’s Board of Directors is responsible for approving the plan’s structure, and the annual amount of the bonus. Each year, FEMSA’s CEO in conjunction with the Evaluation and Compensation Committee of the board of directors and the CEO of the respective sub-holding company determine the employees eligible to participate in the plan and the bonus formula to determine the number of shares to be received, which vest ratably over a six year period. On such date, the Company and the eligible employee agree to the share-based payment arrangement, being when it and the counterparty have a shared understanding of the terms and conditions of the arrangement. FEMSA accounts for its share-based payment bonus plan as an equity-settled share based payment transaction as it will ultimately settle its obligations with its employees by issuing its own shares or options, based onthose of its subsidiary Coca-Cola FEMSA.
The Administrative Trust tracks the executive’s responsibilityindividual employees’ account balance. FEMSA created the Administrative Trust with the objective of administering the purchase of FEMSA and Coca-Cola FEMSA shares by each of its subsidiaries with eligible executives participating in the organization, their business’ EVA result achieved, and their individual performance.stock incentive plan. The acquired shares or optionsAdministrative Trust’s objectives are deposited in a trust, and the executives may access them one year after they are vested at 20% per year. The 50% of Coca-Cola FEMSA’s annual executive bonus is to be used to purchaseacquire FEMSA shares, or optionsshares of Coca- Cola FEMSA and the remaining 50% to purchase Coca-Cola FEMSA shares or options. As of December 31, 2010, 2009 and 2008, no options have been granted to employees undermanage the plan.
As of April 30, 2010, the trust linked to FEMSA Cerveza executives was liquidated; as a result 230,642 of FEMSA UBD shares and 27,339 of KOF L shares granted to the individual employees based on instructions set forth by the Technical Committee. Once the shares are acquired following the Technical Committee’s instructions, the Administrative Trust assigns to each participant their respective rights. As the trust is controlled and therefore consolidated by FEMSA, Cerveza executives were vestedshares purchased in the market and held within the Administrative Trust are presented as parttreasury stock (as it relates to FEMSA’s shares) or as a reduction of the share exchangenoncontrolling interest (as it relates to Coca-Cola FEMSA’s shares) in the consolidated statement of FEMSA Cerveza.
changes in equity, line issuance (repurchase) of shares associated with share-based payment plans. Should an employee leave prior to their shares vesting, they would lose the rights to such shares, which would then remain within the Administrative Trust and be able to be reallocated to other eligible employees as determined by the Company. The incentive plan target is expressed in months of salary, and the final amount payable is computed based on a percentage of compliance with the goals established every year. The bonuses are recorded in income from operations and are paid in cash the following year. DuringFor the years ended December 31, 2010, 20092012 and 2008,2011, the bonuscompensation expense recorded in the consolidated income statement amounted to Ps. 1,016 Ps. 1,210275 and Ps. 1,050,
253, respectively.
All shares held in trustthe Administrative Trust are considered outstanding for diluted earnings per share purposes and dividends on shares held by the trusts are charged to retained earnings.
As of December 31, 20102012 and 2009,2011, the number of shares held by the trust associated with the Company’s share based payment plans is as follows:
| Number of Shares | Number of Shares | |||||||||||||||||||||||||||||||
| FEMSA UBD | KOF L | FEMSA UBD | KOFL | |||||||||||||||||||||||||||||
| 2010 | 2009 | 2010 | 2009 | 2012 | 2011 | 2012 | 2011 | |||||||||||||||||||||||||
Beginning balance | 10,514,672 | 8,992,423 | 3,035,008 | 2,451,977 | 9,400,083 | 10,197,507 | 2,714,552 | 3,049,376 | ||||||||||||||||||||||||
Shares granted to executives | 3,700,050 | 4,384,425 | 989,500 | 1,340,790 | ||||||||||||||||||||||||||||
Shares released from trust to executives upon vesting | (3,863,904 | ) | (2,775,853 | ) | (975,132 | ) | (742,249 | ) | ||||||||||||||||||||||||
Shares acquired by the Administrative Trust and granted to employees | 2,390,815 | 2,438,590 | 749,830 | 651,870 | ||||||||||||||||||||||||||||
Shares released from Administrative trust to employees upon vesting | (3,374,871 | ) | (3,236,014 | ) | (1,042,506 | ) | (986,694 | ) | ||||||||||||||||||||||||
Forfeitures | — | — | — | — | ||||||||||||||||||||||||||||
|
|
|
| |||||||||||||||||||||||||||||
Forfeitures | (153,311 | ) | (86,323 | ) | — | (15,510 | ) | |||||||||||||||||||||||||
Ending balance | 10,197,507 | 10,514,672 | 3,049,376 | 3,035,008 | 8,416,027 | 9,400,083 | 2,421,876 | 2,714,552 | ||||||||||||||||||||||||
|
|
|
| |||||||||||||||||||||||||||||
The fair value of the shares held by the trust as of the end of December 31, 20102012 and 20092011 was Ps. 8571,552 and Ps. 920,1,297, respectively, based on quoted market prices of those dates.
Note 18.18 Bank Loans and Notes Payable.Payables
| At December 31,(1) | At December 31,(1) | 2018 and | Carrying December 31, | Fair Value at December 31, | Carrying December 31, | Carrying January 1, | ||||||||||||||||||||||||||||||||||||||||||||||||||||||||||||||||||||||
| (in millions of Mexican pesos) | 2011 | 2012 | 2013 | 2014 | 2015 | 2016 and Thereafter | 2010 | Fair Value | 2009(1) | 2013 | 2014 | 2015 | 2016 | 2017 | Thereafter | 2012 | 2012 | 2011(1) | 2011(1) | |||||||||||||||||||||||||||||||||||||||||||||||||||||||||
Short-term debt: | ||||||||||||||||||||||||||||||||||||||||||||||||||||||||||||||||||||||||||||
Fixed rate debt: | ||||||||||||||||||||||||||||||||||||||||||||||||||||||||||||||||||||||||||||
Argentine pesos | ||||||||||||||||||||||||||||||||||||||||||||||||||||||||||||||||||||||||||||
Bank loans | Ps. 291 | Ps.— | Ps.— | Ps. — | Ps. — | Ps.— | Ps. 291 | Ps. 291 | Ps. 325 | Ps. 506 | ||||||||||||||||||||||||||||||||||||||||||||||||||||||||||||||||||
Interest rate | 19.2 | % | — | — | — | — | — | 19.2 | % | 14.9 | % | 15.3 | % | |||||||||||||||||||||||||||||||||||||||||||||||||||||||||||||||
Mexican pesos | ||||||||||||||||||||||||||||||||||||||||||||||||||||||||||||||||||||||||||||
Finance leases | — | — | — | — | — | — | — | — | 18 | — | ||||||||||||||||||||||||||||||||||||||||||||||||||||||||||||||||||
Interest rate | — | — | — | — | — | — | — | 6.9 | % | — | ||||||||||||||||||||||||||||||||||||||||||||||||||||||||||||||||||
Variable rate debt: | ||||||||||||||||||||||||||||||||||||||||||||||||||||||||||||||||||||||||||||
Colombian pesos | ||||||||||||||||||||||||||||||||||||||||||||||||||||||||||||||||||||||||||||
Bank loans | 1,072 | — | — | — | — | — | 1,072 | 1,072 | 496 | — | — | — | — | — | — | — | — | 295 | 1,072 | |||||||||||||||||||||||||||||||||||||||||||||||||||||||||
Interest rate | 4.4% | 4.4% | 4.9% | — | — | — | — | — | — | — | 6.8 | % | 4.4 | % | ||||||||||||||||||||||||||||||||||||||||||||||||||||||||||||||
Argentine pesos | ||||||||||||||||||||||||||||||||||||||||||||||||||||||||||||||||||||||||||||
Brazilian Reais | ||||||||||||||||||||||||||||||||||||||||||||||||||||||||||||||||||||||||||||
Bank loans | 506 | — | — | — | — | — | 506 | 506 | 1,179 | 19 | — | — | — | — | — | 19 | 19 | — | — | |||||||||||||||||||||||||||||||||||||||||||||||||||||||||
Interest rate | 15.3% | 15.3% | 20.7% | 8.1 | % | — | — | — | — | — | 8.1 | % | — | — | ||||||||||||||||||||||||||||||||||||||||||||||||||||||||||||||
Mexican pesos | ||||||||||||||||||||||||||||||||||||||||||||||||||||||||||||||||||||||||||||
Bank loans | 1,400 | |||||||||||||||||||||||||||||||||||||||||||||||||||||||||||||||||||||||||||
Interest rate | 8.2% | |||||||||||||||||||||||||||||||||||||||||||||||||||||||||||||||||||||||||||
Venezuelan bolivars | ||||||||||||||||||||||||||||||||||||||||||||||||||||||||||||||||||||||||||||
Bank loans | 741 | |||||||||||||||||||||||||||||||||||||||||||||||||||||||||||||||||||||||||||
U.S. dollars (bank loans) | 3,903 | — | — | — | — | — | 3,903 | 3,899 | — | — | ||||||||||||||||||||||||||||||||||||||||||||||||||||||||||||||||||
Interest rate | 18.1% | 0.6 | % | — | — | — | — | — | 0.6 | % | — | — | ||||||||||||||||||||||||||||||||||||||||||||||||||||||||||||||||
|
|
|
|
|
|
|
|
|
| |||||||||||||||||||||||||||||||||||||||||||||||||||||||||||||||||||
Total short-term debt | 1,578 | 1,578 | 1,578 | 3,816 | Ps. 4,213 | Ps.— | Ps.— | Ps.— | Ps.— | Ps.— | Ps. 4,213 | Ps. 4,209 | Ps. 638 | Ps. 1,578 | ||||||||||||||||||||||||||||||||||||||||||||||||||||||||||||||
|
|
|
|
|
|
|
|
|
| |||||||||||||||||||||||||||||||||||||||||||||||||||||||||||||||||||
Long-term debt: | ||||||||||||||||||||||||||||||||||||||||||||||||||||||||||||||||||||||||||||
Fixed rate debt: | ||||||||||||||||||||||||||||||||||||||||||||||||||||||||||||||||||||||||||||
Argentine pesos | ||||||||||||||||||||||||||||||||||||||||||||||||||||||||||||||||||||||||||||
Bank loans | 62 | 622 | — | — | — | — | 684 | 684 | 69 | 180 | 336 | 13 | — | — | — | 529 | 514 | 595 | 684 | |||||||||||||||||||||||||||||||||||||||||||||||||||||||||
Interest rate | 20.5% | 16.1% | 16.5% | 20.5% | 18.7 | % | 20.7 | % | 15.0 | % | — | — | — | 19.9 | % | 16.4 | % | 16.5 | % | |||||||||||||||||||||||||||||||||||||||||||||||||||||||||
Brazilian reais | ||||||||||||||||||||||||||||||||||||||||||||||||||||||||||||||||||||||||||||
Bank loans | 4 | 9 | 15 | 15 | 14 | 45 | 102 | 102 | — | 17 | 21 | 21 | 21 | 19 | 20 | 119 | 114 | 82 | 81 | |||||||||||||||||||||||||||||||||||||||||||||||||||||||||
Interest rate | 4.5% | 4.5% | 4.5% | 4.5% | 4.5% | 4.5% | 4.5% | — | 3.8 | % | 3.6 | % | 3.6 | % | 3.6 | % | 3.6 | % | 4.5 | % | 3.8 | % | 4.5 | % | 4.5 | % | ||||||||||||||||||||||||||||||||||||||||||||||||||
Finance leases | 4 | 4 | 3 | — | — | — | 11 | 11 | 17 | 21 | ||||||||||||||||||||||||||||||||||||||||||||||||||||||||||||||||||
Interest rate | 4.5 | % | 4.5 | % | 4.5 | % | — | — | — | 4.5 | % | 4.5 | % | 4.5 | % | |||||||||||||||||||||||||||||||||||||||||||||||||||||||||||||
U.S. dollars | ||||||||||||||||||||||||||||||||||||||||||||||||||||||||||||||||||||||||||||
Yankee Bond | 6,179 | 6,179 | 6,179 | — | — | — | — | — | — | 6,458 | 6,458 | 7,351 | 6,940 | 6,121 | ||||||||||||||||||||||||||||||||||||||||||||||||||||||||||||||
Interest rate | 4.6% | 4.6% | — | — | — | — | — | — | 4.6 | % | 4.6 | % | 4.6 | % | 4.6 | % | ||||||||||||||||||||||||||||||||||||||||||||||||||||||||||||
Capital leases | 4 | — | — | — | — | — | 4 | 4 | 15 | |||||||||||||||||||||||||||||||||||||||||||||||||||||||||||||||||||
Finance leases | — | — | — | — | — | — | — | — | — | 4 | ||||||||||||||||||||||||||||||||||||||||||||||||||||||||||||||||||
Interest rate | 3.8% | 3.8% | 3.8% | — | — | — | — | — | — | — | — | 3.8 | % | |||||||||||||||||||||||||||||||||||||||||||||||||||||||||||||||
Mexican pesos | ||||||||||||||||||||||||||||||||||||||||||||||||||||||||||||||||||||||||||||
Units of investment (UDIs) | 3,193 | 3,193 | 3,193 | 2,964 | ||||||||||||||||||||||||||||||||||||||||||||||||||||||||||||||||||||||||
Units of investment | ||||||||||||||||||||||||||||||||||||||||||||||||||||||||||||||||||||||||||||
(UDIs) | — | — | — | — | 3,567 | — | 3,567 | 3,567 | 3,337 | 3,193 | ||||||||||||||||||||||||||||||||||||||||||||||||||||||||||||||||||
Interest rate | 4.2% | 4.2% | 4.2% | — | — | — | — | 4.2 | % | — | 4.2 | % | 4.2 | % | 4.2 | % | ||||||||||||||||||||||||||||||||||||||||||||||||||||||||||||
Domestic senior notes | 1,000 | — | — | — | — | — | 2,495 | 2,495 | 2,822 | 2,495 | — | |||||||||||||||||||||||||||||||||||||||||||||||||||||||||||||||||
Interest rate | 10.4% | |||||||||||||||||||||||||||||||||||||||||||||||||||||||||||||||||||||||||||
Bank loans | 1,000 | |||||||||||||||||||||||||||||||||||||||||||||||||||||||||||||||||||||||||||
Interest rate | 9.3% | — | — | — | — | — | 8.3 | % | 8.3 | % | 8.3 | % | — | |||||||||||||||||||||||||||||||||||||||||||||||||||||||||||||||
|
|
|
|
|
|
|
|
|
| |||||||||||||||||||||||||||||||||||||||||||||||||||||||||||||||||||
Subtotal | 70 | 631 | 15 | 15 | 14 | 9,417 | 10,162 | 10,162 | 5,048 | Ps. 201 | Ps. 361 | Ps. 37 | Ps. 21 | Ps. 3,586 | Ps. 8,973 | Ps. 13,179 | Ps. 14,379 | Ps. 13,466 | Ps. 10,104 | |||||||||||||||||||||||||||||||||||||||||||||||||||||||||
|
|
|
|
|
|
|
|
|
| |||||||||||||||||||||||||||||||||||||||||||||||||||||||||||||||||||
Variable rate debt: | ||||||||||||||||||||||||||||||||||||||||||||||||||||||||||||||||||||||||||||
U.S. dollars | ||||||||||||||||||||||||||||||||||||||||||||||||||||||||||||||||||||||||||||
Bank loans | — | 37 | 185 | — | — | — | 222 | 222 | 2,873 | |||||||||||||||||||||||||||||||||||||||||||||||||||||||||||||||||||
Interest rate | 0.5% | 0.6% | 0.6% | 0.5% | ||||||||||||||||||||||||||||||||||||||||||||||||||||||||||||||||||||||||
Mexican pesos | ||||||||||||||||||||||||||||||||||||||||||||||||||||||||||||||||||||||||||||
Domestic senior notes | 1,500 | 3,000 | 3,500 | — | — | — | 8,000 | 7,945 | 10,000 | |||||||||||||||||||||||||||||||||||||||||||||||||||||||||||||||||||
Interest rate | 4.9% | 4.8% | 4.8% | 4.8% | 5.0% | |||||||||||||||||||||||||||||||||||||||||||||||||||||||||||||||||||||||
Bank loans | — | 67 | 267 | 1,392 | 2,824 | — | 4,550 | 4,550 | 8,062 | |||||||||||||||||||||||||||||||||||||||||||||||||||||||||||||||||||
Interest rate | 5.1% | 5.1% | 5.1% | 5.1% | 5.1% | 6.3% | ||||||||||||||||||||||||||||||||||||||||||||||||||||||||||||||||||||||
Colombian pesos | ||||||||||||||||||||||||||||||||||||||||||||||||||||||||||||||||||||||||||||
Bank loans | 155 | 839 | — | — | — | — | 994 | 994 | — | |||||||||||||||||||||||||||||||||||||||||||||||||||||||||||||||||||
Interest rate | 4.7% | 4.7% | 4.7% | |||||||||||||||||||||||||||||||||||||||||||||||||||||||||||||||||||||||||
Subtotal | 1,655 | 3,943 | 3,952 | 1,392 | 2,824 | — | 13,766 | 13,711 | 20,935 | |||||||||||||||||||||||||||||||||||||||||||||||||||||||||||||||||||
Total long-term debt | 1,725 | 4,574 | 3,967 | 1,407 | 2,838 | 9,417 | 23,928 | 23,873 | 25,983 | |||||||||||||||||||||||||||||||||||||||||||||||||||||||||||||||||||
Current portion of long-term debt | (1,725 | ) | (4,723 | ) | ||||||||||||||||||||||||||||||||||||||||||||||||||||||||||||||||||||||||
| Ps.22,203 | Ps.21,260 | |||||||||||||||||||||||||||||||||||||||||||||||||||||||||||||||||||||||||||
| (1) | All interest rates are weighted average annual rates. |
Derivative Financial Instruments(1) | 2011 | 2012 | 2013 | 2014 | 2015 | 2016 and Thereafter | 2010 | 2009 | ||||||||||||||||||||||||||||||||||||||||||||||||||||||||||||||||
| Fair | ||||||||||||||||||||||||||||||||||||||||||||||||||||||||||||||||||||||||
| At December 31,(1) | 2018 and | December 31, | Value at December 31, | December 31, | January 1, | |||||||||||||||||||||||||||||||||||||||||||||||||||||||||||||||||||
| (in millions of Mexican pesos) | 2013 | 2014 | 2015 | 2016 | 2017 | Thereafter | 2012 | 2012 | 2011(1) | 2011 (1) | ||||||||||||||||||||||||||||||||||||||||||||||||||||||||||||||
Variable rate debt: | ||||||||||||||||||||||||||||||||||||||||||||||||||||||||||||||||||||||||
U. S. dollars | ||||||||||||||||||||||||||||||||||||||||||||||||||||||||||||||||||||||||
Bank loans | Ps. 195 | Ps. 2,600 | Ps. 5,195 | Ps.— | Ps.— | Ps. — | Ps. 7,990 | Ps. 8,008 | Ps. 251 | Ps. 222 | ||||||||||||||||||||||||||||||||||||||||||||||||||||||||||||||
Interest rate | 0.6 | % | 0.9 | % | 0.9 | % | — | — | — | 0.9 | % | 0.7 | % | 0.6 | % | |||||||||||||||||||||||||||||||||||||||||||||||||||||||||
Mexican pesos | ||||||||||||||||||||||||||||||||||||||||||||||||||||||||||||||||||||||||
Domestic senior notes | 3,500 | — | — | 2,511 | — | — | 6,011 | 5,999 | 8,843 | 8,000 | ||||||||||||||||||||||||||||||||||||||||||||||||||||||||||||||
Interest rate | 4.8 | % | — | — | 5.0 | % | — | 5.0 | % | 4.7 | % | 4.8 | % | |||||||||||||||||||||||||||||||||||||||||||||||||||||||||||
Bank loans | 266 | 1,370 | 2,744 | — | — | — | 4,380 | 4,430 | 4,550 | 4,340 | ||||||||||||||||||||||||||||||||||||||||||||||||||||||||||||||
Interest rate | 5.1 | % | 5.1 | % | 5.1 | % | — | — | — | 5.1 | % | 5.0 | % | 5.1 | % | |||||||||||||||||||||||||||||||||||||||||||||||||||||||||
Argentine pesos | ||||||||||||||||||||||||||||||||||||||||||||||||||||||||||||||||||||||||
Bank loans | 106 | — | — | — | — | — | 106 | 106 | 130 | — | ||||||||||||||||||||||||||||||||||||||||||||||||||||||||||||||
Interest rate | 22.9 | % | — | — | — | — | — | 22.9 | % | 27.3 | % | — | ||||||||||||||||||||||||||||||||||||||||||||||||||||||||||||
Brazilian reais | ||||||||||||||||||||||||||||||||||||||||||||||||||||||||||||||||||||||||
Bank loans | — | 106 | — | — | — | — | 106 | — | — | — | ||||||||||||||||||||||||||||||||||||||||||||||||||||||||||||||
Interest rate | — | 8.9 | % | — | — | — | — | 8.9 | % | — | — | |||||||||||||||||||||||||||||||||||||||||||||||||||||||||||||
Finance leases | 36 | 40 | 43 | 30 | — | — | 149 | 149 | 193 | — | ||||||||||||||||||||||||||||||||||||||||||||||||||||||||||||||
Interest rate | 10.5 | % | 10.5 | % | 10.5 | % | 10.5 | % | — | 10.5 | % | 11.0 | % | — | ||||||||||||||||||||||||||||||||||||||||||||||||||||||||||
Colombian pesos | ||||||||||||||||||||||||||||||||||||||||||||||||||||||||||||||||||||||||
Bank loans | — | 1,023 | — | — | — | — | 1,023 | 990 | 935 | 994 | ||||||||||||||||||||||||||||||||||||||||||||||||||||||||||||||
Interest rate | — | 6.8 | % | — | — | — | — | 6.8 | % | 6.1 | % | 4.7 | % | |||||||||||||||||||||||||||||||||||||||||||||||||||||||||||
Finance leases | 185 | — | — | — | — | — | 185 | 186 | 386 | — | ||||||||||||||||||||||||||||||||||||||||||||||||||||||||||||||
Interest rate | 6.8 | % | — | — | — | — | — | 6.8 | % | 6.6 | % | — | ||||||||||||||||||||||||||||||||||||||||||||||||||||||||||||
|
|
|
|
|
|
|
|
|
| |||||||||||||||||||||||||||||||||||||||||||||||||||||||||||||||
Subtotal | 4,288 | 5,139 | 7,982 | 2,541 | — | — | 19,950 | 19,868 | 15,288 | 13,556 | ||||||||||||||||||||||||||||||||||||||||||||||||||||||||||||||
|
|
|
|
|
|
|
|
|
| |||||||||||||||||||||||||||||||||||||||||||||||||||||||||||||||
Total long-term debt | Ps. 4,489 | Ps. 5,500 | Ps. 8,019 | Ps. 2,562 | Ps. 3,586 | Ps. 8,973 | Ps. 33,129 | Ps. 34,247 | Ps. 28,754 | Ps. 23,660 | ||||||||||||||||||||||||||||||||||||||||||||||||||||||||||||||
Current portion of long-term debt | (4,489 | ) | (4,935 | ) | (1,725 | ) | ||||||||||||||||||||||||||||||||||||||||||||||||||||||||||||||||||
|
|
| ||||||||||||||||||||||||||||||||||||||||||||||||||||||||||||||||||||||
| Ps. 28,640 | Ps. 23,819 | Ps. 21,935 | ||||||||||||||||||||||||||||||||||||||||||||||||||||||||||||||||||||||
|
|
| ||||||||||||||||||||||||||||||||||||||||||||||||||||||||||||||||||||||
(1) All interest rates are weighted average annual rates. |
(1) All interest rates are weighted average annual rates. |
| ||||||||||||||||||||||||||||||||||||||||||||||||||||||||||||||||||||||
Hedging Derivative Financial Instruments(1) | 2013 | 2014 | 2015 | 2016 | 2017 | 2018 and Thereafter | 2012 | 2011 | January 1, 2011 | |||||||||||||||||||||||||||||||||||||||||||||||||||||||||||||||
| (notional amounts in millions of Mexican pesos) | (notional amounts in millions of Mexican pesos) | |||||||||||||||||||||||||||||||||||||||||||||||||||||||||||||||||||||||
Cross currency swaps: | ||||||||||||||||||||||||||||||||||||||||||||||||||||||||||||||||||||||||
Units of investments to Mexican pesos and variable rate: | 2,500 | 2,500 | 2,500 | |||||||||||||||||||||||||||||||||||||||||||||||||||||||||||||||||||||
Units of investments to | ||||||||||||||||||||||||||||||||||||||||||||||||||||||||||||||||||||||||
Mexican pesos and variable rate: | — | — | — | 2,500 | — | — | 2,500 | 2,500 | 2,500 | |||||||||||||||||||||||||||||||||||||||||||||||||||||||||||||||
Interest pay rate | 4.7% | 4.7% | 4.8% | — | — | — | 4.7 | % | — | — | 4.7 | % | 4.6 | % | 4.7 | % | ||||||||||||||||||||||||||||||||||||||||||||||||||||||||
Interest receive rate | 4.2% | 4.2% | 4.2% | — | — | — | 4.2 | % | — | — | 4.2 | % | 4.2 | % | 4.2 | % | ||||||||||||||||||||||||||||||||||||||||||||||||||||||||
U. S. dollars to Mexican pesos: | ||||||||||||||||||||||||||||||||||||||||||||||||||||||||||||||||||||||||
Variable to variable | — | 2,553 | — | — | — | — | 2,553 | — | — | |||||||||||||||||||||||||||||||||||||||||||||||||||||||||||||||
Interest pay rate | — | 3.7 | % | — | — | — | — | 3.7 | % | — | — | |||||||||||||||||||||||||||||||||||||||||||||||||||||||||||||
Interest receive rate | — | 1.4 | % | — | — | — | — | 1.4 | % | — | — | |||||||||||||||||||||||||||||||||||||||||||||||||||||||||||||
Interest rate swap: | ||||||||||||||||||||||||||||||||||||||||||||||||||||||||||||||||||||||||
Mexican pesos | ||||||||||||||||||||||||||||||||||||||||||||||||||||||||||||||||||||||||
Variable to fixed rate: | — | 1,600 | 2,500 | — | 1,160 | — | 5,260 | 5,012 | 3,787 | 575 | 1,963 | — | — | — | 6,325 | 6,638 | 5,260 | |||||||||||||||||||||||||||||||||||||||||||||||||||||||
Interest pay rate | 8.1% | 8.1% | 8.4% | 8.1% | 8.9% | 8.2 | % | 8.4 | % | 8.6 | % | — | — | — | 8.4 | % | 8.3 | % | 8.1 | % | ||||||||||||||||||||||||||||||||||||||||||||||||||||
Interest receive rate | 4.8% | 4.8% | 5.1% | 4.9% | 4.9% | 4.9 | % | 5.1 | % | 5.1 | % | — | — | — | 5.0 | % | 4.9 | % | 4.9 | % | ||||||||||||||||||||||||||||||||||||||||||||||||||||
U.S. dollars | ||||||||||||||||||||||||||||||||||||||||||||||||||||||||||||||||||||||||
Variable to fixed rate: | 1,632 | |||||||||||||||||||||||||||||||||||||||||||||||||||||||||||||||||||||||
Interest pay rate | 3.1% | |||||||||||||||||||||||||||||||||||||||||||||||||||||||||||||||||||||||
Interest receive rate | 0.5% | |||||||||||||||||||||||||||||||||||||||||||||||||||||||||||||||||||||||
|
|
|
|
|
|
|
|
| ||||||||||||||||||||||||||||||||||||||||||||||||||||||||||||||||
| (1) | All interest rates are weighted average annual rates. |
For the years ended December 31, 2012 and 2011, interest expense is comprised as follows:
| 2012 | 2011 | |||||||
Interest on debts and borrowings | Ps. 2,029 | Ps. 2,083 | ||||||
Finance charges payable under capitalized interest | (38 | ) | (185 | ) | ||||
Finance charges for employee benefits | 230 | 177 | ||||||
Derivative instruments | 142 | 111 | ||||||
Finance operating charges | 98 | 103 | ||||||
Finance charges payable under finance leases | 45 | 13 | ||||||
|
|
|
| |||||
| Ps. 2,506 | Ps. 2,302 | |||||||
|
|
|
| |||||
On December 4, 2007, the Company obtained the approval from the National Banking and Securities Commission (Comisión Nacional Bancaria y de Valores or “CNBV”) for the issuance of long-term domestic senior notes (“Certificados Bursátiles”) in the amount of Ps. 10,000 (nominal amount) or its equivalent in investment units. As of December 31, 2010,2012, the Company has issued the following domestic senior notes: i) on December 7, 2007, the Company issued domestic senior notes composed of Ps. 3,500 (nominal amount) with a maturity date on November 29, 2013 and a floating interest rate; ii) on December 7, 2007, the Company issued domestic senior notes in the amount of 637,587,000 investment units (Ps. 2,500 nominal amount), with a maturity date on November 24, 2017 and a fixed interest rate, iii) on May 26, 2008, the Company issued domestic senior notes composed of Ps. 1,500 (nominal amount), with a maturity date on May 23, 2011 and a floating interest rate.rate, which was paid at maturity.
Additionally, Coca-Cola FEMSA has the following domestic senior notes: a) issued in the Mexican stock exchange,exchange: i) Ps. 3,0002,500 (nominal amount) with a maturity date in 20122016 and a variable rate;interest rate and ii) Ps. 2,500 (nominal amount) with a maturity date in 2021 and fixed interest rate of 8.3%; b) issued in the NYSE a Yankee Bond of $500 with a bearing interest at a fixed rate of 4.6% and maturity date on February
15, 2020. Propimex, S. de R.L. de C.V. (subsidiary) guaranteed these notes.
During 2012, Coca-Cola FEMSA contracted the following bilateral Bank loans denominated in U.S. dollars: i) $300 (nominal amount) with a maturity date in 2013 and variable interest rate, ii) $200 (nominal amount) with a maturity date in 2014 and variable interest rate and $400 (nominal amount) with a maturity date in 2015 and variable interest rate.
The Company has financing from different institutions under agreements that stipulate different restrictions and covenants, which mainly consist of maximum levels of leverage and capitalization as well as minimum consolidated net worth and debt and interest coverage ratios. As of the date of these consolidated financial statements, the Company was in compliance with all restrictions and covenants contained in its financing agreements.
Note 19.19 Other Income and Expenses Net.
| 2010 | 2009 | 2008 | ||||||||||
Employee profit sharing (see Note 5 S) | Ps. | 785 | Ps. | 1,020 | Ps. | 803 | ||||||
Sale of shares (see Note 6 B) | (1,554 | ) | (35 | ) | (85 | ) | ||||||
Brazil tax amnesty (see Note 24 A) | (179 | ) | (311 | ) | — | |||||||
Vacation provision | — | 333 | — | |||||||||
Write-off of long-lived assets(1) | 9 | 129 | 378 | |||||||||
Severance payments associated with an ongoing benefit | 583 | 127 | 175 | |||||||||
Loss on sale of long-lived assets | 215 | 177 | 166 | |||||||||
Donations | 195 | 116 | 101 | |||||||||
Contingencies | 104 | 152 | 174 | |||||||||
Amortization of unrecognized actuarial loss, net (see Note 3 K) | — | — | 163 | |||||||||
Other | 124 | 169 | 144 | |||||||||
Total | Ps. | 282 | Ps. | 1,877 | Ps. | 2,019 | ||||||
| 2012 | 2011 | |||||||
Gain on sale of shares (see Note 4) | Ps. 1,215 | Ps. | — | |||||
Gain on sale of long-lived assets | 132 | 95 | ||||||
Sale of waste material | 43 | 40 | ||||||
Write off-contingencies | 76 | 80 | ||||||
Others | 279 | 166 | ||||||
|
|
|
| |||||
Other income | Ps. 1,745 | Ps. | 381 | |||||
|
|
|
| |||||
Contingencies associated with prior acquisitions or disposals | 213 | 226 | ||||||
Impairment of non current assets | 384 | 146 | ||||||
Disposal of long-lived assets (1) | 133 | 656 | ||||||
Foreign exchange | 40 | 11 | ||||||
Securities taxes from Colombia | 40 | 197 | ||||||
Severance payments | 349 | 256 | ||||||
Donations (2) | 200 | 200 | ||||||
Effect of new labor law (LOTTT) (see Note 16) (3) | 381 | — | ||||||
Other | 233 | 380 | ||||||
|
|
|
| |||||
Other expenses | Ps. 1,973 | Ps. | 2,072 | |||||
|
|
|
| |||||
| (1) | Charges related to fixed assets retirement from ordinary operations and other long-lived assets. |
| (2) | In this caption are included the gain on the sale of 45% interest held by FEMSA in the parent companies of the Mareña Renovables Wind Power Farm (see Note 10) offsetting to the donation made to Fundación FEMSA, A. C. (see Note 14). |
| (3) | This amount relates to the past service cost related to post-employment by Ps. 381 as a result of the effect of the change in LOTTT and it is included in the consolidated income statement under the “Other expenses” caption. |
20 Financial Instruments
Note 20. Fair Value of Financial Instruments.Instruments
The Company uses a three levelthree-level fair value hierarchy to prioritize the inputs used to measure the fair value.value of its financial instruments. The three input levels of inputs are described as follows:
Level 1:quoted prices (unadjusted) in active markets for identical assets or liabilities that the reporting entity has the ability to access at the measurement date.
Level 2:inputs other than quoted prices included within level 1 that are observable for the asset or liability, either directly or indirectly.
Level 3:are unobservable inputs for the asset or liability. Unobservable inputs shall be used to measure fair value to the extent that observable inputs are not available, thereby allowing for situations in which there is little, if any, market activity for the asset or liability at the measurement date.
The Company measures the fair value of its financial assets and liabilities classified as level 2, applying the income approach method, which estimates the fair value based on expected cash flows discounted to net present value. The following table summarizes the Company’s financial assets and liabilities measured at fair value, as of December 31, 20102012 and 2009:2011 and as of January 1, 2011:
| 2010 | 2009 | |||||||||||||||
| Level 1 | Level 2 | Level 1 | Level 2 | |||||||||||||
Cash equivalents | Ps. | 19,770 | Ps. | 9,950 | ||||||||||||
Marketable securities | 66 | 2,113 | ||||||||||||||
Pension plan trust assets | 1,544 | 1,183 | ||||||||||||||
Derivative financial instruments (asset) | Ps. | 732 | Ps. | 507 | ||||||||||||
Derivative financial instruments (liability) | 694 | 598 | ||||||||||||||
| December 31, 2012 | December 31, 2011 | January 1, 2011 | ||||||||||||||||||||||
| Level 1 | Level 2 | Level 1 | Level 2 | Level 1 | Level 2 | |||||||||||||||||||
Available-for-sale investments | 12 | 330 | 66 | |||||||||||||||||||||
Derivative financial instrument (current asset) | 106 | 530 | 15 | |||||||||||||||||||||
Derivative financial instrument (non-current asset) | 1,144 | 850 | 707 | |||||||||||||||||||||
Derivative financial instrument (current liability) | 279 | 5 | 8 | |||||||||||||||||||||
Derivative financial instrument (non-current liability) | 212 | 563 | 651 | |||||||||||||||||||||
The Company does not use inputshas no assets or liabilities classified as level 3 for fair value measurement.
20.1 Total debt
The fair value of long-term debtbank and syndicated loans is determinedcalculated based on the discounted value of contractual cash flows in whichwhereby the discount rate is estimated using rates currently offered for debt of similar amounts and maturities.maturities, which is considered to be level 2 in the fair value hierarchy. The fair value of notesthe Company’s publicly traded debt is based on quoted market prices.prices as of December 31, 2012 and 2011 and as of January 1, 2011, which is considered to be level 1 in the fair value hierarchy.
| 2010 | 2009 | 2012 | 2011 | January 1, 2011 | ||||||||||||||||
Carrying value | Ps. | 25,506 | Ps. | 29,799 | Ps. 37,342 | Ps. 29,392 | Ps. 25,238 | |||||||||||||
Fair value | 25,451 | 29,673 | 38,456 | 30,302 | 25,451 | |||||||||||||||
20.2 Interest rate swaps
The Company uses interest rate swaps to offset the interest rate risk associated with its borrowings, pursuant to which it pays amounts based on a fixed rate and receives amounts based on a floating rate. These instruments have been designated as cash flow hedges and are recognized in the consolidated balance sheetstatement of financial position at their estimated fair value and have been designated as a cash flow hedge.value. The estimated fair value is based onestimated using formal technical models. The valuation method involves discounting to present value the expected cash flows of interest, calculated from the rate curve of the cash flow currency, and expresses the net result in the reporting currency. Changes in fair value wereare recorded in cumulative other comprehensive income, net of taxes until such time as the hedged amount is recorded in earnings.the consolidated income statements.
At December 31, 2010,2012, the Company has the following outstanding interest rate swap agreements:
Maturity Date | Notional Amount | Fair Value Asset (Liability) | Notional Amount | Fair Value Liability December 31, 2012 | Asset | |||||||||||||||
2011 | Ps. | — | Ps. | — | ||||||||||||||||
2012 | 1,600 | (57 | ) | |||||||||||||||||
2013 | 3,812 | (185 | ) | Ps. 3,787 | Ps. (82 | ) | Ps. 5 | |||||||||||||
2014 | 575 | (24 | ) | 575 | (33 | ) | 2 | |||||||||||||
2015 and thereafter | 1,963 | (152 | ) | |||||||||||||||||
2015 | 1,963 | (160 | ) | 5 | ||||||||||||||||
At December 31, 2011 the Company has the following outstanding interest rate swap agreements:
Maturity Date | Notional Amount | Fair Value Liability December 31, 2011 | Asset | |||||||||
2012 | Ps. 1,600 | Ps. | (16) | Ps. 4 | ||||||||
2013 | 3,812 | (181) | — | |||||||||
2014 | 575 | (45) | 2 | |||||||||
2015 | 1,963 | (189) | 5 | |||||||||
A portion of certain interest rate swaps do not meet the hedging criteria for accounting purposes;hedge accounting; consequently, changes in the estimated fair value of the ineffective portionthese portions were recorded inwithin the consolidated results as part ofincome statements under the comprehensive financing result.caption “market value gain(loss) on financial instruments.”
The net effect of expired contracts that met hedging criteria istreated as hedges are recognized as interest expense as part ofwithin the comprehensive financing result.consolidated income statements.
20.3 Forward agreements to purchase foreign currency
The Company entershas entered into forward agreements to reduce its exposure to the risk of exchange rate fluctuations between the Mexican peso and other currencies. Foreign exchange forward contracts measured at fair value are designated hedging instruments in cash flow hedge of forecast inflows in Euros and forecast purchases of raw materials in U. S. dollars. These forecast transactions are highly probable.
These instruments have been designated as cash flow hedges and are recognized in the consolidated balance sheetstatement of financial position at their estimated fair value which is determined based on prevailing market exchange rates to endterminate the contracts at the end of the period. For contracts that meet hedging criteria,The price agreed in the changesinstrument is compared to the current price of the market forward currency and is discounted to present value of the rate curve of the relevant currency. Changes in the fair value of these forwards are recorded inas part of cumulative other comprehensive income, prior to expiration.net of taxes. Net gain/loss on expired contracts is recognized as part of cost of goods sold when the raw material is included in sale transaction, and as a part of foreign exchange.exchange when the inflow in Euros are received.
Net changes in the fair value of forward agreements that do not meet hedging criteria for hedge accounting purposes are recorded in the consolidated resultsincome statements under the caption “market value gain (loss) on financial instruments.”
At December 31, 2012, the Company had the following outstanding forward agreements to purchase foreign currency:
Maturity Date | Notional Amount | Fair Value Asset Decembe r 31, 2012 | ||||||
2013 | Ps. 2,803 | Ps. 36 | ||||||
At December 31, 2011, the Company had the following outstanding forward agreements to purchase foreign currency:
Maturity Date | Notional Amount | Fair Value Asset December 31, 2011 | ||||||
2012 | Ps. 2,933 | Ps. 183 | ||||||
20.4 Options to purchase foreign currency
The Company has entered into a collar strategy to reduce its exposure to the risk of exchange rate fluctuations. A collar is a strategy that limits the exposure to the risk of exchange rate fluctuations in a similar way as a forward agreement.
These instruments have been designated as cash flow hedges and are recognized in the consolidated statement of financial position at their estimated fair value which is determined based on prevailing market exchange rates to terminate the contracts at the end of the period. They are valued based on the Black & Scholes model, doing a split in the intrinsic and extrinsic value. Changes in the fair value of these options, corresponding to the intrinsic value are initially recorded as part of cumulative other comprehensive income, net of taxes. Changes in the fair value, corresponding to the extrinsic value are recorded in the consolidated income statements under the caption “market value gain (loss) on financial instruments,” as part of the comprehensive financing result. Theconsolidated net effect ofincome. Net gain (loss) on expired contracts that do not meet hedging criteria for accounting purposes is recognized as part of cost of goods sold when the raw material is affecting the cost of good sold.
At December 31, 2012, the Company had the following outstanding collars to purchase foreign currency (composed of a market value gain/loss oncall and a put option with different strike levels with the ineffective portion of derivative financial instruments.same notional amount and maturity):
| Notional Amount | December 31, 2012 | ||||||
2013 | Ps. 982 | Ps. 47 | ||||||
At December 31, 2011, the Company had the following outstanding collars to purchase foreign currency (composed of a call and a put option with different strike levels with the same notional amount and maturity):
Maturity Date | Notional Amount | Fair Value Asset December 31, 2011 | ||||||
2012 | Ps. 1,901 | Ps. 300 | ||||||
20.5 Cross-currency swaps
The Company enters into cross currencyhas contracted for a number of cross-currency swaps to reduce its exposure to risks of exchange rate and interest rate fluctuations associated with its borrowings denominated in U.S.U. S. dollars and other foreign currencies. Cross-Currency swaps contracts are designated as hedging instruments through which the Company changes dollar and Units of Investments (UDIs) denominated debt to Mexican Peso denominated debt.
These instruments are recognized in the consolidated balance sheetstatement of financial position at their estimated fair value which is estimated based onusing formal technical models. TheseThe valuation method involves discounting to present value the expected cash flows of interest, calculated from the rate curve of the cash flow currency, and expresses the net result in the reporting currency. The Company has contracts that are designated as fair value hedges. The fair valuevalues changes related to those cross currency swaps wereare recorded as part ofunder the ineffective portion of derivativecaption “market value gain (loss) on financial instruments,” net of changes related to the long-term liability.liability, within the consolidated income statements.
Net changes in the fair value of currentThe Company has Cross-Currency contracts designated as cash flow hedges and expired cross currency swaps contracts that did not meet the hedging criteria for accounting purposes are recorded as a gain/loss in the market value on the ineffective portion of derivative financial instrumentsrecognized in the consolidated resultsstatement of financial position at their estimated fair value. Changes in fair value are recorded in cumulative other comprehensive income, net of taxes until such time as part of the comprehensive financing result.hedge amount is recorded in the consolidated income statement.
At December 31, 2012, the Company had the following outstanding cross currency swap agreements:
Maturity Date | Notional Amount | Fair Value Asset December 31, 2012 | ||||||
2014 | Ps.2,553 | Ps. | 46 | |||||
2017 | 2,711 | 1,089 | ||||||
At December 31, 2011, the Company had the following outstanding cross currency swap agreements:
| Notional Amount | December 31, 2011 | ||||||
2017 | Ps. 2,500 | Ps. 860 | ||||||
20.6 Commodity price contracts
The Company entershas entered into various commodity price contracts to reduce its exposure to the risk of fluctuation in the costs of certain raw material. Those commodities contracts are designated as hedging instruments of purchases of sugar and aluminum.
These instruments have been designated as cash flow hedges and are recognized in the consolidated statement of financial position at their estimated fair value. The fair value is estimated based on the market valuations to end ofterminate the contracts at the closing date of closing of the period. Commodity price contracts are valued by the Company, based on publicly quoted prices in futures market of Intercontinental Exchange. Changes in the fair value were recorded inas part of cumulative other comprehensive income.income, net of taxes.
Changes in theThe fair value of expired commodity price contracts werecontract was recorded in cost of sales.sales where the hedged item was recorded. At December 31, 2012, the Company had the following outstanding commodity price contract:
Maturity Date | Notional Amount | Fair Value Liability December 31, 2012 | ||||||
2013 | Ps. 1,902 | Ps. (156 | ) | |||||
2014 | 856 | (34 | ) | |||||
2015 | 213 | (10 | ) | |||||
TheAt December 31, 2011, the Company has determinedhad the following outstanding commodity price contract:
Maturity Date | Notional Amount | Fair Value Liability December 31, 2011 | ||||||
2012 | Ps. 427 | Ps. (14 | ) | |||||
2013 | 327 | (5 | ) | |||||
20.7 Net effects of expired contracts that its leasing contracts denominatedmet hedging criteria
Type of Derivatives | Impact in Consolidated Income Statement | 2012 | 2011 | |||||||
Interest rate swaps | Interest expense | Ps. (147 | ) | Ps. (120 | ) | |||||
Forward agreements to purchase foreign currency | Foreign exchange | 126 | — | |||||||
Cross-currency swaps | Foreign Exchange / Interest expense | (44 | ) | 8 | ||||||
Commodity price contracts | Cost of goods sold | 6 | 257 | |||||||
Options to purchase foreign currency | Cost of goods sold | 13 | — | |||||||
Forward agreements to purchase foreign currency | Cost of goods sold | — | 21 | |||||||
20.8 Net effect of changes in U.S. dollars host embeddedfair value of derivative financial instruments. The fair value is estimated based on formal technical models. Changesinstruments that did not meet the hedging criteria for accounting purposes
Some Interest Rate Swaps do not meet the hedging criteria for accounting purposes; consequently changes in the estimated fair value were recorded in current earnings in the comprehensive financing resultconsolidated results as part of market value gain (loss) on derivative financial instruments.
Type of Derivatives | Impact in Consolidated Income Statement | 2012 | 2011 | |||||||
Cross-currency swaps | Market value loss on financial instruments | (2 | ) | (2 | ) | |||||
20.9 Net effect of expired contracts that did not meet the hedging criteria for accounting purposes
Type of Derivatives | Impact in Consolidated Income Statement | 2012 | 2011 | |||||||
Cross-currency swaps | Market value gain (loss) on financial instruments | 42 | (144 | ) | ||||||
Interest rate swaps | (4 | ) | — | |||||||
Others | (29 | ) | 37 | |||||||
20.10 Market risk
Market risk is the risk that the fair value of future cash flow of a financial instrument will fluctuate because of changes in market prices. Market prices include currency risk and commodity price risk.
The Company’s activities expose it primarily to the financial risks of changes in foreign currency exchange rates and commodity prices. The Company enters into a variety of derivative financial instruments to manage its exposure to foreign currency risk, and commodity prices risk including:
Forward Agreements to Purchase Foreign Currency in order to reduce its exposure to the risk of exchange rate fluctuations.
Cross-Currency Swaps in order to reduce its exposure to the risk of exchange rate fluctuations.
Commodity price contracts in order to reduce its exposure to the risk of fluctuation in the costs of certain raw materials.
The Company tracks the fair value (mark to market) of our derivative financial instruments and its possible changes using scenario analyses.
The following disclosures provide a sensitivity analysis of the market risks management considered to be reasonably possible at the end of the reporting period, which the Company is exposed to as it relates to foreign exchange rates and commodity prices, which it considers in its existing hedging strategy:
Foreign Currency Risk(1)(2) | Change in Exchange Rate | Effect on Equity | Effect on Profit or Loss | |||||||||
2012 | ||||||||||||
FEMSA | +9% EUR/+11% USD | Ps. (250 | ) | Ps. | — | |||||||
| -9% EUR/-11% USD | 104 | — | ||||||||||
Coca-Cola FEMSA | -11% USD | (438 | ) | — | ||||||||
2011 | ||||||||||||
FEMSA | +13% EUR/+15% USD | Ps. (189 | ) | Ps. | — | |||||||
| -13% EUR/-15% USD | 191 | — | ||||||||||
Coca-Cola FEMSA | -15% USD | (352 | ) | (127 | ) | |||||||
|
|
|
|
|
| |||||||
Net Cash in Foreign Currency(1) | Change in Exchange Rate | Effect on Profit or Loss | ||||||
2012 | ||||||||
FEMSA | +9% EUR/+11% USD | Ps. | 809 | |||||
| -9% EUR/-11% USD | (809 | ) | ||||||
Coca-Cola FEMSA | +15% USD | (362 | ) | |||||
2011 | +13% EUR/+15% USD | Ps. | 1,188 | |||||
FEMSA | -13% EUR/-15% USD | (1,188 | ) | |||||
Coca-Cola FEMSA | +16% USD | (398 | ) | |||||
|
|
|
| |||||
Commodity Price Contracts(1) | Change in U. S. $ Rate | Effect on Equity | ||||||
2012 | ||||||||
Coca-Cola FEMSA | Sugar - 30 | % | (732 | ) | ||||
| luminum - 20 | % | (66 | ) | |||||
2011 | ||||||||
Coca-Cola FEMSA | Sugar - 40 | % | (294 | ) | ||||
|
|
|
| |||||
| Notional Amounts | Fair Value | |||||||||||
| 2010 | 2009 | |||||||||||
CASH FLOW HEDGE: | ||||||||||||
Assets: | ||||||||||||
Forward agreements | Ps. | 578 | Ps. | 2 | (1) | Ps. | — | |||||
Commodity price contracts | 451 | 445 | (2) | 133 | ||||||||
Interest rate swaps | 3 | |||||||||||
Liabilities: | ||||||||||||
Forward agreements | Ps. | 1,690 | Ps. | 18 | (1) | Ps. | — | |||||
Interest rate swaps | 7,950 | 418 | (3) | 213 | ||||||||
FAIR VALUE HEDGE: | ||||||||||||
Assets: | ||||||||||||
Cross currency swaps | Ps. | 2,500 | Ps. | 717 | Ps. | 480 | ||||||
| (2) |
20.11 Interest rate risk
Types of Derivatives | Impact in Income | 2010 | 2009 | 2008 | ||||||||||
Interest rate swaps | Interest expense | Ps. | (181 | ) | Ps. | (67 | ) | Ps. | 44 | |||||
Forward agreements | Foreign exchange | 27 | — | — | ||||||||||
Cross currency swaps | Foreign exchange/ interest expense | 2 | (32 | ) | (73 | ) | ||||||||
Commodity price contract | Cost of sales | 393 | 247 | 2 | ||||||||||
Interest rate risk is the risk that the fair value or future cash flow of a financial instrument will fluctuate because of changes in market interest rates.
The Company is exposed to interest rate risk because it and its subsidiaries borrow funds at both fixed and floating interest rates. The risk is managed by the Company by maintaining an appropriate mix between fixed and floating rate borrowings, and by the use of the difference derivative financial instruments. Hedging activities are evaluated regularly to align with interest rate views and defined risk appetite, ensuring the most cost-effective hedging strategies are applied.
The following disclosures provide a sensitivity analysis of the interest rate risks management considered to be reasonably possible at the end of the reporting period, which the Company is exposed to as it relates to its fixed and floating rate borrowings, which it considers in its existing hedging strategy:
| 2012 | 2011 | |||||||
Change in interest rate | +100 Bps. | +100 Bps. | ||||||
Effect on profit or loss | Ps. (198 | ) | Ps. (98 | ) | ||||
|
|
|
| |||||
20.12 Liquidity risk
Each of the Company’s sub-holding companies generally finances its operational and capital requirements on an independent basis. As of December 31, 2012 and 2011, 82.4% and 76.9%, respectively of the Company’s outstanding consolidated total indebtedness was at the level of its sub-holding companies. This structure is attributable, in part, to the inclusion of third parties in the capital structure of Coca-Cola FEMSA. Currently, the Company’s management expects to continue to finance its operations and capital requirements primarily at the level of its sub-holding companies. Nonetheless, they may decide to incur indebtedness at our holding company in the future to finance the operations and capital requirements of the Company’s subsidiaries or significant acquisitions, investments or capital expenditures. As a holding company, the Company depends on dividends and other distributions from our subsidiaries to service the Company’s indebtedness.
The Company’s principal source of liquidity has generally been cash generated from its operations. The Company has traditionally been able to rely on cash generated from operations because a significant majority of the sales of Coca-Cola FEMSA and FEMSA Comercio are on a cash or short-term credit basis, and FEMSA Comercio’s OXXO stores are able to finance a significant portion of their initial and ongoing inventories with supplier credit. The Company’s principal use of cash has generally been for capital expenditure programs, debt repayment and dividend payments. Nonetheless, as a result of regulations in certain countries in which the Company operates, it may not be beneficial or, as in the case of exchange controls in Venezuela, practicable to remit cash generated in local operations to fund cash requirements in other countries. Exchange controls like those in Venezuela may also increase the real price of remitting cash from operations to fund debt requirements in other countries. In addition, the Company’s liquidity in Venezuela could be affected by changes in the rules applicable to exchange rates as well as other regulations, such as exchange controls.
Ultimate responsibility for liquidity risk management rests with the Company’s board of directors, which has established an appropriate liquidity risk management framework for the management of the Company’s short-, medium- and long-term funding and liquidity management requirements. The Company manages liquidity risk by maintaining adequate reserves and credit facilities, by continuously monitoring forecast and actual cash flows, and by matching the maturity profiles of financial assets and liabilities. The Company has access to credit in order to face treasury needs; besides, the Company has the highest investor grade (AAA) given by independent rating agencies in Mexico, allowing the Company to evaluate capital markets in case it needs resources.
The Company’s management continuously evaluates opportunities to pursue acquisitions or engage in joint ventures or other transactions. We would expect to finance any significant future transactions with a combination of cash from operations, long- term indebtedness and capital stock.
The Company’s sub-holding companies generally incur short-term indebtedness in the event that they are temporarily unable to finance operations or meet any capital requirements with cash from operations. A significant decline in the business of any of the Company’s sub-holding companies may affect the sub-holding company’s ability to fund its capital requirements. A significant and prolonged deterioration in the economies in which we operate or in the Company’s businesses may affect the Company’s ability to obtain short-term and long-term credit or to refinance existing indebtedness on terms satisfactory to the Company’s management.
The Company presents the maturity dates associated with its long-term financial liabilities as of December 31, 2012, see Note 18. The Company generally makes payments associated with its long-term financial liabilities with cash generated from its operations.
See Note 18 for a disclosure of the Company’s maturity dates associated with its non-current financial liabilities as of December 31, 2012.
The following table reflects all contractually fixed pay-offs for settlement, repayments and interest resulting from recognized financial liabilities. It includes expected net cash outflows from derivative financial liabilities that are in place as per December
31, 2012. Such expected net cash outflows are determined based on each particular settlement date of an instrument. The amounts disclosed are undiscounted net cash outflows for the respective upcoming fiscal years, based on the earliest date on which the Company could be required to pay. Cash outflows for financial liabilities (including interest) without fixed amount or timing are based on economic conditions (like interest rates and foreign exchange rates) existing at December 31, 2012.
Types of Derivatives | Impact in Income Statement | 2010 | 2009 | 2008 | ||||||||||
Interest rate swaps | Market value gain (loss) on ineffective portion of derivative financial instruments | Ps. (7 | ) | Ps. — | Ps. 24 | |||||||||
Forwards for purchase of foreign currency | — | (63 | ) | (705 | ) | |||||||||
Cross currency swaps | 205 | 168 | (200 | ) | ||||||||||
(in millions of Ps.) | 2013 | 2014 | 2015 | 2016 | 2017 | 2018 and Thereafter | ||||||||||||||||||
Non-derivative financial liabilities: | ||||||||||||||||||||||||
Notes and bonds | 910 | 629 | 629 | 3,059 | 746 | 10,260 | ||||||||||||||||||
Loans from banks | 5,448 | 5,695 | 8,158 | 11 | 11 | 22 | ||||||||||||||||||
Obligations under finance leases | 199 | 8 | 7 | 2 | — | — | ||||||||||||||||||
Derivatives financial liabilities | 235 | 55 | 50 | (15 | ) | (645 | ) | — | ||||||||||||||||
|
|
|
|
|
|
|
|
|
|
|
| |||||||||||||
The Company generally makes payments associated with its non-current financial liabilities with cash generated from its operations.
Types of Derivatives | Impact in Income | 2010 | 2009 | 2008 | ||||||||||
Embedded derivative financial instruments | Market value gain (loss) on ineffective portion of derivative financial instruments | Ps. | 15 | Ps. | 19 | Ps. | (68 | ) | ||||||
Others | (1 | ) | — | (1 | ) | |||||||||
Note 21. Noncontrolling20.13 Credit risk
Credit risk refers to the risk that a counterparty will default on its contractual obligations resulting in financial loss to the Company. The Company has adopted a policy of only dealing with creditworthy counterparties, where appropriate, as a means of mitigating the risk of financial loss from defaults. The Company only transacts with entities that are rated the equivalent of investment grade and above. This information is supplied by independent rating agencies where available and, if not available, the Company uses other publicly available financial information and its own trading records to rate its major customers. The Company’s exposure and the credit ratings of its counterparties are continuously monitored and the aggregate value of transactions concluded is spread amongst approved counterparties. Credit exposure is controlled by counterparty limits that are reviewed and approved by the risk management committee.
The Company has a high receivable turnover; hence management believes credit risk is minimal due to the nature of its businesses, which have a large portion of their sales settled in cash.
The credit risk on liquid funds and derivative financial instruments is limited because the counterparties are banks with high credit-ratings assigned by international credit-rating agencies.
The Company manages the credit risk related to its derivative portfolio by only entering into transactions with reputable and credit- worthy counterparties as well as by maintaining in some cases a Credit Support Annex (CSA) that establishes margin requirements. As of December 31, 2012, the Company concluded that the maximum exposure to credit risk related with derivative financial instruments is not significant given the high credit rating of its counterparties.
21 Non-Controlling Interest in Consolidated Subsidiaries.Subsidiaries
An analysis of FEMSA’s noncontrollingnon-controlling interest in its consolidated subsidiaries for the years ended December 31, 20102012 and 20092011 and as of January 1, 2011 is as follows:
| 2010 | 2009 | December 31, 2012 | December 31, 2011 | January 1, 2011 | ||||||||||||||||
Coca-Cola FEMSA | Ps. | 35,585 | Ps. | 32,918 | Ps. 54,902 | (2) | Ps. 47,906 | (1) | Ps. 31,485 | |||||||||||
FEMSA Cerveza | — | 1,219 | ||||||||||||||||||
Other | 80 | 55 | — | 43 | 36 | |||||||||||||||
|
|
| ||||||||||||||||||
| Ps. | 35,665 | Ps. | 34,192 | Ps. 54,902 | Ps.47,949 | Ps.31,521 | ||||||||||||||
|
|
| ||||||||||||||||||
| (1) | Changes compared to the prior year mainly resulted from the acquisitions of Grupo Tampico and CIMSA (see Note 4). |
| (2) | Changes compared to the prior year mainly resulted from the acquisition FOQUE (see Note 4). |
The changes in the FEMSA’s non-controlling interest were as follows:
| 2012 | 2011 | |||||||||||
Initial balance | Ps. 47,949 | Ps. 31,521 | ||||||||||
Net income of non controlling interest Other comprehensive income: | 7,344 | 5,569 | ||||||||||
Exchange diferences on translation foreign operation | (1,342 | ) | 1,944 | |||||||||
Remeasurements of the net defined benefits liability | (60 | ) | 6 | |||||||||
Valuation of the effective portion of derivative financial instruments | (113 | ) | (15 | ) | ||||||||
Acquisitions effects (see Note 4) | 4,172 | 11,038 | ||||||||||
Disposal effects | (50 | ) | (70 | ) | ||||||||
Dividends | (2,986 | ) | (2,025 | ) | ||||||||
Share based payment | (12 | ) | (19 | ) | ||||||||
|
|
|
| |||||||||
Ending balance | Ps.54,902 | Ps.47,949 | ||||||||||
|
|
|
| |||||||||
Non controlling cumulative other comprehensive income is comprised as follows: | ||||||||||||
| December 31, 2012 | December 31, 2011 | January 1, 2011 | ||||||||||
Exchange diferences on translation foreign operation | Ps. 602 | Ps. 1,944 | Ps. — | |||||||||
Remeasurements of the net defined benefits liability | (126 | ) | (66 | ) | (72 | ) | ||||||
Valuation of the effective portion of derivative financial instruments | (72 | ) | 41 | 56 | ||||||||
|
|
|
|
|
| |||||||
Cumulative other comprehensive income | Ps. 404 | Ps. 1,919 | Ps. (16 | ) | ||||||||
|
|
|
|
|
| |||||||
Note 22. Stockholders’ Equity.22 Equity
22.1 Shareholders’ equity accounts
The capital stock of FEMSA is comprised of 2,161,177,770 BD units and 1,417,048,500 B units.
As of December 31, 20102012 and 2009,2011 and as of January 1, 2011, the capital stock of FEMSA was comprised of 17,891,131,350 common shares, without par value and with no foreign ownership restrictions. Fixed capital stock amounts to Ps. 300 (nominal value) and the variable capital may not exceed 10 times the minimum fixed capital stock amount.
The characteristics of the common shares are as follows:
Series “B” shares, with unlimited voting rights, which at all times must represent a minimum of 51% of total capital stock;
Series “L” shares, with limited voting rights, which may represent up to 25% of total capital stock; and
Series “D” shares, with limited voting rights, which individually or jointly with series “L” shares may represent up to 49% of total capital stock.
The Series “D” shares are comprised as follows:
Subseries “D-L” shares may represent up to 25% of the series “D” shares;
Subseries “D-B” shares may comprise the remainder of outstanding series “D” shares; and
The non-cumulative premium dividend to be paid to series “D” stockholdersshareholders will be 125% of any dividend paid to series “B” stockholders.shareholders.
The Series “B” and “D” shares are linked together in related units as follows:
“B units” each of which represents five series “B” shares and which are traded on the BMV;
“BD units” each of which represents one series “B” share, two subseries “D-B” shares and two subseries “D-L” shares, and which are traded both on the BMV and the NYSE;
The Company’s statutes addressed that in May 2008, shares structure established in 1998 would be modified, unlinking subseries “D-B” into “B” shares and unlinking subseries “D-L” into “L” shares.
At an ordinary stockholders’ meeting of FEMSA held on April 22, 2008, it was approved to modify the Company’s statutes in order to preserve the unitary shares structure of the Company established on May 1998, and also to maintain the shares structure established after May 11, 2008.
As of December 31, 20102012 and 2009,2011 and as of January 1, 2011, FEMSA’s outstanding capital stock is comprised as follows:
| “B” Units | “BD” Units | Total | ||||||||||
Units | 1,417,048,500 | 2,161,177,770 | 3,578,226,270 | |||||||||
|
|
|
|
|
| |||||||
Shares: | ||||||||||||
Series “B” | 7,085,242,500 | 2,161,177,770 | 9,246,420,270 | |||||||||
Series “D” | — | 8,644,711,080 | 8,644,711,080 | |||||||||
Subseries “D-B” | — | 4,322,355,540 | 4,322,355,540 | |||||||||
Subseries “D-L” | — | 4,322,355,540 | 4,322,355,540 | |||||||||
|
|
|
|
|
| |||||||
Total shares | 7,085,242,500 | 10,805,888,850 | 17,891,131,350 | |||||||||
|
|
|
|
|
| |||||||
The net income of the Company is subject to the legal requirement that 5% thereof be transferred to a legal reserve until such reserve equals 20% of capital stock at nominal value. This reserve may not be distributed to stockholdersshareholders during the existence of the Company, except as a stock dividend. As of December 31, 2010,2012 and 2011 and January 1, 2011, this reserve in FEMSA amounted to Ps. 596 (nominal value).596.
Retained earnings and other reserves distributed as dividends, as well as the effects derived from capital reductions, are subject to income tax at the rate in effect at the date of distribution, except for restated stockholder contributions and distributions made from consolidated taxable income, denominated “Cuenta de Utilidad Fiscal Neta” (“CUFIN”).
Dividends paid in excess of CUFIN are subject to income tax at a grossed-up rate based on the current statutory rate. Since 2003, this tax may be credited against the income tax of the year in which the dividends are paid, and in the following two years against the income tax and estimated tax payments. As of December 31, 2010,2012, FEMSA’s balances of CUFIN amounted to Ps. 55,369.69,890.
At the ordinary stockholders’shareholders’ meeting of FEMSA held on April 26, 2010, stockholders approved dividends of Ps. 0.12966 Mexican pesos (nominal value) per series “B” share and Ps. 0.16208 Mexican pesos (nominal value) per series “D” share that were paid in May and November, 2010. Additionally,March 23, 2012, the stockholdersshareholders approved a reserve for share repurchase of a maximum of Ps. 3,000.
As of December 31, 2010,2012, the Company has not repurchased shares. Treasury shares resulted from share- based payment bonus plan are disclosed in Note 17.
At an ordinary stockholders’shareholders’ meeting of Coca-Cola FEMSA held on April 14, 2010,March 20, 2012, the stockholdersshareholders approved a dividend of Ps. 2,6045,625 that was paid in April 2010.on May 30, 2012. The corresponding payment to the noncontrollingnon-controlling interest was Ps. 1,205.
As ofFor the years ended December 31, 2010, 20092012 and 20082011 the dividends declared and paid by the Company and Coca-Cola FEMSA were as follows:
| 2010 | 2009 | 2008 | 2012 | 2011 | ||||||||||||||||
FEMSA | Ps. 2,600 | Ps. 1,620 | Ps. 1,620 | Ps. 6,200 | Ps. 4,600 | |||||||||||||||
Coca-Cola FEMSA (100% of dividend) | 2,604 | 1,344 | 945 | 5,625 | 4,358 | |||||||||||||||
For the years ended December 31, 2012 and 2011 the dividends declared and paid per share by the Company are as follows:
Series of Shares | 2012 | 2011 | ||||||
“B” | Ps. 0.30919 | Ps. 0.22940 | ||||||
“D” | 0.38649 | 0.28675 | ||||||
Note 23. Net Controlling Interest Income per Share.22.2 Capital management
This representsThe Company manages its capital to ensure that its subsidiaries will be able to continue as going concerns while maximizing the return to stakeholders through the optimization of its debt and equity balances in order to obtain the lowest cost of capital available. The Company manages its capital structure and makes adjustments to it in light of changes in economic conditions. To maintain or adjust the capital structure, the Company may adjust the dividend payment to shareholders, return capital to shareholders or issue new shares. No changes were made in the objectives, policies or processes for managing capital during the years ended December 31, 2012 and 2011.
The Company is not subject to any externally imposed capital requirements, other than the legal reserve (see Note 22.1).
The Company’s finance committee reviews the capital structure of the Company on a quarterly basis. As part of this review, the committee considers the cost of capital and the risks associated with each class of capital. In conjunction with this objective, the Company seeks to maintain the highest credit rating both nationally and internationally and is currently rated AAA in Mexico and BBB in the United States, which requires it to have a debt to earnings before interest, taxes, depreciation and amortization (“EBITDA”) ratio lower than 2. As a result, prior to entering into new business ventures, acquisitions or divestures, management evaluates the optimal ratio of debt to EBITDA in order to maintain its high credit rating.
23 Earnings per Share
Basic earnings per share amounts are calculated by dividing consolidated net income for the year attributable to controlling interest income corresponding to each share of the Company’s capital stock, computed on the basis ofby the weighted average number of shares outstanding during the period adjusted for the weighted average of own shares purchased in the period. Additionally, the
Diluted earnings per share amounts are calculated by dividing consolidated net income distribution is presented accordingfor the year attributable to controlling interest by the dividend rights of each share series.
The following presents the computed weighted average number of shares andoutstanding during the distributionperiod plus the weighted average number of shares for the effects of dilutive potential shares (originated by the Company’s share based payment program).
| 2012 | 2011 | |||||||||||||||
| Per Series “B” Shares | Per Series “D” Shares | Per Series “B” Shares | Per Series “D” Shares | |||||||||||||
Net Controlling Interest Income | 9,548.21 | 11,158.58 | 7,069.69 | 8,262.04 | ||||||||||||
Shares expressed in millions: | ||||||||||||||||
Weighted average number of shares for basic earnings per share | 9,237.49 | 8,609.00 | 9,236.62 | 8,605.49 | ||||||||||||
Effect of dilution associated with nonvested shares for share based payment plans | 8.93 | 35.71 | 9.80 | 39.22 | ||||||||||||
Weighted average number of shares adjusted for the effect of dilution | 9,246.42 | 8,644.71 | 9,246.42 | 8,644.71 | ||||||||||||
24 Income Taxes
24.1 Income Tax
The major components of income per share series as oftax expense for the years ended December 31, 2010, 20092012 and 2008:2011 are:
| Millions of Shares | ||||||||||||||||
| Series “B” | Series “D” | |||||||||||||||
| Number | Weighted Average | Number | Weighted Average | |||||||||||||
Shares outstanding as of December 31, 2010, 2009 and 2008 | 9,246.42 | 9,246.42 | 8,644.71 | 8,644.71 | ||||||||||||
Dividend rights | 1.00 | 1.25 | ||||||||||||||
Allocation of earnings | 46.11 | % | 53.89 | % | ||||||||||||
| 2012 | 2011 | |||||||
Current tax expense | Ps. 7,412 | Ps. 7,519 | ||||||
Deferred tax expense | 537 | 99 | ||||||
|
|
|
| |||||
| Ps. 7,949 | Ps. 7,618 | |||||||
|
|
|
| |||||
Note 24 Taxes.Recognized in Consolidated Statement of Other Comprehensive Income (OCI)
Income tax related to items charged or recognized directly in OCI during the year | December 31, 2012 | December 31, 2011 | ||||||
Unrealized (gain) loss on cash flow hedges | Ps. (120) | Ps. 43 | ||||||
Unrealized (gain) loss on available for sale securities | (1 | ) | 2 | |||||
Exchange differences on translation of foreign operations | (1,012 | ) | 1,930 | |||||
Remeasurements of the net defined benefit liability | (113 | ) | (18 | ) | ||||
Share of the other comprehensive income of associates companies and joint ventures | (304 | ) | (542 | ) | ||||
|
|
|
| |||||
Total income tax (benefit) cost recognized in OCI | Ps. (1,550) | Ps. 1,415 | ||||||
|
|
|
| |||||
IncomeA reconciliation between tax is computed on taxable income, which differs from net income for accounting purposes principally due to the treatment of the comprehensive financing result, the cost of labor liabilities, depreciationexpense and other accounting provisions. A tax loss may be carried forward and applied against future taxable income.
| Domestic | Foreign | |||||||||||||||||||||||
| 2010 | 2009 | 2008 | 2010 | 2009 | 2008 | |||||||||||||||||||
Income before income tax from continuing operations | Ps. 13,585 | Ps. 10,278 | Ps. 8,422 | Ps. 12,356 | Ps. 7,549 | Ps. 3,455 | ||||||||||||||||||
Income tax: | ||||||||||||||||||||||||
Current income tax | 2,643 | 2,839 | 2,718 | 2,211 | 2,238 | 1,727 | ||||||||||||||||||
Deferred income tax | 264 | (401 | ) | (1,310 | ) | 553 | 283 | (27 | ) | |||||||||||||||
The difference to sum consolidated income before income tax is mainly dividends which are eliminated in the consolidated financial statementtaxes and share of the Company. profit or loss of associates and joint ventures accounted for using the equity method multiplied by the Mexican domestic tax rate for the years ended December 31, 2012 and 2011 is as follows:
| 2012 | 2011 | |||||||
Mexican statutory income tax rate | 30.0 | % | 30.0 | % | ||||
Difference between book and tax inflationary effects | (1.1 | %) | (1.1 | %) | ||||
Difference between statutory income tax rates | 1.1 | % | 1.5 | % | ||||
Non-deductible expenses | 0.8 | % | 1.3 | % | ||||
Non-taxable income | (1.3 | %) | (0.2 | %) | ||||
Others | (0.6 | %) | 0.8 | % | ||||
|
|
|
| |||||
| 28.9 | % | 32.3 | % | |||||
|
|
|
| |||||
Deferred Tax Related to:
Consolidated Statement of Financial Position | Consolidated Statement of Income | |||||||||||||||||||
| December 31, 2012 | As of December 31, 2011 | January 1, 2011 | 2012 | 2011 | ||||||||||||||||
Allowance for doubtful accounts | Ps. | (131) | Ps. | (107) | Ps. | (71) | Ps. | (33) | Ps. | (28) | ||||||||||
Inventories | 1 | (52 | ) | 37 | 51 | (124 | ) | |||||||||||||
Other current assets | 25 | 141 | 60 | (104 | ) | 93 | ||||||||||||||
Property, plant and equipment, net | (405 | ) | (157 | ) | (421 | ) | (101 | ) | (75 | ) | ||||||||||
Investments in associates and joint ventures | 938 | (161 | ) | 161 | 1,589 | 200 | ||||||||||||||
Other assets | (187 | ) | (412 | ) | (89 | ) | 238 | (308 | ) | |||||||||||
Finite useful lived intangible assets | 221 | 260 | 192 | (38 | ) | 65 | ||||||||||||||
Indefinite useful lived intangible assets | 41 | 17 | (17 | ) | 32 | 24 | ||||||||||||||
Post-employment and other long-term employee benefits | (847 | ) | (696 | ) | (642 | ) | (40 | ) | (14 | ) | ||||||||||
Derivative financial instruments | (87 | ) | 46 | 16 | (14 | ) | (8 | ) | ||||||||||||
Provisions | (645 | ) | (721 | ) | (703 | ) | (12 | ) | (1 | ) | ||||||||||
Temporary non-deductible provision | (767 | ) | (785 | ) | (860 | ) | 51 | 133 | ||||||||||||
Employee profit sharing payable | (221 | ) | (200 | ) | (125 | ) | (13 | ) | (56 | ) | ||||||||||
Tax loss carryforwards | (181 | ) | (631 | ) | (989 | ) | 434 | 358 | ||||||||||||
Exchange differences on translation of foreign operations | 853 | 1,897 | — | — | — | |||||||||||||||
Other liabilities | 64 | (25 | ) | (60 | ) | 72 | 40 | |||||||||||||
|
|
|
|
|
|
|
|
|
| |||||||||||
Deferred tax expense (income) | 2,112 | 299 | ||||||||||||||||||
Deferred tax expense (income) net recorded in share of the profit associates and joint ventures accounted for using the equity method | (1,575 | ) | (200 | ) | ||||||||||||||||
|
|
|
| |||||||||||||||||
Deferred tax expense (income), net | 537 | 99 | ||||||||||||||||||
|
|
|
| |||||||||||||||||
Deferred income taxes, net | (1,328 | ) | (1,586 | ) | (3,511 | ) | ||||||||||||||
Deferred tax asset | (2,028 | ) | (2,000 | ) | (3,734 | ) | ||||||||||||||
Deferred tax liability | Ps.700 | Ps. 414 | Ps. 223 | |||||||||||||||||
The changes in the balance of the net deferred income tax liability are as follows: Initial balance Deferred tax provision for the year Deferred tax expense (income) net recorded in share of the profit associates and joint ventures accounted for using the equity method Acquisition of subsidiaries (see Note 4) Disposal of subsidiaries Effects in equity: Unrealized (gain) loss on cash flow hedges Unrealized (gain) loss on available for sale securities Exchange differences on translation of foreign operations Remeasurements of the net defined benefit liability Retained earnings of associates Restatement effect of beginning balances associated with hyperinflationary economies Ending balance 2012 2011 Ps. (1,586) Ps. (3,511) 537 99 1,575 200 (77 ) 218 16 — (76 ) 80 (1 ) 2 (974 ) 1,410 (532 ) (110 ) (189 ) 23 (21 ) 3 Ps. (1,328) Ps. (1,586)
The Company offsets tax assets and liabilities if and only if it has a legally enforceable right to set off current tax assets and current tax liabilities and the deferred tax assets and deferred tax liabilities related to income taxes levied by the same tax paid in foreign countries is compensated with the consolidated income tax paidauthority.
Tax Loss Carryforwards
The subsidiaries in Mexico for the period.
| Domestic | Foreign | |||||||||||||||||||||||
| 2010 | 2009 | 2008 | 2010 | 2009 | 2008 | |||||||||||||||||||
Income before income tax from discontinued operations | Ps. 306 | Ps. 2,688 | Ps. 3,868 | Ps. 442 | Ps. (456 | ) | Ps. (1,121 | ) | ||||||||||||||||
Income tax: | ||||||||||||||||||||||||
Current income tax | 210 | 1,568 | 2,212 | 92 | (45 | ) | 9 | |||||||||||||||||
Deferred income tax | (260 | ) | (508 | ) | (1,122 | ) | — | (2,066 | )(1) | — | ||||||||||||||
The statutory income tax rates applicable in the countries where the Company operates, the years in whichand Brazil have tax loss carryforwards may be appliedcarryforwards. The tax effect net of consolidation benefits and the open periods that remain subject to examination astheir years of December 31, 2010expiration are as follows:
| Statutory Tax Rate | Expiration (Years) | Open Period (Years) | ||||||||||
Mexico | 30 | % | 10 | 5 | ||||||||
Guatemala | 31 | % | N/A | 4 | ||||||||
Nicaragua | 30 | % | 3 | 4 | ||||||||
Costa Rica | 30 | % | 3 | 4 | ||||||||
Panama | 27.5 | % | 5 | 3 | ||||||||
Colombia | 33 | % | Indefinite | 2-5 | ||||||||
Venezuela | 34 | % | 3 | 4 | ||||||||
Brazil | 34 | % | Indefinite | 6 | ||||||||
Argentina | 35 | % | 5 | 5 | ||||||||
Year | Tax Loss Carryforwards | |||
2014 | Ps. 2 | |||
2015 | 3 | |||
2018 | 3 | |||
2019 | 8 | |||
2020 | 61 | |||
2021 | 68 | |||
2022 and thereafter | 435 | |||
No expiration (Brazil) | 46 | |||
|
| |||
| 626 | ||||
Tax losses used in consolidation | (535 | ) | ||
|
| |||
| Ps. 91 | ||||
|
| |||
The statutorychanges in the balance of tax loss carryforwards are as follows:
| 2012 | 2011 | |||||||
Initial balance | Ps. 688 | Ps. 751 | ||||||
Additions | 903 | 56 | ||||||
Usage of tax losses | (1,449 | ) | (135 | ) | ||||
Translation effect of beginning balances | (51 | ) | 16 | |||||
|
|
|
| |||||
Ending balance | Ps. 91 | Ps. 688 | ||||||
|
|
|
| |||||
There are no income tax rateconsequences associated with the payment of dividends in Mexico was 30% for 2010, and 28% for 2009 and 2008.either 2012 or 2011 by the Company to its shareholders.
In Panama, the statutory income tax rate for 2010 was 27.5% and 30% for 2009 and 2008.
On January 1, 2010, the Mexican Tax Reform was effective. The most important changes are described as follows: the value added tax rate (IVA) increases from 15% to 16%, an increase in special tax on productions and services from 25% to 26.5%; and the statutory income tax rate changes from 28% in 2009 to 30% for 2010, 2011 and 2012, and then in 2013 and 2014Company has determined that undistributed profits of its subsidiaries, joint venture or associate will decrease to 29% and 28%, respectively. Additionally, the Mexican tax reform requires that income tax payments related to consolidation tax benefits obtained since 1999, have tonot be paid during the next five years beginning on the sixth year when tax benefits were used (see Note 24 D and E).
In Colombia, tax losses may be carried forward for an indefinite period and they are limited to 25% of the taxable income of each year.
In Brazil, tax losses may be carried forward for an indefinite period but cannot be restated and are limited to 30% of the taxable income of each year.
During 2009 and 2010, Brazil adopted new laws providing for certain tax amnesties. The tax amnesty programs offers Brazilian legal entities and individuals an opportunity to pay off their income tax and indirect tax debts under less stringent conditions than would normally apply. The amnesty programs also include a favorable option under which taxpayers may utilize income tax loss carry-forwards (“NOLs”) when settling certain outstanding income tax and indirect tax debts. Brazilian subsidiary of Coca-Cola FEMSA, decided to participatedistributed in the amnesty programs allowing itforeseeable future. The temporary differences associated with investments in subsidiaries, associates and joint ventures, for which a deferred tax liability has not been recognised, aggregate to settle certain previously accrued indirect tax contingencies. During the years ended, DecemberPs.43,569 (December 31, 2010 and 2009 the Company de-recognized indirect tax contingency accruals of2011: Ps.42,225, January 1st 2011: Ps. 333 and Ps. 433 respectively (see Note 25 C), making payments of Ps. 118 and Ps. 243, recording a credit to other expenses of Ps. 179 and Ps. 311 (see Note 19), reversing previously recorded Brazil valuation allowances against NOL’s in 2009, and recording certain taxes recoverable.40,683).
| 24.2 Tax |
Effective in 2008, the tax on assets has been eliminated in Mexico and it was replaced by the Business Flat Tax (Impuesto Empresarial a Tasa Única, “IETU;” see Note 24 C). The amounts of tax on assets paid corresponding to previous periods to the IETU introduction can be recovered thru tax returns, only if the income tax is higher than the IETU generated in the same period, to the extent equivalent to 10% of the lesser tax on asset paid during 2007, 2006 or 2005.
The operations in Guatemala, Nicaragua, Colombia and Argentina are also subject to a minimum tax, which is based primarilyprimary on a percentage of assets. Any payments are recoverable in future years, under certain conditions.
24.3 Flat-rate business tax (“IETU”)
Effective in 2008, the IETU came into effect in Mexico and replaced the Tax on Assets.Asset Tax. IETU functions are similar to an alternativeessentially works as a minimum corporate income tax, except that amounts paid cannot be creditable against future income tax payments. The payable tax will befor a taxpayer in a given year is the higher between theof IETU or the income tax liability computed under the Mexican income tax law. The IETU applies to individuals and corporations, including permanent establishments of foreign entities in Mexico, at a rate ofis 17.5% beginning in 2010. The rates for 2008 and 2009 were 16.5% and 17.0%, respectively. The. IETU is calculated undercomputed on a cash-flow basis, wherebywhich means the tax base is determined by reducingequal to cash proceeds, withless certain deductions and credits. In the case of income derived from export sales, where cash on thea receivable has not been collected within 12 months, income will beis deemed received at the end of thisthe 12-month period. In addition, as opposed to Mexican income taxunlike the Income Tax Law, which allows for fiscaltax consolidation, companies that incur IETU are required to file their returns on an individual basis.
Based on its
25 Other Liabilities, Provisions, Contingencies and Commitments
25.1 Other current financial projections for purposes of its Mexican tax returns, the Company expects to pay corporate income taxliabilities
| December 31, 2012 | December 31, 2011 | January 1, 2011 | ||||||||||
Sundry creditors | Ps.3,054 | Ps.2,116 | Ps.1,681 | |||||||||
Derivative financial instruments | 279 | 5 | 8 | |||||||||
Others | 14 | 14 | 37 | |||||||||
|
|
|
|
|
| |||||||
Total | Ps.3,347 | Ps.2,135 | Ps.1,726 | |||||||||
|
|
|
|
|
| |||||||
25.2 Provisions and other long term liabilities | ||||||||||||
| December 31, 2012 | December 31, 2011 | January 1,2011 | ||||||||||
Provisions | Ps.2,476 | Ps.2,764 | Ps.2,712 | |||||||||
Others | 938 | 792 | 949 | |||||||||
|
|
|
|
|
| |||||||
Total | Ps.3,414 | Ps. 3,556 | Ps. 3,661 | |||||||||
|
|
|
|
|
| |||||||
25.3 Other financial liabilities | ||||||||||||
| December 31, 2012 | December 31, 2011 | January 1,2011 | ||||||||||
Derivative financial instruments | Ps. 212 | Ps. 563 | Ps. 651 | |||||||||
Taxes payable | 356 | 639 | 1,083 | |||||||||
Security deposits | 268 | 291 | 238 | |||||||||
|
|
|
|
|
| |||||||
Total | Ps.836 | Ps.1,493 | Ps.1,972 | |||||||||
|
|
|
|
|
| |||||||
25.4 Provisions recorded in the future and does not expect to pay IETU. As such, the enactmentconsolidated statement of IETU did not impact the Company’s consolidated financial position or results of operations.
Effective January 2008, in accordance with NIF B-10, “Effects of Inflation,” in Mexico the application of inflationary accounting is suspended. However, for taxes purposes, the balance of non monetary assets is restated through the application of National Consumer Price Index (NCPI) of each country. For this reason, the difference between accounting and taxable values will increase, generating a deferred tax.
The impact to deferred income tax generated by liabilities (assets) temporary differences are as follows:
Deferred Income Taxes | 2010 | 2009 | ||||||
Allowance for doubtful accounts | Ps. | (71) | Ps. | (73) | ||||
Inventories | 37 | (26) | ||||||
Prepaid expenses | 75 | 70 | ||||||
Property, plant and equipment | 1,418 | 1,596 | ||||||
Investments in shares | 161 | (26) | ||||||
Intangibles and other assets | (458) | (418) | ||||||
Amortized intangible assets | 197 | 27 | ||||||
Unamortized intangible assets | 1,769 | 2,264 | ||||||
Labor liabilities | (448) | (429) | ||||||
Derivative financial instruments | 8 | 40 | ||||||
Loss contingencies | (703) | (805) | ||||||
Temporary non-deductible provision | (999) | (1,426) | ||||||
Employee profit sharing payable | (125) | (137) | ||||||
Recoverable tax on assets | — | 48 | ||||||
Tax loss carryforwards | (988) | (1,867) | ||||||
Deferred tax from exchange of shares of FEMSA Cerveza (see Note 2) | 10,099 | — | ||||||
Other reserves | 249 | 502 | ||||||
Deferred income taxes, net | 10,221 | (660) | ||||||
Deferred income taxes asset | 346 | 1,527 | ||||||
Deferred income taxes liability | Ps. | 10,567 | Ps. | 867 | ||||
The changes in the balance of the net deferred income tax liability are as follows:
| 2010 | 2009 | 2008 | ||||||||||
Initial balance | Ps. | (660 | ) | Ps. | 670 | Ps. | 546 | |||||
Tax provision for the year | 875 | (31 | ) | (1,337 | ) | |||||||
Change in the statutory rate | (58 | ) | (87 | ) | — | |||||||
Deferred tax from the exchange of shares of FEMSA (see Note 2) | 10,099 | — | — | |||||||||
Usage of tax losses related to exchange of FEMSA Cerveza (see Note 2) | 280 | — | — | |||||||||
Effect of tax loss carryforwards(1) | — | (1,874 | ) | — | ||||||||
Disposal of subsidiaries | (34 | ) | — | — | ||||||||
Effects in stockholders’ equity: | ||||||||||||
Additional labor liability over unrecognized transition obligation | — | — | 129 | |||||||||
Derivative financial instruments | 75 | 80 | (29 | ) | ||||||||
Cumulative translation adjustment | (352 | ) | 609 | 1,263 | ||||||||
Retained earnings | (38 | ) | — | — | ||||||||
Deferred tax cancellation due to change in accounting principle | — | (71 | ) | — | ||||||||
Restatement effect of beginning balances | 34 | 44 | 98 | |||||||||
Ending balance | Ps. | 10,221 | Ps. | (660 | ) | Ps. | 670 | |||||
| ||||||||||||
| 2010 | 2009 | 2008 | ||||||||||
Current income taxes | Ps. | 4,854 | Ps. | 5,077 | Ps. | 4,445 | ||||||
Deferred income tax | 875 | (31 | ) | (1,337 | ) | |||||||
Change in the statutory rate(1) | (58 | ) | (87 | ) | — | |||||||
Income taxes and tax on assets | Ps. | 5,671 | Ps. | 4,959 | Ps. | 3,108 | ||||||
| ||||||||||||
The subsidiaries in Mexico and Brazil have tax loss carryforwards and/or recoverable tax on assets. The taxes effect net of consolidation benefits and their years of expiration are as follows:
Year | Tax Loss Carryforwards | Recoverable Tax on Assets | ||||||
2011 | Ps. | 185 | Ps. | 2 | ||||
2012 | — | — | ||||||
2013 | — | 26 | ||||||
2014 | — | 50 | ||||||
2015 | — | 2 | ||||||
2016 | 255 | 2 | ||||||
2017 | 254 | 102 | ||||||
2018 and thereafter | 2,221 | — | ||||||
No expiration (Brazil, see Note 24 A) | 457 | — | ||||||
| 3,372 | 184 | |||||||
Tax losses used in consolidation | (2,620 | ) | (133 | ) | ||||
| Ps. | 752 | Ps. | 51 | |||||
The changes in the balance of tax loss carryforwards and recoverable tax on assets, excluding discontinued operations are as follows:
| 2010 | 2009 | |||||||
Initial balance | Ps. | 1,425 | Ps. | 2,610 | ||||
Provision | 18 | 491 | ||||||
Usage of tax losses | (600 | ) | (1,714 | ) | ||||
Translation effect of beginning balances | (40 | ) | 38 | |||||
Ending balance | Ps. | 803 | Ps. | 1,425 | ||||
As of December 31, 2010, there is not valuation allowance recorded due to the uncertainty related to the realization of certain tax loss carryforwards and tax on assets. The changes in the valuation allowance are as follows:
| 2010 | 2009 | |||||||
Initial balance | Ps. | 1 | Ps. | 183 | ||||
Provision | — | — | ||||||
Usage of tax losses carryforwards | — | (195 | ) | |||||
Translation of foreign currency effect | (1 | ) | 13 | |||||
Ending balance | Ps. | — | Ps. | 1 | ||||
| 2010 | 2009 | 2008 | ||||||||||
Mexican statutory income tax rate | 30.0 | % | 28.0 | % | 28.0 | % | ||||||
Difference between book and tax inflationary effects | (3.9 | )% | (1.8 | )% | — | |||||||
Difference between statutory income tax rates | 1.2 | % | 2.4 | % | 2.1 | % | ||||||
Non-taxable income | (2.4 | )% | (0.2 | )% | (0.6 | )% | ||||||
Other | (0.9 | )% | 1.2 | % | (0.6 | )% | ||||||
| 24.0 | % | 29.6 | % | 28.9 | % | |||||||
Note 25. Other Liabilities, Contingencies and Commitments.
| 2010 | 2009 | |||||||
Derivative financial instruments | Ps. | 41 | Ps. | 45 | ||||
Sundry creditors | 1,681 | 1,542 | ||||||
Current portion of other long-term liabilities | 276 | 269 | ||||||
Short-term financing(1) | — | 66 | ||||||
Others | 37 | — | ||||||
Total | Ps. | 2,035 | Ps. | 1,922 | ||||
| 2010 | 2009 | |||||||
Contingencies | Ps. | 2,712 | (1) | Ps. | 2,467 | |||
Taxes payable | 872 | 1,428 | ||||||
Derivative financial instruments | 653 | 553 | ||||||
Current portion of other long-term liabilities | (276 | ) | (269 | ) | ||||
Others | 1,435 | 1,678 | ||||||
Total | Ps. | 5,396 | Ps. | 5,857 | ||||
The Company has various loss contingencies, and has recorded reserves have been recorded inas other liabilities for those cases where the Companylegal proceedings for which it believes an unfavorable resolution is probable. Most of these loss contingencies were recorded as aare the result of recentthe Company’s business acquisitions. The following table presents the nature and amount of the loss contingencies recorded as of December 31, 2010:2012 and 2011 and as of January 1, 2011:
Indirect taxes Labor Legal 25.5 Changes in the balance of provisions recorded 25.5.1 Indirect taxes Initial balance Penalties and other charges New contingencies Contingencies added in business combination Cancellation and expiration Payments Current portion Restatement of the beginning balance of subsidiaries in hyperinflationary economies Ending balance 25.5.2 Labor Initial balance Penalties and other charges New contingencies Contingencies added in business combination Cancellation and expiration Payments Restatement of the beginning balance of subsidiaries in hyperinflationary economies Ending balance A roll forward for legal contingencies is not disclosed because the amounts are not considered to be material. While provision for all claims has already been made, the actual outcome of the disputes and the timing of the resolution cannot be estimated by the Company at this time. | |||||||||||||||||||||||||||||||||||||||||||||||||||||||||||||||||||||||||||||||||||||||||||||||||||||||||||||||||||||||||||||||||||||||||||||||||||||||||||||||||||||||||||||||||||||||||||||||||||||||||||||||||||||||||||||||||||||||||||||||||||||||||||||||||||||||||||||||||||||||||||||||||||||||||||||||||||||||||||||||||||||||||||||||||||||||||||||||||||||||||||||||||||||||||||||||||||||||||||||||||||||||||||||||||||||||||||||||||||||||||||||||||||||||||||||||||||||||||||||||||||||||||||||||||||||||||||||||
| |||||||||||||||||||||||||||||||||||||||||||||||||||||||||||||||||||||||||||||||||||||||||||||||||||||||||||||||||||||||||||||||||||||||||||||||||||||||||||||||||||||||||||||||||||||||||||||||||||||||||||||||||||||||||||||||||||||||||||||||||||||||||||||||||||||||||||||||||||||||||||||||||||||||||||||||||||||||||||||||||||||||||||||||||||||||||||||||||||||||||||||||||||||||||||||||||||||||||||||||||||||||||||||||||||||||||||||||||||||||||||||||||||||||||||||||||||||||||||||||||||||||||||||||||||||||||||||||
| |||||||||||||||||||||||||||||||||||||||||||||||||||||||||||||||||||||||||||||||||||||||||||||||||||||||||||||||||||||||||||||||||||||||||||||||||||||||||||||||||||||||||||||||||||||||||||||||||||||||||||||||||||||||||||||||||||||||||||||||||||||||||||||||||||||||||||||||||||||||||||||||||||||||||||||||||||||||||||||||||||||||||||||||||||||||||||||||||||||||||||||||||||||||||||||||||||||||||||||||||||||||||||||||||||||||||||||||||||||||||||||||||||||||||||||||||||||||||||||||||||||||||||||||||||||||||||||||
| |||||||||||||||||||||||||||||||||||||||||||||||||||||||||||||||||||||||||||||||||||||||||||||||||||||||||||||||||||||||||||||||||||||||||||||||||||||||||||||||||||||||||||||||||||||||||||||||||||||||||||||||||||||||||||||||||||||||||||||||||||||||||||||||||||||||||||||||||||||||||||||||||||||||||||||||||||||||||||||||||||||||||||||||||||||||||||||||||||||||||||||||||||||||||||||||||||||||||||||||||||||||||||||||||||||||||||||||||||||||||||||||||||||||||||||||||||||||||||||||||||||||||||||||||||||||||||||||
Changes in the Balance of Contingencies Recorded:25.6 Unsettled lawsuits
| 2010 | 2009 | |||||||
Initial balance | Ps. | 2,467 | Ps. | 2,076 | ||||
Provision | 716 | 475 | ||||||
Penalties and other charges | 376 | 258 | ||||||
Reversal of provision | (205 | ) | (241 | ) | ||||
Payments | (211 | ) | (190 | ) | ||||
Amnesty adoption | (333 | ) | (433 | ) | ||||
Translation of foreign currency of beginning balance | (98 | ) | 522 | |||||
Ending balance | Ps. | 2,712 | Ps. | 2,467 | ||||
The Company has entered into legal proceedings with its labor unions, tax authorities and other parties that primarily involve Coca-Cola FEMSA.parties. These proceedings have resulted in the ordinary course of business and are common to the industry in which the Company operates. The aggregate amount being claimed against the Company resulting from such proceedings as of December 31, 20102012 is Ps. 5,767.13,309. Such contingencies were classified by legal counsel as less than probable but more than remote of being settled against the Company. However, the Company believes that the ultimate resolution of such legal proceedings will not have a material effect on its consolidated financial position or result of operations.
In recent years in its Mexican, Costa Rican and Brazilian territories, Coca-Cola FEMSA has been requested to present certain information regarding possible monopolistic practices. These requests are commonly generated in the ordinary course of business in the soft drink industry where this subsidiary operates. The Company does not expect any significant liability to arise from these contingencies.
25.7 Collateralized contingencies
As is customary in Brazil, the Company has been requestedrequired by the tax authorities there to collateralize tax contingencies currently in litigation amounting to Ps. 2,164, Ps. 2,418 and Ps. 2,292 as of December 31, 2012 and 2011 and as of January 1, 2011, respectively, by pledging fixed assets and entering into available lines of credit which cover suchcovering the contingencies.
25.8 Commitments
As of December 31, 2010,2012, the Company has contractual commitments for finance leases for machinery and transport equipment and operating lease commitmentsleases for the rental of production machinery and equipment, distribution equipment,and computer equipment, and land for FEMSA Comercio’s operations.
The contractual maturities of the operating lease commitments by currency, expressed in Mexican pesos as of December 31, 2010,2012, are as follows:
| Mexican Pesos | U.S. Dollars | Other | ||||||||||
2011 | Ps. | 2,014 | Ps. | 94 | Ps. | 105 | ||||||
2012 | 1,906 | 95 | 109 | |||||||||
2013 | 1,820 | 79 | 34 | |||||||||
2014 | 1,706 | 78 | 8 | |||||||||
2015 | 1,636 | 764 | 8 | |||||||||
2016 and thereafter | 8,298 | — | 8 | |||||||||
Total | Ps. | 17,380 | Ps. | 1,110 | Ps. | 272 | ||||||
| Mexican Pesos | U. S. Dollars | Others | ||||||||||
Not later than 1 year | Ps. 2,966 | Ps. 77 | Ps. 97 | |||||||||
Later than 1 year and not later than 5 years | 10,498 | 335 | 86 | |||||||||
Later than 5 years | 13,516 | 544 | — | |||||||||
|
|
|
|
|
| |||||||
Total | Ps.26,980 | Ps. 956 | Ps. 183 | |||||||||
|
|
|
|
|
| |||||||
Rental expense charged to operations amounted to approximatelyconsolidated net income was Ps. 2,602 Ps. 2,2554,032 and Ps. 1,8163,248 for the years ended December 31, 2010, 20092012 and 2008,2011, respectively.
Future minimum lease payments under finance leases with the present value of the net minimum lease payments are as follows:
| 2012 Minimum Payments | Present Value of Payments | 2011 Minimum Payments | Present Value of Payments | |||||||||||||
Not later than 1 year | 236 | 225 | 285 | 265 | ||||||||||||
Later than 1 year and not later than 5 years | | 134 | | | 122 | | 357 | 350 | ||||||||
Later than 5 years | — | — | — | — | ||||||||||||
|
|
|
|
|
|
|
| |||||||||
Total mínimum lease payments | 370 | 347 | 642 | 615 | ||||||||||||
Less amount representing finance charges | 23 | 27 | ||||||||||||||
|
|
|
| |||||||||||||
Present value of minimum lease payments | 347 | 615 | ||||||||||||||
|
|
|
| |||||||||||||
Coca-Cola FEMSA has firm commitments for the purchase of property, plan and equipment of Ps. 27 as December 31, 2012.
Note 26.25.9 Restructuring provision
Coca-Cola FEMSA recorded a restructuring provision. This provision relates principally to reorganization in the structure of Coca-Cola FEMSA. The restructuring plan was drawn up and announced to the employees of Coca-Cola FEMSA in 2011 when the provision was recognized in its consolidated financial statements. The restructuring of Coca-Cola FEMSA is expected to be completed by 2013 and it is presented in current liabilities within accounts payable caption in the consolidated statement of financial position.
| December 31, 2012 | December 31, 2011 | |||||||
Initial balance | Ps. 153 | Ps. 230 | ||||||
New | 195 | 48 | ||||||
Payments | (258 | ) | (76 | ) | ||||
Cancellation | — | (49 | ) | |||||
|
|
|
| |||||
Ending balance | Ps. 90 | Ps. 153 | ||||||
|
|
|
| |||||
26 Information by Segment.Segment
AnalyticalThe analytical information by segment is presented considering the Company’s business units and geographic areas(Subholding Companies as defined in Note 1), which is consistent with the internal reporting presented to the Chief Operating Decision Maker. A segment is a component of the Company operates,that engages in business activities from which it earns revenues, and is presented accordingincurs the related costs and expenses, including revenues, costs and expenses that relate to transactions with any of Company’s other components. All segments’ operating results are reviewed regularly by the Chief Operating Decision Maker, which makes decisions about the resources that would be allocated to the segment and to assess its performance, and for which financial information used for decision-makingis available.
Inter-segment transfers or transactions are entered into and presented under accounting policies of each segment, which are the administration.
The information presented is based onsame to those applied by the Company’s accounting policies.Company. Intercompany operations are eliminated and presented within the consolidation adjustment column.
The information by business unit operation and geographic area forcolumn included in the years ended December 31, 2010, 2009 and 2008, have been modified as a result of the discontinued operations (see Note 2).tables below.
a) By Business Unit:
2010 | Coca-Cola FEMSA | FEMSA Comercio | CB Equity | Other (1) | Consolidation Adjustments | Consolidated | ||||||||||||||||||
Total revenue | Ps. 103,456 | Ps. 62,259 | Ps. | — | Ps. 12,010 | Ps. (8,023 | ) | Ps. 169,702 | ||||||||||||||||
Intercompany revenue | 1,642 | 2 | — | 6,379 | (8,023 | ) | — | |||||||||||||||||
Income from operations | 17,079 | 5,200 | (3 | ) | 253 | — | 22,529 | |||||||||||||||||
Depreciation(2) | 3,333 | 990 | — | 204 | — | 4,527 | ||||||||||||||||||
Amortization | 403 | 545 | — | 27 | — | 975 | ||||||||||||||||||
Other non-cash charges(3) (4) | 207 | 62 | — | 117 | — | 386 | ||||||||||||||||||
Write-off of long-lived assets | 7 | — | — | 2 | — | 9 | ||||||||||||||||||
Interest expense | 1,748 | 917 | — | 951 | (351 | ) | 3,265 | |||||||||||||||||
Interest income | 285 | 25 | 2 | 1,143 | (351 | ) | 1,104 | |||||||||||||||||
Equity method from associates | 217 | — | 3,319 | 2 | — | 3,538 | ||||||||||||||||||
Income taxes | 4,260 | 499 | 208 | 704 | — | 5,671 | ||||||||||||||||||
Capital expenditures | 7,478 | 3,324 | — | 369 | — | 11,171 | ||||||||||||||||||
Net cash flows provided by (used in) operating activities | 14,350 | 6,704 | — | (3,252 | ) | — | 17,802 | |||||||||||||||||
Net cash flows (used in) provided by investment activities | (6,845 | ) | (3,288 | ) | 553 | 15,758 | — | 6,178 | ||||||||||||||||
Net cash flow (used in) financing activities | (2,011 | ) | (819 | ) | (504 | ) | (7,162 | ) | — | (10,496 | ) | |||||||||||||
Long-term assets | 87,625 | 14,655 | 66,478 | 4,785 | (1,425 | ) | 172,118 | |||||||||||||||||
Total assets | 114,061 | 23,677 | 67,010 | 27,705 | (8,875 | ) | 223,578 | |||||||||||||||||
2012 | Coca-Cola FEMSA | FEMSA Comercio | CB Equity | Other(1) | Consolidation Adjustments | Consolidated | ||||||||||||||||||
Total revenues | Ps. 147,739 | Ps. 86,433 | Ps.— | Ps.15,899 | Ps. (11,762) | Ps. 238,309 | ||||||||||||||||||
Intercompany revenue | 2,873 | 5 | — | 8,884 | (11,762 | ) | — | |||||||||||||||||
Gross profit | 68,630 | 30,250 | — | 4,647 | (2,227 | ) | 101,300 | |||||||||||||||||
Administrative expenses | — | — | — | 9,552 | ||||||||||||||||||||
Selling expenses | — | — | — | 62,086 | ||||||||||||||||||||
Other income | — | — | — | 1,745 | ||||||||||||||||||||
Other expenses | — | — | — | (1,973 | ) | |||||||||||||||||||
Interest expense | (1,955 | ) | (445 | ) | — | (511 | ) | 405 | (2,506 | ) | ||||||||||||||
Interest income | 424 | 19 | 18 | 727 | (405 | ) | 783 | |||||||||||||||||
Other net finance expenses(3) | — | — | — | (181 | ) | |||||||||||||||||||
Income before income taxes and share of the profit of associates and joint ventures accounted for using the equity method | 19,992 | 6,146 | 10 | 1,620 | (238 | ) | 27,530 | |||||||||||||||||
Income taxes | 6,274 | 729 | — | 946 | — | 7,949 | ||||||||||||||||||
Share of the profit of associates and joint ventures accounted for using the equity method, net of taxes | 180 | (23 | ) | 8,311 | 2 | — | 8,470 | |||||||||||||||||
|
|
|
|
|
|
|
|
|
|
|
| |||||||||||||
Consolidated net income | — | — | — | 28,051 | ||||||||||||||||||||
|
|
|
|
|
|
|
|
|
|
|
| |||||||||||||
Depreciation and amortization(2) | 5,692 | 2,031 | — | 293 | (126 | ) | 7,890 | |||||||||||||||||
Non-cash items other than depreciation and amortization | 580 | 200 | — | 237 | 1,017 | |||||||||||||||||||
|
|
|
|
|
|
|
|
|
|
|
| |||||||||||||
Investments in associates and joint ventures | 5,352 | 459 | 77,484 | 545 | 83,840 | |||||||||||||||||||
Total assets | 166,103 | 31,092 | 79,268 | 31,078 | (11,599 | ) | 295,942 | |||||||||||||||||
Total liabilities | 61,275 | 21,356 | 1,822 | 12,409 | (11,081 | ) | 85,781 | |||||||||||||||||
Investments in fixed assets(4) | 10,259 | 4,707 | — | 959 | (365 | ) | 15,560 | |||||||||||||||||
|
|
|
|
|
|
|
|
|
|
|
| |||||||||||||
| (1) | Includes other companies (see Note 1) and corporate. |
| (2) | Includes bottle breakage. |
| (3) |
| (4) | Includes |
2009 Total revenue Intercompany revenue Income from operations Depreciation(2) Amortization Other non-cash charges(3) (4) Write-off of long-lived assets Interest expense Interest income Equity method from associates Income taxes Capital expenditures Net cash flows provided by operating activities Net cash flows (used in) provided by investment activities Net cash flow (used in) provided by financing activities Long-term assets(5) Total assets(5) 2008 Total revenue Intercompany revenue Income from operations Depreciation(2) Amortization Other non-cash charges(3) (4) Write-off of long-lived assets Interest expense Interest income Equity method from associates Income taxes Capital expenditures Net cash flows provided by operating activities Net cash flows used in investment activities Net cash flow (used in) provided by financing activities 2011 Total revenues Intercompany revenue Gross profit Administrative expenses Selling expenses Other income Other expenses Interest expense Interest income Other net finance income(3) Income before income taxes and share of the profit of associates and joint ventures accounted for using the equity method Income taxes Share of the profit of associates and joint ventures accounted for using the equity method, net of taxes Consolidated net income Depreciation and amortization(2) Non-cash items other than depreciation and amortization Investments in associates and joint ventures Total assets Total liabilities Investments in fixed assets(4) Coca-Cola
FEMSA FEMSA
Comercio Other (1) Consolidation
Adjustments Consolidated Ps. 102,767 Ps. 53,549 Ps. 10,991 Ps. (7,056 ) Ps. 160,251 1,277 2 5,777 (7,056 ) — 15,835 4,457 838 — 21,130 3,473 819 99 — 4,391 307 461 30 — 798 368 49 247 664 124 — 5 129 1,895 954 1,594 (432 ) 4,011 286 27 1,324 (432 ) 1,205 142 — (10 ) — 132 4,043 544 372 — 4,959 6,282 2,668 153 9,103 16,663 4,339 1,742 — 22,744 (8,900 ) (2,634 ) 158 — (11,376 ) (6,029 ) (346 ) (1,514 ) — (7,889 ) 87,022 12,378 20,754 (4,779 ) 115,375 110,661 19,693 31,346 (8,062 ) 153,638 Ps. 82,976 Ps. 47,146 Ps. 9,401 Ps. (5,715 ) Ps. 133,808 1,009 2 4,704 (5,715 ) — 13,695 3,077 577 — 17,349 3,036 663 63 — 3,762 240 422 27 — 689 145 46 104 — 295 371 — 7 — 378 2,207 665 1,254 (303 ) 3,823 433 27 708 (303 ) 865 104 (14 ) — 90 2,486 351 271 — 3,108 4,802 2,720 294 7,816 11,901 3,201 921 — 16,023 (7,299 ) (2,718 ) (1,250 ) — (11,267 ) (5,261 ) 870 (1,152 ) — (5,543 ) Coca-Cola
FEMSA FEMSA
Comercio C B
Equity Other(1) Consolidation
Adjustments Consolidated Ps.123,224 Ps.74,112 Ps.— Ps.13,360 Ps.(9,156) Ps.201,540 2,099 2 — 7,055 (9,156 ) — 56,531 25,476 — 3,884 (1,595 ) 84,296 — — — — — 8,172 — — — — — 50,685 — — — — — 381 — — — — — (2,072 ) (1,729 ) (396 ) — (540 ) 363 (2,302 ) 616 12 7 742 (363 ) 1,014 — — — — — 1,092 16,794 4,993 — 1,827 (62 ) 23,552 5,667 578 67 1,306 — 7,618 86 — 4,880 1 — 4,967 20,901 4,219 1,778 — 246 (80 ) 6,163 638 170 — 31 — 839 3,656 — 74,746 241 — 78,643 141,738 26,535 76,463 28,853 (10,227 ) 263,362 48,657 18,558 1,782 12,134 (9,940 ) 71,191 7,862 4,186 — 735 (117 ) 12,666
| (1) | Includes other companies (see Note 1) and corporate. |
| (2) | Includes bottle breakage. |
| (3) | Includes foreign exchange gain, net; gain on monetary position for subsidiaries in |
| (4) | Includes |
January 1, 2011 | Coca-Cola FEMSA | FEMSA Comercio | CB Equity | Other (1) | Consolidation Adjustments | Consolidated | ||||||||||||||||||
Investment in associates companies and joint ventures | Ps.2,108 | Ps.— | Ps.66,478 | Ps. 207 | Ps.— | Ps.68,793 | ||||||||||||||||||
Total assets | 104,326 | 23,090 | 67,010 | 28,676 | (8,407 | ) | 214,695 | |||||||||||||||||
Total liabilities | 38,890 | 16,394 | 217 | 13,978 | (8,182 | ) | 61,297 | |||||||||||||||||
|
|
|
|
|
|
|
|
|
|
|
| |||||||||||||
b) Information by geographic area:
The Company’s operations are grouped inCompany aggregates geographic areas into the following divisions:for the purposes of its consolidated financial statements: (i) Mexico division; (ii) Latincentro division, which is comprised of the territories operated inand Central America division (comprising the following countries: Mexico, Guatemala, Nicaragua, Costa Rica and Colombia; (iii) Venezuela; (iv) MercosurPanama) and (ii) the South America division which is comprised of(comprising the territories operated infollowing countries: Brazil, Argentina, Colombia and Argentina; and (v) Europe.
Venezuela). Venezuela operates in an economy with exchange controls. Ascontrols and hyper-inflation; and as a result, Bulletin B-5 “Information by Segments” doesit is not allow its integrationaggregated into another geographical segment.
2010 Mexico Latincentro(1) Venezuela Mercosur(2) Europe Consolidation adjustments Consolidated 2009(3) Mexico Latincentro(1) Venezuela Mercosur(2) Consolidation adjustments Consolidated 2008(3) Mexico Latincentro(1) Venezuela Mercosur(2) Consolidation adjustments Consolidated Total
Revenue Capital
Expenditures Long-Lived
Assets Total Assets Ps. 105,448 Ps. 6,297 Ps. 64,310 Ps. 100,657 17,492 1,773 18,982 22,162 14,048 505 5,469 7,882 33,409 2,596 16,879 27,418 — — 66,478 67,010 (695 ) — — (1,551 ) Ps. 169,702 Ps. 11,171 Ps. 172,118 Ps. 223,578 Ps. 94,819 Ps. 5,484 Ps. 73,563 Ps. 98,404 16,211 1,298 17,992 20,635 22,448 1,253 8,945 13,746 27,604 1,068 14,875 23,158 (831 ) — — (2,305 ) Ps. 160,251 Ps. 9,103 Ps. 115,375 Ps. 153,638 Ps. 84,920 Ps. 4,780 Ps. 63,398 Ps. 83,142 12,853 1,265 16,742 21,150 15,217 722 6,883 9,799 21,227 1,049 12,215 17,546 (409 ) — — (4,804 ) Ps. 133,808 Ps. 7,816 Ps. 99,238 Ps. 126,833
2012 | Total Revenues | Total Non Current Assets | ||||||
Mexico and Central America(1) | Ps.155,576 | Ps.104,983 | ||||||
South America(2) | 56,444 | 29,275 | ||||||
Venezuela | 26,800 | 9,127 | ||||||
Europe | — | 77,484 | ||||||
Consolidation adjustments | (511 | ) | (382 | ) | ||||
|
|
|
| |||||
Consolidated | Ps.238,309 | Ps.220,487 | ||||||
|
|
|
| |||||
2011 | ||||||||
Mexico and Central America(1) | Ps.129,716 | Ps. 91,428 | ||||||
South America(2) | 52,149 | 29,252 | ||||||
Venezuela | 20,173 | 7,952 | ||||||
Europe | — | 74,747 | ||||||
Consolidation adjustments | (498 | ) | — | |||||
|
|
|
| |||||
Consolidated | Ps.201,540 | Ps.203,379 | ||||||
|
|
|
| |||||
January 1, 2011 | ||||||||
Mexico and Central America(1) | Ps. 64,267 | |||||||
South America(2) | 26,082 | |||||||
Venezuela | 5,545 | |||||||
Europe | 66,478 | |||||||
Consolidation adjustments | — | |||||||
|
| |||||||
Consolidated | Ps.162,372 | |||||||
|
| |||||||
| (1) |
| (2) |
27 First Time Adoption of IFRS
27.1 Basis for the Transition to IFRS
27.1.1 Application of IFRS 1, First-time adoption of international financial reporting standards
For preparing the consolidated financial statements under IFRS, the Company applied the mandatory exceptions and utilized certain optional exemptions set forth in IFRS 1, related to the complete retroactive application of IFRS.
27.1.2 Optional exemptions used by the Company
The Company applied the following optional exemptions:
a) Business Combinations and Acquisitions of Associates and Joint Ventures:
The Company elected not to apply IFRS 3Business Combinations, to business combinations as well as to acquisitions of associates and joint ventures prior to its transition date.
b) Deemed Cost:
An entity may elect to measure an item or all of property, plant and equipment at the Transition Date at its fair value and use that fair value as its deemed cost at that date. In addition, a first-time adopter may elect to use a previous GAAP’s revaluation of an item of property, plant and equipment at, or before, of the Transition Date as deemed cost at the date of the revaluation, if the revaluation was, at the date of the revaluation, broadly comparable to: (i) fair value; or (ii) cost or depreciated cost in accordance with IFRS, adjusted to reflect, changes in a general or specific price index.
The Company has presented its property, plant, and equipment and its intangible assets at IFRS historical cost in all countries.
In Mexico, the Company ceased to record inflationary adjustments to its property, plant and equipment on December 31, 2007, due to both changes to Mexican FRS in effect at that time, and the fact that the Mexican peso was not deemed to be a currency of an inflationary economy as of that date. According to IAS 29,Financial Reporting in Hyperinflationary Economiesthe last hyperinflationary period for the Mexican peso was in 1998. As a result, the Company eliminated the cumulative inflation recognized within long-lived assets for the Company’s Mexican operations, based on Mexican FRS during the years 1999 through 2007, which were not deemed hyperinflationary for IFRS purposes.
In Venezuela this IFRS historical cost represents actual historical cost in the year of acquisition, indexed for inflation in a hyper- inflationary economy based on the provisions of IAS 29.
c) Cumulative Translation Effects:
The Company applied the exemption to not recalculate retroactively the translation differences in the financial statements of foreign operations; accordingly, at the transition date, it reclassified the cumulative translation effect to retained earnings.
The application of this exemption is detailed in Note 27.3 (h).
d) Borrowing Costs:
The Company began capitalizing its borrowing costs at the transition date in accordance with IAS 23, Borrowing Costs. The borrowing costs included previously under Mexican FRS were subject to the deemed cost exemption mentioned in b) above.
27.1.3 Mandatory exceptions used by the Company
The Company applied the following mandatory exceptions set forth in IFRS 1, which do not allow retroactive application to the requirements set forth in such standards:
a) Derecognition of Financial Assets and Liabilities:
The Company applied the derecognition rules of IAS 39,Financial Instruments: Recognition and Measurementprospectively for transactions occurring on or after the date of transition. As a result, there was no impact in the Company’s consolidated financial statements due to the application of this exception.
b) Hedge Accounting:
The Company measured at fair value all derivative financial instruments and hedging relationships designated and documented effectively as accounting hedges as required by IAS 39 as of the transition date. As a result, there was no impact in the Company’s consolidated financial statements due to the application of this exception.
c) Non-controlling Interest:
The Company applied the requirements in IAS 27,Consolidated and Separate Financial Statementsrelated to non-controlling interests prospectively beginning on the transition date. As a result, there was no impact in the Company’s consolidated financial statements due to the application of this exception.
d) Accounting Estimates:
Estimates prepared under IFRS as of January 1, 2011 are consistent with the estimates recognized under Mexican FRS as of the same date.
27.2 Reconciliations of Mexican FRS and IFRS
The following reconciliations quantify the effects of the transition to IFRS:
Equity as of December 31, 2011 and as of January 1, 2011 (date of transition to IFRS).
Comprehensive income for the year ended December 31, 2011.
27.2.1 Effects of IFRS adoption on equity – Consolidated statement of financial position
| As of December 31, 2011 | As of January 1, 2011 | |||||||||||||||||||||||||||||||||||
| Mexican FRS | Adjustments | Reclassifications | IFRS | Mexican FRS | Adjustments | Reclassifications | IFRS | |||||||||||||||||||||||||||||
Cash and cash equivalents | a | Ps.26,329 | Ps. — | Ps.(488) | Ps.25,841 | Ps.27,097 | Ps. — | Ps.(392) | Ps.26,705 | |||||||||||||||||||||||||||
Investments | 1,329 | — | — | 1,329 | 66 | — | — | 66 | ||||||||||||||||||||||||||||
Accounts receivable, net | 10,499 | — | (1 | ) | 10,498 | 7,702 | — | (1 | ) | 7,701 | ||||||||||||||||||||||||||
Inventories | d | 14,385 | (9 | ) | (16 | ) | 14,360 | 11,314 | — | — | 11,314 | |||||||||||||||||||||||||
Recoverable taxes | g | 4,311 | — | 1,032 | 5,343 | 4,243 | — | 909 | 5,152 | |||||||||||||||||||||||||||
Other current financial assets | a,l | — | — | 1,018 | 1,018 | — | — | 409 | 409 | |||||||||||||||||||||||||||
Other current assets | a,e | 2,114 | (23 | ) | (497 | ) | 1,594 | 1,038 | (52 | ) | (10 | ) | 976 | |||||||||||||||||||||||
|
|
|
|
|
|
|
|
|
|
|
|
|
|
|
| |||||||||||||||||||||
Total Current Assets | 58,967 | (32 | ) | 1,048 | 59,983 | 51,460 | (52 | ) | 915 | 52,323 | ||||||||||||||||||||||||||
Investments in associates and joint ventures | k | 78,972 | (328 | ) | (1 | ) | 78,643 | 68,793 | — | — | 68,793 | |||||||||||||||||||||||||
Property, plant and equipment, net | b | 53,402 | (5,260 | ) | 6,421 | 54,563 | 41,910 | (5,221 | ) | 5,493 | 42,182 | |||||||||||||||||||||||||
Intangible assets, net | d | 71,608 | (8,580 | ) | 2 | 63,030 | 52,340 | (8,087 | ) | — | 44,253 | |||||||||||||||||||||||||
Deferred tax assets | g | 461 | 2,139 | (600 | ) | 2,000 | 346 | 2,318 | 1,070 | 3,734 | ||||||||||||||||||||||||||
Other financial assets | j | — | 43 | 2,702 | 2,745 | — | — | 1,388 | 1,388 | |||||||||||||||||||||||||||
Other assets, net | b,l | 11,294 | — | (8,896 | ) | 2,398 | 8,729 | (1 | ) | (6,706 | ) | 2,022 | ||||||||||||||||||||||||
|
|
|
|
|
|
|
|
|
|
|
|
|
|
|
| |||||||||||||||||||||
Total Assets | 274,704 | (12,018 | ) | 676 | 263,362 | 223,578 | (11,043 | ) | 2,160 | 214,695 | ||||||||||||||||||||||||||
|
|
|
|
|
|
|
|
|
|
|
|
|
|
|
| |||||||||||||||||||||
Bank loans and notes payable | 638 | — | — | 638 | 1,578 | — | — | 1,578 | ||||||||||||||||||||||||||||
Current portion of long-term debt | 4,935 | — | — | 4,935 | 1,725 | — | — | 1,725 | ||||||||||||||||||||||||||||
Interest payable | 216 | — | — | 216 | 165 | — | — | 165 | ||||||||||||||||||||||||||||
Suppliers | 21,475 | — | — | 21,475 | 17,458 | — | — | 17,458 | ||||||||||||||||||||||||||||
Accounts payable | 5,761 | (273 | ) | — | 5,488 | 5,375 | (224 | ) | — | 5,151 | ||||||||||||||||||||||||||
Taxes payable | g | 3,208 | — | 1,033 | 4,241 | 2,180 | — | 909 | 3,089 | |||||||||||||||||||||||||||
Other current financial liabilities | l | — | — | 2,135 | 2,135 | — | — | 1,726 | 1,726 | |||||||||||||||||||||||||||
Current portion of other long-term liabilities | e,l | 2,397 | (74 | ) | (2,126 | ) | 197 | 2,035 | (33 | ) | (1,726 | ) | 276 | |||||||||||||||||||||||
|
|
|
|
|
|
|
|
|
|
|
|
|
|
|
| |||||||||||||||||||||
Total Current Liabilities | 38,630 | (347 | ) | 1,042 | 39,325 | 30,516 | (257 | ) | 909 | 31,168 | ||||||||||||||||||||||||||
Bank loans and notes payable | j | 24,031 | (156 | ) | (56 | ) | 23,819 | 22,203 | (211 | ) | (57 | ) | 21,935 | |||||||||||||||||||||||
Post-employment and other long-term employee benefits | c | 2,258 | 327 | (1 | ) | 2,584 | 1,883 | 455 | — | 2,338 | ||||||||||||||||||||||||||
Deferred tax liabilities | g | 13,911 | (12,897 | ) | (600 | ) | 414 | 10,567 | (11,414 | ) | 1,070 | 223 | ||||||||||||||||||||||||
Other financial liabilities | l | — | — | 1,493 | 1,493 | — | — | 1,972 | 1,972 | |||||||||||||||||||||||||||
Provisions and other long-term liabilities | e,l | 4,760 | (2 | ) | (1,202 | ) | 3,556 | 5,396 | (1 | ) | (1,734 | ) | 3,661 | |||||||||||||||||||||||
|
|
|
|
|
|
|
|
|
|
|
|
|
|
|
| |||||||||||||||||||||
Total Long-Term Liabilities | 44,960 | (12,728 | ) | (366 | ) | 31,866 | 40,049 | (11,171 | ) | 1,251 | 30,129 | |||||||||||||||||||||||||
|
|
|
|
|
|
|
|
|
|
|
|
|
|
|
| |||||||||||||||||||||
Total Liabilities | 83,590 | (13,075 | ) | 676 | 71,191 | 70,565 | (11,428 | ) | 2,160 | 61,297 | ||||||||||||||||||||||||||
|
|
|
|
|
|
|
|
|
|
|
|
|
|
|
| |||||||||||||||||||||
Equity: | ||||||||||||||||||||||||||||||||||||
Controlling interest: | ||||||||||||||||||||||||||||||||||||
Capital stock | f,d | Ps.5,348 | Ps. (4) | Ps.(1,999) | Ps. 3,345 | Ps. 5,348 | Ps. (4) | Ps.(1,999) | Ps. 3,345 | |||||||||||||||||||||||||||
Additional paid-in capital | f,d | 20,513 | 5,995 | (5,852 | ) | 20,656 | 20,558 | 51 | (5,852 | ) | 14,757 | |||||||||||||||||||||||||
Retained earnings | i,d | 101,889 | 4,747 | 7,851 | 114,487 | 91,296 | 4,548 | 7,851 | 103,695 | |||||||||||||||||||||||||||
Cumulative other comprehensive income | h | 5,830 | (96 | ) | — | 5,734 | 146 | (66 | ) | — | 80 | |||||||||||||||||||||||||
|
|
|
|
|
|
|
|
|
|
|
|
|
|
|
| |||||||||||||||||||||
Total controlling interest | 133,580 | 10,642 | — | 144,222 | 117,348 | 4,529 | — | 121,877 | ||||||||||||||||||||||||||||
|
|
|
|
|
|
|
|
|
|
|
|
|
|
|
| |||||||||||||||||||||
Non-controlling interest in consolidated subsidiaries | i | 57,534 | (9,585 | ) | — | 47,949 | 35,665 | (4,144 | ) | — | 31,521 | |||||||||||||||||||||||||
|
|
|
|
|
|
|
|
|
|
|
|
|
|
|
| |||||||||||||||||||||
Total equity | 191,114 | 1,057 | — | 192,171 | 153,013 | 385 | — | 153,398 | ||||||||||||||||||||||||||||
|
|
|
|
|
|
|
|
|
|
|
|
|
|
|
| |||||||||||||||||||||
Total Liabilities and Equity | 274,704 | (12,018 | ) | 676 | 263,362 | 223,578 | (11,043 | ) | 2,160 | 214,695 | ||||||||||||||||||||||||||
|
|
|
|
|
|
|
|
|
|
|
|
|
|
|
| |||||||||||||||||||||
27.2.2 Reconciliation of equity
| Note | As of December 31, 2011 | As of January 1, 2011 | ||||||||
Total equity under Mexican FRS | Ps. | 191,114 | Ps. | 153,013 | ||||||
Property, plant and equipment, net | b | (5,260 | ) | (5,221 | ) | |||||
Intangible assets, net | d | (8,580 | ) | (8,087 | ) | |||||
Post-employment and other long-term employee benefits | c | (327 | ) | (455 | ) | |||||
Embedded derivatives instruments | e | 76 | 24 | |||||||
Share-based payments | f | 298 | 234 | |||||||
Effect on deferred income taxes | g | 15,036 | 13,732 | |||||||
Effective interest method | j | 195 | 211 | |||||||
Investments in associates and Joint Ventures | k | (328 | ) | — | ||||||
Others | d | (53 | ) | (53 | ) | |||||
Total adjustments to equity | 1,057 | 385 | ||||||||
|
|
|
| |||||||
Total equity under IFRS | 192,171 | 153,398 | ||||||||
|
|
|
| |||||||
27.2.3 Effects of IFRS adoption on consolidated net income – Consolidated income statement
| For the year ended December 31, 2011 | ||||||||||||||||||||
| Note | Mexican FRS | Adjustments | Reclassifications | IFRS | ||||||||||||||||
Net sales | d | Ps. | 201,867 | Ps. | (1,441) | Ps. | — | Ps. | 200,426 | |||||||||||
Other operating revenues | d | 1,177 | (63 | ) | — | 1,114 | ||||||||||||||
|
|
|
|
|
|
|
| |||||||||||||
Total revenues | 203,044 | (1,504 | ) | — | 201,540 | |||||||||||||||
Cost of goods sold | b,c,d,l | 118,009 | (1,079 | ) | 314 | 117,244 | ||||||||||||||
|
|
|
|
|
|
|
| |||||||||||||
Gross profit | 85,035 | (425 | ) | (314 | ) | 84,296 | ||||||||||||||
|
|
|
|
|
|
|
| |||||||||||||
Administrative expenses | b,c,d,l | 8,249 | (172 | ) | 95 | 8,172 | ||||||||||||||
Selling expenses | b,c,d,l | 49,882 | (575 | ) | 1,378 | 50,685 | ||||||||||||||
Other income | d,l | — | 21 | 360 | 381 | |||||||||||||||
Other expenses | d,l | (2,917 | ) | 60 | 785 | (2,072 | ) | |||||||||||||
Interest expense | d,j | (2,934 | ) | 6 | 626 | (2,302 | ) | |||||||||||||
Interest income | d,j | 999 | 15 | — | 1,014 | |||||||||||||||
Foreign exchange gain, net | d,l | 1,165 | (33 | ) | 16 | 1,148 | ||||||||||||||
Gain on monetary position for subsidiaries in hyperinflationary economies | d | 146 | (93 | ) | — | 53 | ||||||||||||||
Market value loss on financial instruments | e | (159 | ) | 50 | — | (109 | ) | |||||||||||||
|
|
|
|
|
|
|
| |||||||||||||
Income before income taxes and share of the profit of associates and joint ventures accounted for using the equity method | 23,204 | 348 | — | 23,552 | ||||||||||||||||
Income taxes | d,g | 7,687 | 131 | (200 | ) | 7,618 | ||||||||||||||
Share of the profit or loss of associates and joint ventures accounted for using the equity method | l | 5,167 | — | (200 | ) | 4,967 | ||||||||||||||
|
|
|
|
|
|
|
| |||||||||||||
Consolidated net income | Ps. | 20,684 | Ps. | 217 | Ps. | — | Ps. | 20,901 | ||||||||||||
|
|
|
|
|
|
|
| |||||||||||||
Attributable to: | ||||||||||||||||||||
Controlling interest | 15,133 | 199 | — | 15,332 | ||||||||||||||||
Non-controlling interest | d,i | 5,551 | 18 | — | 5,569 | |||||||||||||||
|
|
|
|
|
|
|
| |||||||||||||
Consolidated net income | Ps. | 20,684 | Ps. | 217 | Ps. | — | Ps. | 20,901 | ||||||||||||
|
|
|
|
|
|
|
| |||||||||||||
27.2.4 Effects of IFRS adoption on consolidated comprehensive Income – Consolidated Statement of comprehensive income
| For the year ended December 31, 2011 | ||||||||||||||||
| Note | Mexican FRS | Adjustments | IFRS | |||||||||||||
Consolidated net income | Ps. | 20,684 | Ps. | 217 | Ps. | 20,901 | ||||||||||
Other comprehensive income: | ||||||||||||||||
Remeasurements of the net defined benefit liability, net of taxes | c | — | (59 | ) | (59 | ) | ||||||||||
Unrealized gain on available for sale securities, net of taxes | 4 | — | 4 | |||||||||||||
Valuation of the effective portion of derivative financial instruments, net of taxes | 118 | — | 118 | |||||||||||||
Exchange differences on translating foreign operations | h | 8,277 | 731 | 9,008 | ||||||||||||
Share of other comprehensive income of associates and joint ventures, net of taxes | k | (1,147 | ) | (248 | ) | (1,395 | ) | |||||||||
|
|
|
|
|
| |||||||||||
Total other comprehensive income, net of taxes | 7,252 | 424 | 7,676 | |||||||||||||
|
|
|
|
|
| |||||||||||
Consolidated comprehensive income, net of taxes | 27,936 | 641 | 28,577 | |||||||||||||
|
|
|
|
|
| |||||||||||
Attributable to: | ||||||||||||||||
Controlling interest(1) | Ps. | 20,817 | Ps. | 169 | Ps. | 20,986 | ||||||||||
Non-controlling interest(1) | 7,119 | 472 | 7,591 | |||||||||||||
|
|
|
|
|
| |||||||||||
| (1) | IFRS controlling interest and non-controlling interest, net of reattribution of other comprehensive income by aquisitions of Grupo Tampico and Grupo CIMSA amounted to Ps. 21,073 and Ps. 7,504, respectively. See Consolidated Statements of Comprehensive Income. |
27.2.5 Reconciliation of consolidated net income
| Note | For the Year ended December 31, 2011 | |||||
Consolidated net income under Mexican FRS | Ps. | 20,684 | ||||
Depreciation of Property, plant and equipment | b | 458 | ||||
Amortization of Intangible assets | d | 12 | ||||
Post-employment and other long-term employee benefits | c | 92 | ||||
Embedded derivatives | e | 51 | ||||
Share-based payments | f | 27 | ||||
Effective interest method | j | (16 | ) | |||
Effect on deferred income taxes | g | (131 | ) | |||
Inflation effects | d | (273 | ) | |||
Other inflation effects on assets | d | (3 | ) | |||
Total adjustments to consolidated net income | 217 | |||||
Total consolidated net income under IFRS | Ps. | 20,901 | ||||
27.3 Explanation of the effects of the adoption of IFRS
The following notes explain the significant adjustments and/or reclassifications for the adoption of IFRS:
| a) | Cash and Cash Equivalents: |
For purposes of Mexican FRS, restricted cash is presented within cash and cash equivalents, whereas for purposes of IFRS it is presented in the statement of financial position depending on the term of the restriction.
The transition from Mexican FRS to IFRS did not have a material impact on the consolidated statement of cash flows for the year ended December 31, 2011.
| b) | Property, Plant and Equipment: |
The adjustments to property, plant and equipment are explained as follows:
| December 31, 2011 | ||||||||||||||||||||
Cost | Mexican FRS | Reclassifications | Adjustment for the write-off of inflation recognized under Mexican FRS | Borrowing Cost | IFRS | |||||||||||||||
Land | Ps. | 6,444 | Ps. | — | Ps. | (1,300) | Ps. | — | Ps. | 5,144 | ||||||||||
Buildings | 15,404 | — | (2,338 | ) | — | 13,066 | ||||||||||||||
Machinery and equipment | 46,972 | — | (6,348 | ) | — | 40,624 | ||||||||||||||
Refrigeration equipment | 11,774 | — | (1,138 | ) | — | 10,636 | ||||||||||||||
Returnable bottles | 4,140 | 290 | (315 | ) | — | 4,115 | ||||||||||||||
Leasehold improvements | — | 8,808 | (535 | ) | — | 8,273 | ||||||||||||||
Investments in fixed assets in progress | 3,920 | 161 | 9 | 12 | 4,102 | |||||||||||||||
Non-strategic assets | 101 | (101 | ) | — | — | — | ||||||||||||||
Other | 585 | 101 | (91 | ) | — | 595 | ||||||||||||||
|
|
|
|
|
|
|
|
|
| |||||||||||
Subtotal | Ps. | 89,340 | Ps. | 9,259 | Ps. | (12,056) | Ps. | 12 | Ps. | 86,555 | ||||||||||
|
|
|
|
|
|
|
|
|
| |||||||||||
Accumulated Depreciation | ||||||||||||||||||||
Buildings | Ps. | (4,695) | Ps. | — | Ps. | 534 | Ps. | — | Ps. | (4,161) | ||||||||||
Machinery and equipment | (22,693 | ) | — | 4,844 | — | (17,849 | ) | |||||||||||||
Refrigeration equipment | (7,076 | ) | — | 1,032 | — | (6,044 | ) | |||||||||||||
Returnable bottles | (1,272 | ) | — | 241 | — | (1,031 | ) | |||||||||||||
Leasehold improvements | — | (2,838 | ) | 139 | — | (2,699 | ) | |||||||||||||
Other | (202 | ) | — | (6 | ) | — | (208 | ) | ||||||||||||
|
|
|
|
|
|
|
|
|
| |||||||||||
Subtotal | (35,938 | ) | (2,838 | ) | 6,784 | — | (31,992 | ) | ||||||||||||
|
|
|
|
|
|
|
|
|
| |||||||||||
Property, plant and equipment, net | Ps. | 53,402 | Ps. | 6,421 | Ps. | (5,272) | Ps. | 12 | Ps. | 54,563 | ||||||||||
|
|
|
|
|
|
|
|
|
| |||||||||||
Cost Land Buildings Machinery and equipment Refrigeration equipment Returnable bottles Leasehold improvements Investments in fixed assets in progress Non-strategic assets Other Subtotal Accumulated Depreciation Buildings Machinery and equipment Refrigeration equipment Returnable bottles Leasehold improvements Other Subtotal Property, plant and equipment, net January 1, 2011 Mexican FRS Reclassifications Adjustment
for the write-off
of inflation
recognized under
Mexican FRS Borrowing
Cost Cost under
IFRS Ps. 5,226 Ps. — Ps. (1,220) Ps. — Ps. 4,006 12,941 — (2,668 ) — 10,273 38,218 — (5,618 ) — 32,600 9,540 — (1,078 ) — 8,462 2,854 238 (162 ) — 2,930 — 7,926 (656 ) — 7,270 3,016 59 7 — 3,082 232 (232 ) — — — 460 232 (63 ) — 629 Ps. 72,487 Ps. 8,223 Ps. (11,458) Ps. — Ps. 69,252 Ps. (3,993) Ps. — Ps. 646 Ps. — Ps. (3,347) (20,031 ) — 4,202 — (15,829 ) (5,777 ) — 999 — (4,778 ) (601 ) — 123 — (478 ) — (2,730 ) 266 — (2,464 ) (175 ) — 1 — (174 ) (30,577 ) (2,730 ) 6,237 — (27,070 ) Ps. 41,910 Ps. 5,493 Ps. (5,221) Ps. — Ps. 42,182
The Company ceased to record inflationary adjustments to its property, plant and equipment on December 31, 2007, due to both changes to Mexican FRS in effect at that time, and the fact that the Mexican peso was not deemed to be a currency of an inflationary economy as of that date. According to IAS 29,Financial Reporting in Hyperinflationary Economiesthe last hyperinflationary period for the Mexican peso was in 1998. As a result, the Company eliminated the cumulative inflation recognized within long-lived assets for the Company’s Mexican operations, based on Mexican FRS during the years 1999 through 2007, which were not deemed hyperinflationary for IFRS purposes.
| 1. | For the foreign operations, the cumulative inflation from the acquisition date was eliminated (except in the case of Venezuela, which was deemed a hyperinflationary economy) from the date the Company began to consolidate them. |
| 2. |
| c) | Post-employment and Other Long-term Employee Benefits: |
Note 27. Differences BetweenAccording to Mexican FRS D-3Employee Benefits, a severance provision and U.S. GAAP.the corresponding expense, must be recognized based on the experience of the entity in terminating the employment relationship before the retirement date, or if the entity deems to pay benefits as a result of an offer made to employees to encourage a voluntary termination. For IFRS purposes, this provision was eliminated as it does not meet the definition of a termination benefit pursuant to IAS 19 (2011) Employee Benefits. Accordingly, at the transition date, the Company derecognized its severance indemnity recorded under Mexican FRS against retained earnings given that no obligation exists. A formal plan was not required for recording a provision under Mexican FRS. As of December 31, 2011 and January 1, 2011 (transition date), the Company eliminated the severance provision for an amount of Ps. 640 and Ps. 452, respectively.
The United States Financial Accounting Standards Board (“FASB”) released the FASB Accounting Standards Codification, or Codification for short, on January 15, 2008 and it became effective in July 2009. At that time all previous reference sources to accounting principles generally accepted in the United States of America (“U.S. GAAP”) became obsolete. The Codification organizes all U.S. GAAP pronouncements under approximately 90 accounting topic areas. The objective of this projectIAS 19 (2011), which was to arrive at a single source of authoritative U.S. accounting and reporting standards, other than certain guidance issued by the SEC. Included in this Note and Note 28 and 29 are references to certain U.S. GAAP Codifications (“ASC”) that have beenearly adopted by the Company (mandatorily effective as of January 1, 2013), eliminates the use of the corridor method, which defers the remeasurements of the net defined benefit liability, and certain ASC’srequires that have yetsuch items be recorded directly within other comprehensive income in each reporting period. The standard also eliminates deferral of past service costs and requires entities to record them in earnings in each reporting period. These requirements increased the Company’s liability for post- employment and other long-term employee benefits with a corresponding reduction in retained earnings at the transition date. Based on these requirements, the items pending to be adopted by the Company.
As discussed in Note 3, the consolidated financial statements of the Company are preparedamortized in accordance with Mexican FRS which differs in certain significant respects from U.S. GAAP. A reconciliation of the reported net income, stockholders’ equity and comprehensive income to U.S. GAAP is presented in Note 28.
The principal differences between Mexican FRS and U.S. GAAP included in the reconciliation that affect the consolidated financial statements of the Company are described below.
The Company consolidates its investment in Coca-Cola FEMSA under Mexican FRS, in accordance with Bulletin B-8 “Consolidated and Combined Financial Statements and Valuation of Long-Term Investments in Shares” through 2008 and revised NIF B-8 “Consolidated and Combined Financial Statements” beginning in 2009were reclassified as disclosed in Note 3 G.
For U.S. GAAP purposes, the existence of substantive participating rights held by the Coca-Cola Company (noncontrolling interest), as addressed in the shareholder agreement, did not allow FEMSA to consolidate Coca-Cola FEMSA in its financial statements. Therefore, FEMSA’s investment in Coca-Cola FEMSA had been accounted for by the equity method in FEMSA’s consolidated financial statement under U.S. GAAP for the years ended December 31, 2009 and 2008.
As of December 31, 2009,2011 and January 1, 2011 to retained earnings at the transition date for Ps. 840 and Ps. 708 respectively in the consolidated statement of financial position.
In Coca-Cola FEMSA Brazil where there is a defined benefit plan, the fair value of FEMSA’s investment in Coca-Cola FEMSA represented by 992,078,519 shares equivalent to 53.7% of its outstanding shares amounted to Ps. 85,135 based on quoted market prices of that date.
Coca-Cola FEMSA’s summarized consolidated balance sheet and income statements under US GAAP are presented as follows as of December 31;
| ||||
| ||||
| ||||
| ||||
| ||||
| ||||
| ||||
| ||||
| ||||
| ||||
| ||||
| ||||
| ||||
Consolidated Income Statements | 2009 | 2008 | ||||||
Total revenues | Ps. 100,393 | Ps. 81,099 | ||||||
Income from operations | 14,215 | 12,042 | ||||||
Income before income taxes | 12,237 | 7,685 | ||||||
Income taxes | 3,525 | 1,987 | ||||||
Consolidated net income | 8,853 | 5,802 | ||||||
Less: Net income attributable to the noncontrolling interest | (446 | ) | (231 | ) | ||||
Net income attributable to the controlling interest | 8,407 | 5,571 | ||||||
Consolidated comprehensive income | 10,913 | 6,288 | ||||||
Less: Comprehensive income attributable to the noncontrolling interest | (592 | ) | (175 | ) | ||||
Consolidated comprehensive income attributable to the controlling interest | Ps. 10,321 | Ps. 6,113 | ||||||
On February 1, 2010, FEMSA andplan assets exceeds the Coca-Cola Company signed an amendment to their shareholder’s agreement. This amendment allowed FEMSA to continue to consolidate Coca-Cola FEMSA for Mexican FRS purposes during 2009, because the Company has maintained control over its operating and financial policies. As a resultamount of the modifications to the shareholders’ agreement, substantive participating rights held by The Coca-Cola Company were amended and became protective rights. As a resultdefined benefit obligation of the modifications made to the shareholders agreement, which provided control to the Company over Coca-Cola FEMSA, the Company recognized a business combination without transfer of consideration in order to comply with ASC 805 and beginning February 1, 2010 started to consolidate Coca-Cola FEMSA for U.S. GAAP purposes.
The Company estimated the total fair value of Coca-Cola FEMSA based on Coca-Cola FEMSA’s outstanding shares price quotedplan. This surplus has been recorded in the Mexican Stock Exchange of Ps. 80.21 (level 1 information) as of February 1, 2010. As a result of a business combination without transfer of consideration, the Company recognized a gain in other income in the consolidated income statements under U.S. GAAP which amounted to Ps. 39,847. This gain represents the difference between the book value and the fair value of the investment acquired in Coca-Cola FEMSA as of the date of the control acquisition and is reported in “other income, net”.
As of the acquisition date and based on the purchase price allocation, the Company has mainly identified intangible assets with indefinite lives consisting of distribution rights of Ps. 113,434 and depreciable long-lived assets that amounted to Ps. 27,409. The Company has also recognized goodwill of Ps. 41,761 as part of this transaction. The goodwill recognized with our control acquisition of Coca-Cola FEMSA is primarily related to synergistic value created from having an unified operating system that will strategically position us to better market and distribute our beverage brands in Mexico, Central America, Brazil, Colombia, Venezuela and Argentina.
The purchase price allocation based on estimated fair value of all Coca-Cola FEMSA net assets acquired by the Company is as follows:
| ||||
| ||||
| ||||
| ||||
| ||||
| ||||
| ||||
| ||||
| ||||
| ||||
| ||||
| ||||
| ||||
After acquisition date, depreciation and amortization of identified assets net of deferred income tax resulted in Ps. 661.
The Company recognized within its consolidated income statement revenues of Ps. 95,839 and a net income of Ps. 9,734 for the year ended December 31, 2010, for the eleven months of operations related to Coca-Cola FEMSA after the acquisition date.
Unaudited Pro Forma Financial Data
The following unaudited consolidated pro forma financial data represents the Company’s historical financial statements, adjusted to give effect to (i) the acquisition of Coca Cola FEMSA mentioned in the preceding paragraphs; and (ii) certain accounting adjustments related mainly to the depreciation of the step-up adjustment for fixed assets acquired, (iii) eliminating the gain on the acquisition of Coca-Cola FEMSA.
The unaudited pro forma adjustments assume that the acquisition was made at the beginning of the year immediately preceding the year of acquisition and are based upon available information and other assumptions that management considers reasonable. The pro forma financial information data does not purport to represent what the effect on the Company’s consolidated operations would have been, had the transactions in fact occurred at the beginning of each year, nor are they intended to predict the Company’s future results of operations.
| FEMSA unaudited pro forma consolidated results for the years ended December 31, | ||||||||
| 2010(2) | 2009(2) | |||||||
Total revenues | 184,336 | 195,090 | ||||||
Income before taxes(1) | 47,607 | 18,924 | ||||||
Net income(1) | 32,543 | 15,022 | ||||||
As explained in Note 2, on April 30, 2010, FEMSA exchanged 100% of its shares in FEMSA Cerveza for a 20% economic interest in Heineken Group. According to Mexican FRS, the disposal of FEMSA Cerveza has been accounted as a discontinued operation.
For U.S. GAAP purposes, FEMSA Cerveza has not been accounted for as a discontinued operation, given the significant cash flows that continue to be exchanged between FEMSA’s ongoing operations and those of the disposed entity. As a result, the disposition was accounted for as a sale of a group of assets and classified within continuing operations in the consolidated financial statements under U.S. GAAP, and not as the disposal of a component of FEMSA. As such, the Company’s Mexican FRS consolidated income statements have reported FEMSA Cerveza’s results of operations prior to the April 30, 2010 exchange in one line item (discontinued operations).For U.S. GAAP purposes it continues to fully consolidate its line by line results prior to the exchange. Additionally, the Company’s Mexican FRS consolidated balance sheet has segregated the FEMSA Cerveza assets and liabilities as current and noncurrent assets and liabilities of discontinued operations as of December 31, 2009, but under U.S. GAAP continues to report individual line items as of such date. See Note 2 for summarized FEMSA Cerveza financial statements for dates and periods prior to April 30, 2010 under Mexican FRS.
The acquisition of the 20% economic interest in Heineken has been accounted for taking into consideration closing prices of Heineken N.V. and Heineken Holding N.V. as of the acquisition date (see Note 2) As of April 30, 2010, under U.S. GAAP, the Company recognized a gain of Ps. 27,132 within other income in the consolidated statements of income and comprehensive income, which represents the difference between the book value of its interest in FEMSA Cerveza and the acquisition value of Heineken recorded at the exchange date. The basis of the assets and liabilities under U.S. GAAP of the FEMSA Cerveza at the exchange date was different from the basis of such assets and liabilities under Mexican FRS, additionally the goodwill of Ps. 10,600 allocated to FEMSA Cerveza was cancelled as part of this transaction (see Note 27 N); accordingly, the gain recorded on disposal under U.S. GAAP differs from that under Mexican FRS. The deferred income taxfor U.S. GAAP purposes amounted to Ps.10,099.
For subsequent accounting the Company recognizes its investment in Heineken for purposes of Mexican FRS under the equity method after reconciling Heineken’s net income and comprehensive income from IFRS to Mexican FRS, as a result of its ability to exercise significant influence over its operating and financial policies as disclosed in Note 2. However, for purposes of U.S. GAAP, the Company recognizes its investment in Heineken based on the cost method because it was unable to obtain the required information to reconcile Heineken’s net income to U.S. GAAP on an accurate and reliable basis.
Beginning on January 1, 2008,Other Comprehensive Income account in accordance with NIF B-10, the Company discontinued inflationary accountingprovisions of IAS 19 (2011). According to the special rules for subsidiaries that operatestandard, the asset ceiling is the present value of any economic benefits available as reductions in non-inflationary economic environments. As a result, financial statements arefuture contributions to the plan. Under Mexican FRS, there is no longer restated for inflation after Dec.restriction to limit the asset. At December 31, 2007. The cumulative effect of previously realized2011 and unrealized results of holding non-monetary assets (RETANM) of previous periods was reclassified to retained earnings as described in Note 3 I. This reclassification does not result in a difference to reconcile for U.S. GAAP purposes since those amounts are ultimately recognized in the Company’s financial statements.
As a result of discontinued inflationary accounting for subsidiaries that operate in non-inflationary economic environments, the Company’s financial statements are no longer considered to be presented in a reporting currency that comprehensively includes the effects of price level changes; therefore, the inflationary effects of inflationary economic environments arising in 2008, 2009 and 2010 result in a difference to be reconciled for U.S. GAAP purposes. The equity method ofJanuary 1, 2011, Coca-Cola FEMSA recorded by FEMSA as of January 31, 2010,Brazil reclassified from Post-employment and December 31, 2009other non-current employee benefits to other comprehensive income Ps. 127 and 2008 considers this difference, as well as the consolidated net income for the eleven months ended on December 31, 2010.Ps. 199, respectively.
As disclosed in Note 5 A, the three year cumulative inflation rate for Venezuela was 100.5% for the period 2007 through 2009. The three year cumulative inflation rate for Venezuela was 108.2 % as of December 31, 2010. Accordingly, Venezuela is accounted for as a hyper-inflationary economy for U.S. GAAP purposes since January 1, 2010.
For U.S. GAAP reconciliation purposes, the Company has applied an accommodation available in Item 18 to the instructions to Form 20-F whereby the International Accounting Standard 21 Changes in Foreign Exchange Rates (IAS 21) and IAS 29 Financial Reporting in Hyperinflationary Economies (IAS 29) indexation approach is applied. U.S. GAAP would otherwise require a hyper-inflationary economy to be reported using the U.S. dollar as a functional currency. The information related to the revenues as well as long-term assets and total assets related to the Venezuelan subsidiary are shown separately in the segment disclosure footnote (see Note 26). Recent devaluations in the Venezuelan currency are also discussed in Note 4 above.
| d) |
Certain items require a different classificationAs discussed above in b), for purposes of IFRS the balance sheet or income statement under U.S. GAAP. These include:
As explained in Note 5 D,Company eliminated the accumulated inflation recorded under Mexican FRS advancesfor such intangible assets, equity and net income related to suppliers are recorded as inventories. Under U.S. GAAP advances to suppliers are classified as prepaid expenses;
Beginning on January 1, 2010, restricted cash has been classifiedaccounts that were not generated from other current assets to cash and cash equivalents according to NIF C-1 Cash and Cash Equivalents. Under U.S. GAAP, restricted cash remains classified as other current or long term assets;operations in hyperinflationary economies.
Impairment of goodwill and other long-lived assets, the gains or losses on the disposition of fixed assets, all severance payments associated with an ongoing benefit and amendments to pension plans, financial expenses from labor liabilities and employee profit sharing, among others, are recorded as part of operating income under U.S. GAAP;
Under Mexican FRS, deferred taxes are classified as non-current, while under U.S. GAAP they are classified based on the classification of the related asset or liability or their estimated reversal date when not associated with an asset or liability;
Under Mexican FRS, market value gain/loss of embeded derivatives contracts are recorded as market value gain/loss of ineffective portion of derivatives financial instruments. For USGAAP purposes, this effect has been reclassified to operating expenses; and
Under Mexican FRS, restructuring costs are recorded as other expenses while for USGAAP purposes restructuring costs are recorded as operating expense.
| e) |
As explainedFor Mexican FRS purposes, the Company recorded embedded derivatives for agreements denominated in Note 5 K, through 2008,foreign currency. Pursuant to the principles set forth in IAS 39, there is an exception for embedded derivatives on those contracts that are denominated in certain foreign currencies, if for example the foreign currency is commonly used in the economic environment in which the transaction takes place. The Company concluded that all of its embedded derivatives fell within the scope of this exception. Therefore, at the transition date, the Company derecognized all embedded derivatives recognized under Mexican FRS, start-up expenses were capitalized and amortized using the straight-line method in accordance with the terms of the lease contracts at the start of operations. Under U.S. GAAP, these expenses must be recorded in the income statement as incurred. Beginning on January 1, 2009, the Company adopted NIF C-8 “Intangible Assets”, which establishes that start-up expenses have to be recorded in the income statement as incurred (see Note 5 K). As a result, since 2009, there are no differences between Mexican FRS and U.S. GAAP.FRS.
| f) |
As explainedUnder Mexican FRS D-3, the Company recognizes its stock bonus plan as a defined contribution plan. IFRS requires that such share-based payment plans be recorded under the principles set forth in note 5 E,IFRS 2,Share-based Payments. The most significant difference for changing the accounting treatment is related to the period during which compensation expense is recognized, which under Mexican FRS promotional expenses relatedD-3 the total amount of the bonus is recorded in the period in which it was granted, while in IFRS 2 it is recognized over the vesting period of such awards.
Additionally, the trust that holds the equity shares allocated to executives, is considered to hold plan assets and was not consolidated under Mexican FRS. However, for purposes of IFRS, SIC 12Consolidation-Special Purpose Entities, requires the launching of new products or product presentations are recorded as prepaid expenses. For U.S. GAAP purposes, such promotional expenses are expensed as incurred.Company to consolidate the trust and reflect its own shares in treasury stock and reduce the non-controlling interest for Coca-Cola FEMSA’s shares held by the trust.
| g) |
AccordingThe adjustments to Mexican FRS,IFRS recognized by the Company had an impact in 2003 the amortizationdeferred income tax calculation, according to the requirements set forth by IAS 12. The impact in the Company’s equity as of goodwillDecember 31, 2011 and January 1, 2011 was discontinued. For U.S. GAAP purposes, since 2002 goodwillPs. 4,936 and indefinite-lived intangible assets are no longer subjectPs. 3,633, respectively. The impact in net income for the year ended December 31, 2011 earnings was Ps. 131.
Furthermore, the Company derecognized a deferred liability recorded in the exchange of shares of FEMSA Cerveza with the Heineken Company which amounted to amortization.
Under U.S. GAAP, indefinite-lived intangible assets are recorded at estimated fair value atPs. 10,099. IFRS has an exception for recognition of a deferred tax liability for an investment in a subsidiary if the dateparent is able to control the timing of the acquisition, under Mexican FRS intangible assetsreversal and it is probable that it will not reverse in the foreseeable future.
Additionally, the Company reclassified the deferred income taxes and other taxes balances in order to comply with indefinite life are recognized at its estimated fair value, limitedIFRS off-setting requirements. The Company reclassified from recoverable taxes to the underlyingtaxes payable balances an amount of the purchase price consideration. This results in a difference in accounting for acquired intangiblePs. 1,032 and Ps. 909, and from deferred tax assets between Mexican FRSto deferred tax liabilities balances an amount of Ps. 600 and U.S.GAAP.Ps. 1,070, as of December 31, 2011 and January 1, 2011, respectively.
| h) |
Through December 2007,The Company decided to use the Company restated imported machinery and equipmentexemption provided by applyingIFRS 1, which permits it to adjust at the inflation rate andtransition date all the exchange rate of the currency of the country of origin. The resulting amounts were then translated into Mexican pesos using the period end exchange rate. This result in a difference in accounting betweentranslation effects it had recognized under Mexican FRS to zero and U.S. GAAP.
As explainedbegin to record them in Note 3 Iaccordance with IAS 21 on January 1, 2008,a prospective basis. The effect was Ps. 6 at the Company adopted NIF B-10, which establishes that imported machinery and equipment are recorded using the exchange ratetransition date, net of the acquisition date. Subholding Companies that operate in inflationary economic environments have to restate those assets by applying the inflation rate in their own countries. The change in this methodology did not impact significantly the consolidated financial positiondeferred income taxes of the Company (see Note 3 I).Ps. 1,112.
| i) |
Through 2006,All the adjustments arising from the Company’s transition to IFRS at the transition date were adjusted against retained earnings and according to Bulletin C-6 “Property, plant and equipment” the Company had not capitalized the comprehensive financial result related to fixed assets.
Beginning in 2007, according to NIF D-6 “Capitalization of Comprehensive Financing Result”, the Company capitalized the comprehensive financing result generated by borrowing obtained to finance qualifying assets.
According to U.S. GAAP, if interest expense (does not include all the components of comprehensive result defined by Mexican FRS) is incurred during the construction of qualifying assets and the net effect is material, capitalization is required for all assets that require a period of time to get them ready for their intended use. The net effect of interest expenses incurred to bring qualifying assets to the condition for its intended use was Ps. 90, Ps. 90 and Ps. 56 forextent applicable also impacted the years ended on December 31, 2010, 2009 and 2008, respectively.
A reconciling item is included forbalance of the difference in capitalized comprehensive financing result and the related amortization recorded under Mexican FRS and the corresponding capitalized interest expense and related amortization recorded under U.S. GAAP.non-controlling interest.
| j) |
In 2008,accordance with IFRS, the Company adopted a FASB pronouncement that establishes a framework for measuring fair value providing a consistent definition that focuses on exit price and prioritizes the use of market based inputs over company specific inputs. This pronouncement requires companies to consider its own nonperformance risk when measuring liabilities carried at fair value, including derivative financial instruments. The effective date of this standard for nonfinancial assets and nonfinancial liabilities that are recognized or disclosed at fair value on a recurring basis (at least annually) started on January 1, 2009.
Additionally, U.S. GAAP establishes a three level fair value hierarchy that prioritizes the inputs used to measure fair value. This hierarchy requires entities to maximize the use of observable inputs and minimize the use of unobservable inputs. The three levels of inputs are fully described in Note 20. The Company has segregated all financial assets and liabilities classified as held to maturity or accounts receivables are subsequently measured using the effective interest rate method as appropriate.
| k) | Investments in Associates and Joint Ventures: |
On 1 January 2011, Heineken Company changed its accounting policy with respect to the recognition of actuarial gains and losses arising from defined benefit plans. After the policy change, Heineken Company recognizes all actuarial gains and losses immediately in other comprehensive income (OCI). In prior years, Heineken Company applied the corridor method. To the extent that any cumulative unrecognised actuarial gain or loss exceeds ten percent of the greater of the present value of the defined benefit obligation and the fair value of plan assets, that portion was recognized in profit or loss over the expected average remaining working lives of the employees participating in the plan. Otherwise, the actuarial gain or loss was not recognized. As such, this change means that deferral of actuarial gains and losses within the corridor are no longer applied and had an impact in our investment in Heineken Company through equity method.
| l) | Presentation and Disclosure Items: |
IFRS requires additional disclosures that are more extensive than those of Mexican FRS, which resulted in additional disclosures regarding accounting policies, significant judgments and estimates, financial instruments and capital management, among others. Additionally, the Company reclassified certain items within its consolidated income statement and consolidated statement of financial position to conform with the requirements of IAS 1,Presentation of Financial Statements.
| 28 | Future Impact of Recently Issued Accounting Standards not yet in Effect: |
The Company has not applied the following new and revised IFRSs that have been issued but are not yet effective as of December 31, 2012.
IFRS 9,Financial Instrumentsissued in November 2009 and amended in October 2010 introduces new requirements for the classification and measurement of financial assets and financial liabilities and for derecognition.
The standard requires all recognized financial assets that are within the scope of IAS 39 to be subsequently measured at amortized cost or fair value. Specifically, debt investments that are held within a business model whose objective is to collect the contractual cash flows, and that have contractual cash flows that are solely payments of principal and interest on the principal outstanding are generally measured at amortized cost at the end of subsequent accounting periods. All other debt investments and equity investments are measured at their fair values at the end of subsequent accounting periods.
The most significant effect of IFRS 9 regarding the classification and measurement of financial liabilities relates to the accounting for changes in fair value onof a recurring basis (at least annually) intofinancial liability (designated as at FVTPL) attributable to changes in the most appropriate level withincredit risk of that liability. Specifically, under IFRS 9, for financial liabilities that are designated as at FVTPL, the amount of change in the fair value hierarchy based onof the inputs usedfinancial liability that is attributable to determinechanges in the credit risk of that liability is recognized in other comprehensive income, unless the recognition of the effects of changes in the liability’s credit risk in other comprehensive income would create or enlarge an accounting mismatch in profit or loss. Changes in fair value attributable to a financial liability’s credit risk are not subsequently reclassified to profit or loss. Previously, under IAS 39, the entire amount of the change in the fair value of the financial liability designated as at FVTPL was recognized in profit or loss.
This standard has not been early adopted by the measurement date as shown in Note 20.
Company. The Company is exposedhas yet to counterparty credit risk on all derivative financial instruments. Because the amounts are recorded at fair value, the full amountcomplete its evaluation, of the Company’s exposure is the carrying value of these instruments. Credit risk is monitored through established approval procedures, which consider grading counterparties periodically in order to offset the net effect of counterparty’s credit risk. Aswhether this standard will have a result the Company only enters into derivative transactions with well-established financial institutions; and estimates that such risk is minimal.
U.S. GAAP allows entities to voluntarily choose to measure certain financial assets and liabilities at fair value (fair value option). The fair value option may be elected on an instrument by instrument basis and is irrevocable, unless a new election date occurs. If the fair value option is elected for an instrument, the unrealized gains and losses for that instrument shall be reported in earnings at each subsequent reporting date. The Company did not elect to adopt fair value option to any of its outstanding instruments; therefore, it did not have anymaterial impact on its consolidated financial statements.
In accordance with
On May and June, 2011, the IASB issued new standards and amended some existing standards including requirements of accounting and presentation for particular topics that have not yet been applied in these consolidated financial instruments disclosures, it is necessary to disclose, instatements. A summary of those changes and amendments includes the body of the financial statements or in the notes, the fair value of financial instruments for which it is practicable to estimate it, and the method(s) used to estimate the fair value. The Company estimates that carrying amounts of cash and cash equivalents, accounts receivable, interest payable, suppliers, accounts payable and other current liabilities approximate their fair value due to their short maturity.
Additionally as explained in Note 17, the Company has a bonus program in which the cost of the equity instruments is measured based on the fair value of the instruments on the date they are granted.following:
| • |
|
The calculation of deferred income taxes and employee profit sharing for U.S. GAAP purposes differs from Mexican FRS as follows:
Under Mexican FRS, inflation effects on the deferred taxes balance generated by monetary items are recognized in the income statement as part of the result of monetary position of subsidiaries in inflationary economic environments. Under U.S. GAAP, the deferred taxes balance is classified as a non-monetary item. As a result, the consolidated U.S. GAAP income statement differs with respect to the presentation of the gain or loss on monetary position and deferred income taxes provision;
Under Mexican FRS, deferred employee profit sharing is calculated using the asset and liability method, which is the method used to compute deferred income taxes under U.S. GAAP. Employee profit sharing is deductible for purposes of Mexican taxes from profit. This deduction reduces the payments of income taxes in subsequent years. For Mexican FRS purposes, the Company did not record deferred employee profit sharing, since is not expected to materialize in the future; and
The differences in the deferred income tax of the control acquisition of Coca-Cola FEMSA, deferred income tax of the exchange of FEMSA Cerveza shares, start up expenses through 2008, deferred promotional expenses, intangible assets, restatement of imported machinery and equipment, capitalization of comprehensive financial result, employee benefits and deferred employee profit sharing, explained in Note 27 A, B, E, F, G, H, I, and K, generate a difference when calculating deferred income taxes under U.S. GAAP compared to that presented under Mexican FRS (see Note 24 D).
The reconciliation of deferred income tax and employee profit sharing, as well as the changes in the balances of deferred taxes, are as follows:
Reconciliation of Deferred Income Taxes, Net | 2010 | 2009 | ||||||
Deferred income taxes under Mexican FRS | Ps. | 10,221 | Ps. | (660 | ) | |||
Deferred income taxes of discontinued operation under Mexican FRS | — | 378 | ||||||
Deferred income taxes of Coca-Cola FEMSA | — | (1,640 | ) | |||||
U.S. GAAP adjustments: | ||||||||
Deferred promotional expenses | (14 | ) | — | |||||
Deferred income tax of Coca-Cola FEMSA´s fair value adjustments | 21,833 | — | ||||||
Intangible assets | (22 | ) | — | |||||
Deferred charges | (20 | ) | — | |||||
Deferred revenues | 26 | — | ||||||
Equity method of Heineken | (859 | ) | — | |||||
Restatement of imported equipment | 85 | (29 | ) | |||||
Capitalization of interest expense | 4 | 62 | ||||||
Tax deduction for deferred employee profit sharing | 50 | (38 | ) | |||||
Employee benefits | (220 | ) | (478 | ) | ||||
Total U.S. GAAP adjustments | 20,863 | (483 | ) | |||||
Deferred income taxes, net, under U.S. GAAP | Ps. | 31,084 | Ps. | (2,405 | ) | |||
Changes in the Balance of Deferred Income Taxes | 2010 | 2009 | 2008 | |||||||||
Initial balance | Ps. | (2,405 | ) | Ps. | 37 |
| Ps. | 1,604 | ||||
Provision for the year | 599 | (795 | ) | (1,243 | ) | |||||||
Control acquisition of Coca-Cola FEMSA and fair value adjustments | 23,843 | — | — | |||||||||
Deferred tax of the exchange of FEMSA Cerveza | 10,001 | — | — | |||||||||
Financial instruments | 75 | 319 | (622 | ) | ||||||||
Equity method of Heineken | (859 | ) | — | — | ||||||||
Application of tax loss carryforwards due to amnesty adoption | — | 2,066 | — | |||||||||
Reversal of tax loss carryforward allowance | — | (2,066 | ) | — | ||||||||
Effect on tax loss carryforwards | — | (1,874 | ) | — | ||||||||
Change in the statutory income tax rate | (58 | ) | (90 | ) | — | |||||||
Cumulative translation adjustment | (15 | ) | (134 | ) | 437 | |||||||
Unrecognized labor liabilities | (59 | ) | 132 | (139 | ) | |||||||
Other | (38 | ) | — | — | ||||||||
Ending balance | Ps. | 31,084 | Ps. | (2,405 | ) | Ps. | 37 | |||||
Reconciliation of Deferred Employee Profit Sharing Deferred employee profit sharing under Mexican FRS U.S. GAAP adjustments: Allowance for doubtful accounts Inventories Prepaid expenses Property, plant and equipment Deferred charges Intangible assets Capitalization of interest expense Derivative financial instruments Labor liabilities Other liabilities Total U.S. GAAP adjustments Valuation allowance Deferred employee profit sharing under U.S. GAAP 2010 2009 Ps. — Ps. — (1 ) (5 ) 8 22 — 6 25 211 4 (34 ) (1 ) 32 — 2 — 15 (233 ) (405 ) (186 ) (187 ) (384 ) (343 ) 206 477 Ps. (178 ) Ps. 134
Changes in the Balance of Deferred Employee Profit Sharing | 2010 | 2009 | 2008 | |||||||||
Initial balance | Ps. | 134 | Ps. | 214 | Ps. | 483 | ||||||
Provision for the year | (257 | ) | (234 | ) | (576 | ) | ||||||
Acquisition of Coca-Cola FEMSA | (17 | ) | — | — | ||||||||
Net effect on exchange of FEMSA Cerveza | (118 | ) | — | — | ||||||||
Labor liabilities | 82 | 42 | (58 | ) | ||||||||
Valuation allowance | (2 | ) | 112 | 365 | ||||||||
Ending balance | Ps. | (178 | ) | Ps. | 134 | Ps. | 214 | |||||
According to U.S. GAAP, the Company is required to recognize in its financial statements the impact of a tax position when it is more likely than not that the position will be sustained upon examination. If the tax position meets the more-likely-than-not recognition threshold, the tax effect is recognized at the largest amount of the benefit that is greater than 50% likely of being realized. Any excess between the tax position taken in the tax return and the tax position recognized in the financial statements using the criteria above results in the recognition of a liability in the financial statements for the uncertain position. Similarly, if a tax position fails to meet the more-likely-than-not recognition threshold, the benefit taken in tax return will also result in the recognition of a liability in the financial statements for the full amount of the unrecognized benefit. According to Mexican FRS, the Company is required to record tax contingencies in its financial statements when such liabilities are probable in nature and estimable. However, this difference between Mexican FRS and U.S. GAAP is not material to the Company’s consolidated financial statements during any of the periods presented herein, and has thus not resulted in a reconciling item.
| • |
|
NIF D-3 “Employee Benefits” eliminates the recognition of the additional labor liability resulting from the difference between actual benefits and the net projected liabilities, establishes a maximum of five years to amortize the beginning balance of past labor costs of pension plans and severance indemnities and requires recording actuarial gains or losses of severance indemnities as part of the income from operations during the period when those are incurred. The adoption of NIF D-3 generates a difference in the unamortized net transition obligation and in the amortization expense of pension plans and severance indemnities. Under U.S. GAAP the Company is required to fully recognize as an asset or liability from the overfunded or underfunded status of defined pension and other postretirement benefit plans.
For the adoption of NIF B-10 for Mexican FRS, the Company is required to apply real rates for inflationary economic environments and nominal rates for non-inflationary economic environments in the actuarial calculations. The Company uses the same criteria for interest rates for both U.S. GAAP and Mexican FRS.
The reconciliation of the pension cost for the year and related labor liabilities is as follows:
Cost for the Year | 2010 | 2009 | 2008 | |||||||||
Net cost recorded under Mexican FRS | Ps. 600 | Ps. 569 | Ps. 664 | |||||||||
Net cost of Coca-Cola FEMSA | — | (313 | ) | (451 | ) | |||||||
Net cost of FEMSA Cerveza(discontinued operation) | 182 | 574 | 539 | |||||||||
U.S. GAAP adjustments: | ||||||||||||
Amortization of unrecognized transition obligation | (46 | ) | (53 | ) | (55 | ) | ||||||
Amortization of prior service cost | (1 | ) | 5 | 4 | ||||||||
Amortization of net actuarial loss | (4 | ) | 2 | (36 | ) | |||||||
Total U.S. GAAP adjustment | (51 | ) | (46 | ) | (87 | ) | ||||||
Cost for the year under U.S. GAAP | Ps. 731 | Ps. 784 | Ps. 665 | |||||||||
Labor Liabilities | 2010 | 2009 | ||||||
Employee benefits under Mexican FRS | Ps. 1,883 | Ps. 1,776 | ||||||
Employee benefits of Coca-Cola FEMSA | — | (1,088 | ) | |||||
Employee benefits of FEMSA Cerveza | — | 1,578 | ||||||
U.S. GAAP adjustments: | ||||||||
Unrecognized net transition obligation | 115 | 287 | ||||||
Unrecognized prior service | 337 | 696 | ||||||
Unrecognized net actuarial loss | 356 | 730 | ||||||
U.S. GAAP adjustments to stockholders’ equity | 808 | 1,713 | ||||||
Labor liabilities under U.S. GAAP | Ps. 2,691 | Ps. 3,979 | ||||||
Estimates of the unrecognized items expected to be recognized as components of net periodic pension cost during 2011 are shown in the table below:
| Pension and Retirement Plans | Seniority Premiums | Postretirement Medical Services | ||||||||||
Actuarial net loss and prior service cost recognized in cumulative other comprehensive income during the year | Ps. 252 | Ps. (36 | ) | Ps. 20 | ||||||||
Actuarial net loss and prior service cost recognized as a component of net periodic cost | 90 | (3 | ) | 2 | ||||||||
Net transition liability recognized as a component of net periodic cost | 11 | 1 | 2 | |||||||||
Actuarial net loss, prior service cost and transition liability included in cumulative other comprehensive income | 534 | (28 | ) | 107 | ||||||||
Estimate to be recognized as a component of net periodic cost over the following fiscal year: | ||||||||||||
Transition obligation | (2 | ) | — | (1 | ) | |||||||
Prior service credit | 11 | — | — | |||||||||
Actuarial gain / (loss) | 3 | 4 | (5 | ) | ||||||||
| • |
|
Under Mexican FRS, the noncontrolling interest in consolidated subsidiaries is presented as a separate component within stockholders’ equity in the consolidated balance sheet.
| • | IFRS 12,Disclosure of Interests in Other Entities, has the objective to require the disclosure of information to allow the users of financial information to evaluate the nature and risk associated with their interests in other entities, and the effects of such interests on their financial position, financial performance and cash flows. The effective date of IFRS 12 is January 1, 2013, with early application permitted in certain circumstances, but it must be applied in conjunction with IAS 28 (2011), IFRS 10 and IFRS 11. This standard has not been early adopted by the Company. The Company has yet to complete its evaluation of whether this standard will have a material impact on its consolidated financial statements. |
Beginning as of January 1, 2009, under U.S. GAAP, this item must be presented as separate component within consolidated stockholders’ equity in the consolidated balance sheet. Additionally, consolidated net income shall be adjusted to include the net income attributed to the noncontrolling interest. And consolidated comprehensive income shall be adjusted to include the net income attributed to the noncontrolling interest. Because these changes are to be applied retrospectively, they eliminate the differences between MFRS and U.S. GAAP in the presentation of the noncontrolling interest in the consolidated financial statements.
| • | IFRS 13,Fair Value Measurement, establishes a single framework for measuring fair value where that is required by other standards. The standard applies to both financial and non-financial items measured at fair value. Fair value is defined as “the price that would be received to sell an asset or paid to transfer a liability in an orderly transaction between market participants at the measurement date.” IFRS 13 is effective for annual periods beginning on or after January 1, 2013, with early adoption permitted, and applies prospectively from the beginning of the annual period in which the standard is adopted . This standard has not been early adopted by the Company. The Company has yet to complete its evaluation of whether this standard will have a material impact on its consolidated financial statements. |
| • | Amendments to IAS 32,Financial Instruments: Presentation, and IFRS 7,Financial Instruments: Disclosures, as it relates to offsetting financial assets and financial liabilities and the related disclosures. The amendments to IAS 32 clarify existing application issues relating to the offsetting requirements. Specifically, the amendments clarify the meaning of ‘currently has a legally enforceable right of set-off’ and ‘simultaneous realization and settlement’. The amendments to IAS 32 are effective for annual periods beginning on or after January 1, 2014, with retrospective application required. The amendments to IFRS 7 require entities to disclose information about rights of offset and related arrangements (such as collateral posting requirements) for financial instruments under an enforceable master netting agreement or similar arrangement. The amendments to IFRS 7 are required for annual periods beginning on or after January 1, 2013 and interim periods within those annual periods. The disclosures should be provided retrospectively for all comparative periods. This standard has not been early adopted by the Company. The Company has yet to complete its evaluation of whether this standard will have a material impact on its consolidated financial statements. |
In accordance with Mexican FRS, the Company applied the entity theory to the acquisition of the noncontrolling interest by FEMSA in May 1998, through an exchange offer. Accordingly, no goodwill was created as a result of such acquisition and the difference between the book value of the shares acquired by FEMSA and the FEMSA shares exchanged was recorded as additional paid-in capital. The direct out-of-pocket costs identified with the purchase of noncontrolling interest were included in other expenses.
In accordance with U.S. GAAP, the acquisition of noncontrolling interest must be accounted for under the purchase method, using the market value of shares received by FEMSA in the exchange offer to determine the cost of the acquisition of such noncontrolling interest and the related goodwill. Under U.S. GAAP, the direct out-of-pocket costs identified with the purchase of noncontrolling interest are treated as additional goodwill.
Additionally, accounting standards related to goodwill, require the allocation of all goodwill to the related reporting units to the operating segment or component that will generate the related cash flows. As of December 31, 2010, the remaining allocation of the goodwill generated by the previously mentioned acquisition of noncontrolling interest was as follows:
| ||||
| ||||
As of February 1, 2010 the goodwill allocated to Coca Cola FEMSA amounted to Ps. 4,753 and was re-evaluated as part of the control acquisition of Coca-Cola FEMSA.
As of April 30, 2010, the goodwill allocated to FEMSA Cerveza amounted to Ps. 10,600 and was cancelled due to the transaction described above, as part of the disposition of FEMSA Cerveza net assets.
During 2009, Coca-Cola FEMSA established a joint venture with The Coca-Cola Company for the production and sale of Crystal brand water in Brazil. Coca-Cola FEMSA has recorded a gain for U.S. GAAP purposes of Ps. 120 related to the deconsolidation of its net assets related to the Crystal operations. Approximately, Ps. 120 of previously recorded unearned revenues related to crystal operations remain recorded for Mexican FRS purposes, and are being amortized into income along with the results from the joint venture over the following three years for Mexican FRS purposes.
In 2008, the Company adopted NIF B-2 “Statement of Cash Flows” which is similar to cash flows standards for U.S. GAAP except for different presentation of interest costs, and certain other supplemental disclosures.
Consolidated Balance Sheets | 2010 | 2009 | ||||||
ASSETS | ||||||||
Current Assets: | ||||||||
Cash and cash equivalents | Ps. | 26,703 | Ps. | 7,896 | ||||
Marketable securities | 66 | — | ||||||
Accounts receivable | 7,702 | 6,688 | ||||||
Inventories | 11,350 | 9,416 | ||||||
Recoverable taxes | 4,243 | 1,755 | ||||||
Other current assets | 1,635 | 1,987 | ||||||
Total current assets | 51,699 | 27,742 | ||||||
Coca-Cola FEMSA | — | 35,730 | ||||||
Heineken | 63,413 | — | ||||||
Other investments | 2,315 | 175 | ||||||
Property, plant and equipment | 42,595 | 36,386 | ||||||
Deferred income tax and deferred employee profit sharing | 541 | 2,116 | ||||||
Intangible assets | 163,170 | 37,547 | ||||||
Bottles and cases | 2,280 | 2,248 | ||||||
Other assets | 8,504 | 16,056 | ||||||
TOTAL ASSETS | Ps. | 334,517 | Ps. | 158,000 | ||||
LIABILITIES AND STOCKHOLDERS’ EQUITY | ||||||||
Current Liabilities: | ||||||||
Bank loans | Ps. | 1,578 | Ps. | 1,400 | ||||
Interest payable | 165 | 109 | ||||||
Current maturities of long-term debt | 1,725 | 2,026 | ||||||
Suppliers | 17,458 | 11,257 | ||||||
Deferred income tax and employee profit sharing | 113 | 77 | ||||||
Taxes payable | 2,180 | 2,961 | ||||||
Accounts payable, accrued expenses and other liabilities | 7,410 | 5,709 | ||||||
Total current liabilities | 30,629 | 23,539 | ||||||
Long-Term Liabilities: | ||||||||
Bank loans and notes payable | 21,927 | 24,119 | ||||||
Deferred taxes liability | 31,539 | 738 | ||||||
Labor liabilities | 2,691 | 3,979 | ||||||
Other liabilities | 5,595 | 6,183 | ||||||
Total long-term liabilities | 61,752 | 35,019 | ||||||
Total liabilities | 92,381 | 58,558 | ||||||
Equity: | ||||||||
Controlling interest | 163,641 | 98,168 | ||||||
Noncontrolling interest | 78,495 | 1,274 | ||||||
Total equity: | 242,136 | 99,442 | ||||||
TOTAL LIABILITIES AND STOCKHOLDERS’ EQUITY | Ps. | 334,517 | Ps. | 158,000 | ||||
Consolidated Statements of Income and Comprehensive Income Net sales Other operating revenues Total revenues Cost of sales Gross profit Operating expenses: Administrative Selling Restructuring Market value (gain) loss of derivative financial instruments Income from operations Comprehensive financing result: Interest expense Interest income Foreign exchange loss, net Gain on monetary position, net Market value gain (loss) on ineffective portion of derivative financial instruments Other income , net Income before taxes Taxes Income before participation in affiliated companies Participation in affiliated companies: Coca-Cola FEMSA Other associates companies Consolidated net income Less: Net income attributable to the noncontrolling interest Net income attributable to controlling interest Consolidated net income Other comprehensive income Consolidated comprehensive income Less: Comprehensive income attributable to the noncontrolling interest Consolidated comprehensive income attributable to the controlling interest Net controlling interest income per share: Per Series “B” Per Series “D 2010 2009 2008 Ps. 175,257 Ps. 102,039 Ps. 90,941 1,796 863 709 177,053 102,902 91,650 102,665 59,841 53,419 74,388 43,061 38,231 9,420 7,769 6,046 43,302 26,451 24,237 446 180 67 (15 ) — — 53,153 34,400 30,350 21,235 8,661 7,881 (3,966 ) (3,013 ) (2,561 ) 1,121 310 181 (332 ) (26 ) (217 ) 219 (1 ) (1 ) 202 73 (24 ) (2,756 ) (2,657 ) (2,622 ) 68,337 52 241 86,816 6,056 5,500 15,014 (127 ) 1,787 71,802 6,183 3,713 183 4,516 2,994 219 (14 ) (108 ) 402 4,502 2,886 Ps. 72,204 Ps. 10,685 Ps. 6,599 (4,759 ) (783 ) 253 Ps. 67,445 Ps. 9,902 Ps. 6,852 Ps. 72,204 Ps. 10,685 Ps. 6,599 (1,702 ) 4,335 (2,241 ) 70,502 15,020 4,358 (4,867 ) (776 ) 193 Ps. 65,635 14,244 4,551 Ps. 3.36 Ps. 0.49 Ps. 0.34 4.20 0.62 0.43
Consolidated Cash Flows Cash flows from operating activities: Net income Adjustments to reconcile net income to net cash provided by (used in) operating activities: Inflation effect Depreciation Amortization Equity method Deferred taxes Other non-cash charges Profit regarding Coca-Cola FEMSA (see Note 27 A) Income from the exchange of FEMSA Cerveza (see Note 27 B) Changes in operating assets and liabilities net of business acquisitions: Working capital investment Dividends received from Coca-Cola FEMSA (Recoverable) payable taxes, net Interest payable Labor obligations Derivative financial instruments Net cash flows provided by operating activities Cash flows from investing activities: Acquisitions by FEMSA Cerveza, net of cash acquired Sale of property, plant and equipment Acquisition of property, plant and equipment Purchase of marketable securities in investing activities Proceeds from marketable securities Other assets Bottles and cases Recovery of long-term financial receivables with FEMSA Cerveza Net effect of FEMSA Cerveza exchange Cash incorporated from Coca-Cola FEMSA Other disposals Net cash flows used in investing activities Cash flows from financing activities: Bank loans obtained Bank loans paid Dividends declared and paid Restricted cash activity for the year Other financing activities Net cash flows provided (used in) by financing activities Effect of exchange rate changes on cash and cash equivalents Cash and cash equivalents: Net increase Initial cash Ending balance Supplemental cash flow information: Interest paid Income taxes and tax on assets paid 2010 2009 2008 Ps. 72,204 Ps. 10,685 Ps. 6,599 (215 ) (1 ) (1 ) 4,884 2,786 2,439 1,620 2,487 2,469 (402 ) (4,502 ) (2,886 ) 10,447 (3,185 ) (1,819 ) 673 5,353 2,779 (39,847 ) — — (27,132 ) (5,609 ) (1,640 ) (914 ) — 722 508 (1,946 ) 673 (354 ) (851 ) (370 ) (276 ) (741 ) (512 ) (453 ) (281 ) (428 ) (1,208 ) 12,804 12,068 6,883 — — (27 ) 643 422 48 (8,210 ) (3,709 ) (5,612 ) (66 ) 1,108 (2,111 ) (3,660 ) (3,432 ) (985 ) (70 ) (260 ) 12, 209 — — (158 ) 5,950 1,949 — — 10,329 (7,017 ) (9,283 ) 12,381 16,775 18,465 (12,569 ) (14,541 ) (14,662 ) (3,813 ) (1,620 ) (1,620 ) (181 ) (88 ) (134 ) (194 ) (4 ) 257 (4,376 ) 522 2,306 50 (596 ) 99 18,807 4,977 5 7,896 2,919 2,914 Ps. 26,703 Ps. 7,896 Ps. 2,919 Ps. (2,868) Ps. (2,586) Ps. (2,268) (6,171 ) (3,737) (2,849)
The effect of exchange rate changes on cash balances held in foreign currencies was Ps. 50 as a gain as of December 31, 2010, a loss of Ps. 596 and a gain of Ps. 99 as of December 31, 2009 and 2008, respectively.
Consolidated Statements of Changes in Stockholders’ Equity Stockholders’ equity at the beginning of the year Dividends declared and paid Noncontrolling interest variation Acquisition of Coca-Cola FEMSA Other transactions of noncontrolling interest Other comprehensive income (loss): Derivative financial instruments Labor liabilities Cumulative translation adjustment Reversal of inflation effect Recycling of OCI due to exchange Beer Business Other comprehensive (loss) gain controlling inerest Net income Stockholders’ equity at the end of the year 2010 2009 Ps. 99,442 Ps. 86,042 (3,813 ) (1,620 ) (891 ) (7 ) 77,277 — (273 ) — 1,036 993 (302 ) 285 (3,130 ) 3,810 1,111 (746 ) (525 ) (1,810 ) 4,342 72,204 10,685 Ps. 242,136 Ps. 99,442
Note 28. Reconciliation of Mexican FRS to U.S. GAAP.
| 2010 | 2009 | 2008 | ||||||||||
Net consolidated income under Mexican FRS | Ps. 45,290 | Ps. 15,082 | Ps. 9,278 | |||||||||
Noncontrolling interest under Mexican FRS of Coca-Cola FEMSA | (222 | ) | (4,390 | ) | (2,819 | ) | ||||||
U.S. GAAP adjustments: | ||||||||||||
Reversal of inflation effect (Note 27 C) | (24 | ) | — | — | ||||||||
Participation in Coca-Cola FEMSA (Note 27 A) | (39 | ) | (63 | ) | (14 | ) | ||||||
Coca-Cola FEMSA acquisition depreciation and amortization (Note 27 A) | (961 | ) | — | |||||||||
Heineken equity method (Note 27 B) | (2,789 | ) | — | |||||||||
Net effect on exchange of FEMSA Cerveza (Note 27 B) | (9,881 | ) | — | |||||||||
Start-up expenses (Note 27 E) | — | — | (16 | ) | ||||||||
Restatement of imported equipment (Note 27 H) | (165 | ) | (12 | ) | (14 | ) | ||||||
Capitalization of interest expense (Note 27 I) | 57 | (49 | ) | (49 | ) | |||||||
Deferred income taxes (Note 27 K) | 769 | (9 | ) | (65 | ) | |||||||
Deferred employee profit sharing (Note 27 K) | 257 | 80 | 211 | |||||||||
Gain on control acquisition of Coca-Cola FEMSA (Note 27 A) | 39,847 | — | — | |||||||||
Gain on de-consolidation of Crystal operation (Note 27 O) | (44 | ) | — | — | ||||||||
Deferred promotional expenses (Note 27 F) | 58 | — | — | |||||||||
Employee benefits (Note 27 L) | 51 | 46 | 87 | |||||||||
Total U.S. GAAP adjustments | 27,136 | (7 | ) | 140 | ||||||||
Net income under U.S. GAAP | Ps. 72,204 | Ps. 10,685 | Ps. 6,599 | |||||||||
| 2010 | 2009 | |||||||
Total stockholders’ equity under Mexican FRS | Ps. | 153,013 | Ps. | 115,829 | ||||
Noncontrolling interest under Mexican FRS of Coca-Cola FEMSA | — | (32,918 | ) | |||||
U.S. GAAP adjustments: | ||||||||
Control acquisition of Coca-Cola FEMSA (Note 27 A) | 90,980 | — | ||||||
Coca-Cola FEMSA acquisition depreciation and amortization | (961 | ) | — | |||||
Gain on acquisition of Brisa intangible assets (Note 27 G) | 72 | — | ||||||
Gain on deconsolidation of Crystal operation (Note 27 O) | 75 | — | ||||||
Deferred promotional expenses (Note 27 F) | (46 | ) | — | |||||
Reversal of inflation effect (Note 27 C) | (443 | ) | — | |||||
Participation in Coca-Cola FEMSA (Note 27 A) | (39 | ) | (1,328 | ) | ||||
Heineken equity method (Note 27 B) | (3,065 | ) | — | |||||
Intangible assets and goodwill (Note 27 G) | 100 | 54 | ||||||
Restatement of imported equipment (Note 27 H) | 351 | 134 | ||||||
Capitalization of interest expense (Note 27 I) | 200 | 215 | ||||||
Deferred income taxes (Note 27 K) | 523 | 483 | ||||||
Deferred employee profit sharing (Note 27 K) | 181 | (134 | ) | |||||
Employee benefits (Note 27 L) | (808 | ) | (1,713 | ) | ||||
Acquisition of Coca-Cola FEMSA noncontrolling interest (Note 27 N) | — | 1,609 | ||||||
Acquisitions by FEMSA Cerveza (Note 27 N) | — | 66 | ||||||
FEMSA’s noncontrolling interest acquisition (Note 27 N) | 2,003 | 17,145 | ||||||
Total U.S. GAAP adjustments | 89,123 | 16,531 | ||||||
Stockholders’ equity under U.S. GAAP | Ps. | 242,136 | Ps. | 99,442 | ||||
| 2010 | 2009 | 2008 | ||||||||||
Consolidated comprehensive income under Mexican FRS | Ps. | 42,589 | Ps. | 21,355 | Ps. | 9,085 | ||||||
Comprehensive income of the noncontrolling interest under Mexican FRS | (4,190 | ) | (6,734 | ) | (3,515 | ) | ||||||
Comprehensive income of the controlling interest under Mexican FRS | 38,399 | 14,621 | 5,570 | |||||||||
U.S. GAAP adjustments: | ||||||||||||
Net income (Note 28 A) | 27,192 | (7 | ) | 144 | ||||||||
Cumulative translation adjustment | 36 | 91 | (18 | ) | ||||||||
Reversal of inflation effect | 1,111 | (746 | ) | (839 | ) | |||||||
Heineken equity method | (276 | ) | — | — | ||||||||
Recycling of OCI due to exchange Beer Business | (525 | ) | — | — | ||||||||
Additional labor liability in excess of unamortized transition obligation | (302 | ) | 285 | (306 | ) | |||||||
Comprehensive income under U.S. GAAP | Ps. | 65,635 | Ps. | 14,244 | Ps. | 4,551 | ||||||
Note 29. Future Impact of Recently Issued Accounting Standards Not Yet in Effect.
TheComisión Nacional Bancaria y de Valores(Mexican National Banking and Securities Commission, or CNBV) announced that commencing in 2012; all Mexican public companies must report their financial information in accordance with IFRS as issued by the Accounting Standards Board (“IASB). Since 2006, theConsejo Mexicano para la Investigación y Desarrollo de Normas de Información Financiera(Mexican Board of Research and Development of Financial Reporting Standards) has been modifying Mexican FRS in order to ensure their convergence with IFRS.
FEMSA will adopt IFRS in 2012. The consolidated financial statements of the Company as of December 31, 2012 and 2011 (comparative period required by IFRS) will be presented according to IFRS as issued by the IASB. As stated by the SEC, foreign private issuers are not required to reconcile to U.S. GAAP if IFRS are fully adopted.
As of the date of issuance of these consolidated financial statements and their accompanying notes, the Company is determining its opening consolidated statement of financial position for IFRS and assessing all the possible impacts in its consolidated financial statements. As part of the transition process to IFRS, the Company is reviewing its accounting policies in order to comply with international standards by the transition date (January 1, 2011).
The following accounting standards have been issued under Mexican FRS, the application of which is required as indicated. Except as otherwise noted, FEMSA will adopt these standards when they become effective. The Company is in the process of assessing the effect of adopting the new standards, but the Company does not anticipate any significant impact except as may be described below.
NIF B-5 “Financial Information by Segment”
NIF B-5 establishes that an operating segment shall meet the following criteria: i) the segment engages in business activities from which it earns or is in the process of obtaining revenues, and incurs in the related costs and expenses; ii) the operating results are reviewed regularly by the main authority of the entity’s decision maker; and iii) specific financial information is available. NIF B-5 also requires disclosures related to operating segments subject to reporting, including details of earnings, assets and liabilities, reconciliations, information about products and services, and geographical areas. NIF B-5 is effective beginning on January 1, 2011, and this guidance shall be applied retrospectively for comparative purposes.
NIF B-9 “Interim Financial Reporting”
NIF B-9 prescribes the content to be included in a complete or condensed set of financial statements for an interim period. In accordance with this standard, the complete set of financial statements shall include: a) a statement of financial position as of the end of the period, b) an income statement for the period, c) a statement of changes in equity for the period, d) a statement of cash flows for the period, and e) notes providing the relevant accounting policies and other explanatory notes. Condensed financial statements shall include: a) condensed statement of financial position, b) condensed income statement, c) condensed statement of changes in equity, d) condensed statement of cash flows, and e) selected explanatory notes. NIF B-9 is effective beginning on January 1, 2011. Interim financial statements shall be presented in comparative form.
NIF C-4, “Inventories”:
In November 2010, the CINIF issued Mexican FRS C-4, which will be effective for fiscal years beginning on or after January 1, 2011 and will replace Mexican accounting Bulletin C-4, Inventories. Any accounting changes resulting from the adoption of this standard related to changes in the formula for assigning inventory costs are to be recognized retrospectively. Changes in valuation methods must be recognized prospectively.
The principal difference between Mexican accounting Bulletin C-4 and Mexican FRS C-4 is that the new standard does not allow using direct costs as the inventory valuation method nor does it allow using the LIFO cost method as the formulas (formerly method) for the assignment of unit cost to the inventories. Mexican FRS C-4 establishes that inventories must be valued at the lower of either acquisition cost or net realizable value. Such standard also establishes that advances to suppliers for the acquisition of merchandise must be classified as inventories provided the risks and benefits are transferred to the Company. Mexican FRS C-4 also establishes the standards for service supplier inventory valuations.
NIF C-5, “Prepaid Expenses”:
In November 2010, the CINIF issued Mexican FRS C-5, which will be effective for fiscal years beginning on or after January 1, 2011. Mexican FRS C-5 will replace Mexican accounting Bulletin B-5. Any accounting changes resulting from the adoption of this standard shall be recognized retrospectively.
This standard establishes that the main characteristic of prepaid expenses is that they do not result in the transfer to the entity of the benefits and risks inherent to the goods or services to be received. Consequently, prepaid expenses must be recognized in the balance sheet as either current or non-current assets, depending on the item classification in the statement of financial position. Moreover, Mexican FRS C-5 establishes that prepaid expenses made for goods or services whose inherent benefits and risks have already been transferred to the entity must be carried to the appropriate caption.
NIF C-6, “Property, Plant and Equipment”:
Mexican FRS C-6 was issued by the CINIF in December 2010 to replace Mexican accounting Bulletin C-6, Property, Machinery and Equipment, and will be effective for fiscal years beginning on or after January 1, 2011, except for the changes related to the segregation of property, plant and equipment into separate components for those assets with different useful lives. For entities that have not performed this component segregation, the provisions of this new standard will be effective as of January 1, 2012.
Unlike Mexican accounting Bulletin C-6, this standard includes within its scope the tax treatment for assets acquired to develop or maintain biological assets and assets related to the mining industry. Among other points, it establishes that for acquisitions of free-of-charge assets, the cost of the assets must be null, thus eliminating the option of performing appraisals. In the case of asset exchanges, Mexican FRS C-6 requires entities to determine the commercial substance of the transaction and the depreciation of these assets must be applied against the components of the assets, and the amount to be depreciated is the cost of acquisition less the asset’s residual value. Prepaid expenses for the acquisition of assets are to be recognized as a component of the asset as of the time the benefits and risks inherent to such assets are transferred. In the case of retirement of assets, income is recognized when the requirements for income recognition outlined under the standard have been met. There are specific disclosures for public entities.
NIF C-18 “Obligations Related to Retirement of Property, Plant and Equipment”:
In December 2010, the CINIF issued Mexican FRS C-18, which came into force for fiscal years beginning on or after January 1, 2011.
This standard establishes the accounting treatment for the initial and subsequent recognition of a liability for provision for legal obligations or assumed related to the retirement of property, plant and equipment recognized as a result of the acquisition, construction, development and/or normal operating of such components.
This standard also establishes that an entity must initially recognize a provision for obligations related to retirement of property, plant and equipment based on its best estimate of the disbursements required to settle the present obligation at the time it is assumed, provided a reliable estimate can be made of the amount of the obligation. The best estimate of a provision for an obligation associated with the retirement of property, plant and equipment components should be determined using the expected present value method.
There are no significant accounting standards that have been issued that are effective in 2011, impacting the Company.
Note 30. Subsequent Events.
On February 23, 2011,27, 2013, the Company’s Board of Directors agreed to propose an ordinary dividend of Ps. 4,6006,684 million which represents an increase of 77% compared to the dividend paid during 2010. This dividend was approved in the Annual Shareholders meeting on March 25, 2011.
On February 18, 2011, Coca-Cola FEMSA’s Board of Directors agreed to propose an ordinary dividend of Ps. 4,358 and represents an increase of 67.4%7.8% as compared to the dividend was paid on April, 2010.in 2012. This dividend was approved inat the Annual Shareholders meeting on March 23, 2011.15, 2013.
On March 17, 2011,In February 2013, the Venezuelan government announced a consortiumdevaluation of investors formed by FEMSA,its official exchange rates from 4.30 to 6.30 bolivars per U.S. dollar. The exchange rate used to translate the Macquarie Mexican Infrastructure Fund and other investors, acquired EnergíCompany’s financial statements to its reporting currency beginning February 2013 pursuant to the applicable accounting rules was 6.30 bolivars per U.S. dollar. As a Alterna Istmeñresult of this devaluation, the balance sheet of Coca-Cola FEMSA’s Venezuelan subsidiary reflected a S. de R.L. de C.V.,reduction in equity of approximately Ps. 3,500 which we refer to as EAI, and Energía Eólica Mareña, S.A. de C.V., which we refer to as EEM, from subsidiaries of Preneal, S.A., which we refer to as Preneal,was accounted for a transaction enterprise value of Ps. 1,063.5. FEMSA owns a 45% interest inat the consortium. EAI and EEM are the owners of a 396 megawatt late-stage wind energy project in the south-eastern regiontime of the State of Oaxaca. Certain subsidiaries of FEMSA, FEMSA Comercio anddevaluation in February 2013.
Effective January 25, 2013, Coca-Cola FEMSA have entered into a 20-year wind power supply agreements with EAI and EEM to purchase energy output produced by such companies. The project is currentlyfinalized the acquisition of 51% of Coca-Cola Bottlers Phillipines, Inc. (CCBPI) for an amount of $688.5 in its long-term financing stage.
On March 28, 2011,an all-cash transaction. As part of the agreement, Coca-Cola FEMSA together withhas an option to acquire the remaining
49% of CCBPI at any time during the seven years following the closing and has a put option to sell its ownership to The Coca-Cola Company acquired Grupo Estrella Azul (also known as Grupo Industrias Lacteas), a Panamanian company engaged for more than 50 yearsany time during year six. The results of CCBPI will be recognized by Coca-Cola FEMSA using the equity method, given certain substantive participating rights of The Coca-Cola Company in the diary and juice-based beverage categories.operations of the bottler.
On January 17, 2013, Coca-Cola FEMSA acquired 50% interestand Grupo Yoli, S. A. de C. V. (“Grupo Yoli”) agreed to merge their beverage divisions. Grupo Yoli beverage division operates mainly in the state of Guerrero, as well as in part of the state of Oaxaca, Mexico. The merger agreement was approved by both Coca-Cola FEMSA’s and Grupo Estrella and will continue to develop this business jointly with thw Coca-Cola Company. Beginning in April 2011, bothYoli’s Boards of Directors as well as by The Coca-Cola Company and is subject to the approval of the Comisión Federal de Competencia the Mexican antitrust authority. The transaction will involve the issuance of approximately 42.4 million of Coca-Cola FEMSA’s newly issued series L shares, and in addition Coca-Cola FEMSA commencedwill assume Ps. 1,009 in net debt. This transaction is expected to be completed during the gradual integrationfirst semester of Grupo Estrella into2013.
In November 2012, through FEMSA Comercio, the existing beverage platform they share forCompany agreed to acquire a 75% stake in Farmacias YZA, a leading drugstore operator in Southeast Mexico, with the developmentcurrent shareholders staying as partners with the remaining 25%. Farmacias YZA, headquartered in Merida, Yucatan, operated 333 stores as of non-carbonated products in Panama.
On April 18, Coca-Cola FEMSA successfully issued two tranchesthe date of Certificados Bursátiles – a five-year bondthe agreement. The transaction is pending customary regulatory approvals and is expected to close in the aggregate amountsecond quarter of Ps. 2,500 million at a yield of 28-day TIIE plus 13 basis points and a 10-year bond in the aggregate amount of Ps. 2,500 million at a fixed rate of 8.27%. A portion of the proceeds from this placement will be used to pay Coca-Cola FEMSA’s KOF-07 Certificado Bursátil at maturity in March 2012, in the amount of Ps. 3,000 million. The remainder of the proceeds will be used for general corporate purposes, including capital expenditures and working capital.
On May 5, 2011, the Company received dividends of Ps. 1,008 regarding its 20% economic interest in Heineken.2013.
Report of Independent Registered Public Accounting Firm
To: theThe Executive and Supervisory Board of Heineken N.V.
We have audited the accompanying consolidated statementstatements of financial position of Heineken N.V. and subsidiaries as of December 31, 20102012 and 2011, and the related consolidated income statements, consolidated statements of income, comprehensive income, cash flows, and changes in equity for each of the year then ended.years in the two-year period ended December 31, 2012. These consolidated financial statements have been prepared in accordance with International Financial Reporting Standards as issued by the International Accounting Standards Board and are the responsibility of the Company’s management. Our responsibility is to express an opinion on these consolidated financial statements based on our audit.audits.
We conducted our auditaudits in accordance with the auditing standards of the Public Company Accounting Oversight Board (United States). Those standards require that we plan and perform the audit to obtain reasonable assurance about whether the consolidated financial statements are free of material misstatement. The Company is not required to have, nor were we engaged to perform, an audit of its internal control over financial reporting. Our audit included consideration of internal control over financial reporting as a basis for designing audit procedures that are appropriate in the circumstances, but not for the purpose of expressing an opinion on the effectiveness of the Company’s internal control over financial reporting. Accordingly, we express no such opinion. An audit also includes examining, on a test basis, evidence supporting the amounts and disclosures in the financial statements,statements. An audit also includes assessing the accounting principles used and significant estimates made by management, as well as evaluating the overall financial statement presentation. We believe that our audit providesaudits provide a reasonable basis for our opinion.
In our opinion, the consolidated financial statements referred to above present fairly, in all material respects, the financial position of Heineken N.V. and subsidiaries as of December 31, 20102012 and 2011, and the results of itstheir operations and itstheir cash flows for each of the year thenyears in the two-year period ended December 31, 2012, in conformity with International Financial Reporting Standards as issued by the International Accounting Standards Board.
/s/ KPMG ACCOUNTANTSAccountants N.V.
Amstelveen,Amsterdam, the Netherlands
February 15, 201112, 2013
Heineken N.V. Financial statements
Income Statement
For the year ended 31 December 2010
In millions of EUR | Note | 2010 | 2009 | |||||||||
Revenue | 5 | 16,133 | 14,701 | |||||||||
Other income | 8 | 239 | 41 | |||||||||
Raw materials, consumables and services | 9 | (10,291 | ) | (9,650 | ) | |||||||
Personnel expenses | 10 | (2,680 | ) | (2,379 | ) | |||||||
Amortisation, depreciation and impairments | 11 | (1,118 | ) | (1,083 | ) | |||||||
Total expenses | (14,089 | ) | (13,112 | ) | ||||||||
Results from operating activities | 2,283 | 1,630 | ||||||||||
Interest income | 12 | 100 | 90 | |||||||||
Interest expenses | 12 | (590 | ) | (633 | ) | |||||||
Other net finance expenses | 12 | (19 | ) | 214 | ||||||||
Net finance expenses | (509 | ) | (329 | ) | ||||||||
Share of profit of associates and joint ventures and impairments thereof (net of income tax) | 16 | 193 | 127 | |||||||||
Profit before income tax | 1,967 | 1,428 | ||||||||||
Income tax expenses | 13 | (399 | ) | (286 | ) | |||||||
Profit | 1,568 | 1,142 | ||||||||||
Attributable to: | ||||||||||||
Equity holders of the Company (net profit) | 1,436 | 1,018 | ||||||||||
Non-controlling interests | 132 | 124 | ||||||||||
Profit | 1,568 | 1,142 | ||||||||||
Weighted average number of shares – basic | 23 | 562,234,726 | 488,666,607 | |||||||||
Weighted average number of shares – diluted | 23 | 563,387,135 | 489,974,594 | |||||||||
Basic earnings per share (EUR) | 23 | 2.55 | 2.08 | |||||||||
Diluted earnings per share (EUR) | 23 | 2.55 | 2.08 | |||||||||
Financial statements
| Note | 2012 | 2011 | ||||||||||
| For the year ended 31 December | ||||||||||||
In millions of EUR | ||||||||||||
Revenue | 5 | 18,383 | 17,123 | |||||||||
Other income | 8 | 1,510 | 64 | |||||||||
Raw materials, consumables and services | 9 | (11,849 | ) | (10,966 | ) | |||||||
Personnel expenses | 10 | (3,037 | ) | (2,838 | ) | |||||||
Amortisation, depreciation and impairments | 11 | (1,316 | ) | (1,168 | ) | |||||||
Total expenses | (16,202 | ) | (14,972 | ) | ||||||||
Results from operating activities | 3,691 | 2,215 | ||||||||||
Interest income | 12 | 62 | 70 | |||||||||
Interest expenses | 12 | (551 | ) | (494 | ) | |||||||
Other net finance income/(expenses) | 12 | 219 | (6 | ) | ||||||||
Net finance expenses | (270 | ) | (430 | ) | ||||||||
Share of profit of associates and joint ventures and impairments thereof (net of income tax) | 16 | 213 | 240 | |||||||||
Profit before income tax | 3,634 | 2,025 | ||||||||||
Income tax expense | 13 | (525 | ) | (465 | ) | |||||||
Profit | 3,109 | 1,560 | ||||||||||
Attributable to: | ||||||||||||
Equity holders of the Company (net profit) | 2,949 | 1,430 | ||||||||||
Non-controlling interests | 160 | 130 | ||||||||||
Profit | 3,109 | 1,560 | ||||||||||
|
|
|
| |||||||||
Weighted average number of shares – basic | 23 | 575,022,338 | 585,100,381 | |||||||||
Weighted average number of shares – diluted | 23 | 576,002,613 | 586,277,702 | |||||||||
Basic earnings per share (EUR) | 23 | 5.13 | 2.44 | |||||||||
Diluted earnings per share (EUR) | 23 | 5.12 | 2.44 | |||||||||
Consolidated Statement of Comprehensive Income
For the year ended 31 December 2010
| Note | 2012 | 2011 | ||||||||||
| For the year ended 31 December | ||||||||||||
In millions of EUR | ||||||||||||
Profit | 3,109 | 1,560 | ||||||||||
Other comprehensive income: | ||||||||||||
Foreign currency translation differences for foreign operations | 24 | 45 | (493 | ) | ||||||||
Effective portion of change in fair value of cash flow hedges | 24 | 14 | (21 | ) | ||||||||
Effective portion of cash flow hedges transferred to profit or loss | 24 | 41 | (11 | ) | ||||||||
Ineffective portion of cash flow hedges (transferred to profit or loss) | 24 | — | — | |||||||||
Net change in fair value available-for-sale investments | 24 | 135 | 71 | |||||||||
Net change in fair value available-for-sale investments transferred to profit or loss | 24 | (148 | ) | (1 | ) | |||||||
Actuarial gains and losses | 24/28 | (439 | ) | (93 | ) | |||||||
Share of other comprehensive income of associates/joint ventures | 24 | (1 | ) | (5 | ) | |||||||
Other comprehensive income, net of tax | 24 | (353 | ) | (553 | ) | |||||||
Total comprehensive income | 2,756 | 1,007 | ||||||||||
|
|
|
| |||||||||
Attributable to: | ||||||||||||
Equity holders of the Company | 2,608 | 884 | ||||||||||
Non-controlling interests | 148 | 123 | ||||||||||
Total comprehensive income | 2,756 | 1,007 | ||||||||||
|
|
|
| |||||||||
In millions of EUR | Note | 2010 | 2009 | |||||||||
Profit | 1,568 | 1,142 | ||||||||||
Other comprehensive income: | ||||||||||||
Foreign currency translation differences for foreign operations | 24 | 400 | 112 | |||||||||
Effective portion of change in fair value of cash flow hedges | 24 | 43 | (90 | ) | ||||||||
Effective portion of cash flow hedges transferred to profit or loss | 24 | 45 | 88 | |||||||||
Ineffective portion of cash flow hedges | 24 | 9 | — | |||||||||
Net change in fair value available-for-sale investments | 24 | 11 | 26 | |||||||||
Net change in fair value available-for-sale investments transferred to profit or loss | 24 | (17 | ) | (12 | ) | |||||||
Share of other comprehensive income of associates/joint ventures | 24 | (29 | ) | 22 | ||||||||
Other comprehensive income, net of tax | 24 | 462 | 146 | |||||||||
Total comprehensive income | 2,030 | 1,288 | ||||||||||
Attributable to: | ||||||||||||
Equity holders of the Company | 1,883 | 1,172 | ||||||||||
Non-controlling interests | 147 | 116 | ||||||||||
Total comprehensive income | 2,030 | 1,288 | ||||||||||
Financial statements
of Financial Position
As at 31 December 2010
| Note | 2012 | 2011 | ||||||||||
| As at 31 December | ||||||||||||
In millions of EUR | ||||||||||||
Assets | ||||||||||||
Property, plant & equipment | 14 | 8,792 | 7,860 | |||||||||
Intangible assets | 15 | 17,725 | 10,835 | |||||||||
Investments in associates and joint ventures | 16 | 1,950 | 1,764 | |||||||||
Other investments and receivables | 17 | 1,099 | 1,129 | |||||||||
Advances to customers | 32 | 312 | 357 | |||||||||
Deferred tax assets | 18 | 564 | 474 | |||||||||
Total non-current assets | 30,442 | 22,419 | ||||||||||
Inventories | 19 | 1,596 | 1,352 | |||||||||
Other investments | 17 | 11 | 14 | |||||||||
Trade and other receivables | 20 | 2,537 | 2,260 | |||||||||
Prepayments and accrued income | 232 | 170 | ||||||||||
Cash and cash equivalents | 21 | 1,037 | 813 | |||||||||
Assets classified as held for sale | 7 | 124 | 99 | |||||||||
Total current assets | 5,537 | 4,708 | ||||||||||
Total assets | 35,979 | 27,127 | ||||||||||
|
|
|
| |||||||||
Equity | ||||||||||||
Share capital | 922 | 922 | ||||||||||
Share premium | 2,701 | 2,701 | ||||||||||
Reserves | 365 | 498 | ||||||||||
Allotted Share Delivery Instrument | — | — | ||||||||||
Retained earnings | 7,703 | 5,653 | ||||||||||
Equity attributable to equity holders of the Company | 11,691 | 9,774 | ||||||||||
Non-controlling interests | 6/22 | 1,071 | 318 | |||||||||
Total equity | 22 | 12,762 | 10,092 | |||||||||
Liabilities | ||||||||||||
Loans and borrowings | 25 | 11,437 | 8,199 | |||||||||
Tax liabilities | 140 | 160 | ||||||||||
Employee benefits | 28 | 1,632 | 1,174 | |||||||||
Provisions | 30 | 418 | 449 | |||||||||
Deferred tax liabilities | 18 | 1,790 | 894 | |||||||||
Total non-current liabilities | 15,417 | 10,876 | ||||||||||
Bank overdrafts | 21 | 191 | 207 | |||||||||
Loans and borrowings | 25 | 1,863 | 981 | |||||||||
Trade and other payables | 31 | 5,273 | 4,624 | |||||||||
Tax liabilities | 305 | 207 | ||||||||||
Provisions | 30 | 129 | 140 | |||||||||
Liabilities classified as held for sale | 7 | 39 | — | |||||||||
Total current liabilities | 7,800 | 6,159 | ||||||||||
Total liabilities | 23,217 | 17,035 | ||||||||||
Total equity and liabilities | 35,979 | 27,127 | ||||||||||
|
|
|
| |||||||||
In millions of EUR | Note | 2010 | 2009 | |||||||||
Assets | ||||||||||||
Property, plant & equipment | 14 | 7,687 | 6,017 | |||||||||
Intangible assets | 15 | 10,890 | 7,135 | |||||||||
Investments in associates and joint ventures | 1,673 | 1,427 | ||||||||||
Other investments and receivables | 17 | 1,103 | 568 | |||||||||
Advances to customers | 32 | 449 | 319 | |||||||||
Deferred tax assets | 18 | 429 | 561 | |||||||||
Total non-current assets | 22,231 | 16,027 | ||||||||||
Inventories | 19 | 1,206 | 1,010 | |||||||||
Other investments | 17 | 17 | 15 | |||||||||
Trade and other receivables | 20 | 2,273 | 2,310 | |||||||||
Prepayments and accrued income | 206 | 189 | ||||||||||
Cash and cash equivalents | 21 | 610 | 520 | |||||||||
Assets classified as held for sale | 7 | 6 | 109 | |||||||||
Total current assets | 4,318 | 4,153 | ||||||||||
Total assets | 26,549 | 20,180 | ||||||||||
Equity | ||||||||||||
Share capital | 922 | 784 | ||||||||||
Share premium | 2,701 | — | ||||||||||
Reserves | 814 | 159 | ||||||||||
ASDI | 666 | — | ||||||||||
Retained earnings | 5,125 | 4,408 | ||||||||||
Equity attributable to equity holders of the Company | 10,228 | 5,351 | ||||||||||
Non-controlling interests | 289 | 296 | ||||||||||
Total equity | 10,517 | 5,647 | ||||||||||
Liabilities | ||||||||||||
Loans and borrowings | 25 | 8,078 | 7,401 | |||||||||
Tax liabilities | 178 | — | ||||||||||
Employee benefits | 28 | 687 | 634 | |||||||||
Provisions | 30 | 475 | 356 | |||||||||
Deferred tax liabilities | 18 | 991 | 786 | |||||||||
Total non-current liabilities | 10,409 | 9,177 | ||||||||||
Bank overdrafts | 21 | 132 | 156 | |||||||||
Loans and borrowings | 25 | 862 | 1,145 | |||||||||
Trade and other payables | 31 | 4,265 | 3,696 | |||||||||
Tax liabilities | 241 | 132 | ||||||||||
Provisions | 30 | 123 | 162 | |||||||||
Liabilities classified as held for sale | 7 | — | 65 | |||||||||
Total current liabilities | 5,623 | 5,356 | ||||||||||
Total liabilities | 16,032 | 14,533 | ||||||||||
Total equity and liabilities | 26,549 | 20,180 | ||||||||||
Financial statements
of Cash Flows
For the year ended 31 December 2010
| Note | 2012 | 2011 | ||||||||||
| For the year ended 31 December | ||||||||||||
In millions of EUR | ||||||||||||
Operating activities | ||||||||||||
Profit | 3,109 | 1,560 | ||||||||||
Adjustments for: | ||||||||||||
Amortisation, depreciation and impairments | 11 | 1,316 | 1,168 | |||||||||
Net interest expenses | 12 | 489 | 424 | |||||||||
Gain on sale of property, plant & equipment, intangible assets and subsidiaries, joint ventures and associates | 8 | (1,510 | ) | (64 | ) | |||||||
Investment income and share of profit and impairments of associates and joint ventures and dividend income on AFS and HFT investments | (238 | ) | (252 | ) | ||||||||
Income tax expenses | 13 | 525 | 465 | |||||||||
Other non-cash items | (110 | ) | 244 | |||||||||
Cash flow from operations before changes in working capital and provisions | 3,581 | 3,545 | ||||||||||
Change in inventories | (52 | ) | (145 | ) | ||||||||
Change in trade and other receivables | (64 | ) | (21 | ) | ||||||||
Change in trade and other payables | 217 | 417 | ||||||||||
Total change in working capital | 101 | 251 | ||||||||||
Change in provisions and employee benefits | (164 | ) | (76 | ) | ||||||||
Cash flow from operations | 3,518 | 3,720 | ||||||||||
Interest paid | (490 | ) | (485 | ) | ||||||||
Interest received | 82 | 65 | ||||||||||
Dividends received | 184 | 137 | ||||||||||
Income taxes paid | (599 | ) | (526 | ) | ||||||||
Cash flow related to interest, dividend and income tax | (823 | ) | (809 | ) | ||||||||
Cash flow from operating activities | 2,695 | 2,911 | ||||||||||
|
|
|
| |||||||||
Investing activities | ||||||||||||
Proceeds from sale of property, plant & equipment and intangible assets | 131 | 101 | ||||||||||
Purchase of property, plant & equipment | 14 | (1,170 | ) | (800 | ) | |||||||
Purchase of intangible assets | 15 | (78 | ) | (56 | ) | |||||||
Loans issued to customers and other investments | (143 | ) | (127 | ) | ||||||||
Repayment on loans to customers | 50 | 64 | ||||||||||
Cash flow (used in)/from operational investing activities | (1,210 | ) | (818 | ) | ||||||||
Free operating cash flow | 1,485 | 2,093 | ||||||||||
Acquisition of subsidiaries, net of cash acquired | 6 | (3,311 | ) | (806 | ) | |||||||
Acquisition/additions of associates, joint ventures and other investments | 6 | (1,246 | ) | (166 | ) | |||||||
Disposal of subsidiaries, net of cash disposed of | — | (9 | ) | |||||||||
Disposal of associates, joint ventures and other investments | 142 | 44 | ||||||||||
Cash flow (used in)/from acquisitions and disposals | (4,415 | ) | (937 | ) | ||||||||
Cash flow (used in)/from investing activities | (5,625 | ) | (1,755 | ) | ||||||||
|
|
|
| |||||||||
In millions of EUR | Note | 2010 | 2009 | |||||||||
Operating activities | ||||||||||||
Profit | 1,568 | 1,142 | ||||||||||
Adjustments for: | ||||||||||||
Amortisation, depreciation and impairments | 11 | 1,118 | 1,083 | |||||||||
Net interest expenses | 12 | 490 | 543 | |||||||||
Gain on sale of property, plant & equipment, intangible assets and subsidiaries, joint ventures and associates | 8 | (239 | ) | (41 | ) | |||||||
Investment income and share of profit and impairments of associates and joint ventures | (200 | ) | (138 | ) | ||||||||
Income tax expenses | 13 | 399 | 286 | |||||||||
Other non-cash items | 163 | 1 | ||||||||||
Cash flow from operations before changes in working capital and provisions | 3,299 | 2,876 | ||||||||||
Change in inventories | 95 | 202 | ||||||||||
Change in trade and other receivables | 515 | 337 | ||||||||||
Change in trade and other payables | (156 | ) | (319 | ) | ||||||||
Total change in working capital | 454 | 220 | ||||||||||
Change in provisions and employee benefits | (205 | ) | (67 | ) | ||||||||
Cash flow from operations | 3,548 | 3,029 | ||||||||||
Interest paid | (554 | ) | (467 | ) | ||||||||
Interest received | 15 | — | ||||||||||
Dividend received | 91 | 62 | ||||||||||
Income taxes paid | (443 | ) | (245 | ) | ||||||||
Cash flow related to interest, dividend and income tax | (891 | ) | (650 | ) | ||||||||
Cash flow from operating activities | 2,657 | 2,379 | ||||||||||
Investing activities | ||||||||||||
Proceeds from sale of property, plant & equipment and intangible assets | 113 | 180 | ||||||||||
Purchase of property, plant & equipment | 14 | (648 | ) | (678 | ) | |||||||
Purchase of intangible assets | 15 | (56 | ) | (99 | ) | |||||||
Loans issued to customers and other investments | (145 | ) | (117 | ) | ||||||||
Repayment on loans to customers | 72 | 76 | ||||||||||
Cash flow (used in)/from operational investing activities | (664 | ) | (638 | ) | ||||||||
Free operating cash flow | 1,993 | 1,741 | ||||||||||
Acquisition of subsidiaries, net of cash acquired* | 6 | 17 | (84 | ) | ||||||||
Acquisition of associates, joint ventures and other investments | (77 | ) | (116 | ) | ||||||||
Disposal of subsidiaries and non-controlling interests, net of cash disposed of | 6 | 270 | 17 | |||||||||
Disposal of associates, joint ventures and other investments | 47 | 34 | ||||||||||
Cash flow (used in)/from acquisitions and disposals | 257 | (149 | ) | |||||||||
Cash flow (used in)/from investing activities | (407 | ) | (787 | ) | ||||||||
Financial statements
| Note | 2012 | 2011 | ||||||||||
| For the year ended 31 December 2012 | ||||||||||||
In millions of EUR | ||||||||||||
Financing activities | ||||||||||||
Proceeds from loans and borrowings | 6,837 | 1,782 | ||||||||||
Repayment of loans and borrowings | (2,928 | ) | (1,587 | ) | ||||||||
Dividends paid | (604 | ) | (580 | ) | ||||||||
Purchase own shares | — | (687 | ) | |||||||||
Acquisition of non-controlling interests | (252 | ) | (11 | ) | ||||||||
Disposal of interests without a change in control | — | 43 | ||||||||||
Other | 3 | 6 | ||||||||||
Cash flow (used in)/from financing activities | 3,056 | (1,034 | ) | |||||||||
|
|
|
| |||||||||
Net cash flow | 126 | 122 | ||||||||||
Cash and cash equivalents as at 1 January | 606 | 478 | ||||||||||
Effect of movements in exchange rates | 114 | 6 | ||||||||||
Cash and cash equivalents as at 31 December | 21 | 846 | 606 | |||||||||
|
|
|
| |||||||||
For the year ended 31 December 2010
In millions of EUR | Note | 2010 | 2009 | |||||||||
Financing activities | ||||||||||||
Proceeds from loans and borrowings | 1,920 | 2,052 | ||||||||||
Repayment of loans and borrowings | (3,127 | ) | (3,411 | ) | ||||||||
Dividends paid | (483 | ) | (392 | ) | ||||||||
Purchase own shares and shares issued | (381 | ) | (13 | ) | ||||||||
Acquisition of non-controlling interests | (92 | ) | — | |||||||||
Other | (9 | ) | (73 | ) | ||||||||
Cash flow (used in)/from financing activities | (2,172 | ) | (1,837 | ) | ||||||||
Net Cash Flow | 78 | (245 | ) | |||||||||
Cash and cash equivalents as at 1 January | 364 | 604 | ||||||||||
Effect of movements in exchange rates | 36 | 5 | ||||||||||
Cash and cash equivalents as at 31 December | 21 | 478 | 364 | |||||||||
Financial statements
of Changes in Equity
In millions of EUR | Note | Share capital | Share Premium | Translation reserve | Hedging reserve | Fair value reserve | Other legal reserves | Reserve for own shares | ASDI | Retained earnings | Equity attributable to equity holders of the Company | Non- controlling interests | Total equity | Note | Share capital | Share Premium | Translation reserve | Hedging reserve | Fair value reserve | Other legal reserves | Reserve for own shares | ASDI | Retained earnings | Equity attributable to equity holders of the Company | Non- controlling interests | Total equity | ||||||||||||||||||||||||||||||||||||||||||||||||||||||||||||||||||||||||||||||
Balance as at 1 January 2009 | 784 | — | (595 | ) | (122 | ) | 88 | 595 | (40 | ) | — | 3,761 | 4,471 | 281 | 4,752 | |||||||||||||||||||||||||||||||||||||||||||||||||||||||||||||||||||||||||||||||||||||||||
Other comprehensive income | 24 | — | — | 144 | (2 | ) | 12 | 6 | — | — | (6 | ) | 154 | (8 | ) | 146 | ||||||||||||||||||||||||||||||||||||||||||||||||||||||||||||||||||||||||||||||||||||||||
Profit | — | — | — | — | — | 150 | — | — | 868 | 1,018 | 124 | 1,142 | ||||||||||||||||||||||||||||||||||||||||||||||||||||||||||||||||||||||||||||||||||||||||||||
Total comprehensive income | — | — | 144 | (2 | ) | 12 | 156 | — | — | 862 | 1,172 | 116 | 1,288 | |||||||||||||||||||||||||||||||||||||||||||||||||||||||||||||||||||||||||||||||||||||||||||
Transfer to retained earnings | — | — | — | — | — | (75 | ) | — | — | 75 | — | — | — | |||||||||||||||||||||||||||||||||||||||||||||||||||||||||||||||||||||||||||||||||||||||||||
Dividends to shareholders | — | — | — | — | — | — | — | — | (289 | ) | (289 | ) | (96 | ) | (385 | ) | ||||||||||||||||||||||||||||||||||||||||||||||||||||||||||||||||||||||||||||||||||||||||
Purchase/reissuance own/non-controlling shares | — | — | — | — | — | — | (2 | ) | — | (11 | ) | (13 | ) | (2 | ) | (15 | ) | |||||||||||||||||||||||||||||||||||||||||||||||||||||||||||||||||||||||||||||||||||||||
Share-based payments | — | — | — | — | — | — | — | — | 10 | 10 | — | 10 | ||||||||||||||||||||||||||||||||||||||||||||||||||||||||||||||||||||||||||||||||||||||||||||
Changes in consolidations | — | — | — | — | — | — | — | — | — | — | (3 | ) | (3 | ) | ||||||||||||||||||||||||||||||||||||||||||||||||||||||||||||||||||||||||||||||||||||||||||
Balance as at 31 December 2009 | 784 | — | (451 | ) | (124 | ) | 100 | 676 | (42 | ) | — | 4,408 | 5,351 | 296 | 5,647 | |||||||||||||||||||||||||||||||||||||||||||||||||||||||||||||||||||||||||||||||||||||||||
Balance as at 1 January 2010 | 784 | — | (451 | ) | (124 | ) | 100 | 676 | (42 | ) | — | 4,408 | 5,351 | 296 | 5,647 | |||||||||||||||||||||||||||||||||||||||||||||||||||||||||||||||||||||||||||||||||||||||||
Balance as at 1 January 2011 | 922 | 2,701 | (93 | ) | (27 | ) | 90 | 899 | (55 | ) | 666 | 4,829 | 9,932 | 288 | 10,220 | |||||||||||||||||||||||||||||||||||||||||||||||||||||||||||||||||||||||||||||||||||||||||
Other comprehensive income | 24 | — | — | 358 | 97 | (10 | ) | 75 | — | — | (73 | ) | 447 | 15 | 462 | 12/24 | — | — | (482 | ) | (42 | ) | 69 | — | — | — | (91 | ) | (546 | ) | (7 | ) | (553 | ) | ||||||||||||||||||||||||||||||||||||||||||||||||||||||||||||||||||||||
Profit | — | — | — | — | — | 241 | — | — | 1,195 | 1,436 | 132 | 1,568 | — | — | — | — | — | 253 | — | — | 1,177 | 1,430 | 130 | 1,560 | ||||||||||||||||||||||||||||||||||||||||||||||||||||||||||||||||||||||||||||||||
Total comprehensive income | — | — | 358 | 97 | (10 | ) | 316 | — | — | 1,122 | 1,883 | 147 | 2,030 | — | — | (482 | ) | (42 | ) | 69 | 253 | — | — | 1,086 | 884 | 123 | 1,007 | |||||||||||||||||||||||||||||||||||||||||||||||||||||||||||||||||||||||||||||
Transfer to retained earnings | — | — | — | — | — | (93 | ) | — | — | 93 | — | — | — | — | — | — | — | — | (126 | ) | — | — | 126 | — | — | — | ||||||||||||||||||||||||||||||||||||||||||||||||||||||||||||||||||||||||||||||
Dividends to shareholders | — | — | — | — | — | — | — | — | (351 | ) | (351 | ) | (138 | ) | (489 | ) | — | — | — | — | — | — | — | — | (474 | ) | (474 | ) | (97 | ) | (571 | ) | ||||||||||||||||||||||||||||||||||||||||||||||||||||||||||||||||||||||||
Share issued | 138 | 2,701 | — | — | — | — | — | 1,026 | — | 3,865 | — | 3,865 | ||||||||||||||||||||||||||||||||||||||||||||||||||||||||||||||||||||||||||||||||||||||||||||
Purchase/reissuance own/non-controlling shares | — | — | — | — | — | — | (381 | ) | — | — | (381 | ) | — | (381 | ) | — | — | — | — | — | — | (687 | ) | — | — | (687 | ) | (1 | ) | (688 | ) | |||||||||||||||||||||||||||||||||||||||||||||||||||||||||||||||||||||||||
Allotted Share Delivery Instrument | — | — | — | — | — | — | 362 | (360 | ) | (2 | ) | — | — | — | — | — | — | — | — | — | 694 | (666 | ) | (28 | ) | — | — | — | ||||||||||||||||||||||||||||||||||||||||||||||||||||||||||||||||||||||||||||
Own shares granted | — | — | — | — | — | — | 6 | — | (6 | ) | — | — | — | |||||||||||||||||||||||||||||||||||||||||||||||||||||||||||||||||||||||||||||||||||||||||||
Own shares delivered | — | — | — | — | — | — | 5 | — | (5 | ) | — | — | — | |||||||||||||||||||||||||||||||||||||||||||||||||||||||||||||||||||||||||||||||||||||||||||
Share-based payments | — | — | — | — | — | — | — | — | 15 | 15 | — | 15 | — | — | — | — | — | — | — | — | 11 | 11 | — | 11 | ||||||||||||||||||||||||||||||||||||||||||||||||||||||||||||||||||||||||||||||||
Share purchase mandate | — | — | — | — | — | — | — | — | (96 | ) | (96 | ) | — | (96 | ) | — | — | — | — | — | — | — | — | 96 | 96 | — | 96 | |||||||||||||||||||||||||||||||||||||||||||||||||||||||||||||||||||||||||||||
Acquisition of non-controlling interests without a change in control | — | — | — | — | — | — | — | — | (58 | ) | (58 | ) | (34 | ) | (92 | ) | — | — | — | — | — | — | — | — | (21 | ) | (21 | ) | (1 | ) | (22 | ) | ||||||||||||||||||||||||||||||||||||||||||||||||||||||||||||||||||||||||
Acquisition of non-controlling interests with a change in control | — | — | — | — | — | — | — | — | — | — | 20 | 20 | ||||||||||||||||||||||||||||||||||||||||||||||||||||||||||||||||||||||||||||||||||||||||||||
Changes in consolidation | — | — | — | — | — | — | — | — | — | — | (2 | ) | (2 | ) | ||||||||||||||||||||||||||||||||||||||||||||||||||||||||||||||||||||||||||||||||||||||||||
Disposal of interests without a change in control | — | — | — | — | — | — | — | — | 33 | 33 | 6 | 39 | ||||||||||||||||||||||||||||||||||||||||||||||||||||||||||||||||||||||||||||||||||||||||||||
Balance as at 31 December 2011 | 922 | 2,701 | (575 | ) | (69 | ) | 159 | 1,026 | (43 | ) | — | 5,653 | 9,774 | 318 | 10,092 | |||||||||||||||||||||||||||||||||||||||||||||||||||||||||||||||||||||||||||||||||||||||||
|
|
|
|
|
|
|
|
|
|
|
| |||||||||||||||||||||||||||||||||||||||||||||||||||||||||||||||||||||||||||||||||||||||||||||
Balance as at 31 December 2010 | 922 | 2,701 | (93 | ) | (27 | ) | 90 | 899 | (55 | ) | 666 | 5,125 | 10,228 | 289 | 10,517 | |||||||||||||||||||||||||||||||||||||||||||||||||||||||||||||||||||||||||||||||||||||||||
In millions of EUR Balance as at 1 January 2012 Other comprehensive income Profit Total comprehensive income Transfer to retained earnings Dividends to shareholders Purchase/reissuance own/non-controlling shares Own shares delivered Share-based payments Share purchase mandate Acquisition of non-controlling interests without a change in control Disposal of interests without a change in control Balance as at 31 December 2012 Note Share
capital Share
Premium Translation
reserve Hedging
reserve Fair
value
reserve Other
legal
reserves Reserve
for own
shares Retained
earnings Equity
attributable
to equity
holders of the
Company Non-
controlling
interests Total
equity 922 2,701 (575 ) (69 ) 159 1,026 (43 ) 5,653 9,774 318 10,092 12/24 — — 48 58 (9 ) 4 — (442 ) (341 ) (12 ) (353 ) — — — — — 222 — 2,727 2,949 160 3,109 — — 48 58 (9 ) 226 — 2,285 2,608 148 2,756 — — — — — (473 ) — 473 — — — — — — — — — — (494 ) (494 ) (110 ) (604 ) — — — — — — — — — — — — — — — — — 17 (17 ) — — — — — — — — — — 15 15 — 15 — — — — — — — — — — — — — — — — — — (212 ) (212 ) 715 503 — — — — — — — — — — — 922 2,701 (527 ) (11 ) 150 779 (26 ) 7,703 11,691 1,071 12,762
Financial statements | Notes to the consolidated financial statementscontinued
Financial Statements
1. Reporting entity
Heineken N.V. (the ‘Company’) is a company domiciled in the Netherlands. The address of the Company’s registered office is Tweede Weteringplantsoen 21, Amsterdam. The consolidated financial statements of the Company as at and for the year ended 31 December 20102012 comprise the Company, its subsidiaries (together referred to as ‘Heineken’‘HEINEKEN’ or the ‘Group’ and individually as ‘Heineken’‘HEINEKEN’ entities) and Heineken’sHEINEKEN’s interest in jointly controlled entities and associates.
A summary of the main subsidiaries, jointly controlled entities and associates is included in note 36 and 16 respectively. The APIPL/APB acquisition has been included in the consolidated financial statements from 15 November 2012.
HeinekenHEINEKEN is primarily involved in the brewing and selling of beer.
2. Basis of preparation
| (a) | Statement of compliance |
The consolidated financial statements have been prepared in accordance with International Financial Reporting Standards (IFRS) as endorsed by the EU and also comply with the financial reporting requirements included in Part 9 of Book 2 of the Dutch Civil Code. All standards and interpretations issued by the International Accounting Standards Board (IASB) and the International Financial Reporting Interpretations Committee (IFRIC) effective year-end 20102012 have been adopted by the EU, except that the EU carved out certain hedge accounting provisions of IAS 39. The Company does not utilise this carve-out permitted by the EU, as it is not applicable. Consequently, the accounting policies applied by the Company also comply fully with IFRS as issued by the IASB.
The consolidated financial statements have been prepared by the Executive Board of the Company and authorised for issue on 1512 February 20112013 and will be submitted for adoption to the Annual General Meeting of Shareholders on 2125 April 2011.2013.
| (b) | Basis of measurement |
The consolidated financial statements have been prepared on the historical cost basis except for the following assets and liabilities that are measured at fair value:unless otherwise indicated.
Available-for-sale investments
Derivative financial instruments
Liabilities for equity-settled share-based payment arrangements
Long-term interest-bearing liabilities on which fair value hedge accounting is applied.
The methods used to measure fair values are discussed further in note 3 and 4.
| (c) | Functional and presentation currency |
These consolidated financial statements are presented in euro, which is the Company’s functional currency. All financial information presented in euroEuro has been rounded to the nearest million unless stated otherwise.
| (d) | Use of estimates and judgements |
The preparation of consolidated financial statements in conformity with IFRSs requires management to make judgements, estimates and assumptions that affect the application of accounting policies and the reported amounts of assets and liabilities, income and expenses. Actual results may differ from these estimates.
Estimates and underlying assumptions are reviewed on an ongoing basis. Revisions to accounting estimates are recognised in the period in which the estimates are revised and in any future periods affected.
Financial statements | Notes to the consolidated financial statementscontinued
2. Basis of preparation continued
In particular, information about assumptions and estimation uncertainties and critical judgements in applying accounting policies that have the most significant effect on the amounts recognised in the consolidated financial statements are described in the following notes:
Note 6 Acquisitions and disposals of subsidiaries and non-controlling interests
Note 15 Intangible assets
Note 16 Investments in associates and joint ventures
Note 17 Other investments and receivables
Note 18 Deferred tax assets and liabilities
Note 28 Employee benefits
Note 29 Share-based payments – Long-Term Incentive PlanVariable award (LTV)
Note 30 Provisions
Note 32 Financial risk management and financial instruments
Note 34 Contingencies.
| (e) | Changes in accounting policies |
There were no changes made to the HEINEKEN accounting policies in 2012, the changes in standards and interpretations effective from 1 January 2012 had no significant impact on the company.
Accounting for business combinations3. Significant accounting policies
From 1 January 2010,General
The accounting policies set out below have been applied consistently to all periods presented in these consolidated financial statements and have been applied consistently by HEINEKEN entities.
| (a) | Basis of consolidation |
| (i) | Business combinations |
Business combinations are accounted for using the acquisition method as at the acquisition date, which is the date on which control is transferred to the Group. Control is the power to govern the financial and operating policies of an entity so as to obtain benefits from its activities. In assessing control, the Group has applied IFRS 3Business Combinations (2008) in accounting for business combinations. The change in accounting policy has been applied prospectively and has no impact on Earnings per Share.takes into consideration potential voting rights that currently are exercisable.
For acquisition on or after 1 January 2010, theThe Group measures goodwill at the acquisition date as the fair value of the consideration transferred plus the fair value of any previously-held equity interest in the acquiree and the recognised amount of any non-controlling interests in the acquiree, less the net recognised amount (generally fair value) of the identifiable assets acquired and liabilities assumed. When the excess is negative, a bargain purchase gain is recognised immediately in profit or loss.
The consideration transferred does not include amounts related to the settlement of pre-existing relationships. Such amounts are generally recognised in profit or loss.
Costs related to the acquisition, other than those associated with the issue of debt or equity securities, that the Group incurs in connection with a business combination are expensed as incurred.
Any contingent consideration payable is recognised at fair value at the acquisition date. If the contingent consideration is classified as equity, it is not remeasured and settlement is accounted for within equity. Otherwise, subsequent changes to the fair value of the contingent considerationconsiderations are recognised in profit or loss.
Accounting for acquisitions of non-controlling interests
| (ii) | Acquisitions of non-controlling interests |
From 1 January 2010 the Group has applied IAS 27Consolidated and Separate Financial Statements (2008) in accounting for acquisitions of non-controlling interests. The change in accounting policy has been applied prospectively and has no impact on Earnings per Share.
Under the new accounting policy, acquisitionsAcquisitions of non-controlling interests are accounted for as transactions with owners in their capacity as owners and therefore no goodwill is recognised as a result of such transactions. The adjustmentsresult. Adjustments to non-controlling interests arising from transactions that do not involve the loss of control are based on a proportionate amount of the net assets of the subsidiary.
Previously, goodwill was recognised on the acquisition of non-controlling interests in a subsidiary, which represented the excess of the cost of the additional investment over the carrying amount of the interest in the net assets acquired at the date of the transaction.
Other standards and interpretations
Other standards and interpretations effective from 1 January 2010 did not have a significant impact on the Company.
Financial statements | Notes to the consolidated financial statementscontinued
3. Significant accounting policies
General
The accounting policies set out below have been applied consistently to all periods presented in these consolidated financial statements and have been applied consistently by Heineken entities.
Business combinations are accounted for using the acquisition method as at the acquisition date, which is the date on which control is transferred to the Group. Control is the power to govern the financial and operating policies of an entity so as to obtain benefits from its activities. In assessing control, the Group takes into consideration potential voting rights that currently are exercisable.
Heineken has changed its accounting policy with respect to accounting for business combinations. See note 2(e) for further details.
| Subsidiaries |
Subsidiaries are entities controlled by Heineken.HEINEKEN. Control exists when HeinekenHEINEKEN has the power, directly or indirectly, to govern the financial and operating policies of an entity so as to obtain benefits from its activities. In assessing control, potential voting rights that currently are exercisable or convertible are taken into account. The financial statements of subsidiaries are included in the consolidated financial statements from the date that control commences until the date that control ceases. Accounting policies of subsidiaries have been changed where necessary to ensure consistency with the policies adopted by Heineken.HEINEKEN. Losses applicable to the non-controlling interests in a subsidiary are allocated to the non-controlling interests even if doing so causes the non-controlling interests to have a deficit balance.
| Special Purpose Entities (SPEs) |
An SPE is consolidated if, based on an evaluation of the substance of its relationship with HeinekenHEINEKEN and the SPE’sSPEs risks and rewards, HeinekenHEINEKEN concludes that it controls the SPE. SPEs controlled by HeinekenHEINEKEN were established under terms that impose strict limitations on the decision-making powers of the SPE’sSPEs management and that result in HeinekenHEINEKEN receiving the majority of the benefits related to the SPE’sSPEs operations and net assets, being exposed to the majority of risks incident to the SPE’sSPEs activities, and retaining the majority of the residual or ownership risks related to the SPESPEs or their assets.
Business combinations arising from transfers of interests in entities that are under the control of the shareholder that controls the Group are accounted for as if the acquisition had occurred at the beginning of the earliest comparative year presented or, if later, at the date that common control was established; for this purpose comparatives are restated. The assets and liabilities acquired are recognised at the carrying amounts recognised previously in the Group controlling shareholder’s consolidated financial statements. The components of equity of the acquired entities are added to the same components within Group equity and any gain/loss arising is recognised directly in equity.
| (v) | Loss of control |
Upon the loss of control, HeinekenHEINEKEN derecognises the assets and liabilities of the subsidiary, any non-controlling interests and the other components of equity related to the subsidiary. Any surplus or deficit arising on the loss of control is recognised in profit or loss. If HeinekenHEINEKEN retains any interest in the previous subsidiary, then such interest is measured at fair value at the date that control is lost. Subsequently it is accounted for as an equity-accounted investee or as an available-for-sale financial asset depending on the level of influence retained.
Financial statements | Notes to the consolidated financial statementscontinued
3. Significant accounting policies continued
| (vi) | Investments in associates and joint ventures |
Investments in associates are those entities in which HeinekenHEINEKEN has significant influence, but not control, over the financial and operating policies. Significant influence is presumed to exist when the Group holds between 20 and 50 per cent of the voting power of another entity. Joint ventures are those entities over whose activities HeinekenHEINEKEN has joint control, established by contractual agreement and requiring unanimous consent for strategic financial and operating decisions.
Investments in associates and joint ventures are accounted for using the equity method (equity-accounted investees) and are recognised initially at cost. The cost of the investment includes transaction costs.
The consolidated financial statements include Heineken’sHEINEKEN’s share of the profit or loss and other comprehensive income, after adjustments to align the accounting policies with those of Heineken,HEINEKEN, from the date that significant influence or joint control commences until the date that significant influence or joint control ceases.
When Heineken’sHEINEKEN’s share of losses exceeds the carrying amount of the associate, including any long-term investments, the carrying amount is reduced to nil and recognition of further losses is discontinued except to the extent that HeinekenHEINEKEN has an obligation or has made a payment on behalf of the associate or joint venture.
| (vii) | Transactions eliminated on consolidation |
Intra-HeinekenIntra-HEINEKEN balances and transactions, and any unrealised gains and losses or income and expenses arising from intra-Heinekenintra-HEINEKEN transactions, are eliminated in preparing the consolidated financial statements. Unrealised gains arising from transactions with equity-accounted associates and JVs are eliminated against the investment to the extent of the Heineken’sHEINEKEN’s interest in the investee. Unrealised losses are eliminated in the same way as unrealised gains, but only to the extent that there is no evidence of impairment.
| (b) | Foreign currency |
| (i) | Foreign currency transactions |
Transactions in foreign currencies are translated to the respective functional currencies of HeinekenHEINEKEN entities at the exchange rates at the dates of the transactions. Monetary assets and liabilities denominated in foreign currencies at the reporting date are retranslated to the functional currency at the exchange rate at that date. The foreign currency gain or loss arising on monetary items is the difference between amortised cost in the functional currency at the beginning of the period, adjusted for effective interest and payments during the period, and the amortised cost in foreign currency translated at the exchange rate at the end of the reporting period.
Non-monetary assets and liabilities denominated in foreign currencies that are measured at fair value are retranslated to the functional currency at the exchange rate at the date that the fair value was determined.
Non-monetary items in a foreign currency that are measured in terms of historical cost are translated using the exchange rate at the date of the transaction. Foreign currency differences arising on retranslation are recognised in profit or loss, except for differences arising on the retranslation of available-for-sale (equity) investments and foreign currency differences arising on the retranslation of a financial liability designated as a hedge of a net investment, which are recognised in other comprehensive income.
Non-monetary assets and liabilities denominated in foreign currencies that are measured at cost remain translated into the functional currency at historical exchange rates.
Financial statements | Notes to the consolidated financial statementscontinued
| (ii) | Foreign operations |
The assets and liabilities of foreign operations, including goodwill and fair value adjustments arising on acquisition, are translated to euro at exchange rates at the reporting date. The income and expenses of foreign operations, excluding foreign operations in hyperinflationary economies, are translated to euro at exchange rates approximating the exchange rates ruling at the dates of the transactions. Group entities, with a functional currency being the currency of a hyperinflationary
economy, first restate their financial statements in accordance with IAS 29, Financial Reporting in Hyperinflationary Economies (see ‘Reporting in hyperinflationary economies’ below). The related income, costs and balance sheet amounts are translated at the foreign exchange rate ruling at the balance sheet date.
Foreign currency differences are recognised in other comprehensive income and are presented within equity in the translation reserve. However, if the operation is a non-wholly-owned subsidiary, then the relevant proportionate share of the translation difference is allocated to the non-controlling interests. When a foreign operation is disposed of such that control, significant influence or joint control is lost, the cumulative amount in the translation reserve related to that foreign operation is reclassified to profit or loss as part of the gain or loss on disposal. When HeinekenHEINEKEN disposes of only part of its interest in a subsidiary that includes a foreign operation while retaining control, the relevant proportion of the cumulative amount is reattributed to non-controlling interests. When HeinekenHEINEKEN disposes of only part of its investment in an associate or joint venture that includes a foreign operation while retaining significant influence or joint control, the relevant proportion of the cumulative amount is reclassified to profit or loss.
Foreign exchange gains and losses arising from a monetary item receivable from or payable to a foreign operation, the settlement of which is neither planned nor likely in the foreseeable future, are considered to form part of a net investment in a foreign operation and are recognised in other comprehensive income, and are presented within equity in the translation reserve.
The following exchange rates, for the most important countries in which HeinekenHEINEKEN has operations, were used while preparing these consolidated financial statements:
| Year-end | Average | Year-end | Year-end | Average | Average | |||||||||||||||||||||||||||
In EUR | 2010 | 2009 | 2010 | 2009 | 2012 | 2011 | 2012 | 2011 | ||||||||||||||||||||||||
BRL | 0.3699 | 0.4139 | 0.3987 | 0.4298 | ||||||||||||||||||||||||||||
GBP | 1.1618 | 1.1260 | 1.1657 | 1.1224 | 1.2253 | 1.1972 | 1.2332 | 1.1522 | ||||||||||||||||||||||||
EGP | 0.1287 | 0.1273 | 0.1339 | 0.1292 | ||||||||||||||||||||||||||||
MXN | 0.0582 | 0.0554 | 0.0592 | 0.0578 | ||||||||||||||||||||||||||||
NGN | 0.0050 | 0.0047 | 0.0051 | 0.0048 | 0.0049 | 0.0049 | 0.0050 | 0.0047 | ||||||||||||||||||||||||
PLN | 0.2516 | 0.2436 | 0.2503 | 0.2311 | 0.2455 | 0.2243 | 0.2390 | 0.2427 | ||||||||||||||||||||||||
BRL | 0.4509 | 0.4001 | 0.4289 | 0.3610 | ||||||||||||||||||||||||||||
MXN | 0.0604 | 0.0533 | 0.0598 | 0.0532 | ||||||||||||||||||||||||||||
RUB | 0.0245 | 0.0232 | 0.0248 | 0.0227 | 0.0248 | 0.0239 | 0.0250 | 0.0245 | ||||||||||||||||||||||||
SGD | 0.6207 | 0.5946 | 0.6229 | 0.5718 | ||||||||||||||||||||||||||||
VND in 1,000 | 0.0364 | 0.0367 | 0.0373 | 0.0348 | ||||||||||||||||||||||||||||
USD | 0.7484 | 0.6942 | 0.7543 | 0.7170 | 0.7579 | 0.7729 | 0.7783 | 0.7184 | ||||||||||||||||||||||||
| (iii) | Reporting in hyperinflationary economies |
When the economy of a country in which we operate is deemed hyperinflationary and the functional currency of a Group entity is the currency of that hyperinflationary economy, the financial statements of such Group entities are adjusted so that they are stated in terms of the measuring unit current at the end of the reporting period. This involves restatement of income and expenses to reflect changes in the general price index from the start of the reporting period and, restatement of non-monetary items in the balance sheet, such as P, P & E to reflect current purchasing power as at the period end using a general price index from the date when they were first recognised. Comparative amounts are not adjusted. Any differences arising were recorded in equity on adoption.
| (iv) | Hedge of net investments in foreign operations |
Foreign currency differences arising on the retranslation of a financial liability designated as a hedge of a net investment in a foreign operation are recognised in other comprehensive income to the extent that the hedge is effective and regardless of whether the net investment is held directly or through an intermediate parent. These differences are presented within equity in the translation reserve. To the extent that the hedge is ineffective, such differences are recognised in profit or loss. When the hedged part of a net investment is disposed of, the relevant amount in the translation reserve is transferred to profit or loss as part of the profit or loss on disposal.
Financial statements | Notes to the consolidated financial statementscontinued
3. Significant accounting policies continued
(c) Non-derivative financial instruments
| (c) | Non-derivative financial instruments |
| (i) | General |
Non-derivative financial instruments comprise investments in equity and debt securities, trade and other receivables, cash and cash equivalents, loans and borrowings, and trade and other payables.
Non-derivative financial instruments are recognised initially at fair value plus, for instruments not at fair value through profit or loss, any directly attributable transaction costs. Subsequent to initial recognition non-derivative financial instruments are measured as described hereafter.
If HeinekenHEINEKEN has a legal right to offset financial assets with financial liabilities and if HeinekenHEINEKEN intends either to settle on a net basis or to realise the asset and settle the liability simultaneously then financial assets and liabilities are presented in the statement of financial position as a net amount.
Cash and cash equivalents comprise cash balances and call deposits. Bank overdrafts that are repayable on demand and form an integral part of Heineken’sHEINEKEN’s cash management and are included as a component of cash and cash equivalents for the purpose of the statement of cash flows.
Accounting policies for interest income, interest expenses and other net finance income and expenses are discussed in note 3r.
| (ii) |
If HeinekenHEINEKEN has the positive intent and ability to hold debt securities to maturity, they are classified as held-to-maturity. Debt securities are loans and long-term receivables and are measured at amortised cost using the effective interest method, less any impairment losses. Investments held-to-maturity are recognised or derecognised on the day they are transferred to or by Heineken.HEINEKEN.
| (iii) | Available-for-sale investments |
Heineken’sHEINEKEN’s investments in equity securities and certain debt securities are classified as available-for-sale. Subsequent to initial recognition, they are measured at fair value and changes therein – other than impairment losses (see note 3i(i)), and foreign currency differences on available-for-sale monetary items (see note 3b(i)) – are recognised in other comprehensive income and presented within equity in the fair value reserve. When these investments are derecognised, the relevant cumulative gain or loss in the fair value reserve is transferred to profit or loss.
Where these investments are interest-bearing, interest calculated using the effective interest method is recognised in the profit or loss. Available-for-sale investments are recognised or derecognised by HeinekenHEINEKEN on the date it commits to purchase or sell the investments.
| (iv) | Investments at fair value through profit or loss |
An investment is classified at fair value through profit or loss if it is classified as held for trading or is designated as such upon initial recognition. Investments are designated at fair value through profit or loss if HeinekenHEINEKEN manages such investments and makes purchase and sale decisions based on their fair value in accordance with Heineken’sHEINEKEN’s documented risk management or investment strategy. Upon initial recognition, attributable transaction costs are recognised in profit or loss as incurred.
Investments at fair value through profit or loss are measured at fair value, with changes therein recognised in profit or loss as part of the other net finance income/(expenses). Investments at fair value through profit and loss are recognised or derecognised by HeinekenHEINEKEN on the date it commits to purchase or sell the investments.
Financial statements | Notes to the consolidated financial statementscontinued
| (v) | Other |
Other non-derivative financial instruments are measured at amortised cost using the effective interest method, less any impairment losses. Included in non-derivative financial instruments are advances to customers. Subsequently, the advances are amortised over the term of the contract as a reduction of revenue.
| (d) | Derivative financial instruments (including hedge accounting) |
| (i) | General |
HeinekenHEINEKEN uses derivatives in the ordinary course of business in order to manage market risks. Generally HeinekenHEINEKEN seeks to apply hedge accounting in order to minimise the effects of foreign currency, interest rate or commodity price fluctuations in profit or loss.
Derivatives that can be used are interest rate swaps, forward rate agreements, caps and floors, commodity swaps, spot and forward exchange contracts and options. Transactions are entered into with a limited number of counterparties with strong credit ratings. Foreign currency, interest rate and commodity hedging operations are governed by internal policies and rules approved and monitored by the Executive Board.
Derivative financial instruments are recognised initially at fair value, with attributable transaction costs recognised in profit or loss as incurred. Derivatives for which hedge accounting is not applied are accounted for as instruments at fair value through profit or loss. When derivatives qualify for hedge accounting, subsequent measurement is at fair value, and changes therein accounted for as described 3b(iii)in 3b(iv), 3d(ii) and 3d(iii).
| (ii) | Cash flow hedges |
Changes in the fair value of the derivative hedging instrument designated as a cash flow hedge are recognised in other comprehensive income and presented in the hedging reserve within equity to the extent that the hedge is effective. To the extent that the hedge is ineffective, changes in fair value are recognised in profit or loss.
If the hedging instrument no longer meets the criteria for hedge accounting, expires or is sold, terminated or exercised, then hedge accounting is discontinued and the cumulative unrealised gain or loss previously recognised in other comprehensive income and presented in the hedging reserve in equity, is recognised in profit or loss immediately, or when a hedging instrument is terminated, but the hedged transaction still is expected to occur, the cumulative gain or loss at that point remains in other comprehensive income and is recognised in accordance with the above-mentioned policy when the transaction occurs. When the hedged item is a non-financial asset, the amount recognised in other comprehensive income is transferred to the carrying amount of the asset when it is recognised. In other cases the amount recognised in other comprehensive income is transferred to the same line of profit or loss in the same period that the hedged item affects profit or loss.
| (iii) | Fair value hedges |
Changes in the fair value of a derivative hedging instrument designated as a fair value hedge are recognised in profit or loss. The hedged item also is stated at fair value in respect of the risk being hedged; the gain or loss attributable to the hedged risk is recognised in profit or loss and adjusts the carrying amount of the hedged item.
If the hedge no longer meets the criteria for hedge accounting, the adjustment to the carrying amount of a hedged item for which the effective interest method is used is amortised to profit or loss over the period to maturity.
Financial statements | Notes to the consolidated financial statementscontinued
3. Significant accounting policies continued
| (iv) | Separable embedded derivatives |
Embedded derivatives are separated from the host contract and accounted for separately if the economic characteristics and risks of the host contract and the embedded derivative are not closely related, a separate instrument with the same terms as the embedded derivative would meet the definition of a derivative, and the combined instrument is not measured at fair value through profit or loss. Changes in the fair value of separable embedded derivatives are recognised immediately in profit or loss.
| (e) | Share capital |
| (i) | Ordinary shares |
Ordinary shares are classified as equity. Incremental costs directly attributable to the issue of ordinary shares are recognised as a deduction from equity, net of any tax effects.
| (ii) | Repurchase of share capital (treasury shares) |
When share capital recognised as equity is repurchased, the amount of the consideration paid, which includes directly attributable costs, is net of any tax effects recognised as a deduction from equity. Repurchased shares are classified as treasury shares and are presented in the reserve for own shares.
When treasury shares are sold or reissued subsequently, the amount received is recognised as an increase inequity, and the resulting surplus or deficit on the transaction is transferred to or from retained earnings.
| (iii) | Dividends |
Dividends are recognised as a liability in the period in which they are declared.
| (f) | Property, Plant and Equipment (P, P & E) |
| (i) | Owned assets |
Items of property, plant and equipmentP, P & E are measured at cost less government grants received (refer (q)), accumulated depreciation (refer (iv)) and accumulated impairment losses (3i(ii)).
Cost comprises the initial purchase price increased with expenditures that are directly attributable to the acquisition of the asset (like transports and non-recoverable taxes). The cost of self-constructed assets includes the cost of materials and direct labour and any other costs directly attributable to bringing the asset to a working condition for its intended use (like an appropriate proportion of production overheads), and the costs of dismantling and removing the items and restoring the site on which they are located. Borrowing costs related to the acquisition or construction of qualifying assets are capitalised as part of the cost of that asset. Cost also may include transfers from equity of any gain or loss on qualifying cash flow hedges of foreign currency purchases of property, plant and equipment.P, P & E.
Spare parts that are acquired as part of an equipment purchase and only to be used in connection with this specific equipment are initially capitalised and amortised as part of the equipment. For example, purchased software that is integral to the functionality of the related equipment is capitalised as part of that equipment.
In all other cases spare parts are carried as inventory and recognised in the income statement as consumed. Where an item of property, plant and equipmentP, P & E comprises major components having different useful lives, they are accounted for as separate items (major components) of property, plantP, P & E.
Returnable bottles and equipment.
Financial statements | Noteskegs in circulation are recorded within P, P & E and a corresponding liability is recorded in respect of the obligation to repay the customers’ deposits. Deposits paid by customers for returnable items are reflected in the consolidated statement of financial statementscontinuedposition within current liabilities.
| (ii) | Leased assets |
Leases in terms of which HeinekenHEINEKEN assumes substantially all the risks and rewards of ownership are classified as finance leases. Upon initial recognition P, P & E acquired by way of finance lease is measured at an amount equal to the lower of its fair value and the present value of the minimum lease payments at inception of the lease. Lease payments are apportioned between the outstanding liability and finance charges so as to achieve a constant periodic rate of interest on the remaining balance of the liability.
Other leases are operating leases and are not recognised in Heineken’sHEINEKEN’s statement of financial position. Payments made under operating leases are charged to profit or loss on a straight-line basis over the term of the lease. When an operating lease is terminated before the lease period has expired, any payment required to be made to the lessor by way of penalty is recognised as an expense in the period in which termination takes place.
| (iii) | Subsequent expenditure |
The cost of replacing a part of an item of property, plant and equipmentP, P & E is recognised in the carrying amount of the item or recognised as a separate asset, as appropriate, if it is probable that the future economic benefits embodied within the part will flow to HeinekenHEINEKEN and its cost can be measured reliably. The carrying amount of the replaced part is derecognised. The costs of the day-to-day servicing of property, plant and equipmentP, P & E are recognised in profit or loss when incurred.
| (iv) | Depreciation |
Depreciation is calculated over the depreciable amount, which is the cost of an asset, or other amount substituted for cost, less its residual value.
Land except for financial leases on land over the contractual period, is not depreciated as it is deemed to have an infinite life. Depreciation on other P, P & E is charged to profit or loss on a straight-line basis over the estimated useful lives of items of property, plant and equipment,P, P & E, and major components that are accounted for separately, since this most closely reflects the expected pattern of consumption of the future economic benefits embodied in the asset. Assets under construction are not depreciated. Leased assets are depreciated over the shorter of the lease term and their useful lives unless it is reasonable certain that HeinekenHEINEKEN will obtain ownership by the end of the lease term. The estimated useful lives for the current and comparative years are as follows:
• Buildings | 30 – 40 years | |||
• Plant and equipment | 10 – 30 years | |||
• Other fixed assets |
Where parts of an item of P, P & E have different useful lives, they are accounted for as separate items of P, P & E.
The depreciation methods, residual value as well as the useful lives are reassessed, and adjusted if appropriate, at each financial year-end.
| (v) | Gains and losses on sale |
Net gains on sale of items of P, P & E are presented in profit or loss as other income. Net losses on sale are included in depreciation. Net gains and losses are recognised in profit or loss when the significant risks and rewards of ownership have been transferred to the buyer, recovery of the consideration is probable, the associated costs can be estimated reliably, and there is no continuing management involvement with the P, P & E.
Financial statements | Notes to the consolidated financial statementscontinued
3. Significant accounting policies continued
| (g) | Intangible assets |
| (i) | Goodwill |
Goodwill arises on the acquisition of subsidiaries, associates and joint ventures and represents the excess of the cost of the acquisition over Heineken’sHEINEKEN’s interest in net fair value of the net identifiable assets, liabilities and contingent liabilities of the acquiree.
Goodwill on acquisitions of subsidiaries is included in ‘intangible assets’. Goodwill arising on the acquisition of associates and joint ventures is included in the carrying amount of the associate, respectively the joint ventures. In respect of acquisitions prior to 1 October 2003, goodwill is included on the basis of deemed cost, being the amount recorded under previous GAAP. Goodwill on acquisitions purchased before 1 January 2003 has been deducted from equity.
Goodwill arising on the acquisition of a non-controlling interest in a subsidiary represents the excess of the cost of the additional investment over the carrying amount of the interest in the net assets acquired at the date of exchange.
Goodwill is measured at cost less accumulated impairment losses (refer accounting policy 3j(ii)3i(ii)). Goodwill is allocated to individual or groups of cash-generating units (CGUs) for the purpose of impairment testing and is tested annually for impairment. Negative goodwill is recognised directly in profit or loss as other income.
| (ii) | Brands |
Brands acquired, separately or as part of a business combination, are capitalised if they meet the definition of an intangible asset and the recognition criteria are satisfied.
Brands acquired as part of a business combination are valued at fair value based on the royalty relief method. Brands acquired separately are measured at cost.
Strategic brands are well-known international/local brands with a strong market position and an established brand name. Strategic brands are amortised on an individual basis over the estimated useful life of the brand. Other brands are amortised on a portfolio basis per country.
| (iii) | Customer-related, |
Customer-related and contract-based intangibles are capitalised if they meet the definition of an intangible asset and the recognition criteria are satisfied. If the amounts are not material these are included in the brand valuation. The relationship between brands and customer-related intangibles is carefully considered so that brands and customer-related intangibles are not both recognised on the basis of the same cash flows.
Reacquired rights are identifiable intangible assets recognised in an acquisition that represent the right an acquirer previously has granted to the acquiree to use one or more of the acquirer’s recognised or unrecognised assets.
Customer-related and contract-based intangibles acquired as part of a business combination are valued at fair value. Customer-related and contract-based intangibles acquired separately are measured at cost.
Customer-related, and contract-based intangibles and reacquired rights are amortised over the period of the contractual arrangements or the remaining useful life of the customer relationships.
Financial statements | Notes torelationships or the consolidated financial statementscontinued
| (iv) | Software, research and development and other intangible assets |
Purchased software is measured at cost less accumulated amortisation (refer (vi)) and impairment losses (refer accounting policy 3i(ii)). Expenditure on internally developed software is capitalised when the expenditure qualifies as development activities, otherwise it is recognised in profit or loss when incurred.
Expenditure on research activities, undertaken with the prospect of gaining new technical knowledge and understanding, is recognised in profit or loss when incurred.
Development activities involve a plan or design for the production of new or substantially improved products, software and processes. Development expenditure is capitalised only if development costs can be measured reliably, the product or process is technically and commercially feasible, future economic benefits are probable, and HeinekenHEINEKEN intends to and has sufficient resources to complete development and to use or sell the asset. The expenditure capitalised includes the cost of materials, direct labour and overhead costs that are directly attributable to preparing the asset for its intended use, and capitalised borrowing costs. Other development expenditure is recognised in profit or loss when incurred.
Capitalised development expenditure is measured at cost less accumulated amortisation (refer (vi)) and accumulated impairment losses (refer accounting policy 3i(ii)).
Other intangible assets that are acquired by HeinekenHEINEKEN and have finite useful lives, are measured at cost less accumulated amortisation (refer (vi)) and impairment losses (refer accounting policy 3i(ii)). Expenditure on internally generated goodwill and brands is recognised in profit or loss when incurred.
| (v) | Subsequent expenditure |
Subsequent expenditure is capitalised only when it increases the future economic benefits embodied in the specific asset to which it relates. All other expenditure is expensed when incurred.
| (vi) | Amortisation |
Amortisation is calculated over the cost of the asset, or other amount substituted for cost, less its residual value. Intangible assets with a finite life are amortised on a straight-line basis over their estimated useful lives, other than goodwill, from the date they are available for use, since this most closely reflects the expected pattern of consumption of the future economic benefits embodied in the asset. The estimated useful lives are as follows:
| • Strategic brands | 40 – 50 years | ||||
| • Other brands | 15 – 25 years | ||||
| • Customer-related and contract-based intangibles | 5 – 20 years | ||||
| 3 – 12 years | |||||
• Software | 3 – 7 years | |||||
| • Capitalised development costs | 3 years |
Amortisation methods, useful lives and residual values are reviewed at each reporting date and adjusted if appropriate.
| (vii) | Gains and losses on sale |
Net gains on sale of intangible assets are presented in profit or loss as other income. Net losses on sale are included in amortisation. Net gains and losses are recognised in profit or loss when the significant risks and rewards of ownership have been transferred to the buyer, recovery of the consideration is probable, the associated costs can be estimated reliably, and there is no continuing management involvement with the intangible assets.
Financial statements | Notes to the consolidated financial statementscontinued
3. Significant accounting policies continued
| (h) | Inventories |
| (i) | General |
Inventories are measured at the lower of cost and net realisable value. The cost of inventories is based on the weighted average cost formula, and includes expenditure incurred in acquiring the inventories, production or conversion costs and other costs incurred in bringing them to their existing location and condition. Net realisable value is the estimated selling price in the ordinary course of business, less the estimated costs of completion and selling expenses.
| (ii) | Finished products and work in progress |
Finished products and work in progress are measured at manufacturing cost based on weighted averages and takes into account the production stage reached. Costs include an appropriate share of direct production overheads based on normal operating capacity.
| (iii) | Other inventories and spare parts |
The cost of other inventories is based on weighted averages. Spare parts are valued at the lower of cost and net realisable value. Value reductions and usage of parts are charged to profit or loss. Spare parts that are acquired as part of an equipment purchase and only to be used in connection with this specific equipment are initially capitalised and amortiseddepreciated as part of the equipment.
| (i) | Impairment |
| (i) | Financial assets |
A financial asset is assessed at each reporting date to determine whether there is any objective evidence that it is impaired. A financial asset is considered to be impaired if objective evidence indicates that one or more events have had a negative effect on the estimated future cash flows of that asset that can be estimated reliably.
Evidence of impairment may include indications that the debtors or a group of debtors are experiencing significant financial difficulty, default or delinquency in interest or principal payments, the probability that they will enter bankruptcy or other financial reorganisation, and where observable data indicate that there is a measurable decrease in the estimated future cash flows, such as changes in arrears or economic conditions that correlate with defaults.
An impairment loss in respect of a financial asset measured at amortised cost is calculated as the difference between its carrying amount, and the present value of the estimated future cash flows discounted at the original effective interest rate. An impairment loss in respect of an available-for-sale financial asset is calculated by reference to its current fair value.
Individually significant financial assets are tested for impairment on an individual basis. The remaining financial assets are assessed collectively in groups that share similar credit risk characteristics.
All impairment losses are recognised in profit or loss. Any cumulative loss in respect of an available-for-sale financial asset recognised previously in other comprehensive income and presented in the fair value reserve in equity is transferred to profit or loss.
An impairment loss is reversed if the reversal can be related objectively to an event occurring after the impairment loss was recognised. For financial assets measured at amortised cost and available-for-sale financial assets that are debt securities, the reversal is recognised in profit or loss. For available-for-sale financial assets that are equity securities, the reversal is recognised in other comprehensive income.
Financial statements | Notes to the consolidated financial statementscontinued
| (ii) | Non-financial assets |
The carrying amounts of Heineken’sHEINEKEN’s non-financial assets, other than inventories (refer accounting policy (h) and deferred tax assets (refer accounting policy (s))), are reviewed at each reporting date to determine whether there is any indication of impairment. If any such indication exists then the asset’s recoverable amount is estimated. For goodwill and intangible assets that are not yet available for use, the recoverable amount is estimated each year at the same time.
The recoverable amount of an asset or CGU is the higher of an asset’s fair value less costs to sell and value in use. In assessing value in use, the estimated future cash flows are discounted to their present value using a pre-tax discount rate that reflects current market assessments of the time value of money and the risks specific to the asset or CGU.
For the purpose of impairment testing, assets that cannot be tested individually are grouped together into the smallest group of assets that generates cash inflows from continuing use that are largely independent of the cash inflows of other assets or groups of assets (the ‘CGU’).
For the purpose of impairment testing, goodwill acquired in a business combination, is allocated to each of the acquirer’s CGUs, or groups of CGUs, that is expected to benefit from the synergies of the combination. Each unit or group of units to which the goodwill is allocated represents the lowest level within the entity at which the goodwill is monitored for internal management purposes. Goodwill is monitored on regional, sub regional or country level depending on the characteristics of the acquisition, the synergies to be achieved and the level of integration.
An impairment loss is recognised if the carrying amount of an asset or its CGU exceeds its recoverable amount. A CGU is the smallest identifiable asset group that generates cash flows that largely are independent from other assets and groups. Impairment losses are recognised in profit or loss. Impairment losses recognised in respect of CGU are allocated first to reduce the carrying amount of any goodwill allocated to the units and then to reduce the carrying amounts of the other assets in the unit (group of units) on a pro rata basis. An impairment loss in respect of goodwill is not reversed. In respect of other assets, impairment losses recognised in prior periods are assessed at each reporting date for any indications that the loss has decreased or no longer exists. An impairment loss is reversed if there has been a change in the estimates used to determine the recoverable amount. An impairment loss is reversed only to the extent that the asset’s carrying amount does not exceed the carrying amount that would have been determined, net of depreciation or amortisation, if no impairment loss had been recognised.
Goodwill that forms part of the carrying amount of an investment in an associate and joint venture is not recognised separately, and therefore is not tested for impairment separately. Instead, the entire amount of the investment in an associate and joint venture is tested for impairment as a single asset when there is objective evidence that the investment in an associate may be impaired.
| (j) | Non-current assets held for sale |
Non-current assets, or disposal groups comprising assets and liabilities, that are expected to be recovered primarily through sale rather than through continuing use, are classified as held for sale. Immediately before classification as held for sale, the assets, or components of a disposal group, are measured at the lower of their carrying amount and fair value less cost to sell. Any impairment loss on a disposal group is first allocated to goodwill, and then to remaining assets and liabilities on a pro rata basis, except that no loss is allocated to inventories, financial assets, deferred tax assets and employee defined benefit plan assets, which continue to be measured in accordance with Heineken’sHEINEKEN’s accounting policies. Impairment losses on initial classification as held for sale and subsequent gains or losses on remeasurement are recognised in profit or loss. Gains are not recognised in excess of any cumulative impairment loss.
Intangible assets and property, plant and equipmentP, P & E once classified as held for sale are not amortised or depreciated. In addition, equity accounting of equity-accounted investees ceases once classified as held for sale or distribution.
Financial statements | Notes to the consolidated financial statementscontinued
3. Significant accounting policies continued
| (k) | Employee benefits |
| (i) | Defined contribution plans |
A defined contribution plan is a post-employment benefit plan (pension plan) under which the Group pays fixed contributions into a separate entity. The Group has no legal or constructive obligations to pay further contributions if the fund does not hold sufficient assets to pay all employees the benefits relating to employee service in the current and prior periods.
Obligations for contributions to defined contribution pension plans are recognised as an employee benefit expense in profit or loss in the periods during which services are rendered by employees. Prepaid contributions are recognised as an asset to the extent that a cash refund or a reduction in future payments is available. Contributions to a defined contribution plan that are due more than 12 months after the end of the period in which the employee renders the service are discounted to their present value.
| (ii) | Defined benefit plans |
A defined benefit plan is a post-employment benefit plan (pension plan) that is not a defined contribution plan. Typically defined benefit plans define an amount of pension benefit that an employee will receive on retirement, usually dependent on one or more factors such as age, years of service and compensation.
Heineken’sHEINEKEN’s net obligation in respect of defined benefit pension plans is calculated separately for each plan by estimating the amount of future benefit that employees have earned in return for their service in the current and prior periods; that benefit is discounted to determine its present value. Any unrecognised past service costs and the fair value of any defined benefit plan assets are deducted. The discount rate is the yield at balance sheet date on AA-rated bonds that have maturity dates approximating the terms of Heineken’sHEINEKEN’s obligations and that are denominated in the same currency in which the benefits are expected to be paid.
The calculations are performed annually by qualified actuaries using the projected unit credit method. When the calculation results in a benefit to Heineken,HEINEKEN, the recognised asset is limited to the net total of any unrecognised actuarial gains and losses and any unrecognised past service costs and the present value of economic benefits available in the form of any future refunds from the plan or reductions in future contributions to the plan. In order to calculate the present value of economic benefits, consideration is given to any minimum funding requirements that apply to any plan in the Group. An economic benefit is available to the Group if it is realisable during the life of the plan, or on settlement of the plan liabilities.
When the benefits of a plan are improved, the portion of the increased benefit relating to past service by employees is recognised as an expense in profit or loss on a straight-line basis over the average period until the benefits become vested. To the extent that the benefits vest immediately, the expense is recognised immediately in profit or loss.
In respect ofHEINEKEN recognises all actuarial gains and losses that arise, Heineken applies the corridor method in calculating the obligation in respect of a plan. To the extent that any cumulative unrecognised actuarial gain or loss exceeds ten per cent of the greater of the present value of thearising from defined benefit obligationplans immediately in other comprehensive income and the fair value of plan assets, that portion is recognisedall expenses related to defined benefit plans in personnel expenses in profit or loss over the expected average remaining working lives of the employees participating in the plan. Otherwise, the actuarial gain or loss is not recognised.loss.
| (iii) | Other long-term employee benefits |
Heineken’sHEINEKEN’s net obligation in respect of long-term employee benefits, other than pension plans, is the amount of future benefit that employees have earned in return for their service in the current and prior periods; that benefit is discounted to determine its present value, and the fair value of any related assets is deducted. The discount rate is the yield at balance sheet date on high-quality credit-rated bonds that have maturity dates approximating the terms of Heineken’sHEINEKEN’s obligations. The obligation is calculated using the projected unit credit method. Any actuarial gains and losses are recognised in profit or lossother comprehensive income in the period in which they arise.
Financial statements | Notes to the consolidated financial statementscontinued
| (iv) | Termination benefits |
Termination benefits are payable when employment is terminated by the Group before the normal retirement date, or whenever an employee accepts voluntary redundancy in exchange for these benefits.
Termination benefits are recognised as an expense when HeinekenHEINEKEN is demonstrably committed to either terminating the employment of current employees according to a detailed formal plan without possibility of withdrawal, or providing termination benefits as a result of an offer made to encourage voluntary redundancy. Termination benefits for voluntary redundancies are recognised if HeinekenHEINEKEN has made an offer encouraging voluntary redundancy, it is probable that the offer will be accepted, and the number of acceptances can be estimated reliably.
Benefits falling due more than 12 months after the balance sheet date are discounted to their present value.
| (v) | Share-based payment plan |
As from 1 January 2005 HeinekenHEINEKEN established a share plan for the Executive Board and as from 1 January 2006 HeinekenHEINEKEN also established a share plan for senior management (see note 29).
The grant date fair value of the share rights granted is recognised as personnel expenses with a corresponding increase in equity (equity-settled), over the period that the employees become unconditionally entitled to the share rights. The costs of the share plan for both the Executive Board and senior management members are spread evenly over the performance period.
At each balance sheet date, HeinekenHEINEKEN revises its estimates of the number of share rights that are expected to vest, for the 100 per cent internal performance conditions of the share plan 2010 – 2012plans 2010-2012, 2011-2013 and 2012-2014 of the senior management members and the Executive Board and for the 75 per cent internal performance conditions of the share plan 2008 – 2010 and 2009 – 2011 of the senior management members.Board. It recognises the impact of the revision of original estimates – only applicable for internal performance conditions, if any, in profit or loss, with a corresponding adjustment to equity. The fair value for the share plan 2008 – 2010 and 2009 – 2011 is measured at grant date using the Monte Carlo model taking into account the terms and conditions of the plan.
| (vi) | Matching share entitlement |
As from 21 April 2011 HEINEKEN established a matching share entitlement for the Executive Board. The grant date fair value of the matching shares is recognised as personnel expenses in the income statement as it is deemed an equity settled incentive.
| (vii) | Short-term employee benefits |
Short-term employee benefit obligations are measured on an undiscounted basis and are expensed as the related service is provided.
A liability is recognised for the amount expected to be paid under short-term benefits if the Group has a present legal or constructive obligation to pay this amount as a result of past service provided by the employee and the obligation can be estimated reliably.
| (l) | Provisions |
| (i) | General |
A provision is recognised if, as a result of a past event, HeinekenHEINEKEN has a present legal or constructive obligation that can be estimated reliably, and it is probable that an outflow of economic benefits will be required to settle the obligation. Provisions are measured at the present value of the expenditures to be expected to be required to settle the obligation using a pre-tax rate that reflects current market assessments of the time value of money and the risks specific to the obligation. The increase in the provision due to passage of time is recognised as part of the net finance expenses.
| (ii) | Restructuring |
A provision for restructuring is recognised when HeinekenHEINEKEN has approved a detailed and formal restructuring plan, and the restructuring has either commenced or has been announced publicly. Future operating losses are not provided for. The provision includes the benefit commitments in connection with early retirement and redundancy schemes.
| (iii) | Onerous contracts |
A provision for onerous contracts is recognised when the expected benefits to be derived by HeinekenHEINEKEN from a contract are lower than the unavoidable cost of meeting its obligations under the contract. The provision is measured at the present value of the lower of the expected cost of terminating the contract and the expected net cost of continuing with the contract. Before a provision is established, HeinekenHEINEKEN recognises any impairment loss on the assets associated with that contract.
Financial statements | Notes to the consolidated financial statementscontinued
| (iv) | Other |
3. Significant accounting policies continuedThe other provisions, not being provisions for restructuring or onerous contracts, consist mainly of surety and guarantees, litigation and claims and environmental provisions.
| (m) | Loans and borrowings |
Loans and borrowings are recognised initially at fair value, net of transaction costs incurred. Loans and borrowings are subsequently stated at amortised cost; any difference between the proceeds (net of transaction costs) and the redemption value is recognised in profit or loss over the period of the borrowings using the effective interest method. Loans and borrowings included in a fair value hedge are stated at fair value in respect of the risk being hedged.
Loans and borrowings for which the Group has an unconditional right to defer settlement of the liability for at least 12 months after the balance sheet date, are classified as non-current liabilities.
| (n) | Revenue |
| (i) | Products sold |
Revenue from the sale of products in the ordinary course of business is measured at the fair value of the consideration received or receivable, net of sales tax, excise duties, returns, customer discounts and other sales-related discounts. Revenue from the sale of products is recognised in profit or loss when the amount of revenue can be measured reliably, the significant risks and rewards of ownership have been transferred to the buyer, recovery of the consideration is probable, the associated costs and possible return of products can be estimated reliably, and there is no continuing management involvement with the products.
If it is probable that discounts will be granted and the amount can be measured reliably, then the discount is recognised as a reduction of revenue as the sales are recognised.
| (ii) | Other revenue |
Other revenues are proceeds from royalties, rental income, pub management services and technical services to third parties, net of sales tax. Royalties are recognised in profit or loss on an accrual basis in accordance with the substance of the relevant agreement. Rental income, pub management services and technical services are recognised in profit or loss when the services have been delivered.
| (o) | Other income |
Other income are gains from sale of P, P & E, intangible assets and (interests in) subsidiaries, joint ventures and associates, net of sales tax. They are recognised in profit or loss when ownership has been transferred to the buyer.
| (p) | Expenses |
| (i) | Operating lease payments |
Payments made under operating leases are recognised in profit or loss on a straight-line basis over the term of the lease. Lease incentives received are recognised in profit or loss as an integral part of the total lease expense, over the term of the lease.
| (ii) | Finance lease payments |
Minimum lease payments under finance leases are apportioned between the finance expense and the reduction of the outstanding liability. The finance expense is allocated to each period during the lease term so as to produce a constant periodic rate of interest on the remaining balance of the liability. Contingent lease payments are accounted for by revising the minimum lease payments over the remaining term of the lease when the lease adjustment is confirmed.
| (q) | Government grants |
Government grants are recognised at their fair value when it is reasonably assured that HeinekenHEINEKEN will comply with the conditions attaching to them and the grants will be received.
Government grants relating to P, P & E are deducted from the carrying amount of the asset.
Government grants relating to costs are deferred and recognised in profit or loss over the period necessary to match them with the costs that they are intended to compensate.
Financial statements | Notes to the consolidated financial statementscontinued
| (r) | Interest income, interest expenses and other net finance income and expenses |
Interest income and expenses are recognised as they accrue in profit or loss, using the effective interest method unless collectability is in doubt.
Other net finance income comprises dividend income, gains on the disposal of available-for-sale investments, changes in the fair value of investments designated at fair value through profit or loss and held for trading investments and gains and losses on hedging instruments that are recognised in profit or loss. Dividend income is recognised in profit or loss on the date that Heineken’s right to receive payment is established, which in the case of quoted securities is the ex-dividend date.
Other net finance expenses comprise unwinding of the discount on provisions, changes in the fair value of investments designated at fair value through profit or loss and held for trading investments, impairment losses recognised on investments, and gains or losses on hedging instruments that are recognised in profit or loss.
Borrowing costs that are not directly attributable to the acquisition, construction or production of a qualifying asset are recognised in profit or loss using the effective interest method.
Other net finance income and expenses comprises dividend income, gains and losses on the disposal of available-for-sale investments, changes in the fair value of investments designated at fair value through profit or loss and held for trading
investments, changes in fair value of hedging instruments that are recognised in profit or loss, unwinding of the discount on provisions and impairment losses recognised on investments. Dividend income is recognised in the income statement on the date that HEINEKEN’s right to receive payment is established, which in the case of quoted securities is the ex-dividend date.
Foreign currency gains and losses are reported on a net basis in the other net finance income and expenses.
| (s) | Income tax |
Income tax comprises current and deferred tax. Current tax and deferred tax are recognised in profit or lossthe income statement except to the extent that it relates to a business combination, or items recognised directly in equity or in other comprehensive income.
| (i) | Current tax |
Current tax is the expected income tax payable or receivable in respect of taxable profitincome or loss for the year, using tax rates enacted or substantiallysubstantively enacted at the balance sheet date, and any adjustment to income tax payable in respect of profits of previous years. Current tax payable also includes any tax liability arising from the declaration of dividends.
| (ii) | Deferred tax |
Deferred tax is recognised in respect of temporary differences between the carrying amounts of assets and liabilities for financial reporting purposes and their tax bases.
Deferred tax assets and liabilities areis not recognised for the following for:
temporary differences: (i) the initial recognition of goodwill, (ii)differences on the initial recognition of assets or liabilities in a transaction that is not a business combination and that affects neither accounting nor taxable profit or loss, (iii)loss;
temporary differences relatingrelated to investments in subsidiaries, joint venturesassociates and associates resulting from translation of foreign operations and (iv) differences relating to investments in subsidiaries and joint venturesjointly controlled entities to the extent that the Company is able to control the timing of the reversal of the temporary differencedifferences and it is probable that they will probably not reverse in the foreseeable future.future; and
taxable temporary differences arising on the initial recognition of goodwill.
The measurement of deferred tax assets and liabilities reflects the tax consequences that would follow the manner in which the Company expects, at the end of the reporting period, to recover or settle the carrying amount of its assets and liabilities.
Deferred tax is determined using tax rates (and laws) that have been enacted or substantiallysubstantively enacted byat the balance sheet date and are expected to apply when the related deferred tax asset is realised or the deferred tax liability is settled.
Deferred tax assets and liabilities are offset if there is a legally enforceable right to offset current tax liabilities and assets, and they relate to income taxes levied by the same tax authority on the same taxable entity, or on different taxable entities which intend either to settle current tax liabilities and assets on a net basis, or to realise the assets and settle the liabilities simultaneously.
A deferred tax asset is recognised for unused tax losses, tax credits and deductible temporary differences, to the extent that it is probable that future taxable profits will be available against which they can be utilised. Deferred tax assets are reviewed at each balance sheet date and are reduced to the extent that it is no longer probable that the related tax benefit will be realised.
Deferred
| (iii) | Tax exposures |
In determining the amount of current and deferred income tax, assets are recognisedthe Company takes into account the impact of uncertain tax positions and whether additional taxes and interest may be due. This assessment relies on estimates and assumptions and may involve a series of judgments about future events. New information may become available that causes the Company to change its judgment regarding the adequacy of existing tax liabilities; such changes to tax liabilities will impact the income tax expense in respect of the carry forward of unused tax losses and tax credits. When an entity hasperiod that such a history of recent losses, the entity recognises a deferred tax asset arising from unused tax losses or tax credits only to the extent that the entity has sufficient taxable temporary differences or theredetermination is convincing other evidence that sufficient taxable profit will be available against which the unused tax losses or unused tax credits can be utilised by the entity.
Financial statements | Notes to the consolidated financial statementscontinued
3. Significant accounting policies continuedmade.
| (t) | Discontinued operations |
A discontinued operation is a component of the Group’s business that represents a separate major line of business or geographical area of operations that has been disposed of or is held for sale or distribution, or is a subsidiary acquired exclusively with a view to resale. Classification as a discontinued operation occurs upon disposal or when the operation meets the criteria to be classified as held for sale, if earlier. When an operation is classified as a discontinued operation, the comparative statement of comprehensive income is re-presentedrepresented as if the operation had been discontinued from the start of the comparative year.
| (u) | Earnings per share |
HeinekenHEINEKEN presents basic and diluted earnings per share (EPS) data for its ordinary shares. Basic EPS is calculated by dividing the profit or loss attributable to ordinary shareholders of the Company by the weighted average number of ordinary shares outstanding during the period including the weighted average of outstanding ASDI, adjusted for the weighted average of own shares purchased in the year. Diluted EPS is determined by adjusting the profit or loss attributable to ordinary shareholders and the weighted average number of ordinary shares outstanding including weighted average of outstanding ASDI, adjusted for the weighted average of own shares purchased in the year, for the effects of all dilutive potential ordinary shares, which comprise share rights granted to employees.
| (v) | Cash flow statement |
The cash flow statement is prepared using the indirect method. Changes in balance sheet items that have not resulted in cash flows such as translation differences, fair value changes, equity-settled share-based payments and other non-cash items, have been eliminated for the purpose of preparing this statement. Assets and liabilities acquired as part of a business combination are included in investing activities (net of cash acquired). Dividends paid to ordinary shareholders are included in financing activities. Dividends received are classified as operating activities. Interest paid is also included in operating activities.
| (w) | Operating segments |
Operating segments are reported in a manner consistent with the internal reporting provided to the Executive Board, who is considered to be the Group’s chief operating decision maker. An operating segment is a component of HeinekenHEINEKEN that engages in business activities from which it may earn revenues and incur expenses, including revenues and expenses that relate to transactions with any of Heineken’sHEINEKEN’s other components. All operating segments’ operating results are reviewed regularly by the Executive Board to make decisions about resources to be allocated to the segment and to assess its performance, and for which discrete financial information is available.
Inter-segment transfers or transactions are entered into under the normal commercial terms and conditions that would also be available to unrelated third parties.
Segment results, assets and liabilities that are reported to the Executive Board include items directly attributable to a segment as well as those that can be allocated on a reasonable basis. Unallocated result items comprise net finance expenses and income tax expenses. Unallocated assets comprise current other investments and cash call deposits.
Segment capital expenditure is the total cost incurred during the period to acquire property, plant and equipment,P, P & E, and intangible assets other than goodwill.
| (x) | Emission rights |
Emission rights are related to the emission of CO2,CO2, which relates to the production of energy. These rights are freely tradable. Bought emission rights and liabilities due to production of CO2CO2 are measured at cost, including any directly attributable expenditure. Emission rights received for free are also recorded at cost, i.e. with a zero value.
Financial statements | Notes to the consolidated financial statementscontinued
| (y) | Recently issued IFRS |
| (i) | Standards effective in |
IFRS 3 Business Combinations (revised 2008)). The IASB issued a revised version of the business combinations standard. For the main changes we refer to paragraph 2(e) Changes in accounting policies.
IAS 27 Consolidated and Separate Financial Statements (amended 2008). The IASB amended IAS 27 to reflect changes to the accounting for non-controlling interest. For the amendments we refer to paragraph 2(e) Changes in accounting policies.
Other standards: other standardsStandards and interpretations effective from 1 January 2010, like IFRS 2 Share based payments, IFRIC 17 Distributions of non cash assets to owners and IAS 39 Financial instruments: recognition and measurement,2012 did not have a significant impact on the Company.
| (ii) | New relevant standards and interpretations not yet adopted |
The followingA number of new standards, amendments to standards and interpretations to existing standards relevant to Heineken are not yet effective for the year ended 31 December 2010,annual periods beginning after 1 January 2013, and have not been applied in preparing these consolidated financial statements:
IFRS 3 Business Combinations (amendments effective date 1 July 2010). The amendments:
Clarify that contingent consideration arising instatements. Those which may be relevant to the Company are set out below, however HEINEKEN does not expect these changes to have a business combination previously accounted for in accordance with IFRS 3 (2004) that remains outstanding at the adoption date of IFRS 3 (2008) continues to be accounted for in accordance with IFRS 3 (2004)
Limit the accounting policy choice to measure non-controlling interests upon initial recognition at fair value or at the non-controlling interest’s proportionate share of the acquiree’s identifiable net assets to instruments that give rise to a present ownership interest and that currently entitle the holder to a share of net assets in the event of liquidation; and
Expand the current guidancesignificant effect on the attribution of the market-based measure of an acquirer’s share-based payment awards issued in exchange for acquiree awards between consideration transferred and post-combination compensation cost when an acquirer is obliged to replace the acquiree’s existing awards to encompass voluntarily replaced unexpired acquired awards.consolidated financial statements.
|
IAS 24 Related Party Disclosures (revised 2009 – effective date 1 January 2011). The revised IAS 24 amends the definition of a related party and modifies certain related party disclosure requirements for government-related entities.
IFRS 7 Financial Instruments: Disclosures (amendments effective date 1 January 2011). The amendments add an explicit statement that qualitative disclosure should be made in the contact of the quantitative disclosures to better enable users to evaluate an entity’s exposure to risks arising from financial instruments. In addition, the IASB amended and removed existing disclosure requirements.
IAS 1 Presentation of Financial Statements (amendments effective date 1 January 2011). The amendments clarify that disaggregation of changes in each component of equity arising from transactions recognised in other comprehensive income also is required to be presented, but may be presented either in the statement of changes in equity or in the notes.
IFRS 9 Financial Instruments is part of the IASB’s wider project to replace IAS 39 ‘Financial Instruments: Recognition and Measurement’. IFRS 9 retains but simplifies the mixed measurement model and establishes two primary measurement categories for financial assets, amortised cost and fair value. The basis of classification depends on the entity’s business model and the contractual cash flow characteristics of the financial asset.19 Employee Benefits was amended. The standard is effective for annual periods beginning on or after 1 January 2013 and was endorsed by the EU. HEINEKEN has evaluated the impact of the applicability of this new standard. The prescribed calculation method to determine the return on net assets would result in an estimated increase in total pension costs of EUR99 million for 2012. This amount represents the variance between expected return on net assets and the prescribed application of the discount rate. Previously, total pension costs were reported within personnel expenses. With effect from 1 January 2013 HEINEKEN will present the interest expense on its net pension liability, an estimated EUR60 million, in Other net finance income and expenses.
IFRS 9 Financial Instruments introduces new requirements for the classification and measurement of financial assets. Under IFRS 9 (2009), financial assets are classified and measured based on the business model in which they are held and the characteristics of their contractual cash flows. IFRS 9 (2010) introduces additions relating to financial liabilities. The IASB currently has an active project to make limited amendments to the classification and measurement requirements of IFRS 9 and add new requirements to address the impairment of financial assets and hedge accounting. The standard is effective for annual periods beginning on or after 1 January 2015, but has not yet been endorsed by the EU. HeinekenHEINEKEN is in the process of evaluating the impact of the applicability of the new standard.
IFRS 10 Consolidated Financial Statements establishes principles for the presentation and preparation of consolidated financial statements when an entity controls one or more other entities. This IFRS supersedes IAS 19 Pensions27 Consolidated and IFRIC 14 (amendmentsseparate financial statements and SIC-12 Consolidation – Special purpose entities and is effective for annual periods beginning on or after 1 January 2011)2014.
IFRS 11 Joint arrangements establishes principles for financial reporting by parties to a joint arrangement. This IFRS supersedes IAS 31 Interest in Joint Ventures and SIC-13 Jointly Controlled Entities – The limitNon-monetary contributions by ventures and is adopted by the EU for annual periods beginning on or after 1 January 2014. Under IFRS 11 the structure of the arrangement is no longer the only determinant for the accounting treatment and entities do no longer have a Defined Benefit Assets, Minimum Funding Requirements and their Interaction. These amendments remove unintended consequences arising from the treatment of prepayments where there is a minimum funding requirement. These amendments resultchoice in prepayments of contributions in certain circumstances being recognised as an asset rather than an expense.accounting treatment.
Financial statements | NotesIFRS 12 Disclosure of interests in other entities applies to entities that have an interest in a subsidiary, a joint arrangement, an associate or an unconsolidated structured entity. The EU has adopted this IFRS for annual periods beginning on or after 1 January 2014. This IFRS integrates and makes consistent the consolidateddisclosure requirements for all entities mentioned above.
IFRS 13 Fair value measurement defines fair value; sets out in a single IFRS a framework for measuring fair value; and requires disclosures about fair value measurements. The EU has adopted this IFRS for annual periods beginning on or after 1 January 2014. The IFRS explains how to measure fair value for financial statementscontinuedreporting. It does not require fair value measurements in addition to those already required or permitted by other IFRSs and is not intended to establish valuation standards or affect valuation practices outside financial reporting.
HEINEKEN has the intention to early adopt IFRS 10, 11, 12 and 13 to align with the IASB effective date of 1 January 2013.
| 4. | Determination of fair values |
General
A number of Heineken’sHEINEKEN’s accounting policies and disclosures require the determination of fair value, for both financial and non-financial assets and liabilities. Fair values have been determined for measurement and/or disclosure purposes based on the following methods. When applicable, further information about the assumptions made in determining fair values or for the purpose of impairment testing is disclosed in the notes specific to that asset or liability.
Fair value as a result of business combinations
| Property, plant and equipment |
The fair value of property, plant and equipmentP, P & E recognised as a result of a business combination is based on the quoted market prices for similar items when available and replacement cost when appropriate.
| Intangible assets |
The fair value of brands acquired in a business combination is based on the ‘relief of royalty’ method or determined using the multi-period excess earnings method. The fair value of customer relationships acquired in a business combination is determined using the multi-period excess earnings method, whereby the subject asset is valued after deducting a fair return on all other assets that are part of creating the related cash flows. The fair value of reacquired rights and other intangible assets is based on the discounted cash flows expected to be derived from the use and eventual sale of the assets.
| Inventories |
The fair value of inventories acquired in a business combination is determined based on its estimated selling price in the ordinary course of business less the estimated costs of completion and sale, and a reasonable profit margin based on the effort required to complete and sell the inventories.
| Trade and other receivables |
The fair value of trade and other receivables is estimated at the present value of future cash flows, discounted at the market rate of interest at the reporting date. This fair value is determined for disclosure purposes or when acquired in a business combination.
Fair value from general business operations
| (i) | Investments in equity and debt securities |
The fair value of financial assets at fair value through profit or loss, held-to-maturity investments and available-for-sale financial assets is determined by reference to their quoted closing bid price at the reporting date, or if unquoted, determined using an appropriate valuation technique. The fair value of held-to-maturity investments is determined for disclosure purposes only. In case the quoted price does not exist at the date of exchange or in case the quoted price exists at the date of exchange but was not used as the cost, the investments are valued indirectly based on discounted cash flow models.
The fair value of trade and other receivables is estimated at the present value of future cash flows, discounted at the market rate of interest at the reporting date. This fair value is determined for disclosure purposes or when acquired in a business combination.
| Derivative financial instruments |
The fair value of derivative financial instruments areis based on their listed market price, if available. If a listed market price is not available, then fair value is in general estimated by discounting the difference between the cash flows based on contractual price and the cash flows based on current price for the residual maturity of the contract using a risk-free interest rate (based on inter-bank interest rates).
Fair values reflectinclude the instrument’s credit risk of the instrument and include adjustments to take account of the credit risk of the Group entity and counterparty when appropriate.
| Non-derivative financial instruments |
Fair value, which is determined for disclosure purposes or when fair value hedge accounting is applied, is calculated based on the present value of future principal and interest cash flows, discounted at the market rate of interest at the reporting date. For finance leases the market rate of interest is determined by reference to similar lease agreements.
Financial statements | NotesFair values include the instrument’s credit risk and adjustments to take account of the consolidated financial statementscontinuedcredit risk of the Group entity and counterparty when appropriate.
| 5. | Operating segments |
HeinekenHEINEKEN distinguishes the following six reportable segments:
Western Europe
Central and Eastern Europe
The Americas
Africa and the Middle East
Asia Pacific
Head Office/Office and Other/eliminations.
TheseThe first five reportable segments as stated above are the Group’s business regions. These business regions are each managed separately by a Regional President. The Regional President is directly accountable for the functioning of the segment’s assets, liabilities and results of the region and reports regularly to the Executive Board (the chief operating decision maker) to discuss operating activities, regional forecasts and regional results. The Head Office operating segment falls directly under the responsibility of the Executive Board. For each of the six reportable segments, the Executive Board reviews internal management reports on a monthly basis.
Information regarding the results of each reportable segment is included in the table on the next page. Performance is measured based on EBIT (beia), as included in the internal management reports that are reviewed by the Executive Board. EBIT (beia) is defined as earnings before interest and taxes and net finance expenses, before exceptional items and amortisation of brands and customer relationships.acquisition related intangibles. Exceptional items are defined as items of income and expense of such size, nature or incidence, that in view of management their disclosure is relevant to explain the performance of HeinekenHEINEKEN for the period. EBIT and EBIT (beia) are not financial measures calculated in accordance with IFRS. EBIT (beia) is used to measure performance as management believes that this measurement is the most relevant in evaluating the results of these regions.segments.
HeinekenHEINEKEN has multiple distribution models to deliver goods to end customers. There is no reliance on major clients. Deliveries to end consumers are done in some countries via own wholesalers or own pubs, in other markets directly and in some others via third parties. As such, distribution models are country specific and on consolidated level diverse. In addition, these various distribution models are not centrally managed or monitored. Consequently, the Executive Board is not allocating resources and assessing the performance based on business type information and therefore no segment information is provided on business type.
Inter-segment pricing is determined on an arm’s-length basis. As net finance expenses and income tax expenses are monitored on a consolidated level (and not on an individual regional basis) and regional presidents are not accountable for that, net finance expenses and income tax expenses are not provided per reportable segment.
Financial statements | Notes to the consolidated financial statementscontinued
5. Operating segmentscontinued
Information about reportable segments
| Note | Western Europe | Central and Eastern Europe | The Americas | Western Europe | Central and Eastern Europe | The Americas | ||||||||||||||||||||||||||||||||||||||||||||||||||
In millions of EUR | 2010 | 2009 | 2010 | 2009 | 2010 | 2009 | Note | 2012 | 2011 | 2012 | 2011 | 2012 | 2011 | |||||||||||||||||||||||||||||||||||||||||||
Revenue | ||||||||||||||||||||||||||||||||||||||||||||||||||||||||
Third party revenue1 | 7,284 | 7,775 | 3,130 | 3,183 | 3,419 | 1,540 | 7,140 | 7,158 | 3,255 | 3,209 | 4,507 | 4,002 | ||||||||||||||||||||||||||||||||||||||||||||
Interregional revenue | 610 | 657 | 13 | 17 | 12 | 1 | 645 | 594 | 25 | 20 | 16 | 27 | ||||||||||||||||||||||||||||||||||||||||||||
Total revenue | 7,894 | 8,432 | 3,143 | 3,200 | 3,431 | 1,541 | 7,785 | 7,752 | 3,280 | 3,229 | 4,523 | 4,029 | ||||||||||||||||||||||||||||||||||||||||||||
|
|
|
|
|
| |||||||||||||||||||||||||||||||||||||||||||||||||||
Other income | 71 | 28 | 8 | 11 | — | — | 13 | 48 | 9 | 7 | 2 | 1 | ||||||||||||||||||||||||||||||||||||||||||||
Results from operating activities | 765 | 504 | 330 | 329 | 474 | 204 | 739 | 820 | 313 | 318 | 581 | 493 | ||||||||||||||||||||||||||||||||||||||||||||
Net finance expenses | ||||||||||||||||||||||||||||||||||||||||||||||||||||||||
Share of profit of associates and joint ventures and impairments thereof | 3 | (2 | ) | 21 | 18 | 75 | 69 | 1 | 3 | 24 | 17 | 81 | 77 | |||||||||||||||||||||||||||||||||||||||||||
Income tax expenses | ||||||||||||||||||||||||||||||||||||||||||||||||||||||||
Profit | ||||||||||||||||||||||||||||||||||||||||||||||||||||||||
Attributable to: | ||||||||||||||||||||||||||||||||||||||||||||||||||||||||
Equity holders of the Company (net profit) | ||||||||||||||||||||||||||||||||||||||||||||||||||||||||
Non-controlling interest | ||||||||||||||||||||||||||||||||||||||||||||||||||||||||
|
|
|
|
|
| |||||||||||||||||||||||||||||||||||||||||||||||||||
EBIT reconciliation | ||||||||||||||||||||||||||||||||||||||||||||||||||||||||
EBIT | 768 | 502 | 351 | 347 | 549 | 273 | 740 | 823 | 337 | 335 | 662 | 570 | ||||||||||||||||||||||||||||||||||||||||||||
eia | 136 | 290 | 12 | 42 | 102 | — | ||||||||||||||||||||||||||||||||||||||||||||||||||
EBIT (beia) | 27 | 904 | 792 | 363 | 389 | 651 | 273 | |||||||||||||||||||||||||||||||||||||||||||||||||
Eia2 | 224 | 139 | 12 | 11 | 86 | 85 | ||||||||||||||||||||||||||||||||||||||||||||||||||
EBIT (beia)2 | 27 | 964 | 962 | 349 | 346 | 748 | 655 | |||||||||||||||||||||||||||||||||||||||||||||||||
|
|
|
|
|
| |||||||||||||||||||||||||||||||||||||||||||||||||||
Beer volumes2 | ||||||||||||||||||||||||||||||||||||||||||||||||||||||||
Consolidated volume | 45,394 | 47,151 | 42,237 | 46,165 | 37,843 | 9,430 | ||||||||||||||||||||||||||||||||||||||||||||||||||
Consolidated beer volume | 44,288 | 45,380 | 47,269 | 45,377 | 53,124 | 50,497 | ||||||||||||||||||||||||||||||||||||||||||||||||||
Joint Ventures’ volume | — | — | 7,229 | 8,909 | 9,195 | 8,988 | — | — | 7,578 | 7,303 | 9,611 | 9,663 | ||||||||||||||||||||||||||||||||||||||||||||
Licenses | 284 | 243 | — | — | 173 | 339 | ||||||||||||||||||||||||||||||||||||||||||||||||||
Licences | 288 | 300 | — | — | 74 | 65 | ||||||||||||||||||||||||||||||||||||||||||||||||||
Group volume | 45,678 | 47,394 | 49,466 | 55,074 | 47,211 | 18,757 | 44,576 | 45,680 | 54,847 | 52,680 | 62,809 | 60,225 | ||||||||||||||||||||||||||||||||||||||||||||
|
|
|
|
|
| |||||||||||||||||||||||||||||||||||||||||||||||||||
Segment assets | 10,123 | 11,047 | 4,583 | 4,826 | 7,756 | 834 | ||||||||||||||||||||||||||||||||||||||||||||||||||
Current segment assets | 2,007 | 1,843 | 1,082 | 985 | 1,193 | 1,045 | ||||||||||||||||||||||||||||||||||||||||||||||||||
Other non-current segment assets | 8,015 | 8,186 | 3,423 | 3,365 | 5,649 | 5,619 | ||||||||||||||||||||||||||||||||||||||||||||||||||
Investment in associates and joint ventures | 28 | 26 | 134 | 143 | 758 | 565 | 22 | 23 | 196 | 165 | 835 | 711 | ||||||||||||||||||||||||||||||||||||||||||||
Total segment assets | 10,151 | 11,073 | 4,717 | 4,969 | 8,514 | 1,399 | 10,044 | 10,052 | 4,701 | 4,515 | 7,677 | 7,375 | ||||||||||||||||||||||||||||||||||||||||||||
Unallocated assets | ||||||||||||||||||||||||||||||||||||||||||||||||||||||||
Total assets | ||||||||||||||||||||||||||||||||||||||||||||||||||||||||
|
|
|
|
|
| |||||||||||||||||||||||||||||||||||||||||||||||||||
Segment liabilities | 3,072 | 3,355 | 1,128 | 1,153 | 1,115 | 123 | 4,178 | 3,723 | 1,347 | 1,160 | 1,072 | 1,068 | ||||||||||||||||||||||||||||||||||||||||||||
Unallocated liabilities | ||||||||||||||||||||||||||||||||||||||||||||||||||||||||
Total equity | ||||||||||||||||||||||||||||||||||||||||||||||||||||||||
Total equity and liabilities | ||||||||||||||||||||||||||||||||||||||||||||||||||||||||
|
|
|
|
|
| |||||||||||||||||||||||||||||||||||||||||||||||||||
Purchase of P, P & E | 205 | 291 | 158 | 216 | 121 | 13 | 260 | 215 | 197 | 170 | 250 | 199 | ||||||||||||||||||||||||||||||||||||||||||||
Acquisition of goodwill | 4 | 16 | — | — | 1,780 | 5 | 7 | — | — | 1 | 36 | 4 | ||||||||||||||||||||||||||||||||||||||||||||
Purchases of intangible assets | 5 | 31 | 4 | 20 | 24 | 1 | 26 | 11 | 12 | 9 | 14 | 20 | ||||||||||||||||||||||||||||||||||||||||||||
Depreciation of P, P & E | 381 | 401 | 253 | 244 | 149 | 15 | (344 | ) | (343 | ) | (247 | ) | (234 | ) | (201 | ) | (183 | ) | ||||||||||||||||||||||||||||||||||||||
Impairment and reversal of impairment of P, P & E | 1 | 108 | 9 | 51 | — | — | ||||||||||||||||||||||||||||||||||||||||||||||||||
(Impairment) and reversal of impairment of P, P & E | (36 | ) | — | 15 | (2 | ) | (17 | ) | 5 | |||||||||||||||||||||||||||||||||||||||||||||||
Amortisation intangible assets | 90 | 89 | 22 | 21 | 73 | 12 | (86 | ) | (100 | ) | (16 | ) | (18 | ) | (103 | ) | (93 | ) | ||||||||||||||||||||||||||||||||||||||
Impairment intangible assets | 15 | 21 | 1 | 4 | — | — | ||||||||||||||||||||||||||||||||||||||||||||||||||
(Impairment) and reversal of impairment of intangible assets | (7 | ) | — | — | (3 | ) | — | — | ||||||||||||||||||||||||||||||||||||||||||||||||
Revenue Third party revenue1 Interregional revenue Total revenue Other income Results from operating activities Net finance expenses Share of profit of associates and joint ventures and impairments thereof Income tax expenses Profit Attributable to: Equity holders of the Company (net profit) Non-controlling interest EBIT reconciliation EBIT Eia2 EBIT (beia)2 Beer volumes2 Consolidated beer volume Joint Ventures’ volume Licences Group volume Current segment assets Other non-current segment assets Investment in associates and joint ventures Total segment assets Unallocated assets Total assets Segment liabilities Unallocated liabilities Total equity Total equity and liabilities Purchase of P, P & E Acquisition of goodwill Purchases of intangible assets Depreciation of P, P & E (Impairment) and reversal of impairment of P, P & E Amortisation intangible assets (Impairment) and reversal of impairment of intangible assets Africa and the
Middle East Asia Pacific Head Office and
Other/
eliminations Consolidated 2012 2011 2012 2011 2012 2011 2012 2011 2,639 2,223 527 216 315 315 18,383 17,123 — — — — (686 ) (641 ) — — 2,639 2,223 527 216 (371 ) (326 ) 18,383 17,123 — 3 1,486 5 — — 1,510 64 613 533 1,546 64 (101 ) (13 ) 3,691 2,215 (270 ) (430 ) 1 35 109 112 (3 ) (4 ) 213 240 (525 ) (465 ) 3,109 1,560 2,949 1,430 160 130 3,109 1,560 614 568 1,655 176 (104 ) (17 ) 3,904 2,455 38 2 (1,388 ) — 36 5 (992 ) 242 652 570 267 176 (68 ) (12 ) 2,912 2,697 23,289 22,029 3,742 1,309 — — 171,712 164,592 6,002 5,706 24,297 24,410 (157 ) — 47,331 47,082 1,149 1,093 675 769 1 — 2,187 2,227 30,440 28,828 28,714 26,488 (156 ) — 221,230 213,901 959 854 913 91 (629 ) (124 ) 5,525 4,694 2,073 1,867 7,151 2 1,619 1,143 27,930 20,182 281 272 534 536 82 57 1,950 1,764 3,313 2,993 8,598 629 1,072 1,076 35,405 26,640 574 487 35,979 27,127 760 653 498 36 238 508 8,093 7,148 15,124 9,887 12,762 10,092 35,979 27,127 395 202 20 — 48 14 1,170 800 — 282 2,757 — 480 — 3,280 287 2 — — — 24 16 78 56 (176) (140 ) (11 ) — (38 ) (36 ) (1,017 ) (936 ) (8) (3 ) — — 2 — (44 ) — (6) (6 ) (24 ) — (12 ) (12 ) (247 ) (229 ) — — — — — — (7 ) (3 )
| 1 | Includes other revenue of |
| 2 | For |
Financial statements | Notes to the consolidated financial statementscontinued
5. Operating segmentscontinued
Information about reportable segments
| Africa and the Middle East | Asia Pacific | Head Office/ Eliminations | Consolidated | |||||||||||||||||||||||||||||
In millions of EUR | 2010 | 2009 | 2010 | 2009 | 2010 | 2009 | 2010 | 2009 | ||||||||||||||||||||||||
Revenue | ||||||||||||||||||||||||||||||||
Third party revenue1 | 1,982 | 1,807 | 206 | 301 | 112 | 95 | 16,133 | 14,701 | ||||||||||||||||||||||||
Interregional revenue | 6 | 10 | — | 4 | (641 | ) | (689 | ) | — | — | ||||||||||||||||||||||
Total revenue | 1,988 | 1,817 | 206 | 305 | (529 | ) | (594 | ) | 16,133 | 14,701 | ||||||||||||||||||||||
Other income | — | 2 | 158 | — | 2 | — | 239 | 41 | ||||||||||||||||||||||||
Results from operating activities | 520 | 470 | 201 | 72 | (7 | ) | 51 | 2,283 | 1,630 | |||||||||||||||||||||||
Net finance expenses | (509 | ) | (329 | ) | ||||||||||||||||||||||||||||
Share of profit of associates and joint ventures and impairments thereof | 28 | 15 | 79 | 31 | (13 | ) | (4 | ) | 193 | 127 | ||||||||||||||||||||||
Income tax expenses | (399 | ) | (286 | ) | ||||||||||||||||||||||||||||
Profit | 1,568 | 1,142 | ||||||||||||||||||||||||||||||
Attributable to: | ||||||||||||||||||||||||||||||||
Equity holders of the Company (net profit) | 1,436 | 1,018 | ||||||||||||||||||||||||||||||
Non-controlling interest | 132 | 124 | ||||||||||||||||||||||||||||||
| 1,568 | 1,142 | |||||||||||||||||||||||||||||||
EBIT reconciliation | ||||||||||||||||||||||||||||||||
EBIT | 548 | 485 | 280 | 103 | (20 | ) | 47 | 2,476 | 1,757 | |||||||||||||||||||||||
eia | 1 | — | (158 | ) | — | 39 | 6 | 132 | 338 | |||||||||||||||||||||||
EBIT (beia) | 549 | 485 | 122 | 103 | 19 | 53 | 2,608 | 2,095 | ||||||||||||||||||||||||
Beer volumes2 | ||||||||||||||||||||||||||||||||
Consolidated volume | 19,070 | 19,820 | 1,328 | 2,681 | — | — | 145,872 | 125,247 | ||||||||||||||||||||||||
Joint Ventures’ volume | 5,399 | 2,228 | 22,181 | 10,897 | — | — | 44,004 | 31,022 | ||||||||||||||||||||||||
Licenses | 1,204 | 1,413 | 806 | 805 | — | — | 2,467 | 2,800 | ||||||||||||||||||||||||
Group volume | 25,673 | 23,461 | 24,315 | 14,383 | — | — | 192,343 | 159,069 | ||||||||||||||||||||||||
Segment assets | 1,911 | 1,673 | 86 | 185 | (74 | ) | (414 | ) | 24,385 | 18,151 | ||||||||||||||||||||||
Investment in associates and joint ventures | 262 | 226 | 507 | 472 | (16 | ) | (5 | ) | 1,673 | 1,427 | ||||||||||||||||||||||
Total segment assets | 2,173 | 1,899 | 593 | 657 | (90 | ) | (419 | ) | 26,058 | 19,578 | ||||||||||||||||||||||
Unallocated assets | 491 | 602 | ||||||||||||||||||||||||||||||
Total assets | 26,549 | 20,180 | ||||||||||||||||||||||||||||||
Segment liabilities | 529 | 466 | 33 | 107 | 479 | 571 | 6,356 | 5,775 | ||||||||||||||||||||||||
Unallocated liabilities | 9,676 | 8,758 | ||||||||||||||||||||||||||||||
Total equity | 10,517 | 5,647 | ||||||||||||||||||||||||||||||
Total equity and liabilities | 26,549 | 20,180 | ||||||||||||||||||||||||||||||
Purchase of P, P & E | 163 | 139 | 1 | 10 | — | 9 | 648 | 678 | ||||||||||||||||||||||||
Acquisition of goodwill | 1 | 13 | — | — | (37 | ) | — | 1,748 | 34 | |||||||||||||||||||||||
Purchases of intangible assets | 9 | 1 | — | — | 14 | 46 | 56 | 99 | ||||||||||||||||||||||||
Depreciation of P, P & E | 100 | 84 | 1 | 10 | 9 | 14 | 893 | 768 | ||||||||||||||||||||||||
Impairment and reversal of impairment of P, P & E | 2 | 2 | — | — | 2 | 2 | 14 | 163 | ||||||||||||||||||||||||
Amortisation intangible assets | 4 | 2 | — | — | 3 | 3 | 192 | 127 | ||||||||||||||||||||||||
Impairment intangible assets | — | — | — | — | — | — | 16 | 25 | ||||||||||||||||||||||||
|
|
Financial statements | Notes to the consolidated financial statementscontinued
6. Acquisitions and disposals of subsidiaries and non-controlling interests
Acquisition of 100the beer operations in Asia Pacific Breweries
On 17 August 2012, HEINEKEN announced that, through its wholly owned subsidiary Heineken International B.V., it had signed the definitive agreements with Fraser & Neave, Limited (‘F&N’) regarding the acquisition of control of Asia Pacific Investment Pte. Ltd (‘APIPL’) and Asia Pacific Breweries Ltd. (‘APB’) and their subsidiaries (together referred to as the ‘Acquired Businesses’, the ‘Transaction’ or ‘APIPL/APB acquisition’). For this Transaction, Heineken agreed to pay SGD53.00 per share for F&N’s entire (direct and indirect) 39.7 per cent effective stake in APB for a total consideration of EUR3,480 million and a total consideration of EUR104 million for F&N’s interest in the non-APB assets held by APIPL. The Transaction has been approved by F&N’s Extraordinary General Meeting on 28 September 2012 and was completed, after regulatory approvals, on 15 November 2012.
Between 17 August 2012 and 15 November 2012, HEINEKEN purchased an additional 13.7 per cent stake in APB (including an 8.6 per cent stake it acquired from Kindest Place Group Limited on 24 September 2012) for a total consideration of EUR1,194 million.
Prior to the Acquisition, HEINEKEN owned a 50 per cent stake in APIPL, a combined direct and indirect stake in APB of 55.6 per cent as well as a direct stake in PT Multi Bintang of 6.78 per cent. Together these stakes are referred to as the Previously Held Equity Interests (‘PHEI’). Prior to the acquisition HEINEKEN did not have control over APB as 64.8 per cent of the beer operationsshares were held by APIPL, the joint venture between F&N and HEINEKEN. In accordance with IFRS, the PHEI in the Acquired Businesses is accounted for at fair value at the date of FEMSAacquisition and amounts to EUR2,975 million. The fair value of the PHEI has been determined using valuation techniques, based on the Acquired Businesses’ equity value and the undisturbed share price. HEINEKEN’s carrying amount consists of the book value of the original investment as well as the price paid for shares bought up to 15 November 2012. The fair value compared to HEINEKEN’s carrying amount results in a non-cash exceptional gain of EUR1,486 million, recognised in Other Income.
After completion of the Transaction, HEINEKEN, in aggregate, owns a 95.3 per cent stake in APB, wholly owns APIPL and also has a combined direct and indirect stake of 83.6 per cent in PT Multi Bintang. From 15 November 2012 onwards these entities are consolidated by HEINEKEN.
On 30 April 2010,15 November 2012, Heineken N.V. completed the acquisition of the beer operations of Fomento Económico Mexicano, S.A.B. de C.V.announced a Mandatory General Offer (‘FEMSA’MGO’) via an all share transaction (the ‘transaction’). Heineken N.V. acquiredfor all shares of common stocks in FEMSA Cerveza, comprising 100APB that Heineken does not already own (i.e. the remaining 4.7 per cent APB free-float shares), in accordance with the Singapore Code on Take-overs and Mergers. HEINEKEN expects to delist APB around 18 February 2013. The total consideration for all remaining shares will be EUR398 million.
Non-controlling interests are measured based on their proportional interest in the recognised amounts of FEMSA’s Mexican beer operations (including its USthe assets and other export businesses)liabilities of the Acquired Businesses. HEINEKEN recognised EUR797 million of non-controlling interests of which EUR645 million represents the APIPL/APB non-controlling stakes.
The following table summarises the major classes of consideration transferred, and the remaining 83 per centrecognised provisional amounts of FEMSA’s Brazilian beer business that Heineken did not own. A portionassets acquired and liabilities assumed at the acquisition date.
In millions of EUR* | ||||
Property, plant & equipment | 731 | |||
Intangible assets | 3,809 | |||
Investments in associates & joint ventures | 473 | |||
Other investments and non-current receivables | 82 | |||
Deferred tax assets | 4 | |||
Inventories | 187 | |||
Trade and other receivables | 296 | |||
Assets held for sale | 17 | |||
Cash and cash equivalents | 377 | |||
Assets acquired | 5,976 | |||
In millions of EUR* | ||||
Loans and borrowings, current and non-current | 296 | |||
Employee benefits | 12 | |||
Provisions | 3 | |||
Deferred tax liabilities | 1,001 | |||
Tax liabilities | 95 | |||
Trade and other current liabilities | 455 | |||
Liabilities assumed | 1,862 | |||
Total net identifiable assets | 4,114 | |||
Consideration paid in cash for the transaction on 15 November 2012 | 3,584 | |||
Fair value of previously held equity interest in the acquiree | 2,975 | |||
Non-controlling interests | 797 | |||
Settlement of pre-existing relationship | (5 | ) | ||
Net identifiable assets acquired | (4,114 | ) | ||
Goodwill on acquisition (provisional) | 3,237 | |||
| * | Amounts were converted to euros at the rate of EUR/SGD1.5622 for the statement of financial position |
The majority of the goodwill has been allocated to the Asia Pacific region and it is attributable to a number of factors such as the future growth platform and synergies that can be achieved. To properly account for the currency impact (in accordance with IAS21) on goodwill, the provisional amount of EUR2,757 million allocated to the Asia Pacific region is held in the following currencies. In alphabetical order; Chinese Yuan Renminbi (CNY), Indonesian Rupiah (IDR), Mongolian Tugrik (MTN), New Zealand Dollar (NZD), Papua New Guinea Kina (PGK), New Solomon Island Dollar (SBD), Singapore Dollar (SGD), Vietnamese Dong (VND), New Caledonian Franc (XPF) and Cambodia in USD. The remaining part of the provisional goodwill (EUR480 million) has been allocated to the Heineken shares allottedGlobal Commerce cash-generating unit (‘CGU’) in Head office and Others and reflects the benefit to FEMSA (and its affiliates) will be delivered over a periodHEINEKEN for safeguarding the position of not more than five years (the ‘Allotted Shares’ or Allotted Share Delivery Instrument or ASDI). The Allotted Shares have been recognisedHeineken® as a separate categoryglobal brand and future royalty streams.
Prior to the acquisition, HEINEKEN accounted for its investment in the Acquired Businesses with a three-month delay with any identified specific large, material events being recognised immediately. At the acquisition date, HEINEKEN discontinued the use of equity method accounting. Included within equity.the revaluation gain of the PHEI is the catch up on the three-month lagging period. This gain amounts to EUR23 million and is embedded within the PHEI gain presented as Other Income.
The beer operations acquired from FEMSAAcquired Businesses contributed a revenue of EUR2,036EUR287 million and results from operating activities of EUR215negative EUR9 million (EBIT)(including the reversal of the EUR76 million fair value lift up on inventory) for the eight-monthssix-week period from 1 May 201015 November 2012 to 31 December 2010.2012. Amortisation of brands and customer relationshipsidentified intangible assets for the eight-monthsix-week period amounts to EUR62EUR24 million. Had the acquisition occurred on 1 January 2010,2012, pro-forma revenue and pro-forma results from operating activities (EBIT) for the 12-month period ended 31 December 20102012 would have amounted to EUR2,873EUR1,698 million and EUR268EUR159 million, respectively. The pro-forma amortisation of brands and customer relationshipsidentified intangible assets would have amounted to EUR90EUR191 million. This pro-forma information does not purport to represent what ourHEINEKEN’s actual results would have been had the acquisition actually occurred on 1 January 2010,2012, nor are they necessarily indicative of future results of operations. In determining the contributions, management has assumed that the fair value adjustments that arose on the date of the acquisition would have been the same as if the acquisition had occurred on 1 January 2010.2012.
Acquisition-related costs of EUR28 million have been recognised in the income statement for the period ended 31 December 2012.
In accordance with IFRS 3R, the amounts recorded for the Transaction are provisional and are subject to adjustments during the measurement period if new information is obtained about facts and circumstances that existed as of the acquisition date and, if known, would have affected the measurement of the amounts recognised as of that date.
Other Acquisitions
During 2012 HEINEKEN completed transactions to increase its shareholding in Brasserie Nationale d’Haiti S.A. (‘BraNa’), the country’s leading brewer, from 22.5 per cent to 95 per cent. HEINEKEN also acquired 100 per cent of the Belgian cider innovation company Stassen in 2012.
The acquisition of BraNa and Stassen contributed revenue of EUR113 million, results from operating activities of EUR19 million (EBIT) and amortisation of identified intangible assets amounts to EUR nil million.
The following summarises the major classes of consideration transferred, and the recognised provisional amounts of assets acquired and liabilities assumed at the acquisition date.date of BraNa and Stassen.
In millions of | ||||
Property, plant & equipment | ||||
Intangible assets | ||||
| ||||
| ||||
| ||||
Inventories | ||||
Trade and other receivables | ||||
Cash and cash equivalents | ||||
| 9 | ||||
Assets acquired | ||||
In millions of | ||||
Loans and borrowings, | ||||
| ||||
| ||||
| ||||
| ||||
Deferred tax liabilities | ||||
| ||||
| ||||
Tax liabilities (current) | ||||
| ||||
| 22 | ||||
Liabilities assumed | ||||
Total net identifiable assets | ||||
| 69 | ||||
| |||||
Consideration | |||||
| |||||
Fair value of | 21 | ||||
Non-controlling interests | |||||
Net identifiable assets acquired | ( | ) | |||
| |||||
| 43 | |||||
| * |
Financial statements | Notes toThe amounts recorded for the consolidated financial statementscontinued
acquired businesses are prepared on a provisional basis. Goodwill has provisionally been allocated to Haiti in the America’s region andwhich is held in US dollars, Mexican pesosHTG (Haitian Gourde) and Brazil reals. The rationale for the allocation is that the acquisition provides accessStassen to the Latin American market, cost synergies to be achieved through economies of scale due to the increased size of the operations and deferred taxes and assembled workforce will mostly be between Mexico and the USA. Additionally, the acquisition secures the distribution of FEMSA productsWestern Europe region held in the USA, previously arranged via a 10-year licence agreement.EUR. The entire amountamounts of goodwill isare not expected to be tax deductible.
The consideration transferred in exchange of Heineken N.V. is based on 86,028,019 new Heineken N.V. Shares with a commitment to deliver Allotted Shares over a period of not more than five years from the date of Closing. The Allotted Shares will be delivered to FEMSA pursuant to the Allotted Share Delivery Instrument (ASDI). Simultaneously with the Closing, Heineken Holding N.V. has exchanged 43,018,320 (out of the 86,028,019 new) Heineken N.V. Shares with FEMSA for an equal number of newly issued Heineken Holding Shares. The equity consideration transferred is based on:
Heineken N.V. issued shares (based on listed share price of Heineken N.V. and Heineken Holding N.V. of respectively EUR35.18 and EUR30.82 as at 30 April 2010)
ASDI, number of shares 29,172,504 (based on listed share price of Heineken N.V. of EUR35.18 as at 30 April 2010).
The consideration paid in cash amounting to EUR51 million relates to the working capital adjustment for the period between 1 January and 30 April 2010 as agreed in the Share Exchange Agreement.
Between Heineken and FEMSA certain indemnifications were agreed on, that primarily relate to tax and legal matters. Upon acquisition the indemnification asset amounts to EUR134 million, this asset will subsequently change depending on the corresponding liabilities and amounts to EUR145 million as at 31 December 2010. Indemnification assets are recognised as an asset of the acquirer at the same time and on the same basis as the indemnified items are recognised as a liability. The indemnification asset is considered an included element of the business combination. Mexican contingencies will be fully indemnified by FEMSA, Brazilian contingencies, however, are covered by FEMSA for its former share of approximately 83 per cent. Items will only qualify for indemnification if they have not been previously disclosed to Heineken, exceed the floor of USD50 million individually, relate to the period prior to acquisition and the total indemnification does not exceed the cap. The indemnification is maximised at USD500 million, excluding items attributable to Brazilian tax matters.
The fair value of the previously held 1722.5 per cent in Cervejarias Kaiser (Kaiser)BraNa is recognised at EUR21 million. The remeasurementrevaluation to fair value of the Group’s existing 1722.5 per cent interest in KaiserBraNa resulted in a net lossprofit of EUR4EUR20 million that has been recognised in profit or loss underthe income statement in other net finance (expenses)/income.income (note12).
Non-controlling interests are recognised based on their proportional interest in the recognised amounts of the assets and liabilities of the beer operations acquired fromBraNa of FEMSA of EUR20EUR3 million.
In the net assets acquired Heineken noted trade receivables with a fair value of EUR319 million. The gross amount is EUR365 million, of which EUR46 million is considered doubtful.
As part of business combination accounting contingent liabilities amounting to EUR14 million have been recognised mainly relating to change in control provisions in existing contracts and certain onerous contracts. The cash-outflow is expected between one to seven years.
Acquisition related costs of EUR24 millionare not material and have been recognised in profit or lossthe income statement for the period ended 31 December 2010.
Provisional accounting other acquisitions in 2010
During 2010 several adjustments were made to provisional accounting for acquisitions in the UK and Ireland. Total impact resulted in a decrease of goodwill of EUR32 million, of which EUR37 million was received in cash. Goodwill decreased by EUR37 million due to the Scottish & Newcastle acquisition of 2008 and is caused by adjustments made to the debt allocation agreement with Carlsberg Group.
For the other acquisitions in 2009, related to Universal Beverages Limited (UBL Cider Mill) in the UK, the goodwill increased by approximately EUR9 million, these adjustments were made within the window period of one year. The remainder goodwill decrease of EUR4 million relates to the finalisation of the contingent consideration of Nash Beverages Ltd. in Ireland.
Financial statements | Notes to the consolidated financial statementscontinued
6. Acquisitions and disposals of subsidiaries and non-controlling interests continued2012.
Acquisition of non-controlling interest
On 12 May 2010, HeinekenAs part of the unwinding of their partnerships in Kazakhstan and Serbia with Efes Breweries International N.V. (EBI) HEINEKEN acquired an additional interest in Commonwealth Brewery Limited (CBL) of 47 per cent and Burns House Limited (BHL) of 60 per cent , increasing its ownership to 100 per cent in both entities. Before this acquisition, Heineken International already had control in CBL / BHL. On 17 November 2010, Heineken International acquired an additional 5 per cent interest in Brasseries et Limonaderies du Rwanda S.A., increasing its ownership to 75 per cent . During the year, several other non-controlling interests were bought out, which is regular business practice within the Heineken Group. The cash paid for all the acquired non-controlling interests during 2010 amounts to EUR92 million, decreased our non-controlling interests by EUR34 million and resulted in a net decrease of our retained earnings of EUR58 million.
Due to non-disclosure agreements, Heineken cannot provide the consideration paid on an individual level. Considering the overall amounts disclosed above we deem these to be individually as well as aggregated to be immaterial in nature.
Disposals
On 10 February 2010 and 13 April 2010, Heineken N.V. transferred in total a 78.3EBI’s 28 per cent stake in PT Multi Bintang Indonesia (MBI)the Serbian operations and Heineken’s 87since 27 December wholly owns Central Europe Beverages (CEB). On 8 January 2013 HEINEKEN sold its 28 per cent stake in Grande Brasserie de Nouvelle-Caledonie S.A. (GBNC)Efes Kazakhstan which is reported in the subsequent events note 37. Selling the cross-holdings to its joint venture Asia Pacific Breweries (APB). Heineken retainseach other will result in a directnet consideration to be paid by EBI to HEINEKEN of USD161 million.
Disposals
Disposal of our minority shareholding in MBICervecería Nacional Dominicana S.A.
On 16 April 2012 HEINEKEN sold its 9.3 per cent minority shareholding in Cervecería Nacional Dominicana S.A. (‘CND’) in the Dominican Republic for USD237 million, ultimately to AmBev Brasil Bebidas S.A. (‘AmBev Brasil’), a subsidiary of 6.8 per cent. As a resultCompanhia de Bebidas das Américas – AmBev.
A pre-tax EUR175 million gain on disposal of the transaction a gain of EUR157 million before tax has been recognised inavailable for sale investment was recorded under other income including the remeasurement to fair value of the Group’s remaining 6.8 per cent share amounting to EUR29 million. The sale price of this transaction was EUR265 million.
Other disposals during 2010 include TBS Waverley in the UK and certain smaller entities in the Caribbean. Due to competitive sensitivity and the non-disclosure agreements with the parties involved, the disposal prices are not individually disclosed.
The disposals had the following effect on Heineken’s assets and liabilities on disposal date:
| ||||
| ||||
| ||||
| ||||
| ||||
| ||||
| ||||
| ||||
| ||||
| ||||
| ||||
| ||||
| ||||
| ||||
| ||||
| ||||
| ||||
| ||||
| ||||
| ||||
| ||||
| ||||
| ||||
Financial statements | Notes to the consolidated financial statementscontinued
net finance income.
7. Assets and liabilities (or disposal groups) classified as held for sale
Other assets classified as held for sale represent landrepresent:
Our associate in Efes Kazakhstan. The transaction to sell our stake in Kazakhstan closed on 8 January 2013.
HEINEKEN’s share in the Chinese joint venture Jiangsu Dafuhao Breweries Co. Ltd. resulting from the acquisition of APIPL/APB. The joint venture was included as available for sale in the opening balance sheet of this acquisition. The sale of our share in Jiangsu Dafuhao Breweries has been completed on 9 January 2013.
Assets and buildingsliabilities following the commitment of Heineken to a planHEINEKEN to sell certain land and buildings. Effortsour wholly-owned subsidiary Pago International GmbH to sell these assets have commenced and areEches-Granini Group. The transaction is expected to be completed during 2011.close in the first quarter of 2013.
Assets and liabilities classified as held for sale
In millions of EUR | 2010 | 2009 | ||||||
Current assets | — | 39 | ||||||
Non-current assets | 6 | 70 | ||||||
| 6 | 109 | |||||||
In millions of EUR | 2010 | 2009 | 2012 | 2011 | ||||||||||||
Current assets | 38 | — | ||||||||||||||
Non-current assets | 86 | 99 | ||||||||||||||
Current liabilities | — | 57 | (36 | ) | — | |||||||||||
Non-current liabilities | — | 8 | (3 | ) | — | |||||||||||
| 85 | 99 | |||||||||||||||
| — | 65 |
|
| |||||||||||||
8. Other income
In millions of EUR | 2010 | 2009 | 2012 | 2011 | ||||||||||||
Net gain on sale of property, plant & equipment | 37 | 39 | 22 | 35 | ||||||||||||
Net gain on sale of Intangible assets | 13 | — | ||||||||||||||
Net gain on sale of intangible assets | 2 | 24 | ||||||||||||||
Net gain on sale of subsidiaries, joint ventures and associates | 189 | 2 | 1,486 | 5 | ||||||||||||
| 1,510 | 64 | |||||||||||||||
| 239 | 41 |
|
| |||||||||||||
Financial statements | NotesIncluded in other income is the fair value gain of HEINEKEN’s previously held equity interest in APB amounting to the consolidated financial statementscontinuedEUR1,486 million (refer to note 6).
9. Raw materials, consumables and services
In millions of EUR | 2010 | 2009 | 2012 | 2011 | ||||||||||||
Raw materials | 1,474 | 1,140 | 1,892 | 1,576 | ||||||||||||
Non-returnable packaging | 1,863 | 1,739 | 2,376 | 2,075 | ||||||||||||
Goods for resale | 1,655 | 2,253 | 1,616 | 1,498 | ||||||||||||
Inventory movements | (8 | ) | (5 | ) | (85 | ) | (8 | ) | ||||||||
Marketing and selling expenses | 2,072 | 1,664 | 2,250 | 2,186 | ||||||||||||
Transport expenses | 979 | 934 | 1,029 | 1,056 | ||||||||||||
Energy and water | 442 | 319 | 562 | 525 | ||||||||||||
Repair and maintenance | 375 | 299 | 458 | 417 | ||||||||||||
Other expenses | 1,439 | 1,307 | 1,751 | 1,641 | ||||||||||||
| 11,849 | 10,966 | |||||||||||||||
| 10,291 | 9,650 |
|
| |||||||||||||
Other expenses include rentals of EUR224EUR264 million (2009: 184(2011: EUR241 million), consultant expenses of EUR126EUR191 million (2009: EUR109(2011: EUR166 million), telecom and office automation of EUR156EUR179 million (2009: EUR145(2011: EUR159 million), travel expenses of EUR155 million (2011: EUR137 million) and other fixed expenses of EUR933EUR962 million (2009: EUR820(2011: EUR938 million).
10. Personnel expenses
In millions of EUR | Note | 2010 | 2009 | Note | 2012 | 2011 | ||||||||||||||||||
Wages and salaries | 1,787 | 1,554 | 2,078 | 1,891 | ||||||||||||||||||||
Compulsory social security contributions | 317 | 287 | 352 | 333 | ||||||||||||||||||||
Contributions to defined contribution plans | 16 | 17 | 39 | 24 | ||||||||||||||||||||
Expenses related to defined benefit plans | 28 | 104 | 107 | 28 | 28 | 56 | ||||||||||||||||||
Increase in other long-term employee benefits | 9 | 7 | 11 | 11 | ||||||||||||||||||||
Equity-settled share-based payment plan | 29 | 15 | 10 | 29 | 12 | 11 | ||||||||||||||||||
Other personnel expenses | 432 | 397 | 517 | 512 | ||||||||||||||||||||
| 3,037 | 2,838 | |||||||||||||||||||||||
| 2,680 | 2,379 |
|
| |||||||||||||||||||||
The increaseRestructuring costs related to the restructuring of wholesale operations across Western Europe are included in other personnel expenses for an amount of EUR35 million is mainly duemillion. These costs are primarily related to the acquisition of the beer operations of FEMSA for (EUR70 million)Netherlands and partly offset by lower amounts paid (EUR35 million) for restructurings compared to 2009.Italy.
The average number of full-time equivalent (FTE) employees during the year was:
In millions of EUR | 2010 | 2009 | ||||||
The Netherlands | 3,861 | 3,938 | ||||||
Other Western Europe | 15,751 | 17,557 | ||||||
Central and Eastern Europe | 18,043 | 20,253 | ||||||
The Americas | 17,164 | 1,698 | ||||||
Africa and the Middle East | 10,607 | 10,882 | ||||||
Asia Pacific | 304 | 973 | ||||||
Heineken N.V. and subsidiaries | 65,730 | 55,301 | ||||||
Financial statements | Notes to the consolidated financial statementscontinued
| 2012 | 2011* | |||||||
The Netherlands | 4,053 | 3,991 | ||||||
Other Western Europe | 14,410 | 14,749 | ||||||
Central and Eastern Europe | 16,835 | 17,424 | ||||||
The Americas | 25,035 | 23,906 | ||||||
Africa and the Middle East | 14,604 | 11,396 | ||||||
Asia Pacific | 1,254 | 279 | ||||||
Heineken N.V. and subsidiaries | 76,191 | 71,745 | ||||||
|
|
|
| |||||
| * | Updated |
11. Amortisation, depreciation and impairments
In millions of EUR | Note | 2010 | 2009 | Note | 2012 | 2011 | ||||||||||||||||||
Property, plant & equipment | 14 | 907 | 931 | 14 | 1,061 | 936 | ||||||||||||||||||
Intangible assets | 15 | 208 | 152 | 15 | 254 | 232 | ||||||||||||||||||
Impairment on available for sale assets | 3 | — | ||||||||||||||||||||||
Impairment on available-for-sale assets | 1 | — | ||||||||||||||||||||||
| 1,316 | 1,168 | |||||||||||||||||||||||
| 1,118 | 1,083 |
|
| |||||||||||||||||||||
12. Net finance income and expenses
Recognised in profit or loss
In millions of EUR | 2010 | 2009 | 2012 | 2011 | ||||||||||||
Interest income | 100 | 90 | 62 | 70 | ||||||||||||
Interest expenses | (590 | ) | (633 | ) | (551 | ) | (494 | ) | ||||||||
Dividend income on available-for-sale investments | 1 | 1 | 2 | 2 | ||||||||||||
Dividend income on investments held for trading | 7 | 10 | 23 | 11 | ||||||||||||
Net gain/(loss) on disposal of available-for-sale investments | — | 12 | 192 | 1 | ||||||||||||
Net change in fair value of derivatives | (75 | ) | (7 | ) | (7 | ) | 96 | |||||||||
Net foreign exchange gain/(loss) | 62 | (47 | ) | 15 | (107 | ) | ||||||||||
Impairment losses on available-for-sale investments | (4 | ) | — | — | — | |||||||||||
Unwinding discount on provisions | (7 | ) | (3 | ) | (7 | ) | (7 | ) | ||||||||
Other net financial income/(expenses) | (3 | ) | 248 | 1 | (2 | ) | ||||||||||
Other net finance income/(expenses) | (19 | ) | 214 | 219 | (6 | ) | ||||||||||
|
| |||||||||||||||
Net finance expenses | (509 | ) | (329 | ) | ||||||||||||
Net finance income/(expenses) | (270 | ) | (430 | ) | ||||||||||||
|
| |||||||||||||||
Included in other net finance income on the line Net gain/(loss) on disposal of available-for-sale investments are the sale of our 9.3 per cent minority shareholding in Cervecería Nacional Dominicana S.A. in the Dominican Republic leading to a gain on disposal of the available-for-sale investment of pre-tax EUR175 million and the revaluation of HEINEKEN’s existing 22.5 per cent interest in Brasserie d’Haiti of EUR20 million.
Recognised in other comprehensive income
In millions of EUR | 2010 | 2009 | ||||||
Foreign currency translation differences for foreign operations | 400 | 112 | ||||||
Effective portion of changes in fair value of cash flow hedges | 43 | (90 | ) | |||||
Effective portion of cash flow hedges transferred to profit or loss | 45 | 88 | ||||||
Ineffective portion of cash flow hedges transferred to profit or loss | 9 | — | ||||||
Net change in fair value of available-for-sale investments | 11 | 26 | ||||||
Net change in fair value available-for-sale investments transferred to profit or loss | (17 | ) | (12 | ) | ||||
Share of other comprehensive income of associates/joint ventures | (29 | ) | 22 | |||||
| 462 | 146 | |||||||
Recognised in: | ||||||||
Fair value reserve | (10 | ) | 12 | |||||
Hedging reserve | 97 | (2 | ) | |||||
Translation reserve | 375 | 136 | ||||||
| 462 | 146 | |||||||
In 2009 the other net financial income/(expense) contained a total (net) book gain of EUR248 million relating to the purchase of Globe debt (Scottish & Newcastle Pub Enterprise).
The increase of the impact of foreign currency translation differences for foreign operations in other comprehensive income is mainly due to the impact of revaluation of the British pound on the net assets and goodwill measured in British pounds of total EUR98 million. Remaining impact is related to the appreciation of the Russian ruble, Polish zloty, Swiss franc and the Chilean peso, partly offset by the devaluation of the Mexican peso.
Financial statements | Notes to the consolidated financial statementscontinued
In millions of EUR | 2012 | 2011 | ||||||
Foreign currency translation differences for foreign operations | 45 | (493 | ) | |||||
Effective portion of changes in fair value of cash flow hedges | 14 | (21 | ) | |||||
Effective portion of cash flow hedges transferred to profit or loss | 41 | (11 | ) | |||||
Ineffective portion of cash flow hedges transferred to profit or loss | — | — | ||||||
Net change in fair value of available-for-sale investments | 135 | 71 | ||||||
Net change in fair value available-for-sale investments transferred to profit or loss | (148 | ) | (1 | ) | ||||
Actuarial (gains) and losses | (439 | ) | (93 | ) | ||||
Share of other comprehensive income of associates/joint ventures | (1 | ) | (5 | ) | ||||
| (353 | ) | (553 | ) | |||||
|
|
|
| |||||
Recognised in: | ||||||||
Fair value reserve | (9 | ) | 69 | |||||
Hedging reserve | 58 | (42 | ) | |||||
Translation reserve | 48 | (482 | ) | |||||
Other | (450 | ) | (98 | ) | ||||
| (353 | ) | (553 | ) | |||||
|
|
|
| |||||
13. Income tax expense
Recognised in profit or lossthe income statement
In millions of EUR | 2010 | 2009 | 2012 | 2011 | ||||||||||||
Current tax expense | ||||||||||||||||
Current year | 498 | 360 | 639 | 502 | ||||||||||||
Under/(over) provided in prior years | 52 | 8 | (6 | ) | (26 | ) | ||||||||||
| 550 | 368 | |||||||||||||||
| 633 | 476 | |||||||||||||||
Deferred tax expense | ||||||||||||||||
Origination and reversal of temporary differences | (19 | ) | (84 | ) | (90 | ) | 17 | |||||||||
Previously unrecognised deductible temporary differences | (2 | ) | — | (28 | ) | (9 | ) | |||||||||
Changes in tax rate | 3 | — | 4 | 1 | ||||||||||||
Utilisation/(benefit) of tax losses recognised | (39 | ) | 10 | (6 | ) | (19 | ) | |||||||||
Under/(over) provided in prior years | (94 | ) | (8 | ) | 12 | (1 | ) | |||||||||
| (151 | ) | (82 | ) | (108 | ) | (11 | ) | |||||||||
Total income tax expense in the income statement | 525 | 465 | ||||||||||||||
|
| |||||||||||||||
Total income tax expense in profit or loss | 399 | 286 | ||||||||||||||
Reconciliation of the effective tax rate
In millions of EUR | 2010 | 2009 | 2012 | 2011 | ||||||||||||
Profit before income tax | 1,967 | 1,428 | 3,634 | 2,025 | ||||||||||||
Share of net profit of associates and joint ventures and impairments thereof | (193 | ) | (127 | ) | (213 | ) | (240 | ) | ||||||||
Profit before income tax excluding share of profit of associates and joint ventures (including impairments thereof) | 3,421 | 1,785 | ||||||||||||||
|
| |||||||||||||||
Profit before income tax excluding share of profit of associates and joint ventures (inclusive impairments thereof) | 1,774 | 1,301 | ||||||||||||||
| % | 2010 | % | 2009 | % | 2012 | % | 2011 | |||||||||||||||||||||||||
Income tax using the Company’s domestic tax rate | 25.5 | 452 | 25.5 | 332 | 25.0 | 855 | 25.0 | 446 | ||||||||||||||||||||||||
Effect of tax rates in foreign jurisdictions | 1.9 | 34 | 1.6 | 21 | 1.8 | 63 | 3.5 | 62 | ||||||||||||||||||||||||
Effect of non-deductible expenses | 4.1 | 72 | 2.8 | 36 | 1.9 | 64 | 3.2 | 58 | ||||||||||||||||||||||||
Effect of tax incentives and exempt income | (8.2 | ) | (146 | ) | (8.2 | ) | (107 | ) | (13.8 | ) | (472 | ) | (6.0 | ) | (107 | ) | ||||||||||||||||
Recognition of previously unrecognised temporary differences | (0.1 | ) | (2 | ) | (0.1 | ) | (1 | ) | (0.8 | ) | (28 | ) | (0.5 | ) | (9 | ) | ||||||||||||||||
Utilisation or recognition of previously unrecognised tax losses | (1.2 | ) | (21 | ) | (0.5 | ) | (7 | ) | (0.5 | ) | (17 | ) | (0.3 | ) | (5 | ) | ||||||||||||||||
Unrecognised current year tax losses | 0.8 | 15 | 0.9 | 12 | 0.7 | 25 | 1.0 | 18 | ||||||||||||||||||||||||
Effect of changes in tax rate | 0.2 | 3 | — | — | 0.1 | 4 | 0.1 | 1 | ||||||||||||||||||||||||
Withholding taxes | 1.4 | 25 | 1.2 | 16 | 0.8 | 27 | 1.5 | 26 | ||||||||||||||||||||||||
Under/(over) provided in prior years | (2.4 | ) | (42 | ) | — | — | 0.2 | 6 | (1.5 | ) | (27 | ) | ||||||||||||||||||||
Other reconciling items | 0.5 | 9 | (1.2 | ) | (16 | ) | (0.1 | ) | (2 | ) | 0.1 | 2 | ||||||||||||||||||||
| 15.3 | 525 | 26.1 | 465 | |||||||||||||||||||||||||||||
| 22.5 | 399 | 22.0 | 286 |
|
|
|
| |||||||||||||||||||||||||
The effectivelower reported tax rate in 2012 of the Company increased from 2215.3 per cent to 22.5(2011: 26.1 per cent. The 2009 rate included the effects of the tax-exempt book gain on the purchase of the Globe Bonds, whilst the 2010 rate includes the effects of the (partly) tax-exempt gain on the sale of the shares in MBI, GBNC and Waverley TBS (book gain EUR199 million), and exceptional tax items in 2010 related to the finalisation of the Globe transactions in the UK and various other settlements withcent) can be explained by the tax authorities (tax effect EUR52 million).exempt remeasurement of HEINEKEN’s PHEI in APIPL/APB, prior to consolidation.
Income tax recognised in other comprehensive income
In millions of EUR | Note | 2010 | 2009 | |||||||||
Changes in fair value | (5 | ) | 2 | |||||||||
Changes in hedging reserve | (38 | ) | (4 | ) | ||||||||
| 18 | (43 | ) | (2 | ) | ||||||||
Financial statements | Notes to the consolidated financial statementscontinued
In millions of EUR | Note | 2012 | 2011 | |||||||||
Changes in fair value | (24 | ) | — | |||||||||
Changes in hedging reserve | (18 | ) | 13 | |||||||||
Changes in translation reserve | (22 | ) | 11 | |||||||||
Other | 123 | 16 | ||||||||||
| 24 | 59 | 40 | ||||||||||
|
|
|
| |||||||||
14. Property, plant and equipment
In millions of EUR | Note | Land and buildings | Plant and equipment | Other fixed assets | Under construction | Total | ||||||||||||||||||
Cost | ||||||||||||||||||||||||
Balance as at 1 January 2009 | 3,381 | 5,169 | 3,459 | 457 | 12,466 | |||||||||||||||||||
Changes in consolidation | 15 | 91 | (9 | ) | 3 | 100 | ||||||||||||||||||
Purchases | 45 | 110 | 232 | 291 | 678 | |||||||||||||||||||
Transfer of completed projects under construction | 89 | 199 | 78 | (366 | ) | — | ||||||||||||||||||
Transfer to/(from) assets classified as held for sale | 19 | (39 | ) | (39 | ) | (3 | ) | (62 | ) | |||||||||||||||
Disposals | (94 | ) | (122 | ) | (204 | ) | (68 | ) | (488 | ) | ||||||||||||||
Effect of movements in exchange rates | 5 | (71 | ) | 1 | 1 | (64 | ) | |||||||||||||||||
Balance as at 31 December 2009 | 3,460 | 5,337 | 3,518 | 315 | 12,630 | |||||||||||||||||||
Balance as at 1 January 2010 | 3,460 | 5,337 | 3,518 | 315 | 12,630 | |||||||||||||||||||
Changes in consolidation | 6 | 745 | 635 | 253 | 72 | 1,705 | ||||||||||||||||||
Purchases | 38 | 82 | 249 | 279 | 648 | |||||||||||||||||||
Transfer of completed projects under construction | 106 | 142 | 104 | (352 | ) | — | ||||||||||||||||||
Transfer to/(from) assets classified as held for sale | 26 | 34 | 39 | 2 | 101 | |||||||||||||||||||
Disposals | (49 | ) | (130 | ) | (285 | ) | (1 | ) | (465 | ) | ||||||||||||||
Effect of movements in exchange rates | 71 | 107 | 61 | 15 | 254 | |||||||||||||||||||
Balance as at 31 December 2010 | 4,397 | 6,207 | 3,939 | 330 | 14,873 | |||||||||||||||||||
Depreciation and impairment losses | ||||||||||||||||||||||||
Balance as at 1 January 2009 | (1,282 | ) | (2,720 | ) | (2,150 | ) | — | (6,152 | ) | |||||||||||||||
Changes in consolidation | 2 | — | 3 | — | 5 | |||||||||||||||||||
Depreciation charge for the year | 11 | (117 | ) | (286 | ) | (365 | ) | — | (768 | ) | ||||||||||||||
Impairment losses | 11 | (81 | ) | (95 | ) | (5 | ) | — | (181 | ) | ||||||||||||||
Reversal impairment losses | 11 | 1 | 16 | 1 | — | 18 | ||||||||||||||||||
Transfer (to)/from assets classified as held for sale | 8 | 22 | 19 | — | 49 | |||||||||||||||||||
Disposals | 62 | 169 | 166 | — | 397 | |||||||||||||||||||
Effect of movements in exchange rates | 2 | 19 | (2 | ) | — | 19 | ||||||||||||||||||
Balance as at 31 December 2009 | (1,405 | ) | (2,875 | ) | (2,333 | ) | — | (6,613 | ) | |||||||||||||||
Balance as at 1 January 2010 | (1,405 | ) | (2,875 | ) | (2,333 | ) | — | (6,613 | ) | |||||||||||||||
Changes in consolidation | 6 | 12 | 31 | 35 | — | 78 | ||||||||||||||||||
Depreciation charge for the year | 11 | (117 | ) | (342 | ) | (434 | ) | — | (893 | ) | ||||||||||||||
Impairment losses | 11 | (15 | ) | (19 | ) | (6 | ) | — | (40 | ) | ||||||||||||||
Reversal impairment losses | 11 | 4 | 21 | 1 | — | 26 | ||||||||||||||||||
Transfer (to)/from assets classified as held for sale | (6 | ) | (14 | ) | (23 | ) | — | (43 | ) | |||||||||||||||
Disposals | 37 | 128 | 263 | — | 428 | |||||||||||||||||||
Effect of movements in exchange rates | (36 | ) | (54 | ) | (39 | ) | — | (129 | ) | |||||||||||||||
Balance as at 31 December 2010 | (1,526 | ) | (3,124 | ) | (2,536 | ) | — | (7,186 | ) | |||||||||||||||
Carrying amount | ||||||||||||||||||||||||
As at 1 January 2009 | 2,099 | 2,449 | 1,309 | 457 | 6,314 | |||||||||||||||||||
As at 31 December 2009 | 2,055 | 2,462 | 1,185 | 315 | 6,017 | |||||||||||||||||||
As at 1 January 2010 | 2,055 | 2,462 | 1,185 | 315 | 6,017 | |||||||||||||||||||
As at 31 December 2010 | 2,871 | 3,083 | 1,403 | 330 | 7,687 | |||||||||||||||||||
Financial statements | Notes to the consolidated financial statementscontinued
In millions of EUR | Note | Land and buildings | Plant and equipment | Other fixed assets | Under construction | Total | ||||||||||||||||||
Cost | ||||||||||||||||||||||||
Balance as at 1 January 2011 | 4,397 | 6,207 | 3,939 | 330 | 14,873 | |||||||||||||||||||
Changes in consolidation | 505 | 89 | (31 | ) | 3 | 566 | ||||||||||||||||||
Purchases | 55 | 99 | 320 | 326 | 800 | |||||||||||||||||||
Transfer of completed projects under construction | 82 | 90 | 150 | (322 | ) | — | ||||||||||||||||||
Transfer (to)/from assets classified as held for sale | (65 | ) | — | — | — | (65 | ) | |||||||||||||||||
Disposals | (35 | ) | (92 | ) | (255 | ) | (6 | ) | (388 | ) | ||||||||||||||
Effect of hyperinflation | 2 | 11 | 2 | 2 | 17 | |||||||||||||||||||
Effect of movements in exchange rates | (71 | ) | (127 | ) | (73 | ) | (1 | ) | (272 | ) | ||||||||||||||
Balance as at 31 December 2011 | 4,870 | 6,277 | 4,052 | 332 | 15,531 | |||||||||||||||||||
|
|
|
|
|
|
|
|
|
| |||||||||||||||
Balance as at 1 January 2012 | 4,870 | 6,277 | 4,052 | 332 | 15,531 | |||||||||||||||||||
Changes in consolidation | 6 | 245 | 385 | 91 | 77 | 798 | ||||||||||||||||||
Purchases | 38 | 105 | 365 | 662 | 1,170 | |||||||||||||||||||
Transfer of completed projects under construction and other | 58 | 235 | 270 | (540 | ) | 23 | ||||||||||||||||||
Transfer (to)/from assets classified as held for sale | (37 | ) | (21 | ) | (24 | ) | — | (82 | ) | |||||||||||||||
Disposals | (19 | ) | (81 | ) | (284 | ) | (1 | ) | (385 | ) | ||||||||||||||
Effect of hyperinflation | 1 | 4 | 1 | — | 6 | |||||||||||||||||||
Effect of movements in exchange rates | 59 | 23 | 23 | (4 | ) | 101 | ||||||||||||||||||
Balance as at 31 December 2012 | 5,215 | 6,927 | 4,494 | 526 | 17,162 | |||||||||||||||||||
|
|
|
|
|
|
|
|
|
| |||||||||||||||
Depreciation and impairment losses | ||||||||||||||||||||||||
Balance as at 1 January 2011 | (1,526 | ) | (3,124 | ) | (2,536 | ) | — | (7,186 | ) | |||||||||||||||
Changes in consolidation | — | 4 | 14 | — | 18 | |||||||||||||||||||
Depreciation charge for the year | 11 | (128 | ) | (356 | ) | (452 | ) | — | (936 | ) | ||||||||||||||
Impairment losses | 11 | — | — | (8 | ) | — | (8 | ) | ||||||||||||||||
Reversal impairment losses | 11 | — | 3 | 5 | — | 8 | ||||||||||||||||||
Transfer to/(from) assets classified as held for sale | 3 | — | — | — | 3 | |||||||||||||||||||
Disposals | 18 | 92 | 224 | — | 334 | |||||||||||||||||||
Effect of movements in exchange rates | 11 | 42 | 43 | — | 96 | |||||||||||||||||||
Balance as at 31 December 2011 | (1,622 | ) | (3,339 | ) | (2,710 | ) | — | (7,671 | ) | |||||||||||||||
Balance as at 1 January 2012 | (1,622 | ) | (3,339 | ) | (2,710 | ) | — | (7,671 | ) | |||||||||||||||
|
|
|
|
|
|
|
|
|
| |||||||||||||||
Changes in consolidation | 6 | — | (2 | ) | (1 | ) | — | (3 | ) | |||||||||||||||
Depreciation charge for the year | 11 | (142 | ) | (399 | ) | (476 | ) | — | (1,017 | ) | ||||||||||||||
Impairment losses | 11 | (10 | ) | (36 | ) | (19 | ) | — | (65 | ) | ||||||||||||||
Reversal impairment losses | 11 | 4 | 12 | 5 | — | 21 | ||||||||||||||||||
Transfer to/(from) assets classified as held for sale | 26 | 15 | 20 | — | 61 | |||||||||||||||||||
Disposals | 5 | 80 | 261 | — | 346 | |||||||||||||||||||
Effect of movements in exchange rates | (14 | ) | (9 | ) | (19 | ) | — | (42 | ) | |||||||||||||||
Balance as at 31 December 2012 | (1,753 | ) | (3,678 | ) | (2,939 | ) | — | (8,370 | ) | |||||||||||||||
|
|
|
|
|
|
|
|
|
| |||||||||||||||
Carrying amount | ||||||||||||||||||||||||
As at 1 January 2011 | 2,871 | 3,083 | 1,403 | 330 | 7,687 | |||||||||||||||||||
|
|
|
|
|
|
|
|
|
| |||||||||||||||
As at 31 December 2011 | 3,248 | 2,938 | 1,342 | 332 | 7,860 | |||||||||||||||||||
|
|
|
|
|
|
|
|
|
| |||||||||||||||
As at 1 January 2012 | 3,248 | 2,938 | 1,342 | 332 | 7,860 | |||||||||||||||||||
|
|
|
|
|
|
|
|
|
| |||||||||||||||
As at 31 December 2012 | 3,462 | 3,249 | 1,555 | 526 | 8,792 | |||||||||||||||||||
|
|
|
|
|
|
|
|
|
| |||||||||||||||
Impairment losses
In 20102012 a total impairment loss of EUR40EUR65 million (2009: EUR181(2011: EUR8 million) was charged to profit or loss. These impairment losses included EUR20 million in Serbia. Management performed an impairment of assets analysis after identifying a triggering event relating to the then current market conditions. The remaining impairments mainly relate to restructuring in Belgium, Egypt, Italy and Austria.
14. Property, plant and equipment continuedincome statement.
Financial lease assets
The Group leases PP&EP, P & E under a number of finance lease agreements. At 31 December 20102012 the net carrying amount of leased property, plant and equipmentP,P & E was EUR95EUR39 million (2009: EUR108(2011: EUR39 million). During the year, the Group acquired leased assets of EUR17EUR5 million (2009: EUR4(2011: EUR6 million).
Security to authorities
Property, plantCertain P, P & equipment EUR281E for EUR142 million (2009: EUR27(2011: EUR137 million) has been pledged to the authorities in a number of countries as security for the payment of taxation, particularly excise duties on beers, non-alcoholic beverages and spirits and import duties. IncreaseThis mainly relates to Brazil (see note 34).
Property, plant and equipment under construction
Property, plantP, P & equipmentE under construction mainly relates to expansion of the brewing capacity in, Mexico, theNigeria, Democratic Republic of Congo, UK, Russia, SpainVietnam and Nigeria.Russia.
Capitalised borrowing costs
During 20102012 no borrowing costs have been capitalised (2009:(2011: EUR nil).
Financial statements | Notes to the consolidated financial statementscontinued
15. Intangible assets
In millions of EUR | Note | Goodwill | Brands | Customer- related intangibles | Contract- based intangibles | Software, research and development and other | Total | |||||||||||||||||||||
Cost | ||||||||||||||||||||||||||||
Balance as at 1 January 2009 | 5,604 | 1,332 | 311 | 108 | 225 | 7,580 | ||||||||||||||||||||||
Changes in consolidation | 34 | 4 | 24 | 7 | 1 | 70 | ||||||||||||||||||||||
Purchases/internally developed | — | 9 | — | 19 | 71 | 99 | ||||||||||||||||||||||
Disposals | — | (7 | ) | — | — | (47 | ) | (54 | ) | |||||||||||||||||||
Transfers to assets held for sale | — | — | — | — | (2 | ) | (2 | ) | ||||||||||||||||||||
Effect of movements in exchange rates | 75 | 44 | 16 | (10 | ) | 11 | 136 | |||||||||||||||||||||
Balance as at 31 December 2009 | 5,713 | 1,382 | 351 | 124 | 259 | 7,829 | ||||||||||||||||||||||
Balance as at 1 January 2010 | 5,713 | 1,382 | 351 | 124 | 259 | 7,829 | ||||||||||||||||||||||
Changes in consolidation | 6 | 1,748 | 924 | 943 | 86 | 39 | 3,740 | |||||||||||||||||||||
Purchased/internally developed | — | — | — | — | 56 | 56 | ||||||||||||||||||||||
Disposals | (1 | ) | (8 | ) | — | — | (16 | ) | (25 | ) | ||||||||||||||||||
Transfers to assets held for sale | — | — | — | — | 3 | 3 | ||||||||||||||||||||||
Effect of movements in exchange rates | 132 | 23 | (10 | ) | 12 | 3 | 160 | |||||||||||||||||||||
Balance as at 31 December 2010 | 7,592 | 2,321 | 1,284 | 222 | 344 | 11,763 | ||||||||||||||||||||||
Amortisation and impairment losses | ||||||||||||||||||||||||||||
Balance as at 1 January 2009 | (290 | ) | (68 | ) | (29 | ) | (11 | ) | (152 | ) | (550 | ) | ||||||||||||||||
Amortisation charge for the year | 11 | — | (36 | ) | (43 | ) | (18 | ) | (30 | ) | (127 | ) | ||||||||||||||||
Impairment losses | 11 | (1 | ) | (4 | ) | — | (20 | ) | — | (25 | ) | |||||||||||||||||
Disposals | (1 | ) | — | — | — | 5 | 4 | |||||||||||||||||||||
Transfers to assets held for sale | — | — | — | — | 2 | 2 | ||||||||||||||||||||||
Effect of movements in exchange rates | 12 | — | (2 | ) | (1 | ) | (7 | ) | 2 | |||||||||||||||||||
Balance as at 31 December 2009 | (280 | ) | (108 | ) | (74 | ) | (50 | ) | (182 | ) | (694 | ) | ||||||||||||||||
Financial statements | Notes to the consolidated financial statementscontinued
In millions of EUR | Note | Goodwill | Brands | Customer- related intangibles | Contract- based intangibles | Software, research and development and other | Total | |||||||||||||||||||||
Cost | ||||||||||||||||||||||||||||
Balance as at 1 January 2011 | 7,592 | 2,321 | 1,284 | 222 | 344 | 11,763 | ||||||||||||||||||||||
Changes in consolidation | 287 | 8 | 18 | 38 | — | 351 | ||||||||||||||||||||||
Purchases/internally developed | — | — | — | 6 | 50 | 56 | ||||||||||||||||||||||
Disposals | — | — | — | (91 | ) | (6 | ) | (97 | ) | |||||||||||||||||||
Effect of movements in exchange rates | (70 | ) | (57 | ) | (74 | ) | (13 | ) | (10 | ) | (224 | ) | ||||||||||||||||
Balance as at 31 December 2011 | 7,809 | 2,272 | 1,228 | 162 | 378 | 11,849 | ||||||||||||||||||||||
|
|
|
|
|
|
|
|
|
|
|
| |||||||||||||||||
Balance as at 1 January 2012 | 7,809 | 2,272 | 1,228 | 162 | 378 | 11,849 | ||||||||||||||||||||||
Changes in consolidation | 6 | 3,280 | 2,069 | 1,077 | 624 | 48 | 7,098 | |||||||||||||||||||||
Purchased/internally developed | — | — | — | 7 | 71 | 78 | ||||||||||||||||||||||
Disposals | (11 | ) | — | (5 | ) | (4 | ) | — | (20 | ) | ||||||||||||||||||
Transfers to assets held for sale | — | — | — | — | (1 | ) | (1 | ) | ||||||||||||||||||||
Effect of movements in exchange rates | (1 | ) | (9 | ) | 4 | (9 | ) | 6 | (9 | ) | ||||||||||||||||||
Balance as at 31 December 2012 | 11,077 | 4,332 | 2,304 | 780 | 502 | 18,995 | ||||||||||||||||||||||
|
|
|
|
|
|
|
|
|
|
|
| |||||||||||||||||
Amortisation and impairment losses | ||||||||||||||||||||||||||||
Balance as at 1 January 2011 | (279 | ) | (163 | ) | (163 | ) | (60 | ) | (208 | ) | (873 | ) | ||||||||||||||||
Changes in consolidation | — | — | — | 1 | (1 | ) | — | |||||||||||||||||||||
Amortisation charge for the year | 11 | — | (59 | ) | (110 | ) | (24 | ) | (36 | ) | (229 | ) | ||||||||||||||||
Impairment losses | 11 | — | (1 | ) | — | — | (2 | ) | (3 | ) | ||||||||||||||||||
Disposals | — | (1 | ) | — | 91 | 1 | 91 | |||||||||||||||||||||
Effect of movements in exchange rates | — | 3 | 5 | (11 | ) | 3 | — | |||||||||||||||||||||
Balance as at 31 December 2011 | (279 | ) | (221 | ) | (268 | ) | (3 | ) | (243 | ) | (1,014 | ) | ||||||||||||||||
|
|
|
|
|
|
|
|
|
|
|
| |||||||||||||||||
In millions of EUR | Note | Goodwill | Brands | Customer- related intangibles | Contract- based intangibles | Software, research and development and other | Total | Note | Goodwill | Brands | Customer- related intangibles | Contract- based intangibles | Software, research and development and other | Total | ||||||||||||||||||||||||||||||||||||||||||
Balance as at 1 January 2010 | (280 | ) | (108 | ) | (74 | ) | (50 | ) | (182 | ) | (694 | ) | ||||||||||||||||||||||||||||||||||||||||||||
Balance as at 1 January 2012 | (279 | ) | (221 | ) | (268 | ) | (3 | ) | (243 | ) | (1,014 | ) | ||||||||||||||||||||||||||||||||||||||||||||
Changes in consolidation | 6 | — | — | — | 25 | 3 | 28 | 6 | — | — | — | — | — | — | ||||||||||||||||||||||||||||||||||||||||||
Amortisation charge for the year | 11 | — | (54 | ) | (88 | ) | (16 | ) | (34 | ) | (192 | ) | 11 | — | (68 | ) | (121 | ) | (11 | ) | (47 | ) | (247 | ) | ||||||||||||||||||||||||||||||||
Impairment losses | 11 | — | (1 | ) | — | (15 | ) | — | (16 | ) | 11 | (7 | ) | — | — | — | — | (7 | ) | |||||||||||||||||||||||||||||||||||||
Disposals | 1 | 2 | — | — | 10 | 13 | — | — | — | — | — | — | ||||||||||||||||||||||||||||||||||||||||||||
Transfers to assets held for sale | — | — | — | — | (2 | ) | (2 | ) | — | — | — | — | 1 | 1 | ||||||||||||||||||||||||||||||||||||||||||
Effect of movements in exchange rates | — | (2 | ) | (1 | ) | (4 | ) | (3 | ) | (10 | ) | (11 | ) | — | 7 | (9 | ) | 10 | (3 | ) | ||||||||||||||||||||||||||||||||||||
Balance as at 31 December 2010 | (279 | ) | (163 | ) | (163 | ) | (60 | ) | (208 | ) | (873 | ) | ||||||||||||||||||||||||||||||||||||||||||||
Balance as at 31 December 2012 | (297 | ) | (289 | ) | (382 | ) | (23 | ) | (279 | ) | (1,270 | ) | ||||||||||||||||||||||||||||||||||||||||||||
|
|
|
|
|
| |||||||||||||||||||||||||||||||||||||||||||||||||||
Carrying amount | ||||||||||||||||||||||||||||||||||||||||||||||||||||||||
As at 1 January 2009 | 5,314 | 1,264 | 282 | 97 | 73 | 7,030 | ||||||||||||||||||||||||||||||||||||||||||||||||||
As at 1 January 2011 | 7,313 | 2,158 | 1,121 | 162 | 136 | 10,890 | ||||||||||||||||||||||||||||||||||||||||||||||||||
|
|
|
|
|
| |||||||||||||||||||||||||||||||||||||||||||||||||||
As at 31 December 2009 | 5,433 | 1,274 | 277 | 74 | 77 | 7,135 | ||||||||||||||||||||||||||||||||||||||||||||||||||
As at 31 December 2011 | 7,530 | 2,051 | 960 | 159 | 135 | 10,835 | ||||||||||||||||||||||||||||||||||||||||||||||||||
|
|
|
|
|
| |||||||||||||||||||||||||||||||||||||||||||||||||||
As at 1 January 2010 | 5,433 | 1,274 | 277 | 74 | 77 | 7,135 | ||||||||||||||||||||||||||||||||||||||||||||||||||
As at 1 January 2012 | 7,530 | 2,051 | 960 | 159 | 135 | 10,835 | ||||||||||||||||||||||||||||||||||||||||||||||||||
|
|
|
|
|
| |||||||||||||||||||||||||||||||||||||||||||||||||||
As at 31 December 2010 | 7,313 | 2,158 | 1,121 | 162 | 136 | 10,890 | ||||||||||||||||||||||||||||||||||||||||||||||||||
As at 31 December 2012 | 10,780 | 4,043 | 1,922 | 757 | 223 | 17,725 | ||||||||||||||||||||||||||||||||||||||||||||||||||
|
|
|
|
|
| |||||||||||||||||||||||||||||||||||||||||||||||||||
Brands, customer-related and customer-related/contract-based intangibles
The main brands capitalised are the brands acquired in 2008: Scottish & Newcastle (Fosters and Strongbow) and, 2010: Cervecería Cuauhtémoc Moctezuma (Dos Equis, Tecate and Sol) and 2012: Asia Pacific Breweries (Tiger, Anchor and Bintang). The main customer-related and contract-based intangibles were acquired in 20082010 and 2012 and are related to customer relationships with pubs or retailers in the UKMexico and Asia Pacific (constituting either by way of a contractual agreement or by way of non-contractual relations). The contract-based and customer related intangibles acquired as a result of the acquisition of the beer operations of FEMSA are a large part of the 2010 intangibles.reacquired rights.
Impairment tests for cash-generating units containing goodwill
For the purpose of impairment testing, goodwill in respect of Western Europe, Central and Eastern Europe (excluding Russia) and, the Americas (excluding Brazil) and Asia Pacific is allocated and monitored by management on a regional basis. In respect of less integrated Operating Companies ofsuch as Russia, Brazil, and Africa, and the Middle East and Head Office and Other, goodwill is allocated and monitored by management on an individual country basis.
The aggregate carrying amounts of goodwill allocated to each CGU are as follows:
In millions of EUR | 2010 | 2009 | 2012 | 2011 | ||||||||||||
Western Europe | 3,328 | 3,282 | 3,428 | 3,396 | ||||||||||||
Central and Eastern Europe (excluding Russia) | 1,494 | 1,467 | 1,445 | 1,394 | ||||||||||||
Russia | 105 | 99 | 106 | 102 | ||||||||||||
The Americas (excluding Brazil) | 2,031 | 349 | 1,778 | 1,743 | ||||||||||||
Brazil | 110 | — | 99 | 111 | ||||||||||||
Africa and the Middle East | 245 | 236 | ||||||||||||||
Africa and the Middle East (aggregated) | 507 | 528 | ||||||||||||||
Asia Pacific | 2,674 | — | ||||||||||||||
Head Office and Other | 743 | 256 | ||||||||||||||
| 10,780 | 7,530 | |||||||||||||||
| 7,313 | 5,433 |
|
| |||||||||||||
Throughout the year total goodwill mainly increased due to the acquisition of the FEMSA beer business in Mexico and BrazilAPIPL/APB, BraNa and net foreign currency gains.differences.
Goodwill is tested for impairments annually. The recoverable amounts of the CGUs are based on value-in-use calculations. Value in use was determined by discounting the future cash flows generated from the continuing use of the unit using a pre-tax discount rate.
The key assumptions used for the value in usevalue-in-use calculations are as follows:
Financial statements | Notes to the consolidated financial statementscontinued
15. Intangible assets continued
Cash flows were projected based on actual operating results and the three-year business plan. Cash flows for a further seven-year period were extrapolated using expected annual per country volume growth rates, which are based on external sources. Management believes that this forecasted period is justified due to the long-term nature of the beer business and past experiences.
The beer price growth per year after the first three-year period is assumed to be at specific per country expected annual long-term inflation, based on external sources.
Cash flows after the first ten-year period were extrapolated using a perpetual growth rate equal to the expected annual long-term inflation, in order to calculate the terminal recoverable amount.
A per CGU-specific pre-tax Weighted Average Cost of Capital (WACC) was applied in determining the recoverable amount of the units.
The values assigned to the key assumptions used for the value-in-usevalue in use calculations are as follows:
| Pre-tax WACC | Expected annual long- term inflation 2014-2020 | Expected volume growth rates 2014-2020 | Pre- tax WACC | Expected annual long- term inflation 2016-2022 | Expected volume growth rates 2016-2022 | |||||||||||||||||||
Western Europe | 9.6 | % | 1.7 | % | (0.2 | )% | 10.1 | % | 2.0 | % | (0.4 | )% | ||||||||||||
Central and Eastern Europe (excluding Russia) | 11.9 | % | 2.2 | % | 2.3 | % | 12.2 | % | 2.4 | % | 0.9 | % | ||||||||||||
Russia | 12.8 | % | 5.5 | % | 3.0 | % | 13.8 | % | 4.1 | % | 1.1 | % | ||||||||||||
The Americas (excluding Brazil) | 13.4 | % | 2.9 | % | 1.9 | % | 10.0 | % | 3.0 | % | 1.4 | % | ||||||||||||
Brazil | 19.3 | % | 4.1 | % | 2.9 | % | 12.6 | % | 4.1 | % | 2.9 | % | ||||||||||||
Africa and Middle East | 11.0-23.2 | % | 1.7-8.3 | % | 1.4-5.0 | % | ||||||||||||||||||
Africa and the Middle East | 13.7%-21.9 | % | 2.6%-8.6 | % | 1.5%-7.1 | % | ||||||||||||||||||
Asia Pacific | 15.7 | % | 5.3 | % | 5.4 | % | ||||||||||||||||||
Head Office and Other | 10.1%-13.2 | % | 2.0%-3.8 | % | (0.4)%-2.4 | % | ||||||||||||||||||
|
|
| ||||||||||||||||||||||
The values assigned to the key assumptions represent management’s assessment of future trends in the beer industry and are based on both external sources and internal sources (historical data). For Russia, management has decreased
HEINEKEN applied its methodology to determine CGU specific WACC’s to perform its annual impairment testing on a consistent basis. The trend and outcome of several WACC’s, for amongst others the perpetual growth rate by 3 per centWestern Europe CGU, turned out lower than expected based on the current economic climate and associated outlooks. HEINEKEN does not believe the risk profile in Western Europe is significantly lower than in prior years. HEINEKEN decided to reflect management’s best estimate, resulting in a perpetual growth rate of 2.5 per cent and a more conservative value in use.adjust the risk-free rates for this observation.
Sensitivity to changes in assumptions
TheLimited headroom is available in some of our CGU’s in the region Africa and Middle East, however the outcome of athe sensitivity analysis of a 100 basis points adverse change in key assumptions (lower growth rates orand higher discount rates respectively) didwould not result in a materially different outcome of the impairment test.
16. Investments in associates and joint ventures
HeinekenHEINEKEN has the following (direct and indirect) significant investments in associates and joint ventures:
| Country | Ownership 2010 | Ownership 2009 | ||||||||||
Joint ventures | ||||||||||||
Brau Holding International GmbH & Co KgaA | Germany | 49.9 | % | 49.9 | % | |||||||
Zagorka Brewery A.D. | Bulgaria | 49.0 | % | 49.0 | % | |||||||
Brewinvest S.A. | Greece | 50.0 | % | 50.0 | % | |||||||
Pivara Skopje A.D. | FYC Macedonia | 27.6 | % | 27.6 | % | |||||||
Brasseries du Congo S.A. | Congo | 50.0 | % | 50.0 | % | |||||||
Asia Pacific Investment Pte. Ltd. | Singapore | 50.0 | % | 50.0 | % | |||||||
Asia Pacific Breweries Ltd. | Singapore | 41.9 | % | 41.9 | % | |||||||
Compania Cervecerias Unidas S.A. | Chile | 33.1 | % | 33.1 | % | |||||||
Tempo Beverages Ltd. | Israel | 40.0 | % | 40.0 | % | |||||||
Heineken Lion Australia Pty. | Australia | 50.0 | % | 50.0 | % | |||||||
Sirocco FZCo | Dubai | 50.0 | % | 50.0 | % | |||||||
Diageo Heineken Namibia B.V. | Namibia | 50.0 | % | 50.0 | % | |||||||
United Breweries Limited | India | 37.5 | % | 37.5 | % | |||||||
Millenium Alcobev Private Limited* | India | 68.8 | % | 68.8 | % | |||||||
DHN Drinks (Pty) Ltd. | South Africa | 44.5 | % | 44.5 | % | |||||||
Financial statements | Notes to the consolidated financial statementscontinued
| Country | Ownership 2010 | Ownership 2009 | Country | Ownership 2012 | Ownership 2011 | |||||||||||||||||||
Joint ventures | ||||||||||||||||||||||||
Brau Holding International GmbH & Co KgaA | Germany | 49.9 | % | 49.9 | % | |||||||||||||||||||
Zagorka Brewery A.D. | Bulgaria | 49.4 | % | 49.4 | % | |||||||||||||||||||
Pivara Skopje A.D. | FYR Macedonia | 48.2 | % | 48.2 | % | |||||||||||||||||||
Brasseries du Congo S.A. | Congo | 50.0 | % | 50.0 | % | |||||||||||||||||||
Compania Cervecerias Unidas S.A. | Chile | 33.1 | % | 33.1 | % | |||||||||||||||||||
Tempo Beverages Ltd. | Israel | 40.0 | % | 40.0 | % | |||||||||||||||||||
Heineken Lion Australia Pty. | Australia | 50.0 | % | 50.0 | % | |||||||||||||||||||
Sirocco FZCo | Dubai | 50.0 | % | 50.0 | % | |||||||||||||||||||
Diageo Heineken Namibia B.V. | Namibia | 50.0 | % | 50.0 | % | |||||||||||||||||||
United Breweries Limited | India | 37.4 | % | 37.5 | % | |||||||||||||||||||
DHN Drinks (Pty) Ltd. | South Africa | 44.6 | % | 44.5 | % | |||||||||||||||||||
Sedibeng Brewery Pty Ltd.* | South Africa | 75.0 | % | 75.0 | % | South Africa | 75.0 | % | 75.0 | % | ||||||||||||||
UB Nizam Breweries Pvt. Ltd | Singapore | 50.0 | % | 0 | % | |||||||||||||||||||
UB Ajanta Breweries Pvt. Ltd | Singapore | 50.0 | % | 0 | % | |||||||||||||||||||
Asia Pacific Investment Pte. Ltd.*** | Singapore | — | 50.0 | % | ||||||||||||||||||||
Asia Pacific Breweries Ltd.*** | Singapore | — | 41.9 | % | ||||||||||||||||||||
Guinness Anchor Berhad **** | Malaysia | 25.2 | % | 10.7 | % | |||||||||||||||||||
Thai Asia Pacific Brewery **** | Thailand | 36.4 | % | 15.4 | % | |||||||||||||||||||
Associates | ||||||||||||||||||||||||
Cerveceria Costa Rica S.A. | Costa Rica | 25.0 | % | 25.0 | % | Costa Rica | 25.0 | % | 25.0 | % | ||||||||||||||
JSC FE Efes Karaganda Brewery | Kazakhstan | 28.0 | % | 28.0 | % | |||||||||||||||||||
JSC FE Efes Kazakhstan** | Kazakhstan | 28.0 | % | 28.0 | % | |||||||||||||||||||
|
| |||||||||||||||||||||||
| * |
| ** | This entity is classified as Held for Sale (see note 7). |
| *** | These entities are consolidated from 15 November 2012 following the APIPL/APB acquisition. |
| **** | The ownership percentages have changed following the APIPL/APB acquisition on 15 November 2012. |
Reporting date
The reporting date of the financial statements of all HeinekenHEINEKEN entities and joint ventures disclosed are the same as for the Company except for for:
(i) Asia Pacific Breweries Ltd., Heineken Lion Australia Pty. and Asia Pacific Investment Pte. LtdPty which havehas a 30 September reporting date (the APB results are included with a three-month delay in reporting), date;
(ii) DHN Drinks (Pty) Ltd. which has a 30 June reporting date, and date;
(iii) United Breweries Limited and Millenium Alcobev Private Limited which havehas a 31 March reporting date;
(iv) Guinness Anchor Berhad which has a 30 June reporting date; and
(v) Thai Asia Pacific Brewery which has a 30 September reporting date.
The results of (ii), (iii), (iv) and (iii)(v) have been adjusted to include numbers for the full financial year ended 31 December 2010.2012.
Shareholdings India
On 10 February 2010, Heineken acquired APB’s existing Indian investments: Asia Pacific Breweries Aurangabad Pte Ltd (‘APB Aurangabad’), currently named UB Ajanta Breweries, and Asia Pacific Breweries-Pearl Pte Ltd (‘APB Pearl’), currently named UB Nizam Breweries. The total acquisition price for 100 per cent of the shares amounted to EUR27 million. We deemed these acquisitions individually to be immaterial in respect of IFRS disclosure requirements. If the acquisitions had occurred on 1 January 2010, management estimates that consolidated results from operating activities and consolidated revenue would not have been materially different. On 27 October 2010 Heineken sold 50 per cent of its share in these acquired entities to our joint venture partner VJM Group.
Share of profit of associates and joint ventures and impairments thereof
In millions of EUR | 2010 | 2009 | 2012 | 2011 | ||||||||||||
Income associates | 28 | 7 | 34 | 25 | ||||||||||||
Income joint ventures | 165 | 120 | 179 | 215 | ||||||||||||
Impairments | — | — | — | — | ||||||||||||
| 213 | 240 | |||||||||||||||
| 193 | 127 |
|
| |||||||||||||
In 2010 no impairments were recognisedThe income associates contain a HEINEKEN’s share in respectthe write off in deferred tax assets in an associate of associates and JVs (2009: EUR nil)EUR36 million (see note 27). Included in the income joint ventures is HEINEKEN’s share of the net impairment in Jiangsu Dafuhao Breweries Co. Ltd in China of EUR11 million.
Summary financial information for equity accounted joint ventures and associates
In millions of EUR | Joint ventures 2010 | Joint ventures 2009 | Joint ventures 2012 | Joint ventures 2011 | Associates 2012 | Associates 2011 | ||||||||||||||||||
Non-current assets | 1,696 | 1,375 | 1,270 | 1,708 | 65 | 73 | ||||||||||||||||||
Current assets | 869 | 681 | 683 | 1,005 | 50 | 52 | ||||||||||||||||||
Non-current liabilities | (611 | ) | (430 | ) | (512 | ) | (581 | ) | (18 | ) | (25 | ) | ||||||||||||
Current liabilities | (684 | ) | (631 | ) | (477 | ) | (725 | ) | (30 | ) | (30 | ) | ||||||||||||
| 1,270 | 995 | |||||||||||||||||||||||
Revenue | 2,108 | 1,540 | 2,234 | 2,313 | 203 | 153 | ||||||||||||||||||
Expenses | (1,887 | ) | (1,377 | ) | (1,851 | ) | (1,914 | ) | (161 | ) | (117 | ) | ||||||||||||
|
|
|
| |||||||||||||||||||||
| 221 | 163 | |||||||||||||||||||||||
Financial statements | Notes toIn the consolidated financial statementscontinued
above table HEINEKEN represents its share of the aggregated amounts of assets, liabilities, revenues and expenses for its Joint Ventures and Associates for the year ended 31 December. The revenue and expenses of Joint Ventures in 2012 contain 10.5 months of APIPL/APB and 1.5 months of Guinness Anchor Berhad and Thai Asia Pacific Brewery. Both Guinness Anchor Berhad and Thai Asia Pacific Brewery are included in the joint ventures 2012 ending balances.
17. Other investments and receivables
In millions of EUR | Note | 2010 | 2009 | Note | 2012 | 2011 | ||||||||||||||||||
Non-current other investments | ||||||||||||||||||||||||
Loans | 32 | 455 | 329 | |||||||||||||||||||||
Loans and advances to customers | 32 | 368 | 384 | |||||||||||||||||||||
Indemnification receivable | 32 | 145 | — | 32 | 136 | 156 | ||||||||||||||||||
Other receivables | 32 | 174 | — | 32 | 148 | 178 | ||||||||||||||||||
Held-to-maturity investments | 32 | 4 | 4 | 32 | 4 | 5 | ||||||||||||||||||
Available-for-sale investments | 32 | 190 | 219 | 32 | 327 | 264 | ||||||||||||||||||
Non-current derivatives | 32 | 135 | 16 | 32 | 116 | 142 | ||||||||||||||||||
| 1,099 | 1,129 | |||||||||||||||||||||||
| 1,103 | 568 |
|
| |||||||||||||||||||||
Current other investments | ||||||||||||||||||||||||
Investments held for trading | 32 | 17 | 15 | 32 | 11 | 14 | ||||||||||||||||||
| 11 | 14 | |||||||||||||||||||||||
| 17 | 15 |
|
| |||||||||||||||||||||
Included in loans are loans to customers with a carrying amount of EUR166EUR108 million as at 31 December 2010 (2009: EUR1502012 (2011: EUR120 million). Effective interest rates range from 26 to 1312 per cent. EUR164EUR60 million (2009: EUR145(2011: EUR72 million) matures between 1one and 5five years and EUR2EUR48 million (2009: EUR5(2011: EUR48 million) after 5five years.
The indemnification receivable represents the receivable on FEMSA and Lewiston investments and is a mirroring of the corresponding indemnified liabilities originating from the acquisition of the beer operations of FEMSA and Sona.
The other non-current receivables mainly originate from the acquisition of the beer operations of FEMSA and represent a receivable on the Brazilian Authorities on which interest is calculated in accordance with Brazilian legislation. Collection of this receivable is expected to be beyond a period of five years. The indemnification receivable represents the receivable on FEMSA and is a mirror of the corresponding indemnified liabilities originating from the acquisition of the beer operations of FEMSA.
The main available-for sale-investmentsavailable-for-sale investments are Caribbean Development Company Ltd., S.A. Des Brasseries du Cameroun, Consorcio Cervecero de Nicaragua S.A. and, Desnoes & Geddes Ltd. and Sabeco Ltd. As far as these investments are listed they are measured at their quoted market price. For others the value in use or multiples are used. Debt securities (which are interest-bearing) with a carrying amount of EUR21 million (2009: EUR21(2011: EUR20 million) are included in available-for-sale investments.
Sensitivity analysis – equity price risk
An amount of EUR69EUR193 million as at 31 December 2010 (2009: EUR572012 (2011: EUR95 million) of available-for-sale investments and investments held for trading is listed on stock exchanges. AAn impact of 1 per cent increase or decrease in the share price at the reporting date would have increased equity by EUR1 million (2009: EUR1 million); an equal changenot result in the opposite direction would have decreased equity by EUR1 million (2009: EUR1 million).a material impact on a consolidated Group level.
18. Deferred tax assets and liabilities
Recognised deferred tax assets and liabilities
Deferred tax assets and liabilities are attributable to the following items:
| Assets | Liabilities | Net | ||||||||||||||||||||||||||||||||||||||||||||||
In millions of EUR | 2010 | Assets 2009 | 2010 | Liabilities 2009 | 2010 | Net 2009 | 2012 | 2011 | 2012 | 2011 | 2012 | 2011 | ||||||||||||||||||||||||||||||||||||
Property, plant & equipment | 86 | 55 | (550 | ) | (385 | ) | (464 | ) | (330 | ) | 136 | 93 | (756 | ) | (590 | ) | (620 | ) | (497 | ) | ||||||||||||||||||||||||||||
Intangible assets | 62 | 41 | (789 | ) | (310 | ) | (727 | ) | (269 | ) | 75 | 51 | (1,608 | ) | (733 | ) | (1,533 | ) | (682 | ) | ||||||||||||||||||||||||||||
Investments | 87 | 15 | (9 | ) | (6 | ) | 78 | 9 | 134 | 91 | (12 | ) | (6 | ) | 122 | 85 | ||||||||||||||||||||||||||||||||
Inventories | 33 | 17 | (6 | ) | (6 | ) | 27 | 11 | 20 | 16 | (7 | ) | (5 | ) | 13 | 11 | ||||||||||||||||||||||||||||||||
Loans and borrowings | 1 | 1 | (2 | ) | — | (1 | ) | 1 | 2 | 3 | — | — | 2 | 3 | ||||||||||||||||||||||||||||||||||
Employee benefits | 141 | 92 | 11 | 24 | 152 | 116 | 399 | 252 | (2 | ) | 12 | 397 | 264 | |||||||||||||||||||||||||||||||||||
Provisions | 133 | 92 | 1 | — | 134 | 92 | 125 | 150 | (17 | ) | 1 | 108 | 151 | |||||||||||||||||||||||||||||||||||
Other items | 77 | 215 | (51 | ) | (207 | ) | 26 | 8 | 242 | 146 | (195 | ) | (138 | ) | 47 | 8 | ||||||||||||||||||||||||||||||||
Tax losses carry-forwards | 213 | 137 | — | — | 213 | 137 | ||||||||||||||||||||||||||||||||||||||||||
Tax losses carry forward | 238 | 237 | — | — | 238 | 237 | ||||||||||||||||||||||||||||||||||||||||||
Tax assets/(liabilities) | 833 | 665 | (1,395 | ) | (890 | ) | (562 | ) | (225 | ) | 1,371 | 1,039 | (2,597 | ) | (1,459 | ) | (1,226 | ) | (420 | ) | ||||||||||||||||||||||||||||
Set-off of tax | (404 | ) | (104 | ) | 404 | 104 | — | — | (807 | ) | (565 | ) | 807 | 565 | — | — | ||||||||||||||||||||||||||||||||
Net tax assets/(liabilities) | 429 | 561 | (991 | ) | (786 | ) | (562 | ) | (225 | ) | 564 | 474 | (1,790 | ) | (894 | ) | (1,226 | ) | (420 | ) | ||||||||||||||||||||||||||||
|
|
|
|
|
| |||||||||||||||||||||||||||||||||||||||||||
Of the total net deferred tax assets of EUR564 million at 31 December 2012 (2011: EUR474 million), EUR301 million (2011: EUR246 million) is recognised in respect of OpCos in various countries where there have been tax losses in the current or preceding period. Management’s projections support the assumption that it is probable that the results of future operations will generate sufficient taxable income to utilise these deferred tax assets. The set-offincrease in 2010 was higher compared to 2009 duedeferred tax liabilities in 2012 is mainly related to the formation of additional tax groups and the effect of the acquisition of FEMSA.
Financial statements | Notes to the consolidated financial statementscontinued
APIPL/APB acquisition.
Tax losses carry-forwardscarry forward
HeinekenHEINEKEN has tax losses carry-forwardscarry forward for an amount of EUR1,833EUR2,011 million as perat 31 December 2010 (2009: EUR9832012 (2011: EUR1,920 million), which expire in the following years:
In millions of EUR | 2010 | 2009 | 2012 | 2011 | ||||||||||||
2010 | — | 11 | ||||||||||||||
2011 | 11 | 16 | ||||||||||||||
2012 | 8 | 11 | — | 5 | ||||||||||||
2013 | 32 | 18 | 11 | 6 | ||||||||||||
2014 | 30 | 18 | 17 | 28 | ||||||||||||
2015 | 32 | — | 32 | 23 | ||||||||||||
After 2015 respectively 2014 but not unlimited | 314 | 91 | ||||||||||||||
2016 | 29 | 36 | ||||||||||||||
2017 | 27 | — | ||||||||||||||
After 2017 respectively 2016 but not unlimited | 292 | 372 | ||||||||||||||
Unlimited | 1,406 | 818 | 1,603 | 1,450 | ||||||||||||
| 2,011 | 1,920 | |||||||||||||||
| 1,833 | 983 | |||||||||||||||
Recognised as deferred tax assets gross | (807 | ) | (479 | ) | (989 | ) | (859 | ) | ||||||||
Unrecognised | 1,026 | 504 | 1,022 | 1,061 | ||||||||||||
|
| |||||||||||||||
The unrecognised losses relate to entities for which it is not probable that taxable profit will be available to offset these losses. The majority of the unrecognised losses were acquired as part of the beer operations of FEMSA in 2010.
Movement in deferred tax on temporary differencesbalances during the year
In millions of EUR | Balance 1 January 2009 | Changes in consolidation | Effect of movements in foreign exchange | Recognised in income | Recognised in equity | Transfers | Balance 31 December 2009 | |||||||||||||||||||||
Property, plant & equipment | (338 | ) | (3 | ) | 10 | (3 | ) | — | 4 | (330 | ) | |||||||||||||||||
Intangible assets | (281 | ) | (1 | ) | (4 | ) | 49 | — | (32 | ) | (269 | ) | ||||||||||||||||
Investments | (25 | ) | — | (2 | ) | 34 | 2 | — | 9 | |||||||||||||||||||
Inventories | 5 | — | — | 6 | — | — | 11 | |||||||||||||||||||||
Loans and borrowings | 1 | — | — | — | — | — | 1 | |||||||||||||||||||||
Employee benefits | 117 | 1 | 3 | (4 | ) | — | (1 | ) | 116 | |||||||||||||||||||
Provisions | 64 | (4 | ) | (4 | ) | — | — | 36 | 92 | |||||||||||||||||||
Other items | 30 | 1 | (4 | ) | 10 | (4 | ) | (25 | ) | 8 | ||||||||||||||||||
Tax losses carry-forwards | 128 | — | 6 | (10 | ) | — | 13 | 137 | ||||||||||||||||||||
Net tax assets/(liabilities) | (299 | ) | (6 | ) | 5 | 82 | (2 | ) | (5 | ) | (225 | ) | ||||||||||||||||
In millions of EUR | Balance 1 January 2010 | Changes in consolidation | Effect of movements in foreign exchange | Recognised in income | Recognised in equity | Transfers | Balance 31 December 2010 | |||||||||||||||||||||
Property, plant & equipment | (330 | ) | (161 | ) | — | 28 | — | (1 | ) | (464 | ) | |||||||||||||||||
Intangible assets | (269 | ) | (475 | ) | 3 | 17 | — | (3 | ) | (727 | ) | |||||||||||||||||
Investments | 9 | 54 | (3 | ) | 18 | — | — | 78 | ||||||||||||||||||||
Inventories | 11 | (4 | ) | (1 | ) | 20 | — | 1 | 27 | |||||||||||||||||||
Loans and borrowings | 1 | (1 | ) | — | (1 | ) | — | — | (1 | ) | ||||||||||||||||||
Employee benefits | 116 | 53 | (2 | ) | (15 | ) | — | — | 152 | |||||||||||||||||||
Provisions | 92 | 14 | (2 | ) | 30 | — | — | 134 | ||||||||||||||||||||
Other items | 8 | 40 | (2 | ) | 15 | (43 | ) | 8 | 26 | |||||||||||||||||||
Tax losses carry-forwards | 137 | 33 | 5 | 39 | — | (1 | ) | 213 | ||||||||||||||||||||
Net tax assets/(liabilities) | (225 | ) | (447 | ) | (2 | ) | 151 | (43 | ) | 4 | (562 | ) | ||||||||||||||||
Financial statements | Notes to the consolidated financial statementscontinued
In millions of EUR | Balance 1 January 2011 | Changes in consolidation | Effect of movements in foreign exchange | Recognised in income | Recognised in equity | Transfers | Balance 31 December 2011 | |||||||||||||||||||||
Property, plant & equipment | (464 | ) | (41 | ) | 20 | (10 | ) | — | (2 | ) | (497 | ) | ||||||||||||||||
Intangible assets | (727 | ) | (18 | ) | 38 | 25 | — | — | (682 | ) | ||||||||||||||||||
Investments | 78 | — | (7 | ) | 14 | — | — | 85 | ||||||||||||||||||||
Inventories | 27 | — | — | (16 | ) | — | — | 11 | ||||||||||||||||||||
Loans and borrowings | (1 | ) | — | 2 | 2 | — | — | 3 | ||||||||||||||||||||
Employee benefits | 265 | — | — | (17 | ) | 16 | — | 264 | ||||||||||||||||||||
Provisions | 134 | 1 | — | 13 | — | 3 | 151 | |||||||||||||||||||||
Other items | 26 | — | (5 | ) | (19 | ) | 8 | (2 | ) | 8 | ||||||||||||||||||
Tax losses carry forward | 213 | 7 | (2 | ) | 19 | — | — | 237 | ||||||||||||||||||||
Net tax assets/(liabilities) | (449 | ) | (51 | ) | 46 | 11 | 24 | (1 | ) | (420 | ) | |||||||||||||||||
|
|
|
|
|
|
|
|
|
|
|
|
|
| |||||||||||||||
In millions of EUR | Balance 1 January 2012 | Changes in consolidation | Effect of movements in foreign exchange | Recognised in income | Recognised in equity | Transfers | Balance 31 December 2012 | |||||||||||||||||||||
Property, plant & equipment | (497 | ) | (66 | ) | (5 | ) | (54 | ) | — | 2 | (620 | ) | ||||||||||||||||
Intangible assets | (682 | ) | (921 | ) | 6 | 59 | — | 5 | (1,533 | ) | ||||||||||||||||||
Investments | 85 | (4 | ) | 4 | 37 | (2 | ) | 2 | 122 | |||||||||||||||||||
Inventories | 11 | (18 | ) | 1 | 22 | — | (3 | ) | 13 | |||||||||||||||||||
Loans and borrowings | 3 | — | (2 | ) | — | — | 1 | 2 | ||||||||||||||||||||
Employee benefits | 264 | 6 | 6 | 2 | 123 | (4 | ) | 397 | ||||||||||||||||||||
Provisions | 151 | (9 | ) | 3 | (34 | ) | — | (3 | ) | 108 | ||||||||||||||||||
Other items | 8 | 9 | (9 | ) | 70 | (40 | ) | 9 | 47 | |||||||||||||||||||
Tax losses carry forward | 237 | 1 | 4 | 6 | — | (10 | ) | 238 | ||||||||||||||||||||
Net tax assets/(liabilities) | (420 | ) | (1,002 | ) | 8 | 108 | 81 | (1 | ) | (1,226 | ) | |||||||||||||||||
|
|
|
|
|
|
|
|
|
|
|
|
|
| |||||||||||||||
19. Inventories
In millions of EUR | 2010 | 2009 | 2012 | 2011 | ||||||||||||
Raw materials | 241 | 170 | 320 | 263 | ||||||||||||
Work in progress | 147 | 132 | 176 | 150 | ||||||||||||
Finished products | 261 | 140 | 407 | 354 | ||||||||||||
Goods for resale | 231 | 269 | 207 | 205 | ||||||||||||
Non-returnable packaging | 120 | 107 | 191 | 143 | ||||||||||||
Other inventories | 206 | 192 | ||||||||||||||
Other inventories and spare parts | 295 | 237 | ||||||||||||||
| 1,596 | 1,352 | |||||||||||||||
| 1,206 | 1,010 |
|
| |||||||||||||
During 20102012 and 20092011 no write-down of inventories to net realisable value was required.
20. Trade and other receivables
In millions of EUR | Note | 2010 | 2009 | Note | 2012 | 2011 | ||||||||||||||||||
Trade receivables due from associates and joint ventures | 102 | 78 | 27 | 42 | ||||||||||||||||||||
Trade receivables | 1,680 | 1,730 | 1,944 | 1,657 | ||||||||||||||||||||
Other receivables | 481 | 453 | 529 | 524 | ||||||||||||||||||||
Derivatives | 10 | 49 | 37 | 37 | ||||||||||||||||||||
| 32 | 2,537 | 2,260 | ||||||||||||||||||||||
| 32 | 2,273 | 2,310 |
|
| ||||||||||||||||||||
A net impairment loss of EUR115EUR38 million (2009: EUR64(2011: EUR57 million) in respect of trade and other receivables was included in expenses for raw materials, consumables and services.
21. Cash and cash equivalents
In millions of EUR | Note | 2010 | 2009 | Note | 2012 | 2011 | ||||||||||||||||||
Bank balances | 430 | 482 | ||||||||||||||||||||||
Call deposits | 180 | 38 | ||||||||||||||||||||||
Cash and cash equivalents | 32 | 610 | 520 | 32 | 1,037 | 813 | ||||||||||||||||||
Bank overdrafts | 25 | (132 | ) | (156 | ) | 25 | (191 | ) | (207 | ) | ||||||||||||||
Cash and cash equivalents in the statement of cash flows | 478 | 364 | 846 | 606 | ||||||||||||||||||||
|
| |||||||||||||||||||||||
22. Capital and reserves
Share issuance
On 30 April 2010 Heineken N.V.HEINEKEN issued 86,028,019 ordinary shares with a nominal value of EUR1.60, as a result of which the issued share capital consists of 576,002,613 shares. To these shares a share premium value was assigned of EUR2,701 million based on the quoted market price value of 43,009,699 shares HEINEKEN and 43,018,320 shares Heineken Holding N.V. and 43,009,699 shares Heineken N.V. combined being the share consideration paid to Fomento Económico Mexicano, S.A.B. de C.V. (FEMSA) for its beer operations.
Allotted Share Delivery Instrument
In addition to the shares issued to FEMSA, HeinekenHEINEKEN also committed itself to deliver 29,172,504 additional shares to FEMSA (the ‘Allotted Shares’) over a period of no longer than five years. This financial instrument iswas classified to beas equity as the number of shares iswas fixed. Heineken N.V. hasHEINEKEN had the option to accelerate the delivery of the Allotted Shares at its discretion. Pending delivery of the Allotted Shares, Heineken N.V. will payHEINEKEN paid a coupon on each undelivered Allotted Share such that FEMSA will bewas compensated, on an after tax basis, for dividends FEMSA would have received had all such Allotted Shares been delivered to FEMSA on or prior to the record date for such dividends.
On 3 October 2011, HEINEKEN announced that the share repurchase programme in connection with the acquisition of FEMSA had been completed. During the period of 8 March1 January through 31 December 2010 Heineken N.V.2011 HEINEKEN acquired 10,765,25818,407,246 shares with an average quoted market price of EUR35.85. During the year a total of 10,240,553EUR36.67. All shares were delivered to FEMSA under the ASDI.
During 2010, Heineken announced several share buy-back programmes relating to the ASDI. The most recent share buy-back programmes of EUR150 million was announced on 17 November 2010. Heineken has mandated a bank to repurchase Heineken N.V. shares in the open market starting 18 November 2010 up to and including 16 June 2011. Up to 31 December 2010, EUR54 million of this EUR150 million was paid by Heineken for 1,501,690 shares. The remaining outstanding share purchase mandate liability of EUR96 million has been presented as a current liability (see note 31) in accordance with IAS 32.23.
Financial statements | Notes to the consolidated financial statementscontinued
Share capital
| Ordinary shares | ||||||||||||||||
In millions of EUR | 2010 | 2009 | 2012 | 2011 | ||||||||||||
On issue as at 1 January | 784 | 784 | 922 | 922 | ||||||||||||
Issued | 138 | — | — | — | ||||||||||||
On issue as at 31 December | 922 | 784 | 922 | 922 | ||||||||||||
|
| |||||||||||||||
As at 31 December 20102012 the issued share capital comprised 576,002,613 ordinary shares (2009: 489,974,594)(2011: 576,002,613). The ordinary shares have a par value of EUR1.60. All issued shares are fully paid.
The Company’s authorised capital amounts to EUR2.5 billion, comprising of 1,562,500,000 shares.
The holders of ordinary shares are entitled to receive dividends as declared from time to time and are entitled to one vote per share at meetings of the Company. In respect of the Company’s shares that are held by HeinekenHEINEKEN (see next page)below), rights are suspended.
Translation reserve
The translation reserve comprises foreign currency differences arising from the translation of the financial statements of foreign operations of the Group (excluding amounts attributable to non-controlling interests) as well as value changes of the hedging instruments in the net investment hedges. HeinekenHEINEKEN considers this a legal reserve.
Hedging reserve
This reserve comprises the effective portion of the cumulative net change in the fair value of cash flow hedging instruments where the hedged transaction has not yet occurred. HeinekenHEINEKEN considers this a legal reserve.
Fair value reserve
This reserve comprises the cumulative net change in the fair value of available-for-sale investments until the investment is derecognised or impaired. HeinekenHEINEKEN considers this a legal reserve.
Other legal reserves
These reserves relate to the share of profit of joint ventures and associates over the distribution of which HeinekenHEINEKEN does not have control. The movement in these reserves reflects retained earnings of joint ventures and associates minus dividends received. In case of a legal or other restriction which causes that retained earnings of subsidiaries cannot be freely distributed, a legal reserve is recognised for the restricted part.
Reserve for own shares
The reserve for the Company’s own shares comprises the cost of the Company’s shares held by Heineken.HEINEKEN. As at 31 December 2010, Heineken2012, HEINEKEN held 1,630,258891,561 of the Company’s shares (2009: 1,251,201), of which 524,705 are ASDI and 1,105,553 are LTIP shares.(2011: 1,265,140).
The coupon paid on the ASDI in 20102011 amounts to EUR7EUR15 million.
22. Capital and reserves continuedLTV
During the period of 1 January through 31 December 2012 HEINEKEN acquired no shares for LTV delivery.
Dividends
The following dividends were declared and paid by Heineken:HEINEKEN:
In millions of EUR | 2010 | 2009 | 2012 | 2011 | ||||||||||||
Final dividend previous year EUR0.40, respectively EUR0.34 per qualifying ordinary share | 195 | 167 | ||||||||||||||
Interim dividend current year EUR0.26, respectively EUR0.25 per qualifying ordinary share | 156 | 122 | ||||||||||||||
Final dividend previous year EUR0.53, respectively EUR0.50 per qualifying ordinary share | 305 | 299 | ||||||||||||||
Interim dividend current year EUR0.33, respectively EUR0.30 per qualifying ordinary share | 189 | 175 | ||||||||||||||
Total dividend declared and paid | 351 | 289 | 494 | 474 | ||||||||||||
|
| |||||||||||||||
Heineken’s
The Heineken N.V. dividend policy is for an annual dividend payoutto pay-out a ratio of 30 –per cent to 35 per cent of Netfull-year net profit BEIA.(beia). The interim dividend is fixed at 40 per cent of the total dividend of the previous year.
After the balance sheet date the Executive Board proposed the following dividends. The dividends, takentaking into account the interim dividends declared and paid, have not been provided for.
In millions of EUR | 2010 | 2009 | 2012 | 2011 | ||||||||||||
per qualifying ordinary share EUR0.76 (2009: EUR0.65) | 438 | 318 | ||||||||||||||
per qualifying ordinary share EUR0.89 (2011: EUR0.83) | 512 | 477 | ||||||||||||||
|
| |||||||||||||||
Financial statements | NotesNon-controlling interests
The non-controlling interests (NCI) relate to minority stakes held by third parties in HEINEKEN consolidated subsidiaries. Due to the consolidated financial statementscontinued
APIPL/APB acquisition HEINEKEN recognised additional NCI’s for a total of EUR797 million. An amount of EUR645 million represents the share of third parties in subsidiaries of the APIPL/APB Group. An amount of EUR152 million represents the APB shares that HEINEKEN did not yet acquire on 15 November 2012. These shares are subject to the Mandatory General Offer. Both NCI’s are valued at their share in net assets acquired. Due to purchases of APB shares between 15 November 2012 and 31 December 2012, the NCI decreased with EUR91 million and as at 31 December 2012 HEINEKEN owns 98.7 per cent of APB.
23. Earnings per share
Basic earnings per share
The calculation of basic earnings per share as at 31 December 20102012 is based on the profit attributable to ordinary shareholders of the Company (net profit) of EUR1.436EUR2,949 million (2009: EUR1,018(2011: EUR1,430 million) and a weighted average number of ordinary shares – basic outstanding during the year ended 31 December 20102012 of 562,234,726 (2009: 488,666,607)575,022,338 (2011:585,100,381). Basic earnings per share for the year amountsamounted to EUR2.55 (2009: EUR2.08)EUR5.13 (2011: EUR2.44).
Weighted average number of shares – basic
| 2010 | 2009 | 2012 | 2011 | |||||||||||||
Number of shares basic 1 January | 489,974,594 | 489,974,594 | 576,002,613 | 576,002,613 | ||||||||||||
Effect of LTIP own shares held | (1,152,409 | ) | (1,307,987 | ) | ||||||||||||
Effect of own shares held | (980,275 | ) | (1,177,321 | ) | ||||||||||||
Effect of undelivered ASDI shares | 14,726,761 | — | — | 10,275,089 | ||||||||||||
Effect of new shares issued | 58,685,780 | — | — | — | ||||||||||||
Weighted number of basic shares for the year | 575,022,338 | 585,100,381 | ||||||||||||||
|
| |||||||||||||||
Weighted number of basic shares 31 December | 562,234,726 | 488,666,607 | ||||||||||||||
ASDI
The Allotted Share Delivery Instrument (ASDI) representing Heineken’srepresented HEINEKEN’s obligation to deliver shares to FEMSA, either through issuance and/or purchasing of its own shares in the open market.market, which was concluded in 2011. EPS isin 2011 was impacted by ASDI as in the formula calculating EPS the net profit is divided by the weighted average number of ordinary shares. In this weighted average number of ordinary shares, the weighted average of outstanding ASDI is included. This means that the ASDI leadshas led to a lower basic EPS until all shares havehad been repurchased.repurchased in 2011.
Diluted earnings per share
The calculation of diluted earnings per share as at 31 December 2010 was2012 is based on the profit attributable to ordinary shareholders of the Company (net profit) of EUR1,436EUR2,949 million (2009: EUR1,018(2011: EUR1,430 million) and a weighted average number of ordinary shares – basic outstanding after adjustment for the effects of all dilutive potential ordinary shares of 563,387,135 (2009: 489,974,594)576,002,613 (2011: 586,277,702). Diluted earnings per share for the year amounted to EUR2.55 (2009: EUR2.08)EUR5.12 (2011: EUR2.44).
Weighted average number of shares – diluted
| 2010 | 2009 | |||||||
Weighted number of basic shares 31 December | 562,234,726 | 488,666,607 | ||||||
Effect of LTIP own shares held | 1,152,409 | 1,307,987 | ||||||
Weighted average diluted shares 31 December | 563,387,135 | 489,974,594 | ||||||
Financial statements | Notes to the consolidated financial statementscontinued
| 2012 | 2011 | |||||||
Weighted number of basic shares for the year | 575,022,338 | 585,100,381 | ||||||
Effect of own shares held | 980,275 | 1,177,321 | ||||||
Weighted average diluted shares for the year | 576,002,613 | 586,277,702 | ||||||
|
|
|
| |||||
24. Income tax on other comprehensive income
| 2012 | 2011 | |||||||||||||||||||||||||||||||||||||||||||||||
In millions of EUR | Amount before tax | Tax | 2010 Amount net of tax | Amount before tax | Tax | 2009 Amount net of tax | Amount before tax | Tax | Amount net of tax | Amount before tax | Tax | Amount net of tax | ||||||||||||||||||||||||||||||||||||
Other comprehensive income | ||||||||||||||||||||||||||||||||||||||||||||||||
Foreign currency translation differences for foreign operations | 400 | — | 400 | 112 | — | 112 | 67 | (22 | ) | 45 | (504 | ) | 11 | (493 | ) | |||||||||||||||||||||||||||||||||
Effective portion of changes in fair value of cash flow hedge | 61 | (18 | ) | 43 | (121 | ) | 31 | (90 | ) | 16 | (2 | ) | 14 | (31 | ) | 10 | (21 | ) | ||||||||||||||||||||||||||||||
Effective portion of cash flow hedges transferred to profit or loss | 65 | (20 | ) | 45 | 117 | (29 | ) | 88 | 57 | (16 | ) | 41 | (14 | ) | 3 | (11 | ) | |||||||||||||||||||||||||||||||
Ineffective portion of cash flow hedges transferred to profit or loss | 9 | — | 9 | — | — | — | — | — | — | — | — | — | ||||||||||||||||||||||||||||||||||||
Net change in fair value available-for-sale investments | 16 | (5 | ) | 11 | 34 | (8 | ) | 26 | 203 | (68 | ) | 135 | 71 | — | 71 | |||||||||||||||||||||||||||||||||
Net change in fair value available-for-sale investments transferred to profit or loss | (17 | ) | — | (17 | ) | (16 | ) | 4 | (12 | ) | (192 | ) | 44 | (148 | ) | (1 | ) | — | (1 | ) | ||||||||||||||||||||||||||||
Actuarial gains and losses | (562 | ) | 123 | (439 | ) | (109 | ) | 16 | (93 | ) | ||||||||||||||||||||||||||||||||||||||
Share of other comprehensive income of associates/joint ventures | (29 | ) | — | (29 | ) | 22 | — | 22 | (1 | ) | — | (1 | ) | (5 | ) | — | (5 | ) | ||||||||||||||||||||||||||||||
Total other comprehensive income | 505 | (43 | ) | 462 | 148 | (2 | ) | 146 | (412 | ) | 59 | (353 | ) | (593 | ) | 40 | (553 | ) | ||||||||||||||||||||||||||||||
|
|
|
|
|
| |||||||||||||||||||||||||||||||||||||||||||
The difference between the income tax on other comprehensive income and the deferred tax reported in equity (note 18) can be explained by current tax on other comprehensive income.
25. Loans and borrowings
This note provides information about the contractual terms of Heineken’sHEINEKEN’s interest-bearing loans and borrowings. For more information about Heineken’sHEINEKEN’s exposure to interest rate risk and foreign currency risk, see note 32.
Non-current liabilities
In millions of EUR | Note | 2010 | 2009 | |||||||||
Secured bank loans | 48 | 179 | ||||||||||
Unsecured bank loans | 3,260 | 2,958 | ||||||||||
Unsecured bond issues | 2,482 | 2,445 | ||||||||||
Finance lease liabilities | 26 | 47 | 89 | |||||||||
Other non-current interest-bearing liabilities | 1,895 | 1,267 | ||||||||||
Non-current interest-bearing liabilities | 7,732 | 6,938 | ||||||||||
Non-current derivatives | 291 | 370 | ||||||||||
Non-current non-interest-bearing liabilities | 55 | 93 | ||||||||||
| 8,078 | 7,401 | |||||||||||
Financial statements | Notes to the consolidated financial statementscontinued
25. Loans and borrowings continued
In millions of EUR | Note | 2012 | 2011 | |||||||||
Secured bank loans | 28 | 37 | ||||||||||
Unsecured bank loans | 1,221 | 3,607 | ||||||||||
Unsecured bond issues | 8,206 | 2,493 | ||||||||||
Finance lease liabilities | 26 | 22 | 33 | |||||||||
Other non-current interest-bearing liabilities | 1,828 | 1,825 | ||||||||||
Non-current interest-bearing liabilities | 11,305 | 7,995 | ||||||||||
Non-current derivatives | 111 | 177 | ||||||||||
Non-current non-interest-bearing liabilities | 21 | 27 | ||||||||||
| 11,437 | 8,199 | |||||||||||
|
|
|
| |||||||||
Current interest-bearing liabilities
In millions of EUR | Note | 2010 | 2009 | Note | 2012 | 2011 | ||||||||||||||||||
Current portion of secured bank loans | 11 | 96 | 13 | 13 | ||||||||||||||||||||
Current portion of unsecured bank loans | 346 | 78 | 740 | 329 | ||||||||||||||||||||
Current portion of unsecured bond issues | — | 500 | ||||||||||||||||||||||
Current portion of unsecured bonds issues | 600 | — | ||||||||||||||||||||||
Current portion of finance lease liabilities | 26 | 48 | 19 | 26 | 16 | 6 | ||||||||||||||||||
Current portion of other interest-bearing liabilities | 32 | 75 | ||||||||||||||||||||||
Current portion of other non-current interest-bearing liabilities | 12 | 184 | ||||||||||||||||||||||
Total current portion of non-current interest-bearing liabilities | 437 | 768 | 1,381 | 532 | ||||||||||||||||||||
Deposits from third parties | 425 | 377 | ||||||||||||||||||||||
Deposits from third parties (mainly employee loans) | 482 | 449 | ||||||||||||||||||||||
| 862 | 1,145 | 1,863 | 981 | |||||||||||||||||||||
Bank overdrafts | 21 | 132 | 156 | 21 | 191 | 207 | ||||||||||||||||||
| 2,054 | 1,188 | |||||||||||||||||||||||
| 994 | 1,301 | |||||||||||||||||||||||
Net interest-bearing debt position
In millions of EUR | Note | 2010 | 2009 | Note | 2012 | 2011 | ||||||||||||||||||
Non-current interest-bearing liabilities | 7,732 | 6,938 | 11,305 | 7,995 | ||||||||||||||||||||
Current portion of non-current interest-bearing liabilities | 437 | 768 | 1,381 | 532 | ||||||||||||||||||||
Deposits from third parties | 425 | 377 | ||||||||||||||||||||||
Deposits from third parties (mainly employee loans) | 482 | 449 | ||||||||||||||||||||||
| 8,594 | 8,083 | 13,168 | 8,976 | |||||||||||||||||||||
Bank overdrafts | 21 | 132 | 156 | 21 | 191 | 207 | ||||||||||||||||||
| 13,359 | 9,183 | |||||||||||||||||||||||
| 8,726 | 8,239 | |||||||||||||||||||||||
Cash, cash equivalents and current other investments | (627 | ) | (535 | ) | (1,048 | ) | (828 | ) | ||||||||||||||||
Net interest-bearing debt position | 8,099 | 7,704 | 12,311 | 8,355 | ||||||||||||||||||||
|
| |||||||||||||||||||||||
Non-current liabilities
In millions of EUR | Secured bank loans | Unsecured bank loans | Unsecured bond issues | Finance lease liabilities | Other non-current interest-bearing liabilities | Non-current derivatives | Non-current non-interest- bearing liabilities | Total | ||||||||||||||||||||||||
Balance as at 1 January 2010 | 179 | 2,958 | 2,445 | 89 | 1,267 | 370 | 93 | 7,401 | ||||||||||||||||||||||||
Consolidation changes | (1 | ) | 880 | — | — | (56 | ) | 24 | 35 | 882 | ||||||||||||||||||||||
Effect of movements in exchange rates | 7 | (9 | ) | 3 | 2 | 85 | (68 | ) | 1 | 21 | ||||||||||||||||||||||
Transfers | (3 | ) | (171 | ) | — | (42 | ) | (1 | ) | 14 | (59 | ) | (262 | ) | ||||||||||||||||||
Charge to/(from) profit or loss i/r derivatives | — | — | — | — | — | (29 | ) | — | (29 | ) | ||||||||||||||||||||||
Charge to/(from) equity i/r derivatives | — | — | — | — | — | (13 | ) | — | (13 | ) | ||||||||||||||||||||||
Proceeds | — | 1,358 | — | — | 572 | (6 | ) | 3 | 1,927 | |||||||||||||||||||||||
Repayments | (134 | ) | (1,702 | ) | — | (4 | ) | (3 | ) | (1 | ) | (13 | ) | (1,857 | ) | |||||||||||||||||
Other | — | (54 | ) | 34 | 2 | 31 | — | (5 | ) | 8 | ||||||||||||||||||||||
Balance as at 31 December 2010 | 48 | 3,260 | 2,482 | 47 | 1,895 | 291 | 55 | 8,078 | ||||||||||||||||||||||||
Financial statements | Notes to the consolidated financial statementscontinued
In millions of EUR | Secured bank loans | Unsecured bank loans | Unsecured bond issues | Finance lease liabilities | Other non-current interest-bearing liabilities | Non-current derivatives | Non-current non-interest- bearing liabilities | Total | ||||||||||||||||||||||||
Balance as at 1 January 2012 | 37 | 3,607 | 2,493 | 33 | 1,825 | 177 | 27 | 8,199 | ||||||||||||||||||||||||
Consolidation changes | — | 11 | 228 | 1 | — | — | 1 | 241 | ||||||||||||||||||||||||
Effect of movements in exchange rates | (1 | ) | 7 | (7 | ) | — | (21 | ) | 6 | 1 | (15 | ) | ||||||||||||||||||||
Transfers to current liabilities | (11 | ) | (1,020 | ) | (600 | ) | (12 | ) | — | 32 | — | (1,611 | ) | |||||||||||||||||||
Charge to/(from) equity i/r derivatives | — | — | — | — | — | (29 | ) | — | (29 | ) | ||||||||||||||||||||||
Proceeds | 6 | 517 | 6,112 | — | 104 | — | 3 | 6,742 | ||||||||||||||||||||||||
Repayments | (3 | ) | (1,895 | ) | — | — | (62 | ) | (68 | ) | 1 | (2,027 | ) | |||||||||||||||||||
Other | — | (6 | ) | (20 | ) | — | (18 | ) | (7 | ) | (12 | ) | (63 | ) | ||||||||||||||||||
Balance as at 31 December 2012 | 28 | 1,221 | 8,206 | 22 | 1,828 | 111 | 21 | 11,437 | ||||||||||||||||||||||||
|
|
|
|
|
|
|
|
|
|
|
|
|
|
|
| |||||||||||||||||
Terms and debt repayment schedule
Terms and conditions of outstanding non-current and current loans and borrowings were as follows:
In millions of EUR | Category | Currency | Nominal interest rate % | Repayment | Carrying amount 2010 | Face value 2010 | Carrying amount 2009 | Face value 2009 | Category | Currency | Nominal interest rate % | Repayment | Carrying amount 2012 | Face value 2012 | Carrying amount 2011 | Face value 2011 | ||||||||||||||||||||||||||||||||||||||||||||
| Secured bank loans | Bank facilities | GBP | 1.9 | 2016 | 23 | 23 | 234 | 234 | Bank facilities | GBP | 1.8 | 2016 | 13 | 13 | 17 | 17 | ||||||||||||||||||||||||||||||||||||||||||||
| Secured bank loans | Various | various | various | various | 36 | 36 | 41 | 41 | Various | various | various | various | 28 | 28 | 33 | 33 | ||||||||||||||||||||||||||||||||||||||||||||
Unsecured bank loans | 2008 Syndicated Bank Facility | EUR | 0.8 | 2013 | 198 | 200 | 1,305 | 1,313 | ||||||||||||||||||||||||||||||||||||||||||||||||||||
Unsecured bank loans | Bank Facility | EUR | 5.1 | 2016 | 207 | 207 | 329 | 329 | ||||||||||||||||||||||||||||||||||||||||||||||||||||
Unsecured bank loans | German Schuldschein notes | EUR | 1.0-6.2 | 2016 | 111 | 111 | 111 | 111 | ||||||||||||||||||||||||||||||||||||||||||||||||||||
Unsecured bank loans | German Schuldschein notes | EUR | 1.0-6.0 | 2013 | 102 | 102 | 102 | 102 | ||||||||||||||||||||||||||||||||||||||||||||||||||||
| Unsecured bank loans | 2008 Syndicated Bank Facility | EUR | 0.7-1.0 | 2013 | 1,708 | 1,709 | 1,700 | 1,709 | German Schuldschein notes | EUR | 1.0-6.0 | 2014 | 207 | 207 | 207 | 207 | ||||||||||||||||||||||||||||||||||||||||||||
| Unsecured bank loans | Bank Facility | EUR | 0.4-5.0 | 2011-2016 | 434 | 434 | 486 | 486 | 2008 Syndicated Bank Facility | GBP | 1.2 | 2013 | 291 | 294 | 287 | 287 | ||||||||||||||||||||||||||||||||||||||||||||
| Unsecured bank loans | German Schuld schein notes | EUR | 1.0-6.0 | 2016 | 111 | 111 | 111 | 111 | Bank Facilities | PLN | 5.2-5.5 | 2013-2014 | 81 | 81 | 72 | 72 | ||||||||||||||||||||||||||||||||||||||||||||
| Unsecured bank loans | German Schuld schein notes | EUR | 1.0-6.0 | 2013 | 102 | 102 | 102 | 102 | 2011 Syndicated Bank Facility | USD | 0.8 | 2017 | — | — | 450 | 450 | ||||||||||||||||||||||||||||||||||||||||||||
| Unsecured bank loans | German Schuld schein notes | EUR | 1.0-6.0 | 2014 | 207 | 207 | 207 | 207 | 2011 Syndicated Bank Facility | GBP | 0.9 | 2017 | 196 | 196 | 422 | 422 | ||||||||||||||||||||||||||||||||||||||||||||
| Unsecured bank loans | 2008 Syndicated Bank Facility | GBP | 0.60 | 2013 | 336 | 340 | 329 | 329 | 2011 Syndicated Bank Facility | EUR | 0.6 | 2017 | 180 | 180 | 107 | 107 | ||||||||||||||||||||||||||||||||||||||||||||
| Unsecured bank loans | Bank Facilities | PLN | 3.7 | 2011 | 60 | 60 | 61 | 61 | Bank Facilities | USD | 0.7 | 2013 | 30 | 30 | 93 | 93 | ||||||||||||||||||||||||||||||||||||||||||||
| Unsecured bank loans | Bank Facilities | USD | 0.80 | 2011-2013 | 167 | 172 | — | — | Bank Facilities | MXN | 4.9 | 2013 | 36 | 36 | 183 | 176 | ||||||||||||||||||||||||||||||||||||||||||||
| Unsecured bank loans | Bank Facilities | MXN | 4.5-10.6 | 2011-2014 | 444 | 445 | — | — | Bank facilities | NGN | 12.5 | 2013-2016 | 276 | 276 | 228 | 228 | ||||||||||||||||||||||||||||||||||||||||||||
| Unsecured bank loans | Various | various | various | various | 37 | 37 | 40 | 40 | Various | various | various | various | 45 | 45 | 40 | 40 | ||||||||||||||||||||||||||||||||||||||||||||
| Unsecured bond | Issue under EMTN programme | GBP | 7.3 | 2015 | 461 | 465 | 442 | 450 | Issue under EMTN programme | GBP | 7.3 | 2015 | 488 | 490 | 476 | 479 | ||||||||||||||||||||||||||||||||||||||||||||
| Unsecured bond | Eurobond on Luxembourg Stock Exchange | EUR | 4.3 | 2010 | — | — | 500 | 500 | Eurobond on Luxembourg Stock Exchange | EUR | 5.0 | 2013 | 600 | 600 | 599 | 600 | ||||||||||||||||||||||||||||||||||||||||||||
| Unsecured bond | Eurobond on Luxembourg Stock Exchange | EUR | 5.0 | 2013 | 599 | 600 | 598 | 600 | Issue under EMTN programme | EUR | 7.1 | 2014 | 1,001 | 1,000 | 1,000 | 1,000 | ||||||||||||||||||||||||||||||||||||||||||||
| Unsecured bond | Issue under EMTN programme | EUR | 7.1 | 2014 | 1,009 | 1,000 | 996 | 1,000 | Issue under EMTN programme | EUR | 4.6 | 2016 | 398 | 400 | 398 | 400 | ||||||||||||||||||||||||||||||||||||||||||||
| Unsecured bond | Issue under EMTN programme | EUR | 4.6 | 2016 | 397 | 400 | 397 | 400 | Issue under EMTN programme | EUR | 2.5 | 2019 | 841 | 850 | — | — | ||||||||||||||||||||||||||||||||||||||||||||
Unsecured bond | Issue under EMTN programme | EUR | 2.1 | 2020 | 995 | 1,000 | — | — | ||||||||||||||||||||||||||||||||||||||||||||||||||||
Unsecured bond | Issue under EMTN programme | EUR | 3.5 | 2024 | 496 | 500 | — | — | ||||||||||||||||||||||||||||||||||||||||||||||||||||
Unsecured bond | Issue under EMTN programme | EUR | 2.9 | 2025 | 740 | 750 | — | — | ||||||||||||||||||||||||||||||||||||||||||||||||||||
Unsecured bond | Issue under APB MTN programme | SGD | 1.0-4.0 | 2014-2022 | 220 | 220 | — | — | ||||||||||||||||||||||||||||||||||||||||||||||||||||
Unsecured bond | Issue under 144A/RegS | USD | 0.8 | 2015 | 377 | 379 | — | — | ||||||||||||||||||||||||||||||||||||||||||||||||||||
Unsecured bond | Issue under 144A/RegS | USD | 1.4 | 2017 | 941 | 947 | — | — | ||||||||||||||||||||||||||||||||||||||||||||||||||||
Unsecured bond | Issue under 144A/RegS | USD | 3.4 | 2022 | 563 | 568 | — | — | ||||||||||||||||||||||||||||||||||||||||||||||||||||
Unsecured bond | Issue under 144A/RegS | USD | 2.8 | 2023 | 753 | 758 | — | — | ||||||||||||||||||||||||||||||||||||||||||||||||||||
Unsecured bond | Issue under 144A/RegS | USD | 4.0 | 2042 | 369 | 379 | — | — | ||||||||||||||||||||||||||||||||||||||||||||||||||||
| Unsecured bond issues | n/a | various | various | various | 16 | 16 | 12 | 12 | n/a | various | various | various | 24 | 24 | 20 | 20 | ||||||||||||||||||||||||||||||||||||||||||||
| Other interest-bearing liabilities | 2010 US private placement | USD | 4.6 | 2018 | 541 | 546 | — | — | ||||||||||||||||||||||||||||||||||||||||||||||||||||
| Other interest-bearing liabilities | 2002 S&N US private placement | USD | 5.4-5.6 | 2012-2014 | 616 | 569 | 557 | 521 | ||||||||||||||||||||||||||||||||||||||||||||||||||||
| Other interest-bearing liabilities | 2005 S&N US private placement | USD | 5.4 | 2015 | 247 | 225 | 221 | 208 | ||||||||||||||||||||||||||||||||||||||||||||||||||||
| Other interest-bearing liabilities | 2008 US private placement | USD | 5.9-6.3 | 2015-2018 | 331 | 333 | 306 | 307 | ||||||||||||||||||||||||||||||||||||||||||||||||||||
| Other interest-bearing liabilities | Private placement | EUR | 2.0 | 2012 | 50 | 50 | 100 | 100 | ||||||||||||||||||||||||||||||||||||||||||||||||||||
| Other interest-bearing liabilities | Various | various | various | various | 142 | 142 | 158 | 158 | ||||||||||||||||||||||||||||||||||||||||||||||||||||
Other interest bearing liabilities | 2010 US private placement | USD | 4.6 | 2018 | 548 | 549 | 559 | 561 | ||||||||||||||||||||||||||||||||||||||||||||||||||||
Other interest bearing liabilities | 2002 S&N US private placement | USD | 5.6 | 2014 | 491 | 455 | 632 | 580 | ||||||||||||||||||||||||||||||||||||||||||||||||||||
Other interest bearing liabilities | 2005 S&N US private placement | USD | 5.4 | 2015 | 248 | 227 | 258 | 232 | ||||||||||||||||||||||||||||||||||||||||||||||||||||
Other interest bearing liabilities | 2008 US private placement | USD | 5.9-6.3 | 2015-2018 | 335 | 336 | 341 | 342 | ||||||||||||||||||||||||||||||||||||||||||||||||||||
Other interest bearing liabilities | 2011 US private placement | USD | 2.8 | 2017 | 68 | 69 | 69 | 70 | ||||||||||||||||||||||||||||||||||||||||||||||||||||
Other interest bearing liabilities | 2008 US private placement | EUR | 7.3 | 2016 | 31 | 31 | 30 | 30 | ||||||||||||||||||||||||||||||||||||||||||||||||||||
Other interest bearing liabilities | various | various | various | various | 120 | 120 | 120 | 120 | ||||||||||||||||||||||||||||||||||||||||||||||||||||
| Deposits from third parties | n/a | various | various | various | 425 | 425 | 377 | 377 | n/a | various | various | various | 482 | 482 | 449 | 449 | ||||||||||||||||||||||||||||||||||||||||||||
| Finance lease liabilities | n/a | various | various | various | 95 | 100 | 108 | 108 | n/a | various | various | various | 38 | 38 | 39 | 39 | ||||||||||||||||||||||||||||||||||||||||||||
| 13,168 | 13,178 | 8,976 | 8,909 | |||||||||||||||||||||||||||||||||||||||||||||||||||||||||
| 8,594 | 8,547 | 8,083 | 8,061 |
|
|
|
| |||||||||||||||||||||||||||||||||||||||||||||||||||||
As at 31 December 2010, no2012 an amount of EUR376 million was drawn on the existing Revolving Credit Facilityrevolving credit facility of EUR2 billion. This revolving credit facility is expiringmatures in 2012. Interest is based on EURIBOR plus2017.
Financial structure
For the first time in the Company’s 148 year history, HEINEKEN was assigned investment grade credit ratings in 2012 by the world’s two leading credit agencies, Moody’s Investor Service and Standard & Poor’s. Both long-term credit ratings, were solid Baa1 and BBB+, respectively and both have a margin.
Financial statements | Notes to‘stable’ outlook per the consolidated financial statementscontinued
date of this Annual Report.
25. LoansNew Financing
On 19 March 2012, HEINEKEN issued EUR1.35 billion of Notes under its EMTN Programme comprising EUR850 million of 7-year Notes with a coupon of 2.5 per cent and borrowings continuedEUR500 million of 12-year Notes with a coupon of 3.5 per cent. On 3 April 2012, HEINEKEN issued USD750 million of 10-year 144A/ RegS US Notes with a coupon of 3.4 per cent. On 2 August 2012, HEINEKEN issued EUR1.75 billion of Notes under its EMTN Programme, consisting of 8-year Notes for a principal amount of EUR1 billion with a coupon of 2.125 per cent and 13-year Notes for a principal amount of EUR750 million with a coupon of 2.875 per cent. On 3 October 2012, HEINEKEN successfully priced 144A/RegS US Notes for a principal amount of USD3.25 billion. This comprised USD500 million of 3-year Notes at a coupon of 0.8 per cent, USD1.25 billion of 5-year Notes at a coupon of 1.4 per cent, USD1 billion of 10.5-year Notes at a coupon of 2.75 per cent and USD500 million of 30-year Notes at a coupon of 4.0 per cent.
As partThe proceeds of the Notes have been mainly used for the financing of the acquisition of the beer operations of FEMSA, Heineken acquired a net debt position of EUR1,564 million. From this amount loansAPB and borrowings in Mexico and Brazil amount to EUR1,595 million, the remainder is cash (net of bank overdrafts) of EUR31 million. This position largely consisted of bank loans from local financial institutions as well as several loans from FEMSA, the seller of FEMSA. These loans, which amounted to EUR573 million as at 30 April 2010, were repaid in May and June 2010. These loans have been refinanced by drawings under the Revolving Credit Facility of Heineken. As at 31 December 2010 the available headroom (including cash available in the Group cash pool) is approximately EUR2.1 billion, as the Revolving Credit Facility was undrawn.
On 13 August 2010, Heineken N.V. received the funds related to the 8-year private loan notes, which were placed on 7 May 2010 with institutional investors in the United States. The principal amount of the loan notes is USD725 millionAPIPL and the coupon was fixed at 4.6 per cent.repayment of debt facilities. The issues have enabled HEINEKEN to further improve the currency and maturity date is 15 August 2018. Heineken has swapped the proceeds into EUR559 million with a fixed couponprofile of 3.9 per cent.
EMTN Programmeits long-term debt.
The Euro Medium Term NoteEMTN Programme (‘EMTN’) was updated and increased to EUR5 billion in September 2010 and is registeredthe notes issued thereunder are listed on the Luxembourg Stock Exchange. As currently approximately EUR1.9 billion is outstanding, HeinekenHEINEKEN still has a capacity of EUR3.1EUR5 billion under this programme. The programme canHEINEKEN is in the process of updating the programme.
Incurrence covenant
HEINEKEN has an incurrence covenant in some of its financing facilities. This incurrence covenant is calculated by dividing net debt (calculated in accordance with the consolidation method of the 2007 Annual Accounts) by EBITDA (beia) (also calculated in accordance with the consolidation method of the 2007 Annual Accounts and including the pro-forma full-year EBITDA of any acquisitions made in 2012). As at 31 December 2012 this ratio was 2.8 (2011: 2.1). If the ratio would be used for issuing up to one year after its latest update.beyond a level of 3.5, the incurrence covenant would prevent us from conducting further significant debt financed acquisitions.
26. Finance lease liabilities
Finance lease liabilities are payable as follows:
In millions of EUR | Future minimum lease payments 2010 | Interest 2010 | Present value of minimum lease payments 2010 | Future minimum lease payments 2009 | Interest 2009 | Present value of minimum lease payments 2009 | ||||||||||||||||||
Less than one year | 49 | (1 | ) | 48 | 22 | (3 | ) | 19 | ||||||||||||||||
Between one and five years | 39 | (3 | ) | 36 | 76 | (9 | ) | 67 | ||||||||||||||||
More than five years | 13 | (2 | ) | 11 | 23 | (1 | ) | 22 | ||||||||||||||||
| 101 | (6 | ) | 95 | 121 | (13 | ) | 108 | |||||||||||||||||
Financial statements | Notes to the consolidated financial statementscontinued
| Future minimum lease payments | Interest | Present value of minimum lease payments | Future minimum lease payments | Interest | Present value of minimum lease payments | |||||||||||||||||||
In millions of EUR | 2012 | 2012 | 2012 | 2011 | 2011 | 2011 | ||||||||||||||||||
Less than one year | 16 | — | 16 | 7 | (1 | ) | 6 | |||||||||||||||||
Between one and five years | 21 | (1 | ) | 20 | 27 | (1 | ) | 26 | ||||||||||||||||
More than five years | 2 | — | 2 | 7 | — | 7 | ||||||||||||||||||
| 39 | (1 | ) | 38 | 41 | (2 | ) | 39 | |||||||||||||||||
|
|
|
|
|
|
|
|
|
|
|
| |||||||||||||
27. Non-GAAP measures
In the internal management reports HeinekenHEINEKEN measures its performance primarily based on EBIT and EBIT (beia), these are non-GAAP measures not calculated in accordance with IFRS. A similar non-GAAP adjustment can be made to the IFRS profit or loss as defined in IAS 1 paragraph 7 being the total of income less expense.
Exceptional items are defined as items of income and expense of such size, nature or incidence, that in the view of management their disclosure is relevant to explain the performance of HeinekenHEINEKEN for the period. The table below presents the relationship with IFRS terms,measures, the results from operating activities and profit and HeinekenHEINEKEN non-GAAP measures being EBIT, EBIT (beia) and profit (beia) for the financial year 2010.2012.
HEINEKEN updated its non-GAAP measure definition to properly present the future impact of intangibles recognised in the APIPL/APB acquisition. Two specific types of contract based intangible assets (beer licences and reacquired rights), that are similar to brands and customer relations, were added and HEINEKEN now refers to this group as acquisition related intangible assets. The update of the definition has no impact on prior years.
In millions of EUR | 2012* | 2011* | ||||||
Results from operating activities | 3,691 | 2,215 | ||||||
Share of profit of associates and joint ventures and impairments thereof (net of income tax) | 213 | 240 | ||||||
HEINEKEN EBIT | 3,904 | 2,455 | ||||||
Exceptional items and amortisation of acquisition related intangible assets included in EBIT | (992 | ) | 242 | |||||
HEINEKEN EBIT (beia) | 2,912 | 2,697 | ||||||
Profit attributable to equity holders of the Company | 2,949 | 1,430 | ||||||
Exceptional items and amortisation of acquisition related intangible assets included in EBIT | (992 | ) | 242 | |||||
Exceptional items included in finance costs | (206 | ) | (14 | ) | ||||
Exceptional items included in tax expense | (55 | ) | (74 | ) | ||||
HEINEKEN net profit beia | 1,696 | 1,584 | ||||||
|
|
|
| |||||
| * | ||||
| ||||
| ||||
| ||||
| ||||
| ||||
| ||||
| ||||
| ||||
| ||||
| ||||
| ||||
| unaudited | ||||
The 2012 exceptional items included in EBIT contain the amortisation of brandsacquisition related intangibles for EUR198 million (2011: EUR170 million). Additional exceptional items included in EBIT relating to the APIPL/APB acquisition are the gain on PHEI for EUR1,486 million, the reversal of the inventory fair value adjustment in cost of goods sold for EUR76 million and customer relations for EUR142acquisition related costs of EUR28 million. The total book gain on the saleremainder of MBI and GBNC as well as Waverley TBS for EUR199 million. The bankruptcy of a large on-trade customerEUR192 million primarily relates to restructuring activities in wholesale in Western Europe resultedfor EUR97 million, impairment of assets for EUR37 million, HEINEKEN’s share in impairmentsthe write-off of loans, receivables and guaranteesdeferred tax assets in an associate for a total of EUR70EUR36 million and Femsaadjustments to an acquisition and integration expense for EUR80 million. The remaining EUR39of EUR20 million relates to TCM expenses and one-off expenses due to contract terminations.outside the provisional period.
Exceptional items in the other net financing costs reflectcontain a pre-tax gain of EUR175 million for the sale of a minority stake in a brewery in the Dominican Republic, a book gain of the existing stake in BraNa of EUR20 million and fair value changes of interest hedges made byrate swaps of Scottish & Newcastle in the pastfor EUR11 million that do not qualify for hedge accounting under IFRS. accounting.
The exceptional items in the tax expense are EUR53 million (2011: EUR47 million) related to acquisition related intangibles and the remainder of EUR2 million represents the net impact of other exceptional items are for EUR39 million related to amortisation of brandsincluded in EBIT and customer relations and EUR27 million to the other exceptional items. Tax specific exceptional items are EUR52 million and relate to the finalisation of the Globe transaction as well as various other settlements with the UK tax authorities.finance cost.
EBIT and EBIT (beia) are not financial measures calculated in accordance with IFRS. The presentation on these financial measures may not be comparable to similarly titled measures reported by other companies due to differences in the ways the measures are calculated.
28. Employee benefits
In millions of EUR | 2010 | 2009 | 2012 | 2011 | ||||||||||||
Present value of unfunded obligations | 118 | 198 | 113 | 96 | ||||||||||||
Present value of funded obligations | 6,525 | 5,738 | 7,788 | 6,804 | ||||||||||||
Total present value of obligations | 6,643 | 5,936 | 7,901 | 6,900 | ||||||||||||
Fair value of plan assets | (5,646 | ) | (4,858 | ) | ||||||||||||
Fair value of defined benefit plan assets | (6,401 | ) | (5,860 | ) | ||||||||||||
Present value of net obligations | 997 | 1,078 | 1,500 | 1,040 | ||||||||||||
Actuarial (losses)/gains not recognised | (411 | ) | (548 | ) | ||||||||||||
Asset ceiling items | 1 | 14 | ||||||||||||||
Recognised liability for defined benefit obligations | 586 | 530 | 1,501 | 1,054 | ||||||||||||
Other long-term employee benefits | 101 | 104 | 131 | 120 | ||||||||||||
| 1,632 | 1,174 | |||||||||||||||
| 687 | 634 |
|
| |||||||||||||
PlanDefined benefit plan assets comprise:
In millions of EUR | 2010 | 2009 | 2012 | 2011 | ||||||||||||
Equity securities | 2,484 | 2,195 | 2,867 | 2,520 | ||||||||||||
Government bonds | 2,421 | 2,119 | 2,726 | 2,534 | ||||||||||||
Properties and real estate | 436 | 385 | 429 | 410 | ||||||||||||
Other plan assets | 305 | 159 | 379 | 396 | ||||||||||||
| 6,401 | 5,860 | |||||||||||||||
| 5,646 | 4,858 |
|
| |||||||||||||
Financial statements | NotesThe primary goal of the Heineken pension funds is to monitor the consolidated financial statementscontinued
28. Employee benefits continuedmix of debt and equity securities in its investment portfolio based on market expectations. Material investments within the portfolio are managed on an individual basis.
Liability for defined benefit obligations
HeinekenHEINEKEN makes contributions to a number of defined benefit plans that provide pension benefits for employees upon retirement in a number of countries being mainly:mainly the Netherlands and the UK (82 per cent of the total DBO). Other countries with a defined benefit plan are: Ireland, Greece, Austria, Italy, France, Spain, Mexico, Belgium, Switzerland, Portugal and Nigeria. In other countries the pension plans are defined contribution plans and/or similar arrangements for employees.
In Ireland the defined benefit scheme for employees (actives) was closed in 2012 and was replaced by a defined contribution scheme.
Other long-term employee benefits mainly relate to long-term bonus plans, termination benefits, medical plans and jubilee benefits.
Movements in the present value of the defined benefit obligations
In millions of EUR | 2010 | 2009 | 2012 | 2011 | ||||||||||||
Defined benefit obligations as at 1 January | 5,935 | 4,963 | 6,900 | 6,643 | ||||||||||||
Changes in consolidation and reclassification | 286 | (6 | ) | (1 | ) | — | ||||||||||
Effect of movements in exchange rates | 131 | 153 | 99 | 75 | ||||||||||||
Benefits paid | (298 | ) | (271 | ) | (326 | ) | (307 | ) | ||||||||
Employee contributions | 19 | 16 | 26 | 24 | ||||||||||||
Current service costs and interest on obligation (see below) | 411 | 363 | ||||||||||||||
Past service costs | (9 | ) | 12 | |||||||||||||
Current and past service costs and interest on obligation | 391 | 406 | ||||||||||||||
Effect of any curtailment or settlement | (15 | ) | (16 | ) | (41 | ) | (35 | ) | ||||||||
Actuarial (gains)/losses | 183 | 722 | ||||||||||||||
Actuarial (gains)/losses in other comprehensive income | 853 | 94 | ||||||||||||||
Defined benefit obligations as at 31 December | 6,643 | 5,936 | 7,901 | 6,900 | ||||||||||||
|
| |||||||||||||||
Movements in the present value of defined benefit plan assets
In millions of EUR | 2010 | 2009 | 2012 | 2011 | ||||||||||||
Fair value of plan assets as at 1 January | 4,858 | 4,231 | ||||||||||||||
Fair value of defined benefit plan assets as at 1 January | 5,860 | 5,646 | ||||||||||||||
Changes in consolidation and reclassification | 115 | (5 | ) | (1 | ) | — | ||||||||||
Effect of movements in exchange rates | 127 | 160 | 73 | 76 | ||||||||||||
Contributions paid into the plan | 226 | 157 | 182 | 145 | ||||||||||||
Benefits paid | (298 | ) | (255 | ) | (326 | ) | (307 | ) | ||||||||
Expected return on plan assets | 298 | 252 | ||||||||||||||
Actuarial gains/(losses) | 320 | 318 | ||||||||||||||
Expected return on defined benefit plan assets | 322 | 315 | ||||||||||||||
Actuarial gains/(losses) in other comprehensive income | 291 | (15 | ) | |||||||||||||
Fair value of defined benefit plan assets as at 31 December | 6,401 | 5,860 | ||||||||||||||
Actual return on defined benefit plan assets | 610 | 307 | ||||||||||||||
|
| |||||||||||||||
Fair value of plan assets as at 31 December | 5,646 | 4,858 | ||||||||||||||
Actual return on plan assets | 618 | 570 | ||||||||||||||
Expense recognised in profit or loss
In millions of EUR | Note | 2010 | 2009 | Note | 2012 | 2011 | ||||||||||||||||||
Current service costs | 77 | 70 | 63 | 71 | ||||||||||||||||||||
Interest on obligation | 334 | 293 | 330 | 340 | ||||||||||||||||||||
Expected return on plan assets | (298 | ) | (252 | ) | ||||||||||||||||||||
Actuarial gains and losses recognised | 15 | — | ||||||||||||||||||||||
Expected return on defined benefit plan assets | (322 | ) | (315 | ) | ||||||||||||||||||||
Past service costs | (9 | ) | 12 | (2 | ) | (5 | ) | |||||||||||||||||
Effect of any curtailment or settlement | (15 | ) | (16 | ) | (41 | ) | (35 | ) | ||||||||||||||||
| 10 | 28 | 56 | ||||||||||||||||||||||
| 10 | 104 | 107 |
|
| ||||||||||||||||||||
Financial statements | Notes to the consolidated financial statementscontinuedActuarial gains and losses recognised in other comprehensive income
In millions of EUR | 2012 | 2011 | ||||||
Amount accumulated in retained earnings at 1 January | 519 | 410 | ||||||
Recognised during the year | 562 | 109 | ||||||
Amount accumulated in retained earnings at 31 December | 1,081 | 519 | ||||||
|
|
|
| |||||
Principal actuarial assumptions as at the balance sheet date
The defined benefit plans in the Netherlands and the UK cover 86.887.4 per cent of the present value of the defined benefit plan assets (2009: 88.8(2011: 87.2 per cent) and 81.7, 82.2 per cent of the present value of the defined benefit obligations (2009: 86.3(2011: 82.8 per cent) and 60.1 per cent of the present value of net obligations (2011: 57.8 per cent) as at 31 December 2010. 2012.
For the Netherlands and the UK the following actuarial assumptions apply as at 31 December 2010:December:
| The Netherlands | 2010 | UK 2009 | The Netherlands | UK* | ||||||||||||||||||||||||||||
| 2010 | 2009 | 2012 | 2011 | 2012 | 2011 | |||||||||||||||||||||||||||
Discount rate as at 31 December | 5.1 | 5.3 | 5.4 | 5.7 | 3.0 | 4.6 | 4.4 | 4.7 | ||||||||||||||||||||||||
Expected return on plan assets as at 1 January | 5.7 | 6.3 | 6.4 | 6.3 | ||||||||||||||||||||||||||||
Expected return on defined benefit plan assets as at 1 January | 5.5 | 5.5 | 6.1 | 6.2 | ||||||||||||||||||||||||||||
Future salary increases | 3 | 3 | 4.6 | 4.8 | 2.0 | 3.0 | — | — | ||||||||||||||||||||||||
Future pension increases | 1.5 | 1.5 | 3 | 3 | 1.0 | 1.0 | 2.9 | 3.0 | ||||||||||||||||||||||||
Medical cost trend rate | — | — | 7 | 7 | — | — | — | — | ||||||||||||||||||||||||
|
|
|
| |||||||||||||||||||||||||||||
| * | The UK plan closed for future accruals leading to certain assumptions being equal to zero. |
For the other defined benefit plans the following actuarial assumptions apply as perat 31 December 2010:December:
| Other Western, Central and Eastern Europe | The Americas | Africa and the Middle East | Asia Pacific | Other Western, Central and Eastern Europe | The Americas | Africa and the Middle East | ||||||||||||||||||||||||||||||||||||||||||||||||||
| 2010 | 2009 | 2010 | 2009 | 2010 | 2009 | 2010 | 2009 | 2012 | 2011 | 2012 | 2011 | 2012 | 2011 | |||||||||||||||||||||||||||||||||||||||||||
Discount rate as at 31 December | 2.4-5.8 | 3.3-5.6 | 7-7.6 | 5.3-7 | 7-10 | 11 | — | — | 2.0-3.2 | 2.9-4.8 | 6.7 | 7.6-10.7 | 14.0 | 13.0 | ||||||||||||||||||||||||||||||||||||||||||
Expected return on plan assets as at 1 January | 2.9-7.3 | 3.5-6.6 | 6.5-8.2 | 6.5 | — | 11 | — | — | ||||||||||||||||||||||||||||||||||||||||||||||||
Expected return on defined benefit plan assets as at 1 January | 2.4-4.9 | 3.3-7.3 | 6.7 | 7.6 | — | — | ||||||||||||||||||||||||||||||||||||||||||||||||||
Future salary increases | 1-10 | 1.5-3.5 | 3.8-5.5 | 2.5-5.5 | 5-10 | 11 | — | — | 1.0-10.0 | 1.0-10.0 | 3.8 | 3.8 | 10.8 | 12.0 | ||||||||||||||||||||||||||||||||||||||||||
Future pension increases | 1-2.1 | 1-3 | 2.8-3 | — | — | 11 | — | — | 1.0-2.5 | 1.0-2.1 | 2.8 | 2.9 | — | — | ||||||||||||||||||||||||||||||||||||||||||
Medical cost trend rate | 3.5-4.5 | 3.5-4.5 | 5.1 | 5 | — | 10 | — | — | 3.4-4.5 | 3.5 | 5.1 | 5.1 | 10.0 | — | ||||||||||||||||||||||||||||||||||||||||||
|
|
|
|
|
| |||||||||||||||||||||||||||||||||||||||||||||||||||
Assumptions regarding future mortality rates are based on published statistics and mortality tables, with a relevant age setback.tables. For the Netherlands the rates are obtained from the ‘AG-Prognosetafel 2012-2062’, fully generational. Correction factors from TowersWatson are applied on these. For the UK the rates are obtained from the ContinuousContinuous Mortality Investigation 2012 projection model.
The overall expected long-term rate of return on assets is 65.6 per cent (2009: 6.1(2011: 5.5 per cent), which is based on the asset mix and the expected rate of return on each major asset class, as managed by the pension funds.
Assumed healthcare cost trend rates have no effect on the amounts recognised in profit or loss. A one percentage point change in assumed healthcare cost trend rates would not have any effect on profit or loss neither on the statement of financial position as at 31 December 2010.2012.
Based on the most recent triannialtri-annual review finalised in early 2010, HeinekenHEINEKEN has agreed a 12-year plan aimed at fundingaiming to fund the recovery of the Scottish & Newcastle pension fundPension Plan through additional Company contributions. These could total GBP504 million of which GBP35GBP65 million washas been paid during 2010.to December 2012. As at 31 December 20102012 the IAS 19 present value of the net obligations of the Scottish & Newcastle pension fundPension Plan represents a GBP409GBP331 million (EUR475(EUR405 million) deficit. No additional liability has to be recognised as the net present value of the minimum funding requirement does not exceed the net obligation. The next review of the funding position and the recovery plan will take place no later than around year-end 2012.commenced in October 2012 and is expected to be finalised during 2013.
The Group expects the 20112013 contributions to be paid for the defined benefit plansplan to be in line with 2010, excluding the additional GBP35 million additional payment made to the UK pension fund in 2010.2012.
Historical information
In millions of EUR | 2010 | 2009 | 2008 | 2007 | 2006 | |||||||||||||||
Present value of the defined benefit obligation | 6,643 | 5,936 | 4,963 | 2,858 | 2,984 | |||||||||||||||
Fair value of plan assets | (5,646 | ) | (4,858 | ) | (4,231 | ) | (2,535 | ) | (2,397 | ) | ||||||||||
Deficit in the plan | 997 | 1,078 | 732 | 323 | 587 | |||||||||||||||
Experience adjustments arising on plan liabilities, losses/(gains) | (24 | ) | (116 | ) | 71 | (4 | ) | (159 | ) | |||||||||||
Experience adjustments arising on plan assets, (losses)/gains | 320 | 313 | (817 | ) | 16 | 9 | ||||||||||||||
Financial statements | Notes to the consolidated financial statementscontinued
In millions of EUR | 2012 | 2011 | 2010 | 2009 | 2008 | |||||||||||||||
Present value of the defined benefit obligation | 7,901 | 6,900 | 6,643 | 5,936 | 4,963 | |||||||||||||||
Fair value of defined benefit plan assets | (6,401 | ) | (5,860 | ) | (5,646 | ) | (4,858 | ) | (4,231 | ) | ||||||||||
Deficit in the plan | 1,500 | 1,040 | 997 | 1,078 | 732 | |||||||||||||||
|
|
|
|
|
|
|
|
|
| |||||||||||
Experience adjustments arising on plan liabilities, losses/(gains) | (170 | ) | (30 | ) | (24 | ) | (116 | ) | 71 | |||||||||||
Experience adjustments arising on defined benefit plan assets, (losses)/gains | 291 | (15 | ) | 320 | 313 | (817 | ) | |||||||||||||
|
|
|
|
|
|
|
|
|
| |||||||||||
29. Share-based payments – Long-Term Incentive PlanVariable Award
As from 1 January 2005 HeinekenHEINEKEN established a performance-based share plan (Long-Term Incentive Plan; LTIP)Variable award; LTV) for the Executive Board. As from 1 January 2006 a similar LTIPplan was established for senior management. Under this LTV share rights are awarded to incumbents on an annual basis. The vesting of these rights is subject to the performance of Heineken N.V. on specific performance conditions over a three year period.
The LTIP 2008 – 2010performance conditions for LTV 2010-2012, LTV 2011-2013 and 2009 – 2011LTV 2012-2014 are the same for the Executive Board includes share rights, which are conditionally awarded to the Executive Board each year and are subject to Heineken’s Relative Total Shareholder Return (RTSR) performance in comparison with the TSR performance of a selected peer group.
The LTIP share rights conditionally awarded to senior management each year in the 2008 – 2010 plan and the 2009 – 2011 plan are for 25 per cent subject to Heineken’s RTSR performance and for 75 per cent subject to internal performance conditions.
The LTIP share rights conditioning awarded to senior management and the Executive Board for the 2010 – 2012 plan are fully subject tocomprise solely of internal performance conditions.
These performance conditionally arefinancial measures, being Organic Gross Profit beia growth, Organic EBIT beia growth, Earnings Per Share (EPS) beia growth and Free Operating Cash Flow.
At target performance, 100 per cent of the shares willawarded share rights vest. At threshold performance, 50 per cent of the awarded share rights vest. As from LTV 2011-2013 at maximum performance 200 per cent of the awarded share rights vest for the Executive Board as well as senior managers contracted by the US, Mexico and Brazil, and 175 per cent vest for all other senior managers. For LTV 2010-2012 the maximum vesting is 150 per cent of the shares will vest.target vesting for all participants.
The performance period for share rights granted in 2008 is2010 was from 1 January 20082010 to 31 December 2010.2012. The performance period for share rights granted in 2009 was2011 is from 1 January 20092011 to 31 December 2011.2013. The performance period for the share rights granted in 20102012 is from 1 January 20102012 to 31 December 2012.
2014. The vesting date for the Executive Board is within five business days, and for senior management the latest of 1 April and 20 business days after the publication of the annual results of 2009, 2010, 20112012, 2013 and 20122014 respectively.
As HeinekenHEINEKEN will withhold the tax related to vesting on behalf of the individual employees, the number of Heineken N.V. shares to be received by the Executive Board and senior management will be a net number.
The terms and conditions of the share rights granted are as follows:
Grant date/employees entitled | Number* | Based on share price | Vesting conditions | Contractual life of rights | ||||||||||
Share rights granted to Executive Board in 2008 | 26,288 | 44.22 | Continued service and RTSR performance | 3 years | ||||||||||
Share rights granted to senior management in 2008 | 263,958 | 44.22 | Continued service, 75% internal performance conditions and 25% RTSR performance | 3 years | ||||||||||
Share rights granted to Executive Board in 2009 | 53,083 | 21.90 | Continued service and RTSR performance | 3 years | ||||||||||
Share rights granted to senior management in 2009 | 562,862 | 21.90 | Continued service, 75% internal performance conditions and 25% RTSR performance | 3 years | ||||||||||
Share rights granted to Executive Board in 2010 | 55,229 | 33.27 | Continued service, 100% internal performance conditions | 3 years | ||||||||||
Share rights granted to senior management in 2010 | 516,765 | 33.27 | Continued service, 100% internal performance conditions | 3 years | ||||||||||
| 1,478,185 | ||||||||||||||
Grant date/employees entitled | Number* | Based on share price | Vesting conditions | Contractual life of rights | ||||||||||
Share rights granted to Executive Board in 2010 | 55,229 | 33.27 | Continued service, 100% internal performance conditions | 3 years | ||||||||||
Share rights granted to senior management in 2010 | 516,765 | 33.27 | Continued service, 100% internal performance conditions | 3 years | ||||||||||
Share rights granted to Executive Board in 2011 | 65,072 | 36.69 | Continued service, 100% internal performance conditions | 3 years | ||||||||||
Share rights granted to senior management in 2011 | 730,090 | 36.69 | Continued service, 100% internal performance conditions | 3 years | ||||||||||
Share rights granted to Executive Board in 2012 | 66,746 | 35.77 | Continued service, 100% internal performance conditions | 3 years | ||||||||||
Share rights granted to senior management in 2012 | 703,382 | 35.77 | Continued service, 100% internal performance conditions | 3 years | ||||||||||
|
|
|
| |||||||||||
| * | The number of shares is based on target performance. |
No vesting occurred under the 2009-2011 LTV of the Executive Board. A total of 615,967 (gross) shares vested under the 2009-2011 LTV of senior management.
Based on RTSR and internal performance, it is expected that approximately 218,903328,346 shares of the 2010-2012 LTV will vest in 20112013 for senior management. No vesting occurredmanagement and Executive Board.
The number – as corrected for the expected performance for the various awards – and weighted average share price per share under the LTV of senior management and Executive Board.Board are as follows:
| Weighted average share price 2012 | Number of share rights 2012 | Weighted average share price 2011 | Number of share rights 2011 | |||||||||||||
Outstanding as at 1 January | 29.14 | 1,546,514 | 30.11 | 1,575,880 | ||||||||||||
Granted during the year | 35.77 | 770,128 | 36.69 | 795,162 | ||||||||||||
Forfeited during the year | 35.44 | (99,391 | ) | 31.73 | (119,856 | ) | ||||||||||
Vested during the year | 21.90 | (615,967 | ) | 44.22 | (234,485 | ) | ||||||||||
Performance adjustment | — | (243,458 | ) | — | (470,187 | ) | ||||||||||
Outstanding as at 31 December | 35.42 | 1,357,826 | 29.14 | 1,546,514 | ||||||||||||
|
|
|
|
|
|
|
| |||||||||
Under the extraordinary share plans 16,700 shares were granted and 2,192 (gross) shares vested. These extraordinary grants only have a service condition and vest between 1 and 5 years. The expenses relating to these expected additional grants are recognised in profit or loss during the performancevesting period.
Financial statements | Notes to the consolidated financial statementscontinued
The number and weighted average share price per share is as follows:
| Weighted average share price 2010 | Number of share rights 2010 | Weighted average share price 2009 | Number of share rights 2009 | |||||||||||||
Outstanding as at 1 January | 31.17 | 1,153,748 | 37.48 | 905,537 | ||||||||||||
Granted during the year | 33.44 | 571,994 | 21.90 | 615,945 | ||||||||||||
Forfeited during the year | (102,510 | ) | — | (74,813 | ) | |||||||||||
Vested during the year | (262,048 | ) | — | (292,921 | ) | |||||||||||
Outstanding as at 31 December | 30.70 | 1,361,184 | 31.17 | 1,153,748 | ||||||||||||
The 262,048 (gross) shares vested Expenses recognised in 20102012 are related to the 2007 – 2009 LTIP of senior management. No vesting occurred under the 2007 – 2009 LTIP of the Executive Board.EUR1.1 million (2011: EUR0.4 million).
The fair value of services received in return for share rights granted is based on the fair value of shares granted, measured using the Monte Carlo model, with following inputs:
In EUR | Executive Board 2009 | Senior management 2009 | ||||||
Fair value at grant date | 512,359 | 8,478,659 | ||||||
Expected volatility | 22.8 | % | 22.8 | % | ||||
Expected dividends | 2.1 | % | 2.1 | % | ||||
Personnel expenses
In millions of EUR | Note | 2010 | 2009 | |||||||||
Share rights granted in 2007 | — | 3 | ||||||||||
Share rights granted in 2008 | 3 | 3 | ||||||||||
Share rights granted in 2009 | 5 | 4 | ||||||||||
Share rights granted in 2010 | 7 | — | ||||||||||
Total expense recognised as personnel expenses | 10 | 15 | 10 | |||||||||
In millions of EUR Share rights granted in 2009 Share rights granted in 2010 Share rights granted in 2011 Share rights granted in 2012 Total expense recognised as personnel expenses In the 2010 LTIP expense an amount of EUR0.5 million is included for some extraordinary grants that only have a service condition and vest between 1 and 5 years. Total granted shares amount to 32,132 shares. Note 2012 2011 — 5 5 1 2 5 5 — 10 12 11
Financial statements | Notes to the consolidated financial statementscontinued
30. Provisions
In millions of EUR | Note | Restructuring | Onerous contracts | Other | Total | Note | Restructuring | Onerous contracts | Other | Total | ||||||||||||||||||||||||||||||
Balance as at 1 January 2010 | 171 | 55 | 292 | 518 | ||||||||||||||||||||||||||||||||||||
Balance as at 1 January 2012 | 151 | 42 | 396 | 589 | ||||||||||||||||||||||||||||||||||||
Changes in consolidation | 6 | (2 | ) | (4 | ) | 154 | 148 | 6 | 1 | — | 2 | 3 | ||||||||||||||||||||||||||||
Provisions made during the year | 50 | 48 | 132 | 230 | 50 | 6 | 70 | 126 | ||||||||||||||||||||||||||||||||
Provisions used during the year | (87 | ) | (38 | ) | (116 | ) | (241 | ) | (57 | ) | (10 | ) | (29 | ) | (96 | ) | ||||||||||||||||||||||||
Provisions reversed during the year | (23 | ) | (9 | ) | (50 | ) | (82 | ) | (11 | ) | (4 | ) | (58 | ) | (73 | ) | ||||||||||||||||||||||||
Effect of movements in exchange rates | 2 | 2 | 12 | 16 | — | 1 | (16 | ) | (15 | ) | ||||||||||||||||||||||||||||||
Unwinding of discounts | 1 | 1 | 7 | 9 | 4 | — | 9 | 13 | ||||||||||||||||||||||||||||||||
Balance as at 31 December 2010 | 112 | 55 | 431 | 598 | ||||||||||||||||||||||||||||||||||||
Balance as at 31 December 2012 | 138 | 35 | 374 | 547 | ||||||||||||||||||||||||||||||||||||
|
|
|
| |||||||||||||||||||||||||||||||||||||
Non-current | 59 | 40 | 376 | 475 | 86 | 24 | 308 | 418 | ||||||||||||||||||||||||||||||||
Current | 53 | 15 | 55 | 123 | 52 | 11 | 66 | 129 | ||||||||||||||||||||||||||||||||
| 138 | 35 | 374 | 547 | |||||||||||||||||||||||||||||||||||||
| 112 | 55 | 431 | 598 |
|
|
|
| |||||||||||||||||||||||||||||||||
Restructuring
The provision for restructuring of EUR112EUR138 million mainly relates to restructuring programmes in Spain, the Netherlands and the UK.Italy.
Other provisions
Included are, amongst others, surety and guarantees provided EUR56EUR23 million (2009: EUR61(2011: EUR27 million), litigations and litigation and claims EUR230EUR202 million (2009: EUR50 million) and environmental provisions EUR4 million (2009: EUR8(2011: EUR207 million).
31. Trade and other payables
In millions of EUR | Note | 2010 | 2009 | |||||||||
Trade payables | 1,660 | 1,361 | ||||||||||
Returnable packaging deposits | 434 | 408 | ||||||||||
Taxation and social security contributions | 652 | 551 | ||||||||||
Dividend | 53 | 24 | ||||||||||
Interest | 97 | 134 | ||||||||||
Derivatives | 66 | 94 | ||||||||||
Share purchase mandate | 96 | — | ||||||||||
Other payables | 298 | 233 | ||||||||||
Accruals and deferred income | 909 | 891 | ||||||||||
| 32 | 4,265 | 3,696 | ||||||||||
Financial statements | Notes to the consolidated financial statementscontinued
In millions of EUR | Note | 2012 | 2011 | |||||||||
Trade payables | 2,244 | 2,009 | ||||||||||
Returnable packaging deposits | 512 | 490 | ||||||||||
Taxation and social security contributions | 751 | 665 | ||||||||||
Dividend | 47 | 33 | ||||||||||
Interest | 204 | 100 | ||||||||||
Derivatives | 53 | 164 | ||||||||||
Other payables | 299 | 243 | ||||||||||
Accruals and deferred income | 1,163 | 920 | ||||||||||
| 32 | 5,273 | 4,624 | ||||||||||
|
|
|
| |||||||||
32. Financial risk management and financial instruments
Overview
HeinekenHEINEKEN has exposure to the following risks from its use of financial instruments, as they arise in the normal course of Heineken’sHEINEKEN’s business:
Credit risk
Liquidity risk
Market risk.
This note presents information about Heineken’sHEINEKEN’s exposure to each of the above risks, and it summarises Heineken’sHEINEKEN’s policies and processes that are in place for measuring and managing risk, including those related to capital management. Further quantitative disclosures are included throughout these consolidated financial statements.
Risk management framework
The Executive Board, under the supervision of the Supervisory Board, has overall responsibility and sets rules for Heineken’sHEINEKEN’s risk management and control systems. They are reviewed regularly to reflect changes in market conditions and the Group’s activities. The Executive Board oversees the adequacy and functioning of the entire system of risk management and internal control, assisted by Group departments.
The Global Treasury function focuses primarily on the management of financial risk and financial resources. Some of the risk management strategies include the use of derivatives, primarily in the form of spot and forward exchange contracts and interest rate swaps, but options can be used as well. It is the Group policy that no speculative transactions are entered into.
Credit risk
Credit risk is the risk of financial loss to HeinekenHEINEKEN if a customer or counterparty to a financial instrument fails to meet its contractual obligations, and arises principally from Heineken’sHEINEKEN’s receivables from customers and investment securities.
The economic crisis has impacted our regular business activities and performance, in particular in consumer spending and solvency. However, the business impact differed across the regions and operations. Local management has assessed the risk exposure following Group instructions and is taking action to mitigate the higher than usual risks. Intensified and continuous focus is being given in the areas of customers (managing trade receivables and loans) and suppliers (financial position of critical suppliers).
As at the balance sheet date there were no significant concentrations of credit risk. The maximum exposure to credit risk is represented by the carrying amount of each financial instrument, including derivative financial instruments, in the consolidated statement of financial position.
Loans to customers
Heineken’sHEINEKEN’s exposure to credit risk is mainly influenced by the individual characteristics of each customer.
Heineken’s HEINEKEN’s held-to-maturity investments includes loans to customers, issued based on a loan contract.
Loans to customers are ideally secured by, amongst others, rights on property or intangible assets, such as the right to take possession of the premises of the customer. Interest rates calculated by HeinekenHEINEKEN are at least based on the risk-free rate plus a margin, which takes into account the risk profile of the customer and value of security given.
HeinekenHEINEKEN establishes an allowance for impairment of loans that represents its estimate of incurred losses. The main components of this allowance are a specific loss component that relates to individually significant exposures, and a collective loss component established for groups of similar customers in respect of losses that have been incurred but not yet identified. The collective loss allowance is determined based on historical data of payment statistics.
In a few countries the issueissuance of new loans is outsourced to third parties. In most cases, HeinekenHEINEKEN issues sureties (guarantees) to the third party for the risk of default ofby the customer. Heineken in return receives a fee.
Financial statements | Notes to the consolidated financial statementscontinued
32. Financial risk management and financial instruments continued
Trade and other receivables
Heineken’sHEINEKEN’s local management has credit policies in place and the exposure to credit risk is monitored on an ongoing basis. Under the credit policies all customers requiring credit over a certain amount are reviewed and new customers are analysed individually for creditworthiness before Heineken’sHEINEKEN’s standard payment and delivery terms and conditions are offered. Heineken’sHEINEKEN’s review includes external ratings, where available, and in some cases bank references. Purchase limits are established for each customer and these limits are reviewed regularly. As a result of the deteriorating economic circumstances insince 2008, and 2009, certain purchase limits have been redefined. Customers that fail to meet Heineken’sHEINEKEN’s benchmark creditworthiness may transact with HeinekenHEINEKEN only on a prepayment basis.
In monitoring customer credit risk, customers are, on a country base, grouped according to their credit characteristics, including whether they are an individual or legal entity, which type of distribution channel they represent, geographic location, industry, ageing profile, maturity and existence of previous financial difficulties. Customers that are graded as ‘high risk’ are placed on a restricted customer list, and future sales are made on a prepayment basis only with approval of Management.
HeinekenHEINEKEN has multiple distribution models to deliver goods to end customers. Deliveries are done in some countries via own wholesalers, in other markets directly and in some others via third parties. As such distribution models are country specific and on consolidated level diverse, as such the results and the balance sheet items cannot be split between types of customers on a consolidated basis. The various distribution models are also not centrally managed or monitored.
HeinekenHEINEKEN establishes an allowance for impairment that represents its estimate of incurred losses in respect of trade and other receivables and investments. The components of this allowance are a specific loss component and a collective loss component.
Advances to customers
Advances to customers relate to an upfront cash-discount to customers, for whichcustomers. The advances are amortised over the amortised amounts are deducted fromterm of the revenue oncontract as a straight-line basis.reduction of revenue.
In monitoring customer credit risk, refer to the paragraph above relating to trade and other receivables.
Investments
HeinekenHEINEKEN limits its exposure to credit risk by only investing available cash balances in liquid securities and only with counterparties that have a credit rating of at least single A or equivalent for short-term transactions and AA- for long-term transactions. HeinekenHEINEKEN actively monitors these credit ratings.
Guarantees
Heineken’sHEINEKEN’s policy is to avoid issuing guarantees where possible unless this leads to substantial savingsbenefits for the Group. In cases where HeinekenHEINEKEN does provide guarantees, such as to banks for loans (to third parties), HeinekenHEINEKEN aims to receive security from the third party.
Heineken N.V. has issued a joint and several liability statement to the provisions of Section 403, Part 9, Book 2 of the Dutch Civil Code with respect to legal entities established in the Netherlands.
Financial statements | Notes to the consolidated financial statementscontinued
Exposure to credit risk
The carrying amount of financial assets represents the maximum credit exposure. The maximum exposure to credit risk at the reporting date was:
In millions of EUR | Note | 2010 | 2009 | Note | 2012 | 2011 | ||||||||||||||||||
Loans | 17 | 455 | 329 | |||||||||||||||||||||
Loans and advances to customers | 17 | 368 | 384 | |||||||||||||||||||||
Indemnification receivable | 17 | 145 | — | 17 | 136 | 156 | ||||||||||||||||||
Other long term receivables | 17 | 174 | — | |||||||||||||||||||||
Other long-term receivables | 17 | 148 | 178 | |||||||||||||||||||||
Held-to-maturity investments | 17 | 4 | 4 | 17 | 4 | 5 | ||||||||||||||||||
Available-for-sale investments | 17 | 190 | 219 | 17 | 327 | 264 | ||||||||||||||||||
Non-current derivatives | 17 | 135 | 16 | 17 | 116 | 142 | ||||||||||||||||||
Investments held for trading | 17 | 17 | 15 | 17 | 11 | 14 | ||||||||||||||||||
Trade and other receivables, excluding derivatives | 20 | 2,263 | 2,261 | |||||||||||||||||||||
Trade and other receivables, excluding current derivatives | 20 | 2,500 | 2,223 | |||||||||||||||||||||
Current derivatives | 20 | 10 | 49 | 20 | 37 | 37 | ||||||||||||||||||
Cash and cash equivalents | 21 | 610 | 520 | 21 | 1,037 | 813 | ||||||||||||||||||
| 4,684 | 4,216 | |||||||||||||||||||||||
| 4,003 | 3,413 |
|
| |||||||||||||||||||||
The maximum exposure to credit risk for trade and other receivables (excluding derivatives) at the reporting date by geographic region was:
In millions of EUR | 2010 | 2009 | 2012 | 2011 | ||||||||||||
Western Europe | 997 | 1,256 | 978 | 1,038 | ||||||||||||
Central and Eastern Europe | 458 | 554 | 502 | 448 | ||||||||||||
The Americas | 497 | 134 | 225 | 405 | ||||||||||||
Africa and the Middle East | 151 | 131 | 448 | 166 | ||||||||||||
Asia Pacific | 19 | 32 | 214 | 19 | ||||||||||||
Head Office/eliminations | 141 | 154 | 133 | 147 | ||||||||||||
| 2,500 | 2,223 | |||||||||||||||
| 2,263 | 2,261 |
|
| |||||||||||||
Impairment losses
The ageing of trade and other receivables (excluding derivatives) at the reporting date was:
In millions of EUR | Gross 2010 | Impairment 2010 | Gross 2009 | Impairment 2009 | ||||||||||||
Not past due | 1,894 | (49 | ) | 1,895 | (34 | ) | ||||||||||
Past due 0 – 30 days | 250 | (21 | ) | 202 | (26 | ) | ||||||||||
Past due 31 – 120 days | 271 | (106 | ) | 198 | (67 | ) | ||||||||||
More than 120 days | 250 | (226 | ) | 300 | (207 | ) | ||||||||||
| 2,665 | (402 | ) | 2,595 | (334 | ) | |||||||||||
Financial statements | Notes to the consolidated financial statementscontinued
32. Financial risk management and financial instruments continued
In millions of EUR | Gross 2012 | Impairment 2012 | Gross 2011 | Impairment 2011 | ||||||||||||
Not past due | 2,052 | (49 | ) | 1,909 | (67 | ) | ||||||||||
Past due 0 – 30 days | 323 | (14 | ) | 233 | (17 | ) | ||||||||||
Past due 31 – 120 days | 213 | (67 | ) | 210 | (83 | ) | ||||||||||
More than 120 days | 373 | (331 | ) | 349 | (311 | ) | ||||||||||
| 2,961 | (461 | ) | 2,701 | (478 | ) | |||||||||||
|
|
|
|
|
|
|
| |||||||||
The movement in the allowance for impairment in respect of trade and other receivables (excluding derivatives) during the year was as follows:
In millions of EUR | 2010 | 2009 | 2012 | 2011 | ||||||||||||
Balance as at 1 January | 334 | 280 | 478 | 446 | ||||||||||||
Changes in consolidation | — | 1 | 1 | — | ||||||||||||
Impairment loss recognised | 168 | 109 | 104 | 104 | ||||||||||||
Allowance used | (52 | ) | (26 | ) | (60 | ) | (17 | ) | ||||||||
Allowance released | (53 | ) | (45 | ) | (66 | ) | (47 | ) | ||||||||
Effect of movements in exchange rates | 5 | 15 | 4 | (8 | ) | |||||||||||
Balance as at 31 December | 402 | 334 | 461 | 478 | ||||||||||||
|
| |||||||||||||||
The movement in the allowance for impairment in respect of loans during the year was as follows:
In millions of EUR | 2010 | 2009 | 2012 | 2011 | ||||||||||||
Balance as at 1 January | 185 | 177 | 170 | 171 | ||||||||||||
Changes in consolidation | (8 | ) | — | — | — | |||||||||||
Impairment loss recognised | 37 | 48 | 38 | 10 | ||||||||||||
Allowance used | (23 | ) | (27 | ) | — | (3 | ) | |||||||||
Allowance released | (2 | ) | (9 | ) | (53 | ) | (9 | ) | ||||||||
Effect of movements in exchange rates | 2 | (4 | ) | 3 | 1 | |||||||||||
Balance as at 31 December | 191 | 185 | 158 | 170 | ||||||||||||
|
| |||||||||||||||
Impairment losses recognised for trade and other receivables (excluding derivatives) and loans are part of the other non-cash items in the consolidated statement of cash flows.
The income statement impact of EUR35EUR15 million (2009: EUR39(2011: EUR1 million) in respect of loans and the income statement impact of EUR115EUR38 million (2009: EUR64(2011: EUR57 million) in respect of trade receivables (excluding derivatives) were included in expenses for raw materials, consumables and services.
The allowance accounts in respect of trade and other receivables and held-to-maturity investments are used to record impairment losses, unless HeinekenHEINEKEN is satisfied that no recovery of the amount owing is possible, at that point the amount considered irrecoverable is written off against the financial asset.
Liquidity risk
Liquidity risk is the risk that HeinekenHEINEKEN will encounter difficulty in meeting the obligations associated with its financial liabilities that are settled by delivering cash or another financial asset. Heineken’sHEINEKEN’s approach to managing liquidity is to ensure, as far as possible, that it will always have sufficient liquidity to meet its liabilities when due, under both normal and stressed conditions, without incurring unacceptable losses or risking damage to Heineken’sHEINEKEN’s reputation.
Recent times have proven the credit markets situation could be such that it is difficult to generate capital to finance long-term growth of the Company. Although currently the situation is more stable, the Company has a clear focus on ensuring sufficient access to capital markets to finance long-term growth and to refinance maturing debt obligations. Financing strategies are under continuous evaluation. In addition, the Company focuses on a further fine-tuning of the maturity profile of its long-term debts with its forecasted operating cash flows. Strong cost and cash management and controls over investment proposals are in place to ensure effective and efficient allocation of financial resources.
Financial statements | Notes to the consolidated financial statementscontinued
Contractual maturities
The following are the contractual maturities of non-derivative financial liabilities and derivative financial assets and liabilities, including interest payments and excluding the impact of netting agreements:
In millions of EUR | Carrying amount | Contractual cash flows | 6 months or less | 6-12 months | 1-2 years | 2-5 years | 2010 More than 5 years | |||||||||||||||||||||
Financial liabilities | ||||||||||||||||||||||||||||
Secured bank loans | 59 | (64 | ) | (5 | ) | (7 | ) | (16 | ) | (34 | ) | (2 | ) | |||||||||||||||
Unsecured bank loans | 3,606 | (3,788 | ) | (228 | ) | (174 | ) | (387 | ) | (2,670 | ) | (329 | ) | |||||||||||||||
Unsecured bond issues | 2,482 | (3,135 | ) | (105 | ) | (49 | ) | (153 | ) | (2,410 | ) | (419 | ) | |||||||||||||||
Finance lease liabilities | 95 | (104 | ) | (47 | ) | (6 | ) | (8 | ) | (29 | ) | (12 | ) | |||||||||||||||
Other interest-bearing liabilities | 1,927 | (2,420 | ) | (62 | ) | (70 | ) | (266 | ) | (944 | ) | (1,078 | ) | |||||||||||||||
Non-interest-bearing liabilities | 55 | (58 | ) | (37 | ) | (1 | ) | (7 | ) | (11 | ) | (2 | ) | |||||||||||||||
Deposits from third parties | 425 | (425 | ) | (422 | ) | (3 | ) | — | — | — | ||||||||||||||||||
Bank overdrafts | 132 | (137 | ) | (90 | ) | (48 | ) | — | — | — | ||||||||||||||||||
Trade and other payables, excluding interest, dividends and derivatives | 4,049 | (4,073 | ) | (3,668 | ) | (405 | ) | — | — | — | ||||||||||||||||||
Derivative financial (assets) and liabilities | ||||||||||||||||||||||||||||
Interest rate swaps used for hedge accounting | ||||||||||||||||||||||||||||
Inflow | (121 | ) | 2,911 | 107 | 52 | 266 | 1,484 | 1,002 | ||||||||||||||||||||
Outflow | 244 | (2,998 | ) | (96 | ) | (88 | ) | (297 | ) | (1,562 | ) | (955 | ) | |||||||||||||||
Forward exchange contracts used for hedge accounting: | ||||||||||||||||||||||||||||
Inflow | (11 | ) | 1,411 | 542 | 580 | 288 | — | — | ||||||||||||||||||||
Outflow | 18 | (1,427 | ) | (567 | ) | (575 | ) | (284 | ) | — | — | |||||||||||||||||
Commodity swaps contracts used for hedge accounting | ||||||||||||||||||||||||||||
Inflow | (26 | ) | 26 | 7 | 1 | 18 | 1 | — | ||||||||||||||||||||
Outflow | 33 | (33 | ) | (7 | ) | (8 | ) | (15 | ) | (3 | ) | — | ||||||||||||||||
Other derivatives not used for hedge accounting, net | 75 | (121 | ) | (52 | ) | (26 | ) | (15 | ) | (29 | ) | — | ||||||||||||||||
| 13,042 | (14,435 | ) | (4,730 | ) | (827 | ) | (876 | ) | (6,207 | ) | (1,795 | ) | ||||||||||||||||
Financial statements | Notes to the consolidated financial statementscontinued
In millions of EUR | Carrying amount | Contractual cash flows | Less than 1 year | 1-2 years | 2-5 years | 2012 More than 5 years | ||||||||||||||||||
Financial liabilities | ||||||||||||||||||||||||
Interest-bearing liabilities | (13,360 | ) | (15,900 | ) | (2,683 | ) | (2,277 | ) | (4,192 | ) | (6,748 | ) | ||||||||||||
Non-interest-bearing liabilities | (21 | ) | (47 | ) | (8 | ) | (22 | ) | (13 | ) | (4 | ) | ||||||||||||
Trade and other payables, excluding interest dividends and derivatives | (4,969 | ) | (4,969 | ) | (4,969 | ) | — | — | — | |||||||||||||||
Derivative financial assets and (liabilities) | ||||||||||||||||||||||||
Interest rate swaps used for hedge accounting, net | 12 | 46 | 33 | (114 | ) | 85 | 42 | |||||||||||||||||
Forward exchange contracts used for hedge accounting, net | 10 | 7 | 4 | 3 | — | — | ||||||||||||||||||
Commodity derivatives used for hedge accounting, net | (22 | ) | (21 | ) | (20 | ) | (1 | ) | — | — | ||||||||||||||
Derivatives not used for hedge accounting, net | (11 | ) | (17 | ) | (16 | ) | (1 | ) | — | — | ||||||||||||||
| (18,361 | ) | (20,901 | ) | (7,659 | ) | (2,412 | ) | (4,120 | ) | (6,710 | ) | |||||||||||||
|
|
|
|
|
|
|
|
|
|
|
| |||||||||||||
32. Financial risk management and financial instruments continued
The total carrying amount and contractual cash flows of derivatives are included in trade and other receivables (note 20), other investments (note 17) and trade and other payables (note 31) and non-current non-interest bearing liabilities (note 25).
In millions of EUR | Carrying amount | Contractual cash flows | 6 months or less | 6-12 months | 1-2 years | 2-5 years | 2009 More than 5 years | |||||||||||||||||||||
Financial liabilities | ||||||||||||||||||||||||||||
Secured bank loans | 275 | (304 | ) | (13 | ) | (16 | ) | (89 | ) | (153 | ) | (33 | ) | |||||||||||||||
Unsecured bank loans | 3,036 | (3,249 | ) | (96 | ) | (170 | ) | (1,375 | ) | (1,263 | ) | (345 | ) | |||||||||||||||
Unsecured bond issues | 2,945 | (3,786 | ) | (626 | ) | (49 | ) | (152 | ) | (2,032 | ) | (927 | ) | |||||||||||||||
Finance lease liabilities | 108 | (114 | ) | (10 | ) | (9 | ) | (15 | ) | (49 | ) | (31 | ) | |||||||||||||||
Other interest-bearing liabilities | 1,342 | (1,690 | ) | (91 | ) | (54 | ) | (67 | ) | (803 | ) | (675 | ) | |||||||||||||||
Non-interest-bearing liabilities | 93 | (120 | ) | (20 | ) | (23 | ) | (31 | ) | (45 | ) | (1 | ) | |||||||||||||||
Deposits from third parties | 377 | (377 | ) | (368 | ) | (9 | ) | — | — | — | ||||||||||||||||||
Bank overdrafts | 156 | (156 | ) | (156 | ) | — | — | — | — | |||||||||||||||||||
Trade and other payables, excluding interest, dividends and derivatives | 3,444 | (3,444 | ) | (3,278 | ) | (166 | ) | — | — | — | ||||||||||||||||||
Derivative financial (assets) and liabilities | ||||||||||||||||||||||||||||
Interest rate swaps used for hedge accounting | ||||||||||||||||||||||||||||
Inflow | (17 | ) | 1,490 | 43 | 36 | 88 | 732 | 591 | ||||||||||||||||||||
Outflow | 438 | (1,819 | ) | (74 | ) | (89 | ) | (102 | ) | (965 | ) | (589 | ) | |||||||||||||||
Forward exchange contracts used for hedge accounting: | ||||||||||||||||||||||||||||
Inflow | (48 | ) | 1,015 | 615 | 282 | 118 | — | — | ||||||||||||||||||||
Outflow | 26 | (996 | ) | (608 | ) | (268 | ) | (120 | ) | — | — | |||||||||||||||||
| 12,175 | (13,550 | ) | (4,682 | ) | (535 | ) | (1,745 | ) | (4,578 | ) | (2,010 | ) | ||||||||||||||||
In millions of EUR | Carrying amount | Contractual cash flows | Less than 1 year | 1-2 years | 2-5 years | 2011 More than 5 years | ||||||||||||||||||
Financial liabilities | ||||||||||||||||||||||||
Interest-bearing liabilities | (9,183 | ) | (10,287 | ) | (1,543 | ) | (2,864 | ) | (4,794 | ) | (1,086 | ) | ||||||||||||
Non-interest-bearing liabilities | (27 | ) | (20 | ) | 7 | (16 | ) | (5 | ) | (6 | ) | |||||||||||||
Trade and other payables, excluding interest, dividends and derivatives | (4,327 | ) | (4,327 | ) | (4,327 | ) | — | — | — | |||||||||||||||
Derivative financial assets and (liabilities) | ||||||||||||||||||||||||
Interest rate swaps used for hedge accounting, net | 12 | 9 | (42 | ) | 26 | (42 | ) | 67 | ||||||||||||||||
Forward exchange contracts used for hedge accounting, net | (46 | ) | (43 | ) | (35 | ) | (8 | ) | — | — | ||||||||||||||
Commodity derivatives used for hedge accounting, net | (26 | ) | (26 | ) | (22 | ) | (4 | ) | — | — | ||||||||||||||
Derivatives not used for hedge accounting, net | (102 | ) | (97 | ) | (86 | ) | (10 | ) | (1 | ) | — | |||||||||||||
| (13,699 | ) | (14,791 | ) | (6,048 | ) | (2,876 | ) | (4,842 | ) | (1,025 | ) | |||||||||||||
|
|
|
|
|
|
|
|
|
|
|
| |||||||||||||
The total carrying amount and contractual cash flows of derivatives are included in trade and other receivables (note 20), other investments (note 17), trade and other payables (note 31) and non-current non-interest bearingnon-interest-bearing liabilities (note 25).
Market risk
Market risk is the risk that changes in market prices, such as foreign exchange rates, interest rates, commodity prices and equity prices will affect Heineken’sHEINEKEN’s income or the value of its holdings of financial instruments. The objective of market risk management is to manage and control market risk exposures within acceptable parameters, whilst optimising the return on risk.
HeinekenHEINEKEN uses derivatives in the ordinary course of business, and also incurs financial liabilities, in order to manage market risks. Generally, HeinekenHEINEKEN seeks to apply hedge accounting or make use of natural hedges in order to minimise the effects of foreign currency fluctuations in profit or loss.
Derivatives that can be used are interest rate swaps, forward rate agreements, caps and floors, commodity swaps, spot and forward exchange contracts and options. Transactions are entered into with a limited number of counterparties with strong credit ratings. Foreign currency, interest rate and commodity hedging operations are governed by internal policies and rules approved and monitored by the Executive Board.
Foreign currency risk
HeinekenHEINEKEN is exposed to foreign currency risk on sales, purchases and borrowings that are denominated in a currency other than the respective functional currencies of HeinekenHEINEKEN entities. The main currencies that give rise to this risk are the US dollar, euro and British pound.
In managing foreign currency risk, HeinekenHEINEKEN aims to reduce the impact of short-term fluctuations on earnings. Over the longer term, however, permanent changes in foreign exchange rates would have an impact on profit.
Financial statements | Notes to the consolidated financial statementscontinued
HeinekenHEINEKEN hedges up to 90 per cent of its mainly intra-Heinekenintra-HEINEKEN US dollar cash flows on the basis of rolling cash flow forecasts in respect to forecasted sales and purchases. Cash flows in other foreign currencies are also hedged on the basis of rolling cash flow forecasts. HeinekenHEINEKEN mainly uses forward exchange contracts to hedge its foreign currency risk. The majority of the forward exchange contracts have maturities of less than one year after the balance sheet date.
The Company has a clear policy on hedging transactional exchange risks, which postpones the impact on financial results. Translation exchange risks are hedged to a limited extent, as the underlying currency positions are generally considered to be long-term in nature. The result of the net investment hedging is recognised in the translation reserve as can be seen in the consolidated statement of comprehensive income.
It is Heineken’sHEINEKEN’s policy to provide intra-Heinekenintra-HEINEKEN financing in the functional currency of subsidiaries where possible to prevent foreign currency exposure on subsidiary level. The resulting exposure at Group level is hedged by means of forward exchange contracts. Intra-HeinekenIntra-HEINEKEN financing in foreign currencies is mainly in British pounds, US dollars, Russian rublesSwiss franc and Polish zloty. In some cases HeinekenHEINEKEN elects to treat intra-Heinekenintra-HEINEKEN financing with a permanent character as equity and does not hedge the foreign currency exposure.
The principal amounts of Heineken’sHEINEKEN’s British pound, Nigerian naira, Singapore dollar, Polish zloty and Mexican peso and Egyptian pound bank loans and bond issues are used to hedge local operations, which generate cash flows that have the same respective functional currencies. Corresponding interest on these borrowings is also denominated in currencies that match the cash flows generated by the underlying operations of Heineken.HEINEKEN. This provides an economic hedge without derivatives being entered into.
In respect of other monetary assets and liabilities denominated in currencies other than the functional currencies of the Company and the various foreign operations, HeinekenHEINEKEN ensures that its net exposure is kept to an acceptable level by buying or selling foreign currencies at spot rates when necessary to address short-term imbalances.
Exposure to foreign currency risk
Heineken’sHEINEKEN’s transactional exposure to the British pound, US dollar and euro was as follows based on notional amounts. The euro column relates to transactional exposure to the euro within subsidiaries which are reporting in other currencies.
| 2012 | 2011 | |||||||||||||||||||||||||||||||||||||||||||||||
In millions | EUR | GBP | 2010 USD | EUR | GBP | 2009 USD | EUR | GBP | USD | EUR | GBP | USD | ||||||||||||||||||||||||||||||||||||
Loans and held-to-maturity investments | — | — | — | — | — | — | ||||||||||||||||||||||||||||||||||||||||||
Financial Assets | ||||||||||||||||||||||||||||||||||||||||||||||||
Trade and other receivables | 11 | — | 6 | 25 | — | 7 | 12 | — | 10 | 14 | 1 | 12 | ||||||||||||||||||||||||||||||||||||
Cash and cash equivalents | 40 | — | 6 | 46 | — | 2 | 72 | — | 92 | 52 | 60 | 21 | ||||||||||||||||||||||||||||||||||||
Secured bank loans | — | — | — | — | — | (1 | ) | |||||||||||||||||||||||||||||||||||||||||
Unsecured bank loans | — | (349 | ) | — | — | (57 | ) | — | ||||||||||||||||||||||||||||||||||||||||
Unsecured bond issues | — | (397 | ) | — | — | (400 | ) | — | ||||||||||||||||||||||||||||||||||||||||
Other interest-bearing liabilities | (50 | ) | — | (2,217 | ) | (100 | ) | — | (1,492 | ) | ||||||||||||||||||||||||||||||||||||||
Intragroup assets | 10 | 455 | 4,788 | 4 | 455 | 1,384 | ||||||||||||||||||||||||||||||||||||||||||
Financial Liabilities | ||||||||||||||||||||||||||||||||||||||||||||||||
Interest bearing borrowings | (6 | ) | (858 | ) | (6,285 | ) | (50 | ) | (1,050 | ) | (3,082 | ) | ||||||||||||||||||||||||||||||||||||
Non-interest-bearing liabilities | — | — | — | (10 | ) | — | (1 | ) | (1 | ) | — | (61 | ) | — | — | (75 | ) | |||||||||||||||||||||||||||||||
Bank overdrafts | (4 | ) | — | — | (63 | ) | — | (2 | ) | |||||||||||||||||||||||||||||||||||||||
Trade and other payables | (46 | ) | — | (2 | ) | (88 | ) | — | (26 | ) | (74 | ) | — | (33 | ) | (61 | ) | — | (34 | ) | ||||||||||||||||||||||||||||
Intragroup liabilities | (298 | ) | — | (715 | ) | (314 | ) | — | (502 | ) | ||||||||||||||||||||||||||||||||||||||
Gross balance sheet exposure | (49 | ) | (746 | ) | (2,207 | ) | (190 | ) | (457 | ) | (1,513 | ) | (285 | ) | (403 | ) | (2,204 | ) | (355 | ) | (534 | ) | (2,276 | ) | ||||||||||||||||||||||||
Estimated forecast sales next year | 129 | 1 | 947 | 140 | 1 | 885 | 71 | 10 | 1,476 | 119 | 16 | 1,041 | ||||||||||||||||||||||||||||||||||||
Estimated forecast purchases next year | (463 | ) | (1 | ) | (539 | ) | (402 | ) | (1 | ) | (88 | ) | (780 | ) | (1 | ) | (1,360 | ) | (442 | ) | — | (723 | ) | |||||||||||||||||||||||||
Gross exposure | (994 | ) | (394 | ) | (2,088 | ) | (678 | ) | (518 | ) | (1,958 | ) | ||||||||||||||||||||||||||||||||||||
Net notional amount forward exchange contracts | (507 | ) | 483 | 1,216 | (851 | ) | 535 | 1,161 | ||||||||||||||||||||||||||||||||||||||||
Net exposure | (1,501 | ) | 89 | (872 | ) | (1,529 | ) | 17 | (797 | ) | ||||||||||||||||||||||||||||||||||||||
Sensitivity analysis | ||||||||||||||||||||||||||||||||||||||||||||||||
Equity | 11 | 7 | 36 | 15 | — | 14 | ||||||||||||||||||||||||||||||||||||||||||
Profit or loss | — | (1 | ) | (3 | ) | — | — | — | ||||||||||||||||||||||||||||||||||||||||
|
|
|
|
|
| |||||||||||||||||||||||||||||||||||||||||||
Gross exposure | (383 | ) | (746 | ) | (1,799 | ) | (452 | ) | (457 | ) | (716 | ) | ||||||||||||||||||||||||||||||||||||
Cash flow hedge accounting forward exchange contracts | 73 | 395 | 392 | 61 | 427 | (375 | ) | |||||||||||||||||||||||||||||||||||||||||
Other hedge accounting forward exchange contracts | (988 | ) | 1 | 1,056 | (945 | ) | — | 1,061 | ||||||||||||||||||||||||||||||||||||||||
Net exposure | (1,298 | ) | (350 | ) | (351 | ) | (1,336 | ) | (30 | ) | (30 | ) | ||||||||||||||||||||||||||||||||||||
Including
Included in the US dollar amounts are intra-Heinekenintra-HEINEKEN cash flows. Within the other hedge accountingnet notional amount forward exchange contracts, the cross-currency interest rate swaps of HeinekenHEINEKEN UK formsform the largest component.
Financial statements | Notes to the consolidated financial statementscontinued
32. Financial risk management and financial instruments continued
The following significant exchange rates applied during the year:
In EUR | 2010 | Average rate 2009 | 2010 | Year-end rate 2009 | ||||||||||||
GBP | 1.1657 | 1.1224 | 1.1618 | 1.1260 | ||||||||||||
USD | 0.7543 | 0.7170 | 0.7484 | 0.6942 | ||||||||||||
Sensitivity analysis
A 10 per cent strengthening of the euro against the British pound and US dollar or, in case of the euro, a strengthening of the euro against all other currencies as at 31 December would have increased (decreased) equity and profit by the amounts shown below.above. This analysis assumes that all other variables, in particular interest rates, remain constant. The analysis is performed on the same basis as for 2009.2011.
In millions of EUR | 31 December | 2010 | Equity 2009 | 2010 | Profit or loss 2009 | |||||||||||||||
EUR | (5 | ) | 1 | — | (3 | ) | ||||||||||||||
GBP | — | 2 | (1 | ) | 2 | |||||||||||||||
USD | 38 | 39 | — | — | ||||||||||||||||
A 10 per cent weakening of the euro against the British pound and US dollar or, in case of the euro, a weakening of the euro against all other currencies as at 31 December would have had the equal but opposite effect on the basis that all other variables remain constant.
Interest rate risk
In managing interest rate risk, HeinekenHEINEKEN aims to reduce the impact of short-term fluctuations on earnings. Over the longer term, however, permanent changes in interest rates would have an impact on profit.
HeinekenHEINEKEN opts for a mix of fixed and variable interest rates in its financing operations, combined with the use of interest rate instruments. Currently Heineken’sHEINEKEN’s interest rate position is more weighted towards fixed rather than floating. Interest rate instruments that can be used are interest rate swaps, forward rate agreements, caps and floors.
Swap maturity follows the maturity of the related loans and borrowings andwhich have swap rates for the fixed leg ranging from 2.01.0 to 8.88.1 per cent (2009:(2011: from 2.01.0 to 7.38.1 per cent).
Interest rate risk – Profile
At the reporting date the interest rate profile of Heineken’sHEINEKEN’s interest-bearing financial instruments was as follows:
In millions of EUR | 2010 | 2009 | ||||||
Fixed rate instruments | ||||||||
Financial assets | 84 | 157 | ||||||
Financial liabilities | (5,275 | ) | (4,664 | ) | ||||
Interest rate swaps floating to fixed | (456 | ) | (2,505 | ) | ||||
| (5,647 | ) | (7,012 | ) | |||||
Variable rate instruments | ||||||||
Financial assets | 633 | 88 | ||||||
Financial liabilities | (2,786 | ) | (2,947 | ) | ||||
Interest rate swaps fixed to floating | 456 | 2,505 | ||||||
| (1,697 | ) | (354 | ) | |||||
Financial statements | Notes to the consolidated financial statementscontinued
In millions of EUR | 2012 | 2011 | ||||||
Fixed rate instruments | ||||||||
Financial assets | 97 | 95 | ||||||
Financial liabilities | (11,133 | ) | (5,253 | ) | ||||
Interest rate swaps floating to fixed | (9 | ) | (1,051 | ) | ||||
| (11,045 | ) | (6,209 | ) | |||||
|
|
|
| |||||
Variable rate instruments | ||||||||
Financial assets | 1,430 | 431 | ||||||
Financial liabilities | (2,054 | ) | (3,177 | ) | ||||
Interest rate swaps fixed to floating | 9 | 1,051 | ||||||
| (615 | ) | (1,695 | ) | |||||
|
|
|
| |||||
Fair value sensitivity analysis for fixed rate instruments
During 2010, Heineken2012, HEINEKEN opted to apply fair value hedge accounting on certain fixed rate financial liabilities. The fair value movements on these instruments are recognised in profit or loss. The change in fair value on these instruments was EUR (67)EUR(30) million in 2010 (2009: EUR732012 (2011: EUR(30) million), which was offset by the change in fair value of the hedge accounting instruments, which was EUR70EUR18 million (2009: EUR(73)(2011: EUR36 million).
A change of 100 basis points in interest rates at the reporting date would have increased (decreased) equity and profit or loss by the amounts shown below (after tax).
In millions of EUR | 100 bp increase | Profit or loss 100 bp decrease | 100 bp increase | Equity 100 bp decrease | 100 bp increase | Profit or loss 100 bp decrease | 100 bp increase | Equity 100 bp decrease | ||||||||||||||||||||||||
31 December 2010 | ||||||||||||||||||||||||||||||||
31 December 2012 | ||||||||||||||||||||||||||||||||
Instruments designated at fair value | 39 | (40 | ) | 40 | (40 | ) | 11 | (11 | ) | 20 | (20 | ) | ||||||||||||||||||||
Interest rate swaps | (25 | ) | 27 | (4 | ) | 5 | (6 | ) | 6 | (9 | ) | 9 | ||||||||||||||||||||
Fair value sensitivity (net) | 14 | (13 | ) | 36 | (35 | ) | 5 | (5 | ) | 11 | (11 | ) | ||||||||||||||||||||
|
|
|
| |||||||||||||||||||||||||||||
31 December 2009 | ||||||||||||||||||||||||||||||||
31 December 2011 | ||||||||||||||||||||||||||||||||
Instruments designated at fair value | 45 | (48 | ) | 45 | (48 | ) | 29 | (29 | ) | 29 | (29 | ) | ||||||||||||||||||||
Interest rate swaps | (19 | ) | 21 | 49 | (47 | ) | (20 | ) | 21 | (2 | ) | 2 | ||||||||||||||||||||
Fair value sensitivity (net) | 26 | (27 | ) | 94 | (95 | ) | 9 | (8 | ) | 27 | (27 | ) | ||||||||||||||||||||
|
|
|
| |||||||||||||||||||||||||||||
As part of the acquisition of Scottish & Newcastle in 2008, HeinekenHEINEKEN took over a specific portfolio of euro floating-to-fixed interest rate swaps of which currently EUR940EUR400 million is still outstanding. Although interest rate risk is hedged economically, it is not possible to apply hedge accounting on this portfolio. A movement in interest rates will therefore lead to a fair value movement in the profit or loss under the other net financing income/(expenses). Any related non-cash income or expenses in our profit or loss are expected to reverse over time.
Cash flow sensitivity analysis for variable rate instruments
A change of 100 basis points in interest rates constantly applied during the reporting period would have increased (decreased) equity and profit or loss by the amounts shown below (after tax). This analysis assumes that all other variables, in particular foreign currency rates, remain constant and excludes any possible change in fair value of derivatives at period-end because of a change in interest rates. The analysis is performed on the same basis as for 2009.2011.
In millions of EUR | 100 bp increase | Profit or loss 100 bp decrease | 100 bp increase | Equity 100 bp Decrease | ||||||||||||
31 December 2010 | ||||||||||||||||
Variable rate instruments | (16 | ) | 16 | (16 | ) | 16 | ||||||||||
Net interest rate swaps fixed to floating | 3 | (3 | ) | 3 | (3 | ) | ||||||||||
Cash flow sensitivity (net) | (13 | ) | 13 | (13 | ) | 13 | ||||||||||
31 December 2009 | ||||||||||||||||
Variable rate instruments | (21 | ) | 21 | (21 | ) | 21 | ||||||||||
Interest rate swaps fixed to floating | 19 | (19 | ) | 19 | (19 | ) | ||||||||||
Cash flow sensitivity (net) | (2 | ) | 2 | (2 | ) | 2 | ||||||||||
Financial statements | Notes to the consolidated financial statementscontinued
32. Financial risk management and financial instruments continued
Other market price risk
Management of Heineken monitors the mix of debt and equity securities in its investment portfolio based on market expectations. Material investments within the portfolio are managed on an individual basis.
The primary goal of Heineken’s investment strategy is to maximise investment returns in order to partially meet its unfunded defined benefit obligations; management is assisted by external advisors in this regard.
In millions of EUR | 100 bp increase | Profit or loss 100 bp decrease | 100 bp increase | Equity 100 bp decrease | ||||||||||||
31 December 2012 | ||||||||||||||||
Variable rate instruments | (4 | ) | 4 | (4 | ) | 4 | ||||||||||
Net interest rate swaps fixed to floating | — | — | — | — | ||||||||||||
Cash flow sensitivity (net) | (4 | ) | 4 | (4 | ) | 4 | ||||||||||
|
|
|
|
|
|
|
| |||||||||
31 December 2011 | ||||||||||||||||
Variable rate instruments | (20 | ) | 20 | (20 | ) | 20 | ||||||||||
Net interest rate swaps fixed to floating | 8 | (8 | ) | 8 | (8 | ) | ||||||||||
Cash flow sensitivity (net) | (12 | ) | 12 | (12 | ) | 12 | ||||||||||
|
|
|
|
|
|
|
| |||||||||
Commodity price risk
Commodity price risk is the risk that changes in commodity priceprices will affect Heineken’sHEINEKEN’s income. The objective of commodity price risk management is to manage and control commodity risk exposures within acceptable parameters, whilst optimising the return on risk. The main commodity exposure relates to the purchase of cans, glass bottles, malt and utilities.
Commodity price risk is in principle addressed by negotiating fixed prices in supplier contracts with various contract durations. So far, commodity hedging with financial counterparties by the Company is limited to the incidental sale of surplus CO2CO2 emission rights, and to aluminium hedging and, to a limited extent, gas hedging, which isare done in accordance with risk policies. HeinekenHEINEKEN does not enter into commodity contracts other than to meet Heineken’sHEINEKEN’s expected usage and sale requirements. As at 31 December 2010,2012, the market value of aluminiumcommodity swaps was EUR12million.EUR(22) million (2011: EUR(25) million).
Cash flow hedges
The following table indicates the periods in which the cash flows associated with derivatives that are cash flow hedges, are expected to occur.
In millions of EUR | Carrying amount | Expected cash flows | 6 months or less | 6-12 months | 1-2 years | 2-5 years | 2010 More than 5 years | |||||||||||||||||||||
Interest rate swaps: | ||||||||||||||||||||||||||||
Assets | 89 | 1,902 | 65 | 30 | 90 | 715 | 1,002 | |||||||||||||||||||||
Liabilities | (105 | ) | (1,921 | ) | (84 | ) | (74 | ) | (118 | ) | (690 | ) | (955 | ) | ||||||||||||||
Forward exchange contracts: | ||||||||||||||||||||||||||||
Assets | 10 | 1,093 | 412 | 393 | 288 | — | — | |||||||||||||||||||||
Liabilities | (18 | ) | (1,117 | ) | (439 | ) | (394 | ) | (284 | ) | — | — | ||||||||||||||||
Other derivatives used for hedge accounting: | ||||||||||||||||||||||||||||
Assets | 26 | 27 | 7 | 1 | 18 | 1 | — | |||||||||||||||||||||
Liabilities | (33 | ) | (33 | ) | (7 | ) | (8 | ) | (15 | ) | (3 | ) | — | |||||||||||||||
| (31 | ) | (49 | ) | (46 | ) | (52 | ) | (21 | ) | 23 | 47 | |||||||||||||||||
In millions of EUR Interest rate swaps: Assets Liabilities Forward exchange contracts: Assets Liabilities Commodity derivatives: Assets Liabilities In millions of EUR Interest rate swaps: Assets Liabilities Forward exchange contracts: Assets Liabilities Commodity derivatives: Assets Liabilities The periods in which the cash flows associated with forward exchange contracts that are cash flow hedges are expected to impact profit or loss is on average two months earlier than the occurrence of the cash flows as in the above table. Carrying
amount Expected cash
flows Less than
1 year 1-2 years 2-5 years 2012
More than
5 years 96 1,752 85 82 696 889 (26 ) (1,632 ) (89 ) (79 ) (617 ) (847 ) 28 1,296 1,150 146 — — (16 ) (1,288 ) (1,145 ) (143 ) — — 1 1 1 — — — (23 ) (23 ) (22 ) (1 ) — — 60 106 (20 ) 5 79 42 The periods in which the cash flows associated with forward exchange contracts that are cash flow hedges are expected to impact profit or loss is on average two months earlier than the occurrence of the cash flows as in the above table. Carrying
amount Expected cash
flows Less than
1 year 1-2 years 2-5 years 2011
More than
5 years 170 1,904 120 107 726 951 (48 ) (1,786 ) (136 ) (108 ) (658 ) (884 ) 15 1,078 871 207 — — (49 ) (1,111 ) (896 ) (215 ) — — 11 11 11 — — — (36 ) (36 ) (32 ) (4 ) — — 63 60 (62 ) (13 ) 68 67
In millions of EUR | Carrying amount | Expected cash flows | 6 months or less | 6-12 months | 1-2 years | 2-5 years | 2009 More than 5 years | |||||||||||||||||||||
Interest rate swaps: | ||||||||||||||||||||||||||||
Assets | (17 | ) | 503 | 16 | 16 | 27 | 66 | 378 | ||||||||||||||||||||
Liabilities | 226 | (740 | ) | (65 | ) | (78 | ) | (80 | ) | (163 | ) | (354 | ) | |||||||||||||||
Commodity swaps: | ||||||||||||||||||||||||||||
Assets | (48 | ) | 1,015 | 615 | 282 | 118 | — | — | ||||||||||||||||||||
Liabilities | 26 | (996 | ) | (608 | ) | (268 | ) | (120 | ) | — | — | |||||||||||||||||
Other derivatives used for hedge accounting: | ||||||||||||||||||||||||||||
Assets | — | — | — | — | — | — | — | |||||||||||||||||||||
Liabilities | — | — | — | — | — | — | — | |||||||||||||||||||||
| 187 | (218 | ) | (42 | ) | (48 | ) | (55 | ) | (97 | ) | 24 | |||||||||||||||||
Financial statements | Notes to the consolidated financial statementscontinued
Fair value hedges/net investment hedges
The following table indicates the periods in which the cash flows associated with derivatives that are fair value hedges or net investment hedges are expected to occur.
In millions of EUR | Carrying amount | Expected cash flows | 6 months or less | 6-12 months | 1-2 years | 2-5 years | 2010 More than 5 years | |||||||||||||||||||||
Interest rate swaps: | ||||||||||||||||||||||||||||
Assets | 32 | 1,009 | 42 | 22 | 176 | 769 | — | |||||||||||||||||||||
Liabilities | (139 | ) | (1,077 | ) | (12 | ) | (14 | ) | (179 | ) | (872 | ) | — | |||||||||||||||
Forward exchange contracts: | ||||||||||||||||||||||||||||
Assets | 1 | 317 | 130 | 187 | — | — | — | |||||||||||||||||||||
Liabilities | — | (309 | ) | (128 | ) | (181 | ) | — | — | — | ||||||||||||||||||
| (106 | ) | (60 | ) | 32 | 14 | (3 | ) | (103 | ) | — | ||||||||||||||||||
In millions of EUR | Carrying amount | Expected cash flows | 6 months or less | 6-12 months | 1-2 years | 2-5 years | 2009 More than 5 years | |||||||||||||||||||||
Interest rate swaps: | ||||||||||||||||||||||||||||
Assets | — | 987 | 27 | 20 | 61 | 666 | 213 | |||||||||||||||||||||
Liabilities | (212 | ) | (1,079 | ) | (9 | ) | (11 | ) | (22 | ) | (802 | ) | (235 | ) | ||||||||||||||
Forward exchange contracts: | ||||||||||||||||||||||||||||
Assets | — | — | — | — | — | — | — | |||||||||||||||||||||
Liabilities | — | — | — | — | — | — | — | |||||||||||||||||||||
| (212 | ) | (92 | ) | 18 | 9 | 39 | (136 | ) | (22 | ) | ||||||||||||||||||
Financial statements | Notes to the consolidated financial statementscontinued
In millions of EUR | Carrying amount | Expected cash flows | Less than 1 year | 1-2 years | 2-5 years | 2012 More than 5 years | ||||||||||||||||||
Interest rate swaps: | ||||||||||||||||||||||||
Assets | 19 | 780 | 48 | 492 | 240 | — | ||||||||||||||||||
Liabilities | (77 | ) | (849 | ) | (6 | ) | (609 | ) | (234 | ) | — | |||||||||||||
Forward exchange contracts: | ||||||||||||||||||||||||
Assets | — | 181 | 181 | — | — | — | ||||||||||||||||||
Liabilities | (2 | ) | (183 | ) | (183 | ) | — | — | — | |||||||||||||||
| (60 | ) | (71 | ) | 40 | (117 | ) | 6 | — | ||||||||||||||||
|
|
|
|
|
|
|
|
|
|
|
| |||||||||||||
32. Financial risk management and financial instruments continued
In millions of EUR | Carrying amount | Expected cash flows | Less than 1 year | 1-2 years | 2-5 years | 2011 More than 5 years | ||||||||||||||||||
Interest rate swaps: | ||||||||||||||||||||||||
Assets | 27 | 967 | 171 | 49 | 747 | — | ||||||||||||||||||
Liabilities | (136 | ) | (1,059 | ) | (180 | ) | (22 | ) | (857 | ) | — | |||||||||||||
Forward exchange contracts: | ||||||||||||||||||||||||
Assets | — | 177 | 177 | — | — | — | ||||||||||||||||||
Liabilities | (12 | ) | (187 | ) | (187 | ) | — | — | — | |||||||||||||||
| (121 | ) | (102 | ) | (19 | ) | 27 | (110 | ) | — | |||||||||||||||
|
|
|
|
|
|
|
|
|
|
|
| |||||||||||||
Capital management
There were no major changes in Heineken’sHEINEKEN’s approach to capital management during the year. The Executive Board’s policy is to maintain a strong capital base so as to maintain investor, creditor and market confidence and to sustain future development of business and acquisitions. Capital is herein defined as equity attributable to equity holders of the Company (total equity minus non-controlling interests).
HeinekenHEINEKEN is not subject to externally imposed capital requirements other than the legal reserves explained in note 22. Shares are purchased to meet the requirements under the Long-TermLong and Short-Term Incentive Plan and the extraordinary share plan as further explained in note 29.
Fair values
The fair values of financial assets and liabilities together withthat differ from the carrying amounts shown in the statement of financial position are as follows:
In millions of EUR | Carrying amount 2010 | Fair value 2010 | Carrying amount 2009 | Fair value 2009 | ||||||||||||
Loans | 455 | 455 | 329 | 329 | ||||||||||||
Indemnification receivable | 145 | 145 | — | — | ||||||||||||
Other long-term receivables | 174 | 174 | — | — | ||||||||||||
Held-to-maturity investments | 4 | 4 | 4 | 4 | ||||||||||||
Available-for-sale investments | 190 | 190 | 219 | 219 | ||||||||||||
Advances to customers | 449 | 449 | 319 | 319 | ||||||||||||
Investments held for trading | 17 | 17 | 15 | 15 | ||||||||||||
Trade and other receivables, excluding derivatives | 2,263 | 2,263 | 2,261 | 2,261 | ||||||||||||
Cash and cash equivalents | 610 | 610 | 520 | 520 | ||||||||||||
Interest rate swaps used for hedge accounting: | ||||||||||||||||
Assets | 121 | 121 | 17 | 17 | ||||||||||||
Liabilities | (244 | ) | (244 | ) | (438 | ) | (438 | ) | ||||||||
Forward exchange contracts used for hedge accounting: | ||||||||||||||||
Assets | 11 | 11 | 48 | 48 | ||||||||||||
Liabilities | (18 | ) | (18 | ) | (26 | ) | (26 | ) | ||||||||
Other derivatives used for hedge accounting: | ||||||||||||||||
Assets | 26 | 26 | — | — | ||||||||||||
Liabilities | (33 | ) | (33 | ) | — | — | ||||||||||
Other derivatives not used for hedge accounting, net | (75 | ) | (75 | ) | — | — | ||||||||||
Bank loans | (3,665 | ) | (3,734 | ) | (3,311 | ) | (3,362 | ) | ||||||||
Unsecured bond issues | (2,482 | ) | (2,739 | ) | (2,945 | ) | (3,058 | ) | ||||||||
Finance lease liabilities | (95 | ) | (95 | ) | (108 | ) | (108 | ) | ||||||||
Other interest-bearing liabilities | (1,927 | ) | (2,260 | ) | (1,342 | ) | (1,423 | ) | ||||||||
Non-interest-bearing liabilities | (55 | ) | (55 | ) | (93 | ) | (93 | ) | ||||||||
Non-current derivatives | (291 | ) | (291 | ) | (370 | ) | (370 | ) | ||||||||
Deposits from third parties | (425 | ) | (425 | ) | (377 | ) | (377 | ) | ||||||||
Trade and other payables excluding dividend, interest and derivatives | (4,049 | ) | (4,049 | ) | (3,444 | ) | (3,444 | ) | ||||||||
Bank overdrafts | (132 | ) | (132 | ) | (156 | ) | (156 | ) | ||||||||
In millions of EUR | Carrying amount 2012 | Fair value 2012 | Carrying amount 2011 | Fair value 2011 | ||||||||||||
Bank loans | (2,002 | ) | (2,002 | ) | (3,986 | ) | (4,017 | ) | ||||||||
Unsecured bond issues | (8,806 | ) | (9,126 | ) | (2,493 | ) | (2,727 | ) | ||||||||
Finance lease liabilities | (38 | ) | (38 | ) | (39 | ) | (39 | ) | ||||||||
Other interest-bearing liabilities | (1,840 | ) | (1,840 | ) | (2,009 | ) | (2,039 | ) | ||||||||
|
|
|
|
|
|
|
| |||||||||
Basis for determining fair values
The significant methods and assumptions used in estimating the fair values of financial instruments reflected in the table above are discussed in note 4.
Fair value hierarchy
IFRS 7 requires disclosure of fair value measurements by level of the following fair value measurement hierarchy:
Financial statements | Notes to the consolidated financial statementscontinued
Quoted prices (unadjusted) in active markets for identical assets or liabilities (level 1)
Inputs other than quoted prices included within level 1 that are observable for the asset or liability, either directly (that is, as prices) or indirectly (that is, derived from prices) (level 2)
Inputs for the asset or liability that are not based on observable market data (unobservable inputs) (level 3).
In millions of EUR | Level 1 | Level 2 | Level 3 | |||||||||
31 December 2010 | ||||||||||||
Available-for-sale investments | 70 | — | 120 | |||||||||
Non-current derivative assets used for hedge accounting | — | 135 | — | |||||||||
Current derivative assets used for hedge accounting | — | 10 | — | |||||||||
Investments held for trading | 17 | — | — | |||||||||
| 87 | 145 | 120 | ||||||||||
Non-current derivative liabilities used for hedge accounting | — | 291 | — | |||||||||
Current derivative liabilities used for hedge accounting | — | 66 | — | |||||||||
| — | 357 | — | ||||||||||
31 December 2009 | Level 1 | Level 2 | Level 3 | |||||||||
Available-for-sale investments | 57 | — | 162 | |||||||||
Non-current derivative assets used for hedge accounting | — | 16 | — | |||||||||
Current derivative assets used for hedge accounting | — | 49 | — | |||||||||
Investments held for trading | 15 | — | — | |||||||||
| 72 | 65 | 162 | ||||||||||
Non-current derivative liabilities used for hedge accounting | — | 370 | — | |||||||||
Current derivative liabilities used for hedge accounting | — | 94 | — | |||||||||
| — | 464 | — | ||||||||||
31 December 2012 | Level 1 | Level 2 | Level 3 | |||||||||
Available-for-sale investments | 193 | — | 134 | |||||||||
Non-current derivative assets | — | 116 | — | |||||||||
Current derivative assets | — | 37 | — | |||||||||
Investments held for trading | 11 | — | — | |||||||||
| 204 | 153 | 134 | ||||||||||
|
|
|
|
|
| |||||||
Non-current derivative liabilities | — | 111 | — | |||||||||
Current derivative liabilities | — | 53 | — | |||||||||
| — | 164 | — | ||||||||||
|
|
|
|
|
| |||||||
31 December 2011 | Level 1 | Level 2 | Level 3 | |||||||||
Available-for-sale investments | 81 | — | 183 | |||||||||
Non-current derivative assets | — | 142 | — | |||||||||
Current derivative assets | — | 37 | — | |||||||||
Investments held for trading | 14 | — | — | |||||||||
| 95 | 179 | 183 | ||||||||||
|
|
|
|
|
| |||||||
Non-current derivative liabilities | — | 177 | — | |||||||||
Current derivative liabilities | — | 164 | — | |||||||||
| — | 341 | — | ||||||||||
|
|
|
|
|
| |||||||
In millions of EUR | 2012 | 2011 | ||||||||||
Available-for-sale investments based on level 3 | ||||||||||||
Balance as at 1 January | 183 | 120 | ||||||||||
Fair value adjustments recognised in other comprehensive income | 1 | 61 | ||||||||||
Disposals | (50 | ) | — | |||||||||
Transfers | — | 2 | ||||||||||
Balance as at 31 December | 134 | 183 | ||||||||||
In millions of EUR | 2010 | 2009 | ||||||
Available-for-sale investments based on Level 3 | ||||||||
Balance as at 1 January | 162 | 174 | ||||||
Fair value adjustments recognised in other comprehensive income | (8 | ) | 18 | |||||
Disposals | (26 | ) | (34 | ) | ||||
Transfers | (8 | ) | 4 | |||||
Balance as at 31 December | 120 | 162 | ||||||
33. Off-balance sheet commitments
In millions of EUR | Total 2010 | Less than 1 year | 1-5 years | More than 5 years | Total 2009 | Total 2012 | Less than 1 year | 1-5 years | More than 5 years | Total 2011 | ||||||||||||||||||||||||||||||
Lease & operational lease commitments | 433 | 85 | 214 | 134 | 322 | 618 | 143 | 302 | 173 | 503 | ||||||||||||||||||||||||||||||
Property, plant & equipment ordered | 49 | 49 | — | — | 46 | 136 | 133 | 3 | — | 50 | ||||||||||||||||||||||||||||||
Raw materials purchase contracts | 4,503 | 1,055 | 2,469 | 979 | 3,564 | 3,806 | 1,416 | 2,227 | 163 | 3,843 | ||||||||||||||||||||||||||||||
Other off-balance sheet obligations | 1,943 | 457 | 1,207 | 279 | 2,199 | 2,139 | 400 | 1,129 | 610 | 2,589 | ||||||||||||||||||||||||||||||
Off-balance sheet obligations | 6,928 | 1,646 | 3,890 | 1,392 | 6,131 | 6,699 | 2,092 | 3,661 | 946 | 6,985 | ||||||||||||||||||||||||||||||
|
|
|
|
| ||||||||||||||||||||||||||||||||||||
Undrawn committed bank facilities | 2,188 | 138 | 2,050 | — | 2,077 | 1,832 | 121 | 1,711 | — | 1,274 | ||||||||||||||||||||||||||||||
|
|
|
|
| ||||||||||||||||||||||||||||||||||||
HeinekenHEINEKEN leases buildings, cars and equipment.equipment in the ordinary course of business.
Raw material contracts include long termlong-term purchase contracts with suppliers in which prices are fixed or will be agreed based upon pre-definedpredefined price formulas. These contracts mainly relate to malt, bottles and cans.
Financial statements | Notes to the consolidated financial statementscontinued
33. Off-balance sheet commitments continued
During the year ended 31 December 2010 EUR2242012 EUR265 million (2009: EUR184(2011: EUR241 million) was recognised as an expense in profit or loss in respect of operating leases and rent.
Other off-balance sheet obligations mainly include distribution, rental, service and sponsorship contracts.
Committed bank facilities are credit facilities on which a commitment fee is paid as compensation for the bank’s requirement to reserve capital. For the details of these committed bank facilities see note 25. The bank is legally obliged to provide the facility under the terms and conditions of the agreement.
34. Contingencies
Netherlands
Heineken is involved in an antitrust case initiated by the European Commission for alleged violations of the European Union competition laws. By decision of 18 April 2007 the European Commission stated that Heineken and other brewers operating in the Netherlands, restricted competition in the Dutch market during the period 1996 – 1999. This decision follows an investigation by the European Commission that commenced in March 2000. Heineken fully cooperated with the authorities in this investigation. As a result of its decision, the European Commission imposed a fine on Heineken of EUR219 million in April 2007.
On 4 July 2007 Heineken filed an appeal with19 December 2012 the European Court of First Instance against the decision of the European Commission as Heineken disagrees with the findings of the European Commission. Pending appeal, Heineken was obliged to payJustice in Luxembourg confirmed the fine imposed on HEINEKEN for their participation in a cartel on the Dutch market from 1996 to the European Commission.1999. This judgement is not subject to appeal. The fine was paid in 2007 and was treated as an expense in the 2007 Annual Report. A final decision by the European Court of First Instance is expected in 2011.
Carlsberg
During 2010, the existing contingency between Heineken and Carlsberg was settled. The consideration paid (purchase price) for the acquisition of Scottish & Newcastle was finalised. The impact on goodwill was immaterial.
Brazil
As part of the acquisition of the beer operations of FEMSA, HeinekenHEINEKEN also inherited existing legal proceedings with labour unions, tax authorities and other parties of its, now wholly-owned, subsidiarysubsidiaries Cervejarias Kaiser (Heinekenand Cervejarias Kaiser Nordeste (jointly, Heineken Brasil). The proceedings have arisen in the ordinary course of business and are common toin the current economic and legal environment of Brazil. The proceedings have partly been provided for, see note 30. The contingent amount being claimed against Heineken Brasil resulting from such proceedings as at 31 December 20102012 is EUR1,267EUR663 million. Such contingencies were classified by legal counsel as less than probable but more than remote of being settled against Heineken Brasil. However, HeinekenHEINEKEN believes that the ultimate resolution of such legal proceedings will not have a material adverse effect on its consolidated financial position or result of operations. HeinekenHEINEKEN does not expect any significant liability to arise from these contingencies. A significant part of the aforementioned contingencies (EUR364(EUR367 million) are tax related and qualify for indemnification by FEMSA, see note 6.17.
As is customary in Brazil, Heineken Brasil has been requested by the tax authorities to collateralise tax contingencies currently in litigation amounting to EUR218EUR292 million by either pledging fixed assets or entering into available lines of credit which cover such contingencies.
Guarantees
In millions of EUR | Total 2010 | Less than 1 year | 1-5 years | More than 5 years | Total 2009 | Total 2012 | Less than 1 year | 1-5 years | More than 5 years | Total 2011 | ||||||||||||||||||||||||||||||
Guarantees to banks for loans (to third parties) | 384 | 213 | 111 | 60 | 371 | 300 | 194 | 95 | 11 | 339 | ||||||||||||||||||||||||||||||
Other guarantees | 271 | 68 | 9 | 194 | 177 | 358 | 63 | 5 | 290 | 372 | ||||||||||||||||||||||||||||||
Guarantees | 655 | 281 | 120 | 254 | 548 | 658 | 257 | 100 | 301 | 711 | ||||||||||||||||||||||||||||||
|
|
|
|
| ||||||||||||||||||||||||||||||||||||
Guarantees to banks for loans relate to loans to customers, which are given byto external parties in the ordinary course of business of Heineken. HeinekenHEINEKEN. HEINEKEN provides guarantees to the banks to cover the risk related to these loans.
Financial statements | Notes to the consolidated financial statementscontinued
35. Related parties
Identification of related parties
HeinekenHEINEKEN has a related party relationship with its associates and joint ventures (refer to note 16), Heineken Holding N.V., Heineken pension funds (refer to note 28), Fomento Económico Mexicano, S.A.B. de C.V. (FEMSA), employees (refer to note 25) and with its key management personnel (Executive Board and the Supervisory Board).
Key management remuneration
In millions of EUR | 2010 | 2009 | 2012 | 2011 | ||||||||||||
Executive Board | 5.6 | 4.2 | 6.8 | 7.5 | ||||||||||||
Supervisory Board | 0.5 | 0.4 | 0.9 | 0.9 | ||||||||||||
Total | 7.7 | 8.4 | ||||||||||||||
|
| |||||||||||||||
| 6.1 | 4.6 | |||||||||||||||
Executive Board
The remuneration of the members of the Executive Board comprises of a fixed component and a variable component. The variable component is made up of a Short-Term Incentive PlanVariable pay and a Long-Term Incentive Plan.Variable award. The Short-Term Incentive PlanVariable pay is based on financial and operational measures and on individual leadership targetsmeasures as set by the Supervisory Board. It will be subject to the approval of the General Meeting of Shareholders to be held on 21 April 2011. It is partly paid out in shares that are blocked overfor a period of five calendar years. After the five calendar years HEINEKEN will match the blocked shares 1:1 which we refer to as the matching share entitlement. For the Long-Term Incentive PlanVariable award see note 29. The separate remuneration report is stated on page 53.
As at 31 December 2010,2012, J.F.M.L. van Boxmeer held 9,24448,641 Company shares and D.R. Hooft Graafland 6,544 (2009:25,109. (2011: J.F.M.L. van Boxmeer 9,24425,369 and D.R. Hooft Graafland 6,54414,818 shares). D.R. Hooft Graafland held 3,052 shares of Heineken Holding N.V. as at 31 December 2010 (2009:2012 (2011: 3,052 shares).
Executive Board
| Fixed Salary | Short-Term Incentive Plan | Long-Term Incentive Plan* | Pension Plan | Total | Fixed Salary | Short-Term Variable Pay | Matching Share Entitlement** | Long-Term Variable award* | Pension Plan | Total | ||||||||||||||||||||||||||||||||||||||||||||||||||||||||||||||||||||||||||||||
In thousands of EUR | 2010 | 2009 | 2010 | 2009 | 2010 | 2009 | 2010 | 2009 | 2010 | 2009 | 2012 | 2011 | 2012 | 2011 | 2012 | 2011 | 2012 | 2011 | 2012 | 2011 | 2012 | 2011* | ||||||||||||||||||||||||||||||||||||||||||||||||||||||||||||||||||
J.F.M.L. van Boxmeer | 950 | 750 | 1,306 | 1,125 | 595 | 303 | 464 | 379 | 3,315 | 2,557 | 1,050 | 1,050 | 1,361 | 1,764 | 681 | 882 | 912 | 669 | 496 | 590 | 4,500 | 4,955 | ||||||||||||||||||||||||||||||||||||||||||||||||||||||||||||||||||
D.R. Hooft Graafland | 650 | 550 | 670 | 619 | 326 | 167 | 404 | 315 | 2,050 | 1,651 | 650 | 650 | 602 | 780 | 301 | 390 | 477 | 355 | 318 | 399 | 2,348 | 2,574 | ||||||||||||||||||||||||||||||||||||||||||||||||||||||||||||||||||
Total | 1,600 | 1,300 | 1,976 | 1,744 | 921 | 470 | 868 | 694 | 5,365 | 4,208 | 1,700 | 1,700 | 1,963 | 2,544 | 982 | 1,272 | 1,389 | 1,024 | 814 | 989 | 6,848 | 7,529 | ||||||||||||||||||||||||||||||||||||||||||||||||||||||||||||||||||
|
|
|
|
|
|
|
|
|
|
|
| |||||||||||||||||||||||||||||||||||||||||||||||||||||||||||||||||||||||||||||
| * | The remuneration reported as part of |
| ** | The matching share entitlement for 2011 is based on 2011 performance. The matching share entitlement for 2012 is based on 2012 performance. The matching share entitlement vests immediately and as such EUR1.0 million was recognised in the 2012 income statement. |
The Dutch government has introduced a one-off additional tax levy of 16 per cent over 2012 taxable income, as a liability for the employer. This tax levy related to remuneration over 2012 for the Executive Board is EUR 754 (in thousands) and is not included in the table above.
Supervisory Board
The individual members of the Supervisory Board received the following remuneration:
In thousands of EUR | 2010 | 2009 | 2012 | 2011 | ||||||||||||
J.A. van Lede | 67 | 66 | ||||||||||||||
J.A. Fernández Carbajal** | 35 | — | ||||||||||||||
C.J.A. van Lede | 160 | 160 | ||||||||||||||
J.A. Fernández Carbajal | 85 | 85 | ||||||||||||||
M. Das | 52 | 52 | 85 | 85 | ||||||||||||
M.R. de Carvalho | 53 | 50 | 135 | 135 | ||||||||||||
J.M. Hessels | 50 | 50 | ||||||||||||||
J.M. Hessels* | 23 | 75 | ||||||||||||||
J.M. de Jong | 53 | 52 | 80 | 80 | ||||||||||||
A.M. Fentener van Vlissingen | 50 | 50 | 80 | 80 | ||||||||||||
M.E. Minnick | 48 | 45 | 70 | 70 | ||||||||||||
V.C.O.B.J. Navarre | 48 | 31 | 75 | 75 | ||||||||||||
J.G. Astaburuaga Sanjinés** | 35 | — | ||||||||||||||
I.C. MacLaurin* | 15 | 50 | ||||||||||||||
J.G. Astaburuaga Sanjinés | 75 | 75 | ||||||||||||||
G.J. Wijers** | 52 | — | ||||||||||||||
Total | 506 | 446 | 920 | 920 | ||||||||||||
|
| |||||||||||||||
| * | Stepped down as at |
| ** | Appointed as at |
In the Annual General Meeting of Shareholders held on 21 April 2011 it was resolved to increase the remuneration of our Supervisory Board. The fees initially established on 1 January 2006 were updated as per 1 January 2011 to reflect the increased size and global footprint of HEINEKEN and also to align to the market practice in Europe (excluding UK).
M.R. de Carvalho held 8 shares of Heineken N.V. as at 31 December 2010 (2009:2012 (2011: 8 shares). As at 31 December 20102012 and 2009,2011, the Supervisory Board members did not hold any of the Company’s bonds or option rights. C.J.A. van Lede held 2,656 and M.R. de Carvalho held 8 ordinary shares of Heineken Holding N.V. as at 31 December 2010 (2009:2012 (2011: C.J.A. van Lede 2,656 and M.R. de Carvalho 8 ordinary shares).
Financial statements | Notes to the consolidated financial statementscontinued
35. Related parties continued
Other related party transactions
| Transaction value | Balance outstanding as at 31 December | Transaction value | Balance outstanding as at 31 December | |||||||||||||||||||||||||||||
In millions of EUR | 2010 | 2009 | 2010 | 2009 | 2012 | 2011 | 2012 | 2011 | ||||||||||||||||||||||||
Sale of products and services | ||||||||||||||||||||||||||||||||
Sale of products, services and royalties | ||||||||||||||||||||||||||||||||
To associates and joint ventures | 18 | 142 | 12 | 12 | 107 | 98 | 31 | 35 | ||||||||||||||||||||||||
To FEMSA | 244 | — | 78 | — | 649 | 572 | 114 | 77 | ||||||||||||||||||||||||
| 262 | 142 | 90 | 12 | 756 | 670 | 145 | 112 | |||||||||||||||||||||||||
|
|
|
| |||||||||||||||||||||||||||||
Raw materials, consumables and services | ||||||||||||||||||||||||||||||||
Goods for resale – joint ventures | 57 | 89 | — | 1 | — | 2 | — | — | ||||||||||||||||||||||||
Other expenses – joint ventures | — | 12 | 1 | — | — | — | — | — | ||||||||||||||||||||||||
Other expenses FEMSA | 12 | — | — | — | 175 | 128 | 27 | 13 | ||||||||||||||||||||||||
| 175 | 130 | 27 | 13 | |||||||||||||||||||||||||||||
| 69 | 101 | 1 | 1 |
|
|
|
| |||||||||||||||||||||||||
Heineken Holding N.V.
In 2010,2012, an amount of EUR7.4 million (2009: EUR712,129)EUR694,065 (2011: EUR586,942) was paid to Heineken Holding N.V. for management services for the Heineken Group, the increase in comparison to 2009 was caused by the acquisition of FEMSA and related services performed by Heineken Holding N.V.HEINEKEN Group.
This payment is based on an agreement of 1977 as amended in 2001, providing that Heineken N.V. reimburses Heineken Holding N.V. for its costs. Best practice provision III.6.4 of the Dutch Corporate Governance Code of 10 December 2008 has been observed in this regard.
FEMSA
As consideration for Heineken’sHEINEKEN’s acquisition of the beer operations of Fomento EconomicoEconómico Mexicano, S.A.B. de C.V. (FEMSA). FEMSA, became a major shareholder of Heineken N.V. Therefore, several existing contracts between FEMSA and former FEMSA-owned companies acquired by HeinekenHEINEKEN have become related-party contracts. The total revenue amount related to these related-party relationships amounts to EUR244EUR649 million.
APB
On 10 February 2010 and 13 April 2010, Heineken transferred its stakes in PT Multi Bintang Indonesia (MBI) and Grande Brasserie de Nouvelle-Caledonie S.A. (GBNC) to its joint venture Asia Pacific Breweries (APB). The total consideration was EUR265 million. Additionally, on 10 February 2010, Heineken acquired from APB, APB Aurangabad and APB Pearl of which 50 per cent of each entity was subsequently sold to the UBL joint venture partner VJM Group.
36. HeinekenHEINEKEN entities
Control of HeinekenHEINEKEN
The shares and options of the Company are traded on Euronext Amsterdam, where the Company is included in the main AEX index. Heineken Holding N.V. Amsterdam has an interest of 50.005 per cent in the issued capital of the Company. The financial statements of the Company are included in the consolidated financial statements of Heineken Holding N.V.
A declaration of joint and several liability pursuant to the provisions of Section 403, Part 9, Book 2, of the Dutch Civil Code has been issued with respect to legal entities established in the Netherlands marked with a • opposite.
Financial statements | Notes to the consolidated financial statementscontinuedbelow.
Significant subsidiaries
| Ownership interest | ||||||||||||
| Country of incorporation | 2010 | 2009 | ||||||||||
• Heineken Nederlands Beheer B.V. | The Netherlands | 100 | % | 100 | % | |||||||
• Heineken Brouwerijen B.V. | The Netherlands | 100 | % | 100 | % | |||||||
• Heineken Nederland B.V. | The Netherlands | 100 | % | 100 | % | |||||||
• Heineken International B.V. | The Netherlands | 100 | % | 100 | % | |||||||
• Heineken Supply Chain B.V. | The Netherlands | 100 | % | 100 | % | |||||||
• Amstel Brouwerij B.V. | The Netherlands | 100 | % | 100 | % | |||||||
• Amstel Internationaal B.V. | The Netherlands | 100 | % | 100 | % | |||||||
• Vrumona B.V. | The Netherlands | 100 | % | 100 | % | |||||||
• Invebra Holland B.V. | The Netherlands | 100 | % | 100 | % | |||||||
• B.V. Beleggingsmaatschappij Limba | The Netherlands | 100 | % | 100 | % | |||||||
• Brand Bierbrouwerij B.V. | The Netherlands | 100 | % | 100 | % | |||||||
• Heineken CEE Holdings B.V. | The Netherlands | 100 | % | 100 | % | |||||||
• Brasinvest B.V. | The Netherlands | 100 | % | 100 | % | |||||||
• Heineken Beer Systems B.V. | The Netherlands | 100 | % | 100 | % | |||||||
Central Europe Beverages B.V. | The Netherlands | 72 | % | 72 | % | |||||||
Heineken France S.A.S. | France | 100 | % | 100 | % | |||||||
Heineken UK Ltd. | United Kingdom | 100 | % | 100 | % | |||||||
Sociedade Central de Cervejas et Bebidas S.A. | Portugal | 100 | % | 100 | % | |||||||
Oy Hartwell Ab. | Finland | 100 | % | 100 | % | |||||||
Heineken España S.A. | Spain | 98.7 | % | 98.7 | % | |||||||
Heineken Italia S.p.A. | Italy | 100 | % | 100 | % | |||||||
Athenian Brewery S.A. | Greece | 98.8 | % | 98.8 | % | |||||||
Brau Union AG | Austria | 100 | % | 100 | % | |||||||
Brau Union Österreich AG | Austria | 100 | % | 100 | % | |||||||
Grupa Z’ywiec S.A. | Poland | 61.9 | % | 61.9 | % | |||||||
Heineken Ireland Ltd.1 | Ireland | 100 | % | 100 | % | |||||||
Heineken Hungária Sorgyárak Zrt. | Hungary | 100 | % | 100 | % | |||||||
Heineken Slovensko a.s. | Slovakia | 100 | % | 100 | % | |||||||
Heineken Switzerland AG | Switzerland | 100 | % | 100 | % | |||||||
Karlovacka Pivovara d.o.o. | Croatia | 100 | % | 100 | % | |||||||
Mouterij Albert N.V. | Belgium | 100 | % | 100 | % | |||||||
Ibecor S.A. | Belgium | 100 | % | 100 | % | |||||||
N.V. Brouwerijen Alken-Maes Brasseries S.A. | Belgium | 99.9 | % | 99.7 | % | |||||||
LLC Heineken Breweries | Russia | 100 | % | 100 | % | |||||||
Heineken USA Inc. | United States | 100 | % | 100 | % | |||||||
Heineken Ceská republika a.s. | Czech Republic | 100 | % | 100 | % | |||||||
Heineken Romania S.A. | Romania | 98.6 | % | 98.5 | % | |||||||
FCJSC Heineken Breweries | Belarus | 100 | % | 100 | % | |||||||
OJSC, Rechitsapivo | Belarus | 95.4 | % | 86.2 | % | |||||||
Commonwealth Brewery Ltd. | Bahamas | 100 | % | 53.2 | % | |||||||
Windward & Leeward Brewery Ltd. | St Lucia | 72.7 | % | 72.7 | % | |||||||
Cervecerias Baru-Panama S.A. | Panama | 74.9 | % | 74.9 | % | |||||||
Nigerian Breweries Plc. | Nigeria | 54.1 | % | 54.1 | % | |||||||
Al Ahram Beverages Company S.A.E. | Egypt | 99.9 | % | 99.9 | % | |||||||
Brasserie Lorraine S.A. | Martinique | 100 | % | 100 | % | |||||||
Surinaamse Brouwerij N.V. | Surinam | 76.2 | % | 76.2 | % | |||||||
Cuauhtémoc Moctezuma Holding, S.A. de C.V. | Mexico | 100 | % | — | ||||||||
Fabricas Monterrey, S.A. de C.V. | Mexico | 100 | % | — | ||||||||
Financial statements | Notes to the consolidated financial statementscontinued
| Ownership interest | Ownership interest | |||||||||||||||||||||||
| Country of incorporation | 2010 | 2009 | Country of incorporation | 2012 | 2011 | |||||||||||||||||||
• Heineken Nederlands Beheer B.V. | The Netherlands | 100 | % | 100 | % | |||||||||||||||||||
• Heineken Brouwerijen B.V. | The Netherlands | 100 | % | 100 | % | |||||||||||||||||||
• Heineken CEE Investments B.V. | The Netherlands | 100 | % | 100 | % | |||||||||||||||||||
• Heineken Nederland B.V. | The Netherlands | 100 | % | 100 | % | |||||||||||||||||||
• Heineken International B.V. | The Netherlands | 100 | % | 100 | % | |||||||||||||||||||
• Heineken Supply Chain B.V. | The Netherlands | 100 | % | 100 | % | |||||||||||||||||||
• Heineken Global Procurement B.V. | The Netherlands | 100 | % | 100 | % | |||||||||||||||||||
• Amstel Brouwerij B.V. | The Netherlands | 100 | % | 100 | % | |||||||||||||||||||
• Amstel Internationaal B.V. | The Netherlands | 100 | % | 100 | % | |||||||||||||||||||
• Vrumona B.V. | The Netherlands | 100 | % | 100 | % | |||||||||||||||||||
• Invebra Holland B.V. | The Netherlands | 100 | % | 100 | % | |||||||||||||||||||
• B.V. Beleggingsmaatschappij Limba | The Netherlands | 100 | % | 100 | % | |||||||||||||||||||
• Brand Bierbrouwerij B.V. | The Netherlands | 100 | % | 100 | % | |||||||||||||||||||
• Heineken CEE Holdings B.V. | The Netherlands | 100 | % | 100 | % | |||||||||||||||||||
• Brasinvest B.V. | The Netherlands | 100 | % | 100 | % | |||||||||||||||||||
• Heineken Beer Systems B.V. | The Netherlands | 100 | % | 100 | % | |||||||||||||||||||
• Heineken Asia Pacific B.V. | The Netherlands | 100 | % | — | ||||||||||||||||||||
• Central Europe Beverages B.V. | The Netherlands | 100 | % | 72 | % | |||||||||||||||||||
Mouterij Albert N.V. | Belgium | 100 | % | 100 | % | |||||||||||||||||||
Ibecor S.A. | Belgium | 100 | % | 100 | % | |||||||||||||||||||
N.V. Brouwerijen Alken-Maes Brasseries S.A. | Belgium | 99.9 | % | 99.9 | % | |||||||||||||||||||
Heineken France S.A.S. | France | 100 | % | 100 | % | |||||||||||||||||||
Oy Hartwall Ab. | Finland | 100 | % | 100 | % | |||||||||||||||||||
Heineken Ireland Ltd.1 | Ireland | 100 | % | 100 | % | |||||||||||||||||||
Heineken Italia S.p.A. | Italy | 100 | % | 100 | % | |||||||||||||||||||
Sociedade Central de Cervejas et Bebidas S.A. | Portugal | 98.7 | % | 98.7 | % | |||||||||||||||||||
Heineken España S.A. | Spain | 98.7 | % | 98.7 | % | |||||||||||||||||||
Heineken Switzerland AG | Switzerland | 100 | % | 100 | % | |||||||||||||||||||
Heineken UK Ltd. | United Kingdom | 100 | % | 100 | % | |||||||||||||||||||
Brau Union AG | Austria | 100 | % | 100 | % | |||||||||||||||||||
Brau Union Österreich AG | Austria | 100 | % | 100 | % | |||||||||||||||||||
FCJSC Heineken Breweries | Belarus | 100 | % | 100 | % | |||||||||||||||||||
OJSC, Rechitsapivo | Belarus | 96.4 | % | 96.2 | % | |||||||||||||||||||
Karlovacka Pivovara d.o.o. | Croatia | 100 | % | 100 | % | |||||||||||||||||||
Heineken Ceská republika a.s. | Czech Republic | 100 | % | 100 | % | |||||||||||||||||||
Athenian Brewery S.A. | Greece | 98.8 | % | 98.8 | % | |||||||||||||||||||
Heineken Hungária Sorgyárak Zrt. | Hungary | 100 | % | 100 | % | |||||||||||||||||||
Grupa Zywiec S.A. | Poland | 61.9 | % | 61.9 | % | |||||||||||||||||||
Heineken Romania S.A. | Romania | 98.4 | % | 98.4 | % | |||||||||||||||||||
LLC Heineken Breweries | Russia | 100 | % | 100 | % | |||||||||||||||||||
United Serbian Breweries EUC LLC | Serbia | 100 | % | 72 | % | |||||||||||||||||||
United Serbian Breweries Zajecarsko JSC | Serbia | 73 | % | 52.5 | % | |||||||||||||||||||
Heineken Slovensko a.s. | Slovakia | 100 | % | 100 | % | |||||||||||||||||||
Commonwealth Brewery Ltd. | Bahamas | 75 | % | 75 | % | |||||||||||||||||||
Cervejarias Kaiser Brasil S.A. | Brazil | 100 | % | 100 | % | |||||||||||||||||||
Brasserie Nationale d’ Haiti | Haiti | 94.8 | % | 22.5 | % | |||||||||||||||||||
Brasserie Lorraine S.A. | Martinique | 100 | % | 100 | % | |||||||||||||||||||
Cuauhtémoc Moctezuma Holding, S.A. de C.V. | Mexico | 100 | % | 100 | % | |||||||||||||||||||
Fabricas Monterrey, S.A. de C.V. | Mexico | 100 | % | 100 | % | |||||||||||||||||||
Silices de Veracruz, S.A. de C.V. | Mexico | 100 | % | — | Mexico | 100 | % | 100 | % | |||||||||||||||
Cervejarias Kaiser Brazil S.A. | Brazil | 100 | % | 17 | % | |||||||||||||||||||
Cervecerias Baru-Panama S.A. | Panama | 74.9 | % | 74.9 | % | |||||||||||||||||||
Windward & Leeward Brewery Ltd. | St Lucia | 72.7 | % | 72.7 | % | |||||||||||||||||||
Surinaamse Brouwerij N.V. | Surinam | 76.2 | % | 76.2 | % | |||||||||||||||||||
Heineken USA Inc. | United States | 100 | % | 100 | % | |||||||||||||||||||
Tango s.a.r.l. | Algeria | 100 | % | 100 | % | |||||||||||||||||||
Brasseries et Limonaderies du Burundi ‘Brarudi’ S.A. | Burundi | 59.3 | % | 59.3 | % | |||||||||||||||||||
Brasseries, Limonaderies et Malteries ‘Bralima’ S.A.R.L. | D.R. Congo | 95.0 | % | 95.0 | % | |||||||||||||||||||
Al Ahram Beverages Company S.A.E. | Egypt | 99.9 | % | 99.9 | % | |||||||||||||||||||
Bedele Brewery | Ethiopia | 100 | % | 100 | % | |||||||||||||||||||
Harar Brewery | Ethiopia | 100 | % | 100 | % | |||||||||||||||||||
Brasserie Almaza S.A.L. | Lebanon | 67.0 | % | 67.0 | % | |||||||||||||||||||
Nigerian Breweries Plc. | Nigeria | 54.1 | % | 54.1 | % | |||||||||||||||||||
Consolidated Breweries Ltd. | Nigeria | 50.5 | % | 50.4 | % | Nigeria | 53.6 | % | 50.5 | % | ||||||||||||||
Brasserie Almaza S.A.L. | Lebanon | 67.0 | % | 67.0 | % | |||||||||||||||||||
Brasseries, Limonaderies et Malteries ‘Bralima’ S.A.R.L. | D.R. Congo | 95.0 | % | 95.0 | % | |||||||||||||||||||
Brasseries de Bourbon S.A. | Réunion | 85.7 | % | 85.7 | % | |||||||||||||||||||
Brasseries et Limonaderies du Rwanda ‘Bralirwa’ S.A. | Rwanda | 75.0 | % | 70.0 | % | Rwanda | 75.0 | % | 75.0 | % | ||||||||||||||
Brasseries et Limonaderies du Burundi ‘Brarudi’ S.A. | Burundi | 59.3 | % | 59.3 | % | |||||||||||||||||||
Brasseries de Bourbon S.A. | Réunion | 85.7 | % | 85.7 | % | |||||||||||||||||||
Sierra Leone Brewery Ltd. | Sierra Leone | 83.1 | % | 83.1 | % | Sierra Leone | 83.1 | % | 83.1 | % | ||||||||||||||
Tango s.a.r.l. | Algeria | 100 | % | 100 | % | |||||||||||||||||||
Société Nouvelle des Boissons Gazeuses S.A. (‘SNBG’) | Tunisia | 74.5 | % | 74.5 | % | Tunisia | 74.5 | % | 74.5 | % | ||||||||||||||
Société Nouvelle de Brasserie S.A. ‘Sonobra’ | Tunisia | 49.9 | % | 49.9 | % | Tunisia | 49.9 | % | 49.9 | % | ||||||||||||||
Cambodia Brewery Ltd. | Cambodia | 79.0 | % | 33.5 | % | |||||||||||||||||||
Shanghai Asia Pacific Brewery Co. Ltd. | China | 99.3 | % | 46.0 | % | |||||||||||||||||||
Hainan Asia Pacific Brewery Co. Ltd. | China | 99.3 | % | 46.0 | % | |||||||||||||||||||
Guangzhou Asia Pacific Brewery Co. Ltd | China | 99.3 | % | 46.0 | % | |||||||||||||||||||
PT Multi Bintang Indonesia Tbk. | Indonesia | 86.4 | % | 40.6 | % | |||||||||||||||||||
Lao Asia Pacific Breweries Ltd. | Laos | 67.1 | % | 28.5 | % | |||||||||||||||||||
MCS Asia Pacific Brewery LLC. | Mongolia | 54.3 | % | 23.1 | % | |||||||||||||||||||
Grande Brasserie de Nouvelle – Calédonie S.A. | New Calédonia | 86.3 | % | 36.6 | % | |||||||||||||||||||
DB Breweries Ltd. | New Zealand | 98.7 | % | 41.9 | % | |||||||||||||||||||
DB South Island Brewery Ltd. | New Zealand | 54.3 | % | 23.1 | % | |||||||||||||||||||
South Pacific Brewery Ltd. | Papua New Guinea | 75.4 | % | 31.8 | % | |||||||||||||||||||
Asia Pacific Investments Pte. Ltd. | Singapore | 100 | % | 50 | % | |||||||||||||||||||
Asia Pacific Breweries Ltd. | Singapore | 98.7 | % | 41.9 | % | |||||||||||||||||||
Asia Pacific Breweries (Singapore) Pte. Ltd. | Singapore | 98.7 | % | 41.9 | % | |||||||||||||||||||
Solomon Breweries Ltd. | Solomon Islands | 96.4 | % | 40.9 | % | |||||||||||||||||||
Asia Pacific Breweries (Lanka) Ltd. | Sri Lanka | 59.2 | % | 25.2 | % | |||||||||||||||||||
Vietnam Brewery Ltd. | Vietnam | 59.2 | % | 25.2 | % | |||||||||||||||||||
Asia Pacific Breweries (Hanoi) Ltd. | Vietnam | 98.7 | % | 41.9 | % | |||||||||||||||||||
VBL Da Nang Co. Ltd. | Vietnam | 59.2 | % | 25.2 | % | |||||||||||||||||||
VBL Tien Giang Ltd. | Vietnam | 59.2 | % | 25.2 | % | |||||||||||||||||||
VBL Quang Nam Ltd | Vietnam | 47.4 | % | 20.1 | % | |||||||||||||||||||
|
|
| ||||||||||||||||||||||
| 1 | In accordance with |
Acquisition37. Subsequent events
Share of businessstake in NigeriaKazakhstan
On 1221 December 2012 HEINEKEN announced its intentions to sell its 28 per cent stake in Efes Kazakhstan JSC FE to majority shareholders Efes Breweries International N.V. The transaction closed on 8 January 2011 Heineken2013 and resulted in an estimated post tax book gain of EUR80 million.
Sale of Jiangsu Dafuhao Breweries Co. Ltd
On 9 January 2013 HEINEKEN’s Asian subsidiary that holds a 49 per cent stake in Jiangsu Dafuhao Breweries Co. Ltd entered into a conditional share transfer agreement whereby Nantong Fuhao Alcohol Co. Ltd. will purchase HEINEKEN’s shareholding interests for USD24.5 million. The transaction closed on 15 January 2013 when the funds were received in full.
Sale of Pago International GmbH
On 17 December 2012 HEINEKEN announced the sale of its wholly-owned subsidiary Pago International GmbH to Eckes-Granini Group. The transaction is expected to close in the first quarter of 2013.
Mandatory unconditional cash offer (Offer for APB shares)
On 17 January 2013 HEINEKEN announced that the final closing date of its Offer for all of the issued and paid-up ordinary APB shares other than those already owned or controlled by HEINEKEN is 31 January 2013.
On 16 January 2013 the required acceptance level of 90 per cent of the APB shares in the open market was reached. As such, HEINEKEN was entitled to exercise its right of compulsory acquisition of the remaining APB shares. The total cash consideration in relation to the acquisition of the remaining shares after 31 December 2012 amounts to approximately EUR146 million.
Strategic review of Hartwall in Finland
On 4 February 2013 HEINEKEN announced that it had strengthenedstarted a strategic review of its platformHartwall business in Finland. During this review, HEINEKEN evaluates strategic options for Hartwall to drive continued growth in Nigeria viafor the acquisitionbusiness, within or outside of two holding companies fromHEINEKEN. The strategic review is expected to be finalised before the Sona Group. The two acquired businesses have controlling interests in eachend of the Sona, IBBI, Benue, Lifeyear.
Executive and Champion breweries in Nigeria.
Heineken will explore the possibility of selling the newly acquired breweries to its existing businesses in Nigeria during 2011. Discussions with Nigerian Breweries and Consolidated Breweries will begin now the transaction has been finalised. The acquired breweries will continue to provide and expand contract brewing services to Nigerian Breweries and Consolidated Breweries for the meantime, whilst continuing to own, brew and support the Goldberg, Williams Dark Ale and Malta Gold brands as well as various smaller regional brands.Supervisory Board statement
The acquisition has been funded from existing resources.members of the Supervisory Board signed the financial statements in order to comply with their statutory obligation pursuant to Article 2:101 paragraph 2 Civil Code.
Allotted Share Delivery Instrument
Between 1 JanuaryThe members of the Executive Board signed the financial statements in order to comply with their statutory obligation pursuant to Article 2:101 paragraph 2 Civil Code and 11 February 2011, Heineken has bought 710,437 additional Heineken N.V. shares, which are in portfolio pending delivery to FEMSA.Article 5:25c paragraph 2 sub c Financial Markets Supervision Act.
Amsterdam, | Executive Board |
| Supervisory Board | |||||
| Van Boxmeer | Van Lede | |||||||
| Hooft Graafland | Fernández Carbajal | |||||||
| Das | ||||||||
| de Carvalho | ||||||||
| De Jong | ||||||||
| Fentener van Vlissingen | ||||||||
| Minnick | ||||||||
| Navarre | ||||||||
| Astaburuaga Sanjinés | ||||||||
| Wijers | ||||||||
F-145F-144
